
the Creative Commons Attribution 4.0 License.
the Creative Commons Attribution 4.0 License.
 | 14 Oct 2026
Optical properties and shape-dependent retrievals of the imaginary part of the refractive index of freshly emitted Saharan dust

Jeronimo Escribano
Marco Pandolfi
Andrés Alastuey
Cristina González-Flórez
Adolfo Gonzalez-Romero
María Gonçalves Ageitos
Matic Ivančič
Martina Klose
Konrad Kandler
Vincenzo Obiso
Agnesh Panta
Cristina Reche
Martin Rigler
Xavier Querol
Carlos Perez García-Pando
Mineral dust is a major contributor to atmospheric aerosol mass and plays a complex role in Earth's radiation budget. However, large uncertainties remain in quantifying its direct radiative effects, partly because dust absorption is poorly constrained and in situ measurements of freshly emitted dust remain scarce. Here, we present high temporal resolution measurements of dust optical properties collected during active dust emission events in the Moroccan Sahara in September 2019. During dust emission periods, the optical properties aligned with previous Saharan dust studies. Single scattering albedo (SSA) for PM2.5 (PM10) was 0.95 (0.94) at 370 nm and 0.97 (0.96) at 660 nm. Coarse particles contributed to negative scattering and SSA Ångström exponents (SSAAE), and absorption Ångström exponents (AAE) reached up to 2.5 (2.0), consistent with stronger wavelength-dependent absorption by iron oxides. The asymmetry parameter (g) was 0.7 (0.65) at 520 nm, and the backscatter fraction (BF) was 0.11 (0.13), showing coarse dust's impact on scattering. Mass absorption efficiency (MAE) decreased from 0.30 to 0.15 m2 g−1 at 370 nm with increasing particle size. Mass scattering efficiency (MSE) shifted towards longer wavelengths for larger particles. We further retrieved the imaginary part of the complex refractive index, k, for the PM2.5 dust-event period under prescribed assumptions for particle shape, particle density, and the real part of the refractive index. For the central density assumption, retrieved k at 520 nm ranged from 0.00104 for spheres to 0.00145 for triaxial ellipsoids, corresponding to a 40 % increase. These results show that particle-shape assumptions can substantially affect retrieved k, and therefore need to be considered when interpreting in situ, remote-sensing, and model estimates of dust optical properties.
- Article
(4603 KB) - Full-text XML
-
Supplement
(8616 KB) - BibTeX
- EndNote


Mineral dust emitted from arid regions is one of the most abundant aerosol types by mass (Myhre et al., 2013) and influences the Earth's climate through multiple mechanisms. It exerts a direct radiative effect (DRE) by absorbing and scattering solar and terrestrial radiation (Kok et al., 2017; Adebiyi and Kok, 2020), a semi-direct effect by modifying atmospheric temperature profiles and influencing cloud properties (e.g., Ackerman et al., 2000; Perlwitz and Miller, 2010), and an indirect effect by altering cloud microphysics and precipitation patterns (Karydis et al., 2017; McGraw et al., 2020). Mineral dust also affects the cryosphere (Skiles et al., 2018) and atmospheric chemistry (Mahowald, 2011), contributing to climate and environmental change (Kok et al., 2023).
Despite its importance, the DRE of mineral dust remains highly uncertain, partly because dust absorption properties are still poorly constrained (Samset et al., 2018). Current estimates place the short-wave DRE at a central value of −0.40 ± 0.30 W m−2 (90 % confidence) based on model assessments that integrate dust optical depth, optical properties and particle size distributions (PSDs) consistent with limited experimental constraints (Kok et al., 2023). Kok et al. (2023) further estimated a 55 ± 30 % increase in global dust aerosol mass concentrations since pre-industrial times, with an associated global negative mean effective radiative forcing of approximately −0.07 W m−2, partially offsetting greenhouse warming. However, the uncertainty in this estimate remains substantial (±0.18 W m−2), leaving open the possibility that dust aerosols may have contributed to net warming since pre-industrial times (Kok et al., 2023).
Several dust properties influence its optical behaviour and, consequently, its DRE. These include mineralogical composition, PSD, particle shape and morphology, mixing state, total atmospheric dust loading, and vertical distribution (e.g. Kok et al., 2017; Di Biagio et al., 2020; Adebiyi and Kok, 2020; Li et al., 2021). Uncertainties in these properties propagate into estimates of dust scattering, absorption, extinction, and angular scattering, thereby affecting radiative-transfer calculations and climate-model simulations.
Dust optical properties, particularly the complex refractive index (CRI ), play a critical role in determining the dust radiative impact. The real part (n) primarily controls scattering, while the imaginary part (k) controls absorption. The intrinsic CRI of dust depends on its mineralogical composition and describes how a homogeneous material interacts with light on a microscopic scale. For instance, the presence of iron oxides in such minerals as goethite and hematite, plays a dominant role in dust absorption (e.g., Di Biagio et al., 2019). Several studies have also found that the relative fraction of total iron in dust correlates with its absorption properties, influencing radiative forcing estimates (Sokolik and Toon, 1999; Lafon et al., 2006; Balkanski et al., 2007; Caponi et al., 2017). The imaginary part of the CRI for iron oxides exhibits increased absorption at short-wavelength UV compared to red and near-infrared wavelengths (e.g. Sokolik and Toon, 1999; Balkanski et al., 2007). However, particle size and shape influence how a given CRI translates into observable optical properties. It is important to note that in real-world measurements, the effective CRI retrieved from bulk optical observations depends not only on composition but also on the particle size and shape distribution of the dust particles. This is because dust is composed of irregularly shaped particles spanning a wide range of sizes, and retrievals from optical measurements inherently integrate these variations (e.g., Gasteiger and Wiegner, 2018a).
The PSD of mineral dust exerts a strong influence on its optical properties because the size parameter, defined by the ratio between particle circumference and wavelength, dictates the dominant scattering regime (Mishchenko et al., 2002). Smaller particles tend to scatter light more evenly across angles, whereas larger particles scatter more strongly in the forward direction, increasing extinction and reducing backscattering (e.g., Sokolik and Toon, 1999). Coarse-mode dust can dominate dust mass and exert substantial effects on direct radiative forcing, yet is often under-represented in models (Adebiyi and Kok, 2020). Therefore, retrievals of dust optical properties from observations are sensitive not only to composition but also to the PSD used in the interpretation.
Particle shape further modulates optical properties. Several studies have reported that total extinction by non-spherical dust particles, including spheroids, super-spheroids, and more complex irregular-particle models, can differ from spherical particle calculations by roughly 10 %–20 % (e.g., Nousiainen, 2009; Lin et al., 2018), especially when averaged across a typical size distribution, although larger effects have also been reported (Kok et al., 2017). Despite these potential differences in total extinction, the single scattering albedo (SSA) often remains relatively unchanged or only modestly affected. Conversely, shape tends to have a more pronounced impact on the scattering phase function and asymmetry factor (g), influencing how light is directionally scattered. Retrievals of the effective CRI are impacted by shape assumptions, because standard inversion algorithms often rely on simplified particle geometries. As a result, differences in assumed particle shape can lead to systematic differences in the retrieved imaginary part of the refractive index.
It is therefore important to distinguish between intrinsic refractive indices, which are determined by particle composition, and effective or retrieved refractive indices, which depend on the assumptions used in the inversion. In atmospheric measurements, the retrieved k is conditional on the assumed PSD, particle shape, density, and real refractive index. Additional complexities arise from internal mixing and physico-chemical ageing of dust during transport. This distinction is crucial for interpreting observations, improving remote-sensing retrievals, and reducing uncertainties in climate models.
Climate models require accurate representations of dust optical properties, including the complex refractive index, single-scattering albedo, and asymmetry parameter. Some studies have examined how various mineralogical compositions and PSDs affect these parameters, often through laboratory experiments with resuspended soil samples (e.g., Di Biagio et al., 2017, 2019), ground-based or satellite remote-sensing, or in-situ observations in known dust outflow regions. However, direct in-situ measurements of freshly emitted dust within source regions remain relatively scarce. Most existing observations in deserts focus on campaigns that capture dust outflow rather than the exact point of emission (Kandler et al., 2009; Müller et al., 2009; Schladitz et al., 2009), leaving gaps in understanding how local soil characteristics and emission processes govern the initial PSD and optical properties of dust. Measurements from large networks such as AERONET also provide valuable remote retrievals of total-column aerosol properties, though the presence of other particles can complicate dust-specific analyses (e.g., Obiso et al., 2024).
To address these gaps, a field campaign was conducted in the Saharan desert (Morocco) in September 2019 under the framework of the FRAGMENT project. One major aim was to characterize the size-resolved mineralogical composition of freshly emitted dust and the emission mechanisms that inject these particles into the lower troposphere (González-Romero et al., 2023, 2024a, b; Panta et al., 2023; González-Flórez et al., 2023). A complementary objective, and the focus of the present study, was to measure and interpret the multi-wavelength optical properties of freshly emitted dust.
Here, we present high-temporal-resolution measurements of extensive properties, namely scattering and absorption coefficients, and derived intensive properties, including SSA, asymmetry parameter, backscatter fraction, Ångström exponents and mass scattering, absorption and extinction efficiencies. We relate these properties to the size of the emitted particles and then retrieve the imaginary part of the complex refractive index, k. The retrieval is performed under prescribed assumptions for particle shape, particle density, and the real part of the refractive index, n. We use campaign-specific particle density measurements, particle-shape information from single-particle analyses (Panta et al., 2023), optical particle counter measurements (González-Flórez et al., 2023), and additional literature-based shape assumptions to quantify how retrieved k depends on particle-shape representation.
In the following, Sect. 2 presents the measurement site, instruments, optical properties, and k retrieval methodology. Particular attention is given to the distinction between corrected scattering coefficients, used for the descriptive optical-property analysis, and truncated scattering coefficients, used in the retrieval. Section 3 presents the results in three parts: first, the temporal evolution of the measured optical properties; second, the relationships between optical properties and particle size; and third, the conditional retrievals of k under different assumptions for particle shape, and n. The implications and limitations of the retrieval are then discussed in the context of in situ observations, remote sensing, and climate-model applications.
2.1 Measurement site
In-situ dust measurements were conducted in a mineral dust emission area in southeastern Morocco, at the transition between the southern foothills of the Atlas Mountains and the Saharan Desert. The study site is located in L'Bour ( N, W, 500 m a.s.l.), a small terminal depression near the Drâa dry riverbed, west of M'Hammid El Ghizlane. It is also located east of Lake Iriki, a seasonal dry lake, and adjacent to two major dune fields, Erg Cheggaga and Erg Smar (see Fig. 1). The surface at L'Bour is predominantly hard-packed, with crust formations resulting from wind and dust erosion, interspersed with shallow sand dunes less than 1 m high. These characteristics make the site well suited for studying freshly emitted dust from natural Saharan sources. Further details on the sampling site and its environmental conditions can be found in González-Flórez et al. (2023), González-Romero et al. (2023), Panta et al. (2023).
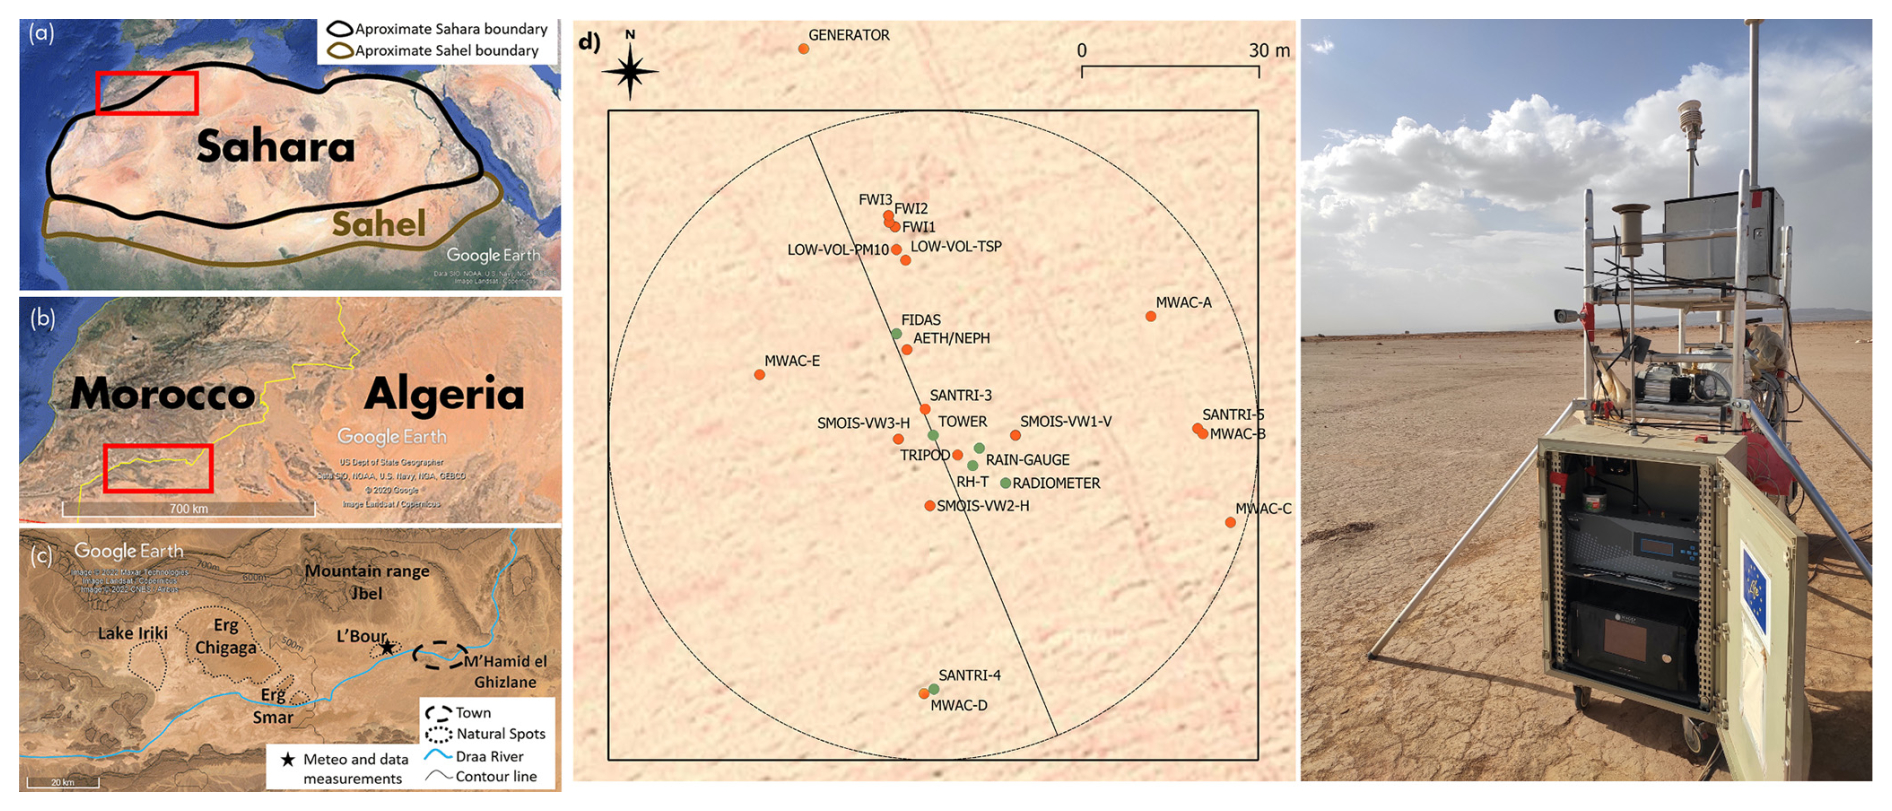
Figure 1Location of the area of study over Northern Africa (a, b, c), the instrument deployment over the L’Bour site, where the diagonal black line is perpendicular to the approximate predominant wind direction estimated based on prior data analysis (d), the green points correspond to the optical instruments (AE33 and nephelometer) and the Fidas, which are shown in (e), where the optical instruments are placed in cage in front of the scaffolding and the Fidas is located in the background behind the scaffolding. The integrating nephelometer is placed in the upper level and the Aethalometer AE33 in the lower one. Satellite imagery in panels (a), (b), (c) and (d) were taken from base layer from world imagery of © Google Earth Pro v:7.3.6.9345. The photo in panel (e) was taken by one of the authors.
2.2 Measurements of optical properties
Scattering coefficients (bscat) were measured using an LED-based multi-angle integrating nephelometer (Aurora 4000, ECOTECH Pty Ltd, Knoxfield, Australia). The nephelometer operates at three wavelengths (450, 525 and 635 nm) and collects scattering measurements at eight angular positions (0, 10, 25, 40, 55, 70, 90, and 170°). The forward (0°) and backward (170°) scattering measurements are affected by non-ideal illumination of the light source and by angular truncation (Müller et al., 2011; Teri et al., 2022). For the descriptive analysis of the campaign optical properties, the scattering coefficients were corrected using the correction scheme of Teri et al. (2022). These corrected scattering coefficients are used throughout the manuscript when reporting scattering coefficients, SSA, asymmetry parameter, backscatter fraction, and mass scattering and extinction efficiencies, except in the retrieval of the imaginary part of the complex refractive index.
For the refractive-index retrieval, we use the uncorrected scattering coefficient measured by the nephelometer, hereafter referred to as the truncated scattering coefficient, (tsca). The corresponding truncated scattering is simulated explicitly in the retrieval observation operator, as described in Sect. 2.6. This distinction avoids applying a correction from truncated scattering to full-phase-function scattering in the retrieval itself, which would introduce additional assumptions about particle shape and the scattering phase function. The corrected multi-angle scattering measurements were also used to derive the asymmetry parameter (e.g., Horvath et al., 2018; Liou, 2002).
Multi-wavelength aerosol absorption coefficients () were derived using a multi-wavelength dual-spot aethalometer (AE33, Aerosol d.o.o.]). The AE33 measures light attenuation at seven wavelengths spanning from the short-UV to the near-infrared range (370, 470, 520, 590, 660, 880, and 950 nm). Absorption coefficients are then computed using Eq. (17) of Drinovec et al. (2015), with the AE33 online correction for filter loading effects.
The uncertainty of AE33-derived absorption coefficients, ranging between 10 % and 30 %, depends strongly on measurement artefacts, particularly the cross-sensitivity of attenuation measurements to light scattering by particles on the filter (Drinovec et al., 2015; Yus-Díez et al., 2021). To correct for this effect, we used the scattering artefact parameter, ms, and the multiple-scattering parameter, C, reported in Yus-Díez et al. (2025) for Saharan mineral soil samples collected during the same FRAGMENT-Morocco campaign and later resuspended and analysed under controlled laboratory conditions. This correction is therefore directly linked to the dust sampled in the present study. To account for uncertainty in the AE33 multiple-scattering correction, we performed a sensitivity analysis using lower and upper values of C derived from the 95 % confidence interval reported in Table S2 of Yus-Díez et al. (2025). This sensitivity results in an uncertainty of approximately 5 % in the corrected absorption coefficient at 370 nm, increasing up to approximately 20 % at 950 nm, where the relative contribution of the scattering artefact is larger for mineral dust.
The aethalometer and nephelometer shared the same sampling line and inlet, with the AE33 pump also used for the nephelometer. During the initial phase of the L’Bour field campaign (4 September 2019 00:00 UTC to 26 September 2019 12:00 UTC), in-situ surface optical measurements were performed using a PM2.5 inlet. After this date and until the end of the campaign (1 October 2019 08:00:00 UTC), a PM10 inlet was used instead. To reduce instrumental noise while accounting for all significant turbulent structures carrying momentum flux, all the campaign measurements, including the optical measurements, were averaged into 15 min intervals for analysis (Dupont et al., 2019).
2.3 Particle size distribution measurements
Number PSDs were measured using a Fine Dust Aerosol Spectrometer (Fidas 200S, Palas GmbH). The instrument measured aerosol particles in 63 logarithmically spaced optical-diameter bins between 0.20 and 19.1 µm, with a time resolution of 120 s and an inlet flow rate of 4.8 L min−1. The first three bins were not used as they were found to be unreliable (cf. González-Flórez et al., 2023). As for the optical measurements, the Fidas data were averaged into 15 min intervals. The Fidas was calibrated in the field using polystyrene latex spheres (PSLs) with a CRI of 1.59+0i. Because mineral dust particles are non-spherical and absorbing, the PSL-calibrated optical diameters must be converted into dust geometric diameters before deriving mass concentrations and optical simulations. We applied the optical-to-geometric diameter conversion described in Sect. 2.6.1, following the method of Huang et al. (2021). This conversion depends on the assumed particle shape and CRI. For the descriptive analysis in Sect. 3.2, mass-dependent quantities were computed using the converted PSD assuming spherical particles and an initial dust refractive-index range guided by Di Biagio et al. (2019), with real parts between 1.47 and 1.52, and imaginary parts between 0.0001 to 0.005. The retrieval of k under different prescribed assumptions for particle shape, particle density, and n is described separately in Sect. 2.6.
From the converted number PSD, we calculated the mass concentration (MPM) and the effective radius (Reff). MPM is given by the third moment of the number PSD,
where D is the particle geometric diameter, and N(D) is the dust number PSD for diameter D derived from the Fidas, and ρp is the particle density. Here, we have used a density of 2.15 g cm−3. This value was obtained from samples collected at the site and analysed with a helium pycnometer. The method estimates particle density from the volume accessible to helium gas, including open and semi-open pores. The results indicate that particle density decreases with decreasing particle size, reaching approximately 2.15 g cm−3 for particles with diameters below 20 µm. This value is therefore considered a reasonable approximation for the dust particles sampled in the size range relevant to this study.
Reff is then defined as the ratio of the third to the second moment of the number PSD,
Here, D spans the relevant diameter range between the first valid bin D0 and and the upper diameter Dx. The value of Dx corresponds to the geometric diameter associated with the aerodynamic diameter of the inlet cut-off, and therefore differs between the PM2.5 and PM10 periods. The optical-to-geometric diameter conversion is described in Sect. 2.6.1. For ρp=2.15 g cm−3 and spherical particles, the PM2.5 aerodynamic cut-off corresponds to a geometric diameter of 1.72 µm.
2.4 Meteorological measurements
Wind measurements were conducted at 2 m above ground level, approximately matching the inlet heights of the optical and PSD instruments. We used a 2-D sonic anemometer (model WINDSONIC4-L, Campbell Scientifics, USA) mounted on a 10 m meteorological tower. As described in González-Flórez et al. (2023), the tower also hosted multiple 2-D and 3-D sonic anemometers, whose data were processed to derive turbulence parameters, including the wind friction velocity (u*). Briefly, u* was obtained via an iterative law-of-the-wall approach, which assumes a (pseudo)logarithmic wind profile in the atmospheric surface layer (cf. González-Flórez et al., 2023, and references therein). Although the raw wind data were recorded at 0.5 Hz, they were averaged into 15 min intervals during post-processing to facilitate a stable, consistent comparison with the other collocated instruments.
2.5 Intensive aerosol optical properties
By combining the extensive optical properties, namely absorption from the AE33 and corrected scattering from the polar nephelometer, with the PSDs from the Fidas, we derived time series of intensive optical properties. These properties depend on the physico-chemical properties of the dust particles, including mineralogy, PSD, and shape. Unless otherwise stated, the scattering coefficients used in this section are the corrected scattering coefficients described in Sect. 2.2. The truncated scattering coefficient, tsca, and the corresponding truncated single scattering albedo, tssa, are used only for the retrieval of k described in Sect. 2.6.
- a.
The Scattering Ångström Exponent (SAE) mostly reflects particle size, with values less than 1 typically indicating coarse particles (Seinfeld and Pandis, 1998; Schuster et al., 2006), as often observed during fresh dust emissions in our campaign. SAE was calculated by fitting the scattering coefficients at three nephelometer wavelengths in a log-log space,
where β is the intercept of the linear fit.
- b.
The Absorption Ångström Exponent (AAE) is strongly influenced by the particle composition. Under anthropogenic-dominated conditions, AAE typically ranges from 0.9 to 1.1 (Kirchstetter et al., 2004; Petzold et al., 2013), whereas dust-rich environments yield higher values, typically between 2 and 6.5 (Schuster et al., 2016; Caponi et al., 2017). This higher AAE reflects the dust enhanced absorption in the short-UV region relative to near-infrared wavelengths (Kirchstetter et al., 2004; Chen and Bond, 2010), largely associated with iron oxides such as hematite and goethite (e.g. Schuster et al., 2006; Müller et al., 2009; Schladitz et al., 2009). Here, AAE was derived by fitting the wavelength dependence of the AE33 absorption coefficients in log-log space,
where β is the intercept of the linear fit.
- c.
The Single Scattering Albedo (SSA) is calculated as the scattering (bscat) to extinction, () ratio, . SSA indicates the relative importance of aerosol scattering and absorption and is therefore a key parameter for assessing aerosol radiative effects. Values close to 1 indicate predominantly scattering particles, whereas lower values indicate stronger absorption. Typical values for Saharan dust range from 0.92 at 370 nm to 0.98 at 880 nm (Di Biagio et al., 2019), and from 0.90 to 0.96 at the green wavelengths (Claquin et al., 1999; Schladitz et al., 2009), depending on source region, iron content, particle size, and mixing state. In this section, SSA was calculated at the seven AE33 wavelengths by extrapolating the corrected nephelometer scattering coefficients using the derived SAE. This standard SSA should be distinguished from tssa, the truncated SSA used only in the retrieval of k in Sect. 2.6.
- d.
The SSA Ångström Exponent (SSAAE) describes the wavelength dependence of SSA. Negative SSAAE values are often associated with coarse dust-dominated conditions, because dust SSA generally increases with wavelength as absorption decreases towards the near-infrared (Collaud Coen et al., 2004; Ealo et al., 2016). SSAAE was obtained by fitting the wavelength dependence of SSA in log-log space,
where β is the intercept of the linear fit.
- e.
The asymmetry parameter (g) is the first moment of the Legendre decomposition of the scalar scattering phase function and describes the mean scattering direction. It ranges from −1 for purely backward scattering to +1 for purely forward scattering. For airborne dust particles, values between 0.6 and 0.85 are commonly used in numerical models (Sokolik and Toon, 1999; Horvath et al., 2018; Ryder et al., 2018). Here we derived g from the phase function of the nephelometer multi-angle measurements, corrected by angular truncation as described in Sect. 2.2.
where P(cos θ) is the scattering phase function (Liou, 2002; Horvath et al., 2018).
- f.
The Backscatter Fraction (BF) is calculated as the ratio between hemispheric backward scattering and total scattering, using the corrected nephelometer measurements. BF provides complementary information to g, with lower BF values generally indicating stronger forward scattering by larger particles.
- g.
The Mass Absorption, Scattering, and Extinction efficiencies (MAE, MSE, and MEE) represent the absorption, scattering, and extinction efficiencies, respectively, of the measured particles per unit of mass. They were obtained as the ratio between the absorption, scattering, and extinction coefficients, respectively, and the mass concentration derived from the number PSD (MPM). During strong dust-emission events at the study site, this mass concentration can be attributed predominantly to mineral dust. Outside these periods, particularly during episodes influenced by anthropogenic advection, the mass-normalized optical quantities may also reflect the contribution of non-dust absorbing particles. The mass efficiencies are therefore interpreted primarily for the dust-event periods and used to assess how optical properties vary with particle size and inlet cut-off. Values of dust MEE around 0.32 m2 g−1 have been reported in previous studies (Ryder et al., 2018).
2.6 Imaginary part of the complex refractive index retrieval
The imaginary part of the complex refractive index (k) was retrieved by comparing measured and simulated optical properties during PM2.5 dust-event periods. The retrieval uses the truncated scattering, denoted tsca in Sect. 2.2, together with the AE33 absorption coefficient, babs. We define the truncated SSA, tssa, as:
The value of k is then obtained by minimizing the difference between simulated and measured tssa. The optimization is performed under prescribed assumptions for particle shape, particle density, and real part of the refractive index, n. Therefore, the retrieval should be interpreted as a conditional estimate of k for each set of assumptions, rather than as a simultaneous retrieval of particle shape, PSD, n, and k.
Our methodology builds on the approach of Di Biagio et al. (2019), but introduces two main modifications motivated by the characteristics of our field dataset. First, the conversion of Fidas optical diameters into dust geometric diameters is coupled to the retrieval, because this conversion depends on the assumed particle shape and refractive index. Second, the cost function is based on tssa, rather than on absorption and scattering coefficients separately. This choice reduces the sensitivity of the retrieval to possible differences in the absolute particle number sampled by the OPC and by the optical instruments, and avoids correcting the measured truncated scattering coefficient to a full-phase-function scattering coefficient in the retrieval itself.
The retrieval procedure consists of three main steps: (1) converting the Fidas PSL-calibrated optical diameters into dust geometric diameters under prescribed assumptions for particle shape, density, and real refractive index; (2) simulating truncated scattering and absorption coefficients from the converted PSD; and (3) minimizing a quadratic cost function based on tssa. A general overview of the procedure is shown in Fig. 2.
A key aspect of the method is that the OPC diameter conversion and the optical simulations are treated consistently. The transformation from PSL-based optical diameters to dust geometric diameters depends on k, while absorption is also directly controlled by k. To avoid a sequential inconsistency, we first retrieve the value of k at the wavelength relevant for the OPC diameter conversion. This value is then used to convert the Fidas optical diameters into dust geometric diameters. The resulting dust PSD is subsequently used to retrieve k at the AE33 wavelengths.
Another key difference from the method of Di Biagio et al. (2019) is that we define the cost function directly in terms of the truncated single scattering albedo, tssa. This choice is motivated by both the sensitivity of tssa to k, and the sampling configuration of the field experiment. The Fidas measured number size distributions through its own inlet over a broad optical-diameter range of approximately 0.2–19 µm, whereas the AE33 and nephelometer sampled through a common PM2.5 inlet during the period used for the refractive-index retrieval. To make the Fidas PSD representative of the aerosol population sampled by the optical instruments, we applied an effective PM2.5 cut-off to the converted dust geometric PSD. However, this procedure cannot fully reproduce possible differences in inlet transmission, size-dependent particle losses, counting efficiency, or absolute particle number between the Fidas and the optical sampling line.
We tested alternative cost functions incorporating additional information from the polar nephelometer, including a combined cost function based on quadratic departures of tssa and the backscatter fraction (BF). However, our dataset did not support a robust simultaneous retrieval of both n and k. This limitation likely reflects the combined sensitivity of the inversion to particle-shape assumptions, particle density, inlet cut-off modelling, and PSD uncertainties. In particular, closure tests comparing inversions based on tssa with inversions using extensive optical properties suggested a possible mismatch between the OPC-derived PSD and the aerosol population sampled by the nephelometer and aethalometer. Expressed as an equivalent scaling of the OPC particle number concentration, this mismatch was of the order of at least 20 % in some cases. Moreover, the spectral dependence of the required scaling suggests that the mismatch may not be a simple constant offset in particle number, but may include size-dependent effects, with larger discrepancies towards the lower and upper ends of the PM2.5 size range.
Because the available data do not allow this potential mismatch to be quantified robustly, we use tssa in the cost function instead of relying on inversions based directly on extensive absorption and scattering coefficients. Since tssa is a ratio between truncated scattering and extinction, it is less sensitive to absolute concentration differences between the OPC and the optical instruments, while retaining sensitivity to the absorption-to-scattering balance controlled by k. The drawback is that tssa is not sufficiently sensitive to n to support a robust simultaneous retrieval of n and k from this dataset. We therefore retrieve k for a range of fixed n values representative of mineral dust, rather than solving for both parameters simultaneously. As shown in Sect. 3.3, the retrieved k is only weakly sensitive to the prescribed value of n within the plausible range tested here.
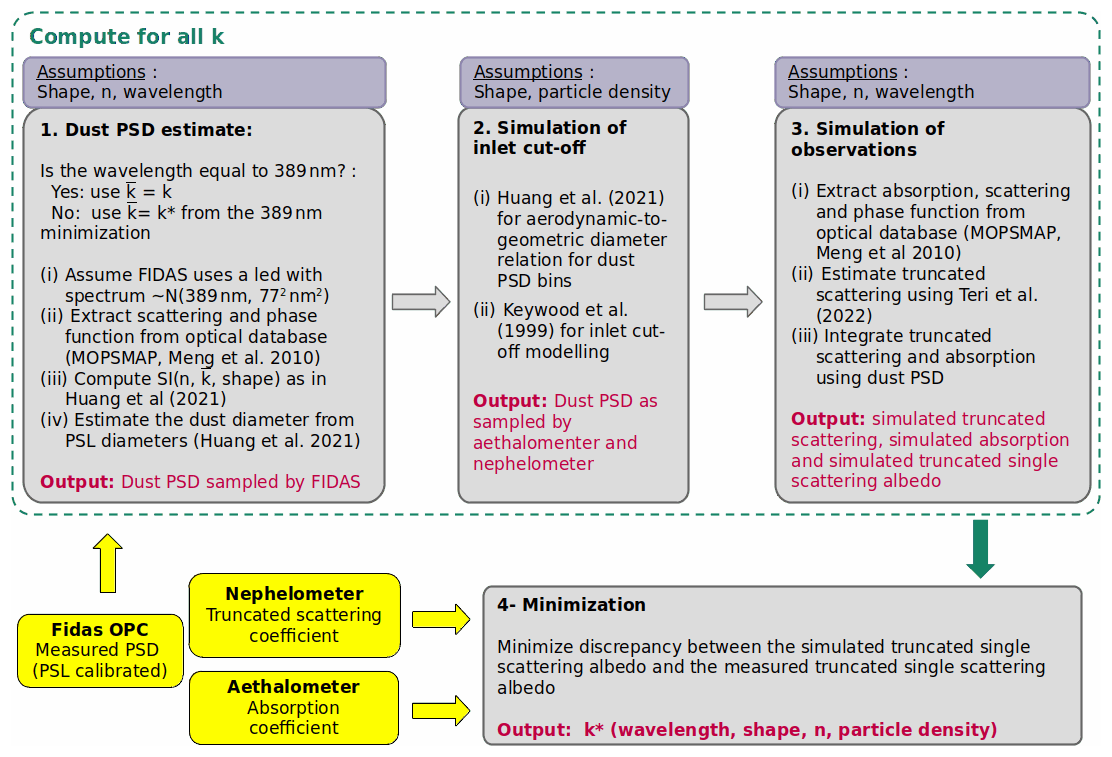
Figure 2Procedure to estimate k. The algorithm is done for every 15 min averaged measurement and for every shape, n, particle density and wavelength independently.
2.6.1 Estimation of the dust PSD
The number PSD measured by the Fidas is reported in terms of PSL-calibrated optical diameters. Since PSL particles are spherical and non-absorbing, whereas mineral dust particles are non-spherical and absorbing, these optical diameters must be converted into dust geometric diameters before being used in the retrieval. As described in González-Flórez et al. (2023), we follow the general approach of Huang et al. (2021), which compares the sideward scattered intensity expected for PSL particles with that expected for dust particles under prescribed assumptions for shape and refractive index.
The Fidas manufacturer does not provide the full spectral response of the light source or the detailed instrumental response function. Therefore, the Fidas was not treated as monochromatic. Instead, we inferred an effective Gaussian light-source spectrum by analysing the Fidas conversion software, which converts PSL-calibrated PSDs into PSDs for spherical aerosols with different refractive indices. Using the known side-scattering geometry of the instrument, (90°±5°), and a Lorenz–Mie scattering model, we optimized this effective spectrum to reproduce the manufacturer-provided conversions. The resulting spectrum was centred at 389 nm, with a standard deviation of 77 nm. The sideward scattered intensity used in the optical-to-geometric diameter conversion was then computed by integrating over this effective spectrum, rather than by assuming a single wavelength. Although this approach makes the conversion internally consistent with the manufacturer tables, uncertainty in the exact instrumental spectral response remains a limitation and may propagate into the converted PSD and the retrieved k.
For PSL particles, the sideward scattered intensity was computed using Lorenz–Mie theory. For dust particles, the scattered intensity depends on the assumed particle shape and refractive index. We therefore performed the conversion for several prescribed particle-shape assumptions. These include spheres as a reference case (Sph); biaxial spheroids using aspect-ratio information derived from campaign-specific single-particle analyses by Panta et al. (2023) (Bi dist); the spheroid aspect-ratio distribution of Dubovik et al. (2006) and reported in the GRASP spheroid package, which is relevant for comparison with remote-sensing retrievals (Dub-06); triaxial ellipsoids from Meng et al. (2010a) using also the campaign-specific median aspect ratio and a height-to-width ratio of 0.45 (Huang et al., 2021); and the six irregular dust shapes (A to F) from the MOPSMAP database (Gasteiger and Wiegner, 2018a).
The single-shape calculations are not intended to represent the full atmospheric dust population. Instead, they are used as controlled sensitivity cases to quantify how different plausible particle morphologies affect the OPC diameter conversion and the retrieved k. Where observationally or methodologically justified distributions are available, such as the campaign-derived spheroid distribution and the Dubovik et al. (2006) distribution, we use these distributions as more representative spheroidal cases.
The conversion from optical to geometric diameter was performed independently for each prescribed particle-shape assumption, particle density, and refractive-index configuration. For the retrieval, the value of k at the effective OPC wavelength was first estimated consistently with the diameter conversion. Once this conversion was obtained, the resulting dust geometric PSD was used to simulate absorption and truncated scattering at the AE33 wavelengths and to retrieve k at each wavelength.
2.6.2 Scattering and absorption simulations
For each prescribed particle-shape assumption, particle density, and real refractive index, the converted dust geometric PSD was used to simulate absorption and truncated scattering coefficients. Single-particle optical properties databases were obtained from the optical-property databases of Gasteiger and Wiegner (2018a) and Meng et al. (2010a), depending on the assumed particle shape. The simulated optical coefficients were then integrated over the converted PSD and over the size range corresponding to the PM2.5 optical inlet.
For consistency with the measurements used in the retrieval, we simulated the angular response and truncation of the Aurora 4000 nephelometer rather than comparing the observations with a full-phase-function scattering coefficient. Specifically, the simulated scattering phase function was integrated over the nephelometer angular sensitivity following Eq. (11) of Teri et al. (2022). This provided the simulated truncated scattering coefficient, directly comparable to the uncorrected nephelometer scattering coefficient, (tsca), defined in Sect. 2.2. The corresponding simulated truncated single scattering albedo, tssa was then calculated.
This use of truncated scattering avoids applying an additional correction from truncated to full-phase-function scattering in the retrieval itself, which would introduce further assumptions about particle shape and the scattering phase function.
The Fidas measures particles over a broader size range and through a different inlet than the optical instruments. Therefore, before computing the optical coefficients, the converted Fidas PSD was transformed into a PM2.5-equivalent PSD representative of the aerosol population sampled by the optical instruments. To do this, we applied an inlet transmission efficiency using a sigmoid function following the PM2.5 URG model described by Keywood et al. (1999), rather than imposing a sharp cut-off.
The inlet transmission was applied in aerodynamic-diameter space and then related to the dust geometric PSD. The conversion between aerodynamic and geometric diameter depends on particle density and particle shape. We computed this conversion following Huang et al. (2021), based on the formulation of Bagheri and Bonadonna (2016), which accounts for the effects of particle density and dynamic shape factor. Thus, for each particle-shape assumption and particle density, the PM2.5 inlet efficiency was mapped onto the corresponding dust geometric diameters and applied to the converted Fidas PSD before simulating absorption and truncated scattering.
Particle density affects the aerodynamic-to-geometric diameter conversion and therefore the effective upper diameter included in the PSD. We use a central density value of 2.15 g cm−3, derived from samples collected during the campaign, and perform sensitivity tests using 1.8 and 2.5 g cm−3. These values are used to quantify the effect of density uncertainty on the PM2.5-equivalent PSD and on the retrieved k. The retrieval is also repeated for the prescribed range of real refractive indices and for the lower, central, and upper values of the AE33 multiple-scattering correction parameter (C), derived from the 95 % confidence interval reported by Yus-Díez et al. (2025). These sensitivity tests quantify how uncertainties in particle density, n, particle shape, inlet-efficiency mapping, and AE33 absorption correction propagate into the retrieved k.
The retrieval is restricted to the PM2.5 period because this period provides the longest and most stable dataset for matching the optical measurements with the Fidas PSD. Extending the retrieval to the PM10 period would increase the sensitivity to large-particle sampling, inlet transmission, particle losses, and the validity range of the optical-property databases, and is therefore not attempted here.
2.6.3 Minimization procedure
The minimization was performed independently for each AE33 wavelength using 15 min averaged measurements with collocated Fidas PSD, AE33 absorption, and nephelometer scattering data. The retrieval was restricted to periods classified as dust events during the PM2.5 part of the campaign, following the criteria described in Sect. 3.1. For each time step, wavelength, prescribed particle-shape assumption, particle density, real refractive index n, and AE33 correction case, we searched for the value of k that minimized the quadratic difference between the measurement-derived and simulated truncated single scattering albedo.
The minimization was performed on a predefined grid of plausible k values. The algorithm therefore does not require an iterative stopping criterion: all grid values are evaluated, and the value of k corresponding to the minimum is retained as the retrieved value for that specific set of assumptions.
The real part of the refractive index was not retrieved simultaneously with k. Instead, the retrieval was repeated for fixed values of n between 1.48 and 1.55, in increments of 0.005, following the range of values reported for mineral dust by Di Biagio et al. (2019). This choice reflects the limited sensitivity of tssa to n, as well as the uncertainties associated with using a Fidas PSD measured through a different inlet from the AE33 and nephelometer. The resulting dependence of retrieved k on the prescribed value of n is evaluated in Sect. 3.3.
The retrieval was also repeated for the particle-shape assumptions described in Sect. 2.6.1, for the particle densities described in Sect. 2.6.2, and for the lower, central, and upper AE33 multiple-scattering correction cases. The resulting values of k should therefore be interpreted as conditional retrievals under prescribed assumptions for particle shape, particle density, n, and AE33 absorption correction. We do not retrieve particle shape, and the different shape assumptions are used to quantify the sensitivity of k to the optical representation of dust morphology.
We performed Observing System Simulation Experiments (OSSEs), described in the Supplement, to test the inversion method and to quantify the sensitivity of the retrieval to the main input variables and assumptions. The OSSEs use prescribed true values of the PSD, absorption coefficient, truncated scattering coefficient, particle density, particle shape, and refractive index, and then apply controlled perturbations to generate synthetic observations. These experiments illustrate the rationale for using the tssa-based cost function and the truncated-scattering observation operator, and evaluate how perturbations in abs, tsca, PSD, particle density, particle shape, and n propagate into the retrieved k.
Importantly, the OSSEs distinguish between approximately uniform particle-number perturbations and size-dependent PSD-shape perturbations. They show that the tssa-based cost function reduces the sensitivity of retrieved k to absolute particle-number mismatches because it is based on a ratio. However, they also show that size-dependent PSD-shape distortions can still introduce systematic uncertainty, because they modify the relative contribution of different particle sizes to absorption and truncated scattering. These experiments therefore support the interpretation of the retrieved values as conditional estimates of k, rather than as a unique unconstrained retrieval of dust shape, PSD, n and k.
Using the campaign measurements as inputs for the retrieval we report two complementary estimates for each possible configuration. First, we retrieve k from the optical and PSD measurements averaged over all PM2.5 dust-event periods. Second, we retrieve k independently for each 15 min dust-event interval and summarize the resulting distribution. The former provides a retrieval representative of the mean dust-event optical properties, whereas the latter quantifies the temporal variability of the retrievals during dust-event conditions.
2.6.4 Retrieval of k from AERONET
To contextualize our in-situ retrievals, we derived a dust-specific k climatology from the AErosol RObotic NETwork (AERONET) version 3, level 2.0 Almucantar retrievals (Giles et al., 2019; Sinyuk et al., 2020). The purpose of this comparison is not to provide a strict validation of the in-situ retrievals, because AERONET products are column-integrated and retrieval-dependent, whereas our measurements are near-surface and source-region observations during a specific field campaign. Instead, the AERONET retrievals are used to place the campaign results in the context of longer-term dust-dominated retrievals from nearby and regional dust-source areas.
Dust-dominated AERONET retrievals were identified following the filtering methodology of Obiso et al. (2024), which applied a set of criteria to exclude retrievals contaminated by other absorbing aerosols, such as carbonaceous species. AERONET hourly retrievals were classified as dust events when the fine-mode volume fraction was below 10 %, ensuring that the dataset was dominated by coarse particles. We additionally required SSA to increase from 440 to 675 nm, a spectral behaviour characteristic of dust that helps distinguish it from fine anthropogenic aerosols and sea salt (Dubovik et al., 2002). To further reduce the influence of absorbing black and brown carbon, we excluded cases where the mean k at red and infrared wavelengths, calculated over 675, 870, and 1020 nm, exceeded 0.0042, following the threshold proposed by Schuster et al. (2016).
Using this filtered dataset, we first computed the dust-specific climatology of k at the Ouarzazate AERONET station, the closest site to our field measurements (160 km away). We then extended our analysis to major global dust source regions including western and eastern North Africa, the Sahel, the Arabian Peninsula, central Asia, and India, using the stations shown in Fig. S10a. For the regional analysis, the statistical metrics of k, including mean values and percentiles, were computed using optical depth weighting. This weighting gives greater influence to retrievals with larger dust optical depth and therefore better represents dust-dominated conditions. For the comparison with our in-situ retrievals, the values of k retrieved at the AE33 wavelengths were interpolated or extrapolated to the AERONET wavelengths of 440, 550, 675, 870, and 1020 nm. We compare AERONET-derived k primarily with the in-situ retrievals obtained using the Dubovik et al. (2006) spheroid aspect-ratio distribution, because this particle-shape representation is more consistent with assumptions used in AERONET-type retrievals. Other particle-shape assumptions are also shown to illustrate the sensitivity of the in-situ k retrievals to shape.
In addition to k, we extracted the dust-filtered AERONET volume size distributions at Ouarzazate for qualitative comparison with the Fidas-derived PSDs measured during the campaign. This comparison is used only to assess potential differences in particle-size representativeness between the two datasets. The Fidas measurements represent near-surface in-situ PSDs at the source-region site and are restricted to the period and size range used in the retrieval, whereas AERONET size distributions are column-integrated and depend on the assumptions of the radiance inversion. Differences between the two PSDs can therefore contribute to discrepancies between in-situ and AERONET-derived k, in addition to differences associated with particle shape, mineralogy, and possible residual aerosol contamination. This caveat is important because previous studies have shown that AERONET dust retrievals may be affected by uncertainties in the representation of coarse and super-coarse dust, with implications for retrieved absorption properties.
3.1 Overview of the optical properties during the measurement campaign
The campaign was characterized by generally calm conditions in the early morning, followed by stronger winds in the afternoon, leading to frequent local saltation and dust emission. This pattern followed the diurnal cycle of solar heating and the resulting destabilization of the near-surface atmospheric layers. On some days, the site was also influenced by the advection of local anthropogenic particles from up-river villages. Additionally, two intense cold pool outflows, referred to as haboobs, were recorded on 4 and 6 September 2019. A more detailed discussion of the atmospheric conditions, turbulence parameters, and dust fluxes during the campaign is provided in González-Flórez et al. (2023).
Two distinct measurement periods were defined based on the inlet cut-off of the optical measurements. During the initial part of the campaign, from 4 until 26 September 2019, the AE33 and nephelometer sampled through a PM2.5 inlet. From 26 September 2019 until the end of the campaign, the optical measurements were performed using a PM10 inlet. Figure S1 in the Supplement shows the temporal evolution of extensive and intensive optical properties, mass concentration, particle effective radius, wind speed, and friction velocity throughout the full campaign.
To analyze the dominant aerosol conditions during the measurement period, we identified three representative periods. Period A corresponds to local dust emissions on 21–22 September 2019. Period B corresponds to the haboob-driven dust event on 6–7 September 2019). Period C corresponds to a period influenced by anthropogenic pollution advection mixed with minor local dust emissions between 7 and 11 September 2019. These periods are highlighted in Fig. 3 and are used to illustrate the range of optical conditions observed during the campaign.
Table 1 summarizes the time-averaged optical properties for the PM2.5 and PM10 periods, distinguishing between the full measurements, dust-event conditions, and the three defined periods. Dust events during the PM2.5 period were identified using three criteria: AAE above 1.5, SSAAE below 0, and a mass concentration above 10 µg m−3 (Collaud Coen et al., 2010; Ealo et al., 2016). Extensive optical properties are presented with their standard errors. Intensive optical properties are summarized using two approaches: (i) averages weighted by the corresponding extensive properties, namely absorption, scattering, or extinction, and (ii) direct time averages with standard errors. The weighted averages emphasize conditions with elevated dust concentrations, while the direct averages reflect the overall variability of the campaign. This variability is further showcased in Figs. S2–S5.
Table 1Summary of mean values and standard errors for the measured and computed optical properties described in Sect. 2 during the full period, dust events, and during the three specific periods (A, B, C). Data are presented as time averages (regular font) and weighted means (italic font). Results are categorized by inlet cut-off periods: PM2.5 (from 4 September 2019 00:00 UTC to 26 September 2019 12:00 UTC) and PM10 (from 26 September 2019 12:00 UTC to the end of the measurements). The number of measurements (N) corresponds to the 15 min averages used in the analysis.
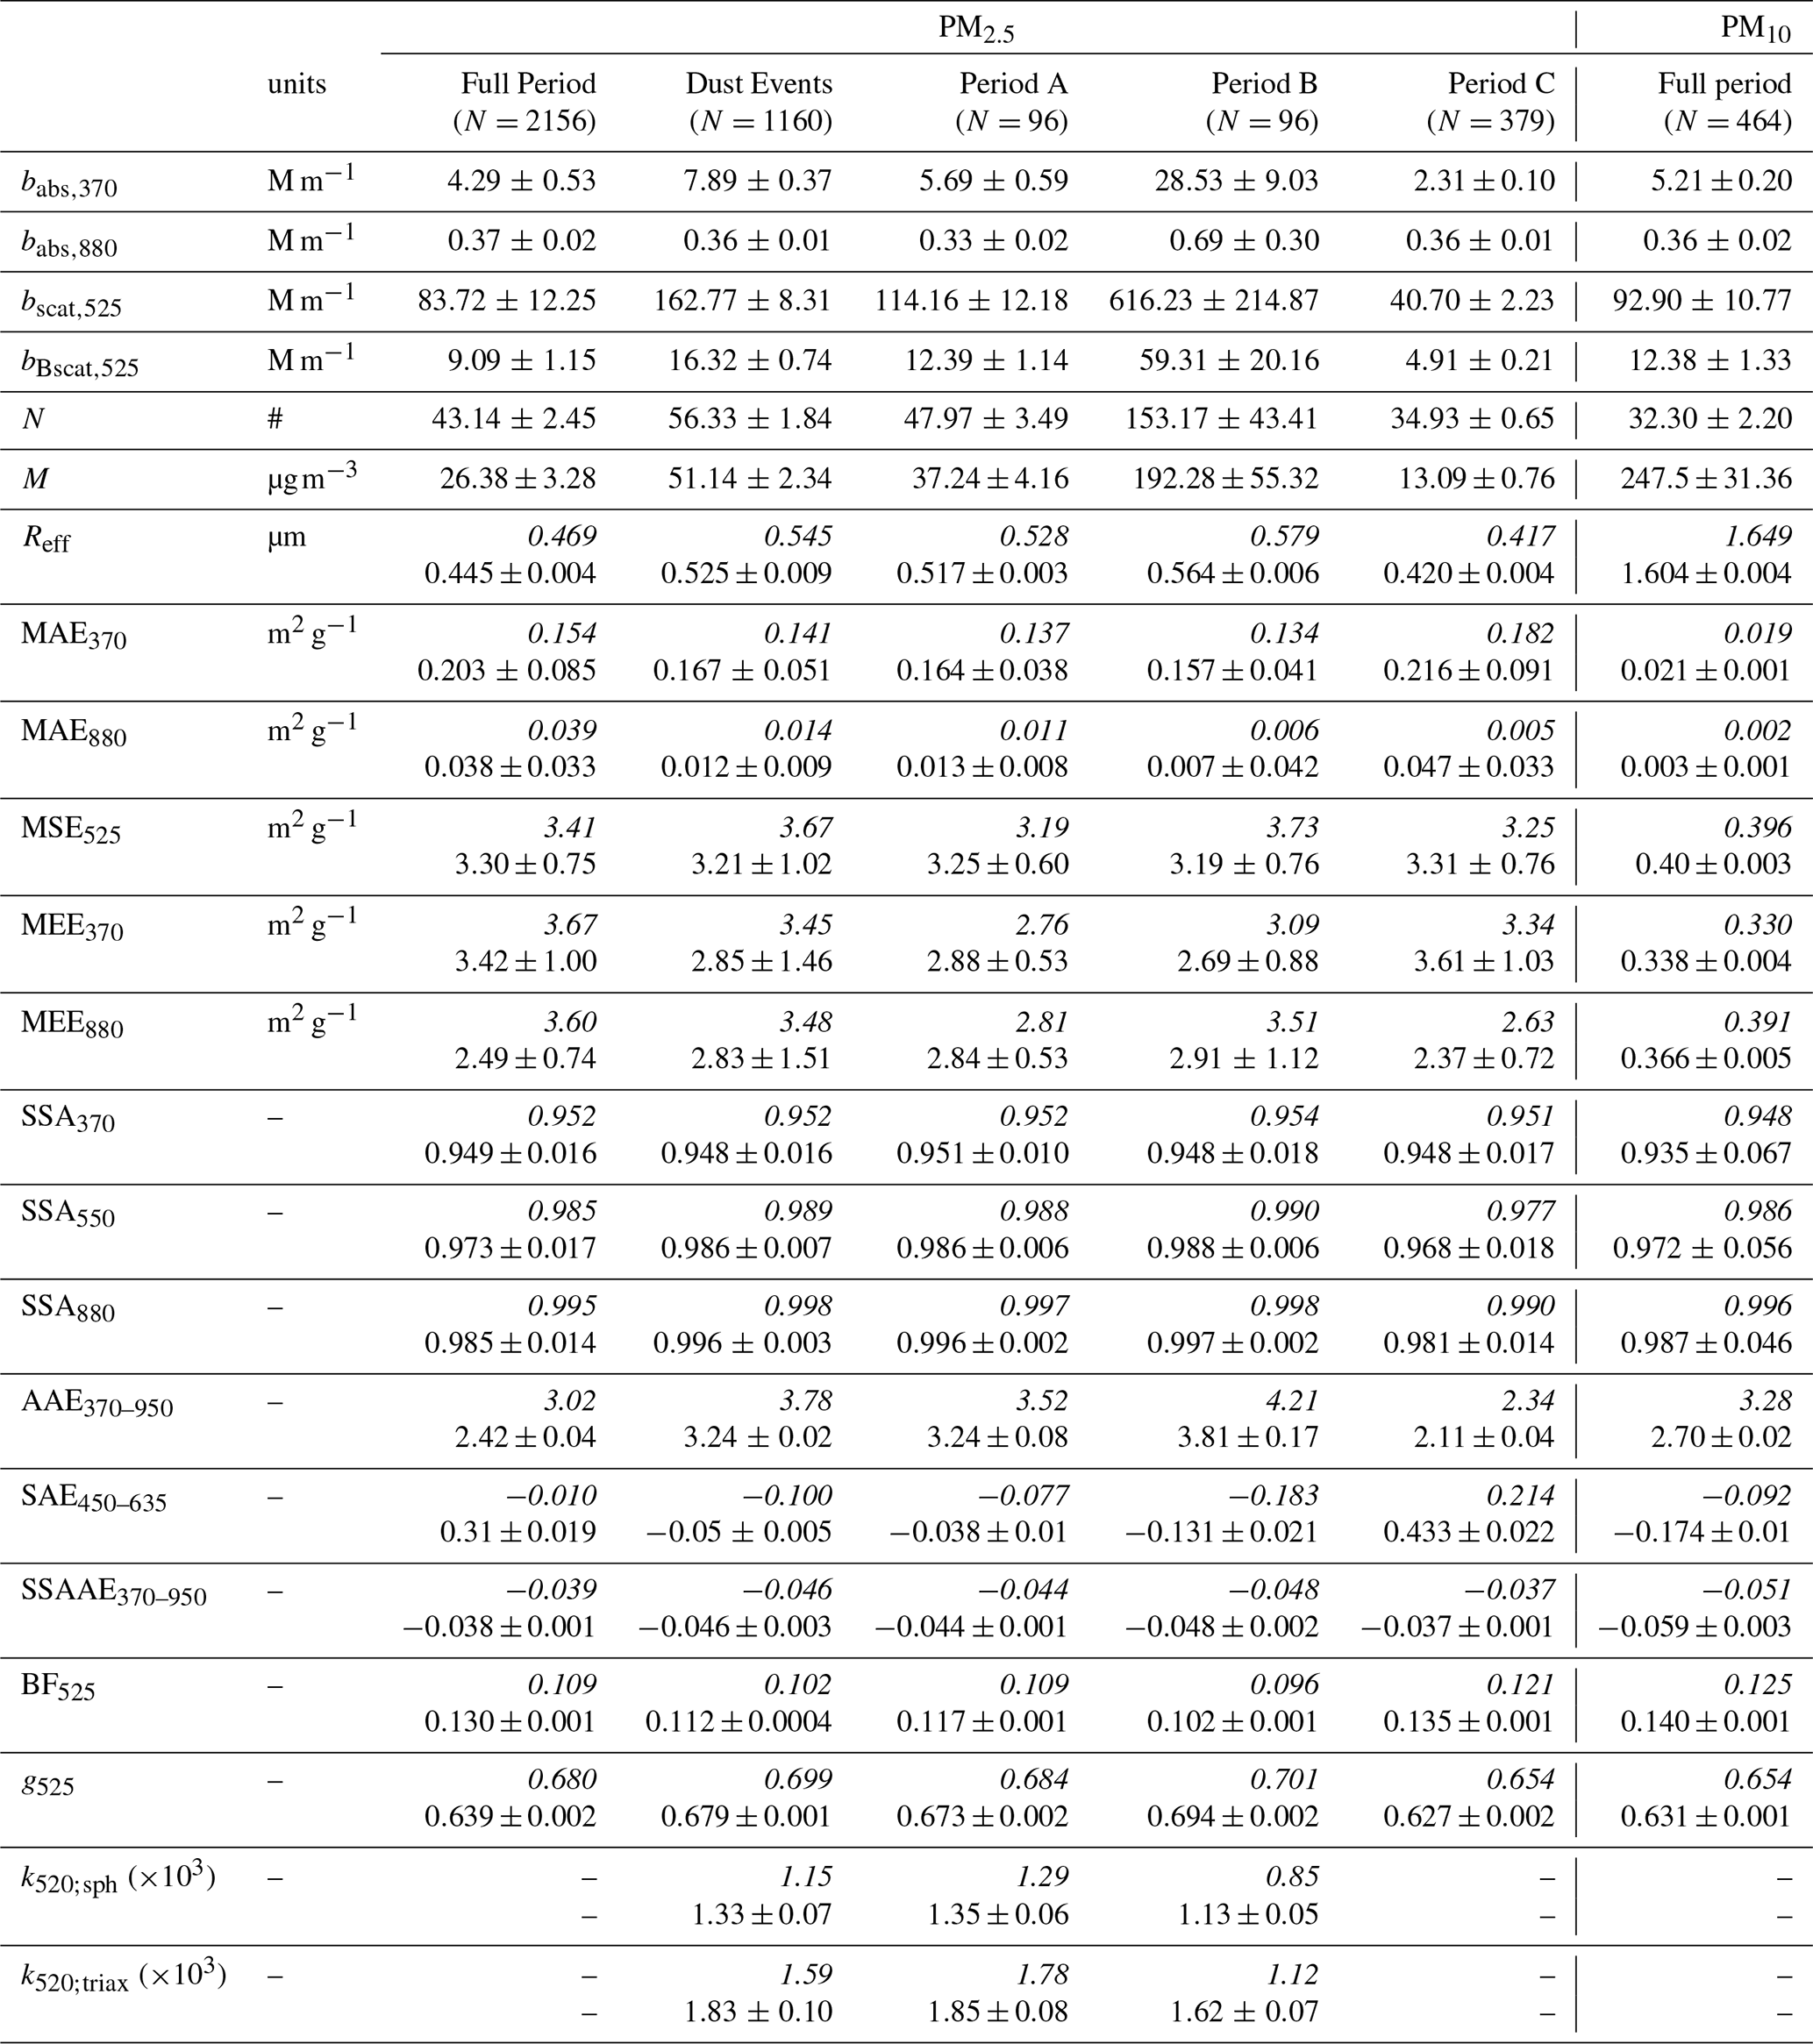
Period A, dominated by local dust emissions, closely resembles the average dust-event conditions, confirming that such local emissions were common during the campaign. Period B, corresponding to the haboob event, exhibits intensive optical properties similar to those of Period A, but with substantially larger extensive optical properties because of the higher dust mass concentration. In contrast, Period C, influenced by anthropogenic pollution, shows lower mass concentrations and therefore lower absorption and scattering coefficients. However, it exhibits much higher mass absorption efficiencies, particularly at longer wavelengths. This indicates an enhanced contribution of fine carbonaceous particles to the optical properties measured at the site during periods of weak easterly winds and limited local dust emission, as discussed in González-Flórez et al. (2023).
Figure 3 and Table 1 show that, during PM2.5 dust events, SSA was around 0.955 at 370 nm, 0.985 at 550 nm and 0.993 at 880 nm. During the same conditions, AAE values were elevated relative to anthropogenic-dominated periods and SAE remained below 0, consistent with a dominant contribution from coarse mineral dust and stronger absorption at shorter wavelengths. Brief decreases in effective radius, accompanied by dips in SSA and increases in SAE and k, again suggest intermittent advection of anthropogenic particles to the site during periods of low wind speed and weak dust emission. For PM10, SSA was lower, with values of approximately 0.945 at 370 nm, 0.974 at 550 nm and 0.984 at 880 nm (Table 1).
A comparison with other dust SSA measurements compiled in Table S1 of the Supplement of Adebiyi et al. (2023) shows that our PM10 results lie well within the general range of Saharan dust SSA values reported by previous in-situ and remote-sensing studies. For example, Schladitz et al. (2009) reported an SSA of 0.957 at 537 nm in Tinfou and Johnson and Osborne (2011) reported an SSA of 0.971 at 550 nm in Western Sahara. As expected, the PM2.5-based values in our study, which emphasize the finer fraction of the sampled dust, tend towards slightly higher SSA at near-infrared wavelengths.
Many of the measurements compiled in Adebiyi et al. (2023) correspond to broader particle size ranges or to long-range transported dust. Such differences can affect SSA because the inclusion of coarser particles, as well as changes in particle morphology, composition, and mixing state during transport, can modify both scattering and absorption. The effect of particle size on the optical properties measured during our campaign is analysed in Sect. 3.2. Furthermore, Table S1 of Adebiyi et al. (2023) includes dust sampled across regions where mineralogy and aerosol mixing states can differ from freshly emitted dust in southeastern Morocco, including samples collected far from the source area, such as Cabo Verde, the Canary Islands, the Atlantic outflow and the West Mediterranean. Therefore, although our SSA measurements overlap with previous studies, differences in size range, sampling region, dust ageing, and possible aerosol mixing must be considered when comparing results across datasets.
The mass efficiencies, MAE, MSE and MEE, show strong sensitivity to inlet cut-off, with variations approaching 1 order of magnitude. This is expected because most of the mass concentration of mineral dust is found in the coarse fraction. The MAE obtained here for dust events during the PM2.5 period, 0.141 m2 g−1 at 370 nm, is higher than the value reported by Caponi et al. (2017) for Saharan dust, 0.107 m2 g−1 at 375 nm, but much lower than the value reported for Sahelian dust, 0.711 m2 g−1 at 375 nm. This comparison illustrates the large variability in dust absorption efficiency across source regions. The asymmetry parameter and backscatter fraction during dust events, 0.68 and 0.11, respectively, fall within the range reported by Horvath et al. (2018) for Saharan dust, 0.71 ± 0.03 and 0.094 ± 0.014, respectively.
The higher absorption efficiency in Period C is associated with the presence of anthropogenic aerosol particles, particularly between midnight and noon. This interpretation is supported by AAE and SAE values close to 1, SSAAE values close to zero or positive, a significantly smaller effective radius compared with dust events (0.42 vs 0.54 µm), and a lower SSA at 880 nm of around 0.978. Together, these features indicate a larger relative contribution of fine particles (González-Flórez et al., 2023) and a higher apparent imaginary refractive index (k). Consistently, the mass absorption efficiency strongly increases from ∼ 0.141 to ∼ 0.182 m2 g−1.
Although the average of the full measurement period exhibits a clear dust optical signature, the overall values are influenced by Period C. This highlights that, even at remote and relatively isolated dust-source locations, regional and local anthropogenic pollution can impact dust measurements.
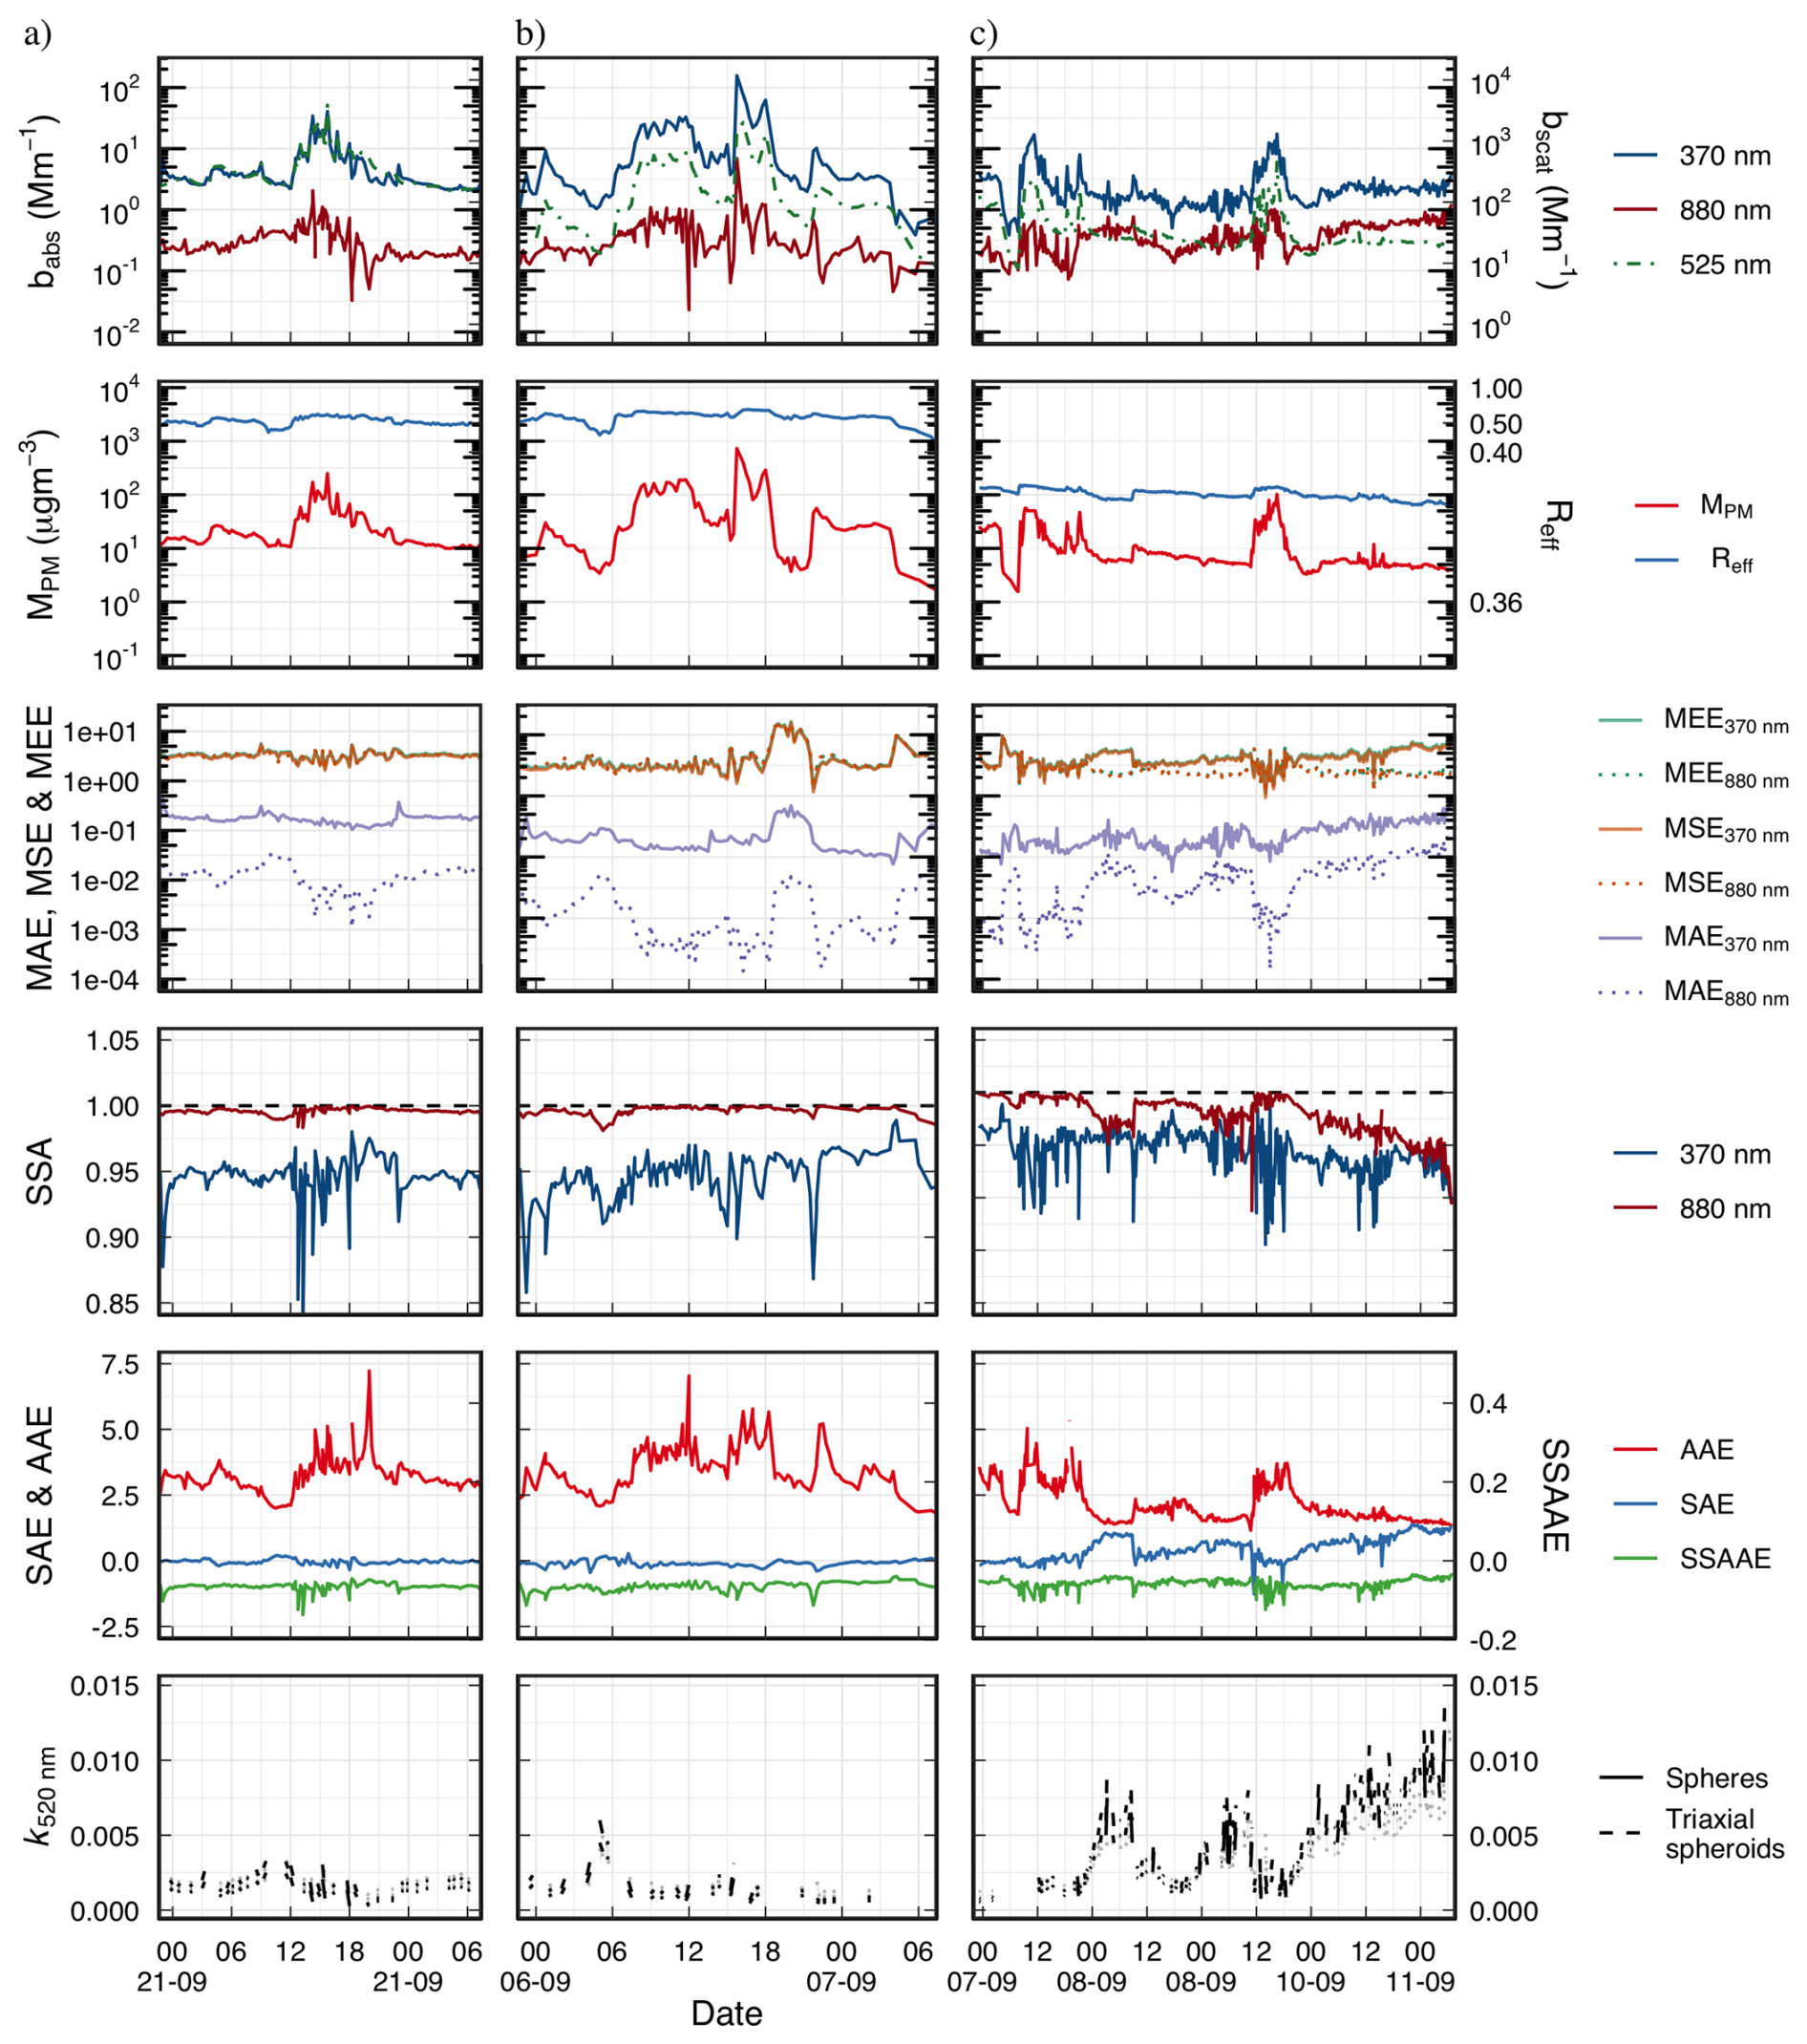
Figure 3Time evolution of key optical and physical properties during the highlighted measurement periods: (a) Period A (midnight 21 September to morning 22 September 2019), (b) Period B (midnight 6 September to morning 7 September 2019), and (c) Period C (midnight 7 September to noon 11 September 2019). Each row represents the time series of: absorption (babs) and scattering (bscat) coefficients at 370 and 880 nm; mass concentration (MPM) and effective radius (Reff); mass absorption, scattering, and extinction efficiency (MAE, MSE, MEE) at 370 and 880 nm; single scattering albedo (SSA) at 370 and 880 nm; absorption, scattering, and SSA Ångström exponents (AAE, SAE, SSAAE); and the estimated imaginary part of the refractive index (k) at 520 nm for spheres (solid line), triaxial ellipsoids (dashed line), and a range of values for other shape assumptions described in Sect. 2.6
The last row of Fig. 3 illustrates the temporal evolution of the conditionally estimated imaginary part of the complex refractive index (k) at 520 nm for different shape assumptions: spheres (solid line), triaxial ellipsoids (dashed line), and the full range of values considered in Sect. 2.6. During dust events, k remains relatively stable. In contrast, Period C and the calm wind phases of Periods A and B exhibit increases of up to an order of magnitude, highlighting the stronger influence of absorbing anthropogenic particles during these periods. These k estimates are used here diagnostically to interpret the temporal variability of the optical measurements; the dust-event retrievals and their sensitivity to particle shape, density, and n are analysed in detail in Sect. 3.3.
3.2 Optical properties and their relationship with effective radius
At this measurement site, mineral dust fluxes, wind friction velocity, and particle size are closely interrelated (González-Flórez et al., 2023). In this section, we examine the dependence of the observed optical properties on the effective radius (Reff, cf. Sect. 2.3). The campaign consisted of two distinct measurement periods with different inlet cut-offs (PM2.5 and PM10), which strongly influence Reff because coarse particles dominate the mass during dust emission events.
Figure 4 shows the absorption (babs) and scattering (bscat) coefficients, and SSA as a function of Reff. The upper panels correspond to the PM2.5 period, while the lower panels represent the PM10 period. The average absorption Ångström exponent, AAE, for each Reff bin is also indicated in Fig. 4a, d. For the PM2.5 period, babs exhibits a non-monotonic U-shaped dependence on Reff, initially decreasing until the 0.4–0.5 µm bin and then increasing again for larger sizes. In contrast, bscat increases consistently for Reff>0.4 µm. SSA also shows a clear dependence on Reff, with distinct spectral behaviour between the PM2.5 and PM10 periods.
The observed U-shaped dependence in babs during the PM2.5 period reflects the varying contribution of different aerosol sources. The smallest Reff values, associated with AAE values close to ∼ 1, correspond to periods influenced by transported fine carbonaceous particles. Larger Reff values are associated with local and nearby dust emissions. At small Reff, babs decreases as SSA increases, despite similar bscat values across the first three size bins. For larger Reff, SSA stabilizes and both bscat and babs increase with dust abundance. The spectral dependence of SSA during the PM2.5 period is therefore consistent with a transition from conditions influenced by fine carbonaceous aerosols to conditions dominated by coarser mineral dust. The PM10 period exhibits optical behaviour consistent with the larger Reff bins of the PM2.5 period, reflecting the stronger influence of coarse dust when the broader inlet cut-off is used.
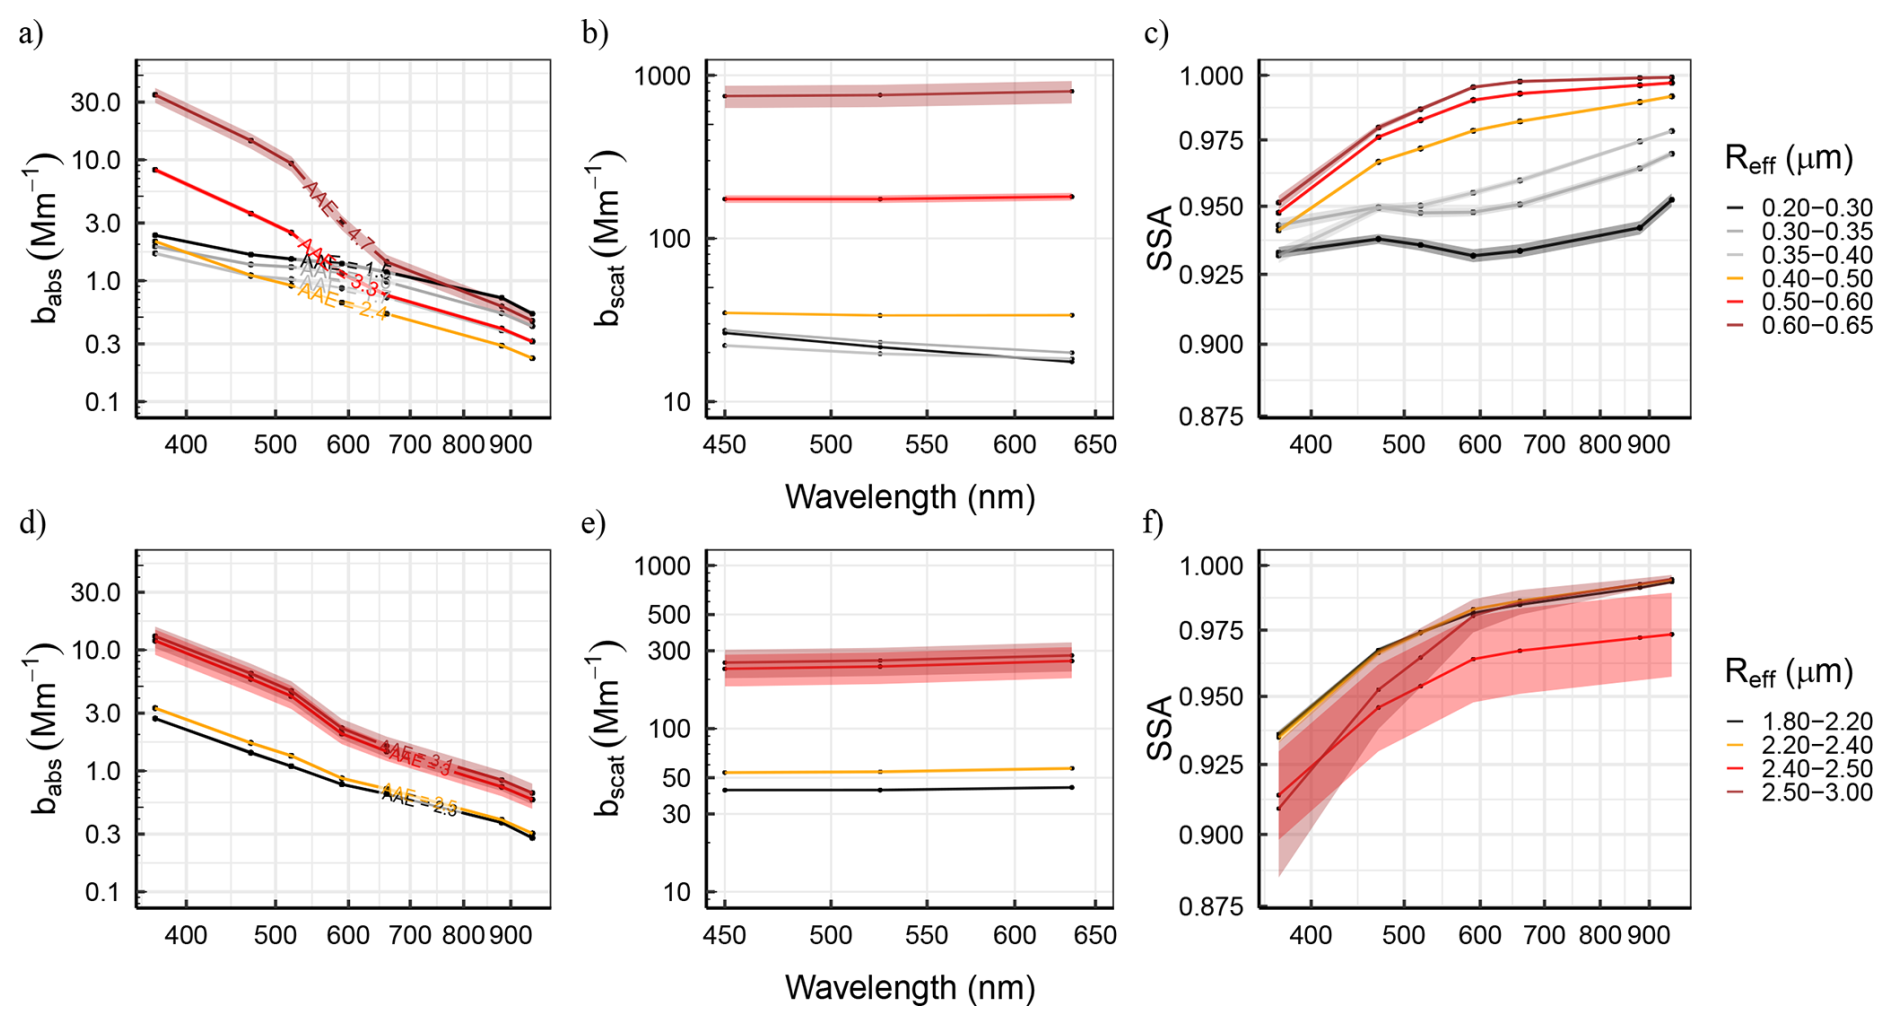
Figure 4Mean and standard error (se) values of the absorption (a, d) and scattering (b, e) coefficients, and the single scattering albedo (SSA; c, f) as a function of wavelength (x-axis) and effective radius (colour scale) at M'Hammid for both PM2.5 (upper panel) and PM10 (lower panel) periods. The log-log plot highlights the enhanced absorption efficiency of dust at short-UV wavelengths, where absorption increases more significantly compared to longer wavelengths. In contrast, BC-influenced particles typically exhibit a nearly linear spectral dependence. The absorption Ångström exponent (AAE) values are indicated along each absorption coefficient curve: from between 1.5 and 1.7 for up to 4.7 for the highest u*'s for PM2.5, and with a range between 2.3 and 3.1 for PM10.
The spectral dependence of babs, bscat, and SSA is further examined through their respective Ångström exponents (Fig. 5). The AAE increases with effective radius, particularly during the PM2.5 period for Reff values above 0.45 µm, where it rises from approximately 1.2 to 2.5. This trend is consistent with increasing friction velocity (u*), indicating stronger local dust emissions. Figure S7 further shows that, during the PM2.5 period, the increase in Reff with wind friction velocity is also associated to higher AAE values. In contrast, during the PM10 period, AAE exhibits a more gradual and steady increase with Reff and u*.
Figure 5 also shows a strong relationship between SAE and effective radius. During the PM2.5 period, SAE decreases markedly, from around 1 to values near or below 0, as Reff increases. During the PM10 period, the high concentration of coarse particles keeps SAE consistently low, generally below 0. Negative SSAAE values have been recognized as a key indicator of Saharan dust events over Europe (Collaud Coen et al., 2004), and this criterion is met for Reff values above 0.3 µm during the PM2.5 period and throughout the PM10 period.
Overall, these results indicate that during the PM2.5 period, when the optical instruments sampled a narrower size range, the dust optical signature became prominent mainly under strong emission conditions. In contrast, during the PM10 period, the inclusion of coarser particles produced a consistently stronger dust optical signature, significantly shaping the spectral behaviour of babs, bscat, and SSA.
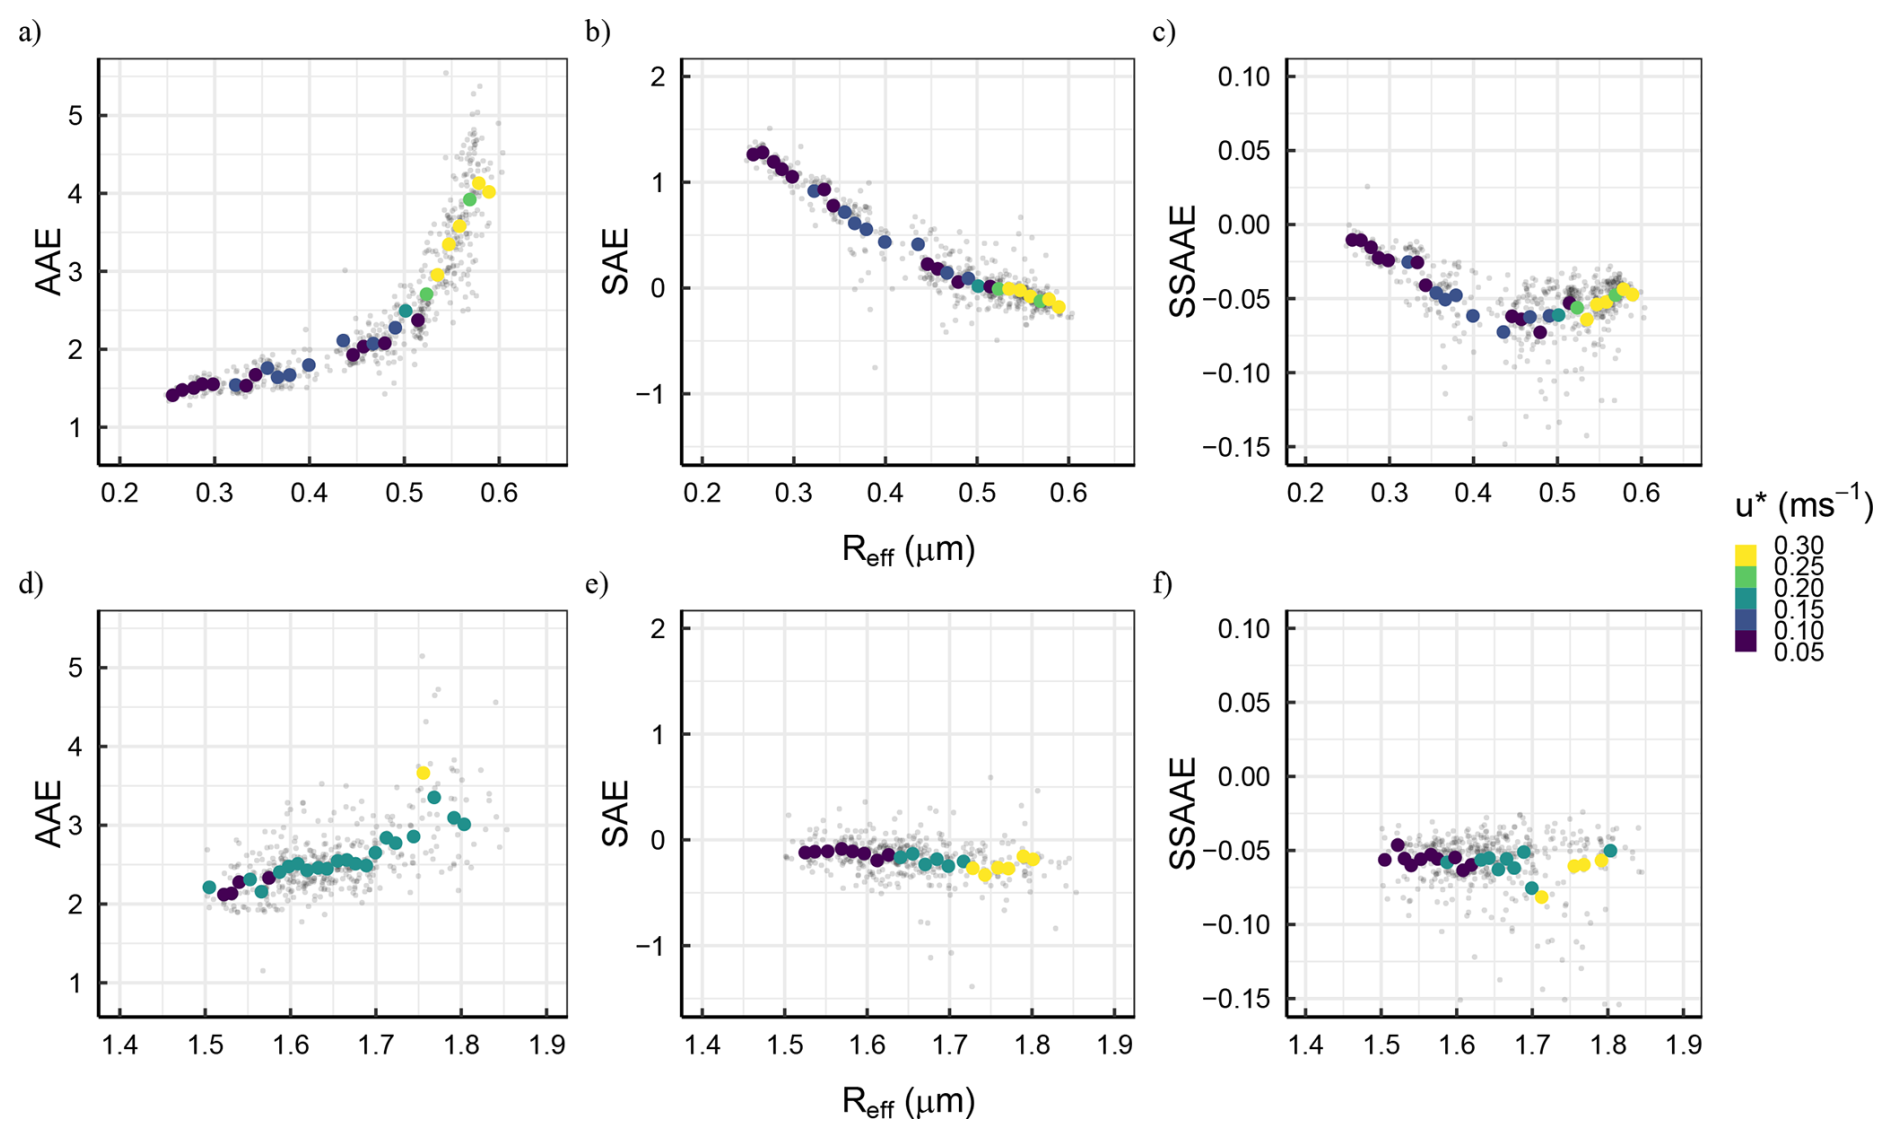
Figure 5Scatter plot of the Absorption Ångström Exponent, AAE (a, d), the Scattering Ångström Exponent, SAE (b, e), and the single-scattering albedo Ångström exponent (SSAAE) as a function of the particle effective radius (Reff) – x-axis – at M'Hammid for both PM2.5 (upper panel) and PM10 (lower panel) periods. The colour scale indicates the average friction velocity, u*, for each Reff bin, with this averaging resulting in the smaller range of u* values. Bins were determined using the Freedman-Diaconis rule (Freedman and Diaconis, 1981) to ensure an optimal balance between resolution and statistical robustness.
Additionally, we computed two key parameters related to the scattering phase function of the particles: the backscatter fraction (BF) and the asymmetry parameter (g). As shown in Fig. 6, forward scattering increases with particle effective radius (Reff), as indicated by increasing g and decreasing BF. The spectral dependence of these parameters also shifts as particles become coarser, with the slope of BF transitioning from negative to positive and that of g from positive to negative. This indicates that finer particles exhibit stronger backscattering at shorter wavelengths, while coarser particles favour forward scattering. During the PM2.5 period, for Reff>0.4 µm, BF decreases from approximately 0.10 at the shortest nephelometer wavelength to approximately 0.09 at the longest wavelength, while g increases from approximately 0.68 to 0.70. During the PM10 period, these spectral variations are less pronounced, with BF values ranging between 0.12 and 0.16 and g values between 0.6 and 0.64. These values are consistent with previous measurements of Saharan dust. Horvath et al. (2018) reported (g) values from about 0.75 to 0.65 and BF values from about 0.07 to 0.12 for Saharan dust advected to the western Mediterranean, while Ryder et al. (2018) reported (g≈0.74) from airborne measurements within the Saharan Aerosol Layer over the Atlantic.
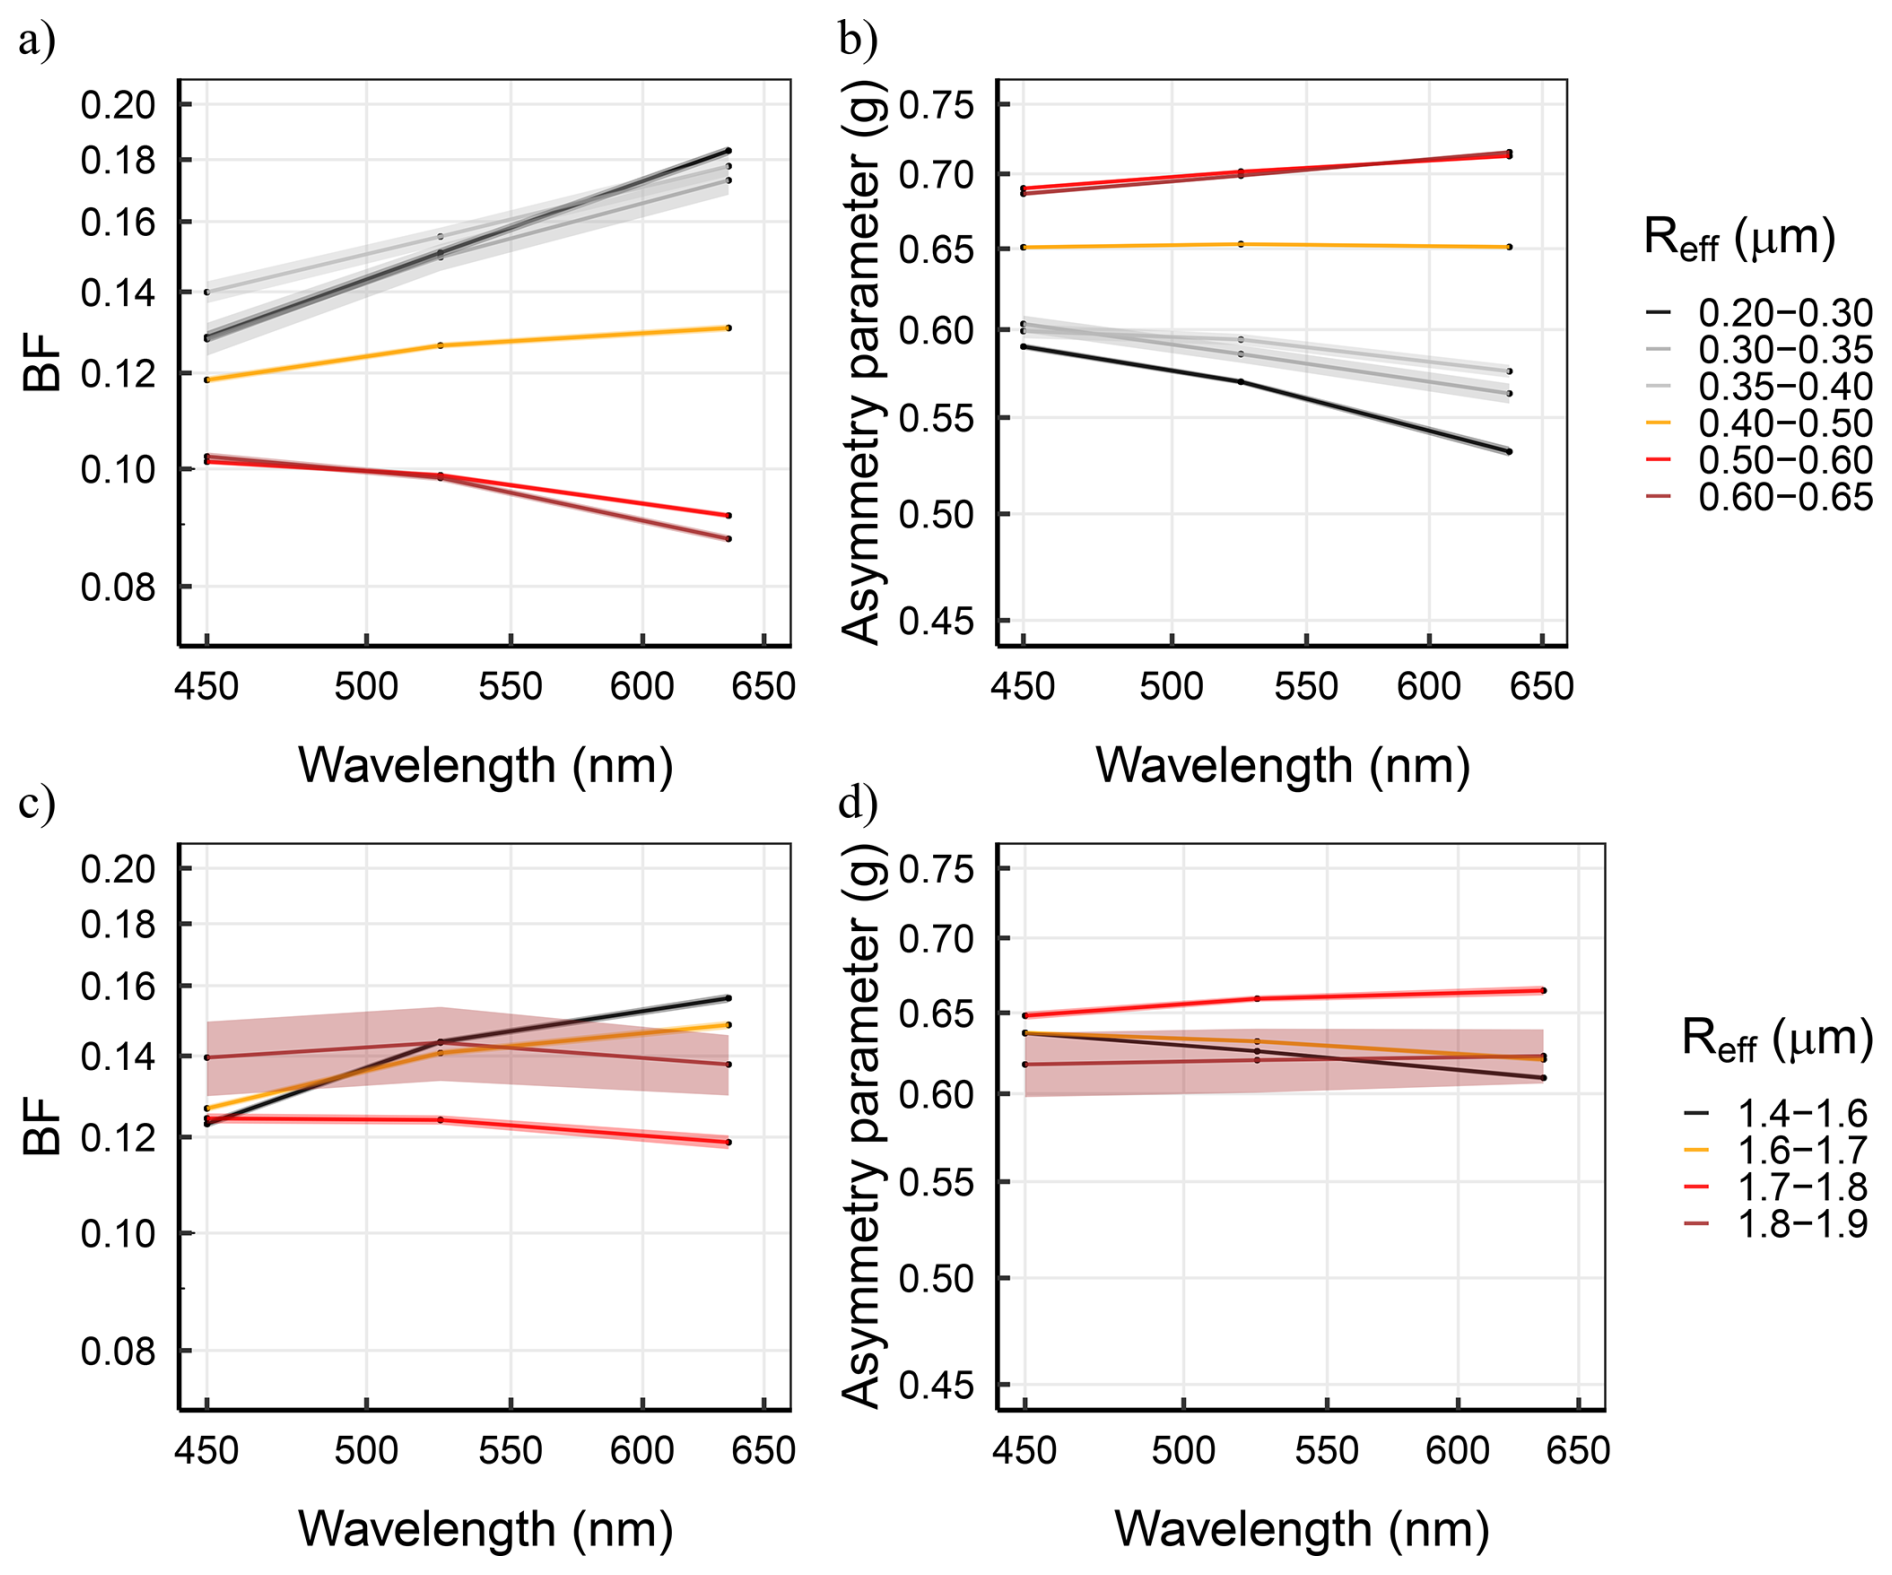
Figure 6Mean (lines) and standard error (se, shaded colours) values of the backscatter fraction, BF (a, c) and the asymmetry parameter (b, d) as a function of the wavelength (x-axis in logarithmic scale) and the effective radius (colour scale) at M'Hammid for both PM2.5 (upper panel) and PM10 (lower panel) periods.
Figure 7 shows the mass absorption, scattering, and extinction efficiencies as a function of wavelength and Reff. Regardless of the inlet cut-off period, MAE consistently decreases as particle size increases. During the PM2.5 period, noting the logarithmic y-axis, MAE values drop by approximately 1 order of magnitude, from ∼ 0.30 to 0.15 m2 g−1 at short-UV wavelengths and from ∼ 0.12 to 0.02 m2 g−1 at near-infrared wavelengths. This decrease reflects the lower absorption per unit mass of larger mineral dust particles compared with smaller particles, which include a greater relative contribution from fine absorbing aerosols during some periods.
The scattering and extinction efficiencies show a different behaviour across the two inlet cut-off periods. During the PM2.5 period, MSE decreases with wavelength for particles with Reff below 0.4 µm, consistent with the stronger scattering efficiency of fine particles at shorter wavelengths (Hansen and Travis, 1974). For coarser particles within the PM2.5, MSE remains more similar across wavelengths. During the PM10 period, MSE declines significantly, both compared to the PM2.5 period and as Reff increases. This behaviour reflects the shifting peak scattering efficiency toward longer wavelengths, beyond the measurement range of this study (Hansen and Travis, 1974). The combined effects of absorption and scattering efficiencies are captured in the MEE trend (Fig. 7c, f), which highlight the distinct optical behaviour of different aerosol regimes: fine particles exhibit higher MAE and MSE, whereas coarser dust particles contribute more strongly to total scattering.
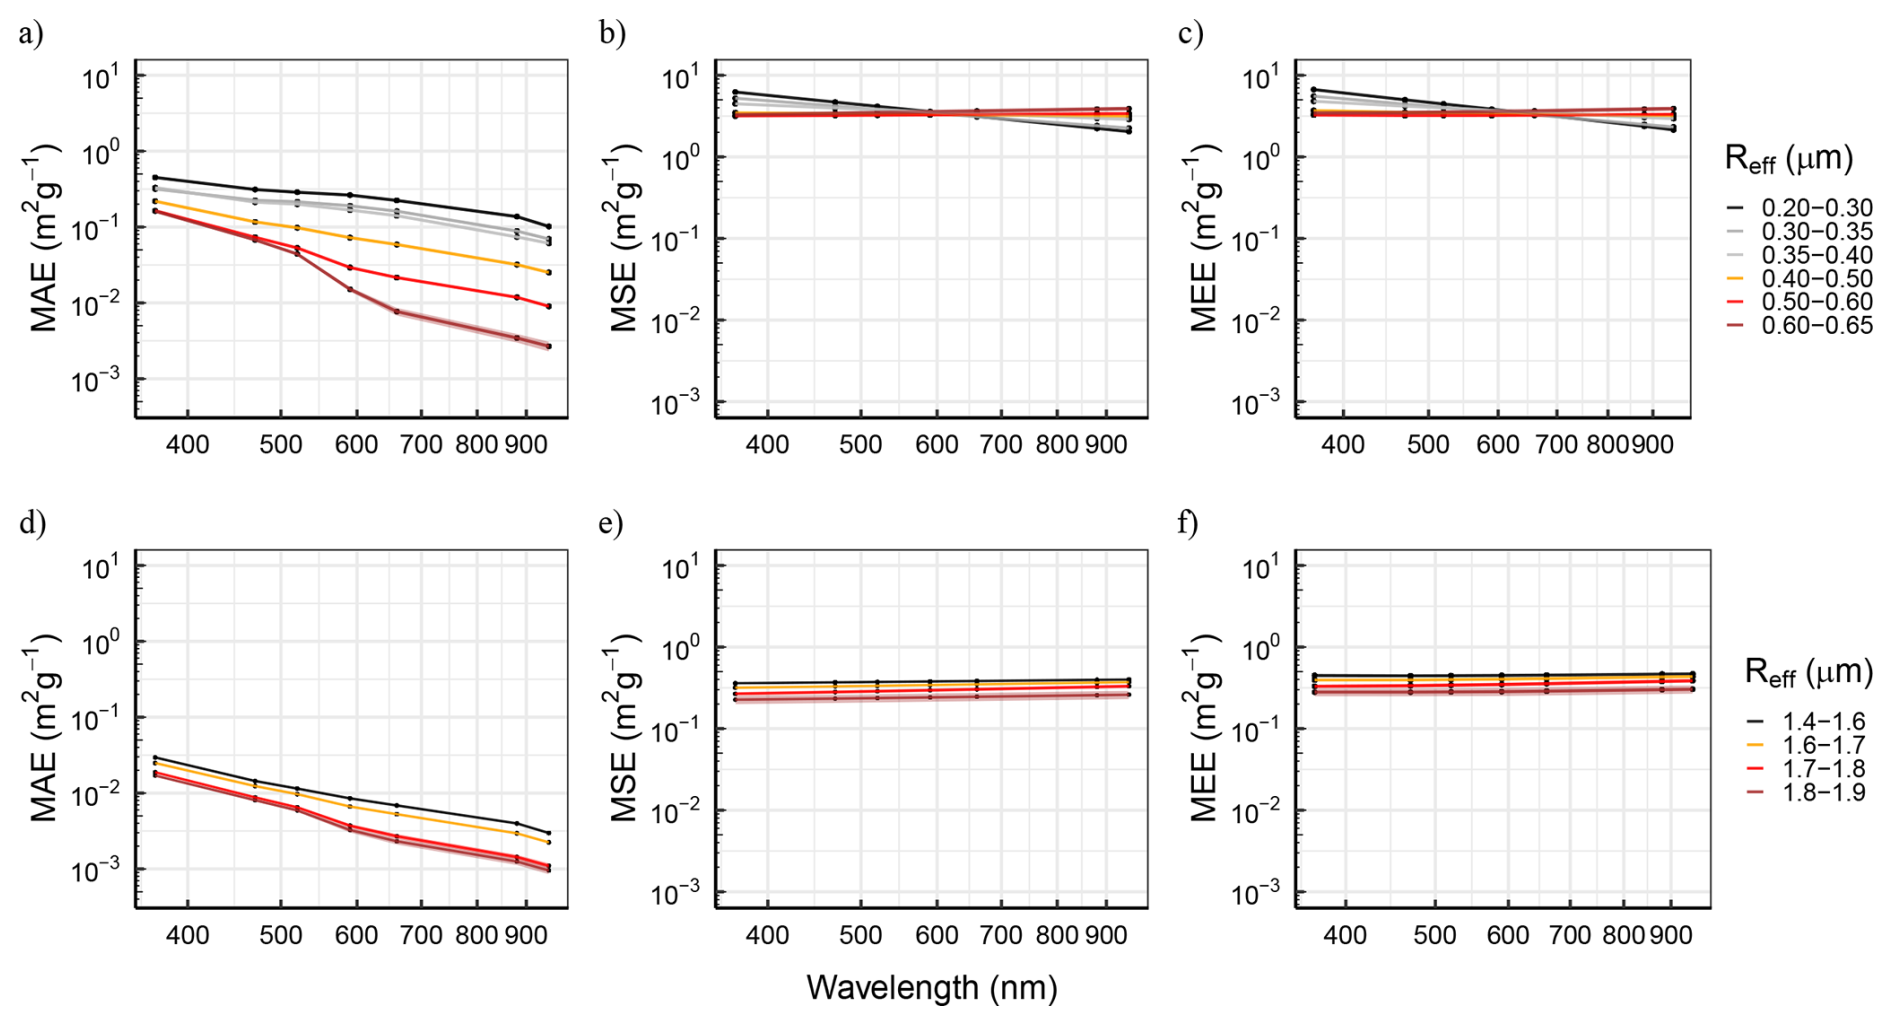
Figure 7Mean and standard error (se) values of the mass absorption, MAE (a, d), scattering, MSE (b, e), and extinction, MEE (c, f) efficiency as a function of the wavelength (x-axis in logarithmic scale and the effective radius (colour scale) at M'Hammid for both PM2.5 (upper panel) and PM10 (lower panel) periods.
3.3 Imaginary part of the refractive index of mineral dust
This section presents the retrieval of the imaginary part of the complex refractive index, k, for mineral dust, following the methodology described in Sect. 2.6. The analysis focuses exclusively on periods classified as dust events (see Sect. 3.1) during the PM2.5 measurement period. As discussed in Sect. 2.6, the retrieved values should be interpreted as conditional estimates of k under prescribed assumptions for particle shape, particle density, the real part of the refractive index, and the AE33 absorption correction.
Two complementary retrieval averages are reported. First, k was retrieved independently for each 15 min dust-event interval. The temporal average of these retrievals is referred to as the average of the retrievals. Second, k was retrieved from the time-averaged dust-event measurements of truncated scattering, absorption, and PSD. This single estimate is referred to as the retrieval of the average. The first approach gives equal weight to each dust-event interval, whereas the second gives greater influence to periods with larger dust loading and more representative mean optical properties.
Figure 8 summarizes the retrieved k values. Panel (a) shows the spectral dependence of (k) for different particle-shape assumptions using the central values (n=1.49, ρp=2.15 g cm−3), and the central AE33 correction. The particle-shape assumptions include spheres (Sph), biaxial spheroids using the aspect-ratio distribution measured during the campaign by Panta et al. (2023) (Bi dist; including oblate and prolate spheroids), biaxial spheroids using the Dubovik et al. (2006) aspect-ratio distribution (Dub-06), triaxial ellipsoids with aspect ratio 1.46 and height-to-width ratio 0.45 (Tri), and the six irregular shapes A–F from Gasteiger et al. (2011). The values reported for the Moroccan sample by Di Biagio et al. (2019) are also shown for comparison.
Panels (b)–(d) of Fig. 8 show the distributions of 15 min retrievals for spheres, biaxial spheroids, and triaxial ellipsoids. Each distribution includes the variability arising from the range of prescribed (n) values, from 1.48 to 1.55 in increments of 0.005, and the three particle-density assumptions, (ρp=1.8, 2.15, and 2.5 g cm−3). The red symbols indicate the retrieval of the average for the central value of (C), while the error bars show the variability introduced by the lower and upper (C) values derived from the 95 % confidence interval of Yus-Díez et al. (2025). The corresponding results for the individual irregular shapes are provided in the Supplement.
Across the five shortest AE33 wavelengths, all shape assumptions show an overall decrease in k with increasing wavelength, consistent with stronger absorption by iron-bearing minerals at shorter wavelengths. The dB19 values for the Moroccan sample fall within the range of our retrievals, except at 950 nm, where their retrieved k increases against the general decreasing trend. The slope of the dB19 k spectrum is somewhat steeper at shorter wavelengths than in our retrievals.
Several factors may explain differences between our estimates and those of Di Biagio et al. (2019). First, the samples and measurement conditions differ: Di Biagio et al. (2019) analysed resuspended dust under controlled chamber conditions, whereas our retrievals are based on ambient, freshly emitted dust measured in the field. Second, the sampled size ranges differ. Our retrieval is based on the PM2.5 period, whereas Di Biagio et al. (2019) used PM10 measurements. This difference can influence the retrieval if particle composition, shape, or density varies with size, even though our inversion assumes size-independent k. Third, in our field setup, the Fidas PSD and the optical measurements were obtained through different sampling lines, which introduces additional uncertainty in the absolute PSD–optical closure. Finally, our procedure applies a consistent Fidas optical-to-geometric diameter conversion for each prescribed particle-shape and refractive-index assumption, whereas Di Biagio et al. (2019) used a prescribed refractive-index range for the OPC conversion. The OSSE tests in the Supplement indicate that this latter difference has a relatively small effect when the assumed particle shape is consistent.
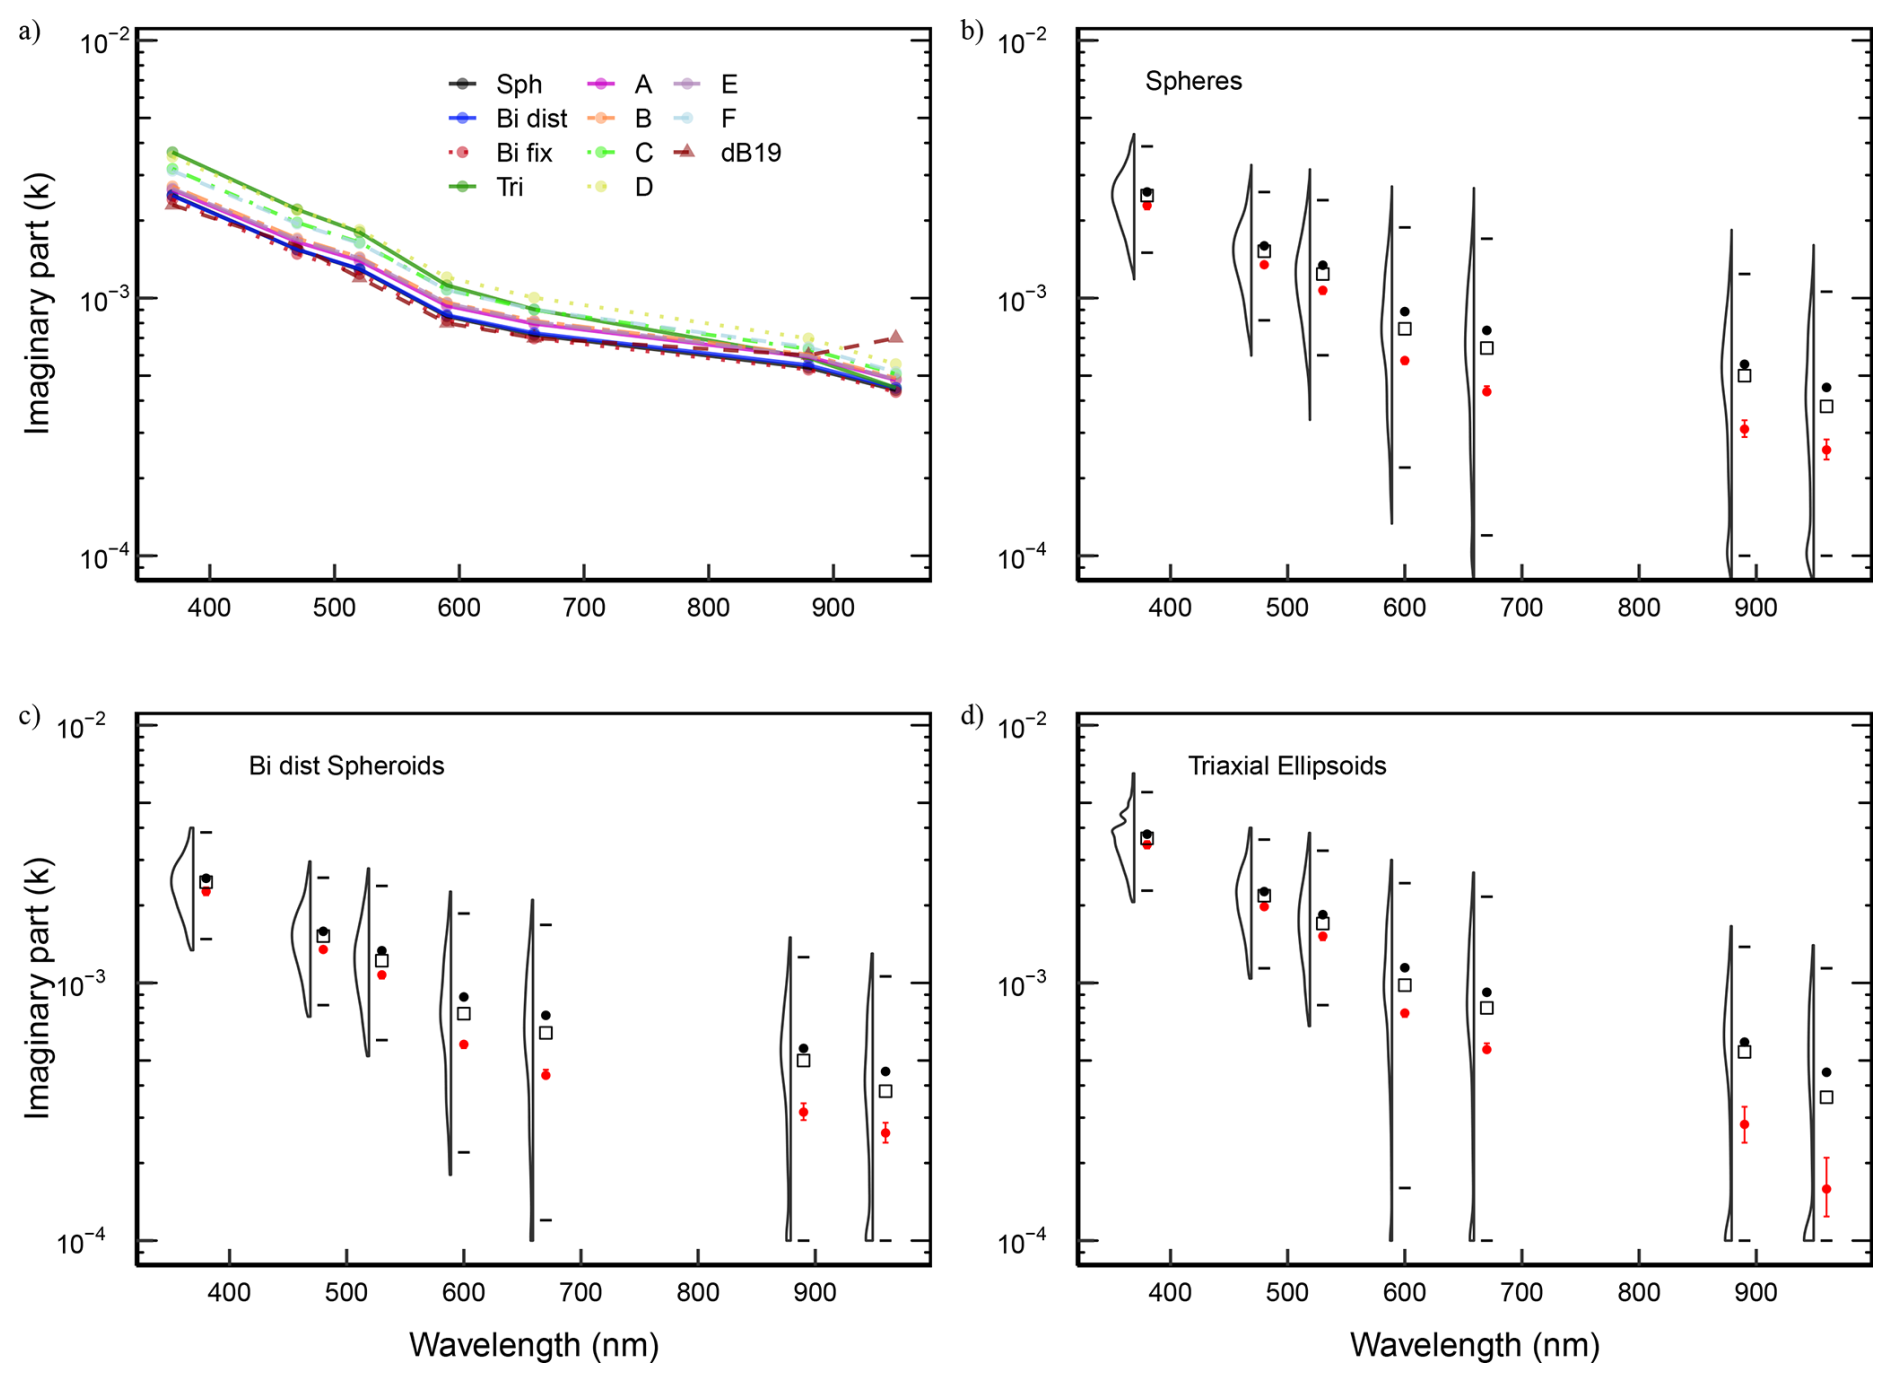
Figure 8Imaginary part of the complex refractive index (k) as a function of wavelength. (a) Coloured lines indicate the average of the k retrieved for each timestamp for which there was dust emission under different shape assumptions, spheres, bi-axial, tri-axial and irregular shapes – A to F from Gasteiger and Wiegner (2018a) – using the best-estimate real refractive index (1.49) and a particle density of 2.15 g cm−3, as well as the k from Di Biagio et al. (2019) for the Morocco sample as dB19; (b–d) Distributions of k for spheres (b), biaxial ellipsoids (c), and triaxial ellipsoids (d) during dust events, showing the mean (dot), median (square), and 5th to 95th percentiles (flat segments). The red dots in (b)–(d) represent the mean of the retrievals of the average for the C values obtained in Yus-Díez et al. (2025) with the error bar showcasing the variability introduced by using an upper/lower C based on its CI. Each distribution reflects the range of retrievals for various real refractive index values and particle density assumptions, highlighting the sensitivity of k to shape and measurement parameters.
A notable difference is observed between the average of the retrievals and the retrieval of the average in panels (b)–(d) of Fig. 8. The average of the 15 min retrievals is generally larger than the k obtained from the time-averaged dust-event measurements, especially at longer wavelengths. This behaviour is also evident in Fig. S8. We attribute this difference to the disproportionate influence of short periods with lower dust concentration and stronger relative contribution from absorbing non-dust aerosols. When each 15 min interval is weighted equally, these periods can raise the average retrieved k. In contrast, the retrieval of the average is more strongly influenced by high-dust periods, such as the haboob event, which exhibit higher SSA in the near-infrared and infrared and are more representative of mineral dust optical properties.
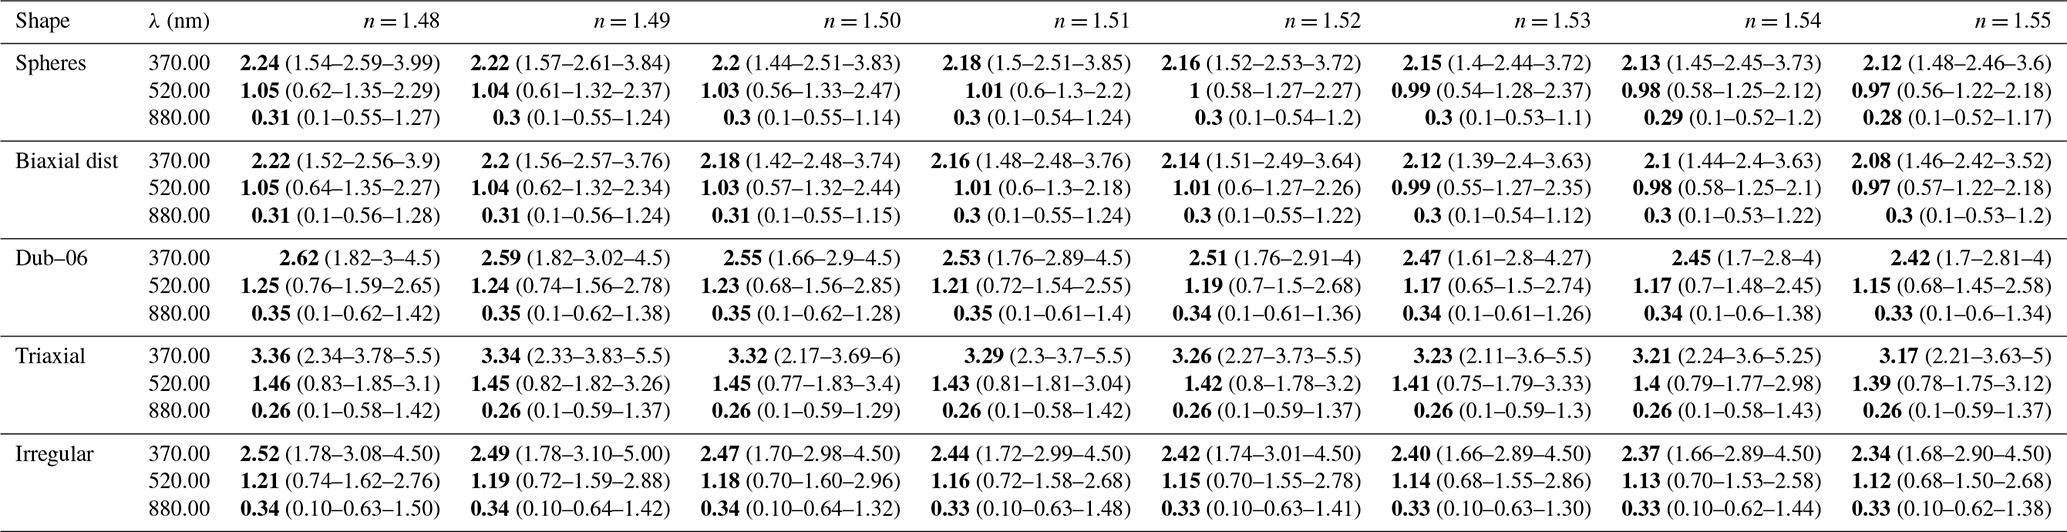
The violin plots in Fig. 8 illustrate the sensitivity of k to particle density, ρp, and n. Figure S9 shows the violin plots also for irregular shapes A–F from Gasteiger et al. (2011). Tables 2 and 3 provide the corresponding numerical values. Table 2 shows k at selected wavelengths for the three ρp, averaged over all n values. Table 3 reports k as a function of n, averaged over the different dust particle density assumptions. Both tables include results for a subset of particle shapes; the complete wavelength range is available in Tables S1–S10.
The results show a clear dependence of retrieved k on the assumed particle density. Lower particle densities lead to lower retrieved k, whereas higher particle densities lead to higher retrieved k. This sensitivity arises because particle density affects the aerodynamic-to-geometric conversion used to map the PM2.5 inlet efficiency onto the dust geometric PSD. As a result, the effective size distribution used in the optical simulations changes with the prescribed density.
The sensitivity to the assumed n is weaker. Table 3 shows that k decreases slightly with increasing n, with maximum k values occurring at the lower end of the n range. For example, varying n from 1.48 to 1.55 causes changes in k on the order of 0.0002 at 370 nm for irregular particles. This sensitivity is modest compared with the effects of particle density and shape, and values of n for mineral dust are typically confined to a narrower range than would be required to produce large changes in k. This supports the use of fixed, plausible n values rather than attempting a simultaneous retrieval of n and k from the present field dataset.
The third factor explored in Tables 2 and 3 is particle shape. Particle-shape assumptions exert a substantial influence on the retrieved k. For a given wavelength and set of ρp and n assumptions, non-spherical particles generally require larger k values than spheres to reproduce the observed (tssa). This is particularly evident for triaxial ellipsoids and for the more elongated or irregular MOPSMAP shapes. To quantify the relationship between particle morphology and retrieved k, we use the ratio of volume-equivalent to cross-section-equivalent particle radii, ξvc, from Gasteiger et al. (2011). Lower ξvc values indicate more non-spherical particles. Shapes C, D, and F, as well as the triaxial ellipsoids, have lower ξvc values than spheres, biaxial spheroids, and some of the less elongated irregular shapes, and they yield higher retrieved k. This outcome is consistent with the findings of Kong et al. (2024), who demonstrated through numerical experiments that greater particle non-sphericity leads to higher retrieved k values.
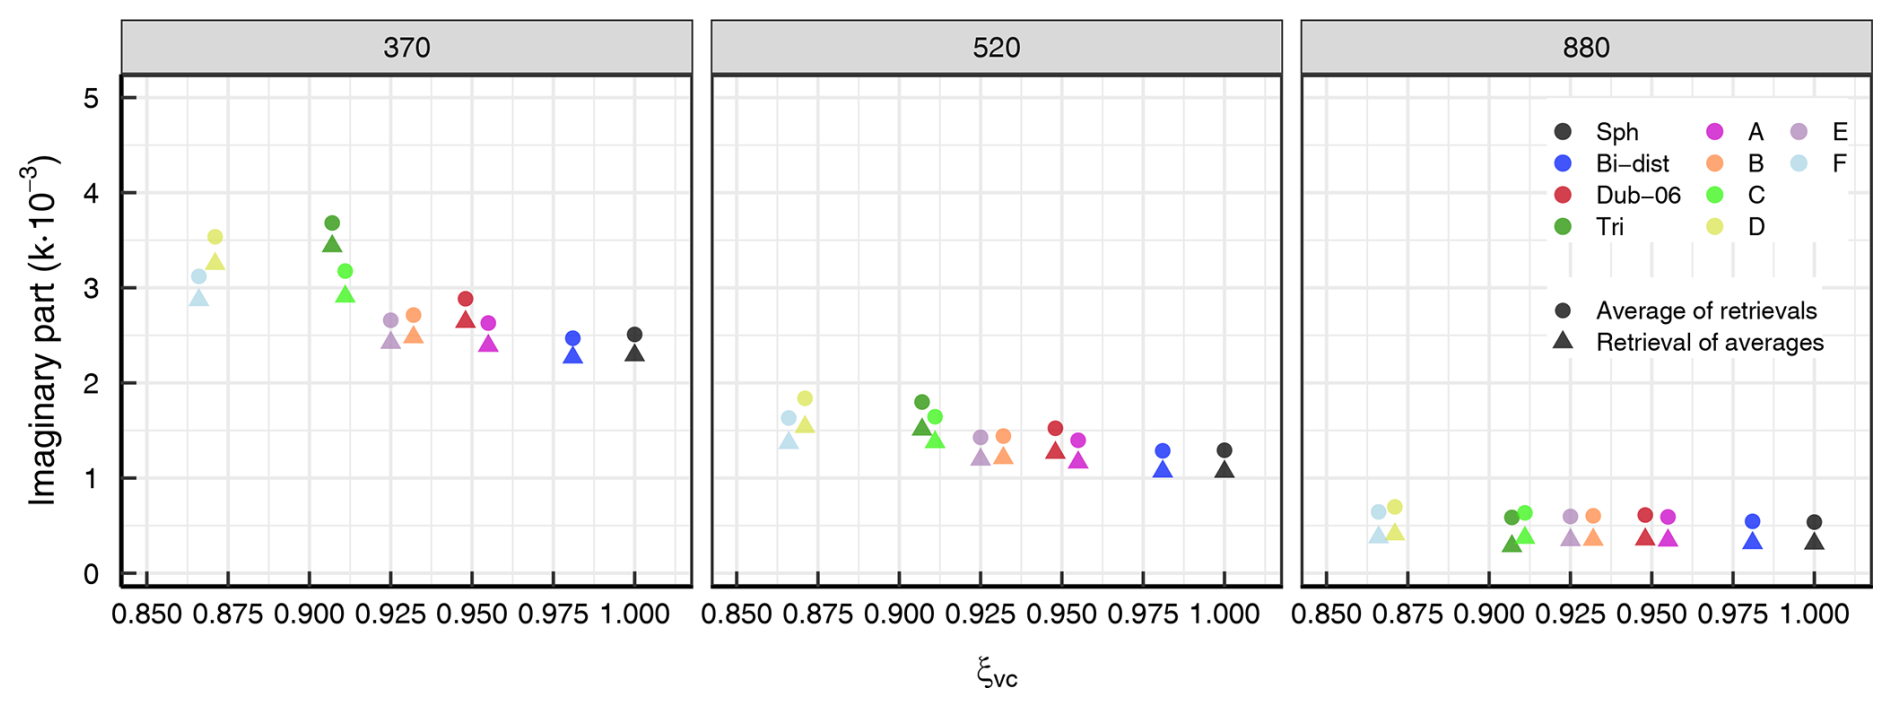
Figure 9Imaginary part of the complex refractive index (k) retrieved for the same shape assumptions as in Fig. 8 as a function of the asphericity of the particles as defined by Gasteiger and Wiegner (2018a), ξvc for three wavelengths (370, 520 and 880 nm) for the retrieval of k for the averaged optical values (triangles) and for the temporal average of the retrievals filtered for dust events (points).
This relationship is further illustrated in Fig. 9, which shows the retrieved k values as a function of ξvc. A near linear tendency is observed (with increasing k corresponding to decreasing ξvc), i.e. to more non-spherical particles. The slope of this relationship becomes weaker at longer wavelengths. While this relationship appears consistent, it is based on a limited number of data points, and any extrapolation should therefore be treated with caution. Nonetheless, establishing a robust connection between particle non-sphericity and retrieved k could provide a valuable tool for reinterpreting past measurements and datasets – many of which rely on spherical particle assumptions – within the context of more realistic, non-spherical dust models (e.g. Saito et al., 2021). For the central assumptions, k retrieved using triaxial ellipsoids can be substantially higher than that retrieved using spherical particles, with the largest relative differences occurring at shorter wavelengths, up to 46 %, and smaller differences at longer wavelengths, up to 10 %.
This apparent relationship between non-sphericity and retrieved k should be interpreted with caution because it is based on a limited set of prescribed shape assumptions. The single irregular shapes are sensitivity cases rather than realistic descriptions of the full atmospheric dust population. Nevertheless, the result demonstrates that particle-shape representation can substantially affect retrieved k. Establishing a more robust link between particle morphology and retrieved absorption properties could help reinterpret past datasets that relied on spherical assumptions and improve the treatment of non-spherical dust in remote-sensing retrievals and climate-model optical-property parametrizations.
Table 2Imaginary part of the complex refractive index k for periods characterized as dust events throughout the PM2.5 part of the campaign. The retrieval of the averaged optical measurements is shown in bold, while the 5th percentile, the mean, and the 95th percentile of the distribution from the 15 min retrievals are shown within the parenthesis. All retrievals in this table were computed under the assumption of n=1.49 and they are shown multiplied by 103 for clarity. They have been obtained for different shapes: spheres, distributions of biaxial ellipsoids, spheroid shape distribution from Dubovik et al. (2006), the triaxial ellipsoid shape, and the average of the A to F irregular shapes from Gasteiger et al. (2011); for 3 wavelengths ranging between the near-UV to the near-infrared and 3 different mineral dust particle density (ρp in g cm−3).
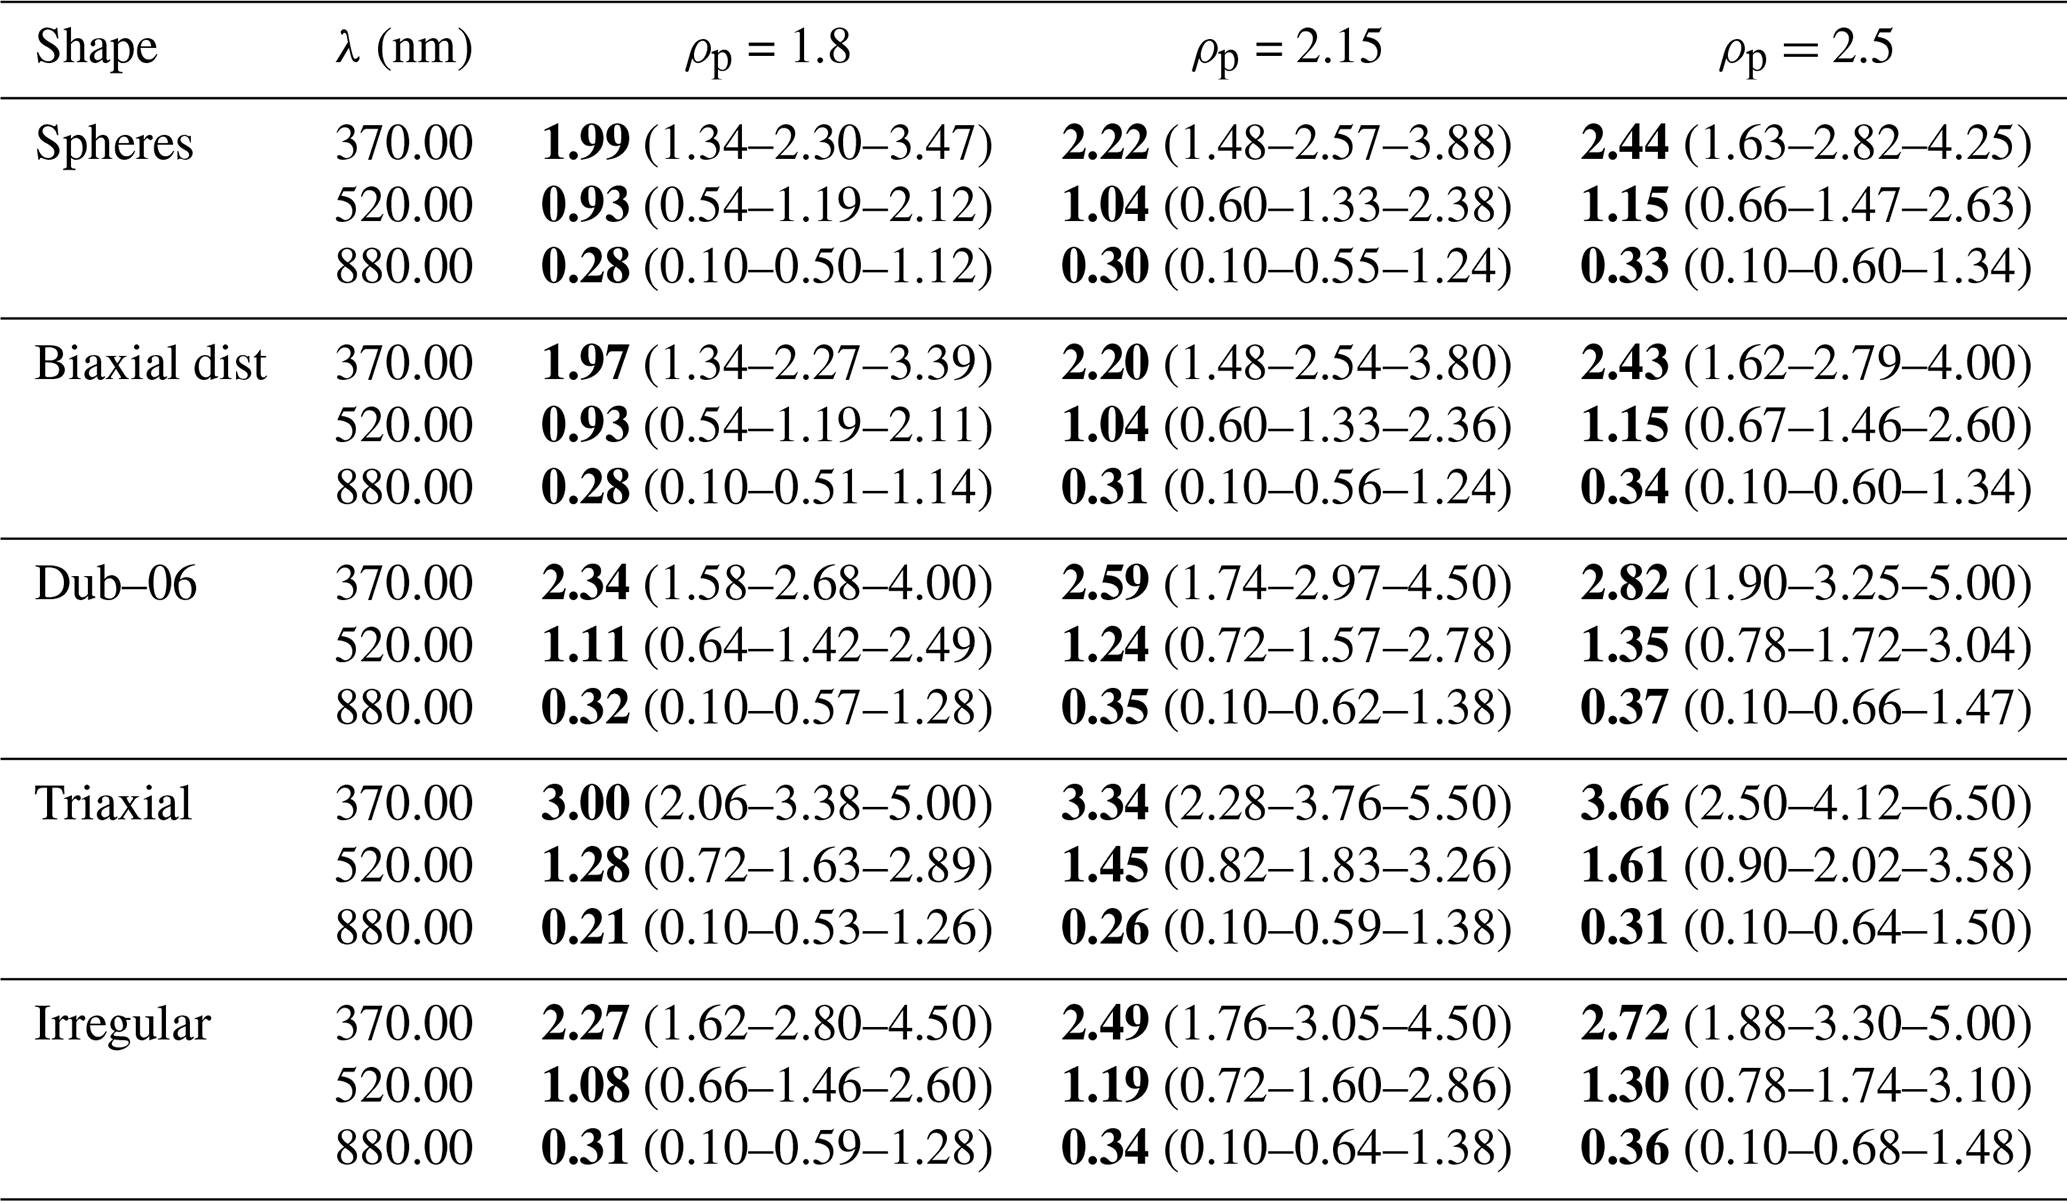
Table 3Imaginary part of the complex refractive index k, with the same table structure as in Table 2 but fixing the best estimate of the particle density to ρp=2.15 g cm−3 and varying the n between 8 different values. Please note the in the table k is multiplied by 103.
3.3.1 Comparison with dust-dominated AERONET retrievals
Figure 10 compares our in-situ k estimates, extrapolated to the AERONET wavelengths of 440, 550, 675, 870, and 1020 nm, with dust-filtered AERONET retrievals compiled over two decades from several mid-latitude dust emission regions. These include Ouarzazate (OUARZ), western and eastern North Africa (WNAFR, ENAFR), the Sahel (SAHEL), the Arabian Peninsula (ARPEN), central Asia (CASIA), and India (INDIA). The selected AERONET stations are shown in Fig. S10a. Our in-situ retrievals are shown for four particle shape assumptions: spheres, biaxial ellipsoids with aspect ratios from Dubovik et al. (2006), biaxial ellipsoids with aspect ratios from Panta et al. (2023), and triaxial ellipsoids. The comparison with the Dubovik et al. (2006) spheroid distribution is included to provide a shape assumption more consistent with AERONET-type retrievals, while the other shape assumptions illustrate the sensitivity of the in-situ k estimates to particle morphology.
Due to differences in spatio-temporal representativeness and observational context, a strict quantitative comparison between AERONET and in-situ k values is not appropriate. AERONET retrievals are column-integrated and rely on inversion assumptions regarding particle size, shape, and refractive index, whereas our estimates are based on near-surface, source-region measurements during a specific field campaign and are restricted to the PM2.5 dust-event period. Differences in the vertical distribution of dust, the sampled size range, particle ageing, mineralogical composition, and possible aerosol mixing can all affect the comparison. The AERONET comparison is therefore used here to provide context rather than direct validation of the in-situ retrievals.
Despite these caveats, our retrievals show qualitative agreement with the AERONET retrievals from OUARZ, the closest AERONET station to the measurement site. The strongest overlap occurs for the more non-spherical shape assumptions, for instance triaxial ellipsoids and the Dubovik et al. (2006) spheroid distribution. Median values are particularly close at 550 and 675 nm, and the full distributions show some overlap at longer wavelengths. At 440 nm, however, our in-situ estimates diverge more noticeably from the AERONET retrievals. When spherical particles are assumed, the retrieved k values are generally lower than both the non-spherical in-situ retrievals and the AERONET values from OUARZ, especially at shorter wavelengths.
A key feature of Fig. 10 is the pronounced regional variability in AERONET-derived k. The median k increases progressively from western to eastern North Africa and further across the Sahel, reaching even higher values in central Asia and India. These differences are likely driven in part by regional variations in dust mineralogy, particularly iron oxide content, but they may also reflect differences in PSD, dust ageing, retrieval assumptions, and residual contamination by non-dust aerosols despite the filtering applied.
To further assess the role of particle size, we compared the Fidas-derived size distributions measured during the FRAGMENT-Morocco campaign with the dust-filtered AERONET volume size distribution at OUARZ over the 2000–2020 period. The Fidas distributions, shown in Figs. 6 and 7 of González-Flórez et al. (2023), represent near-surface in-situ measurements close to the dust source, whereas the AERONET distribution is column-integrated and retrieval-dependent (Fig. S10b). The comparison shows that the AERONET volume size distribution has a relatively larger contribution from smaller particles and a coarse-mode maximum around 3 µm, whereas the Fidas-derived mass distribution during the campaign peaks closer to 10 µm. This difference is important because particle size affects both the optical response and the retrieved refractive index.
The different size distributions suggest that part of the discrepancy between our in-situ k retrievals and AERONET-derived k may arise from PSD differences, not only from particle shape. In our PM2.5 retrieval, the size range includes most of the particles in number and is directly relevant for the AE33 absorption wavelengths used to retrieve k. In contrast, AERONET retrievals are sensitive to a column-integrated size distribution with a different fine-to-coarse partitioning. A larger relative contribution of smaller particles in the AERONET retrieval could affect the inferred absorption properties and may contribute to the higher AERONET-derived k values.
This interpretation is consistent with Adebiyi et al. (2023), who emphasized that dust absorption estimates are sensitive to particle size distribution, particle shape, and refractive index. They also discussed potential limitations in AERONET dust retrievals over North Africa, including uncertainties in the representation of coarse and super-coarse dust and possible biases in retrieved refractive indices. Thus, differences between AERONET and in-situ estimates should not be attributed solely to particle-shape assumptions. They may also reflect differences in PSD, column versus surface sampling, retrieval assumptions, dust ageing, and mineralogy.
These results emphasize the importance of region-specific in-situ studies, such as the present work, for constraining dust optical properties. Direct measurements of locally emitted dust provide information that is complementary to column-integrated remote-sensing retrievals and help refine our understanding of regional differences in dust absorption. Such measurements are essential for improving the representation of dust optical properties in remote-sensing algorithms and climate models, particularly for quantifying the contribution of mineral dust absorption to the Earth’s radiative budget.
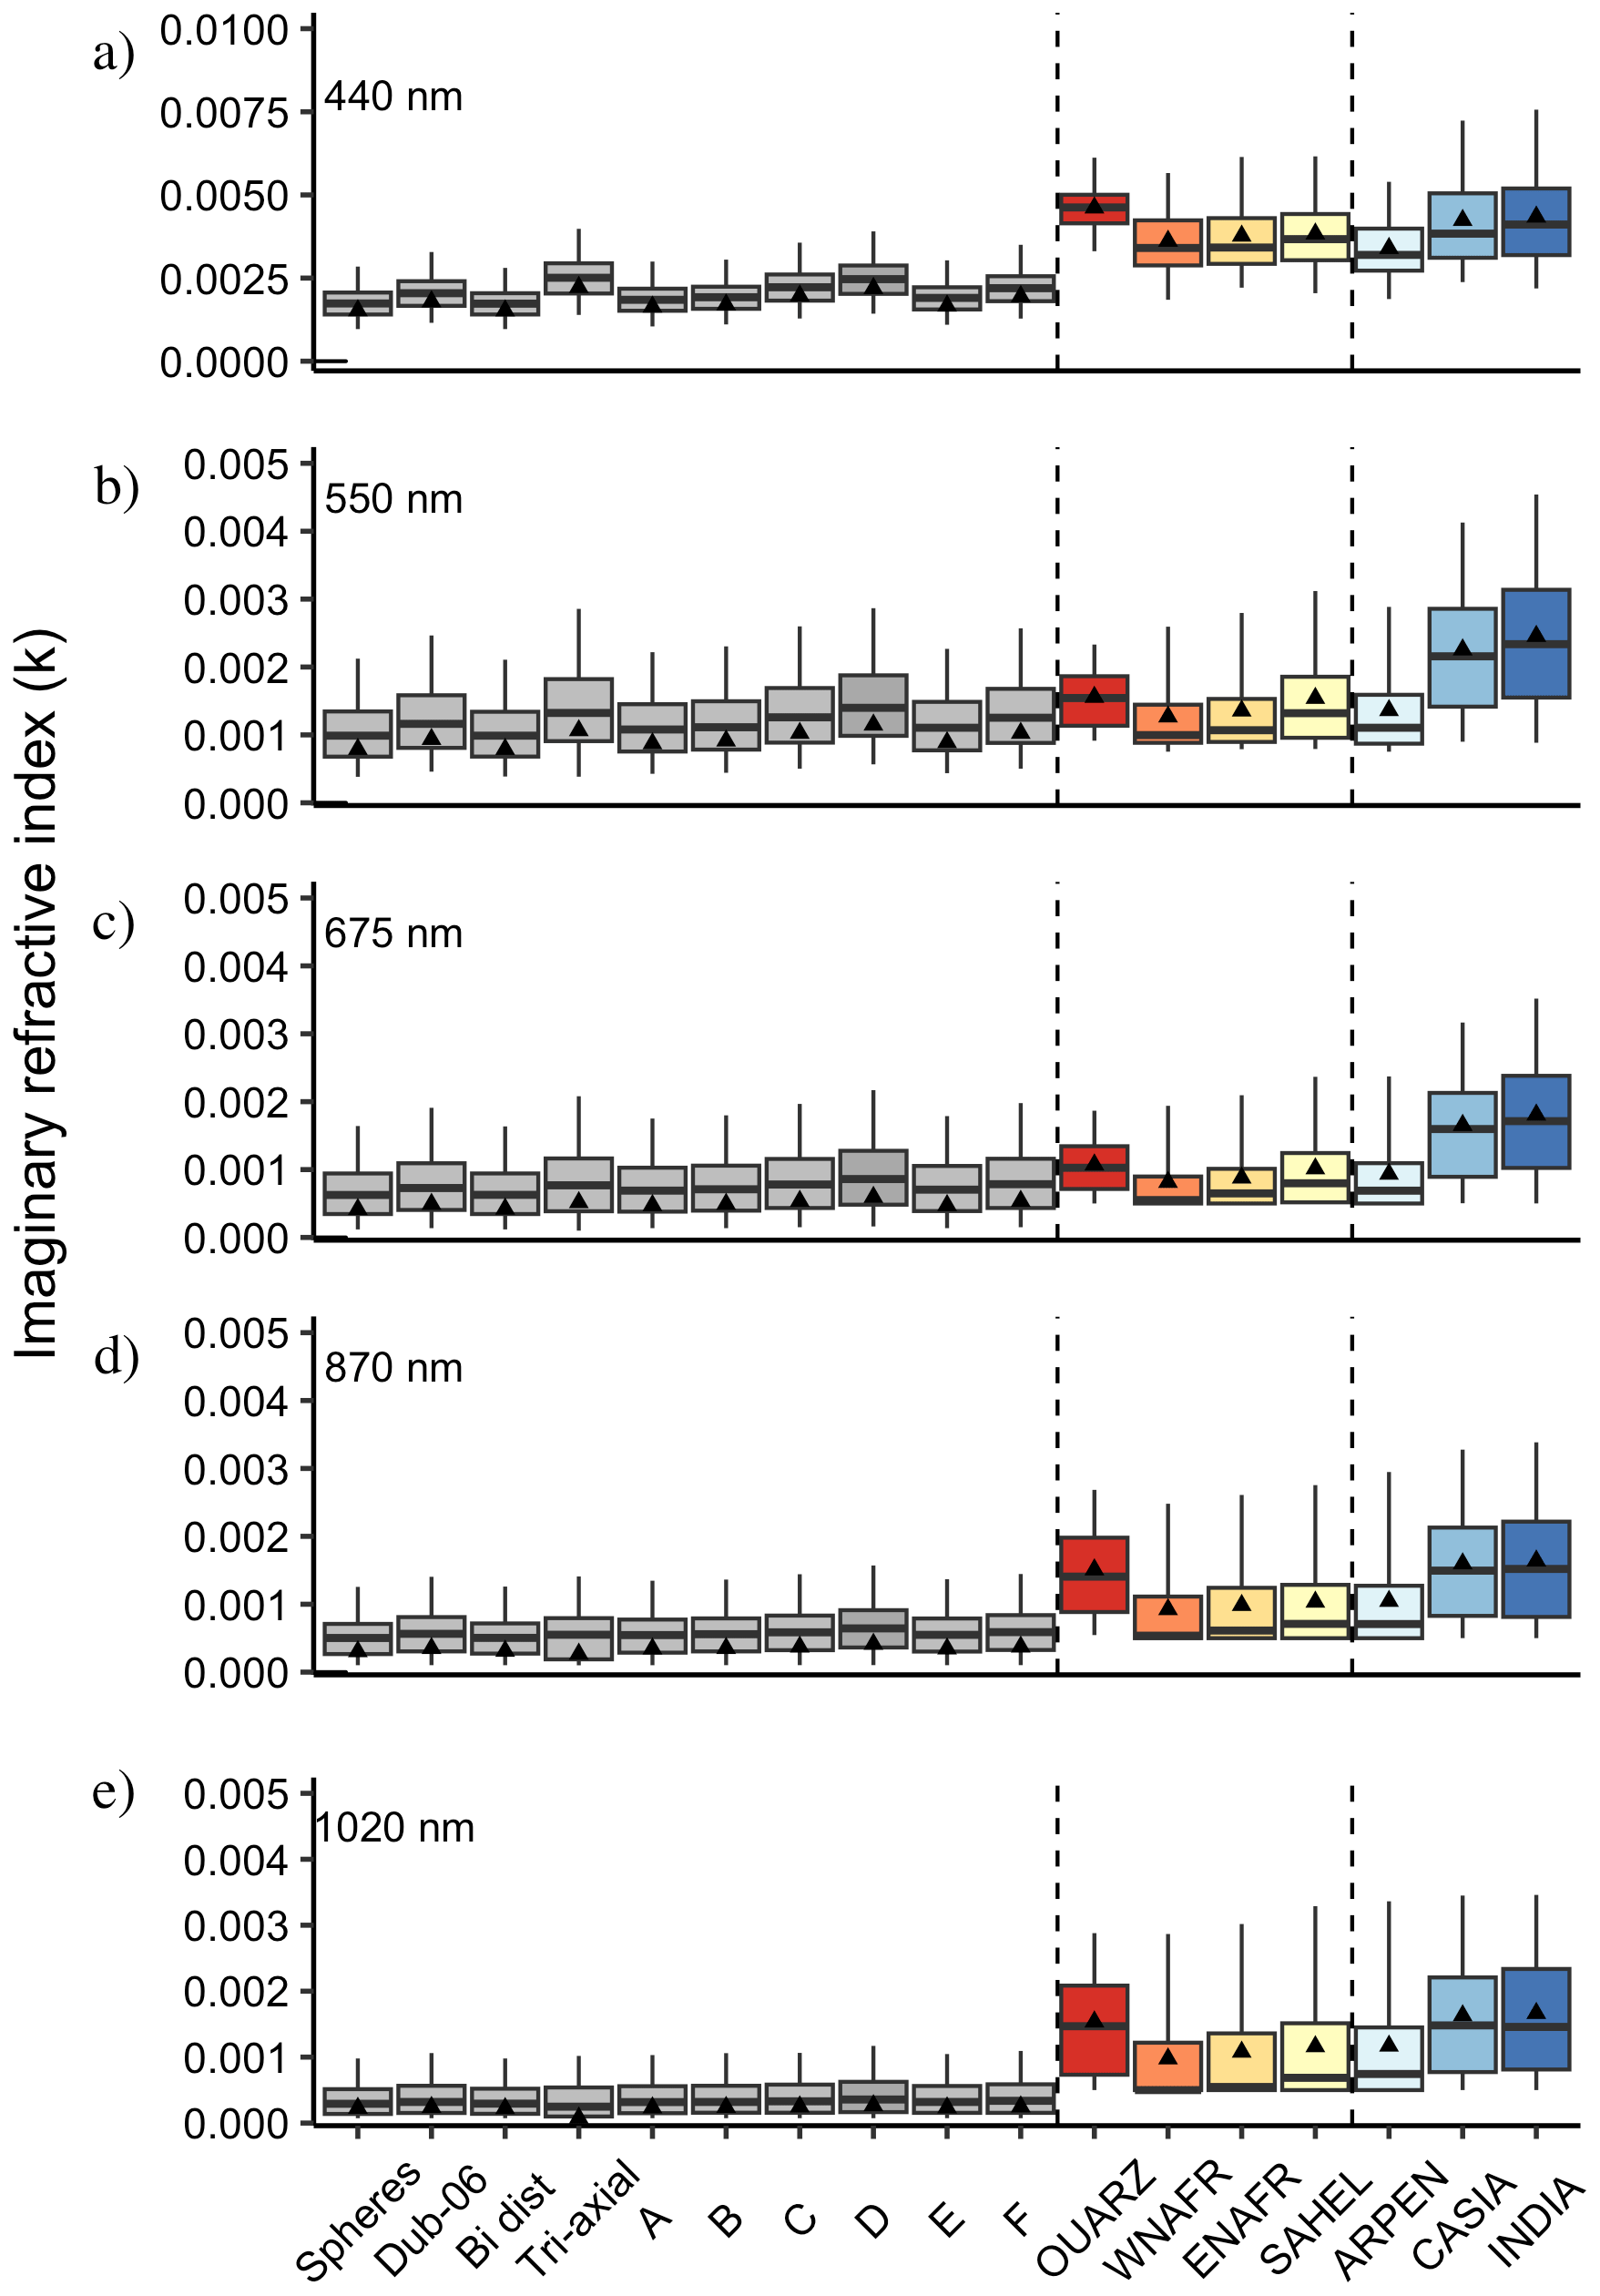
Figure 10Box-plots of the imaginary part of the retrieved complex refractive index, k, for the dust events as described in Sect. 2.6 for the assumption of the best estimates of n and particle density ρp of 2.15 g cm−3, from Panta et al. (2023). Here we compare the k for: spheres, Oblate-Prolate biaxial ellipsoid distributions, Dub-06 spheroids, and triaxial ellipsoids (in greyscale) and A–F irregular shapes from Gasteiger et al. (2011). We compared this k with 20 years of AERONET measurements over different mid-latitude dust emitting areas (from closer to further from our location, in colours). The retrievals of the average for the in-situ measurements and the average for the AERONET estimations are also shown through the black triangles. The regions of the AERONET measurements are shown in Fig. S10a, with the following acronyms: Ouarzazate (OUARZ), northwestern Africa (WNAFR), northeastern Africa (ENAFR), Sahel (SAHEL), Arabian Peninsula (ARPEN), central Asia (CASIA), and India (INDIA). The box-plots limits represent the 25th and 75th quantiles and the lines represent the 5th and 95th quantiles.
This study provides high-temporal-resolution, source-region in-situ measurements of mineral dust optical properties, with a focus on absorption, scattering, and their spectral dependence, and the conditional retrieval of the imaginary part of the complex refractive index, k. The measurements were conducted during the FRAGMENT-Morocco campaign in a Saharan dust source region, allowing the optical properties of freshly emitted dust to be characterized under natural emission conditions.
The campaign captured three distinct aerosol regimes: local dust emissions, haboob-driven dust events, and periods influenced by anthropogenic pollution advection mixed with minor dust emissions. Dust-dominated periods exhibited high SSA values, increasing from 0.952 at 370 nm to 0.985 at 550 nm to 0.995 at 880 nm for PM2.5 particles and from 0.948 at 370 nm to 0.986 at 550 nm to 0.996 at 880 nm for PM10 particles. These values are broadly consistent with previous Saharan dust observations, while differences among studies reflect variations in size range, source region, mineralogy, atmospheric processing, and aerosol mixing state. Periods with anthropogenic influence showed lower SSA, particularly at near-infrared wavelengths and higher mass absorption efficiencies, suggesting the presence of fine carbonaceous aerosols.
The optical properties showed a strong dependence on particle size and inlet cut-off. During the PM2.5 period, increasing effective radius was associated with a clearer dust optical signature: SAE decreased towards values near or below zero, SSAAE became negative, and AAE increased towards values typical of mineral dust. The mass absorption efficiency decreased with increasing particle size, while the scattering and extinction efficiencies reflected the shift of the optically active particle size range. During the PM10 period, the broader coarse-particle fraction produced a consistently stronger dust signature and lower mass-normalized efficiencies, reflecting the dominant contribution of coarse dust to mass. The asymmetry parameter and backscatter fraction were also consistent with previous Saharan dust measurements, confirming the important role of coarse particles in controlling the angular distribution of scattering.
The observations also show that even at a remote dust-source site, regional and local anthropogenic pollution can affect the measured optical properties. Period C, influenced by anthropogenic advection, exhibited smaller effective radius, AAE and SAE values closer to 1, a less negative or positive SSAAE, lower SSA at near-infrared wavelengths, and higher mass absorption efficiency. These features point to a larger relative contribution of fine absorbing carbonaceous particles during calm periods with weak local dust emission. This result highlights the importance of separating dust-dominated periods from mixed aerosol conditions when interpreting source-region dust optical measurements.
We retrieved k for PM2.5 dust-event periods using a cost function based on the truncated single scattering albedo (tssa). The retrieval was performed under prescribed assumptions for particle shape, particle density, the real part of the refractive index, and the AE33 multiple-scattering correction. Therefore, the retrieved values should be interpreted as conditional estimates of k, not as a unique unconstrained retrieval of dust shape, PSD, n, and k. This formulation was chosen because the Fidas and the optical instruments sampled through different inlets and over different size ranges, making inversions based directly on extensive absorption and scattering coefficients more sensitive to possible PSD–optical sampling mismatches.
The retrieved k values decreased with wavelength across the five shortest AE33 wavelengths, consistent with stronger short-wave absorption by iron-bearing minerals. Particle density and particle shape were the dominant assumptions affecting the retrieval. The prescribed real part of the refractive index had a comparatively weaker effect within the tested range of (n=1.48)–1.55. The AE33 correction uncertainty also propagated into the retrieved k, particularly at longer wavelengths where the relative contribution of the scattering artefact is larger.
Particle-shape assumptions had a substantial effect on the retrieved k. For the central assumptions, non-spherical particles generally required larger k values than spheres to reproduce the observed (tssa). At 520 nm, k increased from approximately 0.00104 for spheres to approximately 0.00145 for triaxial ellipsoids, corresponding to an increase of about 40 %. The relationship between retrieved k and particle non-sphericity, represented by the ratio of volume-equivalent to cross-section-equivalent radii, suggests that more elongated or irregular particles require higher k values under otherwise equivalent assumptions. This relationship should be interpreted cautiously because single irregular shapes are used as sensitivity cases rather than as realistic descriptions of the full atmospheric dust population. Nevertheless, the result demonstrates that particle-shape representation can substantially affect retrieved absorption properties.
The comparison with dust-filtered AERONET retrievals provides useful context but should not be interpreted as a direct validation of the in-situ retrievals. The closest AERONET station, Ouarzazate, showed qualitative agreement with the in-situ retrievals, particularly at 550 nm and 675 nm, when non-spherical shape assumptions were used, including the Dubovik et al. (2006) spheroid distribution. However, discrepancies appear at shorter and longer wavelengths. Differences between AERONET and in-situ k values can arise from several factors, including column versus surface sampling, differences in PSD, size sensitivity, retrieval assumptions, mineralogy, dust ageing, and possible residual contamination by non-dust aerosols. The comparison between Fidas and AERONET size distributions further indicates that PSD differences may contribute to discrepancies in retrieved k, in addition to particle-shape effects.
Overall, this work provides field-based constraints on the optical properties of freshly emitted Saharan dust and highlights the sensitivity of inferred absorption properties to particle size, density, and shape. The results support the need for improved treatment of non-spherical dust optics in remote-sensing retrievals and climate-model parametrizations. At the same time, the OSSEs and sensitivity tests show that robust field retrievals of dust refractive index require careful characterization of inlet transmission, PSD–optical closure, particle density, particle shape, and absorption-correction uncertainty. In particular, the use of a tssa-based cost function reduces sensitivity to approximately uniform particle-number mismatches between the OPC and optical instruments, but it cannot fully remove the possible impact of size-dependent PSD-shape distortions. Future field campaigns should therefore prioritize co-located and size-consistent PSD and optical measurements, harmonized and well-characterized inlet systems, independent constraints on particle density and morphology, and explicit cross-instrument closure protocols. Field and chamber studies should be viewed as complementary: chamber experiments provide controlled conditions for testing retrieval methods and quantifying instrumental biases, whereas field measurements provide environmental representativeness by sampling dust under natural emission, turbulence, transport, and mixing conditions. A closer integration of both approaches will be essential to further reduce uncertainties in dust absorption and its radiative impact.
Data and code will be made accessible through an open repository once the publication has been accepted. MOPSMAP dataset is available at https://doi.org/10.5281/zenodo.1284217 (Gasteiger and Wiegner, 2018b). Triaxial spheroids database is available at https://doi.org/10.5281/zenodo.4959767 (Meng et al., 2010b). Aspect ratio distribution from Dubovik et al. (2006) is available in the GRASP Spheroids Package repository at https://www.grasp-open.com/products/spheroid-package-release/ (last access: 1 April 2026).
The supplement related to this article is available online at https://doi.org/10.5194/acp-26-14531-2026-supplement.
AA, XQ, MK, KK and CPGP designed the measurement campaign. JYD, AA, CGF, AGR, MK, KK, AP, XQ, CR and CPGP participated in the field measurement campaign. CGF processed the meteorological data, CGF and JE treated the PNSD datasets, AP and AGR obtained the airborne and soil mineralogical measurements. JYD processed the optical data-sets, analyzed the results, and summarized and expressed them in this manuscript. JE provided the complex refractive index modelization analysis, analyzed the results, and summarized and expressed them in this manuscript. CPGP played a key role in shaping the manuscript’s conception and structure and revised and edited the text. All authors provided advice regarding the structure and content as well as contributed to the writing of the final manuscript.
At the time of the research, MR and MI were also employed by the manufacturer of the Aethalometer AE33. At least one of the (co-)authors is a member of the editorial board of Atmospheric Chemistry and Physics. The peer-review process was guided by an independent editor.
Publisher's note: Copernicus Publications remains neutral with regard to jurisdictional claims made in the text, published maps, institutional affiliations, or any other geographical representation in this paper. The authors bear the ultimate responsibility for providing appropriate place names. Views expressed in the text are those of the authors and do not necessarily reflect the views of the publisher.
We would like to acknowledge the EMIT project, supported by the NASA Earth Venture Instrument program, under the Earth Science Division of the Science Mission Directorate. We thank Paul Ginoux for providing high-resolution global dust source maps that were very helpful for identifying the experimental site. We also acknowledge Jasper Kok for providing useful insights on our methods. We are very thankful of the teams behind the production of the optical properties used in this work, namely, MOPSMAP, the triaxial spheroids database from Meng et al. (2010a), and also the GRASP Spheroids Package teams for making the aspect ratio distribution data openly available.
This publication was funded by the DUSTIMPACT (DUSTMOD) project (grant no. PID2024-157110OI-C21 funded by MICIU/AEI/10.13039/501100011033 and by ERDF, EU). The field campaign and its associated research, including this work, was primarily funded by the European Research Council under the Horizon 2020 research and innovation programme through the ERC Consolidator Grant FRAGMENT (grant agreement no. 773051) and the AXA Research Fund through the AXA Chair on Sand and Dust Storms at BSC. BSC co-authors also acknowledge the support of the Spanish Ministerio de Economía y Competitividad through the HEAVY project (grant no. PID2022-140365OB-I00 funded by MCIN/AEI/10.13039/501100011033 and by ERDF/EU) and the Horizon Europe programme under grant agreement no. 101137680 via project CERTAINTY. JYD was supported by the European Union's Horizon Europe research and innovation programme under the Marie Skłodowska-Curie Postdoctoral Fellowship Programme, SMASH co-funded under the grant agreement no. 101081355. The SMASH project is co-funded by the Republic of Slovenia and the European Union from the European Regional Development Fund. JE acknowledges his AI4S fellowship within the “Generación D” initiative by Red.es, Ministerio para la Transformación Digital y de la Función Pública, for talent attraction (C005/24-ED CV1), funded by NextGenerationEU through PRTR. CGF was supported by a PhD fellowship from the Agència de Gestió d'Ajuts Universitaris i de Recerca (AGAUR) grant no. 2020-FI-B 00678. MK received funding through the Helmholtz Association's Initiative and Networking Fund (grant agreement no. VH-NG-1533). KK was funded by the Deutsche Forschungsgemeinschaft (DFG, German Research Foundation, grant nos. 264907654 and 416816480).
This paper was edited by Stelios Kazadzis and reviewed by five anonymous referees.
Ackerman, A. S., Toon, O. B., Stevens, D. E., Heymsfield, A. J., Ramanathan, V., and Welton, E. J.: Reduction of Tropical Cloudiness by Soot, Science, 288, 1042–1047, https://doi.org/10.1126/science.288.5468.1042, 2000. a
Adebiyi, A. A. and Kok, J. F.: Climate models miss most of the coarse dust in the atmosphere, Sci. Adv., 6, 1–10, https://doi.org/10.1126/sciadv.aaz9507, 2020. a, b, c
Adebiyi, A. A., Huang, Y., Samset, B. H., and Kok, J. F.: Observations suggest that North African dust absorbs less solar radiation than models estimate, Commun. Earth Environ., 4, 168, https://doi.org/10.1038/s43247-023-00825-2, 2023. a, b, c, d
Bagheri, G. and Bonadonna, C.: On the drag of freely falling non-spherical particles, Powder Technol., 301, 526–544, https://doi.org/10.1016/j.powtec.2016.06.015, 2016. a
Balkanski, Y., Schulz, M., Claquin, T., and Guibert, S.: Reevaluation of Mineral aerosol radiative forcings suggests a better agreement with satellite and AERONET data, Atmos. Chem. Phys., 7, 81–95, https://doi.org/10.5194/acp-7-81-2007, 2007. a, b
Caponi, L., Formenti, P., Massabó, D., Di Biagio, C., Cazaunau, M., Pangui, E., Chevaillier, S., Landrot, G., Andreae, M. O., Kandler, K., Piketh, S., Saeed, T., Seibert, D., Williams, E., Balkanski, Y., Prati, P., and Doussin, J.-F.: Spectral- and size-resolved mass absorption efficiency of mineral dust aerosols in the shortwave spectrum: a simulation chamber study, Atmos. Chem. Phys., 17, 7175–7191, https://doi.org/10.5194/acp-17-7175-2017, 2017. a, b, c
Chen, Y. and Bond, T. C.: Light absorption by organic carbon from wood combustion, Atmos. Chem. Phys., 10, 1773–1787, https://doi.org/10.5194/acp-10-1773-2010, 2010. a
Claquin, T., Schulz, M., and Balkanski, Y.: Modeling the mineralogy of atmospheric dust sources, J. Geophys. Res.-Atmos., 104, 22243–22256, 1999. a
Collaud Coen, M., Weingartner, E., Schaub, D., Hueglin, C., Corrigan, C., Henning, S., Schwikowski, M., and Baltensperger, U.: Saharan dust events at the Jungfraujoch: detection by wavelength dependence of the single scattering albedo and first climatology analysis, Atmos. Chem. Phys., 4, 2465–2480, https://doi.org/10.5194/acp-4-2465-2004, 2004. a, b
Collaud Coen, M., Weingartner, E., Apituley, A., Ceburnis, D., Fierz-Schmidhauser, R., Flentje, H., Henzing, J. S., Jennings, S. G., Moerman, M., Petzold, A., Schmid, O., and Baltensperger, U.: Minimizing light absorption measurement artifacts of the Aethalometer: evaluation of five correction algorithms, Atmos. Meas. Tech., 3, 457–474, https://doi.org/10.5194/amt-3-457-2010, 2010. a
Di Biagio, C., Formenti, P., Cazaunau, M., Pangui, E., Marchand, N., and Doussin, J.-F.: Corrigendum to “Aethalometer multiple scattering correction Cref for mineral dust aerosols” published in Atmos. Meas. Tech., 10, 2923–2939, 2017, Corrigendum to Atmos. Meas. Tech., 10, 2923–2939, https://doi.org/10.5194/amt-10-2923-2017-corrigendum, 2017. a
Di Biagio, C., Formenti, P., Balkanski, Y., Caponi, L., Cazaunau, M., Pangui, E., Journet, E., Nowak, S., Andreae, M. O., Kandler, K., Saeed, T., Piketh, S., Seibert, D., Williams, E., and Doussin, J.-F.: Complex refractive indices and single-scattering albedo of global dust aerosols in the shortwave spectrum and relationship to size and iron content, Atmos. Chem. Phys., 19, 15503–15531, https://doi.org/10.5194/acp-19-15503-2019, 2019. a, b, c, d, e, f, g, h, i, j, k, l, m
Di Biagio, C., Balkanski, Y., Albani, S., Boucher, O., and Formenti, P.: Direct Radiative Effect by Mineral Dust Aerosols Constrained by New Microphysical and Spectral Optical Data, Geophys. Res. Lett., 47, 1–12, https://doi.org/10.1029/2019GL086186, 2020. a
Drinovec, L., Močnik, G., Zotter, P., Prévôt, A. S. H., Ruckstuhl, C., Coz, E., Rupakheti, M., Sciare, J., Müller, T., Wiedensohler, A., and Hansen, A. D. A.: The ”dual-spot” Aethalometer: an improved measurement of aerosol black carbon with real-time loading compensation, Atmos. Meas. Tech., 8, 1965–1979, https://doi.org/10.5194/amt-8-1965-2015, 2015. a, b
Dubovik, O., Holben, B., Eck, T. F., Smirnov, A., Kaufman, Y. J., King, M. D., Tanré, D., and Slutsker, I.: Variability of absorption and optical properties of key aerosol types observed in worldwide locations, J. Atmos. Sci., 59, 590–608, 2002. a
Dubovik, O., Sinyuk, A., Lapyonok, T., Holben, B. N., Mishchenko, M., Yang, P., Eck, T. F., Volten, H., Muñoz, O., Veihelmann, B., van der Zande, W. J., Leon, J.-F., Sorokin, M., and Slutsker, I.: Application of spheroid models to account for aerosol particle nonsphericity in remote sensing of desert dust, J. Geophys. Res.-Atmos., 111, https://doi.org/10.1029/2005JD006619, 2006. a, b, c, d, e, f, g, h, i, j
Dupont, S., Rajot, J.-L., Labiadh, M., Bergametti, G., Lamaud, E., Irvine, M. R., Alfaro, S. C., Bouet, C., Fernandes, R., Khalfallah, B., Marticorena, B., Bonnefond, J. M., Chevaillier, S., Garrigou, D., Henry-des Tureaux, T., Sekrafi, S., and Zapf, P.: Dissimilarity Between Dust, Heat, and Momentum Turbulent Transports During Aeolian Soil Erosion, J. Geophys. Res.-Atmos., 124, 1064–1089, https://doi.org/10.1029/2018JD029048, 2019. a
Ealo, M., Alastuey, A., Ripoll, A., Pérez, N., Minguillón, M. C., Querol, X., and Pandolfi, M.: Detection of Saharan dust and biomass burning events using near-real-time intensive aerosol optical properties in the north-western Mediterranean, Atmos. Chem. Phys., 16, 12567–12586, https://doi.org/10.5194/acp-16-12567-2016, 2016. a, b
Freedman, D. and Diaconis, P.: On the histogram as a density estimator:L2 theory, Z. Wahrscheinlichkeit., 57, 453–476, https://doi.org/10.1007/BF01025868, 1981. a
Gasteiger, J. and Wiegner, M.: MOPSMAP v1.0: a versatile tool for the modeling of aerosol optical properties, Geosci. Model Dev., 11, 2739–2762, https://doi.org/10.5194/gmd-11-2739-2018, 2018a. a, b, c, d, e
Gasteiger, J. and Wiegner, M.: Modeling of aerosol optical properties with MOPSMAP: Fortran program with data set, Zenodo [code], https://doi.org/10.5281/zenodo.1284217, 2018b. a
Gasteiger, J., Wiegner, M., Groß, S., Freudenthaler, V., Toledano, C., Tesche, M., and Kandler, K.: Modelling lidar-relevant optical properties of complex mineral dust aerosols, Tellus B, 63, 725–741, 2011. a, b, c, d, e
Giles, D. M., Sinyuk, A., Sorokin, M. G., Schafer, J. S., Smirnov, A., Slutsker, I., Eck, T. F., Holben, B. N., Lewis, J. R., Campbell, J. R., Welton, E. J., Korkin, S. V., and Lyapustin, A. I.: Advancements in the Aerosol Robotic Network (AERONET) Version 3 database – automated near-real-time quality control algorithm with improved cloud screening for Sun photometer aerosol optical depth (AOD) measurements, Atmos. Meas. Tech., 12, 169–209, https://doi.org/10.5194/amt-12-169-2019, 2019. a
González-Flórez, C., Klose, M., Alastuey, A., Dupont, S., Escribano, J., Etyemezian, V., Gonzalez-Romero, A., Huang, Y., Kandler, K., Nikolich, G., Panta, A., Querol, X., Reche, C., Yus-Díez, J., and Pérez García-Pando, C.: Insights into the size-resolved dust emission from field measurements in the Moroccan Sahara, Atmos. Chem. Phys., 23, 7177–7212, https://doi.org/10.5194/acp-23-7177-2023, 2023. a, b, c, d, e, f, g, h, i, j, k, l
González-Romero, A., González-Flórez, C., Panta, A., Yus-Díez, J., Reche, C., Córdoba, P., Moreno, N., Alastuey, A., Kandler, K., Klose, M., Baldo, C., Clark, R. N., Shi, Z., Querol, X., and Pérez García-Pando, C.: Variability in sediment particle size, mineralogy, and Fe mode of occurrence across dust-source inland drainage basins: the case of the lower Drâa Valley, Morocco, Atmos. Chem. Phys., 23, 15815–15834, https://doi.org/10.5194/acp-23-15815-2023, 2023. a, b
González-Romero, A., González-Flórez, C., Panta, A., Yus-Díez, J., Córdoba, P., Alastuey, A., Moreno, N., Hernández-Chiriboga, M., Kandler, K., Klose, M., Clark, R. N., Ehlmann, B. L., Greenberger, R. N., Keebler, A. M., Brodrick, P., Green, R., Ginoux, P., Querol, X., and Pérez García-Pando, C.: Characterization of the particle size distribution, mineralogy, and Fe mode of occurrence of dust-emitting sediments from the Mojave Desert, California, USA, Atmos. Chem. Phys., 24, 9155–9176, https://doi.org/10.5194/acp-24-9155-2024, 2024a. a
González-Romero, A., González-Flórez, C., Panta, A., Yus-Díez, J., Córdoba, P., Alastuey, A., Moreno, N., Kandler, K., Klose, M., Clark, R. N., Ehlmann, B. L., Greenberger, R. N., Keebler, A. M., Brodrick, P., Green, R. O., Querol, X., and Pérez García-Pando, C.: Probing Iceland's dust-emitting sediments: particle size distribution, mineralogy, cohesion, Fe mode of occurrence, and reflectance spectra signatures, Atmos. Chem. Phys., 24, 6883–6910, https://doi.org/10.5194/acp-24-6883-2024, 2024b. a
Hansen, J. E. and Travis, L. D.: Light scattering in planetary atmospheres, Space science reviews, 16, 527–610, 1974. a, b
Horvath, H., Alados Arboledas, L., and Olmo Reyes, F. J.: Angular scattering of the Sahara dust aerosol, Atmos. Chem. Phys., 18, 17735–17744, https://doi.org/10.5194/acp-18-17735-2018, 2018. a, b, c, d, e
Huang, Y., Adebiyi, A. A., Formenti, P., and Kok, J. F.: Linking the Different Diameter Types of Aspherical Desert Dust Indicates That Models Underestimate Coarse Dust Emission, Geophys. Res. Lett., 48, e2020GL092054, https://doi.org/10.1029/2020GL092054, 2021. a, b, c, d
Johnson, B. and Osborne, S.: Physical and optical properties of mineral dust aerosol measured by aircraft during the GERBILS campaign, Q. J. Roy. Meteor. Soc., 137, 1117–1130, 2011. a
Kandler, K., Schütz, L., Deutscher, C., Ebert, M., Hofmann, H., Jäckel, S., Jaenicke, R., Knippertz, P., Lieke, K., Massling, A., Petzold, A., Schladitz, A., Weinzierl, B., Wiedensohler, A., Zorn, S., and Weinbruch, S.: Size distribution, mass concentration, chemical and mineralogical composition and derived optical parameters of the boundary layer aerosol at Tinfou, Morocco, during SAMUM 2006, Tellus B, 61, 32–50, https://doi.org/10.1111/j.1600-0889.2008.00385.x, 2009. a
Karydis, V. A., Tsimpidi, A. P., Bacer, S., Pozzer, A., Nenes, A., and Lelieveld, J.: Global impact of mineral dust on cloud droplet number concentration, Atmos. Chem. Phys., 17, 5601–5621, https://doi.org/10.5194/acp-17-5601-2017, 2017. a
Keywood, M. D., Ayers, G. P., Gras, J. L., Gillett, R. W., and Cohen, D.: An Evaluation of PM10 and PM2.5 Size Selective Inlet Performance Using Ambient Aerosol, Aerosol Sci. Tech., 30, 401–407, https://doi.org/10.1080/027868299304589, 1999. a
Kirchstetter, T. W., Novakov, T., and Hobbs, P. V.: Evidence that the spectral dependence of light absorption by aerosols is affected by organic carbon, J. Geophys. Res.-Atmos., 109, https://doi.org/10.1029/2004JD004999, 2004. a, b
Kok, J. F., Ridley, D. A., Zhou, Q., Miller, R. L., Zhao, C., Heald, C. L., Ward, D. S., Albani, S., and Haustein, K.: Smaller desert dust cooling effect estimated from analysis of dust size and abundance, Nat. Geosci., 10, 274–278, https://doi.org/10.1038/ngeo2912, 2017. a, b, c
Kok, J. F., Storelvmo, T., Karydis, V. A., Adebiyi, A. A., Mahowald, N. M., Evan, A. T., He, C., and Leung, D. M.: Mineral dust aerosol impacts on global climate and climate change, Nature Rev. Earth Environ., 4, 71–86, 2023. a, b, c, d
Kong, S., Wang, Z., and Bi, L.: Uncertainties in laboratory-measured shortwave refractive indices of mineral dust aerosols and derived optical properties: a theoretical assessment, Atmos. Chem. Phys., 24, 6911–6935, https://doi.org/10.5194/acp-24-6911-2024, 2024. a
Lafon, S., Sokolik, I. N., Rajot, J. L., Caquincau, S., and Gaudichet, A.: Characterization of iron oxides in mineral dust aerosols: Implications for light absorption, J. Geophys. Res.-Atmos., 111, 1–19, https://doi.org/10.1029/2005JD007016, 2006. a
Li, L., Mahowald, N. M., Miller, R. L., Pérez García-Pando, C., Klose, M., Hamilton, D. S., Gonçalves Ageitos, M., Ginoux, P., Balkanski, Y., Green, R. O., Kalashnikova, O., Kok, J. F., Obiso, V., Paynter, D., and Thompson, D. R.: Quantifying the range of the dust direct radiative effect due to source mineralogy uncertainty, Atmos. Chem. Phys., 21, 3973–4005, https://doi.org/10.5194/acp-21-3973-2021, 2021. a
Lin, W., Bi, L., and Dubovik, O.: Assessing Superspheroids in Modeling the Scattering Matrices of Dust Aerosols, J. Geophys. Res.-Atmos., 123, 13917–13943, https://doi.org/10.1029/2018JD029464, 2018. a
Liou, K.-N.: An introduction to atmospheric radiation, vol. 84, Elsevier, ISBN 9780124514515, 2002. a, b
Mahowald, N.: Aerosol indirect effect on biogeochemical cycles and climate, Science, 334, 794–796, 2011. a
McGraw, Z., Storelvmo, T., David, R. O., and Sagoo, N.: Global Radiative Impacts of Mineral Dust Perturbations Through Stratiform Clouds, J. Geophys. Res.-Atmos., 125, e2019JD031807, https://doi.org/10.1029/2019JD031807, 2020. a
Meng, Z., Yang, P., Kattawar, G. W., Bi, L., Liou, K., and Laszlo, I.: ingle-scattering properties of tri-axial ellipsoidal mineral dust aerosols: A database for application to radiative transfer calculations, J. Aerosol Sci., 41, 501–512, https://doi.org/10.1016/j.jaerosci.2010.02.008, 2010a. a, b, c
Meng, Z., Yang, P., Kattawar, G. W., Bi, L., Liou, K.-N., and Laszlo, I.: Database of the paper “Single-scattering properties of tri-axial ellipsoidal mineral dust aerosols: A database for application to radiative transfer calculations”, Zenodo [data set], https://doi.org/10.5281/zenodo.4959767, 2010b. a
Mishchenko, M. I., Travis, L. D., and Lacis, A. A.: Scattering, absorption, and emission of light by small particles, Cambridge university press, ISBN 0 521 78252 X, 2002. a
Müller, T., Schladitz, A., Massling, A., Kaaden, N., Kandler, K., and Wiedensohler, A.: Spectral absorption coefficients and imaginary parts of refractive indices of Saharan dust during SAMUM-1, Tellus B, 61, 79–95, https://doi.org/10.1111/j.1600-0889.2008.00399.x, 2009. a, b
Müller, T., Laborde, M., Kassell, G., and Wiedensohler, A.: Design and performance of a three-wavelength LED-based total scatter and backscatter integrating nephelometer, Atmos. Meas. Tech., 4, 1291–1303, https://doi.org/10.5194/amt-4-1291-2011, 2011. a
Myhre, G., Shindell, D., Breéon, F.-M., Collins, W., Fuglestvedt, J., Huang, J., Koch, D., Lamarque, J.-F., Lee, D., Mendoza, B., Nakajima, T., Robock, A., Stephens, G., Takemura, T., and Zhang, H.: Anthropogenic and Natural Radiative Forcing, book section 8, Cambridge University Press, Cambridge, United Kingdom and New York, NY, USA, 659–740, ISBN 978-1-107-66182-0, https://doi.org/10.1017/CBO9781107415324.018, 2013. a
Nousiainen, T.: Optical modeling of mineral dust particles: A review, J. Quant. Spectrosc. Ra., 110, 1261–1279, https://doi.org/10.1016/j.jqsrt.2009.03.002, 2009. a
Obiso, V., Gonçalves Ageitos, M., Pérez García-Pando, C., Schuster, G. L., Bauer, S. E., Di Biagio, C., Formenti, P., Perlwitz, J. P., Tsigaridis, K., and Miller, R. L.: Observationally constrained regional variations of shortwave absorption by iron oxides emphasize the cooling effect of dust, EGUsphere [preprint], https://doi.org/10.5194/egusphere-2023-1166, 2023. a
Obiso, V., Gonçalves Ageitos, M., Pérez García-Pando, C., Perlwitz, J. P., Schuster, G. L., Bauer, S. E., Di Biagio, C., Formenti, P., Tsigaridis, K., and Miller, R. L.: Observationally constrained regional variations of shortwave absorption by iron oxides emphasize the cooling effect of dust, Atmospheric Chemistry and Physics, 24, 5337–5367, https://doi.org/10.5194/acp-24-5337-2024, 2024. a
Panta, A., Kandler, K., Alastuey, A., González-Flórez, C., González-Romero, A., Klose, M., Querol, X., Reche, C., Yus-Díez, J., and Pérez García-Pando, C.: Insights into the single-particle composition, size, mixing state, and aspect ratio of freshly emitted mineral dust from field measurements in the Moroccan Sahara using electron microscopy, Atmos. Chem. Phys., 23, 3861–3885, https://doi.org/10.5194/acp-23-3861-2023, 2023. a, b, c, d, e, f, g
Perlwitz, J. and Miller, R. L.: Cloud cover increase with increasing aerosol absorptivity: A counterexample to the conventional semidirect aerosol effect, J. Geophys. Res.-Atmos., 115, https://doi.org/10.1029/2009JD012637, 2010. a
Petzold, A., Ogren, J. A., Fiebig, M., Laj, P., Li, S.-M., Baltensperger, U., Holzer-Popp, T., Kinne, S., Pappalardo, G., Sugimoto, N., Wehrli, C., Wiedensohler, A., and Zhang, X.-Y.: Recommendations for reporting “black carbon” measurements, Atmos. Chem. Phys., 13, 8365–8379, https://doi.org/10.5194/acp-13-8365-2013, 2013. a
Ryder, C. L., Marenco, F., Brooke, J. K., Estelles, V., Cotton, R., Formenti, P., McQuaid, J. B., Price, H. C., Liu, D., Ausset, P., Rosenberg, P. D., Taylor, J. W., Choularton, T., Bower, K., Coe, H., Gallagher, M., Crosier, J., Lloyd, G., Highwood, E. J., and Murray, B. J.: Coarse-mode mineral dust size distributions, composition and optical properties from AER-D aircraft measurements over the tropical eastern Atlantic, Atmos. Chem. Phys., 18, 17225–17257, https://doi.org/10.5194/acp-18-17225-2018, 2018. a, b, c
Saito, M., Yang, P., Ding, J., and Liu, X.: A Comprehensive Database of the Optical Properties of Irregular Aerosol Particles for Radiative Transfer Simulations, J. Atmos. Sci., 78, 2089–2111, https://doi.org/10.1175/JAS-D-20-0338.1, 2021. a
Samset, B. H., Sand, M., Smith, C. J., Bauer, S. E., Forster, P. M., Fuglestvedt, J. S., Osprey, S., and Schleussner, C. F.: Climate Impacts From a Removal of Anthropogenic Aerosol Emissions, Geophys. Res. Lett., 45, 1020–1029, https://doi.org/10.1002/2017GL076079, 2018. a
Schladitz, A., Müller, T., Kaaden, N., Massling, A., Kandler, K., Ebert, M., Weinbruch, S., Deutscher, C., and Wiedensohler, A.: In situ measurements of optical properties at Tinfou (Morocco) during the Saharan Mineral Dust Experiment SAMUM 2006, Tellus B, 61, 64–78, https://doi.org/10.1111/j.1600-0889.2008.00397.x, 2009. a, b, c, d
Schuster, G. L., Dubovik, O., and Holben, B. N.: Angstrom exponent and bimodal aerosol size distributions, J. Geophys. Res.-Atmos., 111, https://doi.org/10.1029/2005JD006328, 2006. a, b
Schuster, G. L., Dubovik, O., and Arola, A.: Remote sensing of soot carbon – Part 1: Distinguishing different absorbing aerosol species, Atmos. Chem. Phys., 16, 1565–1585, https://doi.org/10.5194/acp-16-1565-2016, 2016. a, b
Seinfeld, J. H. and Pandis, S. N.: Atmospheric Chemistry and Physics: From air pollution to climate change, John Wiley & Sons New York, ISBN-10 0471178152, 1998. a
Sinyuk, A., Holben, B. N., Eck, T. F., Giles, D. M., Slutsker, I., Korkin, S., Schafer, J. S., Smirnov, A., Sorokin, M., and Lyapustin, A.: The AERONET Version 3 aerosol retrieval algorithm, associated uncertainties and comparisons to Version 2, Atmos. Meas. Tech., 13, 3375–3411, https://doi.org/10.5194/amt-13-3375-2020, 2020. a
Skiles, S. M., Flanner, M., Cook, J. M., Dumont, M., and Painter, T. H.: Radiative forcing by light-absorbing particles in snow, Nat. Clim. Change, 8, 964–971, 2018. a
Sokolik, I. N. and Toon, O. B.: Incorporation of mineralogical composition into models of the radiative properties of mineral aerosol from UV to IR wavelengths, J. Geophys. Res.-Atmos., 104, 9423–9444, https://doi.org/10.1029/1998JD200048, 1999. a, b, c, d
Teri, M., Müller, T., Gasteiger, J., Valentini, S., Horvath, H., Vecchi, R., Bauer, P., Walser, A., and Weinzierl, B.: Impact of particle size, refractive index, and shape on the determination of the particle scattering coefficient – an optical closure study evaluating different nephelometer angular truncation and illumination corrections, Atmos. Meas. Tech., 15, 3161–3187, https://doi.org/10.5194/amt-15-3161-2022, 2022. a, b, c
Yus-Díez, J., Bernardoni, V., Močnik, G., Alastuey, A., Ciniglia, D., Ivančič, M., Querol, X., Perez, N., Reche, C., Rigler, M., Vecchi, R., Valentini, S., and Pandolfi, M.: Determination of the multiple-scattering correction factor and its cross-sensitivity to scattering and wavelength dependence for different AE33 Aethalometer filter tapes: a multi-instrumental approach, Atmos. Meas. Tech., 14, 6335–6355, https://doi.org/10.5194/amt-14-6335-2021, 2021. a
Yus-Díez, J., Drinovec, L., Alados-Arboledas, L., Titos, G., Bazo, E., Casans, A., Patrón, D., Querol, X., Gonzalez-Romero, A., Perez García-Pando, C., and Močnik, G.: Characterization of filter photometer artifacts in soot and dust measurements – laboratory and ambient experiments using a traceably calibrated aerosol absorption reference, Atmos. Meas. Tech., 18, 3073–3093, https://doi.org/10.5194/amt-18-3073-2025, 2025. a, b, c, d, e