
the Creative Commons Attribution 4.0 License.
the Creative Commons Attribution 4.0 License.
 | 12 Oct 2026
Synoptic and regional-scale meteorological controls of stratus altitude in the Namib Desert
Viola Hipler
Hendrik Andersen

Robert Spirig
Roland Vogt
Stuart Piketh
Bianca Adler
Jan Cermak
In the Namib Desert, fog is an essential water source and occurs when and where advected marine stratus clouds intersect with the land surface. However, the meteorological controls of the cloud base height are still insufficiently understood. This study aims to develop a basic understanding of the processes that influence the stratus altitude and, by extension, the spatial occurrence of fog. We combine satellite and in situ observations with large-scale meteorological data from reanalysis data (ERA5) to compare fog events to lifted stratus at the coast (low-cloud events). In fog situations, the marine boundary layer is shallower by up to 130 m along the entire coastline than in low-cloud situations. This is found to be related to the large-scale high-pressure systems. Fog situations exhibit a weaker Atlantic High but elevated continental pressure. The weaker Atlantic High is connected to less pronounced near-surface winds along the coastline, less cold advection, and heat fluxes upstream of the study region, leading to the shallower marine boundary layer. In parallel, higher continental pressures on fog days facilitate the formation of stronger nocturnal katabatic winds which can mix with, undercut or block the advected cloudy marine air. An alternative mechanism is highlighted in a case study of an off-season fog event, where a ridging high produces hot and dry subsiding easterly air masses which lower and intensify the inversion from above. To assess the predictive power of the continental and Atlantic high-pressure systems and the regional pressure pattern, a logistic regression is trained with three corresponding features. The classification outperformed a climatological baseline by ≈10 %, suggesting that the features contain relevant process information. The results improve our understanding of the processes that determine the seasonal and day-to-day variability of fog versus elevated low-cloud occurrence in the Namib.
- Article
(9783 KB) - Full-text XML
- BibTeX
- EndNote


In the hyperarid Namib Desert, fog is a frequently available water source for ecosystems and is therefore of great ecological importance. While fog water has been documented to be essential for animal (Seely, 1979) and plant species (Burke, 2007; Loots et al., 2019) as well as microbial communities (Ramond et al., 2019; Warren-Rhodes et al., 2013), fog can also act as a vector for nutrients and pollutants (Weathers et al., 2020), impacting biochemistry in the receiving regions (Warren-Rhodes et al., 2013; Gottlieb et al., 2019). The frequency of fog events also determines the amount of harvestable water for human use (Shanyengana et al., 2002; Mupambwa et al., 2019). Climate models project southern Africa to become warmer and drier (Maúre et al., 2018), potentially reducing the positive impact fog can have in this unique ecosystem (Haensler et al., 2011). Therefore, a thorough understanding of the controlling factors of fog occurrence patterns is essential and needed to assess the future of the Namib Desert.
Fog in the Namib occurs most frequently near the coast and decreases towards the mountains of the Great Escarpment that separates the Southern Africa inland plateau from the coastal plains. Fog water collected by Juvik-type fog collectors peaks within a belt 20–60 km inland from the coast at around 400–500 m above sea level (a.s.l.) (Lancaster et al., 1984; Seely and Henschel, 1998). Directly at the coast and peaking during the warm half-year (September to March), advective fog is connected to the southwesterly sea breeze in the afternoon (Seely and Henschel, 1998). Further inland, fog events are described as advected marine stratus clouds coming in touch with the gently rising land (“high fog”, Seely and Henschel, 1998, Fig. 1). They are generally associated with northerly winds at the surface (Seely and Henschel, 1998; Spirig et al., 2019) and feature distinct seasonal characteristics (Lancaster et al., 1984; Seely and Henschel, 1998; Spirig, 2022). It has been speculated that the northerly near-surface winds during inland fog events may be decoupled from the cloud-level winds that transport the stratus and may arise from mixing of different air masses (Seely and Henschel, 1998). In the austral autumn, particularly in April, May, and June (AMJ), the inversion base is very low, and the marine stratus has a low cloud base height of ≤200 m a.s.l. (Andersen et al., 2019; Yakubu et al., 2025) and is often limited to a coastal strip of ≈25 km (here called “fog” from the perspective of a coastal station). During austral spring and summer the inversion is elevated, the marine boundary layer (MBL) is thicker and the stratus base is higher (here called “low cloud” from the perspective of a coastal station), with cloud-base heights of 300–500 m a.s.l. and touching the ground only further inland (Andersen et al., 2019; Malik et al., 2026; Yakubu et al., 2025).
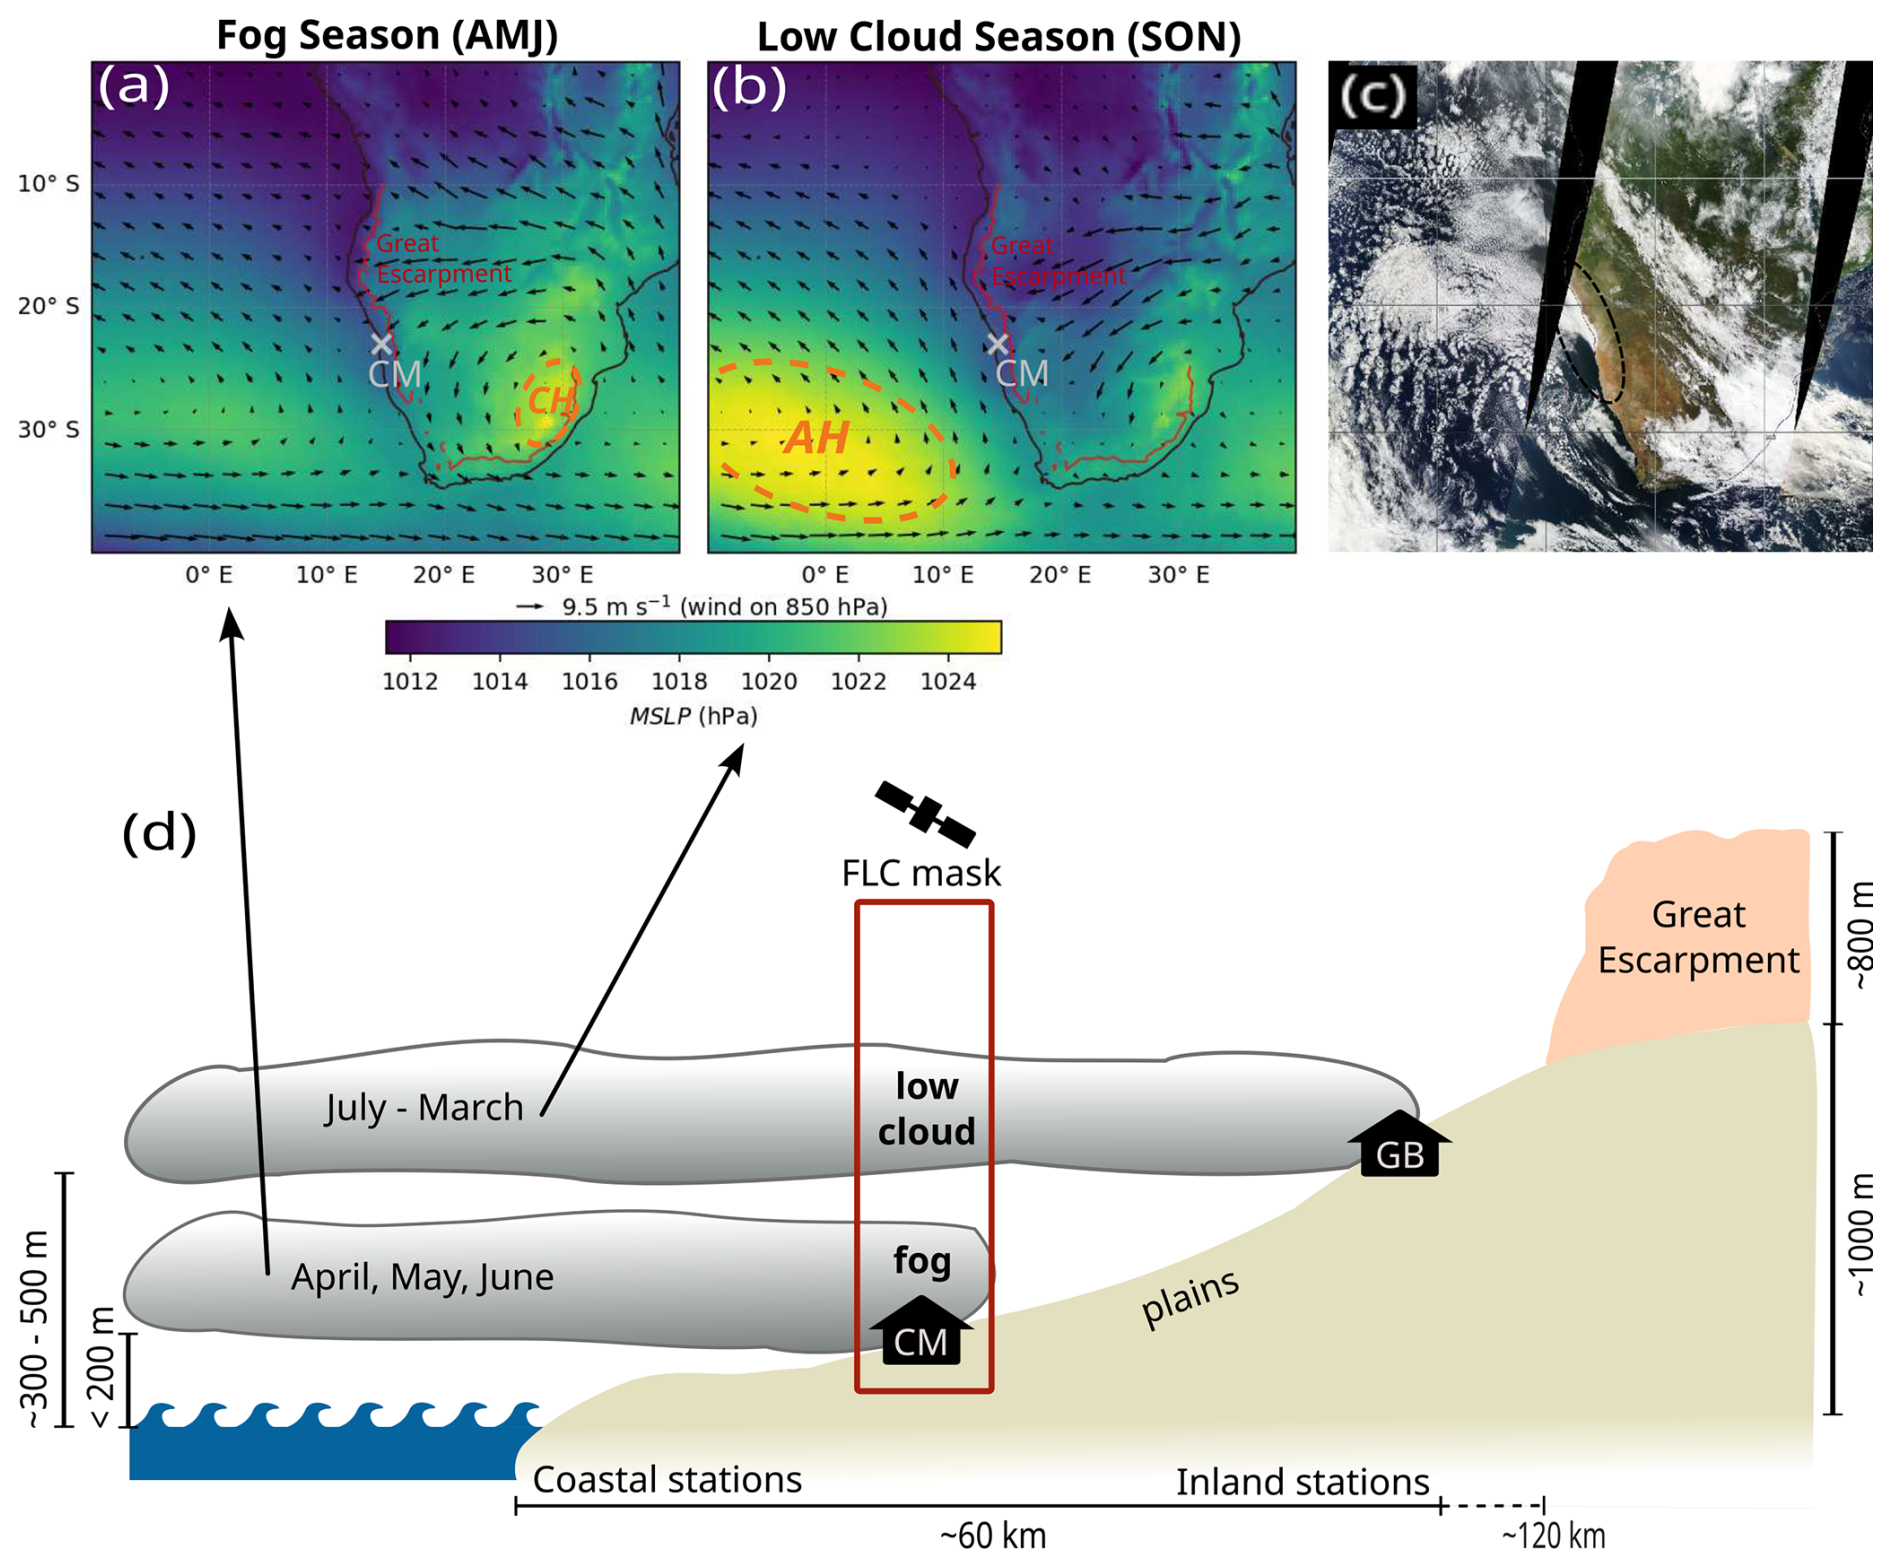
Figure 1Known seasonal patterns of Namib high fog on different altitudes (= fog and low cloud) and study setup. Median composites of the fog (a) and the low cloud (b) peak season featuring synoptic patterns, MODIS Terra snapshot of 23 April 2025 taken from EOSDIS Worldview, showing advected marine stratus forming high fog in the Namib (c) and overview of terms, locations, and data sources, adapted from Andersen et al. (2019) (d). AMJ = April-May-June, CM = Coastal Met station, CH = continental high pressure, SON = September-October-November, AH = Atlantic high pressure, FLC = fog and low clouds, GB = Gobabeb station. The location of the Great Escarpment in (a) and (b) is approximated by the 1000 m elevation contour. MODIS satellite data ©NASA.
The marine stratus clouds offshore the Namibian coast (Fig. 1c) form within a shallow MBL over low sea surface temperatures (SSTs), and under a capping temperature inversion related to large-scale subsidence induced by the South Atlantic High (AH) (Andersen et al., 2020). The AH produces coast-parallel winds in the marine boundary layer from the south-southeast (SSE). This SSE wind stabilizes the atmosphere and the offshore low cloud deck, as it advects cool air into the stratus/stratocumulus region, and is strongest in October due to the latitudinal position of the AH (Fig. 1b) and the land-sea thermal contrast during that season (Zuidema et al., 2009). One should note that the AH is weakest during April and May (Sun et al., 2017), when the marine boundary layer is particularly shallow and the stratus deck low-lying (Andersen et al., 2019). Mostly in austral winter (June, July, August, JJA), a second high pressure develops over the southern African continent (already visible in the AMJ median in Fig. 1a) and the warm and dry air from the continental interior overrides the development of the coastal MBL, possibly reinforcing the shallow inversion that caps the moist and cold marine boundary layer (Preston-Whyte and Tyson, 1988; Tyson et al., 1996; Zuidema et al., 2009; Andersen et al., 2020). Variability at the described synoptic scales influences marine stratocumulus clouds (De Szoeke et al., 2016; Fuchs et al., 2017, 2018), and modulates the regional scale thermotopographic circulation (Tyson and Seely, 1980) that is linked to the inland advection and lifetime of marine fog and low clouds (FLCs) (Seely and Henschel, 1998; Andersen et al., 2020; Mass et al., 2025) and thus regional fog occurrence.
The regional circulation in the Namib Desert is driven by temperature differences between the ocean, flat plain, and mountain surfaces (Weischet and Endlicher, 2000). A moderate SW sea breeze of 5–10 m s−1 (Seely and Henschel, 1998) begins in the late morning at the coast due to stronger heating of the land surface and brings moist, cool air from the ocean. Especially in austral summer (December, January, February, DJF), a second temperature gradient develops between the hot mountains of the Great Escarpment and the cooler flat plain, causing a strong northwesterly wind of 10–15 m s−1 to start blowing in the late afternoon (Seely and Henschel, 1998). This plain-mountain wind keeps blowing until around midnight and overlasts the sea breeze, which cedes at dusk. With the afternoon NW wind, fog or low stratus clouds from the ocean creep onto the land (Andersen et al., 2019) and hinder nocturnal radiative cooling. The bare inland and mountain regions cool down faster, reversing the temperature gradient of the day, especially in austral winter (JJA). This results in a shallow, surface-based cold katabatic mountain-plain wind, which blows with 5–10 m s−1 from the Escarpment down to the sea. At Gobabeb it has been observed to reach a depth of up to ≈1000 m a.g.l. with maximum wind speeds at 250–500 m a.g.l. (Lindesay and Tyson, 1990). It arrives at the coast cooler than the marine boundary layer advected from the west and is expected to mix with it and produce the observed northerly winds associated with inland fog occurrence (Seely and Henschel, 1998; Spirig et al., 2019). However, the mountain-plain wind has also been documented to undercut or block the sea breeze. This diurnal wind pattern is repeated regularly unless disturbed by synoptic-scale perturbations such as bergwinds, coastal lows, or cold fronts (Lindesay and Tyson, 1990). Bergwinds are hot and dry subsiding easterly winds that are produced by a strong horizontal pressure gradient between the elevated continental interior and the coast. Bergwinds are typically associated with ridging high pressure systems (Ndarana et al., 2018) and most often occur in winter, frequently reaching the coast to produce hot, dry and cloud free conditions there (Lancaster et al., 1984).
From the satellite perspective, both fog near the coast and further inland, with their complementary seasonality, are observed as advected marine low stratiform clouds (Olivier, 1995; Cermak, 2012; Andersen et al., 2019; Spirig et al., 2019) (Fig. 1d) occurring at varying altitudes. However, the physical mechanisms that determine the altitude of the advected stratus and, therefore, the spatial patterns of fog occurrence, are not understood yet. While satellite imagers can easily observe the spatial extent of fog and low stratus clouds (Fig. 1c), they cannot retrieve cloud-base height to distinguish between the two with high accuracy, neither by microphysical (Cermak and Bendix, 2011) nor by machine learning techniques (Egli et al., 2018). Space-born lidars yield much higher accuracy (Cermak, 2018; Qiao and Wang, 2022), but the spatial and temporal coverage of the scenes is sparse. Hence, no spatially coherent fog occurrence data exists to date.
Given the advective nature and the contrasting seasonality between fog and low clouds, it seems plausible that synoptic-scale variability contributes to the elevation of the stratus and thus to the occurrence of one or the other. However, it is not yet clear which meteorological aspects of the variability are mechanistically related to fog vs. low-cloud occurrence. One reason for this knowledge gap is the current inability to distinguish fog and low clouds directly from satellite imagery. More specifically, the large-scale high-pressure systems in the South Atlantic and over continental southern Africa have been suggested to drive the spatial extent of fog in the Namib (Lancaster et al., 1984) and are linked to FLCs in the different seasons (Andersen et al., 2020). Easterly winds occurring primarily during the fog season (Fig. 1a) have been related to the seasonal thinning of the MBL (Veloso et al., 2024) and were also found in a simulation of a fog event in September (Hacker, 2024), yet a systematic explanation of the large intraseasonal variability of the MBL height (Veloso et al., 2024) is still missing.
This study aims (i) to characterize the meteorological situations during the two fog variants and (ii) to investigate the extent to which the identified drivers can be used to classify the satellite-based FLC product into fog and low clouds. We combine fog records of a representative near-coastal station with satellite information on FLCs to create a dataset encompassing both fog and low-cloud events from the perspective of a coastal site (CM in Fig. 1d). We then use reanalysis data and a statistical model to address the following specific hypotheses:
-
Seasonal and intraseasonal variability of the two high-pressure systems influences the regional thermotopographic circulation and the altitude of the capping inversion and thus the occurrence of fog vs. low clouds.
-
Information on meteorological drivers can be exploited to separate fog from low clouds in a satellite-based FLC product.
Three main data sources contribute to this study to give a complete analysis.
-
Satellite data from the Spinning Enhanced Visible and Infrared Imager (SEVIRI)
-
The ERA5 dataset, a reanalysis of global hourly meteorological variables
-
In situ measurements from the 2014 established FogNet, combined with in situ measurements from the NaFoLiCA campaign in September/October 2017
The satellite-based FLC product is a mask of low-cloud presence, derived from infrared bands of the geostationary satellite SEVIRI, and is described in Andersen and Cermak (2018). FLCs are one single category and are detected with a probability of 94 % and a false-alarm rate of 12 % in a 3 km × 3 km pixel and with a temporal resolution of 15 min (Andersen and Cermak, 2018). The algorithm excludes high ice clouds with spectral thresholds and then identifies FLC by comparing to monthly and annual composites of cloud-free conditions. A further context-plausibility check is applied via an iterative counting of surrounding FLC pixels (Andersen and Cermak, 2018). The product is available for the years 2004 to 2020.
The ECMWF Reanalysis Version 5 (ERA5) is a global coverage reanalysis product with hourly meteorological variables (mean variables correspond to the temporal mean of the foregoing hour) and is used to characterize the large-scale conditions during fog and low-cloud events. ERA5 spans from 1940 to the present and has a horizontal resolution of 0.25 ° and a vertical resolution 25–50 hPa (Hersbach et al., 2020). It is produced by assimilating multiple observational data sets like station data, radiosondes, and satellite imagery into a numerical model. The variables used in this study are mean sea level pressure (MSLP), geopotential (Z), mean surface latent heat flux (LHF), mean surface sensible heat flux (SHF), temperature (T), specific humidity (Q), relative humidity (RH), boundary layer height (BLH), wind components (U, V, W), sea surface temperature (SST) and temperature at 2 m (T2M). ERA5 uncertainties differ across variables, with surface fluxes being less tightly constrained than directly observed quantities such as sea surface temperature (Bentamy et al., 2017; Luo and Minnett, 2020; Martens et al., 2020; Pokhrel et al., 2020). Specifically for near-surface winds in the central Namib, Mass et al. (2026) report that the diurnal evolution of the thermotopographic mountain-plain wind in ERA5 is delayed relative to in situ observations, but the circulation is captured at the time of our composite analysis (05:00 UTC). The ERA5 bulk Richardson number-based “BLH” does not account for liquid water and tends to approximate the cloud-base height rather than the true PBL height in marine cloudy boundary layers (Engeln and Teixeira, 2013). It can therefore be expected to be biased low in coastal Namibia.
In situ measurements serve as ground truth and have a higher temporal resolution than the first two data sources. We here employ FogNet data from two stations, namely Coastal Met (CM) and Gobabeb (GB). Both measure the standard meteorological variables (RH, T, and wind; see also Spirig, 2022) at 1 min resolution, and additionally measure passive fog collection with Juvik-type fog collectors. Each Juvik-type collector comprises a louvered aluminium cylinder (12.7 cm in diameter, 40.6 cm tall) mounted above a tipping-bucket rain gauge that registers fog water dripping from the collector in discrete 2 mL increments. The instrument design follows Juvik and Nullet (1995) and includes a protective rain shield that also reduces longwave radiative cooling of the mesh, thereby suppressing dew formation on the collector itself. The amount of fog water is scaled to a square meter: 1 mm of fog collection correspond to 20 mL of fog water. Via the collector's projected silhouette area of 515.6 cm2 the fog water amounts are comparable to other collector types. The resulting passive fog collection is a semi-quantitative measure of fog deposition because the collection efficiency depends on the silhouette area exposed to the airflow and on the surface properties of the mesh (Spirig et al., 2019). Misclassification of dew-only nights, which also occur frequently in the Namib (Henschel and Seely, 2008), as fog events is therefore unlikely: beyond the suppression of dew on the collector by the rain shield, dewfall in the central Namib is expected primarily under clear-sky conditions, whereas our analysis is restricted to nights with low-cloud cover. The relative humidity is measured by a Campbell Scientific CS215 sensor (CampbellScientific, 2013) and is used to check the plausibility of fog occurrence, i.e., relative humidity above 90 %. The measurements of FogNet are available from August 2014 onward, but we will exclusively use data from August 2014–December 2020, as this aligns with the availability of the FLC product.
GB is located in the inland zone where fog events generally are associated with northwesterly or northerly winds and occur between September and March (Lancaster et al., 1984). CM, on the other hand, is located just 17 km from the sea, at the border of the high fog belt (20–120 km) inland, Seely and Henschel (1998). It thus serves to first identify and then distinguish near-coastal and inland high fog events with the intent to combine them with the FLC product. Based on the predominant northerly winds during fog events at CM (Lancaster et al., 1984; Spirig et al., 2019; Spirig, 2022) and known advection patterns from satellite analyses (Andersen et al., 2019), fog events in CM are expected to be stratus clouds with low cloud base altitude, touching the land at the station elevation of 94 m a.s.l. Stratus clouds with a higher base altitude may pass CM overhead as a cloud and result in fog further inland. Thus, FLCs derived from SEVIRI may appear as fog or cloud at CM depending on the altitude of the stratus.
We furthermore use data from the Namib Fog Life Cycle Analysis field campaign (NaFoLiCA, Spirig et al., 2019) that took place in September/October 2017 in both CM and GB. During this period, two SODARs (sonic detection and ranging MFAS from Scintec) measured wind direction and speed, as well as the three wind components U, V, and W up to 900 m above ground level at CM and GB in 30 min intervals at 15 m vertical resolution based on the return strength (SNR, signal-to-noise ratio) of an acoustic signal. Furthermore, a ceilometer (CL31 from Vaisala) was installed at CM, complementing the existing installation of another ceilometer (CS135 from Campbell Scientific) at GB. These provide backscatter profiles and cloud base height up to 7 and 10 km, respectively, at a 1 min resolution (see Malik et al., 2026 for detailed instrument description).
To create median composites for the two event types, the dates of fog and low-cloud events were derived by combining station and satellite data and were then used to extract data from the reanalysis.
In the first step, the satellite FLC product was used to identify days with FLC presence by selecting days on which FLC is detected in the majority of satellite scenes (min. 5 out of 9) over CM between 04:00 and 06:00 UTC, the time of maximum FLC occurrence at CM (Andersen and Cermak, 2018). These FLC days are then divided into fog and low-cloud days using in situ fog collection measurements. Fog days were defined as FLC days where any amount of fog water was collected at CM between 04:00 and 06:00 UTC (338 d) and enriched by fog events that were not detected by the FLC product (e.g., due to higher-level clouds above, 411 d). Low-cloud days are therefore all FLC days without any fog collection in the time window. In total, the data covers a common time span of in situ and FLC data from July 2014 to December 2020, containing 749 fog and 623 low-cloud days. Consistency checks with in situ relative humidity showed that 97 % of fog events exceed 95 % relative humidity.
3.1 Composite analysis and case study
ERA5 composites at 05:00 UTC were computed by calculating the median pixel value of fog or low-cloud events, respectively, over southern Africa and adjacent parts of the Atlantic Ocean (median composites). Difference maps were created by subtracting the fog from the low-cloud composite. As fog and low clouds at CM feature a contrasting seasonality, the resulting meteorological composites can be expected to have a strong signature of the peak seasons. The composites can therefore not be directly interpreted as being mechanistically linked to fog vs. low clouds. Hence, regions are identified where the composite differences have the same sign in all 4 seasons DJF – MAM – JJA – SON to facilitate interpretation. The heatflux composites were computed additionally at 03:00 UTC, which is before sunrise in all seasons, to check for radiation influence, and showed no relevant differences to 05:00 UTC. To examine the specific interplay of the identified general drivers, the fog event of the night of 22/23 September 2017 was analysed in more detail and supplemented with the additional ceilometer and SODAR data from the NaFoLiCA campaign. Anomalies from typical September conditions were calculated in units of the standard deviation from hourly mean values of all September events (including clear days).
3.2 Statistical classification
A simple logistic regression (Cox, 1958) is used to classify FLC-covered days at CM into fog and low-cloud days using ERA5 data of large-scale features associated with fog vs. low-cloud appearance. The logistic regression resembles a linear regression but uses a sigmoid function that is fitted by maximum likelihood estimation to predict class probabilities (Hosmer et al., 2013). We use the default settings of the Python library scikit-learn (Pedregosa et al., 2011) but without L2-regularisation. The L2-regularisation reduces overfitting in the case of many input variables (Tibshirani, 1996), which does not apply to our study since we only use three variables.
To estimate the model's skill and transferability, we use cross-validation. Because the data is a non-continuous time series (only FLC-covered days), a custom cross-validation algorithm is implemented to achieve (1) minimum temporal correlation between training and test set, and (2) representation of all seasons in the test set. For that purpose, all events within a window of 365 consecutive days are used as a test set, and the remaining FLC days are used for training, discarding the 7 d before and after the test window. During the iteration process, the window is moved over the time series in 3-month steps. This results in 23 cross-validation iterations (6 non-overlapping). Across iterations, this corresponds on average to a training-to-test ratio broadly equivalent to a standard 5-fold cross-validation split.
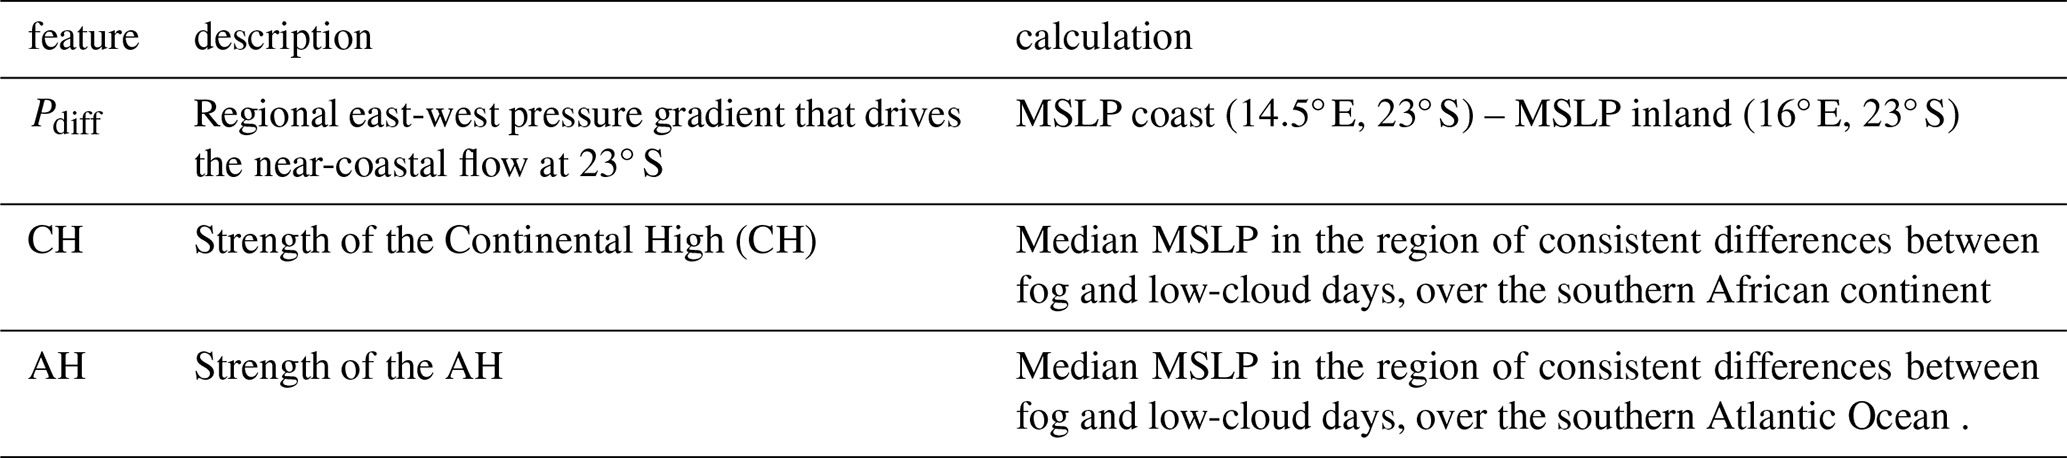
As suitable input variables for the logistic regression, the observed patterns from the composite analysis were captured in a range of single-value variables and refined to three meaningful features (Table 1). The features were standardized separately in each iteration of the cross-validation using a pipeline to mitigate the effects of different value ranges.
Table 1Features used in the logistic regression to classify fog and low-cloud days over CM, Namibia. Calculated from ERA5 data at 05:00 UTC.
The performance of the logistic regression is compared to a climatological baseline. Instead of using model predictions, the cross-validation procedure is performed using random draws from the monthly probabilities of fog/low-cloud occurrence. Full years serve as folds. To ensure reliable performance estimates, the random draw predictions for each excluded test year are repeated 1000 times and averaged. Model skill is evaluated using two complementary metrics: classification accuracy, defined as the fraction of correctly classified events, and the F1-score, defined as the harmonic mean of precision and recall for the fog class. The F1-score is reported in addition to accuracy because it is less sensitive to changes in class balance between cross-validation folds and rewards a model only when both classes are correctly identified.
4.1 Large-scale meteorological differences between fog and low clouds
Fog and low clouds at CM show a pronounced alternating seasonality (Fig. 2). The months April-May-June (AMJ, indicated by the red bars at the top of the figure) capture the peak fog season, while the months September-October-November (SON, blue bars) are dominated by low clouds. This seasonality agrees roughly with Veloso et al. (2024), who find a deeper MBL during austral summer and a thinner MBL during the fog peak season in early winter. The peak occurrence time can vary considerably between years, as 2017 shows a late fog peak in August and September compared to the expected peak time in May and June (e.g., in 2018). The usual low-cloud peak is missing in November/December 2019, followed by irregular fog peaks during 2020, which makes these two years show unusual FLC occurrence.
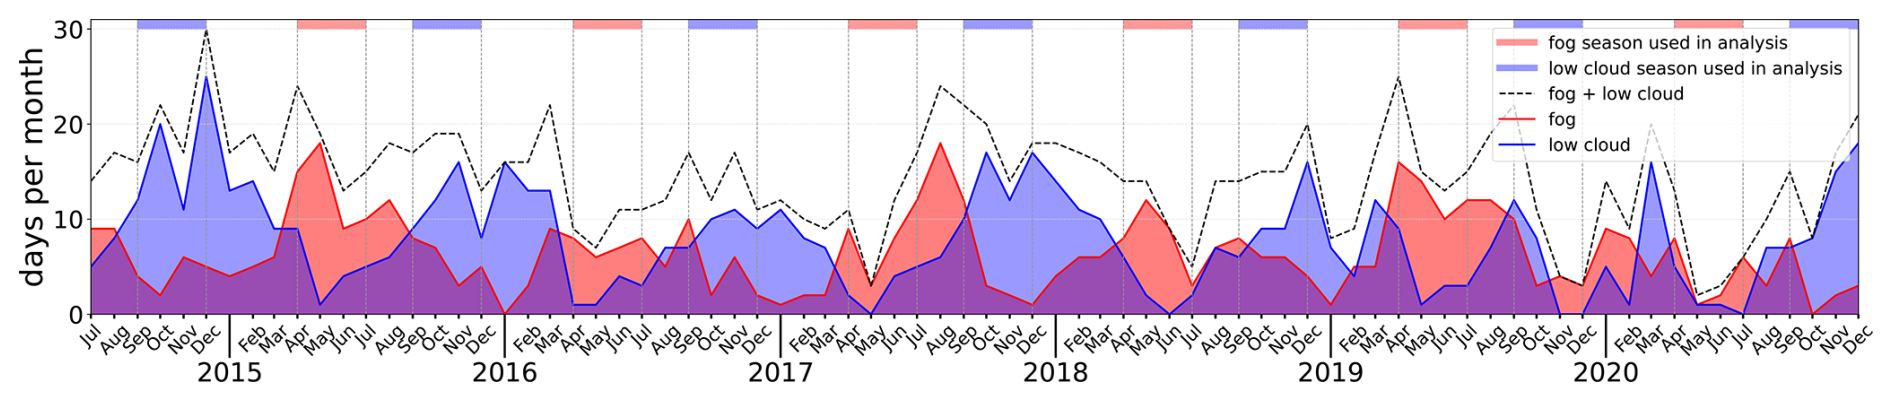
Figure 2Time series of monthly counts of fog (red) and low-cloud (blue) events and their sum (dashed line) between 04:00 and 06:00 UTC at CM, according to combined SEVIRI-based low-cloud data and in situ passive fog collection. Bars at the top and dotted vertical lines indicate the months of peak seasons at CM of fog (red, April-May-June) and low clouds (blue, September-October-November).
To examine the key drivers beyond peak season characteristics, we compare fog events during the whole year to low-cloud events during the whole year using median composites of meteorological variables (Fig. 3). A pattern of dipolar pressure differences appears in the composites of the fog vs. low-cloud events (Fig. 3a–c), resembling the peak season conditions (Fig. 1a, b). The outlined differences are consistent throughout the year (all four mean differences during DJF, MAM, JJA, SON have the same sign, e.g., MSLP is greater in all four seasons) and may thus point to a physical link to stratus altitudes and, thereby, to spatial fog occurrence patterns. In the following, the consistent differences over the ocean are described and discussed first, followed by the consistent differences over the southern African continent.
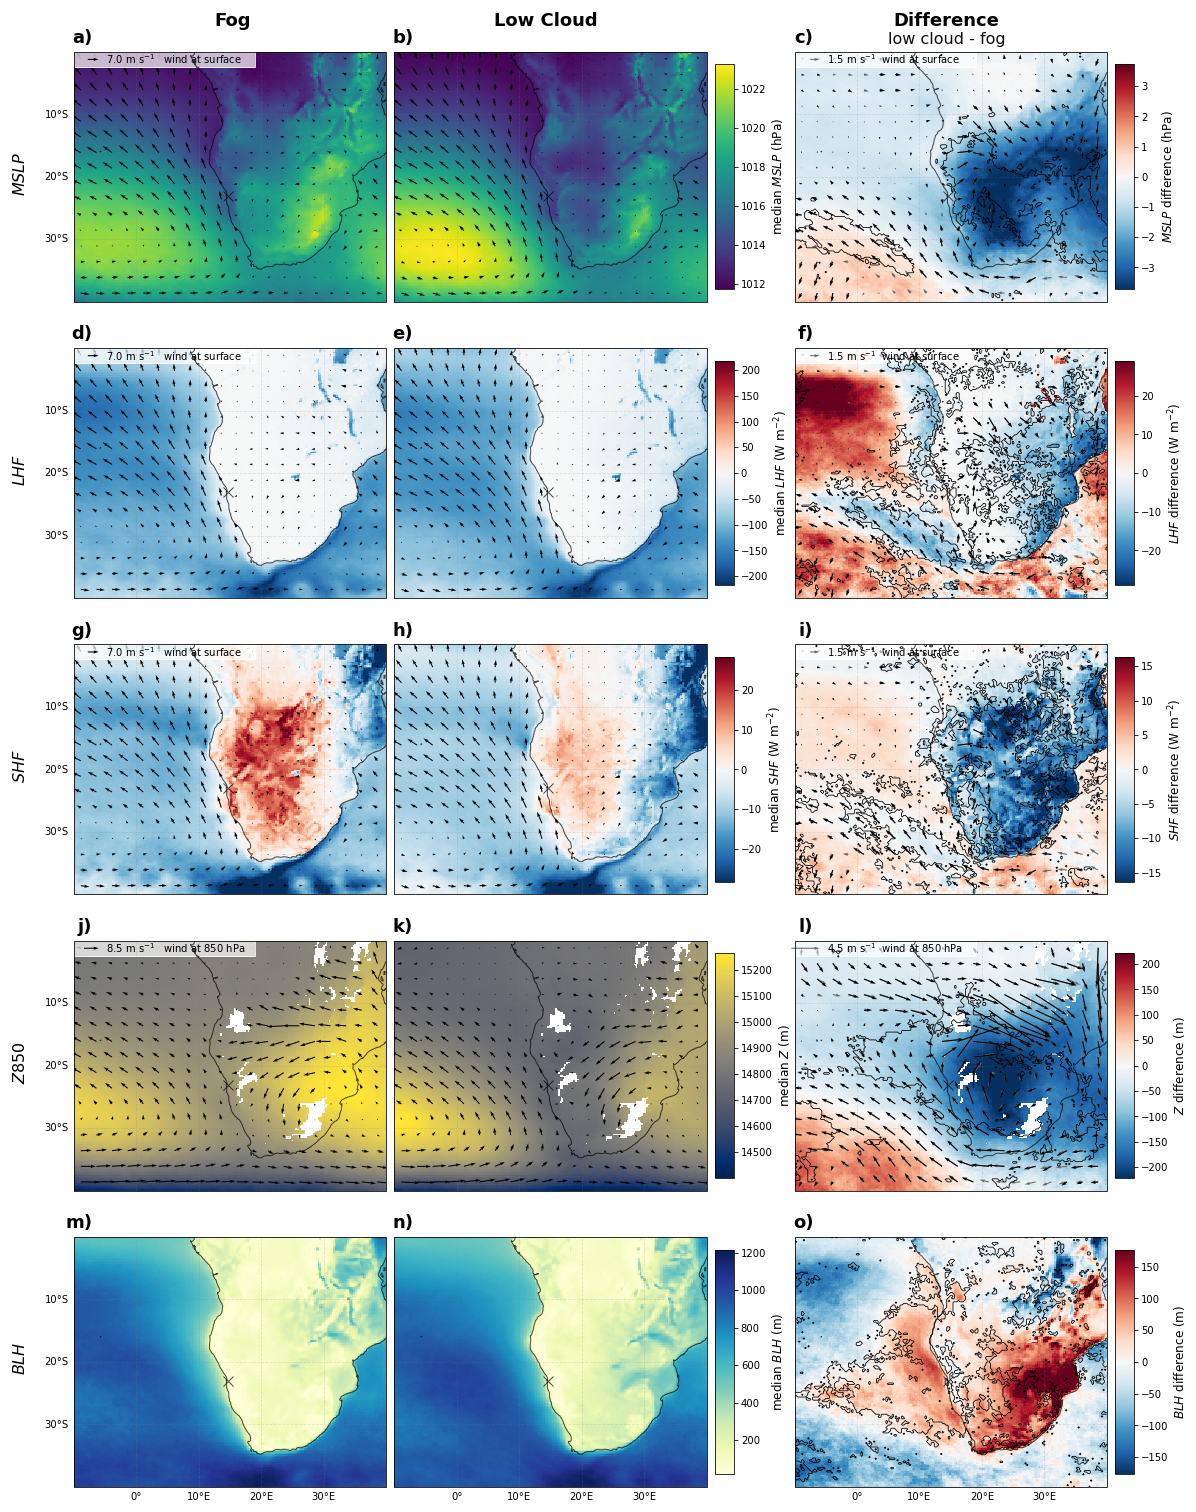
Figure 3Median synoptic situation at 05:00 UTC during fog (left column) and low-cloud (central column) events at CM (x) and their differences (right column). Regions where the differences are consistent throughout the year (same sign) are highlighted with contours for the variables (a, b, c): mean sea level pressure (MSLP); (d, e, f): geopotential height at 850 hPa (Z850); (g, h, i): mean surface latent heat flux (LHF); (j, k, l): mean surface sensible heat flux (SHF); (m, n, o): boundary layer height (BLH). Arrows show U and V wind on the corresponding pressure level or at the surface, in black (U or V have the same sign differences throughout the year) or grey (none of the two has the same sign differences). Flux direction is negative upward, so the blue (red) difference indicates stronger (weaker) upward fluxes during low-cloud events compared to fog. Data from ERA5. Where the land surface is higher than the given pressure level, values are masked.
Low-cloud situations show higher pressure (red) and about 27 % stronger anticyclonic winds on the northeastern flank of the AH, at ≈30° S (Fig. 3c). In the region of increased surface winds, increased upward latent and sensible heat fluxes are apparent during low-cloud situations (blue in Fig. 3f, i, as fluxes are negative upward and generally upward over the ocean during both fog and low clouds in Fig. 3d, e, and g, h).
The differences in geopotential at 850 hPa (Fig. 3l) appear similar to the MSLP differences (Fig. 3c) with lower values over the continent (blue) and higher values (red) in the AH region in low-cloud situations. However, the region of seasonally consistent lower geopotential extends from the continent over the ocean (Fig. 3l). This difference persists up to 500 hPa (not shown) and is tilted towards the coast, suggesting a slightly stronger subsidence regime in fog cases. In this marine region and extending offshore, the MBL is consistently shallower in fog situations (Fig. 3o), particularly near the Namibian coastline northwest of CM, where the median difference in MBL depth is up to 130 m. While it is likely that the BLH is generally biased low (see Sect. 2), it is not expected that this bias would strongly influence this composite difference.
We interpret the composites and their differences in terms of AH-related processes as follows. The more pronounced AH in low-cloud situations produces the observed stronger coast-parallel southeasterly winds at ≈30° S. This causes increased cold-air advection from the south, which likely drives the intensified sensible and latent heat fluxes into the MBL in low-cloud situations. Increased upward heat fluxes indicate a stronger contrast between cool air over warm ocean water, leading to unstable conditions, stronger evaporation and heat uptake from the ocean, and have been found to result in a deeper MBL by increasing the buoyancy and the vertical mixing in the MBL (Jury and Walker, 1988; Zheng et al., 2021). Indeed, Andersen et al. (2020) found that specific humidity in MBL air masses is higher on FLC days than on clear days already at least 24 h before the FLC event occurs in the Namib. This suggests that the development of the MBL over multiple days critically determines its moisture content, depth, and the resulting stratus altitude.
The AH also drives a coastal jet centered at around ≈20° S (Nicholson, 2010), which is weakest in May and June during the fog peak season and most pronounced during the low-cloud peak season. The jet evolves when winds from the AH are deflected into a coast-parallel direction by the elevated terrain, and it advects cold air into the marine stratocumulus region, thereby enhancing stability and cloud formation (Zuidema et al., 2009). While our results do not show local differences in wind speeds at this latitude between fog and low-cloud days, a link to stratus altitude is likely and warrants further attention in the future.
Over the southern African continent, low-cloud situations feature lower MSLP (blue), and a less pronounced influence of continental airmasses at the coast. One should note that MSLP is likely affected by the elevation of the topography in southern Africa. The difference in the wind patterns is even more pronounced at 850 hPa than at the surface, featuring less continental easterly winds arriving at the coast in low-cloud situations (Fig. 3l).
In both fog and low-cloud situations, the cool and moist coastal MBL is capped by warm and dry air (Fig. 4), forming an inversion that lowers and strengthens towards the continent. The vertical position of this inversion cap is lower during fog situations throughout the seasons and along the entire Namibian coast, confining the shallow BL. The inversion cap in fog situations is warmer than during low-cloud situations. It should be noted that the differences in temperature and moisture profiles is strongest below the inversion base in low cloud conditions, i.e. in layers that already feature an inversion in fog cases but that are within the boundary layer in low cloud cases. Local temperature and moisture profiles at CM are shown in supplementary Fig. A1, and highlight that differences between fog and low cloud cases peak at 950 hPa. As the temperature cross sections show limited temperature differences at 1000 hPa over the ocean and above 850 hPa in the free troposphere, the overall stability of the lower troposphere, which is an important fog and low cloud control (Espinoza et al., 2024; Mass et al., 2026), is not found to differ substantially.
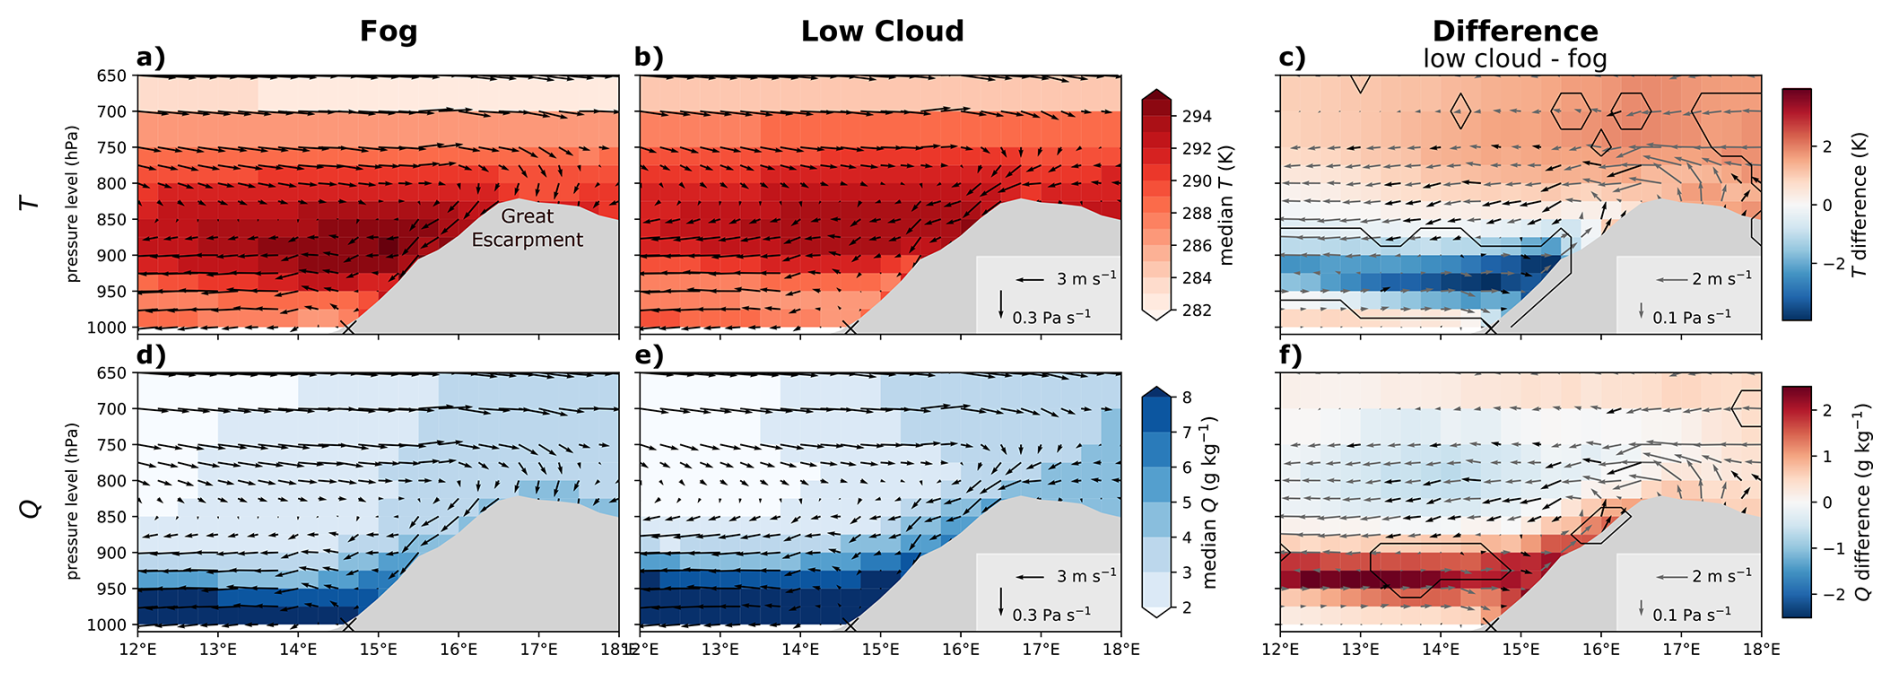
Figure 4ERA5 median vertical structure of the regional atmosphere at 23° S, 05:00 UTC for (a, b, c): temperature (T) and (d, e, f): specific humidity (Q) with u and w (multiplied by factor of 10 for visualization purposes) wind (arrows). Composites of fog (left) and low-cloud (centre) events at Coastal Met, Namibia (x) and their differences (right). Seasonally consistent differences are highlighted with outlines and black wind arrows.
There are also differences in the regional circulation. The zonal circulation pattern over the ocean is shifted vertically by one reanalysis pressure level (25 hPa), with a turnaround from easterly winds near the surface to westerly winds at 850 hPa (fog) vs. 825 hPa (low cloud) where temperatures decrease again (Fig. 4a, b). This vertical shift appears consistently throughout the seasons with free troposphere (FT) winds between 750 and 900 hPa having a consistently weaker eastward component in low-cloud situations, visible by the easterly direction of the residual wind vector in Fig. 4c. The subsidence over the Great Escarpment is consistently less pronounced in low-cloud situations and vice versa, more pronounced in fog situations (Fig. 4a–f). One should note the lack of a pronounced easterly wind at the Escarpment which would, if present, indicate a systematic synoptic forcing in the composite. In both fog and low-cloud situations, the subsiding air masses follow the topography towards the coast. In fog situations, this easterly flow is slightly stronger and persists to lower elevations, thus reaching closer to the coast. The depth of these easterly winds is comparable to the typical depth of the katabatic mountain-plain wind with ≈ 1000 m a.g.l., peaking at 250–500 m a.g.l. described by Lindesay and Tyson (1990).
The described difference patterns likely work together to modulate the altitude of the advected stratus through the following sequence of processes. A stronger AH in low-cloud cases drives enhanced coast-parallel southeasterly winds and increased surface heat fluxes upstream (Fig. 3f, i), supporting a deeper, more vigorously developing MBL that arrives at the Namib coast deeper than in fog cases. A weaker AH in fog cases produces weaker upstream heat fluxes and an MBL that arrives shallower. The temperature signature of this depth difference at fixed pressure levels in the coastal MBL (cooler in low-cloud cases at 975–900 hPa, with near-surface temperatures and T at 850 hPa essentially unchanged) is likely dominated by the inversion sitting at higher altitudes in low-cloud cases, rather than by a uniform thermodynamic anomaly of the MBL air mass. Locally over the elevated interior, the higher continental pressure and stronger subsidence in fog cases is likely to suppress daytime convective cloud cover, which enhances overnight longwave radiative cooling of the elevated terrain, and thereby strengthens the shallow surface katabatic drainage component that can mix with, undercut, or block the marine air mass near the coast (Lindesay and Tyson, 1990; Seely and Henschel, 1998). Because this drainage flow is cool, it cannot cap the MBL from above and is therefore not expected to contribute meaningfully to the inversion-lowering signal of the fog days in the composites.
Lower continental pressures have already been related to inland-reaching FLC occurrence (Andersen et al., 2020) and longer persistence of FLC events (Mass et al., 2025). Warm easterly continental winds have been associated with lower cloud base height of Namibian FLCs during events with limited inland extent in simulations (Hacker, 2024). These simulated low-lying fog events featured warmer capping air and a stronger inversion, in line with the satellite and ERA5 data. Hacker (2024) suggests that a merging of the continental NE wind with SE trade winds may result in a strengthening of the capping inversion. Easterly continental winds have also been found to cause a shallower MBL offshore the central Namib during the fog season March–August, with decreased FLC cover, especially in the region north of CM (Veloso et al., 2024), where we observe the greatest BLH differences between fog and low-cloud situations. One should note that both the simulated low-cloud-base events of Hacker (2024) and the monthly-mean easterly-winds presented in Veloso et al. (2024) are at least partly capturing bergwind-type conditions. In most such situations the warm, dry descending continental air entirely dissipates the marine stratus, consistent with the decreased FLC cover reported by (Veloso et al., 2024) and with the general expectation that strong descending continental winds and the associated adiabatic heating overwhelm the coastal stratus regime. When the dry descending continental air does not reach the surface at the coast, however, it can instead lower and confine the stratus into a narrow band of low-lying fog at the coast (Hacker, 2024). It is possible that the warmer capping air and slightly stronger easterly advection in fog cases could be partially due to such bergwind-type conditions contained in the fog composite. We therefore present one such event as a case study in Sect. 4.2.
A note on scale separation. The discussion above implies that the regional easterly circulation in the central Namib is the product of two physically coupled but qualitatively distinct contributions: a synoptically forced subsiding easterly (bergwind), driven by the horizontal pressure gradient between the elevated continental interior and the coast, and a cold surface-based katabatic drainage component driven by local nocturnal radiative cooling. The two are not independent as a similar high-pressure regime that establishes the synoptic pressure gradient also facilitates the formation of the local katabatic flow, but they cannot occur simultaneously and interact with the marine boundary layer in qualitatively different ways. The synoptically forced flow arrives at the coast warmed by adiabatic descent and would act on the MBL from above, while the shallow cool surface katabatic drainage is more likely to mix with or undercut/block it near the surface than to cap it (Seely and Henschel, 1998). An inversion-strengthening or lowering signal in our composites can though only be caused by the synoptically forced component, since only the warmed-by-descent synoptic flow can cap the marine boundary layer from above. However, this is not thought to be a dominant process as no clear evidence of a systematic presence of synoptically forced easterlies is present in the fog composite (e.g. no easterly component of winds above the Escarpment). The same coupling affects the interpretation of regional pressure-gradient diagnostics such as Pdiff (Table 1), which captures the local east–west pressure gradient driving the near-coastal flow but cannot be uniquely attributed to a single scale of forcing.
The relationships between the continental synoptic pressure (CH), the regional pressure gradient Pdiff, the near-coastal flow and the offshore marine BLH are shown in Fig. 5. The strength of the CH is moderately and negatively correlated with Pdiff (Pearson r=−0.43, Fig. 5a), confirming that a stronger CH is reflected in a more pronounced east-west pressure gradient toward the coast, and that the synoptic and regional pressure signals are physically coupled. Pdiff in turn is moderately correlated with the 900 hPa zonal wind close to CM (r=0.51, Fig. 5b), showing that the regional pressure gradient is associated with a stronger easterly component of the near-coastal flow. The strongest relationship is between Pdiff and the offshore BLH at the same latitude (r=0.62, Fig. 5c), with a more negative Pdiff associated with a shallower offshore MBL. This last relationship connects the CH to the depth of the marine boundary layer that ultimately controls the stratus altitude. One should note that the Pdiff–BLH scatter (Fig. 5c) is triangular rather than elliptical: a deep MBL is observed only when Pdiff is weakly negative or positive, while strongly negative Pdiff values are systematically associated with a shallow MBL. This asymmetric distribution suggests that the bergwind regime contained in the lower-tail of the Pdiff distribution imposes a direct local upper bound on the offshore MBL depth by mechanically suppressing it, while in the bulk of the distribution the Pdiff–BLH relationship does not seem to be as tightly coupled and is more representative for the synoptically unforced conditions. The fog (red) and low-cloud (blue) events are visibly displaced from each other in all three panels, illustrating that these synoptic and regional variables jointly carry information that discriminates between fog and low-cloud events. This motivates their use as features in the classification of Sect. 4.3.
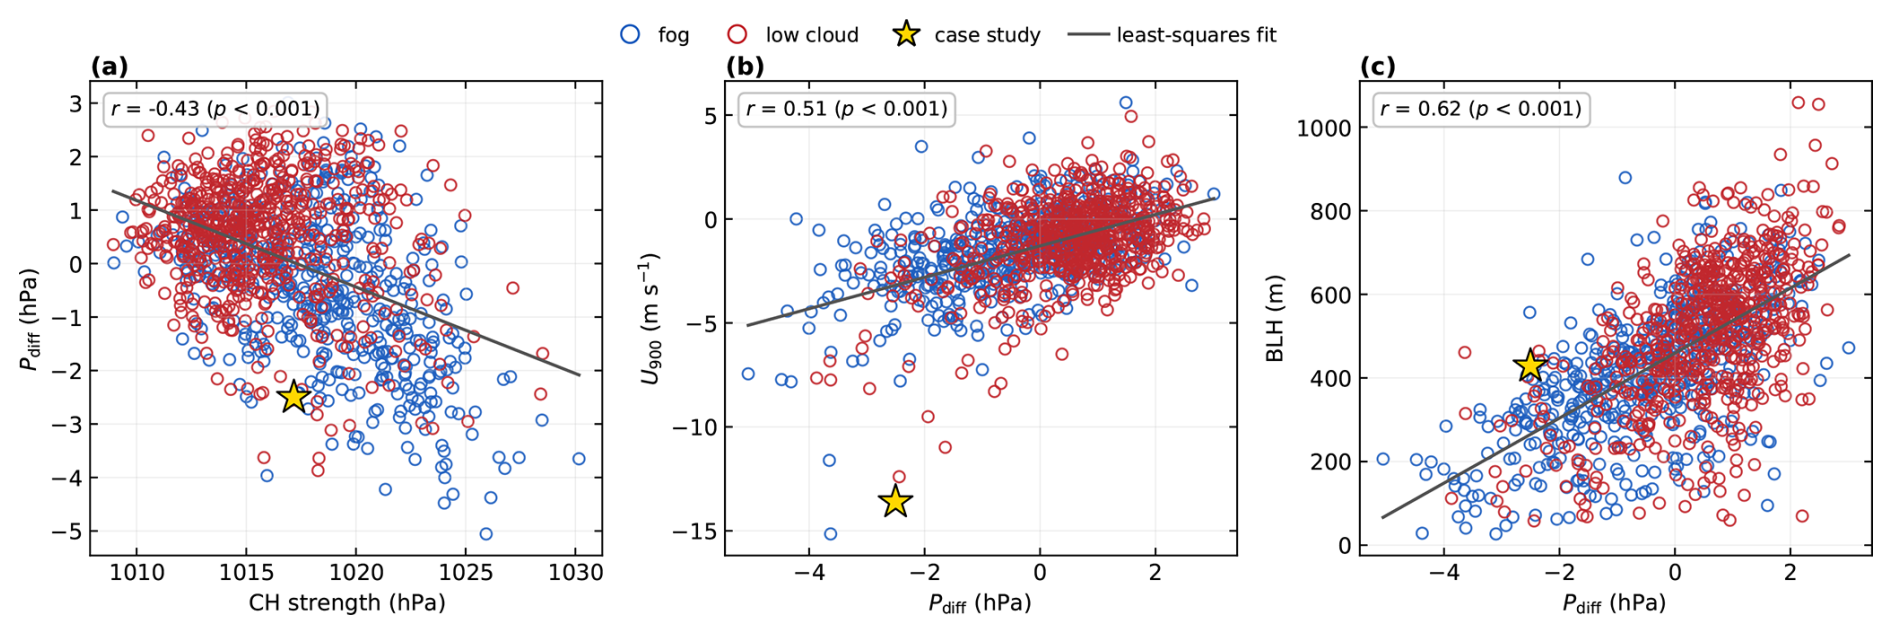
Figure 5Quantitative relationships between the synoptic and regional pressure pattern, the near-surface zonal wind in the Central Namib, and the offshore boundary layer height, evaluated across all fog (red) and low-cloud (blue) events at CM. (a) Strength of the continental high (CH, Table 1) versus the regional pressure gradient Pdiff. (b) Pdiff versus the 900 hPa zonal wind component at 23° S and 15° E. (c) Pdiff versus the offshore boundary layer height west of CM (23° S and 13° E). Pearson correlation coefficients are given in each panel. All quantities are computed from ERA5 at 05:00 UTC. The star marks the case event investigated in more detail as a case study in Sect. 4.2.
From the composite analysis, we summarize the following seasonally consistent large-scale characteristics of low clouds compared to fog (and vice versa): (1) A stronger AH produces stronger MBL winds, cold air advection, and enhanced sensible and latent heat fluxes upstream of the study region, in combination leading to a deeper marine BLH during low cloud cases than in fog cases. (2) Inland over the elevated terrain, a weaker continental high reduces the production of near-surface katabatic drainage (Lindesay and Tyson, 1990). The composites do not show marked differences in local subsidence or synoptically forced warm and dry easterlies between fog and low-cloud cases, so the majority of the inversion-lowering signal in the composite is most plausibly attributed to the upstream processes rather than to anomalously strong local downward forcing.
4.2 Case study: Fog outside the peak season
In the following, an anomalous fog event that occurred during the low-cloud season is used to assess how the identified meteorological differences may contribute to day-to-day variability in stratus altitude and out-of-season occurrence of fog at CM. The event occurred during the NaFoLiCA campaign and is partially documented in Spirig et al. (2019).
During the night of 22/23 September 2017, a stratus is advected over CM with a cloudbase height consistently below 100 m a.g.l., appearing as fog from about 23:00 to 06:30 UTC at CM with almost no lowering and lifting (Fig. 6a). During the nights before and after, a low stratus is advected at 300–500 m a.g.l. that either stays lifted as a low cloud (leading to fog further inland, 20/21 September) or lowers towards the surface, leading to fog occurrence at CM, and then strongly lifts and dissipates after sunrise (19/20, 21/22, 23/24 September). The sudden appearance of a very low cloud base height during the case study possibly points to a generally low stratus layer and thus to a shallow MBL. A limited stratus extent is apparent on the available MODIS Terra image at 09:00 UTC (Fig. 6b), showing a narrow 20–30 km wide coast-parallel cloud strip that has, at that time, already been shifted back towards the ocean.

Figure 6The fog event 23 September 2017 from the station and the satellite perspective. (a) Hourly mean backscatter and cloud base height 20 to 25 September 2017 at CM, Namibia, data from a CL31 ceilometer; (b) MODIS image at about 09:00 UTC 23 September 2017, featuring remaining coastal stratus clouds of the fog event in the night. Image taken from EOSDIS Worldview. MODIS satellite data ©NASA.
The synoptic situation during this specific fog event (Fig. 7b) shows characteristics that were identified as typical for fog events and that differ from the climatological September conditions that typically produce the higher-altitude low clouds at CM during this time of year (and the days before and after the event, Fig. 7a, c). The first characteristic is the higher pressure over the southern African continent (Great Escarpment and Kalahari) compared to the nights before and after. It is here caused by the formation of a ridging high-pressure circulation pattern over the subcontinent following the passage of a mid-latitude cyclone which impacted the continent at about 30° S. The second characteristic is a southeasterly 850 hPa wind that originates from the AH and passes over the continent before reaching CM, in contrast to the calm local conditions observed on the nights before and after. As a third characteristic, the coast-parallel southeasterly winds are weakly developed because of the position of the AH, which is also the case one day before the event.
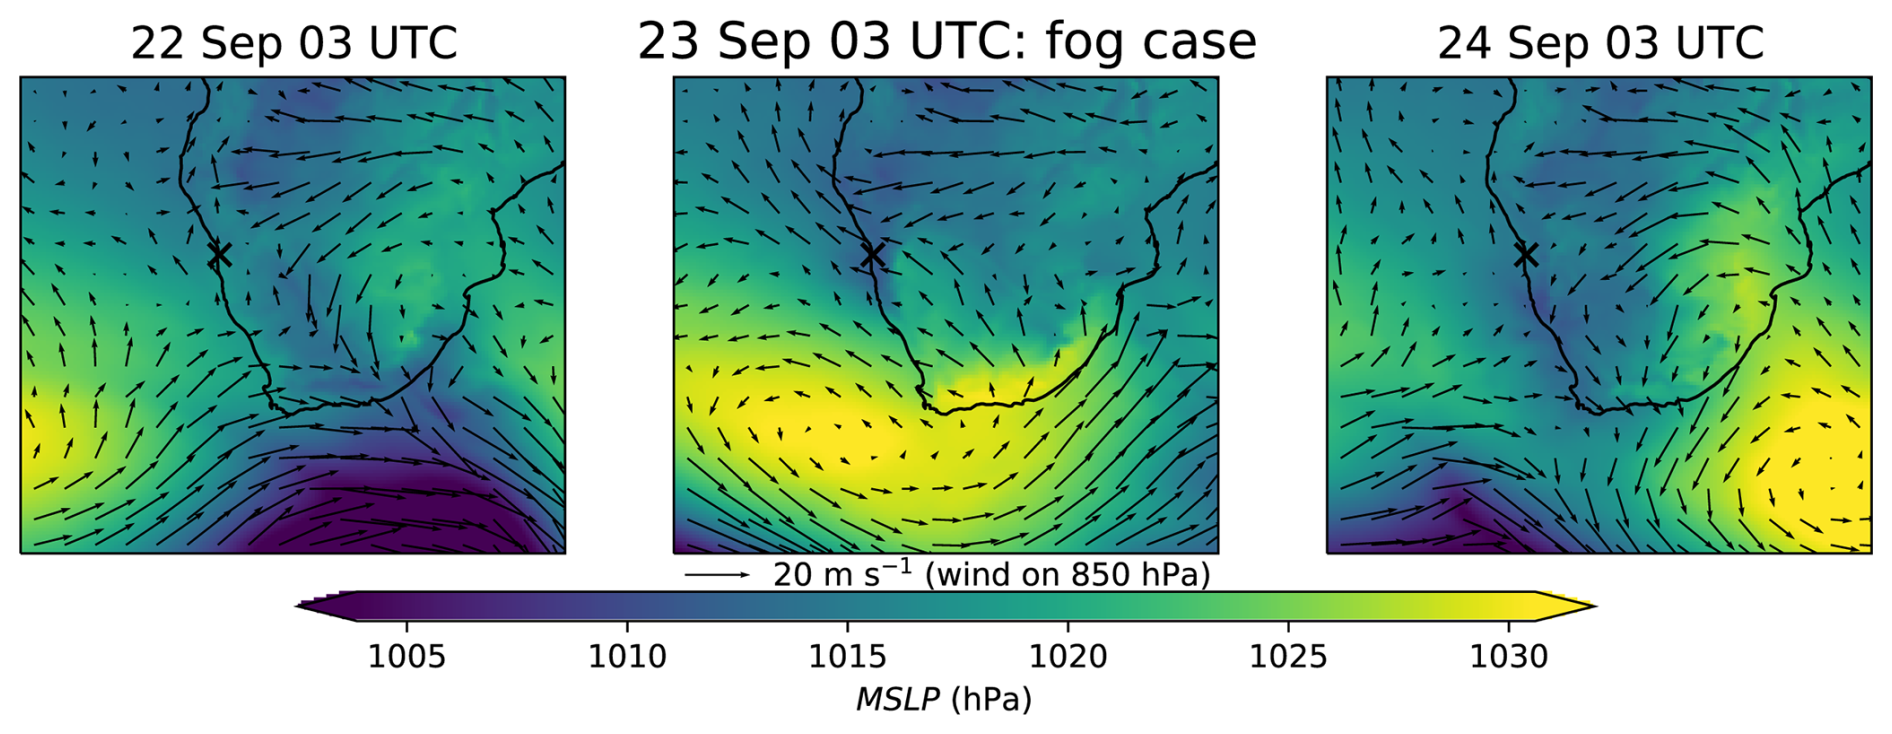
Figure 7Evolution of the synoptic situation one day before the fog night 22 to 23 September 2017 until one day after (mean sea level pressure (MSLP) and wind on 850 hPa). The fog was measured in Coastal Met, Namibia (x).
The vertical structure of the regional atmosphere is shown in a zonal cross-section along the station latitude 23° S (Fig. 8b, e, h). The air masses coming from the continental interior turn into a strong downward wind of up to about 2 Pa s−1 vertical and 20 m s−1 easterly wind speed, blowing over the Great Escarpment and down to the top of the coastal boundary layer. As outlined before, such strong winds co-occurring with ridging highs have been described as bergwinds (Lancaster et al., 1984; Tlhalerwa et al., 2005; Ndarana et al., 2018) and are often strong enough to disrupt the stable surface layer, typically leading to the dissipation of low stratus clouds. The wind may have caused the clear sky over most of the Namib and the ocean without dissipating the small coastal FLC strip. It may have also been deflected by the wind shear with the northerly coast-parallel surface wind that was measured at CM and that likely advected the stratus from the low-cloud deck over the ocean about 350 km north of CM (Fig. 6b).
The comparably shallow coastal boundary layer is capped by a strengthened inversion with temperatures up to 301.8 K (28.7 °C) (Fig. 7a–c), likely caused by adiabatic heating of the subsiding air masses. The wind seems to not penetrate the cool and moist boundary layer containing the stratus. Rather, the wind is deflected offshore at the top of the BL, at the same time likely pushing it down and towards the coast (Fig. 8b, e, h). The continental easterly wind thereby seems to limit the inland extension of the MBL and a further inland advection of the stratus. The actual advection of the stratus is not visible in these curtain plots because it happens with northerly winds (FLC extension from northerly FLC deck in Fig. 6b, nocturnal northerly wind (blue) during nights in CM in Fig. 9b). The inversion strengthening and subsidence are more extreme in this case than in the median composites of fog, underscoring the strong synoptic forcing.
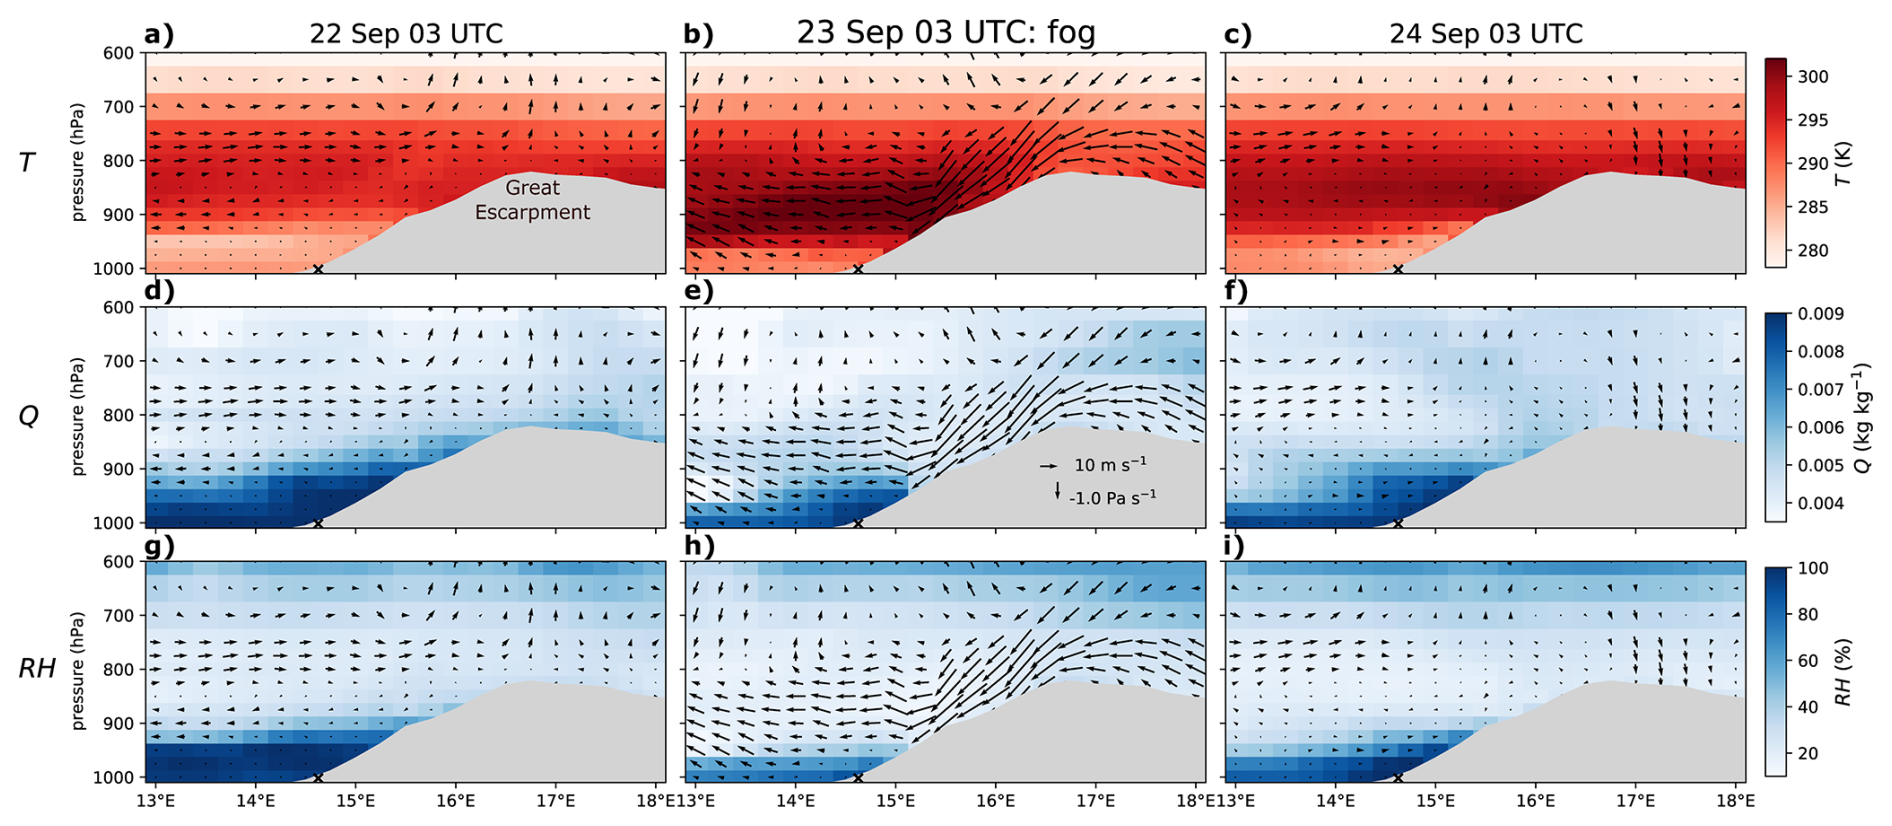
Figure 8Regional circulation during the fog event at CM, Namibia (x), at 03:00 UTC, compared to the night before and after in latitudinal curtain plots at 23° S.
The meteorological characteristics related to fog occurrence are extraordinarily pronounced during this specific event compared to mean September conditions (Fig. 9a), pointing to its exceptional nature. The anomalies are even more pronounced inland (GB) than at the coast (CM), highlighting that the mechanisms leading to fog near the coast are of regional to synoptic scale. Anomalously increased temperatures (1–2 σ) at the altitude of the inversion (T950) together with extraordinary inland easterly-downward wind (−4 σ) around 900 hPa (U900, W875) indicate the warm-air advection from the continent and adiabatic heating. Ground-based SODAR measurements confirm the easterly wind component. At GB (station elevation 405 m a.s.l.), the easterly extends down into the lowest SODAR level at ∼450 m a.s.l. and thus effectively reaches the surface. At CM (94 m a.s.l.), by contrast, the easterly is observed only at ∼500 m a.s.l. – several hundred metres above the surface – and only after 10:00 UTC due to the limited SODAR range (Fig. 9b). The anomaly in the regional pressure difference (−1 σ) developing over the night (Fig. A2) that approximates the thermotopographic winds (Pdiff) is less pronounced than in the occurring winds, indicating a strong synoptic forcing on the local winds in the free troposphere. This is further illustrated by the position of this case in the climatological Pdiff–U950 scatter (Fig. 5b) where the particularly pronounced easterly advection of this event departs clearly from the linear relationship of the two variables, as the deep synoptically forced subsiding easterly contributes momentum at the coast beyond what the local pressure gradient encodes.
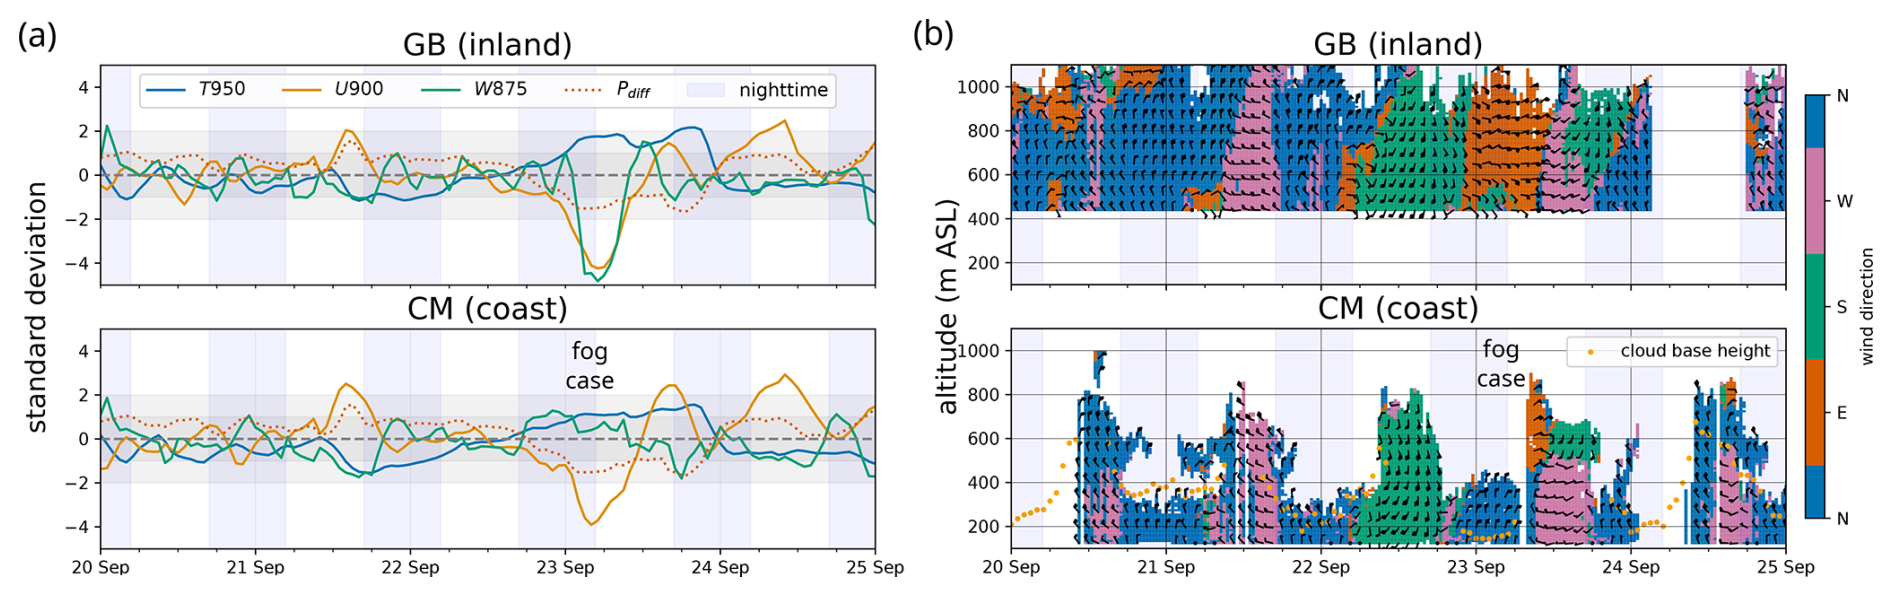
Figure 9Meteorological conditions in Coastal Met (CM) and Gobabeb (GB) during the week of the fog event, 23 September 2017 at CM. (a) Anomalies to the typical September day (hourly data 2014–2020) of temperature at 950 hPa (T950), the eastward wind component at 900 hPa (U900), upward wind component at 875 hPa (W975), and a regional mountain-plain pressure gradient (Pdiff, not site-specific) from ERA5 data. (b) In situ wind direction (colours) and vertical component (barbs) from SODAR.
The case study highlights that mechanisms at the regional and particularly at the synoptic scale control the local boundary layer and the characteristics of this fog situation. This exceptional fog event presents an alternative mechanism by which synoptics can modify MBL and stratus height: the warm, dry, adiabatically heated bergwind character of the descending air mass demonstrates an inversion-lowering-from-above mechanism, separate from the upstream effects that seem to dominate in the composite. We also conclude that fog at CM can be connected to two different high fog situations: (1) a very low cloud base touching the ground when it is advected to CM (typical for AMJ, but can also be synoptically forced out of season), or (2) stratus base lowering after the advection of the stratus has already taken place (as shown by the ceilometer in the fog nights before and after the case night).
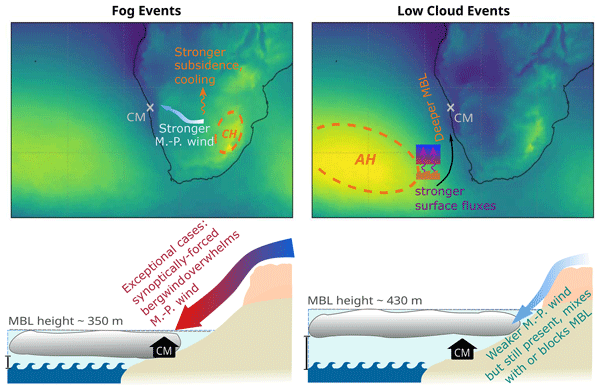
Taken together, the composite analysis (Sect. 4.1) and the case study presented above provide a consistent picture of the synoptic and regional-scale processes that modulate the stratus altitude in the central Namib which are schematically summarized in Fig. 10. Under typical low-cloud conditions, a strengthened Atlantic High drives enhanced coast-parallel southeasterly winds, increased latent and sensible heat fluxes upstream of the study region, and a correspondingly deeper marine boundary layer that supports an elevated stratus base. Under typical fog conditions these processes are less developed and the MBL is shallower, and elevated continental pressure favors the development of a nocturnal mountain-plain wind that descends the Great Escarpment, and can mix with, undercut or block the advection of marine air masses. The case study additionally shows that the regional katabatic flow can be completely overridden by a synoptically forced (here: ridging high-pressure system) easterly flow that is hot and dry and intensifies the inversion from above well beyond the composite mean and confines the stratus to a narrow coastal strip.
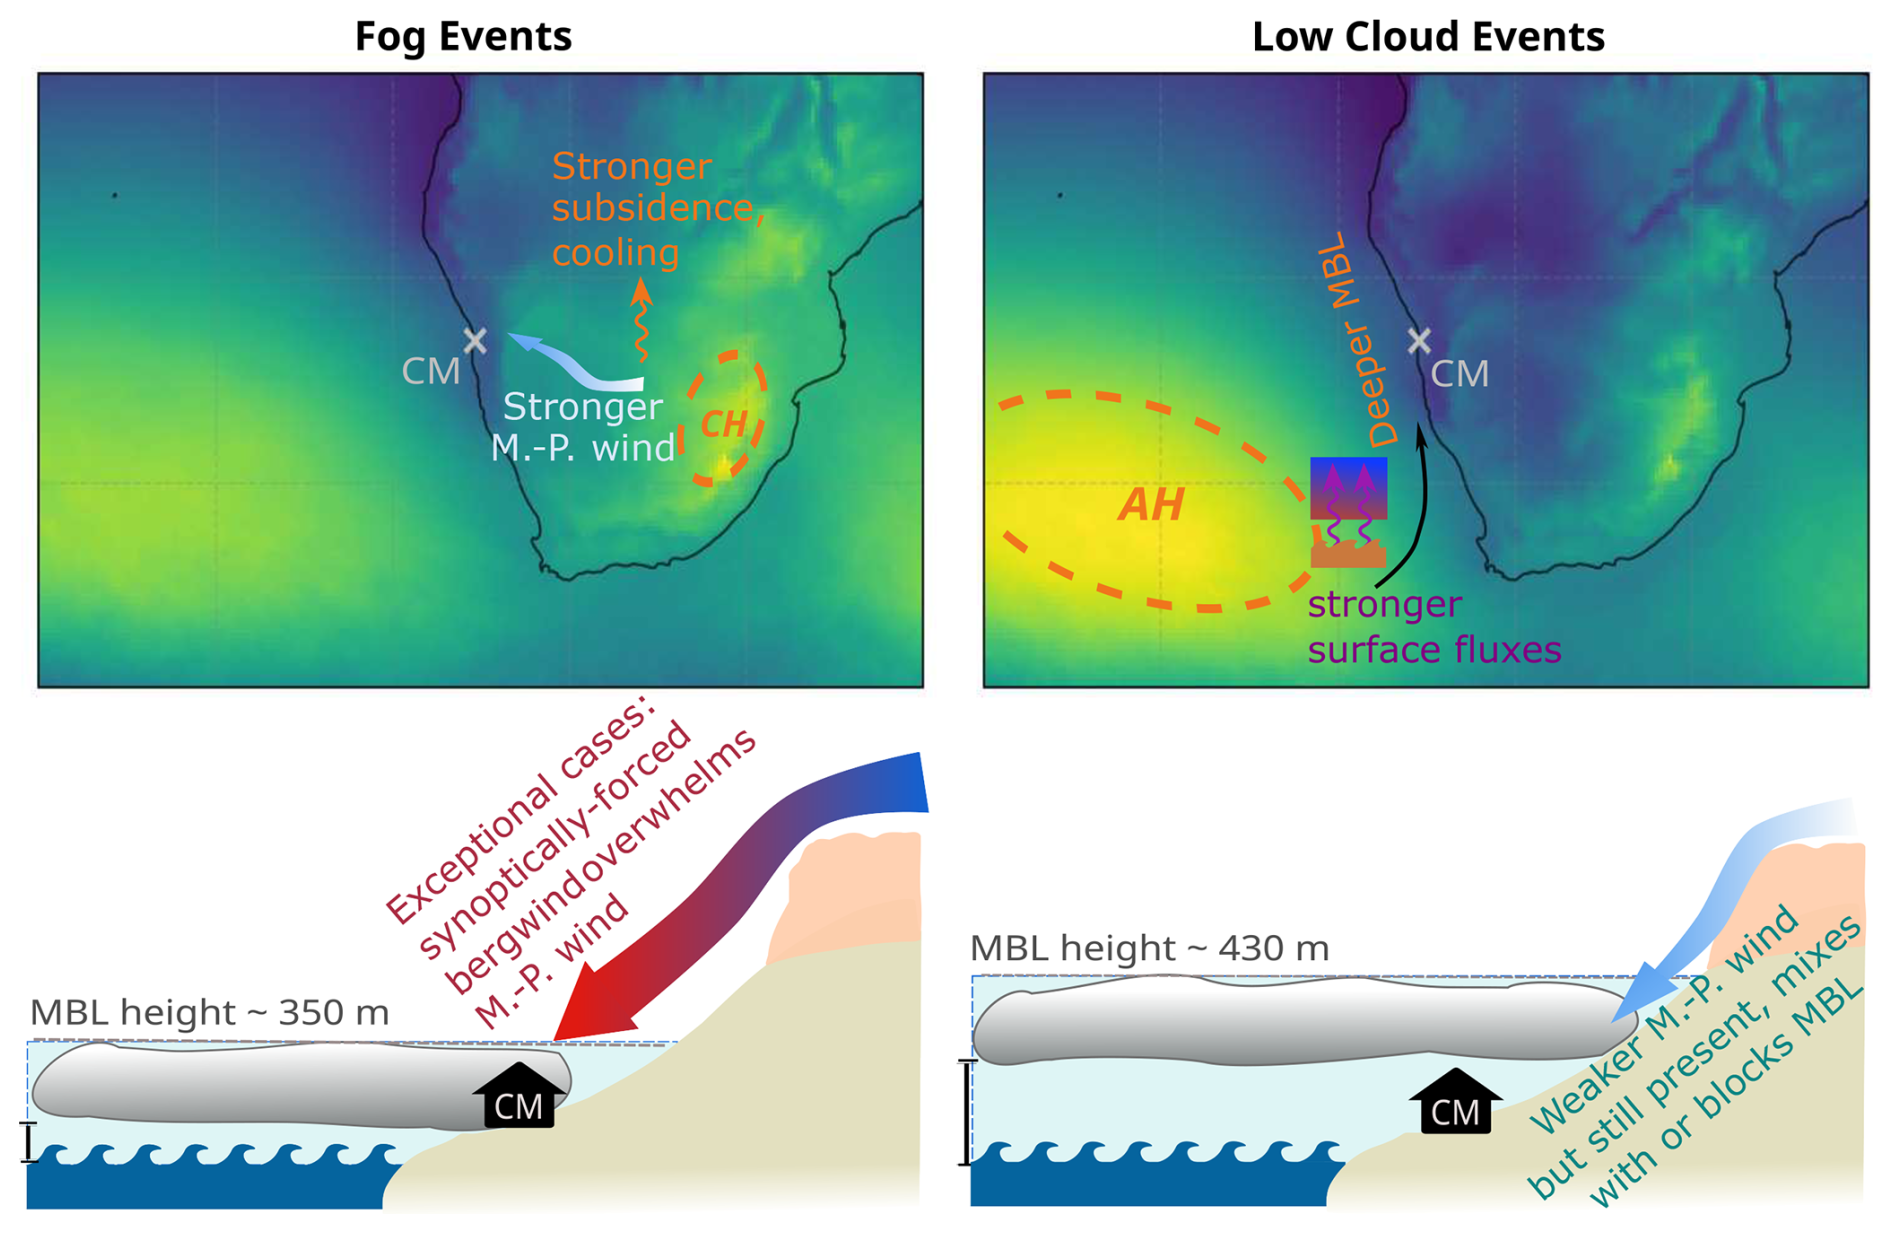
Figure 10Schematic description of synoptic-scale and regional patterns and processes associated with fog events vs. low cloud events in the Namib. The MBL height is an averaged value of a 1 ° wide strip along the coast from 17.5 to 31° S (about 100 km wide). M.-P. wind denotes the mountain-plain wind.
4.3 Classification of fog and low clouds
A logistic regression model was trained to classify FLC days into fog or low-cloud days with three features capturing the CH, AH, and the regional pressure gradient (described in Table 1). With only these three meteorological features, the model achieves a cross-validated 69.1 % accuracy and thus excels the mean baseline by 10.1 % (F1-score of 0.622 vs. 0.545 for the baseline, an increase of 0.077; Fig. 9 bottom panel).
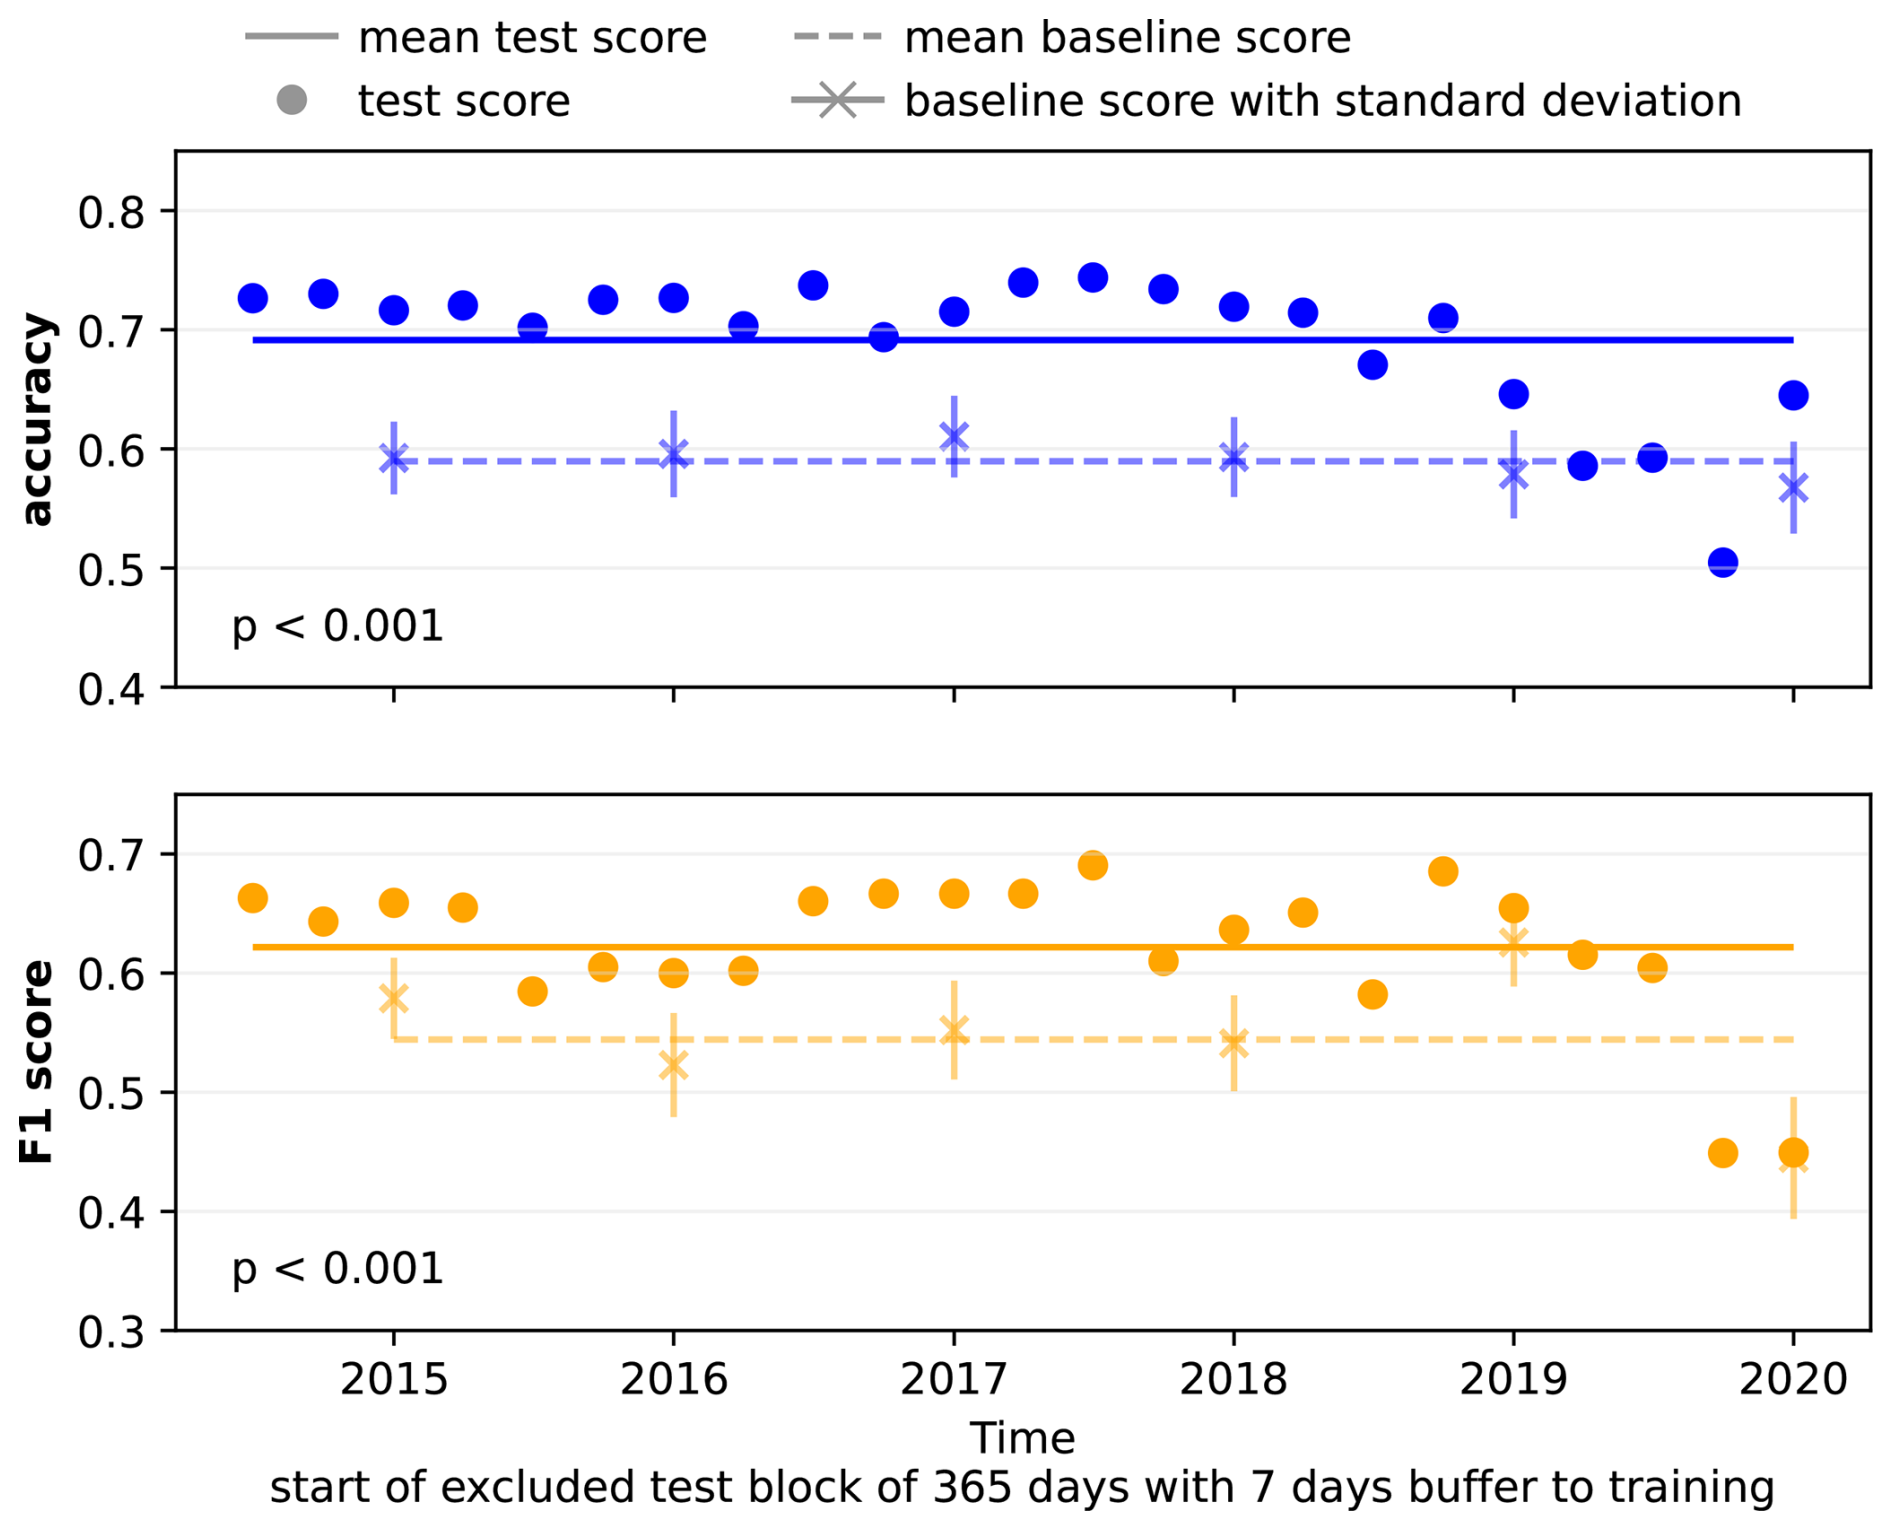
Figure 11Skill of the logistic regression (top: classification accuracy; bottom: F1-score) based on the three meteorological features (CH, AH, Pdiff; Table 1) compared to a climatological baseline, evaluated by sliding-window cross-validation. Each dot corresponds to one cross-validation iteration and its x-axis position marks the start date of the 365-day test window that was withheld from training, with successive windows offset by 3 months (23 iterations in total). Each ”x” marker shows the annual baseline performance, with the error bars indicating ±1 standard deviation of the baseline distribution, estimated from 1000 random draws per test fold. The solid line indicates the mean across iterations for the model and the dashed line the mean of the baseline.
The mean baseline accuracies for the test years 2015–2020 are 0.594, 0.594, 0.613, 0.594, 0.578, and 0.567, respectively, illustrating that guessing fog/low cloud from seasonality is better than a random pick (accuracy = 0.5 to distinguish the event types for a given FLC event). The applied split method in the cross-validation allows for comparing the performance on different test sets of 365 d (Fig. 11). The reduced classification skill during the 2019 and 2020 test windows (Fig. 11) coincides with the Benguela Niño of October 2019–January 2020, which produced coastal SST anomalies exceeding 2 °C and was accompanied by anomalous near-surface winds and surface heat fluxes (Imbol Koungue et al., 2021). Under these anomalous oceanic conditions, the climatological coupling between the synoptic pressure pattern and the marine boundary layer state is weakened. Warmer SSTs enhance latent and sensible heat fluxes into the MBL and deepen it, so that synoptic conditions that would normally produce fog at CM may instead produce elevated low clouds. Because the model uses only pressure-based features (CH, AH, Pdiff) and does not carry direct information on SST or surface heat fluxes, this oceanically driven shift in the MBL response is not represented in the feature space. The simultaneous drop in baseline skill during the same period confirms that even the climatological seasonality is shifted, so that the lower model skill in 2019/2020 reflects a genuine departure from the climatological expectation rather than a methodological shortcoming. This is consistent with the findings of Mass et al. (2026) that Benguela Niños are a relevant driver of fog and low-cloud variability in the central Namib, and suggests that including SST patterns or MBL information could improve model robustness to anomalous oceanic states in future work.
As the model based on meteorological features outperforms the baseline, the features carry information related to the target variable fog or low cloud, consistent with their visible separation between fog and low-cloud events shown in Fig. 5. The results also highlight the potential to use reanalysis information to separate fog from low clouds in satellite-based FLC products, in particular, when local temperature and humidity profiles are additionally used.
This study is a first characterisation of meteorological conditions associated with the altitude of advected marine stratus (high fog) in the central Namib that, in turn, determines the locations receiving fog. Two hypotheses guided this work: that fog (high fog touching the ground) and low-cloud occurrence at CM are connected to variability of the continental and Atlantic high pressure systems and regional thermotopographic winds (H1) and that information on these meteorological characteristics can be used to classify fog/low clouds (H2). A composite analysis and a case study are conducted to test H1, where the composite analysis additionally tests for consistency over the seasons. The main findings of this study are:
-
The boundary layer is systematically shallower in fog situations than in low-cloud situations along the entire southwestern African coast, particularly in marine regions close to Walvis Bay. In fog situations, the capping inversion is therefore lower, and the capping air is warmer. The differences in the depth of the marine boundary layer and stratus altitude are related to the variability of the two high-pressure systems in the regions.
-
Over the ocean, the South Atlantic Anticyclone is stronger in low-cloud situations than in fog situations, leading to stronger MBL winds and increased cold advection at ≈ 30° S and into the stratus formation region. This probably causes the observed increases in latent and sensible heat fluxes into the MBL in that region, which would deepen the developing MBL by increasing its buoyancy and vertical mixing.
-
Over the continent, fog situations at CM are associated with higher pressures over the Great Escarpment and the Kalahari than low-cloud situations. Locally over the elevated terrain, these conditions enhance the shallow surface katabatic drainage, by stronger nocturnal radiative cooling under the clearer skies of the high-pressure regime. The resulting stronger mountain-plain wind has been described to mix with or block the cloudy marine boundary layer rather than to cap it from above (Seely and Henschel, 1998), and is not expected to contribute to the regional inversion-lowering.
-
In a case study, an out-of-season fog event that occurred during September 2017 is analyzed in detail. The case is strongly influenced by a ridging high-pressure system that highlights a second synoptic-scale mechanism that influences marine boundary layer height and stratus altitude: the large inland-coast pressure gradient produces strong subsiding easterly continental air masses (i.e., bergwind conditions) that seem to push down and strengthen the inversion, leading to a particularly low-lying stratus and spatially limited fog event on this day. Such bergwind conditions could be partly contained in the fog composite and could contribute to the warmer capping air and slightly stronger easterly advection observed on fog days.
-
A logistic regression was used to classify fog and low clouds based on three meteorological features describing the South Atlantic and continental high-pressure systems and the regional mountain-plain circulation. The logistic regression has a 69 % accuracy and 62 % F1-score, outperforming the climatological baseline by 10 % and 7 %, respectively. This underlines that the two large-scale high-pressure systems, as well as the regional pressure gradient, are relevant controls of the capping inversion and stratus altitude.
The findings of this study highlight the connection between synoptic-scale variability, regional thermotopographic circulations and fog and low clouds. Synoptic-scale variability seems to largely control the seasonal patterns and day-to-day variability of the altitude of the capping inversion, the stratus altitude, and subsequent spatial fog occurrence patterns, while the cool, nocturnal mountain-plain wind is more likely to mix with, undercut or block advected marine air masses. Future studies should investigate these relationships for specific synoptic circulation types.
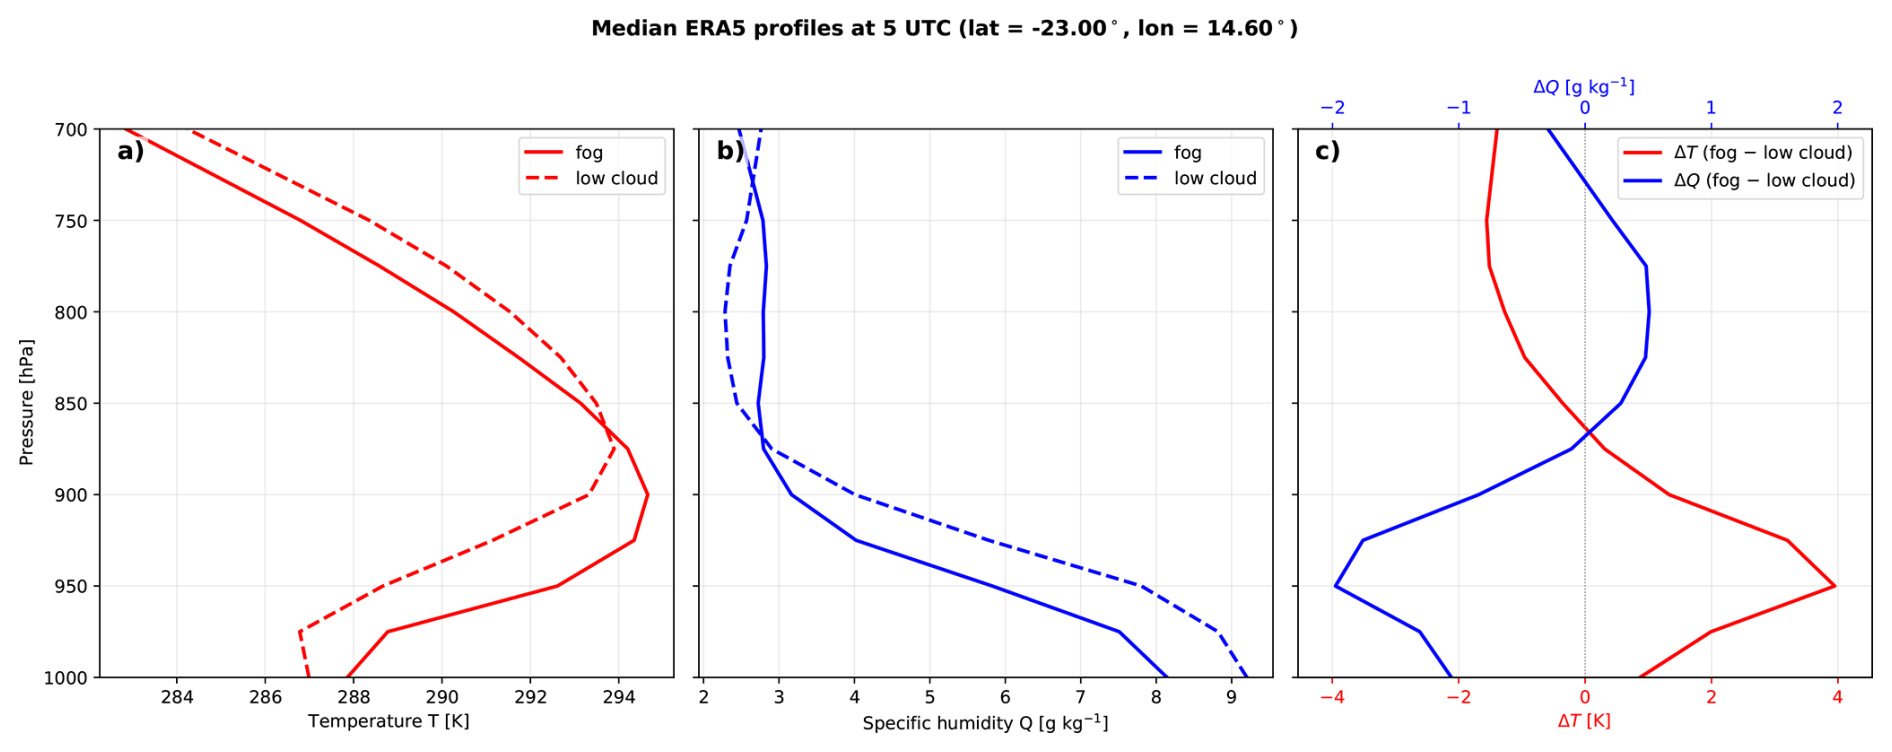
Figure A1Median temperature (a) and moisture (b) profiles for fog cases (solid lines) and low cloud cases (dashed lines) and their differences (c) at CM.
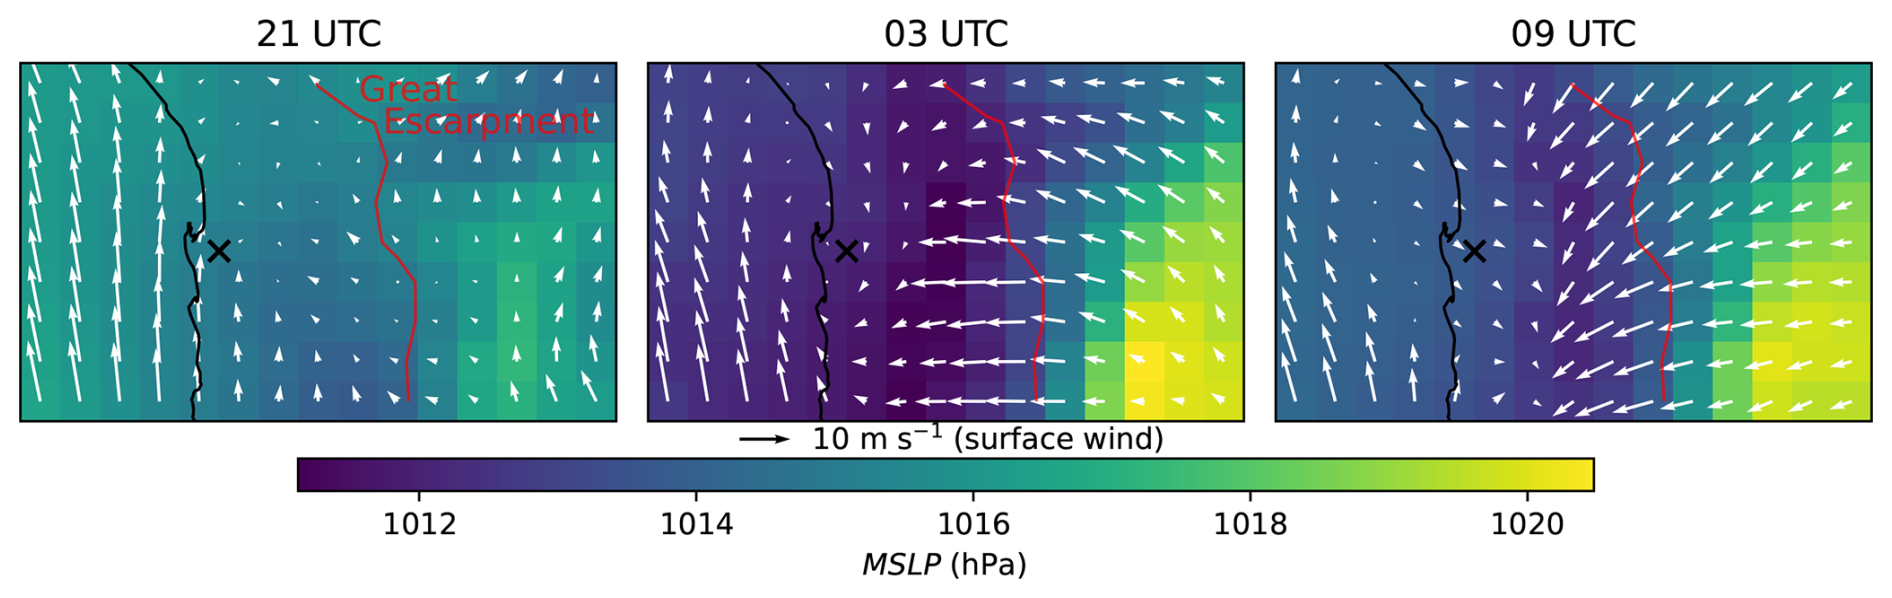
Figure A2Mean sea level pressure (MSLP) during the fog night 22 to 23 September 2017. Quivers denote the surface wind at 10 m. The red line provides an approximate indication of the Great Escarpment (1000 m elevation contour).
ERA5 data were taken from Copernicus Climate Data Store. The satellite FLC product and code for data processing and analysis are available from the corresponding author upon reasonable request.
HA had the initial idea for the study and provided the FLC product. RV and RS provided the in situ station data. VH acquired the ERA5 datasets and designed, developed the code for, and performed the statistical analysis and classification in exchange with HA and JC. RS provided visualisations of in situ data. BA contributed to heat flux interpretation. SP contributed to the meteorological interpretation. VH wrote the manuscript with contributions by all authors. All co-authors contributed to the overall interpretation of the results and manuscript editing.
The contact author has declared that none of the authors has any competing interests.
This work draws on a long-term research infrastructure at the Gobabeb Namib Research Institute, Namibia, which is a platform for interdisciplinary research on the Namib. Station access and on-site maintenance support was provided by Gobabeb staff. Regional dynamical expertise was contributed by a co-author from North-West University (South Africa). We aim to continue active collaborations with local partners in future work at this site.
Publisher's note: Copernicus Publications remains neutral with regard to jurisdictional claims made in the text, published maps, institutional affiliations, or any other geographical representation in this paper. The authors bear the ultimate responsibility for providing appropriate place names. Views expressed in the text are those of the authors and do not necessarily reflect the views of the publisher.
This article is part of the special issue “Aerosol, fog, climate, and biogeochemistry in southern Africa (ACP/AMT/AR/ESSD inter-journal SI)”. It is not associated with a conference.
We thank the Gobabeb Namib Research Institute for access to the station measurements and gratefully acknowledge the Gobabeb maintenance team for their efforts in the field. We thank three anonymous reviewers for their valuable comments.
This research has been supported by the Deutsche Forschungsgemeinschaft ft (DFG, grant no. CE 163/14-1, project no. 505800970) and the Agence Nationale de la Recherche (ANR, grant no. ANR-22-CE92-0051) of the project “Aerosols and fog in southern Africa: processes and impact on biogeochemistry (AeroFog)”. The contribution of BA was supported by NOAA cooperative agreement (grant no. NA22OAR4320151), for the Cooperative Institute for Earth System Research and Data Science (CIESRDS). The statements, findings, conclusions, and recommendations are those of the authors and do not necessarily reflect the views of NOAA or the U.S. Department of Commerce.
The article processing charges for this open-access publication were covered by the Karlsruhe Institute of Technology (KIT).
This paper was edited by Minghui Diao and reviewed by three anonymous referees.
Andersen, H. and Cermak, J.: First fully diurnal fog and low cloud satellite detection reveals life cycle in the Namib, Atmos. Meas. Tech., 11, 5461–5470, https://doi.org/10.5194/amt-11-5461-2018, 2018. a, b, c, d
Andersen, H., Cermak, J., Solodovnik, I., Lelli, L., and Vogt, R.: Spatiotemporal dynamics of fog and low clouds in the Namib unveiled with ground- and space-based observations, Atmos. Chem. Phys., 19, 4383–4392, https://doi.org/10.5194/acp-19-4383-2019, 2019. a, b, c, d, e, f, g
Andersen, H., Cermak, J., Fuchs, J., Knippertz, P., Gaetani, M., Quinting, J., Sippel, S., and Vogt, R.: Synoptic-scale controls of fog and low-cloud variability in the Namib Desert, Atmos. Chem. Phys., 20, 3415–3438, https://doi.org/10.5194/acp-20-3415-2020, 2020. a, b, c, d, e, f
Bentamy, A., Piollé, J. F., Grouazel, A., Danielson, R., Gulev, S., Paul, F., Azelmat, H., Mathieu, P. P., von Schuckmann, K., Sathyendranath, S., Evers-King, H., Esau, I., Johannessen, J. A., Clayson, C. A., Pinker, R. T., Grodsky, S. A., Bourassa, M., Smith, S. R., Haines, K., Valdivieso, M., Merchant, C. J., Chapron, B., Anderson, A., Hollmann, R., and Josey, S. A.: Review and assessment of latent and sensible heat flux accuracy over the global oceans, Remote Sens. Environ., 201, 196–218, https://doi.org/10.1016/j.rse.2017.08.016, 2017. a
Burke, A.: Plant endemism in the central Namib Desert, Evol. Ecol. Res., 9, 283–297, 2007. a
CampbellScientific: CS215 temp and rh probe: user manual, Campbell Scientific, available at: https://s.campbellsci.com/documents/ca/manuals/cs215_man.pdf (last access: 20 July 2026), 2013. a
Cermak, J.: Low clouds and fog along the South-Western African coast – Satellite-based retrieval and spatial patterns, Atmos. Rese., 116, 15–21, 2012. a
Cermak, J.: Fog and low cloud frequency and properties from active-sensor satellite data, Remote Sens., 10, 1209, https://doi.org/10.3390/rs10081209, 2018. a
Cermak, J. and Bendix, J.: Detecting ground fog from space – a microphysics-based approach, Int. J. Remote Sens., 32, 3345–3371, 2011. a
Cox, D. R.: The regression analysis of binary sequences, J. Roy. Stat. Soc. B, 20, 215–232, 1958. a
De Szoeke, S. P., Verlinden, K. L., Yuter, S. E., and Mechem, D. B.: The time scales of variability of marine low clouds, J. Climate, 29, 6463–6481, 2016. a
Egli, S., Thies, B., and Bendix, J.: A hybrid approach for fog retrieval based on a combination of satellite and ground truth data, Remote Sens., 10, 628, https://doi.org/10.3390/rs10040628, 2018. a
Engeln, A. v. and Teixeira, J.: A Planetary Boundary Layer Height Climatology Derived from ECMWF Reanalysis Data, J. Climate, 26, 6575–6590, https://doi.org/10.1175/JCLI-D-12-00385.1, 2013. a
Espinoza, V., Lobos-Roco, F., and del Río, C.: Synoptic control of the spatiotemporal variability of fog and low clouds under ENSO phenomena along the Chilean coast (17°–36° S), Atmos. Res., 308, 107533, https://doi.org/10.1016/j.atmosres.2024.107533, 2024. a
Fuchs, J., Cermak, J., Andersen, H., Hollmann, R., and Schwarz, K.: On the influence of air mass Origin on low-cloud properties in the Southeast Atlantic, J. Geophys. Res.-Atmos., 122, 11–076, 2017. a
Fuchs, J., Cermak, J., and Andersen, H.: Building a cloud in the southeast Atlantic: understanding low-cloud controls based on satellite observations with machine learning, Atmos. Chem. Phys., 18, 16537–16552, https://doi.org/10.5194/acp-18-16537-2018, 2018. a
Gottlieb, T. R., Eckardt, F. D., Venter, Z. S., and Cramer, M. D.: The contribution of fog to water and nutrient supply to Arthraerua leubnitziae in the central Namib Desert, Namibia, J. Arid Environ., 161, 35–46, https://doi.org/10.1016/j.jaridenv.2018.11.002, 2019. a
Hacker, M.: Modelling Fog and Low Stratiform Clouds in the Namib Desert with COSMO-FOG, Ph.D. thesis, Universitäts-und Landesbibliothek Bonn, https://doi.org/10.48565/bonndoc-430, 2024. a, b, c, d, e
Haensler, A., Cermak, J., Hagemann, S., and Jacob, D.: Will the southern African west coast fog be affected by future climate change? Results of an initial fog projection using a regional climate model, Erdkunde, 65, 261–275, https://doi.org/10.3112/erdkunde.2011.03.04, 2011. a
Henschel, J. R. and Seely, M. K.: Ecophysiology of atmospheric moisture in the Namib Desert, Atmos. Res., 87, 362–368, https://doi.org/10.1016/j.atmosres.2007.11.015, 2008. a
Hersbach, H., Bell, B., Berrisford, P., Hirahara, S., Horányi, A., Muñoz-Sabater, J., Nicolas, J., Peubey, C., Radu, R., Schepers, D., Simmons, A., Soci, C., Abdalla, S., Abellan, X., Balsamo, G., Bechtold, P., Biavati, G., Bidlot, J., Bonavita, M., De Chiara, G., Dahlgren, P., Dee, D., Diamantakis, M., Dragani, R., Flemming, J., Forbes, R., Fuentes, M., Geer, A., Haimberger, L., Healy, S., Hogan, R. J., Hólm, E., Janisková, M., Keeley, S., Laloyaux, P., Lopez, P., Lupu, C., Radnoti, G., de Rosnay, P., Rozum, I., Vamborg, F., Villaume, S., and Thépaut, J.-N.: The ERA5 global reanalysis, Q. J. Roy. Meteorol. Soc., 146, 1999–2049, https://doi.org/10.1002/9781118548387.ch5, 2020. a
Hosmer Jr, D. W., Lemeshow, S., and Sturdivant, R. X.: Applied logistic regression, Vol. 398, John Wiley & Sons, https://doi.org/10.1002/9781118548387.ch1, 2013. a
Imbol Koungue, R. A., Brandt, P., Lübbecke, J., Prigent, A., Martins, M. S., and Rodrigues, R. R.: The 2019 Benguela Niño, Front. Mar. Sci., 8, 800103, https://doi.org/10.3389/fmars.2021.800103, 2021. a
Jury, M. and Walker, N.: Marine boundary layer modification across the edge of the Agulhas Current, J. Geophys. Res.-Oceans, 93, 647–654, 1988. a
Juvik, J. O. and Nullet, D.: Comments on ”A proposed standard fog collector for use in high-elevation regions”, J. Appl. Meteorol. (1988–2005), 34, 2108–2110, 1995. a
Lancaster, J., Lancaster, N., and Seely, M.: Climate of the central Namib Desert, Madoqua, 1984, 5–61, 1984. a, b, c, d, e, f, g
Lindesay, J. A. and Tyson, P. D.: Thermo-topographically induced boundary layer oscillations over the central Namib, southern Africa, Int. J. Climatol., 10, 63–77, https://doi.org/10.1002/joc.3370100108, 1990. a, b, c, d, e
Loots, S., Ritz, C. M., Schwager, M., Sehic, J., Herklotz, V., Garkava-Gustavsson, L., and Nybom, H. E.: Distribution, habitat profile and genetic variability of Namibian succulent Lithops ruschiorum, Bothalia-African Biodiversity & Conservation, 49, 1–18, 2019. a
Luo, B. and Minnett, P. J.: Evaluation of the ERA5 sea surface skin temperature with remotely-sensed shipborne marine-atmospheric emitted radiance interferometer data, Remote Sens., 12, https://doi.org/10.3390/rs12111873, 2020. a
Malik, D., Andersen, H., Cermak, J., Vogt, R., and Adler, B.: Cloud base height determines fog occurrence patterns in the Namib Desert, Atmos. Chem. Phys., 26, 681–701, https://doi.org/10.5194/acp-26-681-2026, 2026. a, b
Martens, B., Schumacher, D. L., Wouters, H., Muñoz-Sabater, J., Verhoest, N. E. C., and Miralles, D. G.: Evaluating the land-surface energy partitioning in ERA5, Geosci. Model Dev., 13, 4159–4181, https://doi.org/10.5194/gmd-13-4159-2020, 2020. a
Mass, A., Andersen, H., Cermak, J., Formenti, P., Pauli, E., and Quinting, J.: A satellite-based analysis of semi-direct effects of biomass burning aerosols on fog and low-cloud dissipation in the Namib Desert, Atmos. Chem. Phys., 25, 491–510, https://doi.org/10.5194/acp-25-491-2025, 2025. a, b
Mass, A., Andersen, H., and Cermak, J.: Coastal upwelling and tropical warm water intrusions are key drivers of interannual fog variability along the southwestern African coast, EGUsphere [preprint], https://doi.org/10.5194/egusphere-2026-1208, 2026. a, b, c
Maúre, G., Pinto, I., Ndebele-Murisa, M., Muthige, M., Lennard, C., Nikulin, G., Dosio, A., and Meque, A.: The southern African climate under 1.5 C and 2 C of global warming as simulated by CORDEX regional climate models, Environ. Res. Lett., 13, 065002, https://doi.org/10.1088/1748-9326/aab190, 2018. a
Mupambwa, H. A., Hausiku, M. K., Nciizah, A. D., and Dube, E.: The unique Namib desert-coastal region and its opportunities for climate smart agriculture: A review, Cogent Food & Agriculture, 5, 1645258, https://doi.org/10.1080/23311932.2019.1645258, 2019. a
Ndarana, T., Bopape, M.-J., Waugh, D., and Dyson, L.: The influence of the lower stratosphere on ridging Atlantic Ocean anticyclones over South Africa, J. Climate, 31, 6175–6187, 2018. a, b
Nicholson, S. E.: A low-level jet along the Benguela coast, an integral part of the Benguela current ecosystem, Clim. Change, 99, 613–624, 2010. a
Olivier, J.: Spatial distribution of fog in the Namib, J. Arid Environ., 29, 129–138, 1995. a
Pedregosa, F., Varoquaux, G., Gramfort, A., Michel, V., Thirion, B., Grisel, O., Blondel, M., Prettenhofer, P., Weiss, R., Dubourg, V., Vanderplas, J., Passos, A., Cournapeau, D., Brucher, M., Perrot, M., and Duchesnay, E.: Scikit-learn: Machine Learning in Python, J. Mach. Learn. Res., 12, 2825–2830, 2011. a
Pokhrel, S., Dutta, U., Rahaman, H., Chaudhari, H., Hazra, A., Saha, S. K., and Veeranjaneyulu, C.: Evaluation of Different Heat Flux Products Over the Tropical Indian Ocean, Earth Space Sci., 7, 1–22, https://doi.org/10.1029/2019EA000988, 2020. a
Preston-Whyte, R. and Tyson, P.: The atmosphere and weather of southern Africa, Oxford University Press, https://archive.org/details/atmosphereweathe0000pres (last access: 18 September 2026), 1988. a
Qiao, N. and Wang, L.: Satellite observed vegetation dynamics and drivers in the Namib sand sea over the recent 20 years, Ecohydrology, 15, e2420, https://doi.org/10.1002/eco.2420, 2022. a
Ramond, J.-B., Baxter, J., Maggs-Kölling, G., Martínez-Alvarez, L., Read, D., León-Sobrino, C., van der Walt, A., and Cowan, D.: Microbial ecology of the Namib Desert, in: Model Ecosystems in Extreme Environments, pp. 113–143, Elsevier, https://doi.org/10.1016/B978-0-12-812742-1.00006-4, 2019. a
Seely, M.: Irregular fog as a water source for desert dune beetles, Oecologia, 42, 213–227, 1979. a
Seely, M. and Henschel, J. R.: The climatology of Namib fog, in: Proceedings of the First International Conference on Fog and Fog Collection, pp. 19–24, Vancouver, https://www.fogquest.org/wp-content/uploads/2015/08/Conf_1998_Seely_Climat.pdf (last access: 18 September 2026), 1998. a, b, c, d, e, f, g, h, i, j, k, l, m, n
Shanyengana, E., Henschel, J., Seely, M., and Sanderson, R.: Exploring fog as a supplementary water source in Namibia, Atmos. Res., 64, 251–259, 2002. a
Spirig, R.: Fog in the Namib – occurrence dynamics properties, Ph.D. thesis, University_of_Basel, https://edoc.unibas.ch/entities/publication/fd0acac9-7fdd-4faa-a272-16449b373539 (last access: 18 September 2026), 2022. a, b, c
Spirig, R., Vogt, R., Larsen, J. A., Feigenwinter, C., Wicki, A., Franceschi, J., Parlow, E., Adler, B., Kalthoff, N., Cermak, J., Andersen, H., Fuchs, J., Bott, A., Hacker, M., Wagner, N., Maggs-Kölling, G., Wassenaar, T., and Seely, M.: Probing the fog life cycles in the Namib Desert, B. Am. Meteorol. Soc., 100, 2491–2507, 2019. a, b, c, d, e, f, g
Sun, X., Cook, K. H., and Vizy, E. K.: The South Atlantic Subtropical High: Climatology and Interannual Variability, J. Climate, 30, 3279–3296, https://doi.org/10.1175/JCLI-D-16-0705.1, 2017. a
Tibshirani, R.: Regression shrinkage and selection via the lasso, J. Roy. Stat. Soc. B, 58, 267–288, 1996. a
Tlhalerwa, K., Freiman, M., and Piketh, S.: Aerosol deposition off the Southern African West Coast by berg winds, S. Afr. Geogr. J., 87, 152–161, 2005. a
Tyson, P. and Seely, M.: Local winds over the central Namib, S. Afr. Geogr. J., 62, 135–150, 1980. a
Tyson, P., Garstang, M., Swap, R., Kallberg, P., and Edwards, M.: An air transport climatology for subtropical southern Africa, Int. J. Climatol., 16, 265–291, 1996. a
Veloso, J. V., Böhm, C., Schween, J. H., Löhnert, U., and Crewell, S.: A comparative study of the atmospheric water vapor in the Atacama and Namib Desert, Global Planet. Change, 232, 104320, https://doi.org/10.1016/j.gloplacha.2023.104320, 2024. a, b, c, d, e, f
Warren-Rhodes, K. A., McKay, C. P., Boyle, L. N., Wing, M. R., Kiekebusch, E. M., Cowan, D. A., Stomeo, F., Pointing, S. B., Kaseke, K. F., Eckardt, F., Henschel, J. R., Anisfeld, A., Seely, M., and Rhodes, K. L.: Physical ecology of hypolithic communities in the central Namib Desert: the role of fog, rain, rock habitat, and light, J. Geophys. Res.-Biogeosci., 118, 1451–1460, 2013. a, b
Weathers, K. C., Ponette-González, A. G., and Dawson, T. E.: Medium, vector, and connector: Fog and the maintenance of ecosystems, Ecosystems, 23, 217–229, 2020. a
Weischet, W. and Endlicher, W.: Regionale Klimatologie: Teil 2: Die Alte Welt, Europa, Afrika, Asien, Springer, https://www.schweizerbart.de/publications/detail/isbn/9783443071196/Weischet_Regionale_Klimatologie_2_Die_A (last access: 18 September 2026), 2000. a
Yakubu, A. T., Klopper, D., Havenga, H., Burger, R., Formenti, P., and Piketh, S. J.: Atmospheric stratification over the Southeast Atlantic Ocean adjacent to the Namibian coast, EGUsphere [preprint], https://doi.org/10.5194/egusphere-2025-1827, 2025. a, b
Zheng, Y., Zhang, H., and Li, Z.: Role of surface latent heat flux in shallow cloud transitions: A mechanism-denial LES study, J. Atmos. Sci., 78, 2709–2723, 2021. a
Zuidema, P., Painemal, D., De Szoeke, S., and Fairall, C.: Stratocumulus cloud-top height estimates and their climatic implications, J. Climate, 22, 4652–4666, 2009. a, b, c
- Abstract
- Introduction
- Data
- Methods
- Results and discussion
- Conclusions
- Appendix A: Temperature and moisture profiles and regional case study wind fields
- Code and data availability
- Author contributions
- Competing interests
- Statement on inclusion in global research
- Disclaimer
- Special issue statement
- Acknowledgements
- Financial support
- Review statement
- References
- Abstract
- Introduction
- Data
- Methods
- Results and discussion
- Conclusions
- Appendix A: Temperature and moisture profiles and regional case study wind fields
- Code and data availability
- Author contributions
- Competing interests
- Statement on inclusion in global research
- Disclaimer
- Special issue statement
- Acknowledgements
- Financial support
- Review statement
- References