
the Creative Commons Attribution 4.0 License.
the Creative Commons Attribution 4.0 License.
 | 02 Oct 2026
Assessing ozone dynamics during the 2023 summer STAQS field campaign using synergistic observations and model simulations
Claudia M. Bernier

Matthew S. Johnson
John Sullivan
Guillaume Gronoff
Daniel Phoenix
Fred Moshary
Raul Alvarez
Brandi McCarty
Andrew Langford
Christoph Senff
Sunil Baidar
Laura Judd
NASA's Tropospheric Emissions: Monitoring of Pollution (TEMPO) geostationary satellite sensor provides high temporal and spatial resolution measurements critical for monitoring air quality. During the Synergistic TEMPO Air Quality Science (STAQS) component of the 2023 AGES+ campaign, extensive surface, airborne, and remote-sensing observations were collected over the New York City/Long Island Sound region, enabling comprehensive investigation of ozone and its precursors, including nitrogen dioxide (NO2) and formaldehyde (HCHO). Evaluating TEMPO (version 3) NO2 and HCHO column retrievals against Pandora and GEO-CAPE Airborne Simulator (GCAS) observations, based on the limited number of coincident flight days available, shows TEMPO can capture urban-suburban pollution gradients and exhibits biases comparable to previous satellite validation studies with strong NO2 column correlations (R≈0.79–0.81), though sharp transitions between high and low emission regions remain challenging. The high-resolution (1.33 km × 1.33 km) WRF-Chem simulation reproduces the major spatiotemporal patterns of surface ozone and NO2 (R≈0.56–0.73), supporting its use to fill observational gaps. Integrating TEMPO, WRF-Chem, in situ measurements, and ozone and wind lidar observations, we characterize the spatiotemporal ozone dynamics under different pollution regimes. High-pollution days involve early urban precursor accumulation and sea-breeze-driven coastal recirculation of pollutant-rich air. Moderate days exhibit localized enhancements driven by transport, such as downwind plume transport, while low-pollution days show efficient dispersion and limited ozone formation. This multi-platform framework highlights the importance of resolving fine-scale variability in coastal and transition zones and illustrates TEMPO's potential for improving ozone forecasting and mitigation in complex environments.
- Article
(15068 KB) - Full-text XML
-
Supplement
(10051 KB) - BibTeX
- EndNote


Poor air quality associated with elevated ozone (O3) concentrations arises from transport and buildup of trace gas species such as nitrogen oxides (NOx = nitric oxide and nitrogen dioxide: NO + NO2), carbon monoxide (CO), and volatile organic compounds such as formaldehyde (HCHO), which photochemically oxidize to form tropospheric O3. These pollutants can negatively impact human health and Earth's natural ecosystems (U.S. EPA, 2020). At the surface, such gases are routinely monitored and regulated under the United States Environmental Protection Agency (EPA) National Ambient Air Quality Standards (NAAQS). Despite persistent mitigation efforts, the New York City/Long Island Sound (NYC/LIS) coastal region remains a frequent non-attainment area.
Coastal regions like NYC/LIS are complex due to the combination of dense urban emissions, proximity to large water bodies, and diverse meteorology. Emission sources in this environment are multi-faceted with heterogenous biogenic and fossil fuel sources, shipping, and biomass burning emissions frequently transported from the western US and Canada (e.g., Wu et al., 2018; Gronoff et al., 2019; Yang et al., 2022; Ring et al., 2023; Su et al., 2025). Local meteorological processes, particularly sea and bay breezes driven by thermally induced mesoscale pressure differences, can recirculate pollutants between land and water and are frequently linked to inland O3 exceedances (Miller et al., 2003; Banta et al., 2005; Darby et al., 2005; Loughner et al., 2014; Stauffer et al., 2015; Mazzuca et al., 2019; Li et al., 2020; Wang et al., 2023). These local-scale transport processes produce strong diurnal and spatial variability in pollutant concentrations (Tucker et al., 2010; Martins et al., 2012; Bernier et al., 2019).
Many modeling studies have highlighted the challenges of accurately simulating and forecasting coastal air pollution and meteorology due to sharp gradients in the planetary boundary layer (PBL) height, temperature, emission sources, and pollutant concentrations at the land-water interface, as well as the fine-scale structure of land/sea breeze circulations (Yerramilli et al., 2012; Dreessen et al., 2019; Sullivan et al., 2019; Zhao et al., 2020). These features often occur at finer spatial and temporal scales than conventional numerical models can resolve (Loughner et al., 2014; Goldberg et al., 2014). While high-resolution chemical transport models (CTMs) improve the representation of localized features on both the vertical structure and the temporal evolution of pollutants (Caicedo et al., 2019, 2021; Torres-Vazquez et al., 2022; Wang et al., 2023), they remain highly sensitive to input uncertainties and require robust observational constraints. Studies have demonstrated how O3 can vary considerably across short distances, such as between the north to the south shores of Long Island (LI), as well as time-height variations due to differences in emission sources, meteorology, and deposition processes along coastlines (Mazzuca et al., 2019, Yang et al., 2022; Zhang et al., 2022; Tzortziou et al., 2023; Luo and Lu, 2024). Capturing these gradients and the mechanisms that drive them depends on sustained, high-resolution observations from ground-based, airborne, and satellite platforms to improve air quality modeling and forecasting.
Historically, in situ measurement networks have lacked the spatial and temporal resolution needed to resolve coastal local-scale pollution gradients, particularly over water (Zhang et al., 2020). This limitation has motivated numerous air quality field campaigns (https://www-air.larc.nasa.gov/missions, last access: 30 September 2024), including DISCOVER-AQ, OWLETS, LISTOS, and TRACER-AQ, to better understand coastal air quality processes. In 2023, NASA contributed to the multi-agency AGES+ campaign (AEROMMA+CUPiDS, EPCAPE, STAQS and others) which encompassed several synergistic field efforts across U.S. urban regions. AGES+ collected comprehensive aircraft and ground-based measurements with extensive spatial and vertical coverage from July–August 2023. This study focuses on the STAQS campaign component which occurred in the NYC/LIS region and targeted the dynamic spatial and vertical structure of emissions and pollution over urban and coastal zones to study air quality and support early validation of the Tropospheric Emissions: Monitoring of Pollution (TEMPO) satellite.
The recent launch of NASA's TEMPO geostationary satellite addresses current satellite observation limitations by providing hourly, high spatial resolution data products such as key O3 precursors at km2 spatial resolution at the center of the field of regard (Chance et al., 2013; Zoogman et al., 2017). Using WRF-CMAQ and Pandora measurements, Tao et al. (2025) demonstrated the value of TEMPO hourly observations for investigating diurnal variability and surface–column relationships among HCHO, NO2, and tropospheric O3. Despite these advancements, satellite retrievals require validation, especially at urban/rural and land/water interfaces where retrievals can be challenging. During the STAQS field campaign, a suite of ground-based, airborne, and in situ instruments including Pandora, the GEO-CAPE Airborne Simulator (GCAS), ozonesondes, and multiple lidar systems were deployed to study spatiotemporal gradients and support satellite validation. In particular, lidars from the Tropospheric Ozone Lidar Network (TOLNet) have proven valuable for capturing large multi-dimensional O3 variability driven by transport and emissions (Johnson et al., 2016; Gronoff et al., 2021; Bernier et al., 2022). Integrating these multi-platform observations with high-resolution models (e.g., CTM, backward trajectories) enables improved characterization of pollutant variability and source attribution, advancing satellite retrieval performance and surface air quality assessment in complex urban-coastal environments (Kotaskis et al., 2022; Phoenix et al., 2025).
In this work, we focus on the following questions: (1) How well does TEMPO capture the large spatiotemporal variability of O3 precursors, NO2 and HCHO, in a complex environment? To investigate this, we compare TEMPO retrievals to Pandora and GCAS measurements and consider both the spatial and temporal variability across the NYC/LIS region during the STAQS campaign. (2) What meteorological mechanisms and chemical conditions lead to the diverse pollution cases observed during this campaign period? To examine this, we conduct a high spatial resolution CTM simulation in conjunction with the campaign measurements to evaluate spatiotemporal patterns of meteorological and pollution conditions in the NYC/LIS region. Representative air quality cases are classified based on observed and modeled O3 and meteorology to analyze atmospheric characteristics under different regimes (high, moderate, and low pollution). This framework also provides a basis for evaluating the conditions under which TEMPO more accurately captures precursor variability. All available datasets including model output, TEMPO satellite retrievals, ground-based and airborne in situ and remote-sensing observations, and TOLNet O3 and Doppler wind lidar measurements are used to explore NO2 and HCHO and their relationship to the multi-dimensional structure of O3, and the chemical and meteorological drivers of pollution events. By combining modeling and multi-platform observations, this study provides a synergistic approach for characterizing atmospheric composition and O3 dynamics as well as evaluating instrument performance in a complex coastal region.
2.1 TEMPO column NO2 and HCHO retrievals
NASA's TEMPO satellite (launched 7 April 2023) measures atmospheric pollution from geostationary orbit in the UV+VIS wavelength range for the greater North America domain (Zoogman et al., 2017). The satellite makes a complete East to West scan of the field of regard every hour during daytime and provides high spatial resolution data (∼2.1 km N/S × 4.4 km E/W at 36.5° N, 100° W). For this project, we use TEMPO L2 version 3 (v3) NO2 tropospheric and HCHO total column retrievals from 2 to 16 August 2023. We oversampled the TEMPO satellite data using a physics-based approach from Sun et al. (2018) to match our custom model inner-most domain at 1.33 km × 1.33 km resolution. TEMPO provides instantaneous retrievals, which were compared to the corresponding hourly model values. The TEMPO averaging kernels (AKs) were calculated following Eskes and Boersma, (2003) and Cooper et al. (2020) where W represents the scattering weight and AMF is the air mass factor:
The AKs were applied to the model derived columns to account for measurement sensitivities and allow for a direct comparison with the TEMPO columns. For each day, we apply the recommended filters (quality flag and effective cloud fraction of <0.2) to the L2 v3 vertical column density (VCD) data before calculating AKs and oversampling.
2.2 WRF-Chem configuration
To simulate air quality during the STAQS campaign we used the coupled meteorology-chemistry model, the regional Weather Research and Forecasting model with Chemistry (WRF-Chem; see Grell et al., 2005) model (version 4.2) on a nested domain over the NYC/LIS region for the duration of the campaign (26 July–16 August 2023) (Fig. S1 in the Supplement). A summary of the key model configurations is displayed in Table S1 in the Supplement and described in more detail below. The spatial resolution of the outer, middle, and inner domains (D01, D02, and D03) are 12, 4, and 1.33 km. Model output is hourly and uses a total of 47 vertical levels from the surface to about 50 hPa.
The Model of Ozone and Related Chemical Tracers (MOZART4; Emmons et al., 2010) chemical mechanism coupled to the Global Ozone Chemistry Aerosol Radiation and Transport (GOCART; Chin et al., 2000) bulk aerosol approach mechanism was used along with the Tropospheric Ultraviolet and Visible (TUV) Radiation Model full photolysis scheme (Madronich, 1987; Tie et al., 2003), which applies climatological O3 and O2 columns. Other selected parameterizations include the Thompson microphysics scheme (Thompson et al., 2008), Rapid Radiative Transfer Model for General Circulation Models (RRTMG) longwave and shortwave radiation scheme (Iacono et al., 2008), revised MM5 Monin–Obukhov similarity scheme for surface layer modeling (Monin and Obukhov, 1954), NOAH Land-Surface Model (Niu et al., 2011), YSU boundary layer scheme (Hong, 2010), and Modified Tiedtke scheme for cumulus modeling (Zhang et al., 2011). The initial and boundary conditions for gas-phase species and aerosols for the outer domain (D01) are provided by the Whole Atmosphere Community Climate Model (WACCM; Gettelman et al., 2019) at 1° × 1° and interpolated in space every 6 h. For the meteorological initial and boundary conditions, Global Forecast System (GFS) model outputs at 0.25° resolution are used for D01, while D02 and D03 receive boundary conditions from their respective WRF model outer domains.
For anthropogenic emissions, the United States Environmental Protection Agency (US EPA) National Emission Inventories (NEI) 2017 emissions dataset at 12 km × 12 km resolution was used for D01. The D02 and D03 simulations are driven by the anthropogenic emission dataset Neighborhood Emission Mapping Operation (NEMO), which is produced at hourly intervals based on the US EPA NEI 2019 dataset, offset to the year 2023, and reprocessed to a spatial resolution of 1 km × 1 km (Ma and Tong, 2022). Elevated point sources and shipping emissions are implemented from US EPA 2019 12 km × 12 km dataset for all three domains. Fire emissions are provided by the Fire Inventory from NCAR version 2.5 (FINN/2.5; Wiedinmyer and Emmons, 2022) and implemented along with biogenic emissions from the Model of Emission of Gases and Aerosols from Nature (MEGAN) with online calculations (Guenther et al., 2012). Lightning NOx is calculated online and included in the MOZCART chemistry option using the Price and Rind (1992) schemes with modifications based on Barth et al. (2012) and Wong et al. (2013). The simulation was performed with a 4 d spin-up applied. To ensure consistency in the comparison with TEMPO observations, we derived model-based tropospheric vertical column densities (VCDs) from WRF-Chem using TEMPO's tropopause pressure product and corresponding AKs.
2.3 Multi-platform measurements during the STAQS campaign
2.3.1 TOLNet O3 vertical profiles
Established in 2012, TOLNet consists of seven O3 lidar systems stationed across the United States and five mobile Small Mobile Ozone Lidar (SMOL) systems, that provide high vertical and temporal resolution measurements of O3 mixing ratios (https://tolnet.larc.nasa.gov, last access: 9 October 2024). For the last decade, many of these lidar systems have been deployed to participate in several air quality campaigns (e.g., DISCOVER-AQ, OWLETS, LISTOS, TRACER-AQ, AGES+) with measurements commonly used for model evaluation, satellite validation, and scientific investigation. The lidar systems apply Differential Absorption Lidar (DIAL)-derived retrieval algorithms as well a central processing system. For the STAQS campaign region, four TOLNet lidars were deployed around the LIS with the goal of capturing unique spatiotemporal differences of O3 along the urban/coastal interface (Fig. 1). The City College of New York (CCNY) Tropospheric Ozone Lidar System (NYTOLS) was located on the CCNY campus in the NYC urban region operating for 23 d during the campaign period. The NASA Goddard Space Flight Center (GSFC) TROPospheric OZone (TROPOZ) lidar was located on the southern shore of the LIS operating for 32 d. The Langley Mobile Lidar (LMOL; Berkoff et al., 2025) and NOAA Chemical Science Laboratory (CSL) Tunable Optical Profiler for Aerosol and oZone (TOPAZ; ASDC, 2025) lidars were both located on the northern coast of the LIS along the CT coast operating for 15 and 36 d, respectively. In this analysis, the high resolution lidar data is interpolated to match the coarser vertical levels and hourly output of the WRF-Chem model with the original high-resolution curtain figures included in the Supplement (Fig. S16).
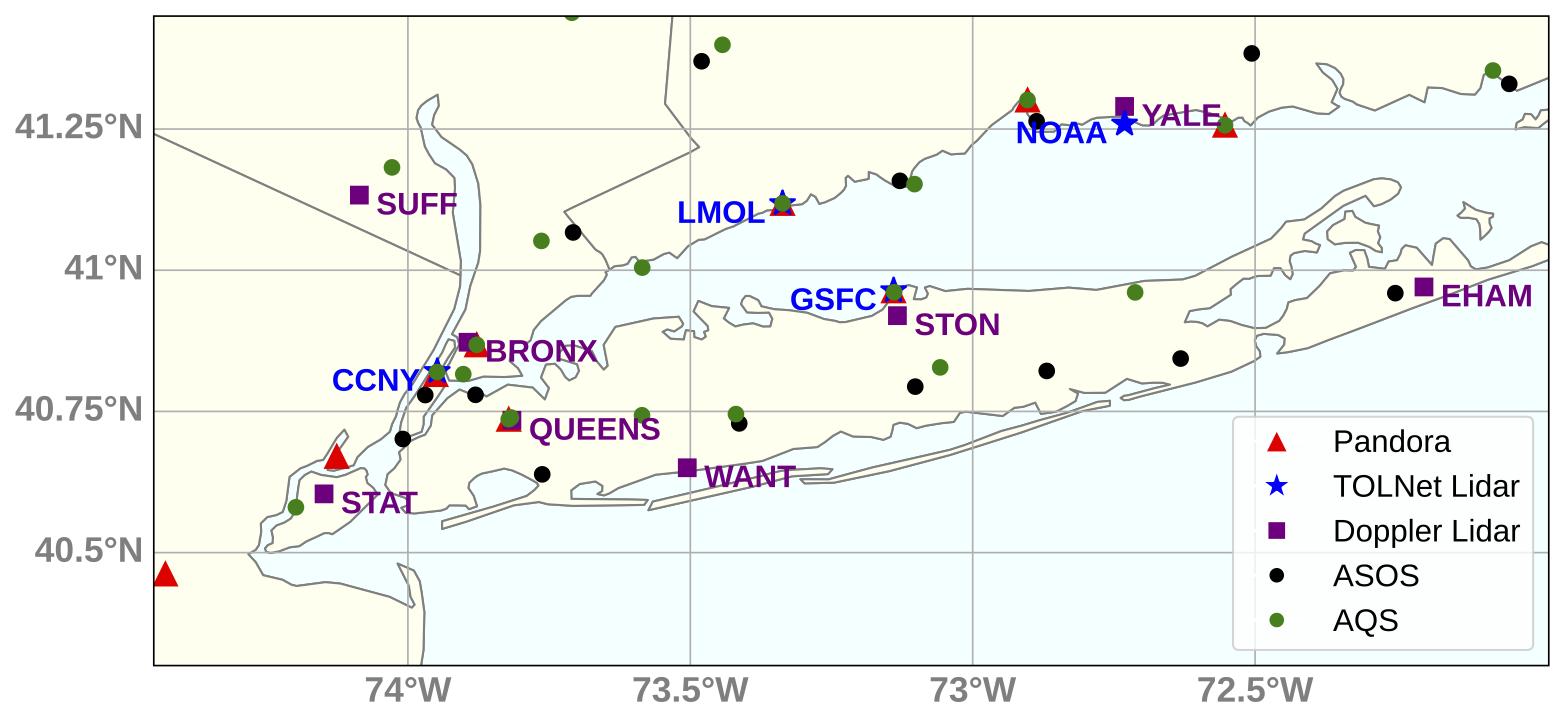
Figure 1Map of the NYC/LIS study area covered during STAQS with subregions labeled: urban (red), LI coastal (blue), and Connecticut (CT) coastal (green) (full model domains shown in Fig. S1). Pandora stations, TOLNet lidar instruments, and ASOS/AQS monitoring sites denoted by discrete markers (marker legend displayed in the bottom right of the figure).
2.3.2 Pandora NO2 and HCHO
Pandora remote sensing instruments, part of the Pandonia Global Network (PGN), are ground-based UV–VIS spectrometers that provide direct-sun column measurements of O3, SO2, NO2, and HCHO at high temporal resolution (Herman et al., 2009). Slant columns retrieved using the spectral fitting algorithm from Cede et al. (2017) are converted to vertical columns using geometric AMFs. For this study, we used the Pandora NO2 and HCHO VCDs from eight sites around the NYC/LIS region from 16 July to 16 August 2023 (Fig. 1). Tropospheric NO2 columns were derived by subtracting TEMPO-retrieved stratospheric columns from the Pandora total columns. All data is processed as part of the PGN (https://www.pandonia-global-network.org/, last access: 9 October 2024) and only data with a quality flag of 0 or 10 (high quality) were applied in this study. Pandora data were co-located to the nearest WRF-Chem model hour (±30 min) and averaged to hourly means for comparison.
2.3.3 GCAS NO2 and HCHO column measurements
The GCAS instrument provides high–spatial native resolution (∼250 m × 250 m) airborne measurements of NO2 and HCHO VCDs using the differential optical absorption spectroscopy (DOAS) technique, following the methodology described in Judd et al. (2019), across the 300–490 and 480–900 nm spectral ranges with a 0.6 and 2.8 nm spectral resolution (Kowalewski and Janz, 2014; Nowlan et al., 2016; Judd et al., 2020). During STAQS, GCAS was flown on the NASA DC-8 aircraft over the NYC/LIS region on 26, 28 July and 5, 9 August 2023, providing ∼7 km swath width observations at a nominal altitude of 9 km. The GCAS NO2 and HCHO VCD data was used in this study to validate TEMPO and analyze pollution spatiotemporal characteristics. To ensure comparability, the GCAS columns (below flight observations up to 9 km) were scaled to full tropospheric columns using scale factors derived from WRF-Chem vertical profiles of NO2 and HCHO that account for the above-aircraft portion of the column. Only cloud-free scenes were included and GCAS observations were collocated within 30 min of the hourly TEMPO measurements, allowing direct comparison of coincident measurements across multiple flight passes.
2.3.4 Other airborne and ground-based measurement instruments and statistical methods
The NASA DC-8 aircraft instrument payload also included the Airborne Cavity Enhanced Spectrometer (ACES) measuring in situ NO2. Doppler lidar data from the New York State (NYS) Mesonet sites (https://nysmesonet.org/networks/profiler, last access: 21 November 2025), as well as the autonomous Doppler lidar from NOAA CSL (https://csl.noaa.gov/, last access: 21 November 2024) at the Yale Coastal Site, provided horizontal and vertical wind measurements. Ground in situ monitoring station datasets for meteorology and chemistry including the US EPA Air Quality System (AQS; https://www.epa.gov/aqs, last access: 21 November 2024) surface network and the National Weather Service (NWS) Automated Surface Observing System (ASOS; https://www.weather.gov/asos/, last access: 4 November 2024) providing observational surface O3, NO2, and wind speed and direction measurements (Fig. 1). The number of ground measuring sites with continuous observations available vary by the parameter with 16 sites for O3, 7 for NO2, and 14 sites for winds.
The statistical metrics employed in this work are Pearson correlation coefficient (R), mean bias (MB), and root mean square error (RMSE). Since the wind direction is an angular variable (recorded in degrees), we calculate circular statistics for correlation coefficient and RMSE. For wind speed statistics when comparing to WRF, we filter out winds below 2 m s−1 as lower winds speeds tend to be variable in direction and bias the model results. To compare the in-situ observations and the simulated surface concentrations, we interpolate the nearest WRF-Chem simulation grid to the geolocations of the AQS and ASOS stations. For further analysis, we split our domain into three subregions: urban area (red symbols in Fig. 1), LI coastal (blue symbols in Fig. 1), and Connecticut (CT) coastal (green symbols in Fig. 1). The locations of the AQS and ASOS stations and the TOLNet lidar, Doppler lidar, and Pandora instruments used in this work are all indicated in Fig. 1.
In this section, we summarize key findings on O3 and precursor species dynamics during the 2023 STAQS campaign and provide an initial assessment of TEMPO performance in a complex coastal environment. Section 3.1.1 compares high-resolution WRF-Chem simulations with ground-based observations, not as a detailed model evaluation but to demonstrate the model's utility as a tool to fill in measurement gaps. Section 3.1.2 evaluates TEMPO tropospheric NO2 and total HCHO columns against Pandora and GCAS data to assess its ability to capture observed chemical conditions. Section 3.2 classifies the campaign period by O3 level and meteorological regimes. Section 3.3 presents an integrated multi-platform analysis of pollution events, including high pollution days influenced by sea breeze circulation (Sect. 3.3.1), moderate cases (Sect. 3.3.2), and two contrasting moderate and low pollution days with a multi-platform perspective (Sect. 3.3.3).
3.1 Model and satellite assessments
3.1.1 WRF-Chem O3 and wind evaluation
WRF-Chem model simulations were evaluated at the finest resolution grid (1.33 km × 1.33 km) to determine its suitability as a tool for filling observational gaps during STAQS. Hourly AQS and ASOS observations of O3, NO2, wind speed, and direction were used for comparison (Fig. S2, Table S2a). Overall, the model captures the spatiotemporal patterns of surface O3 and NO2 with moderate to strong correlations, reproducing key features. The diurnal time series comparison (Fig. S2) reveals a common model high O3 bias overnight (Li and Rappenglueck, 2018; Travis and Jacob, 2019) and slight high bias during daytime O3 peaks. Quantitative performance statistics computed across the full diurnal cycle indicate an overall slight overestimation of O3 (MB = 4.4 ppb, NMB = 12.5 %), and a more variable but slight underestimation of NO2 (MB = −1.4 ppb, NMB = −19.1 %).
To further investigate model performance across different regions of NYC/LIS, we subset the domain into three subregions: urban, LI coastal, and CT coastal (Table S2b). Results show the best performance for surface O3 was in urban areas, with slightly lower correlations and higher biases along the LI and CT coasts. Model performance of surface NO2 at all three locations is poor to moderate (R=0.26–0.55) with the best performance in the urban region. Due to the importance of transport and sea breeze effect in coastal regions, we focus on the wind speed and direction parameters when evaluating the model simulated meteorological parameters. Surface level winds are simulated well overall, though urban wind speed and direction are more variable and slightly less accurate due to the calm and fluctuating conditions (R=0.52 and 0.68, respectively). The coastal winds are better simulated with the highest correlations for wind speed and direction at LI coastal (R=0.63 and 0.77, respectively) and CT coastal (R=0.55 and 0.76, respectively) regions. In summary, WRF-Chem reproduces the main features of surface gaseous species and meteorology sufficiently to serve as a tool to fill observational gaps during the STAQS campaign.
3.1.2 TEMPO NO2 and HCHO vertical column evaluation
To determine the capability of TEMPO to observe complex pollution patterns in the NYC/LIS region, we investigate the agreement with independent instruments (Pandora and GCAS). We first investigate the overall statistical performance of TEMPO NO2 and HCHO VCDs at Pandora sites (all campaign days) and along the entire GCAS flight paths (5 and 9 August 2023) (Fig. 2). The results indicate that TEMPO has a strong correlation with both Pandora and GCAS (R=0.79 and 0.81, respectively) for NO2 based on n=412 and n=6020 coincident matchups, respectively. Relative to Pandora, TEMPO performance varies with NO2 magnitude, exhibiting a low bias at the highest VCDs measured by Pandora and improved agreement at lower VCD values. In comparison to GCAS, TEMPO NO2 shows a slight low bias overall but less than compared to Pandora. For HCHO, TEMPO shows weaker correlation with Pandora (R=0.41) and GCAS (R=0.02) across the available coincidences. Biases indicate a more similar agreement between Pandora and TEMPO across both low and high HCHO VCD values. In contrast, comparison with GCAS reveal TEMPO has a negative bias at higher HCHO VCDs values as well as a strong positive bias at lower observed GCAS VCD values. The pronounced high HCHO VCD measurements captured by GCAS (Fig. 2) may be influenced by localized point or near-point sources sampled by the aircraft, resulting in sharp HCHO enhancements that are not fully captured by TEMPO. Similar localized HCHO plumes, associated with combustion processes and urban NMVOC emissions, have been reported in previous studies (Zheng et al., 2022; Zuo et al., 2023).
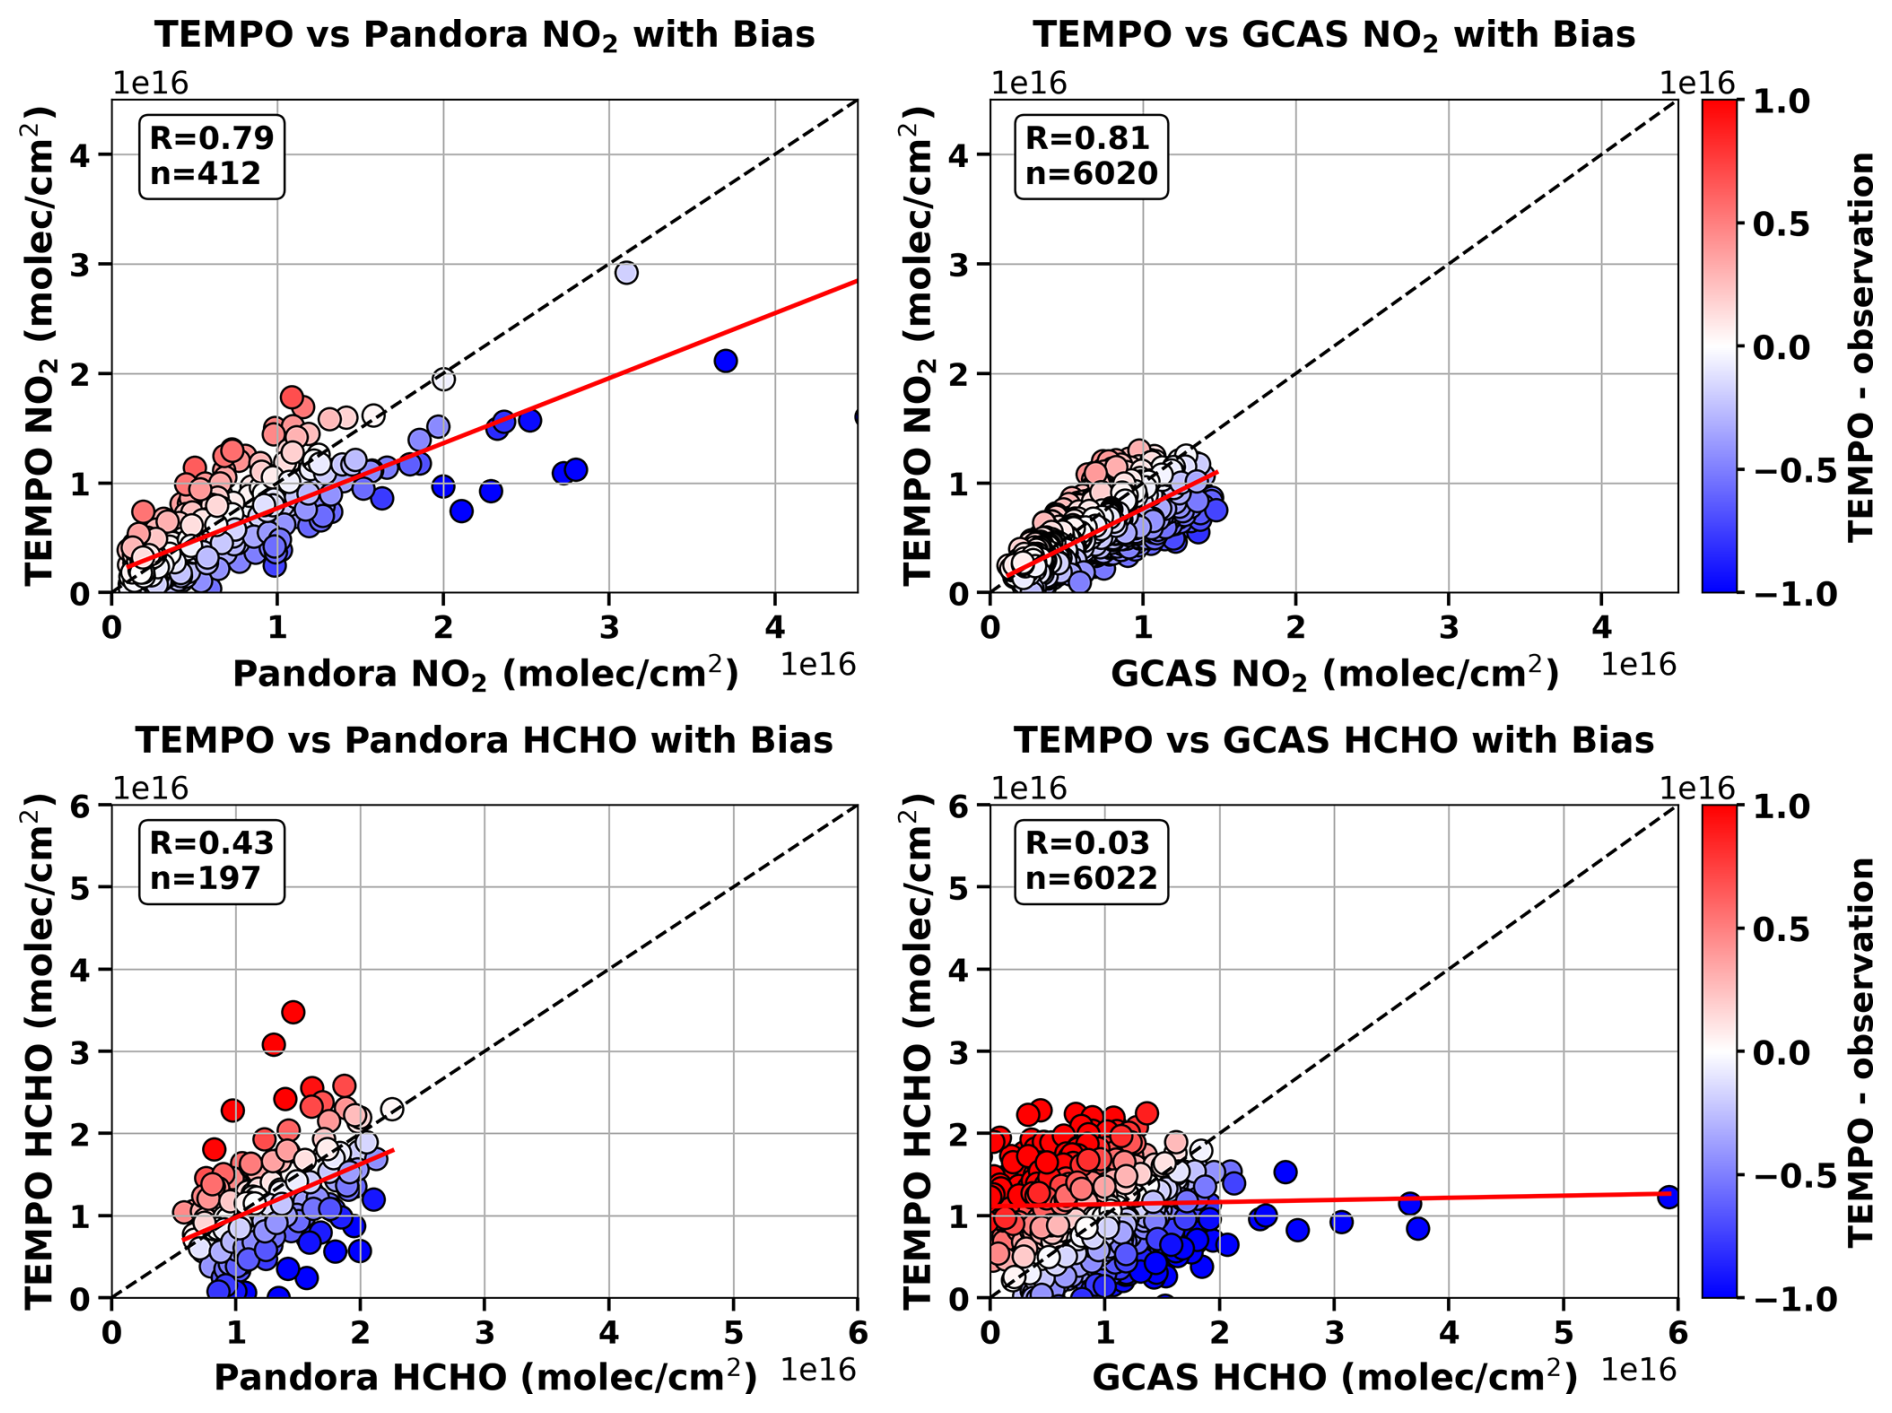
Figure 2TEMPO comparison with Pandora (left column) and GCAS (right column) retrievals for NO2 (top row) and HCHO (bottom row) (molec cm−2). Points are colored by the bias (TEMPO – Pandora or GCAS). The dashed black line indicates the 1:1 relationship and the solid red line shows the least-squares regression fit. Sample sizes are indicated in each panel (n).
To gain further insight into localized patterns of TEMPO performance, we evaluate NO2 and HCHO VCDs at each Pandora site for the campaign period (Table 1, Fig. S3). At urban sites (New Brunswick, Bayonne, Queens, Manhattan-CCNY, Bronx), TEMPO NO2 agrees well with Pandora (R=0.69–0.80), showing positive biases at Bronx and Manhattan-CCNY and negative biases at the remaining sites. At coastal sites (Old Field, Westport, New Haven, Madison), TEMPO shows mixed biases and lower correlations. This evaluation suggests TEMPO NO2 columns capture the large contrast in NO2 concentrations between the urban core (Manhattan and Bronx) and surrounding transitional-suburban and transportation-influenced regions (Bayonne, Queens, New Brunswick). However, larger biases in these transitional (non-urban core) regions indicate that TEMPO does not fully resolve the steep NO2 gradients at this urban-suburban interface and may exhibit elevated biases under lower background pollution conditions. TEMPO displays the poorest performance (largest biases) at the sites closest to the land-water interfaces (New Haven and Westport), suggesting possible retrieval complications and increased uncertainty at these boundaries, likely driven by sharp surface albedo contrasts between land and water as well as differences between the true vertical distribution of NO2 and the a priori profiles used. The diverse results based on site location have been highlighted for TROPOMI in Judd et al. (2020) and is attributed to the differences in spatial representativity between the satellite and Pandora instruments, especially in the case of sampling over a shorter time range such as a campaign study. Even though TEMPO is retrieving at a higher spatial resolution compared to TROPOMI, the subpixel variation in the area seems to still influence the results when comparing with localized Pandora measurements and even more along complex interfaces. Overall, the TEMPO NO2 performance relative to Pandora is reasonable, with biases falling within the range reported in other satellite validation studies where station-to-station performance can vary considerably (e.g., Ghahremanloo et al., 2025), including in challenging urban–suburban transition zones and complex coastal land–water boundary environments.
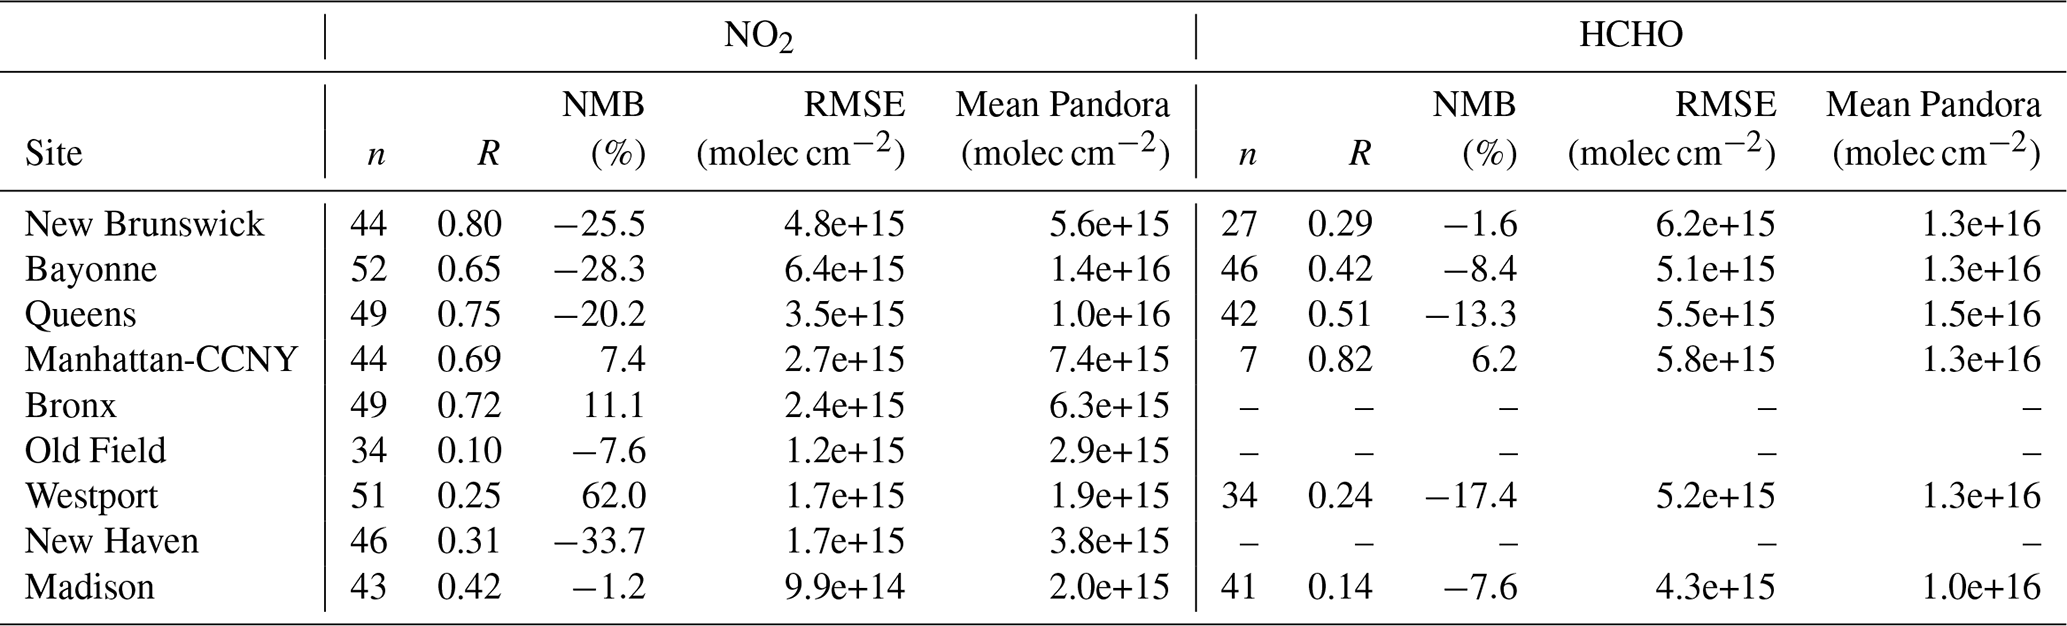
Pandora HCHO VCD measurements were unavailable at the Bronx, Old Field, and New Haven sites during STAQS. At the remaining sites, correlations with TEMPO range from weak to strong, with small negative biases (−13.3 % to −1.6 %) at all sites except for a positive bias at the Manhattan-CCNY station. Absolute errors are modest relative to column variability across both urban and coastal sites and can be attributed to many factors such as retrieval vertical sensitivity and a priori vertical profiles. Overall, the TEMPO HCHO relationship with Pandora aligns with previous studies using other satellite instruments, such as TROPOMI and GEMS, showing a general slight underestimation (Judd et al., 2020; Zhu et al., 2020; Kim et al., 2023).
Having established the overall TEMPO bias relative to GCAS, we next investigate how these differences vary across specific areas of the NYC/LIS domain by examining the full GCAS flight paths. Figure 3 provides a detailed view of the resulting NO2 and HCHO differences (quantitative results in Fig. S4). On both days, TEMPO NO2 exhibits a pronounced negative bias over Staten Island. This pattern may be partly attributed to the same albedo and reflectivity errors found with the near water Pandora sites, as well as the coarse spatial resolution of the a priori profiles used in the TEMPO retrievals. Conversely, directly over the NYC urban core, TEMPO NO2 biases high with the bias stretching over the west end of LI. The bias differences from the core urban boroughs (Manhattan, Queens, and Brooklyn) to the more transitional urban-suburban Staten Island region are consistent with what was noted with the Pandora results. Although TEMPO captures the overall decrease in NO2 across the urban–suburban/transitional boundary, the gradient is smoother than observed by GCAS. These results highlight the challenges of pixel-to-pixel retrievals of pollution variability, even with higher spatial resolution satellite retrievals. For HCHO, TEMPO retrievals exhibit weaker spatial correlations and moderate positive biases relative to GCAS, with noise dominating the signal. The differing HCHO bias behavior between TEMPO–Pandora and TEMPO–GCAS comparisons is consistent with previous studies showing that GCAS HCHO columns tend to be lower than Pandora (Rawat et al., 2025).
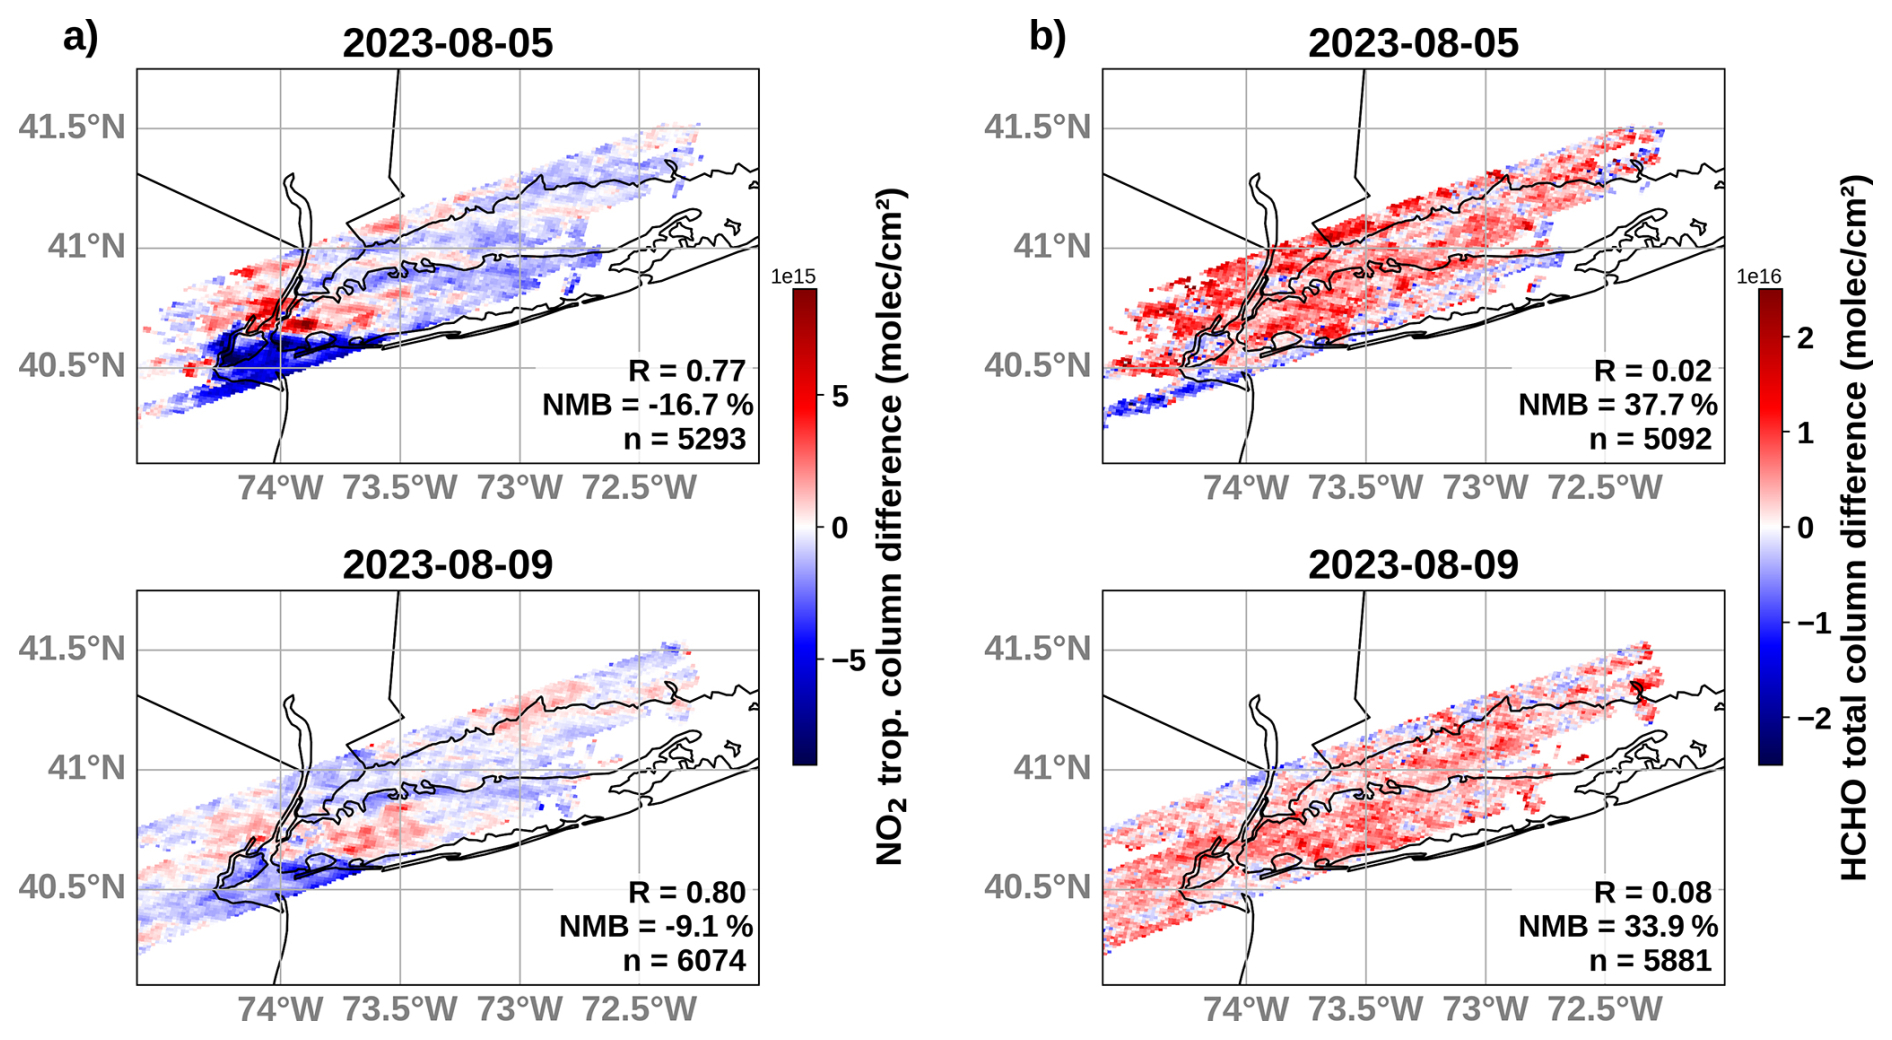
Figure 3TEMPO – GCAS NO2 (a) and HCHO (b) tropospheric VCD differences (molec cm−2) for two DC-8 flight days: 5 and 9 August 2023. The main statistics of these differences are displayed in the figure legend. Sample sizes are indicated in each panel (n).
It is worth noting that HCHO validation studies typically rely on multi-day or monthly averaged retrievals to reduce retrieval noise and improve signal robustness (e.g., Johnson et al., 2023). The comparisons presented here use hourly TEMPO snapshots, which demonstrate TEMPO's unique geostationary capability but are inherently noisier and yield less statistically robust signals than those derived from longer temporal averages. The HCHO results should be interpreted as an illustration of what is achievable with TEMPO's high-temporal-resolution observations under the sampling constraints of a campaign dataset, rather than as a comprehensive characterization of overall TEMPO HCHO retrieval performance. Caution is warranted when drawing broad conclusions from single-overpass comparisons of this nature.
TEMPO tropospheric NO2 VCDs were also compared with in situ NO2 (ppb) measured by the ACES instrument aboard the DC-8 aircraft on 9 and 16 August 2023 (Fig. 4). While these products differ in units and vertical representation, the comparison serves as a qualitative illustration of spatial patterns and the connection between surface and column observations rather than a formal validation. On both days, ACES-measured NO2 enhancements generally align with the elevated TEMPO tropospheric VCDs, particularly over the NYC urban core, suggesting well-mixed plumes and spatial consistency in the urban-suburban gradients in NO2. Some mismatches occur such as along the LI coastline on 16 August 2023, where ACES captures sharp local gradients that are not as elevated in the TEMPO VCDs, likely reflecting the difference in vertical representation between the shallow in situ layer and the total column measurement. Overall, this qualitative agreement across multiple independent measurement types provides additional spatial context for interpreting TEMPO column retrievals. Combined with high-resolution WRF-Chem output, these observations allow us to bridge gaps among surface monitors, GCAS, and Pandora, providing a comprehensive view of O3 dynamics and precursor species characteristics during the STAQS campaign.
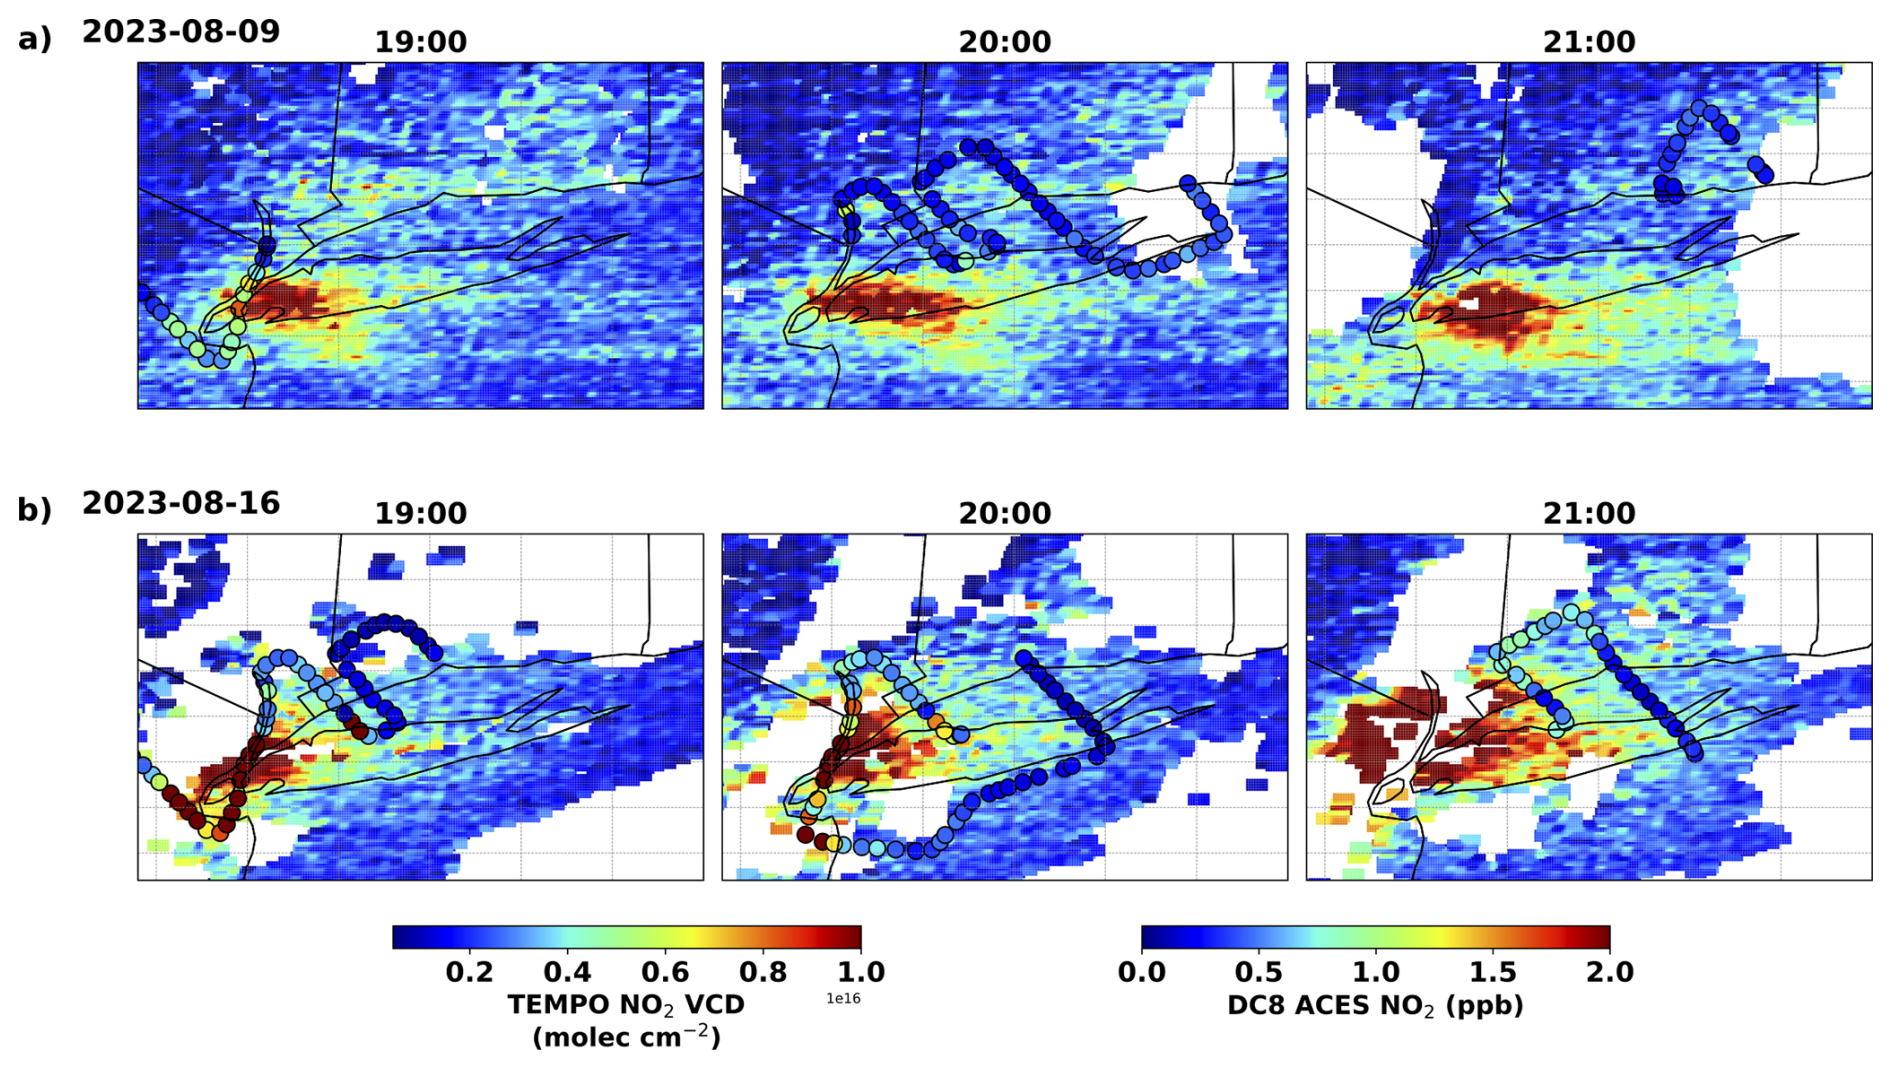
Figure 4Hourly average TEMPO NO2 VCDs (molec cm−2) overlayed with hourly ACES measured NO2 (ppb) for the two DC-8 flight days: 9 and 16 August 2023.
3.2 Pollution regimes during STAQS
To investigate different characteristics of O3 dynamics, we classify the STAQS campaign period into three O3 pollution regimes: high, moderate, and low pollution. Classification is based primarily on observed peak hourly surface O3 concentrations and the prevailing synoptic conditions, with thresholds informed by the distribution of O3 levels across the campaign period rather than fixed regulatory standards. Based on observed and simulated surface O3 concentrations, 26 and 28 July 2023 were classified as high pollution days; 5, 6, 11, and 12 August 2023 as moderate pollution days; and 2 and 9 August 2023 as low pollution days. These classifications are further supported in the following sections by the accompanying meteorological conditions from both in situ observations and model output, as well as the precursor species accumulation patterns from remote sensing observations.
The high pollution cases at the end of July occurred under a strong regional high-pressure system, with weak winds, high temperatures, and clear skies. The averaged observed surface winds for the high pollution regime (Fig. S5a) indicate winds were relatively weak and generally north-westerly to south-westerly (225–315°). These stagnant conditions promoted photochemical buildup and local recirculation and transport of O3 from the urban city to the coastal areas. Sea breeze circulation further enhanced coastal O3 levels, with observed and simulated afternoon hourly exceedances (>90 ppb) along the LIS coastlines. During the moderate pollution cases in early and mid-August, weaker synoptic forcing and transitional high-pressure systems produced light, variable winds and elevated temperatures. The averaged observed surface winds for these cases were much less consistent, which is typical under transitional synoptic conditions (Fig. S5b). These conditions brought moderate (∼60 ppb) overall hourly O3 levels but allowed for unique, localized O3 formation. The low pollution cases on 2 and 9 August 2023, followed frontal passages that brought cooler temperatures, increased cloud cover, and scattered showers. Stronger synoptic winds, marine south-westerly winds on 2 August 2023, and continental northerly winds on 9 August 2023 (Fig. S5c) enhanced pollutant dispersion, resulting in low hourly average O3 levels (<40–50 ppb) across the region. Overall, these regimes capture the wide variability of hourly O3 dynamics during STAQS, ranging from high-pressure dominate and sea breeze-driven exceedances to post-frontal events. These classifications provide the framework for the detailed multi-platform analysis in the following sections.
3.3 Integrated multi-platform analysis of pollution events
To comprehensively evaluate the mechanisms driving each pollution regime, model output was integrated with a range of surface, vertical profile, and column measurements. Surface data from WRF-Chem and AQS sites are used to establish general pollution behavior, while multi-dimensional profiles from TOLNet and Doppler lidars reveal regional transport, PBL mixing, and sea breeze circulations, with WRF-Chem providing spatial continuity where observational gaps exist. Satellite and airborne TEMPO and GCAS observations further capture the spatiotemporal evolution of precursor species, allowing for a thorough investigation of O3 development during different pollution regimes.
3.3.1 High pollution and sea breeze cases (26 and 28 July 2023)
The most prominent air pollution event occurred on 26 July 2023. Around midday, O3 concentrations increased initially over the NYC urban core and western LIS before spreading eastward along both coastlines. The daily observed maximum O3 (>100 ppb) peaked midday along the coast of the NY/CT border (Figs. 5a, S6a), driven by surface winds shifting from NW–W to S–SW in the afternoon. A classic strong sea breeze event involves the morning westerly transport of fresh urban emissions over the LIS, followed by a pronounced S–SE wind shift that recirculates the photochemically aged, O3 -rich air mass back inland toward NYC. The afternoon wind shift on this day (most notable at the LI coastal sites) is indicative of a sea breeze circulation; however, the transition is less sharp than in a classic strong sea breeze event where winds typically veer distinctly to S–SE (Fig. S7a). This more moderate sea breeze can still act to recirculate precursor-rich air masses inland, contributing to the observed O3 buildup. While still resulting in elevated O3 concentrations, the conditions on 28 July 2023, differed. Early/midday urban O3 was on average much lower compared to 26 July 2023, while strong O3 enhancements were observed on the southern LI coast (daily maximum O3>90 ppb) and later building along the LI side of the LIS coastline before reaching the CT side (Figs. 5b, S6b). A similar NW–W to SW–S wind shift occurred, again consistent with a moderate sea breeze circulation rather than strong (most notable at the LI coastal sites) (Fig. S7b). Given the similar surface winds observed on both high pollution days (Fig. S7a, b), the differing O3 accumulation patterns appear to be driven by other factors such as differences in emissions sources, PBL, and vertical mixing.
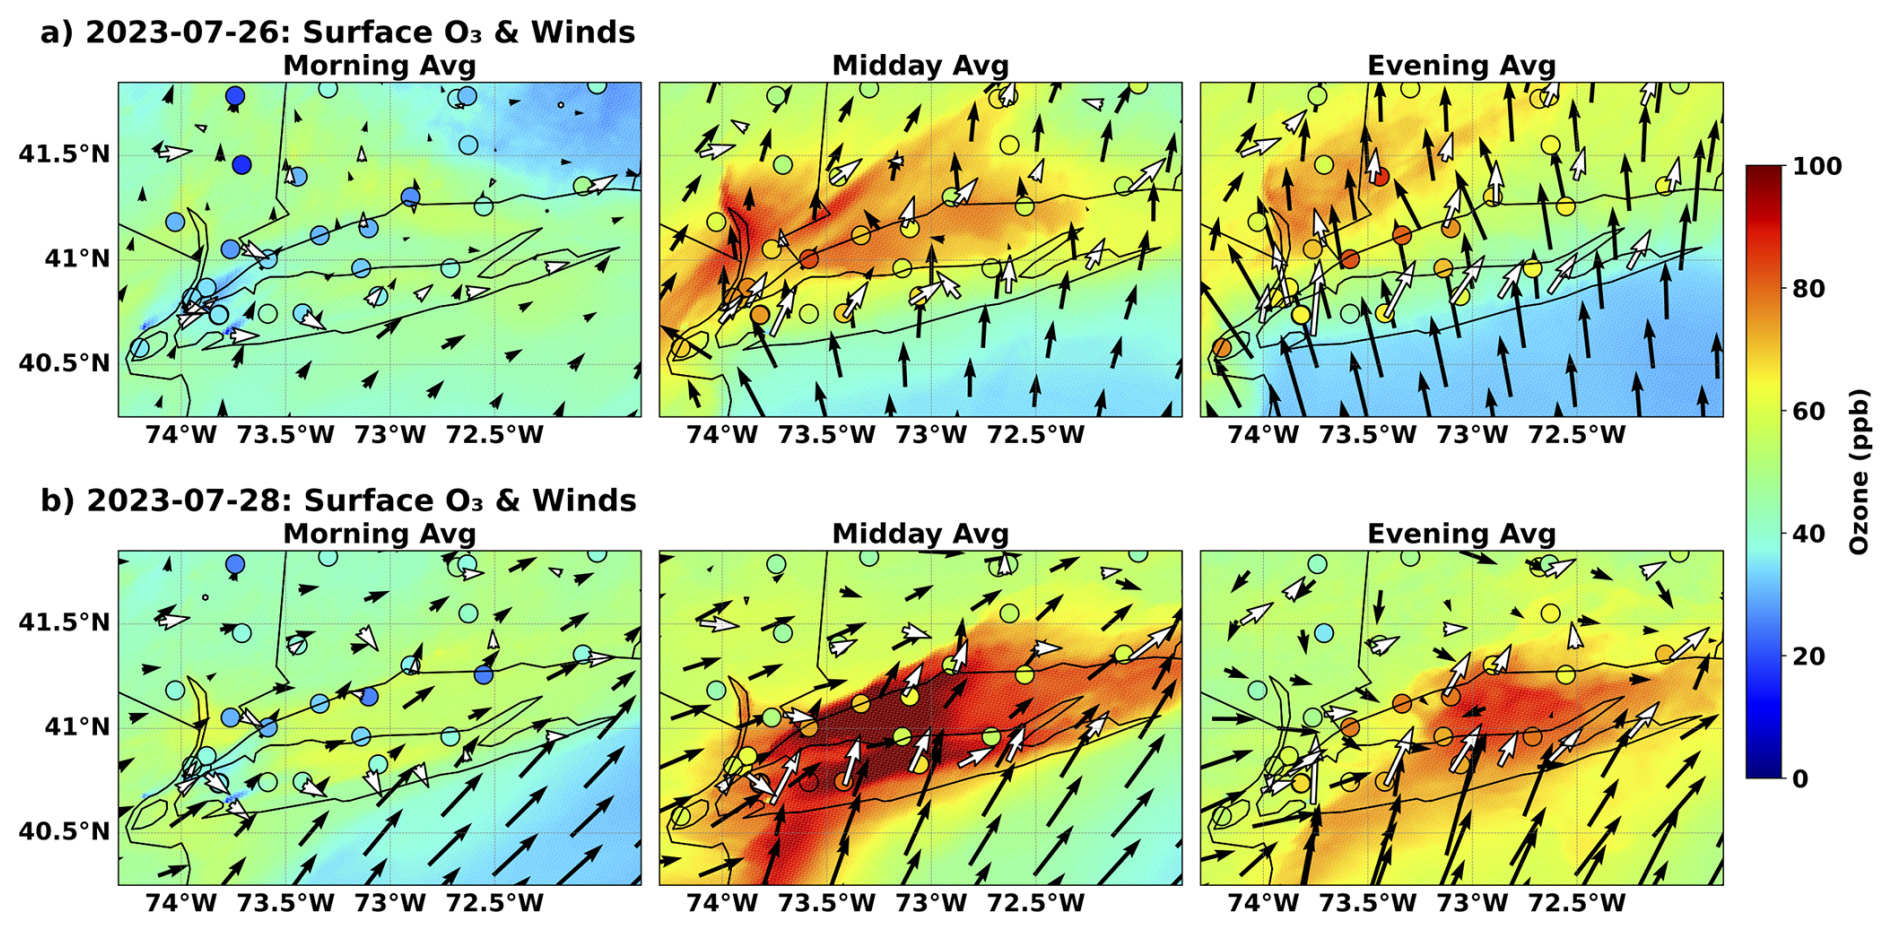
Figure 5Morning, midday, and evening averaged AQS O3 observations (scatter points) and ASOS winds (white arrows), overlaid with WRF-Chem simulated O3 (contours) and winds (black arrows) for 26 July (a) and 28 July 2023 (b). Morning averages correspond to 11:00–15:00 UTC, midday to 15:00–19:00 UTC, and evening to 19:00–00:00 UTC.
To provide additional perspective beyond surface observations, we also investigate the spatiotemporal distribution of O3 and winds using the TOLNet O3 and Doppler wind lidars (Fig. 6). The TOLNet lidars available on 26 July 2023, observed well-mixed high O3 (∼100 ppb) throughout the PBL (Fig. 6a) with the highest concentrations in the PBL indicative of a local O3 formation. On this day, a clear progression of the pollution event was observed from its initiation at the NYTOLS lidar (urban core) which was then transported downwind over the LIS first to the TROPOZ lidar (LI side) and then finally to the TOPAZ lidar (CT side), corresponding with what was captured by the ground in situ network. The Doppler lidar vertical winds further demonstrate the sea breeze event captured by the surface ASOS monitors on this day (Fig. 6b). The observed wind shift is most notable at the urban location but is also apparent at the coastal locations. The urban wind shift extended up to ∼1 km above the surface, indicating that the sea breeze circulation penetrated well into the mixed layer, recirculating urban emissions over the LIS and promoting a widespread increase of O3 along both coastlines.
On 28 July 2023, urban in situ surface monitors measured relatively lower O3 all day while the coastal sites observed elevated levels already by midday, suggesting that observed O3 exceedances were not likely dominated by local photochemical production, in contrast to 26 July 2023. Often, O3 exceedances can arise from the entrainment of pollutants from the previous day retained within the residual layer, which can be mixed into the growing PBL the following morning (e.g., Kaser et al., 2017; Sullivan et al., 2017). In other cases, these pollutants can be trapped overnight near coastlines and over the LIS under a shallow marine boundary layer later getting mixed into the growing PBL and transported to nearby sites (Zhang et al., 2022; Torres-Vazquez et al., 2022). To assess whether these mechanisms may have contributed to the pollution events on 28 July, we examined the simulated O3 curtains as well as the observed wind lidar profiles spanning the overnight and early morning period (Figs. 6, S8). TOLNet observations on 27 July show elevated O3 (75–105 ppb) persisting aloft at TROPOZ and TOPAZ through the late afternoon and into the evening (up to ∼00:00 UTC 28 July), providing observational evidence that an O3 rich layer was present going into the overnight period (Fig. S8). Direct overnight observations are unavailable, however, WRF-Chem simulated O3 curtains suggest elevated O3 concentrations (60–75 ppb) may have persisted within the residual layer (approximately 1–2 km) through the overnight hours at these same sites. Consistent with this, the TOLNet observed profiles beginning near 12:00–13:00 UTC on 28 July 2023, capture elevated O3 levels just above the surface layer that deepen vertically by mid-afternoon as the PBL develops (Fig. 6c), which is consistent with entrainment of residual layer air into the growing daytime PBL, though direct observational confirmation of the overnight transport itself is limited. There is also an overnight shallow marine boundary layer most notably present at the Yale Coastal site and slightly at the Stony Brook site (Fig. 6d), however, direct observational evidence of elevated O3 within this layer is not available, and its contribution remains inferred from the surface timing and spatial pattern of the coastal enhancements. An alternative or complementary mechanism involves coastal convergence and recirculation within the LIS region, where interactions between the south-shore sea breeze and opposing coastal flows from Connecticut could favor O3 accumulation; surface wind observations show some evidence of convergence along the northern LIS shore, though the signal is not strong enough to conclusively distinguish this from the residual layer entrainment pathway. These results are consistent with the early coastal O3 enhancements on 28 July 2023, having been influenced by overnight pollutant accumulation in the residual layer and possibly shallow marine boundary layer, subsequently entrained into the daytime PBL during its initial growth that favored sustained coastal O3 enhancements. However, given the reliance on model-simulated overnight structure and the plausibility of coastal convergence as a contributing factor, this interpretation should be regarded as a provisional hypothesis rather than a demonstrated mechanism.
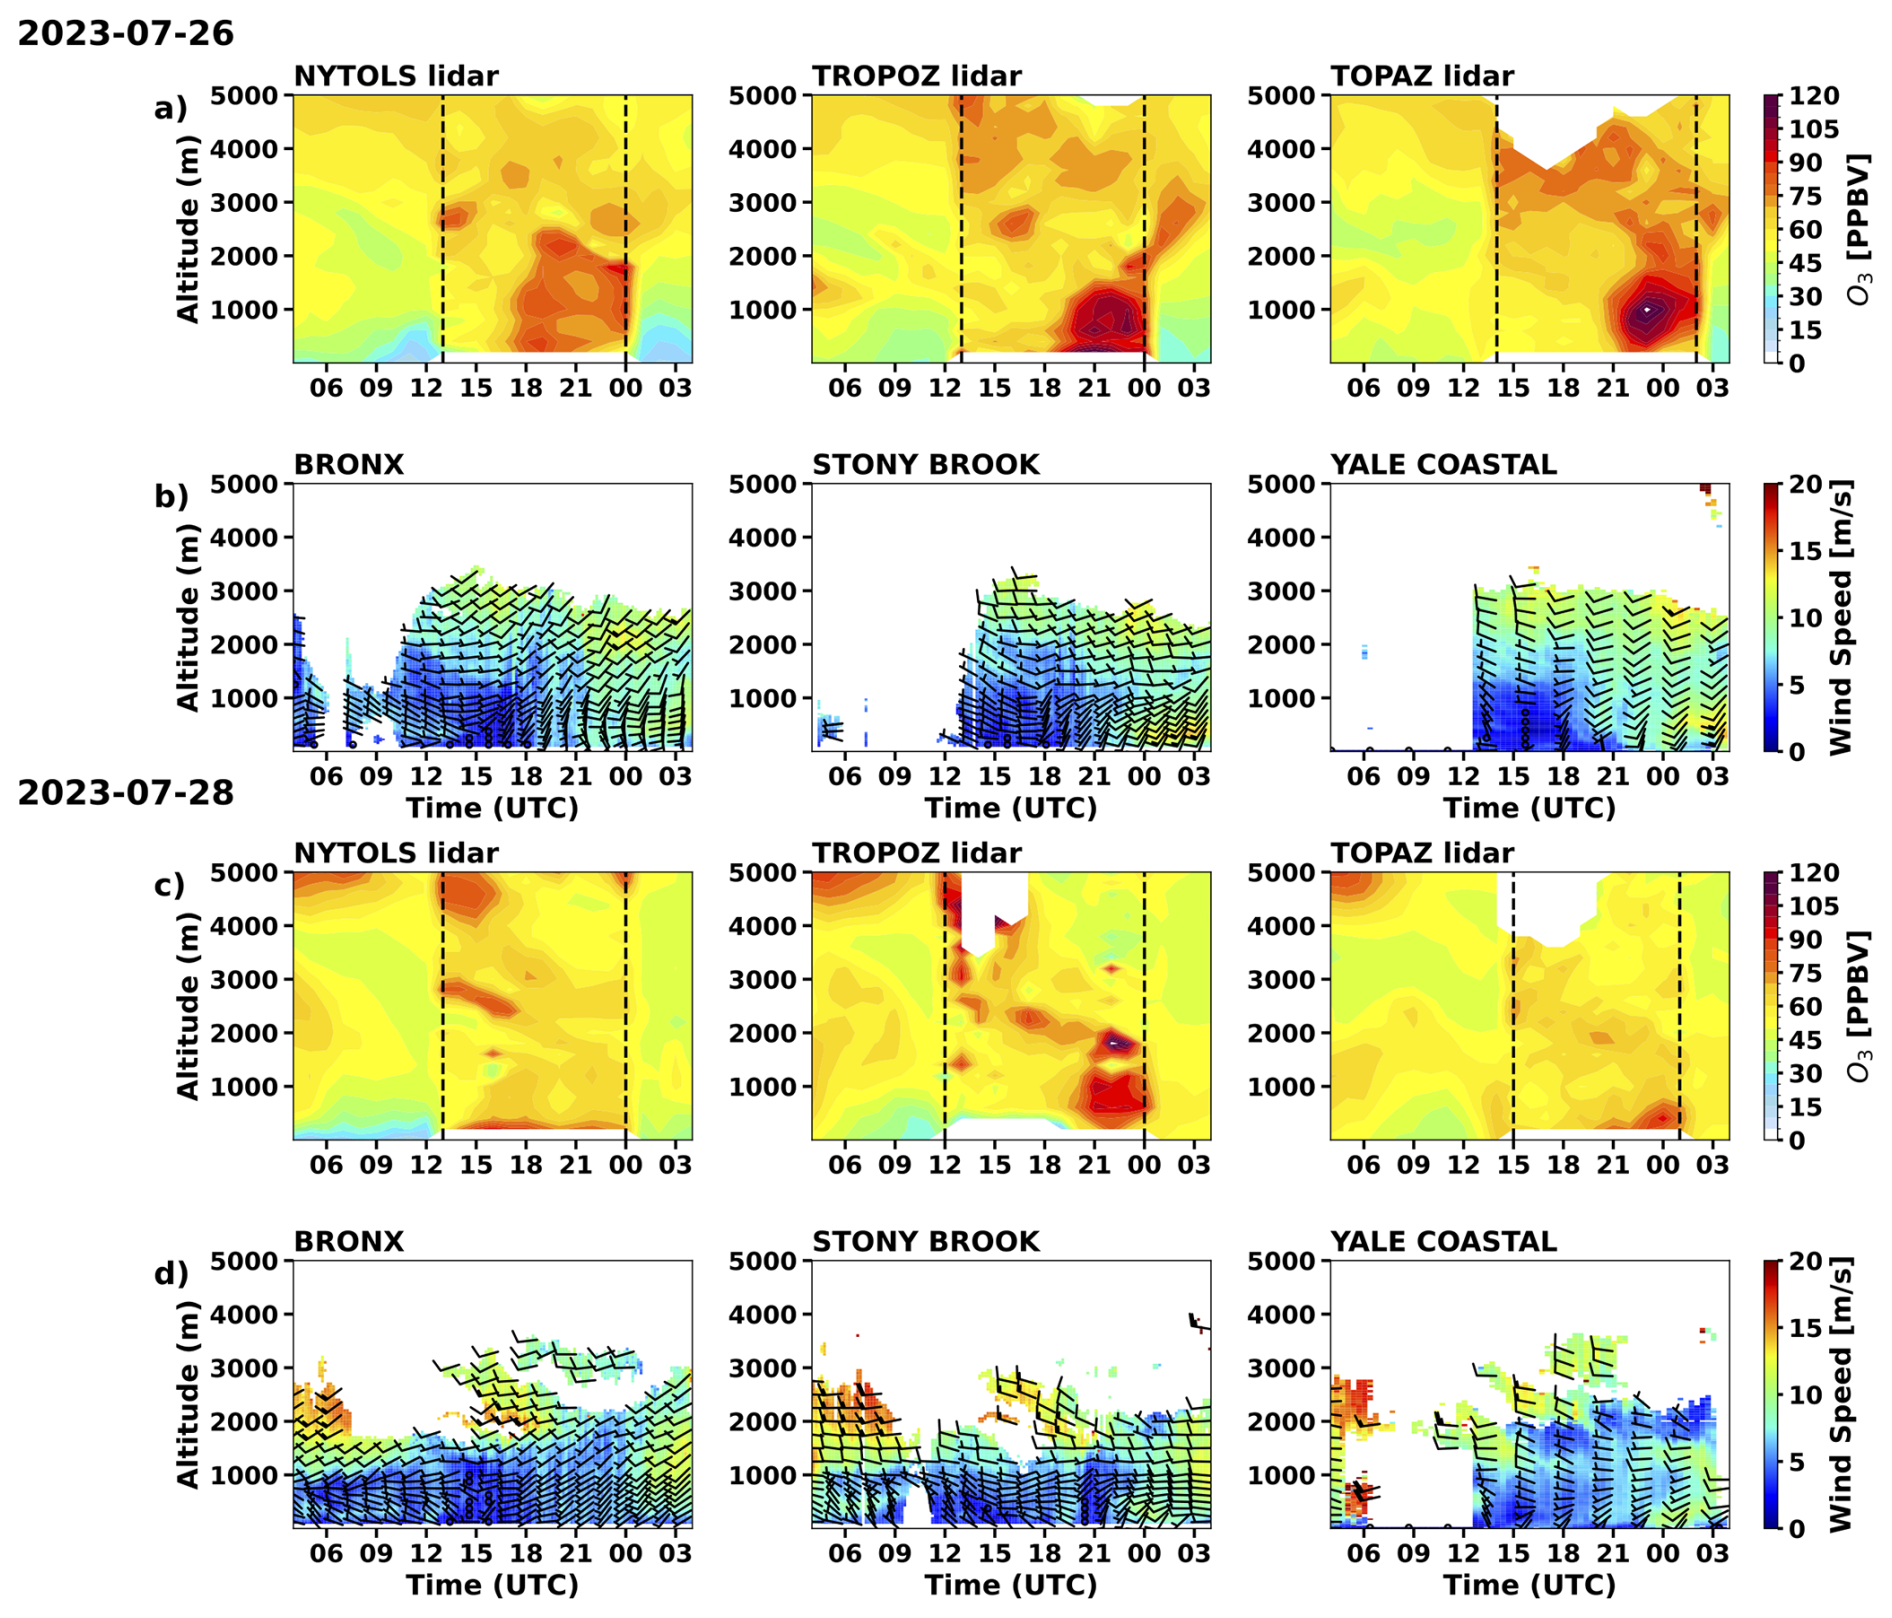
Figure 6TOLNet lidar multidimensional O3 (ppb) observations (outlined in black dotted lines) with WRF-Chem model simulated spatiotemporal O3 filling missing data (a, c) and Doppler lidar (b, d) multidimensional wind profiles (m s−1) observations at sites around NYC/LIS on 26 and 28 July 2023.
As TEMPO L2 data was not yet in available in July 2023, GCAS measurements were used to investigate the O3 precursor species development and potential O3 sensitivity regimes during the high pollution cases (Figs. 7, S9). On 26 July 2023, GCAS columns confirmed a dense NO2 plume over the urban NYC region during the late morning to early afternoon that aligns with the urban emission sources and corresponds to the highest NO2 columns observed during the campaign (Fig. 7a). This early morning growth of pollutants is not surprising as the urban core usually provides fresh anthropogenic NOx emissions, and the stagnant weather conditions were conducive to pollution accumulation. By late afternoon, high NO2 was still observed over NYC and the majority of western and central LI (Fig. 7a). At the same time, GCAS captures some HCHO enhancements over the LIS and along both coastlines, suggesting possible enhanced VOC contributions to the O3 photochemical production downwind/over water in a potentially more NOx-limited region (VOC-rich) (Figs. 7c, S9a). This pattern is consistent with a fresh urban NO2 plume undergoing photochemical processing as it is advected over the LIS and coincides with the transport event that led to the O3 exceedances established with the surface and lidar measurements. On 28 July 2023, the morning NO2 signal over the urban core is particularly weaker than 26 July 2023 (Fig. 7b). By mid-late afternoon, high column ratios (FNRs) dominate the LIS and coastal sites, coinciding with the high HCHO levels (Fig. S9b). Previous satellite studies over coastal regions, such as the Lake Michigan area, show that O3 exceedance conditions are often associated with simultaneous increases in NO2, HCHO, as well as the derived column ratio (Acdan et al., 2023). In this case, the temporal evolution is consistent with elevated HCHO and FNRs on 28 July 2023, broadly characterizing a VOC-rich environment later in the day, occurring after the initial coastal O3 exceedances. This is consistent with the entrainment-driven enhancement earlier in the day, followed by subsequent VOC-sensitive chemistry potentially contributing to the persistence of elevated coastal O3.
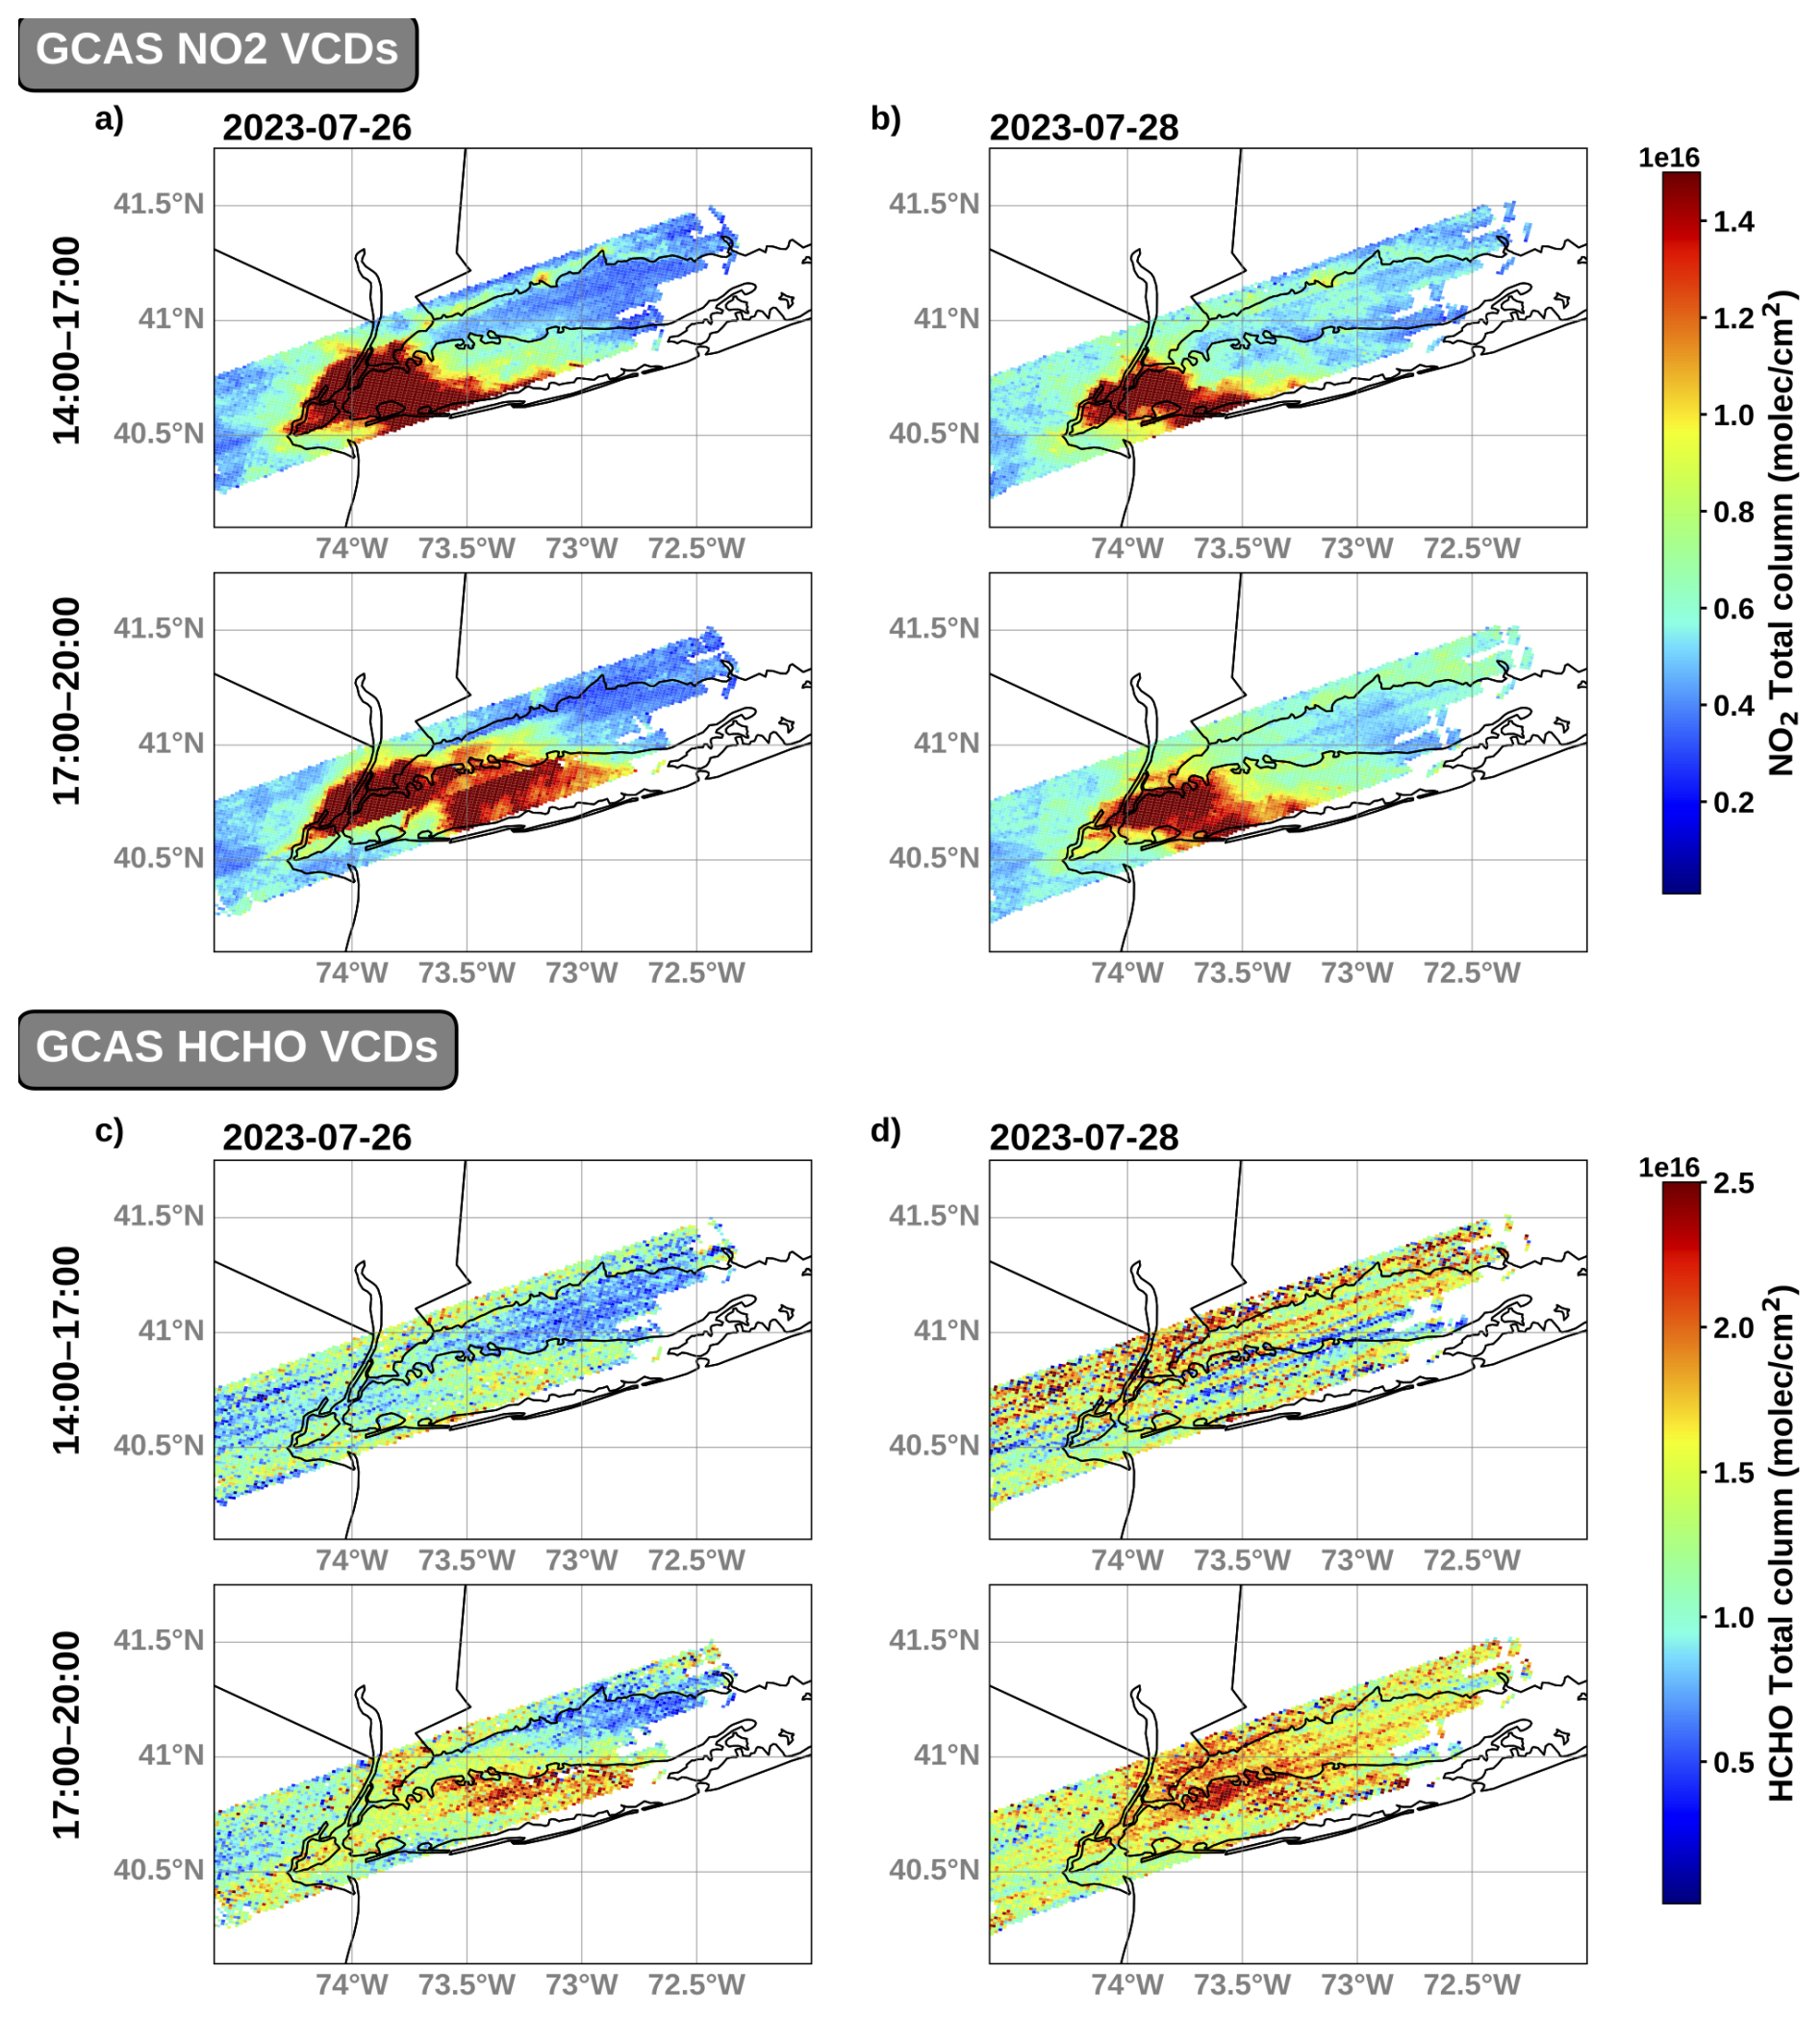
Figure 7GCAS 3 h averaged (14:00–17:00 and 17:00–22:00 UTC) NO2 and HCHO VCDs (molec cm−2) on 26 and 28 July 2023.
The GCAS column measurements provide additional context for distinguishing two different types of coastal O3 cases where a NOx-dominated urban plume and sea breeze recirculation appear to have driven the 26 July 2023, event versus a more photochemically processed pollution regime on 28 July 2023, potentially influenced by residual pollution from prior days. FNR-based O3 sensitivity inferences are qualitative given known uncertainties in HCHO retrievals; conclusions reflect broad photochemical regime characterization rather than a quantitative sensitivity diagnosis. Had TEMPO (or GCAS) data been available on the evening of 27 July 2023, the hourly columns could have provided more insight into the late-day buildup of O3 aloft over the LIS, offering stronger evidence for the overnight residual layer and subsequent entrainment the next day. These high pollution cases represent two complex sea breeze events in which high spatiotemporal resolution measurements from TEMPO will be essential in future investigations providing valuable insight into the evolution and transport of pollution that might not be resolved with surface monitors.
3.3.2 Moderate pollution cases (5–6 and 11–12 August 2023)
The conditions for the moderate pollution days resulted in unique, localized O3 exceedances, defined here as brief hourly concentrations exceeding 70 ppb (not considered regulatory exceedances events based on the maximum 8 h O3 average). Among the cases, 6 and 12 August 2023, exhibited similar O3 patterns, so the remaining focus will be on 11 and 12 August 2023, where lidar and satellite observations provide deeper insight into transport and precursor species variability. The 5 August 2023, case is revisited in Sect. 3.3.1., while detailed analysis of O3 and wind behavior on the 5 and 6 August 2023 cases are summarized in the Supplement (Sect. S1, Figs. S11, S12).
On average, observed surface O3 concentrations on 11 and 12 August 2023 were moderate but with a few localized hotspots (Figs. 8, S6e, f). On 11 August 2023, elevated O3 (>70 ppb) persisted in the afternoon for several hours in AQS observations along the CT coast, with steady W/SW winds (Fig. S7e) driving O3 increases at the eastern end of the LIS. On 12 August 2023, surface O3 reached a daily maximum (78 ppb) north of NYC shortly after peaking in the urban core of the city following a wind shift (E to S), with concurrent moderate levels of O3 accumulating along the CT coast (Fig. S6f). Strong winds on this day transported polluted air far inland and north of the city (Fig. S7f), a pattern typical of downwind transport from major urban centers and often associated with localized hourly O3 enhancements.
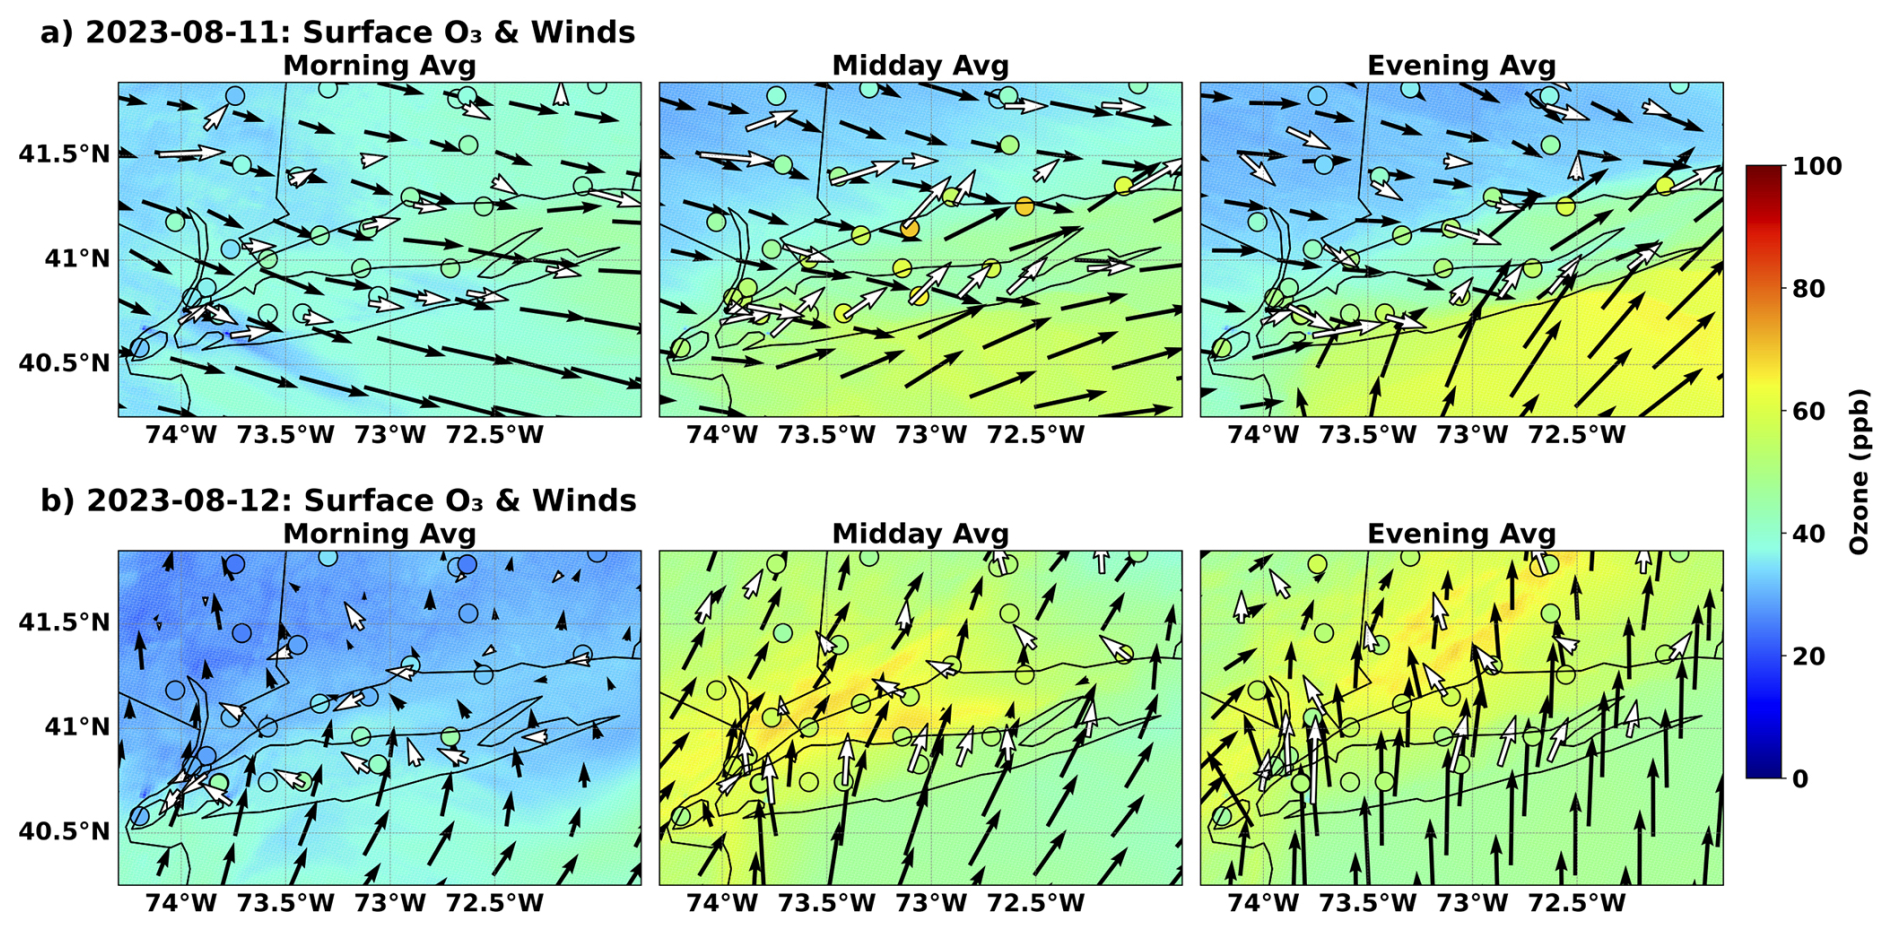
Figure 8Morning, midday, and evening averaged AQS O3observations (scatter points) and ASOS winds (white arrows), overlaid with WRF-Chem simulated O3(contours) and winds (black arrows) for 11 August (a) and 12 August 2023 (b). Morning averages correspond to 11:00–15:00 UTC, midday to 15:00–19:00 UTC, and evening to 19:00–00:00 UTC.
On 11 August , the highest observed surface O3 along the CT coast was captured first by the LMOL lidar and shortly thereafter by the TOPAZ system (Fig. 9a), consistent with the elevated O3 measured at the nearby surface AQS sites. At the Yale Coastal site, Doppler lidar observations show weak westerly winds in the morning that strengthened and shifted slightly southwesterly by midday near the surface (Fig. 9b), a flow pattern consistent with alongshore transport and enhanced downwind influence along the CT coastline. This wind evolution coincides with the higher near-surface O3 concentrations observed by the O3 lidars located on the CT coast of the LIS (LMOL and TOPAZ). In contrast, winds at Stony Brook were more northwesterly, indicating that the site was influenced by a different air mass than the CT coastal sites, which likely limited accumulations and is consistent with the relatively lower concentrations observed at that site. Consistently, the TROPOZ lidar at the same location detected elevated O3 in the lower PBL that remained decoupled from the surface. Together, the co-located lidar observations on 11 August 2023, highlight the sharp mesoscale differences that can occur across the LIS where NY north shore experienced lower pollution and the CT coastline sustained hourly O3 concentrations exceeding 70 ppb for multiple hours, though these do not constitute regulatory exceedances based on the MDA8 standard.
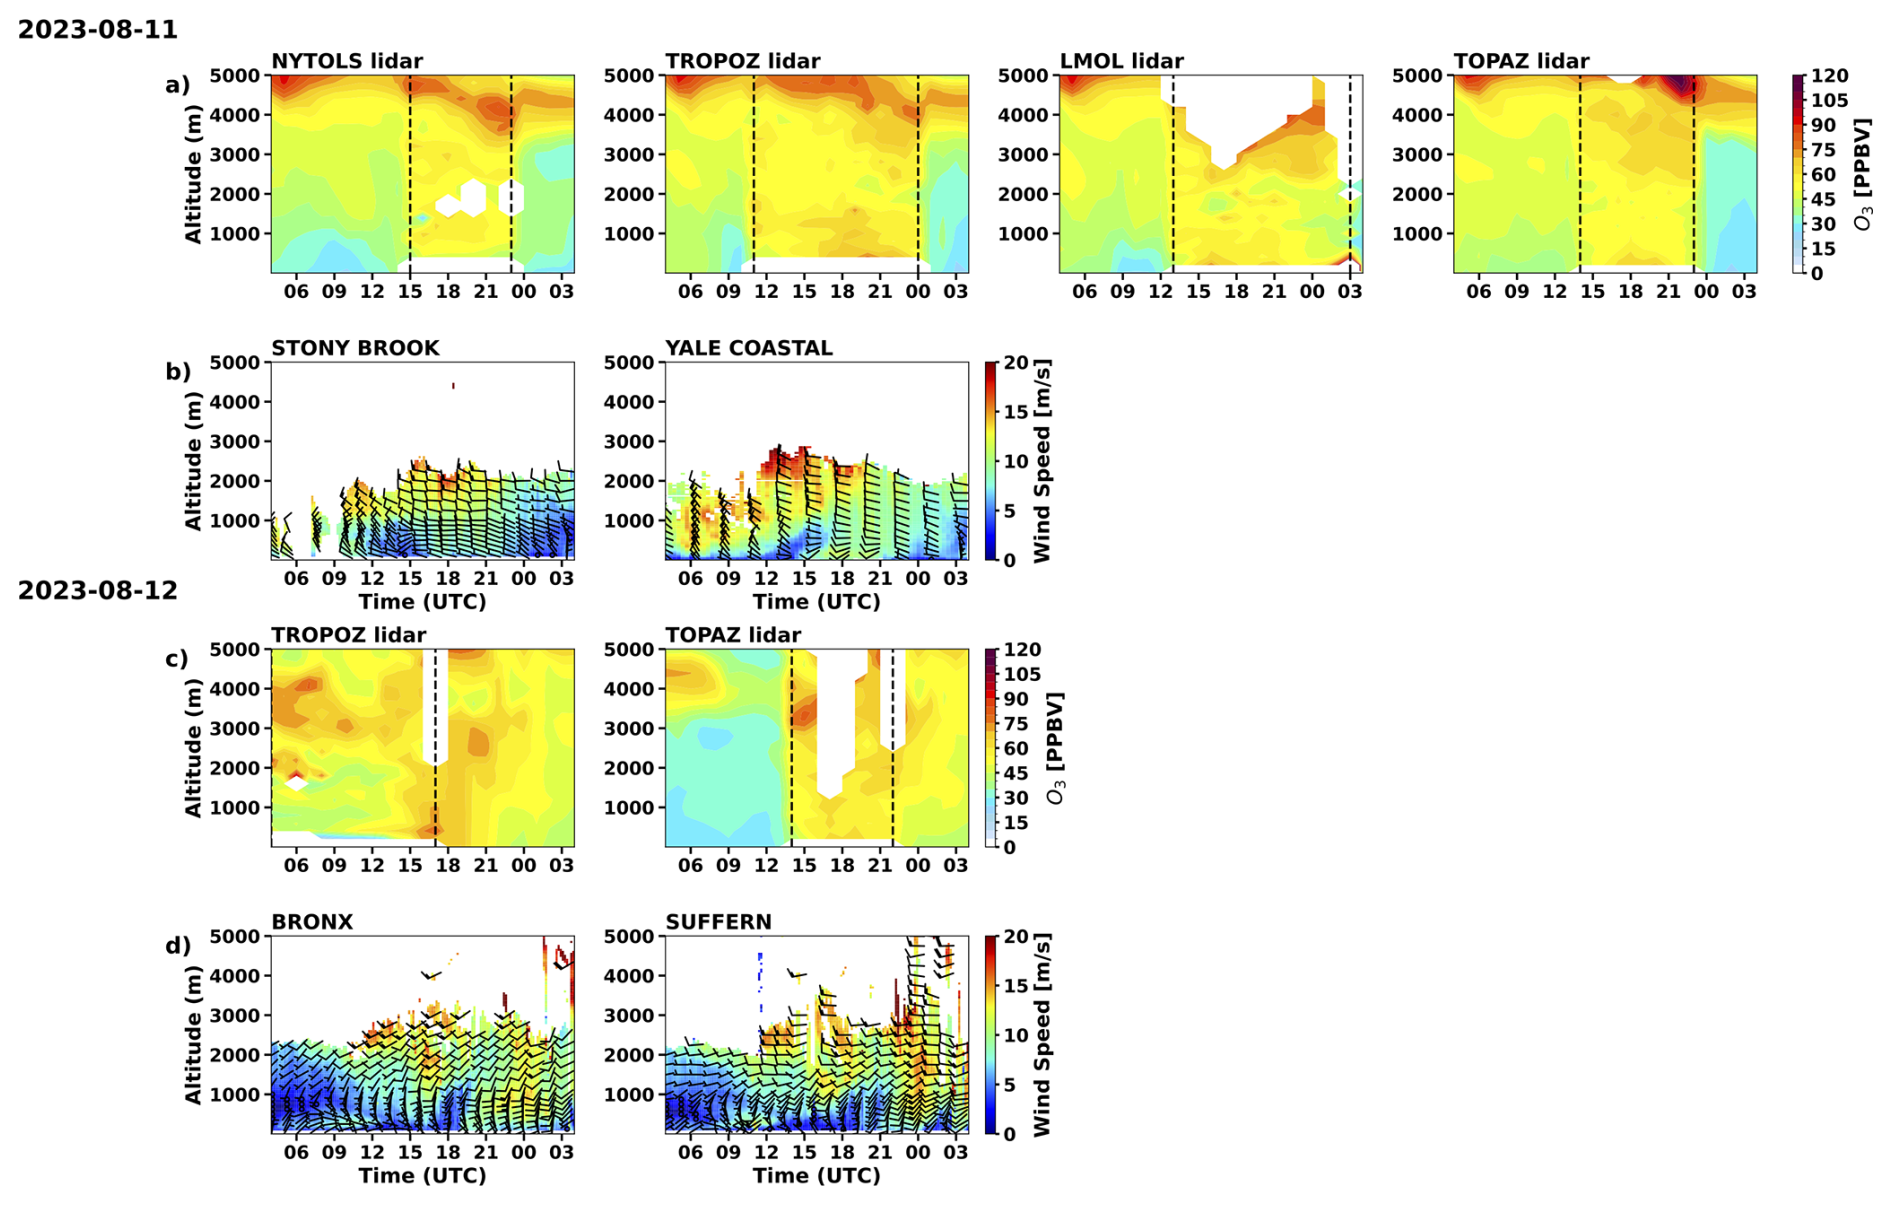
Figure 9TOLNet lidar multidimensional O3 (ppb) observations (outlined in black dotted lines) with WRF-Chem model simulated spatiotemporal O3 filling missing data (a, c) and Doppler lidar (b, d) multidimensional wind profiles (m s−1) observations at sites around NYC/LIS on 11 and 12 August 2023.
On 12 August 2023, moderate O3 levels (∼65 ppb) were observed along the CT coast by surface measurements and captured by the TOPAZ lidar (Fig. 9c). Near the urban region (Bronx), winds shifted from early morning easterlies to southerlies by evening, throughout ∼1 km (Fig. 9d), while at Suffern, near-surface winds were stagnant, coinciding with the evening localized hourly O3 enhancement (78 ppb) at the correspondent AQS site north of NYC. The CT coastline experienced easterly flow (Fig. 8b), resulting in a mesoscale convergence zone that contributed to the moderate O3 along the CT coast. Near-surface O3 evolution in downtown NYC could not be confirmed due to the unavailability of the NYTOLS lidar.
TEMPO observations on 11 August 2023, show early-day NO2 enhancements over the NYC urban areas and the southern LI coast, consistent with precursor accumulation in the source region (Fig. 10a). Later in the day, enhanced NO2 persisted, followed by elevated HCHO over LI, suggesting possible photochemical processing and a potential transition toward a more VOC-rich chemical environment (Fig. S10a). The column measurements provide a spatially resolved picture of the precursor development and transport that complement the surface and lidar observations and help link upwind emission sources to the downwind O3 response along the CT coastline that lasted many hours (Fig. 8a). The TEMPO observations on 12 August 2023, show similar patterns. High NO2 was observed midday north of the NYC urban source region, urban region near the NJ/NY border, and west of the Hudson River. By the afternoon/evening, a slight NO2 enhancement was observed just north of the CT coastline reaching the Yale Coastal location (TOPAZ lidar location). Higher HCHO is observed in the region in the morning hours (Fig. 10d) but NO2 appears to dominate the chemical environment with a possible shift toward more VOC-rich conditions taking over by the evening hours (Fig. S10b). Given the known uncertainties in HCHO retrievals, these FNR-based regime inferences are treated as qualitative and spatially illustrative rather than as a definitive sensitivity diagnosis. The FNRs for these two moderate days nonetheless highlight the strong spatiotemporal variability of the chemical environment over the NYC/LIS region. These cases highlight the value TEMPO adds to interpreting the dynamics of pollution evolution, insight that cannot be captured by surface monitors alone. Future investigation of this variability using the hourly TEMPO observation will be particularly valuable to better resolve the evolution of precursor buildup and daily photochemical transitions.
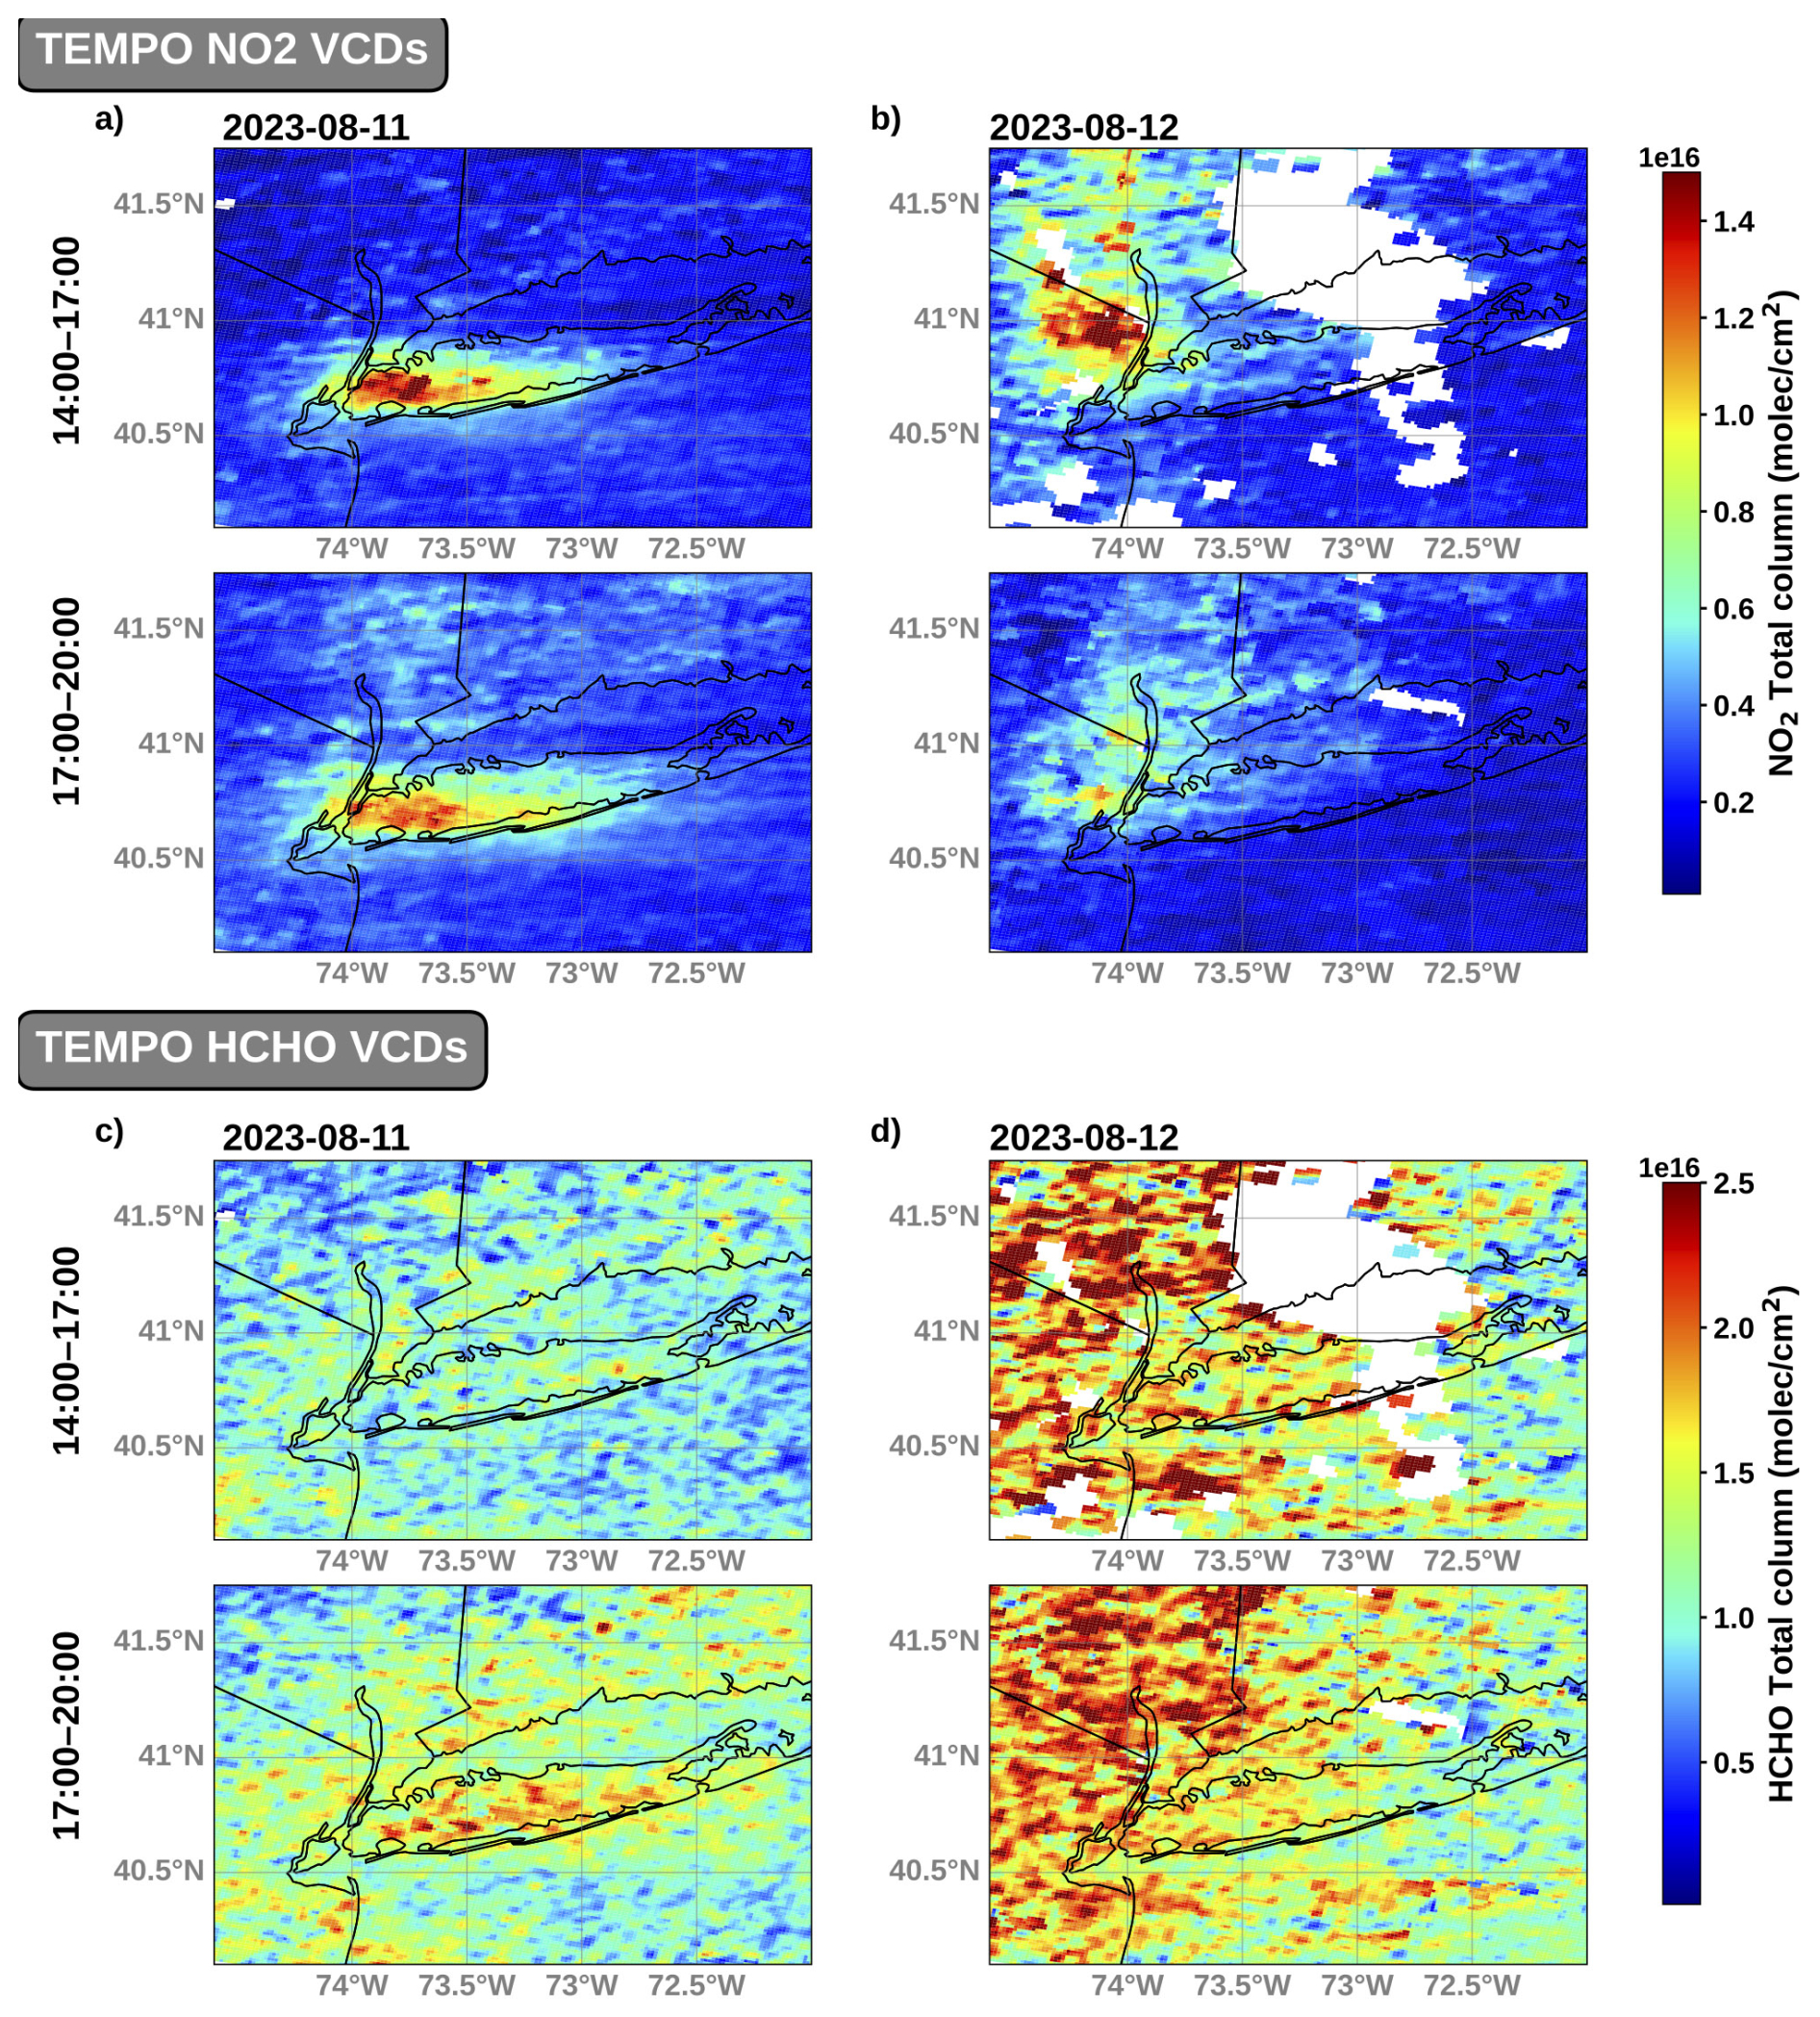
Figure 10TEMPO 3 h averaged (14:00–17:00 and 17:00–22:00 UTC) NO2 and HCHO VCDs (molec cm−2) on 11 and 12 August 2023.
3.3.3 Cross-comparison of moderate and low pollution cases (5 and 9 August 2023)
With the additional moderate pollution and low pollution cases further summarized in the Supplement (Sects. S1, S2 and Figs. S11–S14), the focus of this section is specifically on two moderate and low pollution representative cases – 5 August (moderate) and 9 August (low) 2023, for which concurrent GCAS and TEMPO observations are available.
In comparison with the high and other moderate pollution cases in the previous sections (Figs. 7, 10), both GCAS and TEMPO notably indicate much lower NO2 and HCHO enhancements near NYC and across the region on 5 and 9 August 2023 (Fig. 11). The notable higher dispersion of O3 precursor species in these columns suggest that even if emissions were high on this day, the meteorological and chemical conditions for these days did not allow for any major exceedances such as in the high pollution cases. This is particularly evident on the low pollution day, when strong winds associated with a cold front advected NOx out of the source region, preventing elevated localized O3 formation (Fig. 11b, d). For the moderate pollution case, there were two minor O3 events: first the localized hourly enhancement on Staten Island and second the moderate increase along the CT coast. The NO2 columns indicate high morning concentrations over Staten Island, Manhattan, and the western end of LI that are consistent with the emission buildup and upwind source of the O3 enhancement later in the day. As established in the Supplement, the moderate O3 increase along the CT coast was most likely not derived from the urban core source hence the low NO2 signal in the column retrievals. Low HCHO columns on these two case days are consistent with minimal VOC-driven photochemistry and suppressed O3 formation contrasting with the high and other moderate pollution days (Fig. 11e–h).
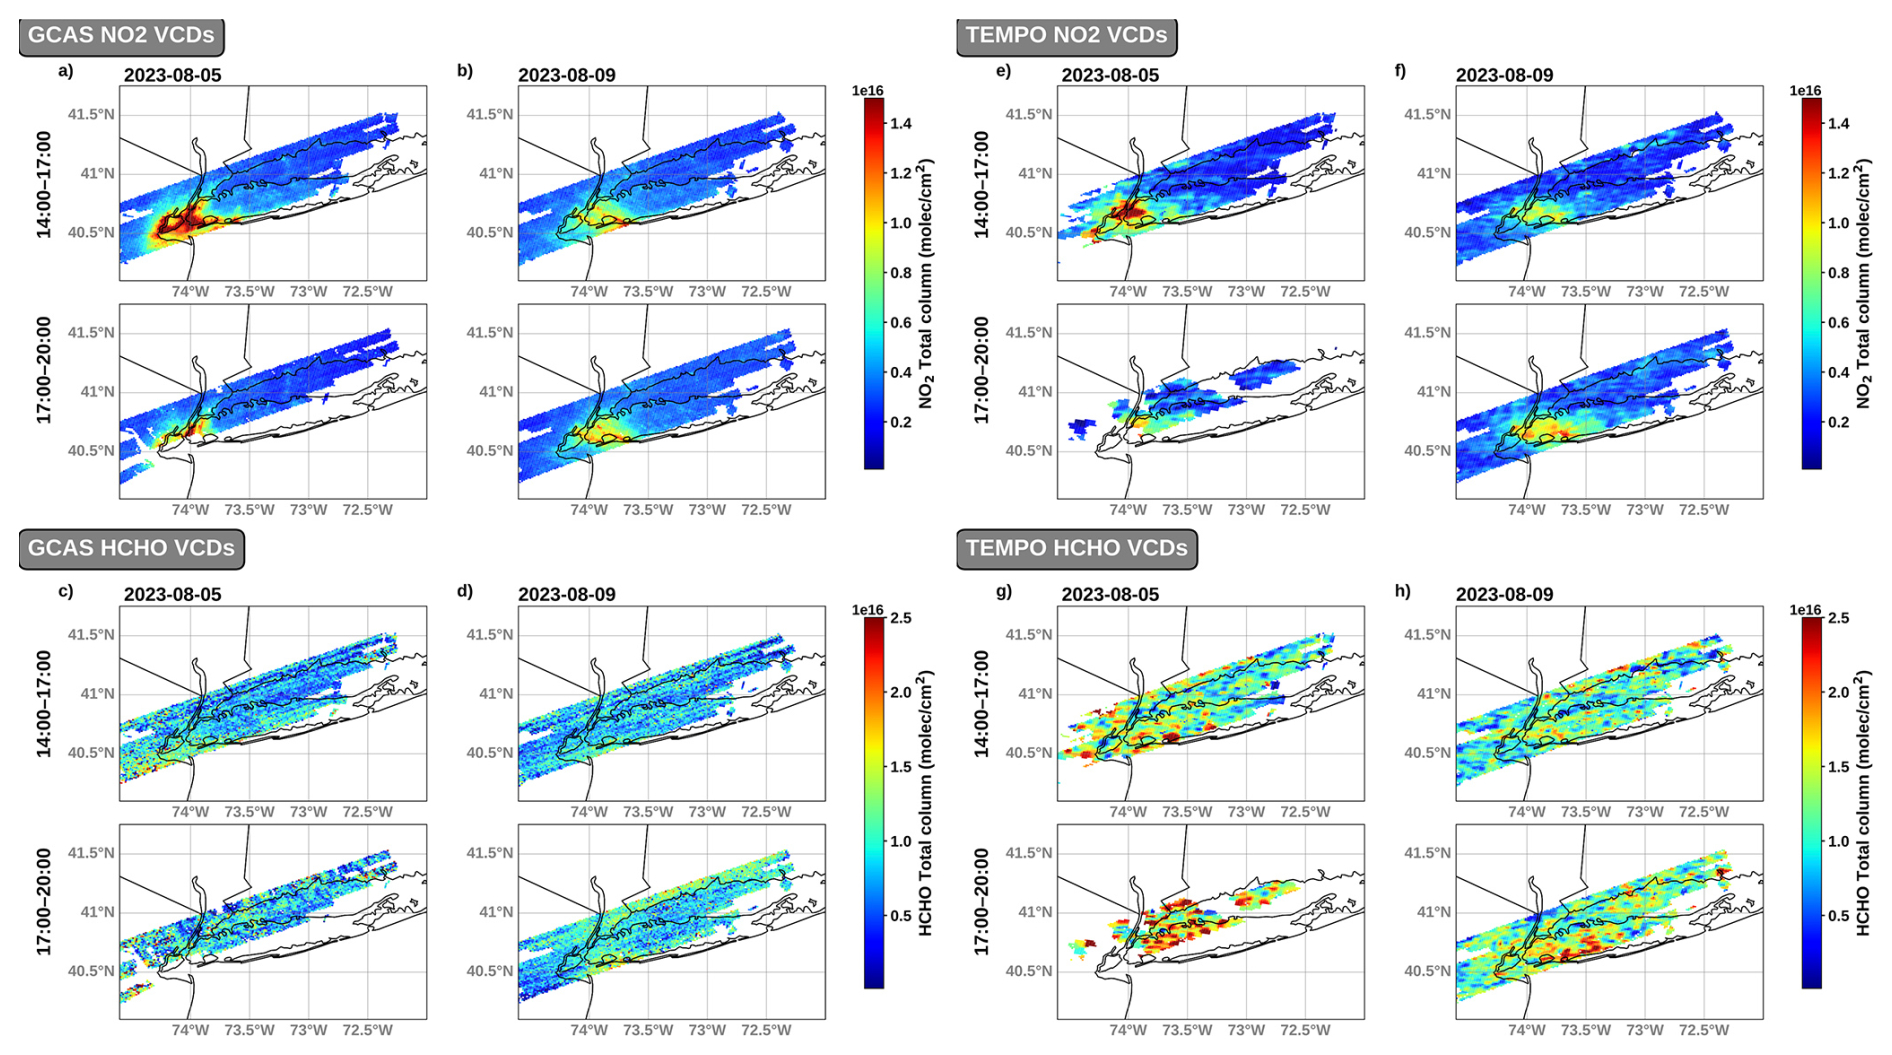
Figure 11NO2 GCAS (a, b) and TEMPO (e, f) and HCHO GCAS (c, d) and TEMPO (g, h) 3 h averaged (14:00–17:00 and 17:00–22:00 UTC) VCDs (molec cm−2) on 5 and 9 August 2023.
The availability of both GCAS and TEMPO on these two case days provides a multi-platform perspective on pollution and precursor variability under varying chemical and meteorological regimes. Generally, TEMPO and GCAS capture similar spatiotemporal patterns, though with some differences (Fig. 11). On the moderate pollution day, GCAS observed higher NO2 over the urban core, particularly Staten Island and western LI, preceding the afternoon elevated O3. TEMPO observed the same spatial pattern but with lower column magnitudes, consistent with Sect. 3.1.2. findings. Both TEMPO and GCAS FNRs suggest urban-to-suburban transitions, though given HCHO retrieval uncertainties these ratio-based patterns are treated as qualitative and spatially illustrative only, TEMPO shows a noisier spatial pattern due to HCHO retrieval noise and slightly higher ratios in regions where GCAS observes more NOx-saturated regimes (Fig. S11). Overall, TEMPO appears to better capture both magnitude and temporal variability on the low pollution day, however, with only two flight days available, this result represents a preliminary inference and a more systematic evaluation across additional cases is needed before drawing broader conclusions about regime-dependent TEMPO retrieval performance.
NASA's TEMPO mission, with its unprecedented hourly geostationary observations of atmospheric composition over North America, offers new opportunities to investigate air quality from urban to regional scales. In coordination with the launch, the summer 2023 STAQS campaign delivered a set of airborne, surface, and ground-based measurements across the NYC/LIS region serving as a foundation for validating TEMPO trace gas retrievals (NO2 and HCHO) and advancing the broader understanding of air quality in one of the most complex coastal urban environments in the United States. Leveraging these datasets, we evaluated TEMPO trace gas retrievals using Pandora and GCAS measurements across the NYC/LIS region. We employed a synergistic, multi-platform framework combining the in-situ measurements, ground-based and airborne remote sensing, and TEMPO v3 satellite retrievals during the campaign with a high-resolution (1.33 km × 1.33 km) WRF-Chem simulation. This approach allowed us to characterize regional pollution variability during the STAQS campaign period by capturing the evolution of O3 and its precursors under a wide range of meteorological and chemical conditions.
The validation efforts during this study suggest TEMPO NO2 column retrievals generally capture broad spatial patterns and magnitudes across the NYC/LIS region in comparison with Pandora and GCAS observations, with relatively best performance over the urban core and reduced accuracy in urban–suburban transition and coastal zones. The limitations are due to multiple potential factors such as the steep gradients along transitional urban/suburban and coastal interfaces, low background concentrations outside of the urban region, surface albedo contrasts between land and water and reflectivity errors, and the a priori profile resolution, highlighting the importance of subgrid sensitivity even at high satellite resolution (Judd et al., 2020). TEMPO HCHO retrievals exhibit weaker correlations and moderate biases, reflecting the greater challenges associated with HCHO retrievals. Unlike validation studies that typically rely on multi-day or monthly averages to reduce retrieval noise, the HCHO comparisons here use hourly TEMPO snapshots; results should therefore be interpreted as an illustration of single-overpass retrieval behavior under campaign sampling conditions rather than a systematic characterization of HCHO retrieval performance. Despite these limitations, TEMPO shows capabilities in resolving spatial and temporal pollution gradients, consistent with recent studies demonstrating its value for near-surface air quality applications (Acker et al., 2025) and supporting improved O3 forecasting and targeted mitigation in heterogeneous environments.
After establishing the performance of the TEMPO column retrievals and the high resolution model simulation, we used these products as tools alongside surface observations to identify and analyze three distinct pollution regimes during the campaign: (1) high pollution days, when stagnant summer conditions and early-morning precursor accumulation and sea breeze events which led to O3 exceedances; (2) moderate pollution days, characterized by localized O3 enhancements under transitional synoptic patterns; and (3) low pollution days, during which frontal passages enhanced dispersion and limited precursor buildup and O3 formation. Integrating the TOLNet O3 lidar and Doppler wind lidar profiles provided additional spatiotemporal context for these diverse chemical conditions, while TEMPO and GCAS observations enabled detailed examination of localized NO2 and HCHO variability and its influence on O3 chemistry across each pollution regime. The July high pollution cases illustrate how similar sea breeze patterns can produce very different O3 outcomes depending on the vertical structure of pollutants and precursor availability. In the first case, the TOLNet O3 and Doppler wind lidars and GCAS observations revealed a well-mixed BL and a deeper sea breeze circulation that recirculated a rich, late morning NO2 plume from the NYC urban core over the LIS, producing strong downwind O3 enhancements along both coastlines. In contrast, the second case showed minimal early NO2 influences from the urban core. Instead, the lidar and GCAS observations, together with WRF-Chem simulated overnight structure, suggest that a more aged, O3-rich residual layer plume may have persisted overnight and potentially contributed to elevated PBL and surface O3 concentrations, however, direct overnight observations are unavailable and coastal convergence and recirculation represent a plausible alternative or complementary pathway. The moderate pollution cases in August highlighted sharp mesoscale differences within the NYC/LIS region, consistent with previous studies (e.g., Zhang et al., 2022; Tzortziou et al., 2023). Lidar and TEMPO observations are consistent with upwind NO2 emissions and HCHO production contributing to downwind O3 responses along the CT coast and north of NYC. Low pollution cases in August highlight how meteorology regulates precursor concentrations controlling the photochemical O3 production on these case days. Cross-comparison of multi-platform observations (TEMPO and GCAS) allowed us to evaluate TEMPO retrieval performance under moderate and low pollution regimes. Based on the available two-day GCAS dataset, TEMPO appears to better capture O3 precursor species variability under cleaner conditions, while at the urban-suburban transition zones in the more complex moderate pollution case the performance appears more limited; however, this represents a preliminary inference from a limited sample and should be confirmed with more extensive observations.
Overall, the TEMPO and GCAS measurements used in this analysis provide new insight into complex coastal O3 precursor species dynamics and demonstrate the value of integrating satellite, airborne, and surface observations to diagnose pollution evolution in heterogeneous environments. A key limitation of this study pertains to the sparse availability of many instrument's datasets included in the analysis. Pandora and GCAS retrievals, while essential to validation, have their own uncertainties and biases independent of the intercomparison with TEMPO. Furthermore, the observations have limited spatiotemporal coverage resulting in minimal numbers of coincident points between TEMPO and GCAS/PANDORA which may introduce a sampling bias. GCAS only flew for two specific days during the STAQS campaign and Pandora data have limited spatial coverage. The synergistic multi-platform framework requires temporal and spatial averaging which is necessary to achieve consistency across datasets but for shorter lived species such as NO2, this approach may smooth sharp gradients and introduce additional uncertainty in column comparisons. Despite these constraints, the consistency in spatial patterns, column to surface relationships, and regime-dependent precursor variability across the datasets lends confidence to the robustness of the identified pollution cases. Beyond validation, these results advance the understanding of how O3 pollution evolves in a multifaceted urban-coastal environment under different meteorological and chemical conditions. This analysis suggests that similar mesoscale transport mechanisms can result in distinct surface O3 cases depending on recirculation, the vertical distribution of pollutants, and chemically favorable conditions, underscoring the critical role of a multi-dimensional perspective in regulating localized hourly O3 enhancements. The regime-based framework further emphasizes how TEMPO performance may be dependent on atmospheric conditions and how this context should be considered when interpreting geostationary observations. Together, these findings highlight the value of geostationary sensors, and in this case unique high-spatiotemporal column measurements, alongside high-resolution in situ and remote sensing observations for resolving multi-dimensional pollution structure and improving our understanding of photochemical evolution and pollutant transport beyond what surface monitoring networks alone can capture, particularly within a chemically evolving complex coastal environment (Tao et al., 2022). Future work will benefit from the evaluation of updated TEMPO retrieval versions, including improvements in surface albedo treatment, and from further assessment of TEMPO O3 profile retrievals across sharp urban-coastal gradients to refine interpretation of O3 vertical structure and its relationship with surface pollution and mitigate O3 episodes.
Python scripts used to reprocess TEMPO data, generate composites of TEMPO data as well as the reprocessed TEMPO composite data files we created in netCDF format are available upon request (send correspondence to Claudia M. Bernier: claudia.m.bernier@nasa.gov). TEMPO NO2 and HCHO data were downloaded from the NASA Goddard Earth Sciences Data website: https://search.earthdata.nasa.gov (last access: 21 November 2024). The reprocessed TEMPO NO2 and HCHO data can be downloaded from https://websitewithdata (last access: 4 November 2024). Ground-based AQS surface O3 and NO2 monitor data can be downloaded from the U.S. EPA Air Data website: https://www.epa.gov/outdoor-air-quality-data (U.S. EPA, 2022). Ground-based ASOS surface wind monitor data can be downloaded from the NCEI NOAA Integrated Surface Dataset website: https://www.ncei.noaa.gov/access/search/data-search/global-hourly (last access: 9 October 2024). Pandora monitor data can be downloaded from the Pandonia Global Network website: https://data.hetzner.pandonia-global-network.org (last access: 9 October 2024). TOLNet data were downloaded from https://tolnet.larc.nasa.gov/download (last access: 30 August 2024). Wind doppler lidar data were downloaded from the New York State (NYS) Mesonet sites https://nysmesonet.org/networks/profiler (last access: 5 June 2025)., as well as from NOAA CSL website https://csl.noaa.gov/ (last access: 5 June 2025).
The supplement related to this article is available online at https://doi.org/10.5194/acp-26-13795-2026-supplement.
CMB and MSJ designed the experiments, and CMB carried them out. CMB developed the model code and performed the simulations and evaluations. CMB prepared the manuscript with contributions from all co-authors. JS, GG, FM, and RA provided the processed TOLNet O3 lidar datasets. LJ provided the processed GCAS datasets.
The contact author has declared that none of the authors has any competing interests.
Publisher's note: Copernicus Publications remains neutral with regard to jurisdictional claims made in the text, published maps, institutional affiliations, or any other geographical representation in this paper. The authors bear the ultimate responsibility for providing appropriate place names. Views expressed in the text are those of the authors and do not necessarily reflect the views of the publisher.
We acknowledge the individuals and groups who collected and shared the AGES+ 2023 field campaign datasets.
This research has been supported by the Oak Ridge Associated Universities (grant no. NASA Postdoctoral Program).
This paper was edited by Jason West and reviewed by two anonymous referees.
Acdan, J. J. M., Pierce, R. B., Dickens, A. F., Adelman, Z., and Nergui, T.: Examining TROPOMI formaldehyde to nitrogen dioxide ratios in the Lake Michigan region: implications for ozone exceedances, Atmos. Chem. Phys., 23, 7867–7885, https://doi.org/10.5194/acp-23-7867-2023, 2023.
Acker, S., Holloway, T., and Harkey, M.: Satellite detection of NO2 distributions using TROPOMI and TEMPO and comparison with ground-based concentration measurements, Atmos. Chem. Phys., 25, 8271–8288, https://doi.org/10.5194/acp-25-8271-2025, 2025.
ASDC|TOLNet_CSL_Data_1: Atmospheric Science Data Center (ASDC), TOLNet CSL Data, https://doi.org/10.5067/Lidar/Ozone/TOLNet/NOAA-CSL, 2025.
Banta, R. M., Senff, C. J., Nielsen-Gammon, J., Darby, L. S., Ryerson, T. B., Alvarez, R. J., Sandberg, S. P., Williams, E. J., and Trainer, M.: A Bad Air Day in Houston, B. Am. Meteorol. Soc., 86, 657–670, https://doi.org/10.1175/BAMS-86-5-657, 2005.
Barth, M. C., Lee, J., Hodzic, A., Pfister, G., Skamarock, W. C., Worden, J., Wong, J., and Noone, D.: Thunderstorms and upper troposphere chemistry during the early stages of the 2006 North American Monsoon, Atmos. Chem. Phys., 12, 11003–11026, https://doi.org/10.5194/acp-12-11003-2012, 2012.
Berkoff, T. A., Gronoff, G. P., Phoenix, D. B., Carrion, W., and Knepp, T. N.: Overview and Status of the NASA Langley Mobile Ozone Lidar, J. Atmos. Ocean. Tech., https://doi.org/10.1175/JTECH-D-25-0029.1, 2025.
Bernier, C., Wang, Y., Gronoff, G., Berkoff, T., Knowland, K. E., Sullivan, J. T., Delgado, R., Caicedo, V., and Carroll, B.: Cluster-based characterization of multi-dimensional tropospheric ozone variability in coastal regions: an analysis of lidar measurements and model results, Atmos. Chem. Phys., 22, 15313–15331, https://doi.org/10.5194/acp-22-15313-2022, 2022.
Caicedo, V., Rappenglueck, B., Cuchiara, G., Flynn, J., Ferrare, R., Scarino, A. J., Berkoff, T., Senff, C., Langford, A., and Lefer, B.: Bay Breeze and Sea Breeze Circulation Impacts on the Planetary Boundary Layer and Air Quality From an Observed and Modeled DISCOVER-AQ Texas Case Study, J. Geophys. Res.-Atmos., 124, 7359–7378, https://doi.org/10.1029/2019JD030523, 2019.
Caicedo, V., Delgado, R., Luke, W. T., Ren, X., Kelley, P., Stratton, P. R., Dickerson, R. R., Berkoff, T. A., and Gronoff, G.: Observations of bay-breeze and ozone events over a marine site during the OWLETS-2 campaign, Atmos. Environ., 263, 118669, https://doi.org/10.1016/j.atmosenv.2021.118669, 2021.
Cede, A: Manual for Blick Software Suite 1.3, version 7, http://pandonia.net/media/documents/BlickSoftwareSuite_Manual_v7.pdf (last access: 26 March 2024), 2017.
Chance, K., Liu, X., Suleiman, R. M., Flittner, D. E., Al-Saadi, J., and Janz, S. J.: Tropospheric emissions: monitoring of pollution (TEMPO), in: Earth Observing Systems XVIII, Proc. SPIE, 8866, 88660D, https://doi.org/10.1117/12.2024479, 2013.
Chin, M., Rood, R. B., Lin, S.-J., Müller, J.-F., and Thompson, A. M.: Atmospheric sulfur cycle simulated in the global model GOCART: Model description and global properties, J. Geophys. Res., 105, 24671–24687, https://doi.org/10.1029/2000JD900384, 2000.
Cooper, M. J., Martin, R. V., Henze, D. K., and Jones, D. B. A.: Effects of a priori profile shape assumptions on comparisons between satellite NO2 columns and model simulations, Atmos. Chem. Phys., 20, 7231–7241, https://doi.org/10.5194/acp-20-7231-2020, 2020.
Darby, L. S.: Cluster Analysis of Surface Winds in Houston, Texas, and the Impact of Wind Patterns on Ozone, J. Appl. Meteorol. Climatol., 44, 1788–1806, https://doi.org/10.1175/JAM2320.1, 2005.
Dreessen, J., Orozco, D., Boyle, J., Szymborski, J., Lee, P., Flores, A., and Sakai, R. K.: Observed ozone over the Chesapeake Bay land-water interface: The Hart-Miller Island Pilot Project, J. Air Waste Manage. Assoc., 69, 1312–1330, https://doi.org/10.1080/10962247.2019.1668497, 2019.
Emmons, L. K., Walters, S., Hess, P. G., Lamarque, J.-F., Pfister, G. G., Fillmore, D., Granier, C., Guenther, A., Kinnison, D., Laepple, T., Orlando, J., Tie, X., Tyndall, G., Wiedinmyer, C., Baughcum, S. L., and Kloster, S.: Description and evaluation of the Model for Ozone and Related chemical Tracers, version 4 (MOZART-4), Geosci. Model Dev., 3, 43–67, https://doi.org/10.5194/gmd-3-43-2010, 2010.
Eskes, H. J. and Boersma, K. F.: Averaging kernels for DOAS total-column satellite retrievals, Atmos. Chem. Phys., 3, 1285–1291, https://doi.org/10.5194/acp-3-1285-2003, 2003.
Gettelman, A., Mills, M. J., Kinnison, D. E., Garcia, R. R., Smith, A. K., Marsh, D. R., Tilmes, S., Vitt, F., Bardeen, C. G., McInerny, J., Liu, H. L., Solomon, S. C., Polvani, L. M., Emmons, L. K., Lamarque, J. F., Richter, J. H., Glanville, A. S., Bacmeister, J. T., Phillips, A. S., Neale, R. B., Simpson, I. R., DuVivier, A. K., Hodzic, A., and Randel, W. J.: The Whole Atmosphere Community Climate Model Version 6 (WACCM6), J. Geophys. Res.-Atmos., 124, 12380–12403, https://doi.org/10.1029/2019JD030943, 2019.
Ghahremanloo, M., Nowlan, C., González Abad, G., Garraffo, C., Liu, X., Wang, H., Henderson, B., Baumann, E., Valin, L., Geddes, J. A., and Zhao, X.: Comprehensive Analysis of Bias in TEMPO NO2 Column Densities Through Pandora Observations, J. Geophys. Res.-Atmos., 130, e2025JD044150, https://doi.org/10.1029/2025JD044150, 2025.
Goldberg, D. L., Loughner, C. P., Tzortziou, M., Stehr, J. W., Pickering, K. E., Marufu, L. T., and Dickerson, R. R.: Higher surface ozone concentrations over the Chesapeake Bay than over the adjacent land: Observations and models from the DISCOVER-AQ and CBODAQ campaigns, Atmos. Environ., 84, 9–19, https://doi.org/10.1016/j.atmosenv.2013.11.008, 2014.
Grell, G. A., Peckham, S. E., Schmitz, R., McKeen, S. A., Frost, G., Skamarock, W. C., and Eder, B.: Fully coupled “online” chemistry within the WRF model, Atmos. Environ., 39, 6957–6975, https://doi.org/10.1016/j.atmosenv.2005.04.027, 2005.
Gronoff, G., Robinson, J., Berkoff, T., Swap, R., Farris, B., Schroeder, J., Halliday, H. S., Knepp, T., Spinei, E., Carrion, W., Adcock, E. E., Johns, Z., Allen, D., and Pippin, M.: A method for quantifying near range point source induced O3 titration events using Co-located Lidar and Pandora measurements, Atmos. Environ., 204, 43–52, https://doi.org/10.1016/j.atmosenv.2019.01.052, 2019.
Gronoff, G., Berkoff, T., Knowland, K. E., Lei, L., Shook, M., Fabbri, B., Carrion, W., and Langford, A. O.: Case study of stratospheric intrusion above Hampton, Virginia: Lidar-observation and modeling analysis, Atmos. Environ., 259, 118498, https://doi.org/10.1016/j.atmosenv.2021.118498, 2021.
Guenther, A. B., Jiang, X., Heald, C. L., Sakulyanontvittaya, T., Duhl, T., Emmons, L. K., and Wang, X.: The Model of Emissions of Gases and Aerosols from Nature version 2.1 (MEGAN2.1): an extended and updated framework for modeling biogenic emissions, Geosci. Model Dev., 5, 1471–1492, https://doi.org/10.5194/gmd-5-1471-2012, 2012.
Herman, J., Cede, A., Spinei, E., Mount, G., Tzortziou, M., and Abuhassan, N.: NO2 column amounts from ground-based Pandora and MFDOAS spectrometers using the direct-sun DOAS technique: Intercomparisons and application to OMI validation, J. Geophys. Res.-Atmos., 114, https://doi.org/10.1029/2009JD011848, 2009.
Hong, S.-Y.: A new stable boundary-layer mixing scheme and its impact on the simulated East Asian summer monsoon, Q. J. Roy. Meteorol. Soc., 136, 1481–1496, https://doi.org/10.1002/qj.665, 2010.
Iacono, M. J., Delamere, J. S., Mlawer, E. J., Shephard, M. W., Clough, S. A., and Collins, W. D.: Radiative forcing by long-lived greenhouse gases: Calculations with the AER radiative transfer models, J. Geophys. Res., 113, D13103, https://doi.org/10.1029/2008JD009944, 2008.
Johnson, M. S., Kuang, S., Wang, L., and Newchurch, M. J.: Evaluating Summer-Time Ozone Enhancement Events in the Southeast United States, Atmosphere, 7, 108, https://doi.org/10.3390/atmos7080108, 2016.
Johnson, M. S., Souri, A. H., Philip, S., Kumar, R., Naeger, A., Geddes, J., Judd, L., Janz, S., Chong, H., and Sullivan, J.: Satellite remote-sensing capability to assess tropospheric-column ratios of formaldehyde and nitrogen dioxide: case study during the Long Island Sound Tropospheric Ozone Study 2018 (LISTOS 2018) field campaign, Atmos. Meas. Tech., 16, 2431–2454, https://doi.org/10.5194/amt-16-2431-2023, 2023.
Judd, L. M., Al-Saadi, J. A., Janz, S. J., Kowalewski, M. G., Pierce, R. B., Szykman, J. J., Valin, L. C., Swap, R., Cede, A., Mueller, M., Tiefengraber, M., Abuhassan, N., and Williams, D.: Evaluating the impact of spatial resolution on tropospheric NO2 column comparisons within urban areas using high-resolution airborne data, Atmos. Meas. Tech., 12, 6091–6111, https://doi.org/10.5194/amt-12-6091-2019, 2019.
Judd, L. M., Al-Saadi, J. A., Szykman, J. J., Valin, L. C., Janz, S. J., Kowalewski, M. G., Eskes, H. J., Veefkind, J. P., Cede, A., Mueller, M., Gebetsberger, M., Swap, R., Pierce, R. B., Nowlan, C. R., Abad, G. G., Nehrir, A., and Williams, D.: Evaluating Sentinel-5P TROPOMI tropospheric NO2 column densities with airborne and Pandora spectrometers near New York City and Long Island Sound, Atmos. Meas. Tech., 13, 6113–6140, https://doi.org/10.5194/amt-13-6113-2020, 2020.
Kaser, L., Patton, E. G., Pfister, G. G., Weinheimer, A. J., Montzka, D. D., Flocke, F., Thompson, A. M., Stauffer, R. M., and Halliday, H. S.: The effect of entrainment through atmospheric boundary layer growth on observed and modeled surface ozone in the Colorado Front Range, J. Geophys. Res.-Atmos., 122, 6075–6093, https://doi.org/10.1002/2016JD026245, 2017.
Kim, S., Kim, D., Hong, H., Chang, L.-S., Lee, H., Kim, D.-R., Kim, D., Yu, J.-A., Lee, D., Jeong, U., Song, C.-K., Kim, S.-W., Park, S. S., Kim, J., Hanisco, T. F., Park, J., Choi, W., and Lee, K.: First-time comparison between NO2 vertical columns from Geostationary Environmental Monitoring Spectrometer (GEMS) and Pandora measurements, Atmos. Meas. Tech., 16, 3959–3972, https://doi.org/10.5194/amt-16-3959-2023, 2023.
Kotsakis, A., Sullivan, J. T., Hanisco, T. F., Swap, R. J., Caicedo, V., Berkoff, T. A., Gronoff, G., Loughner, C. P., Ren, X., Luke, W. T., Kelley, P., Stratton, P. R., Delgado, R., Abuhassan, N., Shalaby, L., Santos, F. C., and Dreessen, J.: Sensitivity of total column NO2 at a marine site within the Chesapeake Bay during OWLETS-2, Atmos. Environ., 277, 119063, https://doi.org/10.1016/j.atmosenv.2022.119063, 2022.
Kowalewski, M. G. and Janz, S. J.: Remote sensing capabilities of the GeoCAPE Airborne Simulator, in: Earth Observing Systems XIX, Earth Observing Systems XIX, 496–507, https://doi.org/10.1117/12.2062058, 2014.
Li, W., Wang, Y., Bernier, C., and Estes, M.: Identification of sea breeze recirculation and its effects on ozone in Houston, TX, during DISCOVER-AQ 2013, J. Geophys. Res.-Atmos., 125, e2020JD033165, https://doi.org/10.1029/2020JD033165, 2020.
Li, X. and Rappenglueck, B.: A study of model nighttime ozone bias in air quality modeling, Atmos. Environ., 195, 210–228, https://doi.org/10.1016/j.atmosenv.2018.09.046, 2018.
Loughner, C. P., Tzortziou, M., Follette-Cook, M., Pickering, K. E., Goldberg, D., Satam, C., Weinheimer, A., Crawford, J. H., Knapp, D. J., Montzka, D. D., Diskin, G. S., and Dickerson, R. R.: Impact of Bay-Breeze Circulations on Surface Air Quality and Boundary Layer Export, J. Appl. Meteorol. Climatol., 53, 1697–1713, https://doi.org/10.1175/JAMC-D-13-0323.1, 2014.
Luo, H. and Lu, C.-H.: Impacts of Local Circulations on Ozone Pollution in the New York Metropolitan Area: Evidence From Three Summers of Observations, J. Geophys. Res.-Atmos., 129, e2023JD039206, https://doi.org/10.1029/2023JD039206, 2024.
Ma, S. and Tong, D. Q.: Neighborhood Emission Mapping Operation (NEMO): A 1-km anthropogenic emission dataset in the United States, Sci. Data, 9, 680, https://doi.org/10.1038/s41597-022-01790-9, 2022.
Madronich, S.: Photodissociation in the atmosphere: 1. Actinic flux and the effects of ground reflections and clouds, J. Geophys. Res.-Atmos., 92, 9740–9752, https://doi.org/10.1029/JD092iD08p09740, 1987.
Martins, D. K., Stauffer, R. M., Thompson, A. M., Knepp, T. N., and Pippin, M.: Surface ozone at a coastal suburban site in 2009 and 2010: Relationships to chemical and meteorological processes, J. Geophys. Res.-Atmos., 117, https://doi.org/10.1029/2011JD016828, 2012.
Mazzuca, G. M., Pickering, K. E., New, D. A., Dreessen, J., and Dickerson, R. R.: Impact of bay breeze and thunderstorm circulations on surface ozone at a site along the Chesapeake Bay 2011–2016, Atmos. Environ., 198, 351–365, https://doi.org/10.1016/j.atmosenv.2018.10.068, 2019.
Miller, S. T. K., Keim, B. D., Talbot, R. W., and Mao, H.: Sea breeze: Structure, forecasting, and impacts, Rev. Geophys., 41, https://doi.org/10.1029/2003RG000124, 2003.
Monin, A. S. and Obukhov, A. M.: Basic laws of turbulent mixing in the surface layer of the atmosphere, Tr. Akad. Nauk SSSR Geofiz. Inst., 24, 163–187, 1954.
Nowlan, C. R., Liu, X., Leitch, J. W., Chance, K., González Abad, G., Liu, C., Zoogman, P., Cole, J., Delker, T., Good, W., Murcray, F., Ruppert, L., Soo, D., Follette-Cook, M. B., Janz, S. J., Kowalewski, M. G., Loughner, C. P., Pickering, K. E., Herman, J. R., Beaver, M. R., Long, R. W., Szykman, J. J., Judd, L. M., Kelley, P., Luke, W. T., Ren, X., and Al-Saadi, J. A.: Nitrogen dioxide observations from the Geostationary Trace gas and Aerosol Sensor Optimization (GeoTASO) airborne instrument: Retrieval algorithm and measurements during DISCOVER-AQ Texas 2013, Atmos. Meas. Tech., 9, 2647–2668, https://doi.org/10.5194/amt-9-2647-2016, 2016.
Niu, G.-Y., Yang, Z.-L., Mitchell, K. E., Chen, F., Ek, M. B., Barlage, M., Kumar, A., Manning, K., Niyogi, D., Rosero, E., Tewari, M., and Xia, Y.: The community Noah land surface model with multiparameterization options (Noah-MP): 1. Model description and evaluation with local-scale measurements, J. Geophys. Res.-Atmos., 116, https://doi.org/10.1029/2010JD015139, 2011.
Phoenix, D. B., Berkoff, T. A., Gronoff, G. P., Salkovitz, D., Bernier, C., Knowland, K. E., Sullivan, J. T., Twigg, L. W., Roots, M., and Knepp, T.: Analysis of atmospheric conditions responsible for an ozone exceedance event in southeast Virginia on June 15, 2022, Atmos. Pollut. Res., 16, 102409, https://doi.org/10.1016/j.apr.2025.102409, 2025.
Price, C. and Rind, D.: A simple lightning parameterization for calculating global lightning distributions, J. Geophys. Res., 97, 9919–9933, https://doi.org/10.1029/92JD00719, 1992.
Rawat, P., Crawford, J. H., Travis, K. R., Judd, L. M., Demetillo, M. A. G., Valin, L. C., Szykman, J. J., Whitehill, A., Baumann, E., and Hanisco, T. F.: Maximizing the scientific application of Pandora column observations of HCHO and NO2, Atmos. Meas. Tech., 18, 2899–2917, https://doi.org/10.5194/amt-18-2899-2025, 2025.
Ring, A. M., Dickerson, R. R., Sebol, A. E., Ren, X., Benish, S. E., Salawitch, R. J., Galasyn, A., Miller, P. J., and Canty, T. P.: Anthropogenic VOCs in the Long Island Sound, NY Airshed and their role in ozone production, Atmos. Environ., 296, 119583, https://doi.org/10.1016/j.atmosenv.2023.119583, 2023.
Stauffer, R. M., Thompson, A. M., Martins, D. K., Clark, R. D., Goldberg, D. L., Loughner, C. P., Delgado, R., Dickerson, R. R., Stehr, J. W., and Tzortziou, M. A.: Bay breeze influence on surface ozone at Edgewood, MD during July 2011, J. Atmos. Chem., 72, 335–353, https://doi.org/10.1007/s10874-012-9241-6, 2015.
Su, J., Delgado, R., Berkoff, T. A., Sullivan, J. T., Gronoff, G. P., and Phoenix, D. B.: Observation of fresh wildfire smoke over Hampton, VA in winter, Atmos. Environ., 358, 121370, https://doi.org/10.1016/j.atmosenv.2025.121370, 2025.
Sullivan, J. T., Rabenhorst, S. D., Dreessen, J., McGee, T. J., Delgado, R., Twigg, L., and Sumnicht, G.: Lidar observations revealing transport of O3 in the presence of a nocturnal low-level jet: Regional implications for “next-day” pollution, Atmos. Environ., 158, 160–171, https://doi.org/10.1016/j.atmosenv.2017.03.039, 2017.
Sullivan, J. T., Berkoff, T., Gronoff, G., Knepp, T., Pippin, M., Allen, D., Twigg, L., Swap, R., Tzortziou, M., Thompson, A. M., Stauffer, R. M., Wolfe, G. M., Flynn, J., Pusede, S. E., Judd, L. M., Moore, W., Baker, B. D., Al-Saadi, J., and McGee, T. J.: The Ozone Water–Land Environmental Transition Study: An Innovative Strategy for Understanding Chesapeake Bay Pollution Events, B. Am. Meteorol. Soc., 100, 291–306, https://doi.org/10.1175/BAMS-D-18-0025.1, 2019.
Sun, K., Zhu, L., Cady-Pereira, K., Chan Miller, C., Chance, K., Clarisse, L., Coheur, P.-F., González Abad, G., Huang, G., Liu, X., Van Damme, M., Yang, K., and Zondlo, M.: A physics-based approach to oversample multi-satellite, multispecies observations to a common grid, Atmos. Meas. Tech., 11, 6679–6701, https://doi.org/10.5194/amt-11-6679-2018, 2018.
Tao, M., Fiore, A. M., Jin, X., Schiferl, L. D., Commane, R., Judd, L. M., Janz, S., Sullivan, J. T., Miller, P. J., Karambelas, A., Davis, S., Tzortziou, M., Valin, L., Whitehill, A., Civerolo, K., and Tian, Y.: Investigating Changes in Ozone Formation Chemistry during Summertime Pollution Events over the Northeastern United States, Environ. Sci. Technol., 56, 15312–15327, https://doi.org/10.1021/acs.est.2c02972, 2022.
Tao, M., Fiore, A., Karambelas, A., Miller, P., Valin, L., Judd, L., Tzortziou, M., Whitehill, A., Teora, A., Tian, Y., Civerolo, K., Tong, D., Ma, S., Adamo, S., and Holloway, T.: Insights Into Summertime Surface Ozone Formation From Diurnal Variations in Formaldehyde and Nitrogen Dioxide Along a Transect Through New York City, J. Geophys. Res.-Atmos., 130, https://doi.org/10.1029/2024JD040922, 2025.
Thompson, G., Field, P. R., Rasmussen, R. M., and Hall, W. D.: Explicit Forecasts of Winter Precipitation Using an Improved Bulk Microphysics Scheme. Part II: Implementation of a New Snow Parameterization, Mon. Weather Rev., 136, 5095–5115, https://doi.org/10.1175/2008MWR2387.1, 2008.
Tie, X., Madronich, S., Walters, S., Zhang, R., Rasch, P., and Collins, W.: Effect of clouds on photolysis and oxidants in the troposphere, J. Geophys. Res.-Atmos., 108, https://doi.org/10.1029/2003JD003659, 2003.
Torres-Vazquez, A., Pleim, J., Gilliam, R., and Pouliot, G.: Performance Evaluation of the Meteorology and Air Quality Conditions From Multiscale WRF-CMAQ Simulations for the Long Island Sound Tropospheric Ozone Study (LISTOS), J. Geophys. Res.-Atmos., 127, e2021JD035890, https://doi.org/10.1029/2021JD035890, 2022.
Travis, K. R. and Jacob, D. J.: Systematic bias in evaluating chemical transport models with maximum daily 8 h average (MDA8) surface ozone for air quality applications: a case study with GEOS-Chem v9.02, Geosci. Model Dev., 12, 3641–3648, https://doi.org/10.5194/gmd-12-3641-2019, 2019.
Tucker, S. C., Banta, R. M., Langford, A. O., Senff, C. J., Brewer, W. A., Williams, E. J., Lerner, B. M., Osthoff, H. D., and Hardesty, R. M.: Relationships of coastal nocturnal boundary layer winds and turbulence to Houston ozone concentrations during TexAQS 2006, J. Geophys. Res.-Atmos., 115, https://doi.org/10.1029/2009JD013169, 2010.
Tzortziou, M., Loughner, C. P., Goldberg, D. L., Judd, L., Nauth, D., Kwong, C. F., Lin, T., Cede, A., and Abuhassan, N.: Intimately tracking NO2 pollution over the New York City - Long Island Sound land-water continuum: An integration of shipboard, airborne, satellite observations, and models, Sci. Total Environ., 897, 165144, https://doi.org/10.1016/j.scitotenv.2023.165144, 2023.
U.S. EPA: Integrated Science Assessment (ISA) for ozone and related photochemical oxidants (final report, April 2020, re-posted with errata September 2021), EPA/600/R-20/012, U.S. Environmental Protection Agency, Washington, DC, https://www.epa.gov/isa/integrated-science-assessment-isa-ozone-and-related-photochemical-oxidants (last access: 29 October 2025), 2020.
U.S. EPA: 8-hour ozone nonattainment areas for criteria pollutants (Green Book), https://www.epa.gov/green-book (last access: 6 June 2025), 2023.
Wang, B., Geddes, J. A., Adams, T. J., Lind, E. S., McDonald, B. C., He, J., Harkins, C., Li, D., and Pfister, G. G.: Implications of Sea Breezes on Air Quality Monitoring in a Coastal Urban Environment: Evidence From High Resolution Modeling of NO2 and O3, J. Geophys. Res.-Atmos., 128, e2022JD037860, https://doi.org/10.1029/2022JD037860, 2023.
Wiedinmyer, C. and Emmons, L.: Fire Inventory from NCAR version 2 Fire Emission, Research Data Archive at the National Center for Atmospheric Research, Computational and Information Systems Laboratory [data set], https://doi.org/10.5065/XNPA-AF09, 2022.
Wong, J., Barth, M. C., and Noone, D.: Evaluating a lightning parameterization based on cloud-top height for mesoscale numerical model simulations, Geosci. Model Dev., 6, 429–443, https://doi.org/10.5194/gmd-6-429-2013, 2013.
Wu, Y., Arapi, A., Huang, J., Gross, B., and Moshary, F.: Intra-continental wildfire smoke transport and impact on local air quality observed by ground-based and satellite remote sensing in New York City, Atmos. Environ., 187, 266–281, https://doi.org/10.1016/j.atmosenv.2018.06.006, 2018.
Yang, Z., Demoz, B., Delgado, R., Sullivan, J., Tangborn, A., and Lee, P.: Influence of the transported Canadian wildfire smoke on the ozone and particle pollution over the Mid-Atlantic United States, Atmos. Environ., 273, 118940, https://doi.org/10.1016/j.atmosenv.2022.118940, 2022.
Yerramilli, A., Challa, V. S., Dodla, V. B. R., Myles, L., Pendergrass, W. R., Vogel, C. A., Tuluri, F., Baham, J. M., Hughes, R., Patrick, C., Young, J., and Swanier, S.: Simulation of surface ozone pollution in the Central Gulf Coast region during summer synoptic condition using WRF/Chem air quality model, Atmos. Pollut. Res., 3, 55–71, https://doi.org/10.5094/APR.2012.005, 2012.
Zaveri, R. A., Easter, R. C., Fast, J. D., and Peters, L. K.: Model for Simulating Aerosol Interactions and Chemistry (MOSAIC), J. Geophys. Res.-Atmos., 113, D13204, https://doi.org/10.1029/2007JD008782, 2008.
Zhang, C., Wang, Y., and Hamilton, K. Improved representation of boundary layer clouds over the southeast pacific in ARW–WRF using a modified Tiedtke cumulus parameterization scheme, Mon. Weather Rev., 139, 3489–3513. https://doi.org/10.1175/MWR-D-10-05091.1, 2011.
Zhang, J., Ninneman, M., Joseph, E., Schwab, M. J., Shrestha, B., and Schwab, J. J.: Mobile Laboratory Measurements of High Surface Ozone Levels and Spatial Heterogeneity During LISTOS 2018: Evidence for Sea Breeze Influence, J. Geophys. Res.-Atmos., 125, e2019JD031961, https://doi.org/10.1029/2019JD031961, 2020.
Zhang, J., Catena, A., Shrestha, B., Freedman, J., McCabe, E., Schwab, M. J., Felton, D., Kent, J., Gaza, B., and Schwab, J. J.: Unraveling the interaction of urban emission plumes and marine breezes involved in the formation of summertime coastal high ozone on Long Island, Environ. Sci.: Atmos., 2, 1438–1449, https://doi.org/10.1039/D2EA00061J, 2022.
Zhao, K., Wu, Y., Huang, J., Jiang, R., Gronoff, G., Berkoff, T. A., and Moshary, F.: Variation of Ozone and PBL from the Lidar Observations and WRF-Chem Model in NYC Area During the 2018 Summer LISTOS Campaign, EPJ Web Conf., 237, 08027, https://doi.org/10.1051/epjconf/202023708027, 2020.
Zheng, Z., Zhang, H., Qian, H., Li, J., Yu, T., and Liu, C.: Emission characteristics of formaldehyde from natural gas combustion and effects of hood exhaust in Chinese kitchens, Sci. Total Environ., 838, 156614, https://doi.org/10.1016/j.scitotenv.2022.156614, 2022.
Zhu, L., González Abad, G., Nowlan, C. R., Chan Miller, C., Chance, K., Apel, E. C., DiGangi, J. P., Fried, A., Hanisco, T. F., Hornbrook, R. S., Hu, L., Kaiser, J., Keutsch, F. N., Permar, W., St. Clair, J. M., and Wolfe, G. M.: Validation of satellite formaldehyde (HCHO) retrievals using observations from 12 aircraft campaigns, Atmos. Chem. Phys., 20, 12329–12345, https://doi.org/10.5194/acp-20-12329-2020, 2020.
Zoogman, P., Liu, X., Suleiman, R. M., Pennington, W. F., Flittner, D. E., Al-Saadi, J. A., Hilton, B. B., Nicks, D. K., Newchurch, M. J., Carr, J. L., Janz, S. J., Andraschko, M. R., Arola, A., Baker, B. D., Canova, B. P., Chan Miller, C., Cohen, R. C., Davis, J. E., Dussault, M. E., Edwards, D. P., Fishman, J., Ghulam, A., González Abad, G., Grutter, M., Herman, J. R., Houck, J., Jacob, D. J., Joiner, J., Kerridge, B. J., Kim, J., Krotkov, N. A., Lamsal, L., Li, C., Lindfors, A., Martin, R. V., McElroy, C. T., McLinden, C., Natraj, V., Neil, D. O., Nowlan, C. R., O'Sullivan, E. J., Palmer, P. I., Pierce, R. B., Pippin, M. R., Saiz-Lopez, A., Spurr, R. J. D., Szykman, J. J., Torres, O., Veefkind, J. P., Veihelmann, B., Wang, H., Wang, J., and Chance, K.: Tropospheric Emissions: Monitoring of Pollution (TEMPO), J. Quant. Spectrosc. Ra., 186, 17–39, https://doi.org/10.1016/j.jqsrt.2016.05.008, 2017.
Zuo, X., Sun, W., De Smedt, I., Li, X., Liu, S., Pu, D., Sun, S., Li, J., Chen, Y., Fu, W., Zhang, P., Li, Y., Yang, X., Fu, T.-M., Shen, H., Ye, J., Wang, C., and Zhu, L.: Observing Downwind Structures of Urban HCHO Plumes From Space: Implications to Non-Methane Volatile Organic Compound Emissions, Geophys. Res. Lett., 50, e2023GL106062, https://doi.org/10.1029/2023GL106062, 2023.