
the Creative Commons Attribution 4.0 License.
the Creative Commons Attribution 4.0 License.
 | 30 Sep 2026
Measurement report: Global Total Ozone Records – Part 1: Ground-based monitoring networks performance assessment and status review

Vitali Fioletov
Irina Petropavlovskikh
Voltaire Velazco
Alberto Redondas
Anna Solomatnikova
Corinne Vigouroux
Kimberly Strong
Michel Van Roozendael
Andrea Pazmino
Thomas F. Hanisco
Alexander Cede
Martin Tiefengraber
Gordon Labow
Masatomo Fujiwara
Ronald van der A
Debora Griffin
Chris McLinden
Tom Kralidis
Wolfgang Steinbrecht
Sum Chi Lee
Total column ozone (TCO) has been observed since the 1920s, with a systematic monitoring network established during the International Geophysical Year (1957–1958). We compile and assess TCO records from six major ground-based instrument types: Dobson and Brewer spectrophotometers, Filter ozonometers, zenith-sky DOAS (UVVIS), Fourier-transform infrared (FTIR) spectroscopy, and Pandora spectrometers. Data are drawn from the World Ozone and Ultraviolet Radiation Data Centre, Network for the Detection of Atmospheric Composition Change, Pandonia Global Network, and European Brewer Network. Using harmonized statistical criteria and daily comparisons with multiple satellite products and four reanalysis datasets, we evaluate site-level performance in 5-year intervals from 1940 to 2024. Metrics include mean bias, variability of daily and monthly differences, seasonal amplitude, and the range of annual means, with percentile-based thresholds used to classify data quality.
Ground-based annual means generally agree with satellite and reanalysis benchmarks within ± 2 %, with typical variability near 2 %. Larger discrepancies occur in the pre-satellite era, where reanalyses show biases of up to −5 % relative to Dobson observations. Network-wide distributions of daily mean differences to those from reanalysis and satellite data indicate comparable internal consistency for Brewer, Dobson, FTIR, and Pandora (standard deviations generally around 2 %), while Filter and UVVIS exhibit slightly broader spreads (< 3 %), especially at high latitudes.
Network capacity has evolved substantially since the 2000s, with a decline in Dobson sites and expansion of Brewer and Pandora observations. By providing station-level flags and thresholds, this assessment helps network operators prioritize calibration and reprocessing efforts and helps users identify robust records, thereby improving confidence in long-term ozone trend detection and satellite validation.
- Article
(12664 KB) - Full-text XML
- BibTeX
- EndNote


© His Majesty the King in Right of Canada, as represented by the Minister of the Environment, 2026.
The stratospheric ozone layer plays a critical role in protecting life on Earth from harmful ultraviolet radiation and has therefore been a focus of sustained global monitoring for nearly a century. Total column ozone (TCO) has been observed from the ground since the 1920s and at global scale since the International Geophysical Year of 1957–1958 (Dobson, 1968; Brönnimann et al., 2003). These long records underpin our understanding of ozone variability and trends, the evaluation of the Montreal Protocol's effectiveness, and the validation and intercalibration of satellite retrievals and atmospheric reanalyses (e.g., Weber et al., 2022). Ground-based TCO measurements are archived by international data centres such as the World Ozone and Ultraviolet Radiation Data Centre (WOUDC, hosted by Environment and Climate Change Canada), Network for the Detection of Atmospheric Composition Change (NDACC, hosted by NASA), Pandonia Global Network (PGN, hosted by LuftBlick), and European Brewer Network (EUBrewnet, hosted by AEMET).
Multiple types of instruments contribute to the global TCO observation, each with distinct measurement principles, retrieval assumptions, and calibration practices. The World Meteorological Organization/Global Atmosphere Watch (WMO/GAW) establishes reference measurements and guidelines to ensure global consistency in atmospheric composition monitoring in key areas (such as TCO, UV radiation, greenhouse gases, aerosols, etc.) (WMO/GAW, 2017, 2026). For total ozone, the Dobson and Brewer spectrophotometers are the WMO/GAW reference instruments, based on their demonstrated precision and stability when appropriately maintained (Fioletov et al., 2008; Gröbner et al., 2021; Zhao et al., 2021). Filter ozonometers provide compact, operational measurements at specific wavelengths with using bandpass filters (Bojkov et al., 1994). Zenith-sky Differential Optical Absorption Spectroscopy (DOAS) instruments, including Système d'Analyse par Observation Zénithale (SAOZ) (Pommereau and Goutail, 1988; Sarkissian et al., 1997) systems within NDACC, retrieve total ozone from scattered sunlight using DOAS techniques and standardized retrieval recommendations (Hendrick et al., 2011). Fourier-transform infrared (FTIR) spectrometers retrieve ozone alongside many other gases from solar absorption spectra and have benefited from recent harmonized reprocessing within NDACC (Björklund et al., 2024; Vigouroux et al., 2015). More recently, Pandora spectrometers, centrally processed within the PGN, have expanded rapidly and show improved performance for total ozone (Zhao et al., 2016, 2025). The composition and capacity of the global total ozone monitoring continue to evolve: Dobson deployments have declined from their late-20th-century peak, Brewers have expanded to become the largest reference network, filter ozonometers have contracted, and UVVIS, FTIR, and especially Pandora sites have grown in number.
While the variety of monitoring instruments and networks provides good spatial coverage and redundancy (except in regions such as Africa and part of South America), this diversity also introduces heterogeneity in measurement characteristics, calibration chains, and data processing. Ensuring that these records collectively support robust long-term trend detection and satellite validation and verification requires systematic assessments of performance across instruments, sites, and decades. Earlier studies used discrete satellite overpasses to assess the performance of Dobson, Brewer, and filter networks, establishing statistical criteria based on mean differences, standard deviation at daily and monthly scales, and seasonal behaviors (Fioletov et al., 1999, 2008). Since then, the observing system has changed substantially. Additional satellite missions and products have become available (e.g., OMI, GOME-2, OMPS, TROPOMI; Garane et al., 2019). In addition, some ground-based networks have expanded or emerged (e.g., Brewer and PGN). Furthermore, reanalyses methods have matured and expanded in temporal scales, as seen in datasets like ERA5, MERRA-2, JRA-3Q, and MSR2 (van der A et al., 2015a; Hersbach et al., 2020; Kosaka et al., 2024; Wargan et al., 2017). These developments offer a possibility to perform a more comprehensive and updated evaluation, extending into the pre-satellite era, but also introducing new challenges. When comparing these latest satellites and reanalysis datasets with ground-based observations requires accounting for assimilation-source driven shifts in the reanalyses datasets and latitude- or season-dependent biases in satellite records.
This paper, Part 1 of a two-part study, compiles and assesses global TCO records from six major ground-based instrument types: Dobson, Brewer, Filter ozonometer, UVVIS, FTIR, and Pandora. The data is drawn from WOUDC, NDACC, EUBrewnet, and PGN archives. We evaluate site-level performance using a harmonized statistical framework applied to daily data in 5-year bins from 1940 to 2024. Ground-based observations are compared with multiple satellite overpass products and four reanalyses (ERA5, MERRA-2, JRA-3Q, and MSR2). Consistent with prior work, our metrics include the mean bias, the standard deviation of daily and monthly differences, the amplitude of the seasonal component of the differences, and the range of annual mean differences (Fioletov et al., 1999, 2008). These metrics are designed to capture systematic offsets, precision, temporal stability, and retrieval sensitivities (e.g., to effective temperature, stray light, or extraterrestrial constants), and to be interpretable across instrument types.
A methodological advance in this assessment is the use of network-specific, percentile-based thresholds to classify station performance as high quality, medium quality (minor issues), or not assured (major issues). Rather than adopting a one-size-fits-all set of limits, we derive thresholds from the distributions of statistics observed within each network and against each benchmark (satellites or reanalysis datasets). This approach accounts for known differences in precision and retrieval characteristics across instruments. By avoiding a reliance on a single reference, it mitigates biases caused by specific reanalysis artifacts and time-dependent shifts (such as some satellite datasets could drift over the years due to degradation of optics and/or detector) in data assimilation.
The work demonstrates the agreement between the reference networks (Dobson and Brewer) and satellite/reanalysis benchmarks, with the expanded assessment identifying specific stations, time periods, and regions where additional scrutiny, recalibration, or reprocessing may be needed. The framework provides practical station-level flags to help data centres and users select the most reliable datasets for climatologies, trend analyses, and satellite validation and verification. Additionally, these flags serve as a guide for prioritizing quality-control activities and intercomparison campaigns. Importantly, by documenting both strengths and limitations across networks and time, this work supports the continued integrity of the global ozone monitoring system and helps ensure that research about long-term ozone changes is based on well-characterized and good-quality observations.
The remainder of the paper is organized as follows: Sect. 2 describes the datasets and statistical model, including the ground-based, satellite, and reanalysis products used. Section 3 presents the ground-based networks' status and the derivation of statistical criteria. Section 4 reports station-level results and network performance patterns. Section 5 summarizes key findings and implications. A companion paper (Part 2) provides a detailed evaluation of satellite and reanalysis ozone products using the quality-assured ground-based records established here.
2.1 Ground-based measurements
We included six major global total ozone networks in this assessment and review work. Figure 1a shows the map for these networks from their 86-year records (1940 to 2025; pre-1940 records were not included). Figure 1b shows the same network map but limited to sites that have submitted data in the past decade. On the map, the data source from Dobson and Filter instruments is solely from WOUDC. The Brewer records are merged from WOUDC and EUBrewnet. The Zenith-Scattered Light Differential Optical Absorption Spectroscopy instruments (ZSL-DOAS, referred to as UVVIS in this work) and FTIR instruments' records are solely from NDACC. Pandora instruments' records are from PGN.
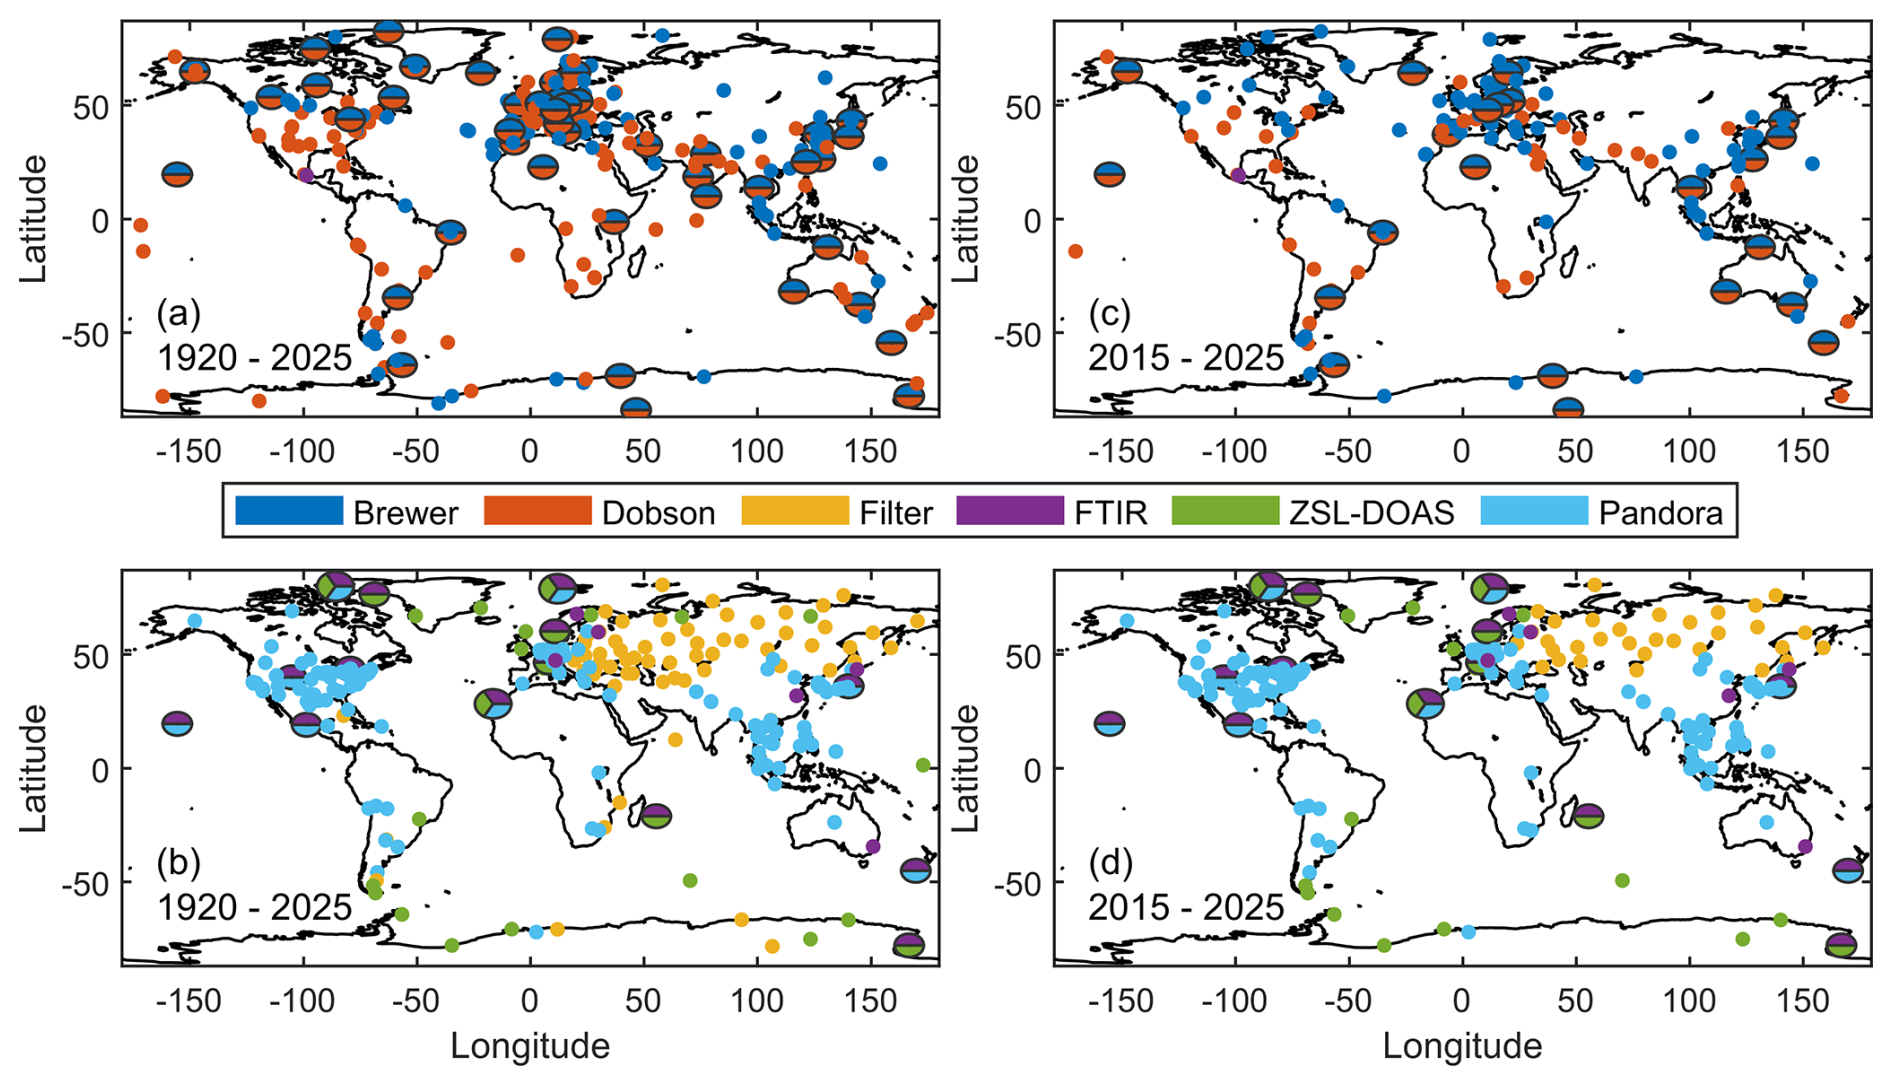
Figure 1Map of ground-based TCO observation networks, the panels (a) and (b) show all sites that have ever (1920 to 2025) submitted data to WOUDC, NDACC, EUBrewnet, or PGN, the panels (c) and (d) show the sites that have submitted data in the past decade (2015 to 2025). The panels (a) and (c) show Dobson and Brewer sites, while panels (b) and (d) show sites equipped with other instruments. The larger pies correspond to sites with multiple instruments.
The Dobson spectrophotometer is a ground-based instrument designed to measure the TCO in the atmosphere by comparing the intensity of ultraviolet (UV) radiation at selected wavelength pairs that are differentially absorbed by ozone. Operating typically in the 305–345 nm spectral range, it employs a double monochromator (with a long optical path within the instrument to reduce stray light) and optical wedge system to provide high measurement precision. By observing direct sunlight, the Dobson instrument enables accurate determination of total ozone. There are other types of observations (e.g., zenith-sky total ozone and Umkehr vertical profile measurements), however, in this work, only direct-sun observations are included, given that it is the primary data products from Dobson and have the highest quality for this type of instrument (e.g., Gröbner et al., 2021). Dobson measurements started in the 1920s, with global-scale monitoring established during the International Geophysical Year (IGY), 1957–1958 (Brönnimann et al., 2003). The Dobson network has the longest global operation, and provides the most continuous and reliable records of atmospheric ozone (Dobson, 1968). The Dobson network is homogenized by using Dobson 083 as the primary WMO GAW World Calibration Standard, which receives independent absolute calibration at the Mauna Loa Observatory. This standard is used to define instrumental constants for all Dobson observational sites (every 4 years for Regional standards and every 6 years for stations; regional standards can then be used to calibrate station instruments), thus ensuring a single, coherent observational scale across the entire network.
In the 1970s to 1980s, the Brewer spectrophotometer was designed to fully automate the TCO measurements (Brewer, 1973). Using a diffraction grating monochromator, the Brewer instrument measures within the 286–365 nm spectral range (Savastiouk, 2006). For total ozone measurements, the Brewer uses four wavelengths between 306 and 320 nm. The instrument can perform automated direct-sun, direct-moon, and zenith-sky measurements (Kerr, 2010). Brewer World (Zhao et al., 2021) and Regional (Redondas et al., 2018) Calibration Centers maintain and calibrate reference instruments (triads) to homogenize the Brewer global network. In this work, similar to Dobson records, only direct-sun observations from Brewers are included. As the WMO/GAW TCO reference instruments, both the Dobson and Brewer spectrophotometer has an accuracy better than 1 % and are traceable via the hierarchical calibration chain (e.g., from the world primary standard to a travelling standard instrument or regional standards, and then to the field instruments). This high level of accuracy and traceable long-term stability is the key strength of the Dobson and Brewer networks.
The Filter ozonometer is a compact ground-based instrument designed to estimate total column ozone by measuring the attenuation of solar ultraviolet (UV) radiation through a set of optical filters. Unlike spectrophotometers that disperse light into individual wavelengths, the Filter ozonometer uses fixed interference filters at two UV wavelengths centered at approximately 306 and 328 nm with different ozone absorption characteristics. By comparing the measured intensities at these two wavelengths, the instrument derives ozone column amounts using established calibration relationships. It is suitable for routine monitoring and network observations, although with lower spectral resolution and accuracy compared to the Dobson and Brewer spectrophotometers. The instrument was originally developed in the late 1950s and redesigned in the early 1970s (Bojkov et al., 1994). In this work, similar to Dobson and Brewer records, only direct-sun observations from Filter ozonometer are included. Note that during this study, an error was found in the observation type in the Filter ozonometer data submitted to the WOUDC between 2007 and 2024. As a result, most of the observations were reported as zenith sky measurements. All affected data were corrected and resubmitted to the WOUDC in December 2025.
The ZSL-DOAS (UVVIS) instrument is a ground-based remote sensing system used to retrieve total column amounts of atmospheric trace gases such as nitrogen dioxide (NO2), ozone (O3), bromine oxide (BrO), and chlorine dioxide (OClO). It measures scattered sunlight from the zenith direction over a broad spectral range, typically in the ultraviolet and visible regions, and applies the DOAS technique to extract weak absorption features of target species from the measured spectra. For geometric reasons, the most accurate measurements are taken twice a day at twilight (sunrise and sunset). All UVVIS sites follow the NDACC UVVIS total ozone retrieval recommendation (Hendrick et al., 2011), but are mostly processed by the individual PI of the site. Within the current NDACC UVVIS network, the SAOZ instrument comprises a large portion of it (as a subnetwork), especially in the polar regions (Pazmiño et al., 2023; Sarkissian et al., 1997). SAOZ was designed to perform measurements in polar regions, which are sometimes difficult to access. It is a fully automated system that requires minimal intervention during operation. However, occasional monitoring and troubleshooting are still necessary. A centralized data processing system enabling consistent data retrieval from the SAOZ instruments, with quality control, is operational allowing near real time data and has been improved in recent years through the NDACC-ACTRIS collaboration. With no need for solar tracking, UVVIS instruments typically have low maintenance requirements and can be operated under a wide range of site conditions. However, as the cost, UVVIS instruments rely on radiative transfer modelling to calculate the effective air mass factor (e.g., in Hendrick et al., 2011, using TOMS v8 climatology ozone and temperature profiles). For example, the combined uncertainty in UVVIS scattering sunlight ozone air mass factor is 3.6 %, whereas the uncertainty in direct-sun ozone air mass factor is less than 0.5 % when SZA <80°. The typical accuracy for UVVIS total ozone is on the level of 5 %.
The FTIR spectrometer is a ground-based instrument used to measure total and partial column amounts of various atmospheric trace gases, including O3, NO2, HCHO, HNO3, HCl, HF, methane (CH4), carbon monoxide (CO), and nitrous oxide (N2O) (De Mazière et al., 2018; Viatte et al., 2011). Typically, FTIR records solar absorption spectra in the 600–4500 cm−1 range, where many gases have distinct rotational–vibrational absorption features. By applying spectral inversion techniques to the measured interferograms, vertical profiles and column abundances of multiple species can be retrieved simultaneously. The ozone retrieval settings are harmonized within the FTIR NDACC network since 2008 (Vigouroux et al., 2008, 2015). Recently, the network has re-processed the ozone time-series using the HITRAN 2020 spectroscopic database (instead of HITRAN 2008) which has improved ozone line parameters in the infrared (Gordon et al., 2022). As expected, this reprocessing reduces the bias observed between FTIR and instruments measuring in the UV to 2 %–3 % (Björklund et al., 2024), in agreement with the uncertainty on the spectroscopic parameters. The accuracy for this updated FTIR data set (labelled “irwg2023” in the NDACC database) is therefore assumed to be 2 %–3 %, in agreement with the calculated systematic uncertainty after propagation of the uncertainty on the spectroscopic parameters (Björklund et al., 2024). The precision of the FTIR ozone total column is about 1 %: the calculated random uncertainty of 1.2 % at Lauder was confirmed by a median absolute deviation of only 2 % when FTIR and Dobson are compared (Björklund et al., 2024).
The Pandora spectrometer is a ground-based multi-viewing instrument designed to measure total and tropospheric partial column amounts of trace gases such as NO2, O3, and HCHO. It records direct-sun and sky radiance spectra in the ultraviolet and visible regions (typically 280–525 nm) with 0.6 nm spectral resolution, allowing precise application of the Total Optical Absorption Spectroscopy (TOAS) technique (e.g., Zhao et al., 2016). Pandora data are centrally calibrated and processed by PGN, providing a uniform quality-controlled dataset. In this work, the latest official retrieval version of PGN total ozone (rout2p1-8) has been used, which was found to have a 1 % level agreement with Brewer (Zhao et al., 2025). Current limitations include the lack of stray-light correction and the use of a climatological effective temperature (Cede et al., 2025). Upcoming versions of the PGN total ozone retrieval are planned to address both issues. It is worth mentioning that the WMO Scientific Advisory Group on Ozone and UV is working to evaluate the capabilities of other new technologies as a potential third-generation ozone reference instrument, including Pandora and the BTS-solar instrument (Zuber et al., 2021).
2.2 Satellite measurements
TCO data from the various satellite instruments are included in the work to help assess the quality of TCO measured by ground-based networks. These satellite instruments include the Total Ozone Mapping Spectrometer (TOMS) series (Nimbus 7 TOMS, EP-TOMS v8p6), the Global Ozone Monitoring Experiment (GOME) series (GOME, GOME 2A, 2B and 2C; v03), the Solar Backscatter Ultraviolet series (SBUV on board Nimbus 4, 7, NOAA 09, 11, 14, 16, 17, 18, and 19, and NPP; v8.7), the Ozone Mapping and Profiler Suite (OMPS; v2.7), the Ozone Monitoring Instrument (OMI; OMTO3 v4 and OMDOAO3 v3), and the Tropospheric Monitoring Instrument (TROPOMI; v2 OFFL). Except for TROPOMI, all satellite overpass datasets came from the NASA atmospheric composition validation data center (https://avdc.gsfc.nasa.gov/pub/data/satellite/, last access: last access: 21 January 2026). Description of these instruments can be found in, e.g., WMO (2022) more detailed ozone retrieval algorithms for each data product can be found in their metadata. TROPOMI (Garane et al., 2019) v2 OFFL overpass datasets are available on the ECCC server.
2.3 Reanalysis datasets
A global atmospheric reanalysis system consists of a global forecast model, an assimilation scheme, and input observations assimilated, which are used in combination to produce best estimates (analyses) of past atmospheric states including the ozone field (Fujiwara et al., 2022, p. 20, see e.g. its Chap. 2 and 4). For the modern reanalysis datasets, used in this work and explained below, satellite total-ozone and profile-ozone data are assimilated or used. Most reanalysis datasets do not assimilate ground-based observations (except MSR2; details are provided later), and thus can be considered as independent comparison targets for the ground-based observations.
The ERA5 reanalysis (Bell et al., 2021; Hersbach et al., 2020) is the fifth-generation global atmospheric reanalysis produced by the European Centre for Medium-Range Weather Forecasts (ECMWF) under the Copernicus Climate Change Service (C3S). Through the four-dimensional variational data assimilation (4D-Var) of satellite ozone retrievals from instruments such as (S)BUV, TOMS, OMI, Microwave Limb Sounder (MLS), and GOME-2, it provides total ozone from 1940 to the present at hourly temporal resolution and 0.25° × 0.25° horizontal resolution (Copernicus Climate Change Service, Climate Data Store, 2023). Before 1970 when satellite ozone measurements were not available, ERA5 ozone analysis is only indirectly influenced by observations that provide information on upper-air temperature, wind and humidity (Bell et al., 2021). These pre-satellite era records are expected to have lower accuracy compared to the results since the 1970s.
MERRA-2 (Modern-Era Retrospective analysis for Research and Applications, Version 2) reanalysis (Gelaro et al., 2017; Wargan et al., 2017), produced by the NASA Global Modeling and Assimilation Office (GMAO), provides total ozone from 1980 to present at hourly temporal resolution and 0.5° × 0.625° horizontal resolution. It is based on the GEOS-5 (Goddard Earth Observing System) model and assimilation system, incorporating an advanced 3D-Var data assimilation scheme. MERRA-2 also assimilates a wide range of satellite radiances and retrievals, including ozone observations from TOMS, (S)BUV, OMI, MLS (Wargan et al., 2017).
The JRA-3Q reanalysis (Kosaka et al., 2024), developed by the Japan Meteorological Agency (JMA) extends from 1950 to the present at daily temporal resolution on a 0.56° horizontal grid. The ozone distributions that are used in the JRA-3Q forecast model and provided to the public as the JRA-3Q ozone data were produced separately from the JRA-3Q data assimilation system (see Sect. 4.3 of Kosaka et al., 2024). A chemistry transport model is driven by wind data from the previous-version reanalysis from JMA, JRA-55 (Kobayashi et al., 2015) for the period starting from 1958 and from a JRA-3Q preliminary experiment before 1958, with bias-corrected satellite level-2 total ozone data (corrected against the Dobson and Brewer measurements. The details are described by Naoe et al. (2020)) nudged to the model after 1979. Therefore, before 1979, JRA-3Q ozone is only indirectly influenced by meteorological observations, being similar to the ERA5 ozone before 1970.
The Multi-Sensor Reanalysis version 2 (MSR2) reanalysis is developed by the Royal Netherlands Meteorological Institute (KNMI). The total ozone from MSR2 spans the period from 1960 onward at 0.5° × 0.5° horizontal resolution, but only have daily temporal resolutions (i.e., either total ozone at local noon, or at 12:00 UTC). Through a Kalman filter technique, MSR2 assimilate satellite total ozone measurements from TOMS, (S)BUV, GOME, SCIAMACHY, OMI, GOME-2, TROPOMI, and OMPS. In the pre-satellite era before 1979, MSR2 assimilated ground-based measurements from Dobson instruments. Before assimilating the satellite data, some basic corrections as a function of solar zenith angle, viewing angle, and atmospheric temperature are applied to the satellite data. These corrections are based on a comparison of the satellite data with the Brewer and Dobson network (van der A et al., 2015a).
Together with satellite observations, these four reanalysis datasets are used as benchmarks to build the statistical model used for the ground-based site assessment.
Following Fioletov et al. (1999, 2008), five statistical criteria are used to evaluate the performance of any instrument at given site, including the mean difference, the standard deviation of daily differences, the standard deviation of monthly differences, the amplitude of the seasonal component of the difference, and the range of annual values. These calculations were done using daily total ozone values from ground-based, satellites, and reanalysis data. For satellites, the coincident overpass criterion is selected to be < 300 km (closest observation to the station). Note that this work is for daily TCO; thus, the satellite observations' overpass time differences are not accounted for in the analysis. For reanalysis data, the model grid that covers the site is selected. For ERA-5 and MERRA-2, which have hourly resolution, their hourly data within ±2 hours of local apparent solar noon are averaged to get the daily mean. For JRA-3Q, its daily data is directly used. For MSR-2, the daily local noon data is used.
To assess the data quality, the same comparison algorithm as in Fioletov et al. (2008) was used in this work. The difference between ground-based and overpass satellite/model values was calculated for each day at each site and was expressed in percentage as ΔTCO ((Ground – X)/Ground; X is the overpass satellite or model value). Here, “Ground” is the daily mean value from reported observation data. Low-quality data, if labelled by each network's quality flag, has been excluded. For example, PGN records have an L2 data quality flag with labels such as “assured low quality”. Those records will be excluded from further analysis. In comparison, the Dobson network only submits quality-assured data, and this pre-screening is not needed. The obtained ΔTCOs were then analyzed to determine the criteria that have been used in the statistical model. For the daily mean and daily standard deviation criteria, the daily data points within a 5-year time bin must be larger than 100; for monthly mean criteria, the minimum requirement is 15 months; for annual range and amplitude, the minimum requirement is 2 years. These limits are to ensure that a sufficient amount of data and sites will be included to estimate the filtering criteria. The amplitude of the seasonal difference was estimated for each station, and each bin from the best fit of monthly differences using local regression (see Appendix D). Other technical details of the statistical criteria can be found in Fioletov et al. (1999). This analysis assumes that satellite records and reanalysis data are accurate and precise enough to help identify problematic ground-based records. Conversely, a change in the overall pattern of differences between a satellite/reanalysis data set and ground-based observations may indicate an issue with that set. This work updates the previously published analyses of Fioletov et al. (2008) and extends the historical record from 1940s through 2020s. Furthermore, the site-specific statistical analyses were performed for each instrument type, comparing ground-based instruments against not only satellites but also against four reanalysis datasets, assuming that satellites and reanalysis data may be more homogeneous in time even if some biases may exist. By estimating the main percentiles for each statistical characteristic, we established rigorous criteria to identify the “suspect” or “outlier” records.
4.1 Initial quality control
Before using all the satellite and reanalysis data to calculate the criteria for the statistical model, we examined the yearly percentage differences between network observations and these comparison datasets. Figure 2 shows examples of these analyses (the median difference of yearly data in percent) for the Dobson and Brewer networks. The results for the other networks are provided in Appendix A. Figures 2b and 2c show that most satellite and reanalysis data agree with the Dobson and Brewer networks within ± 2 % after 1980s, respectively (Fig. 2a covers 1940 to 1981; Figs. 2b and 2c cover 1982 to 2024). OMDOAS (OMI data processed via the DOAS method) overpass data have been found deteriorating due to drifting issues in the last decade, and have been removed from the inputs for the statistical model. Unsurprisingly, without satellite observations for data assimilation, reanalysis datasets extending into the pre-satellite era exhibit greater differences when compared to ground-based observations than in more recent reanalyses (see Fig. 2a). For example, from the 1940s to the 1960s, ERA-5 and JRA3Q show up to −5 % bias compared to the Dobson network. It is worth noting that the excellent agreement (differences close to 0 %) between MSR2 and the Dobson network from the 1960s to 1979 is largely attributable to the assimilation of Dobson observations into MSR2 as an additional satellite-like data source.
The bottom panels of Fig. 2 show the interquartile range (75th to 25th percentile) of the annual mean percentage difference in yearly averaged data (i.e., each station's daily ΔTCO will be averaged into yearly ΔTCO). Figure 2e and 2f show a similar level of agreement between Dobson and Brewer networks, with some clear outliers (OMDOAS), which will be further discussed later. The results here represent the general data quality of each individual network for a given year, as examined by comparison data. Both Dobson and Brewer networks have a similar 2 % standard deviation of the mean percentage difference in good years (not shown here), with the Dobson network having done better quality controls (fewer outliers).
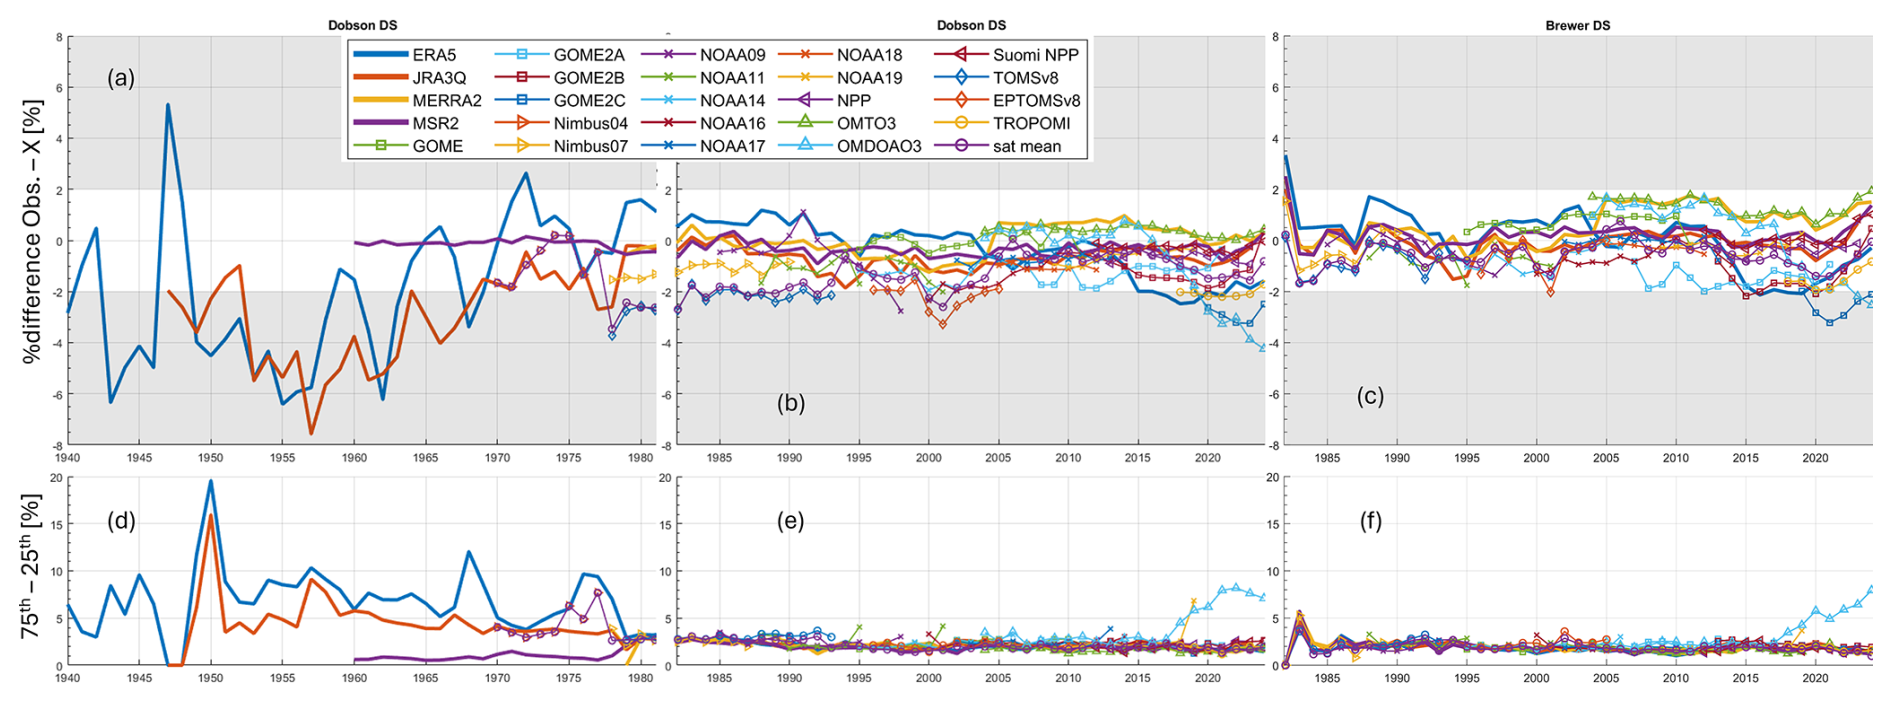
Figure 2Time series of the TCO percentage difference between Dobson (a, b) and Brewer (c) network observations and reanalysis/satellites (top panels). The bottom panels show the 25th to 75th interpercentile of the annual mean difference. Dobson data have been divided into two periods to better illustrate the performance of the reanalysis datasets before and during the satellite era.
Figure 3 shows an example using the reanalysis data (MERRA-2) as the benchmark for comparisons with the ground-based networks. A few interesting features should be mentioned, including some obvious shifts that happen to all networks close to 2006, when MERRA-2 changed its assimilation sources from TOMS and SBUV to OMI and MLS. Despite such discontinuities in the reanalysis, Fig. 3a still shows some important results, such as the general agreement of all networks being within a 2 %–3 % level for most of the records, with the agreement between the two reference networks (Dobson and Brewer) mostly within 1 %. There are two versions of the NDACC FTIR data, one of which is the 2023 reprocessing with improved spectral fitting. In Fig. 3a, the solid purple line is the new 2023 NDACC IRWG (InfraRed Working Group) reprocessing results and the dotted purple line is the old version data on NDACC. The IRWG reprocessing improved the performance of the FTIR network by reducing the bias by around 1 %–2 %. The new IRWG reprocessing agreement with other networks is noteworthy, given that FTIR retrieves ozone at different wavelengths compared to satellites (used in this study) and other ground-based instruments. For the UVVIS network, some problems were found in its records in the early 1990s (mainly due to some outlier sites, as indicated by Fig. 3b). Similar issues can also be found in the original FTIR dataset (not shown here), while the IRWG reprocessing shows good internal consistency (Fig. 3b). The rest of this work will only use this IRWG reprocessing results for FTIR network. A companion paper (Part 2) provides a detailed evaluation of satellite and reanalysis datasets' performance.
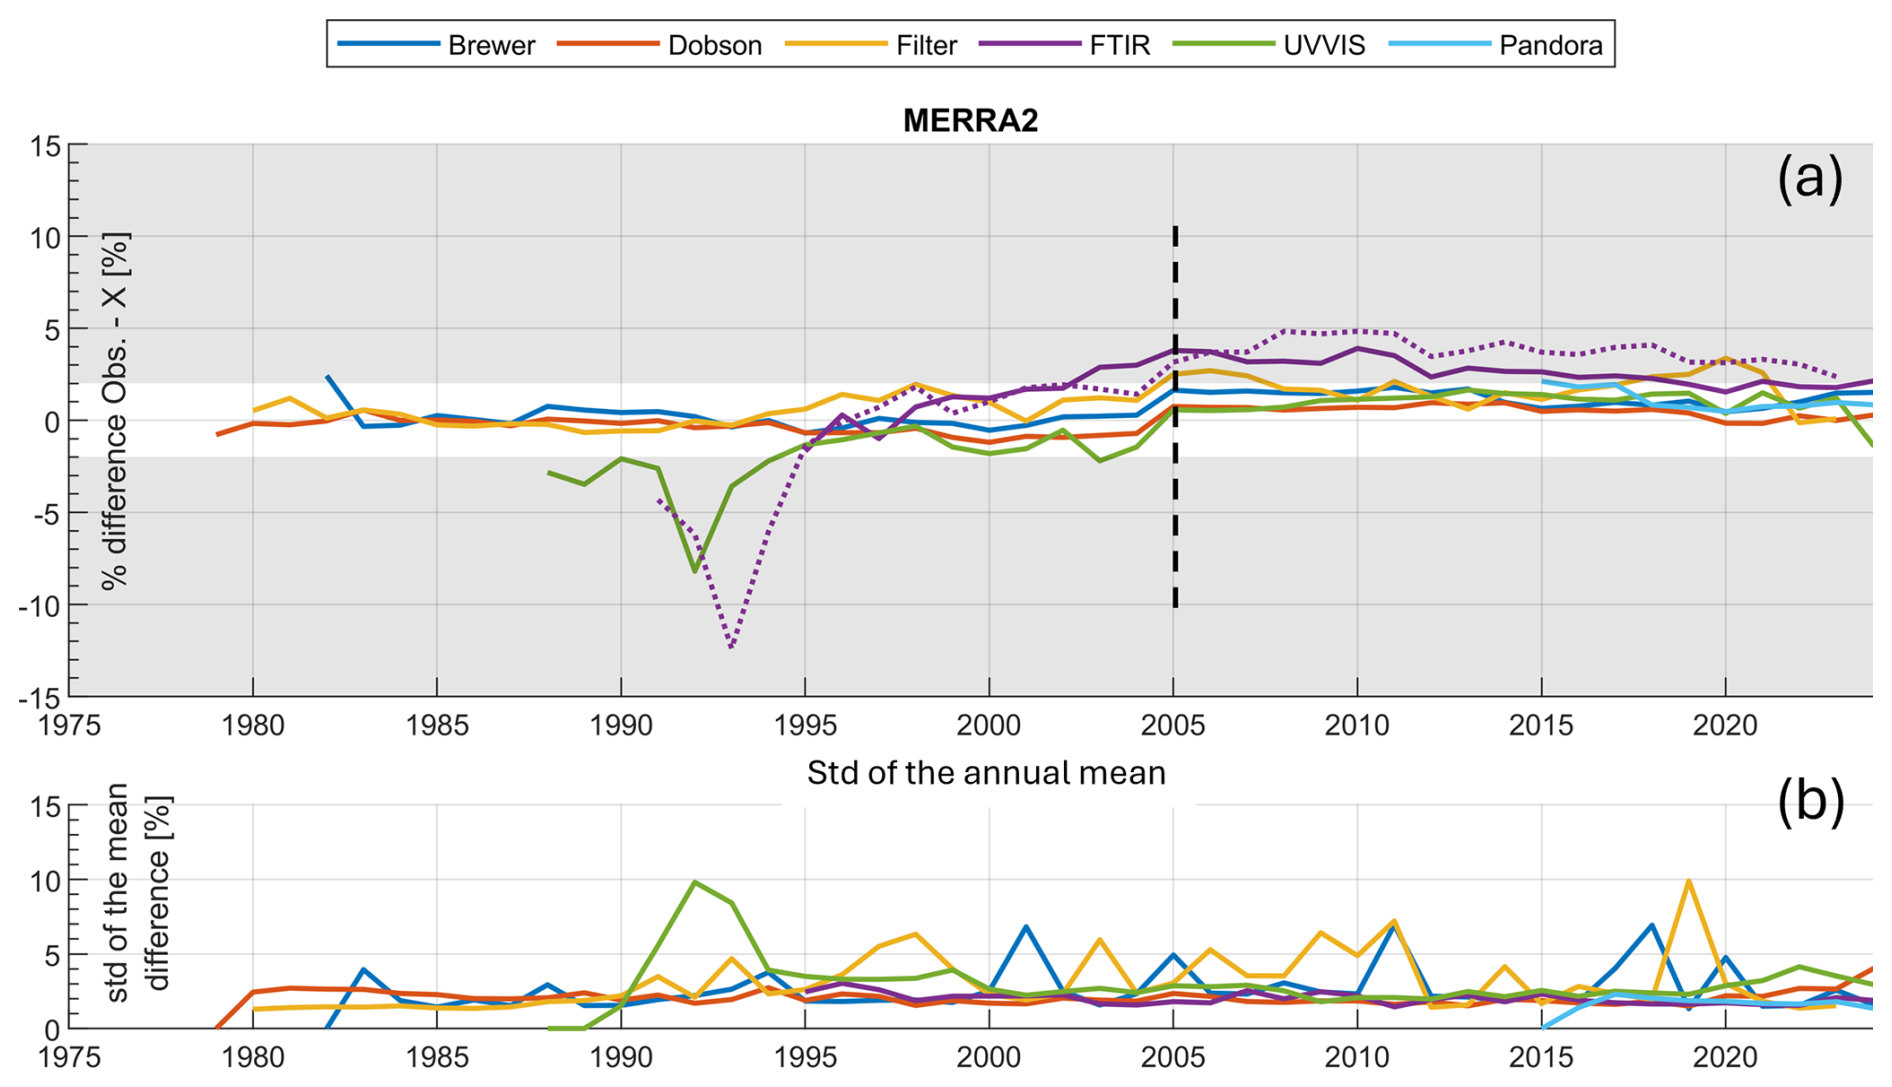
Figure 3Time series of the TCO percentage difference between ground-based network observations and MERRA-2 reanalysis (top panel). The bottom panel shows the standard deviation of the annual mean difference over all stations. The vertical dashed line marks the year 2005 when the assimilation sources changed. The solid and dotted purple lines indicate two versions of the FTIR data (the new and the old data versions, respectively).
4.2 Statistical criteria
After the initial quality control, the five statistical characteristics were calculated for each site and instrument type. For a given site, due to instrument recalibrations, maintenance, refurbishment, hardware changes, or operational malfunctions, the difference between ground-based observations and satellite/model data changes over time. Thus, these statistical analyses were made for 17 5-year-period bins from the 1940s to 2020s and for each site separately for direct sun (DS) and zenith sky (ZS, from UVVIS network only; ZS observations from other networks are not assessed in this work) ozone measurements. Note that Dobson, Brewer, and Filter instruments also provide long-term zenith-sky (ZS) observations but not included in this work.
The main percentiles were estimated for each statistical characteristic and then used to establish criteria to determine “suspect” or “outlier” site records.
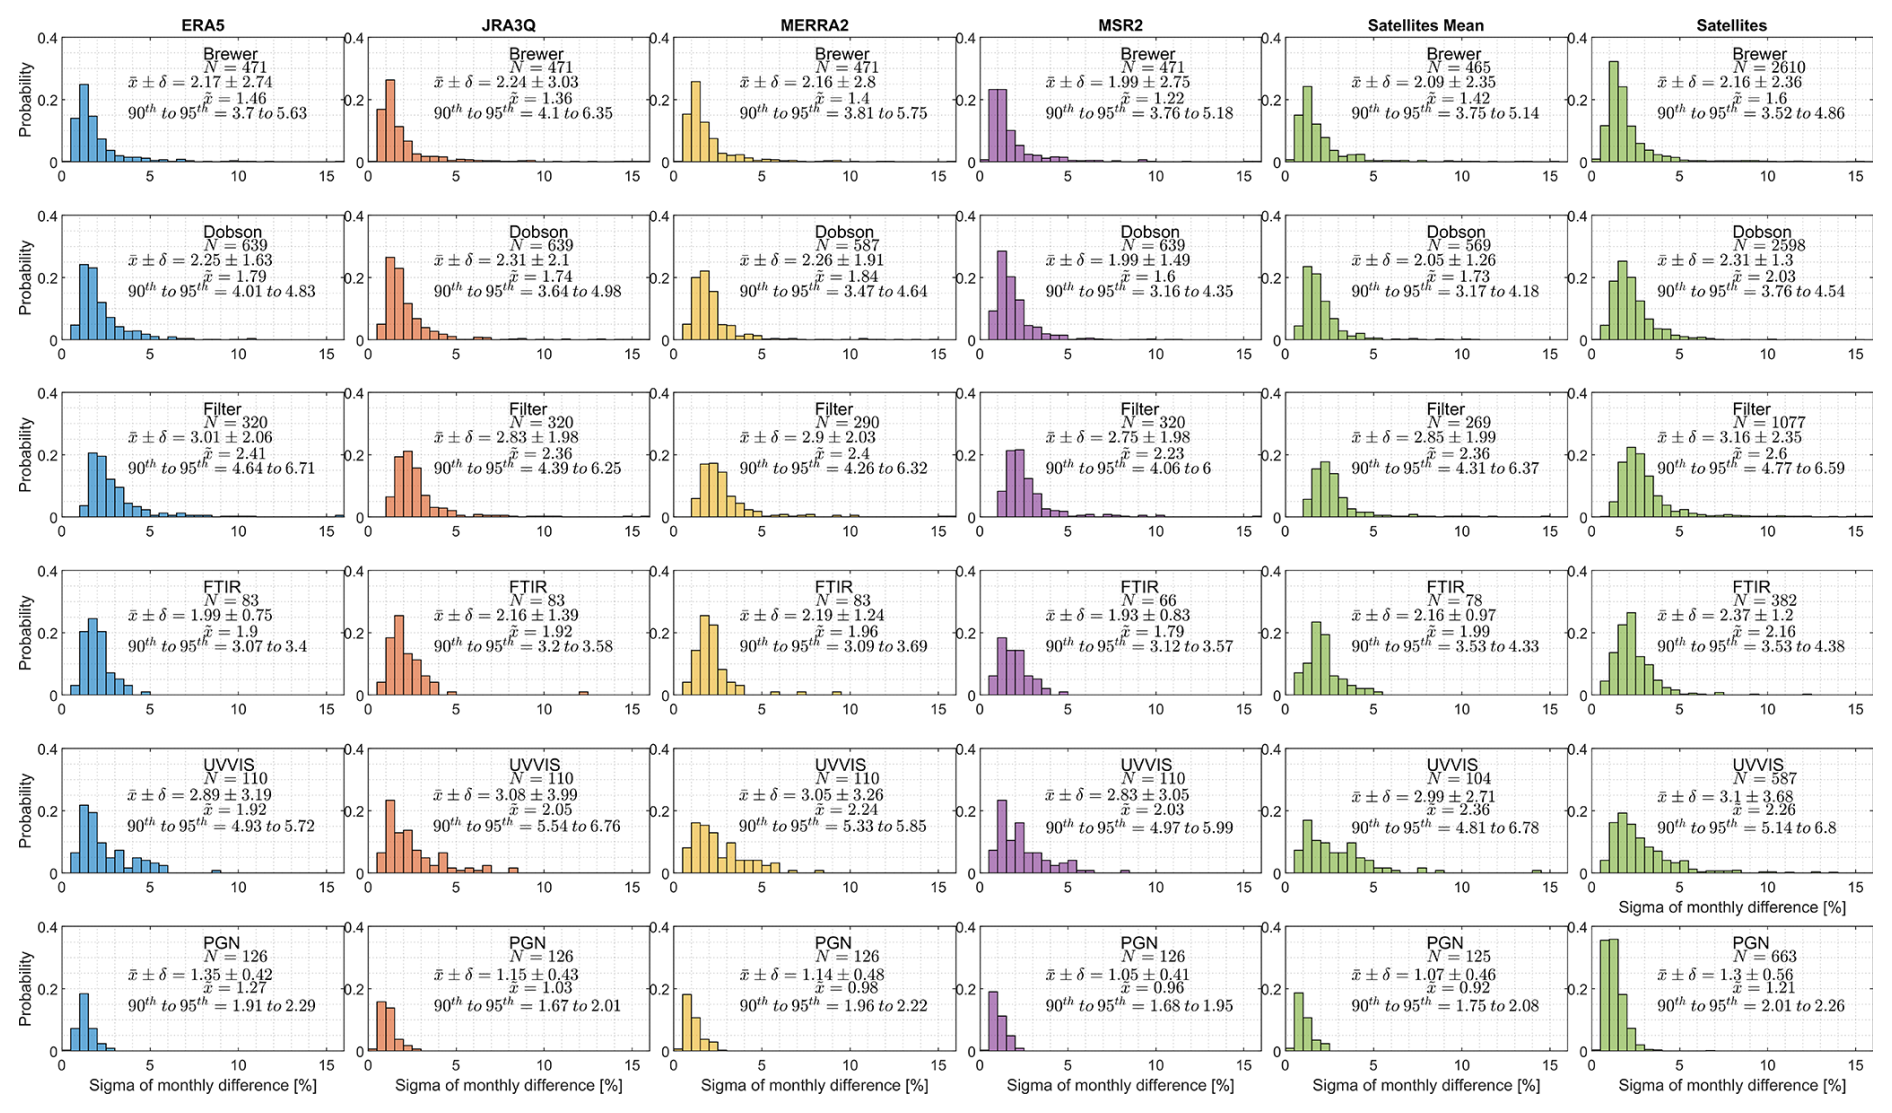
Figure 4 shows the daily mean of ΔTCO calculated using reanalysis (first four columns) and satellites (last two columns) for 1978–2024. The “Satellites Mean” column is the results for using satellites' mean results as the comparison target; the “Satellites” column is the results for using each individual satellite as the comparison target and then combining their results. For example, when using each satellite as an individual comparison target, there were N=3060 data points that were used in calculating the criteria for the daily mean of ΔTCO. When we calculate the mean of all satellites and then use it as the comparison target, we only have N=570 data points, which is close to the number of data points when we use reanalysis as the comparison target (e.g., when using ERA5, N=589; the small difference came from quality controls in satellite data, missing overpass records, etc.). In Fig. 4, each row shows the results from a network. For example, the top left panel shows Brewer network results using ERA-5 to calculate ΔTCO. Some statistical information, such as the number of data points (N; one data point means observation from a Brewer site in 5 years), mean ± one standard deviation, median, and 5th to 95th percentile values. The top right panel shows Brewer network results using all satellites' observations to calculate ΔTCO. The Brewer, Dobson, and Filter panels in the last column (satellites) are equivalent to the analysis in Fig. 7 in Fioletov et al. (2008). Compared to the analysis in that work, with more satellite observations over the last two decades, more data points are included. The derived statistics are similar to previous work, such as the median value of the Brewer network (daily mean difference) has only changed from 0.2 % to −0.46 %. The 5th percentile values changed from −2.7 % to −3.7 % and the 95th percentile values changed from 2.2 % to 2.09 %. These small changes reflect the fact that both ground-based networks and satellite observations have evolved. Thus, these new criteria will be used in the statistical model.
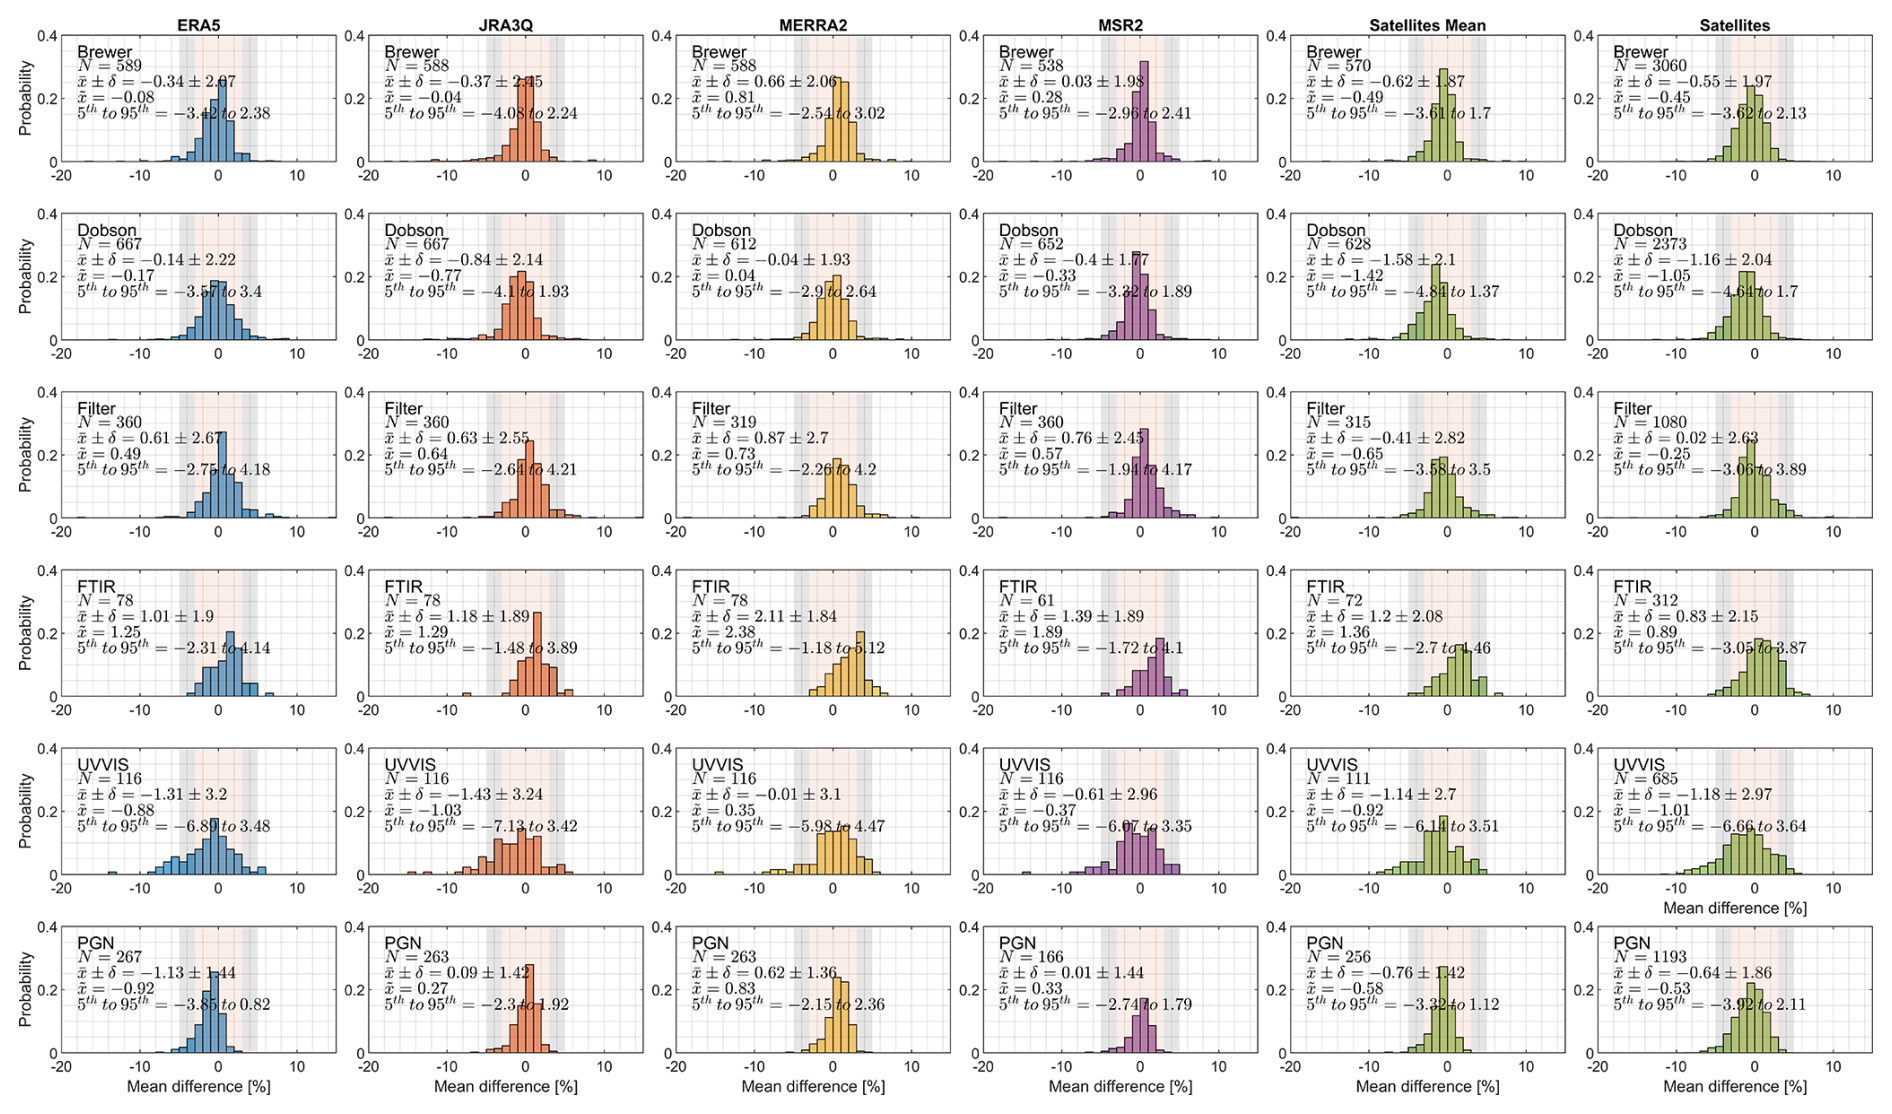
Figure 4Daily mean of ΔTCO; (Ground – X)/Ground, for the 1978–2024 period of each ground-based network. Each row shows the results from one ground-based network (from first to last as Brewer, Dobson, Filter, FTIR, UVVIS, and PGN); each column shows the results using specified comparison benchmarks (see the title in each column; from first to last as ERA5, JRA3Q, MERRA2, MSR2, satellites' mean value (average all satellites overpass), and all satellites (each satellite as individual inputs)). Detailed statistics are printed on each panel, including the number of data points, mean ± standard deviation, median, and 5th to 95th percentile.
The last column (satellites) also has panels for the three networks (FTIR, UVVIS, and PGN) that are assessed by the statistical model for the first time. In general, the distribution of the daily mean of ΔTCO also reflects the internal agreement between different instruments/sites within a network. For example, a network with a lower standard deviation value reflects that it could have a more harmonized data quality across its sites. Compared to the WMO/GAW reference networks (Brewer 1.97 and Dobson 2.04), PGN (1.83) and FTIR (2.15) show a comparably low standard deviation (although for a shorter time interval), while the other networks show slightly higher standard deviations (Filter 2.63 and UVVIS 2.77, but all within 3 %).
The first four columns of Fig. 4 are the results using the reanalysis data in the ΔTCO calculation. For most of the reanalysis-based results, the distribution of the daily mean of ΔTCO using reanalysis data is similar to the one using satellite observations. One clear exception is MSR2, which shows better agreement with the Brewer and Dobson networks (very narrow distributions with low standard deviation). This is because MSR2's assimilation process included satellite data corrections based on the Brewer and Dobson observations from some sites.
The analysis for the remaining four criteria is shown in Appendix B. Details of the designs for these criteria can be found in Fioletov et al. (2008). In general, the range of annual mean differences (i.e., the largest difference minus the smallest one) was used to assess non-local-condition-induced bias. The standard deviation of the daily difference is used to reflect the precision of the daily values. The standard deviation of the monthly mean difference is used to determine both the short-term and long-term differences. The seasonal amplitude of the difference accounts for the fact that some ground-based retrievals are affected by errors in extraterrestrial constants, stray light, and effective ozone temperature changes more than others. In general, a well-calibrated ground-based instrument should have a relatively stable seasonal amplitude of the difference when compared to fixed comparison data. Together, these five criteria were calculated for each individual network by using either reanalysis data or satellite observations, respectively.
4.3 Statistical model and the general performance of ground-based networks
The statistical model is built on the threshold criteria defined in Sect. 3.2, and details for the parameters derived from the datasets are provided in Appendix C. The thresholds for statistical characteristics of the difference between ground-based network observations and reference data (either satellites or reanalysis datasets) are illustrated in Fig. C1. Unlike Fioletov et al. (2008), who used a group of fixed parameters for all networks (see their Table 4), in this work, we used parameters derived specifically for each network. This accounts for several factors. First, the distribution of the daily mean difference from different networks is different, and they are not necessarily normally distributed. Second, unlike the previous work, which only had satellites as the comparison data, we have new comparison targets: four reanalysis datasets. Apparently, different reanalysis datasets have different issues (e.g., systematic, latitudinal, or seasonal bias), and the same group of fixed parameters could not fit all conditions (i.e., the fixed parameters derived only from Brewer and Dobson networks will make the statistical model wrongly categorize more data into suspect or outlier due to reanalysis data issues). For example, if a network has 10 % low-quality data, no matter which comparison dataset we select, we should ensure we still only report 10 % of the network has low-quality data. Thus, this threshold change should not affect the goal of the work, i.e., to detect the problematic ground-based observation data, or more precisely, to detect problematic sites from the ground-based networks.
As discussed above, the parameters derived for each network using different comparison data have different values. This feature also reflects the fact that some reanalysis data have less agreement with ground-based networks than others. However, even for the comparison data that have the highest threshold limits (meaning it has lower agreement with ground-based data than others), we can still use it for general ground-based data quality checks if we only use the comparison dataset to detect the outliers and suspect data points based on its own statistics. In summary, using such independent thresholds, we also ensure that different reference data would report similar amounts of low, medium, or high-quality data. This is important when we merge the final results from satellites and all reanalysis datasets, i.e., as independent referees, each “voter” (satellites or reanalysis datasets) would not be biased due to any bias induced by statistical thresholds. For example, if we only use Brewer and Dobson versus satellite-derived thresholds (which are stricter than other pairs), ERA5 or other reanalysis could artificially flag more low and medium-quality data. This is also true for other ground-based networks, which might have lower quality (such as lower precision) than Brewer and Dobson networks, and would be labelled with more low and medium-quality data. For instance, it is well-known that the UVVIS network has lower precision than the Brewer and Dobson networks; using the Brewer and Dobson criteria for the UVVIS network would artificially label more UVVIS data as problematic.
It should also be mentioned that the criteria were the same for all sites and did not depend on latitude. As a result, polar sites with difficult observational conditions more often get evaluated as “with issues” compared to sites at lower latitudes. This is a limitation of the statistical method employed, not necessarily a real degradation of instrument performance. For a given site, its performance within a single time bin (5 years) is labelled as “suspect” or “outlier” if a certain characteristic of the ground-based to satellite/model difference (ΔTCO) is outside the limits shown in Fig. C1. These limits correspond to the 90th and 95th percentiles estimated for each individual network by using different comparison data (satellites or reanalysis datasets). Next, following Fioletov et al. (2008), for every 5 years, we identify a site as one with minor issues (data quality as medium) if its record in this time bin has either (1) one to three “suspect” characteristics or (2) one “outlier” with zero or one “suspect” characteristics. If a site in this time period has a greater number of “suspect” or “outlier” characteristics, it will be labelled with major issues (data quality as “not assured”). This categorization is summarized in Table 1. Note that, different from the determination of statistical criteria in Sect. 3.2, where we treated each individual satellite as an independent comparison target (to increase the number of data points for reliable statistics; minimize the impact of problematic satellite records), all satellite records are averaged to generate the comparison target in the step of statistical model analysis. One could use an individual satellite record as a comparison target in the statistical model analysis; however, that approach would lead to 20 satellite assessments. Reasonably merging all satellite assessments into one result is challenging, given that these assessments cover different periods of time and potentially have different qualities. Using methods such as “one-vote vote” (i.e., if any satellite labels a site in a period as “suspect”, we will label that data as suspect), majority vote, or the Dempster–Shafer (DeSh) method (Hall and Llinas, 1997; Shafer, 1976) (will be introduced and discussed in Sect. 4.1) all have their own issues and then are avoided here.
Table 1Data quality categorization based on the statistical characteristics.
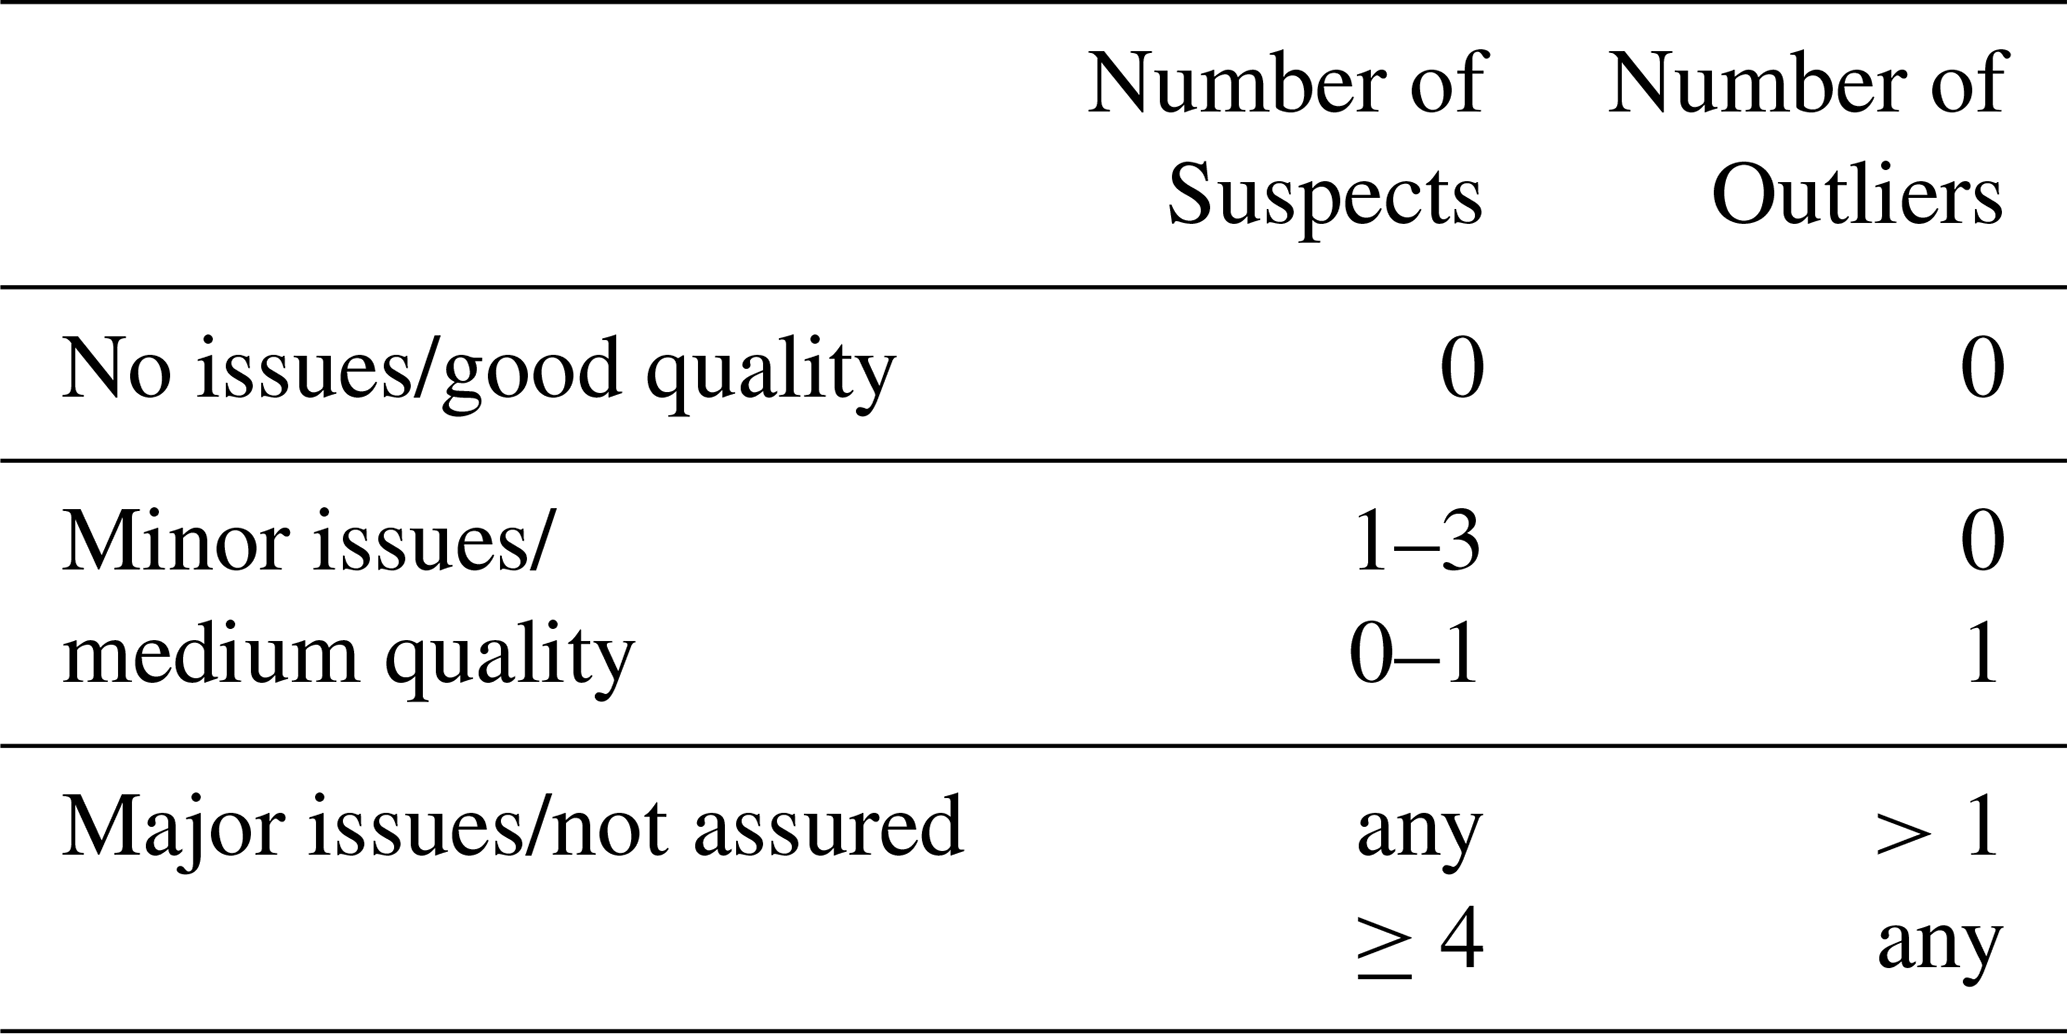
Figure 5a shows the results of using satellites as the comparison target in this statistical model. The bar plot is colour-coded for each network, with shaded parts (in light colours) representing the percentage of sites that have high-quality data records and no issues were detected by the statistical model. The solid parts are stacked on top, representing the sites that have medium-quality data records for that period with some minor issues. I.e., the top of the solid bars shows the percentage of observations that have no or minor issues, which can be used for most research applications (such as satellite validation and trend analysis). The bottom of the solid bars shows the percentage of observations that have no issues, which can be used for studies which need more assured results (such as validation or verification of high-precision ground-based instruments). The sites that have major issues found by the statistical model are plotted with gray bars (with a top-to-bottom direction). Typically, most networks have <20 % sites that have reported such “not assured” data. Some gaps between gray bars and colour bars represent the sites which reported data but cannot be assessed by the statistical model using satellites as a reference. This happens mostly because the coincident high-quality satellite overpass data is fewer than the required number to calculate the statistics. Also, except for TROPOMI, the overpass data used in this work, provided by NASA, did not cover all ground-based sites. Reprocessing some historical satellite records for all ground-based sites is not the focus of this work. Figure 5b, using reanalysis datasets as the comparison target, shows no such gaps in the assessment, with the assessment extended to before the 1970s.
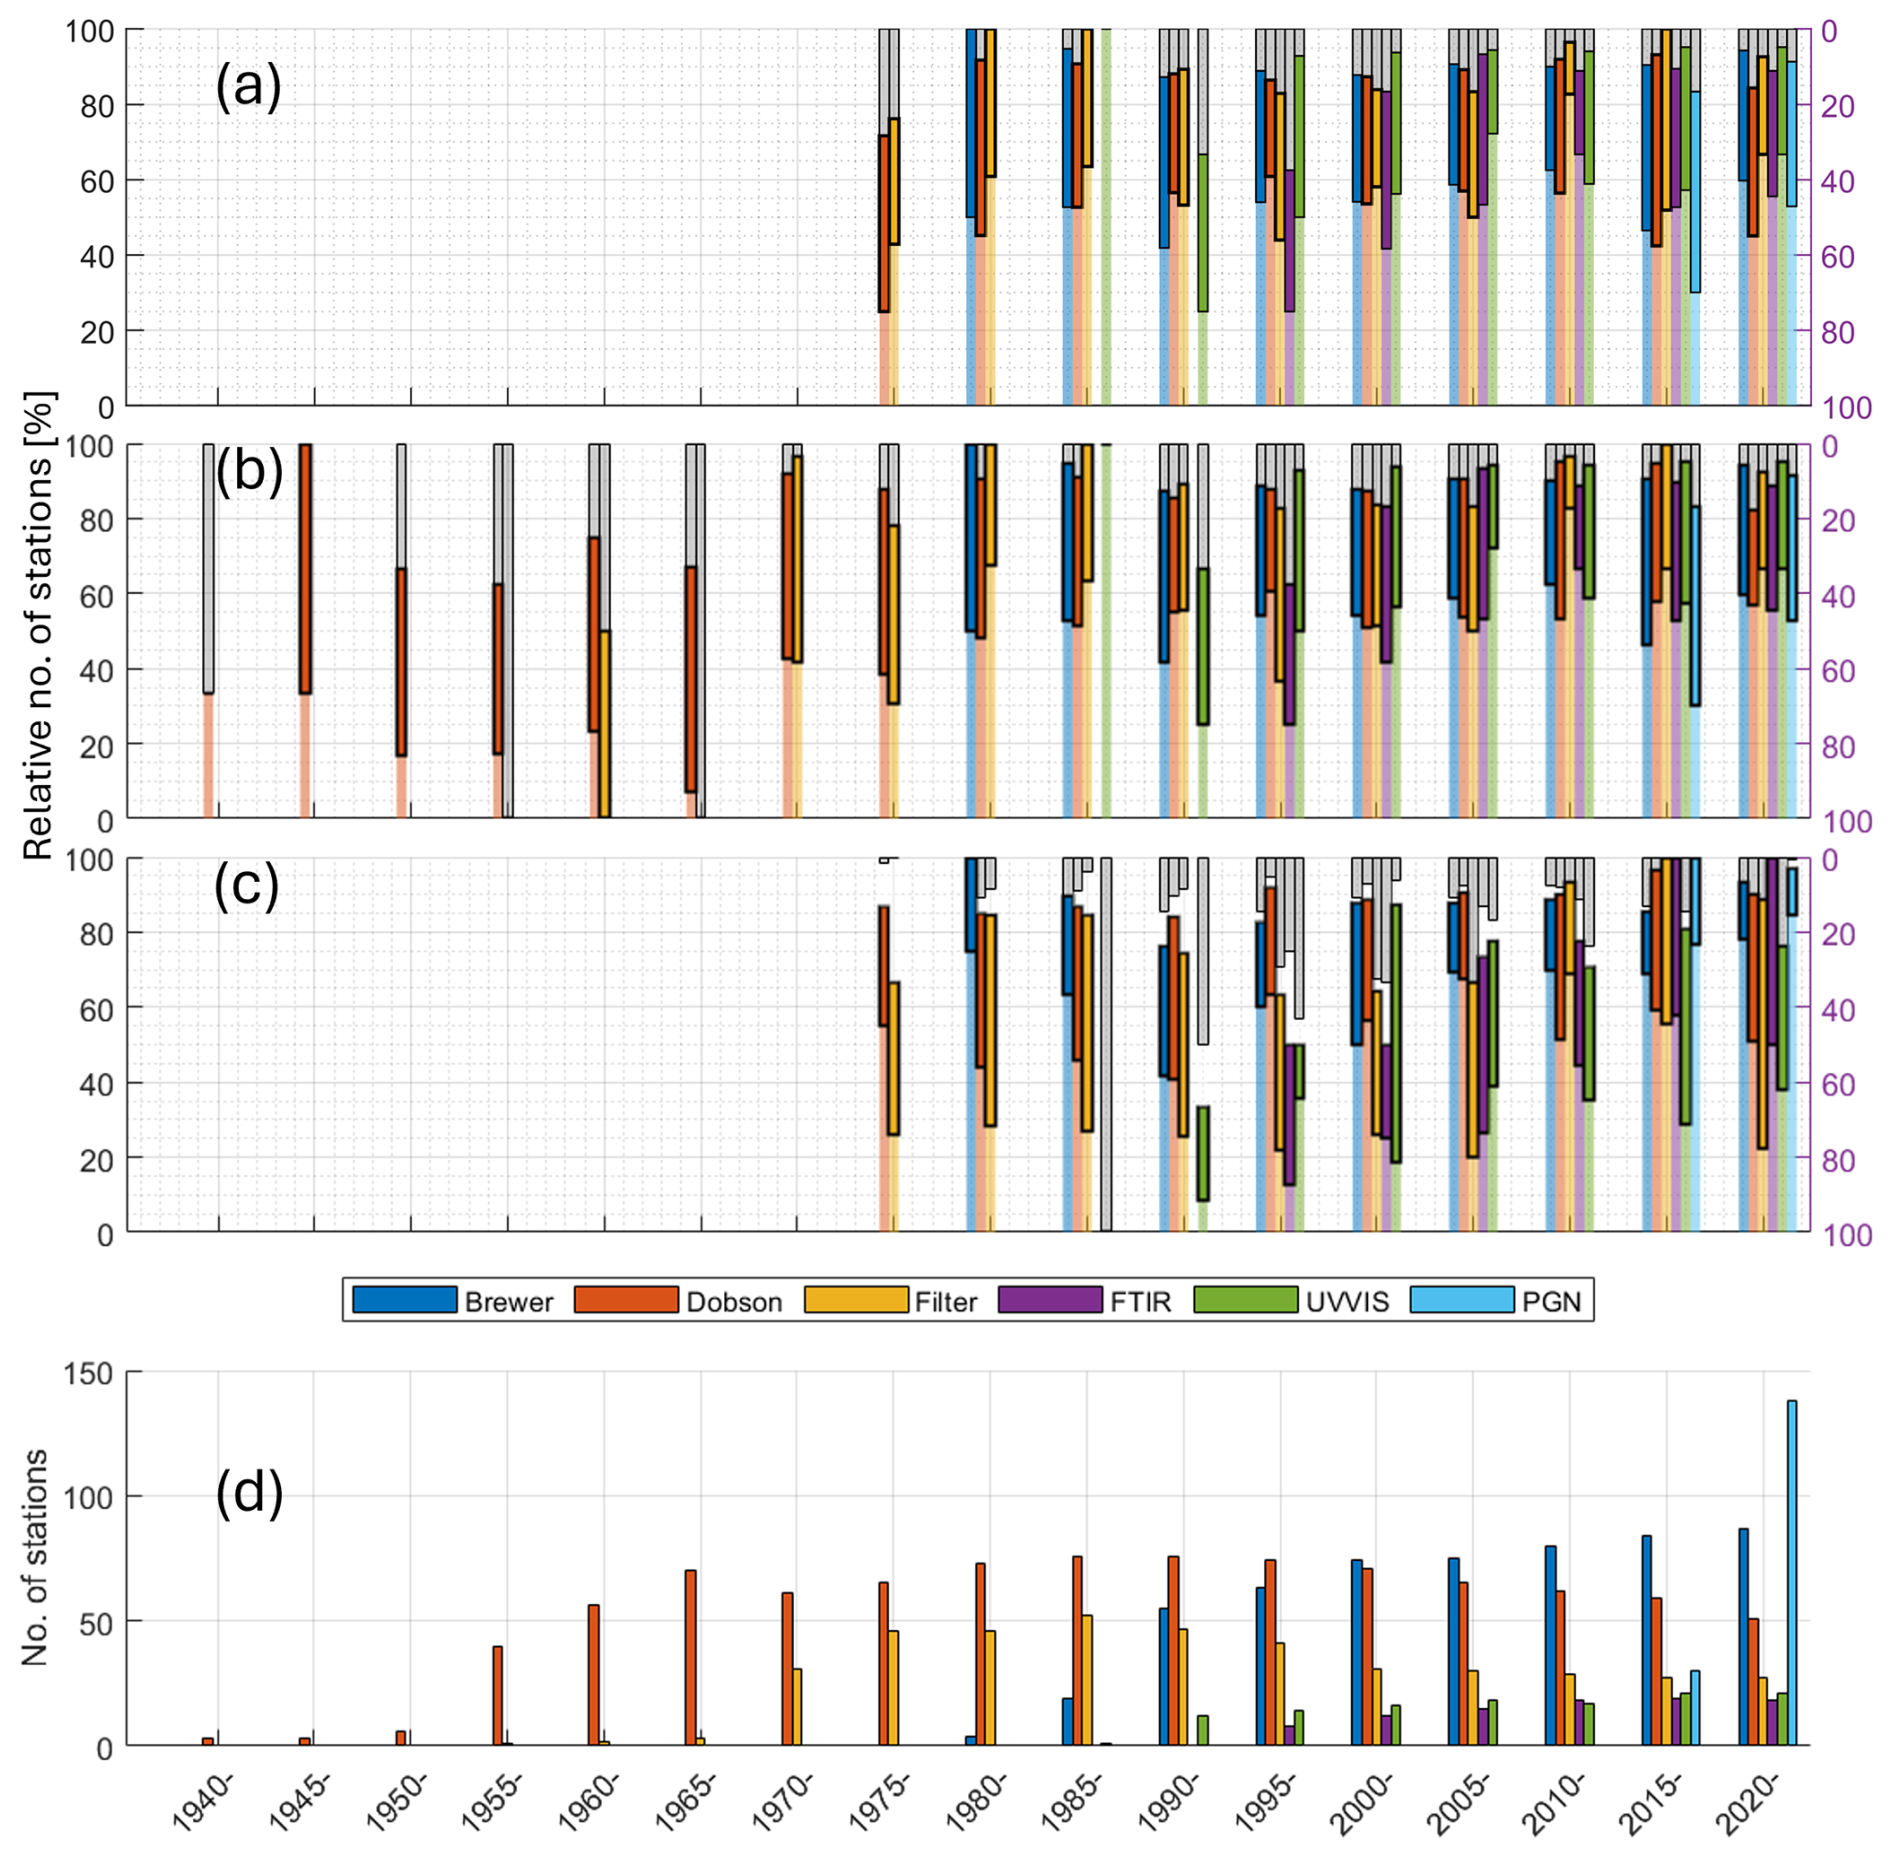
Figure 5Station flag. Panels (a) to (c): shading bars are sites with “no issues”; stacked solid bars are sites with minor issues; sites with major issues are plotted as gray bars. Panels (a) and (b) are the results of employing network-dependent statistical thresholds, and using (a) satellites and (b) reanalysis datasets as the comparison target, respectively. Panel (c) is the result of employing the same statistical thresholds for all six networks, and using satellites as the comparison target. Panel (d): number of all available sites.
Figure 5c shows the results using satellites as the comparison target, but with fixed statistical thresholds following Fioletov et al. (2008), i.e., using “Dobson and Brewer criteria” to assess the performance of all six networks. A few important features of Fig. 5c should be mentioned here. First, the percentage of high-quality sites for Dobson and Brewer networks increased compared to Fig. 5a. This is due to the thresholds built in Fioletov et al. (2008) not being strict from the statistics of 5th and 95th percentile values, but generalized numbers (and even slightly relaxed). As the results, when we use those thresholds from Fioletov et al. (2008), it is in fact a relaxation for Brewer and Dobson networks. Second, for Filter, FTIR, and UVVIS networks, these “Dobson and Brewer criteria” thresholds are stronger than those derived from their own statistics. As a result, a smaller percentage of stations are categorized as high quality. The exception is PGN, which shows more high-quality stations in Fig. 5c compared to 5a, indicating its similar performance to Brewer and Dobson records.
As the goal of this work is to improve the quality of the ground-based network observations by identifying potential problematic sites and periods for each network, in the rest of the work, the network-dependent thresholds are used (i.e., the results from Fig. 5a and b).
Besides the general health conditions for these networks, Fig. 5d shows the number of stations that change over time. On WOUDC, the early Dobson total ozone observations date back to 1924. Here, as the longest comparison data (ERA-5) we have only back to the 1940s, we assessed the Dobson records only since then. The rapid increase of Dobson instruments started with the formal formation of the Dobson network in IGY1957-1958. The Dobson network reached its peak in the 1985–1994 period with 76 active sites globally and now has decreased to 51 sites. As the other WMO/GAW reference network, the Brewer network started in the 1980s now gradually increased to 87 active sites (with six unique active sites from EUBrewnet, which are not included on WOUDC) and is the largest reference ozone network. The Filter network reached 52 active sites around the same peak time as the Dobson network, and now shrunk to only 20 sites located mostly in Russia. NDACC FTIR and UVVIS networks started in the 1990s have 22 and 17 sites reporting total ozone data in the past 5 years. The youngest network, PGN, has had rapid growth since 2015 and by early 2024 has 138 active sites reporting total ozone.
5.1 Performance of WMO reference networks
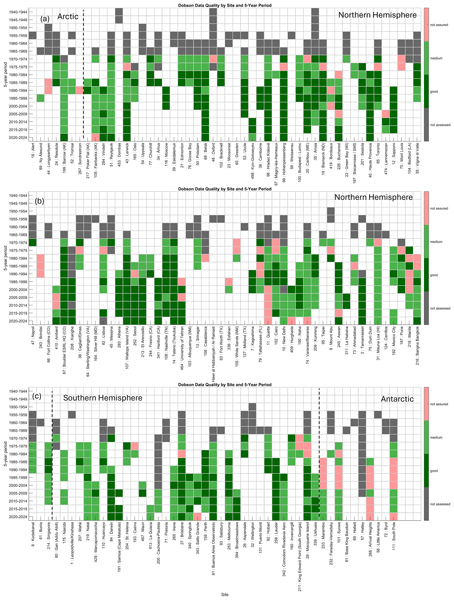
As illustrated in Sect. 3.3, when only using satellites as the comparison data, the assessment can only go back to the 1970s. For example, Fig. 6 below shows the assessment results for Dobson sites. Each tile represents a measurement of total ozone from a site for 5 years. The dark green colour represents the data has “no issue” and good quality; light green represents the data has “minor issues” identified by the statistical model and labelled as medium quality. A red tile means the model identifies some “major issues” and the data quality can not be assured by our statistical model (i.e., the end user should exercise extra caution when using that data). Note that the assessment is done for 5-year bins; thus, it is possible that one site has only 1 year of low-quality data, but still causes the whole tile to be coloured in red. The statistical model can only assure good and medium data for a period, and it should not be simply interpreted as bad data for that entire period for any red tile. Last, the gray tile shows the period for which there are ground-based measurements, but the statistical model can not make an assessment due to the lack of comparison satellite data. The sites are sorted by latitude from north to south. Figure 6 shows that most Dobson sites have very healthy records. As the anchor point for the entire Dobson network, the world reference Dobson at the Boulder site shows good results (Fig. 6b). Despite their high data quality, the declining Dobson network and reliance on fewer long-term stations pose concerns for long-term continuity.
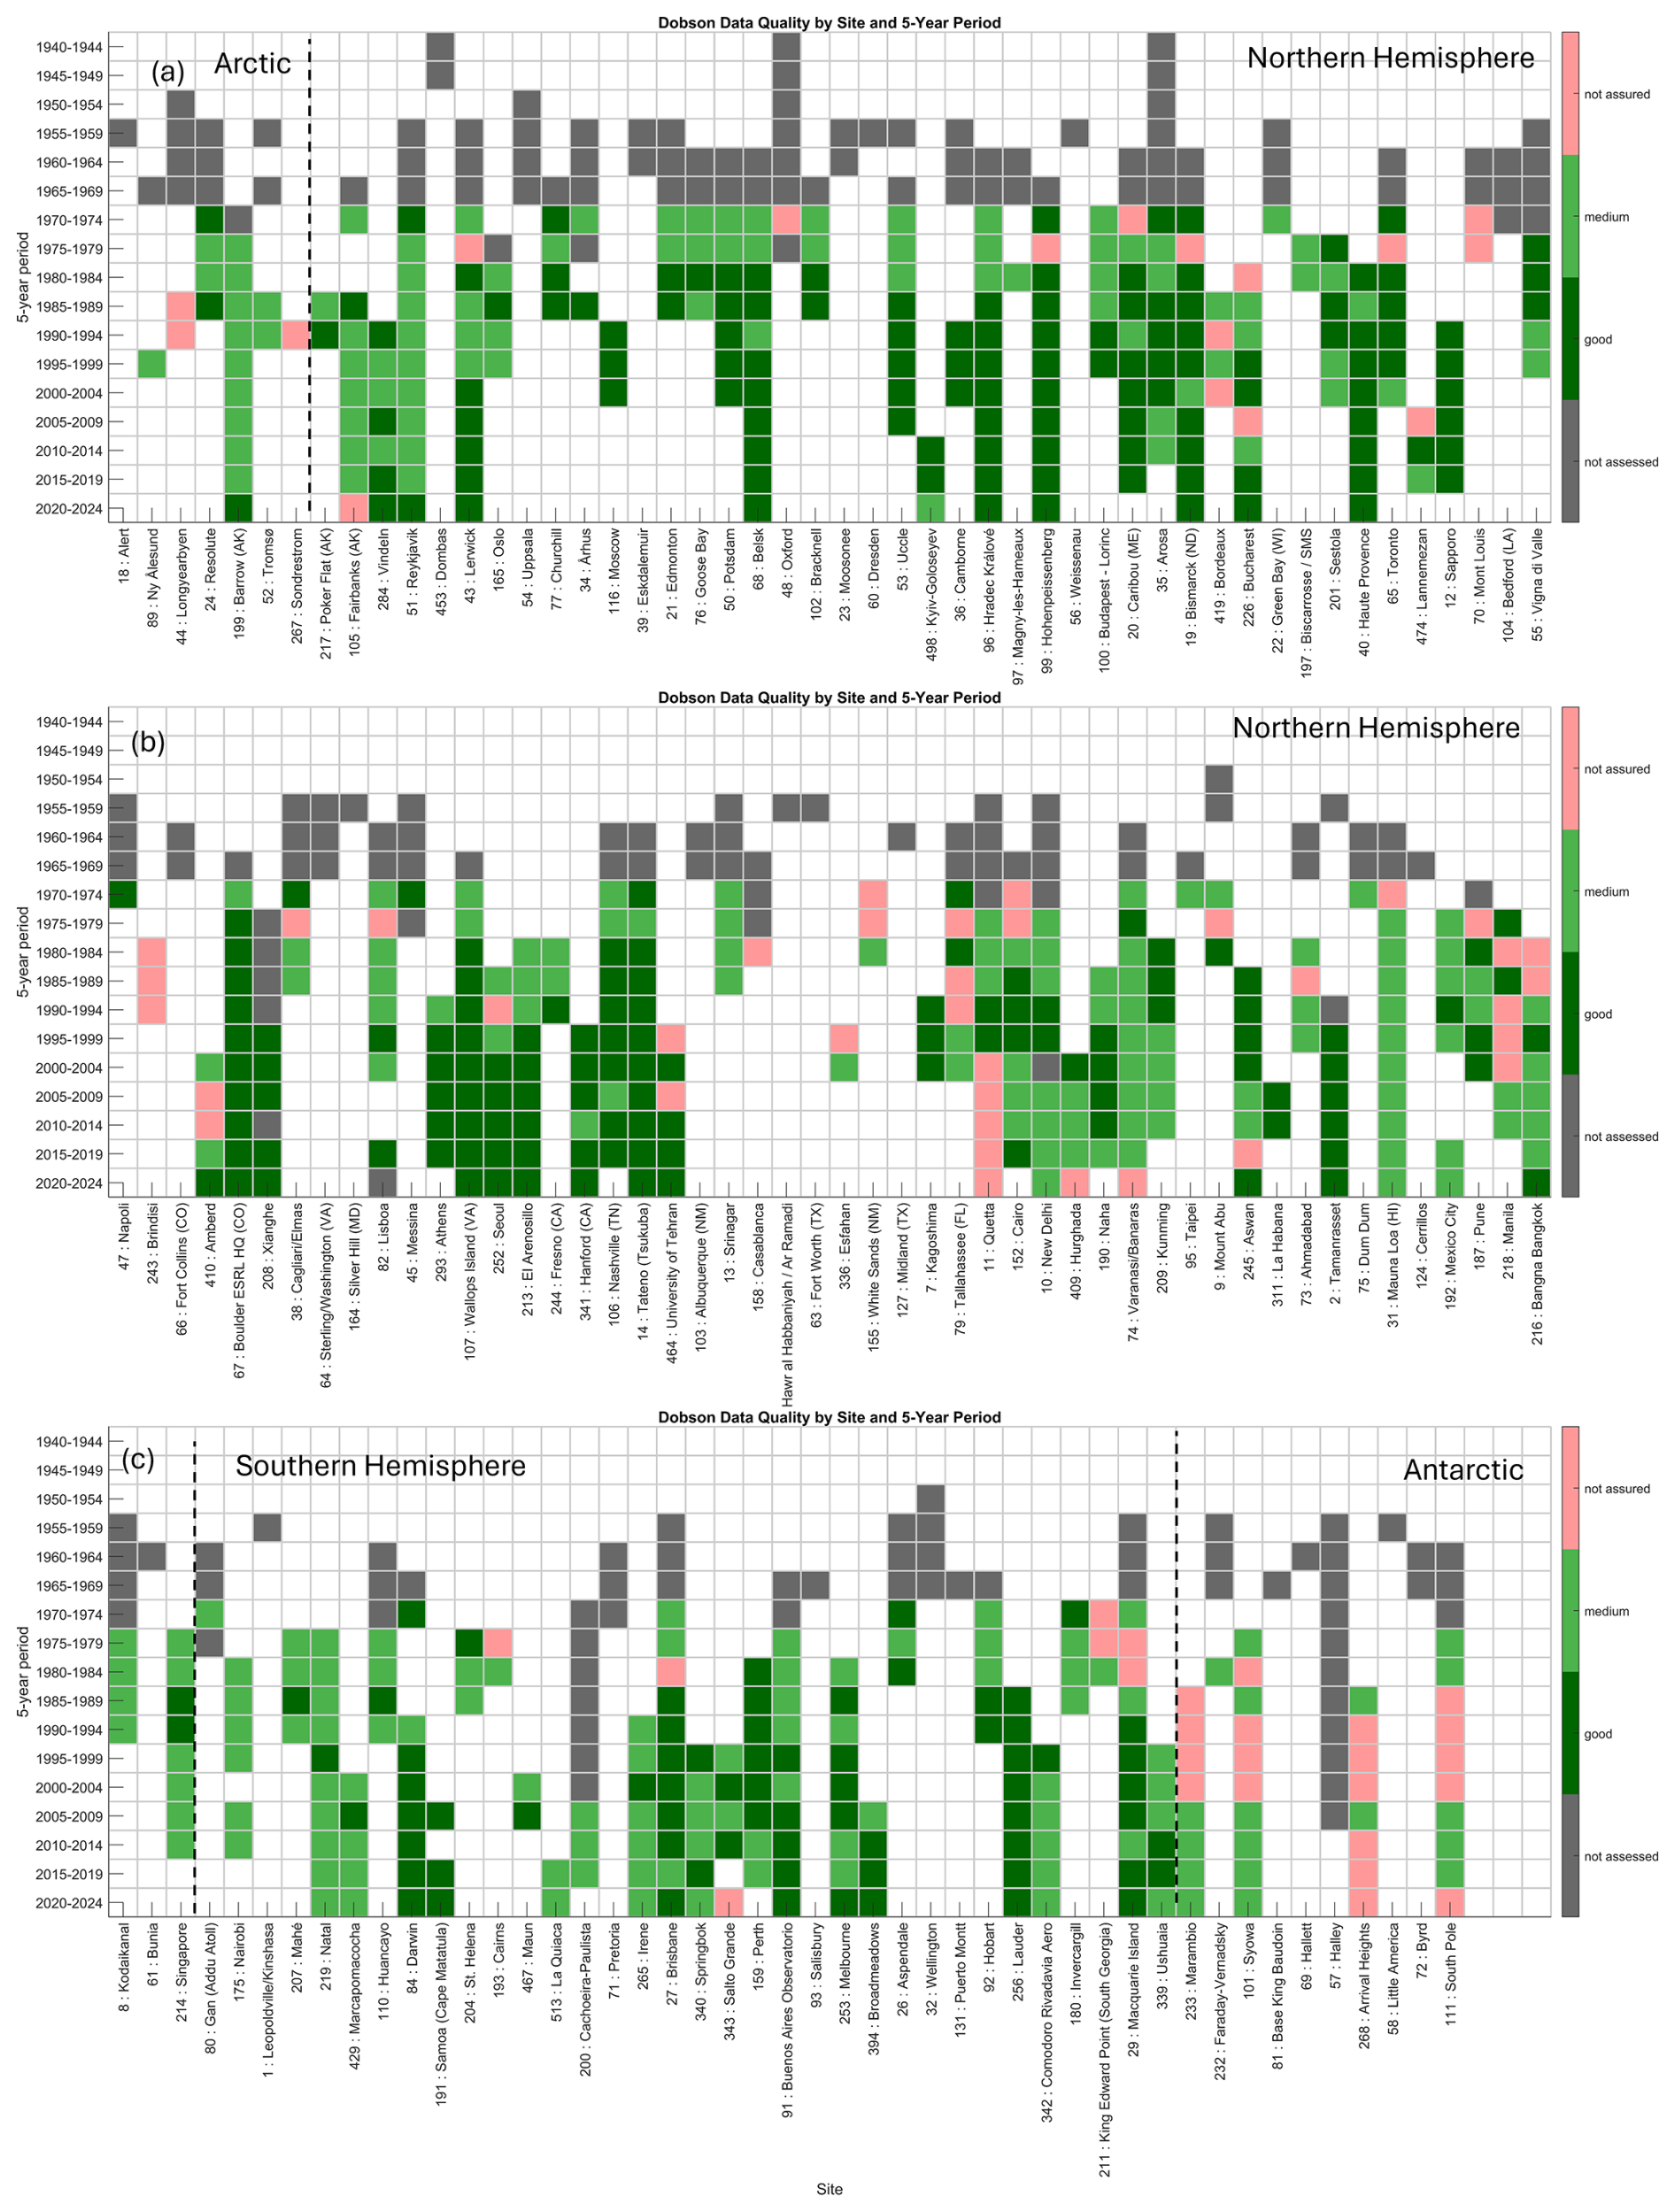
Figure 6Heatmap of data quality for Dobson sites assessed using satellite measurements. The assessment results are colour-coded for each tile and labelled on the legend; assessment criteria are determined based on Dobson network records (which only reflect Dobson networks' internal performance). The stations' WOUDC ID number and name are printed on x-axis ticks. Sites are sorted by latitude from north to south. Vertical dashed lines separate the sites into four regions: Arctic, Northern Hemisphere, Southern Hemisphere, and Antarctic.
Utilizing the reanalysis data, we expanded the assessment to cover the pre-satellite era. Using reanalysis datasets along with satellites as the comparison benchmarks, we can have multiple assessments (produced by using each comparison target). As the reanalysis may have systematic issues (e.g., see Fig. 2c, where ERA-5 and MERRA-2 show a 3 % bias in recent decades), they are used as independent comparison benchmarks, and their assessments are then merged into one using the Dempster–Shafer (DeSh) method (Hall and Llinas, 1997; Shafer, 1976). The major reason for employing the DeSh method is to deal with the tiles for which reanalysis datasets have conflicting results (e.g., if some models labelled the tile as not assured, but some other models labelled the tile as medium or good). In general, the DeSh method will yield the same results as majority votes when there is a majority from four reanalysis datasets for a tile. For the tiles for which no majority was found, conflict scores will be calculated for each model to determine their reliability (i.e., the model that always has conflicts with others will receive a higher conflict score and then “punished” in the conflicted voting).
Figure 7 shows the results for Dobson sites, as in Fig. 6, but assessed by reanalysis datasets. In general, the pattern of the data quality for most sites is maintained when switching the comparison benchmarks to reanalysis datasets. This result extends our knowledge of the historical datasets, for example, the European Dobson references at the Arosa site show high-quality results since the 1940s. It is worth mentioning that the Dobson instruments at the Arosa site have now been relocated to the Davos site. Stübi et al. (2017, 2021) analyzed the relocation and concluded the effect is <0.5 %. Ongoing homogenization efforts to produce a generic Arosa-Davos Dobson record are in progress. Another feature of Fig. 7 is that more “not assured” tiles are found in the pre-satellite era. Note that the “not assured” category needs to be interpreted as some level of concerns have been identified by using the comparison data for a 5-year period. Thus, the results are only as good as the accuracy the comparison data can provide and are only a general mark for that period. A detailed site-by-site and year-by-year review is strongly recommended when using these pre-satellite era records for ozone trend analysis. Lastly, this is the first time reanalysis data have been used for the ground-based network performance survey. Utilizing reanalysis data in such work reduces the impacts of potential issues with individual satellite records. Besides, reanalysis records can be easily extracted for any location and date. However, note that the quality of the reanalysis records is not always uniform, as there are clear quality changes before and after the satellite total ozone observations became available in the 1970s.
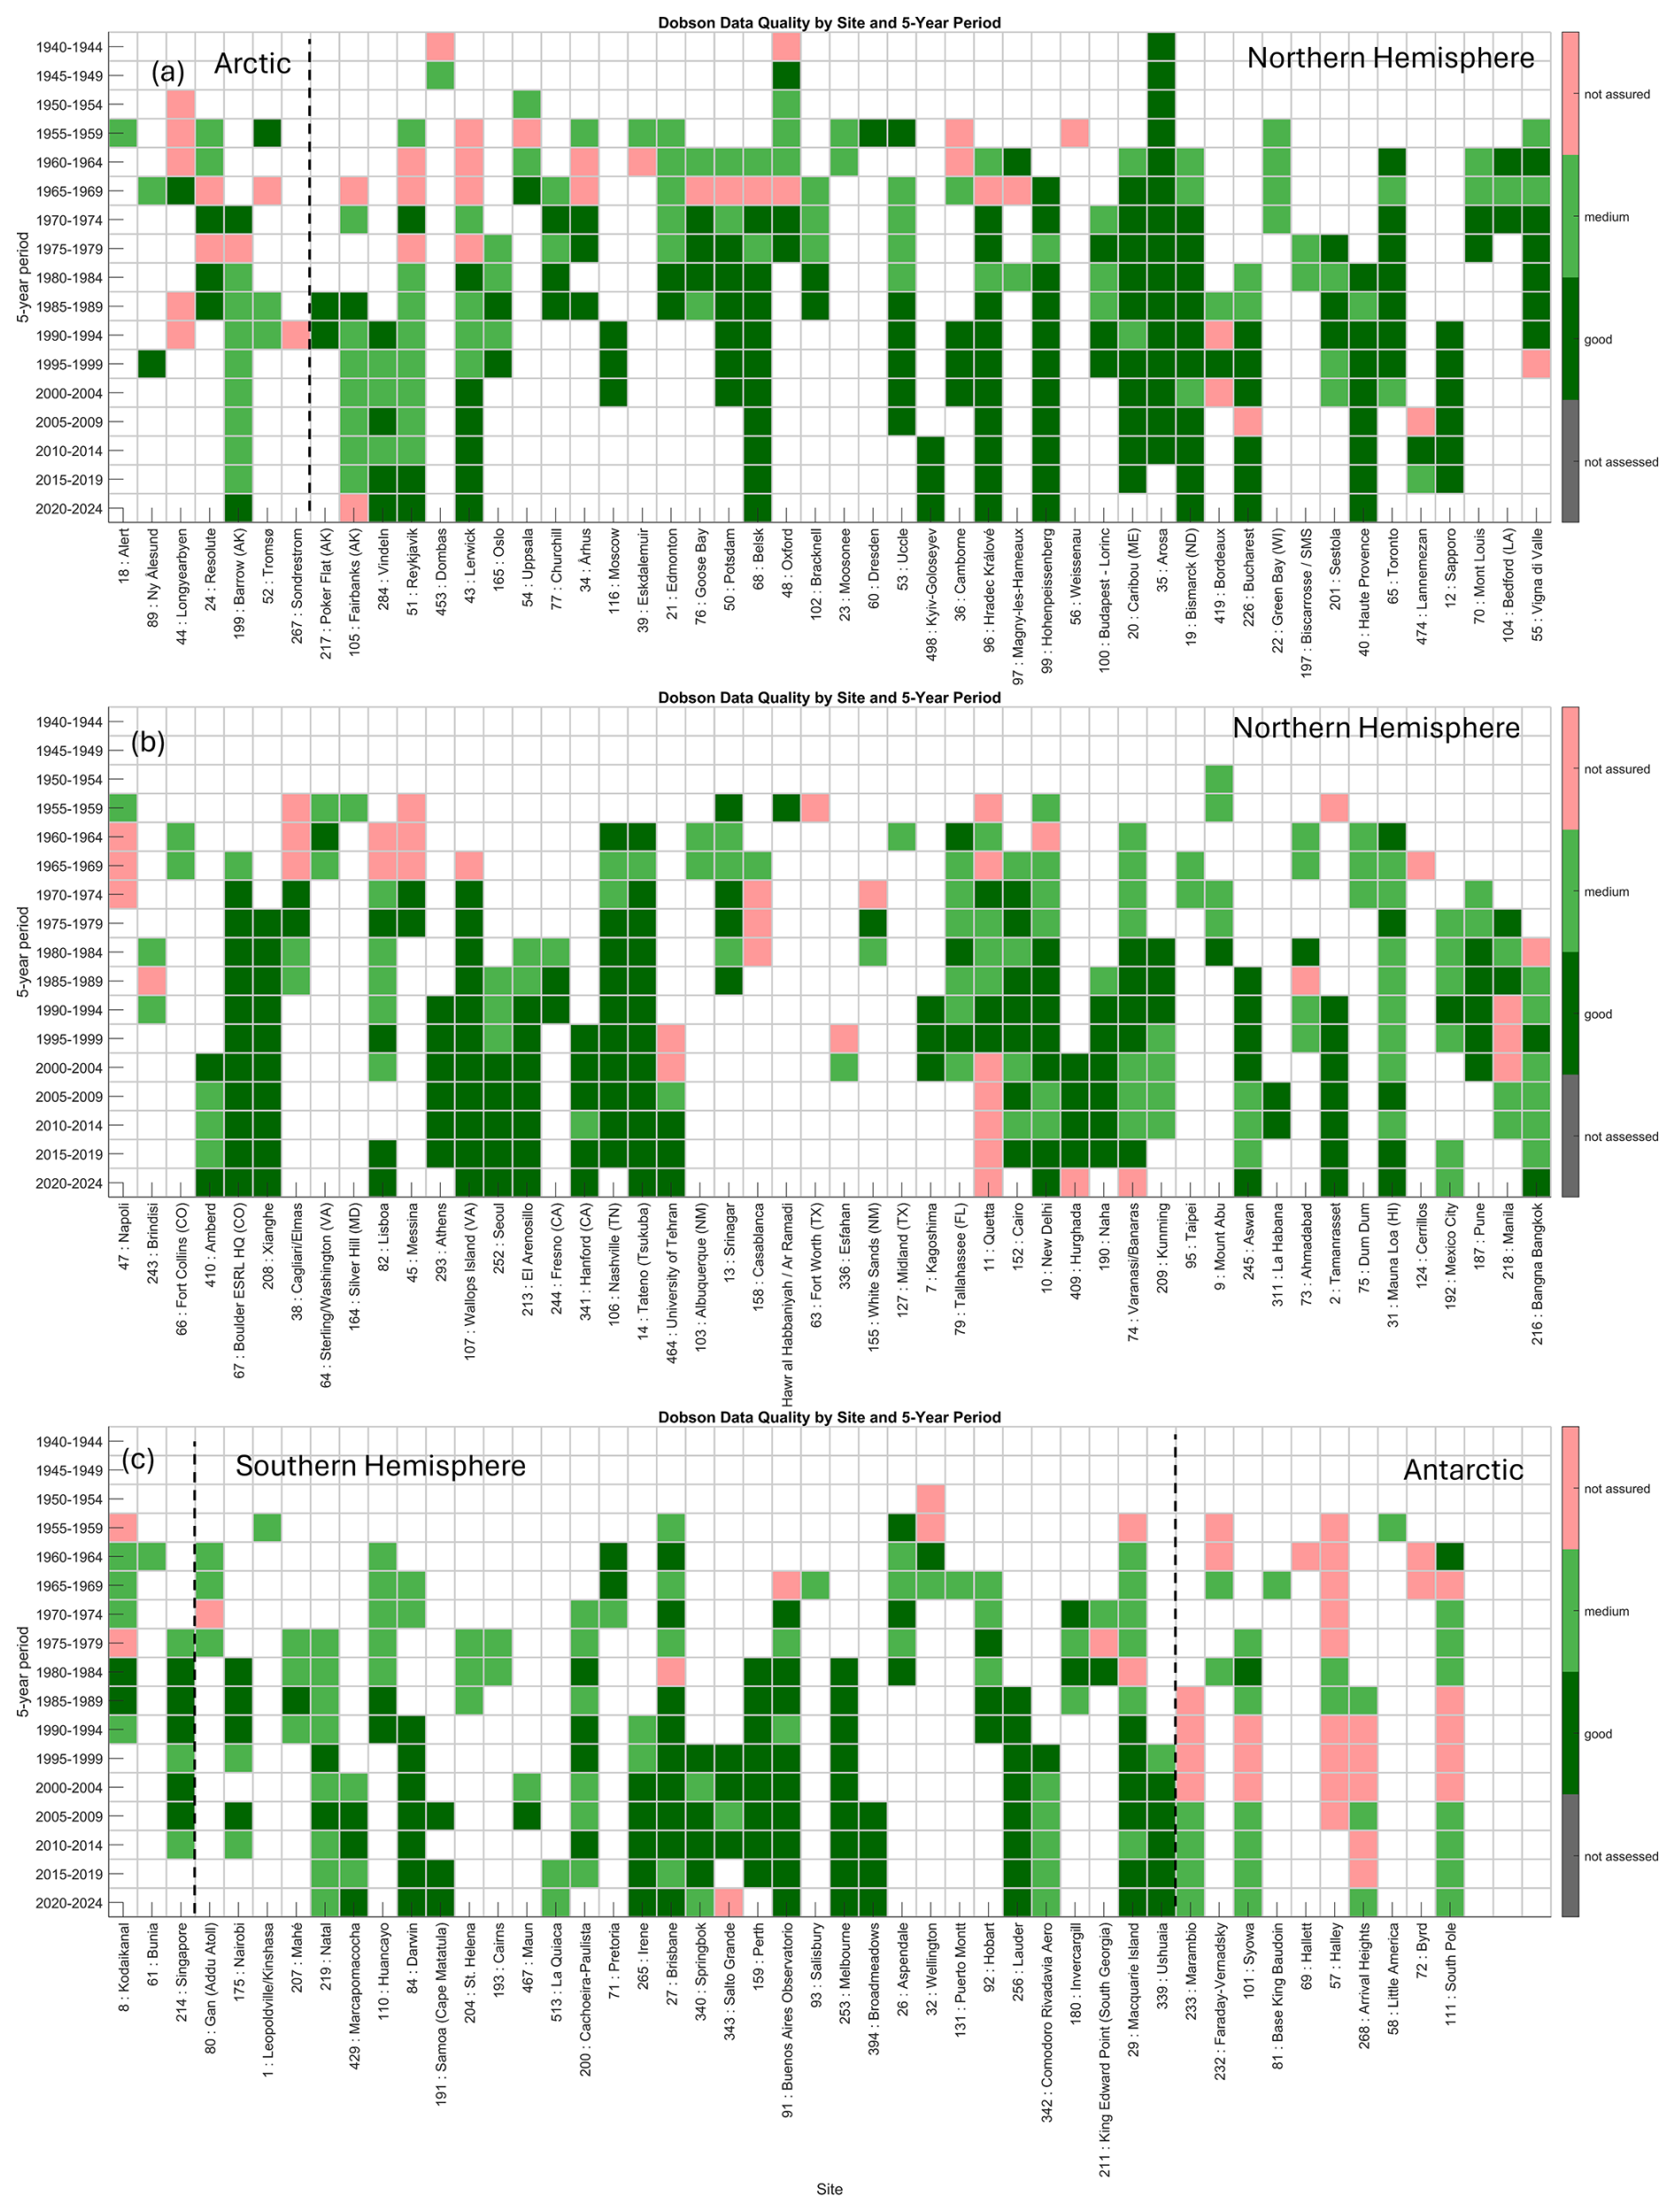
Figure 7Same as Fig. 6, but assessed using reanalysis datasets. Note that the assessment criteria are determined based on Dobson network records (which only reflect Dobson networks' internal performance).
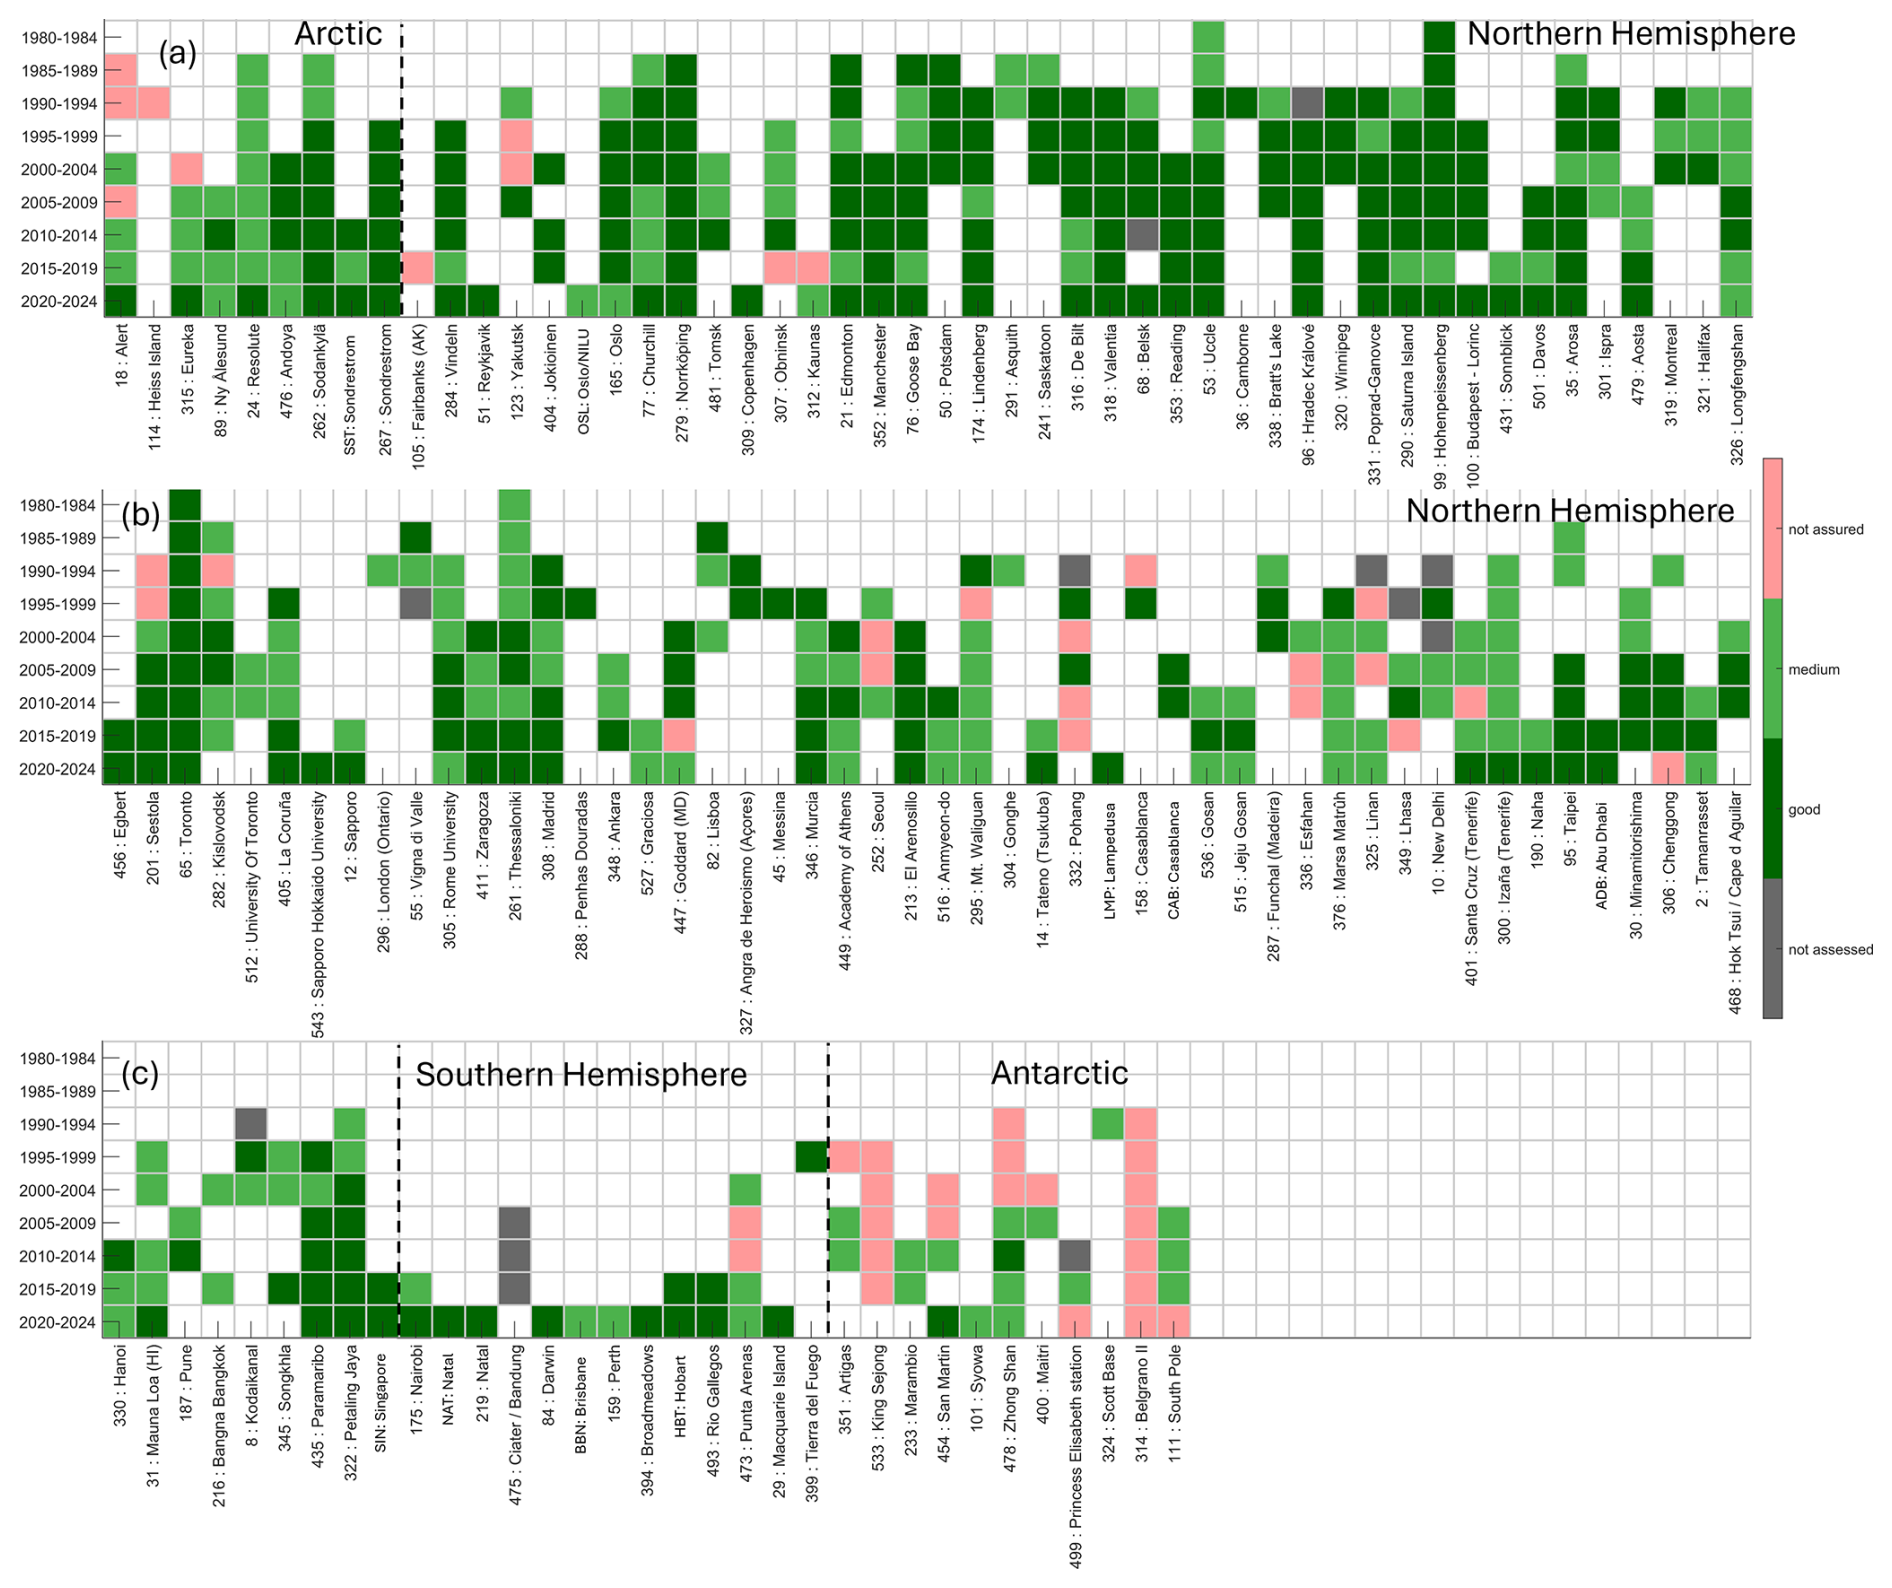
Figure 8Same as Fig. 6, but the results are for the Brewer network and assessed using satellite measurements. Note that the assessment criteria are determined based on Brewer network records (which only reflect Brewer networks' internal performance).
The Brewer network assessed by satellites is shown in Fig. 8. Brewer records only go back to the 1980s, which can be assessed by satellites. Some gray blocks are due to not enough coincident satellite observations defined by the criteria in the statistical model. A similar assessment was done by using reanalysis datasets and shows consistent patterns (not shown here). The world reference Brewer at the Toronto site and the European regional reference Brewer at Izana show good results.
For Figs. 6 to 8, as the statistical criteria are generated by the entire network, statistical filters such as the range of annual mean or even monthly standard deviation are stricter for polar regions (where the natural variability of total ozone is much larger) than they are for mid-latitude or low-latitude regions. As a result, Figs. 7 and 8 show more “not assured” and “medium” tiles in the polar regions (e.g., see Fig. 8a and c). These artifacts in the assessment should be considered when interpreting the results from this work. However, this is also not to say that all red tiles in the polar regions are wrongly categorized. For example, Fig. 8c shows a red tile for WOUDC station no. 499 (Princess Elisabeth Station) in the 2020–2024 period. This is confirmed by the local team due to HG lamp failure in seasons 2022/23 and 2023/24. Brewer no. 100 was then shipped back for the scheduled calibration (in June 2024) at the Royal Meteorological Institute of Belgium; the issue was fixed, and Brewer no. 100 started well in December 2024 in Antarctica again.
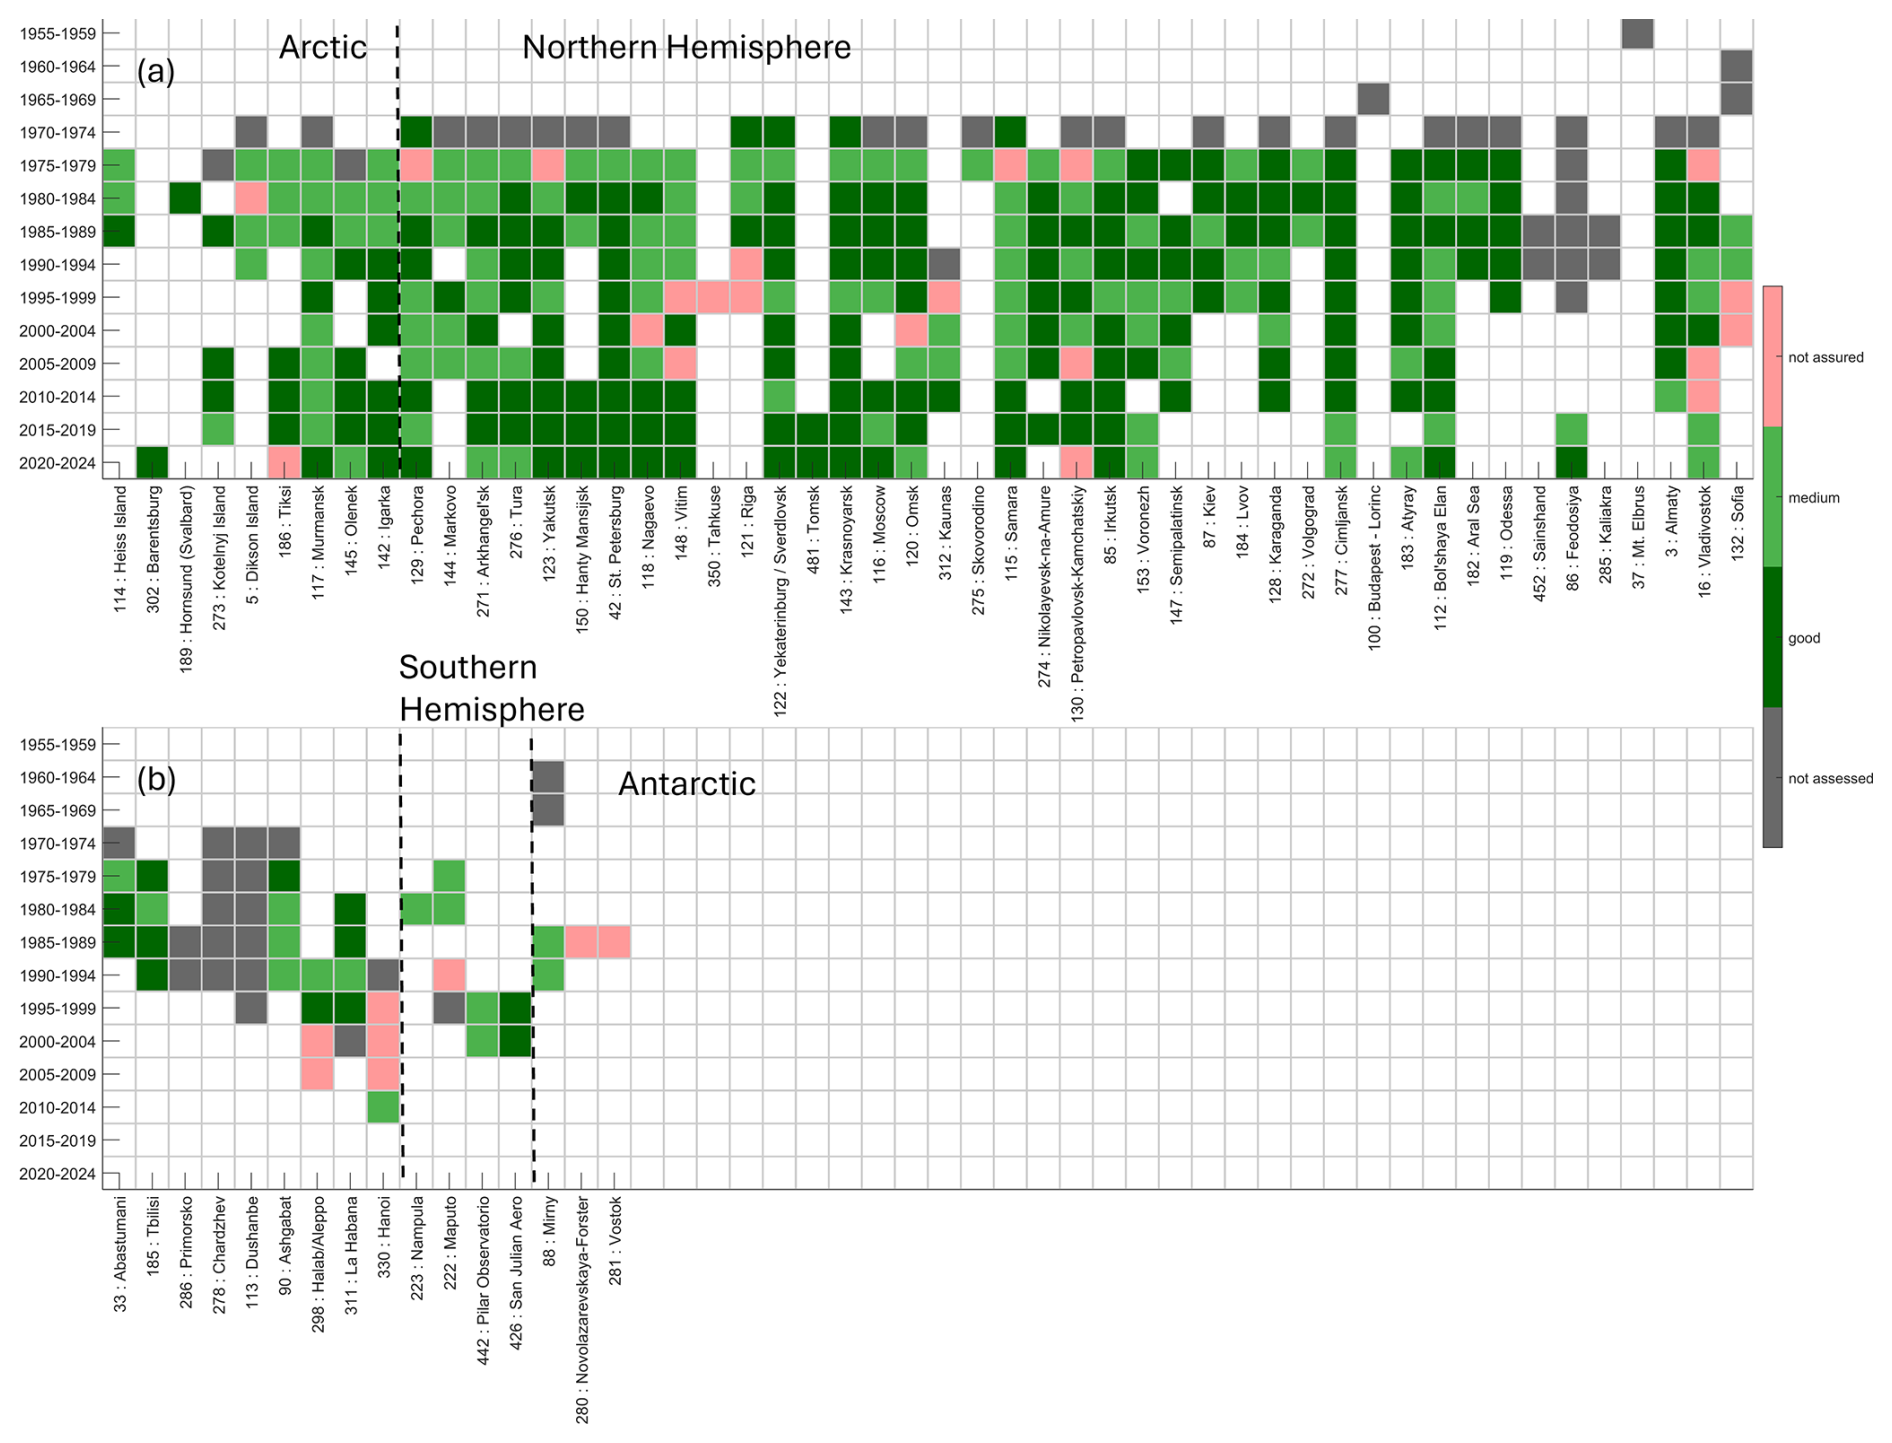
Figure 9Same as Fig. 6, but the results are for the Filter network and assessed using satellite measurements. Note that the assessment criteria are determined based on Filter network records (which only reflect Filter networks' internal performance).
5.2 Performance of Filter, FTIR, UVVIS, and PGN
Figures 9 to 11 show the results for the remaining four total ozone monitoring networks. Although the number of sites for the Filter network decreased by half in the late couple of decades, the network's general performance is fine, with a few sites that might need attention. It is worth noting that the Filter network's headquarters, WOUDC station no. 42, St. Petersburg (reference site for the network with the national reference Dobson instrument), has good records, which ensured the performance of the entire Filter network.
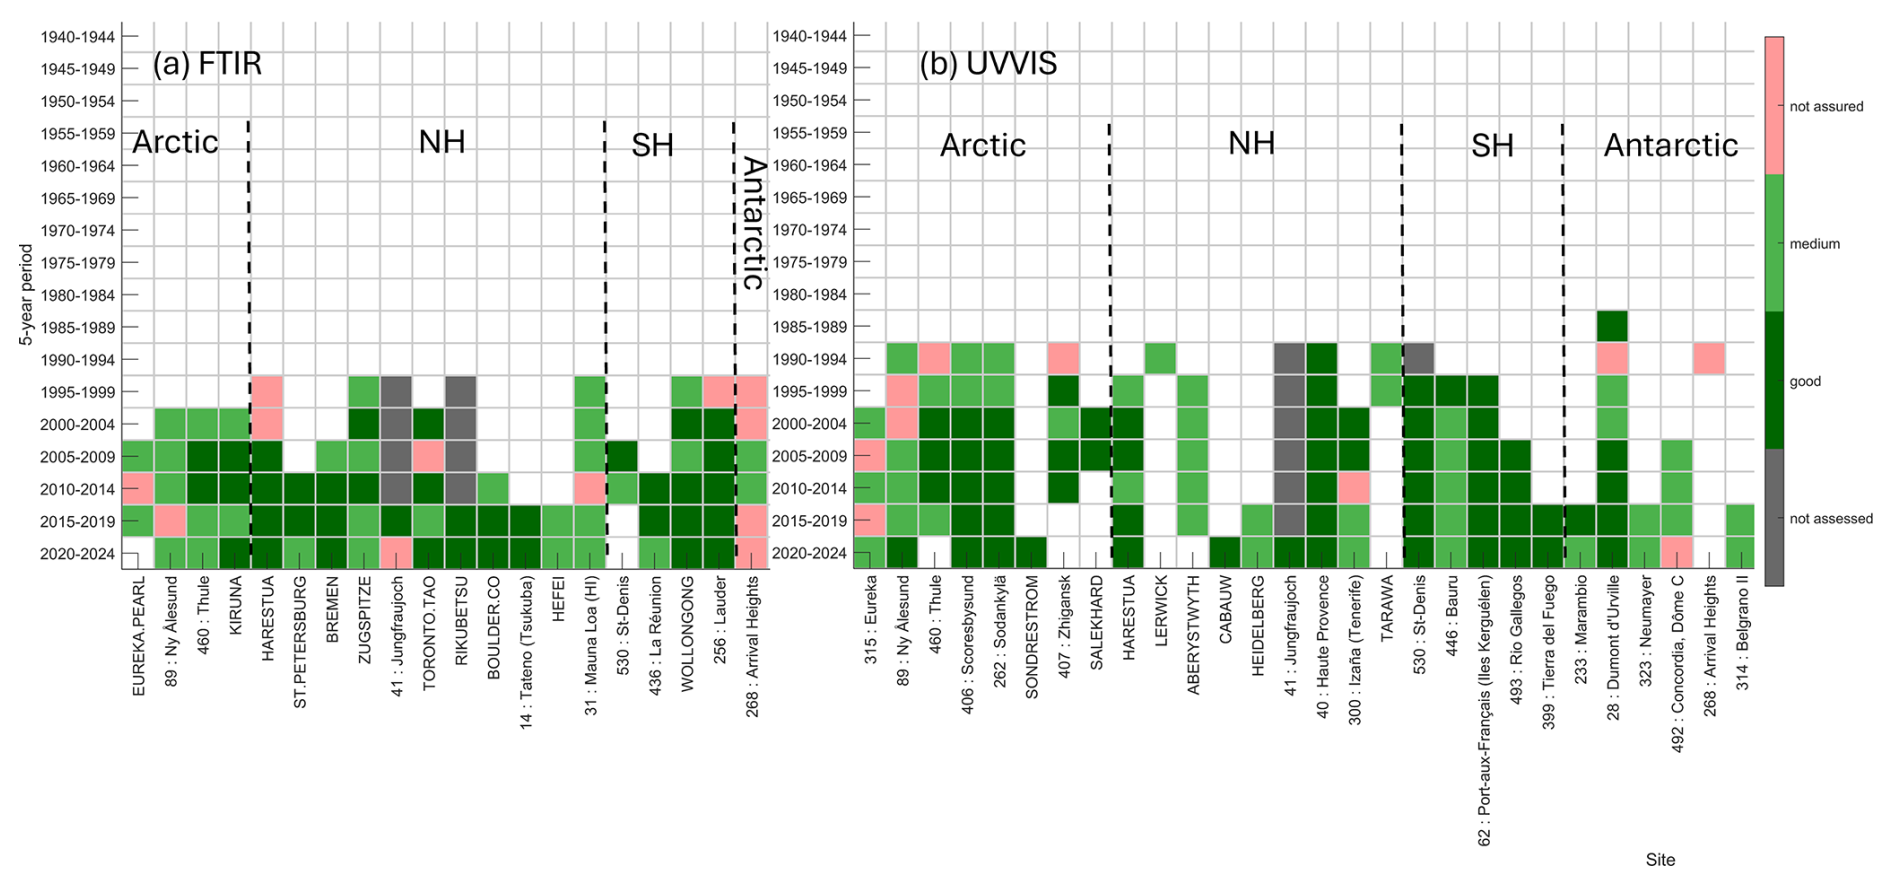
Figure 10Same as Fig. 6, but the results are for the (a) FTIR and (b) UVVIS network and assessed using satellite measurements. Note that the assessment criteria are determined based on their own network records (which only reflect FTIR and UVVIS networks' internal performance).
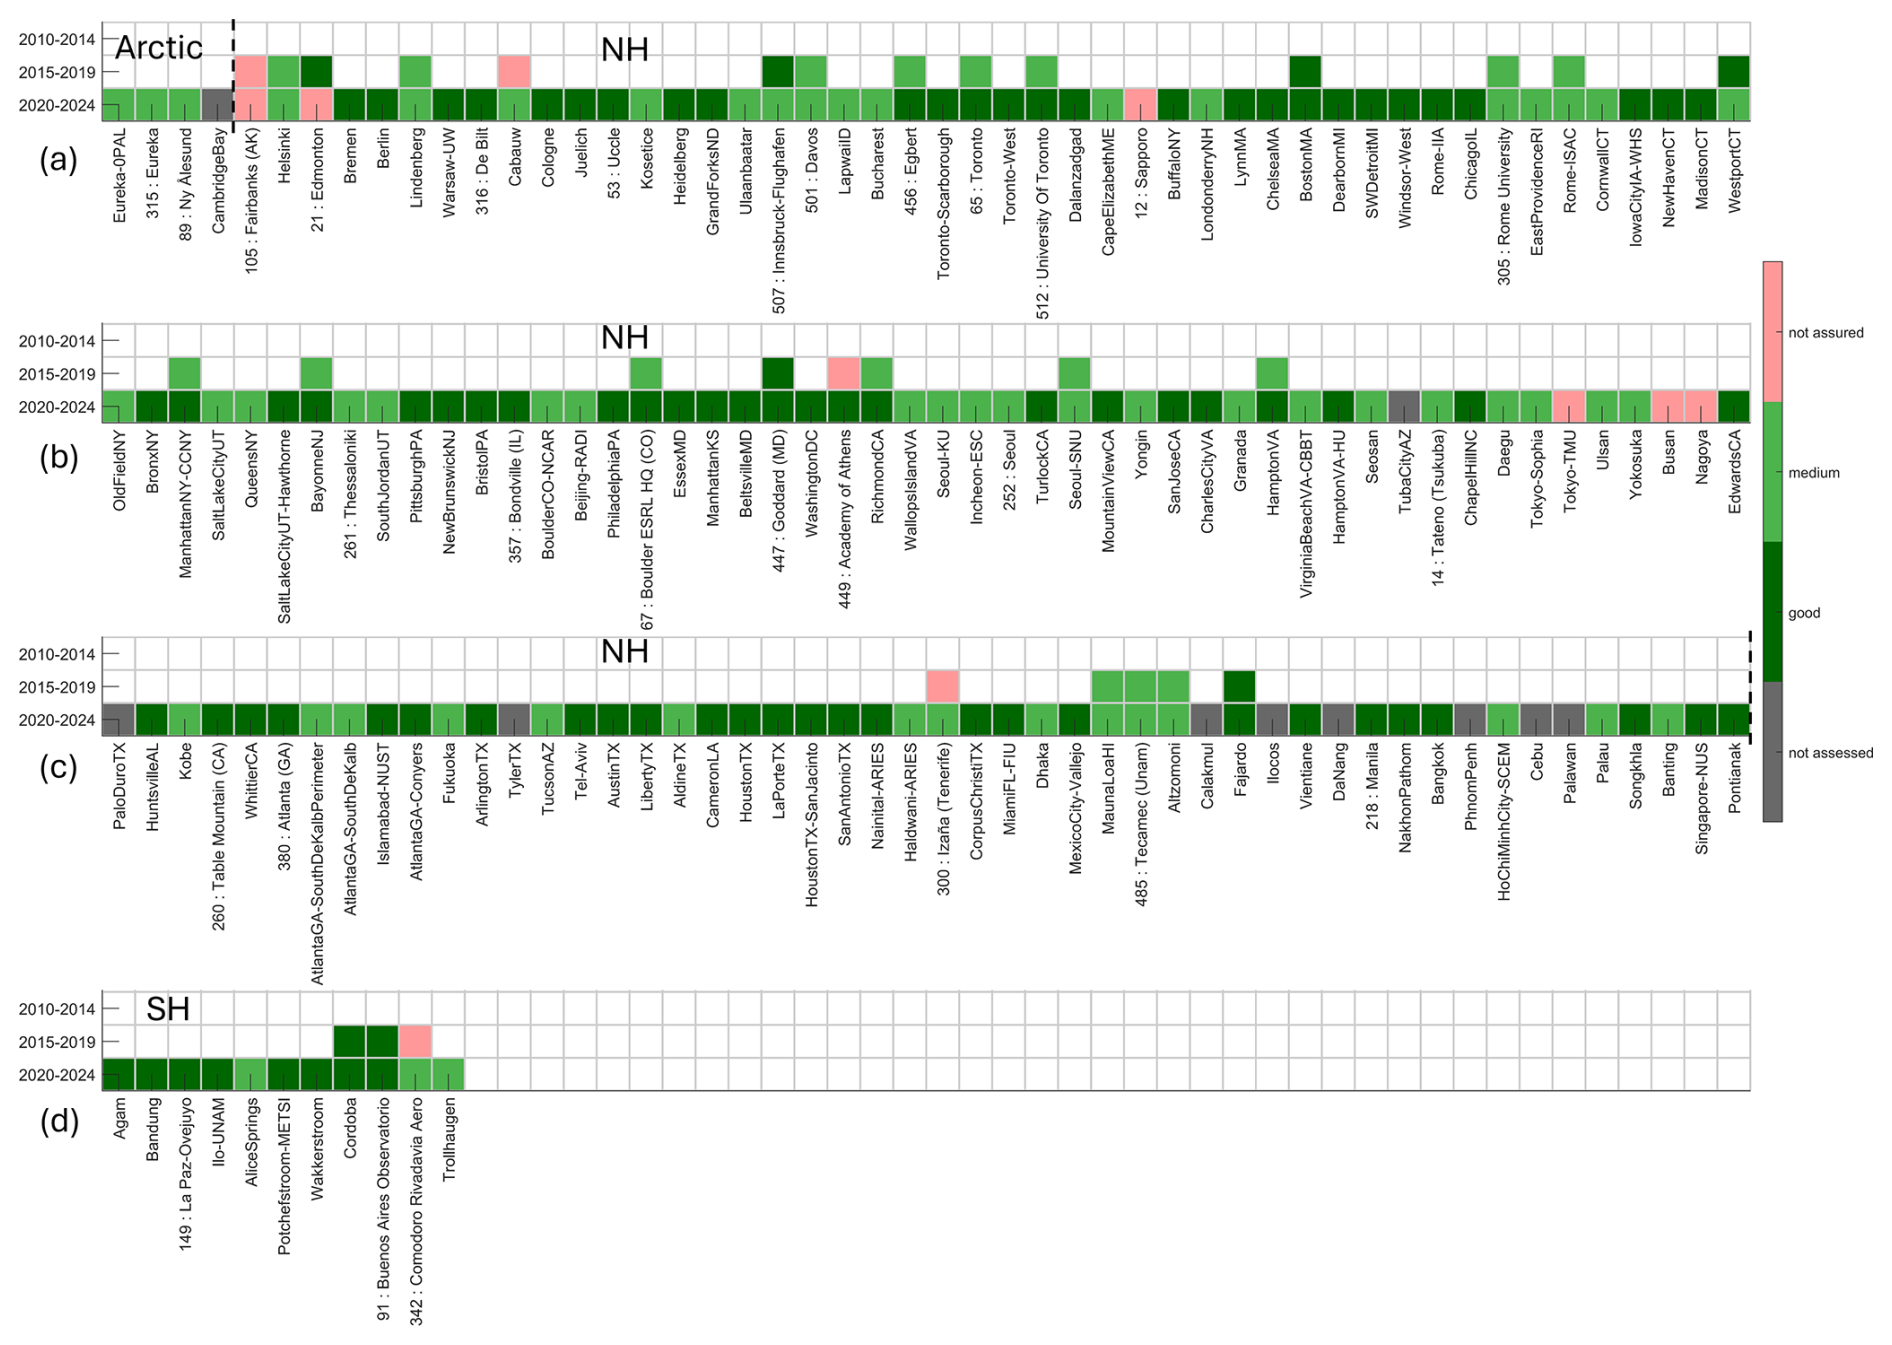
Figure 11Same as Fig. 6, but the results are for the Pandonia Global Network and assessed using satellite measurements. Note that the assessment criteria are determined based on Pandora network records (which only reflect Pandora networks' internal performance).
FTIR, UVVIS, and PGN do not have a hierarchical calibration chain like Dobson, Brewer, and Filter networks. Pandora results shown in this work are centrally processed, while the FTIR and UVVIS results are processed by individual instrument teams (but following community standards). For example, the FTIR reprocessing data (IRWG2023) has gone through a harmonization work as described in Sect. 2.1 and Vigouroux et al. (2015) (FTIR records from Izana in Spain and Altzomoni in Mexico have not been reprocessed yet). To avoid misinterpretation, it is important to state that the relative quality of the total ozone data between different instruments/networks should be referenced to Figs. 3, 4, and the figures in Appendix B. The heatmaps from Figs. 7 to 10 only reflect a network's internal comparison. As stated previously (e.g., in the discussion for Fig. 5c), a uniform or standard criterion for the statistical model can be applied (similar to the approach in Fioletov et al. (2008), who used a group of generalized criteria for Dobson, Brewer, and Filter networks), however, this is avoided. As the goal of this work is to identify the potential problematic sites and records within individual networks, such standard criteria that work best for the reference networks are too strict for other networks (or vice versa; e.g., if one applies criteria for the UVVIS network to the Dobson and Brewer reference networks, the statistical model would not be efficient at detecting problematic observations from Dobson or Brewer instruments).
Limited by the statistical method employed here, similar latitudinal artifacts (the apparently lower quality of the sites in polar regions) can also be seen from FTIR and UVVIS sites. It should be noted that the Jungfraujoch site for FTIR and UVVIS was not assessed before 2015 due to the wrong site location registered in the NASA satellite overpass records (the latter results since 2015 were assessed by TROPOMI overpass records, which were processed by the authors). Such site location registration issues were found for several sites in NASA satellite overpass records.
Figure 11 shows the heatmap for the PGN. In addition, many new sites from PGN are not included NASA satellite overpass records. Thus, for those new sites, their assessments are based on information from TROPOMI. This highlights the importance of utilizing the reanalysis dataset as the pathway for future monitoring of the performance of ozone networks. As the youngest network delivering total ozone, close monitoring of PGN's long-term performance is still needed. As an example, Pandora at WOUDC station 105, Fairbanks, shows two red tiles. A close investigation shows the data is low-biased on −4 % level compared to satellites and reanalysis, and with some outliers in 2021 and 2024. In addition, the instrument seems have been degraded, and the bias starts to become worse in 2024 and 2025. Another minor concern is that some PGN sites are focused on air quality or satellite research, which their PI might lack the resources or even motivation for long-term operations for stratospheric ozone recovery monitoring (for instance, in the ozone monitoring community, it is very common that the instruments operated by university researchers typically retire with their PI, in contrast to the instruments operated by government agencies or institutions). Currently, 17 % of Pandora sites are operated by universities.
This study provides a comprehensive, network-wide assessment of global total column ozone observations from 1940 to 2024 by harmonizing comparisons across six major ground-based networks and multiple satellite and reanalysis products (ERA5, MERRA-2, JRA-3Q, and MSR2). Building on an established statistical model, we evaluated site-level performance in 5-year bins using both satellite overpasses and four reanalyses, and consolidated assessments with a data-fusion approach. The result flags records as high quality, medium quality (minor issues), or not assured (major issues), thereby offering end users and data centres clear guidance on long-term data reliability.
Several key findings in this work include, first, the WMO/GAW reference networks (Dobson and Brewer) continue to demonstrate good performance (agreement within ± 1 %) in recent years. The sites hosting world and regional reference instruments show good long-term records. Second, Filter, FTIR, and UVVIS networks generally meet expected quality benchmarks (for most years, they agree with the reference networks within ± 2 %), while as an emerging new network, the PGN shows promising statistical consistency (such as daily mean difference, daily standard deviation, etc.) compared to the reference networks. Third, the reanalysis datasets show overall good agreement with ground-based networks, with typical agreement near the ±3 %–4 % level. But problems such as clear shifts (such as a 2 % sudden shift in MERRA-2 in 2005) due to assimilation source changes pose some risk in their application in long-term ozone trend studies. Finally, ground-based network capacity has shifted over time: Dobson sites peaked at 76 during 1985–1994 and have since declined to 51; Brewer has expanded since 1990s to now has 87 active sites to become the largest reference network; Filter has contracted from 52 to 20; FTIR and UVVIS currently have observations at 22 and 17 sites, respectively; PGN has grown rapidly to 138 active sites (reporting total ozone). In most 5-year periods, fewer than 20 % of stations are flagged as not assured.
This work has practical implications for trend detection and ozone-layer recovery studies. For example, by using the quality-assured ground-based network data, the performance of reanalysis datasets can be further assessed (in Part 2 of this work). International data centres such as WOUDC can utilize the statistical model for the station-level flags to: (1) guide users toward higher-confidence records for ozone climatological analyses, trend analysis, and satellite validation and verification, (2) identify periods and sites that need data reprocessing, and (3) prioritize calibration and maintenance across networks and regions, or targeted intercomparison campaigns to support local operations.
Figure A1 shows the percentage differences between four ground-based networks with reanalysis datasets and satellite observations.
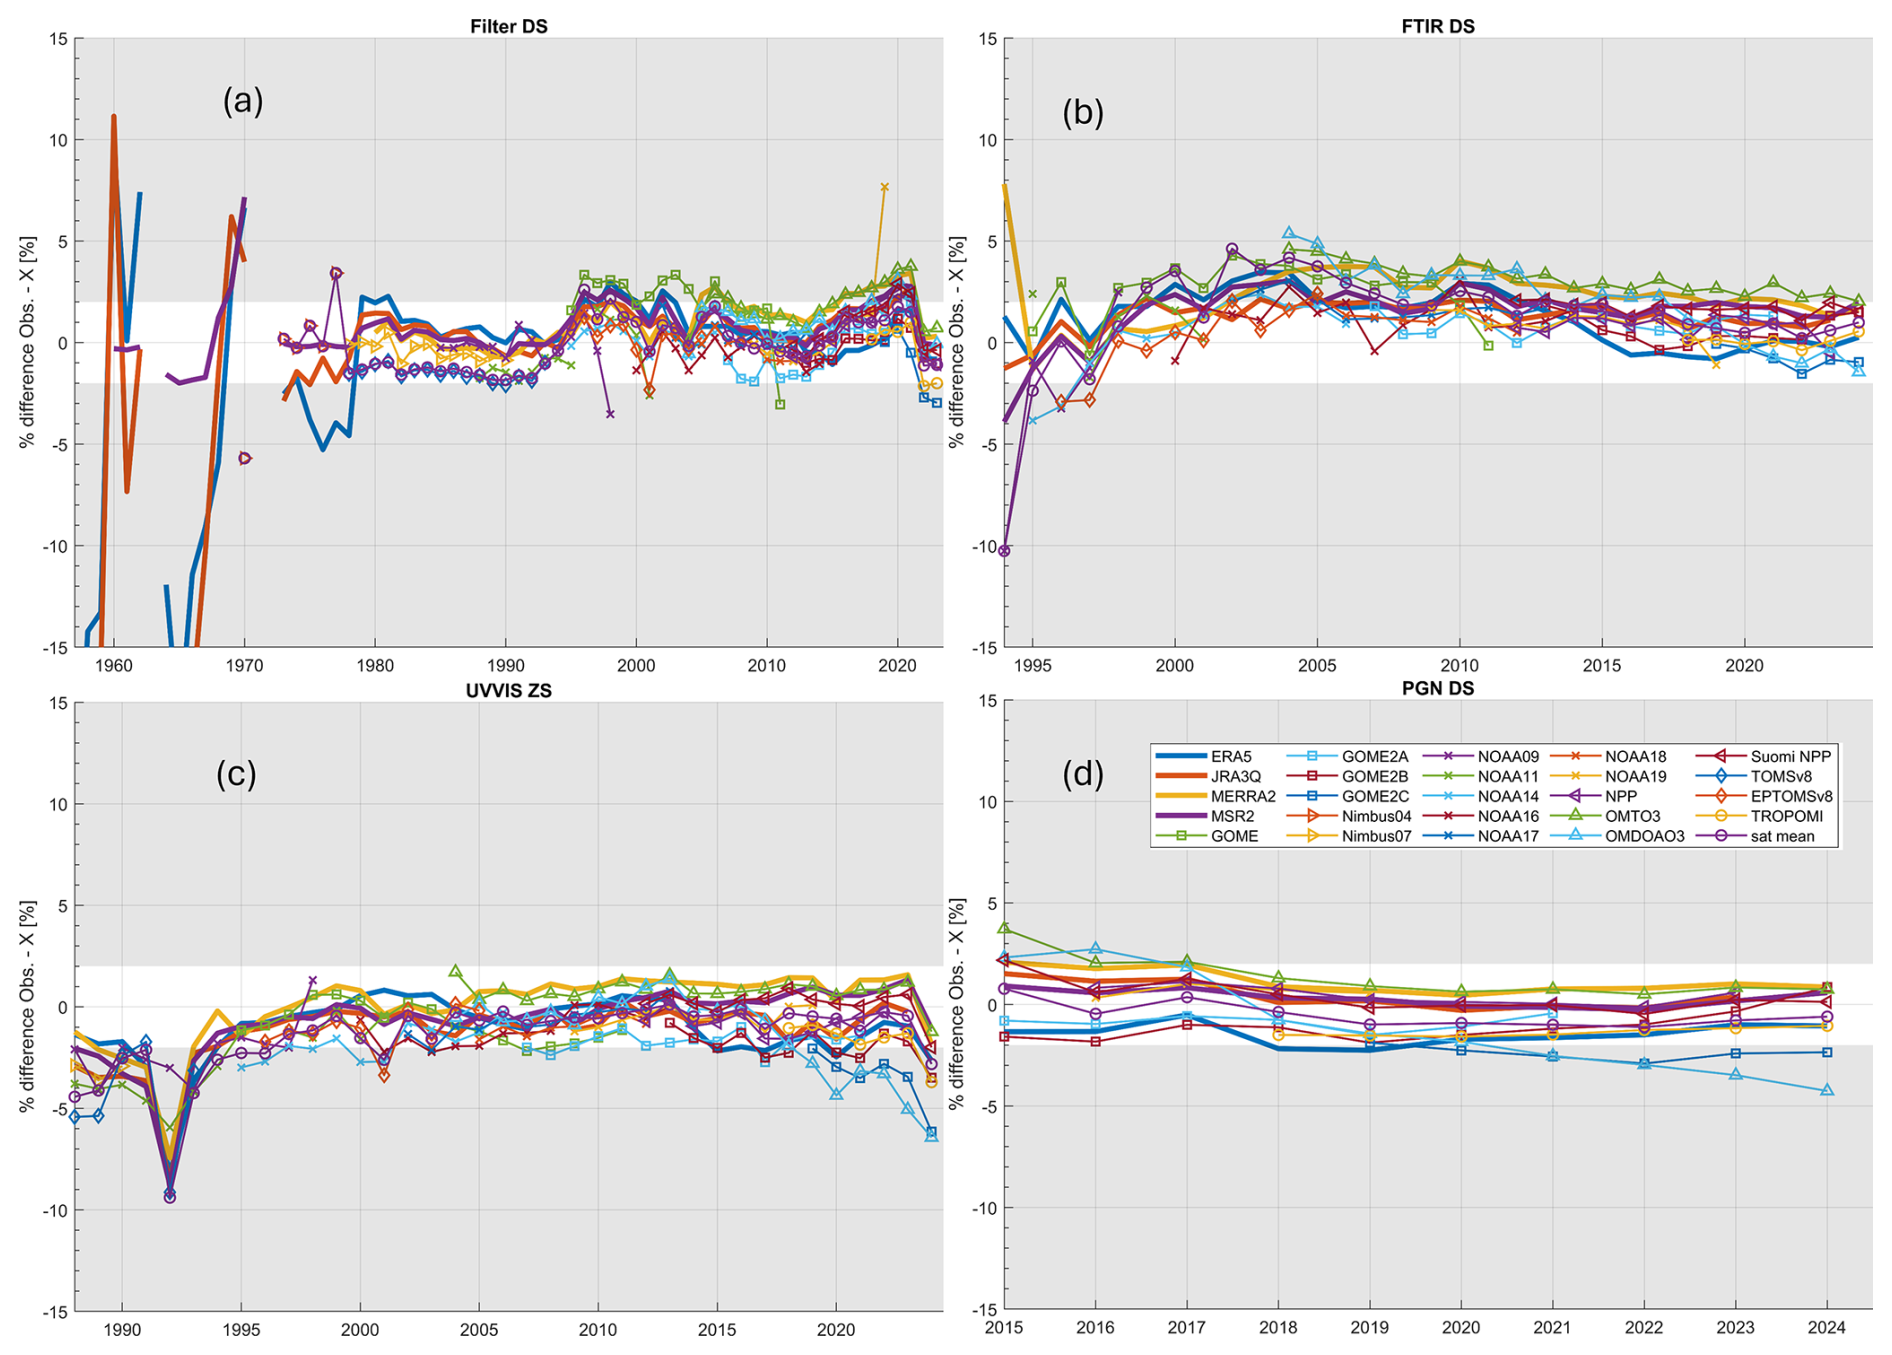
Figure A1Time series of the percentage difference between (a) Filter, (b) FTIR, (c) UVVIS and (d) PGN network observations and reanalysis/satellite datasets.
Together with Fig. 4, Figs. B1 to B4 show the statistical criteria analysis used for ground-based network assessment. Columns one to four show the comparison between four reanalysis datasets and different networks. The last column shows the comparison between all satellites and different networks. These analyses are comparable to Figs. 8 to 11 in Fioletov et al. (2008), but have been extended to cover more networks and to include results using data from updated satellite observations and reanalysis data. Note that some ground-based networks have larger seasonal biases than others. For example, the Dobson network data used in this work is processed with the Bass and Paur cross-section, which induced a well-known artificial seasonal bias (e.g., 0 % in summer and up to 2.5 % in winter in some midlatitude sites). Thus, it is critical for each network to use its own statistics. An ongoing effort in improving the Dobson network's records on WOUDC is to re-process the data to the new Serdyuchenko cross-section scale (Voglmeier et al., 2024), to minimize the seasonal bias.
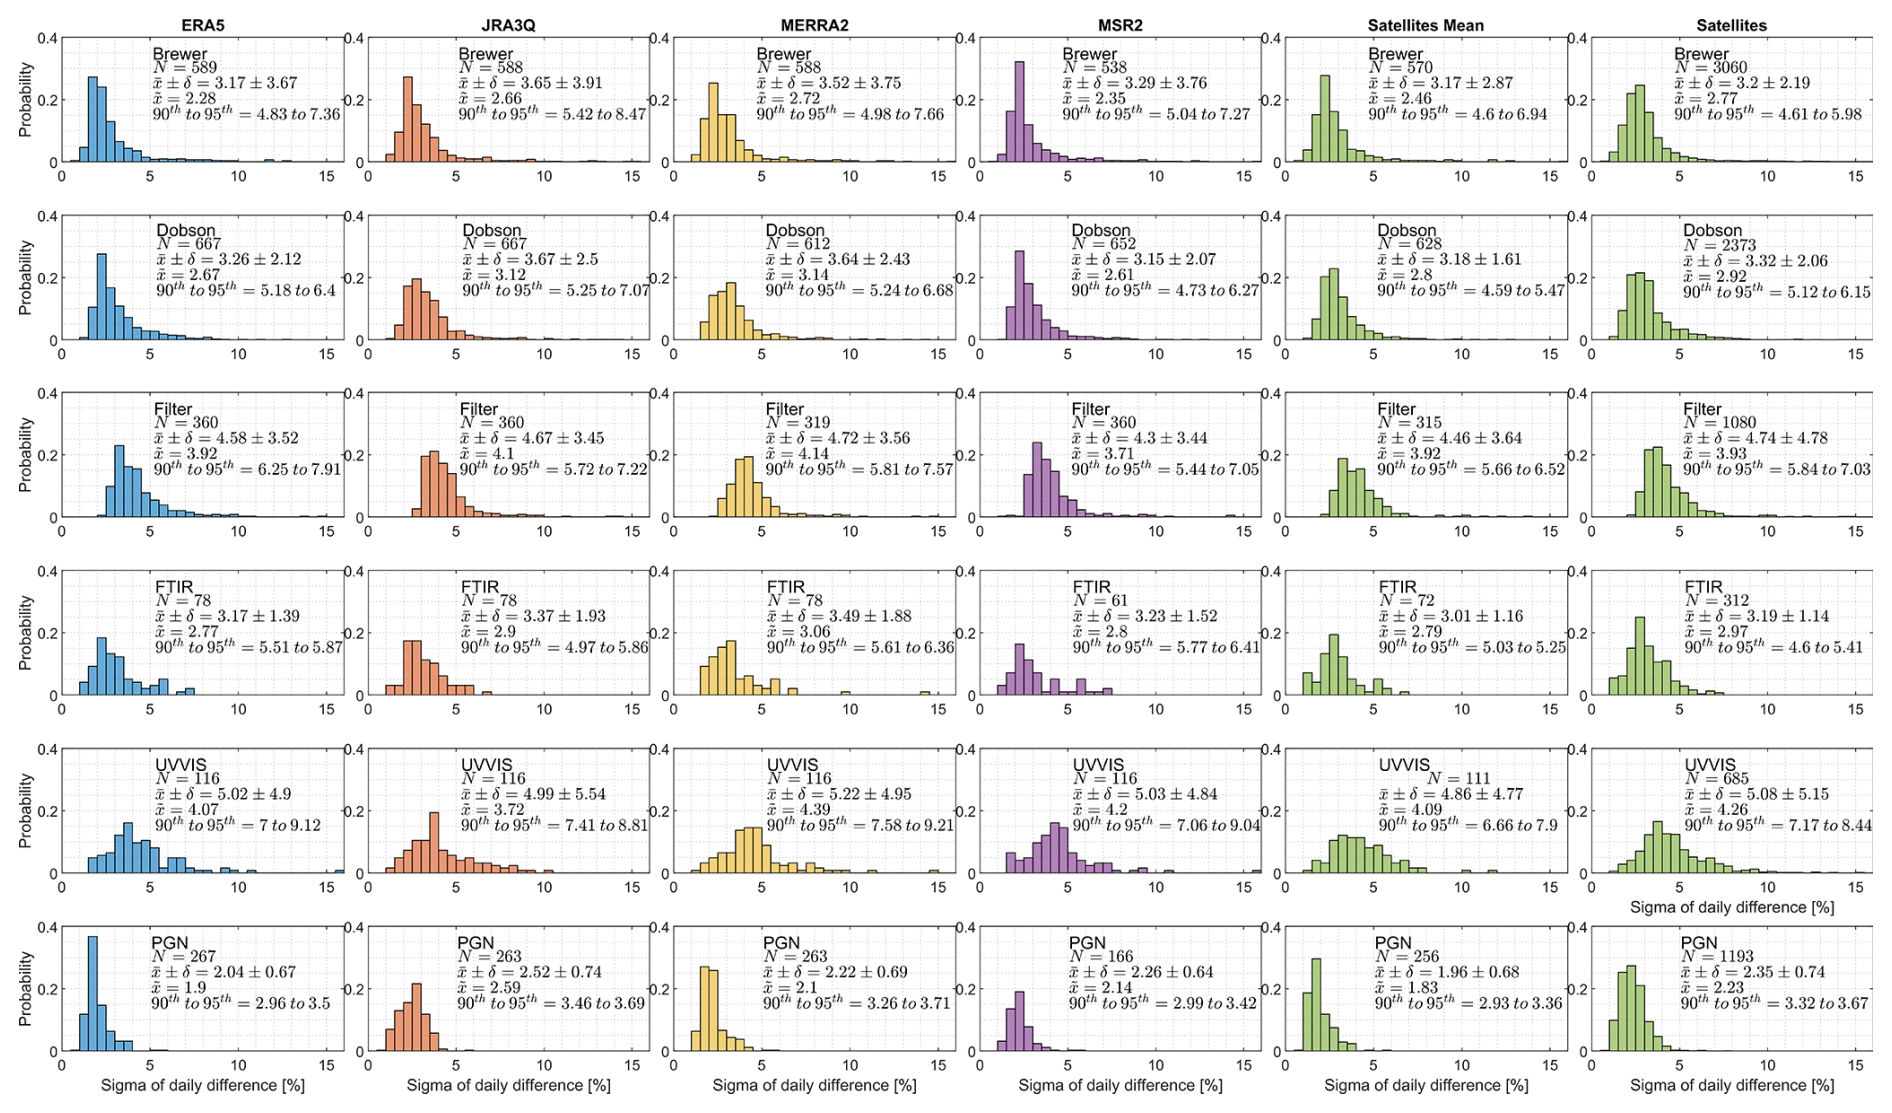
Figure B1The standard deviation of ΔTCO, for the 1978–2024 period of each ground-based network.
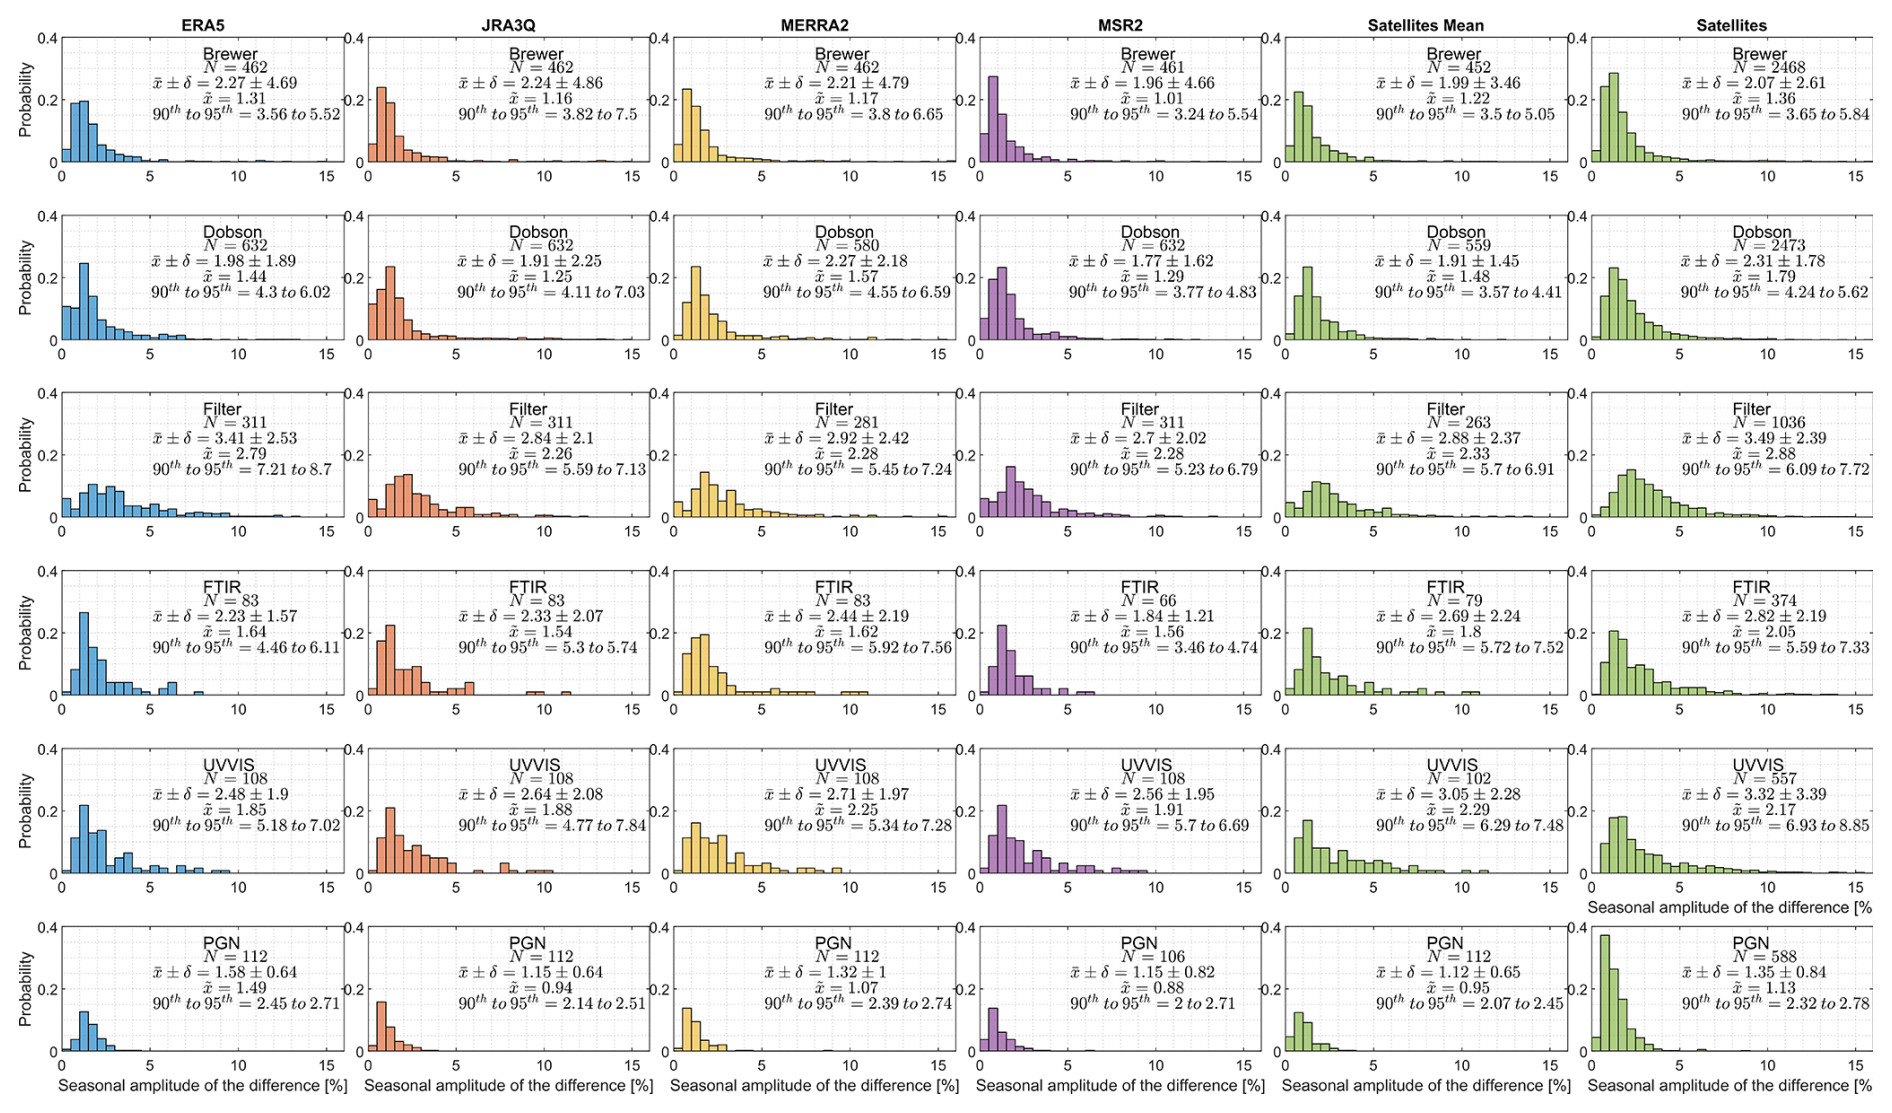
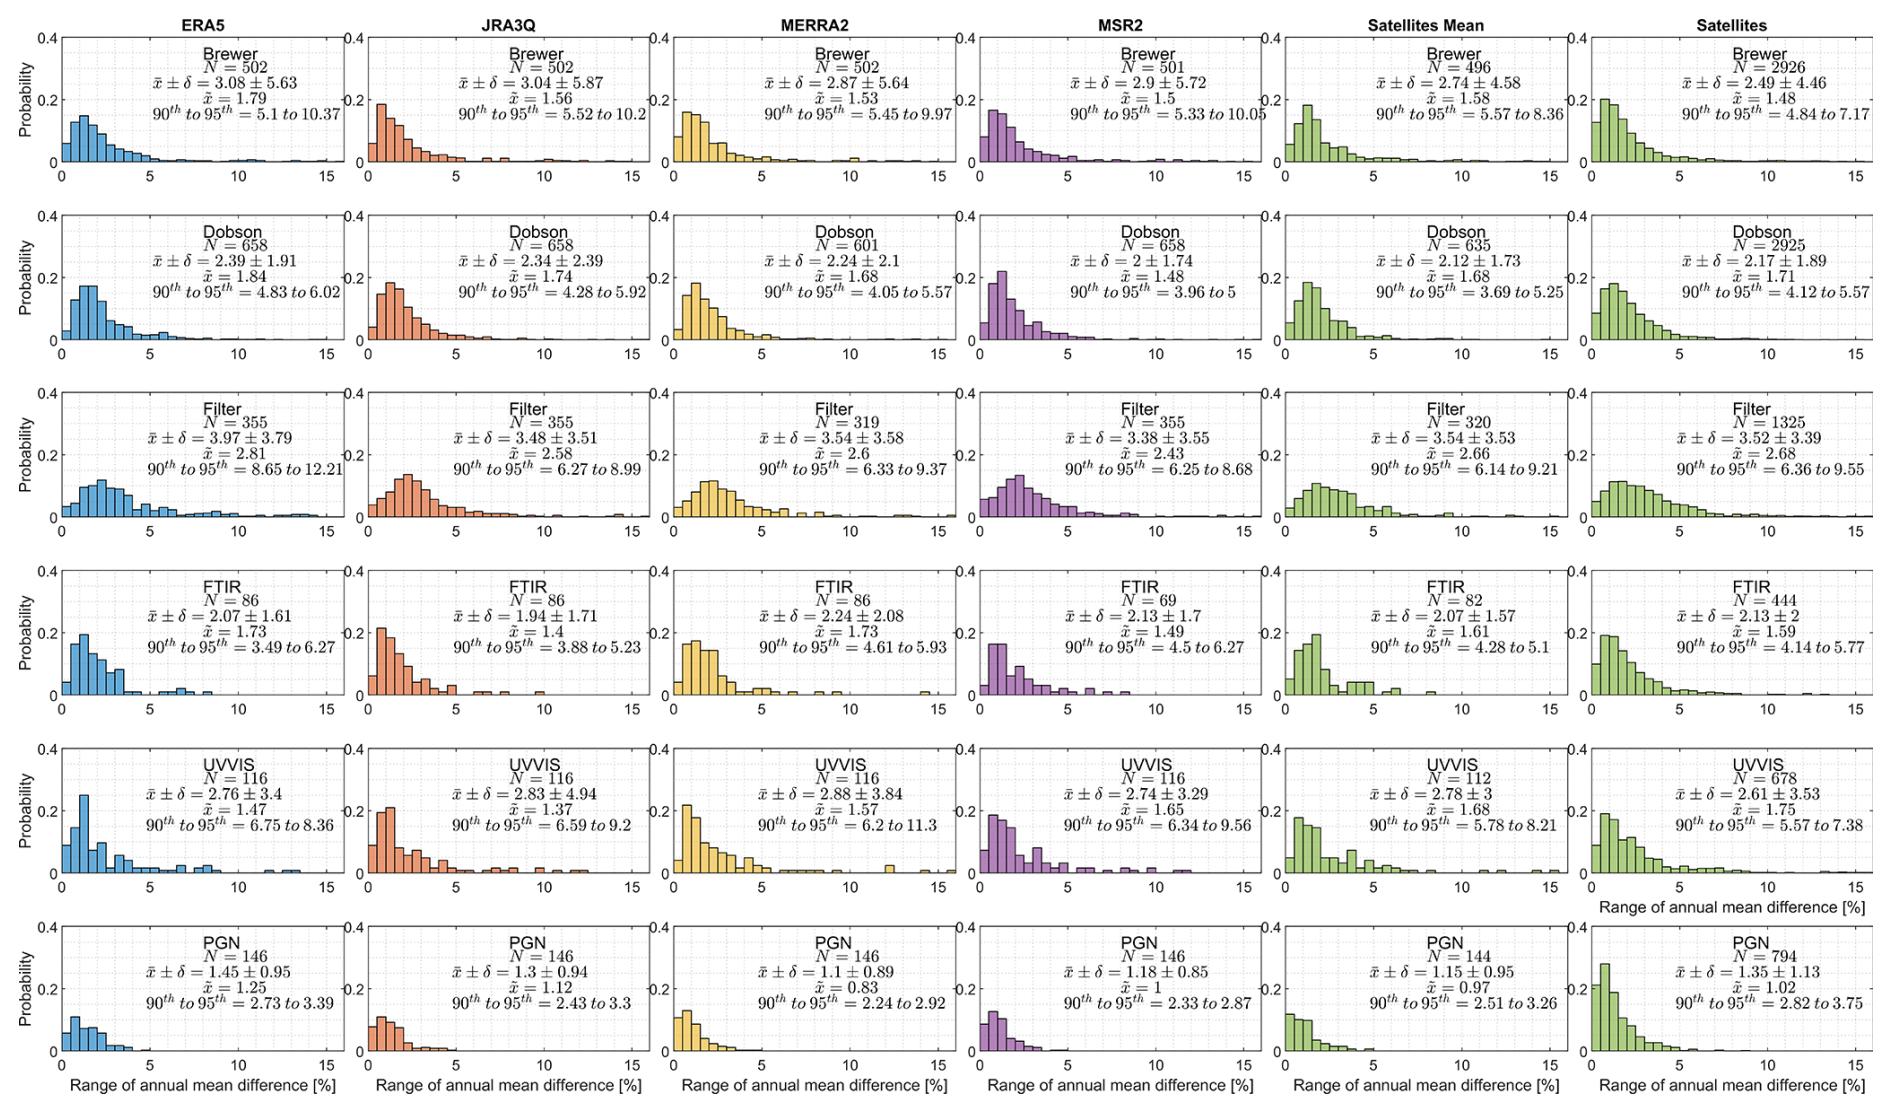
The percentile threshold derived for each network by using different comparison targets is summarized and illustrated in Fig. C1. Note that the results from different networks are not related in a series; plotting them together in different types of lines is only for better illustration.
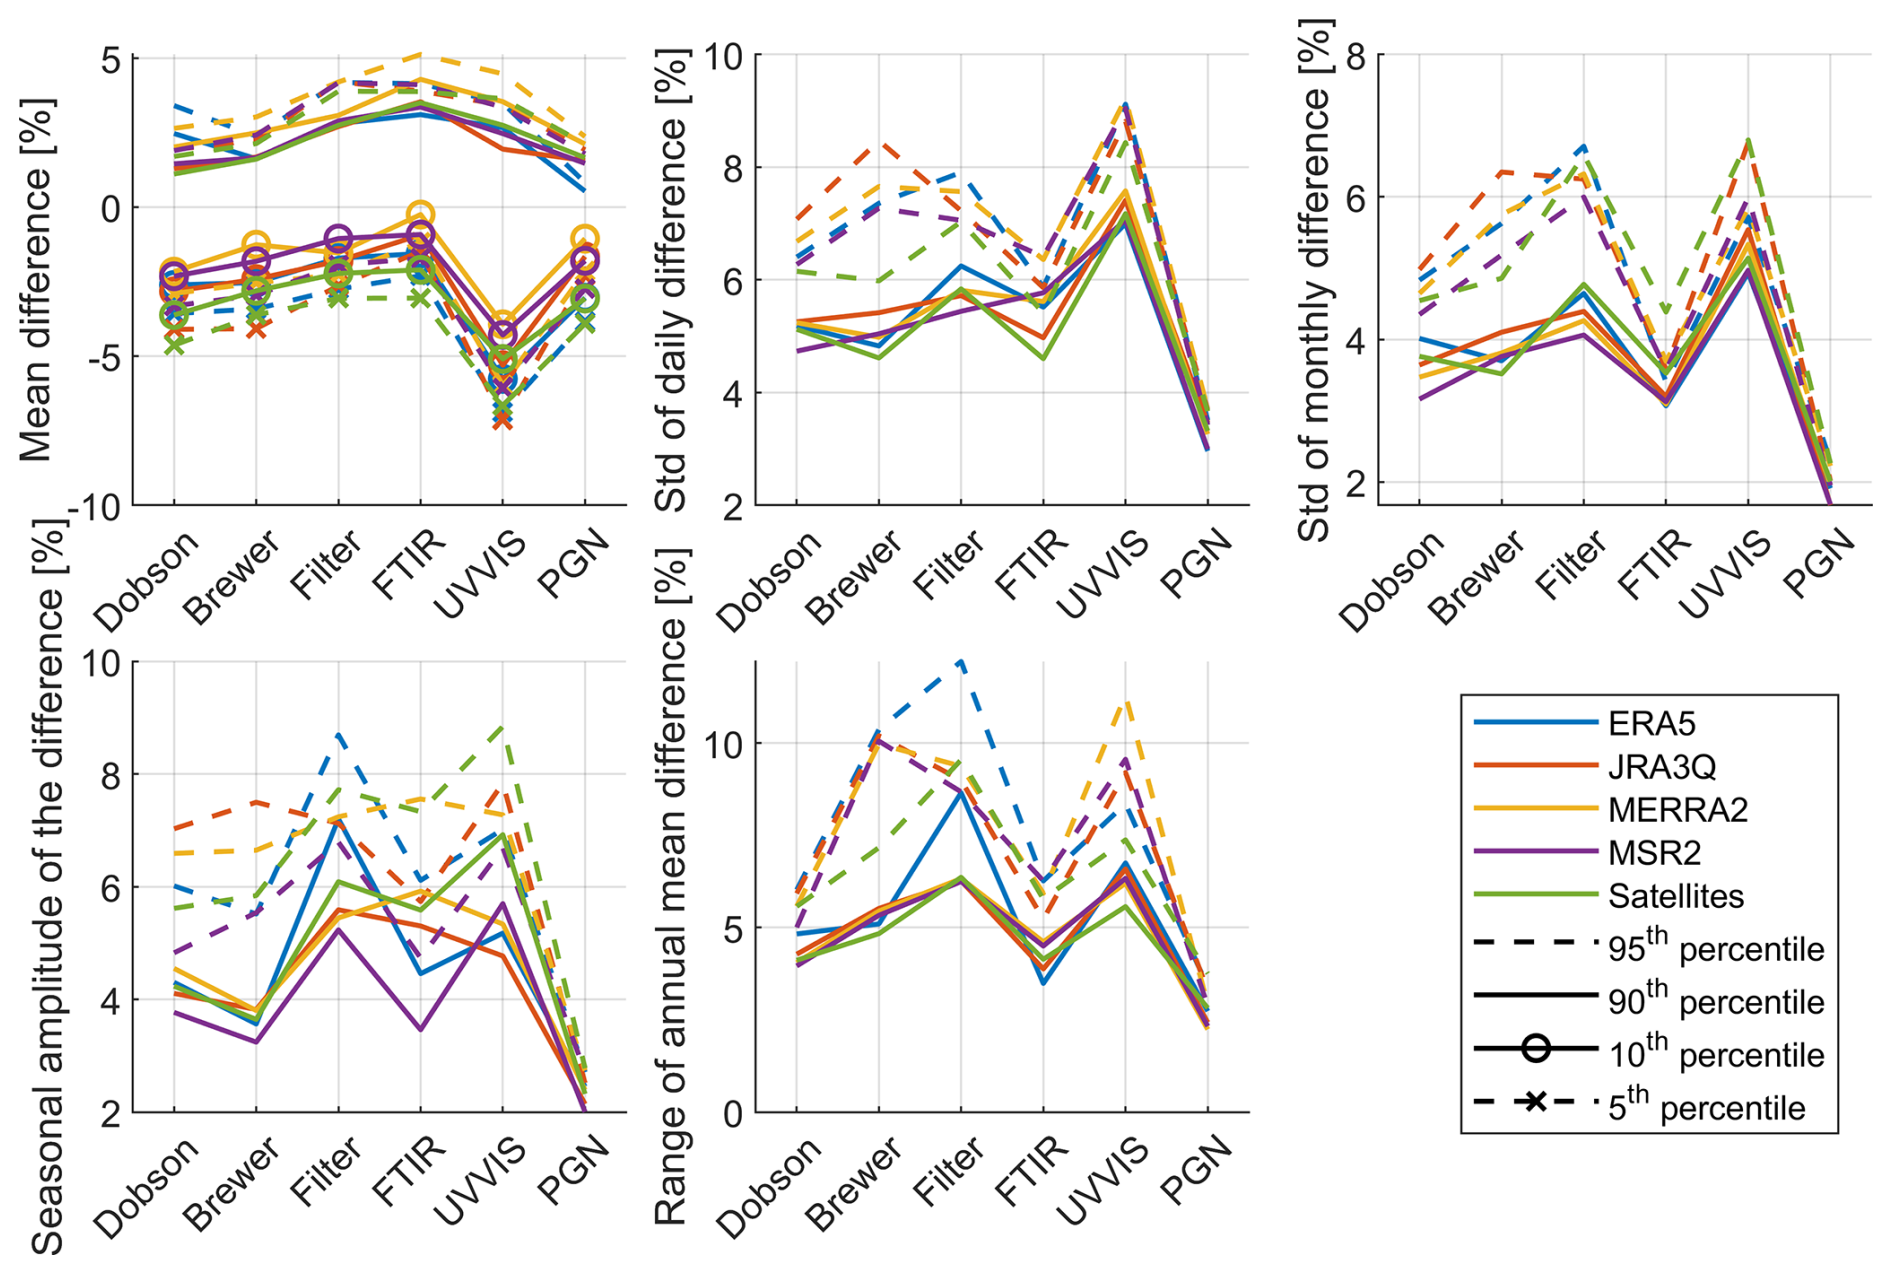
Figure C1Percentile thresholds for statistical characteristics of ΔTCO, for the entire observation period of each ground-based network.
To account for the potential changing amplitude of the seasonal cycle in ΔTCO, the data have been decomposed into linear and changing amplitude seasonal components.
Here, Ω is the ΔTCO amount; t represents time (in months); βt is the linear trend term (to account for potential drift between the comparison and target datasets); α is the time-dependent seasonal offset; the summation operator term is the seasonal signal with a local regression indicator (I); b1i and b2i are the constant coefficients to be determined from the fitting; and N is the residual. The local regression indicator (I) fits the data with a time window of ±6 months for each year (i.e., each year is fitted by its own data plus data from half a year before and half a year after). One example of this fitting for Brewer at Toronto (STN065) against OMTO3 records is shown in Fig. D1. The clear seasonal structure in ΔTCO is caused by satellite records having larger sensitivities to effective ozone temperature changes than the Brewer spectrophotometer. Different network instruments have different seasonal features; thus it is critical to make sure the ΔTCO seasonal amplitude criteria used in the statistical model are derived for each network by only using their own observations.
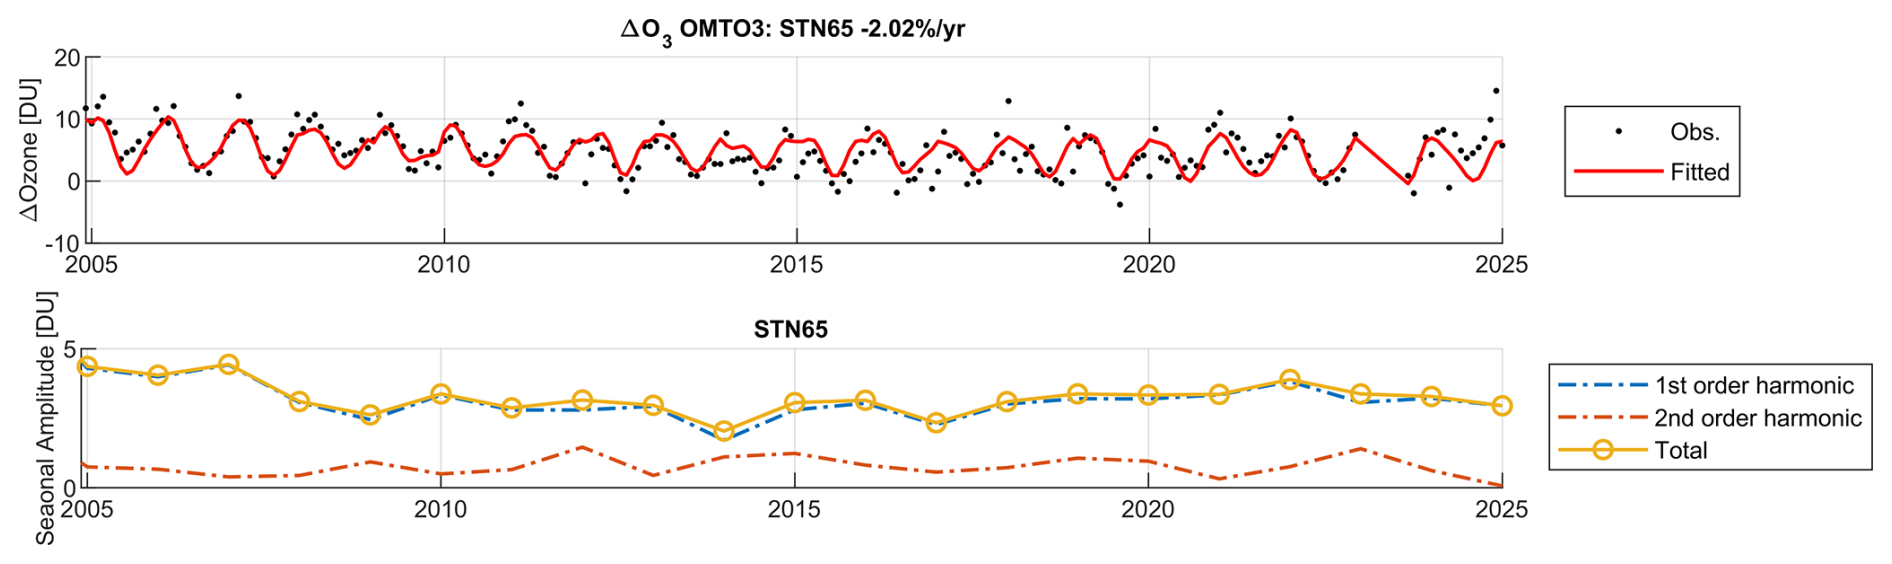
Figure D1Example of ΔTCO (Brewer vs. OMTO3) seasonal amplitude fitting (local regression) for Brewer spectrophotometer records in Toronto (STN065). Observations (ΔTCO) are plotted on the first panel in black dots, with the final fitting shown in a red line. Fitted first- and second-order harmonics and the combined seasonal amplitudes are plotted on the bottom panel.
NASA satellites' overpass files can be found at https://avdc.gsfc.nasa.gov/pub/data/satellite/ (NASA, 2025). Brewer, Dobson, and Filter total ozone records can be found on the World Ozone and Ultraviolet Radiation Data Centre from https://doi.org/10.14287/10000004 (WOUDC, 2026). FTIR (Vigouroux et al., 2015) and UVVIS (Hendrick et al., 2011) records are available on NDACC https://www-air.larc.nasa.gov/missions/ndacc/data.html (NDACC, 2026), individual sites have data DOIs such as https://doi.org/10.21336/2van-tm26 for UVVIS from AUTH-LAP stations (Bais et al., 2020). Some Brewer records are available on EUBrewnet (EUBrewnet, 2026) at https://eubrewnet.aemet.es/eubrewnet (last access: 20 March 2026), individual sites have data DOIs such as https://doi.org/10.48801/eubrewnet.izana (Redondas, 2023). Pandora records (Zhao et al., 2025) can be found at https://www.pandonia-global-network.org/home/documents/pgn-data/ (PGN, 2025). TROPOMI data (Garane et al., 2019) are available at https://doi.org/10.5270/S5P-fqouvyz (Copernicus Sentinel-5P, 2018), overpass data are stored in the ECCC data archive (https://hpfx.collab.science.gc.ca/~deg001/tropomi_ovp/, ECCC, 2024). ERA5 can be found at https://doi.org/10.24381/cds.adbb2d47 (Hersbach et al., 2023), MERRA-2 (Wargan et al., 2017) can be found at https://doi.org/10.5067/VJAFPLI1CSIV (Global Modeling and Assimilation Office (GMAO), 2015), JRA3Q are available on https://doi.org/10.5065/AVTZ-1H78 (JMA, 2024), and MSR2 are available at https://doi.org/10.21944/temis-ozone-msr2 (van der A et al., 2015b).
XZ analyzed the data and prepared the manuscript, with significant conceptual input from VF. All co-authors contributed with critical feedback and discussions. IP, VV, and WS supported analysis and evaluation of the Dobson network. AR and VF supported analysis and evaluation of the Brewer network. AS supported analysis and evaluation of the Filter network. CV and KS supported analysis and evaluation of the FTIR network. MVR, AP, and KS supported analysis and evaluation of the UVVIS network. TH, AC, MT supported analysis and evaluation of the Pandora network. GL, DG, CM, prepared satellite data and supported data analysis. MF and RA provided reanalysis data supported data analysis. TK, SCL, TH, AR, IP, WS, AC, MT supported in data centre and/or network operations.
At least one of the (co-)authors is a member of the editorial board of Atmospheric Chemistry and Physics. The peer-review process was guided by an independent editor, and the authors also have no other competing interests to declare.
Publisher's note: Copernicus Publications remains neutral with regard to jurisdictional claims made in the text, published maps, institutional affiliations, or any other geographical representation in this paper. The authors bear the ultimate responsibility for providing appropriate place names. Views expressed in the text are those of the authors and do not necessarily reflect the views of the publisher.
This article is part of the special issue “Achievements and perspectives of the Network for the Detection of Atmospheric Composition Change (NDACC) after 35 years of operation (ACP/AMT inter-journal SI)”. It is not associated with a conference.
We thank the NASA Goddard Space Flight Center (GSFC) and all satellite mission teams for providing satellite overpass records. We also acknowledge the ERA5, MERRA-2, JRA-3Q, and MSR2 reanalysis teams for making their datasets available. The authors, representing the ground-based networks (Brewer, Dobson, Filter, FTIR, UVVIS, and PGN), sincerely thank the many principal investigators, operators, and researchers whose sustained efforts have established and maintained these observing sites, producing ground-based records spanning more than 80 years. We further acknowledge the staff of the data centers (WOUDC, NDACC, PGN, and EUBrewnet) for ensuring that these data records are publicly accessible. Xiaoyi Zhao thanks Alexander Mangold of the Royal Meteorological Institute of Belgium for providing information on Brewer instrument operation at Princess Elisabeth Station. The PGN is a bilateral project supported with funding from NASA and ESA.
This paper was edited by Rolf Müller and reviewed by Rolf Rüfenacht and one anonymous referee.
Bais, A., Karagkiozidis, D., and Gkertsi, F.: NDACC MAX-DOAS Service data sets from AUTH-LAP stations available at the NDACC and EVDC Data Handling Facilities, NDACC [data set], https://doi.org/10.21336/2van-tm26, 2020.
Bell, B., Hersbach, H., Simmons, A., Berrisford, P., Dahlgren, P., Horányi, A., Muñoz-Sabater, J., Nicolas, J., Radu, R., Schepers, D., Soci, C., Villaume, S., Bidlot, J.-R., Haimberger, L., Woollen, J., Buontempo, C., and Thépaut, J.-N.: The ERA5 global reanalysis: Preliminary extension to 1950, Q. J. Roy. Meteor. Soc., 147, 4186–4227, https://doi.org/10.1002/qj.4174, 2021.
Björklund, R., Vigouroux, C., Effertz, P., García, O. E., Geddes, A., Hannigan, J., Miyagawa, K., Kotkamp, M., Langerock, B., Nedoluha, G., Ortega, I., Petropavlovskikh, I., Poyraz, D., Querel, R., Robinson, J., Shiona, H., Smale, D., Smale, P., Van Malderen, R., and De Mazière, M.: Intercomparison of long-term ground-based measurements of total, tropospheric, and stratospheric ozone at Lauder, New Zealand, Atmos. Meas. Tech., 17, 6819–6849, https://doi.org/10.5194/amt-17-6819-2024, 2024.
Bojkov, R. D., Fioletov, V. E., and Shalamjansky, A. M.: Total ozone changes over Eurasia since 1973 based on reevaluated filter ozonometer data, J. Geophys. Res.-Atmos., 99, 22985–22999, https://doi.org/10.1029/94JD02006, 1994.
Brewer, A. W.: A replacement for the Dobson spectrophotometer?, Pure Appl. Geophys., 106, 919–927, 1973.
Brönnimann, S., Staehelin, J., Farmer, S. F. G., Cain, J. C., Svendby, T., and Svenøe, T.: Total ozone observations prior to the IGY. I: A history, Q. J. Roy. Meteor. Soc., 129, 2797–2817, https://doi.org/10.1256/qj.02.118, 2003.
Cede, A., Tiefengraber, M., Gebetsberger, M., and Lind, E. S.: PGN_DataProducts_Readme_v1-8-10, PGN, https://www.pandonia-global-network.org/assets/manuals/PGN_DataProducts_Readme_v1-8-10.pdf (last access: 21 September 2026), 2025.
Copernicus Climate Change Service, Climate Data Store: ERA5 hourly data on single levels from 1940 to present, Copernicus [data set], https://doi.org/10.24381/cds.adbb2d47, 2023.
Copernicus Sentinel-5P: TROPOMI Level 2 Ozone Total Column products, Copernicus [data set], https://doi.org/10.5270/S5P-fqouvyz, 2018.
De Mazière, M., Thompson, A. M., Kurylo, M. J., Wild, J. D., Bernhard, G., Blumenstock, T., Braathen, G. O., Hannigan, J. W., Lambert, J.-C., Leblanc, T., McGee, T. J., Nedoluha, G., Petropavlovskikh, I., Seckmeyer, G., Simon, P. C., Steinbrecht, W., and Strahan, S. E.: The Network for the Detection of Atmospheric Composition Change (NDACC): history, status and perspectives, Atmos. Chem. Phys., 18, 4935–4964, https://doi.org/10.5194/acp-18-4935-2018, 2018.
Dobson, G. M. B.: Forty Years' Research on Atmospheric Ozone at Oxford: a History, Appl. Opt., 7, 387–405, https://doi.org/10.1364/ao.7.000387, 1968.
ECCC: TROPOMI overpass total ozone files, Environment and Climate Change Canada [data set], https://hpfx.collab.science.gc.ca/~deg001/tropomi_ovp/ (last access: 20 March 2026), 2024.
EUBrewnet: Brewer total ozone records, AEMET [data set], https://eubrewnet.aemet.es/eubrewnet (last access: 20 March 2026), 2026.
Fioletov, V. E., Kerr, J. B., Hare, E. W., Labow, G. J., and McPeters, R. D.: An assessment of the world ground-based total ozone network performance from the comparison with satellite data, J. Geophys. Res., 104, 1737–1747, https://doi.org/10.1029/1998JD100046, 1999.
Fioletov, V. E., Labow, G., Evans, R., Hare, E. W., Köhler, U., McElroy, C. T., Miyagawa, K., Redondas, A., Savastiouk, V., Shalamyansky, A. M., Staehelin, J., Vanicek, K., and Weber, M.: Performance of the ground-based total ozone network assessed using satellite data, J. Geophys. Res.-Atmos., 113, https://doi.org/10.1029/2008JD009809, 2008.
Fujiwara, M., Manney, G. L., Gray, L. J., Wright, J. S., Tegtmeier, S., Ivanciu, I., and Pilch Kedzierski, R.: SPARC Reanalysis Intercomparison Project (S-RIP) Final Report, DLR, 612 pp., https://doi.org/10.17874/800dee57d13, 2022.
Garane, K., Koukouli, M.-E., Verhoelst, T., Lerot, C., Heue, K.-P., Fioletov, V., Balis, D., Bais, A., Bazureau, A., Dehn, A., Goutail, F., Granville, J., Griffin, D., Hubert, D., Keppens, A., Lambert, J.-C., Loyola, D., McLinden, C., Pazmino, A., Pommereau, J.-P., Redondas, A., Romahn, F., Valks, P., Van Roozendael, M., Xu, J., Zehner, C., Zerefos, C., and Zimmer, W.: TROPOMI/S5P total ozone column data: global ground-based validation and consistency with other satellite missions, Atmos. Meas. Tech., 12, 5263–5287, https://doi.org/10.5194/amt-12-5263-2019, 2019.
Gelaro, R., McCarty, W., Suárez, M. J., Todling, R., Molod, A., Takacs, L., Randles, C. A., Darmenov, A., Bosilovich, M. G., Reichle, R., Wargan, K., Coy, L., Cullather, R., Draper, C., Akella, S., Buchard, V., Conaty, A., da Silva, A. M., Gu, W., Kim, G.-K., Koster, R., Lucchesi, R., Merkova, D., Nielsen, J. E., Partyka, G., Pawson, S., Putman, W., Rienecker, M., Schubert, S. D., Sienkiewicz, M., and Zhao, B.: The Modern-Era Retrospective Analysis for Research and Applications, Version 2 (MERRA-2), J. Climate, 30, 5419–5454, https://doi.org/10.1175/JCLI-D-16-0758.1, 2017.
Global Modeling and Assimilation Office (GMAO): MERRA-2 tavg1_2d_slv_Nx: 2d,1-Hourly,Time-Averaged,Single-Level,Assimilation, Single-Level Diagnostics V5.12.4, Goddard Earth Sciences Data and Information Services Center (GES DISC) [data set], https://doi.org/10.5067/VJAFPLI1CSIV, 2015.
Gordon, I. E., Rothman, L. S., Hargreaves, R. J., Hashemi, R., Karlovets, E. V., Skinner, F. M., Conway, E. K., Hill, C., Kochanov, R. V., Tan, Y., Wcisło, P., Finenko, A. A., Nelson, K., Bernath, P. F., Birk, M., Boudon, V., Campargue, A., Chance, K. V., Coustenis, A., Drouin, B. J., Flaud, J. –M., Gamache, R. R., Hodges, J. T., Jacquemart, D., Mlawer, E. J., Nikitin, A. V., Perevalov, V. I., Rotger, M., Tennyson, J., Toon, G. C., Tran, H., Tyuterev, V. G., Adkins, E. M., Baker, A., Barbe, A., Canè, E., Császár, A. G., Dudaryonok, A., Egorov, O., Fleisher, A. J., Fleurbaey, H., Foltynowicz, A., Furtenbacher, T., Harrison, J. J., Hartmann, J. –M., Horneman, V. –M., Huang, X., Karman, T., Karns, J., Kassi, S., Kleiner, I., Kofman, V., Kwabia–Tchana, F., Lavrentieva, N. N., Lee, T. J., Long, D. A., Lukashevskaya, A. A., Lyulin, O. M., Makhnev, V. Yu., Matt, W., Massie, S. T., Melosso, M., Mikhailenko, S. N., Mondelain, D., Müller, H. S. P., Naumenko, O. V., Perrin, A., Polyansky, O. L., Raddaoui, E., Raston, P. L., Reed, Z. D., Rey, M., Richard, C., Tóbiás, R., Sadiek, I., Schwenke, D. W., Starikova, E., Sung, K., Tamassia, F., Tashkun, S. A., Vander Auwera, J., Vasilenko, I. A., Vigasin, A. A., Villanueva, G. L., Vispoel, B., Wagner, G., Yachmenev, A., and Yurchenko, S. N.: The HITRAN2020 molecular spectroscopic database, J. Quant. Spectrosc. Ra., 277, 107949, https://doi.org/10.1016/j.jqsrt.2021.107949, 2022.
Gröbner, J., Schill, H., Egli, L., and Stübi, R.: Consistency of total column ozone measurements between the Brewer and Dobson spectroradiometers of the LKO Arosa and PMOD/WRC Davos, Atmos. Meas. Tech., 14, 3319–3331, https://doi.org/10.5194/amt-14-3319-2021, 2021.
Hall, D. L. and Llinas, J.: An introduction to multisensor data fusion, P. IEEE, 85, 6–23, https://doi.org/10.1109/5.554205, 1997.
Hendrick, F., Pommereau, J.-P., Goutail, F., Evans, R. D., Ionov, D., Pazmino, A., Kyrö, E., Held, G., Eriksen, P., Dorokhov, V., Gil, M., and Van Roozendael, M.: NDACC/SAOZ UV-visible total ozone measurements: improved retrieval and comparison with correlative ground-based and satellite observations, Atmos. Chem. Phys., 11, 5975–5995, https://doi.org/10.5194/acp-11-5975-2011, 2011.
Hersbach, H., Bell, B., Berrisford, P., Hirahara, S., Horányi, A., Muñoz-Sabater, J., Nicolas, J., Peubey, C., Radu, R., Schepers, D., Simmons, A., Soci, C., Abdalla, S., Abellan, X., Balsamo, G., Bechtold, P., Biavati, G., Bidlot, J., Bonavita, M., De Chiara, G., Dahlgren, P., Dee, D., Diamantakis, M., Dragani, R., Flemming, J., Forbes, R., Fuentes, M., Geer, A., Haimberger, L., Healy, S., Hogan, R. J., Hólm, E., Janisková, M., Keeley, S., Laloyaux, P., Lopez, P., Lupu, C., Radnoti, G., de Rosnay, P., Rozum, I., Vamborg, F., Villaume, S., and Thépaut, J.-N.: The ERA5 global reanalysis, Q. J. Roy. Meteor. Soc., 146, 1999–2049, https://doi.org/10.1002/qj.3803, 2020.
Hersbach, H., Bell, B., Berrisford, P., Biavati, G., Horányi, A., Muñoz Sabater, J., Nicolas, J., Peubey, C., Radu, R., Rozum, I., Schepers, D., Simmons, A., Soci, C., Dee, D., and Thépaut, J.-N.: ERA5 hourly data on single levels from 1940 to present, Copernicus Climate Change Service (C3S) Climate Data Store (CDS) [data set], https://doi.org/10.24381/cds.adbb2d47, 2023.
JMA: Japanese Reanalysis for Three Quarters of a Century (JRA-3Q), NSF National Center for Atmospheric Research [data set], https://doi.org/10.5065/AVTZ-1H78, 2024.
Kerr, J. B.: The Brewer Spectrophotometer, in: UV Radiation in Global Climate Change: Measurements, Modeling and Effects on Ecosystems, edited by: Gao, W., Slusser, J. R., and Schmoldt, D. L., Springer, Berlin, Heidelberg, 160–191, https://doi.org/10.1007/978-3-642-03313-1_6, 2010.
Kobayashi, S., Ota, Y., Harada, Y., Ebita, A., Moriya, M., Onoda, H., Onogi, K., Kamahori, H., Kobayashi, C., Endo, H., Miyaoka, K., and Takahashi, K.: The JRA-55 Reanalysis: General Specifications and Basic Characteristics, J. Meteorol. Soc. Jpn., 93, 5–48, https://doi.org/10.2151/jmsj.2015-001, 2015.
Kosaka, Y., Kobayashi, S., Harada, Y., Kobayashi, C., Naoe, H., Yoshimoto, K., Harada, M., Goto, N., Chiba, J., Miyaoka, K., Sekiguchi, R., Deushi, M., Kamahori, H., Nakaegawa, T., Tanaka, T. Y., Tokuhiro, T., Sato, Y., Matsushita, Y., and Onogi, K.: The JRA-3Q Reanalysis, J. Meteorol. Soc. Jpn., 102, 49–109, https://doi.org/10.2151/jmsj.2024-004, 2024.
Naoe, H., Matsumoto, T., Ueno, K., Maki, T., Deushi, M., and Takeuchi, A.: Bias Correction of Multi-sensor Total Column Ozone Satellite Data for 1978–2017, J. Meteorol. Soc. JPN II, 98, 353–377, https://doi.org/10.2151/jmsj.2020-019, 2020.
NASA: NASA/GFSC total ozone satellite datasets, NASA [data set], https://avdc.gsfc.nasa.gov/pub/data/satellite/ (last access: 21 January 2026), 2025.
NDACC: FTIR and UVVIS records, NASA [data set], https://www-air.larc.nasa.gov/missions/ndacc/data.html (last access: 20 March 2026), 2026.
Pazmiño, A., Goutail, F., Godin-Beekmann, S., Hauchecorne, A., Pommereau, J.-P., Chipperfield, M. P., Feng, W., Lefèvre, F., Lecouffe, A., Van Roozendael, M., Jepsen, N., Hansen, G., Kivi, R., Strong, K., and Walker, K. A.: Trends in polar ozone loss since 1989: potential sign of recovery in the Arctic ozone column, Atmos. Chem. Phys., 23, 15655–15670, https://doi.org/10.5194/acp-23-15655-2023, 2023.
PGN: Pandora total ozone records, Pandonia Global Network, https://www.pandonia-global-network.org/home/documents/pgn-data/ (last access: 20 March 2026), 2025.
Pommereau, J. P. and Goutail, F.: O3 and NO2 ground‐based measurements by visible spectrometry during Arctic winter and spring 1988, Geophys. Res. Lett., 15, 891–894, https://doi.org/10.1029/GL015i008p00891, 1988.
Redondas, A.: EUBREWNET ozone products for the Izana (Spain) station, AEMET [data set], https://doi.org/10.48801/eubrewnet.izana, 2023.
Redondas, A., Carreño, V., León-Luis, S. F., Hernández-Cruz, B., López-Solano, J., Rodriguez-Franco, J. J., Vilaplana, J. M., Gröbner, J., Rimmer, J., Bais, A. F., Savastiouk, V., Moreta, J. R., Boulkelia, L., Jepsen, N., Wilson, K. M., Shirotov, V., and Karppinen, T.: EUBREWNET RBCC-E Huelva 2015 Ozone Brewer Intercomparison, Atmos. Chem. Phys., 18, 9441–9455, https://doi.org/10.5194/acp-18-9441-2018, 2018.
Sarkissian, A., Vaughan, G., Roscoe, H. K., Bartlett, L. M., O'Connor, F. M., Drew, D. G., Hughes, P. A., and Moore, D. M.: Accuracy of measurements of total ozone by a SAOZ ground-based zenith sky visible spectrometer, J. Geophys. Res., 102, 1379–1390, https://doi.org/10.1029/95JD03836, 1997.
Savastiouk, V.: Improvements to the direct-sun ozone observations taken with the Brewer spectrophotometer, Ph.D Thesis, York University, Canada, https://www.esrl.noaa.gov/gmd/grad/neubrew/docs/publications/VladimirSavastiouk_PhD_thesis.pdf (last access: 21 September 2026), 2006.
Shafer, G.: A Mathematical Theory of Evidence, Princeton University Press, https://doi.org/10.2307/j.ctv10vm1qb, 1976.
Stübi, R., Schill, H., Klausen, J., Vuilleumier, L., Gröbner, J., Egli, L., and Ruffieux, D.: On the compatibility of Brewer total column ozone measurements in two adjacent valleys (Arosa and Davos) in the Swiss Alps, Atmos. Meas. Tech., 10, 4479–4490, https://doi.org/10.5194/amt-10-4479-2017, 2017.
Stübi, R., Schill, H., Maillard Barras, E., Klausen, J., and Haefele, A.: Quality assessment of Dobson spectrophotometers for ozone column measurements before and after automation at Arosa and Davos, Atmos. Meas. Tech., 14, 4203–4217, https://doi.org/10.5194/amt-14-4203-2021, 2021.
van der A, R. J., Allaart, M. a. F., and Eskes, H. J.: Extended and refined multi sensor reanalysis of total ozone for the period 1970–2012, Atmos. Meas. Tech., 8, 3021–3035, https://doi.org/10.5194/amt-8-3021-2015, 2015a.
van der A, R. J., Allaart, M. A. F., and Eskes, H. J.: Multi-Sensor Reanalysis (MSR) of total ozone, version 2, KNMI [data set], https://doi.org/10.21944/temis-ozone-msr2, 2015b.
Viatte, C., Schneider, M., Redondas, A., Hase, F., Eremenko, M., Chelin, P., Flaud, J.-M., Blumenstock, T., and Orphal, J.: Comparison of ground-based FTIR and Brewer O3 total column with data from two different IASI algorithms and from OMI and GOME-2 satellite instruments, Atmos. Meas. Tech., 4, 535–546, https://doi.org/10.5194/amt-4-535-2011, 2011.
Vigouroux, C., De Mazière, M., Demoulin, P., Servais, C., Hase, F., Blumenstock, T., Kramer, I., Schneider, M., Mellqvist, J., Strandberg, A., Velazco, V., Notholt, J., Sussmann, R., Stremme, W., Rockmann, A., Gardiner, T., Coleman, M., and Woods, P.: Evaluation of tropospheric and stratospheric ozone trends over Western Europe from ground-based FTIR network observations, Atmos. Chem. Phys., 8, 6865–6886, https://doi.org/10.5194/acp-8-6865-2008, 2008.
Vigouroux, C., Blumenstock, T., Coffey, M., Errera, Q., García, O., Jones, N. B., Hannigan, J. W., Hase, F., Liley, B., Mahieu, E., Mellqvist, J., Notholt, J., Palm, M., Persson, G., Schneider, M., Servais, C., Smale, D., Thölix, L., and De Mazière, M.: Trends of ozone total columns and vertical distribution from FTIR observations at eight NDACC stations around the globe, Atmos. Chem. Phys., 15, 2915–2933, https://doi.org/10.5194/acp-15-2915-2015, 2015.
Voglmeier, K., Velazco, V. A., Egli, L., Gröbner, J., Redondas, A., and Steinbrecht, W.: The transition to new ozone absorption cross sections for Dobson and Brewer total ozone measurements, Atmos. Meas. Tech., 17, 2277–2294, https://doi.org/10.5194/amt-17-2277-2024, 2024.
Wargan, K., Labow, G., Frith, S., Pawson, S., Livesey, N., and Partyka, G.: Evaluation of the Ozone Fields in NASA's MERRA-2 Reanalysis, J. Climate, 30, 2961–2988, https://doi.org/10.1175/JCLI-D-16-0699.1, 2017.
Weber, M., Arosio, C., Coldewey-Egbers, M., Fioletov, V. E., Frith, S. M., Wild, J. D., Tourpali, K., Burrows, J. P., and Loyola, D.: Global total ozone recovery trends attributed to ozone-depleting substance (ODS) changes derived from five merged ozone datasets, Atmos. Chem. Phys., 22, 6843–6859, https://doi.org/10.5194/acp-22-6843-2022, 2022.
WMO: Scientific Assessment of the Ozone Layer Depletion: 2022, Global Ozone Research and Monitoring Project, World Meteorological Organization, Geneva, Switzerland, http://www.unep.org/resources/publication/scientific-assessment-ozone-layer-depletion-2022 (last access: 21 September 2026), 2022.
WMO/GAW: WMO Global Atmosphere Watch (GAW) Implementation Plan: 2016–2023, WMO, https://library.wmo.int/es/records/item/55442 (last access: 21 September 2026), 2017.
WMO/GAW: Global Atmosphere Watch Central Facilities Activity Report (2010–2023), 321, WMO, Geneva, Switzerland, https://library.wmo.int/records/item/69832 (last access: 14 July 2026), 2026.
WOUDC: Brewer, Dobson, and Filter total ozone records on the World Ozone and Ultraviolet Radiation Data Centre, World Meteorological Organization-Global Atmosphere Watch Program (WMO-GAW)/World Ozone and Ultraviolet Radiation Data Centre (WOUDC) [data set], https://doi.org/10.14287/10000004, 2026.
Zhao, X., Fioletov, V., Cede, A., Davies, J., and Strong, K.: Accuracy, precision, and temperature dependence of Pandora total ozone measurements estimated from a comparison with the Brewer triad in Toronto, Atmos. Meas. Tech., 9, 5747–5761, https://doi.org/10.5194/amt-9-5747-2016, 2016.
Zhao, X., Fioletov, V., Brohart, M., Savastiouk, V., Abboud, I., Ogyu, A., Davies, J., Sit, R., Lee, S. C., Cede, A., Tiefengraber, M., Müller, M., Griffin, D., and McLinden, C.: The world Brewer reference triad – updated performance assessment and new double triad, Atmos. Meas. Tech., 14, 2261–2283, https://doi.org/10.5194/amt-14-2261-2021, 2021.
Zhao, X., Griffin, D., Fioletov, V., McLinden, C., Liu, X., Park, J., Petropavlovskikh, I., Hanisco, T. F., Szykman, J., Valin, L., Baumann, E., Cede, A., Tiefengraber, M., Gebetsberger, M., Uesato, I., Zheng, X., Ahn, S., Chang, L., Lee, W.-J., Kim, J. H., Lee, H., Baek, K., Redondas, A., Fujiwara, M., Wang, T., Grutter, M., Houck, J. C., Haffner, D., and Lee, S. C.: Geostationary Satellites Total Ozone Observations: First Results on Ground-Based Networks Validation Efforts for TEMPO and GEMS, Geophys. Res. Lette., 52, e2025GL114768, https://doi.org/10.1029/2025GL114768, 2025.
Zuber, R., Köhler, U., Egli, L., Ribnitzky, M., Steinbrecht, W., and Gröbner, J.: Total ozone column intercomparison of Brewers, Dobsons, and BTS-Solar at Hohenpeißenberg and Davos in 2019/2020, Atmos. Meas. Tech., 14, 4915–4928, https://doi.org/10.5194/amt-14-4915-2021, 2021.
- Abstract
- Copyright statement
- Introduction
- Datasets and statistical model
- Statistical model
- Status of ground-based networks
- Results
- Conclusions
- Appendix A: Percentage differences between ground-based networks with reanalysis datasets and satellite observations
- Appendix B: Statistical analysis criteria used for ground-based network assessment
- Appendix C: Thresholds for statistical models
- Appendix D: ΔTCO seasonal amplitude fitting
- Data availability
- Author contributions
- Competing interests
- Disclaimer
- Special issue statement
- Acknowledgements
- Review statement
- References
- Abstract
- Copyright statement
- Introduction
- Datasets and statistical model
- Statistical model
- Status of ground-based networks
- Results
- Conclusions
- Appendix A: Percentage differences between ground-based networks with reanalysis datasets and satellite observations
- Appendix B: Statistical analysis criteria used for ground-based network assessment
- Appendix C: Thresholds for statistical models
- Appendix D: ΔTCO seasonal amplitude fitting
- Data availability
- Author contributions
- Competing interests
- Disclaimer
- Special issue statement
- Acknowledgements
- Review statement
- References