
the Creative Commons Attribution 4.0 License.
the Creative Commons Attribution 4.0 License.
 | 21 Sep 2026
Chemical characterization and source apportionment of carbonaceous aerosols during post-monsoon biomass burning and Diwali at an upwind site of Delhi

Dilip Ganguly
Jaswant Rathore
Lokesh Kumar Sahu
Ravi Kumar Kunchala
Sagnik Dey
Severe post-monsoon haze in Delhi-NCR poses air-quality and health risks and reflects regional and urban emissions. Sonipat lies along the principal transport corridor linking the agricultural burning regions of Punjab and Haryana with Delhi and serves as an intermediate receptor for regional pollution. However, source apportionment at upwind locations remains limited. To address this gap, we measured composition-based PM2.5, defined as non-refractory PM2.5 plus equivalent black carbon, at Sonipat from 25 October to 15 November 2023 using a Time-of-Flight Aerosol Chemical Speciation Monitor and a multi-wavelength Aethalometer. Positive matrix factorization, black-carbon apportionment, and trajectory and wind analyses were used to identify carbonaceous aerosol sources and examine their evolution during haze, non-haze, and Diwali periods. Two severe haze episodes occurred, with composition-based PM2.5 exceeding 300 µg m−3. Organic aerosol contributed 65 % of non-refractory PM2.5, and its daily mean reached nearly 140 µg m−3. Oxygenated organic aerosol accounted for approximately 57 %–60 % of total organic aerosol, with more-oxidized oxygenated organic aerosol reaching 42.8 µg m−3 during peak haze, indicating substantial secondary processing and accumulation. Under the reference absorption Ångström exponent pair, biomass- or solid-fuel-related eBC accounted for approximately 78 % of the campaign-integrated eBC burden, although the quantitative source split was sensitive to the assumed exponents. Northwestern transport signatures and co-variation of eBCbb with biomass-burning and solid-fuel organic aerosol indicate an important regional combustion influence. These findings show that carbonaceous aerosol was already present at this receptor before further interaction with Delhi emissions and support coordinated regional controls alongside sustained urban emission reductions.
- Article
(4522 KB) - Full-text XML
-
Supplement
(3048 KB) - BibTeX
- EndNote


The Indo-Gangetic Plain (IGP) is widely recognized as one of the most polluted regions globally in terms of fine particulate matter (PM2.5) loading and its associated atmospheric impacts (Dey and Di Girolamo, 2010; Ganguly et al., 2009; Ghude et al., 2016). This densely populated and rapidly developing airshed is influenced by a complex mixture of emission sources, including vehicular traffic, industrial activities, residential biofuel consumption, and seasonal agricultural residue burning (Biswal et al., 2023; Ganguly et al., 2009). Within the IGP, the Delhi-National Capital Region (Delhi-NCR) frequently experiences severe haze episodes, particularly during the post-monsoon and winter seasons (Gani et al., 2019), when PM2.5 concentrations can exceed World Health Organization (WHO) guidelines by an order of magnitude or more (Rathore et al., 2025). These extreme pollution episodes have profound public health consequences. Air pollution in India has been linked to 1.67 million premature deaths in 2019, with approximately 1 million deaths attributed specifically to ambient PM2.5 exposure (Pandey et al., 2021). Given its significance in critical scientific and policy priority, it is necessary to understand the sources and processes that drive these episodes over the study region.
Post-monsoon haze events over northern India are strongly influenced by extensive agricultural residue burning in the northwestern IGP, particularly across Punjab and Haryana, and are further reinforced by unfavorable meteorological conditions (Sarkar et al., 2018). Cold and dry northwesterly winds coincide with the post-harvest agricultural cycle, transporting biomass-burning emissions toward Delhi-NCR. At the same time, shallow planetary boundary layers (PBLs), weak ventilation, and stagnant conditions limit dispersion and enhance pollutant accumulation near the surface (Nair et al., 2007). Although the dominant drivers of these episodes are broadly understood, robust quantification of individual source contributions and their evolution during regional transport remains limited. This limitation is particularly pronounced at upwind locations outside the urban core, where transported air mass begins to interact with local emissions and undergoes complex chemical processing before reaching megacity environments (Lalchandani et al., 2022).
Reliable source apportionment is essential for designing effective mitigation strategies. Policy frameworks such as the Graded Response Action Plan (GRAP) depend on accurate identification of dominant sources, yet separating regional background pollution from episodic enhancements associated with biomass burning and festival-related emissions remains challenging (Ghude et al., 2024; Pant et al., 2016; Yadav et al., 2022). During the post-monsoon period, intense agricultural burning and Diwali firework emissions can both elevate PM2.5 concentrations (Satish et al., 2017; Thamban et al., 2019). Their chemical signatures often overlap with those from domestic cooking and heating, complicating attribution (Tobler et al., 2020). Distinguishing these contributions is critical because the relative importance of primary versus secondary sources has direct implications for control strategies. For example, if secondary aerosol formation dominates, mitigation efforts targeting only primary emissions may be insufficient to significantly reduce peak pollution levels.
Most of the previous studies on source apportionment in the region have relied on filter-based receptor modelling, which typically provides 24 h averaged chemical composition (Jain et al., 2019; Sharma et al., 2016). While such approaches yield valuable information on bulk aerosol composition, they lack the temporal resolution required to capture rapid chemical transformations and short-lived pollution peaks. Intense but transient emissions from firework displays, moving fire plumes, or episodic industrial activities can be substantially smoothed in daily averages. Moreover, measurements conducted within dense urban environments are often dominated by local traffic and industrial emissions, which can mask the signatures of regionally transported aerosols (Bhandari et al., 2020; Guttikunda and Calori, 2013; Singh et al., 2021b). These limitations highlight the need for high-time-resolution measurements at strategically located receptor sites to isolate regional contributions.
Advances in online aerosol instrumentation provide new opportunities to overcome these challenges. Instruments such as the Time-of-Flight Aerosol Chemical Speciation Monitor (ToF-ACSM) enable continuous, high-time-resolution measurements of non-refractory aerosol species and can resolve rapid changes in chemical composition associated with evolving atmospheric processes (Fröhlich et al., 2013; Ng et al., 2011). When combined with Positive Matrix Factorization (PMF), these datasets can be decomposed into sources related to organic aerosol factors without requiring a priori source profiles (Canonaco et al., 2013). This approach has been widely applied across complex source regions within the IGP to differentiate fresh biomass burning organic aerosol (BBOA) from more aged, oxygenated organic aerosol (OOA), thereby providing deeper insight into aerosol evolution beyond bulk chemical characterization (Lakra et al., 2024; Shukla et al., 2025). Recent studies have identified solid-fuel combustion organic aerosol (SFCOA) and oxygenated organic aerosol (OOA) as major contributors to organic mass in Delhi (Lalchandani et al., 2022) and Faridabad (Tobler et al., 2020). However, most such investigations have focused on urban receptor sites, leaving the transformation and mixing processes of carbonaceous aerosols during regional transport poorly constrained .
In this context, Sonipat, located northwest of Delhi along the dominant pollution transport corridor from Punjab and Haryana, represents a strategically important upwind receptor site. Air masses arriving at this location intercept regional biomass-burning plumes before they are substantially mixed with strong local emissions from the Delhi metropolitan area (Singh et al., 2023). Recent chemical characterization at this site during the post-monsoon period indicated that carbonaceous aerosols accounted for nearly 80 % of composition-based PM2.5 mass, with relatively minor contributions from secondary inorganic species (Rathore et al., 2025). This composition differs from haze episodes in other regions such as the North China Plain, where secondary sulfate and nitrate often dominate. Analysis of satellite-derived vegetation indices and fire counts data reveals increasing agricultural burning activity in source regions upwind of Sonipat (Jethva et al., 2019), supporting the observations of enhanced aged organic aerosol at this site (Rathore et al., 2025). Although earlier work characterized bulk aerosol chemistry and highlighted the importance of biomass burning emissions, substantial variability during the Diwali festival and post-rainfall periods suggests the presence of multiple temporally varying sources that cannot be resolved through bulk analysis alone. Periods of relatively clean air following rainfall, followed by rapid pollution buildup during Diwali, provide a natural experiment for examining source dynamics under changing meteorological and emission conditions.
Based on the research literature, there are several questions yet to be addressed for better understanding the role of the source contributions and evaluating the effectiveness of emission control strategies. We have tried to answer some of those questions in this manuscript as follow:
-
What are the relative contributions of transported biomass burning emissions and local sources such as traffic and industry emissions during peak haze conditions at this upwind location?
-
To what extent does primary organic aerosol dominate over secondary formation under conditions of weak photochemistry and limited inorganic precursor availability?
Addressing these questions is essential for evaluating the effectiveness of emission control strategies. A detailed, high-time-resolution source apportionment is therefore required to disentangle the contributions of individual sources and to assess the balance between primary and secondary carbonaceous aerosols during regional transport into Delhi.
In this study, we present a comprehensive source apportionment of PM2.5 at the upwind Sonipat site during the post-monsoon biomass-burning and Diwali period, building upon our earlier chemical characterization study (Rathore et al., 2025). Using high-time-resolution ToF-ACSM and Aethalometer measurements in conjunction with receptor modeling and trajectory analysis, we resolve carbonaceous aerosol into source-specific components and examine their temporal variability in relation to meteorology and independent tracers. The primary objectives are to (i) identify and quantify major organic aerosol sources during haze and non-haze conditions, (ii) assess the relative contributions of transported biomass burning emissions, local traffic, industrial sources, and secondary formation, and (iii) contrast source dynamics between prolonged biomass-burning episodes and the transient Diwali event. Rathore et al. (2025) established this site as an upwind receptor and characterized the haze episodes at Sonipat, identifying two haze and two non-haze episodes through temporal variability, tracer, and fragment analyses combined with VOC emission ratios. Building on this foundation, the present work offers one of the first high-resolution PM2.5 source apportionment analyses at this strategically located upwind gateway to Delhi, providing new constraints on regional transport processes and source contributions relevant to air quality management across Delhi-NCR and the broader Indo-Gangetic Plain.
2.1 Study Site Description
Measurements for this study were conducted at the Center for Atmospheric Sciences-Atmospheric Observatory (CAS-AO) located on the IIT Delhi Sonipat campus (28.95° N, 77.10° E; 228 m above mean sea level). The observatory is situated approximately 14 km upwind of the Delhi border in the state of Haryana and lies within the National Capital Region (NCR). The site is positioned in a semi-urban environment within the Rajiv Gandhi Education City and is surrounded by a heterogeneous land-use matrix comprising academic institutions, agricultural fields, small-scale industrial activities, and major national highways. This setting makes the site well suited for investigating the combined influence of regional and local emissions. The geographic location of the observational site, and an image of the installed ToF-ACSM are presented in Fig. 1.
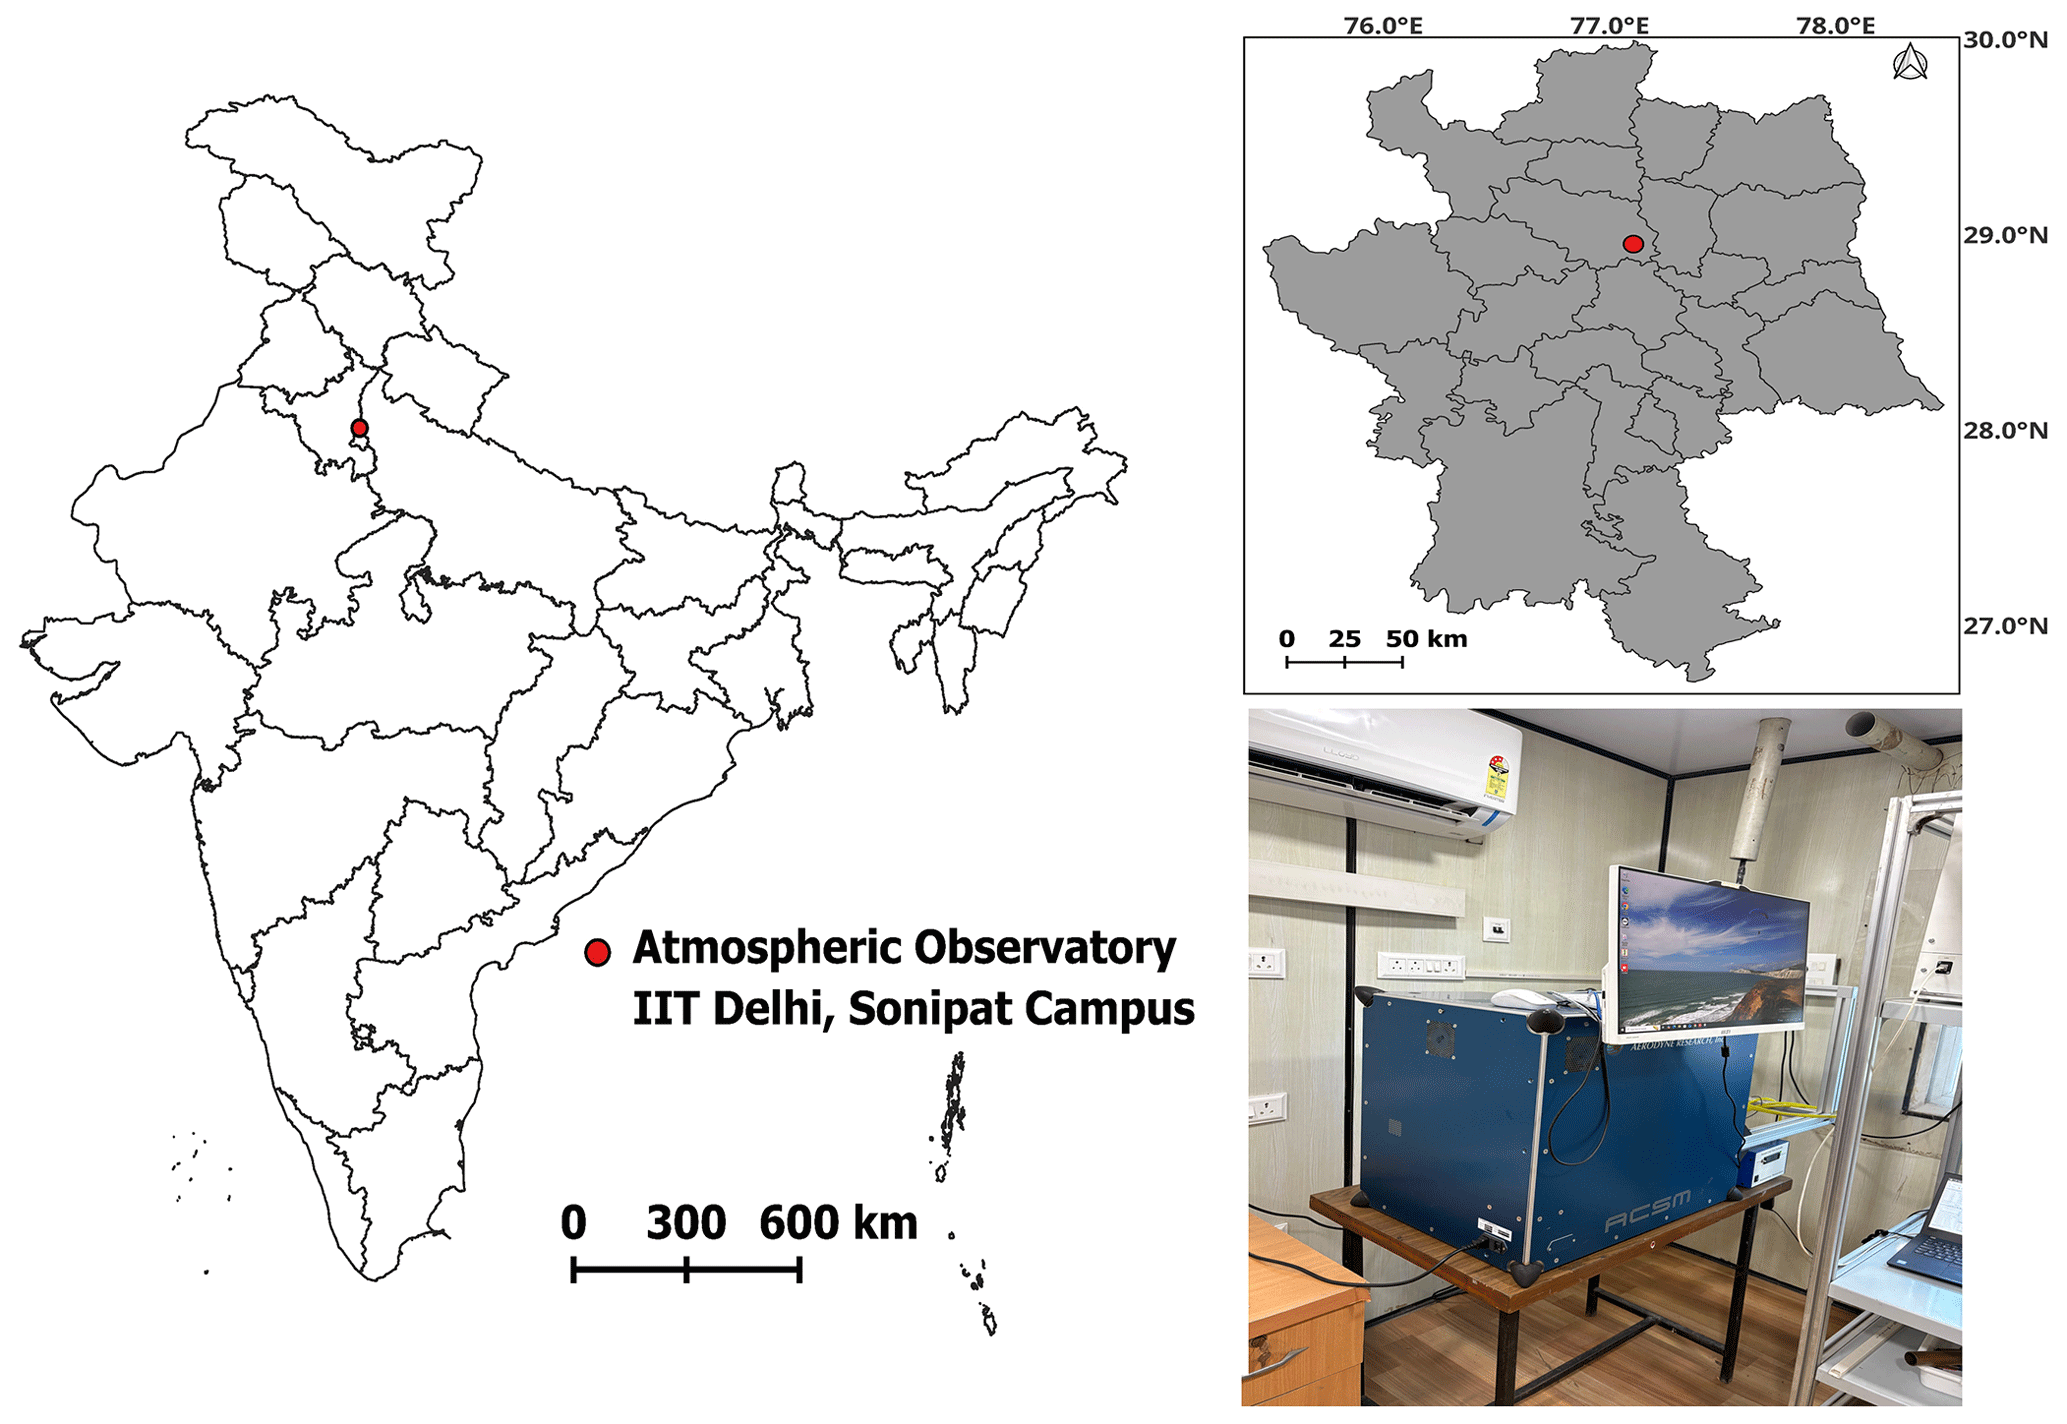
Figure 1Location map of the study site (marked by a star symbol) and a photograph of the installed ToF ACSM.
The regional climate is characterized by hot summers, a humid monsoon season, and cold winters, broadly similar to prevailing meteorological conditions over Delhi. During the pre-monsoon (March–May) and monsoon (June–September) seasons, the site is frequently affected by dust transport from Thar Desert. In contrast, the post monsoon (October–November) and winter (December–February) seasons are characterized by frequent haze and smog episodes that substantially degrade visibility and air quality. During the post-monsoon period, northwesterly winds often transport polluted air masses from the agricultural regions of Punjab and Haryana, where large-scale crop-residue burning occurs. In addition to these regional influences, the site is also affected by local vehicular emissions, nearby industrial activities, and biomass-burning sources. Owing to its proximity to Delhi and similarity in meteorological conditions, the site provides a representative location for examining aerosol processes relevant to the Delhi-NCR region. Additional details regarding the site characteristics, measurement, and long-term observations are provided in Rathore et al. (2025).
2.2 Instrumentation and Measurements
2.2.1 Time of Flight Aerosol Chemical Speciation Monitor (ToF-ACSM)
This study utilizes measurements conducted between 25 October 2023 to 16 November 2023 at the CAS-AO site using multiple state-of-the-art instruments. Non-refractory submicron particulate matter (NR-PM2.5) was measured using a Time-of-Flight Aerosol Chemical Speciation Monitor (ToF-ACSM; Aerodyne Research, Inc., Billerica, Massachusetts, USA) equipped with a PM2.5 aerodynamic lens and a capture vaporizer. The instrument was housed in a temperature-controlled room on the top floor (18 m above ground) of I-TECH building at the observatory to ensure stable operating conditions. The ToF-ACSM measures the mass concentration of non-refractory aerosol species that flash vaporize at temperature above ∼ 600 °C. Vaporized species are ionized using 70 eV electron-impact ionization, and the resulting ions are analyzed by a time-of-flight mass spectrometer (Fröhlich et al., 2013; Nault et al., 2023). The inlet system was specifically set up to enable the ToF-ACSM and the Scanning Mobility Particle Sizer (SMPS) to run alongside each other at the same time, sharing a common sampling line. The instrument is equipped with a 3.05 m copper tube and a PM2.5 cyclone at beginning of the inlet ensuring only fine particles (smaller than 2.5 µm) are analyzed from outside the window. The sampling line also has water trap and a Nafion membrane diffusion dryer(Perma Pure MD) to remove moisture from the aerosol sample. The system operates at a total flow rate of 2.5 L min−1. This flow is split between the connected instruments- the SMPS draws 1 L min−1, the ToF-ACSM pulls approximately 0.1 L min−1, and the leftover 1.4 L min−1 is handled by an in-line flow controller to maintain the overall balance. During the entire sampling period, the vaporizer was maintained at a temperature below 600 °C (approximately 525–530 °C). The ToF-ACSM was calibrated on-site, yielding relative ionization efficiencies (RIE) of 3.67 for NH4 and 1.12 for SO4, which were applied throughout the data processing(Rathore et al., 2025). For the data analysis, a composition-dependent collection efficiency (CDCE) value of 1 was applied to the capture vaporizer system, in line with the approach recommended by Hu et al. (2018). The instrument provides high-time-resolution measurements of organic aerosol, sulfate, nitrate, ammonium, and chloride with a 40 s time resolution, with 20 s of each cycle dedicated to background or filter sampling. Standard operating procedures, including calibrations, air-beam corrections, application of fragmentation tables, and uncertainty estimation, were performed using the TOFWARE 4.4.1 data analysis package prior to further processing.
2.2.2 Aethalometer AE31
Black carbon (BC) mass concentrations were measured using a seven-wavelength Aethalometer (model AE31; Magee Scientific, Berkeley, California, USA), which provides 7wavelength-dependent aerosol light absorption coefficients. The instrument measures the attenuation of light at 7 wavelengths: 370, 470, 520, 590, 660, 880, and 950 nm and infers BC concentration from the degree to which collected particles attenuate transmitted light. The AE31 Aethalometer had its own dedicated sampling arrangement, independent of the ToF-ACSM inlet AE31 sampled the ambient air at the rate of 2 L min−1 through a 2.5 m long conductive tube, with PM2.5 cyclone. The sampled air had a residence time of roughly 9.5 s within the tubing before reaching the analyzer. To ensure data quality, we conducted regular flow checks, leak tests, and instrument calibrations alongside routine maintenance over the course of the study. The AE31 system had a detection limit of 0.1 µg m−3.
2.2.3 Meteorological Measurement
Meteorological parameters, including temperature, relative humidity, wind speed, and wind direction, were obtained from an automatic weather station (AWS, manufactured by Geonica) installed at the rooftop I-TECH building of IIT Delhi Sonipat Campus. AWS gives real-time measurements at high temporal resolution, that was extracted in CSV format using Datagraph-W4K 2.1.30, a proprietary software provided by the manufacturer.
The vertical structure of the lower atmosphere, including atmospheric boundary layer (ABL) height and depolarization ratios, was monitored using a Vaisala CL61 ceilometer installed at the same site as AWS. We have used the derived planetary boundary layer height (PBLH) for this study (Rathore et al., 2025). All instruments are regularly calibrated and maintained to ensure reliability and accuracy of data. More detailed descriptions of instrument configuration, calibration protocols, and data acquisition procedures are discussed in Rathore et al. (2025).
2.3 Source-apportionment Techniques
Receptor-based source apportionment techniques were applied to identify and quantify major sources contributing to submicron aerosol mass at the study site. These methods resolve the observed aerosol composition into a limited number of source-related factors based on characteristic temporal and chemical signatures.
2.3.1 Positive Matrix Factorization (PMF)
Positive Matrix Factorization (PMF) was applied to the organic aerosol mass spectral dataset to apportion sources of submicron particulate matter. PMF is a multivariate receptor-modeling technique that decomposes the observed data matrix X into a factor contribution matrix G and a factor profile matrix F, along with a residual matrix E, such that:
The optimal solution is obtained by minimizing the objective function:
where eij represents residuals and σij denotes measurement uncertainties. This weighting scheme reduces the influence of variables with higher uncertainty on the solution (Paatero and Tapper, 1994). PMF has been widely used in aerosol mass spectrometry studies and is particularly well suited for resolving organic aerosol sources from high-time-resolution datasets (Ulbrich et al., 2009).
PMF analysis was performed using the Source Finder (SoFi, version 8) interface (Datalystica Ltd.) implemented in Igor Pro. SoFi provides an interactive framework that enables evaluation of rotational ambiguity through FPEAK exploration, as well as displacement and bootstrap analyses to assess solution stability. However, we have followed the Canonaco et al. (2021) framework where the rotational ambiguity was assessed using the combination of a-value and bootstrap analysis. The tool also allows direct comparison of factor profiles with reference spectra from previous studies (Canonaco et al., 2013, 2021). Factor identification was guided by time series behavior, diurnal patterns, correlations with external tracers, and comparison with established reference spectra.
2.3.2 Aethalometer-Based Source Apportionment of Black Carbon
Multi-wavelength AE31 Aethalometer measurements were used to estimate the contributions of fossil-fuel-related and biomass or solid-fuel-related combustion to equivalent black carbon sources using the Aethalometer model of Sandradewi et al. (2008). The model uses the wavelength dependence of aerosol light absorption and assumes that the measured absorption coefficient at a given wavelength is the sum of fossil-fuel-related and biomass-burning-related components (Sandradewi et al., 2008; Zotter et al., 2017).
The spectral dependence of each component is represented by a power-law relationship:
where α is the absorption Ångström exponent (AAE). Absorption coefficients at 470 and 950 nm were used because this wavelength pair provides sensitivity to differences in the spectral absorption associated with fossil-fuel and brown-carbon-containing combustion aerosols (Singh et al., 2021a).
The reference source apportionment used αff=1.0 and αbb=2.0, consistent with values commonly applied in previous studies (Deng et al., 2020; Vaishya et al., 2017). Because the selected AAE values are an important source of model uncertainty, we repeated the calculations using αff values from 0.9 to 1.1 and αbb values from 1.7 to 2.2. The sensitivity analysis and its results are presented in Sect. S3 and Fig. S10 of the Supplement.
The use of a common αbb value does not imply that open-field crop-residue burning, fuelwood combustion, dung-cake burning, and other solid-fuel sources have identical spectral absorption properties. Their AAEs may vary with fuel composition, combustion efficiency, flaming and smouldering conditions, brown-carbon content, atmospheric processing, and particle mixing state. The reference value of αbb=2.0 is therefore used to define an operational biomass- or solid-fuel-related optical component rather than to represent a unique AAE for all such sources. Accordingly, the resulting eBCbb component may include absorption associated with crop-residue burning, fuelwood, dung, and other brown-carbon-rich solid-fuel combustion sources, and the method cannot independently distinguish among them. Similarly, eBCff represents an operational fossil-fuel-related optical component rather than a source-specific measure of traffic emissions.
By solving the coupled Eq. (3) described by Sandradewi et al. (2008), the fractional contributions of eBCbb and eBCff were estimated. Data screening and quality control followed procedures outlined by Segura et al. (2014). The analysis methodology followed the approaches described by Harrison et al. (2013); Kumar et al. (2020) and Titos et al. (2017). Following Petzold et al. (2013), the term equivalent black carbon (eBC) is used to denote absorption-derived BC.
This method has been widely applied in Delhi and across the IGP to quantify contributions from vehicular emissions and biomass combustion, particularly during winter and the post-monsoon periods (Bikkina et al., 2019; Dumka et al., 2018). The method provides a useful indication of changes in the dominant optical combustion signature, although the quantitative fossil-fuel and biomass-burning split remains sensitive to the assumed AAE values and should be interpreted together with the sensitivity analysis presented in Sect. S3 and Fig. S10 of the Supplement and independent source indicators.
2.4 Trajectory and Wind Based Source Analysis
To identify potential source regions influencing the receptor site, concentration-weighted trajectory (CWT) analysis was conducted using the ZeFir toolkit by Petit et al. (2017). Five-day air mass back trajectories were computed at hourly time resolution using the Hybrid Single-Particle Lagrangian Integrated Trajectory (Hysplit v4.1) model (Stein et al., 2015), driven by Global Data Assimilation System (GDAS) meteorological fields at 1° × 1° a spatial resolution. These trajectories combined with time series of organic aerosol factors to compute CWT fields according to:
where, Ck is the measured concentration associated with trajectory k, and τijk is the residence time of trajectory k in the grid cell i j. This approach identifies geographic regions associated with elevated concentrations at the receptor site. Organic aerosol factor time series were averaged to 3 h intervals to match trajectory resolution.
To examine the relationship between pollutant concentrations and local meteorology, Non-Parametric Wind Regression (NWR) analysis was performed following Henry et al. (2009). NWR applies Gaussian kernel smoothing to estimate pollutant concentrations as a continuous function of wind speed and direction, enabling separation of local and transported sources. Pollution-rose analyses were generated by combining wind direction frequency with concentration data to identify dominant source sectors. These complementary methods provide a comprehensive assessment of local and regional source influences on observed aerosol composition.
For consistency with our earlier chemical characterization study (Rathore et al., 2025), we partition the measurement period into four phases representing distinct emission-meteorology regimes: a pre-haze non-haze period (NH1; 25 October–1 November), a prolonged biomass-burning–dominated haze episode (H1; 1–10 November), a rain-influenced non-haze period (NH2; 10–12 November), and a second haze episode coincident with Diwali emissions (H2; 12–15 November). Rathore et al. (2025) demonstrated that bulk PM2.5 during these phases is dominated by carbonaceous aerosols at Sonipat, indicating that this upwind site frequently experiences severe particulate loading even before air masses reach the Delhi urban core. Here, we extend that framework by resolving source-specific contributions to carbonaceous PM (organic aerosol and black carbon) and by examining how primary emissions, secondary processing, and meteorology jointly control the timing, magnitude, and composition of haze and non-haze conditions along the northwest transport corridor into Delhi-NCR. This approach is particularly relevant for mitigation because it distinguishes periods dominated by direct combustion emissions from periods where a large fraction of the mass resides in aged, oxygenated material, implying different leverage points for control strategies.
3.1 Identification and Interpretation of OA Factors
The PMF analysis applied to the ToF-ACSM organic mass spectra resolved five distinct factors: hydrocarbon-like organic aerosol (HOA), biomass-burning organic aerosol (BBOA), solid-fuel combustion organic aerosol (SFCOA), less oxidized oxygenated organic aerosol (LO-OOA), and more oxidized oxygenated organic aerosol (MO-OOA), providing a physically interpretable separation between primary organic aerosol (POA) and secondary organic aerosol (SOA) (Fig. 2a). The corresponding factor mass spectra and elemental ratios (calculation in Sect. S2) are shown in Fig. 2a and summarized in Table S1 (Supplement), while bulk C-PM2.5 (composition-based PM2.5 = NR-PM2.5 + BC) and OA-factor contributions are shown in Fig. 2b. The emergence of two oxygenated factors alongside multiple combustion-related factors is consistent with a receptor site that intercepts both fresh regional plumes and their progressively aged products. This structure is mechanistically meaningful for the IGP post-monsoon period because haze evolution often reflects not a single source type, but the superposition of transported combustion emissions and subsequent oxidation or partitioning under stagnant boundary-layer conditions.
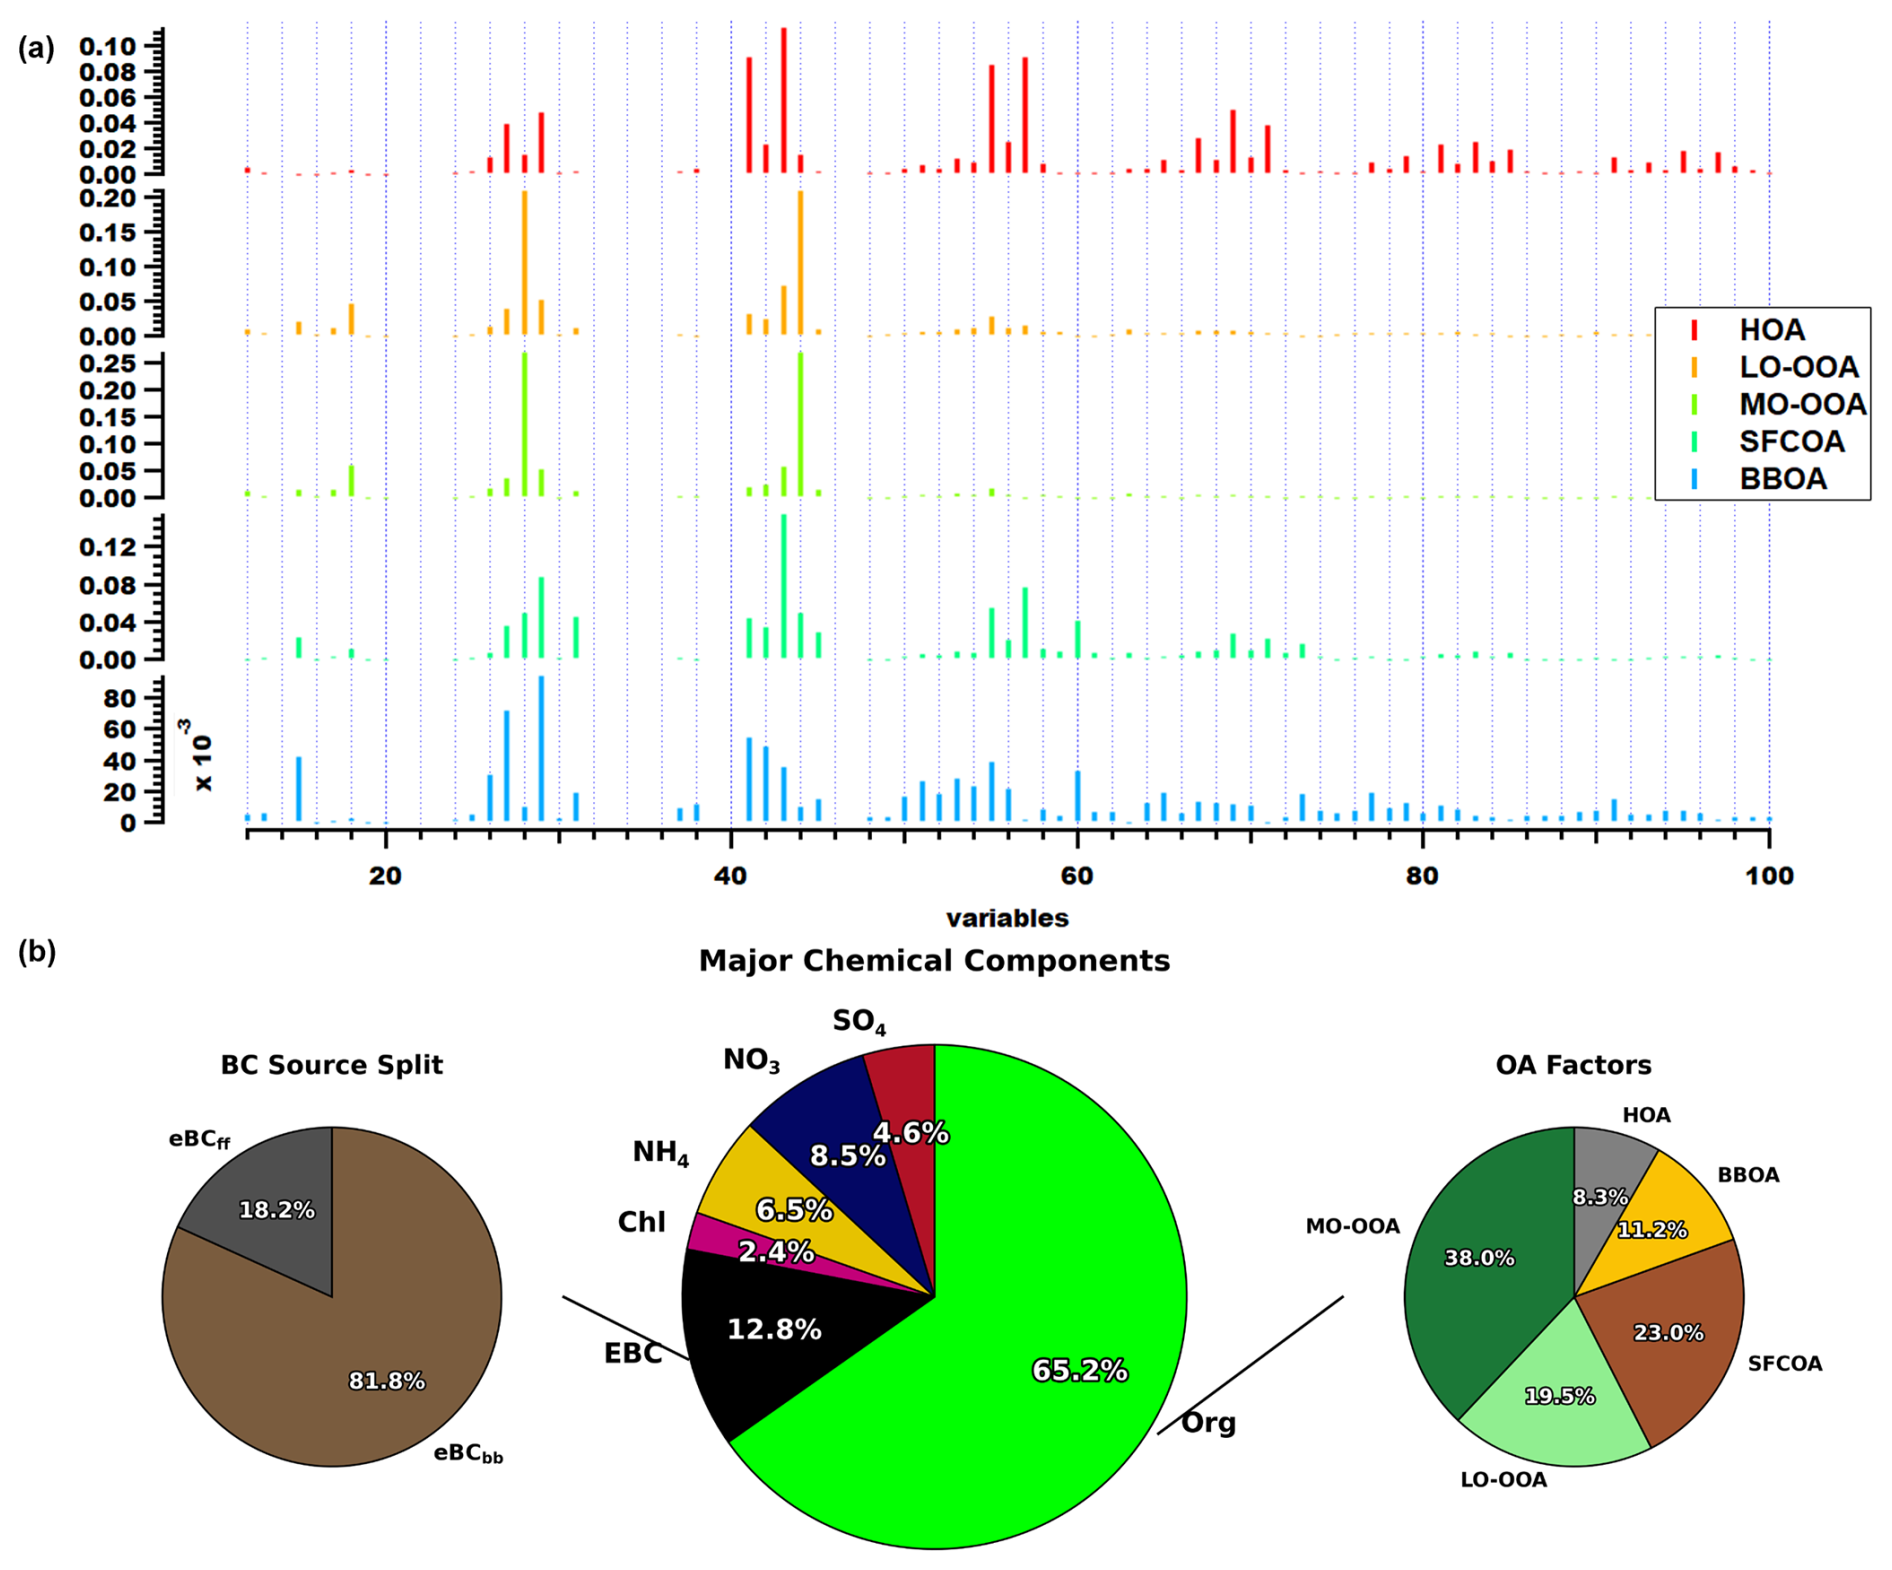
Figure 2(a) Mass spectra of the OA factors (HOA, LO-OOA, MO-OOA, SFCOA and BBOA) resolved by PMF and, (b) Species contribution to C-PM2.5 (NH, SO, NO, Org, Cl− and BC) (center pie chart), Relative contribution of OA factors to total OA (right pie chart) and Relative contribution of BC factors (left pie chart).
3.1.1 PMF solution selection and robustness
Unconstrained PMF solutions containing three to seven factors were first examined to determine the appropriate factor structure. Factor-number selection was evaluated using changes in , where Q is the uncertainty-weighted sum of squared residuals and Qexp is its statistically expected value, together with the residual structure, chemical interpretability of the factor profiles, temporal behaviour, relationships with independent tracers, and evidence of factor splitting. The decreases in for the transitions from three to four, four to five, five to six, and six to seven factors were 29.9 %, 41.2 %, 20.6 %, and 17.9 %, respectively (Fig. S1). The transition from four to five factors produced the largest relative improvement. Although continued to decrease for the six- and seven-factor solutions, these solutions produced splitting of existing factors and did not provide additional profiles with sufficiently distinct mass spectra, temporal behavior, or tracer relationships. The five-factor structure was therefore selected using the combined statistical and chemical diagnostics rather than from alone.
The unconstrained five-factor solution showed substantial mixing between HOA and SFCOA. We therefore retained the five-factor solution but used the ME-2 framework to obtain the final reported solution. Only the HOA profile was constrained, using the reference spectra of Canonaco et al. (2013) and Crippa et al. (2013) with random a-values between 0 and 0.5. BBOA, SFCOA, LO-OOA, and MO-OOA were left unconstrained. This approach allowed controlled variation of the HOA profile while improving the separation and chemical interpretability of HOA and SFCOA.
For the five-factor solution, ranged from 9.17 to 9.69 across FPEAK values from −1.0 to +1.0, with the minimum occurring at FPEAK = −0.2 (Fig. S1). The variation across the tested range was approximately 5.7 % relative to the minimum, indicating limited sensitivity of the overall fit statistic to FPEAK. Because the minimum remained greater than unity, the fit statistic was used comparatively rather than as evidence of an ideal model fit.
Bootstrap resampling using 500 iterations reproduced and successfully mapped all five factors in all runs according to the criteria described in Sect. S1. This indicates high reproducibility of the five-factor structure under resampling. Across the HOA a-value sensitivity analysis, the factor contributions remained within 7 %–9 % for HOA, 21 %–26 % for SFCOA, 10 %–14 % for BBOA, 18 %–20 % for LO-OOA, and 36 %–40 % for MO-OOA, without a systematic redistribution between HOA and SFCOA (Fig. S8). The scaled residuals were centred close to zero and showed no persistent positive or negative bias with time or , although the fitted residual-distribution width of 3.52 was broader than the ideal unit-width distribution, indicating remaining unexplained variability (Fig. S9). Taken together, these diagnostics support the reproducibility and interpretability of the selected five-factor solution while recognizing that PMF solutions are not mathematically unique. Further details are provided in Sect. S1 of the Supplement.
3.1.2 Primary OA Factors (HOA, BBOA, SFCOA)
HOA was characterized by prominent aliphatic hydrocarbon fragments at 41, 43, 55, and 57 and a low estimated O:C ratio (Eq. S5) of 0.10 (Table S1 in the Supplement), consistent with relatively fresh combustion emissions commonly associated with traffic and other fossil-fuel sources. The final source-apportionment analysis used the five-factor ME-2 solution described in Sect. 3.1.1. In this solution, only the HOA profile was constrained, while BBOA, SFCOA, LO-OOA, and MO-OOA were left unconstrained. The constraint allowed controlled variation of the HOA reference profile and improved its separation from SFCOA without strongly affecting the campaign-average factor contributions.
BBOA exhibited enhanced signals at the levoglucosan-related fragments 60 and 73 (Fig. 2a), together with a low estimated O:C ratio (Eq. S5) of 0.09 (Table S1 in Supplement), supporting its association with relatively fresh biomass-burning emissions. The BBOA factor should not, however, be interpreted as an exclusive measure of agricultural residue burning because emissions from wood, dung, and other biomass fuels can produce similar mass-spectral signatures. The slightly lower estimated O:C ratio of BBOA relative to HOA should also not be interpreted as a physical inversion of their oxidation states. Fragmentation associated with the capture vaporizer can suppress biomass-burning marker signals and affect empirical elemental-ratio estimates for primary and multifunctional organic aerosol, thereby reducing the apparent separation among primary factors (Canagaratna et al., 2015). The f44–f60 relationship reported for this campaign by Rathore et al. (2025), nevertheless supports an important fresh biomass-burning influence during the post-monsoon period.
Co-located aromatic VOC measurements provide additional information about the combustion sources affecting the site. Rathore et al. (2025) reported a strong correlation between xylene and ethylbenzene during the haze periods, with r2=0.97, indicating a common or closely related source influence. The regression slope, expressed as the xylene-to-ethylbenzene enhancement ratio , was approximately 0.92 ppb ppb−1. This value is lower than the ratio of 2.24±0.33 commonly reported for anthropogenic emissions dominated by fossil-fuel sources and falls within the range reported for biomass-burning plumes, which is generally below 1.2 (Monod et al., 2001; Nelson and Quigley, 1983; Wang et al., 2014). It is also comparable to the value of approximately 1.12 observed in biomass-combustion plumes in Brazil (Monod et al., 2001).
The low enhancement ratio supports an important biomass-burning contribution to the aromatic VOC mixture during the haze periods. However, xylene reacts more rapidly than ethylbenzene, and atmospheric aging may reduce the observed ratio through preferential xylene removal. We therefore use the enhancement ratio as supporting evidence rather than as a unique quantitative source tracer. When considered together with the BBOA mass spectrum, the enhancement of combustion-related factors, and the prevailing north-westerly transport signatures, the VOC measurements indicate that biomass-burning emissions contributed substantially to the primary aerosol and gaseous organic precursor mixture reaching Sonipat.
SFCOA contributed approximately 23 % of OA in the selected PMF solution (Fig. 2b). Its mass spectrum contained enhanced hydrocarbon-related fragments, including 55, together with signals at 60 and 73 that were weaker than those in the BBOA profile (Fig. 2a). The factor had an estimated O:C ratio (Eq. S5) of 0.21 (Table S1 in the Supplement), consistent with a mixed source category influenced by residential and small-scale industrial solid-fuel combustion. Solid fuels commonly used in northern India include fuelwood, dung cakes, crop residues, charcoal, and, in some applications, coal. Open burning of mixed municipal waste may provide an additional combustion-related influence in peri-urban areas. The relative importance of these sources is expected to vary with location, season, fuel availability, and combustion practice. Partial overlap between the marker ions of BBOA and SFCOA is expected because both factors represent combustion-related emissions. Nevertheless, differences in their mass spectra, temporal evolution, diurnal behaviour, and relationships with independent tracers support their interpretation as distinct, although not uniquely defined, source classes. Agricultural residue burning and household or small-scale industrial solid-fuel combustion also represent different combustion activities that require different regulatory and socioeconomic interventions.
The occurrence of BBOA and SFCOA at Sonipat indicates that primary biomass and solid-fuel combustion aerosol reached this upwind receptor under the observed post-monsoon transport conditions. The accompanying VOC evidence also suggests that these combustion sources supplied gaseous organic compounds capable of contributing to secondary aerosol formation. These findings support regional measures targeting biomass and solid-fuel combustion alongside sustained controls on urban primary emissions and aerosol precursor gases. The possible relationship between these combustion sources and the oxygenated OA factors is examined in Sect. 3.1.3.
3.1.3 Secondary OA Factors (LO-OOA, MO-OOA)
The two oxygenated organic aerosol factors were classified as less-oxidized oxygenated organic aerosol (LO-OOA) and more-oxidized oxygenated organic aerosol (MO-OOA) based primarily on their relative degree of oxygenation and inferred atmospheric processing (Guo et al., 2020). Together, they accounted for approximately 57.5 % of the total OA mass (Fig. 2b). Both oxygenated factors were reproducibly mapped in the bootstrap analysis, and their campaign-average contributions showed only limited variation across the HOA a-value sensitivity runs, as described in Sects. 3.1.1 and S1 (Supplement). MO-OOA was the largest individual factor and contributed approximately 38 % of OA. It was characterized by a strong signal at 44, attributed mainly to CO, and a high estimated O:C ratio (Eq. S5) of 0.91 (Table S1), consistent with extensively oxidized OA. Thermal decomposition of oxygenated organic acids contributes substantially to the 44 signal in aged OA (Ng et al., 2011). MO-OOA also had a lower ratio than LO-OOA, with values of 0.22 and 0.33, respectively, supporting its interpretation as the more extensively oxidized component. LO-OOA had an estimated O:C ratio (Eq. S5) of 0.72 and represents a comparatively less-oxidized secondary fraction that may form through more recent oxidation of gaseous organic precursors and the partitioning of lower-volatility products. Because the elemental ratios were obtained from empirical parameterizations applied to capture-vaporizer measurements, they are used as approximate indicators of relative oxidation state rather than as direct quantitative measurements.
The large combined contribution of LO-OOA and MO-OOA demonstrates that secondary processing was important at Sonipat during the study period. Several independent observations indicate that biomass and solid-fuel combustion contributed to the precursor mixture and processed aerosol represented by these factors. Both OOA factors increased during haze periods when BBOA, SFCOA, and eBCbb were also enhanced. The nighttime increase in LO-OOA broadly tracked that of eBCbb, which is consistent with secondary formation from recently emitted combustion precursors under shallow boundary-layer and weak-dispersion conditions. LO-OOA and MO-OOA also exhibited north-westerly transport signatures similar to those of the combustion-related factors. In addition, the f44–f43 and f44–f60 relationships reported by Rathore et al. (2025) are consistent with the presence of processed biomass-burning OA, while the enhancement ratio of approximately 0.92 ppb ppb−1 supports an important biomass-burning influence on the aromatic VOC mixture during haze periods.
Processed biomass-burning OA can progressively lose the mass-spectral markers associated with fresh combustion and become spectrally similar to generic OOA. Vasilakopoulou et al. (2023), for example, showed that extensively processed biomass-burning aerosol may be represented within an OOA factor after its fresh-burning signatures have weakened. Their source interpretation required independent evidence in addition to the OOA mass spectrum, illustrating that OOA cannot be assigned uniquely to biomass burning from ACSM spectra alone. In the present study, the temporal correspondence and common transport signatures of MO-OOA and the combustion-related factors are consistent with a contribution from aged biomass and solid-fuel combustion aerosol, but they do not establish that all MO-OOA originated from these sources.
The use of a capture vaporizer introduces an additional interpretive uncertainty. Biomass-burning marker signals, particularly f60, are lower in capture-vaporizer spectra than in standard-vaporizer spectra, and these signals decline further during atmospheric aging (Zheng et al., 2020). Consequently, the resolved BBOA factor may not represent the complete contribution of biomass-burning OA. Some processed combustion-derived material may instead be represented within LO-OOA or MO-OOA. This possibility should be considered when interpreting the relatively modest BBOA contribution and the large oxygenated fraction, although the available measurements do not permit a quantitative reassignment of OOA mass to biomass burning.
We therefore interpret LO-OOA and MO-OOA as mixed secondary components with evidence for an important combustion influence during the haze periods. LO-OOA may include relatively recently formed oxidation products from biomass and solid-fuel combustion emissions, while MO-OOA may contain more extensively aged and regionally transported combustion-derived material. However, particle-phase PMF cannot directly identify the emission sources or relative contributions of the gaseous and particle-phase organic precursors that contribute to the formation of LO-OOA and MO-OOA. Contributions from traffic, industrial activities, residential fuel use, and biogenic emissions cannot be excluded or quantified using the available observations. Biomass and solid-fuel combustion are therefore considered important, and potentially major, anthropogenic precursor influences rather than the exclusive sources of either OOA factor.
This interpretation has direct implications for mitigation. Source-based reductions in biomass burning and solid-fuel combustion would reduce both directly emitted particulate matter and co-emitted gaseous organic precursors, potentially lowering BBOA, SFCOA, and combustion-derived OOA simultaneously. By contrast, measures targeting only directly emitted particles, without corresponding reductions in co-emitted organic precursors, may provide more limited reductions in LO-OOA and MO-OOA. Effective mitigation of the carbonaceous aerosol burden therefore requires coordinated regional reductions in combustion activities and precursor emissions alongside sustained controls on urban sources.
3.1.4 Black carbon source apportionment and linkage to OA sources
Using the reference AAE combination of αff=1.0 and αbb=2.0, the campaign-mean concentrations of fossil-fuel-related equivalent black carbon, eBCff, and biomass or solid-fuel-related equivalent black carbon, eBCbb, were 3.1 and 10.9 µg m−3, respectively (Table S2). These concentrations correspond to mass-weighted campaign fractions of 22.2 % for eBCff and 77.8 % for eBCbb. In contrast, the arithmetic means of the time-resolved and fractions under the same AAE combination were 46.4 % and 53.6 %, respectively. The difference between these two averaging approaches arises because the mass-weighted calculation gives greater influence to periods of high eBC loading, during which the Aethalometer model assigned a larger fraction of the absorption to the biomass or solid-fuel component. The value of 77.8 % should therefore be interpreted as the contribution to the campaign-integrated eBC burden under the reference AAE parameterization rather than as the typical source fraction at each measurement interval.
The quantitative source split was sensitive to the assumed AAE values. When αff was varied from 0.9 to 1.1 and αbb from 1.7 to 2.2, the arithmetic mean fraction ranged from 38.4 % to 79.7 %, while the corresponding fraction ranged from 20.3 % to 61.6 % (Sect. S3 and Fig. S10). The apportionment was particularly sensitive to αbb. At a fixed αff of 1.0, increasing αbb from 1.7 to 2.2 changed the mean eBCff fraction from 22.4 % to 58.2 %. By comparison, at a fixed αbb of 2.0, changing αff from 0.9 to 1.1 altered the mean eBCff fraction from 43.6 % to 49.9 %. These results demonstrate that the exact numerical attribution to biomass- or solid-fuel-related and fossil-fuel-related combustion is not uniquely constrained by the optical measurements and depends substantially on the selected AAE values (Sect. S3 and Fig. S10).
Accordingly, eBCbbrepresents an operational biomass- or solid-fuel-related optical component, while eBCff represents a fossil-fuel-related optical component, as described in Sects. 2.3.2 and S3. Nevertheless, several independent observations support an important biomass and solid-fuel influence during the study period. The eBCbb component was elevated during high-loading episodes and showed temporal correspondence with the PMF-resolved BBOA and SFCOA factors (Figs. S2 and S5). These periods also frequently coincided with north-westerly transport from Punjab and Haryana, where agricultural residue burning was active during the post-monsoon season. Therefore, the optical apportionment, OA factor behaviour, and transport diagnostics support a substantial regional combustion contribution to the carbonaceous aerosol measured at Sonipat, while allowing for concurrent local and fossil-fuel influences.
The source pattern obtained under the reference parameterization differs from that reported in several urban Delhi studies, where fossil-fuel-related eBC was the larger apportioned component. Dumka et al. (2018), for example, reported mean eBCff and eBCbb concentrations of 17.6 and 6.8 µg m−3, respectively, during December 2015 to February 2016. (Goel et al., 2021) reported corresponding contributions of 68.85 % and 31.15 % during August to November 2020, with mean concentrations of 7.90 and 4.73 µg m−3, respectively. The greater apparent biomass- or solid-fuel-related contribution at Sonipat under the reference parameterization is consistent with its location in the northwestern upwind sector of Delhi-NCR and its exposure to regional post-monsoon combustion emissions. However, direct quantitative comparison among studies should be made cautiously because the reported source fractions may also be affected by differences in measurement periods, local source environments, wavelength selection, assumed AAE values, data-screening procedures, and averaging conventions.
The co-occurrence of elevated eBCbb, BBOA, and SFCOA also has implications for air quality and aerosol radiative effects. Black carbon emitted together with biomass and solid-fuel combustion products can enhance aerosol light absorption and contribute to atmospheric heating, potentially affecting boundary-layer stability and pollutant accumulation during haze conditions (Sahu et al., 2012; Shiraiwa et al., 2008). Quantification of these radiative and dynamical effects is beyond the scope of the present study. However, the observed association between the biomass- or solid-fuel-related optical component and the combustion-related OA factors indicates that reductions in post-monsoon biomass burning and solid-fuel combustion could lower both light-absorbing carbon and combustion-related organic aerosol at this upwind receptor. Because the precise eBC source split remains AAE-dependent, this interpretation is based on the combined evidence from optical apportionment, PMF-resolved OA factors, and transport analysis rather than on any single apportioned percentage.
3.1.5 Inorganic Fraction and Implications for Haze Chemistry
Although secondary inorganic aerosols (NO, SO, NH, and Cl−) account for only ∼ 20 % of bulk PM2.5 mass (Fig. 2b), the dominance of oxygenated OA within the organic fraction implies that secondary mass growth at Sonipat is more strongly governed by organic oxidation/aging processes than by inorganic neutralization and salt formation. This secondary organic heavy character is consistent with a receptor that intercepts biomass-burning plumes and their processed products before the air mass mixes with stronger urban NOx and ammonia emission environments that can promote substantial nitrate formation. The result is a haze chemical regime in which aged carbonaceous aerosol, rather than sulfate or nitrate, plays an outsized role in determining PM mass and optical properties at this upwind gateway to Delhi-NCR.
This contrast is important for understanding why Delhi-centric mitigation strategies that prioritize NO, NH, or sulfate (SO) driven inorganic aerosol control may not fully address the severity of upwind haze during the post-monsoon period. At Sonipat, the dominant mass resides in carbonaceous aerosol, much of it oxygenated, implying that regional combustion controls and interventions that reduce primary carbonaceous emissions and their reactive precursors are likely to provide stronger leverage for reducing the intensity of upwind haze events that subsequently influence Delhi-NCR. At the same time, the presence of non-negligible nitrate and chloride indicates that thermodynamic partitioning and multiphase processes still contribute to the aerosol burden, particularly during cool, humid and stagnant conditions that favor condensation and heterogeneous processing, setting up conditions conducive to sustained haze for longer duration.
3.1.6 Comparison with prior OA factorization studies over Delhi and the IGP
A significant amount of work over Delhi and the wider IGP has reported the dominant role of SOA contributions, particularly MO-OOA, though with strong seasonality and event dependence (Bhandari et al., 2020; Bhowmik et al., 2022; Goel et al., 2024; Lalchandani et al., 2022). For example, Shukla et al. (2021) applied PMF to ACSM measurements during summer season in Delhi and found strong MO-OOA dominance, consistent with extensive photochemical aging under high insolation and oxidant availability. Wintertime and post-monsoon studies more complex coupling between primary emissions and secondary processing. Thamban et al. (2021), demonstrated that SOA enhances not only OA but also the effective mass loading of primary OA families and wintertime inorganic species (e.g., nitrate and chloride), pointing to multiphase processing and nocturnal chemistry as critical amplifiers during haze (Haslett et al., 2023; Mathai et al., 2026).
More recent urban investigations further support this framework. Lalchandani et al. (2021) resolved traffic, biomass-burning, and oxygenated OA factors over Delhi and highlighted strong coupling between biomass-burning emissions and secondary OA formation during post-monsoon and winter periods. Similarly, Reyes-Villegas et al. (2021) reported oxygenated OA dominance during polluted conditions, consistent with enhanced oxidation states reflecting regional transport and aging. Across the IGP, Panda et al. (2025) reported substantial MO-OOA during prolonged haze, reinforcing the role of sustained secondary processing under stagnant meteorological conditions. Cash et al. (2023) emphasized that SOA formation is strongly modulated by meteorology and episodic primary emissions, producing large temporal variability in OA composition even within the same season. Within this broader context, the prominent MO-OOA fraction observed at Sonipat is consistent with the regional picture of strong secondary processing, while the magnitude and timing of primary combustion enhancements (especially SFCOA or BBOA) indicate that the proximity to upwind sources and shorter aging times can shift the balance toward primary emissions during certain periods, particularly short-lived events such as Diwali.
A key added value of the Sonipat perspective is that it enables a clearer separation of regional aerosol evolution occurring prior to arrival in Delhi from the intense urban mixing and source complexity within the city. The relatively low HOA and the dominant biomass-related BC fraction indicate that the upwind plume arriving at this intermediate receptor is compositionally distinct from Delhi's urban aerosol, and that the commonly reported large HOA contributions in Delhi represent additional urban increments rather than the nature of the regional background plume. This distinction matters for air-quality planning because it implies that a large fraction of the haze burden affecting Delhi-NCR can be pre-formed outside the city, requiring coordinated regional actions rather than city-only responses.
3.1.7 Temporal Evolution of OA Factors Across Haze and non-Haze Periods
Figure 3 shows the hourly time series of the five deconvolved OA factors during the study period. The time series reveals sharp regime shifts in both mass loading and source contributions, reflecting the combined effects of changing emissions intensity in the source regions, evolving transport pathways, and the local boundary-layer state at the receptor.
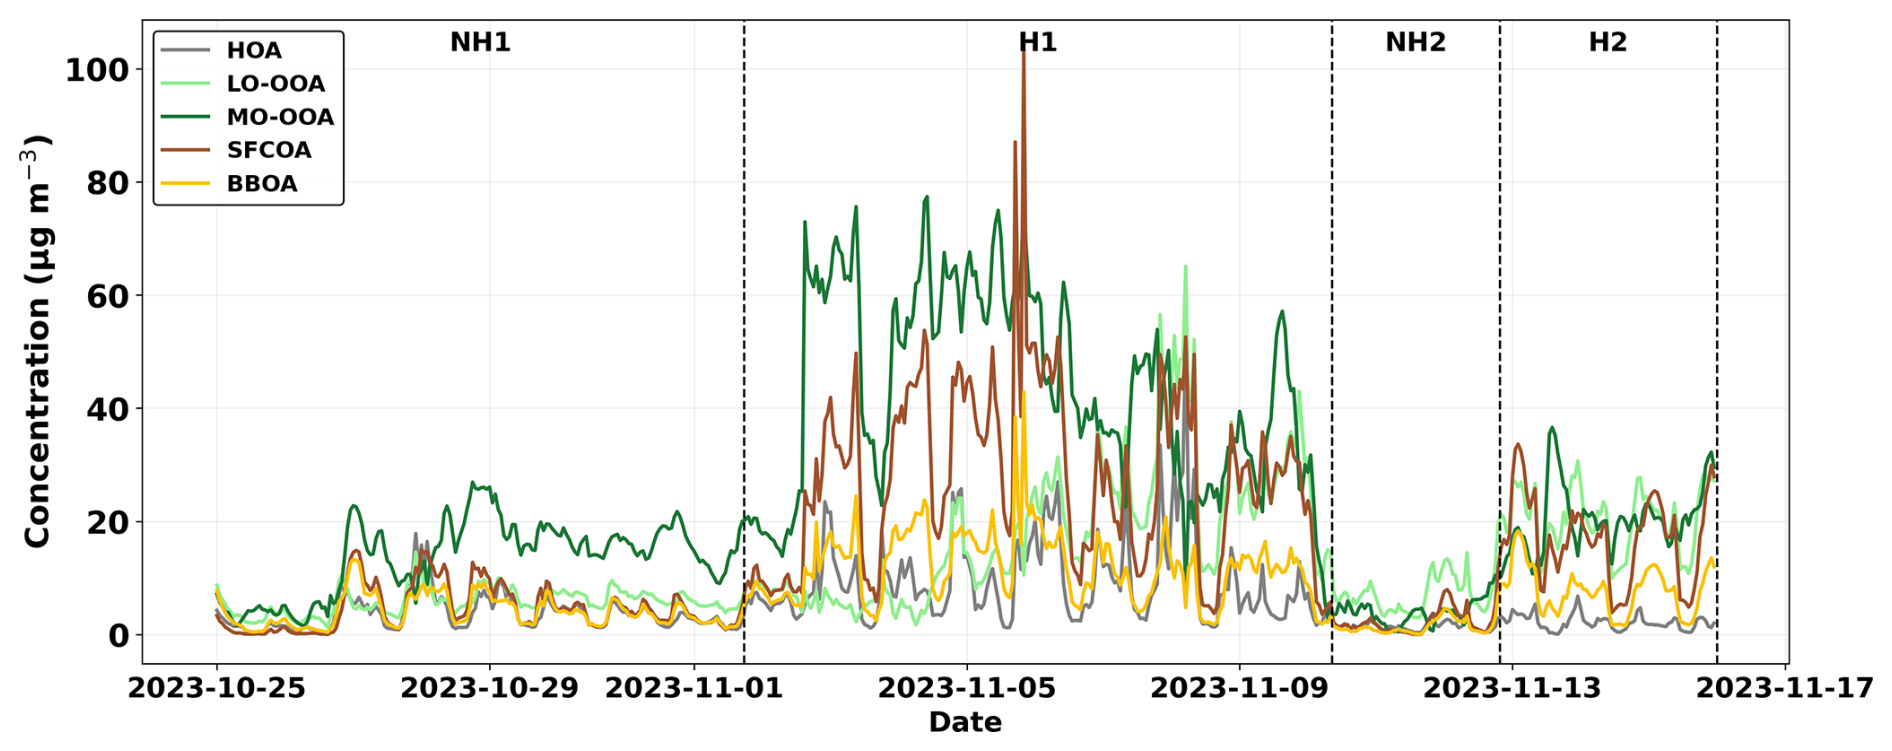
Figure 3Hourly time series of OA source components (µg m−3) during the sampling period. Five factors were resolved via PMF: HOA, LO-OOA, MO-OOA, SFCOA, and BBOA. Dashed lines demarcate non-haze (NH) and haze (H) periods based on the classification criteria established by Rathore et al. (2025).
During the initial non-haze phase (NH1), OA levels were relatively modest and the background was dominated by oxygenated OA, indicating a persistent regional secondary baseline even prior to the onset of severe haze. This baseline is important because it implies that even “non-haze” conditions can carry substantial aged material, so the transition to haze represents not a clean-to-dirty switch but an amplification of an already elevated carbonaceous background. As the system transitioned into H1, all OA factors increased markedly, with especially large enhancements in SFCOA and BBOA. SFCOA increased by roughly a factor of six relative to NH conditions and exceeded 100 µg m−3 during 5–6 November, while BBOA increased by roughly a factor of four. The timing is consistent with intensified upwind burning activity, also reflected by elevated fire counts (Fig. S15). Such concurrent enhancements of primary factors are typical of IGP haze formation when stagnant meteorology and shallow boundary layers limit dispersion and promote the accumulation of regionally transported combustion emissions (Lalchandani et al., 2022; Rathore et al., 2025). Importantly, MO-OOA remained persistently elevated throughout H1, indicating that regional processing/aging continues to contribute substantial mass even during periods dominated by primary emission spikes. This sustained MO-OOA suggests that multi-day accumulation and aging within the IGP transport corridor can maintain high oxygenated OA even when emission pulses fluctuate, implying that short-term episodic controls may need to be complemented by sustained reductions in regional combustion emissions to lower the baseline that supports prolonged haze.
Across the entire study period, MO-OOA had the highest overall mean concentration (25.0 µg m−3), followed by SFCOA (15.1 µg m−3) and LO-OOA (12.8 µg m−3) (Table S2). These concentrations are comparable to, and in some cases higher than, values reported in previous PM1 studies from urban center Delhi, noting that our study collects the PM2.5 that captures additional aged material at larger sizes. For example, in Old Delhi during post-monsoon, total oxygenated OA (MO-OOA + LO-OOA) reached 29.13 µg m−3 in PM1 (Cash et al., 2021), whereas our PM2.5 measurements show combined OOA (MO-OOA + LO-OOA) is 37.8 µg m−3, consistent with enhanced inclusion of larger, more processed material. Mean HOA (5.5 µg m−3) is broadly consistent with reported HOA ranges of ∼ 3–5 µg m−3 in PM1 in Delhi (Bhandari et al., 2020; Tobler et al., 2020), reinforcing that Sonipat is not a traffic-dominated urban core receptor and that the haze burden here is shaped primarily by regional combustion and subsequent aging rather than by intense local traffic increments.
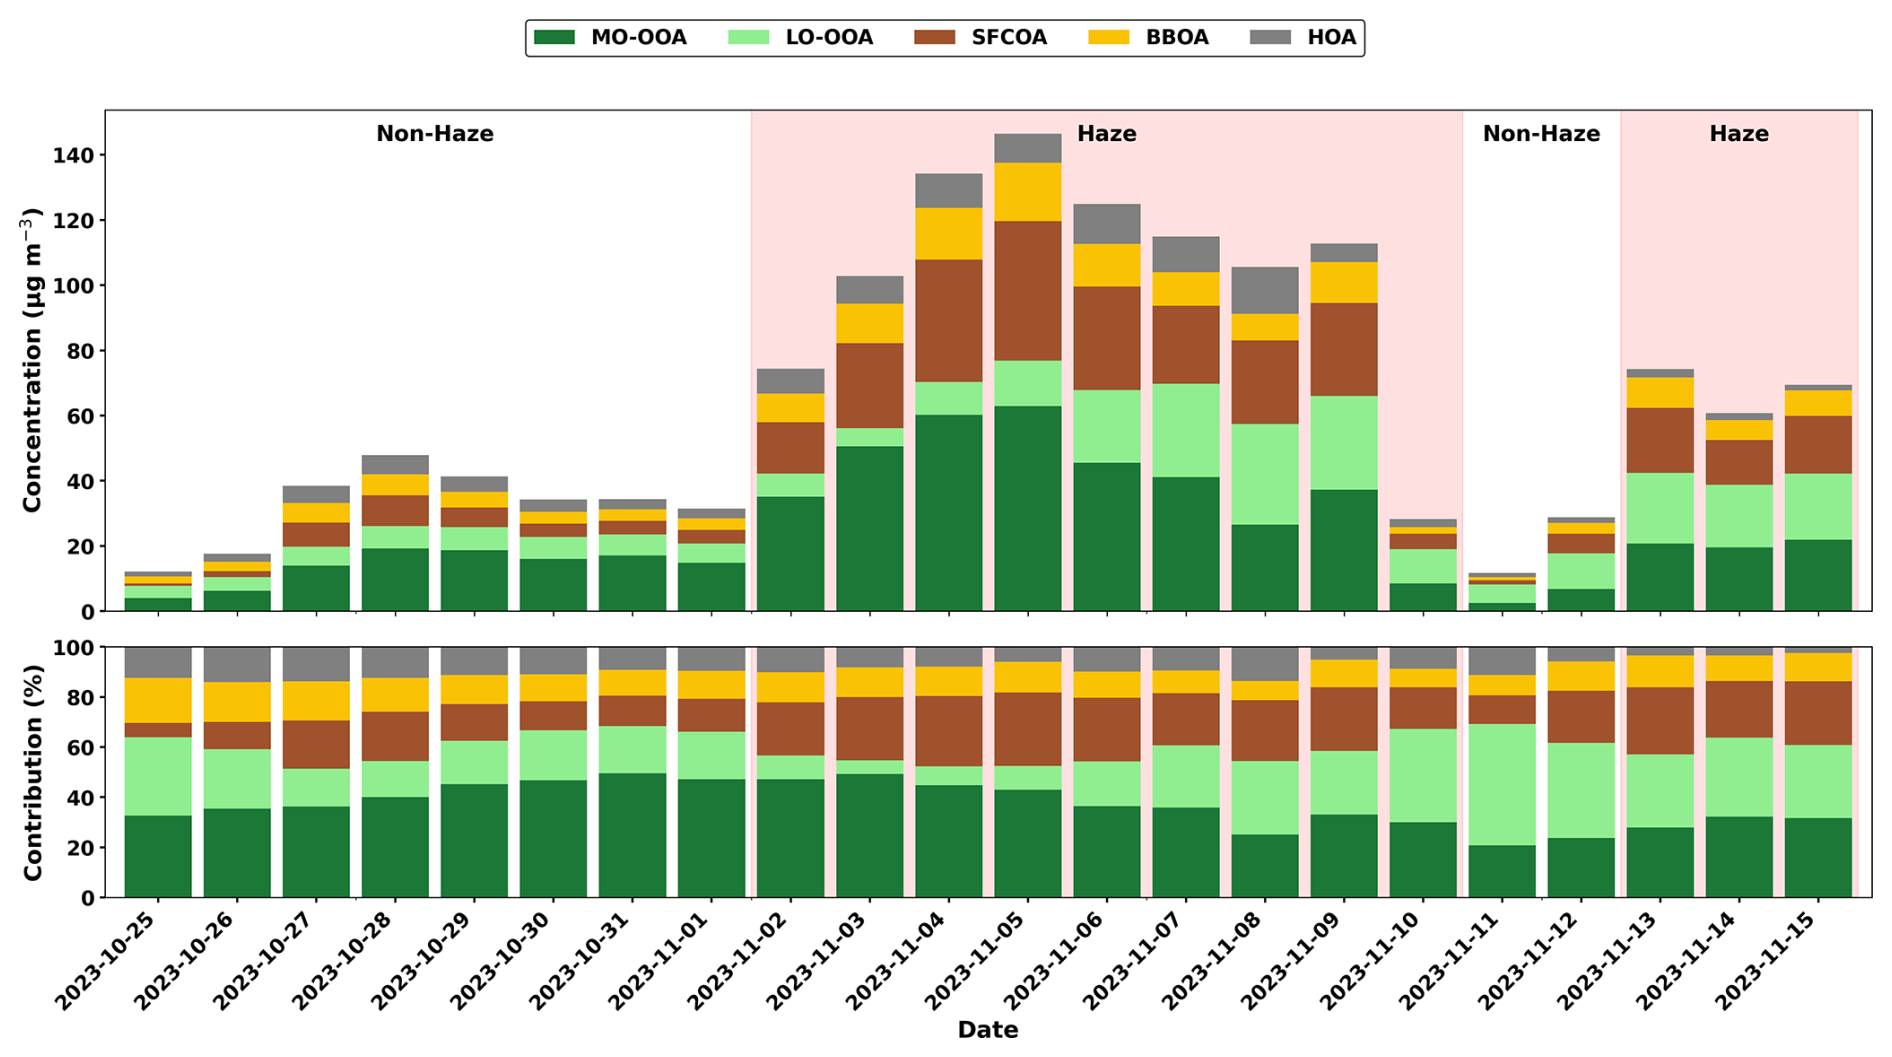
Figure 4Daily organic aerosol (OA) source contributions during haze and non-haze periods from 25 October to 15 November 2023. The upper panel shows absolute concentrations (µg m−3) of OA factors, including low-volatility oxygenated OA (MO-OOA), semi-volatile oxygenated OA (LO-OOA), solid fuel combustion OA (SFCOA), biomass burning OA (BBOA), and hydrocarbon-like OA (HOA). The lower panel presents the corresponding relative contributions (%) of each OA factor to total OA. Shaded regions indicate haze periods, while unshaded regions represent non-haze conditions.
Figure 4 presents daily absolute and fractional OA contributions. Secondary OA (LO-OOA + MO-OOA) remained dominant during haze periods, frequently contributing >55 % of total OA, consistent with continued secondary processing under stagnant and humid conditions. At the same time, strong enhancements in SFCOA and BBOA during haze indicate that primary combustion emissions are the immediate drivers of the most intense peaks, with secondary formation contributing to large and persistent baseline on top of which primary spikes are superimposed. This structure helps reconcile two seemingly competing narratives about IGP haze: it is both combustion-driven and strongly secondary. Combustion emissions provide the mass and precursors, while stagnant meteorology and multiphase processing sustain and amplify oxygenated aerosol. Notably, during H1, MO-OOA dominated early and remained persistently high, whereas during H2 the LO-OOA and MO-OOA contributions were more comparable, indicating differences in event character and/or processing pathways that are consistent with the shift from a prolonged regional burning episode to a shorter event with strong local/regional pulse emissions associated with Diwali.
3.1.8 Episode-wise contrasts (H1 versus H2; NH periods)
For the BC fraction, biomass burning emissions (eBCbb) were the dominant contributor with an overall mean of 10.9 µg m−3, significantly outweighing the average fossil fuel fraction (eBCff), of 3.1 µg m−3 (Table S2). This contrasts markedly with Delhi urban winter studies where eBCff dominated at 72 % with mean eBCff of 17.6 µg m−3 versus eBCbb of 6.8 µg m−3 during December 2015–February 2016 (Dumka et al., 2018) and eBCff contributed 68.85 % (7.90 µg m−3) compared to eBCbb at 31.15 % (4.73 µg m−3) during August-November 2020 (Gupta et al., 2022). However, measurements at this upwind Sonipat site shows an opposite pattern, with wood burning accounting for approximately 78 % of total BC, confirming the site's status as a regional receptor for transboundary biomass burning emissions rather than a localized traffic hotspot.
The first haze episode (H1) exhibited the highest concentrations for most factors. MO-OOA reached 42.8 µg m−3 during H1 compared to 13.5 µg m−3 in the preceding non-haze period (NH1), while SFCOA increased from 4.6 µg m−3 (NH1) to 27.5 µg m−3 (H1) and BBOA from 4.0 to 11.8 µg m−3 (Table S2). This magnitude is exceptional when compared to reported values from Delhi-NCR and other global megacities. For instance, during severe winter haze episodes in Beijing, total OA concentrations ranged from 43.8 to 87.9 µg m−3 with SOA contributing 46 %–66 % (Zhao et al., 2019), indicating that the aged oxygenated fraction at Sonipat during H1 approaches the lower end of total OA seen in Chinese megacity haze, despite Sonipat being a semi-urban upwind receptor. This comparison demonstrates that the extreme aerosol aging and accumulation can occur over the IGP transport corridor, not only within major urban cores, and therefore regional emission reductions can yield substantial benefits by reducing the mass that is already present before the plume reaches large population centers.
The SFCOA levels during H1 are notably higher than typical Delhi urban winter averages, where combined SFCOA factors contributed approximately 20 %–35 % of total OA in PM1 measurements across urban Delhi and suburban Faridabad sites (Lalchandani et al., 2022; Tobler et al., 2020).
In contrast, the second haze episode, H2, exhibited a different oxygenated OA distribution. SFCOA remained elevated at 17.0 µg m−3, while LO-OOA and MO-OOA reached comparable concentrations of 20.4 and 20.2 µg m−3, respectively (Table S3). This pattern differs from H1, during which MO-OOA remained substantially higher than LO-OOA through much of the episode. The contrasting distributions do not support a simple duration-controlled progression from LO-OOA to MO-OOA. Instead, they indicate differences in the source mixture and atmospheric processing between the two haze events. The temporal coincidence of H2 with the Diwali period, together with elevated SFCOA and the larger relative contribution of LO-OOA, is consistent with an enhanced influence of recently emitted combustion products and rapid secondary formation or partitioning superimposed on the regional aged aerosol background. However, the available measurements cannot determine whether these fresher contributions were predominantly local or transported over shorter regional distances, nor can they be attributed uniquely to fireworks. H2 is therefore interpreted as a mixed regime containing substantial contributions from both recently processed and more extensively aged OA. The rain-influenced non-haze period, NH2, was the cleanest interval, with MO-OOA decreasing to 4.1 µg m−3 and BBOA to 1.5 µg m−3 (Table S3), consistent with wet scavenging and improved ventilation. The rapid increase in aerosol loading after NH2 further indicates that changing emissions and renewed stagnation promoted the re-accumulation of carbonaceous aerosol during H2.
During H1, eBCbb peaked at 14.2 µg m−3 while eBCff averaged 3.8 µg m−3 (Table S2). During H2, eBCbb remained substantial (8.3 µg m−3), while eBCff decreased strongly (reported here as 0.03 µg m−3), highlighting the overwhelming dominance of biomass or solid-fuel sources during that episode. These results are consistent with isotopic constraints indicating that open burning of post-harvest crop residue and wood in nearby rural regions can contribute ∼ 42 ± 17 % to severe haze in Delhi during autumn and winter (Bikkina et al., 2019); the higher biomass fraction at Sonipat is expected because of its closer proximity to upwind burning regions and weaker masking by local fossil-fuel emissions. Therefore, the episode wise contrasts indicate that severe haze at Sonipat reflects the combined influence of combustion emissions and suppressed dispersion, while the relative balance between less-oxidized and more-oxidized OA varies with the source mixture, atmospheric processing, precipitation history, meteorological evolution, and short-lived festival-related emission pulses. This has practical relevance because it implies that episodic interventions targeting a single source category may have limited efficacy unless they are aligned with the dominant regime as prolonged regional haze requires sustained regional combustion reductions, whereas short lived festival-related emission enhancements may also benefit from targeted and time-specific controls.
The temporal evolution of OA at Sonipat reveals pronounced shifts in both mass loading and source dominance during the transition from non-haze to haze conditions. OA constituted approximately 65 % of the NR-PM2.5 mass and exhibited multi-day accumulation episodes, with daily mean concentrations peaking near 140 µg m−3 during the first major haze event (H1). Under non-haze conditions, the aerosol composition was dominated by regionally aged secondary organic aerosol, particularly low-volatility oxygenated organic aerosol (MO-OOA; mean ∼ 11.2 µg m−3), reflecting the persistent oxidized background characteristic of the Indo-Gangetic Plain. With the onset of haze phases (H1 and H2), there was a marked intensification of primary combustion-related factors, notably solid-fuel combustion OA (SFCOA) and biomass-burning OA (BBOA), which drove the extreme OA enhancements. This behavior is consistent with regional biomass-burning influences documented for the Delhi-NCR upwind sector (e.g., Rathore et al., 2025) and underscores the role of transported combustion emissions in modulating pollution levels at the site. Overall, the observations demonstrate that OA at Sonipat is shaped by a sustained regional oxygenated background onto which episodic influxes of primary combustion emissions are superimposed, leading to severe carbonaceous aerosol loading even before air masses mix with additional urban emissions from Delhi. These findings reinforce the necessity of airshed-scale mitigation strategies that simultaneously address regional biomass and solid-fuel combustion sources in conjunction with local urban controls.
3.2 Diurnal Variation of Carbonaceous Aerosols and effect of Meteorology
Figure 5 shows mean diurnal cycles of PMF resolved OA factors (HOA, LO-OOA, MO-OOA, SFCOA, BBOA), the source apportioned BC components (eBCbb and eBCff), and key meteorological variables for haze (H1 + H2), non-haze (NH1 + NH2), and the full periods. The diurnal behavior reflects the combined influences of the variation in emission, boundary layer dynamics, and secondary formation/partitioning. The features provide a process level evidence for how daily meteorological cycling modulates both primary emission accumulation and the partitioning/aging of oxygenated aerosol components. The correlation values between different variables and their tracers can be found in supplementary material (Figs. S4–S7).
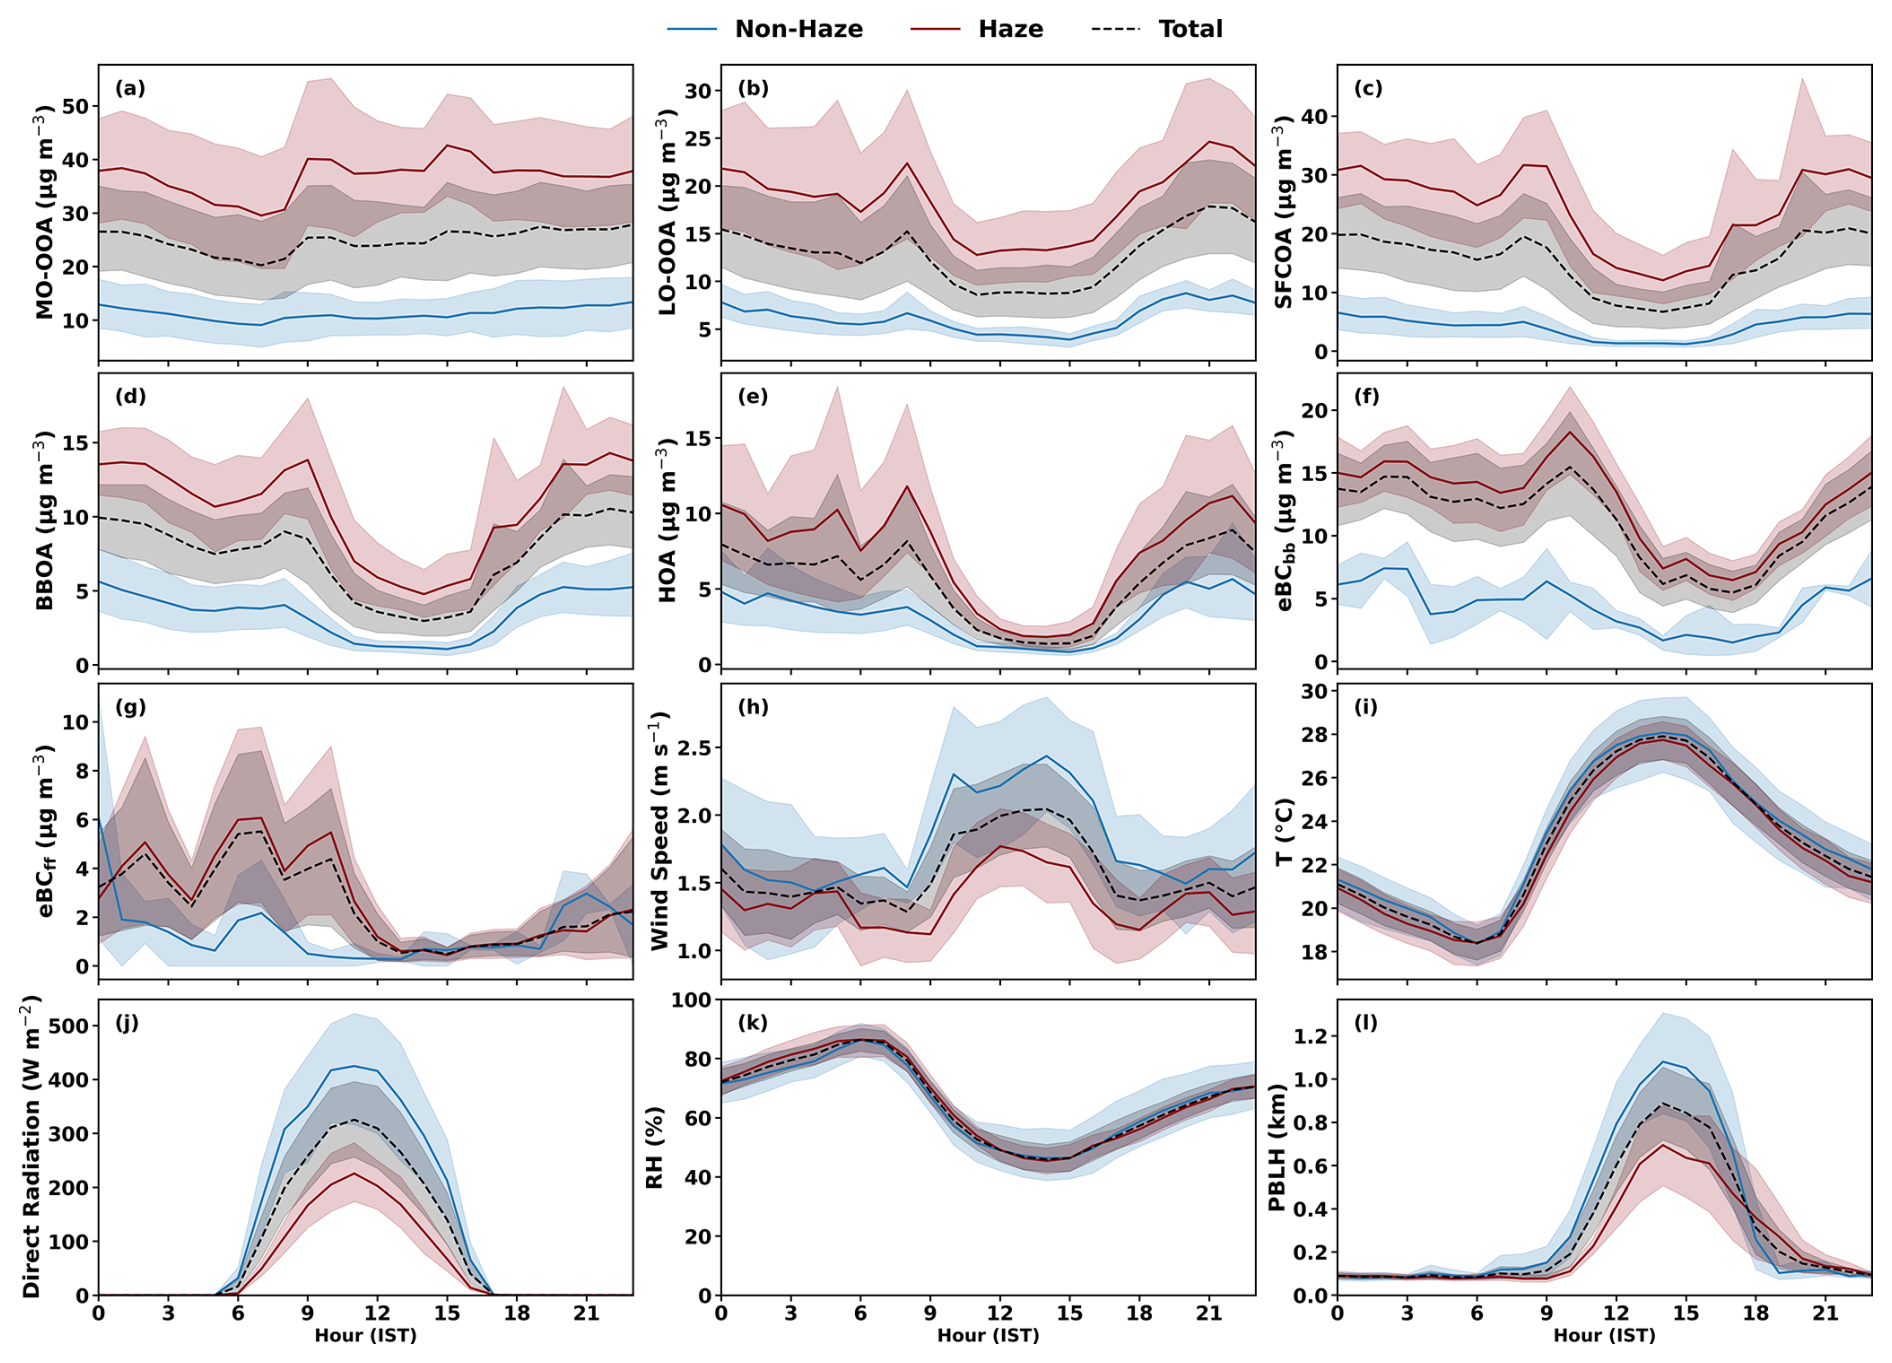
Figure 5Diurnal variations of PMF factors: HOA, LO-OOA, MO-OOA, SFCOA and BBOA; 2 resolved BC factors: eBCbb and eBCff, meteorological parameters: Wind Speed, Temperature, Direct Radiation, Relative Humidity, PBLH during Haze (H1 + H2), Non-Haze (NH1 + NH2) and study period (Total) from 25 October to 15 November 2023.
3.2.1 Traffic-related factors (HOA and eBCff)
The diurnal variation of both HOA and eBCff exhibit coherent diurnal variability characterized by enhanced nighttime concentrations (21:00–00:00 IST) and a secondary peak during the morning hours (06:00–09:00 IST; Fig. 5e). The similarity in their temporal evolution (Fig. S2) and a moderate correlation between the two species (R2 = 0.48; Fig. 5g) indicates their common origin in traffic-related emissions and with previous observations from urban and peri-urban environments (Bhandari et al., 2020; Crippa et al., 2013; Lalchandani et al., 2022). Elevated nighttime levels likely reflect increased heavy-duty vehicle activity following relaxation of daytime traffic restrictions, while the morning peak corresponds to commuter traffic. These patterns are evident under both haze and non-haze conditions; however, the amplitude of the nocturnal diurnal contrast is substantially stronger during haze episodes when shallow boundary layers suppress dilution and promote accumulation (Fig. S11).
During non-haze periods, deeper daytime mixing, precipitation-driven scavenging, and reduced combustion-related activity lead to lower concentrations and a weaker diurnal contrast, in agreement with Rathore et al. (2025). Notably, the overall magnitude of HOA remains relatively modest even during severe haze, indicating that traffic emissions are not the principal driver of peak PM2.5 at this upwind receptor. Nevertheless, localized traffic contributions can still produce short-term enhancements under nocturnal stagnation, particularly when combined with regionally transported pollution.
3.2.2 Biomass or solid-fuel factors (SFCOA, BBOA, and eBCbb)
SFCOA, BBOA, and eBCbb exhibit coherent diurnal behavior (Fig. 5), with their concentrations rising from late evening (∼ 19:00 IST), remaining elevated through the night, and declining after morning (∼ 08:00 IST). The eBCbb correlates strongly with SFCOA (R2 = 0.63; Fig. 5f), and BBOA exhibits an even stronger correlation with SFCOA (R2 = 0.95; Fig. 5d), indicating that the nocturnal enhancement reflects widespread biomass or solid-fuel combustion influences. Such nighttime peaks are consistent with residential combustion timing (cooking/heating) and with the tendency for agricultural burning and regional smoke impacts to be most pronounced under stable nighttime boundary layers (Singh et al., 2023; Tobler et al., 2020). A smaller secondary enhancement around ∼ 08:00–10:00 IST is consistent with morning household activity and localized waste burning. As with traffic factors, haze-period boundary-layer suppression amplifies these nocturnal enhancements.
The correlated temporal variations of SFCOA, BBOA, and eBCbb also imply that at Sonipat, combustion sources contributing to organic aerosol mass and light-absorbing carbon are coupled in time and likely co-located within the regional influence footprint, rather than representing independent local-only behaviors. This coupling strengthens the inference that a large fraction of the carbonaceous aerosol burden during haze is regionally coherent and thus amenable to coordinated regional interventions, including strategies aimed at reducing open burning and promoting cleaner household and small-scale industrial fuels.
3.2.3 Contrasting diurnal behavior of LO-OOA and MO-OOA
LO-OOA and MO-OOA show clearly distinct diurnal signatures that reflect distinct formation mechanisms and atmospheric processing pathways. LO-OOA shows pronounced nocturnal enhancement and covaries with particulate nitrate (NO) and chloride (Cl−) (Fig. S3), consistent with thermodynamically driven gas-particle partitioning (Zhang et al., 2021). As nighttime temperatures decrease and relative humidity increases, semi-volatile species, including inorganic nitrate and freshly formed organic oxidation products, preferentially partition to the particle phase (Lanz et al., 2007). This behavior supports the interpretation that LO-OOA represents a relatively fresh SOA fraction formed through rapid oxidation of local and regional precursors followed by volatility-controlled condensation. Its diurnal variability therefore reflects both chemical production rates and equilibrium partitioning processes. In contrast, MO-OOA closely tracks sulfate (SO) (Figs. 5a and S2) and exhibits a strong correlation (R2 = 0.86), indicating a regionally aged component that covaries with slower-forming secondary aerosol produced and transported over multi-day timescales. The comparatively flat diurnal profile of MO-OOA further supports a transported and highly processed origin. This interpretation is consistent with previous studies over Delhi and the IGP, which attribute MO-OOA to highly oxidized, carboxylic-acid-rich aerosol formed via sustained regional processing (Rathore et al., 2025; Shukla et al., 2021, 2023) and aligns with observations from other polluted megacities such as Guangzhou, where MO-OOA was predominantly associated with transported aged aerosol (Guo et al., 2020). Across pollution episodes, MO-OOA reaches its highest concentrations during H1, followed by H2, consistent with stronger regional accumulation during the prolonged biomass-burning haze, whereas LO-OOA remains broadly comparable between H1 and H2, suggesting that once favorable thermodynamic and chemical conditions are established, the semi-volatile secondary fraction responds rapidly and approaches saturation.
The day-night contrasts summarized in Table S3 (Supplement) and illustrated in Fig. 6 further clarify these behaviors. Transitioning from non-haze (NH1, NH2) to haze conditions (H1, H2), haze-night totals increase by approximately 3–4 times relative to NH-day baselines. For example, MO-OOA rises from 12.8 µg m−3 (NH1 day) to 42.9 µg m−3 (H1 night), while LO-OOA increases from 4.7 to 20.3 µg m−3 (H2 night). Primary combustion-related factors show similarly strong nocturnal amplification, with SFCOA increasing from 3.1 µg m−3 (NH1 day) to 31.2 µg m−3 (H1 night) and BBOA from 2.7 to 13.5 µg m−3, reflecting enhanced evening combustion activity and boundary-layer contraction (Lakra et al., 2024). These findings are consistent with the post-monsoon PM1 observations of Cash et al. (2021), where biomass-related factors (SVBBOA and SFOA) peaked under shallow nighttime boundary layers. Figure 6 demonstrates that haze-night composition is dominated by oxygenated secondary components (LO-OOA and MO-OOA, ∼ 60 %), superimposed on elevated SFCOA, BBOA, and biomass-burning black carbon (eBCbb). The increase in eBCbb from 13.6 to 14.8 µg m−3 between H1 day and night parallels the rise in LO-OOA (e.g., 9.1 to 20.3 µg m−3 during H2), linking biomass-derived precursors to enhanced secondary formation under weakly ventilated nocturnal conditions. Comparable wintertime nocturnal enhancement of LO-OOA has been reported by Tobler et al. (2020), although the stronger nighttime increase in HOA observed here (6.6 to 12 µg m−3 during H1) suggests more pronounced trapping of traffic emissions under stagnation.
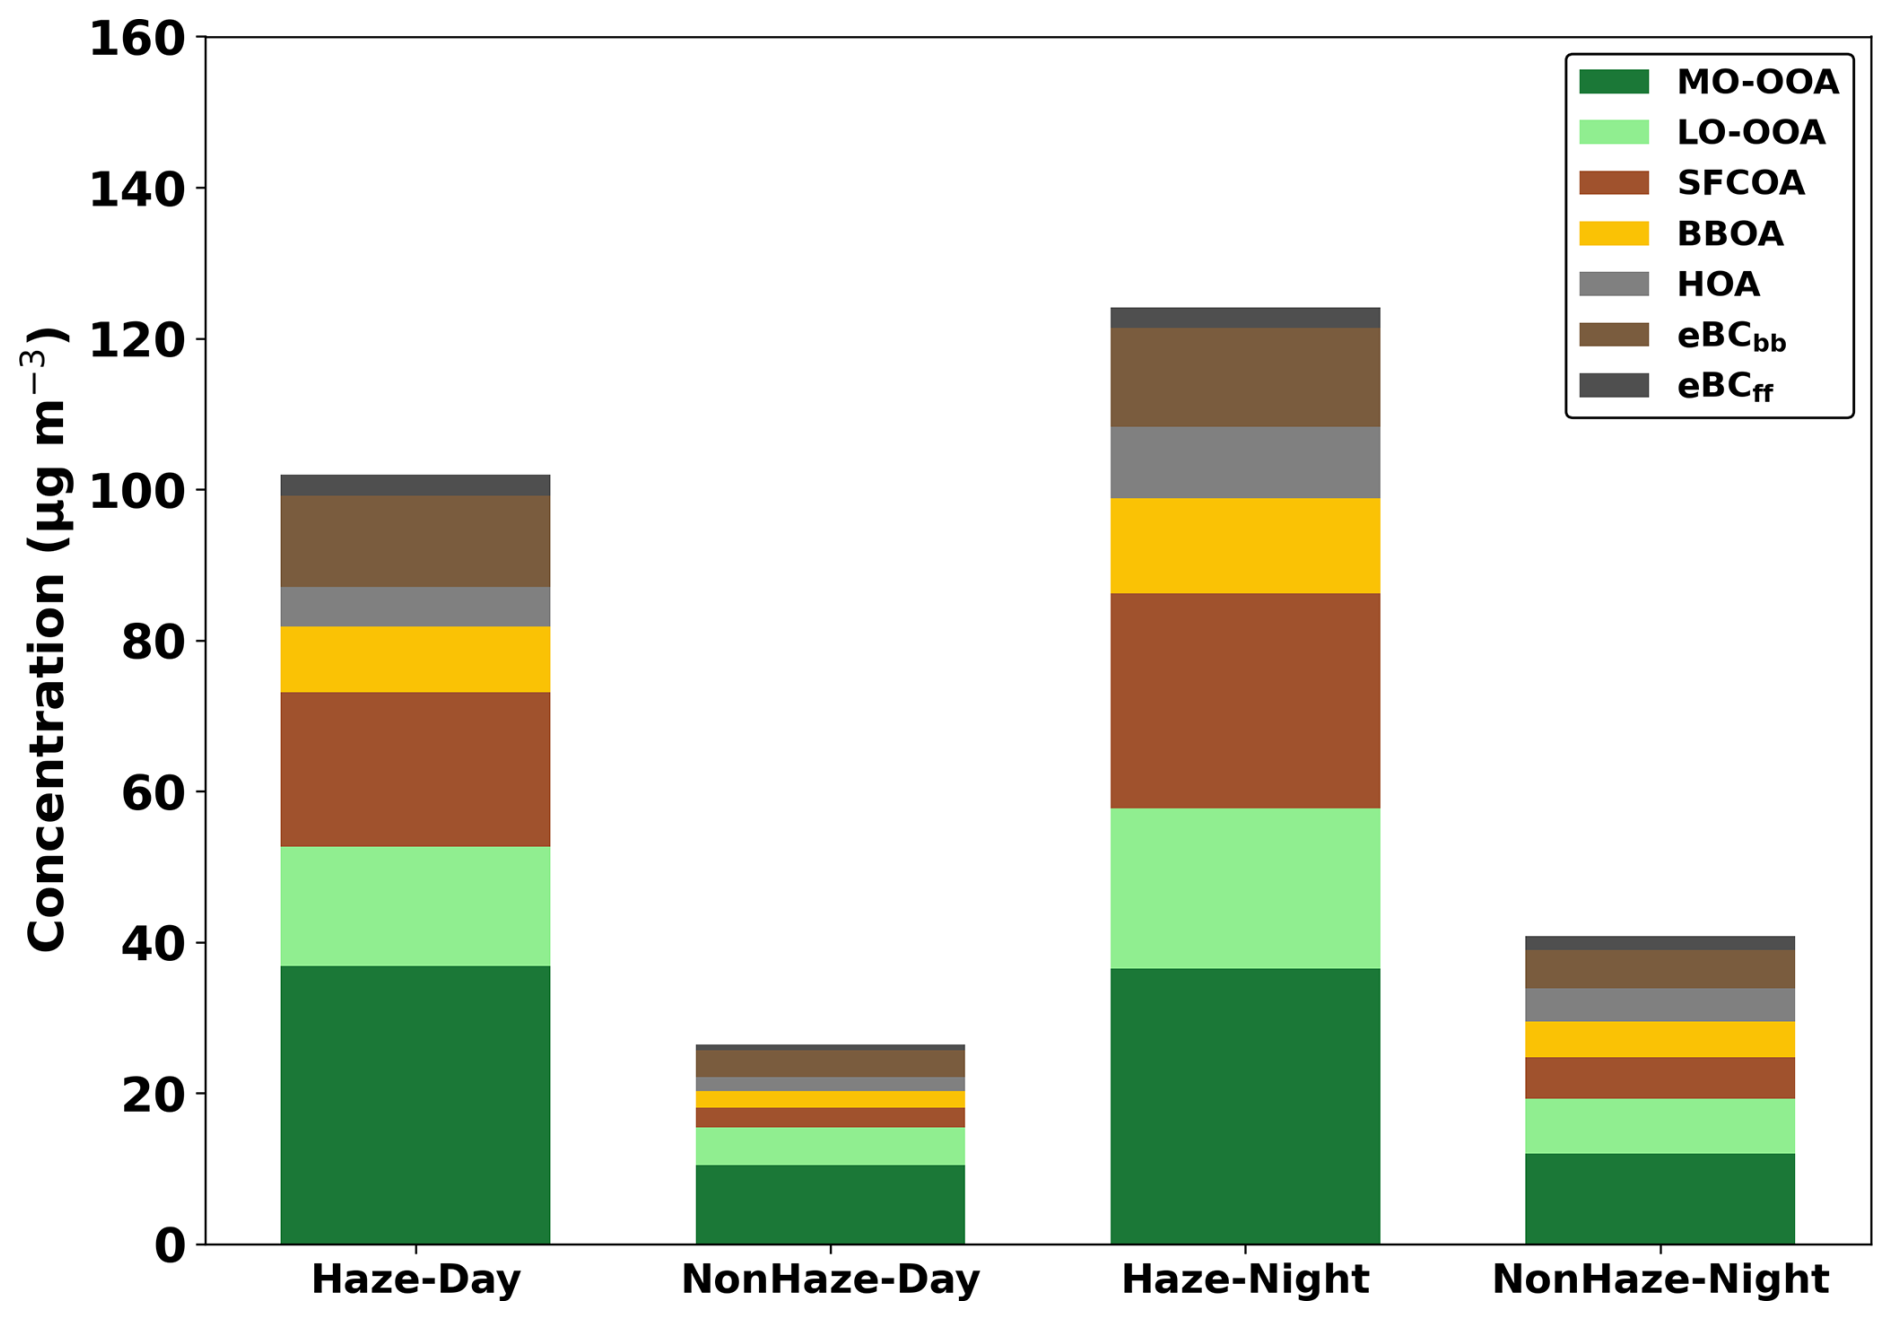
Figure 6Daytime and nighttime OA and eBC factors during haze and non-haze periods. Bars represent mean contributions of organic factors: HOA, LO-OOA, MO-OOA, SFCOA, and BBOA and EBC factors: eBCff and eBCbb. Data is for the full period from 25 October to 15 November 2023.
Meteorological conditions (Figs. 5 and S11) provide the physical framework underlying these compositional shifts. During haze episodes, particularly H1, planetary boundary layer heights (PBLH) remain suppressed (<500 m during daytime and <200 m at night), wind speeds are weak (often <1.5–2.0 m s−1), and direct solar radiation is reduced. Elevated relative humidity (frequently 60 %–80 %) further favors heterogeneous and multiphase processing. These conditions create an effective meteorological lid that traps primary emissions (SFCOA, BBOA, HOA) while simultaneously promoting secondary mass growth and chemical aging. In contrast, non-haze periods (NH1 and NH2) are characterized by deeper daytime PBL development (often >1000 m), stronger ventilation, higher radiation, and, in NH2, rainfall-driven scavenging, leading to lower aerosol concentrations and reduced diurnal amplitude. Notably, MO-OOA maintains a persistently elevated baseline during haze (∼ 42.8 µg m−3 during both day and night in H1), underscoring its regional persistence. This behavior indicates that even if local emissions fluctuate, aged, oxygenated aerosols can remain elevated under stagnant conditions due to sustained regional inflow and limited ventilation. Consequently, emission reductions alone may not immediately translate into lower concentrations during strong stagnation events unless regional transport is also mitigated, as shallow boundary-layer conditions facilitate multi-day retention and recycling of aged secondary aerosol.
3.3 Primary versus Secondary Carbonaceous Aerosol Dynamics
To interpret haze growth and chemical evolution, we examine the interplay between primary and secondary components of C-PM2.5 (Figs. 7; S16; Tables S4–S5). Primary components (SFCOA + BBOA + HOA + eBCff + eBCbb) reflect direct combustion emissions and show strong sensitivity to activity patterns and boundary-layer dynamics, with bimodal peaks in the early morning and late evening during haze periods. As the boundary layer deepens during daytime, primary concentrations typically decrease through dilution, unless regional transport continues to supply fresh emissions. The prominence of SFCOA and BBOA in the primary budget during haze indicates that a large fraction of the peak-driving mass is combustion-derived and can respond to measures that reduce burning intensity and solid-fuel use, particularly when these measures are timed to coincide with the high-risk stagnation window.
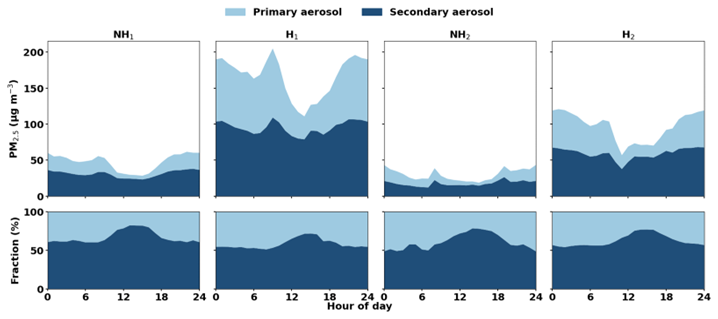
Figure 7Average diurnal variation of mass concentrations and mass fractions of primary and secondary C-PM2.5 by different haze periods. Data is for the full period from 25 October to 15 November 2023.
Secondary components (SO + NO + NH + Cl− + MO-OOA + LO-OOA) form through atmospheric oxidation and multiphase processes and can remain elevated for longer periods, especially under haze-favorable conditions. During peak haze, the secondary fraction (SOA + secondary inorganics) often dominates C-PM2.5 mass, frequently exceeding ∼ 60 %. While daytime photochemistry can contribute to secondary production, winter/post-monsoon haze in the IGP is also strongly shaped by nighttime partitioning and aqueous/multiphase reactions under high RH, allowing secondary mass to remain elevated even when direct radiation is reduced. This contributes to positive feedback: stagnant meteorology traps primary emissions, which provide both condensational sink and reactive surfaces, promoting secondary growth and further reducing visibility. The secondary to primary ratio (Fig. S16) captures this behavior: it tends to decrease during morning/evening emission peaks and increase during midday when dilution reduces primary components while secondary material persists or continues to form. In more humid conditions, this ratio can remain elevated even at night, indicating continued secondary processing.
From a mitigation perspective, the sustained dominance of secondary material during the most polluted periods implies that controlling only direct primary emissions will not fully suppress peak PM2.5 unless precursor emissions and the regional aged background are also reduced. Conversely, if secondary components dominate, mitigation efforts focused solely on primary emissions may be insufficient to reduce peak pollution levels because secondary formation and partitioning can maintain a large mass burden even when local primary increments are reduced. The Sonipat observations therefore support integrated strategies that reduce both regional combustion emissions (which supply primary mass and precursors) and the conditions that enable rapid accumulation, including targeted actions during predicted stagnation episodes when boundary-layer suppression maximizes the sensitivity of concentrations to emissions.
3.4 Biomass Burning Influence on Haze Severity
Fire counts (Fig. S15) increase sharply during haze periods, indicating strong coupling between regional biomass burning and extreme pollution at Sonipat. To quantify how biomass-burning-related factors scale with pollution severity, we binned C-PM2.5 into five concentration ranges from low (<50 µg m−3) to extreme (>200 µg m−3) and evaluated the fractional contributions of biomass burning (BBOA + SFCOA + eBCbb), fossil fuel combustion (HOA + eBCff), secondary inorganic aerosols (SO + NO + NH + Cl−), and secondary organic aerosol (MO-OOA + LO-OOA) (Fig. S17). Biomass-burning contributions increase from ∼ 21 % under low pollution to ∼ 34 % under extreme pollution (>200 µg m−3), indicating that intensified biomass/solid-fuel influence is a key driver of the highest PM loadings. Fossil-fuel contributions remain comparatively small (∼ 4 %–10 %) across all bins. SOA remains persistently large (∼ 32 %–44 %) across pollution levels, while secondary inorganic aerosol contributions vary less strongly.
The persistence of a large SOA fraction even at extreme pollution suggests that regional combustion emissions supply abundant precursors and aging products (including dark aging and transported oxidized OA), sustaining a substantial secondary burden (Lalchandani et al., 2022). Notably, secondary aerosol (SOA + secondary inorganics) still accounts for ∼ 56 % of C-PM2.5 even during extreme pollution, underscoring that haze severity is not solely a function of primary emissions but is strongly modulated by secondary mass growth and aging. This result has direct relevance for clean-air strategies because it implies that measures that only suppress immediate combustion activity may reduce the sharpest primary spikes but may leave a large secondary burden largely intact unless the broader regional emissions that feed secondary formation are also reduced. It also implies that actions aimed at reducing open burning can yield amplified benefits: reductions in biomass-burning emissions would simultaneously lower primary and reduce the supply of reactive organic precursors that contribute to oxygenated OA during transport.
3.5 Regional versus Local Influences: Trajectory and Wind-Based Source Diagnostics
To distinguish regional transport from local influences, we integrate non-parametric wind regression (NWR), pollution rose (PR) diagnostics, and concentration-weighted trajectory (CWT) analysis (Figs. 8; S13; S14). Together, these complementary methods provide a consistent framework for identifying dominant transport pathways and likely source regions, and they help interpret whether high concentrations arise predominantly from local stagnation or from coherent regional inflow.
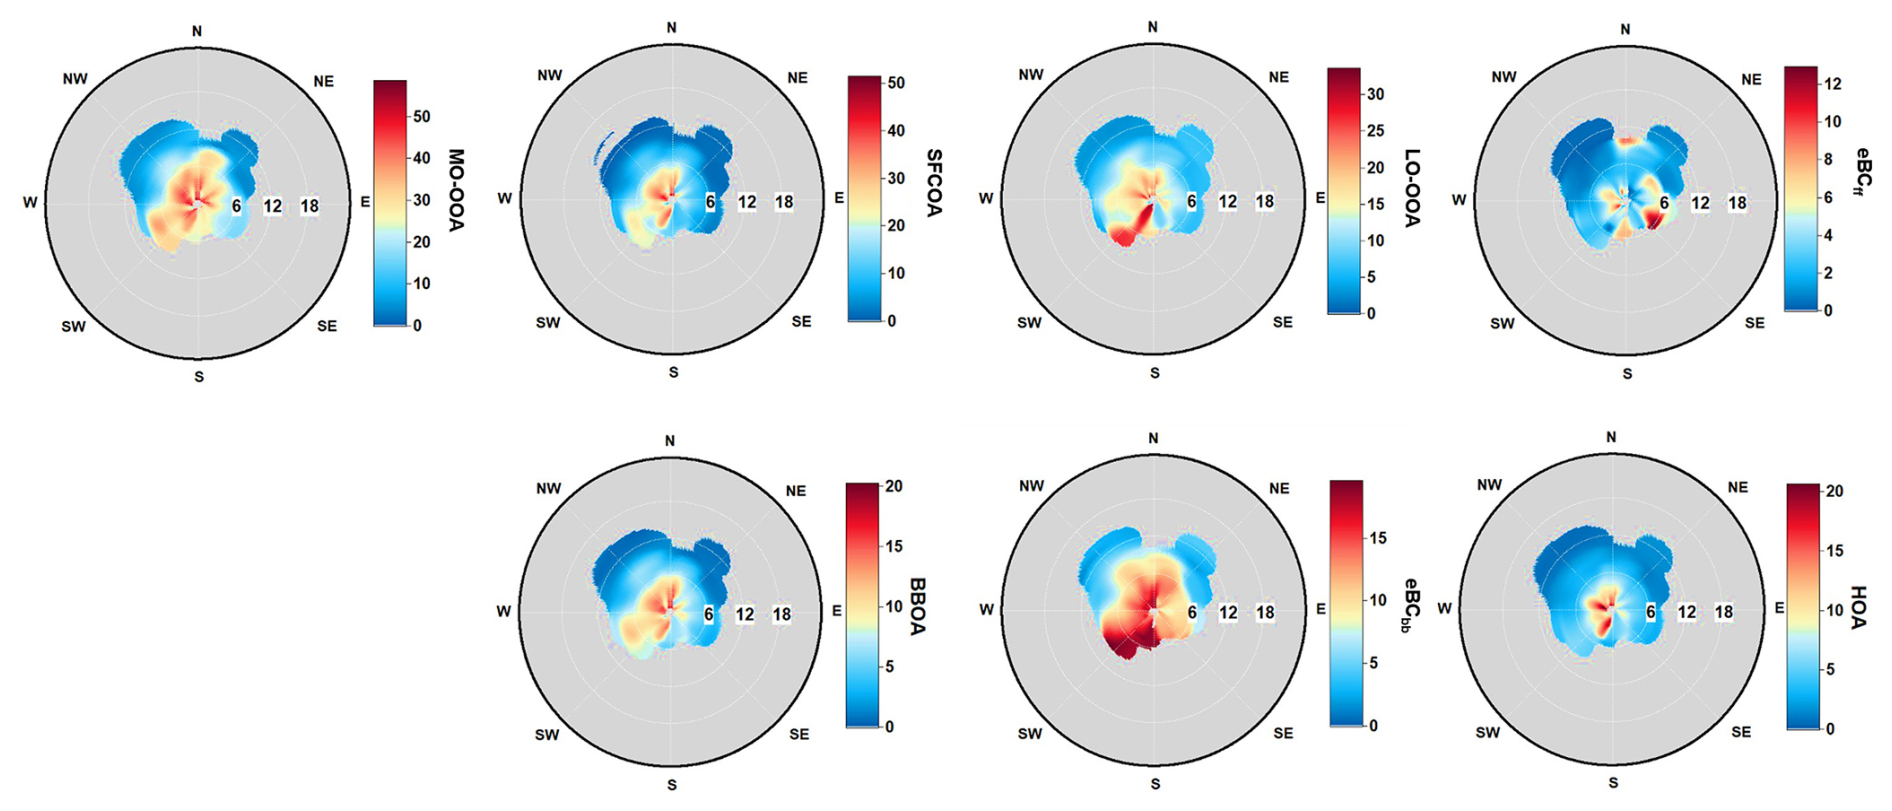
Figure 8Estimation of source regions using NWR approach around the site using wind speed and wind direction for organics and black carbon factors during full period from 25 October to 15 November 2023.
The NWR results show that MO-OOA and LO-OOA exhibit strong northwest influence with peak concentrations (40–50 µg m−3), consistent with regional transport along the post-monsoon corridor. PR plots (Fig. S13) show that MO-OOA is elevated primarily under northwest flow at moderate-to-high wind-speed percentiles (40–60+), supporting an interpretation of transported aged aerosol rather than purely local stagnation. CWT further localizes the likely source influence on the Punjab-Haryana agricultural belt, with hotspots of 15–25 µg m−3 for MO-OOA (Fig. S14). This spatial alignment with satellite-derived fire activity strengthens the inference that transported agricultural burning emissions, and their processed products contribute substantially to aged OOA at Sonipat (Gunthe et al., 2021). LO-OOA shows broadly similar northwest preference, but with a wider spatial footprint in CWT, consistent with a combination of formation during transport and regionally distributed precursor sources. The presence of a southwest influence for LO-OOA in NWR/PR suggests an additional contribution from relatively fresher emissions nearer to the site compared to MO-OOA, consistent with the idea that semi-volatile oxygenated aerosol can respond rapidly to local-to-regional precursor inputs and thermodynamic partitioning.
SFCOA exhibits one of the strongest northwest directional signatures, with high concentrations in NWR (25–30 µg m−3) at moderate wind speeds and PR enhancements extending into high wind-speed bins (60–80+ percentile). CWT identifies SFCOA hotspots (12–16 µg m−3) concentrated in Punjab and western Haryana, consistent with widespread residential solid-fuel use and small-scale combustion emissions across rural/agricultural districts. These transport signatures are consistent with trajectory-based estimates indicating that northwesterly winds can deliver stubble-burning aerosol to the Delhi region within ∼ 15–51 h depending on source distance (185–420 km) (Bikkina et al., 2019; Cusworth et al., 2018). BBOA also shows northwest influence, but with a somewhat broader spatial distribution, consistent with contributions from both intense agricultural burning and more distributed residential biomass burning. The coherence of SFCOA and BBOA regional signatures reinforces that what is often labeled as Delhi haze is, in substantial part, the manifestation of a broader IGP combustion plume that is already heavily polluted and chemically evolved before reaching the city (Sharma et al., 2020).
The BC apportionment reinforces this regional narrative. eBCbb shows strong northwest directionality in NWR (15–20 µg m−3), increasing concentrations under moderate-to-high wind speeds in PR, and distinct CWT hotspots (7–10 µg m−3) co-located with SFCOA and BBOA source regions. The tri-method agreement (NWR direction, PR wind-speed dependence, and CWT geographic localization) provides robust evidence that biomass burning dominates BC at Sonipat during this period. In contrast, eBCff is comparatively small (5–10 µg m−3), exhibits a centre-weighted NWR pattern, is associated mainly with lower wind-speed bins in PR, and shows weak/limited spatial structure in CWT (<3 µg m−3). This indicates predominately local fossil-fuel influence with minimal regional transport signatures. The strong contrast between eBCbb and eBCff at Sonipat is consistent with its role as an intermediate receptor site, where transported biomass-burning plumes are intercepted before dilution by Delhi's urban fossil fuel emissions, and it suggests that reductions in regional biomass burning could produce immediate downwind benefits by lowering the incoming BC burden that contributes to both exposure and aerosol absorption.
HOA remains low (5–10 µg m−3) and displays center-weighted NWR behavior, broad directional spread in PR at low wind speeds, and minimal spatial structure in CWT (<3 µg m−3), indicating that HOA is dominated by local traffic with negligible long-range transport. This differs from many Delhi urban studies where HOA is higher and transport contributions to PM2.5 can be substantial (Pant et al., 2015). The weak regional signature in HOA at Sonipat provides an important contrast: the regional plume arriving at Sonipat is strongly biomass or solid-fuel dominated, and traffic-related emissions become more important only after mixing within the Delhi urban environment. This upwind-downwind contrast supports the interpretation that policies targeting only urban traffic will not substantially reduce the regional carbonaceous plume that sets the baseline for Delhi-NCR haze, whereas coordinated actions addressing agricultural burning and solid-fuel combustion across the corridor are likely to be more effective for reducing both upwind and downwind exposure.
Overall, the integrated NWR-PR-CWT evidence indicates that the Sonipat site experienced overwhelming regional influence during the post-monsoon period, with Punjab-Haryana agricultural regions consistently identified as dominant source areas for aged, oxygenated OA, solid-fuel combustion OA, and biomass-derived BC. Secondary OA (MO-OOA + LO-OOA) frequently reached combined levels approaching 80–100 µg m−3 during intense haze, and biomass-related combustion factors (SFCOA, BBOA, eBCbb) exhibited coherent transport signatures and geographically consistent hotspots. High concentration of secondary OA is consistent with recent evidence that fresh biomass-burning OA can transform into spectrally generic OOA within 1–2 d of transport, with the combustion origin recoverable only through inert co-tracers such as potassium (Vasilakopoulou et al., 2023). At the same time, HOA remained low and locally influenced. These results establish Sonipat as a sensitive receptor for transboundary biomass-burning emissions and their processed products before they mix with Delhi's urban emissions, underscoring that effective mitigation of post-monsoon haze across Delhi-NCR requires addressing regional combustion sources along the broader IGP transport corridor and aligning short-term actions with meteorological forecasts that identify high risk stagnation periods.
This study presents the first comprehensive, high-time-resolution source apportionment analysis of carbonaceous PM2.5 at Sonipat, an upwind receptor site located approximately 40 km northwest of Delhi. The site lies along the principal post-monsoon transport corridor connecting the agricultural burning regions of Punjab and Haryana with Delhi-NCR under prevailing north-westerly flow. Measurements conducted from 25 October to 15 November 2023 combined ToF-ACSM observations, Aethalometer-based eBC apportionment, Positive Matrix Factorization, and trajectory- and wind-based diagnostics to examine the sources, processing, and temporal evolution of carbonaceous aerosol during haze, non-haze, and Diwali-period conditions.
Two major haze episodes were observed, with composition-based PM2.5 exceeding 300 µg m−3. Organic aerosol was the dominant component of non-refractory PM2.5 and contributed approximately 65 % of its mass. Daily mean OA concentrations reached nearly 140 µg m−3 during the first haze episode. PMF resolved five factors, namely, hydrocarbon-like OA (HOA), biomass-burning OA (BBOA), solid-fuel combustion OA (SFCOA), less-oxidized oxygenated OA (LO-OOA), and more-oxidized oxygenated OA (MO-OOA). Secondary organic aerosol (LO-OOA + MO-OOA) constituted approximately 57 %–60 % of OA mass throughout the campaign, with MO-OOA was the largest individual factor, with a campaign mean concentration of approximately 25 µg m−3 and reaching up to 42.8 µg m−3 during the first haze episode. These results indicate that secondary processing and accumulation were major components of the carbonaceous aerosol burden, even during periods of strong primary combustion influence.
The transition from non-haze to haze conditions reflected the enhancement of primary combustion emissions superimposed on a persistent oxygenated aerosol background. MO-OOA remained substantial (∼ 11–13 µg m−3) during the non-haze periods, indicating the continued presence of regionally processed aerosol. During the haze episodes, SFCOA and BBOA and oxygenated aerosol factors increased markedly. Secondary components, including SOA and secondary inorganics, still contributed approximately 56 %–60 % of C-PM2.5 even under extreme pollution (>200 µg m−3), indicating that severe haze reflected the combined influence of primary combustion emissions, secondary formation, and meteorological conditions that limited dispersion. Differences between the two haze episodes further indicate that aerosol composition and oxidation state varied with event duration, meteorological evolution, precipitation, and short-lived emission pulses. The second haze episode, which included the Diwali period, showed a comparatively greater contribution from less-oxidized OA, consistent with an enhanced influence of fresher emissions, although the available measurements do not allow this contribution to be attributed exclusively to fireworks.
The available evidence suggests that biomass and solid-fuel combustion contributed not only primary aerosol but also gaseous organic precursors involved in OOA formation. Co-located measurements reported by Rathore et al. (2025) showed that xylene and ethylbenzene were strongly correlated during the haze periods, with r2=0.97, and that the xylene-to-ethylbenzene enhancement ratio, , was approximately 0.92 ppb ppb−1. This value falls within the range reported for biomass-burning plumes and supports an important biomass-burning influence on the aromatic VOC mixture. The simultaneous enhancement of BBOA, SFCOA, eBCbb, LO-OOA, and MO-OOA, together with their north-westerly transport signatures, provides further evidence that combustion emissions contributed to the precursor mixture and processed aerosol represented by the OOA factors. However, the ratio can also be affected by atmospheric aging because xylene reacts more rapidly than ethylbenzene. Particle-phase PMF cannot directly identify the emission sources of the organic precursors that contribute to the formation of LO-OOA and MO-OOA. Biomass and solid-fuel combustion are therefore interpreted as important, and potentially major, anthropogenic precursor influences during the haze periods rather than as the exclusive sources of LO-OOA or MO-OOA. Contributions from traffic, industrial activities, residential fuel use, and biogenic emissions cannot be quantified or excluded with the available observations.
Using the reference AAE combination of αff=1.0 and αbb=2.0, the campaign-mean concentrations of eBCbb and eBCff were 10.9 and 3.1 µg m−3, respectively. These concentrations correspond to mass-weighted campaign fractions of 77.8 % for eBCbb and 22.2 % for eBCff. The arithmetic means of the time-resolved fractions under the same parameterization were 53.6 % and 46.4 %, respectively. The difference between these metrics indicates that periods with the highest eBC loadings were also assigned a greater biomass or solid-fuel optical contribution. However, sensitivity calculations showed that the arithmetic mean eBCbb fraction varied from 38.4 % to 79.7 % across plausible AAE combinations. The exact numerical split between eBCbb and eBCff is therefore not uniquely constrained and should not be interpreted independently of the assumed AAE values.
Nevertheless, the elevated eBCbb concentrations during high-loading periods, their temporal correspondence with BBOA and SFCOA, and the accompanying northwestern transport signatures collectively support an important biomass and solid-fuel combustion influence at Sonipat during the study period.
Trajectory, concentration-weighted trajectory, and wind-based analyses consistently indicated northwestern transport during several polluted periods. MO-OOA, LO-OOA, SFCOA, BBOA, and eBCbb showed source-direction or trajectory signatures extending towards agricultural regions of Punjab and Haryana, whereas HOA was comparatively low and showed a greater association with nearby sources. These results demonstrate that substantial carbonaceous aerosol loading was already present at Sonipat under the observed post-monsoon transport conditions before the sampled air masses could undergo further interaction with emissions from Delhi. They do not, however, establish the complete source balance over Delhi-NCR or quantify how much additional primary and secondary aerosol is contributed within the urban area. The findings should therefore be interpreted as evidence for an important regional component rather than as evidence that urban sources are unimportant.
Several limitations affect the interpretation and broader generalization of the results. The measurements represent one post-monsoon period at a single receptor site and may not capture interannual variability or the spatial heterogeneity of sources across the Indo-Gangetic Plain. Concurrent measurements at upwind, urban, and downwind sites would be required to quantify changes in aerosol mass and composition as air masses pass through Delhi. The ToF-ACSM measures non-refractory aerosol and does not quantify refractory components such as mineral dust, elemental material, and some trace metals. The use of a capture vaporizer can reduce the biomass-burning marker signal at 60 relative to measurements made using a standard vaporizer, and atmospheric aging can reduce this signal further (Zheng et al., 2020). Consequently, the resolved BBOA factor may underestimate the total contribution of fresh and processed biomass-burning OA, and some combustion-derived material may have been apportioned to LO-OOA or MO-OOA. This possibility is consistent with previous evidence that processed biomass-burning aerosol can become spectrally similar to OOA (Vasilakopoulou et al., 2023), although the available measurements do not permit a quantitative reassignment of OOA mass to biomass burning. The elemental ratios derived using the parameterizations of Canagaratna et al. (2015) and Hu et al. (2018) should therefore be regarded as approximate indicators of relative oxidation state rather than direct quantitative measurements.
Additional uncertainties arise from the Aethalometer model and PMF analysis. The optical BC apportionment depends on prescribed AAEs that can vary with fuel type, combustion conditions, aerosol aging, and particle mixing state. A single value cannot represent all biomass and solid-fuel sources encountered at the site. PMF factors are statistical representations of covarying mass-spectral signals, and their source labels are supported by spectral characteristics, temporal behaviour, and external tracers but are not unique. Trajectory and concentration-weighted trajectory analyses identify probable transport pathways and potential source regions but cannot determine absolute emission strengths or substitute for emission inventories, chemical transport modelling, or source-specific measurements such as radiocarbon analysis.
Within these limitations, the observations show that regional transport was an important contributor to the post-monsoon carbonaceous aerosol measured at Sonipat. Substantial OA and eBC concentrations were present at this upwind site during periods of north-westerly flow, and their temporal evolution reflected the combined effects of biomass and solid-fuel combustion, secondary processing, and unfavourable dispersion. The observations further suggest that biomass and solid-fuel combustion supplied gaseous organic precursors that contributed to OOA formation. This finding does not diminish the importance of emissions generated within Delhi-NCR. Rather, it indicates that urban emission controls operate within a wider airshed in which a considerable transported pollution burden may already be present during severe regional haze episodes.
Effective mitigation therefore requires complementary regional and urban strategies. Regional measures should address agricultural residue burning, household and commercial solid-fuel use, industrial combustion, and gaseous precursor emissions that contribute to secondary aerosol formation. Source-based reductions in biomass burning and solid-fuel combustion could reduce both directly emitted particulate matter and co-emitted organic precursors, thereby lowering primary and secondary aerosol simultaneously. By contrast, measures targeting only directly emitted particles, without corresponding reductions in co-emitted organic precursors, may provide more limited reductions in LO-OOA and MO-OOA. Regional measures must be implemented alongside sustained controls on traffic, industry, construction activities, waste burning, and other urban sources within Delhi-NCR. Neither regional measures nor urban controls alone are likely to address the full range of emissions and atmospheric processes responsible for severe post-monsoon haze. Coordinated airshed-scale management targeting both primary emissions and secondary aerosol precursors, supported by emission monitoring and meteorological forecasting, is therefore required to achieve durable reductions in PM2.5 exposure across Delhi-NCR and the broader Indo-Gangetic Plain.
The observational datasets used in this study are publicly available in a Zenodo archive and can be accessed from https://doi.org/10.5281/zenodo.22071367 (Singh et al., 2026).
The fire counts data can be accessed from https://firms.modaps.eosdis.nasa.gov/ (last access: 8 March 2026).
ZeFir is used for wind and trajectory-based analysis (https://sites.google.com/site/zefirproject, last access: 8 March 2026).
All plots in this study were generated using Python (https://www.anaconda.com/download, last access: 8 March 2026).
The supplement related to this article is available online at https://doi.org/10.5194/acp-26-13227-2026-supplement.
Conceptualization: VS, DG, SD. Data curation: VS, JR. Investigation, Methodology: VS, DG, SD, JR. Software, Visualization: VS. Writing – original draft: VS. Writing – review and editing: DG, JR, SD, RKK, LKS. Resources – DG, SD, RKK, LKS.
The contact author has declared that none of the authors has any competing interests.
Publisher's note: Copernicus Publications remains neutral with regard to jurisdictional claims made in the text, published maps, institutional affiliations, or any other geographical representation in this paper. The authors bear the ultimate responsibility for providing appropriate place names. Views expressed in the text are those of the authors and do not necessarily reflect the views of the publisher.
The authors are grateful to the Head,Centre for Atmospheric Sciences and Director, IIT Delhi, for necessary support and in developing the IIT Delhi Atmospheric Observatory at Sonipat. We gratefully acknowledge the use of data products from NOAA Hysplit Model. We also thank Shahzad Gani (IIT Delhi) for his contribution to the observatory.
This paper was edited by Benjamin A Nault and reviewed by two anonymous referees.
Bhandari, S., Gani, S., Patel, K., Wang, D. S., Soni, P., Arub, Z., Habib, G., Apte, J. S., and Hildebrandt Ruiz, L.: Sources and atmospheric dynamics of organic aerosol in New Delhi, India: insights from receptor modeling, Atmos. Chem. Phys., 20, 735–752, https://doi.org/10.5194/acp-20-735-2020, 2020.
Bhowmik, H. S., Tripathi, S. N., Sahu, R., Shukla, A. K., Lalchandani, V., Talukdar, S., Tripathi, N., and Sahu, L.: Insights into the Regional Transport and Local Formation of Secondary Organic Aerosol in Delhi, India, Aerosol Air Qual. Res., 22, 220113, https://doi.org/10.4209/aaqr.220113, 2022.
Bikkina, S., Andersson, A., Kirillova, E. N., Holmstrand, H., Tiwari, S., Srivastava, A. K., Bisht, D. S., and Gustafsson, Ö.: Air quality in megacity Delhi affected by countryside biomass burning, Nat. Sustain., 2, 200–205, https://doi.org/10.1038/s41893-019-0219-0, 2019.
Biswal, A., Singh, V., Malik, L., Tiwari, G., Ravindra, K., and Mor, S.: Spatially resolved hourly traffic emission over megacity Delhi using advanced traffic flow data, Earth Syst. Sci. Data, 15, 661–680, https://doi.org/10.5194/essd-15-661-2023, 2023.
Canagaratna, M. R., Jimenez, J. L., Kroll, J. H., Chen, Q., Kessler, S. H., Massoli, P., Hildebrandt Ruiz, L., Fortner, E., Williams, L. R., Wilson, K. R., Surratt, J. D., Donahue, N. M., Jayne, J. T., and Worsnop, D. R.: Elemental ratio measurements of organic compounds using aerosol mass spectrometry: characterization, improved calibration, and implications, Atmos. Chem. Phys., 15, 253–272, https://doi.org/10.5194/acp-15-253-2015, 2015.
Canonaco, F., Crippa, M., Slowik, J. G., Baltensperger, U., and Prévôt, A. S. H.: SoFi, an IGOR-based interface for the efficient use of the generalized multilinear engine (ME-2) for the source apportionment: ME-2 application to aerosol mass spectrometer data, Atmos. Meas. Tech., 6, 3649–3661, https://doi.org/10.5194/amt-6-3649-2013, 2013.
Canonaco, F., Tobler, A., Chen, G., Sosedova, Y., Slowik, J. G., Bozzetti, C., Daellenbach, K. R., El Haddad, I., Crippa, M., Huang, R.-J., Furger, M., Baltensperger, U., and Prévôt, A. S. H.: A new method for long-term source apportionment with time-dependent factor profiles and uncertainty assessment using SoFi Pro: application to 1 year of organic aerosol data, Atmos. Meas. Tech., 14, 923–943, https://doi.org/10.5194/amt-14-923-2021, 2021.
Cash, J. M., Langford, B., Di Marco, C., Mullinger, N. J., Allan, J., Reyes-Villegas, E., Joshi, R., Heal, M. R., Acton, W. J. F., Hewitt, C. N., Misztal, P. K., Drysdale, W., Mandal, T. K., Shivani, Gadi, R., Gurjar, B. R., and Nemitz, E.: Seasonal analysis of submicron aerosol in Old Delhi using high-resolution aerosol mass spectrometry: chemical characterisation, source apportionment and new marker identification, Atmos. Chem. Phys., 21, 10133–10158, https://doi.org/10.5194/acp-21-10133-2021, 2021.
Cash, J. M., Di Marco, C., Langford, B., Heal, M. R., Mandal, T. K., Sharma, S. K., Gurjar, B. R., and Nemitz, E.: Response of organic aerosol to Delhi's pollution control measures over the period 2011–2018, Atmos. Environ., 315, 120123, https://doi.org/10.1016/j.atmosenv.2023.120123, 2023.
Crippa, M., El Haddad, I., Slowik, J. G., DeCarlo, P. F., Mohr, C., Heringa, M. F., Chirico, R., Marchand, N., Sciare, J., Baltensperger, U., and Prévôt, A. S. H.: Identification of marine and continental aerosol sources in Paris using high resolution aerosol mass spectrometry, J. Geophys. Res.-Atmos., 118, 1950–1963, https://doi.org/10.1002/jgrd.50151, 2013.
Cusworth, D. H., Mickley, L. J., Sulprizio, M. P., Liu, T., Marlier, M. E., DeFries, R. S., Guttikunda, S. K., and Gupta, P.: Quantifying the influence of agricultural fires in northwest India on urban air pollution in Delhi, India, Environ. Res. Lett., 13, 044018, https://doi.org/10.1088/1748-9326/aab303, 2018.
Deng, J., Guo, H., Zhang, H., Zhu, J., Wang, X., and Fu, P.: Source apportionment of black carbon aerosols from light absorption observation and source-oriented modeling: an implication in a coastal city in China, Atmos. Chem. Phys., 20, 14419–14435, https://doi.org/10.5194/acp-20-14419-2020, 2020.
Dey, S. and Di Girolamo, L.: A climatology of aerosol optical and microphysical properties over the Indian subcontinent from 9 years (2000–2008) of Multiangle Imaging Spectroradiometer (MISR) data, J. Geophys. Res., 115, 2009JD013395, https://doi.org/10.1029/2009JD013395, 2010.
Dumka, U. C., Kaskaoutis, D. G., Tiwari, S., Safai, P. D., Attri, S. D., Soni, V. K., Singh, N., and Mihalopoulos, N.: Assessment of biomass burning and fossil fuel contribution to black carbon concentrations in Delhi during winter, Atmos. Environ., 194, 93–109, https://doi.org/10.1016/j.atmosenv.2018.09.033, 2018.
Fröhlich, R., Cubison, M. J., Slowik, J. G., Bukowiecki, N., Prévôt, A. S. H., Baltensperger, U., Schneider, J., Kimmel, J. R., Gonin, M., Rohner, U., Worsnop, D. R., and Jayne, J. T.: The ToF-ACSM: a portable aerosol chemical speciation monitor with TOFMS detection, Atmos. Meas. Tech., 6, 3225–3241, https://doi.org/10.5194/amt-6-3225-2013, 2013.
Ganguly, D., Ginoux, P., Ramaswamy, V., Winker, D. M., Holben, B. N., and Tripathi, S. N.: Retrieving the composition and concentration of aerosols over the Indo‐Gangetic basin using CALIOP and AERONET data, Geophys. Res. Lett., 36, 2009GL038315, https://doi.org/10.1029/2009GL038315, 2009.
Gani, S., Bhandari, S., Seraj, S., Wang, D. S., Patel, K., Soni, P., Arub, Z., Habib, G., Hildebrandt Ruiz, L., and Apte, J. S.: Submicron aerosol composition in the world's most polluted megacity: the Delhi Aerosol Supersite study, Atmos. Chem. Phys., 19, 6843–6859, https://doi.org/10.5194/acp-19-6843-2019, 2019.
Ghude, S. D., Chate, D. M., Jena, C., Beig, G., Kumar, R., Barth, M. C., Pfister, G. G., Fadnavis, S., and Pithani, P.: Premature mortality in India due to PM2.5 and ozone exposure, Geophys. Res. Lett., 43, 4650–4658, https://doi.org/10.1002/2016GL068949, 2016.
Ghude, S. D., Govardhan, G., Kumar, R., Yadav, P. P., Jat, R., Debnath, S., Kalita, G., Jena, C., Ingle, S., Gunwani, P., Pawar, P. V., Ambulkar, R., Kumar, S., Kulkarni, S., Kulkarni, A., Khare, M., Kaginalkar, A., Soni, V. K., Nigam, N., Ray, K., Atri, S. D., Nanjundiah, R., and Rajeevan, M.: Air Quality Warning and Integrated Decision Support System for Emissions (AIRWISE): Enhancing Air Quality Management in Megacities, B. Am. Meteorol. Soc., 105, E2525–E2550, https://doi.org/10.1175/BAMS-D-23-0181.1, 2024.
Goel, V., Hazarika, N., Kumar, M., and Singh, V.: Source apportionment of black carbon over Delhi: A case study of extreme biomass burning events and Diwali festival, Urban Climate, 39, 100926, https://doi.org/10.1016/j.uclim.2021.100926, 2021.
Goel, V., Tripathi, N., Gupta, M., Sahu, L. K., Singh, V., and Kumar, M.: Study of secondary organic aerosol formation and aging using ambient air in an oxidation flow reactor during high pollution events over Delhi, Environ. Res., 251, 118542, https://doi.org/10.1016/j.envres.2024.118542, 2024.
Gunthe, S. S., Liu, P., Panda, U., Raj, S. S., Sharma, A., Darbyshire, E., Reyes-Villegas, E., Allan, J., Chen, Y., Wang, X., Song, S., Pöhlker, M. L., Shi, L., Wang, Y., Kommula, S. M., Liu, T., Ravikrishna, R., McFiggans, G., Mickley, L. J., Martin, S. T., Pöschl, U., Andreae, M. O., and Coe, H.: Enhanced aerosol particle growth sustained by high continental chlorine emission in India, Nat. Geosci., 14, 77–84, https://doi.org/10.1038/s41561-020-00677-x, 2021.
Guo, J., Zhou, S., Cai, M., Zhao, J., Song, W., Zhao, W., Hu, W., Sun, Y., He, Y., Yang, C., Xu, X., Zhang, Z., Cheng, P., Fan, Q., Hang, J., Fan, S., Wang, X., and Wang, X.: Characterization of submicron particles by time-of-flight aerosol chemical speciation monitor (ToF-ACSM) during wintertime: aerosol composition, sources, and chemical processes in Guangzhou, China, Atmos. Chem. Phys., 20, 7595–7615, https://doi.org/10.5194/acp-20-7595-2020, 2020.
Gupta, T., Rajeev, P., and Rajput, R.: Emerging Major Role of Organic Aerosols in Explaining the Occurrence, Frequency, and Magnitude of Haze and Fog Episodes during Wintertime in the Indo Gangetic Plain, ACS Omega, 7, 1575–1584, https://doi.org/10.1021/acsomega.1c05467, 2022.
Guttikunda, S. K. and Calori, G.: A GIS based emissions inventory at 1 km × 1 km spatial resolution for air pollution analysis in Delhi, India, Atmos. Environ., 67, 101–111, https://doi.org/10.1016/j.atmosenv.2012.10.040, 2013.
Harrison, R. M., Beddows, D. C. S., Jones, A. M., Calvo, A., Alves, C., and Pio, C.: An evaluation of some issues regarding the use of aethalometers to measure woodsmoke concentrations, Atmos. Environ., 80, 540–548, https://doi.org/10.1016/j.atmosenv.2013.08.026, 2013.
Haslett, S. L., Bell, D. M., Kumar, V., Slowik, J. G., Wang, D. S., Mishra, S., Rastogi, N., Singh, A., Ganguly, D., Thornton, J., Zheng, F., Li, Y., Nie, W., Liu, Y., Ma, W., Yan, C., Kulmala, M., Daellenbach, K. R., Hadden, D., Baltensperger, U., Prevot, A. S. H., Tripathi, S. N., and Mohr, C.: Nighttime NO emissions strongly suppress chlorine and nitrate radical formation during the winter in Delhi, Atmos. Chem. Phys., 23, 9023–9036, https://doi.org/10.5194/acp-23-9023-2023, 2023.
Henry, R., Norris, G. A., Vedantham, R., and Turner, J. R.: Source Region Identification Using Kernel Smoothing, Environ. Sci. Technol., 43, 4090–4097, https://doi.org/10.1021/es8011723, 2009.
Hu, W., Day, D. A., Campuzano-Jost, P., Nault, B. A., Park, T., Lee, T., Croteau, P., Canagaratna, M. R., Jayne, J. T., Worsnop, D. R., and Jimenez, J. L.: Evaluation of the New Capture Vaporizer for Aerosol Mass Spectrometers (AMS): Elemental Composition and Source Apportionment of Organic Aerosols (OA), ACS Earth Space Chem., 2, 410–421, https://doi.org/10.1021/acsearthspacechem.8b00002, 2018.
Jain, S., Sharma, S. K., Srivastava, M. K., Chaterjee, A., Singh, R. K., Saxena, M., and Mandal, T. K.: Source Apportionment of PM10 Over Three Tropical Urban Atmospheres at Indo-Gangetic Plain of India: An Approach Using Different Receptor Models, Arch. Environ. Contam. Toxicol., 76, 114–128, https://doi.org/10.1007/s00244-018-0572-4, 2019.
Jethva, H., Torres, O., Field, R. D., Lyapustin, A., Gautam, R., and Kayetha, V.: Connecting Crop Productivity, Residue Fires, and Air Quality over Northern India, Sci. Rep., 9, 16594, https://doi.org/10.1038/s41598-019-52799-x, 2019.
Kumar, R. R., Soni, V. K., and Jain, M. K.: Evaluation of spatial and temporal heterogeneity of black carbon aerosol mass concentration over India using three year measurements from IMD BC observation network, Sci. Total Environ., 723, 138060, https://doi.org/10.1016/j.scitotenv.2020.138060, 2020.
Lakra, A., Shukla, A. K., Bhowmik, H. S., Yadav, A. K., Jain, V., Murari, V., Gaddamidi, S., Lalchandani, V., and Tripathi, S. N.: Comparative analysis of winter composite-PM2.5 in Central Indo Gangetic Plain cities: Combined organic and inorganic source apportionment and characterization, with a focus on the photochemical age effect on secondary organic aerosol formation, Atmos. Environ., 338, 120827, https://doi.org/10.1016/j.atmosenv.2024.120827, 2024.
Lalchandani, V., Kumar, V., Tobler, A., M. Thamban, N., Mishra, S., Slowik, J. G., Bhattu, D., Rai, P., Satish, R., Ganguly, D., Tiwari, S., Rastogi, N., Tiwari, S., Močnik, G., Prévôt, A. S. H., and Tripathi, S. N.: Real-time characterization and source apportionment of fine particulate matter in the Delhi megacity area during late winter, Sci. Total Environ., 770, 145324, https://doi.org/10.1016/j.scitotenv.2021.145324, 2021.
Lalchandani, V., Srivastava, D., Dave, J., Mishra, S., Tripathi, N., Shukla, A. K., Sahu, R., Thamban, N. M., Gaddamidi, S., Dixit, K., Ganguly, D., Tiwari, S., Srivastava, A. K., Sahu, L., Rastogi, N., Gargava, P., and Tripathi, S. N.: Effect of Biomass Burning on PM2.5 Composition and Secondary Aerosol Formation During Post‐Monsoon and Winter Haze Episodes in Delhi, J. Geophys. Res.-Atmos., 127, e2021JD035232, https://doi.org/10.1029/2021JD035232, 2022.
Lanz, V. A., Alfarra, M. R., Baltensperger, U., Buchmann, B., Hueglin, C., and Prévôt, A. S. H.: Source apportionment of submicron organic aerosols at an urban site by factor analytical modelling of aerosol mass spectra, Atmos. Chem. Phys., 7, 1503–1522, https://doi.org/10.5194/acp-7-1503-2007, 2007.
Mathai, S., Ijaz, A., Gautam, T., Cheng, Z., Lata, N. N., Bhotika, H., Tseng, D., Chu, R. K., Mazzoleni, L., Mazzoleni, C., and China, S.: Haze processing of atmospheric particles during wintertime in the Indo-Gangetic Plains, Environ. Sci. Atmos., 6, 139–151, https://doi.org/10.1039/D5EA00150A, 2026.
Monod, A., Sive, B. C., Avino, P., Chen, T., Blake, D. R., and Sherwood Rowland, F.: Monoaromatic compounds in ambient air of various cities: a focus on correlations between the xylenes and ethylbenzene, Atmos. Environ., 35, 135–149, https://doi.org/10.1016/S1352-2310(00)00274-0, 2001.
Nair, V. S., Moorthy, K. K., Alappattu, D. P., Kunhikrishnan, P. K., George, S., Nair, P. R., Babu, S. S., Abish, B., Satheesh, S. K., Tripathi, S. N., Niranjan, K., Madhavan, B. L., Srikant, V., Dutt, C. B. S., Badarinath, K. V. S., and Reddy, R. R.: Wintertime aerosol characteristics over the Indo‐Gangetic Plain (IGP): Impacts of local boundary layer processes and long‐range transport, J. Geophys. Res., 112, 2006JD008099, https://doi.org/10.1029/2006JD008099, 2007.
Nault, B. A., Croteau, P., Jayne, J., Williams, A., Williams, L., Worsnop, D., Katz, E. F., DeCarlo, P. F., and Canagaratna, M.: Laboratory evaluation of organic aerosol relative ionization efficiencies in the aerodyne aerosol mass spectrometer and aerosol chemical speciation monitor, Aerosol Sci. Tech., 57, 981–997, https://doi.org/10.1080/02786826.2023.2223249, 2023.
Nelson, P. F. and Quigley, S. M.: The ,. A technique for estimating hydrocarbon age in ambient atmospheres, Atmos. Environ., 17, 659–662, https://doi.org/10.1016/0004-6981(83)90141-5, 1983.
Ng, N. L., Canagaratna, M. R., Jimenez, J. L., Zhang, Q., Ulbrich, I. M., and Worsnop, D. R.: Real-Time Methods for Estimating Organic Component Mass Concentrations from Aerosol Mass Spectrometer Data, Environ. Sci. Technol., 45, 910–916, https://doi.org/10.1021/es102951k, 2011.
Paatero, P. and Tapper, U.: Positive matrix factorization: A non‐negative factor model with optimal utilization of error estimates of data values, Environmetrics, 5, 111–126, https://doi.org/10.1002/env.3170050203, 1994.
Panda, U., Dey, S., Sharma, A., Singh, A., Reyes-Villegas, E., Darbyshire, E., Carbone, S., Das, T., Allan, J., McFiggans, G., Ravikrishna, R., Coe, H., Liu, P., and Gunthe, S. S.: Exploring the chemical composition and processes of submicron aerosols in Delhi using aerosol chemical speciation monitor driven factor analysis, Sci. Rep., 15, 14383, https://doi.org/10.1038/s41598-025-99245-9, 2025.
Pandey, A., Brauer, M., Cropper, M. L., et al.: Health and economic impact of air pollution in the states of India: the Global Burden of Disease Study 2019, The Lancet Planetary Health, 5, e25–e38, https://doi.org/10.1016/S2542-5196(20)30298-9, 2021.
Pant, P., Shukla, A., Kohl, S. D., Chow, J. C., Watson, J. G., and Harrison, R. M.: Characterization of ambient PM2.5 at a pollution hotspot in New Delhi, India and inference of sources, Atmos. Environ., 109, 178–189, https://doi.org/10.1016/j.atmosenv.2015.02.074, 2015.
Pant, P., Guttikunda, S. K., and Peltier, R. E.: Exposure to particulate matter in India: A synthesis of findings and future directions, Environ. Res., 147, 480–496, https://doi.org/10.1016/j.envres.2016.03.011, 2016.
Petit, J.-E., Favez, O., Albinet, A., and Canonaco, F.: A user-friendly tool for comprehensive evaluation of the geographical origins of atmospheric pollution: Wind and trajectory analyses, Environ. Modell. Softw., 88, 183–187, https://doi.org/10.1016/j.envsoft.2016.11.022, 2017.
Petzold, A., Ogren, J. A., Fiebig, M., Laj, P., Li, S.-M., Baltensperger, U., Holzer-Popp, T., Kinne, S., Pappalardo, G., Sugimoto, N., Wehrli, C., Wiedensohler, A., and Zhang, X.-Y.: Recommendations for reporting “black carbon” measurements, Atmos. Chem. Phys., 13, 8365–8379, https://doi.org/10.5194/acp-13-8365-2013, 2013.
Rathore, J., Ganguly, D., Singh, V., Gupta, M., Vazhathara, V. J., Biswal, A., Kunchala, R. K., Patra, P. K., Sahu, L. K., Gani, S., and Dey, S.: Characteristics of Haze Pollution Events During Biomass Burning Period at an Upwind Site of Delhi, J. Geophys. Res.-Atmos., 130, e2024JD042347, https://doi.org/10.1029/2024JD042347, 2025.
Reyes-Villegas, E., Panda, U., Darbyshire, E., Cash, J. M., Joshi, R., Langford, B., Di Marco, C. F., Mullinger, N. J., Alam, M. S., Crilley, L. R., Rooney, D. J., Acton, W. J. F., Drysdale, W., Nemitz, E., Flynn, M., Voliotis, A., McFiggans, G., Coe, H., Lee, J., Hewitt, C. N., Heal, M. R., Gunthe, S. S., Mandal, T. K., Gurjar, B. R., Shivani, Gadi, R., Singh, S., Soni, V., and Allan, J. D.: PM1 composition and source apportionment at two sites in Delhi, India, across multiple seasons, Atmos. Chem. Phys., 21, 11655–11667, https://doi.org/10.5194/acp-21-11655-2021, 2021.
Sahu, L. K., Kondo, Y., Moteki, N., Takegawa, N., Zhao, Y., Cubison, M. J., Jimenez, J. L., Vay, S., Diskin, G. S., Wisthaler, A., Mikoviny, T., Huey, L. G., Weinheimer, A. J., and Knapp, D. J.: Emission characteristics of black carbon in anthropogenic and biomass burning plumes over California during ARCTAS‐CARB 2008, J. Geophys. Res., 117, 2011JD017401, https://doi.org/10.1029/2011JD017401, 2012.
Sandradewi, J., Prévôt, A. S. H., Szidat, S., Perron, N., Alfarra, M. R., Lanz, V. A., Weingartner, E., and Baltensperger, U.: Using Aerosol Light Absorption Measurements for the Quantitative Determination of Wood Burning and Traffic Emission Contributions to Particulate Matter, Environ. Sci. Technol., 42, 3316–3323, https://doi.org/10.1021/es702253m, 2008.
Sarkar, S., Singh, R. P., and Chauhan, A.: Crop Residue Burning in Northern India: Increasing Threat to Greater India, J. Geophys. Res.-Atmos., 123, 6920–6934, https://doi.org/10.1029/2018JD028428, 2018.
Satish, R., Shamjad, P., Thamban, N., Tripathi, S., and Rastogi, N.: Temporal Characteristics of Brown Carbon over the Central Indo-Gangetic Plain, Environ. Sci. Technol., 51, 6765–6772, https://doi.org/10.1021/acs.est.7b00734, 2017.
Segura, S., Estellés, V., Titos, G., Lyamani, H., Utrillas, M. P., Zotter, P., Prévôt, A. S. H., Močnik, G., Alados-Arboledas, L., and Martínez-Lozano, J. A.: Determination and analysis of in situ spectral aerosol optical properties by a multi-instrumental approach, Atmos. Meas. Tech., 7, 2373–2387, https://doi.org/10.5194/amt-7-2373-2014, 2014.
Sharma, S., Zhang, M., Anshika, Gao, J., Zhang, H., and Kota, S. H.: Effect of restricted emissions during COVID-19 on air quality in India, Sci. Total Environ., 728, 138878, https://doi.org/10.1016/j.scitotenv.2020.138878, 2020.
Sharma, S. K., Mandal, T. K., Jain, S., Saraswati, Sharma, A., and Saxena, M.: Source Apportionment of PM2.5 in Delhi, India Using PMF Model, Bull. Environ. Contam. Toxicol., 97, 286–293, https://doi.org/10.1007/s00128-016-1836-1, 2016.
Shiraiwa, M., Kondo, Y., Moteki, N., Takegawa, N., Sahu, L. K., Takami, A., Hatakeyama, S., Yonemura, S., and Blake, D. R.: Radiative impact of mixing state of black carbon aerosol in Asian outflow, J. Geophys. Res., 113, 2008JD010546, https://doi.org/10.1029/2008JD010546, 2008.
Shukla, A. K., Lalchandani, V., Bhattu, D., Dave, J. S., Rai, P., Thamban, N. M., Mishra, S., Gaddamidi, S., Tripathi, N., Vats, P., Rastogi, N., Sahu, L., Ganguly, D., Kumar, M., Singh, V., Gargava, P., and Tripathi, S. N.: Real-time quantification and source apportionment of fine particulate matter including organics and elements in Delhi during summertime, Atmos. Environ., 261, 118598, https://doi.org/10.1016/j.atmosenv.2021.118598, 2021.
Shukla, A. K., Tripathi, S. N., Canonaco, F., Lalchandani, V., Sahu, R., Srivastava, D., Dave, J., Thamban, N. M., Gaddamidi, S., Sahu, L., Kumar, M., Singh, V., and Rastogi, N.: Spatio-temporal variation of C-PM2.5 (composition based PM2.5) sources using PMF*PMF (double-PMF) and single-combined PMF technique on real-time non-refractory, BC and elemental measurements during post-monsoon and winter at two sites in Delhi, India, Atmos. Environ., 293, 119456, https://doi.org/10.1016/j.atmosenv.2022.119456, 2023.
Shukla, A. K., Tripathi, S. N., Talukdar, S., Murari, V., Gaddamidi, S., Manousakas, M.-I., Lalchandani, V., Dixit, K., Ruge, V. M., Khare, P., Kumar, M., Singh, V., Rastogi, N., Tiwari, S., Srivastava, A. K., Ganguly, D., Daellenbach, K. R., and Prévôt, A. S. H.: Measurement report: Sources and meteorology influencing highly time-resolved PM2.5 trace elements at three urban sites in the extremely polluted Indo-Gangetic Plain in India, Atmos. Chem. Phys., 25, 3765–3784, https://doi.org/10.5194/acp-25-3765-2025, 2025.
Singh, A., Rastogi, N., Kumar, V., Slowik, J. G., Satish, R., Lalchandani, V., Thamban, N. M., Rai, P., Bhattu, D., Vats, P., Ganguly, D., Tripathi, S. N., and Prévôt, A. S. H.: Sources and characteristics of light-absorbing fine particulates over Delhi through the synergy of real-time optical and chemical measurements, Atmos. Environ., 252, 118338, https://doi.org/10.1016/j.atmosenv.2021.118338, 2021a.
Singh, T., Matsumi, Y., Nakayama, T., Hayashida, S., Patra, P. K., Yasutomi, N., Kajino, M., Yamaji, K., Khatri, P., Takigawa, M., Araki, H., Kurogi, Y., Kuji, M., Muramatsu, K., Imasu, R., Ananda, A., Arbain, A. A., Ravindra, K., Bhardwaj, S., Kumar, S., Mor, S., Dhaka, S. K., Dimri, A. P., Sharma, A., Singh, N., Bhatti, M. S., Yadav, R., Vatta, K., and Mor, S.: Very high particulate pollution over northwest India captured by a high-density in situ sensor network, Sci. Rep., 13, 13201, https://doi.org/10.1038/s41598-023-39471-1, 2023.
Singh, V., Singh, S., and Biswal, A.: Exceedances and trends of particulate matter (PM2.5) in five Indian megacities, Sci. Total Environ., 750, 141461, https://doi.org/10.1016/j.scitotenv.2020.141461, 2021b.
Singh, V., Ganguly, D., Rathore, J., Sahu, L., Kunchala, R. K., and Dey, S.: Chemical Characterization and Source Apportionment of Carbonaceous Aerosols during Post-Monsoon Biomass Burning and Diwali at an Upwind Site of Delhi, Version v1, Zenodo [data set], https://doi.org/10.5281/zenodo.22071367, 2026.
Stein, A. F., Draxler, R. R., Rolph, G. D., Stunder, B. J. B., Cohen, M. D., and Ngan, F.: NOAA's HYSPLIT Atmospheric Transport and Dispersion Modeling System, B. Am. Meteorol. Soc., 96, 2059–2077, https://doi.org/10.1175/BAMS-D-14-00110.1, 2015.
Thamban, N. M., Joshi, B., Tripathi, S. N., Sueper, D., Canagaratna, M. R., Moosakutty, S. P., Satish, R., and Rastogi, N.: Evolution of Aerosol Size and Composition in the Indo-Gangetic Plain: Size-Resolved Analysis of High-Resolution Aerosol Mass Spectra, ACS Earth Space Chem., 3, 823–832, https://doi.org/10.1021/acsearthspacechem.8b00207, 2019.
Thamban, N. M., Lalchandani, V., Kumar, V., Mishra, S., Bhattu, D., Slowik, J. G., Prevot, A. S. H., Satish, R., Rastogi, N., and Tripathi, S. N.: Evolution of size and composition of fine particulate matter in the Delhi megacity during later winter, Atmos. Environ., 267, 118752, https://doi.org/10.1016/j.atmosenv.2021.118752, 2021.
Titos, G., Del Águila, A., Cazorla, A., Lyamani, H., Casquero-Vera, J. A., Colombi, C., Cuccia, E., Gianelle, V., Močnik, G., Alastuey, A., Olmo, F. J., and Alados-Arboledas, L.: Spatial and temporal variability of carbonaceous aerosols: Assessing the impact of biomass burning in the urban environment, Sci. Total Environ., 578, 613–625, https://doi.org/10.1016/j.scitotenv.2016.11.007, 2017.
Tobler, A., Bhattu, D., Canonaco, F., Lalchandani, V., Shukla, A., Thamban, N. M., Mishra, S., Srivastava, A. K., Bisht, D. S., Tiwari, S., Singh, S., Močnik, G., Baltensperger, U., Tripathi, S. N., Slowik, J. G., and Prévôt, A. S. H.: Chemical characterization of PM2.5 and source apportionment of organic aerosol in New Delhi, India, Sci. Total Environ., 745, 140924, https://doi.org/10.1016/j.scitotenv.2020.140924, 2020.
Ulbrich, I. M., Canagaratna, M. R., Zhang, Q., Worsnop, D. R., and Jimenez, J. L.: Interpretation of organic components from Positive Matrix Factorization of aerosol mass spectrometric data, Atmos. Chem. Phys., 9, 2891–2918, https://doi.org/10.5194/acp-9-2891-2009, 2009.
Vaishya, A., Singh, P., Rastogi, S., and Babu, S. S.: Aerosol black carbon quantification in the central Indo-Gangetic Plain: Seasonal heterogeneity and source apportionment, Atmos. Res., 185, 13–21, https://doi.org/10.1016/j.atmosres.2016.10.001, 2017.
Vasilakopoulou, C. N., Matrali, A., Skyllakou, K., Georgopoulou, M., Aktypis, A., Florou, K., Kaltsonoudis, C., Siouti, E., Kostenidou, E., Błaziak, A., Nenes, A., Papagiannis, S., Eleftheriadis, K., Patoulias, D., Kioutsioukis, I., and Pandis, S. N.: Rapid transformation of wildfire emissions to harmful background aerosol, npj Clim Atmos Sci, 6, 218, https://doi.org/10.1038/s41612-023-00544-7, 2023.
Wang, H., Lou, S., Huang, C., Qiao, L., Tang, X., Chen, C., Zeng, L., Wang, Q., Zhou, M., Lu, S., and Yu, X.: Source Profiles of Volatile Organic Compounds from Biomass Burning in Yangtze River Delta, China, Aerosol Air Qual. Res., 14, 818–828, https://doi.org/10.4209/aaqr.2013.05.0174, 2014.
Yadav, S., Tripathi, S. N., and Rupakheti, M.: Current status of source apportionment of ambient aerosols in India, Atmos. Environ., 274, 118987, https://doi.org/10.1016/j.atmosenv.2022.118987, 2022.
Zhang, Z., Zhu, W., Hu, M., Liu, K., Wang, H., Tang, R., Shen, R., Yu, Y., Tan, R., Song, K., Li, Y., Zhang, W., Zhang, Z., Xu, H., Shuai, S., Li, S., Chen, Y., Li, J., Wang, Y., and Guo, S.: Formation and evolution of secondary organic aerosols derived from urban-lifestyle sources: vehicle exhaust and cooking emissions, Atmos. Chem. Phys., 21, 15221–15237, https://doi.org/10.5194/acp-21-15221-2021, 2021.
Zhao, J., Qiu, Y., Zhou, W., Xu, W., Wang, J., Zhang, Y., Li, L., Xie, C., Wang, Q., Du, W., Worsnop, D. R., Canagaratna, M. R., Zhou, L., Ge, X., Fu, P., Li, J., Wang, Z., Donahue, N. M., and Sun, Y.: Organic Aerosol Processing During Winter Severe Haze Episodes in Beijing, J. Geophys. Res.-Atmos., 124, 10248–10263, https://doi.org/10.1029/2019JD030832, 2019.
Zheng, Y., Cheng, X., Liao, K., Li, Y., Li, Y. J., Huang, R.-J., Hu, W., Liu, Y., Zhu, T., Chen, S., Zeng, L., Worsnop, D. R., and Chen, Q.: Characterization of anthropogenic organic aerosols by TOF-ACSM with the new capture vaporizer, Atmos. Meas. Tech., 13, 2457–2472, https://doi.org/10.5194/amt-13-2457-2020, 2020.
Zotter, P., Herich, H., Gysel, M., El-Haddad, I., Zhang, Y., Močnik, G., Hüglin, C., Baltensperger, U., Szidat, S., and Prévôt, A. S. H.: Evaluation of the absorption Ångström exponents for traffic and wood burning in the Aethalometer-based source apportionment using radiocarbon measurements of ambient aerosol, Atmos. Chem. Phys., 17, 4229–4249, https://doi.org/10.5194/acp-17-4229-2017, 2017.