the Creative Commons Attribution 4.0 License.
the Creative Commons Attribution 4.0 License.
 | 27 Jan 2026
Emerging Mineral Dust Source in ’A’ą̈y Chù’ Valley, Yukon, Canada Poses Potential Health Risk via Exposure to Metal and Metalloids Enriched in PM10 and PM2.5 Size Fractions
Arnold R. Downey
Alisée Dourlent
Daniel Bellamy
James King
Patrick L. Hayes
The ’A’ą̈y Chù’ Valley in Kluane National Park and Reserve, Yukon, Canada has undergone significant hydrological change in the past decade due to climate-driven glacial recession. This has reverted the ’A’ą̈y Chù’ to a major source of sediment-derived mineral dust, representing an environmental change for the region. Mineral dust influences climatic radiative forcing and impacts human health, both of which depend on its concentration, size distribution, and composition. This work discusses results from a field campaign conducted in the ’A’ą̈y Chù’ Valley in 2021 aimed at understanding and quantifying these parameters, with comparison to a previous campaign in the same location to evaluate the evolution of the dust emissions between 2018 and 2021. An optical particle counter (OPC) instrument measured a mean volume diameter of airborne dust of 4.43 µm at 3.3 m above ground, with Coulter Counter measurements being used for comparison and validation. The concentration of many metal(loid)s in the dust were also studied: Al, Ag, As, Ba, Ca, Cd, Co, Cr, Cu, Fe, K, Mg, Mn, Ni, Pb, Rb, Tl, U, and V. It was found that 24 h ambient air quality criteria for exposure to several metal(loid)s were surpassed. Significant enrichment of several metal(loid)s was observed for both the PM10 and PM2.5 size fractions relative to the Total Suspended Material (TSP) fraction of the mineral dust and the parent soil. This suggests that the mineral dust in the ’A’ą̈y Chù’ Valley possesses compounding characteristics that are detrimental to human health due to exposure to potentially toxic metal(loid) concentrations.
- Article
(3674 KB) - Full-text XML
-
Supplement
(581 KB) - BibTeX
- EndNote


The field campaign for this project was conducted on the traditional territories of the Champagne and Aishihik First Nations and Kluane First Nation. These peoples are included in the Southern Tutchone First Nations. Therefore, the Southern Tutchone names and spellings of places referenced in this work are used.
The size distribution of aerosols, including mineral dust, is one of the key properties determining their impact on climate and health. The radiative properties of aerosol particles are intimately tied to size, with scattering cross section scaling as a power of 3–5 with respect to particle diameter (Tegen and Lacis, 1996; Scheuvens and Kandler, 2014). For mineral dust, particles with sizes on the order of solar short-wave radiation wavelengths (0.2–2 µm) produce the greatest shortwave radiative effect per unit mass and generally have a direct cooling effect (Miller et al., 2006). Similarly, mineral dust particles with sizes on the order of terrestrial radiation wavelengths, >4 µm, produce the greatest warming effect (Tegen and Lacis, 1996). The indirect radiative properties are also affected by size, such as when aerosol particles act as Cloud Condensation Nuclei (CCN) or Ice Nulei (IN) (Xi et al., 2022; Kok et al., 2023). An aerosol's role in multiphase chemical reactions is also affected by size, where the particle's surface area and surface-to-volume ratio are key parameters (Fang, 2018). All of these effects are related to atmospheric lifetime, which is also primarily driven by aerosol particle size. Atmospheric lifetimes of dust particles have been modelled based on effective radius (reff), accounting for both wet and dry deposition processes. For instance, large sand-sized particles with reff=38 µm give a modeled lifetime of only 1 h, while small clay-sized particles with reff=0.7 µm give a modeled lifetime of 13 d (Tegen and Fung, 1994).
Furthermore, the impact of particulate matter (PM) on health is related to particle size. It is known that coarse particles larger than 10 µm typically deposit in the oral and nasal cavities upon respiration. Particles less than or equal to 10 µm in diameter (PM10) travel further into the respiratory system, exhibiting greater deposition traction in the bronchial and alveolar regions of the lungs, with this effect being further pronounced for particles of diameters less than or equal to 2.5 µm (PM2.5) (Hofmann, 2011). A systematic review on PM and all non-accidental mortality reported a higher risk on a per-mass basis associated with PM2.5 relative to PM10, due to lung cancer, Chronic Obstructive Pulmonary Disease and other negative health outcomes (Chen and Hoek, 2020; World Health Organization, 2021). Thus, the daily exposure limit recommended by the WHO for PM2.5 is much lower than that for PM10, 15 versus 45 µg m−3, respectively (World Health Organization, 2021). One should note that PM2.5 naturally contains more particles per volume, with greater specific surface area than PM10. It is also known that the composition of PM plays a role in its impact on human health. Chen and Lippmann (2009) outlines this phenomenon, where the hazard risk associated with certain components of PM is quite high (Ni, V, EC) compared to others (Si, Al, NO3) (Chen and Lippmann, 2009). Environmental and Public Health organizations thus establish exposure limits to potentially toxic PM components like metals and metalloids typically based on epidemiological studies, with each component possessing its own toxicological characteristics (Ali et al., 2019).
For mineral dust, size distributions span multiple orders of magnitude, with diameters ranging from less than 100 nm to more than 100 µm (Marticorena, 2014), making complete assessments of the particle size distribution difficult. Nonetheless, a great deal of research has been conducted to assess dust size distributions of geographically diverse sources (Scheuvens and Kandler, 2014). Mid-latitude dust sources have received the most attention since these sources contribute to the vast majority of earth's yearly dust budget. High-latitude dust (HLD) sources are estimated to only contribute 1 %–5 % of global dust emissions (Meinander et al., 2022; Dagsson-Waldhauserova et al., 2019). However, these dust sources demonstrate climatic and environmental significance and should not be overlooked. Although HLD contributes a small percentage to the Earth's global dust budget, it is estimated to account for 57 % of the dust deposited on snow and ice surfaces (Meinander et al., 2022). This causes the albedo of these surfaces to decrease substantially, suggesting that HLD may have a disproportionate impact on climate (Boy et al., 2019). The dust-induced snow albedo effect is influenced by many factors, including its concentration in the snow and dust optical properties, as determined by its size distribution and chemical composition (Flanner et al., 2009; Dang et al., 2015; Flanner et al., 2021). Mineral dust with greater concentrations of iron oxide species, for example, is known to have a greater imaginary refractive index, leading to a higher tendency to absorb radiation (Zhang et al., 2015a), causing warming and accelerated melting of ice and snow. The composition and size characteristics of HLD have been studied in recent years using a wide variety of techniques, as summarized in Table 1 of Meinander et al. (2022).
HLD composition has been characterized to some extent on a size-resolved basis with respect to mineral content (Kandler et al., 2020; Barr et al., 2023), as well as for some major metallic components using Scanning Electron Microscopy (SEM) (Panta et al., 2025). However, the direct relationship between the metallic composition of mineral dusts, including trace metals, and their size class in post-glaciated high-latitude regions has not yet been characterized, to our knowledge. Some insight into the composition of HLD in different size fractions can be derived from previous research related to drift prospecting for mining purposes (Shilts, 1993). Metal and metalloid concentrations in glacial sediments increase substantially in sediments of finer size fractions due to the tendency of minerals to crush to specific sizes during comminution, which is the reduction of geological material to smaller average sizes during glacial transport. We refer to this increase in metal(loid) concentration as “enrichment”. Enrichment has been noted for several metal(loid)s studied, reaching maximal concentrations in size fractions below 4 µm in diameter, but greater than 1 µm (Shilts, 1984a). The metal(loid)s are thought to reside within the lattices of the physically comminuted phyllosilicates that are abundant in these size fractions and the observed enrichment occurs in both weathered and unweathered sediment (Shilts, 1984b).
Thus, a complete understanding of the size distribution and metallic composition of emerging HLD sources is desirable from climate, geo-chemical, and public health standpoints. As noted, mineral dust size distributions are notoriously difficult to measure, owing to their large size distribution range, along with various shortcomings of aerosol size measurement techniques (Reid et al., 2003). Aerosol light scattering is often exploited to measure aerosol size distributions in real time, such as with an Optical Particle Counter (OPC) (McMurry, 2000). Such instruments are efficient at measuring particle size distributions at high temporal resolution and are relatively low-maintenance and robust for a variety of field applications. The relationship between particle size and light scattering is mathematically complicated, yet direct for spherical particles of known composition thanks to applications of Mie scattering theory (Wriedt, 2012). This is not the case, however, for mineral dust. Mineral dust particles adopt a variety of shapes, and are composed of several different minerals, meaning their interaction with the light sources of OPC instruments is not straightforward (Scheuvens and Kandler, 2014). The varied composition of mineral dust can furthermore lead to slight oversizing of particles, while the effect of shape depends on scattering angle (Collins et al., 2000). Some degree of confidence on size distribution results can be obtained by comparison with other sizing techniques, such as using a Coulter Counter instrument (Davies, 1970). Coulter Counter instruments measure particle size distributions by resistive pulse sensing as particles pass through a sensing region while suspended in an electrolyte solution. The magnitude of the resistive pulse it proportional to the volume of the particle in the sensing region from which a high-resolution particle size distribution may be obtained containing hundreds of size bins (McTainsh et al., 1997). Although the resistive pulse is proportional to the particle volume, this technique is still susceptible to biases from non-sphericity (Hurley, 1970). Another drawback to such a technique is that it must be performed off-line, requiring sampling and sample processing steps. This means that high time resolution is not obtainable, as samples are usually collected over the course of one or two days. It also means that the particles are not in their natural chemical environment during analysis, with some components possibly dissolving or disaggregating in the electrolyte solution. It is thus an advantage to assess mineral dust size distributions using parallel techniques, when possible, to compensate for each technique's shortcomings.
The mechanisms dictating the production of mineral dust are relatively well-established. Aeolian erosion is related to wind shear stress, which is related to the gradient of wind speed with height and the dynamical viscosity of the air (Marticorena, 2014). In some cases, dust emission may occur in low-wind conditions, as surface heating may cause sufficient upward air motion to lift and suspend silt-sized particles (Dagsson-Waldhauserova et al., 2014). In most cases however, a wind speed threshold must be met to overcome the forces holding particles in place on the surface, namely their weight, and interparticle cohesion forces resulting from electrostatics and soil moisture (Shao and Lu, 2000; Kok et al., 2012). These forces are especially strong for ultrafine soil particles on the order of microns or smaller. These particles are typically liberated by the impaction of larger particles transported by wind, a process called “saltation” (Kok et al., 2012). For example, a typical threshold wind speed used in dust emission modelling is 6.5 m s−1 at 10 m height, mainly due to lack of input on surface properties at the global scale. Below this threshold wind speed, one does not expect dust emission (Sokolik, 2002; Kalma et al., 1988). In comparison, the erosion thresholds for wind velocities at 10 m measured on natural surfaces range from 4 to 20 m s−1 (Nickling and Gillies, 1989; Helgren and Prospero, 1987). To produce dust, these winds must generally act on a bare surface of soil or sediment that is relatively dry, or otherwise be strong enough to overcome the cohesive forces resulting from soil humidity (Dupont et al., 2024). As such, dust emission models commonly operate as a function of surface conditions and shear velocity (Lee et al., 2019). A better understanding of the meteorological conditions of the ’A’ą̈y Chù’ Valley in relation to dust emissions would provide insights leading to better integration of these types of emissions into climate and geochemical transport models. The present study provides unique observations that can be used for such model improvements.
Overall, it has been determined that climate change likely enhances dust activity to a greater extent than it reduces it. Dust emissions are estimated to have increased by 55±30 % since pre-industrial era (Kok et al., 2023), and dust concentrations are expected to increase 10 % more by 2100 according to the IPCC (Canadell et al., 2021). Hydrological changes driven by climate change are one mechanism by which dust activity may increase in the future. The river piracy event experienced by the ’A’ą̈y Chù’ (formerly Slims River) in 2016 is a dramatic example of such a change. Located in Kluane National Park and Reserve in southwest Yukon, Canada, the ’A’ą̈y Chù’ Valley runs from the foot of the Kaskawulsh Glacier to Lhù'ààn Mân' (Kluane Lake). At 409 km2, Lhù'ààn Mân' is the largest lake contained entirely in the Yukon (Natural Resources Canada et al., 1973). The valley is over 30 km long from the tip of the Kaskawulsh to the edge of the delta before the lake. The recession of the Kaskawulsh Glacier has been documented since the 1970s (Foy et al., 2011; Denton and Stuiver, 1966). In 2016, this recession reached a point where the majority of the ’A’ą̈y Chù’ river flow was diverted to the Kaskawulsh River (Shugar et al., 2017), leaving the ’A’ą̈y Chù’ as a dried sediment bed. The sediment there is exposed to strong winds in the valley, and as a result, dust activity has increased substantially in the southern Lhù'ààn Mân' region (Bachelder et al., 2020).
The goal of this study is to accurately describe the size distribution, diurnal trend, and size-resolved composition of mineral dust emissions from the ’A’ą̈y Chù’ Valley. This emerging dust source has been a recent topic of study for field-based research. A previous measurement campaign was successful in providing a preliminary characterization of the composition and size distribution of the dust from this source and noted several elemental enrichments relative to the source soil (Bachelder et al., 2020). This work did not directly study the finer PM2.5 size class composition, nor the non-size-discriminated Total Suspended Material (TSP) fraction and was relatively limited in terms of the elements analyzed. For instance, this study did not quantify some elements of importance for human health considerations, like Cr and V. As mineral dust transport is often implicated in nutrient transport modelling, it is also important to quantify components like Ca and Mg (Schepanski, 2018; Zhang et al., 2015b). Furthermore, the size distributions measured by OPC were not compared and validated against another technique. Therefore, the present study aims to expand on the progress that has been made on understanding this unique mineral dust source and to provide a basis for future characterization of high-latitude mineral dust.
2.1 Field Site and Sampling Approach
A map of the region where sampling was performed is presented in Fig. 1. The GPS coordinates of the sampling location, hereafter referred to as the Down Valley Site, are 60°59′55.25′′ N, 138°31′24.05′′ W. The region surrounding Lhù'ààn Mân' is described as a subarctic climate with cool summers and year-round precipitation, a Dfc climate zone in the Köppen-Geiger classification, typically having little precipitation overall (Beck et al., 2018). This sampling location has been previously used in a number of recent studies also studying mineral dust dynamics and properties (Bachelder et al., 2020; Bellamy et al., 2025a; Bellamy et al., 2025b; Tardif et al., 2025). PM sampling began on 4 June and ended on 2 July 2021. It was noted from previous campaigns in this location that late spring and early summer show the highest dust activity, due to a combination of the ground being thawed following the winter season and the melt water from the glacier and snow of adjacent mountains not yet being so abundant as to moisten the sediment (Bachelder et al., 2020).
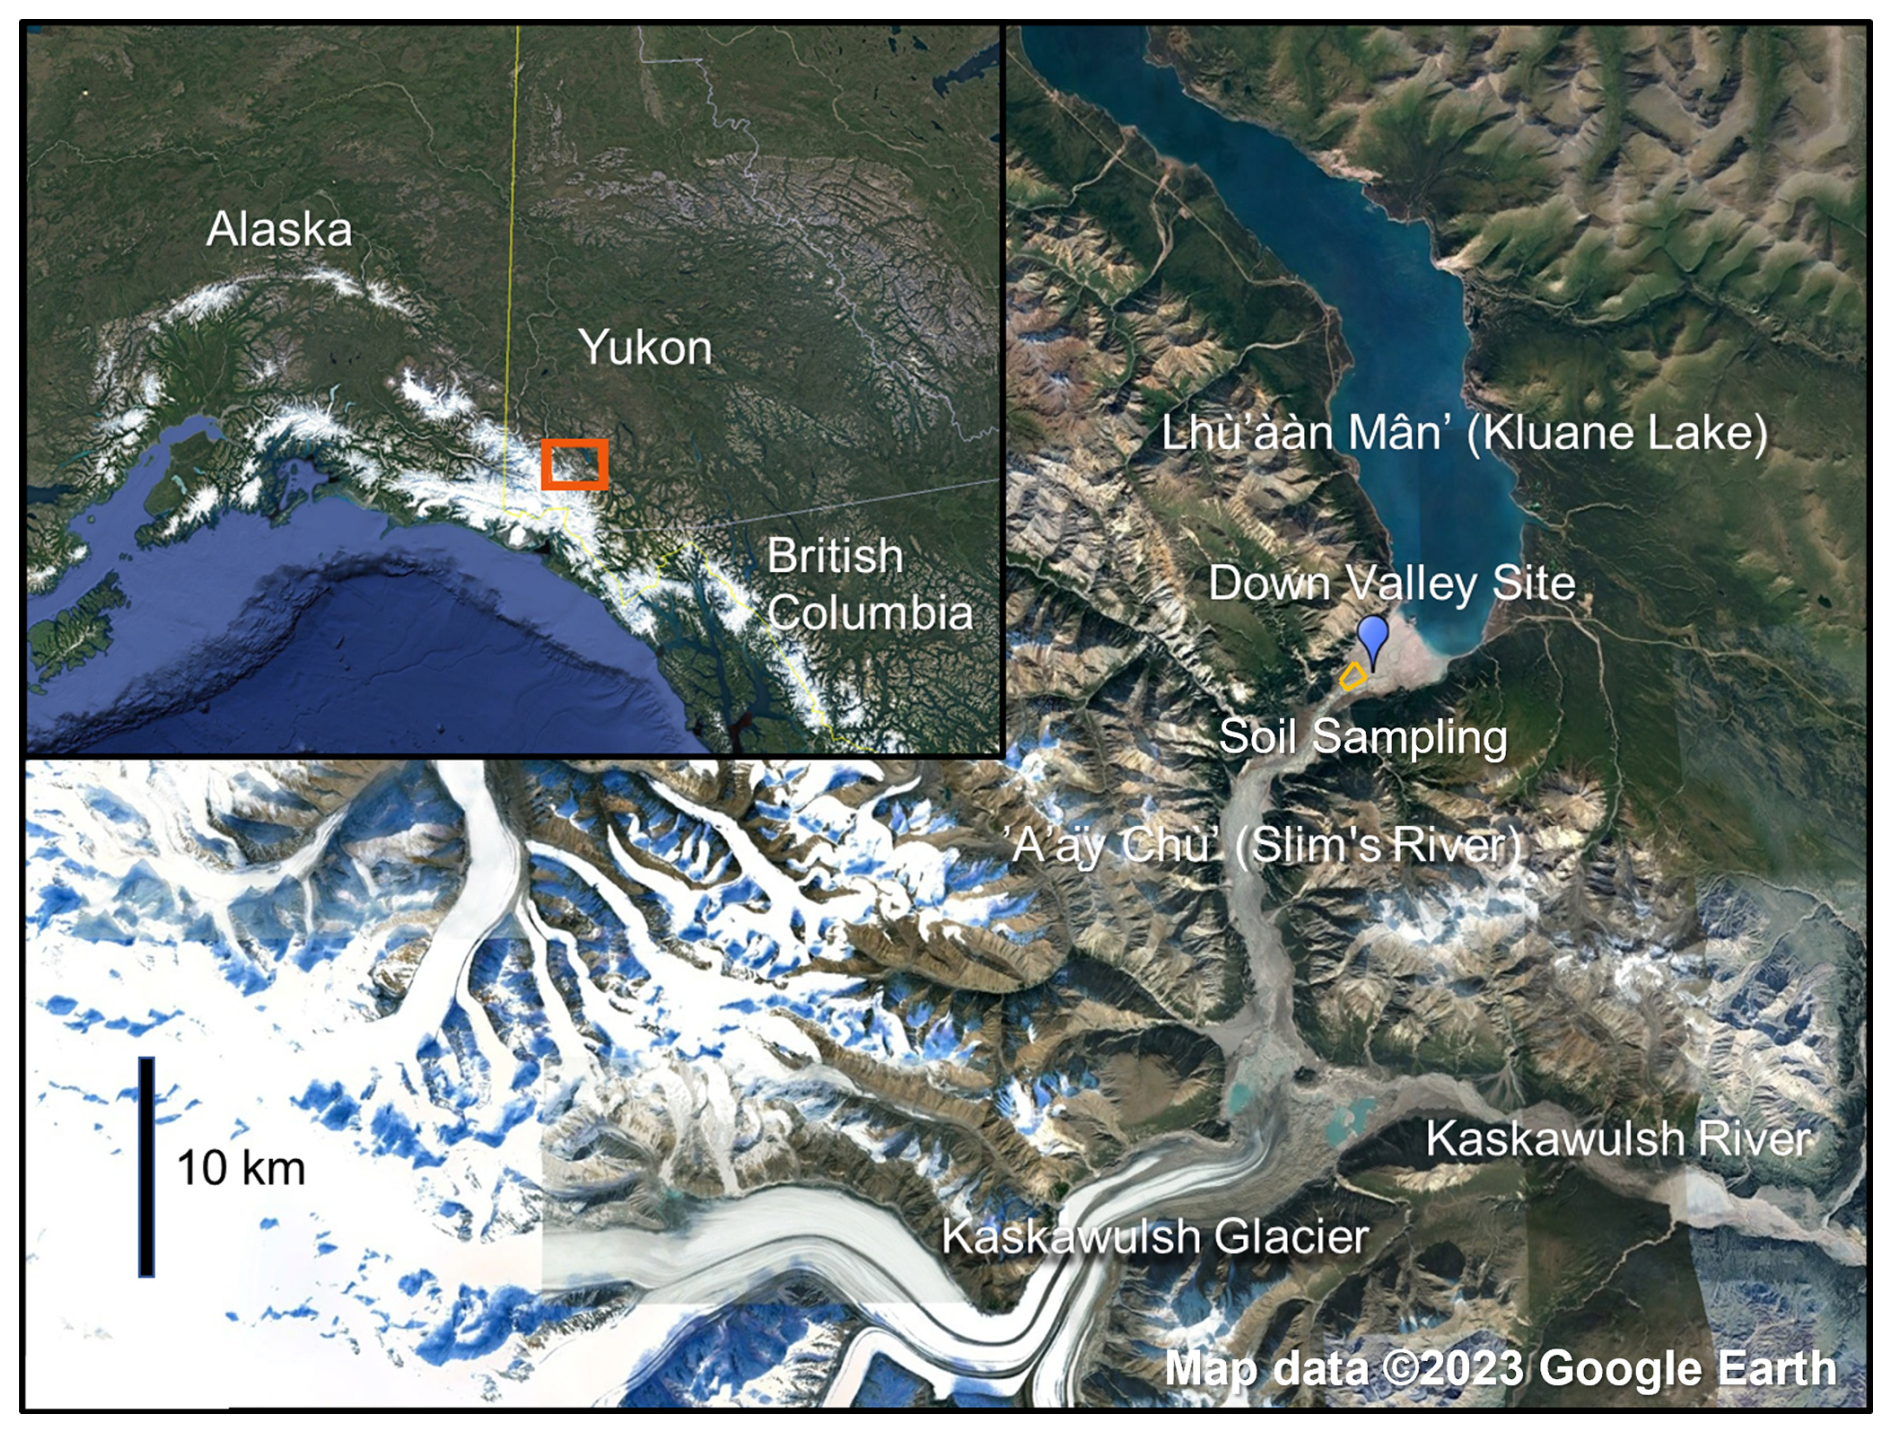
Figure 1Map of sampling locations for dust and soil. Dust samples were collected at the Down Valley Site. The insert map shows the location of the area in Yukon, Canada. Maps produced by © 2023 Google Earth.
PM sampling was conducted using a set of four ARA N-FRM Samplers (ARA Instruments) positioned in pairs at 3.3 and 6.3 m above the ground, with respect to the height of the sampling head inlets, Fig. 2. The sampling was conducted at different heights to provide information on the vertical gradient of PM concentrations. The samplers were set in pairs to allow for simultaneous sampling at a given height of different PM size classes, TSP, PM10, and PM2.5. PM sampling was conducted on nearly a daily basis for TSP and PM10 samples, using an approximate collection time of 24 h, whereas a 48 h collection time was used for PM2.5 samples to obtain greater masses of PM2.5 for improved quantitation of trace elements. A flow rate of 16.7 L min−1 was used for samples destined for metal(loid)s analysis. All PM sampled this way was either collected on Teflon (PALL Corporation, Teflo, 2.0 µm pore size, 47 mm diameter) or Quartz fiber (Whatman™, Grade QMA, 47 mm diameter) filters. Filters were weighed and pre-weighed using a microbalance (VWR, VWR-21XC, readability 1 µg). Quality control procedures for gravimetric measurements were adapted from the US-EPA's Quality Assurance Guidance Document 2.12 for Monitoring PM2.5 in Ambient Air Using Designated Reference or Class 1 Equivalent Methods (U.S. EPA, 2016). As such, at least one lab blank and one field blank filter was reserved for every 10 filters used for sampling. The filters were conditioned in the weighing room for at least 24 h prior to their weighing or pre-weighing. The temperature and relative humidity (RH) of the weighing room was monitored during the conditioning and weighing periods. The specifications on average temperature (between 20 and 23 °C), temperature variability (±2 °C), and RH variability (±5 %) for the 24 h prior to weighing sessions were always met, while the specification for average RH (between 30 % and 40 %) was sometimes not met, with RH exceeding 40 % upon re-weighing. Following gravimetric measurements, the filter samples were stored at 4 °C prior to preparation for elemental analysis. Any value deemed to be below the Limit of Detection (LOD) was assumed to be one half of the LOD for the given size class, determined using the collected field blanks.
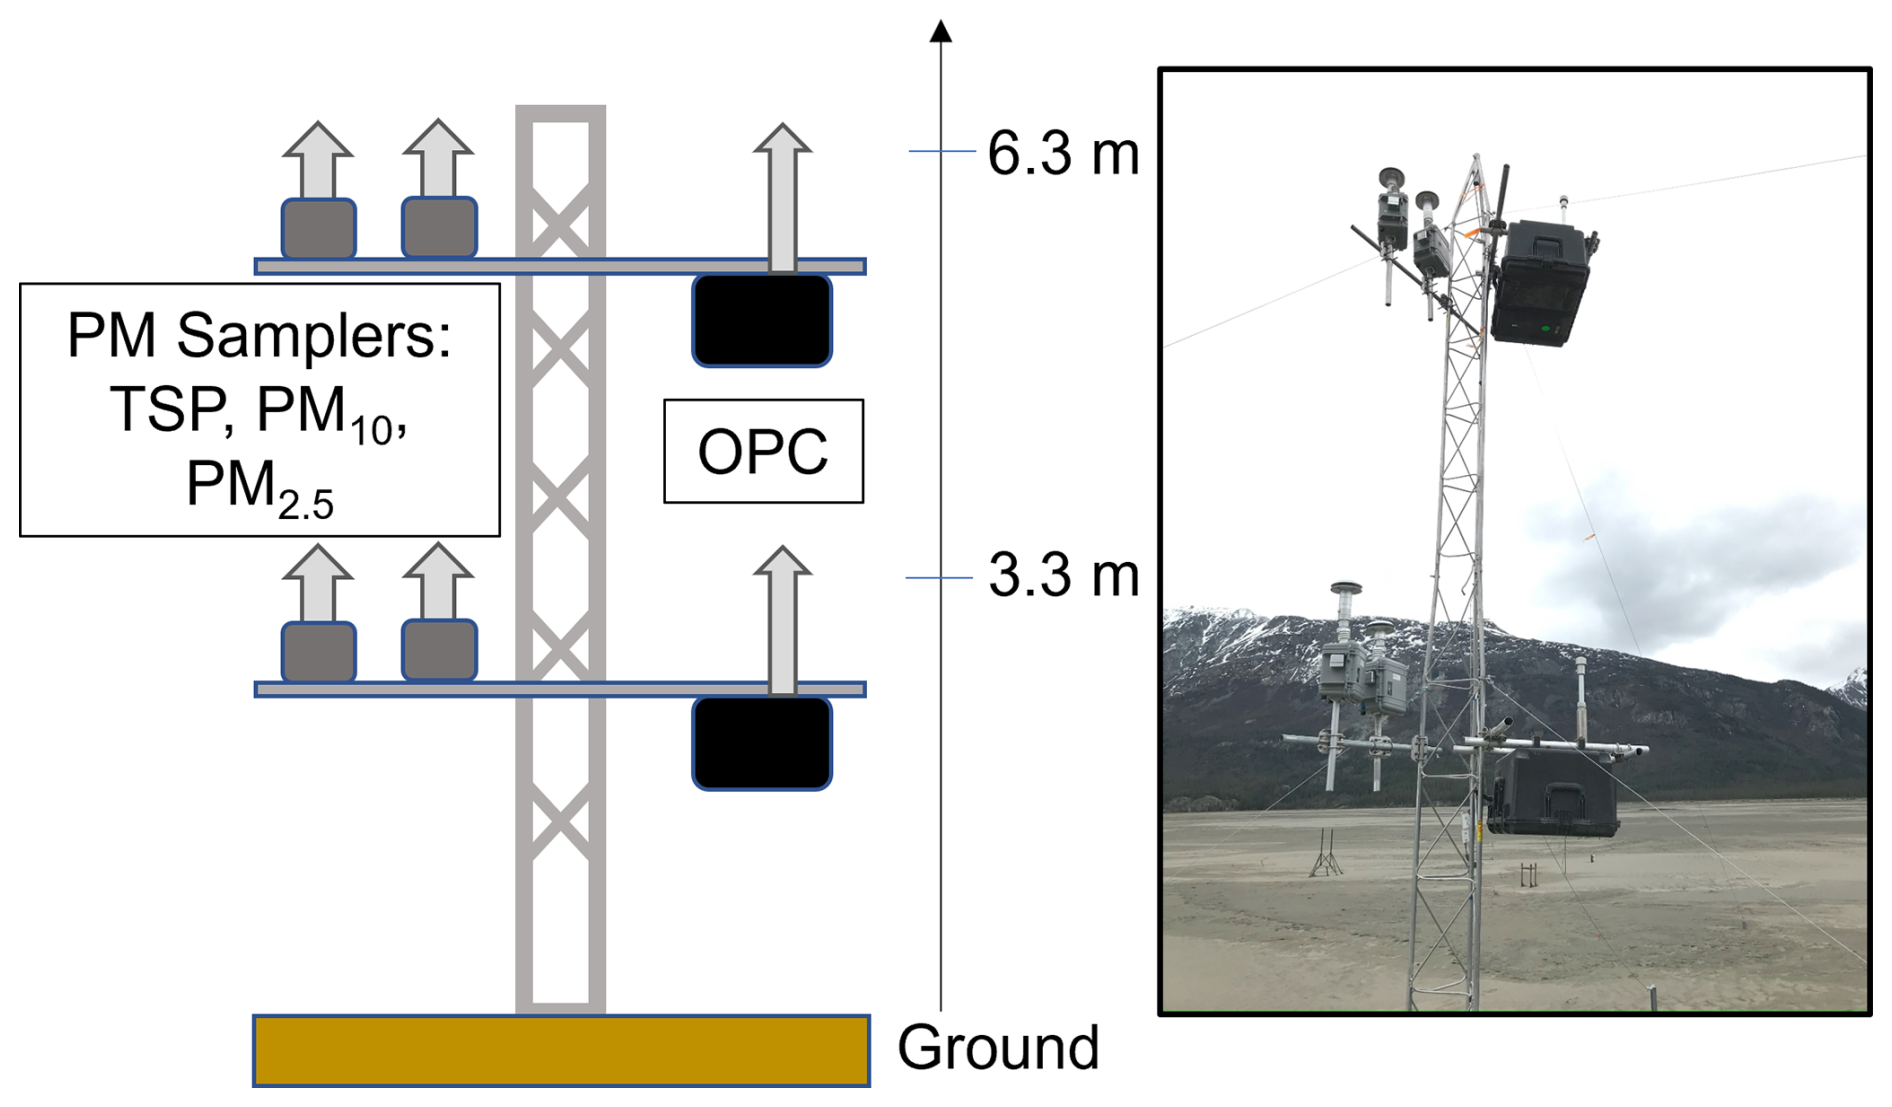
Figure 2Schematic and photo of the dust sampling tower. Measurements were conducted from 4 June to 2 July 2021 in ’A’ą̈y Chù’ Valley, Kluane National Park and Reserve, Yukon.
Soil samples were collected in transects a few hundred meters upwind from the Down Valley site, where the top centimeter was collected for each. Detailed soil sampling locations are given in Table S1.
2.2 Sample Preparation
Filter samples and soils were prepared for total metal(loid)s determination following a modified version of US EPA method 3051a: Microwave Assisted Acid Digestion of Sediments, Sludges, and Oils (U.S. EPA, 2007). For filters, one half of a sample was transferred to a previously washed PFA microwave digestion vessel. For soils, 100 mg was weighed into the vial. Next, 4 mL of concentrated nitric acid (HNO3 for Trace Metal Analysis, Baker Instra-Analyzed Plus, Assay 67 %–70 % ()) and 1 mL of hydrochloric acid (HCl for Trace Metals Analysis, Baker Instra-Analyzed Plus, Assay 34 %–37 % ()) were applied to each sample. The mixture was left to predigest the filter for at least 30 min, at which point the digestion vessel was sealed and placed into the sample carousel of a Microwave Digestion Apparatus (CEM, Mars Xpress, Model MARS 230/60). A pre-programmed EPA 3051 method available with the instrument was utilized, and so the Microwave Digestion Apparatus was programmed to ramp the temperature of the solution to 175 °C over 5.5 min and then hold at this temperature for 4.5 min, ending with a 15 min cool-down period. Once the digested samples were cooled, the vessels were opened carefully in a fume hood to release any remaining pressure. For filter samples, 20 mL of Type-1 water was added to each digestion to obtain an acid concentration suitable for passing through a Nylon syringe filter (VWR® Syringe Filter, Polypropylene housing, 25 mm diameter, Nylon membrane, 0.45 µm pore size). The samples were filtered into tared 50 mL polypropylene centrifuge tubes that were either previously acid washed or were certified metal-free and given an initial rinse with Type-1 water. Type-1 water was used to thoroughly rinse the vessels and then passed through the syringe filter multiple times for optimal recovery. The centrifuge tubes were then completed to about 45 mL with Type-1 water and then reweighed to determine the final volume gravimetrically. Soil digestates were transferred directly into the 50 mL centrifuge tubes, completed to 50 mL with type-1 water, and then centrifuged at 3000 rpm for ten minutes (Heraeus® Multifuge 1 S-R). A portion of each was decanted and stored for later analysis.
2.3 Elemental analysis by ICP-MS
External calibration standards were prepared using a multi-element ICP-MS standard (Inorganic Ventures, IV-ICPMS-71A, ICP-MS Complete Standard – 1 % HNO3) between 1 and 100 µg L−1 for major elements and between 0.01 and 5 µg L−1 for minor elements. Quality Control Standards were prepared using a separate multi-elemental ICP-MS standard (High-Purity Standards, ICP-MSCS-PE3-A, High Purity Standards Solution A of ICP-MS PE Calibration Standard 3 in 5 % HNO3), at concentrations representing both the center and lower range of each calibration range. Sc, Y, and Tb were used as internal standards, introduced in-line prior to the instrument spray chamber. A Nexion 5000 Multi-Quadrupole ICP-MS (Perkin-Elmer®) was used for the analysis. O2 was used as a reaction gas to reduce interferences for the As, Cr, Cu, Fe, and V isotopes of interest. Otherwise, elements were analyzed in standard quadrupole mode. The details of the ICP-MS instrumental parameters can be found in Table S2. The recovery of analytes was determined by preparing replicates of Standard Reference Material (SRM) 2710a Montana I Soil, as its matrix most closely resembles that of mineral dust, although its size distribution is coarser. Recovery data, along with the method LOD, is presented in Table S3. Approximately 10 mg of the SRM was digested along with a quartz fiber sampling filter half, so to best reproduce the digestion environment that the samples are subject to. The low recovery of some major elements in the SRM could be due to incomplete digestion of the silicate structures found in soil particles, which could be explained in part by the non-use of HF in the digestion, which is normally responsible for breaking down these structures (Chen and Ma, 2001). The obtained recoveries are similar to those presented for the “Leachable concentrations Determined Using US-EPA Method 200.7 and 3050B” for this SRM, which are precursor methods to the 3051A method adapted and employed here (Gonzalez and Choquette, 2018). The elemental concentrations presented in this work have been adjusted using the obtained recoveries (Linsinger, 2008).
2.4 Size Distribution Determination
Two Multichannel Optical Particle Counters (OPC; Fast-Response Multichannel Monitor, FAI Instruments) were used to measure the size distribution and concentrations of the PM during the campaign. The OPC inlet heights were matched to the ARA N-FRM sampler inlet heights. Particles of diameters between 0.28 and 10 µm were measured at an initial time resolution of 4 Hz and a flow rate of 1 L min−1. The instrument pumped filtered air at a rate of 6 L min−1 in line with the sampled air to yield a dilution factor of 6:1 to avoid saturation of the detector during highly dusty periods. Raw OPC data is made accessible via a repository (Downey, 2025b). OPC data from 6 m above the ground was not used in this manuscript, as this OPC did not demonstrate good agreement with the corresponding samples collected gravimetrically, indicating that it was possibly not well-calibrated for accurate particle counting.
The dust size distribution for PM10 was also measured offline. Near the end of the campaign between 28 June and 5 July, Nucleopore membrane filters were used to sample PM10 for 24 h periods using the same ARA N-FRM Samplers as above but operating at a flow rate of 10.0 L min−1. All Nucleopore filters (lab blank, field blank, and samples) were cut in half and weighed using a balance (Mettler Toledo XSE105), with the filter half to be extracted weighed directly in a 50 mL centrifuge tube. 5 mL of Type-1 water was added to each tube containing a filter half. The tubes were then secured to an orbital shaker and set to run at 200 rpm for 60 min at room temperature. The filter halves were removed from the tubes and the remaining particle suspensions were stored at −20 °C until size distribution measurements were performed. Size distributions were measured using a Beckman Coulter Multisizer 4e Particle Analyzer, equipped with a 30 µm aperture tube.
2.5 Meteorological Measurements
Wind speed and direction was measured throughout the campaign using cup anemometers equipped with wind vanes (NRG 40C) at various heights between ground level and 10 m, averaged to 10 min resolution. The data used for the purposes of this publication was measured by an anemometer positioned between 2.5 and 4.7 m above ground during the reported measurement period. The height of the anemometer was adjusted at times to account for sand dunes migrating in the sampling site. Temperature and RH were measured throughout the campaign using digital air temperature and RH sensors (Campbell CS215) at 1.3 m off the ground.
3.1 Gravimetric Analysis of Mineral Dust Resolved to Size Class
Daily mass concentrations were highly variable during the measurement period. Figure 3 shows a time series of the PM mass concentrations measured gravimetrically, on a 24 h basis for TSP and PM10, and on a 48 h basis for PM2.5. The corresponding recommended daily limits by the WHO for PM10 and PM2.5 exposure were exceeded in the Valley several times throughout the campaign, 45 and 15 µg m−3, respectively (World Health Organization, 2021). The PM concentrations for each day are also presented in Table S4. The average daily TSP concentration at 3.3 m off the ground measured during the campaign was 8200 ± 3900 µg m−3, while that for PM10 was 372 ± 79 µg m−3, and that for PM2.5 was 84 ± 62 µg m−3, where the uncertainties express the standard error of the mean. The maximum daily dust concentrations measured gravimetrically at 3.3 m off the ground for TSP, PM10, and PM2.5 were 4.61 × 10⁴, 922, and 327 µg m−3, respectively. These maxima occurred near the end of June and signify a peak of dust activity during the campaign. A clear gradient of dust concentrations with height was determined by comparing measurements at 6.3 m against those taken at 3.3 m above the ground. On average, the ratio of TSP concentration in air at 6.3 m to that at 3.3 m was 0.61±0.42, while for PM10 it was 0.69±0.24, as determined by gravimetric concentration results. On average during the measurement period, nearly a quarter of TSP mass concentration in air could be attributed to the PM10 size class, as the portion of PM10 in TSP measured during the campaign was 0.23±0.11. However, this ratio decreased with an increasing magnitude of the dust event from 0.5 to almost zero, Fig. S1.
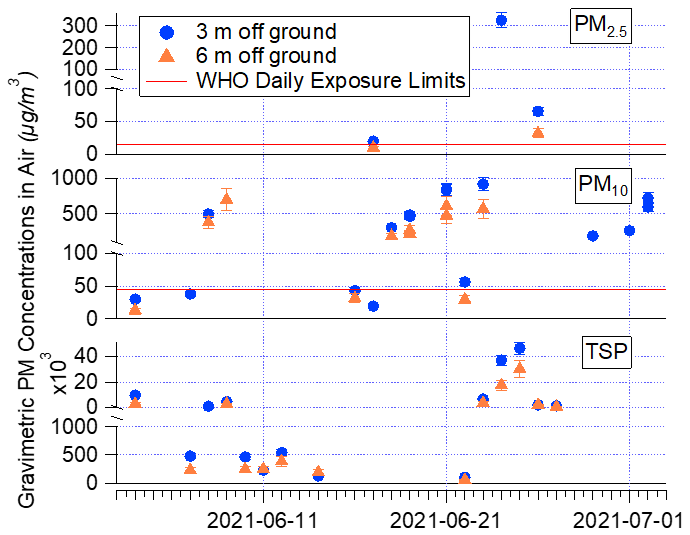
Figure 3Gravimetric PM concentrations in air measured during Kluane 2021 campaign. TSP and PM10 samples were collected over 24 h periods, while PM2.5 samples were collected over 48 h periods. Sampling began within one hour of 9 am local time of the date indicated. Error bars indicate the precision of the measurement (14 %), which was estimated by the mean percent difference of multiple duplicate samples collected.
3.2 Dust Concentrations, Size Distribution, and Temporal Variation Analysis from OPC Data with Meteorological Factors
OPC data was collected continuously during the campaign, with some interruptions experienced, Fig. 4. Dust concentration measurements from the OPC at 3.3 m were compared to those obtained gravimetrically from filter sampling and are presented in Fig. 5. Compared to the unity function, the OPC slightly overestimated PM10 on low-concentration days and slightly underestimated it on high-concentration dust days, as indicated by the line of best fit. The average ratio of concentration determined by the OPC method relative to the gravimetric method is 1.28. The OPC did not agree well with the gravimetric method with respect to PM2.5 concentrations, Fig. S2, having a ratio of 0.35, but the number of datapoints available for this comparison was very limited.
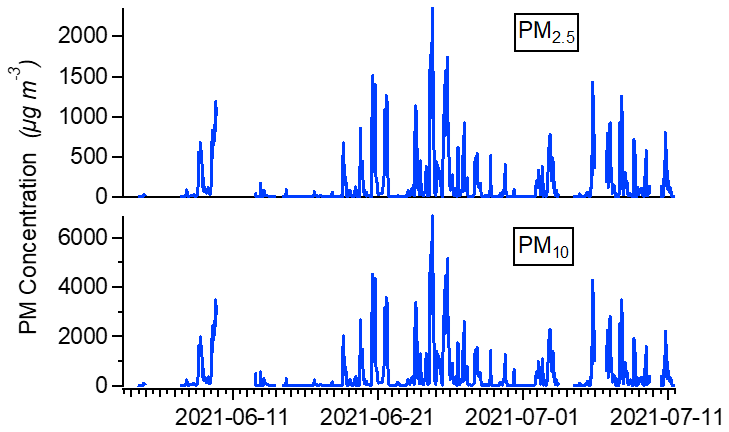
Figure 4PM10 and PM2.5 concentrations measured at Down Valley site in ’A’ą̈y Chù’ Valley using OPC at 3.3 m above ground level, averaged to 1 h.
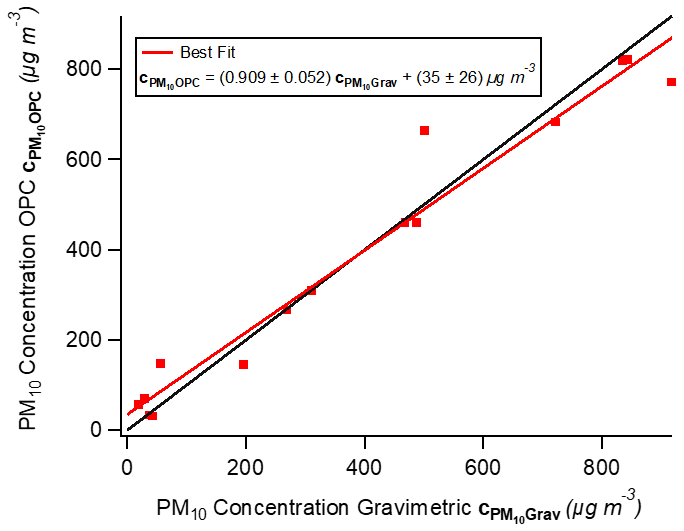
Figure 5Comparison of PM10 measurements at 3 m using OPC and Gravimetry. The black line represents the unity function. The linear function of best fit is presented along with associated standard errors.
As shown in Fig. 4, a clear diurnal cycle of dust activity is observed at the sampling site, which is also summarized on an hourly basis by Fig. 6. Tabulated results of the diurnal trends for PM concentrations and meteorological conditions are available in the manuscript assets (Downey, 2025a). The diurnal trend matches visual observations made in the field. Often, mornings exhibited little-to-no dust activity, with more pronounced extreme dust activity occurring in the afternoons. As such, the lowest PM concentrations occurred at 5 am on average while the daily maximum in dust activity tended to occur at 7 pm local time, which boasted an average PM10 and PM2.5 concentration of 1378 ± 34 and 467 ± 12 µg m−3, respectively. This maximum corresponds with meteorological conditions, Fig. 7, as wind speeds tended to be highest at this time of day on average, 6.47 ± 0.30 m s−1. There is also a correspondence between the afternoon increase of the 75th percentile wind speeds and PM concentration at 2 pm local time, with a 1.3-fold increase in wind speed corresponding to a 6-fold increase in dust concentrations for both size fractions, compared to the previous hour. Wind direction, Fig. S3, largely followed the contours of the valley over the sampling period, Fig. 1. The maximum dust concentrations lag an hour behind the maximum average air temperature and two hours behind the minimum relative humidity during the campaign, 18.28 ± 0.47 °C and 36.2 ± 1.6 %, respectively; suggesting the warm and dry air conditions prime sediment of the ground for optimal dust emission. It has often been suggested that the primary driving factor of the high-speed winds causing the dust emission in the ’A’ą̈y Chù’ Valley was the phenomenon of katabatic winds derived from nearby glaciers (Denton and Stuiver, 1967; Bachelder et al., 2020). However, a more thorough investigation into this phenomenon in the ’A’ą̈y Chù’ Valley has revealed that this is most likely not the case, and that topographically channeled flows have been misclassified as katabatic winds in these cases. A study on the forcing mechanisms of strong surface winds in this valley over the period of July 2021 to September 2022 revealed that 50.0 % of high-wind-speed events occurred under high above-valley wind speeds; while a summertime valley wind system is likely responsible for persistent nocturnal high-speed winds near the valley delta, contributing to 28 % of summer high-speed winds under distinctly calm conditions aloft (Bellamy et al., 2025b).
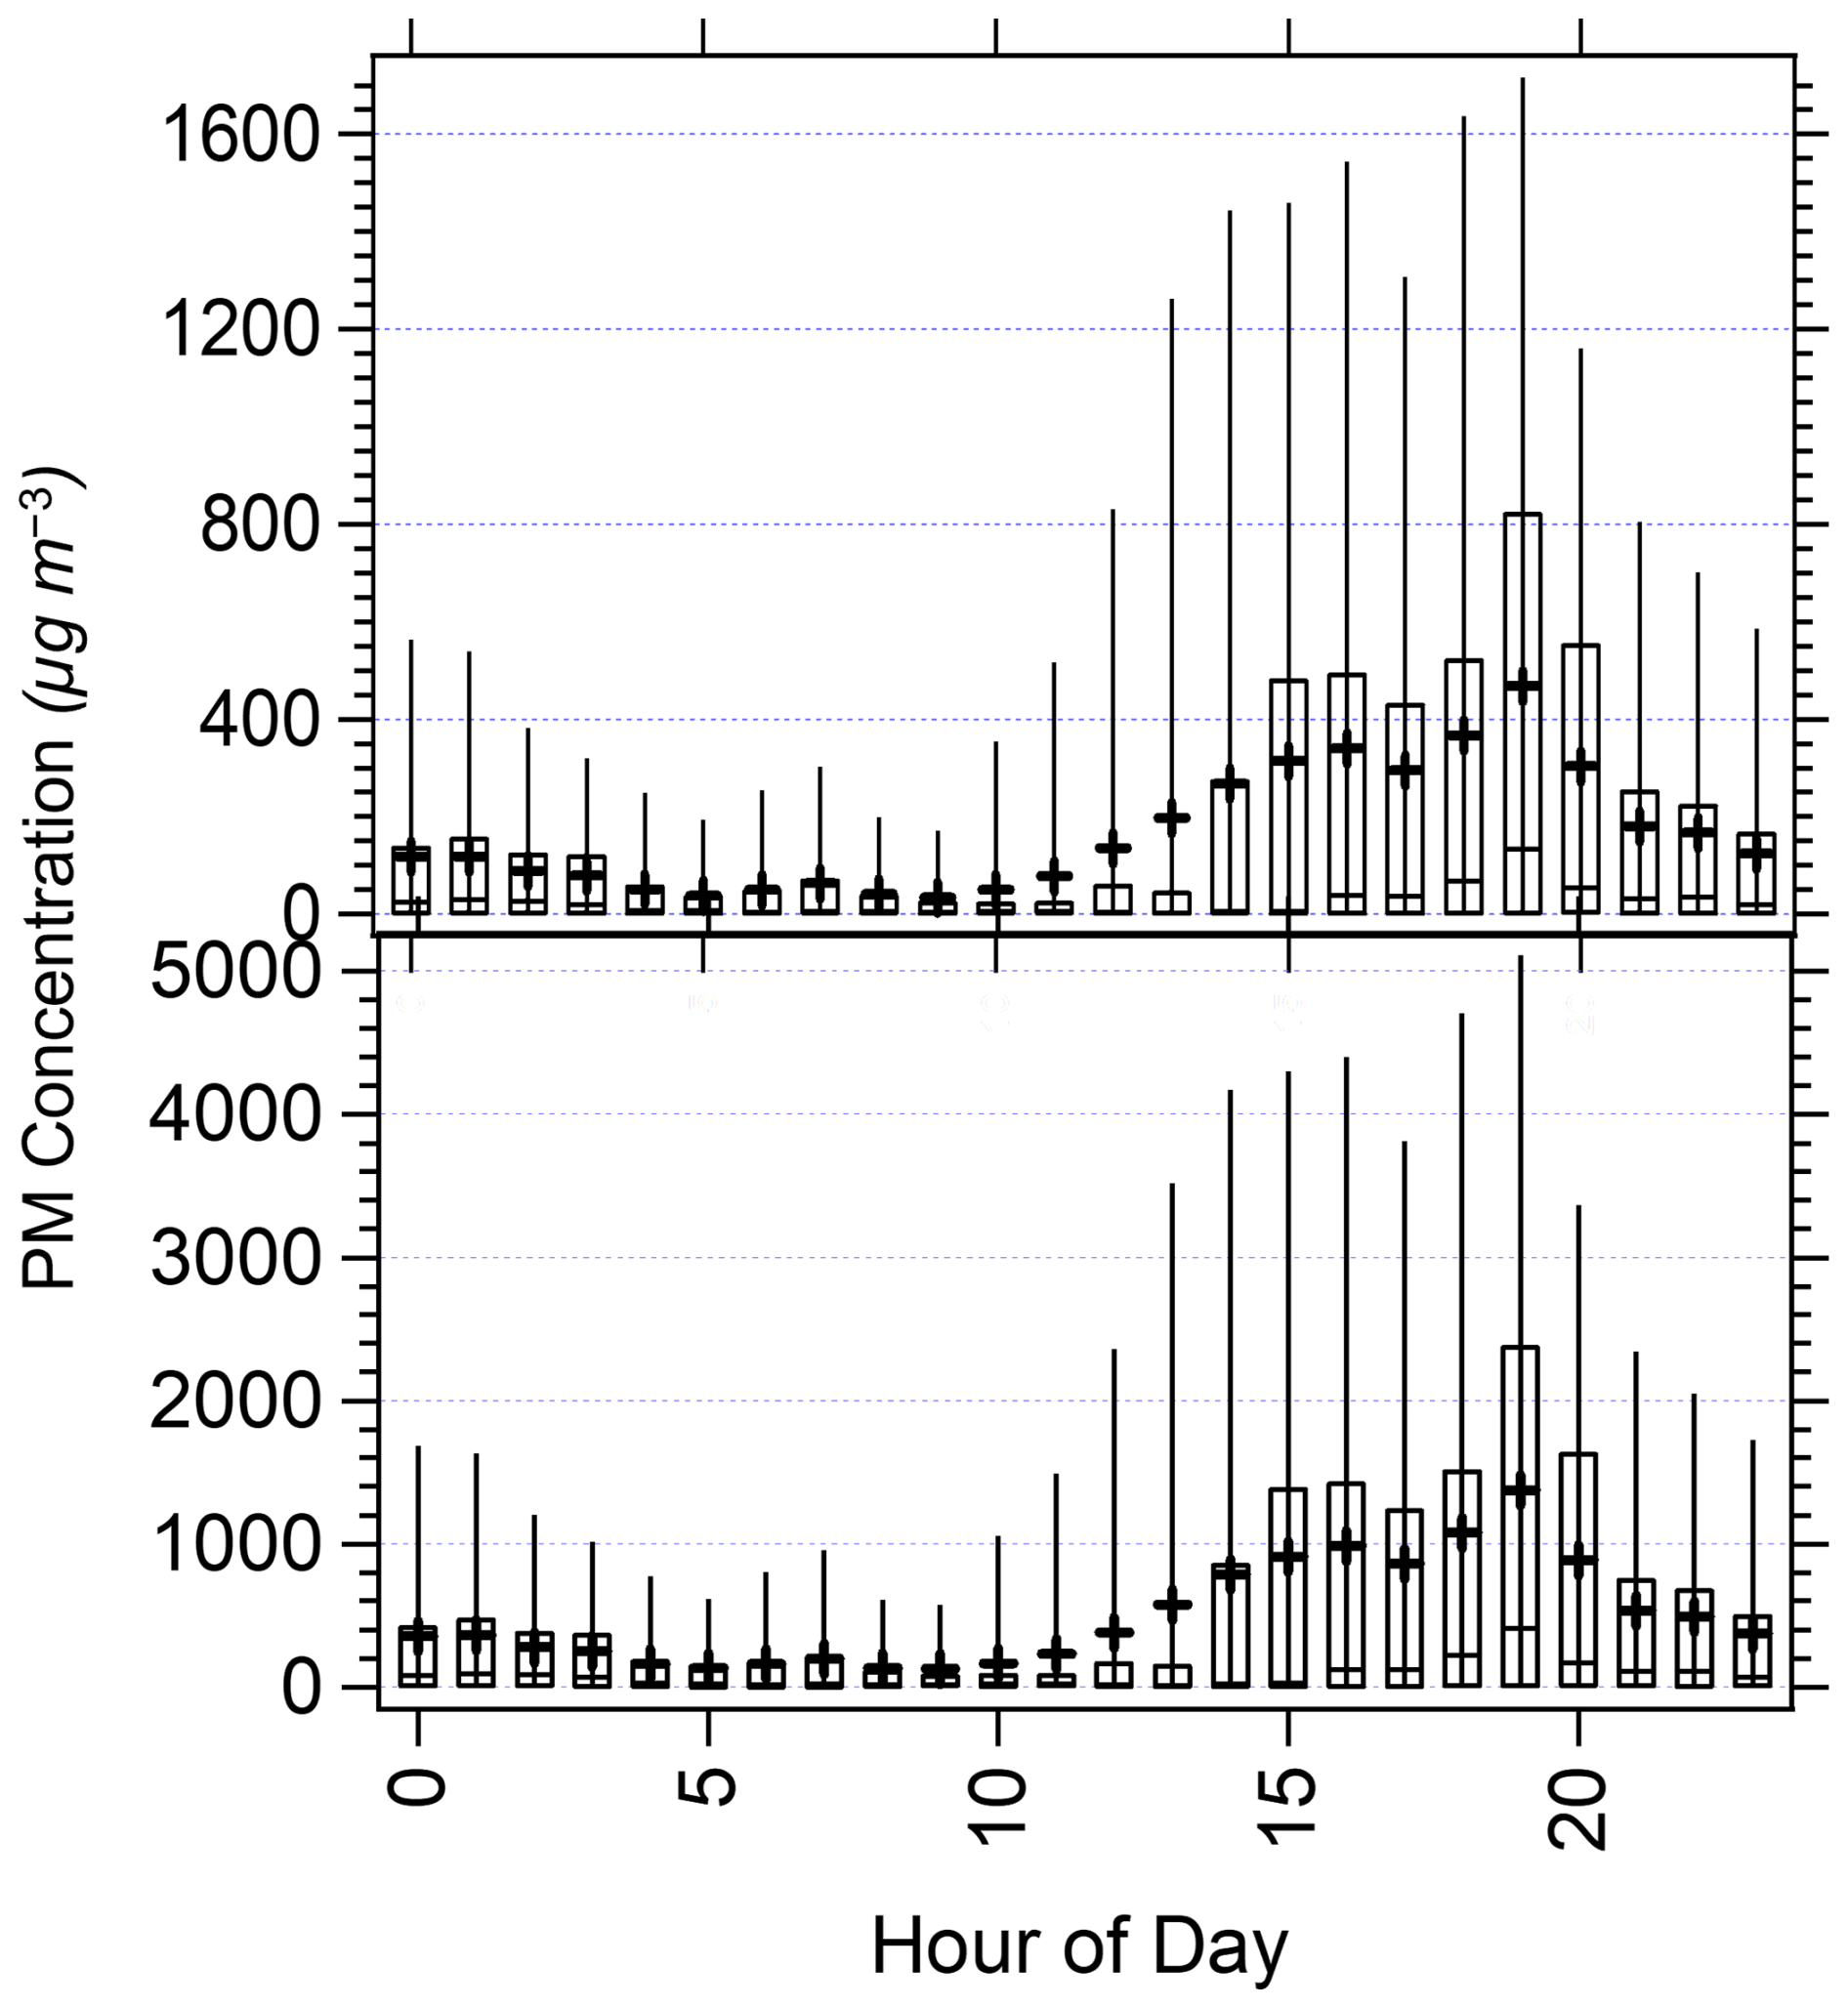
Figure 6Hourly diurnal variation in PM10 and PM2.5 concentrations. Black crosses indicate the mean, while the center line of each box indicates the median, with each box edge indicating the 25 and 75 percentile ranges. Whiskers indicate the 5 and 95 percentile ranges.
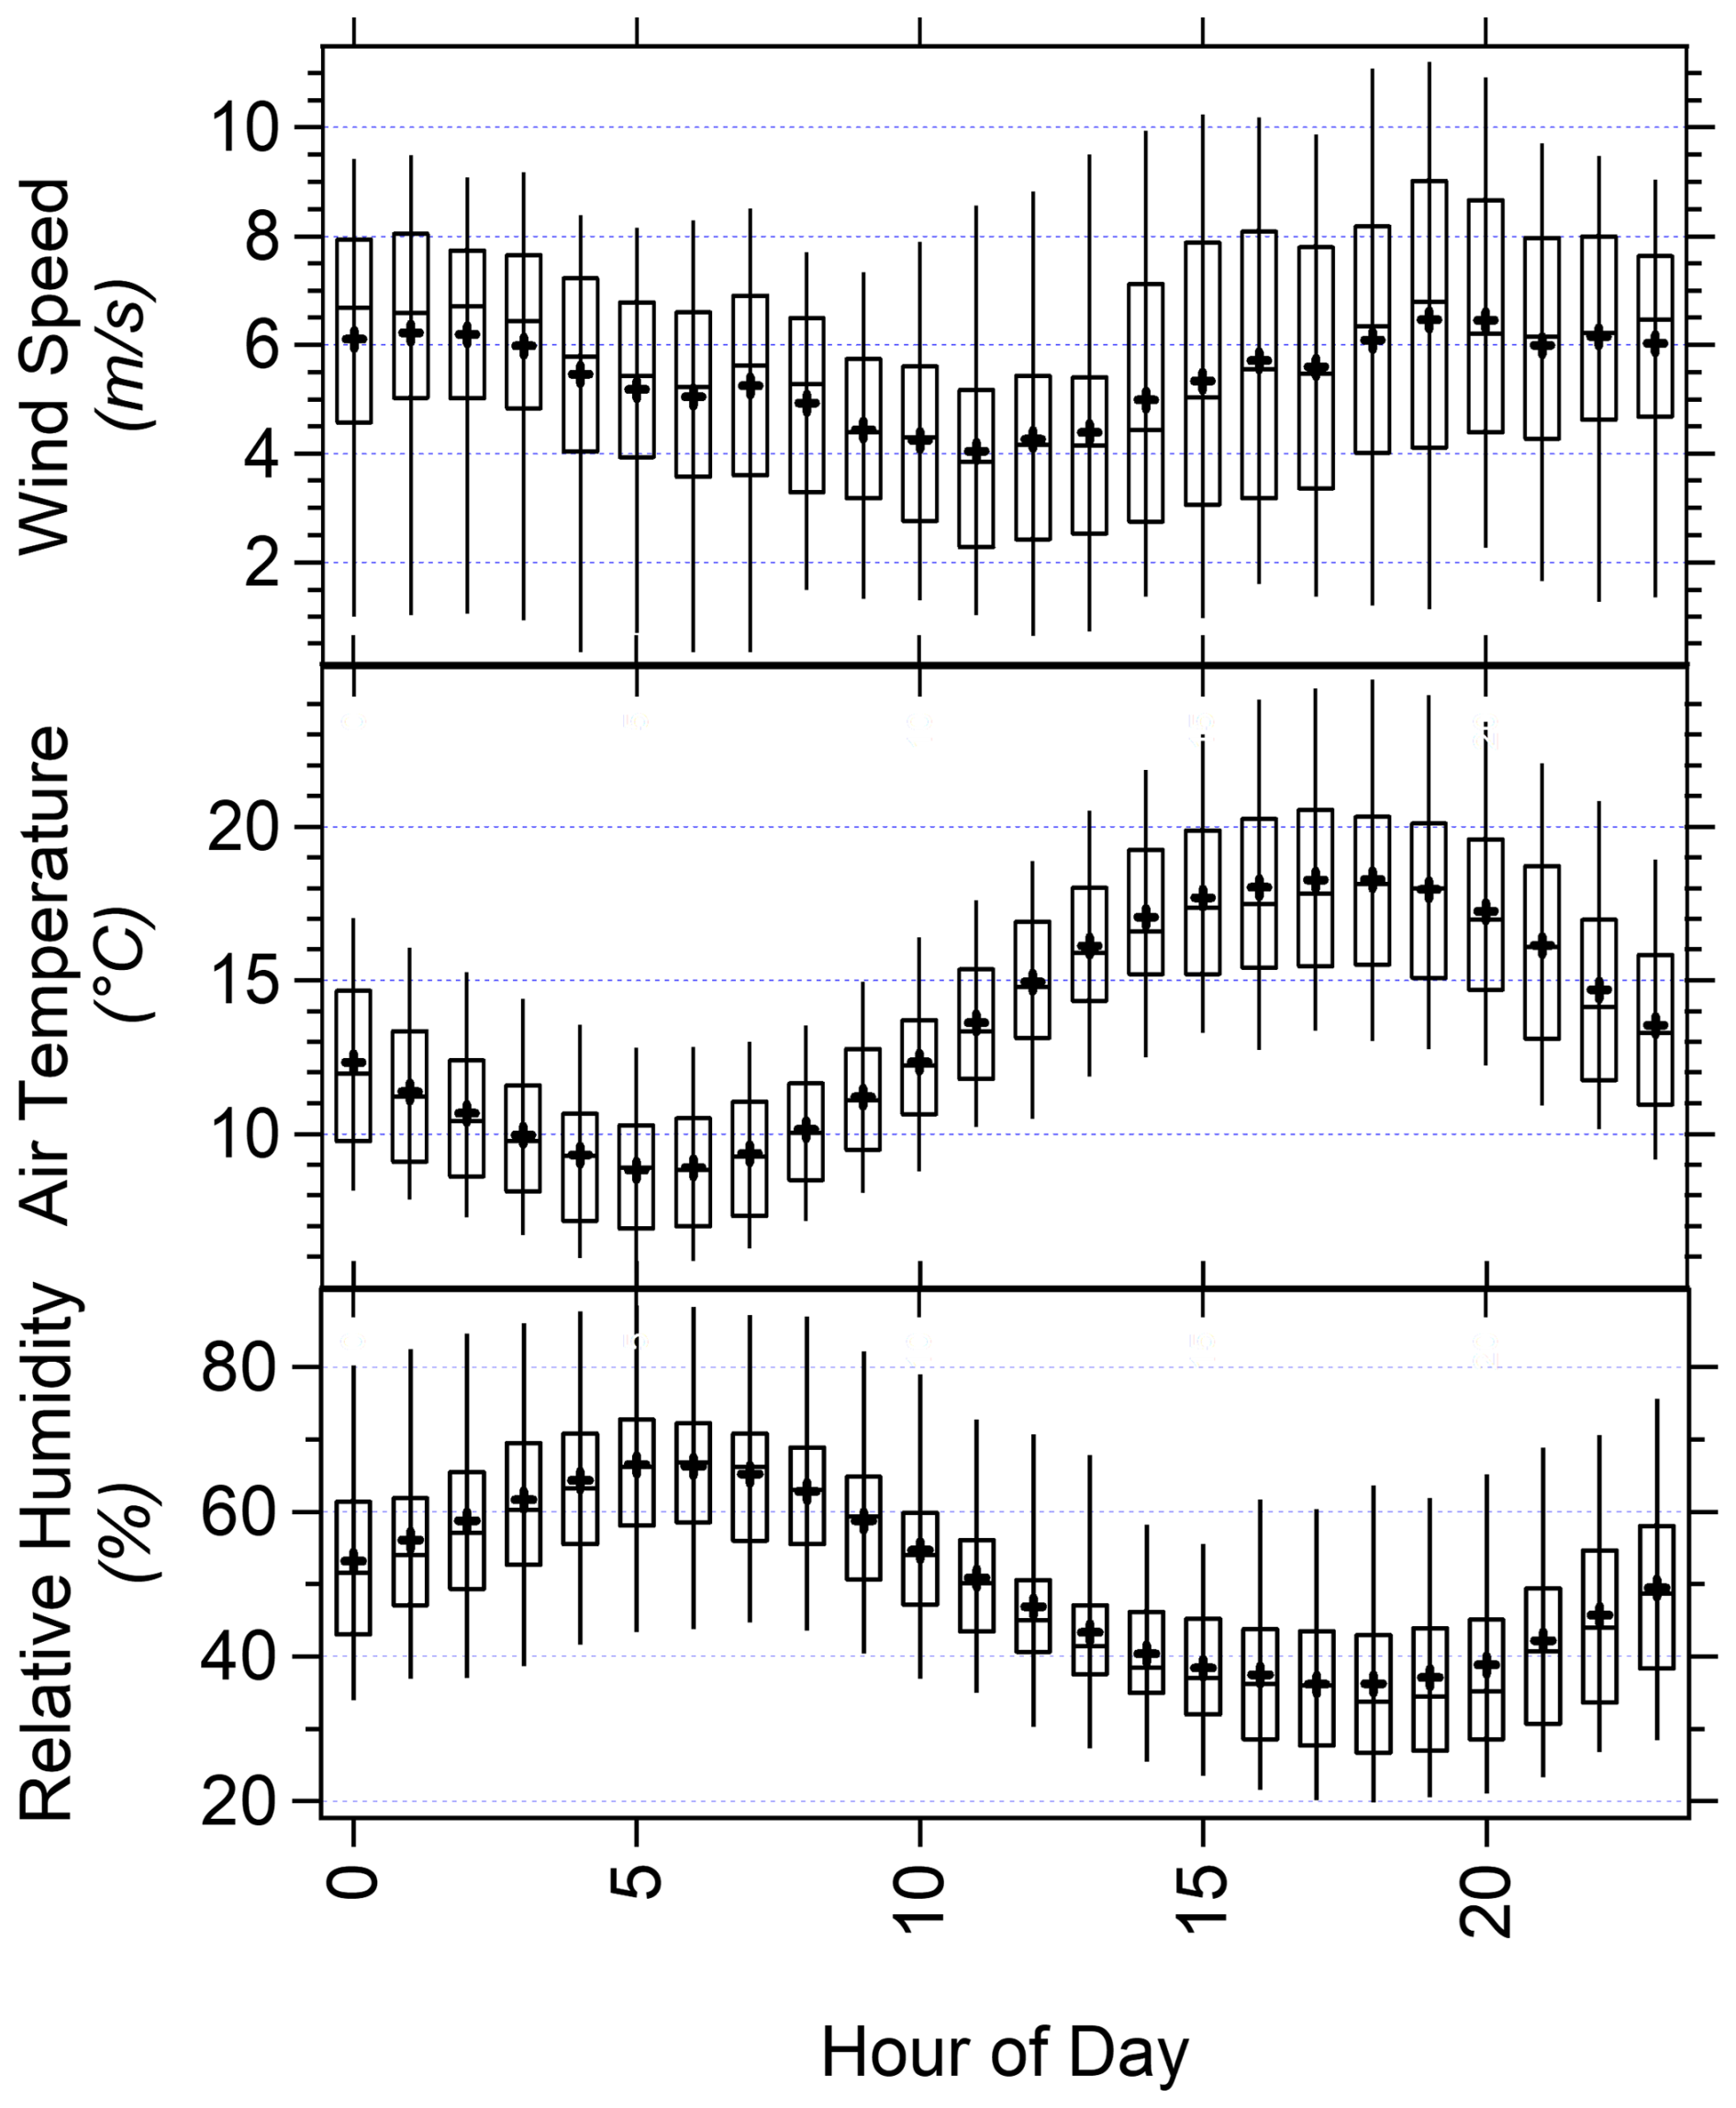
Figure 7Hourly diurnal variation in wind speed, air temperature, and relative humidity. Black crosses indicate the mean, while the center of each box indicates the median, with each box edge indicating the 25 and 75 percentile ranges. Whiskers indicate the 5 and 95 percentile ranges. Meteorological factors were measured the campaign between 2 June and 12 July 2021.
The number, surface area, and volume distribution of the mineral dust measured during the campaign by the OPCs is depicted in Fig. 8 and summarized in Table 1. The mean diameter for the particle number distribution of 1.43 µm is comparable to, yet slightly smaller than, the 1.69 µm reported for an Icelandic mineral dust event where a similar method was employed (Dagsson-Waldhauserova et al., 2014). While Dupont et al. (2024) do not report comparative moments of the OPC-derived size distributions in their flux work, comparable features arise upon inspection as the number distributions also exhibit bi-modality, with a mode in the 0.3–0.6 µm range, and a second mode centered around 2 µm for measurements collected at 2.7 m from the ground (Dupont et al., 2024). As shown by Fig. S4, the average size characteristics of the dust did not differ substantially when compared to that for the top 10th percentile of dust concentrations during the campaign. Mean particle diameters obtained from the Coulter Counter analysis were somewhat smaller compared to the OPC, when constraining both techniques to the size ranges they have in common (0.6–10 µm), Fig. 9 and Table 2. As discussed, the assumption of sphericity does not have a straightforward, directional effect on the assumed particle size of mineral dust when measured with OPC (Collins et al., 2000; Knippertz and Stuut, 2014). The compositional difference of mineral dust compared to the polystyrene latex spheres (PLS) used to calibrate the OPC is not expected to make a substantial difference either, as the refractive index of PLS is within the range of refractive indices for the clay minerals largely composing this fraction, which is between 1.47 and 1.68 (Bachelder et al., 2020; Mukherjee, 2013; Smart and Willis, 1967). Alternatively, the mineral dust particles may contain some soluble material, which is dissolved in the electrolyte solution during the Coulter Counter analysis leading to a low bias in the particle size measurements. In fact, it was previously surmised that the PM10 mineral dust particles in this Valley were largely comprised of silt-sized clay mineral aggregates (Bachelder et al., 2020). It is therefore possible that these aggregates disaggregate upon introduction to the electrolyte solution used for Could Counter analysis, resulting in the perceived shift in size distribution. The measured particle size distribution is coarser than that measured at the same location and height above the ground in 2018 by Bachelder et al, whose OPC results yield a particle mass distribution with a mean diameter of 3.17 µm and a variance of 4.18 µm2 (Bachelder et al., 2020). This could be due to the depletion of finer material in the sediment over the years between campaigns. Despite recent interest in high-latitude dust, direct field-based measurements of size distributions remain scarce, with some examples existing for Icelandic dust (Dupont et al., 2024). The size distributions of source sediments for Icelandic mineral dust have been studied previously as well (Butwin et al., 2020; González-Romero et al., 2024). Mineral dusts derived from snow pack and ice core samples in Greenland, Iceland, and Antarctica have illuminated historical dust properties, including size distribution and composition (Komuro et al., 2024; Albani et al., 2012; Aarons et al., 2017). Icelandic dust size distributions have also been studied by way of balloon-deployed OPC instruments to achieve extensive vertical profiling (Dagsson-Waldhauserova et al., 2019). A similar approach has been taken towards arctic aerosols in the Svalbard archipelago (Porter et al., 2020). Arctic aerosol size distributions measured in Svalbard have received sizable attention in the research community (Moroni et al., 2017; Lai et al., 2025; Rinaldi et al., 2021), and to some extent those measured in Canada as well (Vicente-Luis et al., 2021). While these studies investigate mineral dust as a portion of the mixture of high-latitude aerosols, the present study stands as one of the only in-situ measurements of a high-latitude mineral dust source near ground level.
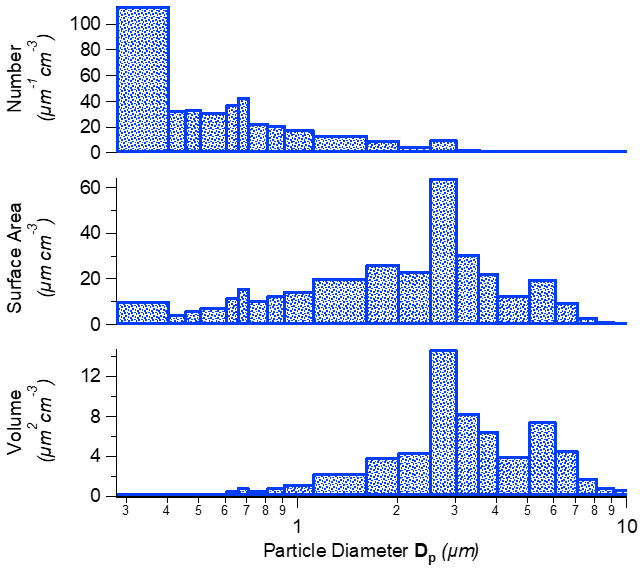
Figure 8Aerosol number, surface, and volume distributions measured at Down Valley site in ’A’ą̈y Chù’ Valley using OPC at 3.3 m above ground level. Values are normalized to bin width.
Table 1Moments of the size distributions of PM measured by OPC at 3.3 m above ground during Kluane 2021 Campaign.
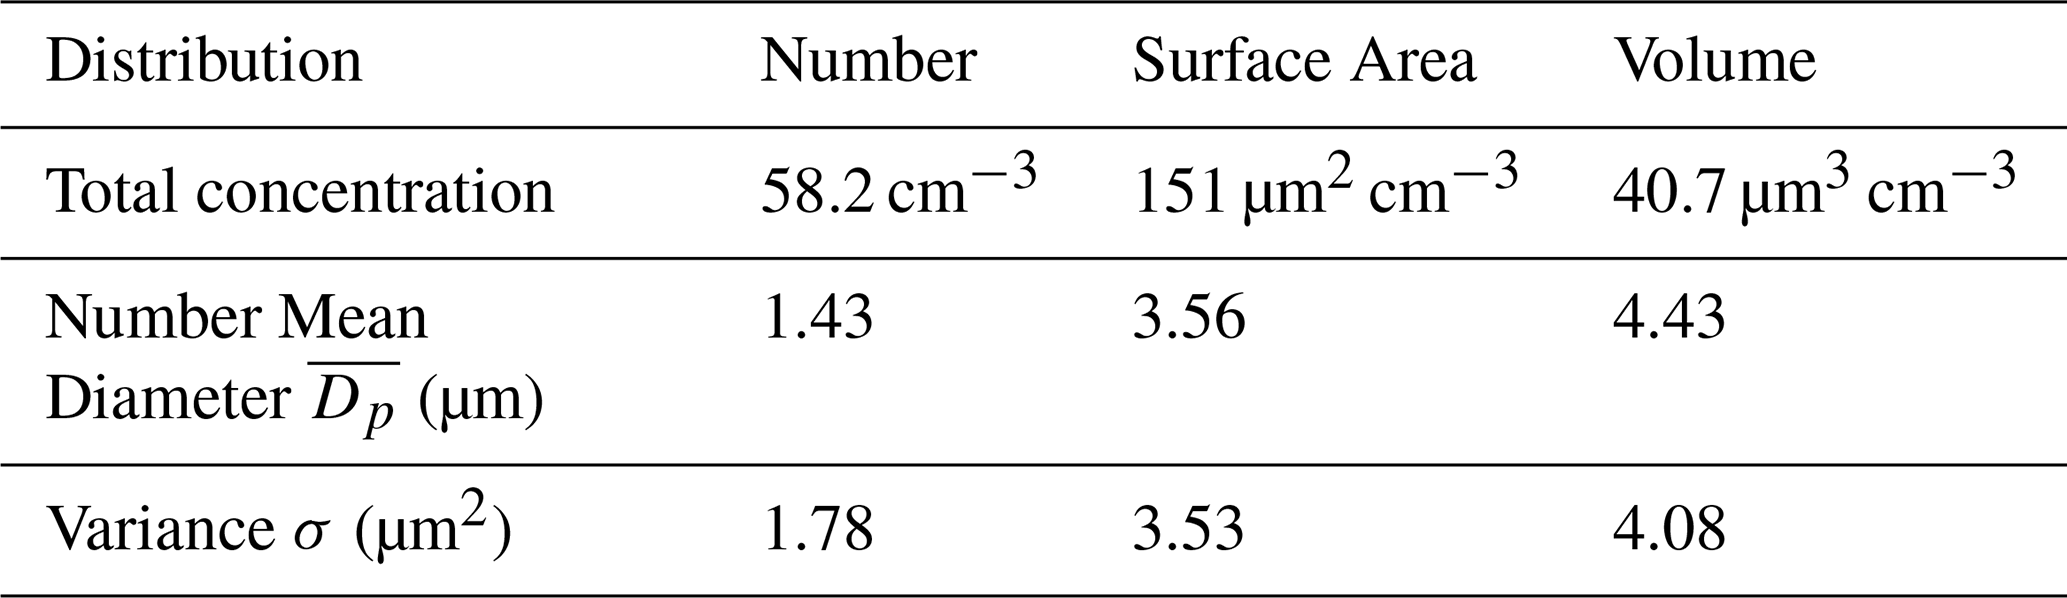
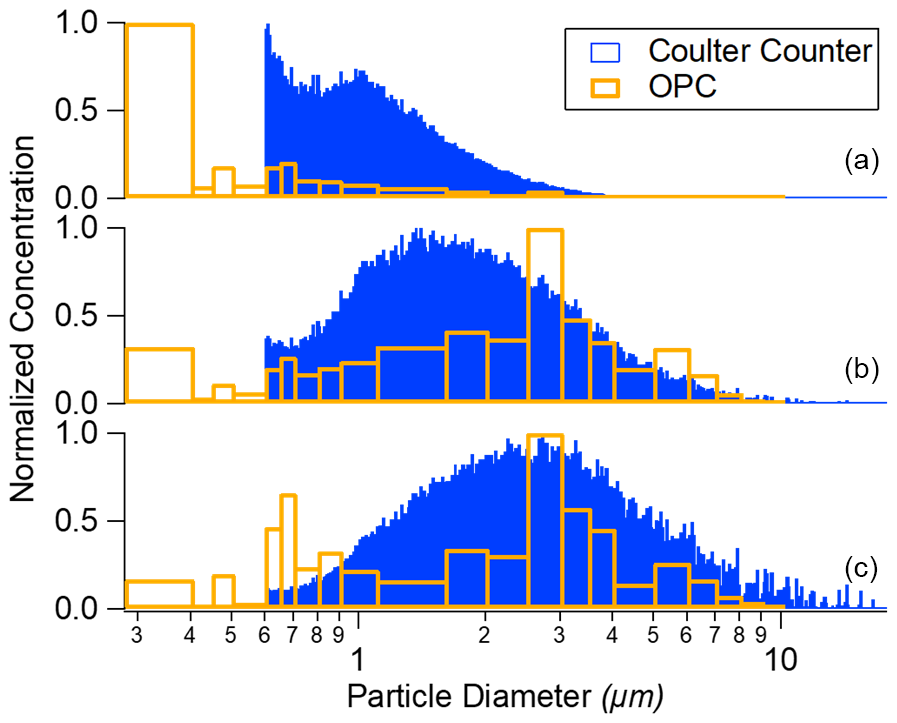
Figure 9Normalized (a) number, (b) surface area, and (c) volume concentration distributions measured simultaneously at Down Valley site in ’A’ą̈y Chù’ Valley using OPC and with Coulter Counter at 3.3 m above ground, normalized to bin widths.
Table 2Comparing moments of particle size distributions measured by the OPC and Coulter Counter during Kluane 2021 campaign for full range and common range of each method.
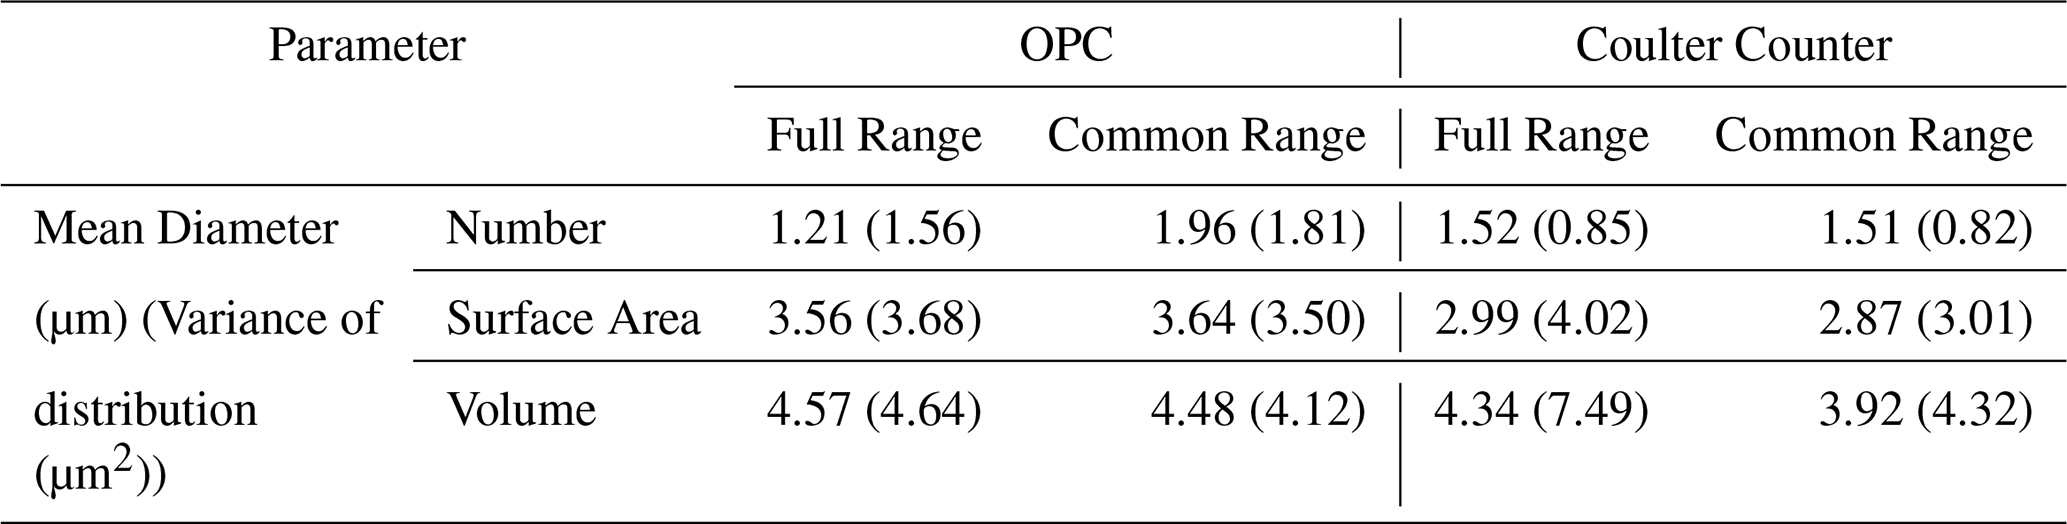
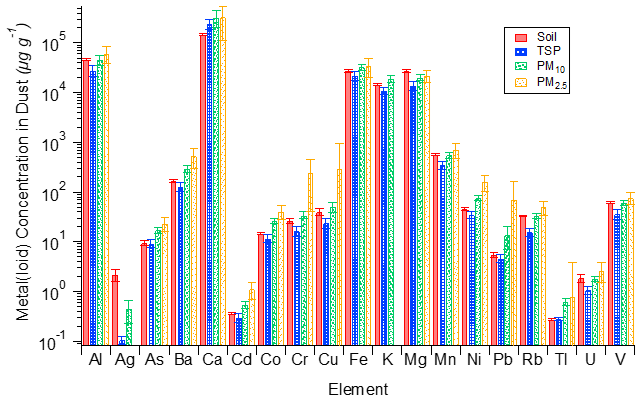
Figure 10Average metal(loid) concentrations measured in soil and mineral dust PM collected during 2021 Kluane campaign with associated standard uncertainty at 95 % confidence.
3.3 Elemental Concentrations
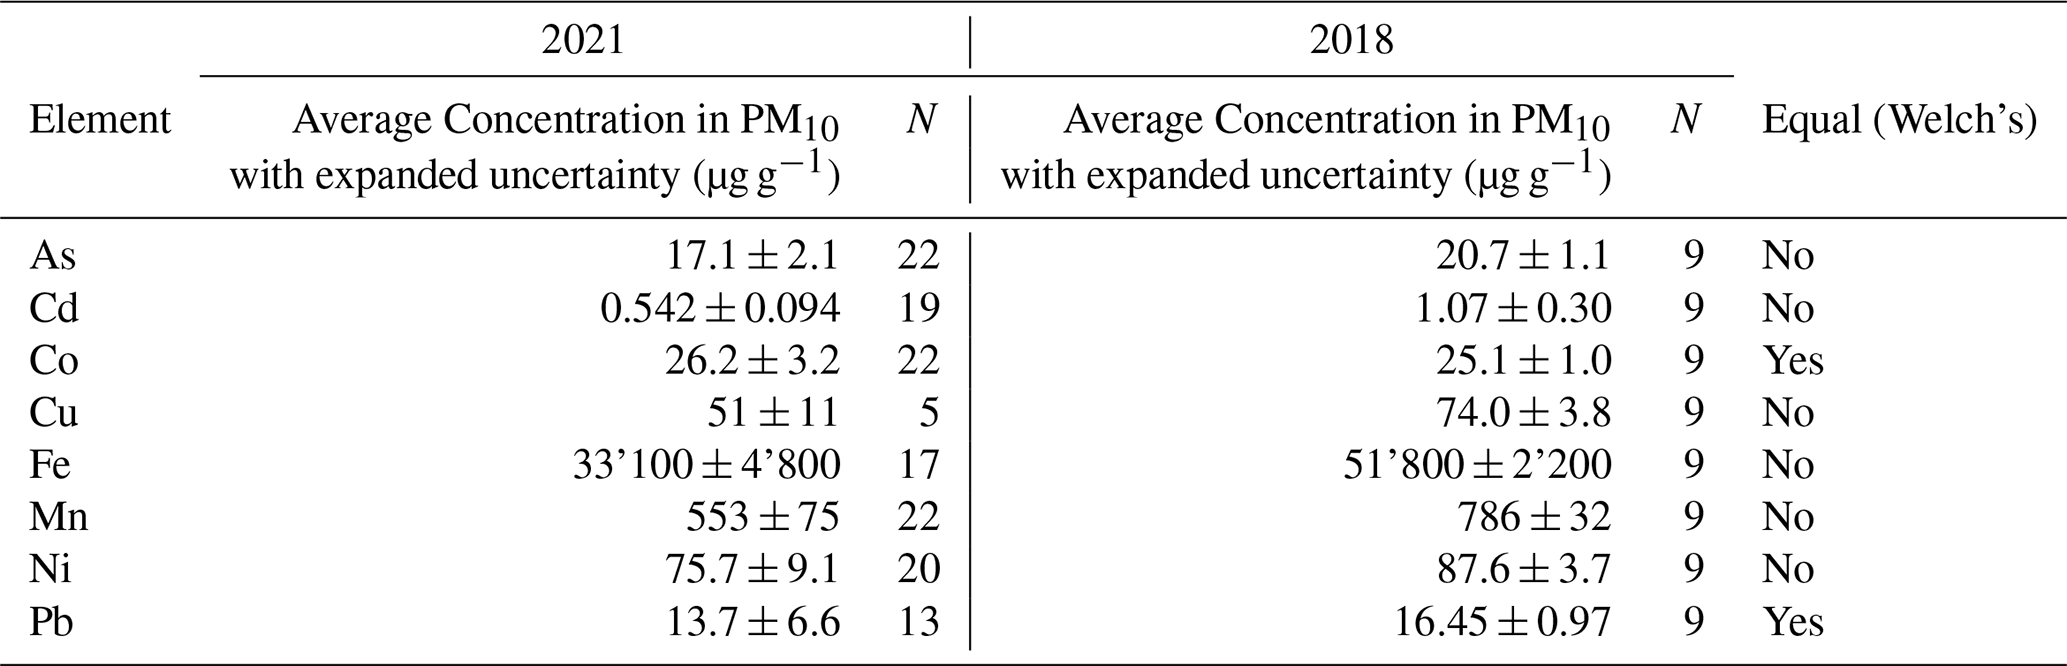
A subset of the collected filter samples with the greatest PM masses for each size class were used to determine the mass concentration of several metal and metalloids present in the mineral dust by ICP-MS. The mass concentrations of various metal(loid)s in the mineral dust of the ’A’ą̈y Chù’ Valley had been previously determined for the PM10 size class in a previous study (Bachelder et al., 2020). This previous analysis covered As, Cd, Co, Cs, Cu, Mn, Ni, and Pb in PM10, as well as in source material, both bulk and fine (less than 53 µm particle diameter) soil. Notably, this previous work found that the determined metal(loid) concentrations increased with finer grain sizes from bulk to fine soil, to PM10. In the present work, we have further investigated this trend by comparing three PM size classes (TSP, PM10, and PM2.5) along with bulk parent soil, and by expanding the number of elements analyzed. The trend of increasing trace element concentrations with decreasing size fraction is observed for many elements in samples collected during this campaign, Fig. 10. The enrichment of elements in the PM10 and PM2.5 size classes relative to the TSP and parent soil are summarized in Table 3, where enrichment in this case is the ratio of the concentration of a given element by mass in one size fraction to that of another size fraction. A clear trend of enrichment emerges in comparing the PM10 size fraction to TSP, where significant enrichment is noted for Al, Ag, As, Ba, Cd, Co, Cr, Cu, Fe, K, Mg, Mn, Ni, Pb, Rb, Tl, U, and V. This trend is maintained for all elements when comparing PM2.5 to TSP, except for Ag, Cu, Fe, Pb, and Tl, largely due to uncertainties being higher with fewer PM2.5 sample results. Further enrichment is noted between the PM2.5 and PM10 size fractions for Cd, Co, Cr, and Ni, indicating substantial compositional differences between these size classes that are considered respirable. Interesting trends emerge when considering the PM size fractions and the parent soil composition, as select elements, Ag and Mg, exhibit significant depletion (i.e., being less concentrated in PM2.5 and PM10 relative to the soil). Furthermore, some PM10 elements that showed enrichment compared to TSP do not do so in comparison to the parent soil. This could be due to spatial inhomogeneity of the bulk glacial sediment compared to the more uniform mixing of suspended material by winds. As soil sampling was conducted near the DV Site, it is possible that “hot spots” of certain elements may be present in the soil sampled, due to the specific minerals present at a given location. A more spatially broad compositional study of the sediment along the length of the valley would help explore this possibility. It is known that glacial sediments can be compositionally inhomogeneous along their glacial trajectory, owing to the different types of bedrock material that would undergo comminution in different locations (Rencz and Shilts, 1980). Otherwise, many elements exhibit enrichment like when compared against the TSP size fraction. The enrichment of metal(loid)s with finer grain sizes is consistent with findings made in the field of glacial till prospecting for mining purposes, which analyzes fine sediments resulting from glacial comminution processes to aid in the identification of mineral sources (Shilts, 1993). Shilts (1993) observed that in glacial sediments, many trace metal(loid)s increase substantially in concentration with finer size fractions, with the highest concentrations found in the primarily clay-sized fraction of <4 µm (Shilts, 1984a). This previous work proposed that these elements are present within the structure of phyllosilicates or scavenged by secondary oxides. Both phases occur preferentially among particles finer than about 10 µm, which could explain the enrichment observed for metal(loid)s in the fine dust size fractions here. It is also suspected that weathering processes play a role in the enhancement of metal(loid) concentrations. Labile minerals, such as sulphides, are weathered within and below the postglacial solum, which is the surface or subsoil layers that have undergone the same soil-forming conditions following a glaciation event. This weathering is accompanied by an increase in metal(loid) concentration in the clay-sized fraction near the surface. This fraction possesses a high specific surface area and a high ion exchange capacity, and is capable of adsorbing and incorporating liberated metal(loid)s from surrounding sources (Shilts, 1993). This enrichment effect should be taken into consideration when assessing the potential health effects from respirable mineral dust due to metal(loid) exposure. In comparing metal(loid) concentration results in PM10 with those determined by Bachelder et al. in 2018 at the same location and taking care to account for differences in recovery of the methods used, performing Welch's t-tests to 95 % confidence between the datasets reveals that the dust analyzed in the present study contains significantly less As, Cd, Cu, Fe, Mn, and Ni on a per-mass basis, Table 4. The PM10 analyzed in the present study contained between 14 % and 49 % less of these elements, while both studies yielded similar results for Co, around 25–26 µg g−1. Pb appeared somewhat depleted but did not yield a significant difference. The relative depletion of these elements over the three-year period between the field studies may be related to the observed difference in particle size distribution noted above, Fig. 11. As discussed, the finer fractions of mineral dust contain greater concentrations of many metal(loid)s. Due to the greater mobility of the finer particles, it is therefore possible that the dust has become coarser and less abundant in clay-sized minerals compared to 2018 resulting in the lower observed concentrations of trace elements. As noted in Shilts (1993), the content of metal(loid)s in glacial till is greatest below the 4 µm diameter. Correspondingly, 50.1 % of the volume distribution of PM10 measured in this campaign falls below this value compared to 81.4 % of the distribution measured in the 2018 campaign. Furthermore, recent single-particle ICP-MS work has revealed that sub-micron mineral dust particles at the Down Valley site are largely dominated by Fe, suggesting that Fe-containing particles are more susceptible to erosion, which is consistent with the relatively large decrease in Fe concentration between 2018 and 2021 (Tardif et al., 2025).
Table 3Metal(loid) enrichment by mass concentration in ’A’ą̈y Chù’ Valley mineral dust fine fractions relative to parent soil and Total Suspended Particle (TSP) size class, with associated propagated uncertainty at 95 % confidence.
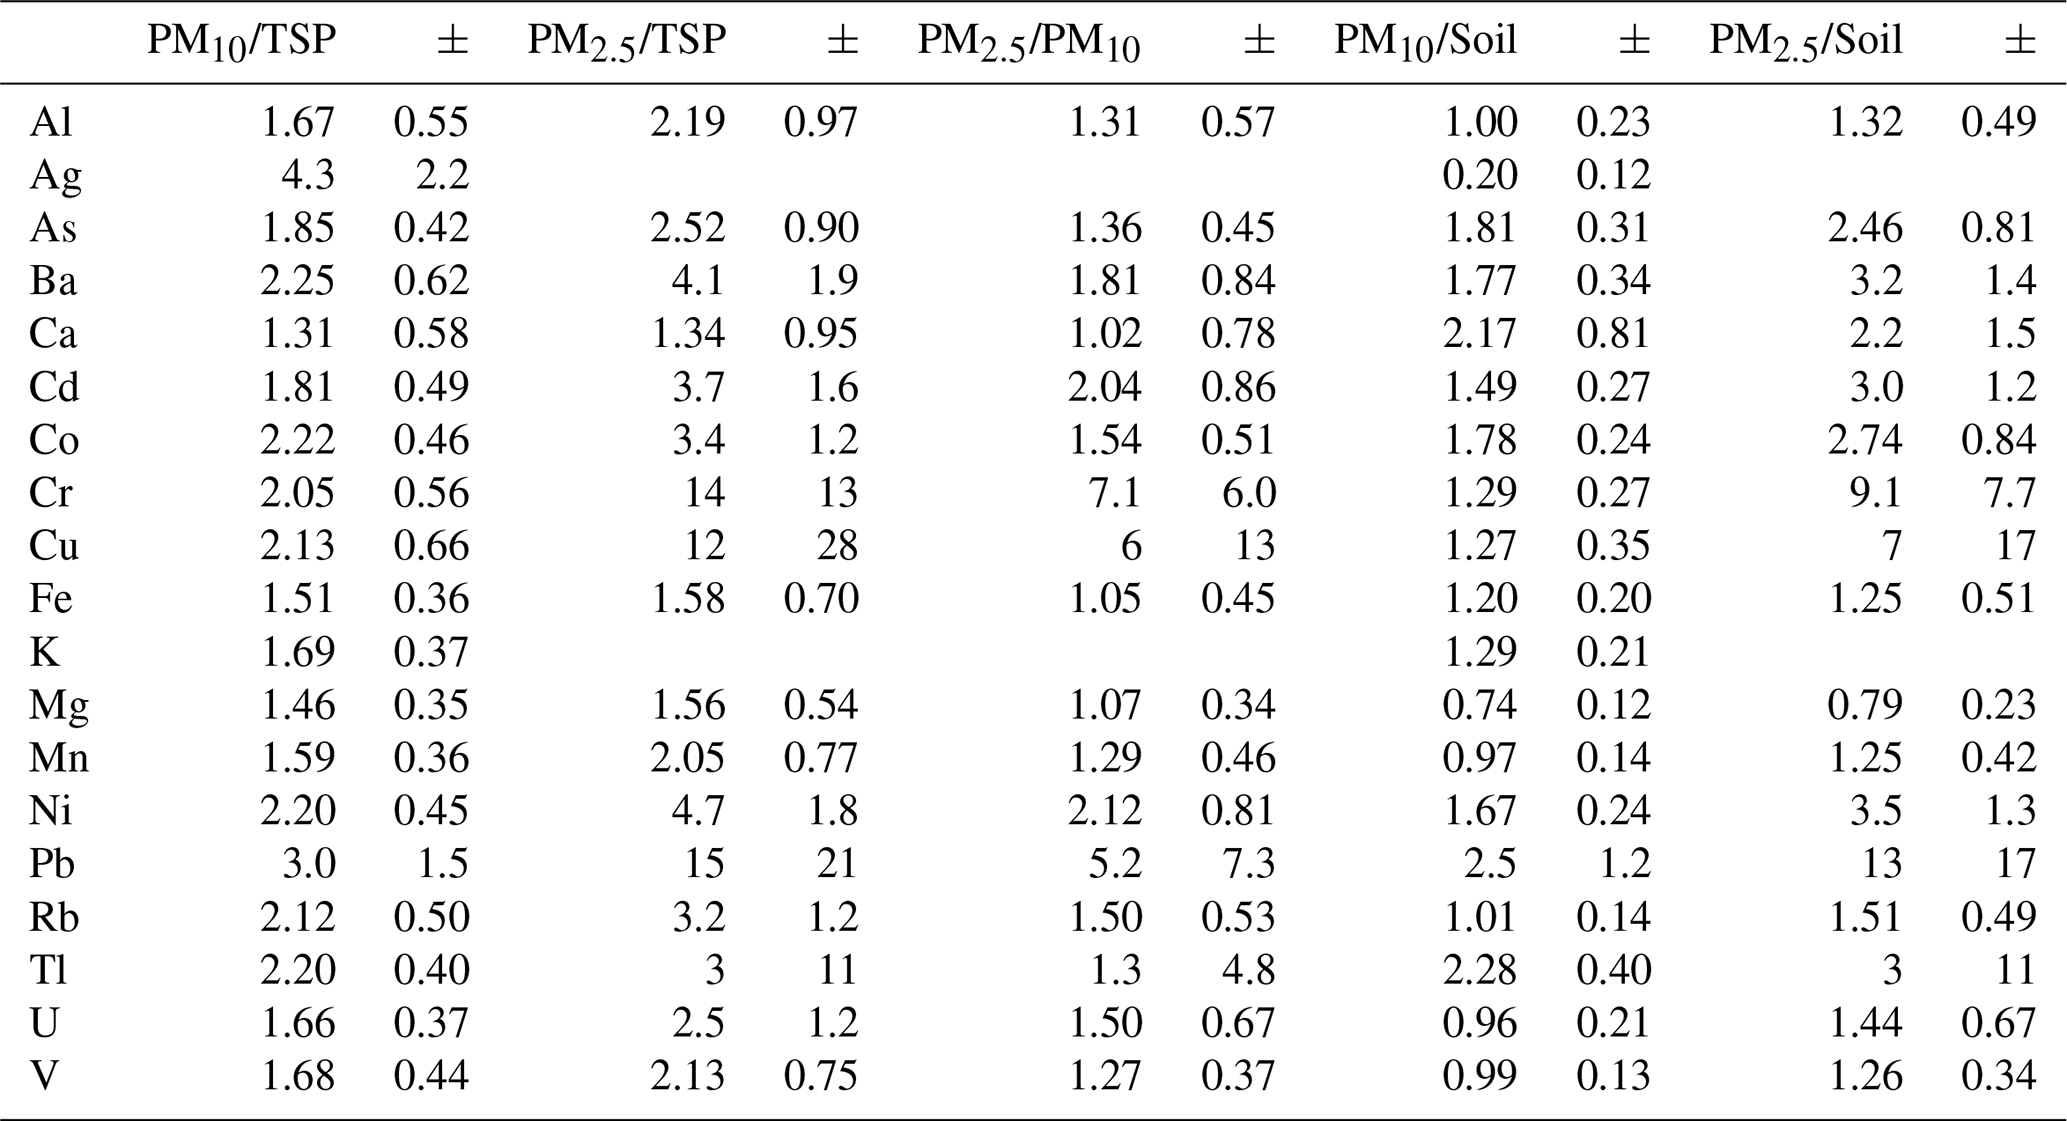
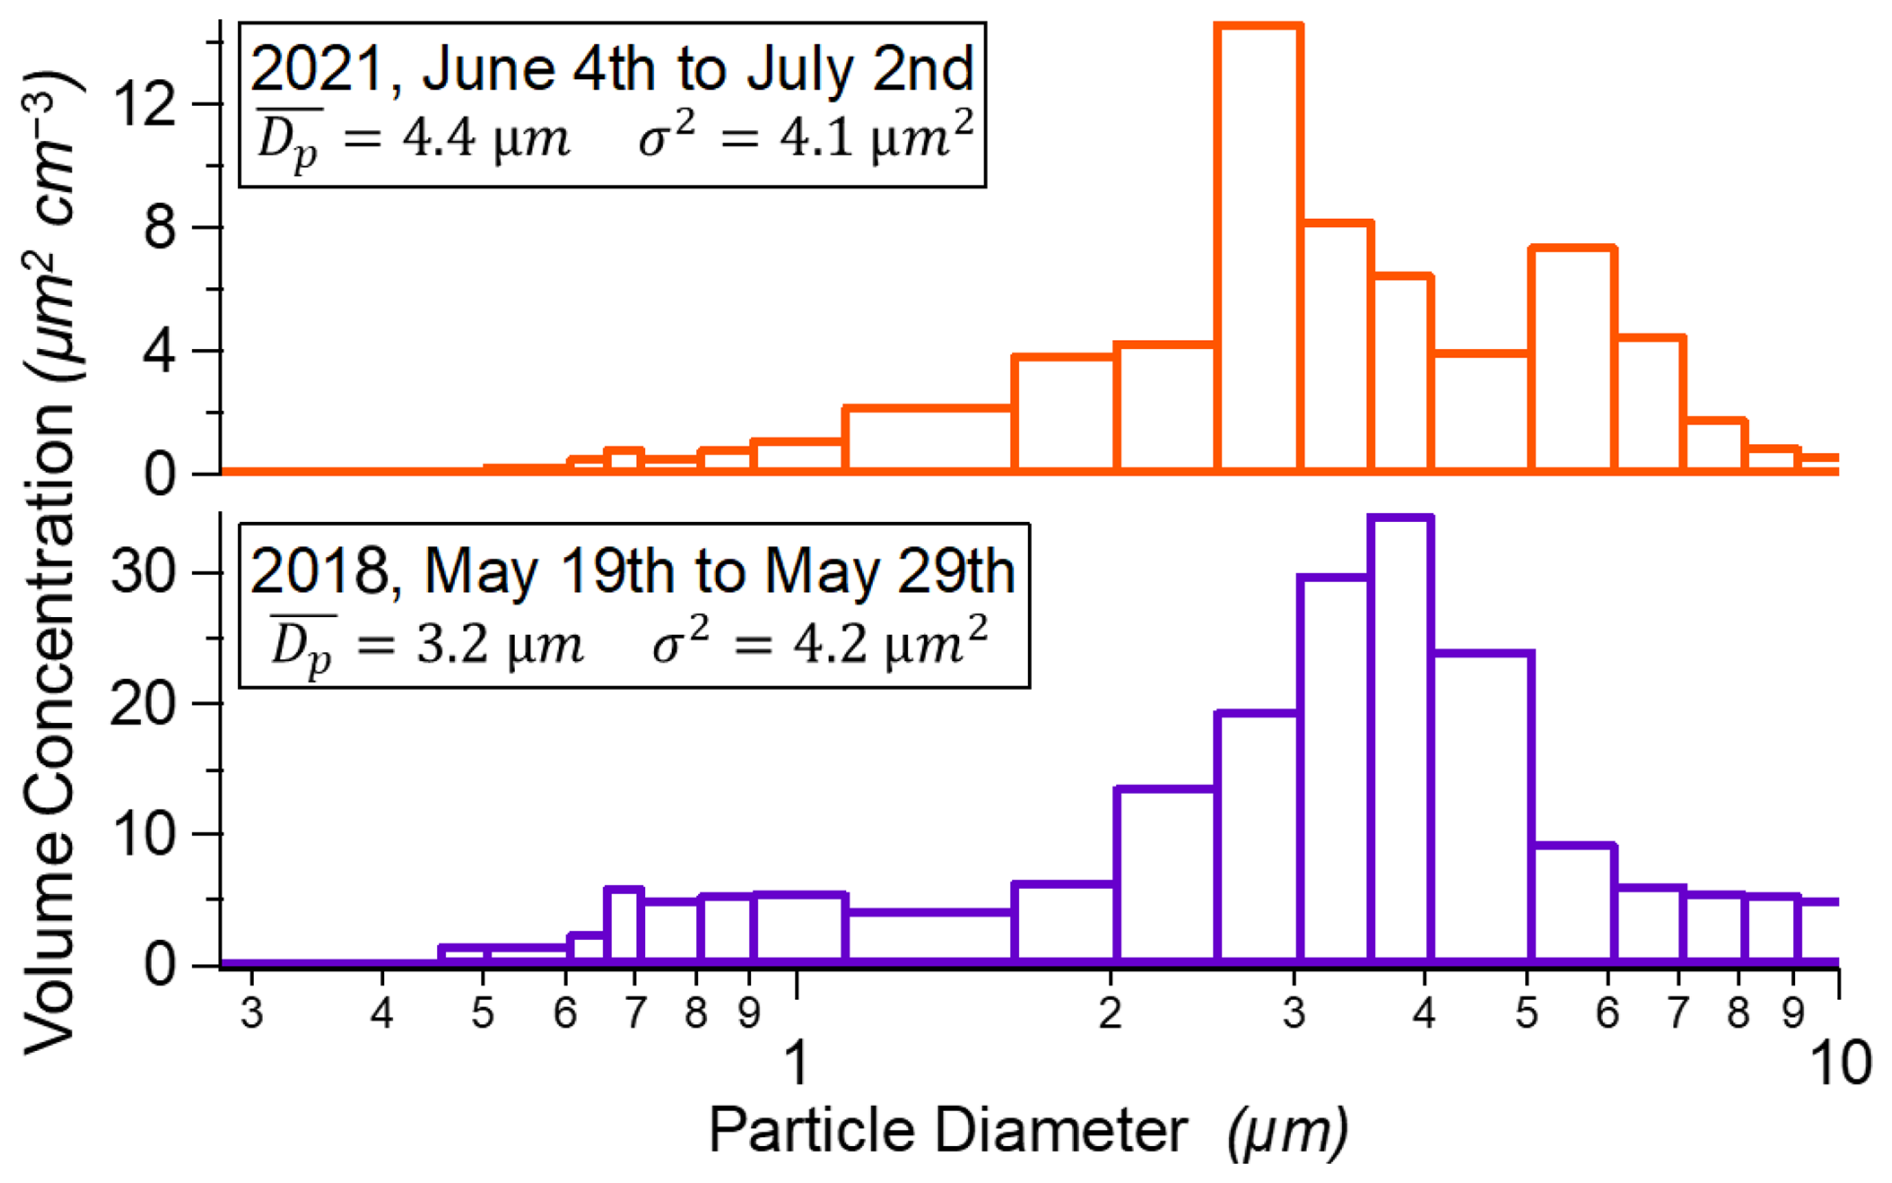
Figure 11Bin width-normalized particle volume distribution comparisons of Kluane mineral dust between 2021 and 2018 at 3.3 and 3.5 m above the ground, respectively. 2018 distribution adapted from Bachelder et al. (2020).
Table 4Average concentrations of elements in Kluane mineral dust PM10 with expanded uncertainty to 95 % confidence comparison between present 2021 campaign and previous 2018 campaign (Bachelder et al., 2020).
Metal(loid) concentrations in air are presented for each applicable sample in the manuscript assets (Downey, 2025c). The Yukon has 8 h and 15 min exposure limits for various metals in air as part of their Workplace Health Regulations (Yukon Regulations, 1986), and to our knowledge, does not have similar standards for ambient air on a 24 h basis. Therefore, standards established by the Province of Ontario Ministry of the Environment are used for comparison on a 24 h basis (Human Toxicology and Air Standards Section, 2020). Ambient exposure to several metals in air exceeded the Ontario Ministry of the Environment standards multiple times throughout the campaign, for TSP (As, Co, Cr, Fe, Mn, Ni, V), PM10 (Fe, Mn), and PM2.5 (Fe, Mn). The bio-accessibility of these metal(loid)s relative to other common respirable PM types would be an important factor to consider, as the entire metal(loid) content likely does not fully dissolve in lung fluid before expulsion via bodily pathways (Kastury et al., 2017; Olumayede et al., 2021). Determining the bioaccessibility of metal(loid)s in respirable PM is an active area of research, with a dominant method still not fully established (Kastury et al., 2018).
It is important to note that the sampling location is right at the dust source, so these results represent the associated maxima. The concentrations of PM and associated metal(loid)s decreases with distance from the valley. Therefore, a study of the horizontal gradients of the metal(loid) concentrations in the region would be beneficial for understanding the potential health impacts on the public. While the study here is descriptive of one proglacial valley, the results hold far-reaching implications in the context of mineral dust emissions from mountainous regions in other high-latitude locations. For example, over 27 000 glaciers comprising an area of 86 723 km2 are found in the surrounding mountain ranges of Alaska and northwestern Canada (Kienholz et al., 2015). Glacial loss in northwestern North America due to climate change will likely lead to further morphological and hydrological changes within decades (Clarke et al., 2015; Clague and Shugar, 2023). The accompanying changes to meltwater discharge and sediment loading and the resulting effects on existing outwash plains will likely modify aeolian processes, causing the emergence of mineral dust sources as observed here (Bullard, 2013).
Metal and metalloid content in PM is known to modulate the impact it has on air quality, as respiration of some metals at elevated concentrations may lead to negative health outcomes (Chen et al., 2023; Badaloni et al., 2017; Liu et al., 2025). Furthermore, PM2.5 has a measurably greater impact on health on a per-mass basis than PM10, and in turn PM10 has a greater impact than TSP, given the progressively greater propensity to penetrate deeply into the respiratory tract. The results presented here suggest that mineral dust in the PM2.5 and PM10 size class possess greater metal(loid) concentrations on a per-mass basis, further contributing to their potential health effects upon respiration. For instance, the concentration of Cd in PM10 was 1.81 ± 0.49 times higher than that present in the TSP size fraction, and that of PM2.5 was 2.04 ± 0.86 times higher than in the PM10 size fraction. A similar trend was noted for several other metals that are known to be problematic in PM exposure, such as Pb, Mn, and Cr (Liu et al., 2025). In contrast, these enhancements were not observed, or were relatively small, for some major elements (e.g., Mg, Ca, and Fe). This could be due to glacial comminution leading to the production of fine glacial sediment material that is rich in the clay-sized particle fraction that is known to possess metallic enrichments, and which is more susceptible to aeolian erosion that produces PM10 and PM2.5. Thus, such sources present a compounded risk for human health effects associated with dust exposure. With the relatively recent emergence of this particular dust source in the Kluane region, and the likelihood of similar glacial sediment dust sources emerging in other high-latitude locations by similar mechanisms of glacial recession due to climate change (IPCC, 2021), attention must be paid to the potential for local populations to be exposed to elevated metal(loid) concentrations in ambient air. This region in particular is home to the Champagne, Aishihik, and Kluane First Nations (Neufeld, 1972), who are impacted by the local dust emissions as well as other environmental impacts of climate change, which is more rapid in northern regions.
The size distribution properties of the mineral dust were characterized in this study using online OPC and offline Coulter Counting techniques for validation and comparison purposes. The volume distribution of the dust measured using the OPC yielded a mean diameter of 4.48 µm, with a variance of 4.12 µm2, while that measured by the Coulter Counter was 3.92 µm with a variance of 4.32 µm2, calculated using the common ranges of the instruments. The two methods provide similar results with respect to the mean diameter, with the slightly smaller diameter determined by the Couter Counter being attributable to the disaggregation of particles when they are dispersed in the electrolyte solution before analysis. The size distribution measured in this campaign was coarser than that also measured by OPC in 2018, which corresponds with the decrease in metal(loid) concentrations in the dust between these campaigns. With ground-based in-situ measurements of high-latitude mineral dust being scarce, more results are needed for broader comparison and characterization of these properties for these regions of emerging importance. Attention should be paid in future work to directly report common size distribution properties, such as mean and median diameters and variances of number, surface area, and volume distributions, to allow for meaningful intercomparisons and efficient integration with models. A more detailed study of the extent of these mineral dust emissions, whether by means of modelling or additional sampling campaigns, would be obtain a broader understanding of high-latitude mineral dust size and compositional properties. Additionally, identifying proglacial valleys in other regions where glacial recession is occurring and conducting field campaigns with similar goals would help affirm the findings contained here.
Data corresponding to this manuscript has been included herein or is available at FAIR-aligned data repository Borealis: https://doi.org/10.5683/SP3/1WHR3P (Downey, 2025a); https://doi.org/10.5683/SP3/FKSRWL (Downey, 2025b); https://doi.org/10.5683/SP3/Y4CTDC (Downey, 2025c). The authors are willing to provide additional information for data that may be of interest to readers upon request.
The supplement related to this article is available online at https://doi.org/10.5194/acp-26-1321-2026-supplement.
PLH and JK supervised this project and provided resources. ARD, JK and PLH administered funding acquisition. ARD, DB, JK, PLH contributed to project conceptualization and campaign planning, with ARD developing the methodology. ARD and DB conducted the field investigation. ARD and AD performed the formal analysis and data validation. ARD prepared the figures and wrote the initial manuscript draft. All authors contributed to manuscript revisions.
The contact author has declared that none of the authors has any competing interests.
Publisher’s note: Copernicus Publications remains neutral with regard to jurisdictional claims made in the text, published maps, institutional affiliations, or any other geographical representation in this paper. While Copernicus Publications makes every effort to include appropriate place names, the final responsibility lies with the authors. Views expressed in the text are those of the authors and do not necessarily reflect the views of the publisher.
ARD acknowledges scholarships from the Centre de recherche en écotoxicologie du Québec (EcotoQ), a strategic cluster funded by the Fonds de recherche du Québec – Nature et technologies. ARD also acknowledges logistical and equipment support from Dr. Kevin Wilkinson and Madjid Hadioui for the ICP-MS analysis. ARD and DB acknowledge the hospitality and service provided by the Outpost Research Station. We acknowledge that the sample collection in this work was done on the traditional territories of the Kluane First Nation and the Champagne and Aishihik First Nations, as well as on the White River First Nation territories, with their permissions obtained through a sampling permit (21-35S&E) as required by the Yukon. We also acknowledge Parks Canada for providing permissions for sampling in the Kluane National Park and Reserve (permit KLU-2021-38964).
This research has been supported by the Natural Sciences and Engineering Research Council of Canada (grant nos. RGPIN-05002-2014 and RGPIN-2016-05417), the Canada Foundation for Innovation Leaders Opportunity Fund Projects 32277 and 36564, and the Polar Knowledge Canada (Northern Scientific Training Program). Research funding was also provided by the Canadian Mountain Network, a Canadian Government Network of Centers of Excellence (PV 143493-NCE).
This paper was edited by Markus Ammann and reviewed by Ian Burke and Pavla Dagsson Waldhauserova.
Aarons, S. M., Aciego, S. M., Arendt, C. A., Blakowski, M. A., Steigmeyer, A., Gabrielli, P., Sierra-Hernández, M. R., Beaudon, E., Delmonte, B., Baccolo, G., May, N. W., and Pratt, K. A.: Dust composition changes from Taylor Glacier (East Antarctica) during the last glacial-interglacial transition: A multi-proxy approach, Quaternary Science Reviews, 162, 60–71, https://doi.org/10.1016/j.quascirev.2017.03.011, 2017.
Albani, S., Mahowald, N. M., Delmonte, B., Maggi, V., and Winckler, G.: Comparing modeled and observed changes in mineral dust transport and deposition to Antarctica between the Last Glacial Maximum and current climates, Climate Dynamics, 38, 1731–1755, https://doi.org/10.1007/s00382-011-1139-5, 2012.
Ali, M. U., Liu, G., Yousaf, B., Ullah, H., Abbas, Q., and Munir, M. A. M.: A systematic review on global pollution status of particulate matter-associated potential toxic elements and health perspectives in urban environment, Environmental Geochemistry and Health, 41, 1131–1162, https://doi.org/10.1007/s10653-018-0203-z, 2019.
Bachelder, J., Cadieux, M., Liu-Kang, C., Lambert, P., Filoche, A., Galhardi, J. A., Hadioui, M., Chaput, A., Bastien-Thibault, M.-P., and Wilkinson, K. J.: Chemical and microphysical properties of wind-blown dust near an actively retreating glacier in Yukon, Canada, Aerosol Science and Technology, 54, 2–20, https://doi.org/10.1080/02786826.2019.1676394, 2020.
Badaloni, C., Cesaroni, G., Cerza, F., Davoli, M., Brunekreef, B., and Forastiere, F.: Effects of long-term exposure to particulate matter and metal components on mortality in the Rome longitudinal study, Environment international, 109, 146–154, https://doi.org/10.1016/j.envint.2017.09.005, 2017.
Barr, S. L., Wyld, B., McQuaid, J. B., Neely III, R. R., and Murray, B. J.: Southern Alaska as a source of atmospheric mineral dust and ice-nucleating particles, Science Advances, 9, eadg3708, https://doi.org/10.1126/sciadv.adg3708, 2023.
Beck, H. E., Zimmermann, N. E., McVicar, T. R., Vergopolan, N., Berg, A., and Wood, E. F.: Present and future Köppen-Geiger climate classification maps at 1-km resolution, Scientific data, 5, 1–12, https://doi.org/10.1038/sdata.2018.214, 2018.
Bellamy, D., King, J., and Nadeau, D. F.: Mineral dust emissions from proglacial valleys of western Canada: Historical and future dynamics, Earth Surface Processes and Landforms, 50, e70069, https://doi.org/10.1002/esp.70069, 2025a.
Bellamy, D., Nadeau, D. F., and King, J.: Forcing Mechanisms of Strong Surface Winds in a Dust Storm–Prone, High-Latitude Proglacial Valley, Journal of Applied Meteorology and Climatology, 64, 77–97, https://doi.org/10.1175/JAMC-D-24-0044.1, 2025b.
Boy, M., Thomson, E. S., Acosta Navarro, J.-C., Arnalds, O., Batchvarova, E., Bäck, J., Berninger, F., Bilde, M., Brasseur, Z., Dagsson-Waldhauserova, P., Castarède, D., Dalirian, M., de Leeuw, G., Dragosics, M., Duplissy, E.-M., Duplissy, J., Ekman, A. M. L., Fang, K., Gallet, J.-C., Glasius, M., Gryning, S.-E., Grythe, H., Hansson, H.-C., Hansson, M., Isaksson, E., Iversen, T., Jonsdottir, I., Kasurinen, V., Kirkevåg, A., Korhola, A., Krejci, R., Kristjansson, J. E., Lappalainen, H. K., Lauri, A., Leppäranta, M., Lihavainen, H., Makkonen, R., Massling, A., Meinander, O., Nilsson, E. D., Olafsson, H., Pettersson, J. B. C., Prisle, N. L., Riipinen, I., Roldin, P., Ruppel, M., Salter, M., Sand, M., Seland, Ø., Seppä, H., Skov, H., Soares, J., Stohl, A., Ström, J., Svensson, J., Swietlicki, E., Tabakova, K., Thorsteinsson, T., Virkkula, A., Weyhenmeyer, G. A., Wu, Y., Zieger, P., and Kulmala, M.: Interactions between the atmosphere, cryosphere, and ecosystems at northern high latitudes, Atmos. Chem. Phys., 19, 2015–2061, https://doi.org/10.5194/acp-19-2015-2019, 2019.
Bullard, J. E.: Contemporary glacigenic inputs to the dust cycle, Earth Surface Processes and Landforms, 38, 71–89, https://doi.org/10.1002/esp.3315, 2013.
Butwin, M. K., Pfeffer, M. A., von Löwis, S., Storen, E. W. N., Bali, E., and Thorsteinsson, T.: Properties of dust source material and volcanic ash in Iceland, Sedimentology, 67, 3067–3087, https://doi.org/10.1111/sed.12734, 2020.
Canadell, J. G., Monteiro, P. M., Costa, M. H., Da Cunha, L. C., Cox, P. M., Eliseev, A. V., Henson, S., Ishii, M., Jaccard, S., and Koven, C.: Global carbon and other biogeochemical cycles and feedbacks, IPCC AR6 WGI, final government distribution, chap. 5, https://doi.org/10.1017/9781009157896.007, 2021.
Chen, J. and Hoek, G.: Long-term exposure to PM and all-cause and cause-specific mortality: a systematic review and meta-analysis, Environment International, 143, 105974, https://doi.org/10.1016/j.envint.2020.105974, 2020.
Chen, L. C. and Lippmann, M.: Effects of metals within ambient air particulate matter (PM) on human health, Inhalation Toxicology, 21, 1–31, https://doi.org/10.1080/08958370802105405, 2009.
Chen, M. and Ma, L. Q.: Comparison of three aqua regia digestion methods for twenty Florida soils, Soil science society of America Journal, 65, 491–499, https://doi.org/10.2136/sssaj2001.652491x, 2001.
Chen, Y. Q., Ge, C. X., Liu, Z. K., Xu, H. Z., Zhang, X., and Shen, T.: Characteristics, sources and health risk assessment of trace metals and polycyclic aromatic hydrocarbons in PM2.5 from Hefei, China, Environmental Geochemistry and Health, 45, https://doi.org/10.1007/s10653-023-01638-0, 2023.
Clague, J. J. and Shugar, D. H.: Impacts of Loss of Cryosphere in the High Mountains of Northwest North America, Quaternary, 6, https://doi.org/10.3390/quat6010001, 2023.
Clarke, G. K. C., Jarosch, A. H., Anslow, F. S., Radic, V., and Menounos, B.: Projected deglaciation of western Canada in the twenty-first century, Nature Geoscience, 8, 372–377, https://doi.org/10.1038/ngeo2407, 2015.
Collins, D., Johnsson, H., Seinfeld, J., Flagan, R., Gasso, S., Hegg, D., Russell, P., Schmid, B., Livingston, J., and Öström, E.: In situ aerosol-size distributions and clear-column radiative closure during ACE-2, Tellus B, 52, 498–525, https://doi.org/10.1034/j.1600-0889.2000.00008.x, 2000.
Dagsson-Waldhauserova, P., Arnalds, O., Olafsson, H., Skrabalova, L., Sigurdardottir, G. M., Branis, M., Hladil, J., Skala, R., Navratil, T., Chadimova, L., Menar, S. V. O., Thorsteinsson, T., Carlsen, H. K., and Jonsdottir, I.: Physical properties of suspended dust during moist and low wind conditions in Iceland, Icelandic Agricultural Sciences, 27, 25–39, 2014.
Dagsson-Waldhauserova, P., Renard, J.-B., Olafsson, H., Vignelles, D., Berthet, G., Verdier, N., and Duverger, V.: Vertical distribution of aerosols in dust storms during the Arctic winter, Scientific Reports, 9, 16122, https://doi.org/10.1038/s41598-019-51764-y, 2019.
Dang, C., Brandt, R. E., and Warren, S. G.: Parameterizations for narrowband and broadband albedo of pure snow and snow containing mineral dust and black carbon, Journal of Geophysical Research: Atmospheres, 120, 5446–5468, https://doi.org/10.1002/2014JD022646, 2015.
Davies, R.: Particle size analysis, Industrial & Engineering Chemistry, 62, 87–93, https://doi.org/10.1021/ie50732a011, 1970.
Denton, G. H. and Stuiver, M.: Neoglacial chronology, northeastern Saint Elias Mountains, Canada, American Journal of Science, 264, 577–599, https://doi.org/10.2475/ajs.264.8.577, 1966.
Denton, G. H. and Stuiver, M.: Late Pleistocene glacial stratigraphy and chronology, northeastern St Elias Mountains, Yukon Territory, Canada, Geological Society of America Bulletin, 78, 485–510, https://doi.org/10.1130/0016-7606(1967)78[485:LPGSAC]2.0.CO;2, 1967.
Downey, A.: Diurnal Statistics for Temperature, Relative Humidity, Wind Speed, PM10, and PM2.5 Concentrations at ’A’ą̈y Chù’ Valley in Kluane National Park, Yukon, Canada for June 2021, Borealis [data set], https://doi.org/10.5683/SP3/1WHR3P, 2025a.
Downey, A.: Raw Optical Particle Counter (OPC) Data for 3.3 and 6.3 meters off ground in ’A’ą̈y Chù’ Valley in Yukon, Canada Late Spring Early Summer 2021, Borealis [data set], https://doi.org/10.5683/SP3/FKSRWL, 2025b.
Downey, A.: Concentrations of Select Metals and Metalloids in Air in ’A’ą̈y Chù’ Valley Mineral Dust Spring/Summer 2021, Borealis [data set], https://doi.org/10.5683/SP3/Y4CTDC, 2025c.
Dupont, S., Klose, M., Irvine, M. R., González-Flórez, C., Alastuey, A., Bonnefond, J.-M., Dagsson-Waldhauserova, P., Gonzalez-Romero, A., Hussein, T., Lamaud, E., Meyer, H., Panta, A., Querol, X., Schepanski, K., Vergara Palacio, S., Wieser, A., Yus-Díez, J., Kandler, K., and Pérez García-Pando, C.: Impact of Dust Source Patchiness on the Existence of a Constant Dust Flux Layer During Aeolian Erosion Events, Journal of Geophysical Research: Atmospheres, 129, e2023JD040657, https://doi.org/10.1029/2023JD040657, 2024.
Fang, Y.: Heterogeneous Chemistry of Atmospheric Organic Acids and Other Organic Compounds with Oxide Surfaces Representative of Mineral Dust and Indoor Surfaces, PhD thesis, University of California, San Diego, United States – California, 252 pp., https://escholarship.org/content/qt4wn282rd/qt4wn282rd_noSplash_05d441d2bef197784ed4cd4e9ca4a604.pdf (last access: 12 December 2025), 2018.
Flanner, M. G., Zender, C. S., Hess, P. G., Mahowald, N. M., Painter, T. H., Ramanathan, V., and Rasch, P. J.: Springtime warming and reduced snow cover from carbonaceous particles, Atmos. Chem. Phys., 9, 2481–2497, https://doi.org/10.5194/acp-9-2481-2009, 2009.
Flanner, M. G., Arnheim, J. B., Cook, J. M., Dang, C., He, C., Huang, X., Singh, D., Skiles, S. M., Whicker, C. A., and Zender, C. S.: SNICAR-ADv3: a community tool for modeling spectral snow albedo, Geosci. Model Dev., 14, 7673–7704, https://doi.org/10.5194/gmd-14-7673-2021, 2021.
Foy, N., Copland, L., Zdanowicz, C., Demuth, M., and Hopkinson, C.: Recent volume and area changes of Kaskawulsh Glacier, Yukon, Canada, Journal of Glaciology, 57, 515–525, https://doi.org/10.3189/002214311796905596, 2011.
Gonzalez, C. and Choquette, S.: Certificate of analysis, Standard Reference Material 2710a, https://tsapps.nist.gov/srmext/certificates/2710a.pdf (last access: 12 December 2025), 2018.
González-Romero, A., González-Flórez, C., Panta, A., Yus-Díez, J., Córdoba, P., Alastuey, A., Moreno, N., Kandler, K., Klose, M., Clark, R. N., Ehlmann, B. L., Greenberger, R. N., Keebler, A. M., Brodrick, P., Green, R. O., Querol, X., and Pérez García-Pando, C.: Probing Iceland's dust-emitting sediments: particle size distribution, mineralogy, cohesion, Fe mode of occurrence, and reflectance spectra signatures, Atmos. Chem. Phys., 24, 6883–6910, https://doi.org/10.5194/acp-24-6883-2024, 2024.
Helgren, D. and Prospero, J.: Wind velocities associated with dust deflation events in the Western Sahara, Journal of climate and applied meteorology, 1147–1151, https://doi.org/10.1175/1520-0450(1987)026<1147:WVAWDD>2.0.CO;2, 1987.
Hofmann, W.: Modelling inhaled particle deposition in the human lung – A review, Journal of Aerosol Science, 42, 693–724, https://doi.org/10.1016/j.jaerosci.2011.05.007, 2011.
Human Toxicology and Air Standards Section: Ambient Air Quality Criteria, https://files.ontario.ca/mecp-ambient-air-quality-criteria-list-en-2020-05-01.pdf (last access: 12 December 2025), 2020.
Hurley, J.: Sizing particles with a Coulter counter, Biophysical Journal, 10, 74–79, https://doi.org/10.1016/S0006-3495(70)86286-5, 1970.
IPCC: Ocean, Cryosphere and Sea Level Change, in: Climate Change 2021 – The Physical Science Basis: Working Group I Contribution to the Sixth Assessment Report of the Intergovernmental Panel on Climate Change, edited by: Intergovernmental Panel on Climate, C., Cambridge University Press, Cambridge, 1211–1362, https://doi.org/10.1017/9781009157896.011, 2021.
Kalma, J., Speight, J., and Wasson, R.: Potential wind erosion in Australia: A continental perspective, Journal of Climatology, 8, 411–428, https://doi.org/10.1002/joc.3370080408, 1988.
Kandler, K., Schneiders, K., Heuser, J., Waza, A., Aryasree, S., Althausen, D., Hofer, J., Abdullaev, S. F., and Makhmudov, A. N.: Differences and similarities of central Asian, African, and arctic dust composition from a single particle perspective, Atmosphere, 11, 269, https://doi.org/10.3390/atmos11030269, 2020.
Kastury, F., Smith, E., and Juhasz, A. L.: A critical review of approaches and limitations of inhalation bioavailability and bioaccessibility of metal (loid) s from ambient particulate matter or dust, Science of the Total Environment, 574, 1054–1074, https://doi.org/10.1016/j.scitotenv.2016.09.056, 2017.
Kastury, F., Smith, E., Karna, R. R., Scheckel, K. G., and Juhasz, A.: An inhalation-ingestion bioaccessibility assay (IIBA) for the assessment of exposure to metal (loid) s in PM10, Science of the Total Environment, 631, 92–104, 2018.
Kienholz, C., Herreid, S., Rich, J. L., Arendt, A. A., Hock, R., and Burgess, E. W.: Derivation and analysis of a complete modern-date glacier inventory for Alaska and northwest Canada, Journal of Glaciology, 61, 403–420, https://doi.org/10.3189/2015JoG14J230, 2015.
Kok, J. F., Parteli, E. J., Michaels, T. I., and Karam, D. B.: The physics of wind-blown sand and dust, Reports on progress in Physics, 75, 106901, https://doi.org/10.1088/0034-4885/75/10/106901, 2012.
Kok, J. F., Storelvmo, T., Karydis, V. A., Adebiyi, A. A., Mahowald, N. M., Evan, A. T., He, C., and Leung, D. M.: Mineral dust aerosol impacts on global climate and climate change, Nature Reviews Earth & Environment, 4, 71–86, https://doi.org/10.1038/s43017-022-00379-5, 2023.
Komuro, Y., Nakazawa, F., Goto-azuma, K., Hirabayashi, M., Shigeyama, W., Fujita, K., Steffensen, J. P., and Dahl-jensen, D.: Major metallic elements (Al, Ca, and Fe) and size distribution of mineral particles in recent snow in inland Northeast Greenland, Bulletin of Glaciological Research, 42, 49–60, https://doi.org/10.5331/bgr.24A02, 2024.
Lai, Z. L., Cheng, Z. Z., Lata, N. N., Mathai, S., Marcus, M. A., Mazzola, M., Mazzoleni, C., Gilardoni, S., and China, S.: Chemical Composition and Mixing State of Wintertime Aerosol from the European Arctic Site of Ny-Ålesund, Svalbard, Acs Earth and Space Chemistry, https://doi.org/10.1021/acsearthspacechem.5c00175, 2025.
Lee, H., Kim, M. Y., and Park, S. H.: A Comparative Review of Wind-Blown Dust Emission Models, Journal of Korean Society for Atmospheric Environment, 35, 149–171, https://doi.org/10.5572/KOSAE.2019.35.2.149, 2019.
Linsinger, T. P.: Use of recovery and bias information in analytical chemistry and estimation of its uncertainty contribution, TrAC Trends in Analytical Chemistry, 27, 916–923, https://doi.org/10.1016/j.trac.2008.08.013, 2008.
Liu, Y., Xu, F., Liu, W., Liu, X., and Wang, D.: Characteristics, Sources, Exposure, and Health Effects of Heavy Metals in Atmospheric Particulate Matter, Current Pollution Reports, 11, 16, https://doi.org/10.1007/s40726-025-00344-y, 2025.
Marticorena, B.: Dust production mechanisms, in: Mineral dust: A key player in the earth system, edited by: Peter, K. J.-B. W., Stuut, Springer Dordrecht, Dordrecht, Netherlands, 93-120, https://doi.org/10.1007/978-94-017-8978-3, 2014.
McMurry, P. H.: A review of atmospheric aerosol measurements, Atmospheric Environment, 34, 1959–1999, https://doi.org/10.1016/S1352-2310(99)00455-0, 2000.
McTainsh, G., Lynch, A., and Hales, R.: Particle-size analysis of aeolian dusts, soils and sediments in very small quantities using a Coulter Multisizer, Earth Surface Processes and Landforms, 22, 1207–1216, https://doi.org/10.1002/(SICI)1096-9837(199724)22:13<1207::AID-ESP820>3.3.CO;2-B, 1997.
Meinander, O., Dagsson-Waldhauserova, P., Amosov, P., Aseyeva, E., Atkins, C., Baklanov, A., Baldo, C., Barr, S. L., Barzycka, B., Benning, L. G., Cvetkovic, B., Enchilik, P., Frolov, D., Gassó, S., Kandler, K., Kasimov, N., Kavan, J., King, J., Koroleva, T., Krupskaya, V., Kulmala, M., Kusiak, M., Lappalainen, H. K., Laska, M., Lasne, J., Lewandowski, M., Luks, B., McQuaid, J. B., Moroni, B., Murray, B., Möhler, O., Nawrot, A., Nickovic, S., O’Neill, N. T., Pejanovic, G., Popovicheva, O., Ranjbar, K., Romanias, M., Samonova, O., Sanchez-Marroquin, A., Schepanski, K., Semenkov, I., Sharapova, A., Shevnina, E., Shi, Z., Sofiev, M., Thevenet, F., Thorsteinsson, T., Timofeev, M., Umo, N. S., Uppstu, A., Urupina, D., Varga, G., Werner, T., Arnalds, O., and Vukovic Vimic, A.: Newly identified climatically and environmentally significant high-latitude dust sources, Atmos. Chem. Phys., 22, 11889–11930, https://doi.org/10.5194/acp-22-11889-2022, 2022.
Miller, R., Cakmur, R., Perlwitz, J., Geogdzhayev, I., Ginoux, P., Koch, D., Kohfeld, K., Prigent, C., Ruedy, R., and Schmidt, G.: Mineral dust aerosols in the NASA Goddard Institute for Space Sciences ModelE atmospheric general circulation model, Journal of Geophysical Research: Atmospheres, 111, https://doi.org/10.1029/2005JD005796, 2006.
Moroni, B., Cappelletti, D., Crocchianti, S., Becagli, S., Caiazzo, L., Traversi, R., Udisti, R., Mazzola, M., Markowicz, K., Ritter, C., and Zielinski, T.: Morphochemical characteristics and mixing state of long range transported wildfire particles at Ny-Alesund (Svalbard Islands), Atmospheric Environment, 156, 135–145, https://doi.org/10.1016/j.atmosenv.2017.02.037, 2017.
Mukherjee, S.: Physical properties of clay and soil mechanics, in: The science of clays, applications in industry, engineering, and environment, Springer, Netherlands, https://doi.org/10.1007/978-94-007-6683-9_5, 2013.
Natural Resources Canada, Atlas of Canada, Environment Canada, and Inland Waters Branch: Inventory of Freshwater Lakes, https://www150.statcan.gc.ca/n1/pub/11-402-x/2012000/chap/geo/tbl/tbl05-eng.htm (last access: 12 December 2025), 1973.
Neufeld, D.: Kluane National Park Reserve, 1923–1974: Modernity and Pluralism, in: A Century of Parks Canada, http://parkscanadahistory.com/publications/kluane/modernity-pluralism.pdf (last access: 12 December 2025), 1972.
Nickling, W. and Gillies, J.: Emission of fine-grained particulates from desert soils, in: Paleoclimatology and Paleometeorology: modern and past patterns of global atmospheric transport, Springer, 133–165, https://doi.org/10.1007/978-94-009-0995-3_5, 1989.
Olumayede, E. G., Babalola, B., and Oghenovo, I.: Trace Elements in Urban Particulate Matters: Variations in Serum Levels, Inhalation Bioaccessibility, Health and Disease Effects, in: Trace Elements and Their Effects on Human Health and Diseases, 79–90, 2021.
Panta, A., Kandler, K., Schepanski, K., Alastuey, A., Dagsson Waldhauserova, P., Dupont, S., Eknayan, M., González-Flórez, C., González-Romero, A., Klose, M., Montag, M., Querol, X., Yus-Díez, J., and Pérez García-Pando, C.: Unveiling single-particle composition, size, shape, and mixing state of freshly emitted Icelandic dust via electron microscopy analysis, Atmos. Chem. Phys., 25, 10457–10478, https://doi.org/10.5194/acp-25-10457-2025, 2025.
Porter, G. C. E., Sikora, S. N. F., Adams, M. P., Proske, U., Harrison, A. D., Tarn, M. D., Brooks, I. M., and Murray, B. J.: Resolving the size of ice-nucleating particles with a balloon deployable aerosol sampler: the SHARK, Atmos. Meas. Tech., 13, 2905–2921, https://doi.org/10.5194/amt-13-2905-2020, 2020.
Reid, J. S., Jonsson, H. H., Maring, H. B., Smirnov, A., Savoie, D. L., Cliff, S. S., Reid, E. A., Livingston, J. M., Meier, M. M., and Dubovik, O.: Comparison of size and morphological measurements of coarse mode dust particles from Africa, Journal of Geophysical Research: Atmospheres, 108, https://doi.org/10.1029/2002JD002485, 2003.
Rencz, A. and Shilts, W.: Nickel in soils and vegetation of glaciated terrains, in: Nickel in the Environment, John Wiley & Sons, New York, 151–188, ISBN 978-0471058854, 1980.
Rinaldi, M., Hiranuma, N., Santachiara, G., Mazzola, M., Mansour, K., Paglione, M., Rodriguez, C. A., Traversi, R., Becagli, S., Cappelletti, D., and Belosi, F.: Ice-nucleating particle concentration measurements from Ny-Ålesund during the Arctic spring–summer in 2018, Atmos. Chem. Phys., 21, 14725–14748, https://doi.org/10.5194/acp-21-14725-2021, 2021.
Schepanski, K.: Transport of mineral dust and its impact on climate, Geosciences, 8, 151, https://doi.org/10.3390/geosciences8050151, 2018.
Scheuvens, D. and Kandler, K.: On Composition, Morphology, and Size Distribution of Airborne Mineral Dust, in: Mineral Dust: A Key Player in the Earth System, edited by: Knippertz, P. and Stuut, J.-B. W., Springer Dordrecht, Dordrecht, Netherlands, 15–49, https://doi.org/10.1007/978-94-017-8978-3, 2014.
Shao, Y. and Lu, H.: A simple expression for wind erosion threshold friction velocity, Journal of Geophysical Research: Atmospheres, 105, 22437–22443, https://doi.org/10.1029/2000JD900304, 2000.
Shilts, W. W.: Till Geochemistry in Finland and Canada, Journal of Geochemical Exploration, 21, 95–117, https://doi.org/10.1016/0375-6742(84)90037-2, 1984a.
Shilts, W. W.: Workshop 1: Till Geochemistry in Mineral Exploration, Journal of Geochemical Exploration, 21, 119–122, https://doi.org/10.1016/0375-6742(84)90038-4, 1984b.
Shilts, W. W.: Geological Survey of Canada's contributions to understanding the composition of glacial sediments, Canadian Journal of Earth Sciences, 30, 333–353, https://doi.org/10.1139/e93-026, 1993.
Shugar, D. H., Clague, J. J., Best, J. L., Schoof, C., Willis, M. J., Copland, L., and Roe, G. H.: River piracy and drainage basin reorganization led by climate-driven glacier retreat, Nature Geoscience, 10, 370–375, https://doi.org/10.1038/NGEO2932, 2017.
Smart, C. and Willis, E.: Determination of refractive indices of polystyrene latices by light scattering, Journal of Colloid and Interface Science, 25, 577–583, https://doi.org/10.1016/0021-9797(67)90071-9, 1967.
Sokolik, I. N.: Dust, in: Encyclopedia of Atmospheric Sciences, edited by: Holton, J. R., Elsevier, Amsterdam, ISBN 9780122270901, 2002.
Tardif, Y., Richard, L., Bellamy, D., Ahabchane, H.-E., Tharaud, M., Schlatt, L., Dourlent, A., Trieu, N., King, J., Wilkinson, K. J., and Hayes, P. L.: Contrasting the elemental composition of fine particulate matter in urban and remote samples using single particle inductively coupled plasma time-of-flight mass spectrometry (SP ICP-ToF-MS), Aerosol Science and Technology, 1–17, https://doi.org/10.1080/02786826.2025.2519091, 2025.
Tegen, I. and Fung, I.: Modeling of mineral dust in the atmosphere: Sources, transport, and optical thickness, Journal of Geophysical Research: Atmospheres, 99, 22897–22914, https://doi.org/10.1029/94JD01928, 1994.
Tegen, I. and Lacis, A. A.: Modeling of particle size distribution and its influence on the radiative properties of mineral dust aerosol, Journal of Geophysical Research: Atmospheres, 101, 19237–19244, https://doi.org/10.1029/95JD03610, 1996.
U.S. EPA: Method 3051A microwave assisted acid digestion of sediments, sludges, soils, and oils, https://www.epa.gov/sites/default/files/2015-12/documents/3051a.pdf (last access: 12 December 2025), 2007.
U.S. EPA: Quality Assurance Guidance Document 2.12 Monitoring PM2.5 in Ambient Air Using Designated Reference or Class I Equivalent Methods, https://www3.epa.gov/ttnamti1/files/ambient/pm25/qa/m212.pdf (last access: 12 December 2025), 2016.
Vicente-Luis, A., Tremblay, S., Dionne, J., Chang, R. Y. W., Fogal, P. F., Leaitch, W. R., Sharma, S., Kolonjari, F., and Hayes, P. L.: In situ optical and microphysical properties of tropospheric aerosols in the Canadian High Arctic from 2016 to 2019, Atmospheric Environment, 250, https://doi.org/10.1016/j.atmosenv.2021.118254, 2021.
World Health Organization: WHO global air quality guidelines: particulate matter (PM2.5 and PM10), ozone, nitrogen dioxide, sulfur dioxide and carbon monoxide, World Health Organization, https://iris.who.int/server/api/core/bitstreams/551b515e-2a32-4e1a-a58c-cdaecd395b19/content (last access: 12 December 2025), 2021.
Wriedt, T.: Mie theory: a review, in: The Mie theory: Basics and applications, 53–71, https://doi.org/10.1007/978-3-642-28738-1, 2012.
Xi, Y., Xu, C., Downey, A., Stevens, R., Bachelder, J. O., King, J., Hayes, P. L., and Bertram, A. K.: Ice nucleating properties of airborne dust from an actively retreating glacier in Yukon, Canada, Environmental Science: Atmospheres, https://doi.org/10.1039/d1ea00101a, 2022.
Yukon Regulations: Occupational Health and Safety Act, https://laws.yukon.ca/cms/images/LEGISLATION/SUBORDINATE/1986/1986-0164/1986-0164.pdf (last access: 12 December 2025), 1986.
Zhang, X. L., Wu, G. J., Zhang, C. L., Xu, T. L., and Zhou, Q. Q.: What is the real role of iron oxides in the optical properties of dust aerosols?, Atmos. Chem. Phys., 15, 12159–12177, https://doi.org/10.5194/acp-15-12159-2015, 2015a.
Zhang, Y., Mahowald, N., Scanza, R. A., Journet, E., Desboeufs, K., Albani, S., Kok, J. F., Zhuang, G., Chen, Y., Cohen, D. D., Paytan, A., Patey, M. D., Achterberg, E. P., Engelbrecht, J. P., and Fomba, K. W.: Modeling the global emission, transport and deposition of trace elements associated with mineral dust, Biogeosciences, 12, 5771–5792, https://doi.org/10.5194/bg-12-5771-2015, 2015b.