
the Creative Commons Attribution 4.0 License.
the Creative Commons Attribution 4.0 License.
 | 16 Sep 2026
Advancing halocarbon radiative efficiency estimates by coupling radiative transfer and quantum chemical calculations: impact of updated spectroscopic parameters and low-frequency contributions
Daniela Alvarado-Jiménez
Nicola Tasinato

Roberto Buizza
We update a fast method for calculating the global mean radiative efficiency (RE) for weak absorbers (known as the Pinnock Curve). It is then employed to evaluate improved REs, for 30 halocarbons focusing particularly on the low-wavenumber (<500 cm−1) contributions where laboratory measurements of absorption cross-sections are scarce. The Pinnock Curve is updated using spectral line parameters from the HITRAN2020 database and the MT_CKD_4.3 water vapor continuum formulation. Halocarbon REs are evaluated by coupling this update with infrared absorption cross section spectra evaluated by means of a quantum chemical protocol featuring a non-empirical inclusion of anharmonic effects in both transition frequencies and intensities and accounting for conformer distributions. Recent revisions to the MT_CKD water vapor continuum coefficients decrease atmospheric opacity, producing a small increase in RE, which is counteracted by updates to line-by-line spectroscopic parameters in HITRAN2020. These compensatory effects result in a small increase in halocarbon REs, with an average rise of ∼0.3 %. Analysis of the low-wavenumber region shows that for the targeted compounds it contributes no more than 5 mW m−2 ppb−1 . On average, it amounts to 0.9 % of the total RE, but reaches about 3 % for HFC-152a and HFC-161. Despite this modest magnitude, accurate treatment of this spectral range is essential, as its impact is molecule-dependent and even small contributions can influence climate metrics. For seven of the 30 gases considered here, the low wavenumber contribution to RE is more than 10 times greater than that calculated in earlier work.
- Article
(1047 KB) - Full-text XML
-
Supplement
(327 KB) - BibTeX
- EndNote


Among the gases emitted into the atmosphere from anthropogenic activities, halogenated compounds play an important role in human-driven climate change. The combined radiative forcing (RF) due to halogenated compounds is about 0.41 W m−2, nearly 20 % of the current CO2 effect (Forster et al., 2023; Hodnebrog et al., 2020), despite their relatively low atmospheric concentrations. Their impact arises from strong ro-vibrational absorption bands associated with C–F and C–Cl stretching motions, particularly between ∼ 700 and 1200 cm−1, where H2O, CO2, and O3 absorb less and Earth's thermal emission is strongest, making them powerful greenhouse gases. Because of this, many halogenated compounds have been included in international agreements aimed at reducing greenhouse gas emissions from human activity.
A widely used metric to describe the greenhouse strength of a gas, and consequently its climate impact, is the radiative efficiency (RE), defined as the RF per unit change in mole fraction. RE can be used to estimate RF given modeled or observed abundances of greenhouse gases. It is also a necessary input to climate emission metrics such as the global warming potential (GWP), which is the time-integrated RE for the pulse emission of 1 kg of a compound relative to that of the same emission of CO2 over a chosen time horizon. Therefore, any update to RE values affects GWPs by the same proportion.
REs, and consequently GWPs, are usually derived using infrared (IR) absorption cross sections measured experimentally over the 500–3000 cm−1 range, leaving the low-wavenumber IR region (i.e., wavenumbers below about 500 cm−1) relatively unexplored because of the intrinsic challenges in acquiring the corresponding spectra. This low-wavenumber region is, however, important because it represents almost 16 % of Earth's thermal emission (Harries et al., 2008; Feldman et al., 2014; Van Hoomissen et al., 2023).
In cases where experimental measurements are unavailable, quantum-chemical (QC) calculations can be used to estimate IR absorption cross sections (see Alvarado-Jiménez and Tasinato, 2024). For this purpose, density functional theory (DFT), and specifically global-hybrid density functionals, within the double-harmonic approximation, has often been used due to its simplicity and low computational cost (Papasavva et al., 1995; Young et al., 2008; Blowers and Hollingshead, 2009; Holtomo et al., 2019; Burkholder et al., 2020). However, by neglecting anharmonic effects, this approach tends to overestimate transition frequencies and intensities, and it ignores overtone and combination bands, as well as frequency shifts and intensity borrowings due to vibrational couplings (Boussessi et al., 2020; Pietropolli Charmet et al., 2022b; Tasinato et al., 2012). For halogenated species, the double-harmonic approximation can lead to errors of 20 %–50 % (Burkholder et al., 2020), which propagate into large uncertainties in REs and GWPs.
Recently, a new QC protocol relying on the use of more accurate double-hybrid functionals and coupling anharmonic simulations with an automatic inclusion of conformer distributions has been proposed. This strategy has been shown to deliver REs with errors around 5 % for fluorinated and chlorinated organic compounds (Alvarado-Jiménez and Tasinato, 2024), an accuracy that is retained even in the low-wavenumber IR region (Alvarado-Jiménez et al., 2025, 2026), thus making it a viable option when laboratory spectra are unavailable.
For RE evaluations, and radiative transfer applications in general, line-by-line (LBL) models, which resolve each spectral line at high resolution (∼ 0.01 cm−1), are the most accurate way to describe radiance and transmission across the electromagnetic spectrum. However, they are computationally expensive when studying weak absorbers at very low concentrations, especially as large numbers of halocarbons now need to be considered (Hodnebrog et al., 2013, 2020). Pinnock et al. (1995) developed a fast method, based on results from a narrow-band radiative transfer model (NBM), which can be applied directly to laboratory measurements or QC-calculated IR absorption cross sections to evaluate RE without the need for a radiative transfer code. This function (the “Pinnock Curve”) describes the change in irradiance at the tropopause caused by a given absorber. In its initial form, this gave the instantaneous radiative forcing, without any other change in the climate system. The RE of a molecule can then be estimated by multiplying this function by the corresponding IR absorption cross section. The original Pinnock Curve has been updated several times, most notably by Hodnebrog et al. (2013) and Shine and Myhre (2020); the latter paper added stratospheric temperature adjustment to the RE calculation.
Since the Pinnock Curve depends on background atmospheric opacity, which is modulated by the spectral properties of the main atmospheric gases, updates in their spectroscopic parameters affect the resulting RE values. Shine and Myhre (2020) demonstrated how updates to the main spectroscopic database of atmospheric molecules (HITRAN; Gordon et al., 2017) and the MT_CKD water vapor continuum (Mlawer et al., 2019) impacted the Pinnock Curve. Since then, there have been further HITRAN updates (HITRAN2020 (Gordon et al., 2022) and HITRAN2024; (Gordon et al., 2026)). There have also been important updates to the MT_CKD water vapor continuum (Mlawer et al., 2023, 2024).
Motivated by these considerations, the purpose of the present study is threefold: (i) to update the Pinnock Curve to investigate how it is affected by recent revisions to the MT_CKD and HITRAN; (ii) to assess the sensitivity of the REs of selected halocarbons to these updates using QC-simulated IR cross sections; and (iii) to provide new estimates of the contribution of the 0–500 cm−1 spectral region to REs in order to evaluate their impact on climate metric values.
The work is organized as follows: computational details about the NBM used to compute the Pinnock Curve and the QC simulation of IR absorption cross sections are given in Sect. 2; the new Pinnock Curve obtained by including the latest version of the MT_CKD water vapor continuum and the HITRAN2020 line parameters is presented and discussed in Sect. 3. The new curve is then coupled to QC-evaluated IR absorption cross sections to provide updated estimates of the far-IR contribution to REs for a range of selected halocarbons. Conclusions are given in Sect. 4. By combining updated spectroscopic datasets with advanced QC predictions, this work aims to provide a more consistent framework for quantifying the climate impact of halogenated species and to reduce uncertainties in their radiative properties.
2.1 Radiative forcing calculations
We employed the Reading NBM (Shine and Myhre, 2020) for radiative transfer calculations. This model, which divides the spectrum into 300 bands with a resolution of 10 cm−1 across the wavenumber range 0–3000 cm−1, was used to calculate Earth's irradiances (W m−2 cm). We sourced spectral line parameters from the HITRAN 2016 (Gordon et al., 2017) and 2020 (Gordon et al., 2022) databases, and used the MT_CKD continuum model versions 3.2 (Mlawer et al., 2019), 4.2 and 4.3 (Mlawer et al., 2023). To determine the instantaneous RF (IRF) for a global and annual mean (GAM) atmosphere, following Pinnock et al. (1995), we introduced a weak absorber with a constant absorption cross-section of 1.0 × 10⁻¹⁸ cm2 molec.−1 at all wavenumbers into the NBM. This weak absorber was assumed to have a mole fraction of 1 ppb and to be uniformly mixed throughout the atmosphere. To evaluate the spectral variation of the IRF of the GAM with respect to the different HITRAN and MT_CKD versions, we ran the radiative code twice: with the weak absorber (perturbed) and once without it (unperturbed). This approach was possible because for the IRF the weak absorber only affects the forcing in the specific wavenumber bands where it absorbs.
We also applied stratospheric temperature adjustment (STA), since RF values that include STA have been shown to be a more reliable predictor of surface temperature response than IRF alone (Shine and Myhre, 2020). STA operates on relatively short timescales (months), in contrast to the decadal response of the surface–troposphere system. Although this has been superseded by the Effective Radiative Forcing (ERF), as the preferred definition of RF in recent Intergovernmental Panel on Climate Change (IPCC) assessments (Forster et al., 2021), the calculation of ERF requires the use of complex Earth System Models which employ radiative transfer schemes with low spectral resolution and include few halogenated gases, and so would be unsuitable for the current assessment. The inclusion of STA makes the calculation of spectral variations in RF considerably more complex (Shine and Myhre, 2020). A perturbation by a halocarbon in one spectral region influences stratospheric emissions by other gases – most notably CO2, O3, and H2O – at other wavenumbers. As a result, the forcing signal for a perturbation in absorption cross-section in one wavenumber band extends across the entire IR spectrum rather than being confined to that wavenumber band. In practice, RF (with STA) is calculated with the weak absorber confined to a single wavenumber band, but STA must be performed across all bands, requiring the procedure to be repeated for all 300 bands in the NBM.
Here, we first used the IRF using the single GAM atmosphere to illustrate the effect of updates to HITRAN and MT_CKD (Sect. 3.1), because of the much lower computational expense. To calculate the final updated version of the Pinnock Curve (Sect. 3.2), including STA, we performed separate calculations for tropical and extratropical profiles, following the methodology of Shine and Myhre (2020) but incorporating the most recent updates in the HITRAN and MT_CKD. In each latitude regime the standard fixed dynamical heating approximation was used; dynamical and solar heating were assumed to balance the unperturbed longwave heating. When the weak absorber was introduced, dynamical and solar heating was held constant, and an iterative procedure was applied to determine the temperature adjustments required to restore balance. This approach has been shown to reproduce global mean forcing values from high spatial resolution calculations to within ∼ 1 % (Myhre et al., 2006; Freckleton et al., 1998). By contrast, Myhre and Stordal (1997) reported errors exceeding 7 % when using a single GAM atmosphere. The updated Pinnock Curve was then used to refine the Oslo line-by-line IRF calculations reported in Shine and Myhre (2020) .
HITRAN2024 (Gordon et al., 2026) was released after most of the work reported here had been completed. We show in Sect. 3.1 that its impact on IRF is modest compared to changes due to HITRAN2020 and therefore do not include its impact on RF calculations incorporating STA.
2.2 Quantum chemical calculations
The set of molecules considered in this study includes chlorofluorocarbons (CFCs), hydrochlorofluorocarbons (HCFCs), hydrofluorocarbons (HFCs), hydrofluoroolefins (HFOs), hydrofluoroethers (HFE), halons and bromomethanes. For these, IR absorption spectra were either taken from the literature (Alvarado-Jiménez and Tasinato, 2024; Alvarado-Jiménez et al., 2025, 2026) or obtained through new QC calculations performed here. The latter were carried out for Halon-1202 (CBr2F2), HFC-161 (C2H5F), HFC-236ea (C3H2F6), HFO-1234yf (C3H2F4), HFO-1234ze(E) (E-C3H2F4), HFO-1234ze(Z) (Z-C3H2F4), and tribromomethane (CHBr3), following the same DFT computational framework as introduced by Alvarado-Jiménez and Tasinato (2024). Briefly, the double-hybrid density functional DSDPBEP86 (Santra et al., 2019) was applied in conjunction with the jun-cc-pV(T+d)Z (Papajak et al., 2011) basis set for C, H and F atoms, while bromine was described by using the energy-consistent pseudopotential basis set aug-cc-pVTZ-PP (Peterson et al., 2003) downloaded from the Basis Set Exchange library (Pritchard et al., 2019). In passing, it should be noted that the use of differently augmented basis sets for C, H, F and Br atoms has only a mild influence on the vibrational frequencies and intensities of vibrations involving the first-row atoms. Some tests were carried out for methylene bromide and tribromethane by describing all the atoms through the aug-cc-pVTZ basis, obtaining REs that agreed within 10−4 W m−2 ppb−1 with respect to the combination of jun-cc-pVTZ (C,H) and aug-cc-pVTZ (Br). Dispersion corrections were consistently included through Grimme's DFT-D3 scheme (Grimme et al., 2010) with Becke-Johnson damping (Grimme et al., 2011). Equilibrium geometries were optimized first, and harmonic vibrational frequencies and IR intensities were then evaluated. Anharmonic contributions were incorporated using second-order vibrational perturbation theory (VPT2) (Papoušek and Aliev, 1982), with cubic- and semi-diagonal-quartic force constants and second- and third-order dipole moment derivatives computed numerically from geometries displaced along normal modes. The resulting anharmonic wavenumbers and intensities were refined within the generalized VPT2 (GVPT2) framework (Barone, 2004; Bloino et al., 2012; Puzzarini et al., 2019), which properly accounts for resonance effects. All computations were carried out with Gaussian 16 (Frisch et al., 2016).
For HFO-1234ze(Z), two conformers, both having CS point group symmetry, were considered to reproduce the overall spectral bandshape, whereas for HFO-1234ze(E), although both C1 and CS conformations exist, only the CS form was retained because the C1 conformer is negligibly populated under the relevant thermal conditions (the conformer distribution was evaluated at 298 K).
In addition to the above molecules, the molecular set was completed by incorporating computed spectral data reported in previous publications. Specifically, IR absorption cross section spectra were taken from Alvarado-Jiménez and Tasinato (2024) and Alvarado-Jiménez et al. (2025) for the following halocarbons: CFC-113 (CF2ClCCl2F), CFC-115 (CClF2CF3), CFC-12 (CCl2F2), CFC-13 (CClF3), Halon-1201 (CHBrF2), Halon-2301 (CH2BrCF3), Halon-1211 (CBrClF2), HCFO-1122 (ClHC=CF2 ), HCFC-132b (C2H2Cl2F2), HCFC-141b (Cl2CFCH3), HCFC-142b (CF2ClCH3), HCFC-22 (CF2ClH), HFC-125 (CF3CHF2), HFC-134a (CF3CFH2), HFC-152a (CHF2CH3), HFC-32 (CH2F2), HFE-143a (CH3OCF3), HFO-1123 (C2F3H), and methylene bromide (CH2Br2). These spectra were obtained with the same computational protocol described above, which has been shown to reproduce the RE of different halocarbon families with mean deviations of ∼ 5 % and up to ∼ 10 % for ethers. Furthermore, QC IR spectra of HFC-236fa (C3H2F6), HFC-245fa (C3H3F5), and HFC-43‑10mee (C5F10H2) were taken from Alvarado-Jiménez et al. (2026) giving a total of 30 halocarbons. For HFC-236fa and HFC-245fa, IR absoprtion cross section spectra were similarly simulated at the DSDPBEP86-D3/jun‑cc‑pVTZ level of theory, while for HFC-43‑10mee a hybrid force‑field approach (Puzzarini et al., 2019) was used, in which DSDPBEP86-D3/jun‑cc‑pVTZ harmonic frequencies and IR intensities were mixed with anharmonic contributions derived using the PW6B95-D3 functional (Zhao and Truhlar, 2005) in conjunction with the jul‑cc‑pVTZ basis set. In particular, third- and semidiagonal fourth-order derivatives of the potential energy surface, and second- and third-derivatives of the dipole moment surface, were evaluated at the PW6B95-D3/jul-cc-pVTZ level by displacing the atoms along the DSDPBEP86-D3 vibrational displacement vectors to maximize the overlap between the two sets of normal modes. This methodological choice, which also stems from the accuracy of the two individual methods (Barone et al., 2020; Alvarado-Jiménez and Tasinato, 2024), offered a practical compromise between accuracy and computational efficiency in climate‑related predictions (Alvarado-Jiménez et al., 2026).
The stick spectra resulting from the QC calculations are provided in the Supplement. Based on previous investigations (Alvarado-Jiménez and Tasinato, 2024; Alvarado-Jiménez et al., 2025, 2026) for the RE calculations these transitions were convoluted with a Lorentzian line-shape function having a half-width at half-maximum (HWHM) of 5 or 30 cm−1 (mainly depending on the molecule's molecular weight): the reader is referred to the cited literature for halocarbons that appeared in previous works, while for those newly considered here the HWHM was set to 30 cm−1 for HFO-1234yf, HFO-1234zeE, HFO-1234zeZ and HFC-161, and to 5 cm−1 for Halon-1202 and HFC-236ea.
2.3 Radiative efficiency calculations
REs of the targeted molecules were computed by feeding the Pinnock Curve derived in this work as described in Sect. 2.1 into the in silico QC workflow to climate metrics together with their IR absorption cross section spectra computed according to the methodology outlined in Sect. 2.2. The calculation was carried out according to the formalism of Pinnock et al. (1995), as given in Eq. (1):
where, represents the global mean RF per unit cross section for a weak absorber within the spectral interval i, ranging in wavenumber from to , while σi denotes the IR absorption cross section integrated over the same range. In the calculations, we employed RF including STA in bins of 10 cm−1 across the spectral range from 0 to 3000 cm−1 (resulting in N=300). In the following sections, contributions from wavenumbers below 500 cm−1 are reported as a percentage of the total RE values.
In order to account for non-uniform vertical and horizontal gas distributions, updated REs over the 0–3000 cm−1 range were obtained by applying an adjustment depending on the molecule's atmospheric lifetime (τ). Following the procedure proposed by Hodnebrog et al. (2020), REs were scaled according to
and
depending on whether the main removal pathway is either photolysis in the stratosphere (typically for fully halogenated species) or degradation by hydroxyl radicals (for H-containing halocarbons). Atmospheric lifetimes were taken from WMO (2022).
Uncertainties in RE stem from several independent sources: as noted by Hodnebrog et al. (2013, 2020), typical contributions are approximately ∼5 % from the radiation scheme and clouds, 3 % from water vapor and temperature profiles, 5 % from the tropopause height, and 1 % from temporal and spatial averaging. Based on the assessment carried out with respect to experimental data (Alvarado-Jiménez and Tasinato, 2024), QC IR absorption cross sections, computed according to the adopted computational approach, contribute with an average uncertainty of about 5 %. Finally, tropospheric adjustments (not accounted here) which are needed to calculate ERF contribute a further estimated uncertainty of 13 % (Forster et al., 2021).
3.1 Influence of updates in spectroscopic parameters and water vapor continuum on the radiative forcing function
Spectroscopic parameters catalogued in the HITRAN database and the opacity linked to the water vapor continuum are fundamental elements in radiative transfer models. As a result, updates to these quantities are regularly introduced and thoroughly assessed (Gava et al., 2024; Mlawer et al., 2019, 2023, 2024). The discussion here considers spectroscopic updates since those that were discussed by Shine and Myhre (2020).
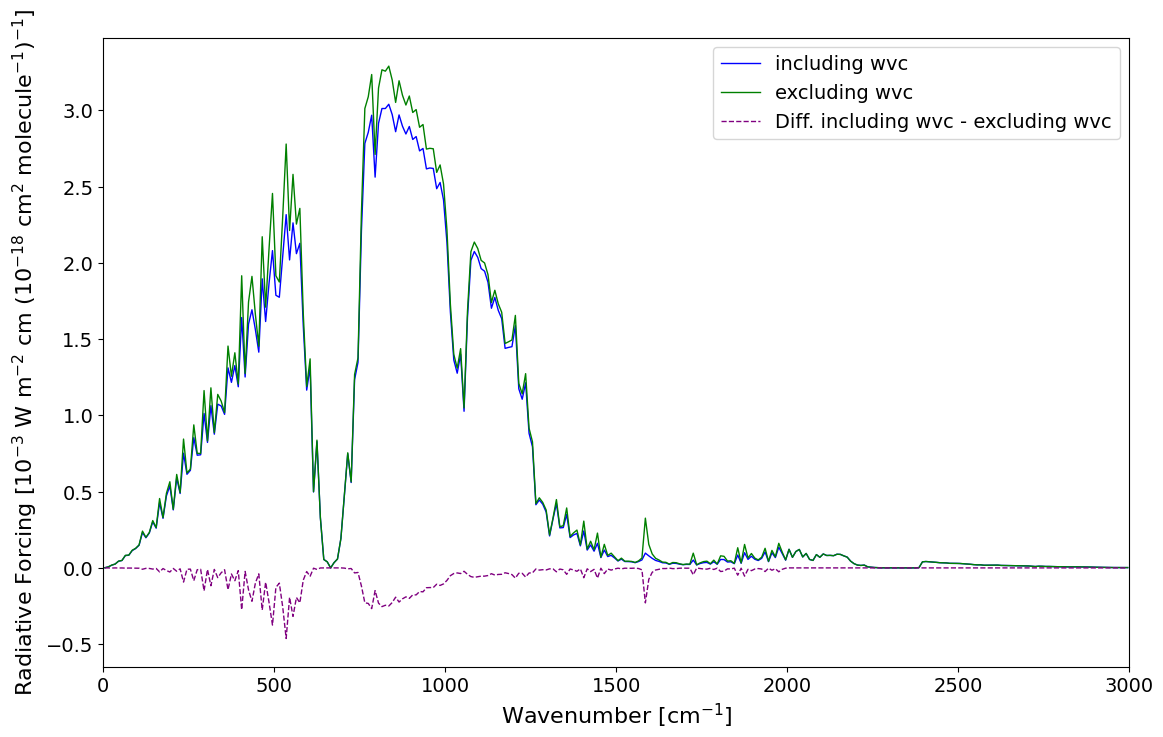
Figure 1IRF as a function of wavenumber for a global mean atmosphere considering a 0–1 ppb increase in mixing ratio of a weak absorber obtained by including or excluding the water vapor continuum (wvc) coefficients from the MT_CKD_4.3 model. The difference between the resulting Pinnock Curves is also shown.
In the first part of this work, we examine how revisions to HITRAN and MT_CKD affect the spectral IRF using the GAM atmosphere. First, to illustrate the overall role of the continuum, Fig. 1 shows the impact of including and excluding the MT_CKD_4.3 water vapor continuum on the Pinnock Curve. Although absorption due to the water vapor continuum is less significant within water vapor bands, it plays a larger role in the window regions, where it frequently dominates over absorption from water vapor spectral lines. Hence, in those spectral regions, the continuum becomes the dominant factor in wavenumber-averaged absorption, especially in clear-skies (Gava et al., 2024; Mlawer et al., 2023). As can be noted in Fig. 1, the largest effects of including the absorption due to water vapor continuum in the NBM radiative transfer model are found in the 200–600 cm−1 region and around 720–1200 cm−1, where it leads to a reduction of the IRF by about 6 % and 4 %, respectively.
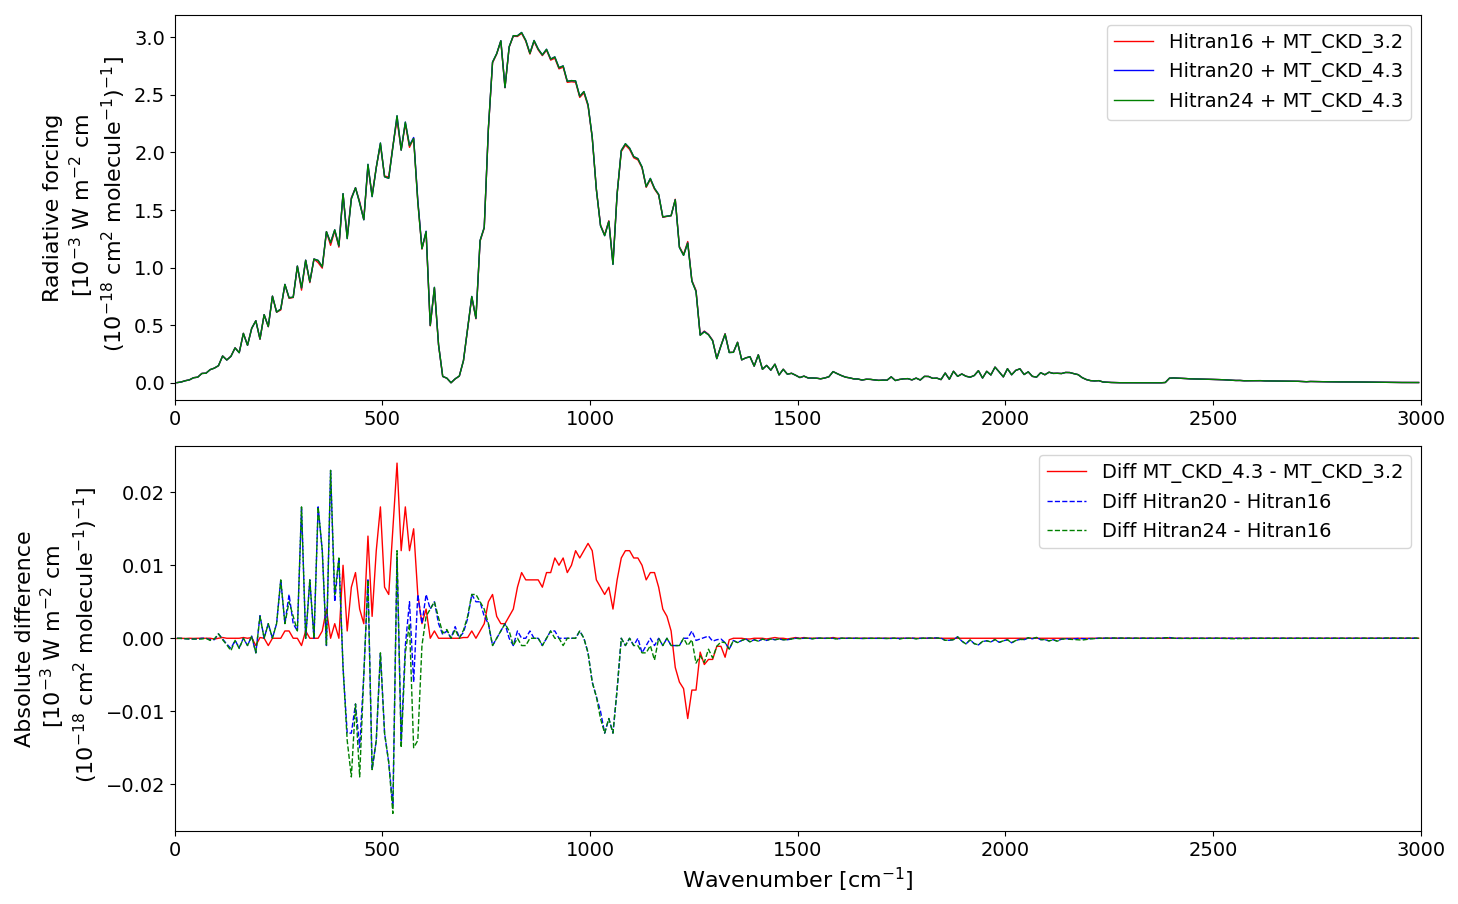
Figure 2Top: IRF as a function of the wavenumber at which a weak absorber is present for a global mean atmosphere and a 0–1 ppb increase in mixing ratio using different versions of the MT_CKD water vapor continuum (MT_CKD_3.2 and MT_CKD_4.3) together with spectroscopic parameters taken from HITRAN2016 (Hitran16) and HITRAN2020 (Hitran20) revisions. Bottom: difference between the IRF functions obtained from different combinations of MT_CKD and HITRAN releases.
Shine and Myhre (2020) reported calculations up to and including MT_CKD 3.2. Since then, there have been several updates affecting both the self and the foreign continuum and its temperature dependence (Mlawer et al., 2023, 2024) in the 0–3000 cm−1 region. The most recent version available on the HITRAN website is MT_CKD_4.3. This is used here but we note that the changes between versions 4.2 (discussed in Mlawer et al., 2024) and 4.3 do not affect the spectral region of interest here. In particular, the version 4.2 revisions corrected an overestimation of self continuum coefficients, particularly in the 70–700 cm−1 range of version 3.2 (Mlawer et al., 2019), which had previously resulted in higher downwelling long-wave flux at the surface and reduced outgoing long-wave radiation. As illustrated in Fig. 2, MT_CKD_ 4.3 generally leads to a reduction in water vapor continuum absorption and increased atmospheric transparency, as also pointed out in previous studies (Gava et al., 2024; Mlawer et al., 2024), resulting in an increase in RF when a weak absorber is introduced, with changes that are not uniform across the entire spectrum. However, the absolute increase is small, peaking at about 1 % near 500 cm−1.
Next, we assessed the effects that updates in spectroscopic parameters, as implemented in the 2020 and 2024 releases of the HITRAN database (Gordon et al., 2022, 2026), have on the Pinnock Curve. HITRAN2020 introduced significant updates in transition frequencies, intensities and broadening parameters of H2O and its isotopologues. It also adjusted the CO2 line list in the 580–750 cm−1 range and it employed a combination of data from new laboratory and theoretical works to obtain consistent intensities of O3 bands and increase the quality of the spectroscopic parameters for individual spectral lines. By comparing the IRF function obtained by using HITRAN2020 and HITRAN2016 (see Fig. 2, bottom panel), it is seen that these updates generally lead to a more opaque atmospheric profile, thus reducing the IRF in, for example, the O3 band around 1000 cm−1 and in the tail of the water vapor rotational band in the 500 cm−1 region. Again, the absolute impact on the IRF small, and is generally 2 % or less. Changes due to HITRAN2024 (see Fig. 2, bottom panel) are much smaller than those resulting from HITRAN2020; they are concentrated around 550 and 1200 cm−1, due to updates to N2O spectral data and near 425 cm−1 due to small changes in H2O spectral data. As explained in Sect. 2.1, the impacts of these small changes due to HITRAN2024 are not included in the remainder of the paper.
Interestingly, the differences reported in the bottom panel of Fig. 2 suggest that the combined effect of changes in both the HITRAN spectroscopic parameters and in the water vapor continuum formulation to some extent compensate each other.
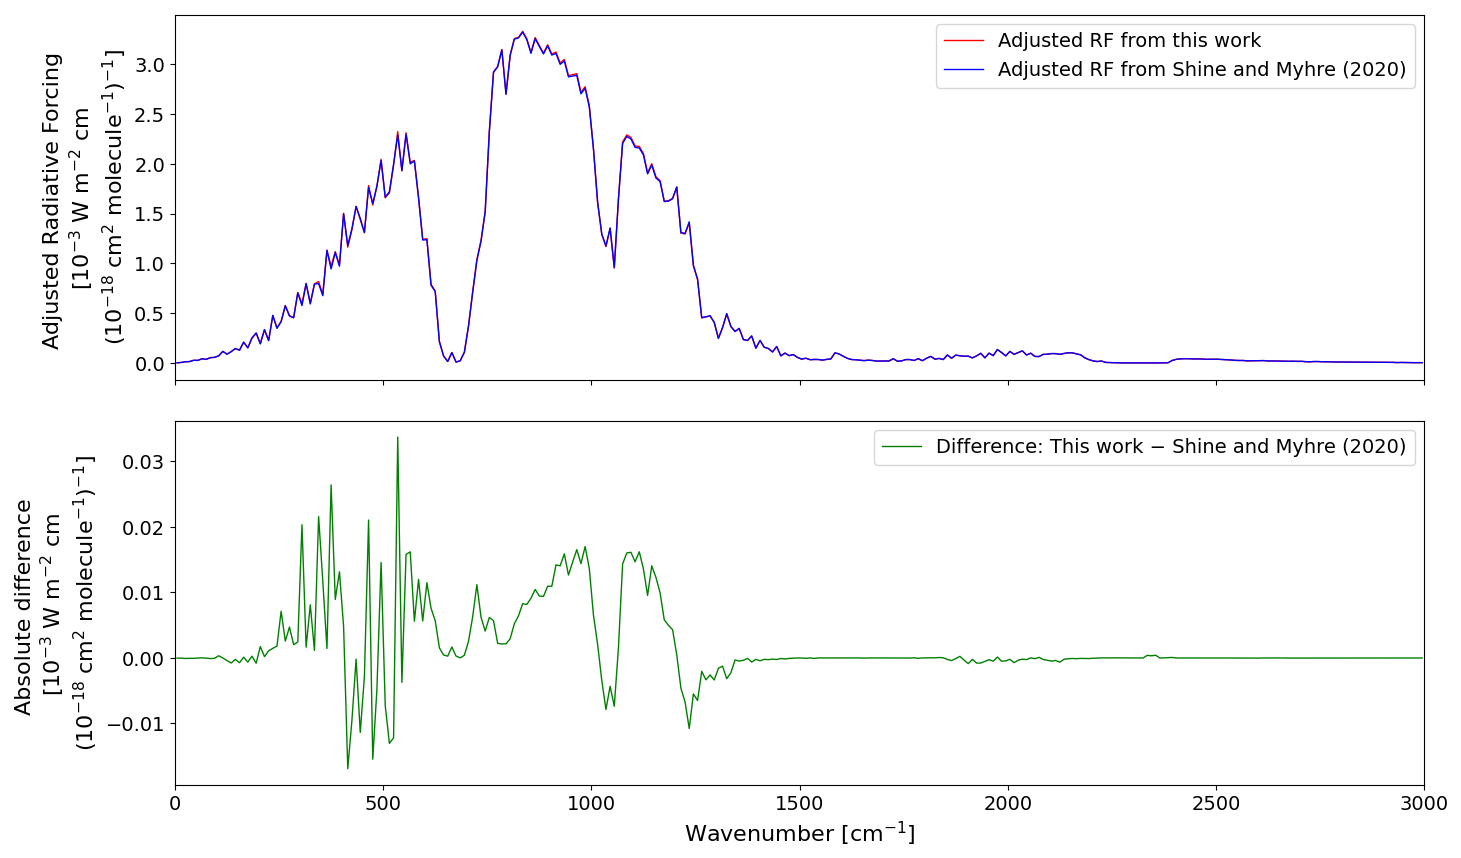
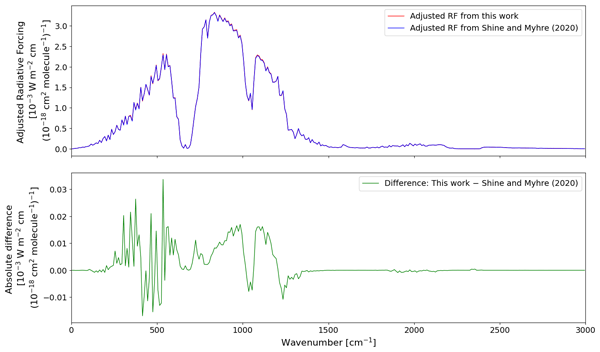
Figure 3Adjusted RF as a function of wavenumber for a 0–1 ppb increase in the mole fraction of a weak absorber. Results including the STA obtained in this work are compared with those of Shine and Myhre (2020); the lower panel shows their difference.
3.2 Impact of stratospheric temperature adjustment on the updated radiative forcing function
In this section, we present an updated version of the Pinnock Curve, obtained by using the HITRAN2020 spectroscopic dataset together with the MT_CKD_4.3 continuum model, adjusted for STA as shown in Fig. 3, and are provided in the Supplement. As explained in Sect. 2.1, NBM calculations described above were repeated using three representative atmospheres: one for the tropics and one each for the northern and southern extratropics. Shine and Myhre (Shine and Myhre, 2020) showed the impact of using multiple profiles rather than a single GAM atmosphere on the Pinnock Curve (see their Fig. 5).
To obtain the final updated Pinnock Curve, derived by using HITRAN2020 and MT_CKD_4.3 and accounting for STA, we adapt the method described in Shine and Myhre (Shine and Myhre, 2020). We first multiply the Oslo line-by-line (LBL) IRF results by the ratio of the new and old NBM IRF results, to account for HITRAN and MT_CKD changes and then multiply by the ratio of RF (including STA) and IRF from the new NBM results, to account for the impact of STA. The spectrally resolved RF estimates introduced by Hodnebrog et al. (2013) are more accurate than NBM results and provide higher spectral resolution. Nonetheless, as noted earlier, it is not computationally feasible to incorporate STA directly into LBL calculations for calculations of the Pinnock Curve.
3.3 Halocarbon radiative efficiencies: Impact of updated radiative forcing curve and low‑frequency contributions
The updated Pinnock Curve was employed to evaluate the effects of updates to HITRAN and MT_CKD on REs of halocarbons. According to Eq. (1), to estimate the RE of a molecule using the method developed by Pinnock et al. (1995), two key quantities are required: (i) the Pinnock Curve including STA and (ii) the absorption cross section of the molecule.
In this subsection, we first illustrate the impact of the updated Pinnock Curve on RE using our QC-determined cross-sections over the entire 0–3000 cm−1 spectral region. We then isolate the RE contribution from the low-wavenumber (0–500 cm−1) spectral region, as this is the region where experimentally-determined values are generally not available, and compare this with the previously presented QC calculations over the same spectral range from Van Hoomissen et al. (2023). Finally, we use our new low-wavenumber QC calculations to update the 0–3000 cm−1 values of RE presented in WMO (WMO, 2022).
Sharpe et al. (2004)Sihra et al. (2001)Gierczak et al. (1996)Tokuhashi et al. (2018)Orkin et al. (2010)Zhang et al. (2015)Sharpe et al. (2004)Table 1QC and experimental integrated absorption cross-sections (10−17 cm molec.−1) for the halocarbons newly considered in the present work. The integration interval and the percentage difference between QC and experimental values is also reported.
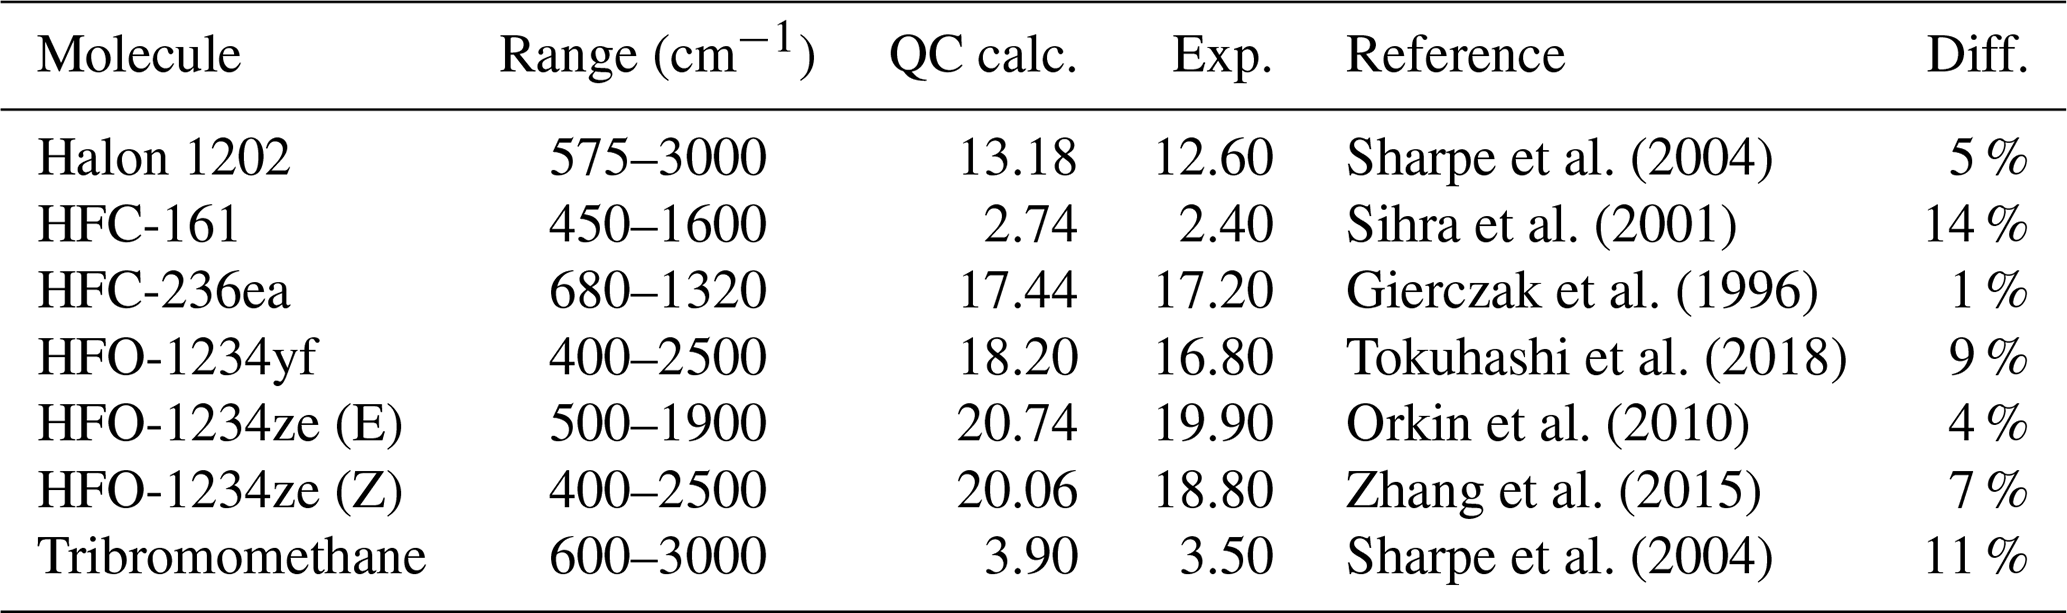
For the first step, to test the impact of the updated Pinnock Curve, the integrated absorption cross-sections obtained by integrating QC-simulated IR absorption spectra of the seven additional halocarbons introduced in the molecular dataset in the present work (see Sect. 2.2) are listed in Table 1 together with the corresponding experimentally derived values taken from the literature. For consistency, the same integration ranges (also specified in Table 1) as in the experimental investigations were adopted. The comparison between QC and experimental band strengths demonstrates that the QC predictions closely reproduce experimental measurements also for the additional molecules. The largest deviation is observed for HFC-161 for which the experimental value is overestimated by 14 %. This apparently large (but still acceptable) percentage error is due to the relatively small integrated band intensity of this molecule ( cm molec.−1): indeed, when considering absolute deviations, the difference between QC predictions and experiment amounts to only cm molec.−1. A similar situation is noted for tribromomethane, for which the percentage deviation is 11 % that actually corresponds to only cm molec.−1 in absolute terms.
On average, the mean deviation over the full set of 30 molecules considered is 7 %, consistent with previous QC estimates (Alvarado-Jiménez and Tasinato, 2024; Alvarado-Jiménez et al., 2025; Melosso et al., 2025; Alvarado-Jiménez et al., 2026), performed by adopting the in silico protocol to calculate climate metrics recently developed by Alvarado-Jiménez and Tasinato (2024). This agreement further supports earlier findings that the use of the DSDPBEP86/jun-cc-pV(T+d)Z method and the non-empirical inclusion of both mechanical and electrical anharmonicity enhances the accuracy of calculated transition frequencies and intensities, for both fundamental- and for two-quanta-transitions (Tasinato et al., 2012; Carnimeo et al., 2013; Tasinato et al., 2017; Barone et al., 2020), which is then transferred to REs and GWPs. In passing, it has to be noted that the latter ones also depend on atmospheric lifetimes that, when not available experimentally, can be reliably computed by adopting suitable QC protocols relying on composite schemes and some form of variational transition state theory (Rais et al., 2024, 2023).
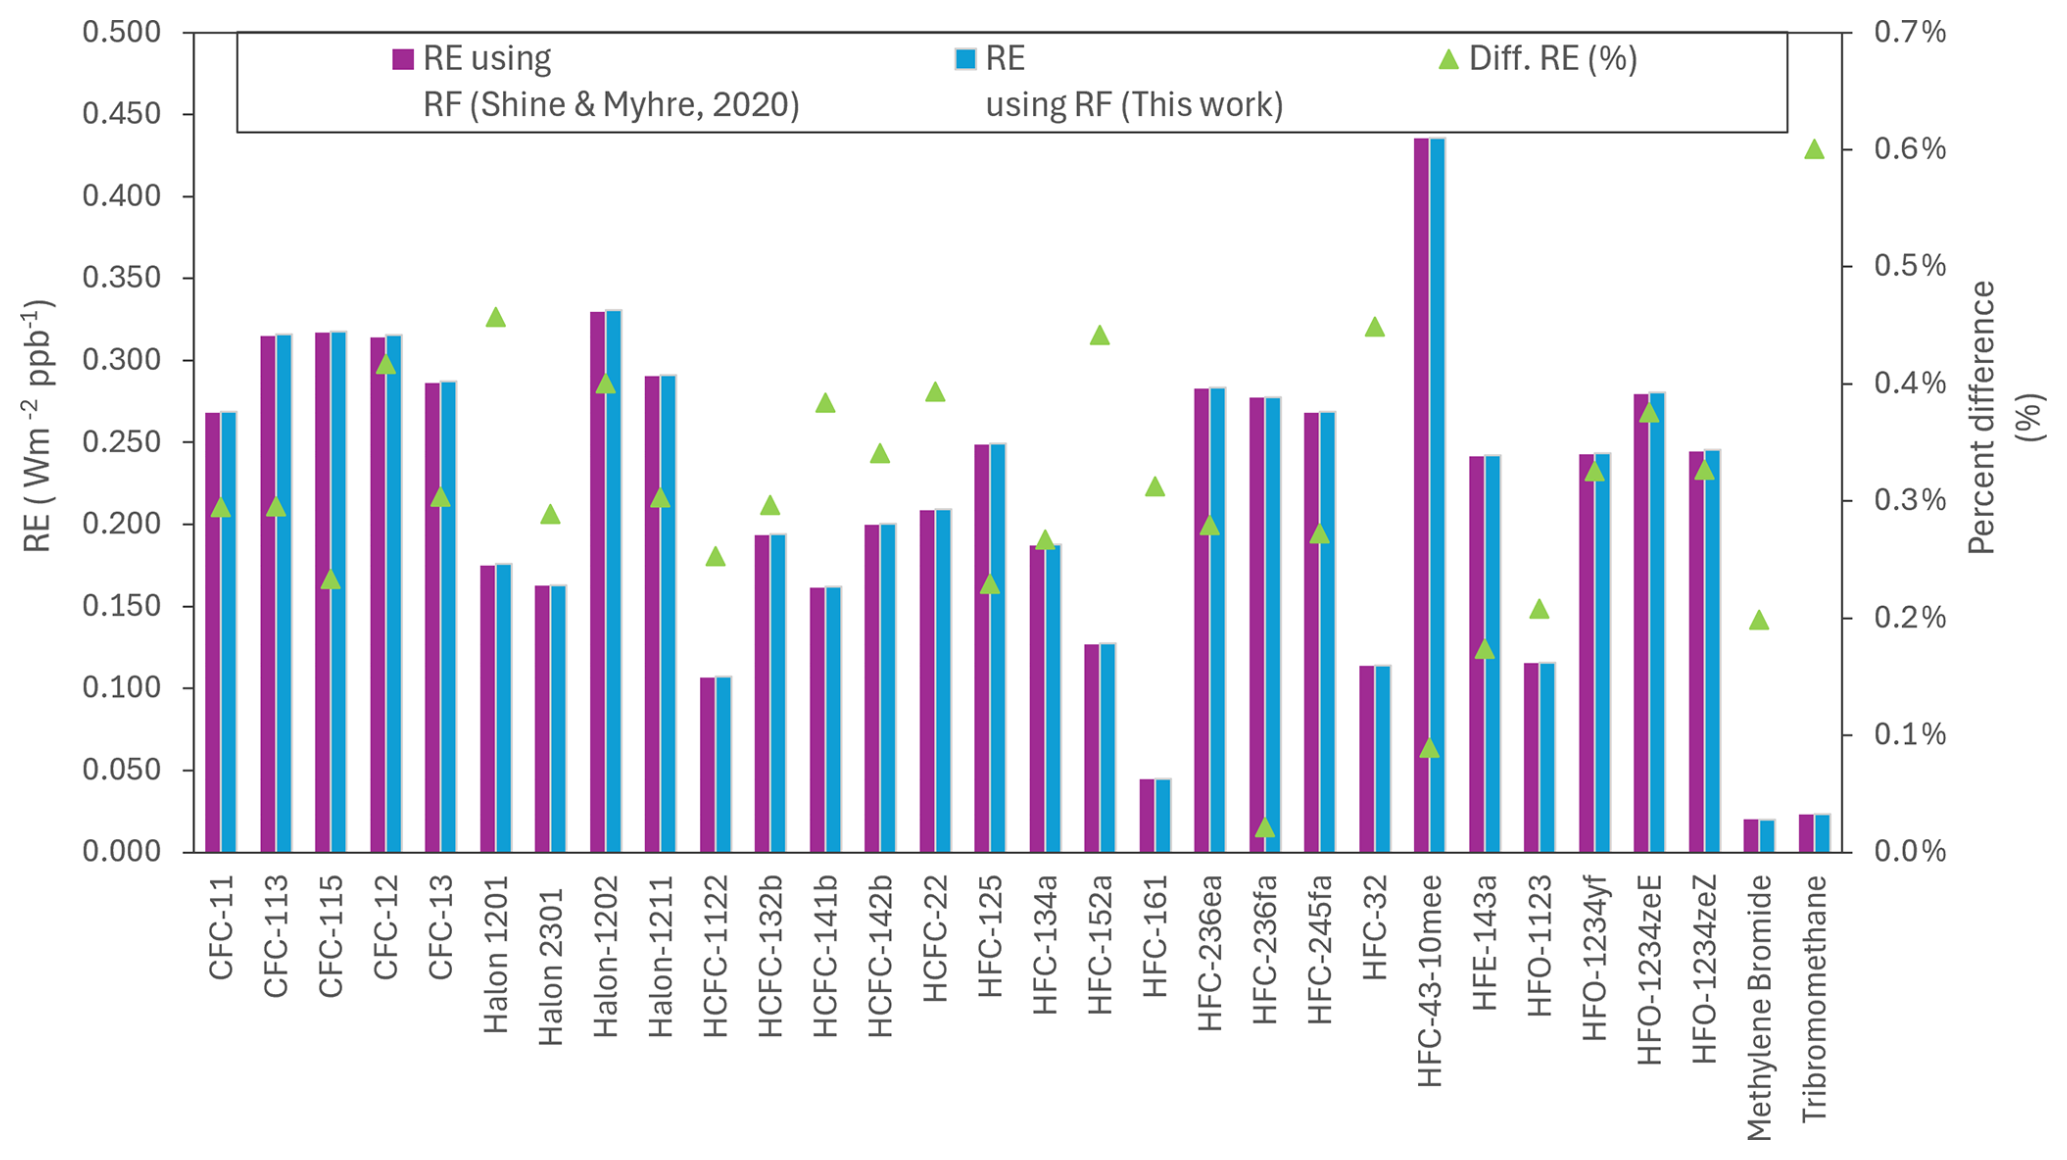
Figure 4REs (W m−2 ppb−1, left axis scale) determined using the updated Pinnock Curve (blue bars) and that of Shine and Myhre (2020) (purple bars) for 30 halocarbons. The percentage differences between the two sets of REs are also reported (green triangles, right axis scale). Values presented here use QC calculations of absorption cross-section over the entire 0–3000 cm−1 spectral region.
Figure 4 illustrates the total REs of all species included in the set of halocarbons, comprising contributions from both the medium-IR (namely 500–3000 cm−1) and low-wavenumber (<500 cm−1) regions. The figure compares two sets of REs: (i) those estimated using the Pinnock Curve from Shine and Myhre (2020), shown in purple, and (ii) those obtained with the updated curve presented in Sect. 3.2, in light blue. Lifetime adjustment was not incorporated into these RE values in order to separately assess the impact of the Pinnock Curve update. Overall, a slight increase in the REs can be seen for all halocarbons analyzed, with an average increase of about 0.3 %. Focusing on the low-wavenumber region, a small increase of similar magnitude can be reported on average amounting to W m−2 ppb−1 or about 0.3 %. The increase in the REs was expected, as recent adjustments to the water vapor self-continuum reduced atmospheric opacity within the 8–12 µm atmospheric window. Our results are consistent with those reported by Shine and Myhre (2020) when comparing RF functions obtained by using HITRAN2016 and MT_CKD_3.2 with the respective previous versions. Although the latest HITRAN and MT_CKD releases introduced significant updates, the changes tend to offset one another, producing compensatory effects as pointed out earlier (see Fig. 2). As a result, they only lead to a marginal modification of the Pinnock Curve and, consequently, to REs.
In the next step, for the target set of halogenated hydrocarbons, we estimated the portion of the RE stemming from the IR absorption cross sections below 500 cm−1. RE values due to the low-wavenumber region and their relative contribution to the total RE are presented in Table 2, where available literature results, obtained from harmonic QC calculations at the ωB97X-D/def2-TZVPPD level of theory (Van Hoomissen et al., 2023) are also reported. As can be seen by inspecting Table 2, the low-wavenumber contributions are usually small, below 1 % for most molecules and, focusing on the present results, only for HFC-152a and HFC-161 do they exceed 2 %. By comparing our results with those of Van Hoomissen et al. (2023) (penultimate column of Table 2), a higher low-wavenumber contribution to the REs can be seen, with the exception of HFC-236fa and HFC-245fa. The most important differences are noted for HFC-152a, HFC-236fa and HFC-245fa for which the RE due to the spectral region below 500 cm−1 are determined in the present work to be 3.0 %, 0.3 % and 1.8 %, respectively, whereas according to Van Hoomissen et al. (2023) they amount to 0.06 %, 4.8 % and 2.8 %.
At this point one may wonder whether these differences are due to the different Pinnock Curve's adopted in the two works, or whether they can be attributed to the different QC protocols. As demonstrated in the previous section, the updated Pinnock Curve does not introduce significant changes in the REs, compared to the previous RF curve (Shine and Myhre, 2020), even when the low-wavenumber region is considered separately. Moreover, the consistency between QC estimates of REs using different RF functions with experimental measurements (Alvarado-Jiménez and Tasinato, 2024) also suggests that variations in RE are more affected by the underlying IR absorption cross sections than modifications to the Pinnock Curve. Therefore, the origin of the differences is very likely due to the different approaches used in the QC estimation of the IR absorption cross section spectra.
While RE estimates based on experimentally acquired IR spectra are usually carried out in the 500–3000 cm−1, because low-wavenumber experimental data are very scarce, for four molecules, i.e. HCFC-132b, HFC-236fa, HFC-245fa,and HFC-43-10mee IR absorption cross sections have been measured down to about 150 cm−1, and used to estimate the corresponding RE contribution (Alvarado-Jiménez et al., 2025, 2026). According to these analyses, the experimentally determined proportion of the total RE due to the vibrational absorption in the region below 500 cm−1 is 0.3 %, 0.3 %, 1.9 % and 0.8 % for HCFC-132b, HFC-236fa, HFC-245fa and HFC-43-10mee, respectively. The correspondimg values for the QC calculations (Table 2) are 0.9 %, 0.3 %, 1.8 % and 0.8 % respectively. Hence, for HCFC-132b the low-wavenumber contribution appears slightly overestimated by QC calculations, but an excellent agreement is found for the three HFCs. Interestingly, while the lowest lying fundamental band of HFC-32, due to the ν4 normal mode, is centered at 528.3 cm−1 (Tasinato et al., 2012), a low-wavenumber contribution of W m−2 ppb−1 (ca. 0.5 %) is predicted from the present QC simulations. By inspecting the experimental IR cross-section spectrum (Tasinato et al., 2012), it is indeed seen that the tail of the ν4 band extends down to about 430 cm−1, and the experimental REs measured over the 400–500 cm−1 amounts to W m−2 ppb−1 (ca. 0.2 %). The capability to correctly predict this very small contribution stemming from the tail of a vibrational band gives further confidence in the accuracy of QC computations reported here. The close agreement between anharmonic QC simulations and laboratory experiments (Alvarado-Jiménez and Tasinato, 2024; Alvarado-Jiménez et al., 2025, 2026) highlights the importance of including anharmonic contributions in the simulations in a non-empirical way for both transition frequencies and intensities, since purely harmonic treatments may give apparently accurate results, while masking the lack of important physical effects.
Table 2QC anharmonic radiative efficiency (RE, W m−2 ppb−1) in the low-wavenumber (Low-) region (<500 cm−1), percentage contribution to the total RE (0–3000 cm−1) from this work and the literature (and the ratio of these two columns), and updated REs including the low- results from this work and experimental literature values for the 500–3000 cm−1 region.
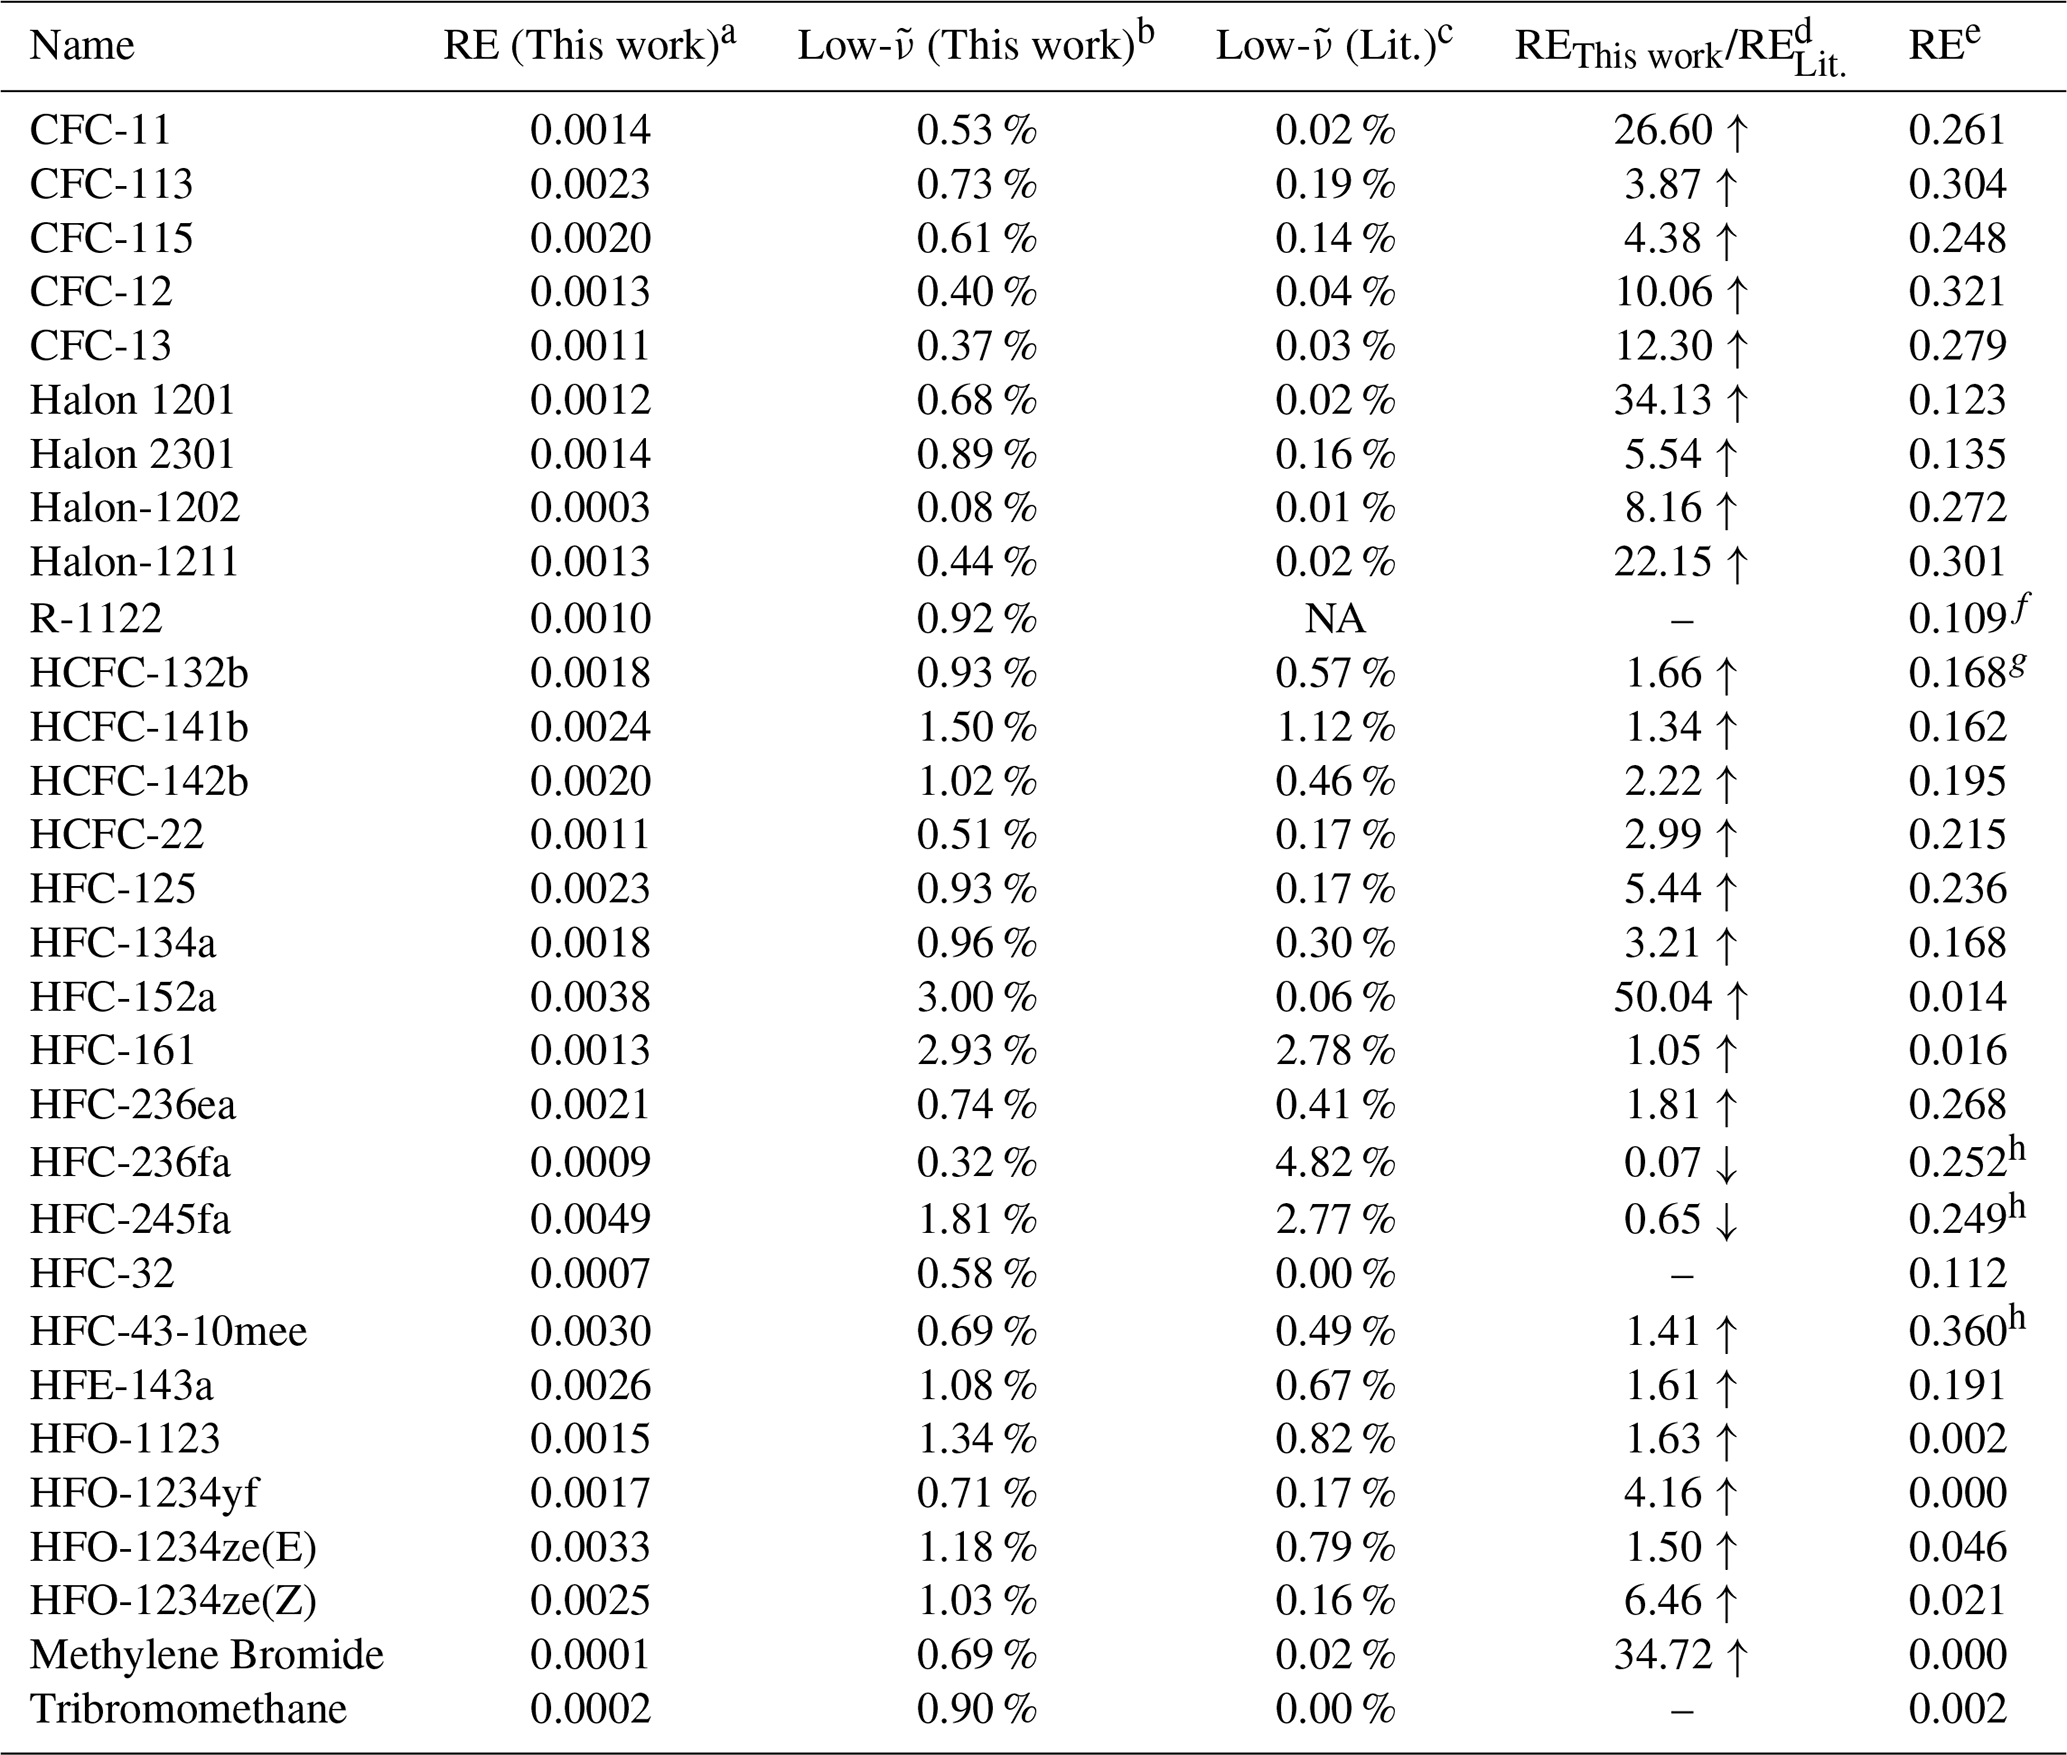
a RE in the 0–500 cm−1 region obtained according to present QC calculations. b Relative low-wavenumber contribution to the total RE obtained according to QC calculations. c Relative low-wavenumber contribution to the total RE obtained according to present Van Hoomissen et al. (2023). d Ratio between the relative low-wavenumber contribution to the total RE obtained according to present work and that from Van Hoomissen et al. (2023). e RE in the 500–3000 cm−1 taken from WMO (2022), except when explicitly indicated, with the RE at wavenumbers less than 500 cm−1 taken from this work (second column). f Experimental RE value obtained from Pietropolli Charmet et al. (2022a); lifetime correction was excluded. g Experimental RE value from 155–3000 cm−1 obtained from Alvarado-Jiménez et al. (2025). h Experimental RE value derived by combining data in the 130–500 cm−1 range from Alvarado-Jiménez et al. (2026) with the remaining spectral information from WMO (2022). NA: not available.
Finally, the last column of Table 2 reports the updated total 0–3000 cm−1 radiative efficiency values, obtained by adding the low-wavenumber contribution (in absolute terms) determined here to the RE determined using experimentally-measured cross-sections in the 500–3000 cm−1 range taken from the literature, and by applying the lifetime correction described in Sect. 2.3. Tropospheric adjustments, which were added to CFC-11 and CFC-12 in WMO (WMO, 2022), are not included.
It is important to assess the impact of updates in spectroscopic parameters collected in dedicated databases such as HITRAN, and improved descriptions of the water vapor continuum absorption on calculations of the radiative efficiency of halogenated gases. Even if the impact of these updates is small, it is necessary to ensure that they are properly documented. This is particularly so in the 8–12 µm atmospheric window where halogenated gases exert much of their radiative forcing.
In this work, an updated RF function for weak absorbers, i.e. the Pinnock Curve, has been computed, which incorporates line-by-line spectroscopic parameters from HITRAN2020 and the MT_CKD_4.3 water vapor continuum absorption together with STA. The new global mean RF was then employed to evaluate improved REs for a set of 30 halocarbons with the aim of assessing the contributions stemming from IR absorption cross sections in the low-wavenumber region, i.e. the 0–500 cm−1 spectral range, which is particularly challenging for experimental investigations. For this purpose, IR absorption cross section spectra and REs have been simulated by exploiting a recently proposed QC protocol relying on the use of the DSDPBEP86 density functional and the non-empirical inclusion of anharmonic effects in both transition frequencies and intensities and an automatic exploration of the molecular conformational space.
Interestingly, while adjustments to MT_CKD led to a reduced opacity this is counteracted by revisions in the HITRAN, overall leading to a modest impact on the resulting Pinnock Curve. This then leads to a modest change in the halocarbons REs which show a small increase – around 0.3 % – compared with those obtained using the previous version of the Pinnock Curve.
The REs due to the low wavenumber region for the range of halogenated compounds targeted in the present study have been determined to be in the range 0–0.5 mW m−2 ppb−1, corresponding to contributions within about 1.5 % (and typically lower than 1 %) to the overall RE for most halocarbons. Only for HFC-152a and HFC-161 does the far-IR spectral range have a larger influence of about 3 %. Comparison of the present results for the low frequency REs with available QC estimates has revealed some significant differences which we attributed to the use of the double-harmonic calculations and the ωB97X-D functional in earlier, rather than the more detailed method used here. For many gases, the low frequency contribution is more than 10 times greater than that calculated in the earlier work.
Furthermore, the good agreement between the present non‑empirical QC predictions – including anharmonic effects and conformer populations – and available experimental data at low wavenumbers (Alvarado-Jiménez et al., 2026) provides confidence in the low‑wavenumber contribution presented here. This provides further confidence in the applicability of our in silico workflow when experimental data are scarce or missing, which is often the case in the far-IR region.
By further narrowing existing uncertainties, this study provides a robust framework for future updates to international climate assessments and highlights the value of integrated experimental–computational approaches to obtain accurate spectral data. This remains important for radiative transfer models and hence for climate simulations and for assessing the impact of anthropogenic greenhouse gas emissions which is of importance for effective climate policies and strategies for mitigation.
The stick spectra from the QC calculations and the updated Pinnock Curve are provided in the Supplement. HITRAN spectral line data and MT_CKD continuum are available on the HITRAN website https://hitran.org/ (last access: 3 August 2026). For the Gaussian 16 QC package see https://gaussian.com/ (last access: 3 August 2026).
The supplement related to this article is available online at https://doi.org/10.5194/acp-26-13069-2026-supplement.
Conceptualization: NT, RB, KPS. Methodologies: DAJ, NT, KPS. Investigation: DAJ, NT, KPS. Software: DAJ, NT, KPS. Writing (original draft preparation): DAJ, NT, KPS. Supervision: NT, RB, KPS. Writing (review and editing): DAJ, NT, RB, KPS.
The contact author has declared that none of the authors has any competing interests.
Publisher's note: Copernicus Publications remains neutral with regard to jurisdictional claims made in the text, published maps, institutional affiliations, or any other geographical representation in this paper. The authors bear the ultimate responsibility for providing appropriate place names. Views expressed in the text are those of the authors and do not necessarily reflect the views of the publisher.
The STARK group is acknowledged for high-performance computing facilities. Scuola Normale Superiore and IUSS Pavia are acknowledged for financial support. This publication was produced while attending the PhD programme in PhD in Sustainable Development And Climate Change at the University School for Advanced Studies IUSS Pavia, Cycle XXXVIII, with the support of a scholarship co-financed by the Ministerial Decree no. 352 of 9 April 2022, based on the NRRP – funded by the European Union – Next Generation EU – Mission 4 “Education and Research”, Component 2 “From Research to Business”, Investment 3.3. The UK Natural Environment Research Council grant InHALE (Investigating HALocarbon impacts on the global Environment) supported the contributions from the University of Reading. We thank the reviewers for many helpful comments.
This research has been supported by the Natural Environment Research Council (grant no. NE/X004198/1) and the European Commission, NextGenerationEU.
This paper was edited by John Plane and reviewed by two anonymous referees.
Alvarado-Jiméez, D. and Tasinato, N.: In silico modelling of radiative efficiencies of anthropogenic greenhouse gases, Atmos. Environ., 338, 120839, https://doi.org/10.1016/j.atmosenv.2024.120839, 2024. a, b, c, d, e, f, g, h, i, j, k, l
Alvarado-Jiménez, D., Pietropolli Charmet, A., Stoppa, P., and Tasinato, N.: The Radiative Efficiency and Global Warming Potential of HCFC-132b, ChemPhysChem, 26, e202400632, https://doi.org/10.1002/cphc.202400632, 2025. a, b, c, d, e, f, g, h
Alvarado-Jiménez, D., Tasinato, N., Brownsword, R., Weidmann, D., Buizza, R., and Shine, K. P.: Low-frequency contributions in the radiative efficiencies of HFC-236fa, HFC-245fa and HFC-43-10mee over the 225–298 K temperature range, J. Quant. Spectrosc. Ra., https://doi.org/10.1016/j.jqsrt.2026.109908, 2026. a, b, c, d, e, f, g, h, i, j
Barone, V.: Anharmonic vibrational properties by a fully automated second-order perturbative approach, J. Chem. Phys, 122, 014108, https://doi.org/10.1063/1.1824881, 2004. a
Barone, V., Ceselin, G., Fusé, M., and Tasinato, N.: Accuracy meets interpretability for computational spectroscopy by means of hybrid and double-hybrid functionals, Front. Chem., 8, 584203, https://doi.org/10.3389/fchem.2020.584203, 2020. a, b
Bloino, J., Biczysko, M., and Barone, V.: General Perturbative Approach for Spectroscopy, Thermodynamics, and Kinetics: Methodological Background and Benchmark Studies, J. Chem. Theory Comput., 8, 1015–1036, https://doi.org/10.1021/ct200814m, 2012. a
Blowers, P. and Hollingshead, K.: Estimations of Global Warming Potentials from Computational Chemistry Calculations for CH2F2 and Other Fluorinated Methyl Species Verified by Comparison to Experiment, J. Phys. Chem. A., 113, 5942–5950, https://doi.org/10.1021/jp8114918, 2009. a
Boussessi, R., Ceselin, G., Tasinato, N., and Barone, V.: DFT meets the segmented polarization consistent basis sets: Performances in the computation of molecular structures, rotational and vibrational spectroscopic properties, J. Mol. Struct., 1208, 127886, https://doi.org/10.1016/j.molstruc.2020.127886, 2020. a
Burkholder, J. B., Marshall, P., Bera, P. P., Francisco, J. S., and Lee, T. J.: Climate Metrics for C1–C4 Hydrofluorocarbons (HFCs), J. Phys. Chem. A, 124, 4793–4800, https://doi.org/10.1021/acs.jpca.0c02679, 2020. a, b
Carnimeo, I., Puzzarini, C., Tasinato, N., Stoppa, P., Pietropolli Charmet, A., Biczysko, M., Cappelli, C., and Barone, V.: Anharmonic theoretical simulations of infrared spectra of halogenated organic compounds, J. Chem. Phys., 139, 074310, https://doi.org/10.1063/1.4817401, 2013. a
Feldman, D. R., Collins, W. D., Pincus, R., Huang, X., and Chen, X.: Far-infrared surface emissivity and climate, P. Natl. Acad. Sci. USA, 111, 16297–16302, https://doi.org/10.1073/pnas.1413640111, 2014. a
Forster, P., Storelvmo, T., Armour, K., Collins, W., Dufresne, J.-L., Frame, D., Lunt, D., Mauritsen, T., Palmer, M., Watanabe, M., Wild, M., and Zhang, H.: The Earth's Energy Budget, Climate Feedbacks, and Climate Sensitivity, IPCC 6th Assess. Rep., 923–1054, https://doi.org/10.1017/9781009157896.009, 2021. a, b
Forster, P. M., Smith, C. J., Walsh, T., Lamb, W. F., Lamboll, R., Hauser, M., Ribes, A., Rosen, D., Gillett, N., Palmer, M. D., Rogelj, J., von Schuckmann, K., Seneviratne, S. I., Trewin, B., Zhang, X., Allen, M., Andrew, R., Birt, A., Borger, A., Boyer, T., Broersma, J. A., Cheng, L., Dentener, F., Friedlingstein, P., Gutiérrez, J. M., Gütschow, J., Hall, B., Ishii, M., Jenkins, S., Lan, X., Lee, J.-Y., Morice, C., Kadow, C., Kennedy, J., Killick, R., Minx, J. C., Naik, V., Peters, G. P., Pirani, A., Pongratz, J., Schleussner, C.-F., Szopa, S., Thorne, P., Rohde, R., Rojas Corradi, M., Schumacher, D., Vose, R., Zickfeld, K., Masson-Delmotte, V., and Zhai, P.: Indicators of Global Climate Change 2022: annual update of large-scale indicators of the state of the climate system and human influence, Earth Syst. Sci. Data, 15, 2295–2327, https://doi.org/10.5194/essd-15-2295-2023, 2023. a
Freckleton, R. S., Highwood, E. J., Shine, K. P., Wild, O., Law, K. S., and Sanderson, M. G.: Greenhouse gas radiative forcing: Effects of averaging and inhomogeneities in trace gas distribution, Q. J. Roy. Meteor. Soc., 124, 2099–2127, https://doi.org/10.1002/qj.49712455014, 1998. a
Frisch, M. J., Trucks, G. W., Schlegel, H. B., Scuseria, G. E., Robb, M. A., Cheeseman, J. R., Scalmani, G., Barone, V., Petersson, G. A., Nakatsuji, H., Li, X., Caricato, M., Marenich, A. V., Bloino, J., Janesko, B. G., Gomperts, R., Mennucci, B., Hratchian, H. P., Ortiz, J. V., Izmaylov, A. F., Sonnenberg, J. L., Williams-Young, D., Ding, F., Lipparini, F., Egidi, F., Goings, J., Peng, B., Petrone, A., Henderson, T., Ranasinghe, D., Zakrzewski, V. G., Gao, J., Rega, N., Zheng, G., Liang, W., Hada, M., Ehara, M., Toyota, K., Fukuda, R., Hasegawa, J., Ishida, M., Nakajima, T., Honda, Y., Kitao, O., Nakai, H., Vreven, T., Throssell, K., Montgomery, J. A., Jr., Peralta, J. E., Ogliaro, F., Bearpark, M. J., Heyd, J. J., Brothers, E. N., Kudin, K. N., Staroverov, V. N., Keith, T. A., Kobayashi, R., Normand, J., Raghavachari, K., Rendell, A. P., Burant, J. C., Iyengar, S. S., Tomasi, J., Cossi, M., Millam, J. M., Klene, M., Adamo, C., Cammi, R., Ochterski, J. W., Martin, R. L., Morokuma, K., Farkas, O., Foresman, J. B., and Fox, D. J.: Gaussian 16 Revision C.01, Wallingford, CT, USA, 2016. a
Gava, M. L. L. M., Costa, S. M. S. D., and Sena, C. A. P.: The effects of changes in HITRAN and the water vapor continuum model on infrared radiative transfer calculations and remote sensing applications, J. Quant. Spectrosc. Ra., 322, 109025, https://doi.org/10.1016/j.jqsrt.2024.109025, 2024. a, b, c
Gierczak, T., Talukdar, R. K., Burkholder, J. B., Portmann, R. W., Daniel, J. S., Solomon, S., and Ravishankara, A. R.: Atmospheric fate and greenhouse warming potentials of HFC 236fa and HFC 236ea, J. Geophys. Res., 101, 12905–12911, https://doi.org/10.1029/96JD00059, 1996. a
Gordon, I. E., Rothman, L. S., Hill, C., Kochanov, R. V., Tan, Y., Bernath, P. F., Birk, M., Boudon, V., Campargue, A., Chance, K. V., Drouin, B. J., Flaud, J. M., Gamache, R. R., Hodges, J. T., Jacquemart, D., Perevalov, V. I., Perrin, A., Shine, K. P., Smith, M. A. H., Tennyson, J., Toon, G. C., Tran, H., Tyuterev, V. G., Barbe, A., Császár, A. G., Devi, V. M., Furtenbacher, T., Harrison, J. J., Hartmann, J. M., Jolly, A., Johnson, T. J., Karman, T., Kleiner, I., Kyuberis, A. A., Loos, J., Lyulin, O. M., Massie, S. T., Mikhailenko, S. N., Moazzen-Ahmadi, N., Müller, H. S. P., Naumenko, O. V., Nikitin, A. V., Polyansky, O. L., Rey, M., Rotger, M., Sharpe, S. W., Sung, K., Starikova, E., Tashkun, S. A., Auwera, J. V., Wagner, G., Wilzewski, J., Wcisło, P., Yu, S., and Zak, E. J.: The HITRAN2016 molecular spectroscopic database, J. Quant. Spectrosc. Radiat. Transf., 203, 3–69, https://doi.org/10.1016/j.jqsrt.2017.06.038, 2017. a, b
Gordon, I. E., Rothman, L. S., Hargreaves, R. J., Hashemi, R., Karlovets, E. V., Skinner, F. M., Conway, E. K., Hill, C., Kochanov, R. V., Tan, Y., Wcisło, P., Finenko, A. A., Nelson, K., Bernath, P. F., Birk, M., Boudon, V., Campargue, A., Chance, K. V., Coustenis, A., Drouin, B. J., Flaud, J., Gamache, R. R., Hodges, J. T., Jacquemart, D., Mlawer, E. J., Nikitin, A. V., Perevalov, V. I., Rotger, M., Tennyson, J., Toon, G. C., Tran, H., Tyuterev, V. G., Adkins, E. M., Baker, A., Barbe, A., Canè, E., Császár, A. G., Dudaryonok, A., Egorov, O., Fleisher, A. J., Fleurbaey, H., Foltynowicz, A., Furtenbacher, T., Harrison, J. J., Hartmann, J., Horneman, V. â., Huang, X., Karman, T., Karns, J., Kassi, S., Kleiner, I., Kofman, V., Kwabia-Tchana, F., Lavrentieva, N. N., Lee, T. J., Long, D. A., Lukashevskaya, A. A., Lyulin, O. M., Makhnev, V. Y., Matt, W., Massie, S. T., Melosso, M., Mikhailenko, S. N., Mondelain, D., Müller, H. S. P., Naumenko, O. V., Perrin, A., Polyansky, O. L., Raddaoui, E., Raston, P. L., Reed, Z. D., Rey, M., Richard, C., Tóbiás, R., Sadiek, I., Schwenke, D. W., Starikova, E., Sung, K., Tamassia, F., Tashkun, S. A., Vander Auwera, J., Vasilenko, I. A., Vigasin, A. A., Villanueva, G. L., Vispoel, B., Wagner, G., Yachmenev, A., and Yurchenko, S. N.: The HITRAN2020 molecular spectroscopic database, J. Quant. Spectrosc. Ra., 277, 107949, https://doi.org/10.1016/j.jqsrt.2021.107949, 2022. a, b, c
Gordon, I. E., Rothman, L. S., Hargreaves, R. J., Gomez, F. M., Bertin, T., Hill, C., Kochanov, R. V., Tan, Y., Wcisło, P., Makhnev, V. Y., Bernath, P. F., Birk, M., Boudon, V., Campargue, A., Coustenis, A., Drouin, B. J., Gamache, R. R., Hodges, J. T., Jacquemart, D., Mlawer, E. J., Nikitin, A. V., Perevalov, V. I., Rotger, M., Robert, S., Tennyson, J., Toon, G. C., Tran, H., Tyuterev, V. G., Adkins, E. M., Barbe, A., Bailey, D. M., Bielska, K., Bizzocchi, L., Blake, T. A., Bowesman, C. A., Cacciani, P., Čermák, P., Császár, A. G., Denis, L., Egbert, S. C., Egorov, O., Ermilov, A. Y., Fleisher, A. J., Fleurbaey, H., Foltynowicz, A., Furtenbacher, T., Germann, M., Guest, E. R., Harrison, J. J., Hartmann, J. M., Hjältén, A., Hu, S. M., Huang, X., Johnson, T. J., Jóźwiak, H., Kassi, S., Khan, M. V., Kwabia-Tchana, F., Lee, T. J., Lisak, D., Liu, A. W., Lyulin, O. M., Malarich, N. A., Manceron, L., Marinina, A. A., Massie, S. T., Mascio, J., Medvedev, E. S., Meshkov, V. V., Mellau, G. C., Melosso, M., Mikhailenko, S. N., Mondelain, D., Müller, H. S. P., O'Donnell, M., Owens, A., Perrin, A., Polyansky, O. L., Raston, P. L., Reed, Z. D., Rey, M., Richard, C., Rieker, G. B., Röske, C., Sharpe, S. W., Starikova, E., Stolarczyk, N., Stolyarov, A. V., Sung, K., Tamassia, F., Terragni, J., Ushakov, V. G., Vasilchenko, S., Vispoel, B., Vodopyanov, K. L., Wagner, G., Wójtewicz, S., Yurchenko, S. N., and Zobov, N. F.: The HITRAN2024 molecular spectroscopic database, J. Quant. Spectrosc. Ra., 353, 109807, https://doi.org/10.1016/j.jqsrt.2026.109807, 2026. a, b, c
Grimme, S., Antony, J., Ehrlich, S., and Krieg, H.: A Consistent and Accurate Ab Initio Parametrization of Density Functional Dispersion Correction (DFT-D) for the 94 Elements H-Pu, J. Chem. Phys, 132, 154104, https://doi.org/10.1063/1.3382344, 2010. a
Grimme, S., Ehrlich, S., and Goerigk, L.: Effect of the damping function in dispersion corrected density functional theory, J. Comput. Chem., 32, 1456–1465, https://doi.org/10.1002/jcc.21759, 2011. a
Harries, J., Carli, B., Rizzi, R., Serio, C., Mlynczak, M., Palchetti, L., Maestri, T., Brindley, H., and Masiello, G.: The Far-infrared Earth, Rev. Geophys, 46, https://doi.org/10.1029/2007RG000233, 2008. a
Hodnebrog, Ø., Etminan, M., Fuglestvedt, J. S., Marston, G., Myhre, G., Nielsen, C. J., Shine, K. P., and Wallington, T. J.: Global warming potentials and radiative efficiencies of halocarbons and related compounds: A comprehensive review, Rev. Geophys., 51, 300–378, https://doi.org/10.1002/rog.20013, 2013. a, b, c, d
Hodnebrog, Ø., Aamaas, B., Fuglestvedt, J. S., Marston, G., Myhre, G., Nielsen, C. J., Sandstad, M., Shine, K. P., and Wallington, T. J.: Updated Global Warming Potentials and Radiative Efficiencies of Halocarbons and Other Weak Atmospheric Absorbers, Rev. Geophys., 58, e2019RG000691, https://doi.org/10.1029/2019RG000691, 2020. a, b, c, d
Holtomo, O., Motapon, O., and Nsangou, M.: DFT Study of Photochemical Properties and Radiative Forcing Efficiency Features of the Stereoisomers cis- and trans-CHCl=CH-CF3, J. Phys. Chem. A., 123, 10437–10445, https://doi.org/10.1021/acs.jpca.9b08089, 2019. a
Melosso, M., Stoppa, P., Alvarado-Jiménez, D., Tamassia, F., Sapienza, C., Bizzocchi, L., Dore, L., Puzzarini, C., Pietropolli Charmet, A., and Tasinato, N.: Completing the Spectral Mosaic of Chloromethane by Adding the CHD2Cl Missing Piece Through the Interplay of Rotational/Vibrational Spectroscopy and Quantum Chemical Calculations, Molecules, 30, 1604, https://doi.org/10.3390/molecules30071604, 2025. a
Mlawer, E. J., Turner, D. D., Paine, S. N., Palchetti, L., Bianchini, G., Payne, V. H., Cady-Pereira, K. E., Pernak, R. L., Alvarado, M. J., Gombos, D., Delamere, J. S., Mlynczak, M. G., and Mast, J. C.: Analysis of Water Vapor Absorption in the Far-Infrared and Submillimeter Regions Using Surface Radiometric Measurements From Extremely Dry Locations, J. Geophys. Res.-Atmos., 124, 8134–8160, https://doi.org/10.1029/2018JD029508, 2019. a, b, c, d
Mlawer, E. J., Cady-Pereira, K. E., Mascio, J., and Gordon, I. E.: The inclusion of the MT_CKD water vapor continuum model in the HITRAN molecular spectroscopic database, J. Quant. Spectrosc. Ra., 306, 108645, https://doi.org/10.1016/j.jqsrt.2023.108645, 2023. a, b, c, d, e
Mlawer, E. J., Mascio, J., Turner, D. D., Payne, V. H., Flynn, C. J., and Pincus, R.: A More Transparent Infrared Window, https://doi.org/10.1029/2024JD041366, 2024. a, b, c, d, e
Myhre, G. and Stordal, F.: Role of spatial and temporal variations in the computation of radiative forcing and GWP, J. Geophys. Res.-Atmos., 102, 11181–11200, https://doi.org/10.1029/97JD00148, 1997. a
Myhre, G., Stordal, F., Gausemel, I., Nielsen, C. J., and Mahieu, E.: Line-by-line calculations of thermal infrared radiation representative for global condition: CFC-12 as an example, J. Quant. Spectrosc. Ra., 97, 317–331, https://doi.org/10.1016/j.jqsrt.2005.04.015, 2006. a
Orkin, V. L., Martynova, L. E., and Ilichev, A. N.: High-Accuracy Measurements of OH Reaction Rate Constants and IR Absorption Spectra: CH2=CF-F3 and trans-CHF=CH-CF3, J. Phys. Chem. A, 114, 5967–5979, https://doi.org/10.1021/jp9092817, 2010. a
Papajak, E., Zheng, J., Xu, X., Leverentz, H. R., and Truhlar, D. G.: Perspectives on Basis Sets Beautiful: Seasonal Plantings of Diffuse Basis Functions, J. Chem. Theory Comput., 7, 3027–3034, https://doi.org/10.1021/ct200106a, 2011. a
Papasavva, S., Tai, S., Esslinger, A., Illinger, K. H., and Kenny, J. E.: Ab Initio Calculations of Vibrational Frequencies and Infrared Intensities for Global Warming Potential of CFC Substitutes: CF3CH2F (HFC-134a), J. Phys. Chem. A., 99, 3438–3443, https://doi.org/10.1021/j100011a006, 1995. a
Papoušek, D. and Aliev, M. R.: Molecular vibrational/rotational spectra, Elsevier, Amsterdam, ISBN: 0-444-99737-7, 1982. a
Peterson, K. A., Figgen, D., Goll, E., Stoll, H., and Dolg, M.: Systematically convergent basis sets with relativistic pseudopotentials. II. Small-core pseudopotentials and correlation consistent basis sets for the post-d group 16–18 elements, J. Chem. Phys., 119, 11113–11123, https://doi.org/10.1063/1.1622924, 2003. a
Pietropolli Charmet, A., Ceselin, G., Stoppa, P., and Tasinato, N.: The Spectroscopic Characterization of Halogenated Pollutants through the Interplay between Theory and Experiment: Application to R1122, Molecules, 27, 748, https://doi.org/10.3390/molecules27030748, 2022a. a
Pietropolli Charmet, A., Ceselin, G., Stoppa, P., and Tasinato, N.: The Spectroscopic Characterization of Halogenated Pollutants through the Interplay between Theory and Experiment: Application to R1122, Molecules, 27, 748, https://doi.org/10.3390/molecules27030748, 2022b. a
Pinnock, S., Hurley, M. D., Shine, K. P., Wallington, T. J., and Smyth, T. J.: Radiative forcing of climate by hydrochlorofluorocarbons and hydrofluorocarbons, J Geophys. Res.-Atmos., 100, 23227–23238, https://doi.org/10.1029/95JD02323, 1995. a, b, c, d
Pritchard, B. P., Altarawy, D., Didier, B., Gibson, T. D., and Windus, T. L.: New Basis Set Exchange: An Open, Up-to-Date Resource for the Molecular Sciences Community, J. Chem. Inf. Model., 59, 4814–4820, https://doi.org/10.1021/acs.jcim.9b00725, 2019. a
Puzzarini, C., Bloino, J., Tasinato, N., and Barone, V.: Accuracy and Interpretability: The Devil and the Holy Grail. New Routes across Old Boundaries in Computational Spectroscopy, Chem. Rev., 119, 8131–8191, https://doi.org/10.1021/acs.chemrev.9b00007, 2019. a, b
Rais, N., Salta, Z., and Tasinato, N.: Thermochemistry and Kinetics of the OH- and Cl-Initiated Degradation Pathways of the HCFC-132b Atmospheric Pollutant, ACS Earth Space Chem., 7, 892–900, https://doi.org/10.1021/acsearthspacechem.3c00025, 2023. a
Rais, N., Salta, Z., and Tasinato, N.: Theoretical Investigation of the OH-initiated Atmospheric Degradation Mechanism of CX2CHX (X = H, F, Cl) by Advanced Quantum Chemical and Transition State Theory Methods, Phys. Chem. Chem. Phys., 26, 19976–19991, https://doi.org/10.1039/D4CP01453G, 2024. a
Santra, G., Sylvetsky, N., and Martin, J. M. L.: Minimally Empirical Double-Hybrid Functionals Trained against the GMTKN55 Database: revDSD-PBEP86-D4, revDOD-PBE-D4, and DOD-SCAN-D4, J. Phys. Chem. A, 123, 5129–5143, https://doi.org/10.1021/acs.jpca.9b03157, 2019. a
Sharpe, S. W., Johnson, T. J., Sams, R. L., Chu, P. M., Rhoderick, G. C., and Johnson, P. A.: Gas-Phase Databases for Quantitative Infrared Spectroscopy, Appl. Spectrosc., 58, 1452–1461, https://doi.org/10.1366/0003702042641281, 2004. a, b
Shine, K. P. and Myhre, G.: The Spectral Nature of Stratospheric Temperature Adjustment and its Application to Halocarbon Radiative Forcing, J. Adv. Model. Earth Sy., 12, e2019MS001951, https://doi.org/10.1029/2019MS001951, 2020. a, b, c, d, e, f, g, h, i, j, k, l, m, n, o, p
Sihra, K., Hurley, M. D., Shine, K. P., and Wallington, T. J.: Updated radiative forcing estimates of 65 halocarbons and nonmethane hydrocarbons, J. Geophys. Res.-Atmos., 106, 20493–20505, https://doi.org/10.1029/2000JD900716, 2001. a
Tasinato, N., Regini, G., Stoppa, P., Pietropolli Charmet, A., and Gambi, A.: Anharmonic force field and vibrational dynamics of CH2F2 up to 5000 cm−1 studied by Fourier transform infrared spectroscopy and state-of-the-art ab initio calculations, J. Chem. Phys, 136, 214302, https://doi.org/10.1063/1.4720502, 2012. a, b, c, d
Tasinato, N., Puzzarini, C., and Barone, V.: Correct Modeling of Cisplatin: a Paradigmatic Case, Angew. Chem. Int. Edit., 56, 13838–13841, https://doi.org/10.1002/anie.201707683, 2017. a
Tokuhashi, K., Takizawa, K., and Kondo, S.: Rate constants for the reactions of OH radicals with CF3CX=Y2 (X=H, F, CF3, Y=H, F, Cl), Environ. Sci. Pollut. Res., 25, 15204–15215, https://doi.org/10.1007/s11356-018-1700-4, 2018. a
Van Hoomissen, D., Papadimitriou, V. C., and Burkholder, J. B.: Low frequency (<500 cm−1) contribution to greenhouse gas radiative efficiency, Mol. Phys., 112, e2273412, https://doi.org/10.1080/00268976.2023.2273412, 2023. a, b, c, d, e, f, g
World Meteorological Organization (WMO): Scientific Assessment of Ozone Depletion: 2022, GAW Report No. 278, WMO, Geneva, Switzerland, ISBN 978-9914-733-97-6, 2022. a, b, c, d, e
Young, C. J., Hurley, M. D., Wallington, T. J., and Mabury, S. A.: Molecular structure and radiative efficiency of fluorinated ethers: A structure-activity relationship, J. Geophys. Res.-Atmos., 113, https://doi.org/10.1029/2008JD010178, 2008. a
Zhang, N., Chen, L., Uchimaru, T., Qing, F., Mizukado, J., Quan, H., and Suda, H.: Kinetics of gas-phase reactions of cyc-CF2CF2CF2CHFCH2 and trans-cyc-CF2CF2CF2CHFCHF with OH radicals between 253–328 K with OH radicals between 253–328 K, Chem. Phys. Lett., 639, 199–204, https://doi.org/10.1016/j.cplett.2015.09.020, 2015. a
Zhao, Y. and Truhlar, D. G.: Design of Density Functionals That Are Broadly Accurate for Thermochemistry, Thermochemical Kinetics, and Nonbonded Interactions, J. Phys. Chem. A, 109, 5656–5667, https://doi.org/10.1021/jp050536c, 2005. a