
the Creative Commons Attribution 4.0 License.
the Creative Commons Attribution 4.0 License.
 | 26 Aug 2026
Ecosystem-scale biogenic volatile organic compound fluxes over rapeseed by eddy-covariance
Florence Lafouge
Raluca Ciuraru
Brigitte Durand
Olivier Zurfluh
Céline Décuq
Olivier Fanucci
Lais Gonzaga Gomez
Jean-Christophe Gueudet
Sandy Bsaibes
Nora Zannoni
Valérie Gros
Benjamin Loubet
Biogenic volatile organic compounds (BVOCs) are key precursors of ozone and secondary organic aerosols, yet their emissions from croplands remain poorly characterized. Here, we report what is, to our knowledge, the first ecosystem-scale quantification of BVOC fluxes over a rapeseed crop during fruit development and senescence. Measurements were conducted at the FR-Gri ICOS site near Paris (France) in May–June 2017 using eddy covariance with a proton-transfer-reaction quadrupole ion guide time-of-flight mass spectrometer (PTR-Qi-TOF-MS). In total, 42 BVOCs were significantly emitted or deposited. Methanol dominated emissions during fruit development (about 90 % of total molar flux), followed by monoterpenes, acetone, and isoprene. During senescence, formaldehyde and methanethiol emerged as additional contributors and emission fluxes of oxygenated compounds like methanol, acetone, acetaldehyde, formaldehyde, formic acid and acetic acid were larger than during the fruit development period. Deposition fluxes over both periods were mainly attributed to formic acid (about 50 %), with smaller contributions from other oxygenated BVOCs. Several BVOCs, including formaldehyde and acetic acid, exhibited bidirectional fluxes. Besides, our findings show that the oxygenated BVOC SEFs, that were calculated in the present study with a slightly modified version of the MEGAN2.1 equations, were generally smaller than what is estimated in MEGAN2.1, while terpenoid BVOCs (isoprene, monoterpenes) SEFs may be underestimated in that model. Finally, our study points out that the contribution to total OH reactivity is mostly due to terpenoids (about 40 %), which suggests a larger role of croplands in secondary organic aerosol formation than currently represented in models.
- Article
(1663 KB) - Full-text XML
-
Supplement
(8649 KB) - BibTeX
- EndNote


Volatile organic compounds (VOCs) only make up a small fraction of air composition and are negligible greenhouse gases, but they play an important role in atmospheric chemistry and have an indirect effect on climate (Isaksen et al., 2009; Peñuelas and Staudt, 2010). Indeed, in the presence of nitrogen oxides and solar radiation, these compounds can form ozone, a greenhouse gas and pollutant (Atkinson and Arey, 2003; Sartelet et al., 2012). They are also precursors of secondary organic aerosols (SOA) when influenced by solar radiation and meteorological parameters like temperature and humidity (Mahilang et al., 2021; Sakulyanontvittaya et al., 2008). Also, by reducing the oxidative capacity of the atmosphere through the consumption of OH radicals, they can increase methane lifetime in the troposphere (Kaplan et al., 2006; Stevenson et al., 2020; Boy et al., 2022). Furthermore, VOCs may affect health directly; such as terpenoids that may cause allergies (Butcher et al., 1994, 1995; McEwan and Macfarlane Smith, 1998), or carbonyl compounds and methyl halides that may be harmful to the environment, respectively due the phytotoxic characteristics of the compounds they contribute to form, and to their contribution to the ozone layer destruction (Müller et al., 2002; Jiao et al., 2020).
VOC emissions can be either anthropogenic or biogenic (BVOC), the latter representing up to 90 % of the total emissions (Guenther et al., 1995) globally. According to Karl et al. (2009), in Europe forests contribute 55 % of total BVOC emissions from terrestrial ecosystems and agricultural lands to 27 %. Forests are strong emitters of the two most contributing BVOC species, isoprene and monoterpenes (Sindelarova et al., 2014), while croplands mostly release oxygenated BVOCs like methanol and acetone (Bachy et al., 2016, 2018, 2020; Das et al., 2003; Gonzaga Gomez et al., 2019; Graus et al., 2013; Havermann et al., 2022; Loubet et al., 2022; Wiß et al., 2017). As forests are the largest emitters of terpenoids globally (reactive compounds that significantly impact atmospheric chemistry), forests have been more studied than agricultural ecosystems. However, better quantification of BVOC exchanged fluxes in agricultural ecosystems is needed and started a decade ago. The variety of crop species and phenological stages have to be considered and documented to improve regional and global BVOC emission estimates, as they greatly influence the type and magnitude of BVOC emissions (Courtois et al., 2009; Manco et al., 2021; Vivaldo et al., 2017). For example, the MEGAN2.1 model (Guenther et al., 2012) gathers all crop species into a unique “crop” category so that BVOC emission factors reflect neither the variety among crop species nor the phenological stages of the crops.
Among the main crop species in Europe, wheat and maize are the crop species in which BVOC emissions have been the most widely quantified from the leaf to the ecosystem scale and through laboratory experiments (Mozaffar et al., 2018; Piesik et al., 2011) and field campaigns (Bachy et al., 2016, 2020; Gallagher et al., 2000; Gomez et al., 2021; Gonzaga Gomez et al., 2019; Morrison et al., 2016). However, although rapeseed represents a large share of oilseed production in France, Europe, and the world, data on BVOC emissions from rapeseed plants and fields are scarce. France is indeed the first country in Europe in rapeseed production. Europe is the world leader (30 %) in this crop production (Woźniak et al., 2019), with rapeseed representing the most significant share of oilseed production (63 %) in Europe and the second most important one after soya bean in the world (FAOSTAT, 2023). Early BVOC studies performed on rapeseed, using adsorption on Tenax-TA tubes and gas chromatography-mass spectrometry (GC-MS) analysis, provided estimations of BVOC compounds emitted (Butcher et al., 1994, 1995) and their relative mixing ratios (Konig, 1995; McEwan and Macfarlane Smith, 1998). The former reported the emission of oxygenated BVOCs, together with terpenoid-like compounds, and the latter showed that flowering rapeseed was emitting various types of terpenes, together with a few sulphur compounds. Later, Müller et al. (2002), using the cuvette technique, self-filled stainless steel adsorption tubes and subsequent GC-MS analysis, quantified emission fluxes of monoterpenes and carbonyl compounds. They also pointed out the significant difference between the fluxes measured in earlier studies and their work, likely attributed to differences in measurement techniques. Gonzaga Gomez et al. (2019) and, more recently, Havermann et al. (2022) performed direct chamber measurements on rapeseed plants in the field. The latter reported emission fluxes for 25 BVOCs using a proton transfer reaction quadrupole mass spectrometer (PTR-QMS 500), and the former, using the “Time-Of-Flight” technology with a PTR-Qi-TOF-MS that allows for the compounds to be detected simultaneously at a high frequency (10 Hz), managed to detect over more than 400 significant BVOCs exchanged by rapeseed plants. However, while the quantification of BVOC flux exchanges at the ecosystem or field scale, using eddy-covariance setups, has already been performed successfully in forests (Acton et al., 2016; Brilli et al., 2014a, 2016; Gallagher et al., 2000; Park et al., 2013, 2014; Jensen et al., 2018; Millet et al., 2018; Schallhart et al., 2016, 2018; Sarkar et al., 2020), grasslands (Bamberger et al., 2011; Ruuskanen et al., 2011), maize and wheat crops (Bachy et al., 2016, 2018, 2020; Karl et al., 2001 (virtual disjunct eddy-covariance); Loubet et al., 2022), and even more recently to a shallow lake at a peatland site (Seco et al., 2020) and urban areas (Acton et al., 2020), such information for rapeseed crops is, to our knowledge, still missing. Compared to chamber measurements, eddy-covariance allows (i) to integrate the whole ecosystem over several hectares (generally from about 4 ha up to 60–70 ha in forested areas), including the canopy and the soil, without disturbing the ecosystem (ii) to detect more reactive species given the shorter residence time in the inlet tube than in chambers, and (iii) to quantify deposition fluxes, which is challenging in chambers due to long residence time, interactions with chamber surfaces, and is even not possible when chambers are filled with zero air.
The objectives of this study were, with the use of an eddy-covariance setup integrating a PTR-Qi-TOF-MS, (i) to identify the main exchanged BVOCs from a rapeseed field during the late vegetation development stages, (ii) to quantify BVOC fluxes (emission and deposition) at the field scale using the eddy-covariance technique, (iii) to provide emission factors specific to rapeseed, therefore contributing to improve modelled BVOC emissions in croplands, and (iv) to evaluate the potential effect of these emissions on OH reactivity in the atmosphere, relative to existing emission factors.
2.1 Measurement site
The field campaign took place at the Grignon FR-Gri site (48.8442° N, 1.9519° E; elevation 125 m), about 40 km west of Paris (France). The site is part of the European ICOS network (Integrated Carbon Observing System, http://www.icos-ri.eu, last access: 19 August 2026). It consists of a 19 ha field on a relatively flat plateau with a gentle slope of approximately 1 % towards the northeast. The soil is classified as silt loam (10 % sand, 71 % silt, 19 % clay) in the cultivated layer. The site is surrounded by other agricultural fields and a mixed farm with animal houses to the southwest (at around 400 m distance). The farm livestock is substantial, with about 200 cows and 500 sheep and a production of 900 lambs yr−1 on average. As shown by earlier studies at the same site (Kammer et al., 2020; Loubet et al., 2011, 2022), both the animal house and the fields are a large source of ammonia and a significant source of VOCs, among which methanol, ethanol and acetaldehyde, together with trimethylamine and dimethylsulfide. The field is also bordered by a road with heavy traffic located at more than 900 m to the east and other roads with less traffic to the north (300 m) and west (700 m), which were shown to be sources of NOx (Vuolo et al., 2017). Loubet et al. (2011) give more details about the site.
The field is managed with the following crop rotation: maize, winter wheat, winter barley, and mustard as a catch crop, and with reduced tillage since 2000. Rapeseed (Brassica napus L.) is also sown occasionally at the field site, such as in August 2012 and 16 August 2016 (Bohême variety) for the present field campaign. The field usually receives a variable amount of nitrogen ranging between 150 and 300 kg N ha−1 yr−1, mainly as nitrogen solution and cattle manure (usually once every 3 years; the last application was on 12 August 2016). Before the present campaign, the field received 3 times 39 kg N ha−1 of urea ammonium nitrate solution (UAN, 5 % NO3, 25 % NH4 and 50 % CO(NH2)2, applied on 20 February, 3 and 22 March 2017), two insecticide applications (12 and 28 March 2017, 0.05 L ha−1, MAGEOS®, Alpha-Cypermethrin 15 %) and a fungicide application (15 April, 0.4 L ha−1, FILAN SC®, 200 g L−1 Boscalid and 200 g L−1 Dimoxystrobin). The preceding crop was winter wheat, harvested in July 2016. Rapeseed was harvested on 30 July 2017. The average above-ground rapeseed biomass sampled and determined at the maturity stage (19 April 2017) was 781 ± 188 g m−2.
2.2 Eddy-covariance BVOC fluxes
BVOC fluxes were measured almost continuously (a few interruptions being due to technical problems with the set-up) from 9 May to 30 June 2017 with the eddy-covariance (EC) method, this period corresponding to mature and senescent rapeseed vegetation (BBCH stages from 70s to 90s, see Sect. 2.4.2). The experimental setup was part of a larger BVOC mixing ratio measurement campaign with profile measurements (see Sect. 2.4.1 and Supplement S4), and chamber measurements (Gonzaga Gomez et al., 2019), similar to the campaign described in Loubet et al. (2022). Air was sampled at 3 m height through a 50 m-60 °C-heated PFA tube at 50 NL min−1 with a SV-1010 pump (Busch, Switzerland). The three components of the wind velocity (u, v, w) and the sonic temperature were recorded at 20 Hz with an ultrasonic anemometer (model R3-50, Gill Instruments Ltd., UK), 20 cm apart from the air inlet.
BVOC mixing ratios were measured at 10 Hz with a PTR-Qi-TOF-MS (Ionicon, Innsbruck, Austria), operated at the same conditions as in Gonzaga Gomez et al. (2019). In the drift tube, the pressure Pd was set to 4 ± 0.01 mbar, the drift temperature Td to 80 ± 0.04 °C, and the drift voltage E to 994.96 ± 1.03 V, while the extraction voltage at the end of the tube UDx was 44.09 ± 0.27 V. These conditions ensured an ratio (where N is the number density of the gas molecules in the drift tube) of 131.85 ± 0.19 Td (1 Td = 10−17 V cm−2). Once extracted from the drift tube, the protonated ions were pulsed and separated according to their mass-to-charge () ratio at a rate of 25 kHz, leading to 2500-extracted spectra per 100 ms. The detection channels were set to 240 000, and the mass spectrum spanned from 15 to 530. BVOCs were identified based on expert knowledge. Many BVOCs could not be unequivocally identified.
The raw data (in counts per second, cps) from the PTR-Qi-TOF-MS were synchronized with the ultrasonic anemometer data at 20 Hz by a Labview program. In practice, each integrated ion peak was updated in the Labview acquisition system as soon as produced by the PTR-Qi-TOF-MS software. Files containing 5 min of synchronized data were stored for post-computation. Mixing ratios for each BVOC i (Ci) were computed following the same procedure as the one described in Loubet et al. (2022). The uncorrected mixing ratio of the compound Ci,ptr (ppb) was calculated using Eq. (1):
where Udrift is the voltage of the drift tube (V), Tdrift is the drift tube temperature in kelvin (K), pdrift is the pressure in the drift (mbar), k is the proton transfer reaction rate assumed to be constant for all compounds (2.5 × 10⁻⁹ cm3 s−1), cps is the cps of the product ion i, cps and cps are the cps of the source ion and the first water cluster, trans stands for corrected for transmission, TRis the transmission factor for H3O+, TR is the transmission factor for the product ion i, both determined by the transmission curve (see Table S1 in the Supplement). The values of was computed from ion 21.022 () by multiplying by the isotopic factor of in water (487.56). The constant was derived from the PTR-Qi-TOF-MS setup. The calibrated mixing ratio Ci was then computed by subtracting the zero-air mixing ratio and multiplying by a calibration coefficient, similarly as in Loubet et al. (2022), following:
The calibration coefficient was computed as a product of a time-evolving calibration coefficient of toluene Stoluene(t) and a species-specific calibration coefficient Si(t0) normalised to toluene computed during the one-off calibration before the campaign or taken from the Koss et al. (2018) dataset. Stoluene(t) was computed as the slope of the regression (with intercept forced to zero) between Ctoluene,ptr and the prescribed mixing ratio of toluene during periodic calibrations with a cylinder containing 102 ppbv of benzene, 104 ppbv of toluene, 130 ppbv of ethylbenzene and 336 ppbv of xylene (122 ppbv ortho, 121 ppbv meta, 123 ppbv para; BTEX, Messer, France). Only toluene was used because other compounds had confounding fragments. Gas from this cylinder was diluted with synthetic air (alphagaz 1, Air Liquide, France) using a fluorinert coated mass flow controller (Bronkhorst, The Netherlands). The calibration factor Stoluene(t) varied between 2.11 ± 0.015 on 4 May and 2.37 ± 0.029 on 23 June (see Table S1 in the Supplement for details). For a few BVOCs, we made a one-off calibration with a standard cylinder (Ionicon, Austria) containing 14 compounds (990 ppb methanol, 990 ppb acetonitrile, 950 ppb acetaldehyde, 1000 ppb ethanol, 1010 ppb acroleine, 980 ppb acetone, 950 ppb isoprene, 1010 ppb crotonaldehyde, 990 ppb 2-butanone, 990 ppb benzene, 990 ppb toluene, 1020 ppb o-xylene, 1010 ppb chlorobenzene, 1010 ppb α-pinene, 1020 ppb 1,2-dichlorobenzene). Additionally, methanol concentrations were compared to a PTR-HR-MS that returned from an ACTRIS inter-comparison exercise (Holzinger et al., 2019). This additional comparison was performed specifically for methanol after we suspected that the equilibrating time (28 min) was not sufficiently long to allow for the methanol mixing ratio to reach a plateau in our setup. Indeed, as a polar molecule methanol requires much longer time to equilibrate with the tubes and the flowmeter, as we noticed in later experiments with the same setup (up to 4 h). In practice, the calibration factor for methanol was derived by linear regression between the mixing ratio measured with the PTR-Qi-TOF-MS from the INRAE team and the PTR-HR-MS instrument from the LSCE team over a period of two days when the two instruments were sampling at the same location and height. Figure S2 shows the mixing ratios measured by the two instruments and the corrected methanol mixing ratio over this two-day period. The calibration was done by using a linear regression between the mixing ratio from LSCE and INRAE with no constrain on the offset, leading to a decrease of the sensitivity by a factor of 1.72. The calibration factors are given in Table S3 (Supplement). The uncertainty on the regression was included in the sensitivity standard error for methanol (Table S3). The calibration factors reported by Koss et al. (2018) were used to compute the calibration factors for 145 other compounds, as a compromise discussed in Loubet et al. (2022). Individual calibration factors from the one-off calibration and Koss et al. (2018) were reported as fractions relative to the toluene calibration factor to be used in Eqs. (3) and (4) (Table S3). The background mixing ratio was determined every 30 min by passing the sampled air through a hydrocarbon filter (Supelco ref 22445-12) for 2 min, averaging the last 30 s. As the two-minute duration was probably too short to provide robust background concentrations, we actually decided to use a single background concentration for the whole experimental period. After checking that during the whole experimental period the background mixing ratios were quite stable, we decided to use the 0.001 quantile of the background concentrations over that period as the background concentration.
The BVOC eddy covariance flux was computed based on standard eddy-covariance procedures following Loubet et al. (2022):
where Fi is the flux (nmol m−2 s−1), w is the vertical wind component (m s−1), is the air temperature (K), is the dry air pressure (Pa), and R is the ideal gas constant (8.31 J mol−1 K−1). Overbars () denote time averages, and primes denote fluctuations around the mean following Reynolds decomposition rules. Here w′ was calculated by applying two rotations following Aubinet et al. (2000). The covariance between and w′ was calculated after dephasing the two signals with a lag time τ computed as the time at which the correlation function was the largest in absolute value (Langford et al., 2015). The time lag, which did not vary with relative air humidity, was 3.55 s for the six BVOCs selected for its determination (methanol, acetic acid, C6H5O, isoprene and formaldehyde, which provided large fluxes, making the determination of the time lag more robust). The time lag was then set equal for all BVOCs in the study.
The random uncertainty on the flux (RUi) was calculated as the standard deviation over a 10 s period of the covariance function corr around t=80 s and s as described by Spirig et al. (2005). The mean hourly fluxes () and random uncertainty were computed based on the 5 min data. The flux was averaged, but the random uncertainty was computed using a quadratic mean (Langford et al., 2015) as:
where N is the number of 5 min periods in an hour, which was 8 or below since 20 min h−1 was dedicated to profile and calibration measurements.
Flux high-frequency losses generated by the sampling tube and the instrument were evaluated to be below 5 % by Loubet et al. (2022) and were neglected here. A footprint analysis for the whole campaign period was performed based on Kljun et al. (2015) and showed that at least 90 % of the total footprint contribution was always within the studied area (Fig. 1).
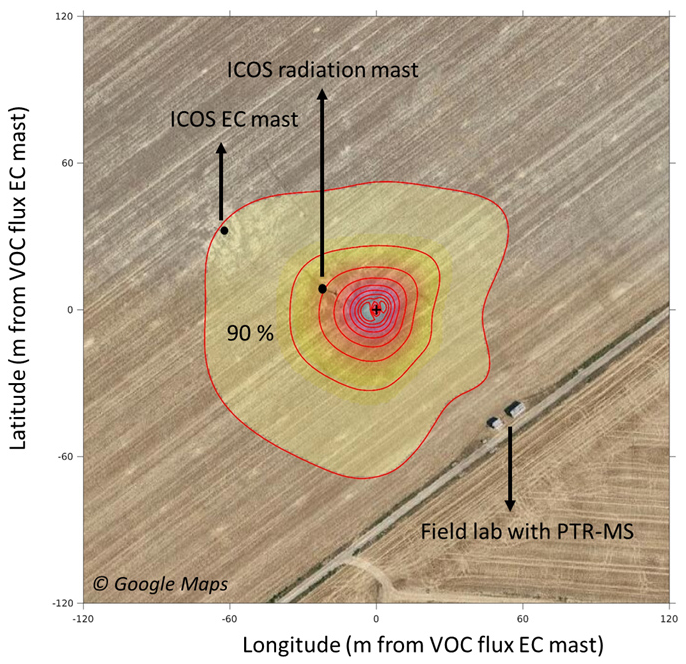
Figure 1Flux footprint for the measurement campaign period (9 May–30 June 2017) showing that at least 90 % of the flux contribution originates from the investigated rapeseed crop area (located north and north-west of the agricultural path appearing on this satellite picture). The black cross in the centre of the ellipses depicts the location of the eddy-covariance (EC) mast deployed in this study. The ICOS eddy covariance and radiation masts, and the field lab are also shown.
2.3 Ancillary data
Meteorological measurements were performed continuously at the FR-Gri site during the campaign following the ICOS standards. Among other variables, air temperature (Tair) and air humidity (RH) (HMP155a, VAISALA, Finland) at 1, 2.7 and 5 m heights, global incoming short-wave solar radiation at 5.3 m (model CNR4, Kipp & Zonen, Germany), and rainfall (model ARG100, Campbell, UK) were recorded.
CO2 and H2O fluxes were measured by eddy-covariance following the ICOS protocol (http://www.icos-ri.eu) using an enclosed path infrared gas analyser (model Li-7200, Li-COR, USA) and an ultrasonic anemometer (model HS-50, Gill Instruments Ltd, UK), located at around 50 m away from the BVOC mast. Crop height evolution was monitored at regular intervals. The leaf area index (LAI) and above-ground biomass were determined on three dates (11 November 2016, 16 March and 19 April 2017) with destructive samplings and planimeter measurements. The LAI was 5.2 ± 1.5 m m during the experiment (rapeseed plants were at their maximum leaf development when the experiment started), of which 80 % were leaves, and 20 % stems.
2.4 Data treatment and analysis
2.4.1 Defining periods for data analysis and interpretation
Data analysis was performed on a subset of the whole measurement period, after excluding data corresponding to two short periods in May when a few selected compounds (isoprene, monoterpenes and its potential fragments, and siloxanes) were seen to deposit outside usual ranges for these compounds, potentially suggesting advection episodes. Data corresponding to the combination of (i) wind direction comprised between 0 and 105° N and (ii) at least 100 % difference in BVOC concentrations between the EC inlet and a distinct 3 m-height inlet line that was part of a BVOC mixing ratio measurement profile (more details about this set-up are provided in the Supplement document S4, wind direction data over the whole measurement campaign (9 May–30 June) are displayed in Fig. S5, and the result of the criteria application is provided in Table S6) were filtered out. This allowed us to identify and exclude two episodes occurring over 9–10 and 23–30 May 2017, characterized by North and North-Eastern winds (0 to 105° N) and very large (above 100 %) concentration level differences, during which monoterpenes and its potential fragments, and siloxanes exhibited very large and unusual deposition fluxes. In details, the period occurring over 9–10 May was characterized by 78 % of hourly data coming from North and North-East direction, conjugated with large concentration level differences between EC and profile 3 m height sampling lines for monoterpenes (64 % of hourly values above 100 % difference over these two days) and siloxanes (between 70 % and 100 % of hourly values above 100 % difference over these two days. The period occurring over 23–30 May was characterized by about 50 % of hourly data coming from North and North-East direction conjugated with large concentration level differences between EC and profile 3 m height sampling lines for monoterpenes (42 % of hourly values above 100 % difference over these 7 d) and siloxanes (between 64 % and 92 % of hourly values above 100 % difference over these two days).
The remaining dataset was then separated into two periods, in order to take crop development stages into account: (i) Period 1 (11–22 May), during which the vegetation was in the fruit development period (BBCH (Biologische Bundesanstalt, Bundessortenamt und CHemische Industrie) stages 70s, AHDB, 2023), and (ii) Period 2 (9–30 June), during which the rapeseed crop entered and pursued senescence (BBCH stages 80s to 90s).
2.4.2 Selection of BVOCs with significant fluxes
In order to take into account, as much as possible, the possible variability of exchanged compounds over the whole measurement period (11 May–30 June), we computed the 7 d running means of () and () using the same quadratic averaging as in Eq. (5) for and retained the BVOCs for which . By using moving windows, it was possible to detect singularities in the dataset. Finally, in order to apply this selection process to the whole measurement period, the selected BVOCs were those which were retained by the above-mentioned criteria in 50 % of the dates. In the rest of the manuscript, the tentative name of each compound is used.
Iron-containing compounds identified as artefacts by Salazar Gómez et al. (2019) were withdrawn from the list of selected BVOCs. Furthermore, the detected BVOC with a peak at 63.006 could not be entirely distinguished from the peak at 63.026 during the campaign, as a consequence of a wide peak integration definition around this value; the identification of this compound is therefore uncertain: it could be dimethylsulfide (DMS) instead of methaneperoxoic acid.
2.4.3 Calculation of standard emission factors
As BVOC emissions by vegetation are driven by both temperature and light or solely by temperature, these emissions can be normalised by light and temperature functions to produce standardised emission factors (SEFs), which are helpful for comparison with previous studies. The SEFs (µg m−2(leaf) h−1) were calculated for periods 1 and 2 based on the MEGAN2.1 model described in Guenther et al. (2012) (Eq. 6):
where Ei is the measured BVOC flux per soil surface expressed in µg m−2(soil) h−1, computed from the measured flux Fi (nmol m−2(soil) s−1) and the molar mass of compound iMi (g mol−1) following Eq. (7) (the ratio converts seconds to hours and ng to µg):
And γi (–) is the activity factor for each compound i. These were calculated using Eq. (8) (Guenther et al., 2012):
Which accounts for the emission response to light (γP), temperature (γT), leaf age (γA), soil moisture (γSM), leaf area index (LAI) and CO2 inhibition (γC). The canopy environment coefficient (CCE) was set so that γ is equal to 1 under standard conditions, with the standard conditions defined as Tref=297 K, PAR =1000 µmol m−2 s−1. The product (γAγSMγC) was set to 1, assuming no aging, soil moisture or CO2 inhibition effects. The emission activity factors accounting for the light and temperature responses were calculated according to Eqs. (3)–(11) in Guenther et al. (2012).
It should be noticed that the SEFs computed in this study represent the ecosystem and not the plants alone since the eddy-covariance fluxes integrate over the whole ecosystem. The SEFs calculated for all the compounds showing a significant emission for both periods 1 (fruit development period) and 2 (senescence period) were compared to values taken from three references: (i) the MEGAN2.1 model (Guenther et al., 2012), (ii) the study by Havermann et al. (2022) and (iii) the study by Gonzaga Gomez et al. (2019), who both used algorithms derived from Guenther et al. (1995) and Guenther (1997). It has to be noted that the SEFs reported in Havermann et al. (2022) and Gonzaga Gomez et al. (2019) were calculated using the equations described in Guenther et al. (1995) and Guenther (1997), which are not exactly the same as those in Guenther et al. (2012). We therefore, as a verification step, also calculated the SEFs using these references. This comparison, detailed in the Supplement S7, shows that the SEF values calculated by both methods are very close. In the rest of this paper, we will only consider SEF values calculated as described in Eqs. (6)–(8), based on Guenther et al. (2012).
MEGAN2.1 is a widely used model that provides estimates of BVOC flux exchanges between the terrestrial biosphere and the atmosphere. This model categorises ecosystems between 15 plant functional types (PFT) and does not distinguish between crop species as they all fall into a unique category (PFT 15). Additionally, bare soil is considered to have null BVOC emissions. The model also categorises BVOCs into individual (e.g. methanol, isoprene, acetone) and compound classes (bidirectional BVOCs, stress BVOCs, etc.) according to chemical characteristics. The comparison between our results and the emission factors provided in Guenther et al. (2012) has to be considered bearing in mind the little adjustments that were made to the actual use of the MEGAN2.1 model in the present study.
Havermann et al. (2022) measured BVOC fluxes using large chambers deployed on three crop species (maize, rapeseed and ryegrass). They then calculated the SEFs based on empirical light- and temperature-dependent relationships. Since they report SEFs on a dry weight basis, we divided their SEF by the leaf specific area for rapeseed they report (39.6 m2 kg−1) to retrieve the SEFs per unit leaf area. It has to be noted that the leaf specific area measured in the present study is 20 ± 1 m2 kg−1, which is half of what is reported by Havermann et al. (2022).
Gonzaga Gomez et al. (2019) measured BVOC fluxes using dynamic automated chambers deployed on rapeseed, wheat and maize at the same site and field campaign as the one reported in the present study. They calculated the SEFs based on the empirical light- and temperature-dependent relationships from Guenther et al. (1995).
2.4.4 Calculation of the OH reactivity flux
The total OH reactivity R (s−1) is usually calculated as Eq. (9) (Gros and Zannoni, 2022):
Where kOH+i (cm3 molecule−1 s−1) is the rate constant of the reaction between OH and BVOC i (Table 2 and references therein), Navo (6.022×10²³ molec. mol−1) is the Avogadro number, P (101 325 Pa) is the atmospheric pressure, R (8.314 J K−1 mol−1) is the gas law constant, T (298 K) is the air temperature, 10−15 is a conversion factor, and Ci (nmol mol−1) is the mixing ratio of BVOC i.
To compare the OH reactivity resulting from the SEFs found in this study to those resulting from literature emission factors, we computed a standard OH reactivity flux (here indicated as RF). It is representative of a total net OH reactivity that would result from the emitted BVOC. It was computed as Eq. (10):
where SEFi in µg m−2 h−1 is the standard emission factor of BVOC i, and the term on the right side of the equation is needed to transform the SEF unit into nmol mol−1 m s−1, which leads to RF being in m s−2, that is the unit of the OH reactivity (s−1) multiplied by an exchange velocity (m s−1). (m3 mol−1) is the air molar volume, Mi (g mol−1) is the molar mass of BVOC i and LAI is the leaf area index (m2 m−2).
In this study, we used the OH reactivity flux to compare the impact of the SEFs computed here with the SEFs available from the model MEGAN 2.1. To do that, only the compounds with a SEF explicitly reported in MEGAN 2.1 were used in this calculation.
3.1 Meteorological conditions and crop development
The BVOC flux measurement campaign started as rapeseed was already in the fruit development phase and actively photosynthesising, as shown by the Net Ecosystem Exchange (NEE) fluxes being largely negative during daytime (Fig. 2). The investigated period was also characterised by significant evaporation (latent heat, LE, Fig. 2) during the whole time. As of June, gradual decreases in the CO2 flux (from about −20 to 0 µmol m−2 s−1) and in the albedo (from about 0.35 to 0.25) were observed as a consequence of progressive crop senescence, while evaporation was sustained. The air temperature was variable during the whole measurement period, and comprised between 2.9 and 34.7 °C, with an average value of 16.9 °C. A few short rain events punctuated the measurement period, especially around mid-May and early June.
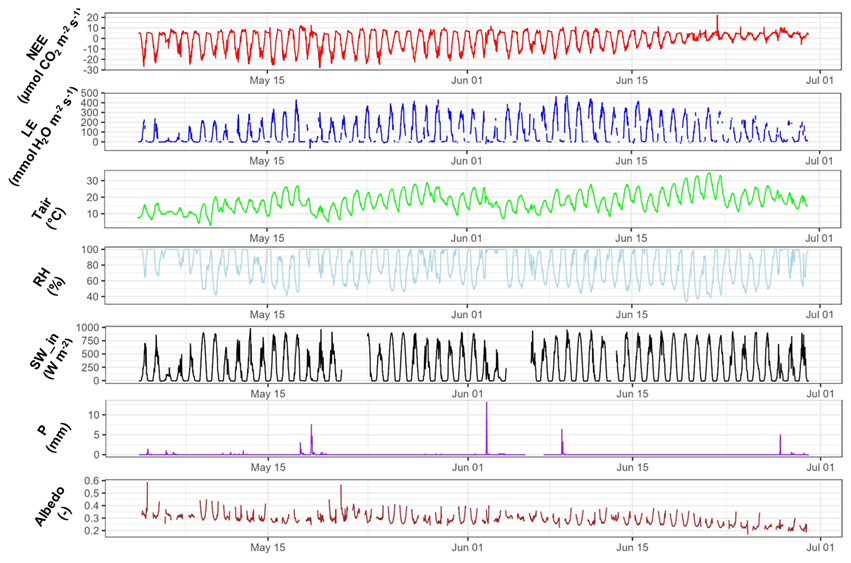
Figure 2CO2, H2O fluxes and meteorological conditions during the field campaign: net ecosystem exchange (NEE), latent heat (LE), air temperature (Tair), relative humidity (RH), short-wave incoming radiation (SW_in), precipitation (P) and Albedo (ratio).
3.2 Eddy-covariance ecosystem BVOC fluxes during fruit development and senescence
Out of more than 500 detected ions, 42 BVOCs (corresponding to 62 ions when including isotopes and fragments), exhibited significant fluxes (Table 1 for the list of the twenty most exchanged BVOCs during periods 1 and 2, and Table S8 and Fig. S9 for the whole list and flux (black) + random error (red) temporal courses of the 42 BVOCs, respectively). Overall, 30 BVOCs were emitted, 7 were deposited, and 5 were bidirectional (Table S8).
Among the emitted BVOCs, 33.033 (methanol) was by far the most emitted one for both periods (Tables 1 and S8, Fig. 3), representing between 90 % and 93 % of the total emissions on a molar basis (Table 1). The magnitude of methanol emissions was twice larger during the senescent period than during the end of fruit development period (Table 1, Fig. 3). The other three most emitted BVOCs were 137.129 (monoterpenes), 59.049 (acetone) and 69.070 (isoprene) in the fruit development period, and 31.018 (formaldehyde), 59.049 (acetone) and 49.014 (methanethiol) in the senescence period, with these compounds representing between 0.4 % and 5.8 % of emissions (on a molar basis) during these two respective periods (Table 1).
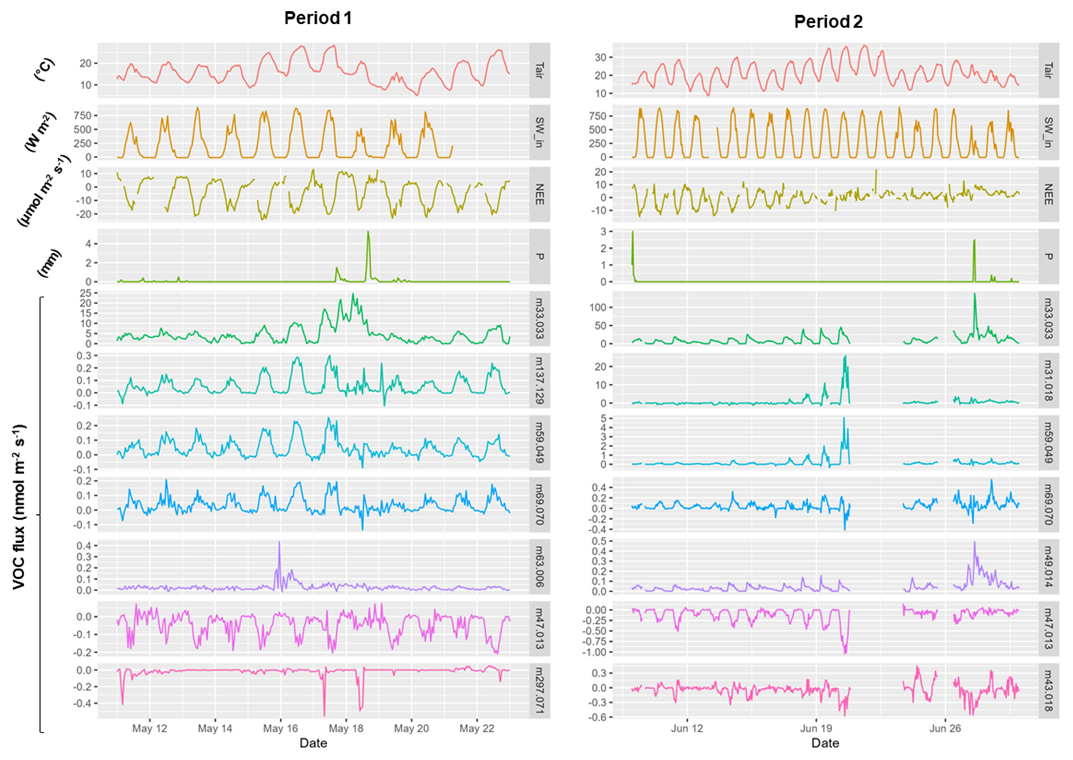
Figure 3Air temperature (Tair), short wave incoming radiation (SW_in), net ecosystem exchange (NEE), Precipitation (P), and BVOC fluxes of a selection of 4 most emitted and 2 most deposited BVOCs over period 1 (left) and 2 (right). BVOCs are named after their ratio, on the right-hand side of each graph (see Table 1 for correspondence). Units of each variable are given on the left-hand side of the graphs.
Table 1Twenty most net emitted and net deposited compounds during periods 1 and 2. The proportions (Prop. (%)) of net emissions/depositions for each compound with respect to the total fluxes are indicated separately for each period.
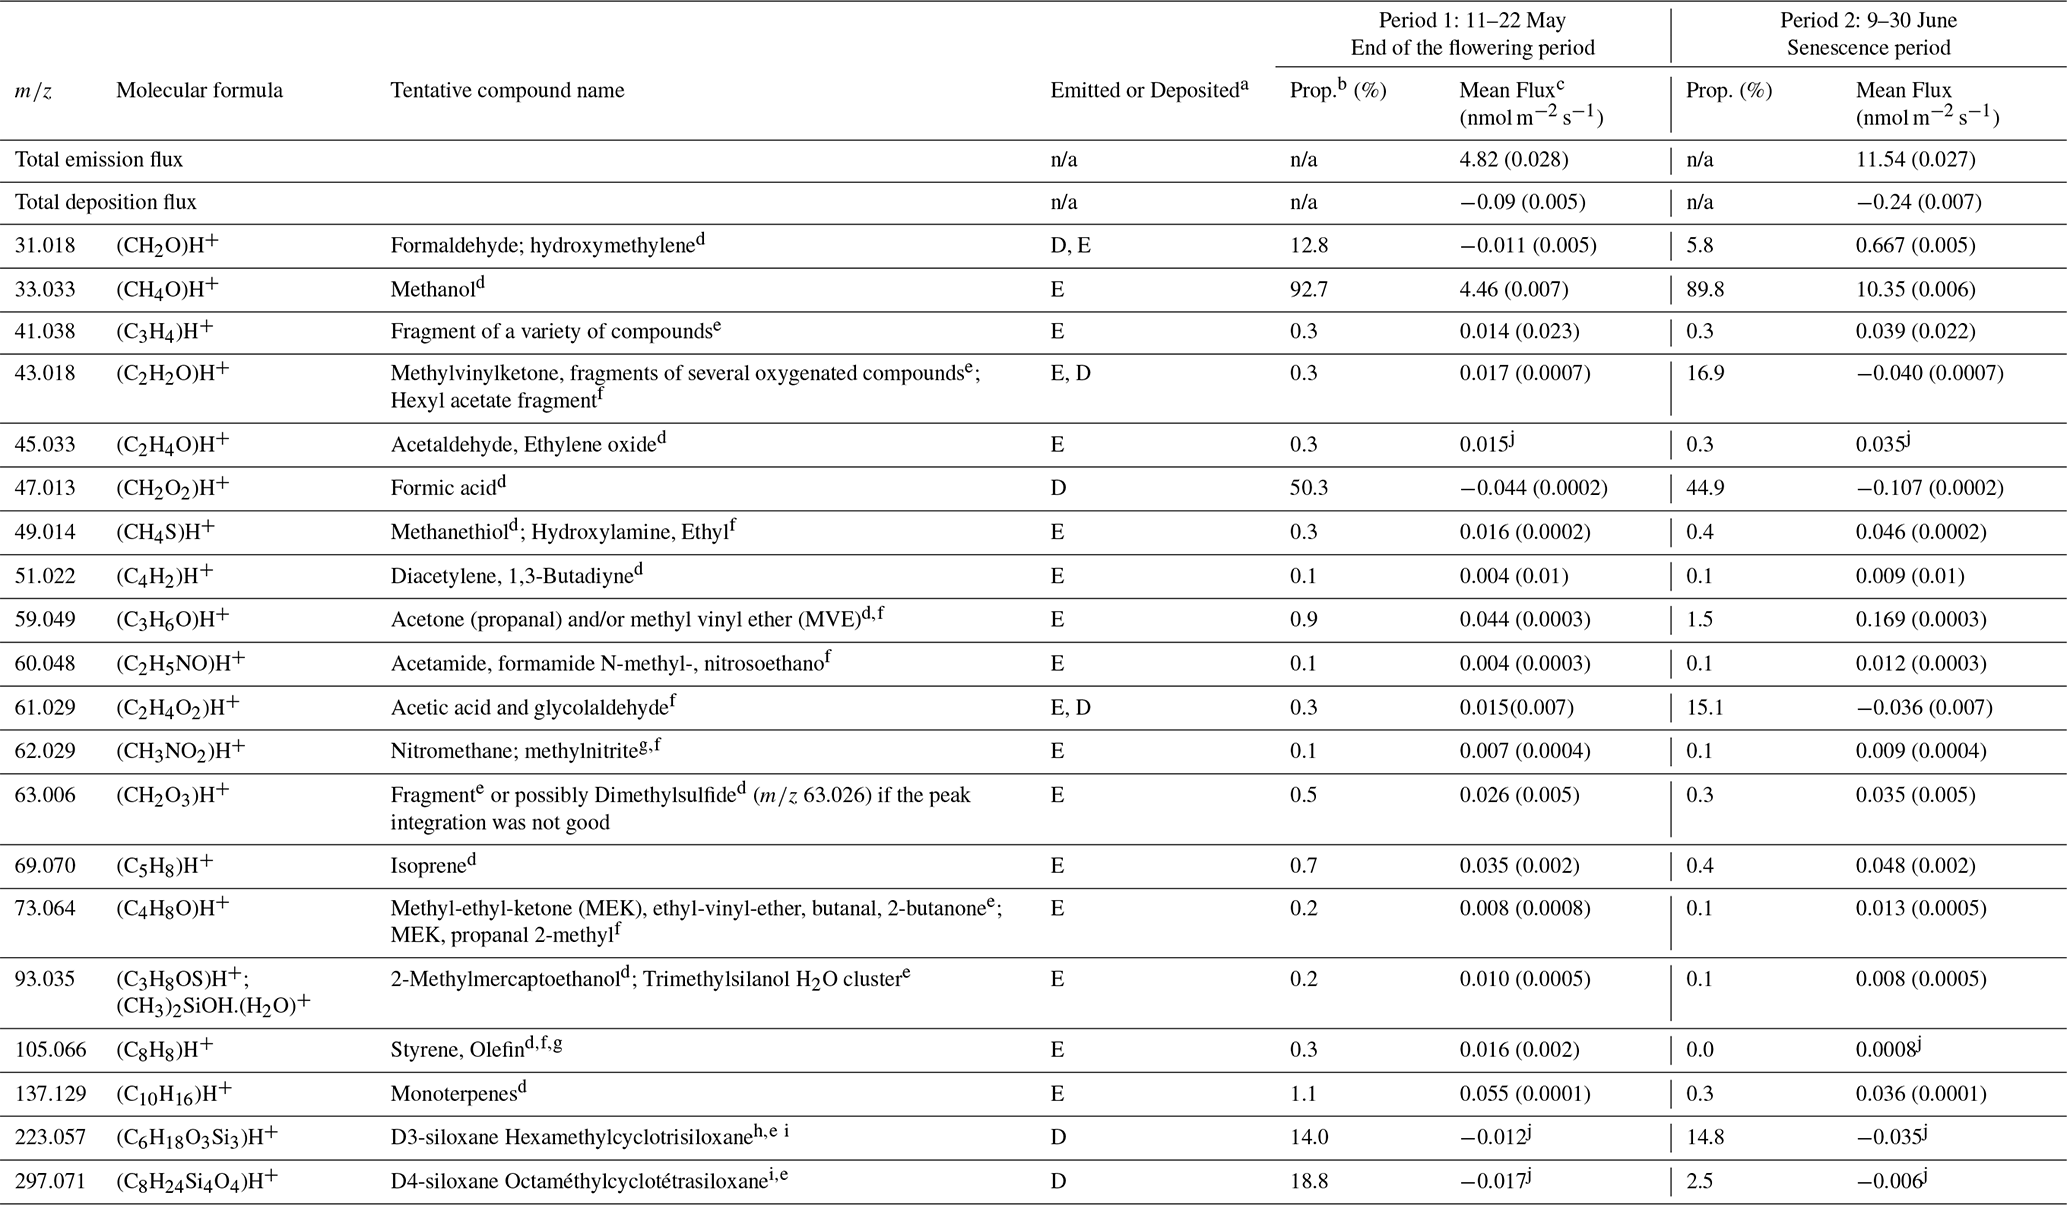
a Net emitter (E) or deposited (D) characteristic is evaluated over each single period, e.g. D, E denotes that this BVOC was seen to deposit in May, then to be emitted in June. b Proportions were calculated within each net deposited or emitted group of compounds for each respective period. c Error is calculated as the root of the sum of squares of data over each respective period. “n/a” means “not applicable”. References for compound identification: d Yáñez-Serrano et al. (2021) (GLOVOC database); e Salazar-Gomez et al. (2021); f Brilli et al. (2014b); g Pagonis et al. (2019); h Chen et al. (2022); i Holzinger et al. (2019). j Error is lower than 0.0001. In this table, the total for both net emitters and net depositers does not reach precisely 100 %, as this was established based on the 42 significant compounds (complete list in Table S1). Ta_mean = 18.1 °C and SW_in_mean = 276.4 W m−2 during period 1, and Ta_mean = 19.1 °C and SW_in_mean = 281.5,W m−2 during period 2, with Ta_mean being the average air temperature and SW_in_mean being the incoming total radiation.
Along these main compounds, many other BVOCs belonging to different chemical compound classes were observed to be emitted and tentatively identified (Table S8). (i) Two other terpenoid compounds than isoprene and monoterpenes was seen to be significantly emitted during periods 1 and 2 (Fig. S9): methylbutenol (MBO, 87.078) and sesquiterpenes ( 205.186), which both exhibited much clearer fluxes – even if rather small compared to methanol – during the fruit development period than during the senescence period. (ii) Possible other sulphur compounds than methanethiol ( 49.014) were also emitted in significant amounts during both periods 1 and 2: 63.006 (which could actually be 63.026, identified as dimethylsulfide, see Sect. 2.4.2), 75.025, possibly identified as methyl-vinyl sulfide, 93.035, possibly identified as 2-methylmercaptoethanol but which could also be (C6H4O)H+ (unidentified ion), and 95.015, possibly identified as dimethyl sulfone. (iii) BVOCs likely containing nitrogen were also seen to be emitted, with clear diurnal patterns over the whole measurement campaign ( 60.048, possibly identified as acetamide, and 62.029, possibly identified as nitromethane), and clear diurnal pattern particularly during period 1 ( 118.074, which could be indole, a quite reactive compound). (iv) Many oxygenated compounds were also seen to be emitted during both periods, though at much smaller rates than methanol: acetaldehyde ( 45.033), 73.064 (possibly identified as methyl-ethyl-ketone (MEK, butanone), or butanal, or ethyl-vinyl-ether), 83.049 (possibly identified as hexanal fragment or methylfuran), 87.042, 87.078, 101.059 (possibly identified as pentanedial or other compounds), and 115.078 for which proposed compounds are hexenoic acid or caprolactone (Table S7). (v) Hydrocarbons were also observed: 67.053 (1,3-cyclopentadiene), 83.084 (cyclohexene), and 105.066 (possibly styrene).
A few compounds were seen to be deposited (Figs. 3, S9) during periods 1 and 2: they are formic acid ( 47.013), which represented about 45 %–50 % of the deposited BVOC flux in each period, 77.005, possibly identified as thioacetic acid, 99.008, possibly identified as maleic anhydride, and much heavier compounds like 223.057, 297.071 and 355.051 possibly identified as D3-siloxane, D4-siloxane and D5-fragment of siloxane compounds, respectively.
Some BVOCs switched from deposition to emission, or vice-versa, between periods. One BVOC (formaldehyde, 31.018) was seen to be deposited in small amounts during period 1, then switched to emissions during period 2. The quantification of formaldehyde fluxes should be considered with caution due to its proton affinity (712.9 kJ mol−1; NIST database, 2023) being close to that of water (691 kJ mol−1; NIST database, 2023), potentially making it more difficult to detect using the PTR-MS technique adequately (Loubet et al., 2022). Conversely, three BVOCs ( 57.069 (possibly butene), 61.029 (identified as acetic acid) and 167.052 (possibly identified as thiocresol)) were emitted during the end of the flowering period, then deposited during the senescence period (Table 1, Fig. S9).
All the detected compounds exhibited diel emission or deposition patterns during both periods (Figs. 3 and S9). BVOC fluxes increased (in absolute value) during the day and decreased to lower nocturnal emission rates following radiation and temperature variations. During period 1, a rain event occurring between the 17 and 18 May, together with a temperature drop, likely caused reductions in all the detected BVOC emission rates (Figs. 2, 3 and S9). Formaldehyde and formic acid deposition rates were also reduced during that specific event. The short rain events during period 2 did not decrease BVOC emissions, probably because rain intensity was smaller than in period 1 and air temperatures remained high. During period 2, a temperature increase that started around mid-June, together with bright sun conditions, could have triggered larger fluxes for the majority of BVOCs (Figs. 3, S9).
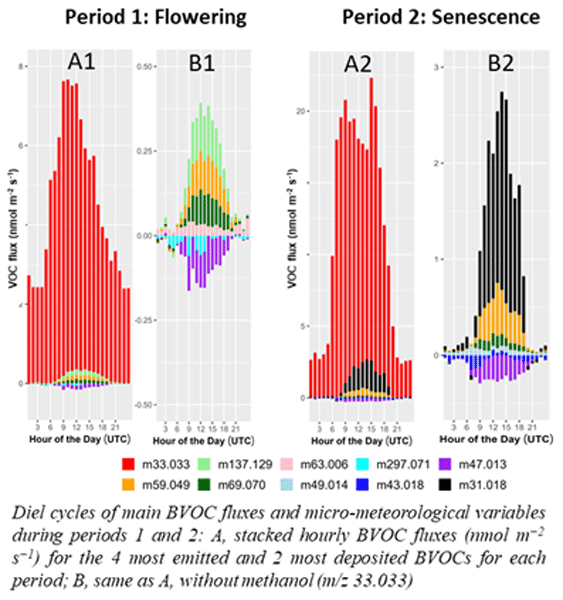
As observed in Figs. 3 and 4 (panels A, B and C), most BVOC fluxes peaked around noon. However, a few BVOCs exhibited a maximum flux during the morning, followed by a decrease during the rest of the day. This was the case for methanol, 63.006 and formic acid during period 1, and for methanol, methanethiol and acetic acid during period 2. During period 1, NEE flux and radiation also peaked earlier than noon (Fig. 4D and E), while this was not the case in the second period. Concerning nocturnal emissions of methanol, we noticed smaller (about 50 %) emission fluxes during senescence compared to the end of flowering period, while diurnal emissions of this compound were more than twice larger during senescence compared to end of flowering.
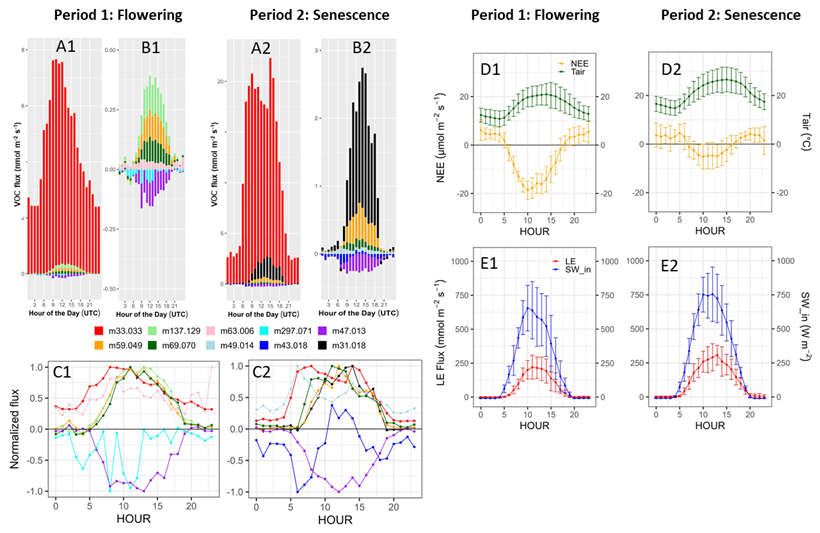
Figure 4Diel cycles of main BVOC fluxes and micro-meteorological variables during periods 1 and 2: (A) stacked hourly BVOC fluxes (nmol m−2 s−1) for the 4 most emitted and 2 most deposited BVOCs for each period; (B) same as (A), without methanol ( 33.033); C, BVOC fluxes divided by their daily maximum; (D) net CO2 fluxes (NEE) and Air temperature (Tair); (E) latent heat fluxes (LE) and global incoming radiation (SW_in). Index 1 refers to period 1 (fruit development), and index 2 refers to period 2 (senescence).
3.3 Emission factors and OH reactivity fluxes
The calculated standard emission factors (SEFs) showed much larger values for methanol than for other oxygenated BVOCs like acetone, formaldehyde, acetaldehyde, and for terpenoid compounds (isoprene, monoterpenes, MBO, sesquiterpenes) (Table 2). Generally, SEF values were of similar magnitude or reduced during period 2 as compared to period 1 (reduction factors varying from 1.3 (acetaldehyde) to about 12 (sesquiterpenes and indole)). Only methanol and acetone – and to a smaller extent methanethiol – SEFs were increased from period 1 to period 2, by factors between 1.4 and 3.3. Compared to values taken into consideration in the MEGAN2.1 model (Guenther et al., 2012), the SEFs calculated in the present study exhibited values about 2, 5, 5 to 15 and 32 to 40 times smaller for formaldehyde, methanol, acetone and acetaldehyde, respectively, over both periods. On the contrary, they were in the same range as values reported by Havermann et al. (2022) or Gonzaga Gomez et al. (2019). Isoprene SEFs were in the same range as what is proposed in MEGAN2.1, but about 5 times smaller than what is reported in Havermann et al. (2022) and Gonzaga Gomez et al. (2019). Besides, much smaller SEF values than in MEGAN2.1 were reported in the present study for more reactive compounds like indole, methanethiol and 101.059. On the other side, larger SEF values for monoterpenes and MBO (2 to 20 times, over both periods) were observed in the present study, compared to those in MEGAN2.1. The isoprene and monoterpenes SEFs reported in the present study were generally smaller, or in the same range of values, as compared to SEFs reported by Gonzaga Gomez et al. (2019) and Havermann et al. (2022).
The OH reactivity fluxes (RF) computed using MEGAN2.1 SEFs or this study SEFs were differing in the same way as the SEFs with smaller MEGAN2.1 OH reactivity flux for isoprene, MBO and monoterpenes, but larger MEGAN2.1 OH reactivity flux for methanol, acetone, sesquiterpenes, formaldehyde, acetaldehyde, indole, methanethiol and 101.059, as compared to the SEFs calculated in the present study (Table 2). In order not to introduce a large disequilibrium due to uncertain SEFs on these last three compounds, we chose not to include these compounds in the evaluations of the total OH reactivity flux and the contributions of each compound to this total amount. In terms of BVOC contribution to the total OH reactivity flux, methanol, formaldehyde and acetaldehyde dominated and contributed in similar proportions to what can be evaluated with MEGAN2.1 SEFs. In our study, the contribution of methanol, in particular, to total OH reactivity flux was actually seen to be about half what is evaluated with MEGAN2.1 SEFs. Contribution of monoterpenes to the total OH reactivity flux was however seen to be much larger (about 10 times) based on results from the present study as compared to results obtained with MEGAN2.1.
Table 2Standard emission factors (SEFs), OH reactivity fluxes and BVOC contribution to OH reactivity flux calculated in the present study for both crop development periods, compared with values from previous studies, either obtained from experimental or modelling works. P1 represents the fruit development crop stage, and P2 corresponds to the senescence period.
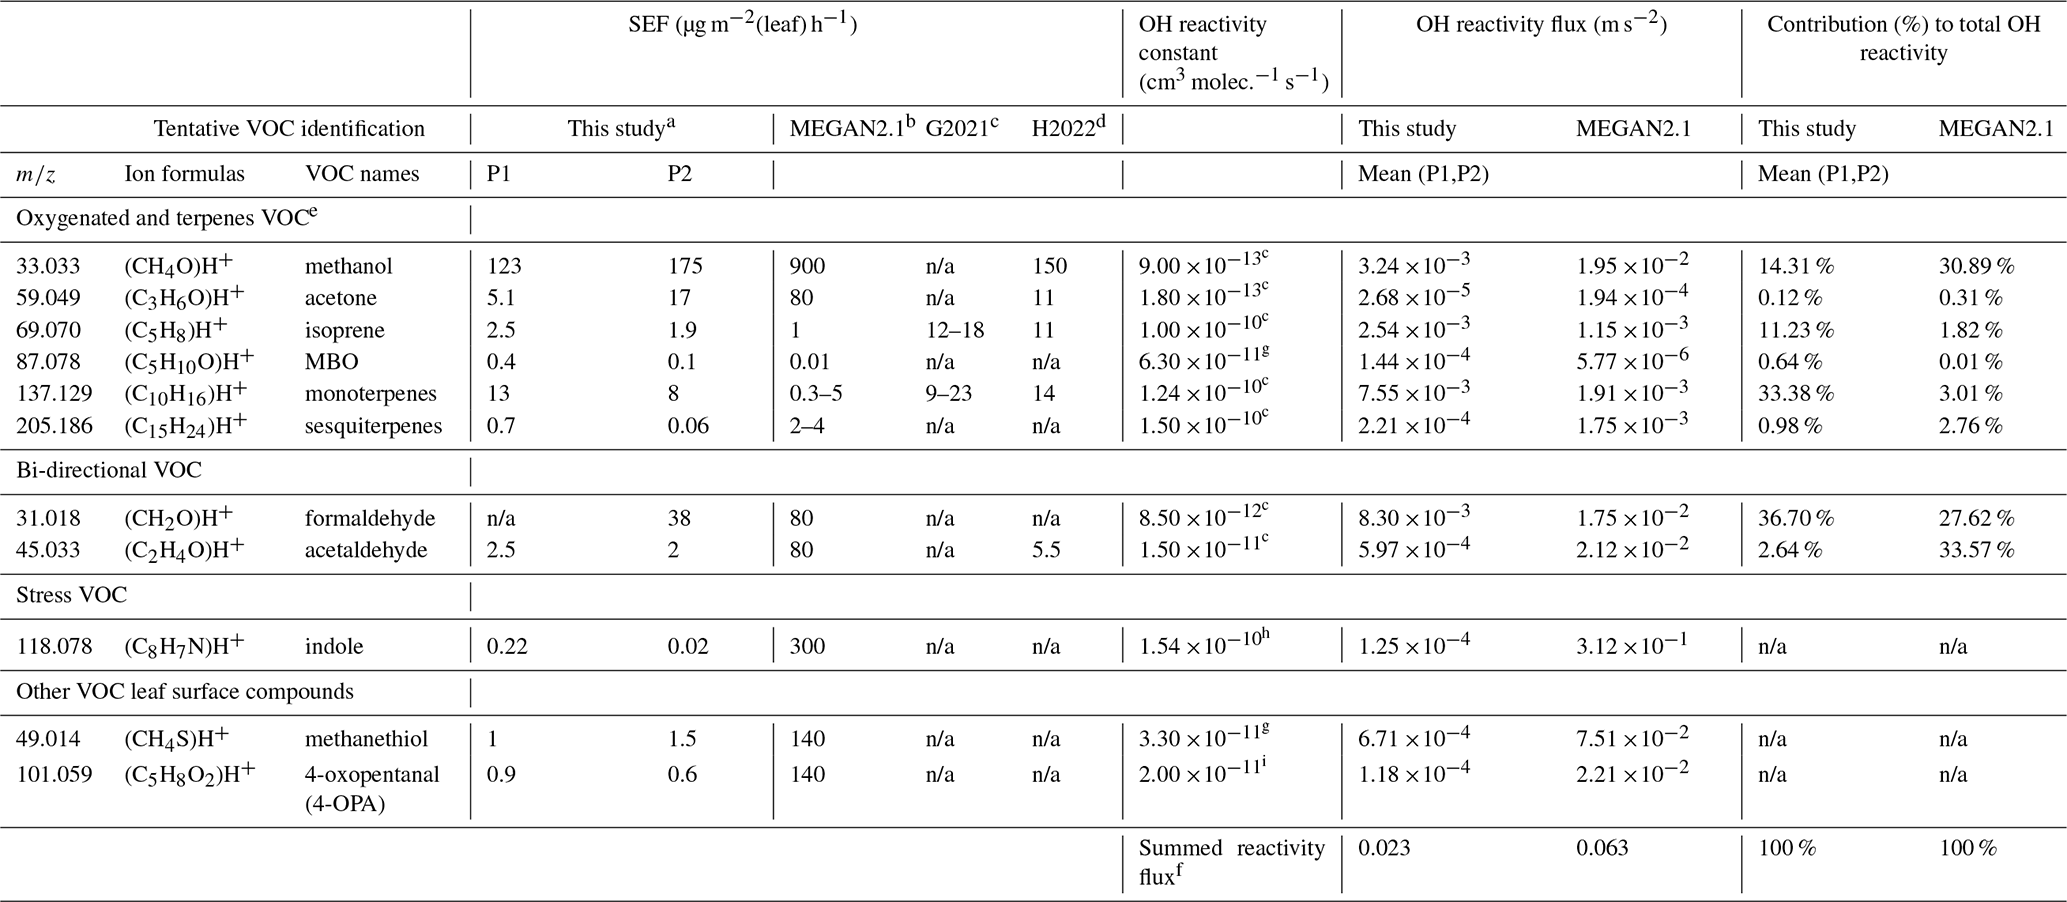
a SEF calculated with the equation proposed by Guenther et al. (2012), considering the adjustements detailed in Sect. 2.4.3. b Values from Guenther et al. (2012). c Values from Gonzaga Gomez et al. (2019). d Values from Havermann et al. (2022), considering a rapeseed biomass density of 1100 g m−2 and a leaf specific area of 39.6 m2 kg−1. e Categories from MEGAN2.1 model (Guenther et al., 2012). f summed reactivity not accounting for “stress VOCs” and “other VOC leaf surface compounds”. g Values from IUPAC standard reference base, https://iupac-aeris.ipsl.fr/datasheets/pdf/HOx_VOC11.pdf (last access: 7 July 2023). h Values from Atkinson et al. (1995). i Value from Fruekilde et al. (1998). “n/a” means that no data were available (for formaldehyde in P1, no emission data was available as this compound was seen to be deposited).
4.1 Dominance of methanol emissions at the ecosystem scale
In the present study, which is, to our knowledge, the first one applying the eddy-covariance technique to measure BVOC fluxes over a rapeseed crop, methanol was found to have the largest fluxes of all measured BVOCs, and its contribution varied between 90 % and 93 % of the summed BVOCs emitted fluxes on a molar basis. This compound is known to be produced during plant growth and cell wall elongation (Fall and Benson, 1996). The prevalence of methanol emissions from vegetated ecosystems (generally at least 50 % of emissions), and particularly from crops, is well known and was reported in several studies for other crops than rapeseed (for maize, see Bachy et al. (2016), Das et al. (2003), Graus et al. (2013), Wiß et al. (2017); for winter wheat see Bachy et al. (2018, 2020), Gonzaga Gomez et al. (2019), Loubet et al. (2022); for grasslands see Ruuskanen et al. (2011)). The dominant methanol contribution observed in this work agrees with previous studies by Gonzaga Gomez et al. (2019) and Havermann et al. (2022), both performed using automated dynamic chambers deployed on rapeseed plants in the field, but shows larger proportions. In particular, Gonzaga Gomez et al. (2019), carried out measurement with two cuvettes during the same campaign showing methanol contributing from 56 % to 77 % of the summed molar BVOC emissions, while Havermann et al. (2022) reported a contribution of more than 80 %. Since these studies were carried out with chambers, either not including (Gonzaga Gomez et al., 2019) or including (Havermann et al., 2022) soil, this difference suggests that the share of methanol to the total BVOC emissions from the soil must necessarily be larger than the share of methanol to the total BVOC emissions from the plants. In a lab experiment conducted with rapeseed plants, Voyard et al. (2024) also reported a large contribution (between 30 % and 90 %) of methanol to total emissions, both from above-ground and below-ground plant parts.
In absolute values, the methanol emissions observed in this study, ranged between about 0.1 and more than 100 nmol m−2 s−1, and averaged 8 nmol m−2 s−1. This agrees reasonably well with Das et al. (2003) for maize (vertical gradient technique, 29 ± 12 nmol m−2 s−1). It is however much larger than those reported by Havermann et al. (2022) for rapeseed (chambers, average 2.5 nmol m−2 s−1), and by Loubet et al. (2022) for winter wheat (EC, 0 to 4 nmol m−2 s−1), as well as by Bachy et al. (2016, 2018, 2020) for maize and wheat (EC, 2.1 to 3 nmol m−2 s−1). However, these fluxes were about five times smaller than those reported by Gonzaga Gomez et al. (2019) during the same experimental campaign (plant chambers, average flux of 37 to 39 nmol m−2 s−1, considering a measured plant biomass of 780 g(dry matter) m−2 at maturity). Such a difference is explained by the higher temperature in the chambers leading to larger emissions. As suggested by the authors, scaling to the soil temperature would lead to a much closer agreement between eddy-covariance and chamber measurements (see Appendix K in Gonzaga Gomez et al., 2019).
4.2 Exchange of other oxygenated BVOCs
This study reported significant emission fluxes of two other oxygenated BVOCs than methanol during the whole field campaign, namely acetaldehyde and acetone, which were also reported in other studies performed in rapeseed crops using continuous flux measurements with dynamic chambers (Gonzaga Gomez et al., 2019; Havermann et al., 2022). Voyard et al. (2024) also reported acetaldehyde emissions as one of the most emitted compounds from a rapeseed plant after methanol, in a chamber experiment. The emission of acetaldehyde during the senescence period, therefore in the presence of leaf litter, twice larger than during the fruit development period in this study, corroborates the chamber observations from Abis et al. (2021) that rapeseed leaf litter are a significant source. According to Seco et al. (2007), acetaldehyde emissions may result from various mechanisms, among which reactions to physical stress (cutting and drying of harvested crop material, which could be assimilated to drying leaf litter).
At the ecosystem scale, emission fluxes of acetaldehyde and acetone were reported on other crop species than rapeseed. In maize, Das et al. (2003) and Graus et al. (2013) reported acetone as the second most importantly emitted oxygenated BVOCs, like in this study. Still in a maize field, Bachy et al. (2016) reported bidirectional fluxes of acetone and acetaldehyde, with emission during early crop development and then progressive reduction (even deposition) as the crop reaches late stages, which they attributed to a reduction in the soil source contribution. In a winter wheat crop, Bachy et al. (2020) also observed bidirectional fluxes of acetone and acetaldehyde, with deposition during plant development stages and emission during senescence for both compounds, which tends to confirm the observations of the present study showing increased senescence-induced emission of methanol, acetone and acetaldehyde.
In this study, two oxygenated compounds had bidirectional behaviours: formaldehyde which was deposited in the fruit development stage and then emitted during senescence, and acetic acid, for which the opposite behaviour was observed. While bearing in mind the uncertainty in formaldehyde quantification, the fluxes observed in the present study were significant and showed a clear daily pattern (e.g. Fig. 4C1 and C2). The formaldehyde behaviour switching from deposition during fruit development period to emission during senescence is similar to what was observed by Loubet et al. (2022) in a winter wheat field. Deposition fluxes of formaldehyde were also observed by Brilli et al. (2016) during the whole eddy-covariance measurement campaign performed in a poplar plantation. On the contrary, formaldehyde emission was reported by Gonzaga Gomez et al. (2019) on plant chambers during late flowering/fruit development stage, while deposition was measured by eddy-covariance. The reasons for these differences could be due to soil deposition not included in plant chambers, or higher temperatures in these devices than in the surrounding field (Gonzaga Gomez et al., 2019). Observations regarding acetic acid will be discussed in Sect. 4.4.
Other oxygenated BVOCs like 73.064 (possibly methyl-ethyl-ketone (MEK) or ethyl-vinyl-ether), 83.049 (methylfuran and GLV fragments), 87.042 (butanedione), 87.078 (butenol (MBO), butanone), 101.059 (pentanedione) were emitted at small but significant rates during both vegetation stages. MEK and GLV were also reported by Brilli et al. (2016) and Havermann et al. (2022) over maize and rapeseed.
4.3 Emission of terpenoids, and sulphur- or nitrogen-containing BVOCs
Emissions of terpenoid compounds, including isoprene, monoterpenes, sesquiterpenes and their associated fragments, were observed in the present study. Butcher et al. (1994, 1995) and Jakobsen et al. (1994), performed measurements of BVOC composition of the floral fragrances with Tenax TA and GC on different rapeseed flowering stages but did not report fluxes quantified at the plant level. Butcher et al. (1994, 1995) reported that terpenoids represented 59 % to 74 % of the summed GC peaks, while Jakobsen et al. (1994), reported that sesquiterpenes and monoterpenes represented up to 90 % of the total measured floral BVOC flux of 45 ng flower−1 h−1, a unit difficult to compare to the emitted amounts observed in other studies. These first studies did not measure all compounds and notably methanol, and focussed on flowers, which explains the high share of terpenoids they found compared to our study. More recently, Havermann et al. (2022) reported that monoterpenes, sesquiterpenes and oxygenated monoterpenes contributed to about 1 % in moles to total emitted BVOC fluxes, an amount comparable to our study.
A few emitted compounds detected by the PTR-Qi-TOF-MS were identified as BVOCs possibly containing sulphur or nitrogen atoms. These were methanethiol ( 49.014), nitromethane ( 62.029), methyl vinyl sulphide ( 75.025), dimethyl sulfone ( 95.015), indole ( 118.074) and p-thiocresol ( 167.052). Among these compounds, methanethiol and dimethyl sulfone were recently reported by Voyard et al. (2024) as being emitted by soils, and methanethiol also emitted by rapeseed leaves and roots. Veromann et al. (2013) observed small emissions of indole by parasited rapeseed plants at various nitrogen crop fertilization rates.
4.4 Deposition of BVOCs
Much fewer BVOCs were deposited in the present study than those observed in winter wheat fields (Bachy et al., 2020; Loubet et al., 2022). Indeed, out of the BVOCs seen to be deposited in Loubet et al. (2022), only formic acid and acetic acid exhibited similar behaviour in the present study, the latter showing bi-directional fluxes. Deposition fluxes of acetic acid were reported by Bachy et al. (2020) over a winter wheat crop, from emergence to senescence, and by Bachy et al. (2016) over bare soil. In the present study, acetic acid was depositing during the senescence stage, but showed small (down to −0.05 nmol m−2 s−1) nocturnal deposition fluxes and large daily emissions (up to 0.2 nmol m−2 s−1) during fruit development period. Kesselmeier et al. (1998) showed that uptake of acetic and formic acids in crop plants were related to the stomatal opening for crops like corn, pea and barley (rapeseed was not investigated), which is not fully consistent with the present study as during senescence, plant cells are less and less active. Acetic acid uptake by the soil could therefore constitute a more likely explanation, as suggested by Bachy et al. (2016, 2020). Gomez et al. (2021), found that acetic acid switched from deposition to emission fluxes when the plant entered senescence, which is opposite to what was observed in the present study at the ecosystem level, suggesting that when the plant parts get degraded, acetic acid may be released from the plant but would then be deposited on the soil or elsewhere within the whole crop canopy.
Differences with observations by Loubet et al. (2022) also relate to methylfuran and GLV fragments ( 83.049) and pentanedione ( 101.059), which were emitted in the present study but deposited in their study over a winter wheat field. Besides, ion 43.018 did not show a significant flux over rapeseed, contrary to Loubet et al. (2022), who found a significant deposition flux. Also, while deposition fluxes of methanol at night were observed in winter wheat fields (Bachy et al., 2020; Loubet et al., 2022), this was not the case in the present work. The observation of few deposited compounds and small deposition fluxes compared to Loubet et al. (2022) could be explained by the closed-canopy structure of rapeseed compared to winter wheat, which would prevent methanol and other soluble BVOCs from being absorbed by the soil.
4.5 BVOC flux diel patterns
All BVOCs in this study exhibited diel emission or deposition patterns (Figs. 4 and S9). The peak emission times occurred between mid-day and early afternoon for most compounds, confirming the roles played by radiation and/or temperature in driving BVOC emissions, as it was also observed in previous works (e.g. Guenther et al., 1995). However, differences between BVOCs in the timing of emission increase at the beginning of the day were observed. Methanol (in both periods) and methanethiol (in period 2) exhibited emission increases starting as of 06:00 a.m. UTC, as radiation also started to increase (Fig. 4E1 and E2). The coincidence of the flux increase with solar radiation suggests a stomatal pathway for these compounds. The emission burst would be explained by the release from plant water where these compounds may have accumulated overnight through metabolic processes. Emission bursts of methanol in relation to stomata closure/aperture have been reported in previous studies (e.g. Harley et al., 2007; Hüve et al., 2007; Mozaffar et al., 2017). However, while emission bursts in the morning were also reported for other BVOCs like acetaldehyde and acetone in a poplar forest equipped with cuvettes (Brilli et al., 2014a), this was not observed for these compounds in the present study.
4.6 Effect of senescence on BVOC emissions
The absolute magnitude of the fluxes of oxygenated compounds like methanol, acetone, acetaldehyde, formaldehyde, formic acid and acetic acid increased during the senescence period. This can be related to both environmental and plant physiological characteristics. All these oxygenated soluble compounds are more storable in foliar water pools (Niinemets et al., 2004), which makes them prone to be released during senescence when the stomatal control becomes less efficient. Increased methanol and acetone emissions during senescence have been recently reported for wheat and maize (Bachy et al., 2018, 2020; Gomez et al., 2021; Gonzaga Gomez et al., 2019; Mozaffar et al., 2017, 2018), but to our knowledge, there is no information in the literature for rapeseed, as Havermann et al. (2022) investigated inflorescence emergence and flowering for this crop, but not senescence stages. In the case of methanol and acetone, larger emissions during senescence could also result from the breakdown of cellular structures from both above-ground and below-ground plant parts (Mozaffar et al., 2018; Rottenberger et al., 2005; Voyard et al., 2024), a process analogous to those occurring during plant growth and cell wall expansion (Fall and Benson, 1996). Increased emissions of acetaldehyde during late senescence were also reported in wheat by Bachy et al. (2020).
Emissions of terpenoid compounds remained in the same range or, opposite to oxygenated compounds behaviour, were seen to slightly decrease (e.g. sesquiterpenes, Fig. S9) during senescence. The decrease in monoterpenes emissions aligns with observations for rapeseed at the plant scale by Gomez et al. (2021), who also observed a decrease in monoterpenes emissions as the plant entered senescence. Conversely, in the study by Bachy et al. (2020) on winter wheat, isoprene and monoterpenes emissions increased slightly during the senescence period.
4.7 BVOC standard emission factors (SEFs) and implication for OH reactivity
SEF estimates for crops are scarce in the literature. In the MEGAN2.1 model, the BVOCs emission profile is assumed to be nearly identical across all crop species, with the exception that some crops do not emit isoprene. Moreover, MEGAN2.1 does not differentiate between crop developmental stages (Guenther et al., 1995; Karl et al., 2009).
In this study, SEFs were determined for rapeseed during both the fruit development and senescence stages (Table 2). Methanol SEFs were about 40 % larger during senescence compared to fruit development, but they were on average about 6 times smaller than the values used in MEGAN2.1 (Guenther et al., 2012) and in the same range as those reported by Havermann et al. (2022). For terpenoids, isoprene SEF was in the same range as in MEGAN2.1 but lower than the values reported by Havermann et al. (2022) and Gonzaga Gomez et al. (2019), and monoterpenes SEF up to 20 times higher than in MEGAN2.1, but close to values determined by Havermann et al. (2022) and Gonzaga Gomez et al. (2019). Sesquiterpenes SEFs were about 10 times lower than MEGAN2.1 estimates.
Our findings suggest that the contributions of methanol and acetaldehyde to OH reactivity may be overestimated by MEGAN2.1 while those of isoprene and monoterpenes, would be underestimated by this model during active plant development, and to a lesser extent during senescence. While flowering was not investigated, this study highlights the importance of accounting for crop development stages when evaluating BVOC emissions. In MEGAN2.1, OH reactivity is mainly attributed to green leaf volatiles and stress-related BVOCs such as indole. However, indole SEFs are about 1000 times higher in MEGAN2.1 than in our study (Table 2). Guenther et al. (2012) acknowledged the uncertainties in SEFs for such compounds, due to both limited measurements and their sensitivity to plant damage. Our results indicate that these emissions are likely minimal during late stages of oilseed rape. The OH reactivity constant of indole used here was taken from Atkinson et al. (1995) and confirmed by Xue et al. (2022), supporting the robustness of our calculations. Methanethiol and 4-oxopentanal SEFs were also found to be about 150 times higher in MEGAN2.1 than in this study (Table 2). In MEGAN2.1, these compounds, which are thought to originate from leaf surface waxes exposed to ozone and UV (Fruekilde et al., 1998), significantly contribute to OH reactivity, while our data suggest they are minor sources (smaller OH reactivity fluxes).
Although methanol contributed substantially to total BVOC emissions from rapeseed, its role in OH reactivity was limited (about 14 %), consistent with Bsaibes et al. (2020). The larger contribution (more than 35 %) to total OH reactivity by formaldehyde was similarly observed in this study and MEGAN2.1 estimates. However, as mentioned earlier in this study, there exists uncertainties in formaldehyde quantification, which tend to prevent robust conclusions to be drawn for this compound. Instead, rapeseed was found to be a stronger source of monoterpenes than previously assumed in MEGAN2.1. Because terpenoids have OH reaction constants about 100 times higher than methanol (Atkinson and Arey, 2003), they dominated OH reactivity, accounting for 44 % of the total. This is in the same range as the 40 % isoprenoid contribution reported by Bsaibes et al. (2020) in the same field experiment, who based their estimates on concentrations rather than emissions. These figures are about 10 times larger than what is assumed in MEGAN2.1 for these compounds. This suggests that MEGAN2.1 would underestimate the role of terpenoids and isoprenoids, which could have implications for secondary organic aerosol (SOA) formation, as terpenoids and isoprenoids (isoprene, monoterpenes, sesquiterpenes) are far more effective SOA precursors than methanol, acetone, or acetaldehyde (Sakulyanontvittaya et al., 2008).
To our knowledge, this study is the first one to report BVOC fluxes measured by the eddy-covariance technique from a rapeseed field. This technique allowed us to quantify BVOC fluxes continuously at the field scale without disturbing the ecosystem. It showed that oxygenated BVOCs, and above all, methanol, are the main BVOCs emitted by this crop type. Notably, methanol contributed more than 90 % to the summed molar-based emissions during vegetated and bare soil periods. As part of 42 compounds with significant fluxes, the other major emitted compounds were monoterpenes, acetone, isoprene, formaldehyde and methanethiol. Few compounds were seen to be deposited during both fruit development and senescence periods, among which formic and acetic acids were the most deposited ones. BVOC diel emission patterns were related to air temperature and solar radiation dynamics.
The standard emission factors (SEFs) computed in this study are based on a non-invasive method (eddy-covariance) and representative of the whole ecosystem. Our findings eventually show that oxygenated BVOC SEFs were generally smaller than what is estimated in MEGAN2.1 while terpenoid BVOC (isoprene, monoterpenes) SEFs may be underestimated in that model. Finally, our study points out that the contribution to total OH reactivity is mostly due to terpenoids (about 40 %), a value that is 10 times lower than that estimated with MEGAN2.1. These results therefore suggest that the contribution of terpenoids from rapeseed crops could be larger than previously reported, therefore playing a more significant role in secondary organic aerosol formation than previously assumed.
Meteorological and BVOC flux datasets, as well as scripts can be found at https://doi.org/10.57745/AIINCW (Buysse, 2023).
ICOS data are accessible at the ICOS carbon portal (https://hdl.handle.net/11676/78Q_tkc0nWxtTDAo1Of0UHoB, Buysse et al., 2024).
The supplement related to this article is available online at https://doi.org/10.5194/acp-26-12131-2026-supplement.
All co-authors contributed to this field campaign of the COV3ER project. PB analysed the data, initiated and wrote the manuscript with contributions of all co-authors, BL, RC, FL, CD and VG designed the field experiment. BD, OZ, JCG and OF carried out most of the technical work during the experiment, LGG performed BVOC chamber measurements during the field campaign, SB performed OH reactivity measurements during the field campaign, NZ thoroughly reviewed the manuscript.
The contact author has declared that none of the authors has any competing interests.
Publisher's note: Copernicus Publications remains neutral with regard to jurisdictional claims made in the text, published maps, institutional affiliations, or any other geographical representation in this paper. The authors bear the ultimate responsibility for providing appropriate place names. Views expressed in the text are those of the authors and do not necessarily reflect the views of the publisher.
We gratefully thank the AgroParisTech farm, for giving us access to their fields, Dominique Tristant for providing detailed information on the crop management, and AIRPARIF for providing isoprene data at its permanent station.
This research was supported by the region 75 Île-de-France (DIM R2DS, Réseau francilien de Recherche sur le Développement Soutenable, grant no. 1656), ADEME (COV3ER, grant no. 1562C0032) and the EU ICOS Research Infrastructure consortium. The PTR-Qi-ToF-MS is a national instrument supported by ANAEE-FR services (ANR grant no. 11-INBS-0001).
This paper was edited by Thomas Karl and reviewed by two anonymous referees.
Abis, L., Kalalian, C., Lunardelli, B., Wang, T., Zhang, L., Chen, J., Perrier, S., Loubet, B., Ciuraru, R., and George, C.: Measurement report: Biogenic volatile organic compound emission profiles of rapeseed leaf litter and its secondary organic aerosol formation potential, Atmos. Chem. Phys., 21, 12613–12629, https://doi.org/10.5194/acp-21-12613-2021, 2021.
Acton, W. J. F., Schallhart, S., Langford, B., Valach, A., Rantala, P., Fares, S., Carriero, G., Tillmann, R., Tomlinson, S. J., Dragosits, U., Gianelle, D., Hewitt, C. N., and Nemitz, E.: Canopy-scale flux measurements and bottom-up emission estimates of volatile organic compounds from a mixed oak and hornbeam forest in northern Italy, Atmos. Chem. Phys., 16, 7149–7170, https://doi.org/10.5194/acp-16-7149-2016, 2016.
Acton, W. J. F., Huang, Z., Davison, B., Drysdale, W. S., Fu, P., Hollaway, M., Langford, B., Lee, J., Liu, Y., Metzger, S., Mullinger, N., Nemitz, E., Reeves, C. E., Squires, F. A., Vaughan, A. R., Wang, X., Wang, Z., Wild, O., Zhang, Q., Zhang, Y., and Hewitt, C. N.: Surface–atmosphere fluxes of volatile organic compounds in Beijing, Atmos. Chem. Phys., 20, 15101–15125, https://doi.org/10.5194/acp-20-15101-2020, 2020.
AHDB: The growth stages of oilseed rape, https://ahdb.org.uk/knowledge-library/the-growth-stages-of-oilseed-rape (last access: 7 July 2023), 2023.
Atkinson, R. and Arey, J.: Gas-phase tropospheric chemistry of biogenic volatile organic compounds: a review, Atmos. Environ., 37, 197–219, https://doi.org/10.1016/S1352-2310(03)00391-1, 2003.
Atkinson, R., Tuazon, E. C., Arey, J., and Aschmann, S. M.: Atmospheric and indoor chemistry of gas-phase indole, quinoline, and isoquinoline, Atmos. Environ., 29, 3423–3432, 1995.
Aubinet, M., Grelle, A., Ibrom, A., Rannik, U., Moncrieff, J., Foken, T., Kowalski, A. S., Martin, P. H., Berbigier, P., Bernhofer, C., Clement, R., Elbers, J., Granier, A., Grunwald, T., Morgenstern, K., Pilegaard, K., Rebmann, C., Snijders, W., Valentini, R., and Vesala, T.: Estimates of the annual net carbon and water exchange of forests: The EUROFLUX methodology, Adv. Ecol. Res., 30, 113–175, 2000.
Bachy, A., Aubinet, M., Schoon, N., Amelynck, C., Bodson, B., Moureaux, C., and Heinesch, B.: Are BVOC exchanges in agricultural ecosystems overestimated? Insights from fluxes measured in a maize field over a whole growing season, Atmos. Chem. Phys., 16, 5343–5356, https://doi.org/10.5194/acp-16-5343-2016, 2016.
Bachy, A., Aubinet, M., Amelynck, C., Schoon, N., Bodson, B., Moureaux, C., Delaplace, P., De Ligne, A., and Heinesch, B.: Methanol exchange dynamics between a temperate cropland soil and the atmosphere, Atmos. Environ., 176, 229–239, https://doi.org/10.1016/j.atmosenv.2017.12.016, 2018.
Bachy, A., Aubinet, M., Amelynck, C., Schoon, N., Bodson, B., Delaplace, P., De Ligne, A., Digrado, A., du Jardin, P., Fauconnier, M.-L., Mozaffar, A., Müller, J.-F., and Heinesch, B.: Dynamics and mechanisms of volatile organic compound exchanges in a winter wheat field, Atmos. Environ., 221, 117105, https://doi.org/10.1016/j.atmosenv.2019.117105, 2020.
Bamberger, I., Hörtnagl, L., Ruuskanen, T. M., Schnitzhofer, R., Müller, M., Graus, M., Karl, T., Wohlfhart, G., and Hansel, A.: Deposition fluxes of terpenes over grassland, J. Geophys. Res., 116, D14305, https://doi.org/10.1029/2010JD015457, 2011.
Boy, M., Zhou, P., Kurtén, T., Chen, D., Xavier, C., Clusius, P., Roldin, P., Baykara, M., Pichelstorfer, L., Foreback, B., Bäck, J., Petäjä, T., Makkonen, R., Kerminen, V.-M., Pihlatie, M., Aalto, J., and Kulmala, M.: Positive feedback mechanism between biogenic volatile organic compounds and the methane lifetime in future climates, Clim. Atmos. Sci., 5, 72, https://doi.org/10.1038/s41612-022-00292-0, 2022.
Brilli, F., Gioli, B., Zona, D., Pallozzi, E., Zenone, T., Fratini, G., Calfapietra, C., Loreto, F., Janssens, I. A., and Ceulemans, R.: Simultaneous leaf- and ecosystem-level fluxes of volatile organic compounds from a poplar-based SRC plantation, Agr. Forest Meteorol., 187, 22–35, https://doi.org/10.1016/j.agrformet.2013.11.006, 2014a.
Brilli, F., Gioli, B., Ciccioli, P., Zona, D., Loreto, F., Janssens, I. A., and Ceulemans, R.: Proton Transfer Reaction Time-of-Flight Mass Spectrometric (PTR-TOFMS) determination of volatile organic compounds (VOCs) emitted from a biomass fire developed under stable nocturnal conditions, Atmos. Environ., 97, 54–67, 2014b.
Brilli, F., Gioli, B., Fares, S., Terenzio, Z., Zona, D., Gielen, B., Loreto, F., Janssens, I. A., and Ceulemans, R.: Rapid leaf development drives the seasonal pattern of volatile organic compound (VOC) fluxes in a “coppiced” bioenergy poplar plantation: Seasonality of VOC fluxes in coppiced poplars, Plant Cell Environ., 39, 539–555, https://doi.org/10.1111/pce.12638, 2016.
Bsaibes, S., Gros, V., Truong, F., Boissard, C., Baisnée, D., Sarda-Esteve, R., Zannoni, N., Lafouge, F., Ciuraru, R., Buysse, P., Kammer, J., Gomez, L. G., and Loubet, B.: Characterization of Total OH Reactivity in a Rapeseed Field: Results from the COV3ER Experiment in April 2017, Atmosphere, 11, 261, https://doi.org/10.3390/atmos11030261, 2020.
Butcher, R. D., Macfarlane-Smith, W., Robertson, G. W., and Griffiths, D. W.: The identification of potential aeroallergen/irritant(s) from oilseed rape (Brassica napus spp. oleifera): volatile organic compounds emitted during flowering progression, Clin. Exp. Allergy, 24, 1105–1114, https://doi.org/10.1111/j.1365-2222.1994.tb03315.x, 1994.
Butcher, R. D., Goodman, B. A., and Deighton, N.: Evaluation of the allergic/irritant potential of air pollutants: detection of proteins modified by volatile organic compounds from oilseed rape (Brassica napus ssp. oleiferd) using electrospray ionization-mass spectrometry, Clin. Exp. Allergy, 25, 985–992, https://doi.org/10.1111/j.1365-2222.1995.tb00401.x, 1995.
Buysse, P.: Data_ECFlux_COV3ER2017, Recherche Data Gouv, V2 [code and data set], https://doi.org/10.57745/AIINCW, 2023.
Buysse, P., Loubet, B., Depuydt, J., Durand, B., and Gueudet, J.: Fluxnet Archive Product from Grignon, 2004–2023, FLUXNET [data set], https://hdl.handle.net/11676/78Q_tkc0nWxtTDAo1Of0UHoB (last access: 19 August 2026), 2024.
Chen, S., Xu, Z., Liu, P., Zhuang, Y., Jiang, M., Zhang, X., Han, Z., Liu, Y., and Chen, X.: Assessment of volatile organic compound emissions from pesticides in China and their contribution to ozone formation potential, Environ. Monit. Assess., 194, 737, https://doi.org/10.1007/s10661-022-10423-y, 2022.
Courtois, E. A., Paine, C. E. T., Blandinieres, P.-A., Stien, D., Bessiere, J.-M., Houel, E., Baraloto, C., and Chave, J.: Diversity of the Volatile Organic Compounds Emitted by 55 Species of Tropical Trees: a Survey in French Guiana, J. Chem. Ecol., 35, 1349–1362, https://doi.org/10.1007/s10886-009-9718-1, 2009.
Das, M., Kang, D., Aneja, V. P., Lonneman, W., Cook, D. R., and Wesely, M. L.: Measurements of hydrocarbon air–surface exchange rates over maize, Atmos. Environ., 37, 2269–2277, https://doi.org/10.1016/S1352-2310(03)00076-1, 2003.
Fall, R. and Benson, A. A.: Leaf methanol – the simplest natural product from plants, Trends Plant Sci., 1, 296–301, https://doi.org/10.1016/S1360-1385(96)88175-0, 1996.
FAOSTAT: FAOSTAT: Food and agriculture data, https://www.fao.org/faostat/en/#home (last access: 7 July 2023), 2023.
Fruekilde, P., Hjorth, J., Jensen, N. R., Kotzias, D., and Larsen, B.: Ozonolysis at vegetation surfaces: A source of acetone, 4-oxopentanal, 6-methyl-5-hepten-2-one, and geranyl acetone in the troposphere, Atmos. Environ., 32, 1893–1902, 1998.
Gallagher, M. W., Clayborough, R., Beswick, K. M., Hewitt, C. N., Owen, S., Moncrie, J., and Pilegaard, K.: Assessment of a relaxed eddy accumulation for measurements of fluxes of biogenic volatile organic compounds: study over arable crops and a mature beech forest, Atmos. Environ., 34, 2887–2899, 2000.
Gomez, L. G., Loubet, B., Lafouge, F., Ciuraru, R., Bsaibes, S., Kammer, J., Buysse, P., Durand, B., Gueudet, J.-C., Fanucci, O., Zurfluh, O., Decuq, C., Truong, F., Gros, V., and Boissard, C.: Effect of senescence on biogenic volatile organic compound fluxes in wheat plants, Atmos. Environ., 266, 118665, https://doi.org/10.1016/j.atmosenv.2021.118665, 2021.
Gonzaga Gomez, L., Loubet, B., Lafouge, F., Ciuraru, R., Buysse, P., Durand, B., Gueudet, J.-C., Fanucci, O., Fortineau, A., Zurfluh, O., Decuq, C., Kammer, J., Duprix, P., Bsaibes, S., Truong, F., Gros, V., and Boissard, C.: Comparative study of biogenic volatile organic compounds fluxes by wheat, maize and rapeseed with dynamic chambers over a short period in northern France, Atmos. Environ., 214, 116855, https://doi.org/10.1016/j.atmosenv.2019.116855, 2019.
Graus, M., Eller, A. S. D., Fall, R., Yuan, B., Qian, Y., Westra, P., de Gouw, J., and Warneke, C.: Biosphere-atmosphere exchange of volatile organic compounds over C4 biofuel crops, Atmos. Environ., 66, 161–168, https://doi.org/10.1016/j.atmosenv.2011.12.042, 2013.
Gros, V. and Zannoni, N.: Total OH Reactivity, in: Atmospheric Chemistry in the Mediterranean Region, edited by: Dulac, F., Sauvage, S., and Hamonou, E., Springer, Cham, https://doi.org/10.1007/978-3-030-82385-6_7, 2022.
Guenther, A.: Seasonal and spatial variations in natural volatile organic compound emissions, Ecol. Appl., 7, 34–45, https://doi.org/10.1890/1051-0761(1997)007[0034:SASVIN]2.0.CO;2, 1997.
Guenther, A., Hewitt, C. N., Erickson, D., Fall, R., Geron, C., Graedel, T., Harley, P., Klinger, L., Lerdau, M., Mckay, W. A., Pierce, T., Scholes, B., Steinbrecher, R., Tallamraju, R., Taylor, J., and Zimmerman, P.: A global model of natural volatile organic compound emissions, J. Geophys. Res., 100, 8873, https://doi.org/10.1029/94JD02950, 1995.
Guenther, A. B., Jiang, X., Heald, C. L., Sakulyanontvittaya, T., Duhl, T., Emmons, L. K., and Wang, X.: The Model of Emissions of Gases and Aerosols from Nature version 2.1 (MEGAN2.1): an extended and updated framework for modeling biogenic emissions, Geosci. Model Dev., 5, 1471–1492, https://doi.org/10.5194/gmd-5-1471-2012, 2012.
Harley, P., Greenberg, J., Niinemets, Ü., and Guenther, A.: Environmental controls over methanol emission from leaves, Biogeosciences, 4, 1083–1099, https://doi.org/10.5194/bg-4-1083-2007, 2007.
Havermann, F., Ghirardo, A., Schnitzler, J., Nendel, C., Hoffmann, M., Kraus, D., and Grote, R.: Modeling Intra‐ and Interannual Variability of BVOC Emissions From Maize, Oil‐Seed Rape, and Ryegrass, J. Adv. Model. Earth Sy., 14, https://doi.org/10.1029/2021MS002683, 2022.
Holzinger, R., Acton, W. J. F., Bloss, W. J., Breitenlechner, M., Crilley, L. R., Dusanter, S., Gonin, M., Gros, V., Keutsch, F. N., Kiendler-Scharr, A., Kramer, L. J., Krechmer, J. E., Languille, B., Locoge, N., Lopez-Hilfiker, F., Materić, D., Moreno, S., Nemitz, E., Quéléver, L. L. J., Sarda Esteve, R., Sauvage, S., Schallhart, S., Sommariva, R., Tillmann, R., Wedel, S., Worton, D. R., Xu, K., and Zaytsev, A.: Validity and limitations of simple reaction kinetics to calculate concentrations of organic compounds from ion counts in PTR-MS, Atmos. Meas. Tech., 12, 6193–6208, https://doi.org/10.5194/amt-12-6193-2019, 2019.
Hüve, K., Christ, M., Kleist, E., Uerlings, R., Niinemets, Ü., Walter, A., and Wildt, J.: Simultaneous growth and emission measurements demonstrate an interactive control of methanol release by leaf expansion and stomata, J. Exp. Bot., 58, 1783–1793, https://doi.org/10.1093/jxb/erm038, 2007.
Isaksen, I. S. A., Granier, C., Myhre, G., Berntsen, T. K., Dalsøren, S. B., Gauss, M., Klimont, Z., Benestad, R., Bousquet, P., Collins, W., Cox, T., Eyring, V., Fowler, D., Fuzzi, S., Jöckel, P., Laj, P., Lohmann, U., Maione, M., Monks, P., Prevot, A. S. H., Raes, F., Richter, A., Rognerud, B., Schulz, M., Shindell, D., Stevenson, D. S., Storelvmo, T., Wang, W.-C., van Weele, M., Wild, M., and Wuebbles, D.: Atmospheric composition change: Climate–Chemistry interactions, Atmos. Environ., 43, 5138–5192, https://doi.org/10.1016/j.atmosenv.2009.08.003, 2009.
Jakobsen, H. B., Friis, P., Nielsen, J. K., and Olsen, C. E.: Emission of volatiles from flowers and leaves of Brassica napus in situ, Phytochemistry, 37, 695–699, 1994.
Jensen, N. R., Gruening, C., Goded, I., Müller, M., Hjorth, J., and Wisthaler, A.: Eddy-covariance flux measurements in an Italian deciduous forest using PTR-ToF-MS, PTR-QMS and FIS, Int. J. Environ. Anal. Chem., 98, 758–788, https://doi.org/10.1080/03067319.2018.1502758, 2018.
Jiao, Y., Acdan, J., Xu, R., Deventer, M. J., Zhang, W., and Rhew, R.C.: Global Methyl Halide Emissions From Rapeseed (Brassica napus) Using Life Cycle Measurements, Geophys. Res. Lett., 47, e2020GL089373. https://doi.org/10.1029/2020GL089373, 2020.
Kammer, J., Décuq, C., Baisnée, D., Ciuraru, R., Lafouge, F., Buysse, P., Bsaibes, S., Henderson, B., Cristescu, S. M., Benabdallah, R., Chandra, V., Durand, B., Fanucci, O., Petit, J.-E., Truong, F., Bonnaire, N., Sarda-Estève, R., Gros, V., and Loubet, B.: Characterization of particulate and gaseous pollutants from a French dairy and sheep farm, Sci. Total Environ., 712, 135598, https://doi.org/10.1016/j.scitotenv.2019.135598, 2020.
Kaplan, J. O., Folberth, G., and Hauglustaine, D. A.: Role of methane and biogenic volatile organic compound sources in late glacial and Holocene fluctuations of atmospheric methane concentrations, Global Biogeochem. Cy., 20, https://doi.org/10.1029/2005GB002590, 2006.
Karl, M., Guenther, A., Köble, R., Leip, A., and Seufert, G.: A new European plant-specific emission inventory of biogenic volatile organic compounds for use in atmospheric transport models, Biogeosciences, 6, 1059–1087, https://doi.org/10.5194/bg-6-1059-2009, 2009.
Karl, T., Guenther, A., Lindinger, C., Jordan, A., Fall, R., and Lindinger, W.: Eddy covariance measurements of oxygenated volatile organic compound fluxes from crop harvesting using a redesigned proton-transfer-reaction mass spectrometer, J. Geophys. Res., 106, 24157–24167, https://doi.org/10.1029/2000JD000112, 2001.
Kesselmeier, J., Bode, K., Gerlach, C., and Jork, E.-M.: Exchange of atmospheric formic and acetic acids with trees and crop plants under controlled chamber and purified air conditions, Atmos. Environ.t, 32, 1765–1775, https://doi.org/10.1016/S1352-2310(97)00465-2, 1998.
Kljun, N., Calanca, P., Rotach, M. W., and Schmid, H. P.: A simple two-dimensional parameterisation for Flux Footprint Prediction (FFP), Geosci. Model Dev., 8, 3695–3713, https://doi.org/10.5194/gmd-8-3695-2015, 2015.
Konig, G.: Relative contribution of oxygenated hydrocarbons to the total biogenic VOC emissions of selected mid-European agricultural and natural plant species, Atmos. Environ., 29, 861–874, https://doi.org/10.1016/1352-2310(95)00026-U, 1995.
Koss, A. R., Sekimoto, K., Gilman, J. B., Selimovic, V., Coggon, M. M., Zarzana, K. J., Yuan, B., Lerner, B. M., Brown, S. S., Jimenez, J. L., Krechmer, J., Roberts, J. M., Warneke, C., Yokelson, R. J., and de Gouw, J.: Non-methane organic gas emissions from biomass burning: identification, quantification, and emission factors from PTR-ToF during the FIREX 2016 laboratory experiment, Atmos. Chem. Phys., 18, 3299–3319, https://doi.org/10.5194/acp-18-3299-2018, 2018.
Langford, B., Acton, W., Ammann, C., Valach, A., and Nemitz, E.: Eddy-covariance data with low signal-to-noise ratio: time-lag determination, uncertainties and limit of detection, Atmos. Meas. Tech., 8, 4197–4213, https://doi.org/10.5194/amt-8-4197-2015, 2015.
Loubet, B., Laville, P., Lehuger, S., Larmanou, E., Fléchard, C., Mascher, N., Genermont, S., Roche, R., Ferrara, R. M., Stella, P., Personne, E., Durand, B., Decuq, C., Flura, D., Masson, S., Fanucci, O., Rampon, J.-N., Siemens, J., Kindler, R., Gabrielle, B., Schrumpf, M., and Cellier, P.: Carbon, nitrogen and Greenhouse gases budgets over a four years crop rotation in northern France, Plant Soil, 343, 109–137, https://doi.org/10.1007/s11104-011-0751-9, 2011.
Loubet, B., Buysse, P., Gonzaga-Gomez, L., Lafouge, F., Ciuraru, R., Decuq, C., Kammer, J., Bsaibes, S., Boissard, C., Durand, B., Gueudet, J.-C., Fanucci, O., Zurfluh, O., Abis, L., Zannoni, N., Truong, F., Baisnée, D., Sarda-Estève, R., Staudt, M., and Gros, V.: Volatile organic compound fluxes over a winter wheat field by PTR-Qi-TOF-MS and eddy covariance, Atmos. Chem. Phys., 22, 2817–2842, https://doi.org/10.5194/acp-22-2817-2022, 2022.
Mahilang, M., Deb, M. K., and Pervez, S.: Biogenic secondary organic aerosols: A review on formation mechanism, analytical challenges and environmental impacts, Chemosphere, 262, 127771, https://doi.org/10.1016/j.chemosphere.2020.127771, 2021.
Manco, A., Brilli, F., Famulari, D., Gasbarra, D., Gioli, B., Vitale, L., Tommasi, P. di, Loubet, B., Arena, C., and Magliulo, V.: Cross-correlations of Biogenic Volatile Organic Compounds (BVOC) emissions typify different phenological stages and stressful events in a Mediterranean Sorghum plantation, Agr. Forest Meteorol., 303, 108380, https://doi.org/10.1016/j.agrformet.2021.108380, 2021.
McEwan, M. and Macfarlane Smith, W. H.: Identification of volatile organic compounds emitted in the field by oilseed rape (Brassica napus ssp. oleifera) over the growing season, Clin. Exp. Allergy, 28, 332–338, https://doi.org/10.1046/j.1365-2222.1998.00234.x, 1998.
Millet, D. B., Alwe, H. D., Chen, X., Deventer, M. J., Griffis, T. J., Holzinger, R., Bertman, S. B., Rickly, B. S., Stevens, B. S., Léonardis, T., Locoge, N., Dusanter, S., Tyndall, G. S., Alvarez, S. L., Erickson, M. H., and Flynn, J. H.: Bidirectional Ecosystem–Atmosphere Fluxes of Volatile Organic Compounds Across the Mass Spectrum: How Many Matter?, ACS Earth Space Chem., 2, , 764–777, https://doi.org/10.1021/acsearthspacechem.8b00061, 2018.
Morrison, E. C., Drewer, J., and Heal, M. R.: A comparison of isoprene and monoterpene emission rates from the perennial bioenergy crops short-rotation coppice willow and Miscanthus and the annual arable crops wheat and oilseed rape, GCB Bioenergy, 8, 211–225, https://doi.org/10.1111/gcbb.12257, 2016.
Mozaffar, A., Schoon, N., Digrado, A., Bachy, A., Delaplace, P., Du Jardin, P., Fauconnier, M.-L., Aubinet, M., Heinesch, B., and Amelynck, C.: Methanol emissions from maize: Ontogenetic dependence to varying light conditions and guttation as an additional factor constraining the flux, Atmos. Environ., 152, 405–417, https://doi.org/10.1016/j.atmosenv.2016.12.041, 2017.
Mozaffar, A., Schoon, N., Bachy, A., Digrado, A., Heinesch, B., Aubinet, M., Fauconnier, M.-L., Delaplace, P., du Jardin, P., and Amelynck, C.: Biogenic volatile organic compound emissions from senescent maize leaves and a comparison with other leaf developmental stages, Atmos. Environ., 176, 71–81, https://doi.org/10.1016/j.atmosenv.2017.12.020, 2018.
Müller, K., Pelzing, M., Gnauk, T., Kappe, A., Teichmann, U., Spindler, G., Haferkorn, S., Jahn, Y., and Herrmann, H.: Monoterpene emissions and carbonyl compound air concentrations during the blooming period of rape (Brassica napus), Chemosphere, 49, 1247–1256, https://doi.org/10.1016/S0045-6535(02)00610-0, 2002.
Niinemets, U., Loreto, F., and Reichstein, M.: Physiological and physicochemical controls on foliar volatile organic compound emissions, Trends Plant Sci. 9, 180–186, 2004.
NIST (National Institute of Standards and Technology) database: Standard reference dataset, https://doi.org/10.18434/T4D303, 2023.
Pagonis, D., Sekimoto, K., and de Gouw, J. : A Library of Proton-Transfer Reactions of H3O+ Ions Used for Trace Gas Detection, J. Am. Soc. Mass Spectrom., 30, 1330–1335, https://doi.org/10.1007/s13361-019-02209-3, 2019.
Park, J.-H., Goldstein, A. H., Timkovsky, J., Fares, S., Weber, R., Karlik, J., and Holzinger, R.: Eddy covariance emission and deposition flux measurements using proton transfer reaction – time of flight – mass spectrometry (PTR-TOF-MS): comparison with PTR-MS measured vertical gradients and fluxes, Atmos. Chem. Phys., 13, 1439–1456, https://doi.org/10.5194/acp-13-1439-2013, 2013.
Park, J.-H., Fares, S., Weber, R., and Goldstein, A. H.: Biogenic volatile organic compound emissions during BEARPEX 2009 measured by eddy covariance and flux–gradient similarity methods, Atmos. Chem. Phys., 14, 231–244, https://doi.org/10.5194/acp-14-231-2014, 2014.
Peñuelas, J. and Staudt, M.: BVOC and global change, Trend. Plant Sci., 15, 133–144, https://doi.org/10.1016/j.tplants.2009.12.005, 2010.
Piesik, D., Pańka, D., Delaney, K. J., Skoczek, A., Lamparski, R., and Weaver, D. K.: Cereal crop volatile organic compound induction after mechanical injury, beetle herbivory (Oulema spp.), or fungal infection (Fusarium spp.), J. Plant Physiol., 168, 878–886, https://doi.org/10.1016/j.jplph.2010.11.010, 2011.
Rottenberger, S., Kuhn, U., Wolf, A., Schebeske, G., Oliva, S. T., Tavares, T. M., and Kesselmeier, J.: Formaldehyde and acetaldehyde exchange during leaf development of the Amazonian deciduous tree species Hymenaea courbaril, Atmos. Environ., 39, 2275–2279, https://doi.org/10.1016/j.atmosenv.2004.12.027, 2005.
Ruuskanen, T. M., Müller, M., Schnitzhofer, R., Karl, T., Graus, M., Bamberger, I., Hörtnagl, L., Brilli, F., Wohlfahrt, G., and Hansel, A.: Eddy covariance VOC emission and deposition fluxes above grassland using PTR-TOF, Atmos. Chem. Phys., 11, 611–625, https://doi.org/10.5194/acp-11-611-2011, 2011.
Sakulyanontvittaya, T., Guenther, A., Helmig, D., Milford, J., and Wiedinmyer, C.: Secondary Organic Aerosol from Sesquiterpene and Monoterpene Emissions in the United States, Environ. Sci. Technol., 42, 8784–8790, https://doi.org/10.1021/es800817r, 2008.
Salazar Gómez, J. I., Klucken, C., Sojka, M., Masliuk, L., Lunkenbein, T., Schlögl, R., and Ruland, H.: Elucidation of artefacts in proton transfer reaction time-of-flight mass spectrometers, J. Mass Spectrom., 54, 987–1002, 2019.
Salazar Gómez, J. I., Sojka, M., Klucken, C., Schlögl, R., and Ruland, H.: Determination of trace compounds and artifacts in nitrogen background measurements by proton transfer reaction time-of-flight mass spectrometry under dry and humid conditions, J. Mass Spectrom., 56, e4777, https://doi.org/10.1002/jms.4777, 2021.
Sarkar, C., Guenther, A. B., Park, J.-H., Seco, R., Alves, E., Batalha, S., Santana, R., Kim, S., Smith, J., Tóta, J., and Vega, O.: PTR-TOF-MS eddy covariance measurements of isoprene and monoterpene fluxes from an eastern Amazonian rainforest, Atmos. Chem. Phys., 20, 7179–7191, https://doi.org/10.5194/acp-20-7179-2020, 2020.
Sartelet, K. N., Couvidat, F., Seigneur, C., and Roustan, Y.: Impact of biogenic emissions on air quality over Europe and North America, Atmos. Environ., 53, 131–141, https://doi.org/10.1016/j.atmosenv.2011.10.046, 2012.
Schallhart, S., Rantala, P., Nemitz, E., Taipale, D., Tillmann, R., Mentel, T. F., Loubet, B., Gerosa, G., Finco, A., Rinne, J., and Ruuskanen, T. M.: Characterization of total ecosystem-scale biogenic VOC exchange at a Mediterranean oak–hornbeam forest, Atmos. Chem. Phys., 16, 7171–7194, https://doi.org/10.5194/acp-16-7171-2016, 2016.
Schallhart, S., Rantala, P., Kajos, M. K., Aalto, J., Mammarella, I., Ruuskanen, T. M., and Kulmala, M.: Temporal variation of VOC fluxes measured with PTR-TOF above a boreal forest, Atmos. Chem. Phys., 18, 815–832, https://doi.org/10.5194/acp-18-815-2018, 2018.
Seco, R., Peñuelas, J., and Filella, I.: Short-chain oxygenated VOCs: Emission and uptake by plants and atmospheric sources, sinks, and concentrations, Atmos. Environ., 41, 2477–2499, https://doi.org/10.1016/j.atmosenv.2006.11.029, 2007.
Seco, R., Holst, T., Matzen, M. S., Westergaard-Nielsen, A., Li, T., Simin, T., Jansen, J., Crill, P., Friborg, T., Rinne, J., and Rinnan, R.: Volatile organic compound fluxes in a subarctic peatland and lake, Atmos. Chem. Phys., 20, 13399–13416, https://doi.org/10.5194/acp-20-13399-2020, 2020.
Sindelarova, K., Granier, C., Bouarar, I., Guenther, A., Tilmes, S., Stavrakou, T., Müller, J.-F., Kuhn, U., Stefani, P., and Knorr, W.: Global data set of biogenic VOC emissions calculated by the MEGAN model over the last 30 years, Atmos. Chem. Phys., 14, 9317–9341, https://doi.org/10.5194/acp-14-9317-2014, 2014.
Spirig, C., Neftel, A., Ammann, C., Dommen, J., Grabmer, W., Thielmann, A., Schaub, A., Beauchamp, J., Wisthaler, A., and Hansel, A.: Eddy covariance flux measurements of biogenic VOCs during ECHO 2003 using proton transfer reaction mass spectrometry, Atmos. Chem. Phys., 5, 465–481, https://doi.org/10.5194/acp-5-465-2005, 2005.
Stevenson, D. S., Zhao, A., Naik, V., O'Connor, F. M., Tilmes, S., Zeng, G., Murray, L. T., Collins, W. J., Griffiths, P. T., Shim, S., Horowitz, L. W., Sentman, L. T., and Emmons, L.: Trends in global tropospheric hydroxyl radical and methane lifetime since 1850 from AerChemMIP, Atmos. Chem. Phys., 20, 12905–12920, https://doi.org/10.5194/acp-20-12905-2020, 2020.
Veromann, E., Toome, M., Kännaste, A., Kaasik, R., Copolovici, L., Flink, J., Kovács, G., Narits, L., Luik, A., and Niinemets, Ü.: Effects of nitrogen fertilization on insect pests, their parasitoids, plant diseases and volatile organic compounds in Brassica napus, Crop Protect., 43, 79–88, https://doi.org/10.1016/j.cropro.2012.09.001, 2013.
Vivaldo, G., Masi, E., Taiti, C., Caldarelli, G., and Mancuso, S.: The network of plants volatile organic compounds, Sci. Rep., 7, 11050, https://doi.org/10.1038/s41598-017-10975-x, 2017.
Voyard, A., Ciuraru, R., Lafouge, F., Décuq, C., Fortineau, A., Loubet, B., Staudt, M., and Rees, F.: Emissions of volatile organic compounds from aboveground and belowground parts of rapeseed (Brassica napus L.) and tomato (Solanum lycopersicum L.), Sci. Total Environ., 955, 177081, https://doi.org/10.1016/j.scitotenv.2024.177081, 2024.
Vuolo, R. M., Loubet, B., Mascher, N., Gueudet, J.-C., Durand, B., Laville, P., Zurfluh, O., Ciuraru, R., Stella, P., and Trebs, I.: Nitrogen oxides and ozone fluxes from an oilseed-rape management cycle: the influence of cattle slurry application, Biogeosciences, 14, 2225–2244, https://doi.org/10.5194/bg-14-2225-2017, 2017.
Wiß, F., Ghirardo, A., Schnitzler, J.-P., Nendel, C., Augustin, J., Hoffmann, M., and Grote, R.: Net ecosystem fluxes and composition of biogenic volatile organic compounds over a maize field-interaction of meteorology and phenological stages, GCB Bioenergy, 9, 1627–1643, https://doi.org/10.1111/gcbb.12454, 2017.
Woźniak, E., Waszkowska, E., Zimny, T., Sowa, S., and Twardowski, T.: The Rapeseed Potential in Poland and Germany in the Context of Production, Legislation, and Intellectual Property Rights, Front. Plant Sci., 10, 1423, https://doi.org/10.3389/fpls.2019.01423, 2019.
Xue, J., Ma, F., Elm, J., Chen, J., and Xie, H.-B.: Atmospheric oxidation mechanism and kinetics of indole initiated by •OH and •Cl: a computational study, Atmos. Chem. Phys., 22, 11543–11555, https://doi.org/10.5194/acp-22-11543-2022, 2022.
Yáñez-Serrano, A. M., Filella, I., LLusià, J., Gargallo-Garriga, A., Granda, V., Bourtsoukidis, E., Williams, J., Seco, R., Cappellin, L., Werner, C., de Gouw, J., and Peñuelas, J.: GLOVOCS – Master compound assignment guide for proton transfer reaction mass spectrometry users, Atmos. Environ., 244, 117929, https://doi.org/10.1016/j.atmosenv.2020.117929, 2021.