
the Creative Commons Attribution 4.0 License.
the Creative Commons Attribution 4.0 License.
Precursor dynamical factors in the local lower atmosphere of warm-sector heavy rainfall over South China: evidence from wind profiler radar observations
Wanju Li
Lifang Sheng
Xueyan Bi
Zehao Huang
Shiqi Xiao
Chao Liu
Yang Yang
Jiandong Wang
Yuanjian Yang
Simone Lolli
Using 14 wind profiler radars and hourly records at 3000 weather stations during 2016–2020, 226 warm-sector heavy rainfall (WSHR) events were identified in Guangdong, South China. Five indices reflecting the vertical structure of the atmosphere were analyzed as precursor dynamical signals of WSHR occurrence – the Low-Level Jet Index (LLJI), Vertical Wind Shear (VWS), Atmospheric Lifting Intensity (ALI), and Boundary Layer Height (BLH). Notable fluctuations in signals were found 1–4 h before precipitation onset, and the sensitivity and occurrence mechanisms of WSHR in the three regions showed marked regional differences. In western Guangdong, LLJI increased sharply 1–2 h before onset and, although not linearly correlated with rainfall intensity, was systematically higher in strong-rainfall events. LLJI was also significantly correlated with upper-level (3–5 km) ascent, indicating that the strengthening of the low-level jet can directly enhance upward motion and thereby increase precipitation intensity. In central Guangdong, VWS at 0.5–1.5 km was significantly positively correlated with precipitation intensity across three consecutive pre-onset periods, which may reflect frictional deceleration of the low-level jet and the resulting enhancement of low-level convergence. In eastern Guangdong, anomalously weak upper-level ascent and higher convective available potential energy appeared before strong-rainfall events, indicating that suppressed mid-to-upper-level ascent allowed unstable energy to accumulate. Strong events were significantly warmer at 925 hPa, but showed no significant differences in large-scale vertical velocity or low-level relative humidity, suggesting that the instability accumulation was driven mainly by boundary layer warming; the anomalously high BLH is a manifestation of this thermal instability build-up.
- Article
(11682 KB) - Full-text XML
-
Supplement
(2432 KB) - BibTeX
- EndNote
The subtropical monsoon climate dominates South China, where torrential rains are among the most frequent and impactful weather phenomena, particularly during the early summer monsoon season. Warm-sector heavy rainfall (WSHR), defined as intense precipitation that occurs 200–300 km ahead of the frontal boundaries of the surface on their “warm side” (Ding, 1994), is the most prevalent type of torrential rainfall during the summer monsoon in this region. These events typically develop in convergence zones between low-level flows in the southwest and southeast, often characterized by weak horizontal wind shear and minimal influence from tropical cyclones (Huang, 1986). Synoptic-scale baroclinic forcing and thermodynamic instability are generally weak, making the initiation of such extreme precipitation largely dependent on mesoscale convective processes modulated by complex terrain and land-sea contrasts (Sun et al., 2019). Consequently, numerical weather prediction models show limited skill in forecasting the timing, location, and intensity of WSHR (Chen et al., 2019; Luo et al., 2017). Convection-allowing ensemble experiments have shown that even very small differences in initial conditions can lead to divergent forecasts of warm-sector heavy rainfall, with the practical predictability closely linked to the accuracy of low-level winds over the sea and near-surface temperatures over coastal mountains (Wu et al., 2020). Therefore, observations of key meteorological variables at high spatiotemporal resolution are critical to improving accuracy of nowcast.
Previous studies have identified the low-level jet (LLJ) as closely associated with the formation of WSHR along the South China coast, where convergence of southerly low-level airflows favours convective initiation (Du et al., 2020a, b; Higgins et al., 1997; Stensrud, 1996; Trier et al., 2006; Zeng et al., 2019; Zhang and Meng, 2019). LLJs can be classified by their vertical position in the lower troposphere into synoptic-system-related low-level jets (SLLJs) and boundary layer jets (BLJs). Studies have shown that BLJs decelerate and converge as they move from the northern South China Sea toward the coast, influenced by land–sea frictional contrasts and coastal orography (Du et al., 2020b; Du and Chen, 2018; Zhang et al., 2022b), and interact with SLLJs to enhance mesoscale uplift and convective precipitation (Du and Chen, 2018; Du et al., 2020b). Zhang et al. (2022a) developed a promising method to identify precursor signals for WSHR by combining LLJ intensity indices, warm tongues, and low-level convergence using observational and reanalysis datasets. However, false alarms in forecasts are often caused by a lack of information on the vertical structure of the atmosphere. A thorough understanding of the pre-onset vertical structure of WSHR, enabled by high-resolution wind profiler radar (WPR) data, is therefore essential for accurate extraction of precursor signals and improved forecasting. WPR provide continuous, high-temporal and vertical-resolution measurements of horizontal and vertical wind components in the middle and lower troposphere, especially in the boundary layer, without reliance on balloon launches (Liu et al., 2020; Lolli et al., 2013; Kotthaus et al., 2023). These instruments have been increasingly used to investigate the evolution of LLJ, vertical wind shear (VWS), and atmospheric refractivity during torrential rainfall events in Beijing, Shanghai, and Guangzhou (Du et al., 2012; Li et al., 2024b; Xian et al., 2024; Zhou et al., 2022). Such high-resolution observations reveal dynamic changes in the low-level wind field preceding precipitation onset more effectively than conventional sounding data.
Despite progress, most previous studies have focused on limited case analyses or regional scales, lacking a detailed investigation of spatiotemporal differences in precursor signals. This study examines five lower-tropospheric precursor indices – the Low-Level Jet Index (LLJI), Vertical Wind Shear (VWS) at 0.5–1.5 and 1.5–3.0 km, Atmospheric Lifting Intensity (ALI), and Boundary Layer Height (BLH) – during the pre-flood season (April–June) from 2016 to 2020, in order to improve the understanding of regional differences in the mechanisms of generation of WSHR.
The remainder of this paper is organized as follows. Section 2 describes the data sources and methods used in this study. Section 3 provides an overview of the WSHR events identified during the study period. Section 4 presents a comprehensive analysis of precursor signals, their temporal evolution, spatial characteristics, regional physical mechanisms, and urban effects. Finally, Sect. 5 summarizes the main conclusions and discusses implications for forecasting and future research.
2.1 Data
WPR continuously measures horizontal wind and vertical velocity profiles in the lower and middle troposphere at high temporal and vertical resolution (Liu et al., 2020), making them particularly suitable for studying the evolution of pre-precipitation wind fields associated with mesoscale weather systems. In this study, we used data from 14 WPR deployed throughout Guangdong Province during 2016–2020 (Fig. 1): boundary-layer wind profilers (BWPR, L–C band, 0–6 km, 60 m vertical resolution, ∼ 6 min native temporal resolution) at most sites, and a tropospheric profiler (TWPR, P–A band) at Luogang (LG). The Guangdong Meteorological Administration provides two operational products: ROBS (real-time observation, raw profiles at the native resolution) and HOBS (half-hour observation, quality-controlled, 30 min effective resolution). HOBS was used for calculations of all indices, limited to 0–6 km due to reliability constraints at higher altitudes for L–C band systems. The 14 stations and their abbreviations are as follows:
Zhanjiang (ZJ), HaiLingDao (HLD), Luoding (LD), Xinhui (XH), Zhuhai (ZH), Nansha (NS), Huadu (HD), Conghua (CH), Luogang (LG), Zengcheng (ZC), Shenzhen (SZ), Huizhou Longmen (HZ), Wuhua (WH), and Chaozhou (CZ).
All WPR data have undergone strict quality control. Records marked invalid by the instrument were removed. Data exceeding 6000 m in range, horizontal wind speeds outside the range of 0–40 m s−1, and vertical wind speeds outside the range of −10 to 10 m s−1 were also discarded. Subsequently, a two-dimensional median filter was applied in the time–height domain: for each data point, the median value of its valid neighbors within ±2 time steps and ±2 range gates was calculated. If there were at least three valid neighbors, any values that deviated from the median by more than 12 m s−1 (horizontally) or 5 m s−1 (vertically) were set to missing. This process effectively removed persistent contamination from ground clutter. After quality control, the overall availability of data during the analysis period was relatively high.
The number of high-density automatic weather stations (AWS) in Guangdong Province gradually increased between 2016 and 2020, reaching over 3000 in 2020. This study used hourly precipitation data from over 3000 AWS stations across the province to identify WSHR events and calculate precipitation weighted centroids. The locations of AWS stations and WPR, as well as the spatial distribution of urban pixels, are shown in Fig. 1. Urban extent in this study is characterised using the Local Climate Zone (LCZ) classification of Stewart and Oke (2012), with LCZ 1–10 (built-type classes) treated as urban pixels. LCZ maps for Guangdong Province are obtained from Demuzere et al. (2022a). This classification is used both for the province-wide visualisation in Fig. 1 and for the 3 km urban fraction reported per profiler station in Sect. 4.5 and Fig. 16 (areal percentage of LCZ 1–10 pixels within a 3 km buffer centred on each station).
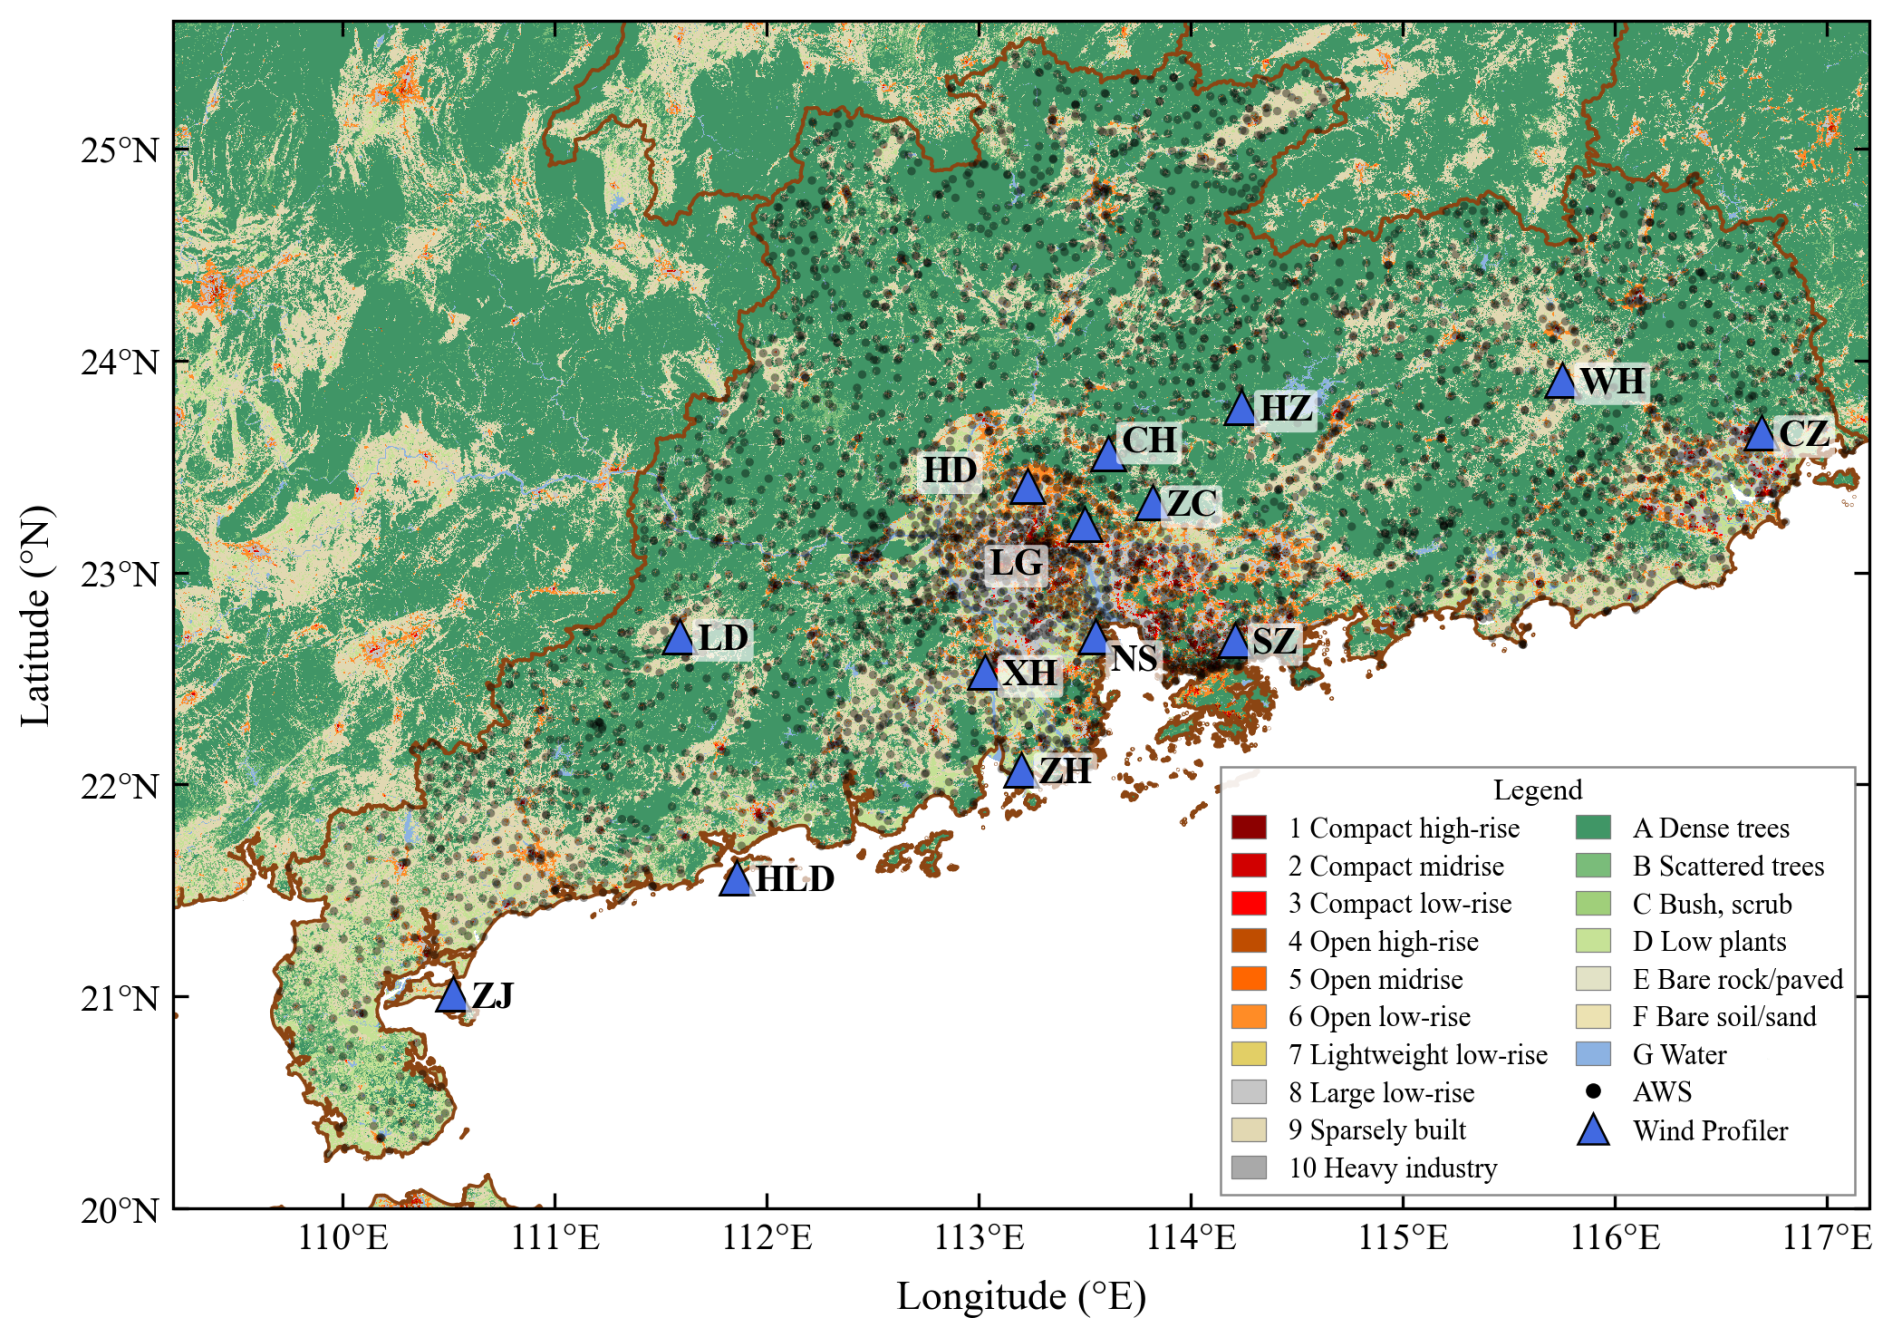
Figure 1Spatial distribution of the WPR network (14 stations, blue), high-density automatic weather stations (> 3000 sites, green), and urban pixels (LCZ 1–10, brown) in Guangdong Province.
Large-scale fields are obtained from the ERA5 reanalysis (Hersbach et al., 2023a, b) at 0.25° × 0.25° horizontal resolution and 1 h temporal resolution, including geopotential height and winds at 925, 850, and 500 hPa, specific humidity for moisture transport and surface-based convective available potential energy (CAPE). Vertically integrated water vapour transport (IVT) is calculated between 1000 and 850 hPa as:
where the IVTu (IVTv) are zonal (meridional) component of the moisture transport vector in kg m−1 s−1, IVT is the magnitude of the vector, g is gravitational accelerations in m s−2, u and v are zonal and meridional components of the layer-mean wind speed, respectively, q is the layer-mean specific humidity in kg kg−1, and dp is pressure difference between two neighboring pressure levels. Positive values of IVTu (IVTv) indicate eastward (northward) zonal (meridional) components.
In addition, vertical moisture transport profiles are characterized by each unintegrated term in Eqs. (4)–(6) for diagnosis in horizontal and vertical components for cross-sectional analysis of moisture transport:
where are horizontal components of moisture transport in each vertical layer in kg m−1 s−1 Pa−1, VTw is vertical component of moisture transport in kg m−2 s−1, ω is vertical components of velocity in Pa s−1.
2.2 Definition and Selection of WSHR Events
WSHR events during the pre-flood season (primarily April–June) of 2016–2020 are identified in two stages. First, candidate warm-sector days are screened according to the method of Liu et al. (2019), which requires the following conditions to be met: (1) the influence of typhoons or tropical depressions is excluded; (2) the daily precipitation of three or more adjacent stations within 100 km is ≥ 50 mm, and there is a period of continuous 3 h with hourly precipitation ≥ 5 mm and a 3 h cumulative total ≥ 30 mm; (3) the warm-sector conditions are confirmed through vertical profiles of θse and temperature advection along the representative station longitude, that is: if there is no obvious frontal system on the profile, the precipitation area is dominated by southerly winds at low-to-middle levels, and the precipitation area is more than 200 km away from the nearest surface northerly wind; if there is an obvious frontal system on the profile, the precipitation area is more than 200 km away from the front. It should be noted that the detection capability of this method is limited by the density and distribution of the precipitation station network.
Secondly, individual events for each candidate day were objectively defined in three Guangdong sub-regions: western Guangdong (western GD, 21.0–22.5° N, 110.0–113.5° E), central Guangdong (central GD, 22.5–24.5° N, 112.5–114.5° E), and eastern Guangdong (eastern GD, 22.5–24.0° N, 115.0–117.0° E), as shown in Fig. 1. These regions correspond to the main areas of high precipitation observed in the province's WSHR. For each sub-region and candidate day, hourly regional average precipitation was calculated from all AWS sites within the region. The onset of an event was defined as when the average precipitation rate reached or exceeded 1.0 mm h−1 for at least three consecutive hours. The event was considered to end after three consecutive hours below 1.0 mm h−1 ; brief intervals of less than 3 h were considered intra-event intervals. Events with a regional average cumulative precipitation of < 5 mm were excluded. The precipitation weighted centroid was calculated as the cumulative precipitation weighted average of the station coordinates. For each event, the WPR station closest to the precipitation weighted centroid (limited to the same sub-region and ≤100 km away) was designated as the representative station for the precursor index calculation; events not meeting this condition were excluded from the analysis. Subsequent analysis (Sect. 4) focused primarily on precursor signals preceding precipitation, as precipitation particles and related contamination significantly degrade radar data quality after precipitation begins. The procedure generated a total of 226 independent WSHR events (65 in western GD, 88 in central GD, and 73 in eastern GD).
2.3 Indices of Atmospheric Conditions and Precursors
Based on the dynamic and thermodynamic conditions of precipitation, this paper selects five indices for study: LLJI, two VWS layers (0.5–1.5 and 1.5–3.0 km), ALI, and BLH. These indices represent different physical processes–LLJ intensity, vertical shear structure, convective uplift, and boundary layer depth. Their relative importance in each region will be empirically assessed in Sect. 4. The indices were calculated from quality-controlled WPR data from representative stations for each event, at native ∼ 30 min resolution and aligned with the precipitation onset time t=0. Raw index values were winsorised at the 5th and 95th percentiles across all events before composite analysis to reduce the influence of extreme outliers. Sensitivity tests using non-winsorised data (not shown) produced consistent temporal patterns, indicating that the results are insensitive to this preprocessing choice.
2.3.1 Low-Level Jet Index (LLJI)
To quantitatively study the relationship between small-scale fluctuations in the LLJ and heavy rainfall, the LLJI is defined as (Liu et al., 2003):
where V is the maximum wind speed under 2 km altitude and D is the lowest altitude at which the wind speed reaches 12 m s−1 in a given time period. When the maximum wind speed does not reach 12 m s−1, D is set to the altitude of the maximum wind speed. The downward transmission of the LLJ and the increase in wind speed leads to an increase in I.
The precision of LLJI is limited by the WPR horizontal wind measurement uncertainty (∼ 1–2 m s−1) and the 60 m vertical resolution; in particular, winds below 0.5 km winds below 0.5 km above ground level (a.g.l.) are subject to ground clutter contamination and are therefore excluded from the computation.
2.3.2 Vertical Wind Shear (VWS)
The VWS of the horizontal wind is conducive to the baroclinic updraft within the convective system. Strong VWS tilts the convective updraft, enabling precipitation particles to fall out of the updraft region, thereby reducing hydrometeor loading on the updraft and sustaining its buoyancy. Strong VWS also enhances the entrainment of dry cold air into the middle layer, strengthening the downdraft and cold outflow near the ground, which forces the inflowing warm, moist air to rise more intensely. The intensity of VWS has a significant impact on the organisational structure of convective storms (single cell, multi-cell, and supercell). WSHR is closely related to the structure, organisation, and propagation of mesoscale convective systems (Chen and Zhang, 2021). The following shows the formula of the VWS:
where ΔV stands for the VWS (units: 10−3 s−1), uz1 and uz2 represent zonal winds at heights z1 and z2, respectively, while vz1 and vz2 denote meridional winds at the top height z1 and the bottom height z2. VWS is analysed in two layers: 0.5–1.5 km (which spans the boundary-layer jet core) and 1.5–3.0 km (spanning the transition from the boundary-layer jet to the free troposphere). Wind measurements below 0.5 km are excluded from the layer-averaged VWS indices used in Sect. 4 due to ground clutter, although the full-resolution profiles shown in Fig. 7 retain this layer for descriptive purposes. The choice of the 0.5–1.5 and 1.5–3.0 km layers is supported by the observed vertical shear maxima (Fig. 7) and typical boundary-layer jet core heights over coastal South China (Du and Chen, 2018).
2.3.3 Atmospheric Lifting Intensity (ALI)
Strong upward motions are known to precede precipitation onset. The product of the maximum uplift velocity and the thickness of the uplift layer is calculated to quantify the intensity of the uplift ALI:
where H represents the atmospheric uplift range where three consecutive observation altitudes within the 0–6 km altitude range show upward vertical velocity; Wmax represents the maximum vertical velocity (unit: m s−1) within the atmospheric updraft range. Factor 10 is a scaling constant used to adjust the index value to a range that is easy to display and compare. ALI values near and after the onset of precipitation should be interpreted with caution, as the vertical velocity measured by WPR contains contributions from hydrometeor fall speeds (∼ 0.5–2 m s−1) that cannot be separated from atmospheric ascent.
2.3.4 Boundary Layer Height (BLH) Estimation
Boundary layer height (BLH) is a key variable describing boundary layer structure (Seibert et al., 2000) and is crucial for elucidating turbulent motion. Furthermore, studies have shown that wind speed is a significant factor influencing BLH variation (Li et al., 2024a). Therefore, boundary layer height was chosen as a precursor indicator. BLH was estimated using an improved vertical velocity standard deviation (σw) method following Heo et al. (2003), who identified the convective boundary layer top from the altitude at which σw sharply decreases toward zero at the top of the turbulent layer using ultra-high frequency wind profiler observations. The original joint implementation proposed in that work was simplified to the σw only approach here, because reliable retrievals of the refractive-index structure parameter were not consistently available across the 2016–2020 sample, particularly under weak-turbulence or dry boundary-layer conditions. Our implementation adapts the σw approach to the humid subtropical environment of coastal South China through layered σw computation (0–3000 m divided into 15 vertical bins of 200 m each), a gradient criterion between adjacent layers (), 3σ outlier removal, and recursive temporal smoothing of the 6 min raw estimates. Compared to the standard method, this regional adaptation reduces the mean bias from +1524 to +300 m, with a root-mean-square error of ∼ 351 m at 20:00 Beijing time (BJT), when validated against the 2016–2019 April–June radiosonde data from Hong Kong Kings Park and Qingyuan stations. Although residual uncertainties of ±300–500 m remain typical for radar-based estimates in humid subtropical regions, the improved product reliably captures diurnal trends and relative changes preceding WSHR onset.
2.3.5 Calculation of vorticity and divergence
Based on the triangle method (Bellamy, 1949), atmospheric vorticity and divergence can be calculated by using three WPR stations deployed in a triangular shape (Wu et al., 2023). The component of each side of the triangle in the spherical coordinate system is calculated based on the latitude, longitude and earth radius at each vertex position of the triangle (). The divergence (D) (unit: s−1) and vorticity (ξ) (unit: s−1) can then be calculated at the same altitude by using the horizontal winds measured at the vertices (). The formulae are as follows:
2.4 Statistical Methods
Composite time series are constructed by aligning all events at the beginning (t=0) and computing the median value of each index in each time step. Uncertainty in the composite median is quantified using bootstrap resampling (2000 resamples with replacement); the 2.5th and 97.5th percentiles of the bootstrap distribution define the 95 % confidence interval.
Associations between index values and subsequent rainfall intensity are assessed using the Spearman rank correlation coefficient. Pre-onset values are averaged over four non-overlapping periods ( to −4 h, −4 to −2 h, −2 to −1 h, and −1 to 0 h) before computing the correlations. The boundaries of these periods are motivated by the composite wind field analysis (Sect. 4.1, Fig. 6), which identifies h as the onset of the most active pre-onset wind field evolution; the innermost period (−1 to 0 h) also represents a practically relevant nowcasting lead time for WSHR. Significance is tested at the 95 % level (p < 0.05).
Regional differences in precipitation characteristics and precursor indices were tested using Kruskal–Wallis one-way ANOVA, with paired comparisons performed where appropriate. Strong and weak precipitation events within each subregion were demarcated by the median of the maximum hourly precipitation intensity recorded for each event; events above the median were classified as strong precipitation, and those below as weak precipitation. Differences between strong and weak precipitation event groups were assessed using the Mann–Whitney U test. All tests were two-tailed nonparametric tests. Sample sizes varied slightly across different figures because each analysis required continuous WPR data within different time windows; events with significant data gaps within the required windows were excluded. Exact numbers, determined independently for each analysis, are reported in the figure captions.
Following the criteria defined in Sect. 2, a total of 226 WSHR events were identified in Guangdong Province during the pre-flood (April to June) of 2016–2020. The urban agglomeration of the Pearl River Delta (PRD) (hereafter the central GD) accounts for the largest share (88 cases, 39 %), followed by the Chaozhou–Shanwei coastal area in eastern GD (73 cases, 32 %) and the Yangjiang coastal area in western GD (65 cases, 29 %). Events peak in May–June across all three regions, though April events occur predominantly in the west.
The rainfall-weighted centroids of individual events cluster into three spatially separated groups (Fig. 2). The western events are concentrated along the coast near Yangjiang (21–22.5° N, 110–113° E), which faces the South China Sea to the south and is backed by the northeast–southwest-oriented Yunwu Mountains to the north. The trumpet-shaped topography near Yangjiang forces onshore airflow to converge and lift as it moves inland. Central events spread across the PRD (22.5–24.5° N, 112.5–114.5° E) and penetrate further inland than events in the other two regions. Eastern events are restricted to the Chaozhou–Shanwei coast (22.5–24° N, 115–117.5° E), bounded to the north by the Lianhua Mountains. The clear spatial gaps between the three clusters support the sub-regional classification adopted here; region boundaries are marked by the dashed rectangles in Fig. 2.
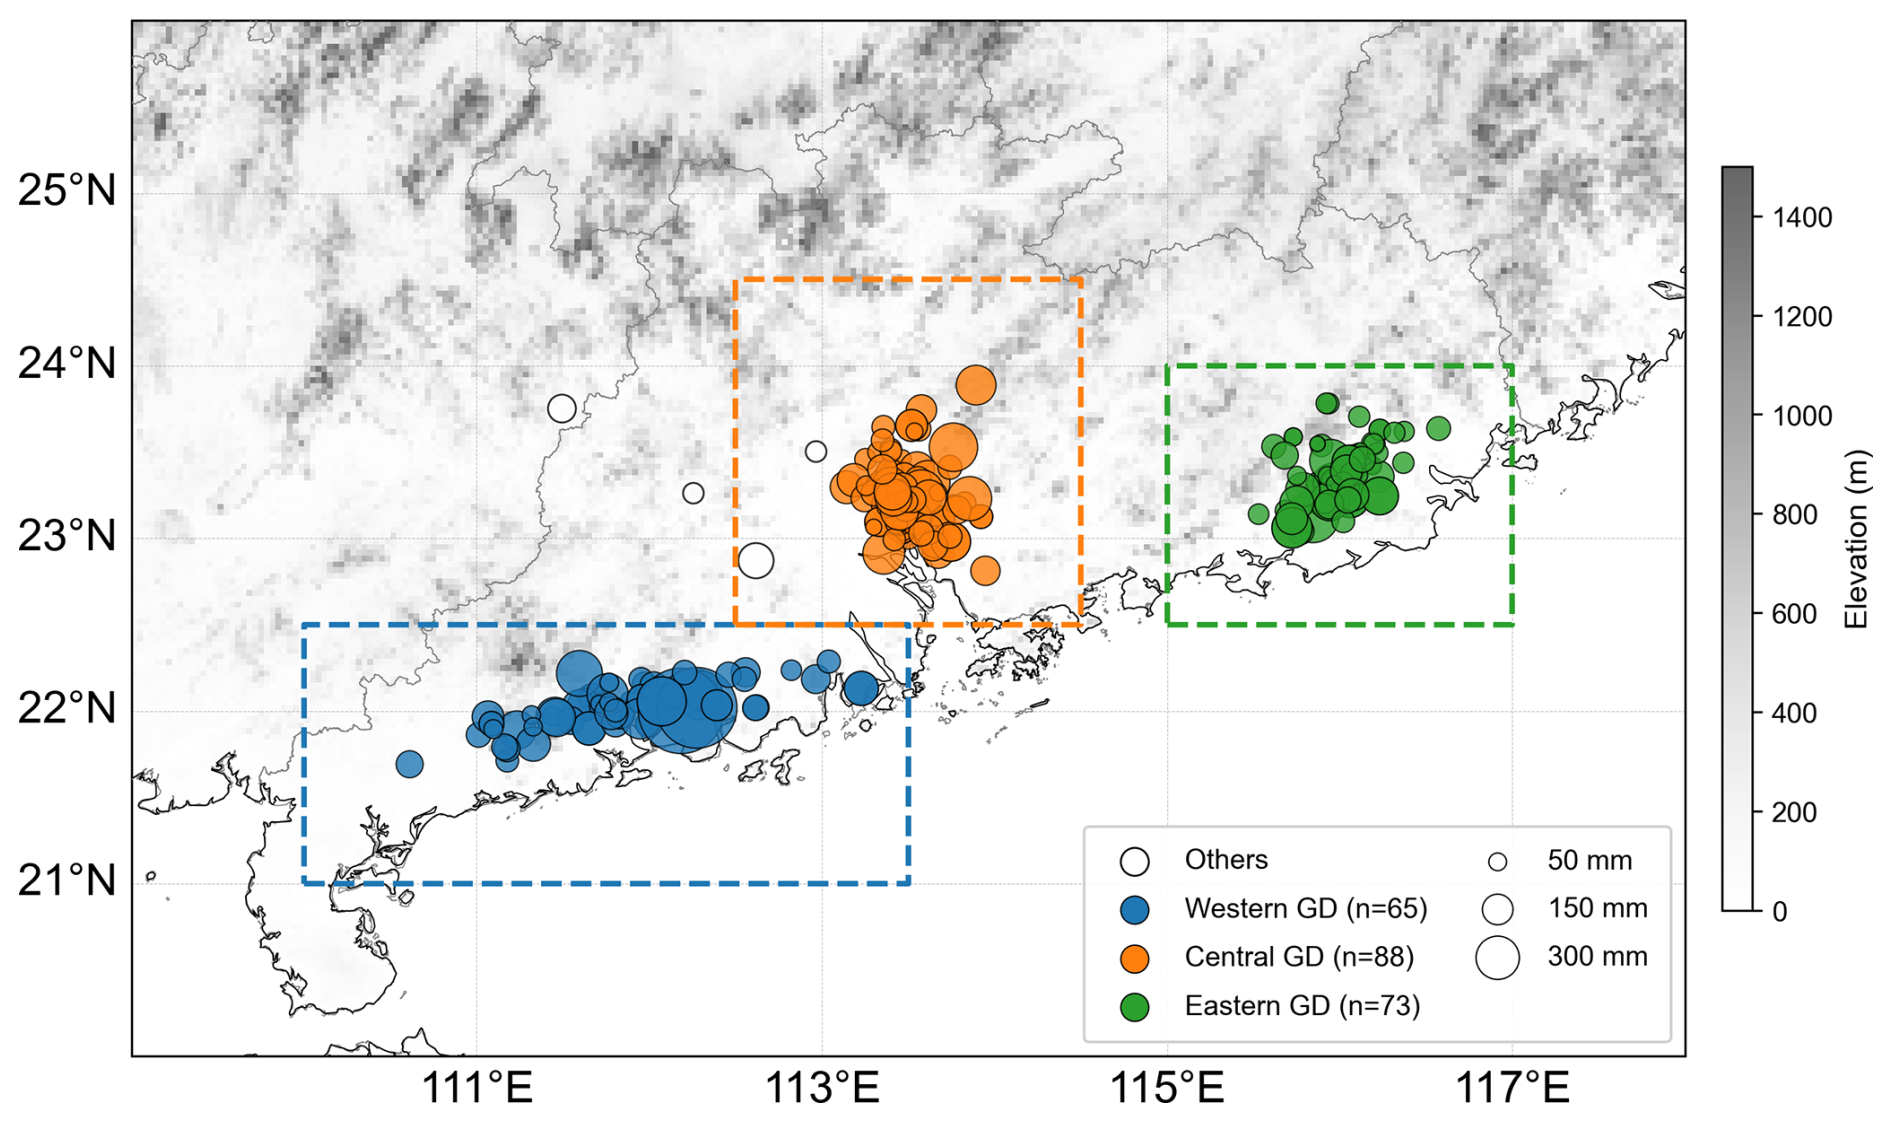
Figure 2Spatial distribution of the WSHR precipitation centers in Guangdong Province during 2016–2020. The size of the marker is proportional to the maximum accumulated precipitation; white markers indicate invalid events. Dashed rectangles delineate the western (blue, n=65), central (orange, n=88), and eastern (green, n=73) sub-regions. Gray shading shows the elevation of the terrain (m).
Among the four rainfall metrics examined (Fig. 3), only maximum hourly rainfall differs significantly across regions: the western median (∼ 70 mm h−1) substantially exceeds the eastern median (∼ 55 mm h−1), with the central region in between. This overall significance primarily reflects the contrast between the western and eastern regions. The mean intensity of the rainfall shows a weaker but still significant difference (H=6.8, p=0.03), while duration and total accumulated rainfall do not differ significantly between regions. Regional differences in WSHR are primarily reflected in rainfall intensity.
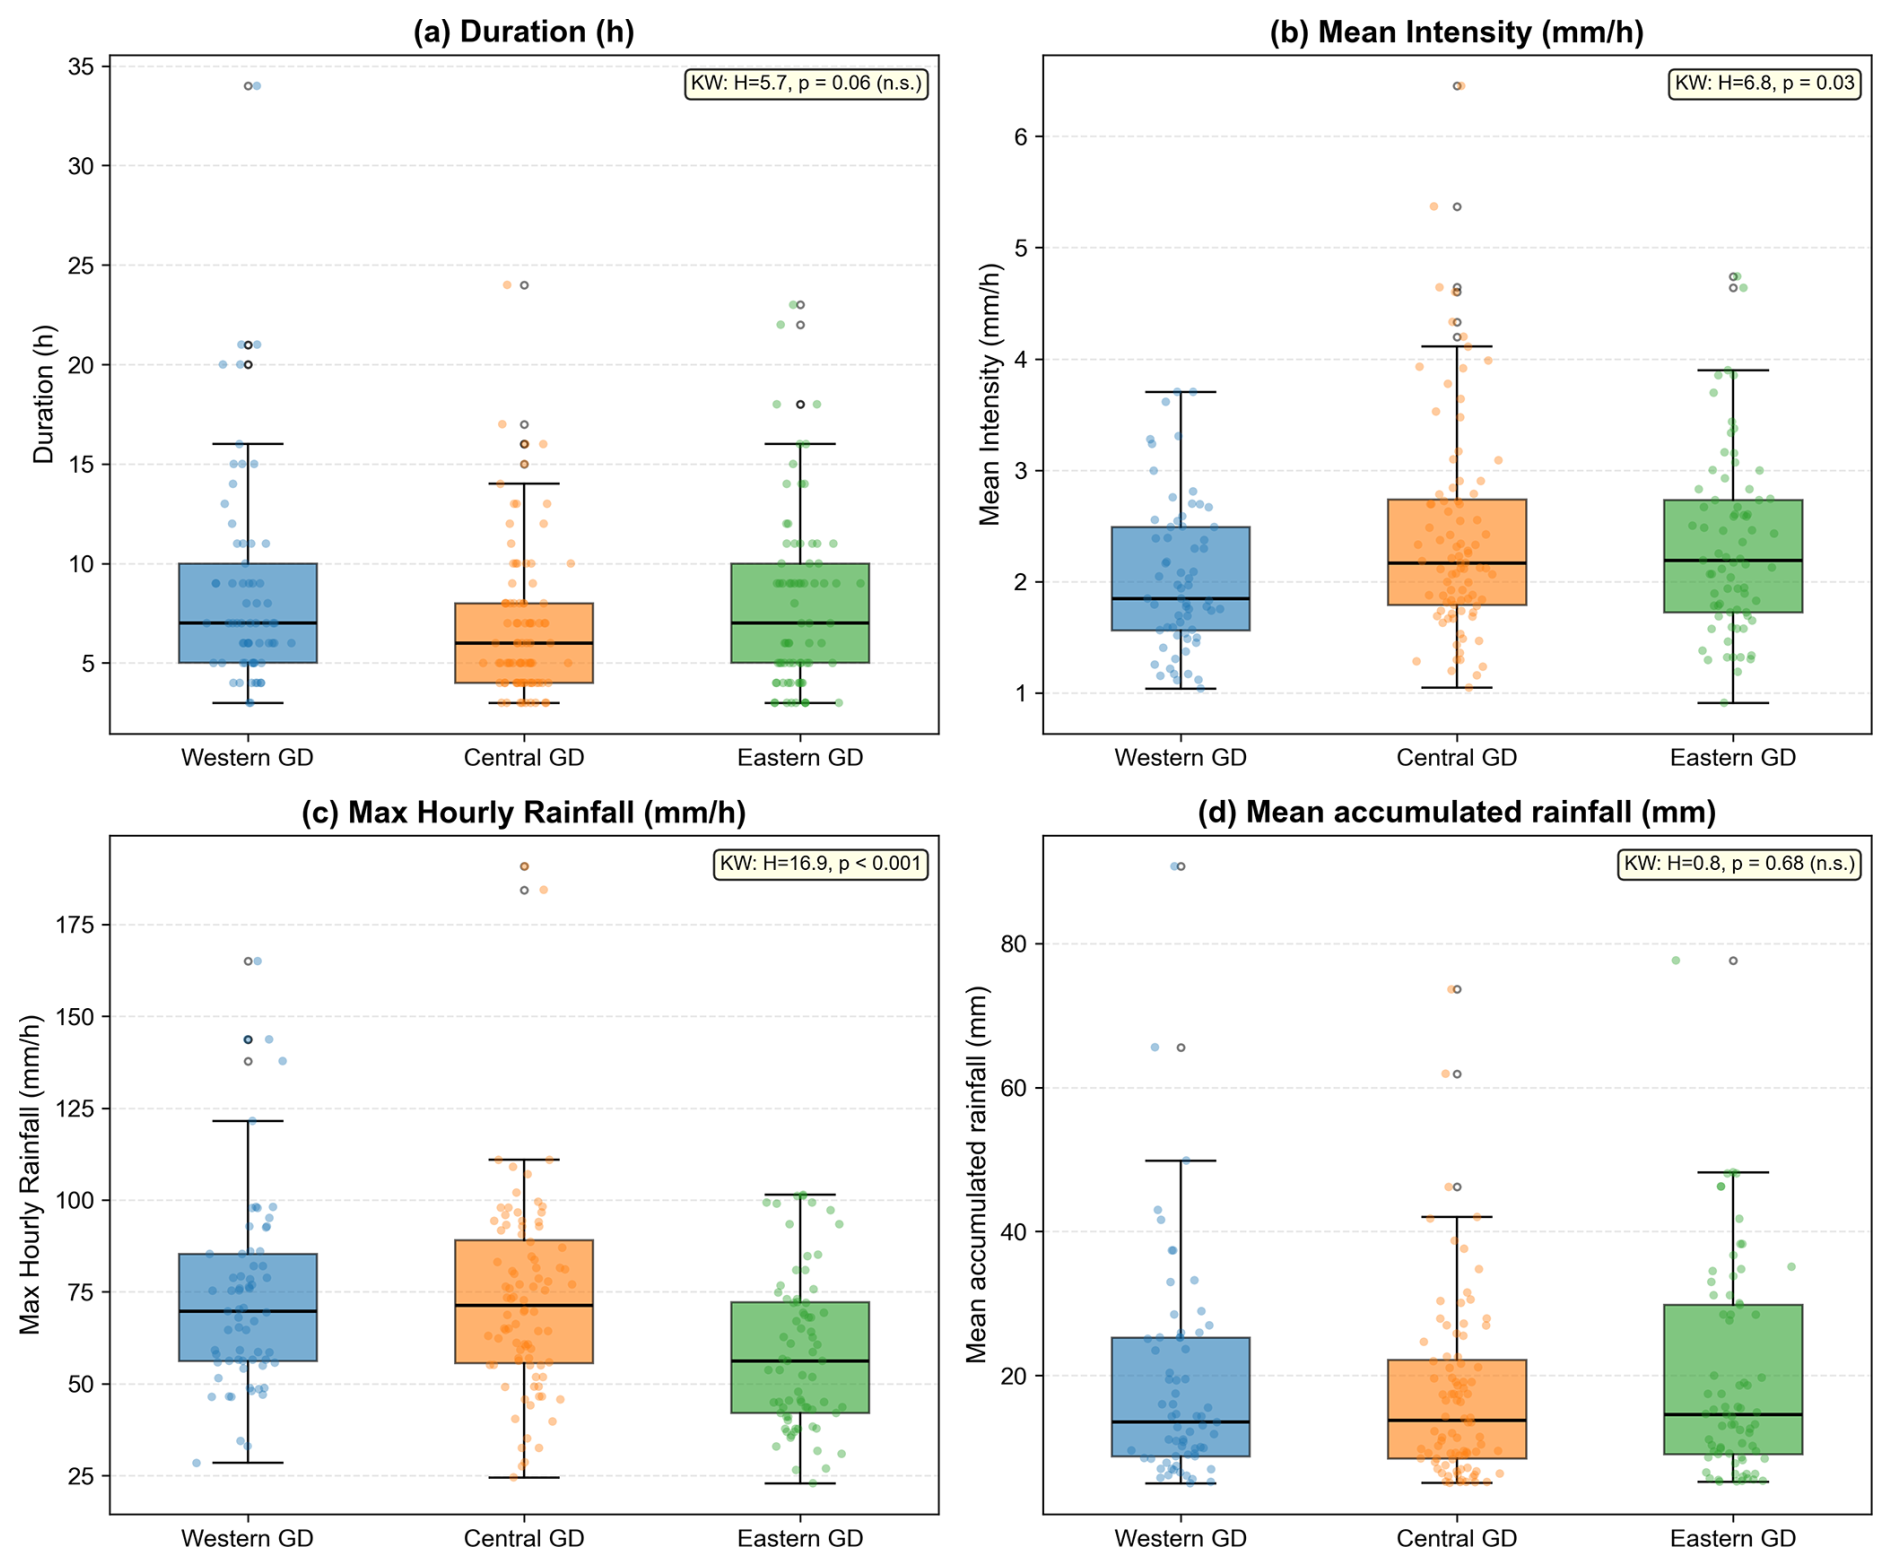
Figure 3Statistical distributions of WSHR characteristics across three sub-regions: (a) event duration, (b) mean rainfall intensity, (c) maximum hourly rainfall, and (d) mean accumulated rainfall. The boxes show the median and interquartile range (IQR); whiskers extend to 1.5 × IQR. The Kruskal–Wallis H statistic and the p-value are annotated in each panel.
Harmonic analysis of diurnal variations revealed distinctly different onset times across the three regions (Fig. 4a). All three regions exhibited a bimodal structure in their peak occurrence times, primarily in the early morning and afternoon, consistent with the diurnal variation characteristics of WSHR. Western GD exhibited a bimodal distribution: a secondary peak occurred near 03:00–05:00 BJT, while the main peak was at 12:00–15:00 BJT, possibly stemming from the superposition of nighttime land breeze convergence and afternoon solar heating enhanced by coastal topography. In central GD, events were more concentrated in the afternoon (12:00–18:00 BJT, UTC+8), consistent with afternoon thermal forcing amplified by the urban heat island effect. Eastern GD showed a more pronounced morning peak (06:00–09:00 BJT), with nighttime acceleration and morning deceleration of the boundary layer jet likely triggering factors.
However, the combined S1 + S2 harmonics only explained 18 %–25 % of the total variance in onset times across the three regions. Weather-scale variability remains the dominant factor controlling when individual events trigger. This limitation is more evident in precipitation intensity analysis (Fig. 4b): although the diurnal variation of intensity in western and eastern GD is roughly consistent with its onset time, central GD shows an almost flat intensity cycle (S1 + S2), indicating that the precipitation intensity over urban agglomerations is jointly influenced by synoptic-scale water vapor supply, mesoscale convergence and local boundary layer processes, rather than being controlled solely by diurnal thermodynamic cycles.
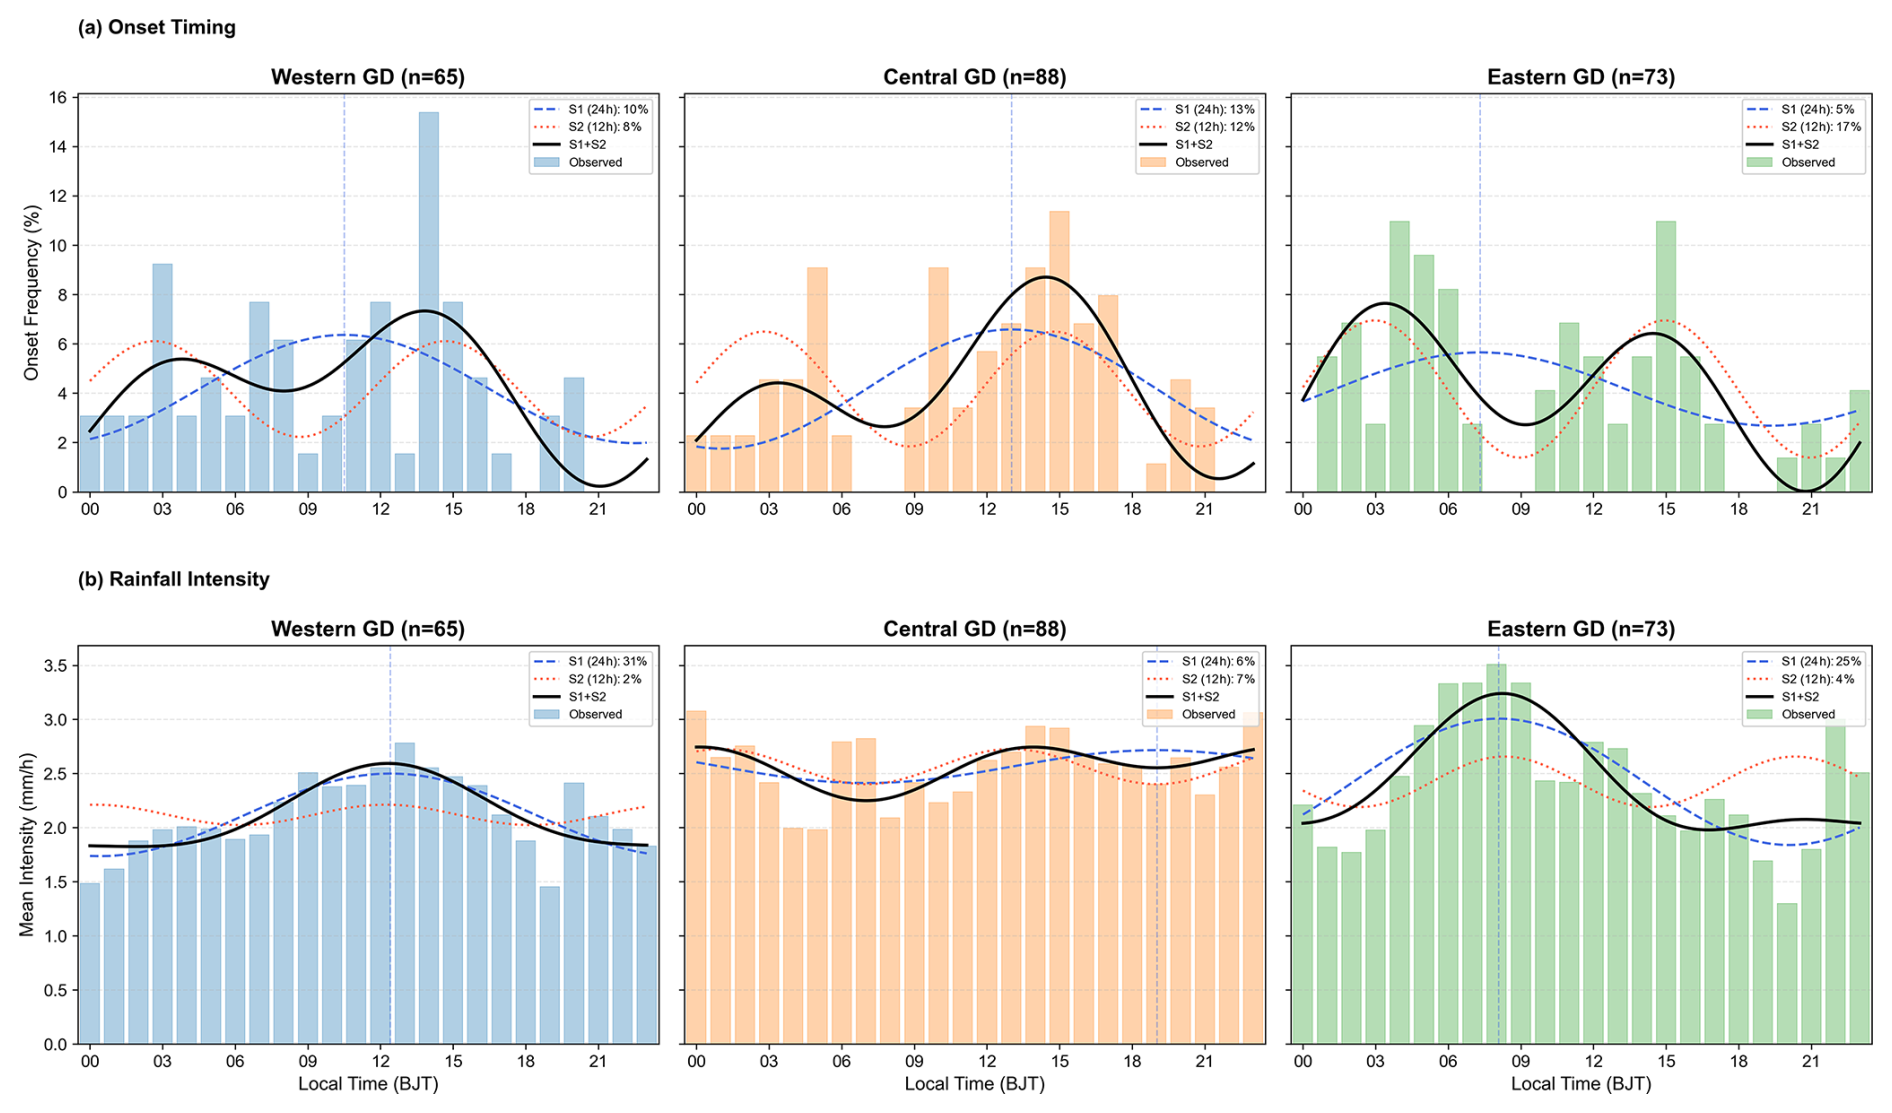
Figure 4Diurnal variations of (a) WSHR onset frequency and (b) mean rainfall intensity for the western (blue), central (orange), and eastern (green) regions. The dashed and dotted curves show the first (S1, 24 h) and second (S2, 12 h) diurnal harmonics; solid black curves show S1 + S2. Percentages indicate explained variance.
Composite synoptic fields (Fig. 5) reveal the large-scale environment at the time of the WSHR events in the three regions. The most significant differences occur at 925 hPa (Fig. 5g–i). The western GD composite shows lower wind speeds over Guangdong and the low-level jet confined to nearshore waters, barely penetrating inland. In central and eastern GD, in contrast, LLJs greater than 8 m s−1 extend from the South China Sea deep into the inland waters of GD, reaching the PRD in central GD and traversing the entire Chaoshan coastline in the eastern composite. The pattern in central GD is consistent with the coupling between BLJs and SLLJs recorded by Du and Chen (2018) and Du et al. (2020a). At 850 hPa (Fig. 5d–f), this contrast persists: a well-defined LLJ extends from the northern South China Sea deep into Guangdong for the central and eastern composites, whereas the western composite shows a considerably weaker jet signal limited to coastal waters. At 500 hPa (Fig. 5a–c), the subtropical high ridge axis lies south of 20° N for all three regions. The western composite shows the ridge axis positioned slightly further north and east compared to the central and eastern composites, placing western GD marginally closer to the northern flank of the anticyclone. In the central and eastern composites, Guangdong lies more squarely under the south–southwestern periphery of the high, with the associated southwest to south flow providing a more direct pathway for moisture transport into the region.
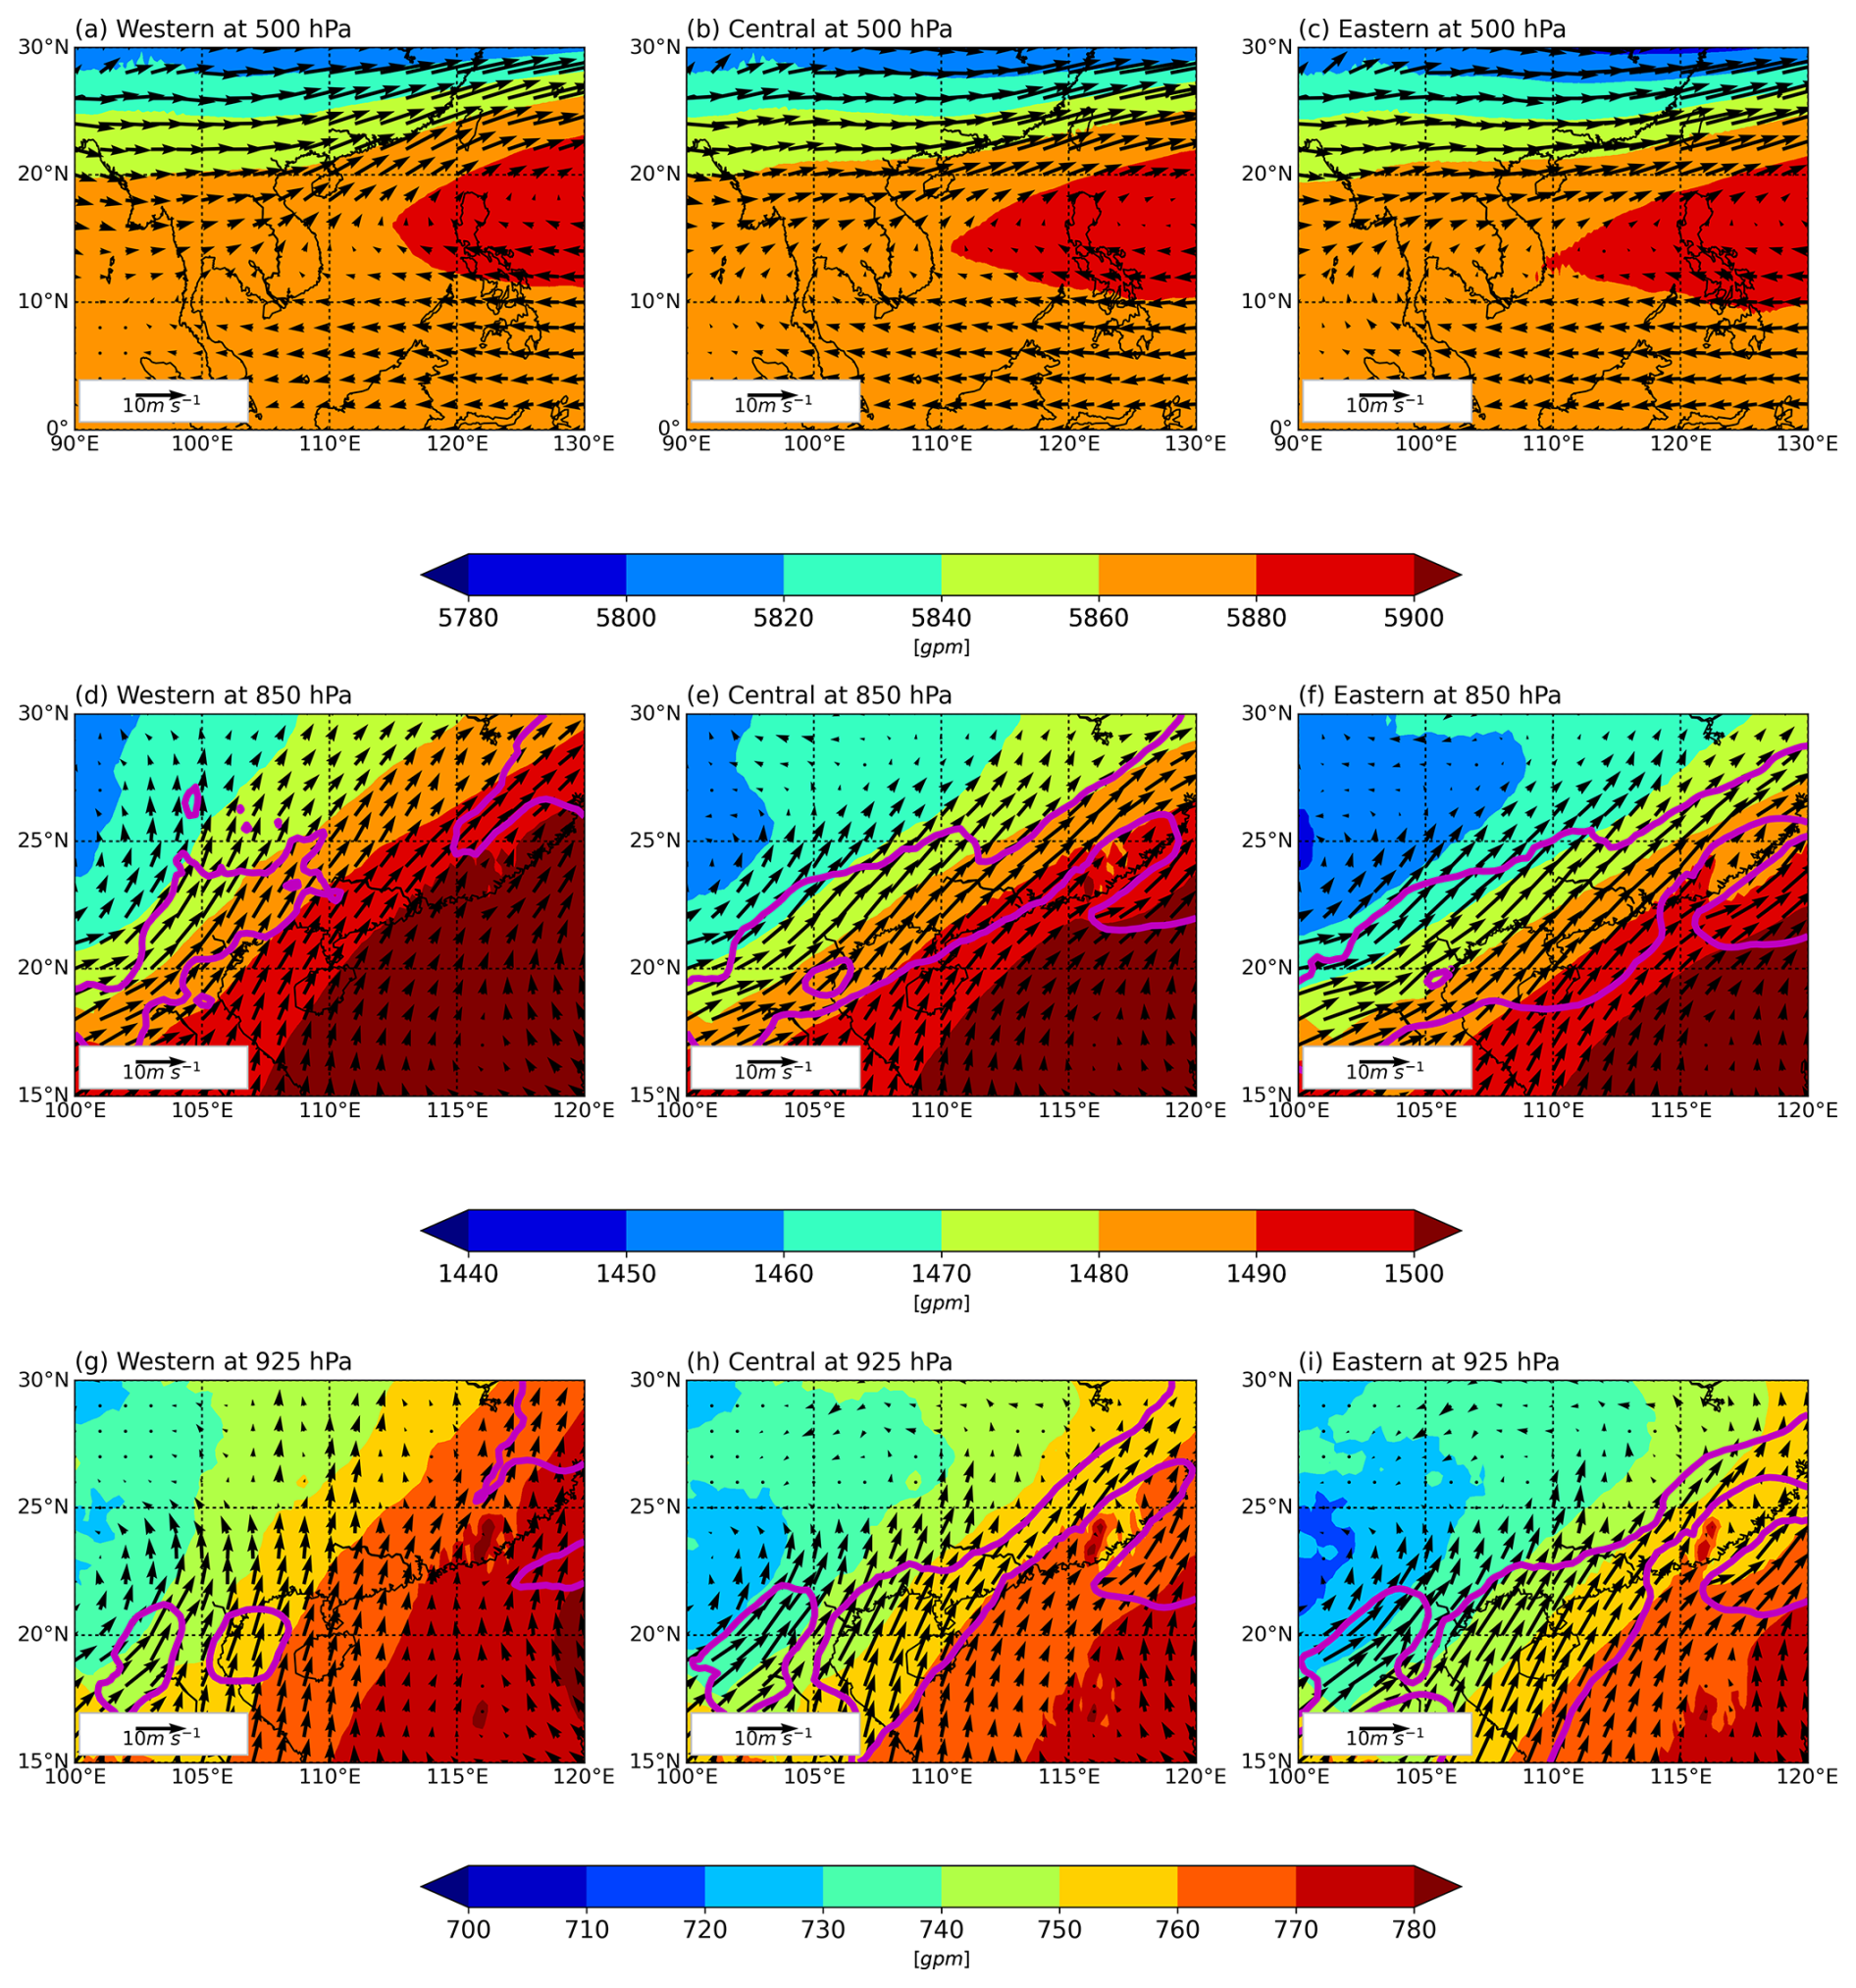
Figure 5Composite mean geopotential heights and wind field at 500 hPa (a–c), 850 hPa (d–f) and 925 hPa (g–i) over WSHR events in Western (a, d, g), Central (b, e, h) and Eastern (c, f, i) GD. Geopotential heights in gpm, wind vectors (black arrows) in m s−1 with wind speed greater than 8 m s−1 marked in magenta contours.
In summary, the composite analysis indicates that the three sub-regions are associated with different large-scale environments, dominant onset times, and precipitation intensity distributions. Events in western GD are characterized by the strongest peak hourly precipitation, but large-scale jet forcing is relatively weak, and low-level airflow is mainly confined to the nearshore area. Events in central GD are the most frequent, tending to peak in the afternoon, and occur under conditions of a dual low-level jet structure over the PRD. Events in eastern GD are most common in the early morning, and are associated with the most extensive low-level jet penetrating into the coastal zone. These contrasting characteristics observed in the pre-precipitation weather environment and diurnal variation behaviour prompt a more detailed examination of the local wind field evolution in the hours leading up to the onset of WSHR, which is the focus of Sect. 4.
Section 3 characterized the synoptic-scale environments in which the three types of WSHR events are embedded. This section shifts focus to the local lower-tropospheric wind field, as observed by WPR in the hours surrounding precipitation onset. All events are aligned so that the onset time is t=0; composite statistics are computed for the window h to h. For each event, the profiler station nearest to the rainfall-weighted centroid (Sect. 2) serves as the representative station. Vertical velocity measurements were pre-processed following the quality control procedure described in Sect. 2.
4.1 Wind field evolution in the hours before onset
Figure 6 presents composite time–height cross-sections of horizontal wind and vertical velocity anomalies for the three regions. The vertical velocity anomaly is defined as the departure from the median over to −4 h at each height level, thus removing the instrument-related background and highlighting the changes associated with approaching convection. Two features are shared in all three regions: (i) a progressive strengthening of low-level winds in the hours before onset, and (ii) a transition from near-zero to positive vertical velocity anomaly beginning 1 to 3 h before onset.
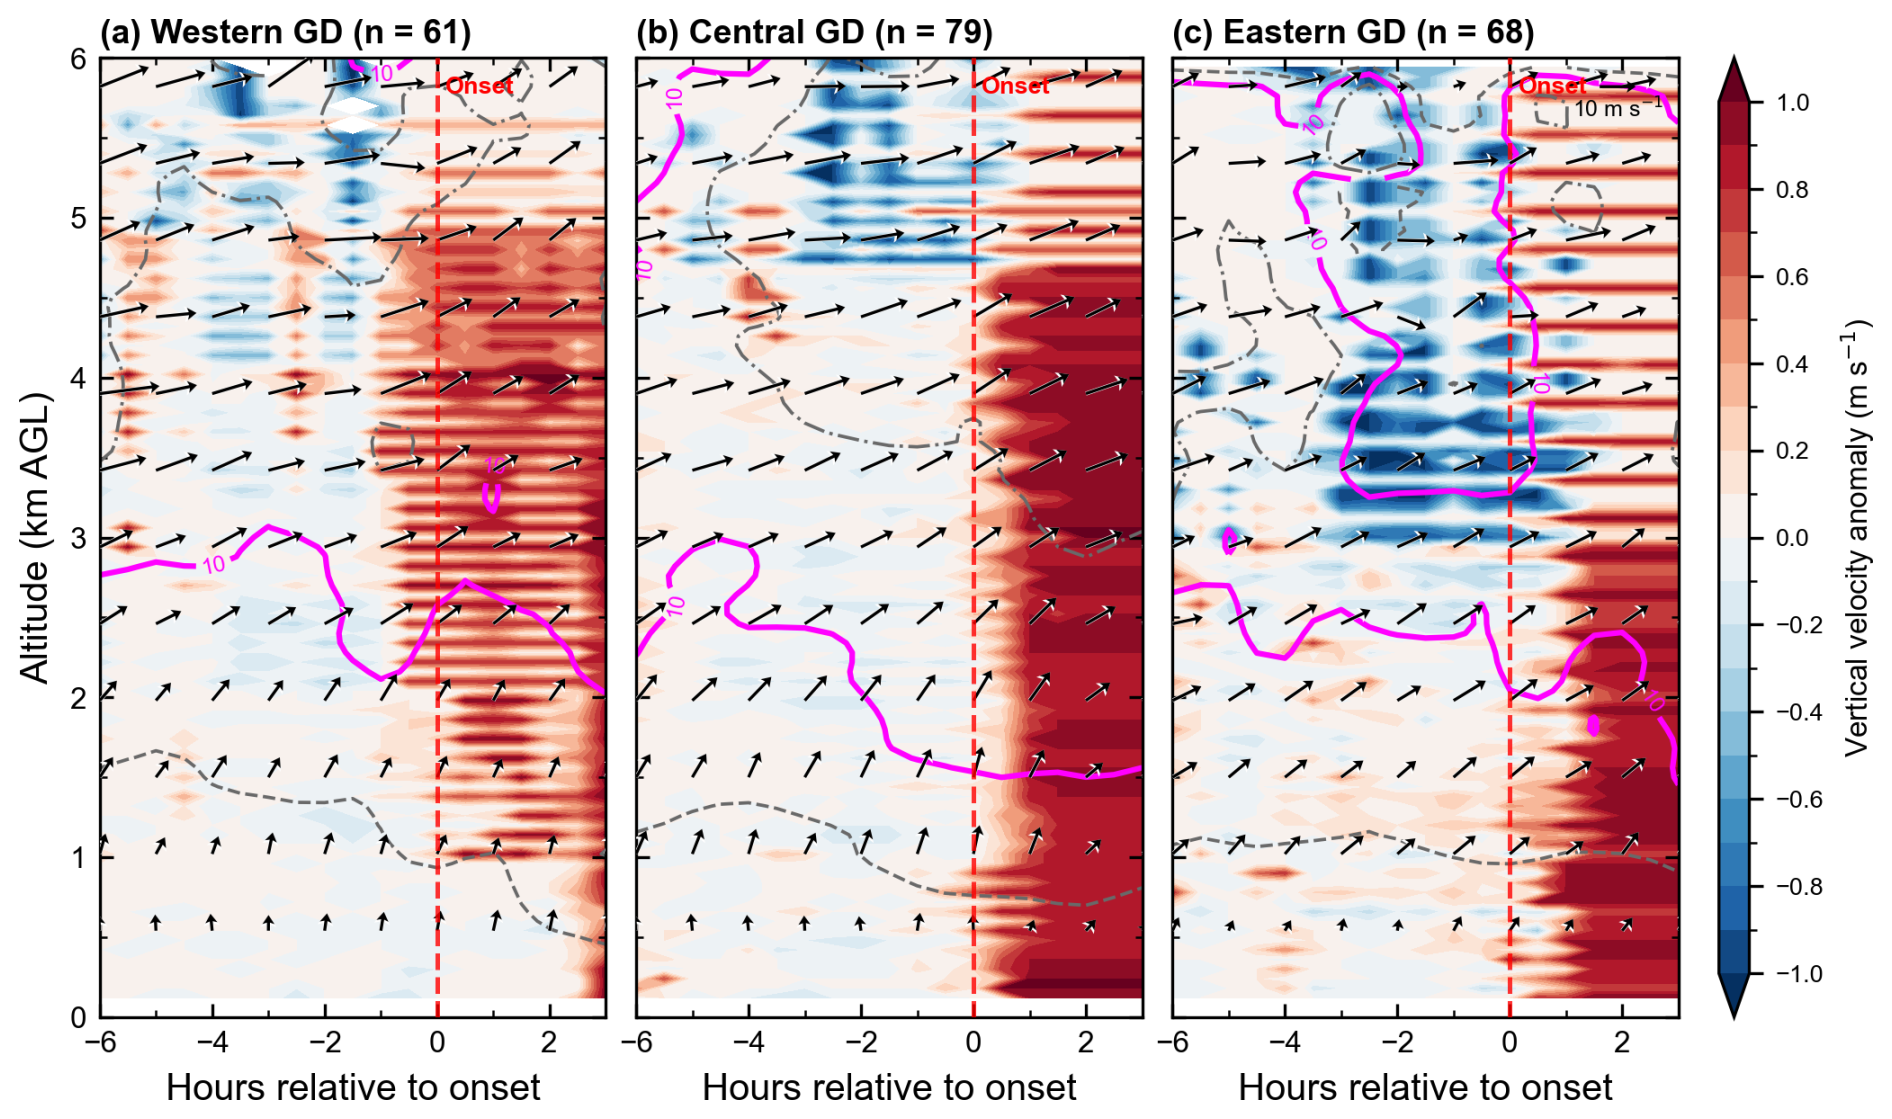
Figure 6Composite time–height cross-sections of horizontal wind and vertical velocity anomalies for (a) western GD (n =61), (b) central GD (n=79), and (c) eastern GD (n=68) WSHR events. Arrows show composite wind vectors (reference: 10 m s−1); shading shows the median vertical velocity anomaly relative to the to −4 h baseline (m s−1; red for ascent, blue for descent); magenta contours mark 10 m s−1 wind speed. The gray contours with dashed and solid lines indicate 8 and 12 m s−1, respectively. The red dashed line indicates onset (t=0).
In western GD (Fig. 6a), southerly winds prevailed below 2 km before precipitation, shifting clockwise to westerly winds above 3 km, consistent with low-level warm advection. Several hours before precipitation, wind speeds gradually increased at the 2–4 km level, with significant fluctuations in the 10 m s−1 contour around h. In central GD (Fig. 6b), the low-level jet began to descend around h, with winds exceeding 12 m s−1 appearing above 3.5 km several hours before precipitation. After the onset of precipitation, the vertical ascent signal was the strongest among the three regions, with positive anomalies rapidly expanding upward. In eastern GD (Fig. 6c), the wind field is more vertically uniform: south-southwest winds extend from the surface to above 3 km with modest directional shear. The low-level jet persists steadily near 2–3 km throughout the pre-onset period. A notable feature is the negative vertical velocity anomaly at 3–5 km during to 0 h, indicating a mesoscale suppression of ascent in the middle troposphere prior to onset, followed by a positive anomaly that develops below 3 km and intensifies through onset.
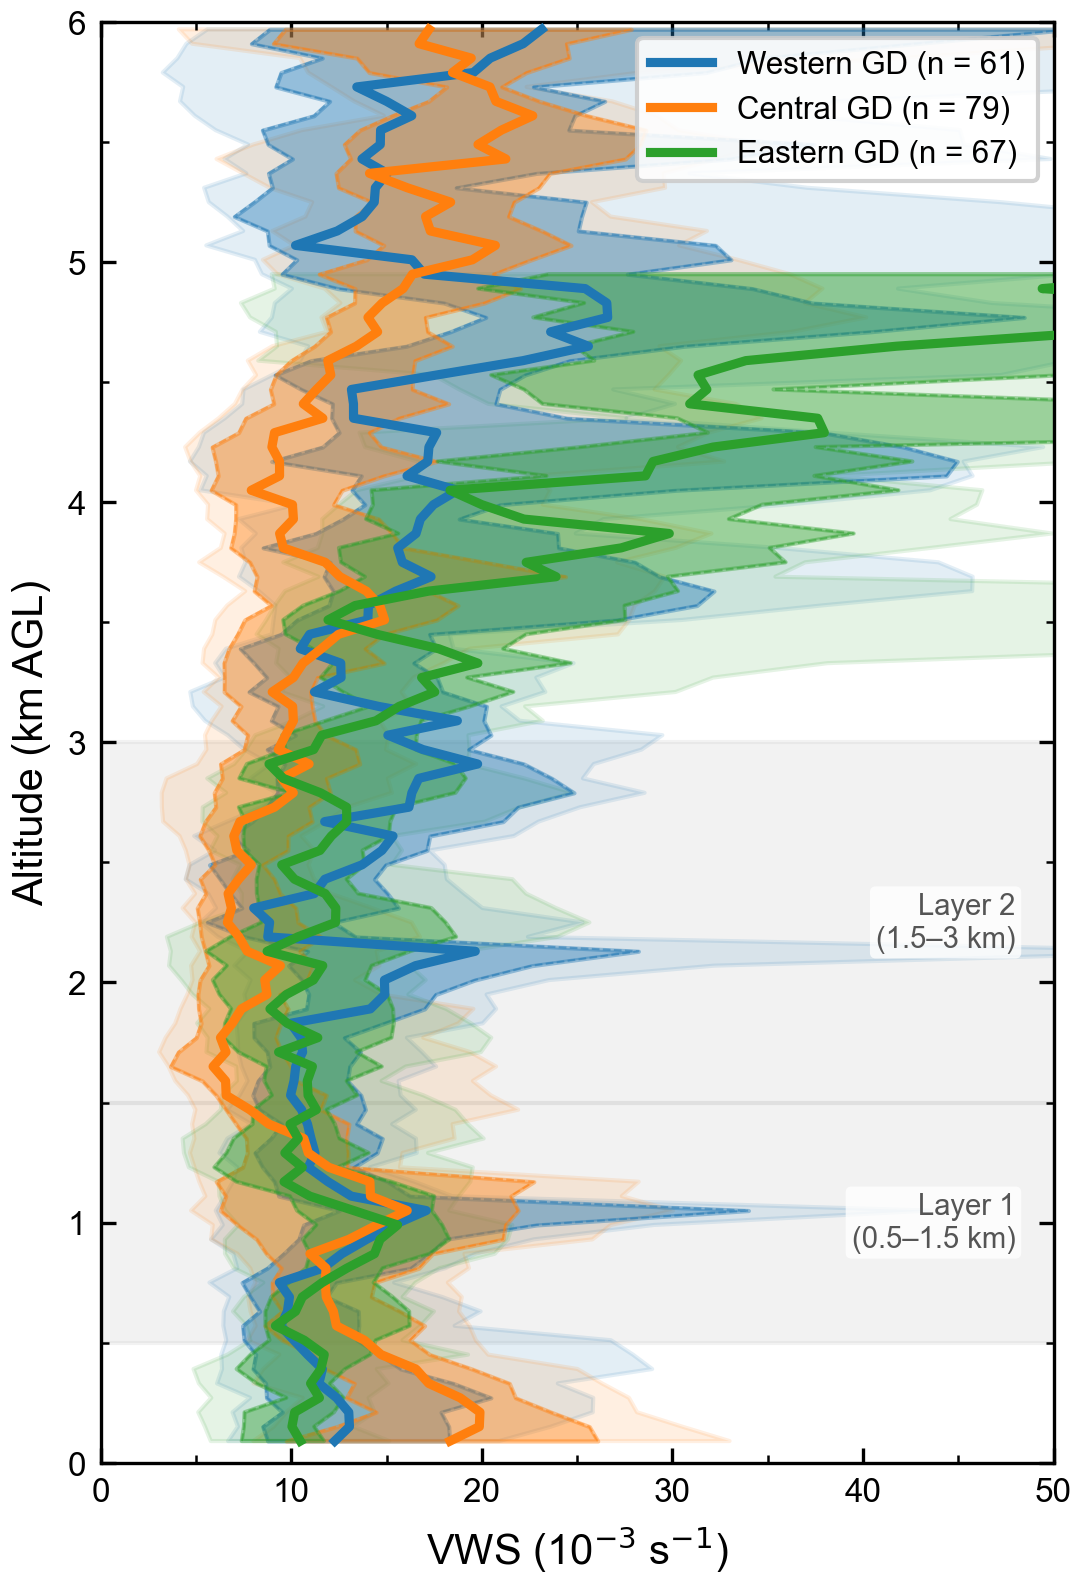
Figure 7Composite VWS profiles averaged over to 0 h for the western GD (blue, n= 61), central GD (orange, n=79), and eastern GD (green, n=67) regions. Lines show medians; dark and light shading show the 25–75 percentile range and 10th–90th percentile ranges. The gray bands mark the two layers used in Sect. 4.2: 0.5–1.5 km (Layer 1) and 1.5–3.0 km (Layer 2).
The composite VWS profiles (Fig. 7) quantify the vertical shear structures in the pre-onset period. VWS is computed between adjacent 60 m range gates and averaged over to 0 h; this window is chosen because it encompasses the period of most active pre-onset wind field evolution identified in Fig. 6.
Three local VWS maxima are identified below 3 km in all regions. The first maximum occurs below 0.5 km and is more pronounced in the central GD (median ∼ 20 × 10−3 s−1), reflecting the strong near-surface wind gradient over the PRD surface. The second maximum lies in the 0.5 to 1.5 km layer and is present in all three regions, corresponding to the wind speed gradient between the surface layer and the jet core. The third maximum, in the 1.5 to 3.0 km layer, is strongest in eastern GD.
These three maxima motivate the choice of analysis layers for Sect. 4.2: 0.5–1.5 km (Layer 1, capturing BLJ-related shear) and 1.5–3.0 km (Layer 2, capturing the BLJ–free-troposphere transition). The lower bound of 0.5 km is adopted because profiler measurements in the lowest few hundred meters are subject to ground clutter and large frictional variability (Liu et al., 2020). The upper bound of 1.5 km encompasses the jet core, which typically resides near 1 km over coastal South China (Du and Chen, 2018).
In summary, the composite analysis reveals coherent pre-onset signals across all three regions–progressive low-level wind intensification, a transition from suppressed to enhanced ascent, and distinct vertical shear layering–but with regional differences in timing, vertical structure, and magnitude. To quantify these signals systematically, Sect. 4.2 examines the temporal evolution of five precursor indices.
4.2 Temporal evolution of precursor indices
To quantify the pre-onset signals identified in Sect. 4.1, composites of precursor indices are constructed for each region (Fig. 8). Five quantities are examined: LLJI, VWS at 0.5 to 1.5 km and 1.5 to 3.0 km, ALI, and BLH. All indices are computed at 30 min resolution and aligned by onset time. In each panel, the solid line shows the composite median, and the dark shading indicates bootstrap 95 % confidence interval of the median (2000 resamples), and the light shading shows the interquartile range.
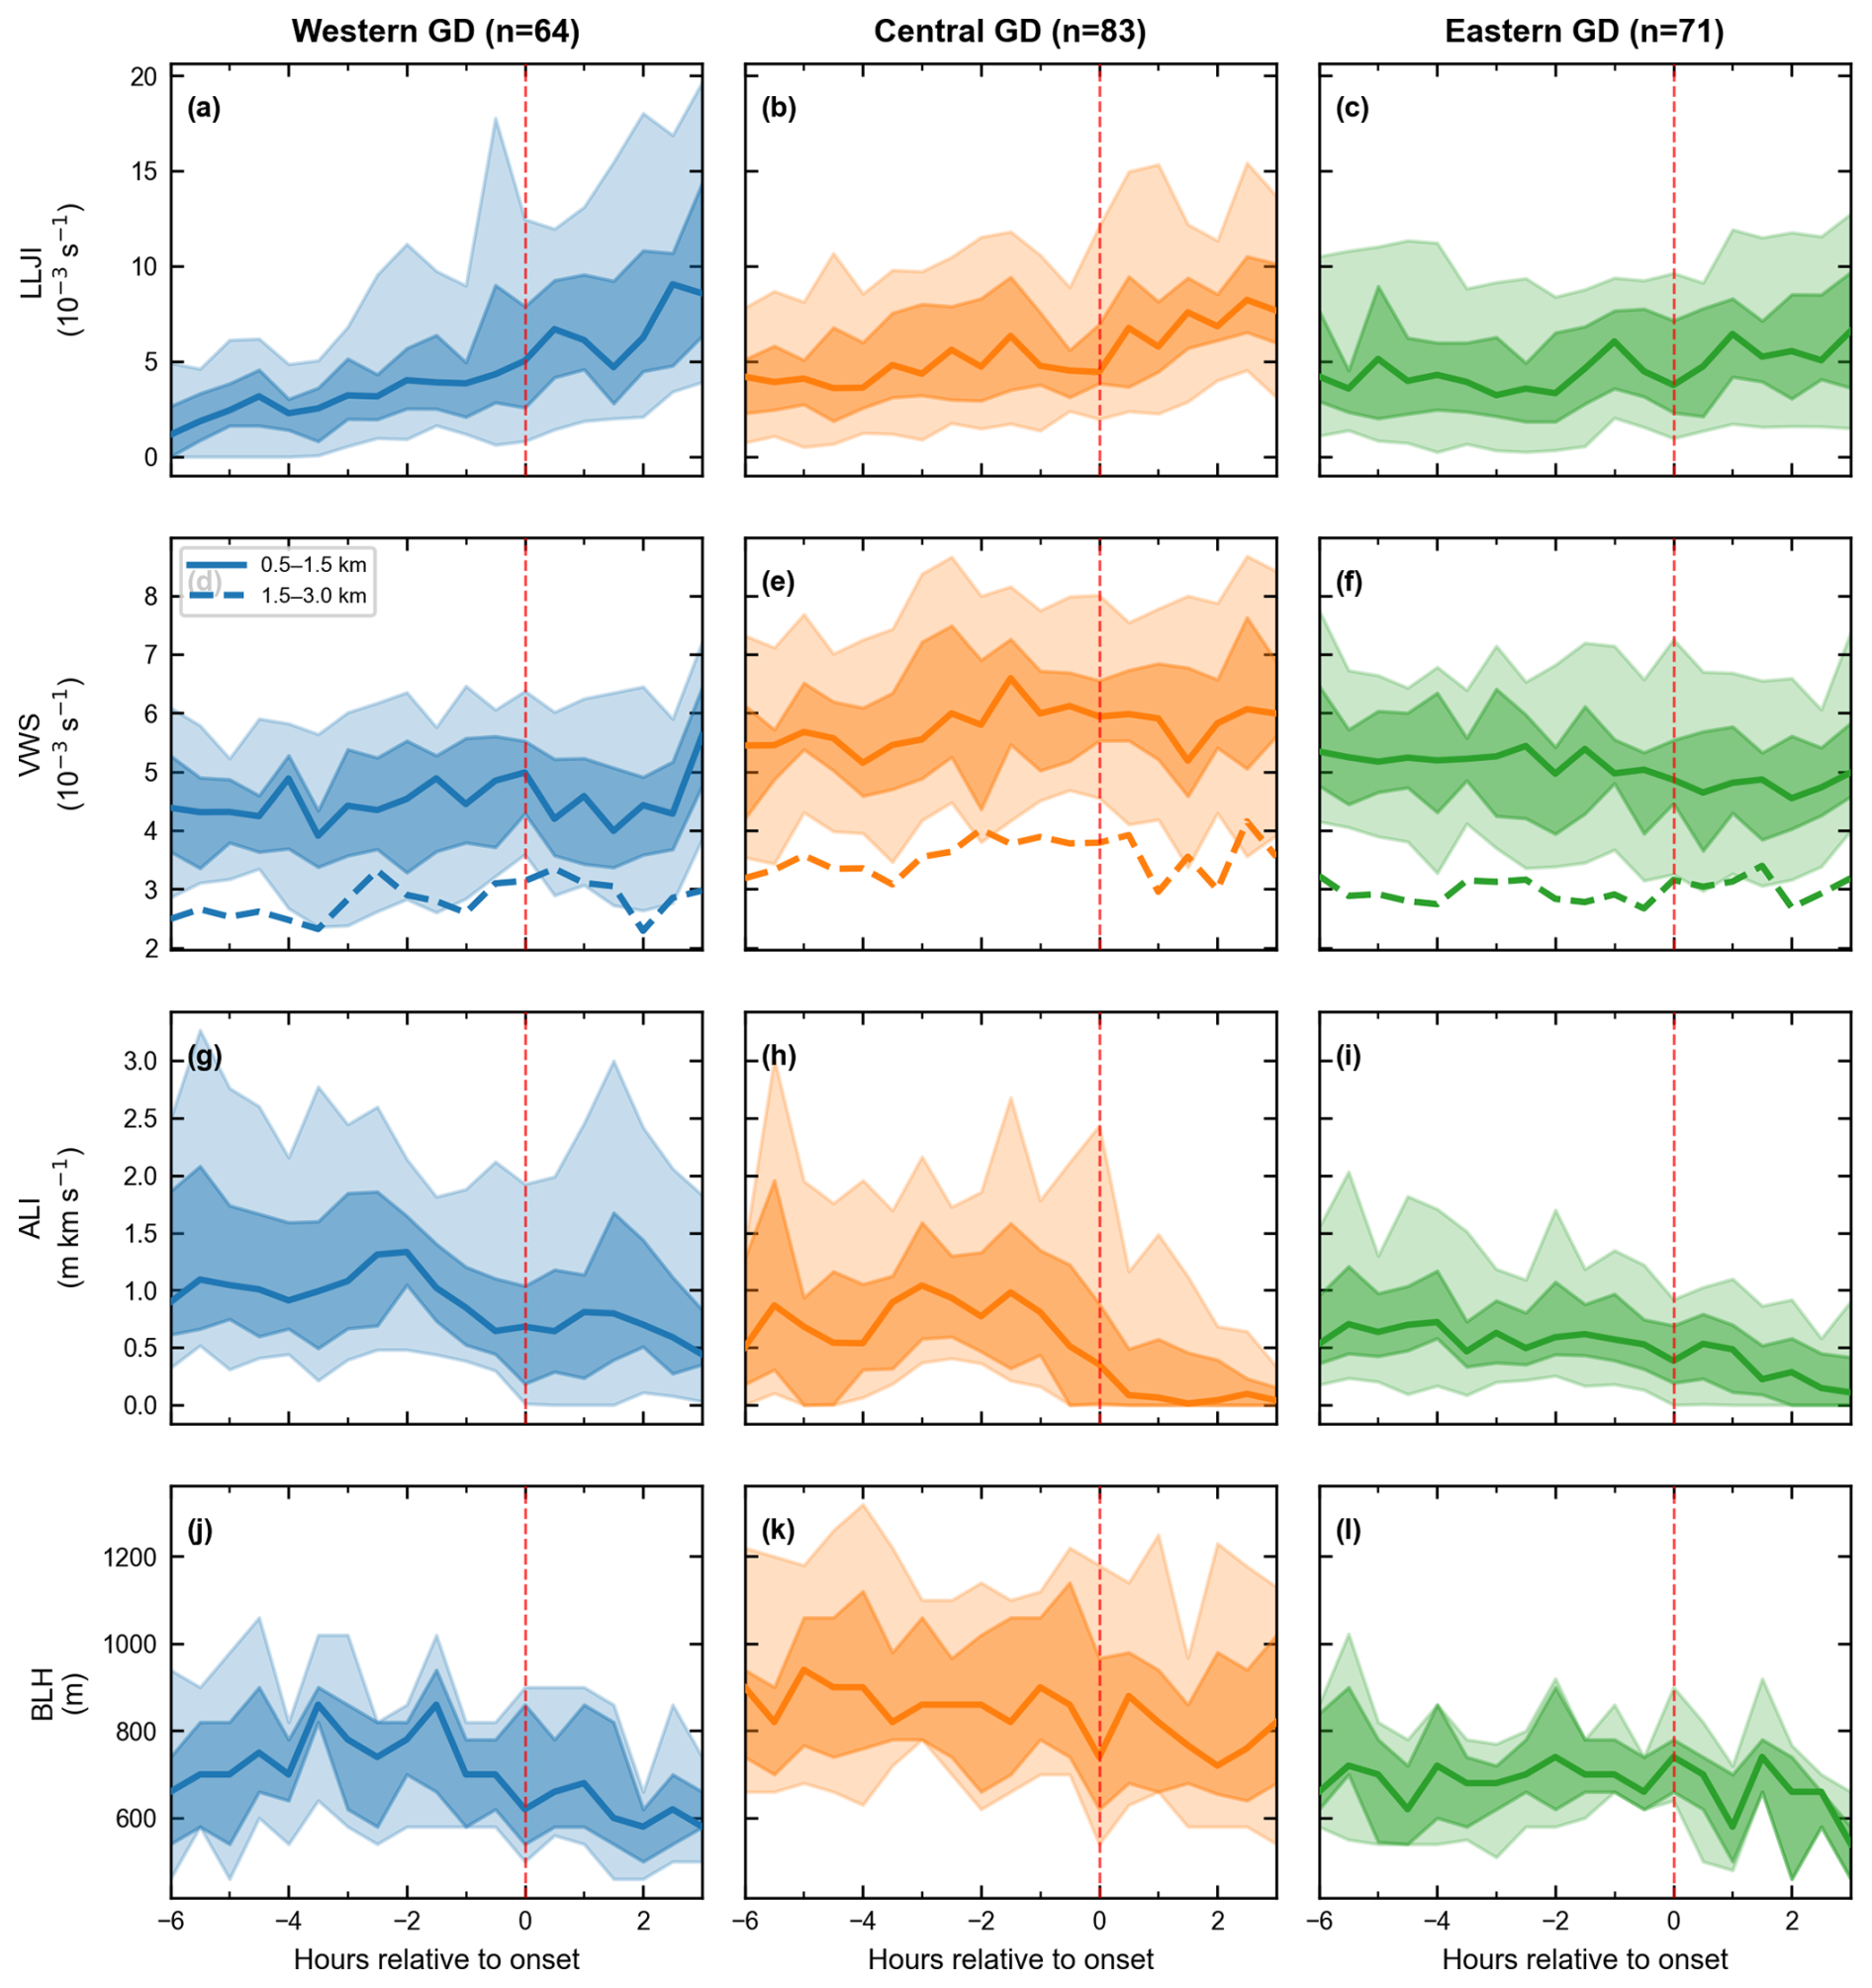
Figure 8Composite temporal evolution of precursor indices for WSHR events over (a, d, g, j) western GD (n=64), (b, e, h, k) central GD (n =83), and (c, f, i, l) eastern GD (n=71): (a–c) LLJI, (d–f) VWS at 0.5–1.5 km (solid) and 1.5–3.0 km (dashed), (g–i) ALI, and (j–l) BLH. Lines show medians; dark shading shows the bootstrap 95 % CI of the median; light shading shows the interquartile range. The red dashed line marks onset (t=0).
The LLJI over three regions in GD increases with development of WSHR events (Fig. 8a–c), the LLJI in western GD increasing the sharpest among three regions (median value approximately 1.0 × 10⁻² s−1). The VWS (solid line in Fig. 8d–f) at 0.5–1.5 km exceeded the values at 1.5–3.0 km (dashed line) in all regions and at all times, reflecting the strong wind speed gradient between the surface layer and the jet core. The highest VWS was recorded in central GD (median value approximately 5.5–6.0 × 10⁻³ s−1). Neither layer showed systematic variation in the 1–2 h preceding precipitation. The ALI (Fig. 8g–i) was intermittent, with intermittent pulses but no sustained accumulation in western and central GD; it remained low and flat in eastern GD. BLH (Fig. 8j–l) showed a weak pattern of initial rise followed by decline in all regions–most pronounced in central GD. For example, in central GD, the median value reached approximately 800–850 m near h, then dropped to approximately 700 m at the onset of precipitation. However, the bootstrap confidence interval was wide, and the signal was indistinguishable from the sampling variability at the 95 % level. A notable feature of Fig. 8 is the large IQR relative to the temporal changes of the medians, reflecting the diversity of synoptic settings, onset times, and rainfall intensities among WSHR events. Stratified analyses addressing this heterogeneity are presented in Sect. 4.4. Whether pre-onset index values are associated with subsequent rainfall intensity is examined in Sect. 4.3.
4.3 Association between precursor indices and rainfall intensity
To assess whether the pre-precipitation index value is related to the subsequent precipitation intensity, Spearman rank correlations are computed between each index and the maximum event-accumulated rainfall, defined as the highest event-total precipitation recorded across all AWS within the sub-region during the event period. The pre-onset window is divided into four periods: to −4 h, to −2 h, to −1 h, and to 0 h. For each event, the index value is averaged over each period, and the correlation with rainfall intensity is calculated for all events in a given region. This period-averaging approach reduces the number of independent tests relative to a point-by-point sliding-window analysis, while providing a more robust estimate of the index value at each lead time. Significance is assessed at 95 % level (p < 0.05).
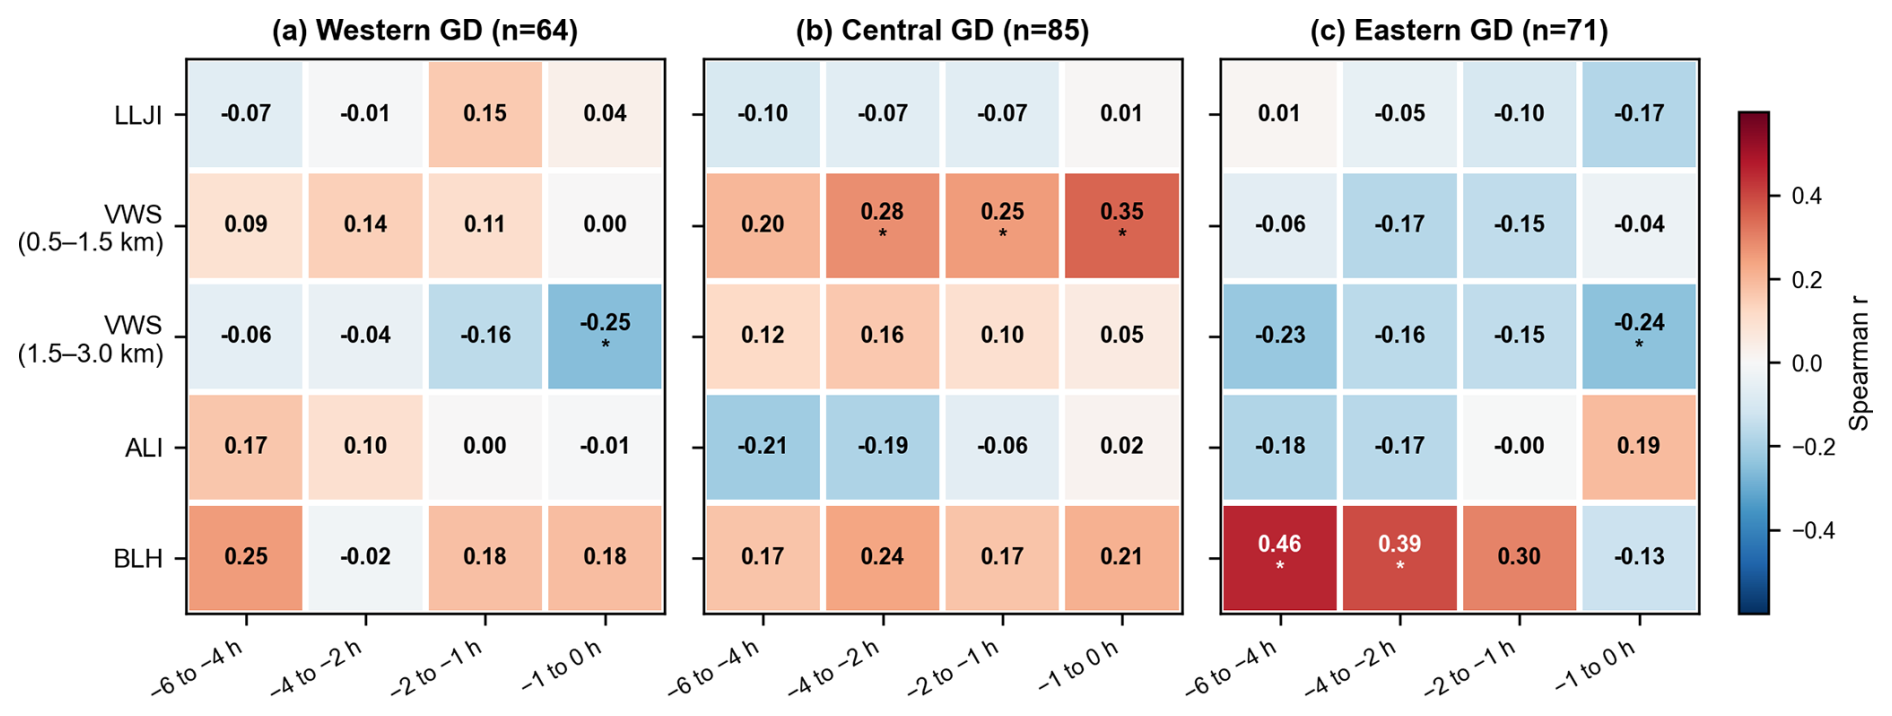
Figure 9Spearman rank correlations between pre-onset index values (averaged over time) and maximum accumulated rainfall for (a) western GD (n=64), (b) central GD (n =85), and (c) eastern GD (n=71). Correlations are computed over four pre-onset periods. The color shading indicates the correlation coefficient (red: positive; blue: negative). Asterisks denote significance at 95 % level (p < 0.05).
The results are summarized in Fig. 9. In central GD (Fig. 9b), VWS at 0.5 to 1.5 km is significantly correlated with rainfall intensity in three consecutive periods (r =0.28 at to −2 h; r=0.25 at to −1 h; r=0.35 at to 0 h; all p < 0.05), the correlation strengthening toward onset. This sustained positive correlation indicates that stronger low-level shear over the PRD is associated with more intense rainfall.
In eastern GD (Fig. 9c), BLH shows the strongest association with rainfall intensity among all region–index combinations. The correlation is significant in the two earliest periods (r =0.46 at to −4 h; r=0.39 at to −2 h; both p < 0.05) but weakens closer to onset. Since eastern WSHR events predominantly occur in the early morning (Sect. 3), when the boundary layer is typically shallow, an anomalously high BLH before onset implies enhanced pre-onset thermodynamic preconditioning of the lower troposphere. The significant correlations at longer lead times suggest that BLH acts as an observational indicator of the pre-convective thermodynamic environment: stronger energy accumulation produces both a deeper boundary layer and, subsequently, more intense rainfall.
Across all three regions, LLJI is not significantly correlated with rainfall intensity during any period. This does not imply that the low-level jet is irrelevant to rainfall: the composite analysis in Sect. 4.2 shows that LLJI increases before onset in western GD, and stratified analysis in Sect. 4.4 confirms that the LLJI is significantly higher for strong-rainfall events. The absence of a linear Spearman correlation suggests that the relationship between LLJI and rainfall intensity may be nonlinear.
In summary, time-dependent correlation analysis identified two robust associations: the 0.5–1.5 km VWS in central GD and precipitation intensity, and the BLH in eastern GD. Both signals persisted over multiple consecutive time periods. While the LLJI is the clearest temporal precursor – showing a marked increase before onset (Sect. 4.2) – it does not serve as a linear intensity predictor, as it shows no significant rank correlation with rainfall amount. This distinction suggests that LLJI may play a nonlinear, threshold-type role in convective triggering rather than scaling proportionally with rainfall intensity. The physical explanation for these regional differences is discussed in Sect. 4.4.
4.4 Physical interpretation of regional differences
Section 4.2 and 4.3 have shown that the nature of the precursor signals differs in the three regions: LLJI is the clearest temporal precursor in western GD, VWS at 0.5–1.5 km is the strongest correlate of rainfall intensity in central GD, and BLH shows the strongest intensity association in eastern GD. This section investigates the physical processes underlying these regional contrasts through stratified composites, vertical structure analysis, and ERA5 diagnostics.
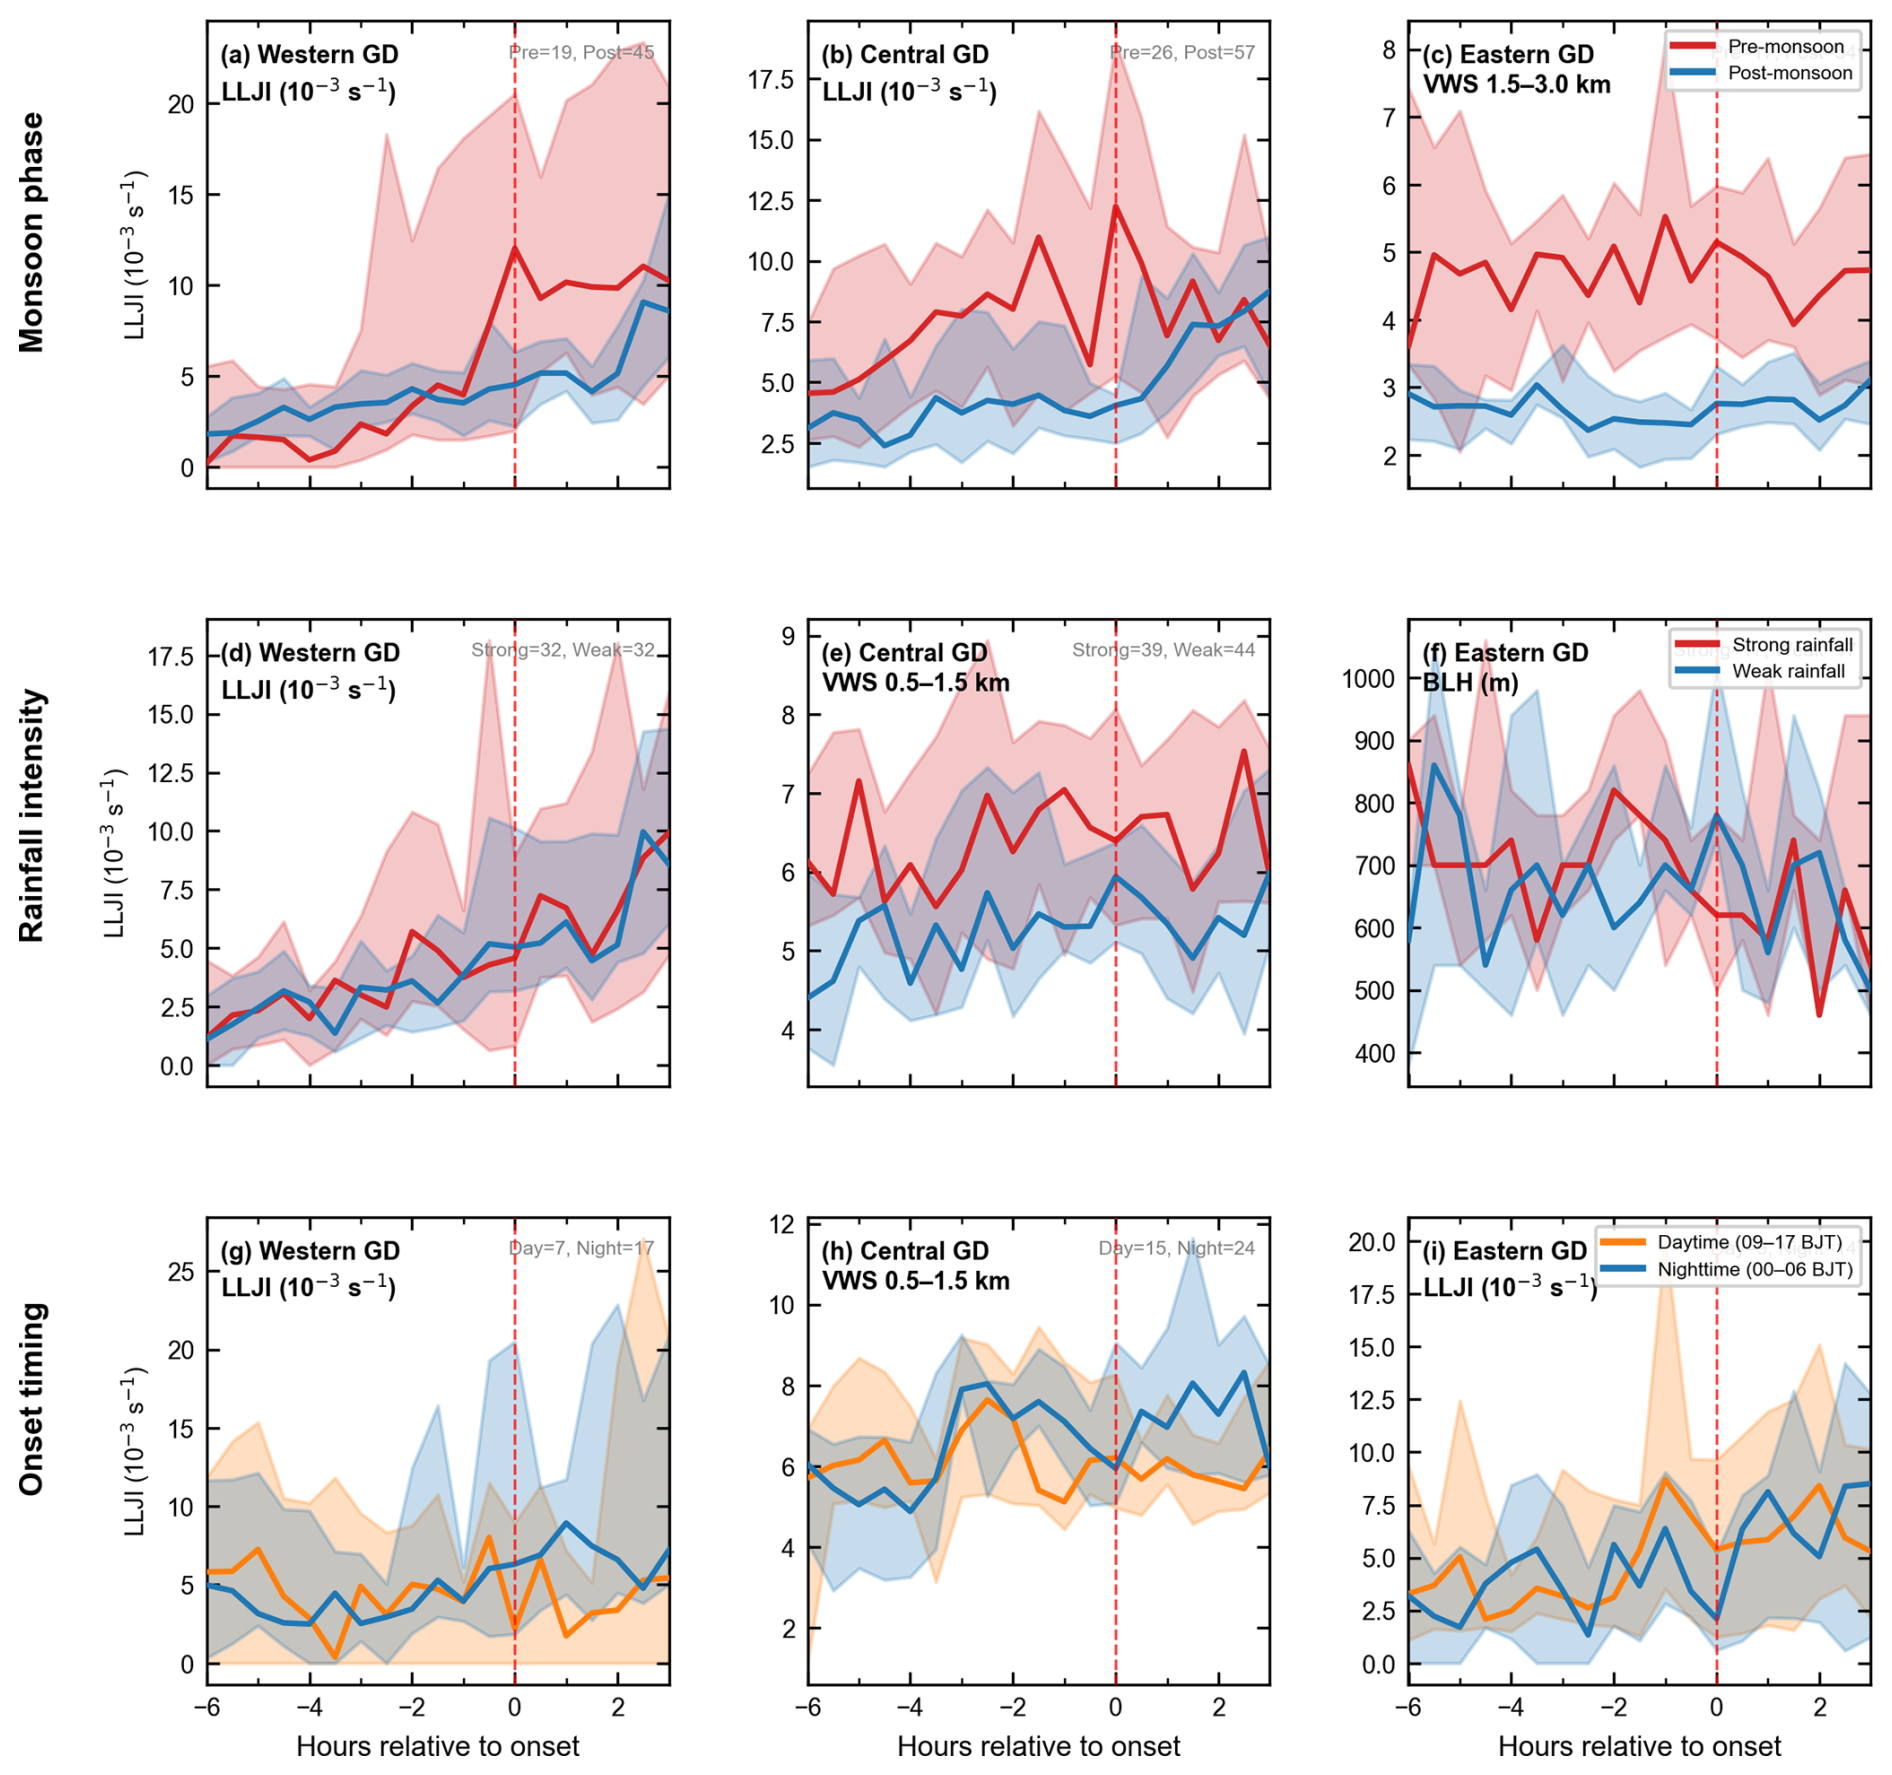
Figure 10Stratified composite time series of selected precursor indices for the most physically interpretable index–stratification combinations (complete results in Figs. S1–S3 in the Supplement). Row 1 (a–c): pre-monsoon (red) versus post-monsoon (blue) for LLJI in western and central GD and VWS at 1.5–3.0 km in eastern GD. Row 2 (d–f): strong-rainfall (red) versus weak-rainfall (blue) events for LLJI in western GD, VWS at 0.5–1.5 km in central GD, and BLH in eastern GD. Row 3 (g–i): daytime versus nighttime onset events, where daytime and nighttime are defined following the onset-hour distributions in Sect. 3, for LLJI in western GD, VWS at 0.5–1.5 km in central GD, and LLJI in eastern GD. Lines show medians; shading shows the bootstrap 95 % CI. Event counts for each group are annotated.
Stratified composites (Fig. 10) show the most significant differences in the selected index-stratified combinations; complete stratification results for all indices and the three stratification methods are shown in Figs. S1–S3 in the Supplement. Pre-monsoon events exhibit larger LLJI fluctuations before precipitation than post-monsoon events (Fig. 10a, b). The strongest contrasts emerge when stratified by precipitation intensity (Fig. 10d–f): strong precipitation events in western GD show higher LLJI starting 2 h before precipitation, strong events in central GD show persistently higher 0.5–1.5 km VWS throughout the entire pre-precipitation window, and strong events in eastern GD show higher BLH 2 h before precipitation. Stratification by onset time (Fig. 10g–i), where daytime and nighttime events are defined according to the onset time distribution identified in Sect. 3, indicates that nighttime events in central GD are accompanied by a significantly enhanced 0.5–1.5 km VWS approximately 2 h before precipitation. These patterns prompt a more in-depth examination of the vertical structure of the low-level jet and its relationship with precipitation intensity.
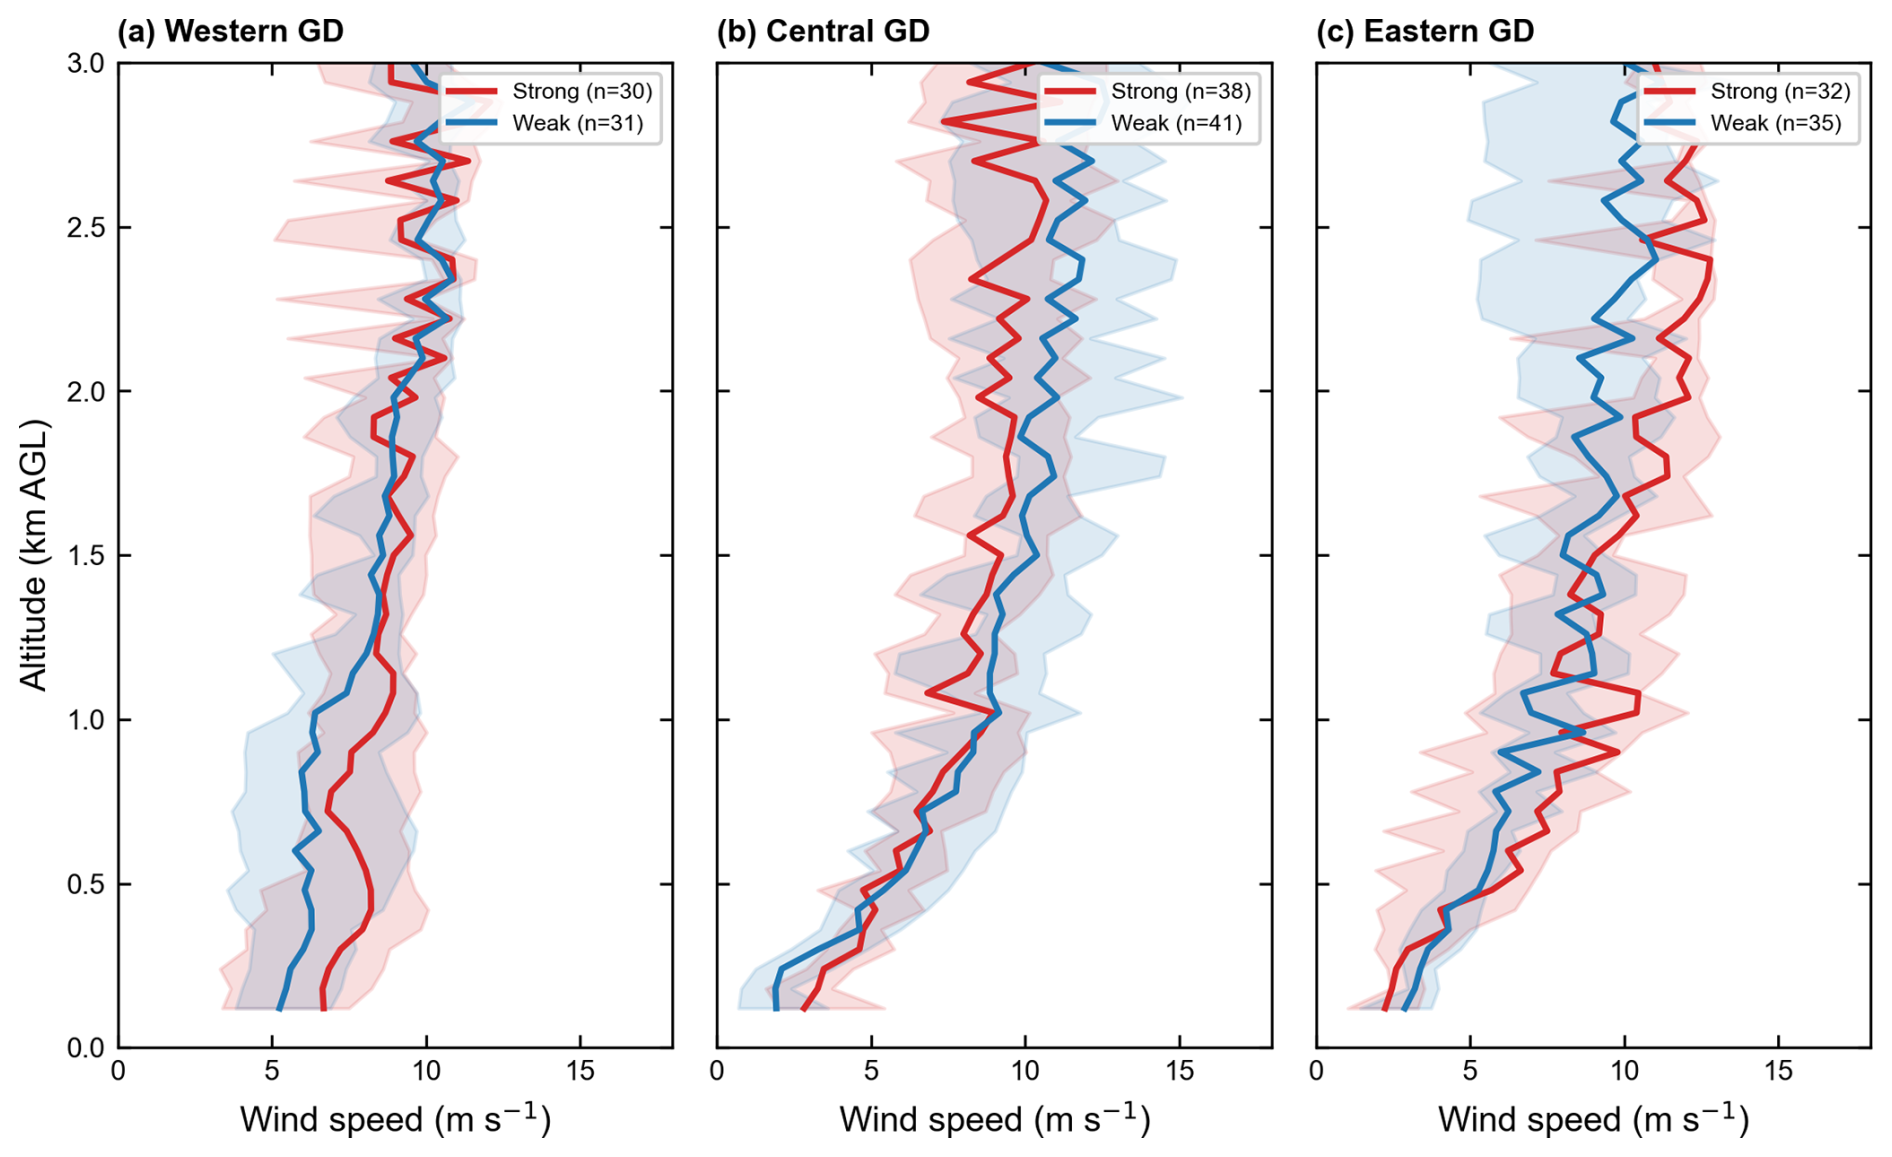
Figure 11Composite wind speed profiles averaged over to 0 h for strong-rainfall (red) and weak-rainfall (blue) events in (a) western GD, (b) central GD, and (c) eastern GD. Lines show medians; shading shows the interquartile range.
The composite wind speed profiles of strong and weak precipitation events (Fig. 11) reveal different characteristics of the low-level jet in the three regions. In western GD (Fig. 11a), the strong precipitation group systematically shows higher wind speeds below 1.5 km. In eastern GD (Fig. 11c), the strong precipitation group has a lower jet core height (2.40 km vs. 2.94 km for the weak events) and stronger peak wind speeds (12.8 vs. 11.2 m s−1). In central GD (Fig. 11b), the two groups of strong events show slightly higher wind speeds below 0.5 km, and the precipitation intensity in this region cannot be distinguished solely by the overall structure of the jet.
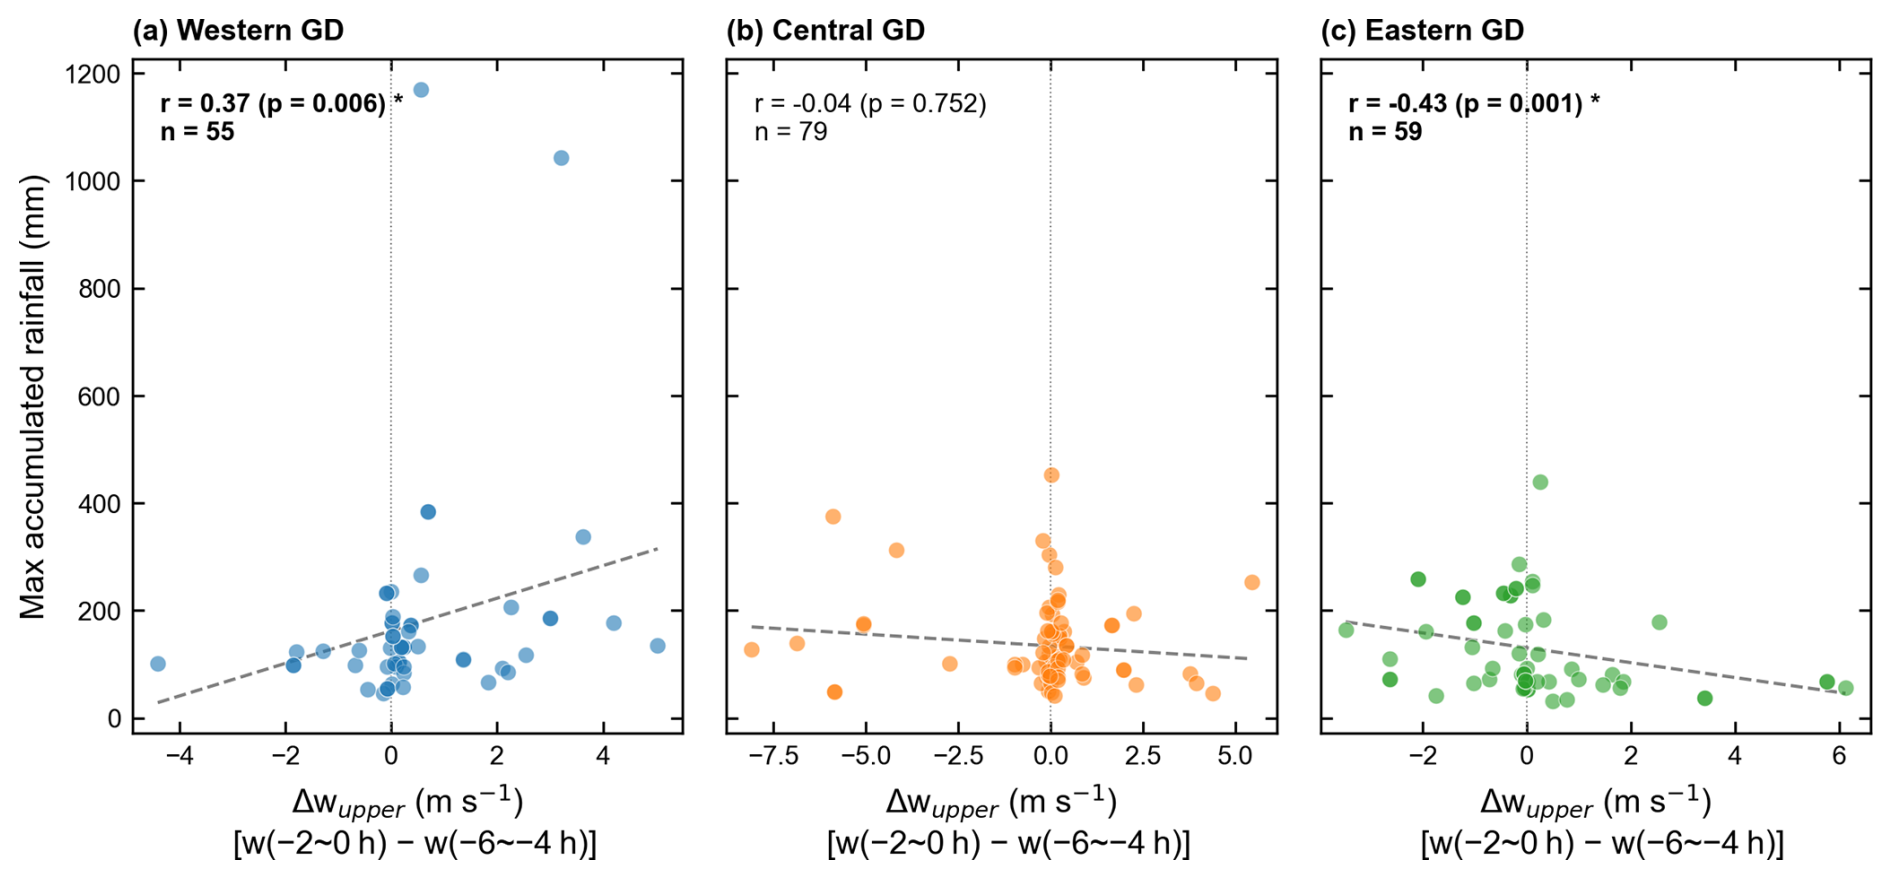
Figure 12Spearman rank correlation between the upper-level (3–5 km) vertical velocity change (Δw=w at to 0 h minus w at to −4 h) and maximum accumulated rainfall for (a) western GD, (b) central GD, and (c) eastern GD. A positive Δw indicates strengthening ascent approaching the onset.
A further diagnostic is provided by the change in upper-level (3–5 km) vertical velocity between the baseline period ( to −4 h) and the near-onset period ( to 0 h), denoted Δw (Fig. 12). A positive Δw indicates upward strengthening motion approaching the onset; a negative Δw indicates weakening. The correlation between Δw and rainfall intensity reveals a striking regional contrast. In western GD (Fig. 12a), Δw is positively correlated with rainfall (r=0.37, p=0.006): events with strengthening ascent before onset produce heavier rainfall. Moreover, Δw is positively correlated with ΔLLJI (r=0.34, p=0.012; Fig. S4), and this association holds after accounting for synoptic-scale geopotential height trends at 925 and 850 hPa (partial r=0.27–0.31, p < 0.05; not shown).
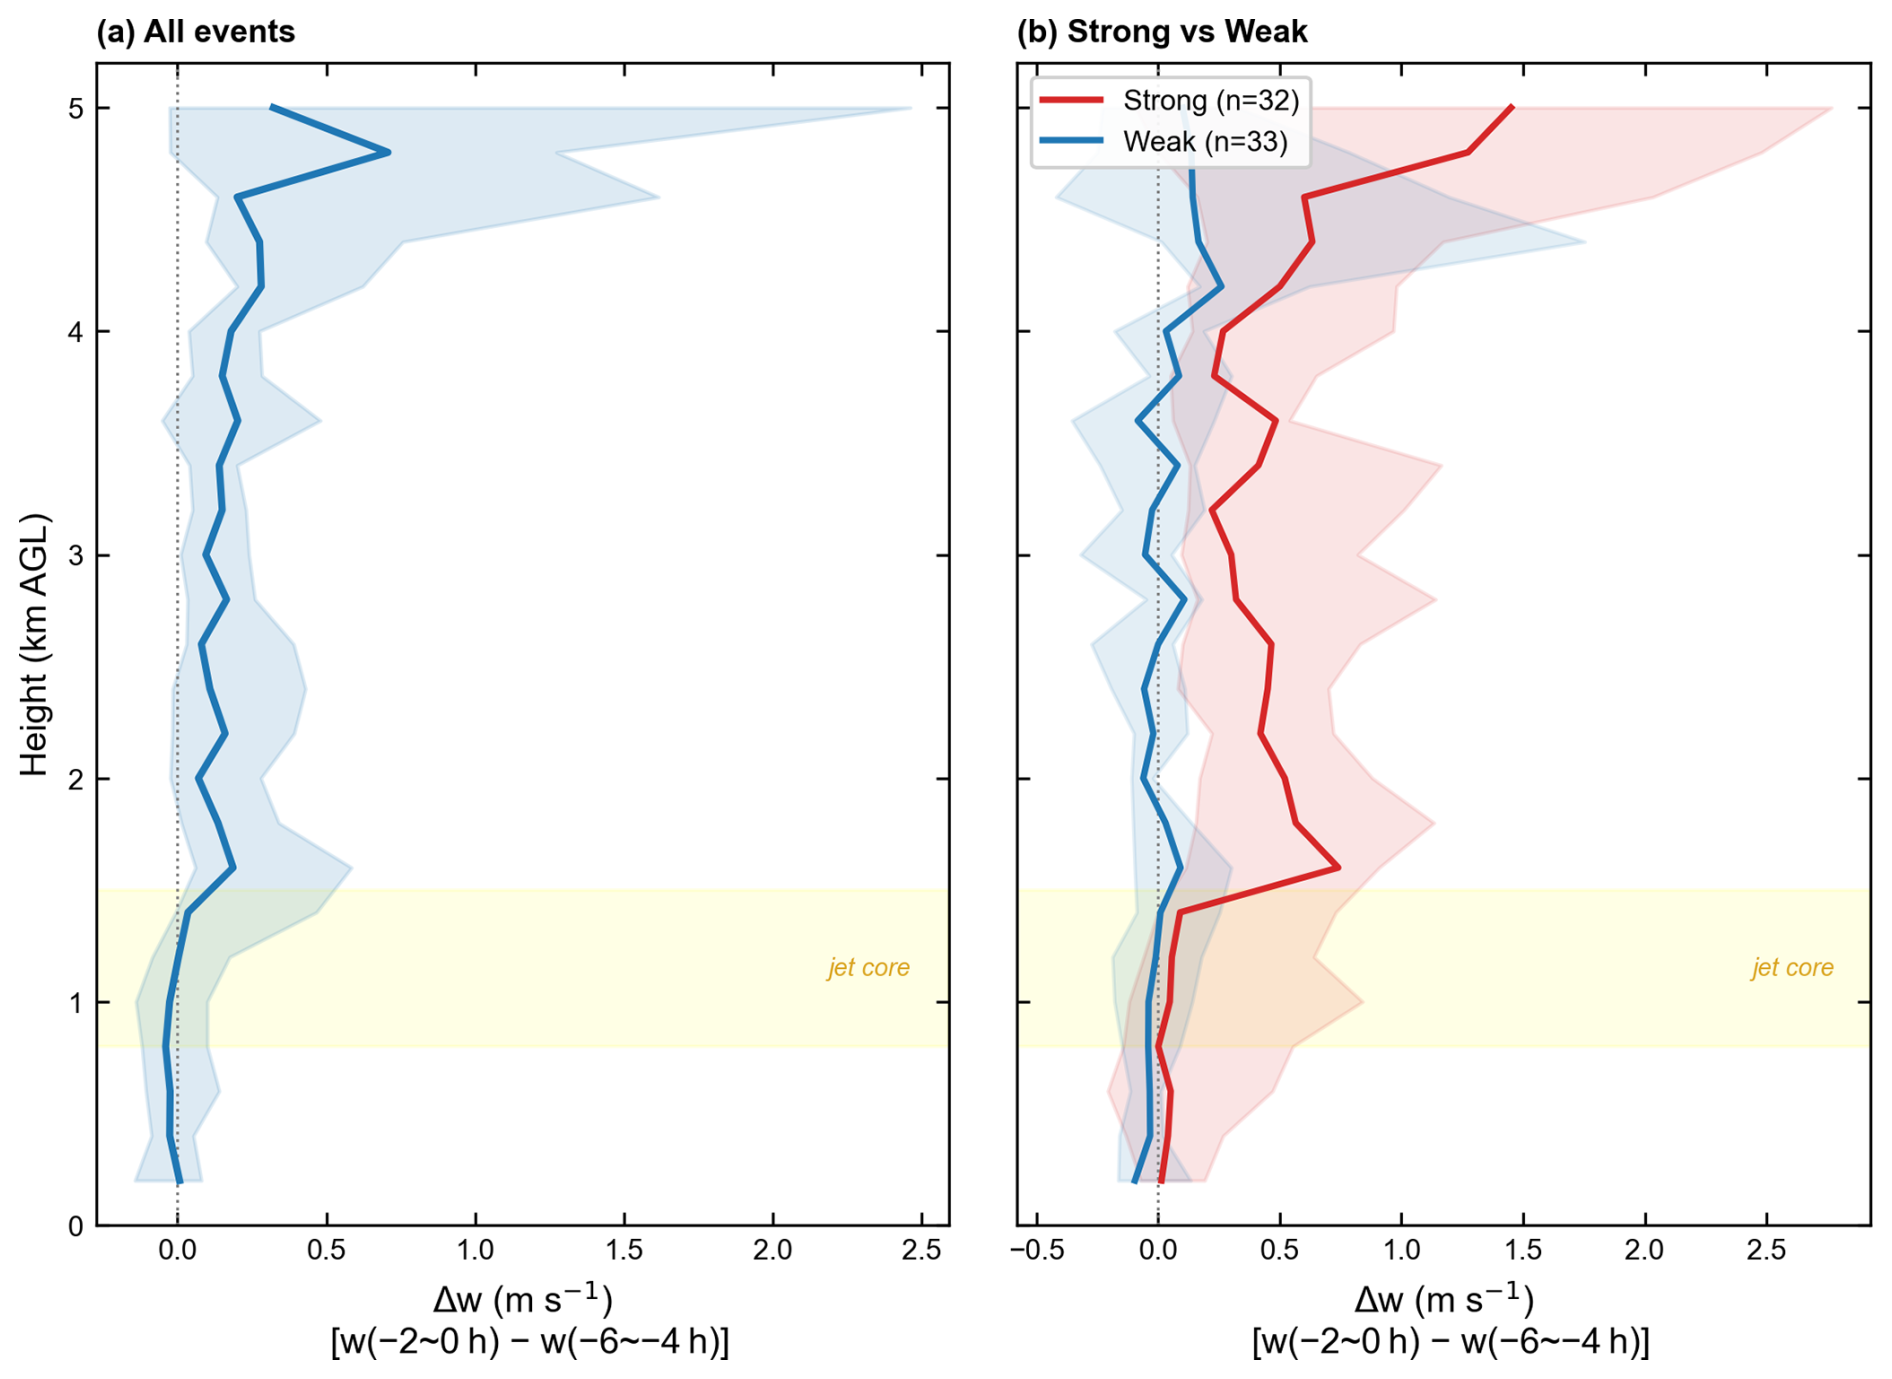
Figure 13Vertical profiles of the pre-onset vertical velocity change (Δw= mean w at to 0 h minus mean w at to −4 h) in western GD. (a) All events: solid line shows the composite median and shading shows the bootstrap 95 % confidence interval. (b) Strong-rainfall (red) and weak-rainfall (blue) events. The yellow band marks the jet core layer (0.8–1.5 km a.g.l.) identified from Fig. 11a.
The vertical structure of Δw is consistent with this: Δw is close to zero in the jet core (0.8–1.5 km) and increases sharply above 1.5 km (Fig. 13), consistent with the upward motion driven by convergence above the jet core. In strong precipitation events, the larger Δw above 1.5 km is more pronounced. Combined with the fact that there is no difference in CAPE between strong and weak events in this region (Fig. 14a, p=0.66), these results support the view that the enhancement of LLJ in western GD directly amplifies the low- to mid-level upward motion, resulting in stronger precipitation.
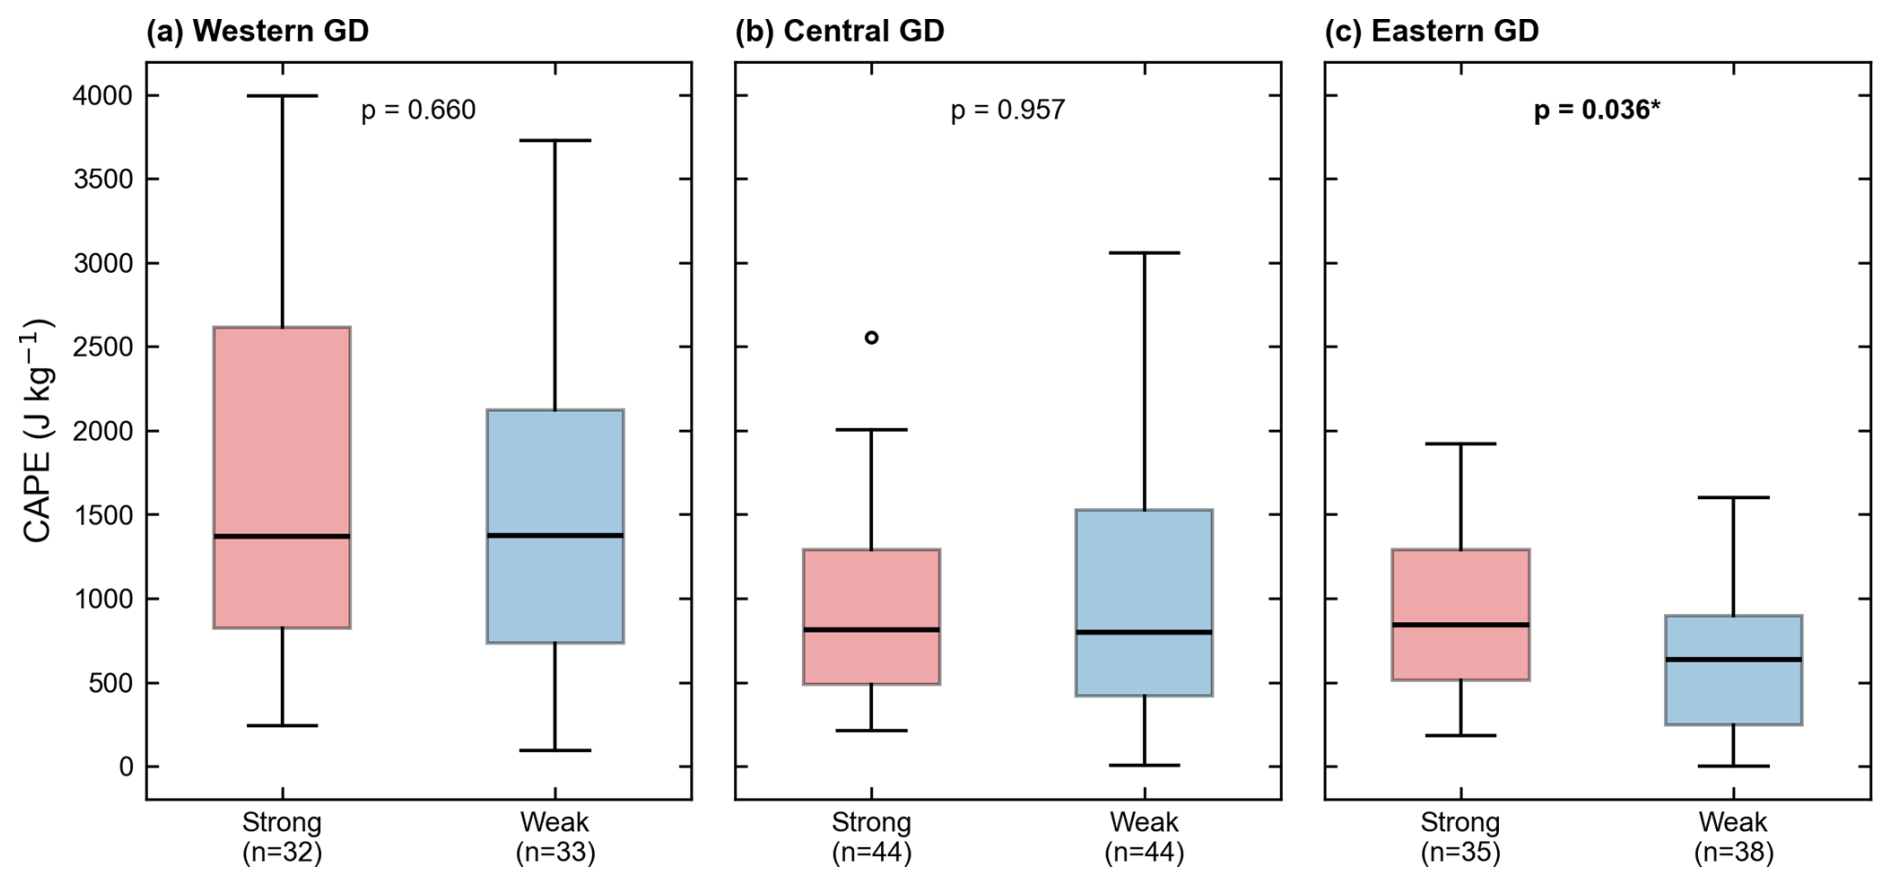
Figure 14Pre-onset CAPE (ERA5, averaged over to −2 h) for strong-rainfall (red) and weak-rainfall (blue) events in (a) western GD, (b) central GD, and (c) eastern GD. The box plots show the median, interquartile range, and whiskers extending to 1.5 × IQR. The p value of the Mann-Whitney U-test is annotated; an asterisk denotes p < 0.05.
In eastern GD (Fig. 12c), the relationship is reversed: Δw is negatively correlated with precipitation (.43, p=0.001). This decrease in Δw is not driven by changes in the low-level jet stream, as ΔLLJI and Δw are uncorrelated in this region (Fig. S4, r=0.15, p =0.26), suggesting that the suppression mechanism operates independently of local jet dynamics. The pre-precipitation CAPE of strong precipitation events is significantly higher than that of weak events (Fig. 14c), and the Δw of strong precipitation events is significantly more negative (Fig. S5d). All these indications suggest that the suppression of upward motion in the middle and upper levels prevents the premature release of convective instability, causing instability energy to build up in the lower troposphere; the significantly higher pre-precipitation CAPE and anomalously deep BLH in strong precipitation events are consistent with this accumulation process. ERA5 diagnostics in eastern GD (Fig. S5) showed no significant differences in large-scale 500 hPa vertical velocity (p=0.80) and 925 hPa relative humidity (p=0.21) between strong and weak precipitation events. Only 925 hPa temperature showed a significant difference (median 22.5 vs. 21.8 °C; p=0.004), with strong events consistently being warmer. In central GD, neither Δw nor CAPE distinguishes between strong and weak events (Fig. 12b, p=0.75; Fig. 14b, p=0.96). The relationship between ΔLLJI and ΔVWS is region-dependent (Fig. S6): in western GD they are significantly anti-correlated (0.26, p=0.044), in central GD they are uncorrelated (r=0.03, p=0.76), and in eastern GD they are also uncorrelated (r=0.03, p=0.84). These contrasts indicate that central-GD low-level shear is modulated by surface friction rather than LLJ pulsing, while in western and eastern GD, LLJ pulses accelerate the boundary-layer and lower-free-troposphere winds more uniformly.
The composite IVT fields (Fig. 15) show that central GD lies at the confluence of southwesterly flow from the Indian Ocean and southeasterly flow steered by the western Pacific subtropical high (consistent with the moisture transport climatology of Ning et al., 2023). Within this convergent large-scale environment, the low-level wind shear is strongest in central GD among the three regions (Fig. 7). This shear may partly arise from frictional deceleration of the low-level jet over the PRD surface, which would enhance convergence beneath the jet core. To further characterize the spatial structure of pre-onset boundary-layer VWS enhancement and the associated divergence pattern across the PRD, a multi-event profiler analysis is presented in Sect. 4.5.
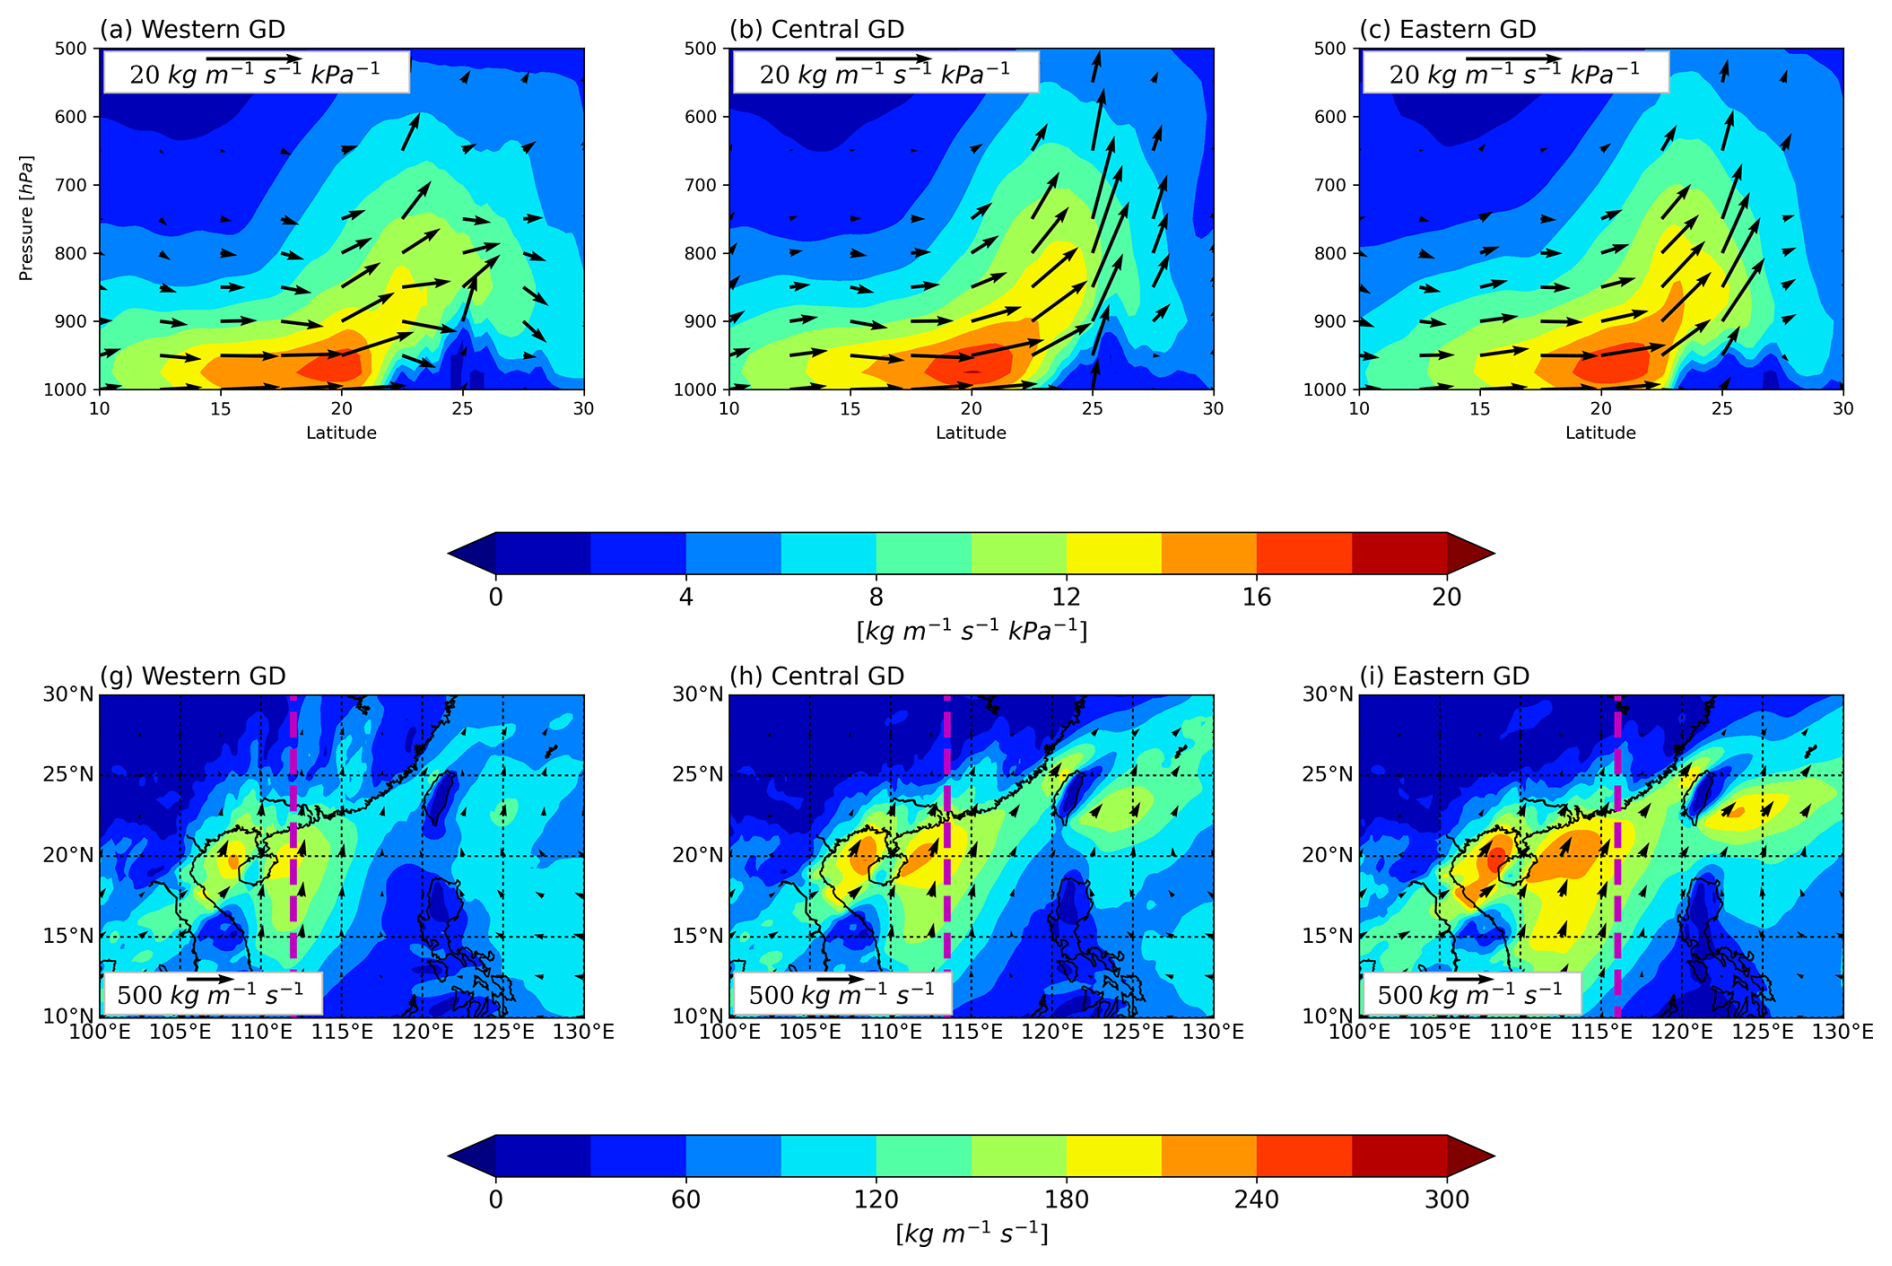
Figure 15Composite mean moisture transport field of WSHR events in 2016–2020 for the Western (a, d), Central (b, e), and Eastern (c, f) regions. Upper panels (a–c): vertical cross-sections of moisture transport along the purple lines shown in (d)–(f); shading shows the horizontal component (kg m−1 s−1 kPa−1), and arrows show the combined horizontal and vertical components, with the vertical component (VTw) magnified by a factor of 50 for visibility. Lower panels (d–f): spatial distribution of vertically integrated water vapour transport (IVT; kg m−1 s−1), with arrows showing IVT vectors and the purple line marking the transect location of the upper panels. IVT is integrated between 1000 and 850 hPa. Fields are averaged over to −2 h before onset.
In summary, the regional differences in precursor signals reflect fundamentally different relationships between low-level jets and precipitation intensity. In western GD, low-level-jet enhancement independent of synoptic-scale forcing promotes mid-to-upper-level upward motion, with a Δw vertical structure consistent with convergence-driven ascent. In eastern GD, pre-precipitation upward motion weakens, accompanied by higher boundary-layer temperatures and associated CAPE accumulation, while large-scale dynamics and low-level moisture conditions show no significant difference between strong and weak events. In central GD, governed by frictional shear modulation, the magnitude of lower-level VWS determines precipitation intensity.
4.5 Multi-event profiler analysis of low-level VWS enhancement in central Guangdong
To verify that the correlation between the lower-level VWS and precipitation intensity in central GD in Fig. 9 reflects a boundary-layer signal rather than a byproduct of synoptic-scale forcing, Spearman partial correlations (Fig. S7) were calculated after controlling for the mean ERA5 geopotential height (Z850 and Z925) in central GD. The 0.5–1.5 km VWS remained significantly correlated with precipitation in the P2–P4 windows, while the 1.5–3.0 km control layer showed no significant correlation in any window, confirming that the signal is confined to the boundary layer.
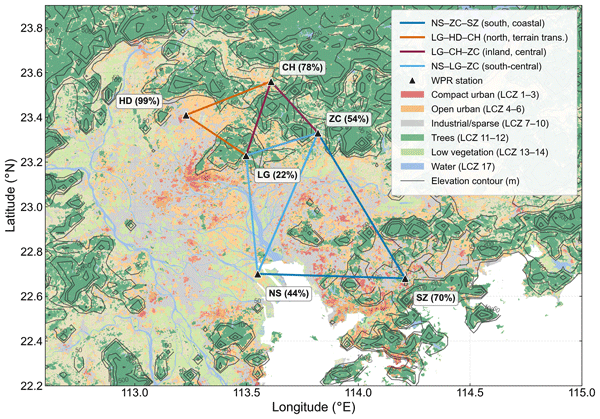
To examine the spatial structure of pre-onset VWS enhancement, per-station anomaly composites at 0.5–1.5 km were computed by subtracting each profiler's onset-hour-matched background median from the 3 h pre-onset mean (Fig. 16). All seven stations showed positive median anomalies, confirming that VWS enhancement is a widespread feature across central GD. The largest median anomaly (+1.81 m s−1 km−1) was observed at Luogang (LG), located within the Changling National Trail System, a forested recreation area in eastern Guangzhou, with the lowest 3 km urban fraction (22 %, LCZ 1–10) among all seven stations. This is consistent with the VWS enhancement at LG arising from the frictional environment of the surrounding urban agglomeration through which the southerly inflow has passed, rather than from the local surface beneath the profiler. Three other stations located well within the PRD urban agglomeration – Huadu (HD), Conghua (CH), and Shenzhen (SZ) – also showed sizeable positive anomalies. Stratifying events by hourly peak rainfall (median split at 71 mm h−1), six of seven stations showed larger anomalies during strong precipitation events, consistent with the VWS–rainfall relationship documented in Fig. 9.
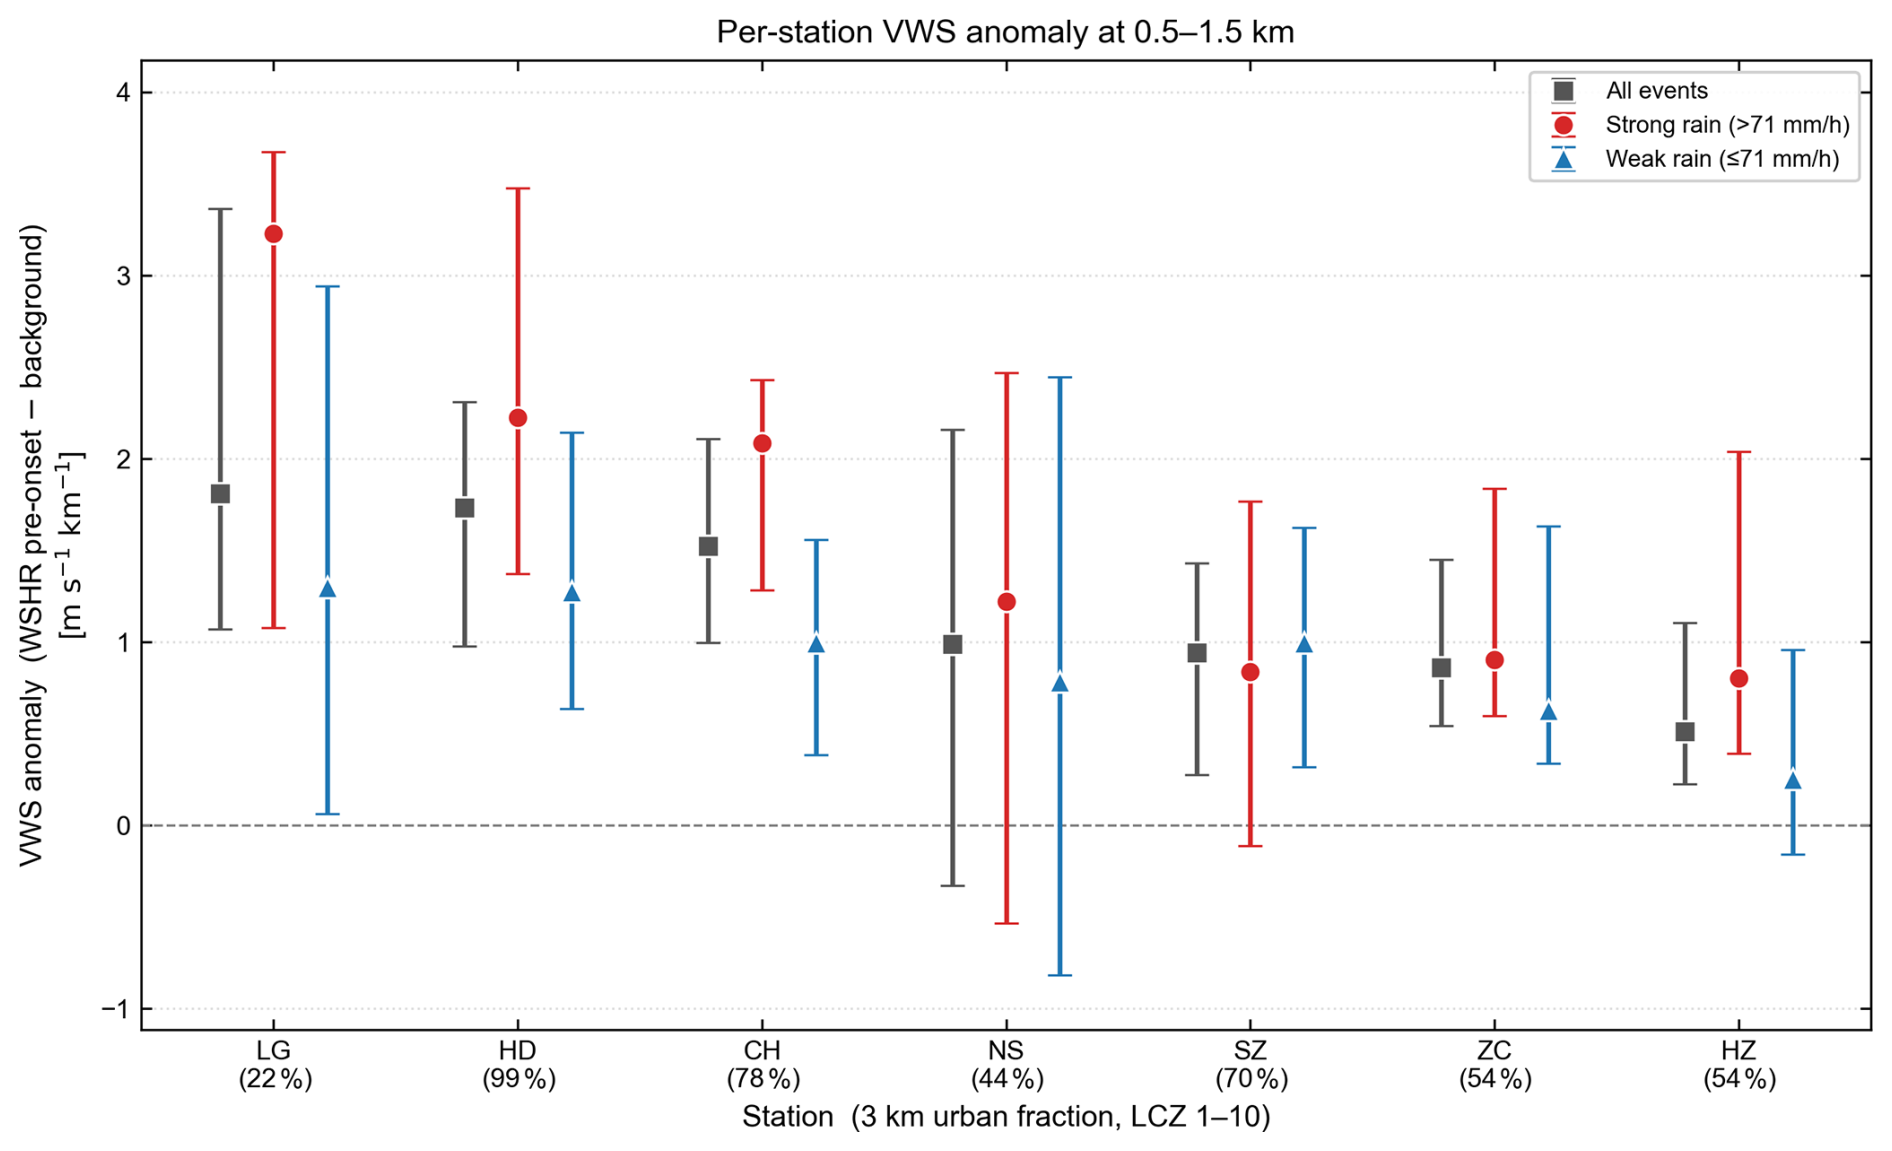
Figure 16Per-station VWS anomaly composites at 0.5–1.5 km (3 h pre-onset mean) for the seven wind profiler stations in central GD, based on WSHR events during 2016–2020. Stations are ordered by the all-events median (grey squares); error bars denote bootstrap 95 % confidence intervals (N=2000). Red circles and blue triangles show medians for events with hourly peak rainfall above and below the 71 mm h−1 split, respectively. x-axis labels include each station's 3 km urban fraction. Station codes: NS (Nansha), LG (Luogang), HD (Huadu), CH (Conghua), ZC (Zengcheng), SZ (Shenzhen), HZ (Huizhou Longmen).
The wind speed anomaly profiles along the dominant southerly inflow path (Fig. 17a; station and triangle locations shown in Fig. S9) show that WSHR events enhance the low-level flow at the coastal station NS by approximately +2.4 m s−1 in the lowest 0.5 km, but this enhancement is progressively attenuated inland – to roughly +0.8 m s−1 at LG and near zero at HD. At heights above ∼ 1 km, the three stations show comparable enhancement. Such spatially non-uniform deceleration within the boundary layer implies, by mass continuity, enhanced convergence where the inflow decelerates rapidly and relative divergence where it remains strong. The absolute divergence composites (Fig. S8) show that the four Bellamy triangles already possess a strong climatological gradient: the background median divergence ranges from +2.5 × 10⁻⁵ s−1 (divergent) at LG–CH–ZC to −2.5 × 10⁻⁵ s−1 (convergent) at LG–HD–CH, indicating that the northern triangle is climatologically convergent due to its location in the terrain-transition zone north of HD. Against this baseline, WSHR events impose an additional south-to-north divergence anomaly dipole (Fig. 17b). At 1.15 km, the four triangles trace a monotonic gradient: from s−1 (divergence enhancement) at the southern coastal triangle NS–ZC–SZ, through −1.5 × 10⁻⁵ s−1 at NS–LG–ZC and −2.6 × 10⁻⁵ s−1 at LG–CH–ZC, to −3.8 × 10⁻⁵ s−1 (convergence enhancement) at LG–HD–CH. This dipole is vertically confined to below ∼ 1.5 km, matching the layer of spatially non-uniform deceleration in Fig. 17a, and its convergent northern branch provides a favourable dynamical environment for convective initiation during WSHR events. HD itself combines a 99 % 3 km urban fraction with an immediate transition to higher terrain to the north, and whether the climatological convergence is controlled primarily by the urban surface, the orographic discontinuity, or their interaction cannot be determined from the present profiler network. The spatially non-uniform deceleration diagnosed in Fig. 17a may arise from a combination of urban roughness, orographic forcing, and land–sea contrast; disentangling these contributions is beyond the scope of the present observational study and requires future numerical sensitivity experiments.
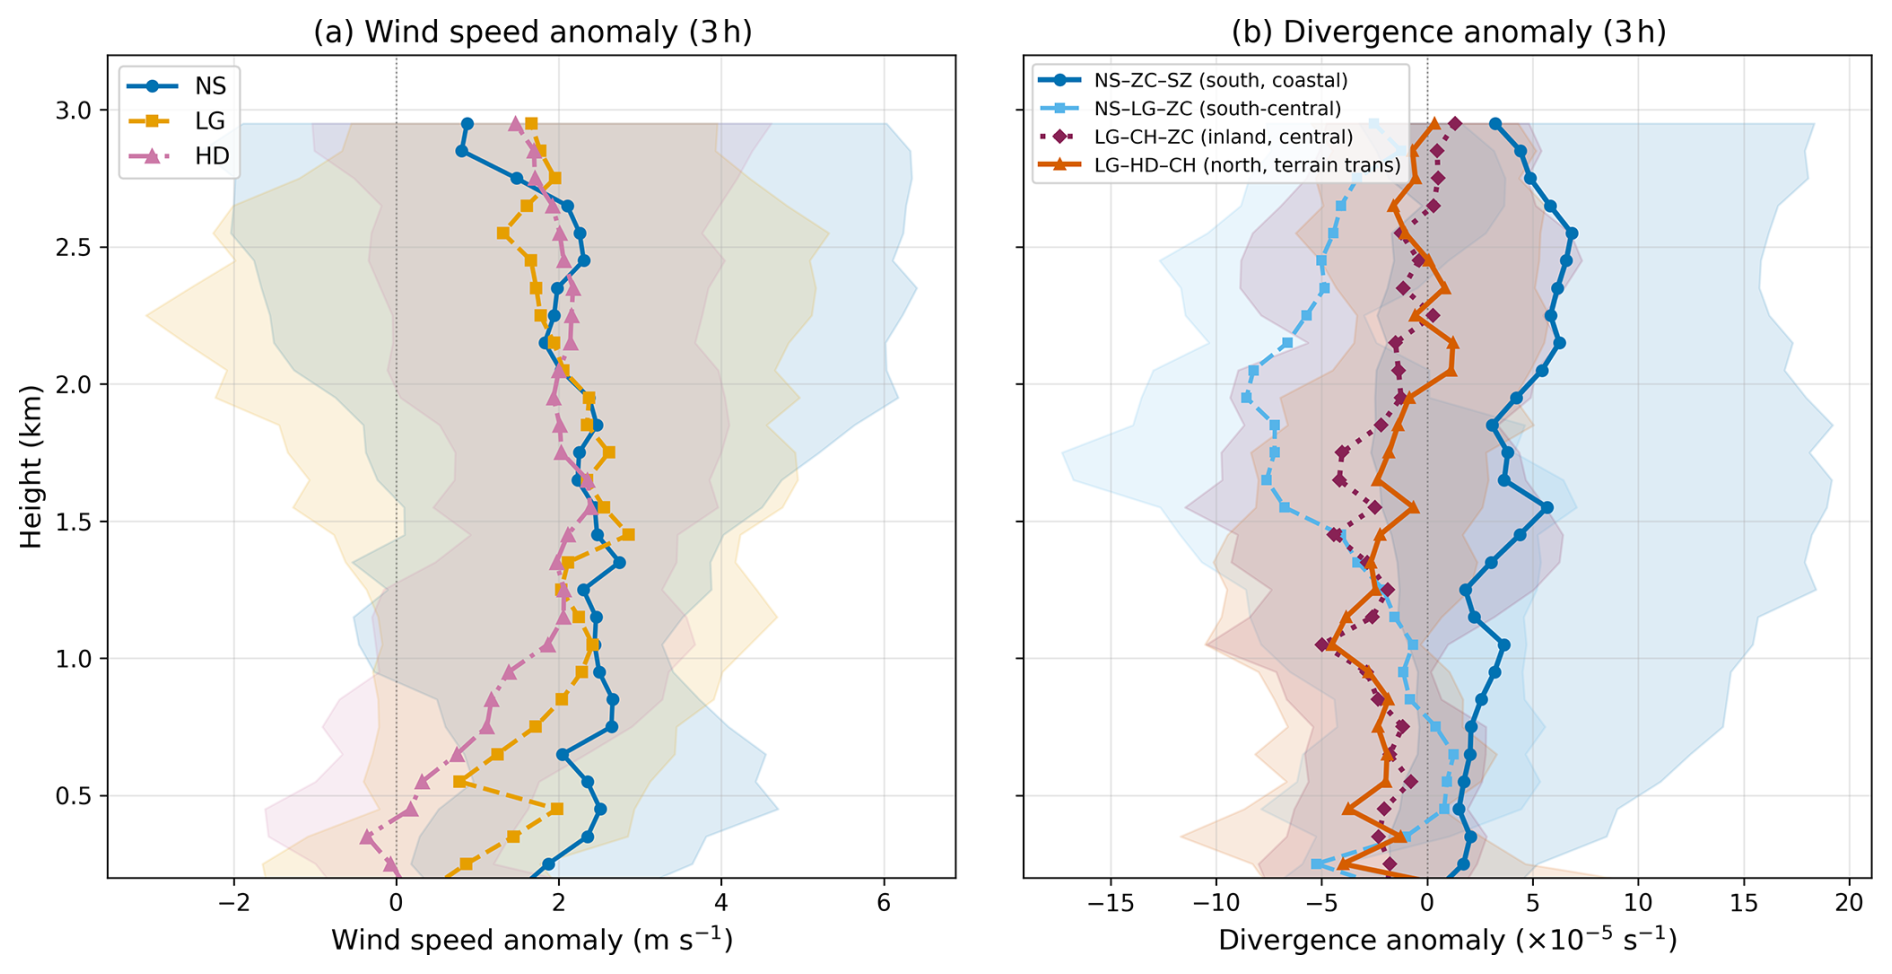
Figure 17Boundary-layer anomaly composites for WSHR events in central GD, averaged over the 3 h preceding rainfall onset. Anomalies are defined as the event composite minus the onset-hour-matched background median. (a) Wind speed anomaly profiles at NS, LG, and HD. (b) Divergence anomaly profiles for four Bellamy triangles, arranged from south to north by centroid latitude: NS–ZC–SZ, NS–LG–ZC, LG–CH–ZC, and LG–HD–CH. Solid lines show composite medians and shaded bands show interquartile ranges. Triangle geometry is shown in Fig. S9.
5.1 Summary
This study investigates the precursor signals of WSHR over Guangdong Province using WPR observations of 226 events during 2016–2020 across three subregions: western, central, and eastern GD. Five profiler-derived indices–LLJI, VWS at 0.5 to 1.5 km and 1.5 to 3.0 km, ALI, and BLH–are analysed through composite time series, period-based rank correlations, stratified composites, and ERA5-based thermodynamic diagnostics.
Among the five indices, LLJI exhibits the clearest temporal evolution before onset, roughly doubling its baseline value in western GD with the increase concentrated in the final 1–2 h before rainfall. However, this temporal trend is not statistically robust in central and eastern GD. LLJI does not show a significant rank correlation with rainfall intensity in any region; however, the stratified analysis confirms that strong-rainfall events are characterised by systematically higher overall LLJI levels than weak-rainfall events. VWS at 0.5 to 1.5 km maintains a significant positive correlation with rainfall intensity across three consecutive pre-onset periods in central GD, making it the most persistent intensity predictor in that region. In eastern GD, BLH shows the strongest association with rainfall intensity among all region–index combinations, with the correlation most pronounced in the early pre-onset window ( to −4 h); strong-rainfall events are also characterized by significantly higher pre-onset CAPE than weak-rainfall events. ALI displays episodic pulses rather than a sustained trend, and does not show consistent predictive value in any region.
The analysis of the pre-onset changes in upper-level (3–5 km) vertical velocity (Δw) reveals a fundamental contrast in the rainfall-producing mechanisms between regions. In western GD, Δw is positively correlated with rainfall intensity and with the concurrent change in LLJI, the Δw−ΔLLJI correlation holds after accounting for synoptic-scale geopotential height trends, and the Δw vertical structure is consistent with low-level convergence forcing upper-level ascent. In eastern GD, the relationship is reversed: weakening of the upper-level ascent before the onset is associated with stronger rainfall. This suppression is independent of both local LLJ changes and large-scale subsidence. Strong precipitation events exhibit significantly higher 925 hPa temperatures, and boundary-layer warming drives the CAPE accumulation and boundary-layer deepening observed in strong events. In central GD, neither Δw nor CAPE distinguishes between strong and weak events; instead, the 0.5–1.5 km VWS serves as the primary modulator of precipitation intensity. The LLJI and VWS are temporally decoupled in this region. Multi-event profiler composites show that the WSHR-enhanced southerly inflow undergoes spatially non-uniform frictional deceleration as it crosses the PRD, producing a south-to-north divergence anomaly dipole with convergence enhancement concentrated in the northern PRD (Sect. 4.5).
Among the five indices, three emerge as regionally dominant precursors: LLJI in western GD, VWS at 0.5–1.5 km in central GD, and BLH in eastern GD. These results provide an observational basis for developing region-specific nowcasting guidance: LLJI temporal changes for western GD, VWS at 0.5–1.5 km for central GD, and BLH combined with low-level temperature for eastern GD.
5.2 Comparison with previous studies
The three rainfall processes identified here are broadly consistent with, but extend, previous findings on WSHR mechanisms. Pulsed LLJ intensification in western GD is in agreement with BLJ–terrain interaction and orographic lifting mechanisms widely documented in coastal South China (Liang and Gao, 2021; Pu et al., 2022; Zhang et al., 2022b). The frictional deceleration effect documented across central GD events supports the findings of Gao et al. (2021) and Huang et al. (2019), who attributed convective initiation in Guangzhou to the urban heat island and enhanced convergence. Furthermore, convective maintenance in this urban agglomeration is often aided by evaporative cooling and cold pool outflows from upstream precipitation (Wang et al., 2014), though our current analysis highlights the primary triggering role of friction-induced VWS rather than thermal or cold-pool forcing alone. Regarding eastern GD, our finding of an energy-accumulation process linked to boundary layer warming rather than large-scale moisture transport or subsidence complements and qualifies the previous emphasis on large-scale moisture transport and spatial configurations. Past studies have demonstrated that robust moisture transport from the South China Sea to the Shanwei coast is crucial for triggering warm-sector rainstorms in the eastern region (Ning et al., 2023; Wang et al., 2025; Zhong and Chen, 2017).
This study uses profiler-observed vertical velocity changes to differentiate between direct dynamical forcing and energy-accumulation mechanisms. Previous studies have generally treated BLJ as a uniform triggering factor (e.g., Sun et al., 2019; Zhang and Meng, 2019), while the opposing signs of the Δw–rainfall correlation in western and eastern GD demonstrate that the role of LLJ varies qualitatively in the region. WPR, with its approximately 6 min temporal resolution and continuous vertical sampling from the surface to 5 to 6 km, is well suited to resolving these pre-onset signals that are not captured by twice-daily radiosondes or hourly reanalysis fields.
5.3 Limitations and future work
This study has several limitations. First, while the 14-station wind profiler network provides high temporal and vertical resolution, its spatial sampling is limited. Observations are lacking on the windward slopes of the Yunwu and Lianhua Mountains, in the central urban area of Guangzhou, and in the gaps between profiler stations, precluding a complete characterization of inflow evolution from ocean to inland. Second, the five-year record (2016–2020) yields limited sample sizes (65–88 events) in each sub-region, which constrains the statistical power of stratified analyses and may not capture the full range of interannual variability in large-scale forcing. Third, as discussed in Sect. 4.5, the observational approach cannot separate the individual contributions of urban roughness, orographic forcing, and land–sea contrast to frictional deceleration and convergence enhancement in central GD; the relative importance of these factors remains unquantified.
Several directions for future work emerge from these findings. High-resolution numerical sensitivity experiments – systematically removing or modifying urban land use, terrain, and coastline geometry – are needed to disentangle the respective contributions to boundary-layer convergence over the PRD. The suppression mechanism that allows CAPE to accumulate before precipitation in eastern GD requires verification with independent thermodynamic profiling to confirm the boundary-layer warming signal beyond ERA5 diagnostics. Finally, translating the regionally distinct precursor signals identified here into operational nowcasting algorithms – for example, real-time monitoring of LLJI trends in western GD, 0.5–1.5 km VWS in central GD, and BLH combined with low-level temperature in eastern GD – represents a natural next step, though the practical skill of such guidance needs to be evaluated through independent case testing and probabilistic verification.
The global Local Climate Zone map used for Guangdong Province is available from Zenodo (https://doi.org/10.5281/zenodo.7324909, Demuzere et al., 2022a, b). The meteorological dataset from weather stations and the measurements from wind profiler radar were provided by Guangdong Meteorological Administration under a restricted license and are thus not publicly distributable. The ERA5 reanalysis data are available from the Copernicus Climate Change Service Climate Data Store: pressure-level fields at https://doi.org/10.24381/cds.bd0915c6 (Hersbach et al., 2023a) and single-level fields at https://doi.org/10.24381/cds.adbb2d47 (Hersbach et al., 2023b).
The supplement related to this article is available online at https://doi.org/10.5194/acp-26-11943-2026-supplement.
WL performed the main data analysis and prepared the manuscript. ZH developed the precursor index calculations. SX contributed to data processing. LS, XB and LY provided important scientific comments and suggestions throughout the study. SL, YaY, CL and JW contributed to the manuscript revision. SL provided expertise on wind profiler radar data quality assessment. YuY conceived of the study, provided overall scientific guidance, and supervised the project. All authors reviewed and approved the final manuscript.
The contact author has declared that none of the authors has any competing interests.
Publisher's note: Copernicus Publications remains neutral with regard to jurisdictional claims made in the text, published maps, institutional affiliations, or any other geographical representation in this paper. The authors bear the ultimate responsibility for providing appropriate place names. Views expressed in the text are those of the authors and do not necessarily reflect the views of the publisher.
We thank the Typhoon Scientific and Technological Innovation Group of China Meteorological Administration (grant no. CMA2023ZD06) and the Scientific and Technological Innovation Group of Guangdong Meteorological Service (grant no. GRMCTD202201) for their support. We also thank Jie Guo from the Guangdong Meteorological Data Center for his assistance with data collection and data quality control, and all the staff responsible for the operation and maintenance of the observational network. Last but not least, we greatly appreciate the constructive comments and suggestions from the anonymous reviewers, which significantly improved the quality of this paper.
This work has been supported by the National Natural Science Foundation of China (grant no. 42521006), Natural Science Foundation of Guangdong Province (grant no. 2024A1515012224), and Guangdong Provincial Marine Meteorology Science Data Center (grant no. 2024B1212070014).
This paper was edited by Dantong Liu and reviewed by four anonymous referees.
Bellamy, J. C.: Objective calculations of divergence, vertical velocity and vorticity, B. Am. Meteorol. Soc., 30, 45–49, https://doi.org/10.1175/1520-0477-30.2.45, 1949.
Chen, T. and Zhang, D.-L.: A 7-Year Climatology of Warm-Sector Heavy Rainfall over South China during the Pre-Summer Months, Atmosphere, 12, 914, https://doi.org/10.3390/atmos12070914, 2021.
Chen, Y., Chen, T., Wang, L., Li, S., and Xu, J.: A review of the warm-sector rainstorms in China, Torrential Rain and Disasters, 38, 483–493, https://doi.org/10.3969/j.issn.1004-9045.2019.05.010, 2019 (in Chinese).
Demuzere, M., Kittner, J., Martilli, A., Mills, G., Moede, C., Stewart, I. D., van Vliet, J., and Bechtel, B.: A global map of local climate zones to support earth system modelling and urban-scale environmental science, Earth Syst. Sci. Data, 14, 3835–3873, https://doi.org/10.5194/essd-14-3835-2022, 2022a.
Demuzere, M., Kittner, J., Martilli, A., Mills, G., Moede, C., Stewart, I. D., van Vliet, J., and Bechtel, B.: Global map of Local Climate Zones (2.0.0), Zenodo [data set], https://doi.org/10.5281/zenodo.7324909, 2022b.
Ding, Y. H.: Monsoons over China, Kluwer Academic Publishers, Dordrecht, the Netherlands, 419 pp., https://doi.org/10.1007/978-94-015-8302-2, 1994.
Du, Y. and Chen, G.: Heavy rainfall associated with double low-level jets over southern China. Part I: Ensemble-based analysis, Mon. Weather Rev., 146, 3827–3844, https://doi.org/10.1175/MWR-D-18-0101.1, 2018.
Du, Y., Zhang, Q., Ying, Y., and Yang, Y.: Characteristics of Low-level Jets in Shanghai during the 2008–2009 Warm Seasons as Inferred from Wind Profiler Radar Data, J. Meteor. Soc. Jpn., 90, 891–903, https://doi.org/10.2151/jmsj.2012-603, 2012.
Du, Y., Chen, G., Han, B., Mai, C., Bai, L., and Li, M.: Convection Initiation and Growth at the Coast of South China. Part I: Effect of the Marine Boundary Layer Jet, Mon. Weather Rev., 148, 3847–3869, https://doi.org/10.1175/MWR-D-20-0089.1, 2020a.
Du, Y., Chen, G., Han, B., Bai, L., and Li, M.: Convection initiation and growth at the coast of South China. Part II: Effects of the terrain, coastline, and cold pools, Mon. Weather Rev., 148, 3871–3892, https://doi.org/10.1175/MWR-D-20-0090.1, 2020b.
Gao, Z., Zhu, J., Guo, Y., Luo, N., Fu, Y., and Wang, T.: Impact of Land Surface Processes on a Record-Breaking Rainfall Event on May 06–07, 2017, in Guangzhou, China, J. Geophys. Res.-Atmos., 126, e2020JD032997, https://doi.org/10.1029/2020JD032997, 2021.
Heo, B., Jacoby-Koaly, S., Kim, K., Campistron, B., Benech, B., and Jung, E.: Use of the Doppler Spectral Width to Improve the Estimation of the Convective Boundary Layer Height from UHF Wind Profiler Observations, J. Atmos. Ocean. Tech., 20, 408–424, https://doi.org/10.1175/1520-0426(2003)020<0408:UOTDSW>2.0.CO;2, 2003.
Hersbach, H., Bell, B., Berrisford, P., Biavati, G., Horányi, A., Muñoz Sabater, J., Nicolas, J., Peubey, C., Radu, R., Rozum, I., Schepers, D., Simmons, A., Soci, C., Dee, D., and Thépaut, J.-N.: ERA5 hourly data on pressure levels from 1940 to present, Copernicus Climate Change Service (C3S) Climate Data Store (CDS) [data set], https://doi.org/10.24381/cds.bd0915c6, 2023a.
Hersbach, H., Bell, B., Berrisford, P., Biavati, G., Horányi, A., Muñoz Sabater, J., Nicolas, J., Peubey, C., Radu, R., Rozum, I., Schepers, D., Simmons, A., Soci, C., Dee, D., and Thépaut, J.-N.: ERA5 hourly data on single levels from 1940 to present, Copernicus Climate Change Service (C3S) Climate Data Store (CDS) [data set], https://doi.org/10.24381/cds.adbb2d47, 2023b.
Higgins, R. W., Yao, Y., Yarosh, E. S., Janowiak, J. E., and Mo, K. C.: Influence of the Great Plains low-level jet on summertime precipitation and moisture transport over the central United States, J. Climate, 10, 481–507, https://doi.org/10.1175/1520-0442(1997)010<0481:IOTGPL>2.0.CO;2, 1997.
Huang, S. S.: Heavy Rainfall over Southern China in the Pre-Summer Rainy Season, Guangdong Science and Technology Press, Guangzhou, 244 pp., China Unified Book Number 13182.129, 1986 (in Chinese).
Huang, Y., Liu, Y., Liu, Y., Li, H., and Knievel, J. C.: Mechanisms for a Record-Breaking Rainfall in the Coastal Metropolitan City of Guangzhou, China: Observation Analysis and Nested Very Large Eddy Simulation With the WRF Model, J. Geophys. Res.-Atmos., 124, 1370–1391, https://doi.org/10.1029/2018JD029668, 2019.
Kotthaus, S., Bravo-Aranda, J. A., Collaud Coen, M., Guerrero-Rascado, J. L., Costa, M. J., Cimini, D., O'Connor, E. J., Hervo, M., Alados-Arboledas, L., Jiménez-Portaz, M., Mona, L., Ruffieux, D., Illingworth, A., and Haeffelin, M.: Atmospheric boundary layer height from ground-based remote sensing: a review of capabilities and limitations, Atmos. Meas. Tech., 16, 433–479, https://doi.org/10.5194/amt-16-433-2023, 2023.
Li, C., Zhang, X., Guo, J., Yu, Q., and Zhang, Y.: Decadal variation and trend of boundary layer height and possible contributing factors in China, Agr. Forest Meteorol., 347, 109910, https://doi.org/10.1016/j.agrformet.2024.109910, 2024a.
Li, N., Guo, J., Wu, M., Zhang, F., Guo, X., Sun, Y., Zhang, Z., Liang, H., and Chen, T.: Low-Level Jet and Its Effect on the Onset of Summertime Nocturnal Rainfall in Beijing, Geophys. Res. Lett., 51, e2024GL110840, https://doi.org/10.1029/2024GL110840, 2024b.
Liang, Z. and Gao, S.: Organized Warm-Sector Rainfall in the Coastal Region of South China in an Anticyclone Synoptic Situation: Observational Analysis, J. Meteorol. Res., 35, 460–477, https://doi.org/10.1007/s13351-021-0157-4, 2021.
Liu, B., Guo, J., Gong, W., Shi, L., Zhang, Y., and Ma, Y.: Characteristics and performance of wind profiles as observed by the radar wind profiler network of China, Atmos. Meas. Tech., 13, 4589–4600, https://doi.org/10.5194/amt-13-4589-2020, 2020.
Liu, R., Sun, J., and Chen, B.: Selection and Classification of Warm-Sector Heavy Rainfall Events over South China, Chinese J. Atmos. Sci., 43, 119–130, https://doi.org/10.3878/j.issn.1006-9895.1803.17245, 2019 (in Chinese).
Liu, S. Y., Zheng, Y. G., and Tao, Z. Y.: The analysis of the relationship between pulse of LLJ and heavy rain using wind profiler data, J. Trop. Meteor., 19, 285–290, https://doi.org/10.3969/j.issn.1004-4965.2003.03.008, 2003 (in Chinese).
Lolli, S., Delaval, A., Loth, C., Garnier, A., and Flamant, P. H.: 0.355-micrometer direct detection wind lidar under testing during a field campaign in consideration of ESA's ADM-Aeolus mission, Atmos. Meas. Tech., 6, 3349–3358, https://doi.org/10.5194/amt-6-3349-2013, 2013.
Luo, Y., Zhang, R., Wan, Q., Wang, B., Wong, W. K., Hu, Z., Jou, B. J.-D., Lin, Y., Johnson, R. H., Chang, C.-P., Zhu, Y., Zhang, X., Wang, H., Xia, R., Ma, J., Zhang, D.-L., Gao, M., Zhang, Y., Liu, X., Chen, Y., Huang, H., Bao, X., Ruan, Z., Cui, Z., Meng, Z., Sun, J., Wu, M., Wang, H., Peng, X., Qian, W., Zhao, K., and Xiao, Y.: The Southern China Monsoon Rainfall Experiment (SCMREX), B. Am. Meteorol. Soc., 98, 999–1013, https://doi.org/10.1175/BAMS-D-15-00235.1, 2017.
Ning, G., Luo, M., Bi, X., Liu, Z., Zhang, H., Huang, M., Huang, X., Yang, Y., and Wu, S.: Large-scale moisture transport and local-scale convection patterns associated with warm-sector heavy rainfall over South China, Atmos. Res., 285, 106637, https://doi.org/10.1016/j.atmosres.2023.106637, 2023.
Pu, Y., Hu, S., Luo, Y., Liu, X., Hu, L., Ye, L., Li, H., Xia, F., and Gao, L.: Multiscale Perspectives on an Extreme Warm-Sector Rainfall Event over Coastal South China, Remote Sens., 14, 3110, https://doi.org/10.3390/rs14133110, 2022.
Seibert, P., Beyrich, F., Gryning, S.-E., Joffre, S., Rasmussen, A., and Tercier, P.: Review and intercomparison of operational methods for the determination of the mixing height, Atmos. Environ., 34, 1001–1027, https://doi.org/10.1016/S1352-2310(99)00349-0, 2000.
Stensrud, D. J.: Importance of low-level jets to climate: A review, J. Climate, 9, 1698–1711, https://doi.org/10.1175/1520-0442(1996)009<1698:IOLLJT>2.0.CO;2, 1996.
Stewart, I. D. and Oke, T. R.: Local Climate Zones for Urban Temperature Studies, B. Am. Meteorol. Soc., 93, 1879–1900, https://doi.org/10.1175/BAMS-D-11-00019.1, 2012.
Sun, J., Zhang, Y., Liu, R., Fu, S., and Tian, F.: A Review of Research on Warm-Sector Heavy Rainfall in China, Adv. Atmos. Sci., 36, 1299–1307, https://doi.org/10.1007/s00376-019-9021-1, 2019.
Trier, S. B., Davis, C. A., Ahijevych, D. A., Weisman, M. L., and Bryan, G. H.: Mechanisms supporting long-lived episodes of propagating nocturnal convection within a 7-day WRF model simulation, J. Atmos. Sci., 63, 2437–2461, https://doi.org/10.1175/JAS3768.1, 2006.
Wang, C., Chen, X., and Zhao, K.: Extreme local mesoscale convective systems over the South China coast during the warm season, Q. J. Roy. Meteor. Soc., 151, e4959, https://doi.org/10.1002/qj.4959, 2025.
Wang, H., Luo, Y., and Jou, B. J.-D.: Initiation, maintenance, and properties of convection in an extreme rainfall event during SCMREX: Observational analysis, J. Geophys. Res.-Atmos., 119, 13206–13232, https://doi.org/10.1002/2014JD022339, 2014.
Wu, N., Zhuang, X., Min, J., and Meng, Z.: Practical and intrinsic predictability of a warm-sector torrential rainfall event in the South China monsoon region, J. Geophys. Res.-Atmos., 125, e2019JD031313, https://doi.org/10.1029/2019JD031313, 2020.
Wu, Y., Guo, J., Chen, T., and Chen, A.: Forecasting Precipitation from Radar Wind Profiler Mesonet and Reanalysis Using the Random Forest Algorithm, Remote Sens., 15, 1635, https://doi.org/10.3390/rs15061635, 2023.
Xian, T., Guo, J., Zhao, R., Guo, X., Li, N., Sun, Y., Zhang, Z., Su, T., and Li, Z.: Impact of Urbanization on Mesoscale Convective Systems: Insights From a Radar Wind Profiler Mesonet, Theoretical Analyses, and Model Simulations, J. Geophys. Res.-Atmos., 129, e2024JD042294, https://doi.org/10.1029/2024JD042294, 2024.
Zeng, W., Chen, G., Du, Y., and Wen, Z.: Diurnal variations of low-level winds and precipitation response to large-scale circulations during a heavy rainfall event, Mon. Weather Rev., 147, 3981–4004, https://doi.org/10.1175/MWR-D-19-0131.1, 2019.
Zhang, L., Ma, X., Zhu, S., Guo, Z., Zhi, X., and Chen, C.: Analyses and applications of the precursor signals of a kind of warm sector heavy rainfall over the coast of Guangdong, China, Atmos. Res., 280, 106425, https://doi.org/10.1016/j.atmosres.2022.106425, 2022a.
Zhang, M. and Meng, Z.: Warm-sector heavy rainfall in southern China and its WRF simulation evaluation: A low-level-jet perspective, Mon. Weather Rev., 147, 4461–4480, https://doi.org/10.1175/MWR-D-19-0110.1, 2019.
Zhang, M., Rasmussen, K. L., Meng, Z., and Huang, Y.: Impacts of Coastal Terrain on Warm-Sector Heavy-Rain-Producing MCSs in Southern China, Mon. Weather Rev., 150, 603–624, https://doi.org/10.1175/MWR-D-21-0190.1, 2022b.
Zhong, S. and Chen, Z.: The Impacts of Atmospheric Moisture Transportation on Warm Sector Torrential Rains over South China, Atmosphere, 8, 116, https://doi.org/10.3390/atmos8070116, 2017.
Zhou, X., Cheng, Z., Li, H., and Hu, D.: Comparison between the Roles of Low-Level Jets in Two Heavy Rainfall Events over South China, J. Meteorol. Res., 36, 326–341, https://doi.org/10.1007/s13351-022-1159-6, 2022.