
the Creative Commons Attribution 4.0 License.
the Creative Commons Attribution 4.0 License.
 | 21 Aug 2026
Impacts of anthropogenic aerosols on a snowfall event – a case study in the Guanzhong Basin and its surrounding areas, China
Yuning Yang
Naifang Bei
Ruonan Wang
Qing Ji
Haiyue Hong
Zhe Li
Xuexi Tie
Guohui Li
Impacts of anthropogenic aerosols on clouds and snowfall during winter precipitation events remain highly uncertain, particularly under heavy pollution. A winter snowfall event over the Guanzhong Basin (GZB) and its surrounding regions (GZBs), China, has been simulated using a cloud-resolving, fully coupled WRF-Chem model to quantify the respective roles of aerosol–radiation interactions (ARIs) and aerosol–cloud interactions (ACIs). The simulated temporal variation and spatial distribution of air pollutants and precipitation generally agree with the observations in the GZB + GZBs. Sensitivity experiments are performed to evaluate effects of ARIs and ACIs by changing the anthropogenic emissions. The precipitation response to ARIs and ACIs exhibits regional contrast in GZB and GZBs due to different aerosol concentrations. In the GZB, exclusion of ARIs leads to a slight increase in precipitation with increasing emissions, mainly associated with enhanced ice-phase precipitation induced by ACIs. ARIs increase the precipitation in the GZB when emissions increase reaches a threshold, caused by ARI-induced enhancement of relative humidity (RH) which increases ice water path and favors survival of falling ice particles. In contrast, precipitation in the GZBs decreases with increasing emissions, reflecting suppression of liquid-phase precipitation by ACIs and reductions in RH caused by ARIs. In addition, changes in anthropogenic emissions exert limited influence on the spatial distribution of precipitation across the combined GZB–GZBs region. These findings provide process-level insight into how ARIs and ACIs regulate snowfall under polluted conditions, with implications for improving aerosol–precipitation coupling in regional climate and weather models.
- Article
(12269 KB) - Full-text XML
-
Supplement
(4178 KB) - BibTeX
- EndNote


Anthropogenic aerosols can directly and indirectly modulate the dynamics, thermodynamics, and microphysics of the cloud-precipitation process by absorbing or scattering the solar radiation and serving as cloud condensation nuclei (CCN) or ice nuclei (IN) (e.g., Boucher et al., 2013; IPCC, 2013; Huang and Ding, 2021; Zhao et al., 2024), constituting one of major uncertainties in climate prediction and weather forecasting (e.g., Quaas, 2015; Myhre et al., 2013; Makar et al., 2015; IPCC, 2021). Aerosol effects on the solar radiation are referred as to aerosol–radiation interactions (ARIs), which traditionally include the direct and semi-direct effects (e.g., Charlson et al., 1992; Sun and Zhao, 2021; Ackerman et al., 2000). Aerosol effects on CCN and IN and further cloud-precipitation are referred as to aerosol-cloud interactions (ACIs), which is also called aerosol indirect effect (e.g., Mitchell, 1971; Braham, 1974; Twomey, 1977; Albrecht, 1989).
Past studies have proposed many mechanisms about aerosol effects on precipitation, such as the positive precipitation-aerosol relationships attributed to invigoration effect (e.g., Khain et al., 2005; Pinsky et al., 2013; Rosenfeld et al., 2008), the negative aerosol effect on precipitation due to cloud water competition (e.g., Albrecht, 1989; Rosenfeld, 1999), and ARIs that reduce solar radiation down to the surface and modify atmospheric temperature profiles (e.g., Ackerman et al., 2000; Koren et al., 2004). The two mechanisms proposed for the invigoration effect include (1) mixed- or cold-phase invigoration, whereby aerosol induced higher CCN suppress warm-rain formation, resulting in greater lofting of cloud condensate mass and increased fusion heating as the droplets freeze (e.g. Rosenfeld et al., 2008), and (2) warm-phase invigoration, whereby aerosol induced higher CCN increase condensation heating (e.g. Kogan and Martin, 1994; Pinsky et al., 2013). It is worth noting that the invigoration effect is still debatable due to insufficient observational evidence or flawed methodology (e.g., Öktem et al., 2023; Romps et al., 2023; Varble et al., 2023).
However, the net effect of aerosols on clouds and precipitation remains controversial and depends on many factors, including meteorological conditions, specific aerosol loadings, cloud/precipitation types, cloud/precipitation development stages, aerosol composition and size distribution, relative location of aerosol and cloud vertical locations, and orography conditions (e.g. Khain et al., 2008; Tao et al., 2007; Guo et al., 2018, 2014; Zhang et al., 2002; Ackerman et al., 2000; Yang and Li, 2014). First, the aerosol effect on precipitation depends on different types of precipitation. For example, aerosols can enhance convective precipitation but inhibit stratiform precipitation, which lead to intensified flooding in southern China in summer and aggravated drought in East Asia' s middle and low latitudes area especially during winter and spring time (e.g., Menon et al., 2002; Zhang et al., 2017; Huo et al., 2021; Xie et al., 2022; Ryu and Min, 2022; Sun et al., 2022). Second, aerosol effect on precipitation varies with precipitation grade. Studies show that increasing aerosol concentrations can enhance heavy rain but reduce moderate and light rain, which may also reduce the frequency of the moderate and light rain (e.g., Wang et al., 2011; Shao et al., 2022). Third, the specific impact of aerosols on precipitation varies across different phases of precipitation process due to the competition between ARIs and ACIs (e.g., Lee et al., 2016). Furthermore, the influence of aerosols on precipitation also relies on the position of aerosols. As an example, low-level anthropogenic aerosols inhibit the precipitation process while high-level aerosols enhance it (e.g., Bai et al., 2020; Sun et al., 2022). Most recently, Yun et al. (2024) have found that aerosol effects on MCS©\ averaged precipitation is mostly similar between the polluted and clean conditions due to compensations among the subregions with divergent spatiotemporally discretized changes. Wang et al. (2024) have emphasized the aerosol IN effect on cloud microphysics, convection intensity, and regional rainfall distribution. Peng et al. (2025) have pointed out that aerosols exert stronger impacts on convective than stratiform precipitation as mentioned in Sun and Zhao (2021) based on data analysis. Moraglia and Crippa (2026) have also indicated that differences induced by land-use perturbation and aerosols is smaller in stratiform rain than that in convective rain because the absence of strong vertical mixing prevents the activation of more aerosols.
Given the complexity of precipitation phase states, there has been relatively limited exploration into how aerosols influence wintertime precipitation processes, especially snowfall event (e.g., Saleeby et al., 2010; Thompson and Eidhammer, 2014; Guo et al., 2021; Cao et al., 2021; Zhang et al., 2022; Xiao et al., 2022; Pravia-Sarabia et al., 2023). Saleeby et al. (2010) have showed that an increase in aerosol concentrations results in a spillover of snowfall from the windward slope to the leeward slope, but the impact is largely controlled by the synoptic-scale flow and available moisture. Guo et al. (2021) have indicated that increased aerosol number concentrations have less impact on snowfall at the initial period due to the lower supersaturation produced by the urban heat and dry island but increase snowfall in the later period due to higher supersaturation caused by the feedback of the cloud microphysics. Based on sensitivity simulations of a winter extreme mixed-phase storm, Pravia-Sarabia et al. (2023) have indicated that the total precipitation remains basically unchanged, with maximum changes of 5 % while the production of snow is largely altered.
Guanzhong Basin (GZB) is surrounded by the Loess Plateau to the northwest and Qinling Mountain to the south (Fig. 1). Due to fast-growing industries and city expansions, the aerosol loadings inside the basin have been elevated during the past 3 decades, particularly during wintertime (e.g., Bei et al., 2016a, b, 2017b). Aerosol effects on precipitation over the mountain area and inside the GZB have been investigated based on observational data at Mt. Hua's summit and its surrounding area (e.g., Rosenfeld et al., 2007; Yang et al., 2013a, b). Rosenfeld et al. (2007) have found that the precipitation at Mt. Hua in the south of GZB could be decreased by 30 % to 50 % during hazy conditions. Yang et al. (2013a, b) have further pointed out that the decreasing trend of precipitation is correlated well with deterioration of the air pollution at Mt. Hua and inside the GZB, supporting the hypothesis that both aerosol microphysical and radiative effects could reduce precipitation. Most recently, based on sensitivity simulations of a summertime short-term heavy rainfall event under different aerosol scenarios, Bei et al. (2025) have shown that the synergetic effect of ARIs and ACIs consistently decreases the precipitation both in the whole simulation domain and GZB with increasing aerosols, but ARIs play a more important role in the decreasing trend of the precipitation with deterioration of PM pollution as mentioned in Zhou et al. (2024).
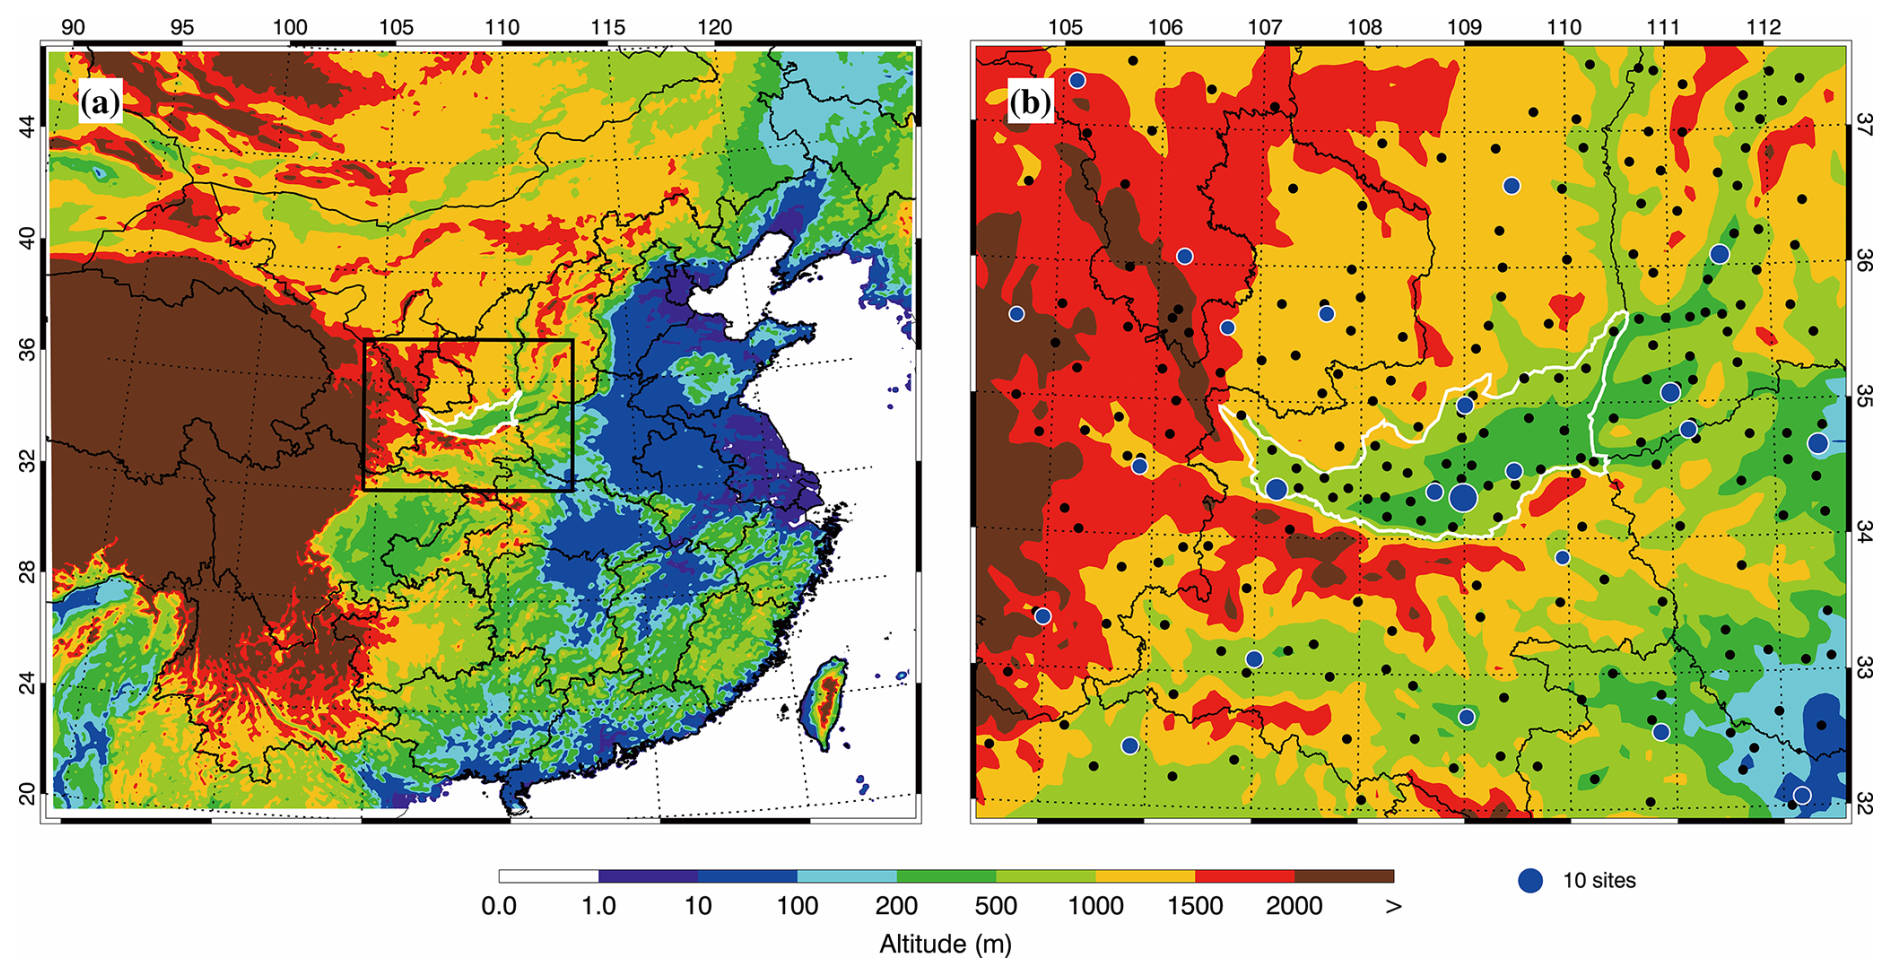
Figure 1(a) WRF-Chem simulation domain with topography and (b) Guanzhong basin (GZB) and its surrounding areas (GZBs). In (b), the black dots denote the meteorological sites with rain gauge and the blue dots denote centers of cities with air pollutants observations and the size of blue circles denotes the number of ambient monitoring sites of cities. The white contour outlines the GZB and the area outside of GZB in (b) is referred to as GZBs.
The present study aims to investigate the synergetic effects of ARIs and ACIs on a snowfall event occurred in the GZB and GZB surrounding areas (GZBs) using a fully coupled cloud-resolving WRF-Chem model. The model and experiment design are described in Sect. 2. The main results and discussion are presented in Sect. 3. The conclusions are given in Sect. 4.
2.1 WRF-Chem model configuration and experimental design
A specific version of WRF-Chem model, incorporating original contributions by Grell et al. (2005) and modifications by Li et al. (2010, 2011a, b, 2012), is employed to investigate the impact of anthropogenic aerosols on a snowfall event occurred in the GZB and GZBs from 26 to 28 January 2022. We use Goddard shortwave module developed by Chou and Suarez (1999) and Chou et al. (2001) to consider the ARIs. The ACIs are evaluated using a two-moment bulk microphysics scheme developed by Morrison et al. (2009). Detailed model description of the WRF-Chem model, including the aerosol radiative module to calculate aerosol optical properties and the aerosol microphysical module to consider activation of aerosols to CCN and IN, can be found in the Supplement (SI, Sects. S1–S3).
The model is configured with one domain using the grid spacing of 6 km for a total of 500×500 grid points in the east-west and south–north directions, respectively, and the domain is centered at Xi'an (34.25° N, 109° E) (Fig. 1a). Figure 1b shows the study area, which is divided into two parts: GZB and its surrounding areas (GZBs). We use GZB + GZBs to represent the study area. The vertical direction is divided into 35 layers extending from the surface to 50 hPa, with a stretched vertical grid spacing ranging from 30 m near the surface, to 500 m above 2.5 km to achieve a finer vertical resolution within the planetary boundary layer. The meteorological initial and boundary conditions are derived from 6-hourly 1°×1° NCEP-FNL (National Centers for Environmental Prediction final operational global gridded analysis). The chemical initial and boundary conditions are interpolated from the 6 h output of a global chemical transport model for ozone and related chemical tracers (MOZART) (Horowitz et al., 2003).
The model is integrated for a 126 h period from 12:00 UTC 23 January to 18:00 UTC 28 January 2022 and the simulations from 16:00 UTC 25 January to 16:00 UTC 28 January 2022 are analyzed. In order to examine the effect of aerosols with different concentrations on the 3 d snowfall event, we first change the atmospheric aerosol concentrations via scaling the anthropogenic emissions of all species in the model. A set of 19 anthropogenic emission scale factor (AESF) is used in sensitivity simulations, ranging from 2−3 to 23 with an exponential increasing step of 1/3 (Table S2). It is worth noting the use of a wide range of AESFs might not represent realistic emission-control scenarios. In the study, the main purpose of applying a wide range of AESFs is to systematically explore the nonlinear responses of aerosol–cloud–precipitation interactions across aerosol environments ranging from relatively clean to heavily polluted conditions. Wintertime PM2.5 concentrations in northern China exhibit substantial variability associated with haze development, boundary-layer evolution, and unfavorable meteorological conditions, often varying by more than one order of magnitude between clean and polluted periods (Li et al., 2021). In the GZB, frequent severe winter haze events have been reported under stagnant meteorological conditions and complex basin topography, with PM2.5 concentrations commonly exceeding 200–300 µg m−3 during polluted episodes (Bei et al., 2017b). As shown in Fig. S1 in the Supplement, the average wintertime [PM2.5] have decreased from about 160 µg m−3 in 2013 to 65 µg m−3 in 2026 in response to emission-control measures, highlighting the large variability of aerosol loading in this region. Therefore, the selected AESF range is designed to span the observed variability of aerosol conditions and to identify potential threshold and nonlinear behaviors of ARIs and ACIs under different pollution regimes. Then we design two groups of experiments to verify the contribution of ARIs, ACIs and the both to precipitation. In the first group sensitivity simulations, both ARIs and ACIs are considered with the AESF ranging from 2−3 to 23 (hereafter referred as to F_BASE). The second group of sensitivity simulations is the same as the F_BASE, but the ARI effect is not considered (hereafter referred as to F_ARI0). In the F_ARI0 experiment, the aerosol effect on solar radiation is not considered in the shortwave radiation transfer module in the WRF-Chem model, such that aerosols no longer modify atmospheric heating rates and further influence meteorological fields. The model setup is the same for all experiments, except for the anthropogenic emission amplitude and the option of ARIs (on or off). In the F_BASE, the member with the AESF of 1.0 is referred to as the benchmark simulation (CTRL), which is used to validate the model performance.
2.2 Model validation and statistical metrics
Hourly precipitation observational data for the GZB and GZBs stations are provided by the China Meteorological Administration (CMD) service center (http://data.cma.cn/, last access: 3 January 2026), and hourly observations of PM2.5, O3, NO2, and SO2 are released by the Ministry of Ecology and Environment of China. Three statistical metrics, including the normalized mean bias (NMB), root mean square error (RMSE), and the index of agreement (IOA) are used to evaluate the model performance. The population mean (p-mean hereinafter) of a given variable across all qualified grid points is applied to verify the general impact of aerosols on cloud properties. Detailed description about NMB, RMSE, IOA and p-mean can be found in Sect. S4.
3.1 Snowfall event overview
A heavy snowfall event occurred from 26 to 28 January 2022 is investigated in GZB + GZBs, with the total precipitation of 6.4 mm, and the maximum daily precipitation of 2.3 mm is on 28 January. Meanwhile, despite the occurrence of the snowfall event, the observed near-surface PM2.5 concentrations ([PM2.5]) are still high during 36 d, with the average of 108.5 and 74.1 µg m−3 in GZB and GZBs, respectively. The snowfall event is basically the result of the interaction between the northerly cold air and southerly and easterly warm air in low-level atmosphere, as a cold front system proceeds from the North China (25 January) to the south-east (26–27 January) and then south-west direction (28 January) mainly along the coast (Fig. S2). GZB + GZBs is located to the southwest (25 January), the west (26 January) and the northwest (27–28 January) side of the cold front, which is not the main area of the precipitation that occurred near the cold front. During 26 to 28 January, there is clear evidence of weak cold air incursion in the GZB + GZBs at 925 hPa (Fig. S2a–c). At 850 and 700 hPa (Fig. S2d–i), the weak cyclonic wind shear and positive vorticity are maintained in the GZB during the event. At 500 hPa (Fig. S2j–l), GZB + GZBs is situated in the front of a very shallow trough, which is favorable for the development of low-level convergence, and eventually leads to the snowfall event in this area. The low-level water vapor is brought to the snowfall area mainly by the southwesterly and easterly airflow from Bay of Bengal and the South China Sea. The snowfall event lasts approximately 72 h from 00:00 LT 26 January to 00:00 LT 29 January 2022. The observed hourly snowfall rate (Fig. 4) shows a multi-peak structure, with the maximum instantaneous rate reaching ∼0.21 mm h−1 around 12:00 LT 28 January. The majority of the precipitation at the surface is in the form of snow, as the near-surface temperature during the event remains between −4 and 0 °C (Fig. S3). Despite the continuous snowfall, the observed PM2.5 concentrations ([PM2.5]) remain high, with an average of 108.5 and 74.1 µg m−3 in GZB and GZBs (Fig. 2a), respectively, providing a unique polluted environment to investigate aerosol-snowfall interactions.
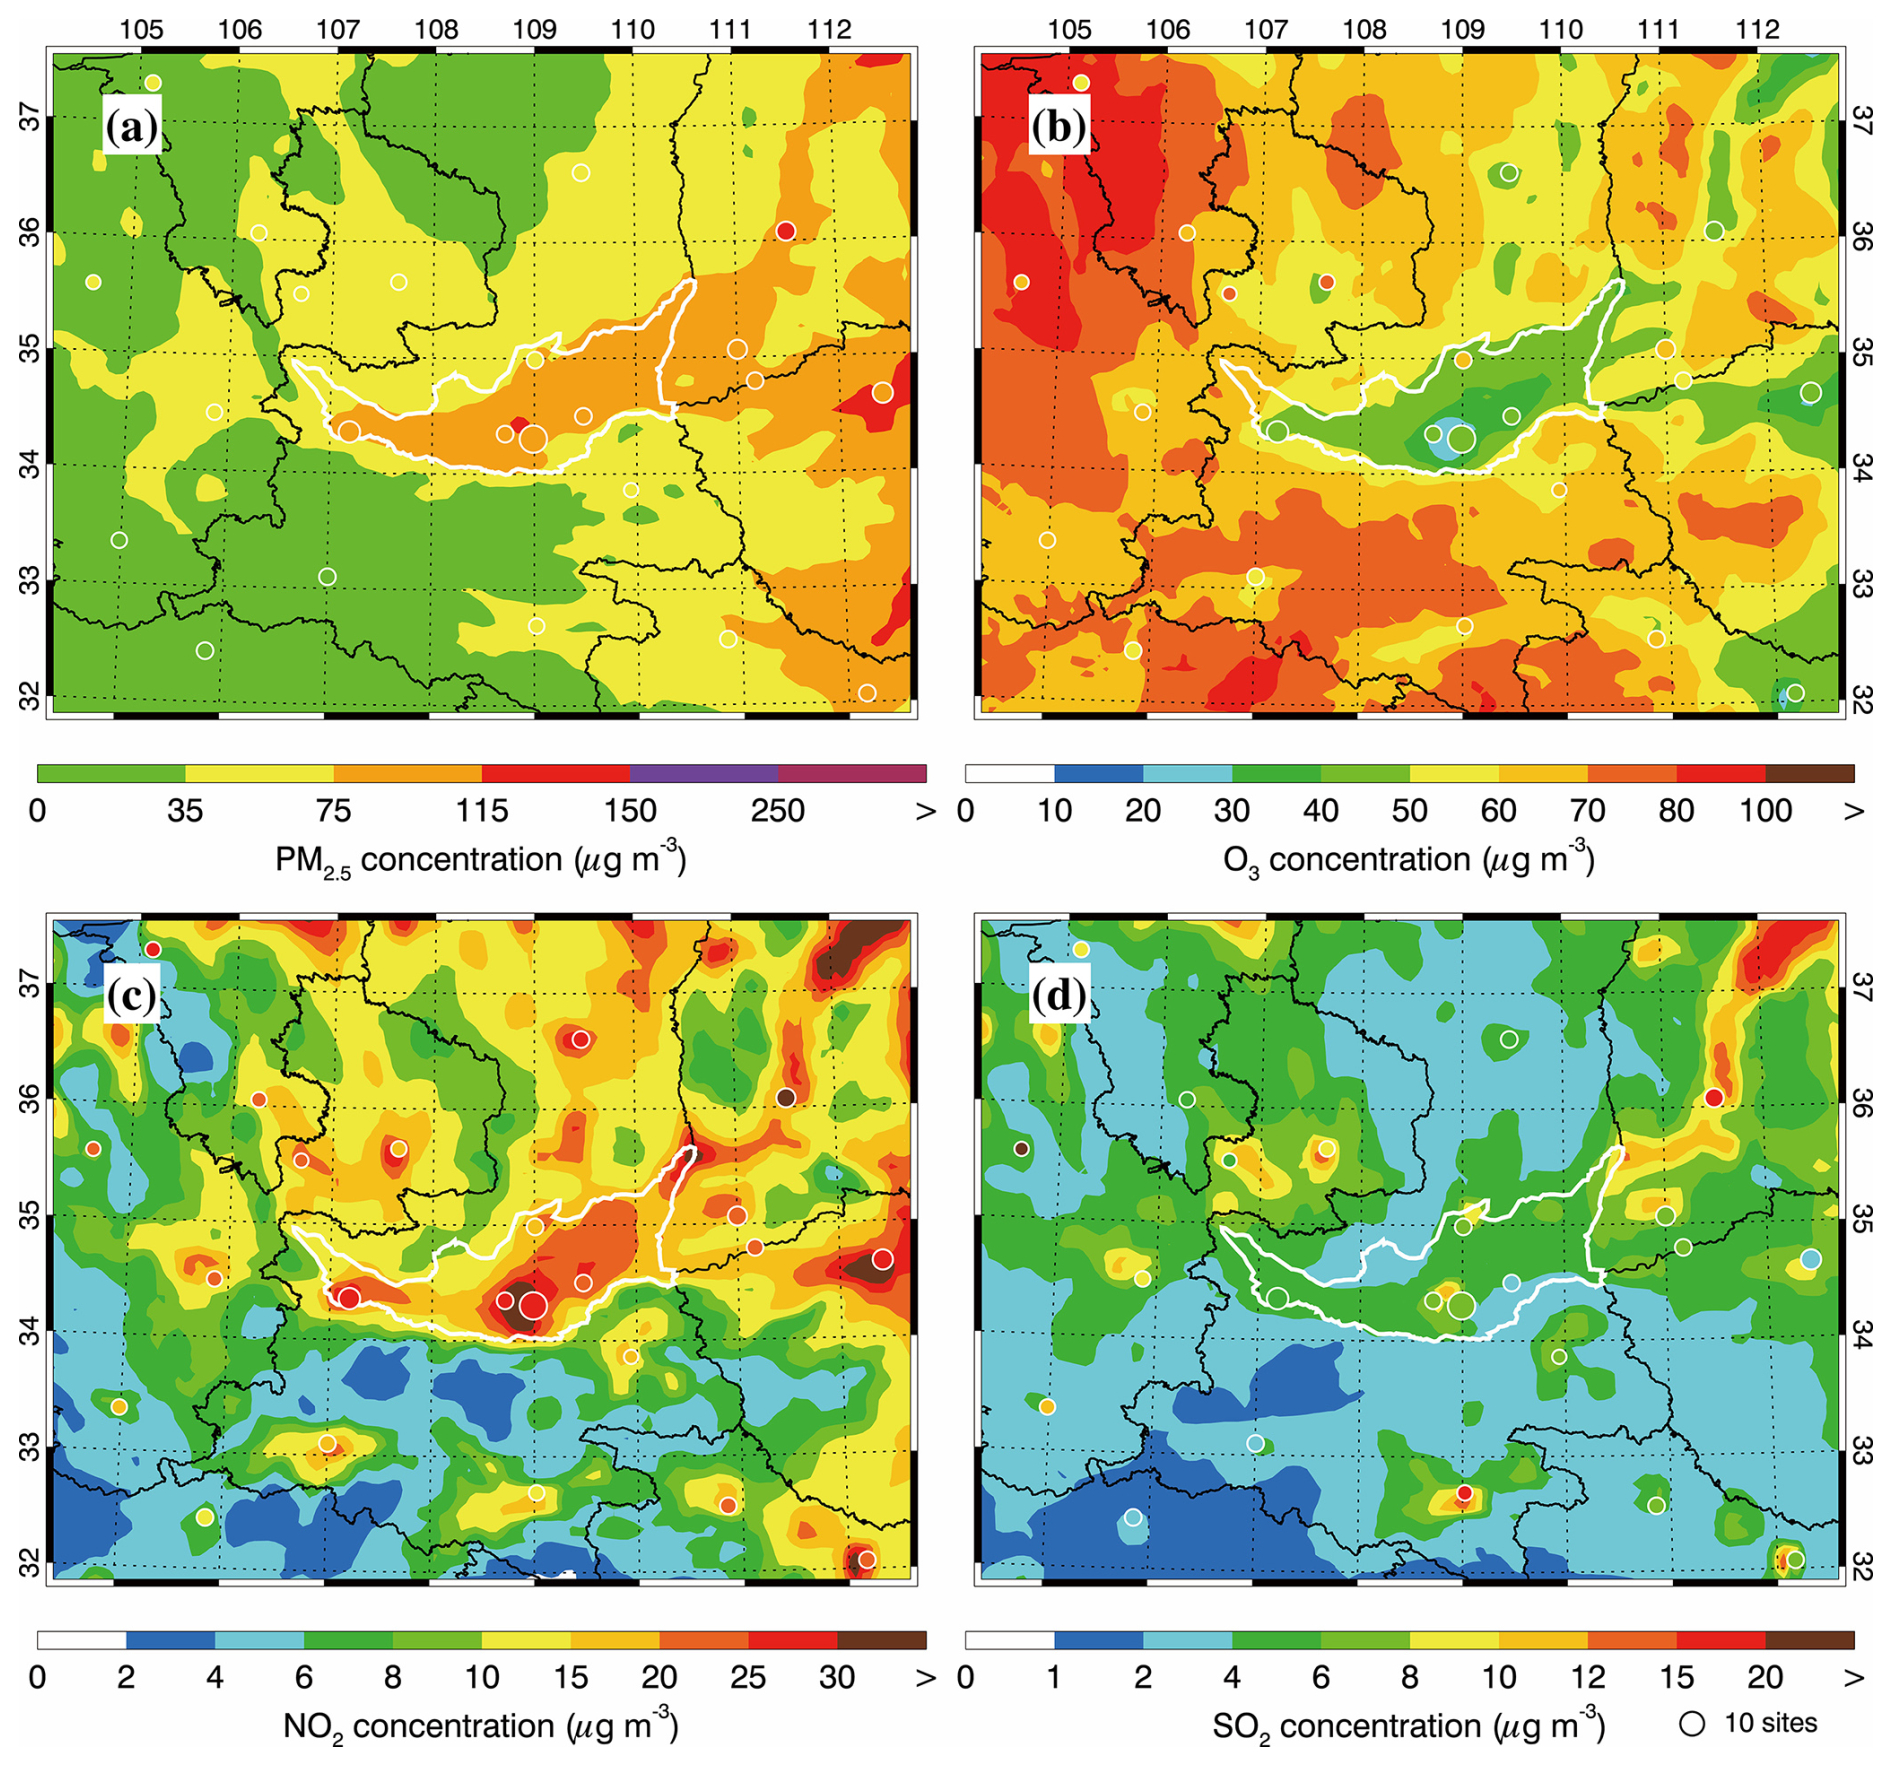
Figure 2Pattern comparisons of simulated (color counters) vs. observed (colored dots) average near-surface mass concentrations of (a) PM2.5, (b) O3, (c) NO2 and (d) SO2 from 26 to 28 January 2022. The white contour outlines the GZB and the area outside of GZB in panels is referred to as GZBs.
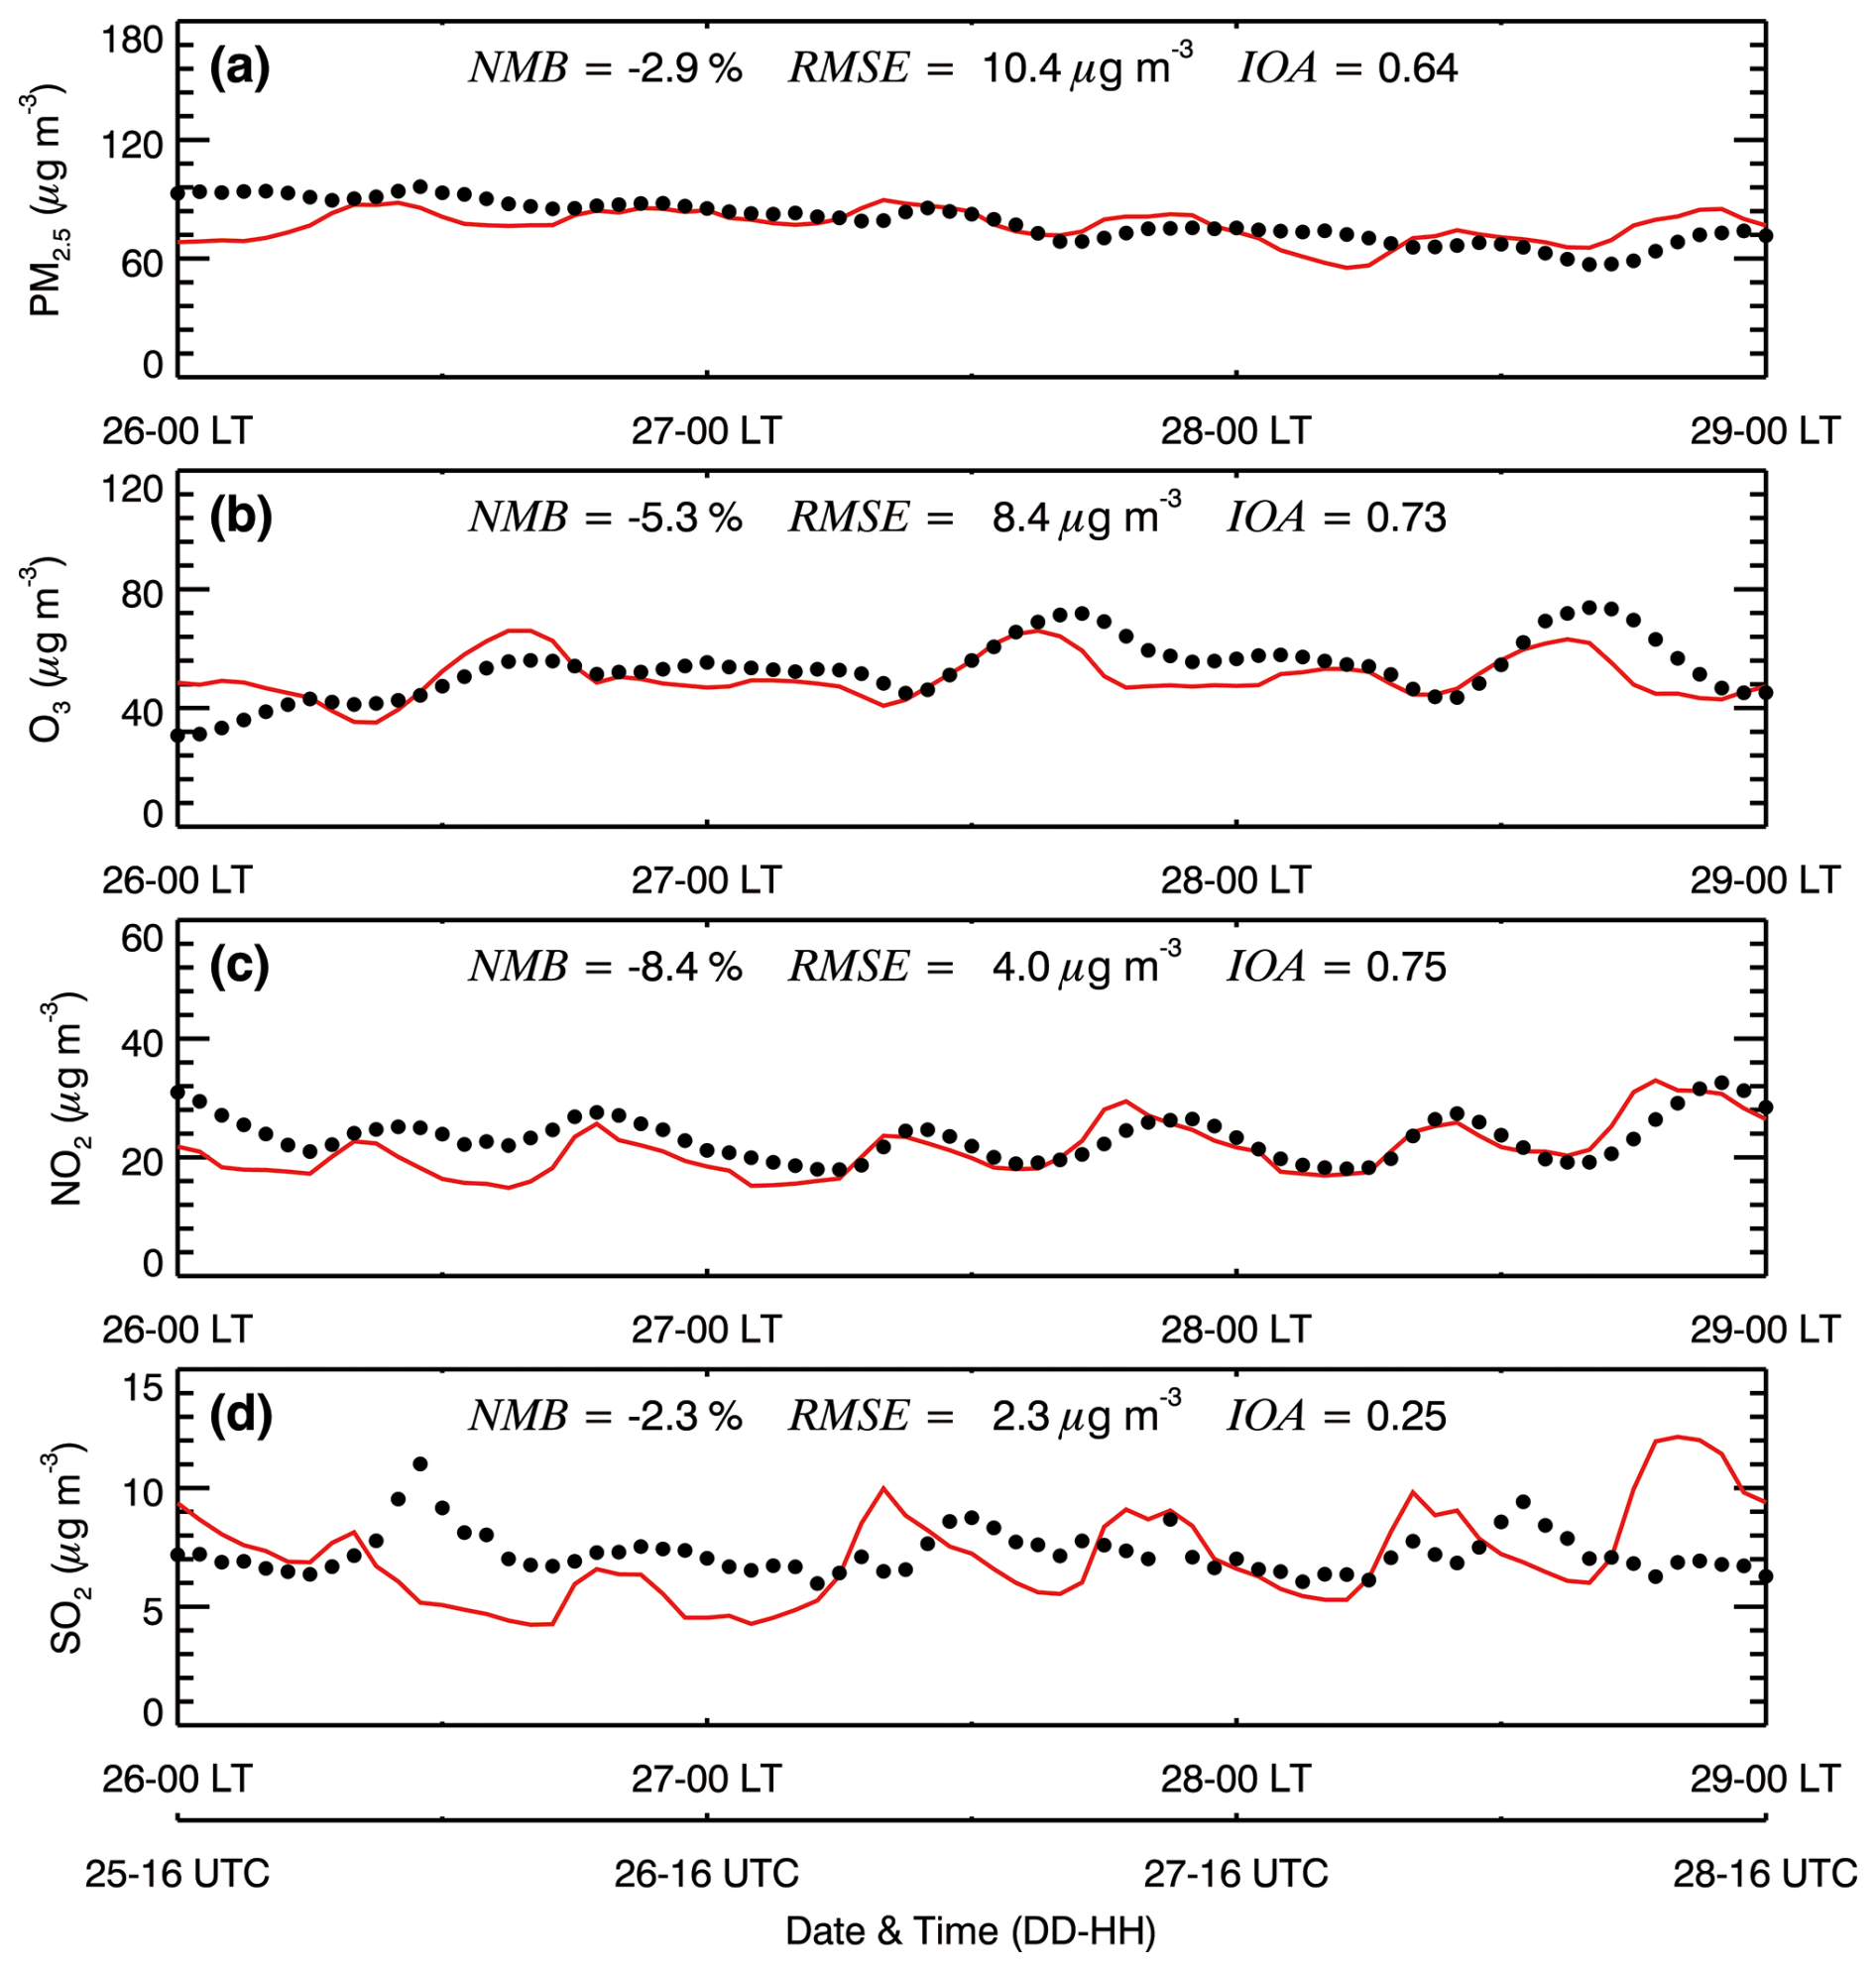
Figure 3Comparison of observed (black dots) and simulated (solid red lines) diurnal profile of near-surface hourly mass concentrations of (a) PM2.5, (b) O3, (c) NO2, and (d) SO2 averaged at monitoring sites in GZB + GZBs from 26 to 28 January 2022.
3.2 Model evaluations
Figure 2 shows the pattern comparison of simulated PM2.5, O3, NO2, and SO2 concentrations averaged during the study period with observations at monitoring sites in GZB and GZBs. The model generally reproduces the spatial distribution of air pollutants when comparing to observations. The simulated [PM2.5] are generally more than 75 µg m−3 in the GZB, but the SO2 level is not high in GZB and GZBs, less than 20 µg m−3. The model tends to underestimate O3 and overestimate NO2 concentrations in the GZB when comparing to observations. During wintertime, near-surface O3 concentrations are strongly influenced by NO titration effects, and the overestimation of NO2 concentrations might partly contribute to the underestimation of O3 concentrations in the simulations. The NO2 overestimation might be associated with uncertainties in the anthropogenic emission inventory or PBLH simulations. Figure 3 presents the simulated and observed time series of average hourly mass concentrations of PM2.5, O3, NO2, and SO2 at monitoring sites in the GZB + GZBs from 26 to 28 January 2022. The model reasonably simulates the temporal variation of PM2.5, O3, and NO2 concentrations, with the IOA exceeding 0.60. However, the model does not show good performance in simulating the SO2 temporal variation, with an IOA of 0.25. The larger discrepancy for SO2 mainly results from the sensitivity of point-source SO2 simulations to meteorological uncertainties. The transport and dispersion of SO2 from point sources (i.e., power plants and industrial facilities) are highly sensitive to the accuracy of simulated wind fields (Hu et al., 2022). In the GZB, complex terrain and weak synoptic forcing further increase the uncertainty in meteorological simulations (Bei et al., 2017b). Additionally, parameterizations of SO2 oxidation, including aqueous-phase and heterogeneous pathways, under the persistent high-RH conditions during this snowfall event also introduces further uncertainties (Travis et al., 2025). In general, the model slightly underestimates the air pollutants concentrations against observations, with the NMB ranging from −8.4 % to −2.3 %. These underestimations may partly result from uncertainties in anthropogenic emissions, meteorological fields, and chemical or physical parameterizations in the model, which can influence air pollutant accumulation and secondary formation processes during wintertime (Bei et al., 2017a; Cheng et al., 2021; Li et al., 2025).
Figure 4 provides the temporal variation of precipitation rates averaged at meteorological sites in GZB + GZBs from 26 to 28 January. The model generally reproduces the temporal evolution of the observed hourly precipitation, with NMBs of −3.3 %, −7.4 %, and −1.3 % and IOAs of 0.85, 0.75, and 0.78 over GZB + GZBs, GZB, and GZBs, respectively. The observed five rainrate peaks are successfully reproduced in all regions, but the underestimation of the first and fifth rainrate peak is considerable in GZB + GZBs. Compared with GZB, the model exhibits better overall performance in GZBs, while a larger underestimation is found over GZB during periods of intense precipitation. These underestimations are likely related to the model's sensitivity to initial conditions and its performance during the spin-up and decay stages of the event, respectively, especially given that the precipitation occurs on the periphery of the cold front where large-scale forcing is weak (Liu et al., 2019; Lin et al., 2023). Additionally, the model also produces higher light precipitation during 27–28 January compared to the observations. As shown by Liu et al. (2024), the lack of a shallow convection scheme at gray-zone resolutions (i.e., 6 km) allows excessive lowlevel moisture to accumulate and prematurely convert to light precipitation under stratiform conditions. These localized discrepancies do not compromise the model's overall performance. The pattern comparison of the 3 d accumulative precipitation over the GZB + GZBs is shown in Fig. 5. The model generally replicates the precipitation distribution compared to the observations (Fig. 5a). For all stations in GZB + GZBs, the simulated accumulated precipitation agrees reasonably well with observations, with an NMB of −3.7 % and an IOA of 0.85 (Fig. 5b). When evaluated separately, the model yields NMBs of −10.2 % and −1.3 % over GZB and GZBs, respectively, indicating that the underestimation is mainly concentrated within the basin region. Nevertheless, the relatively high IOAs of 0.89 and 0.85 over GZB and GZBs suggest that the model adequately captures the spatial variability of precipitation in both regions.
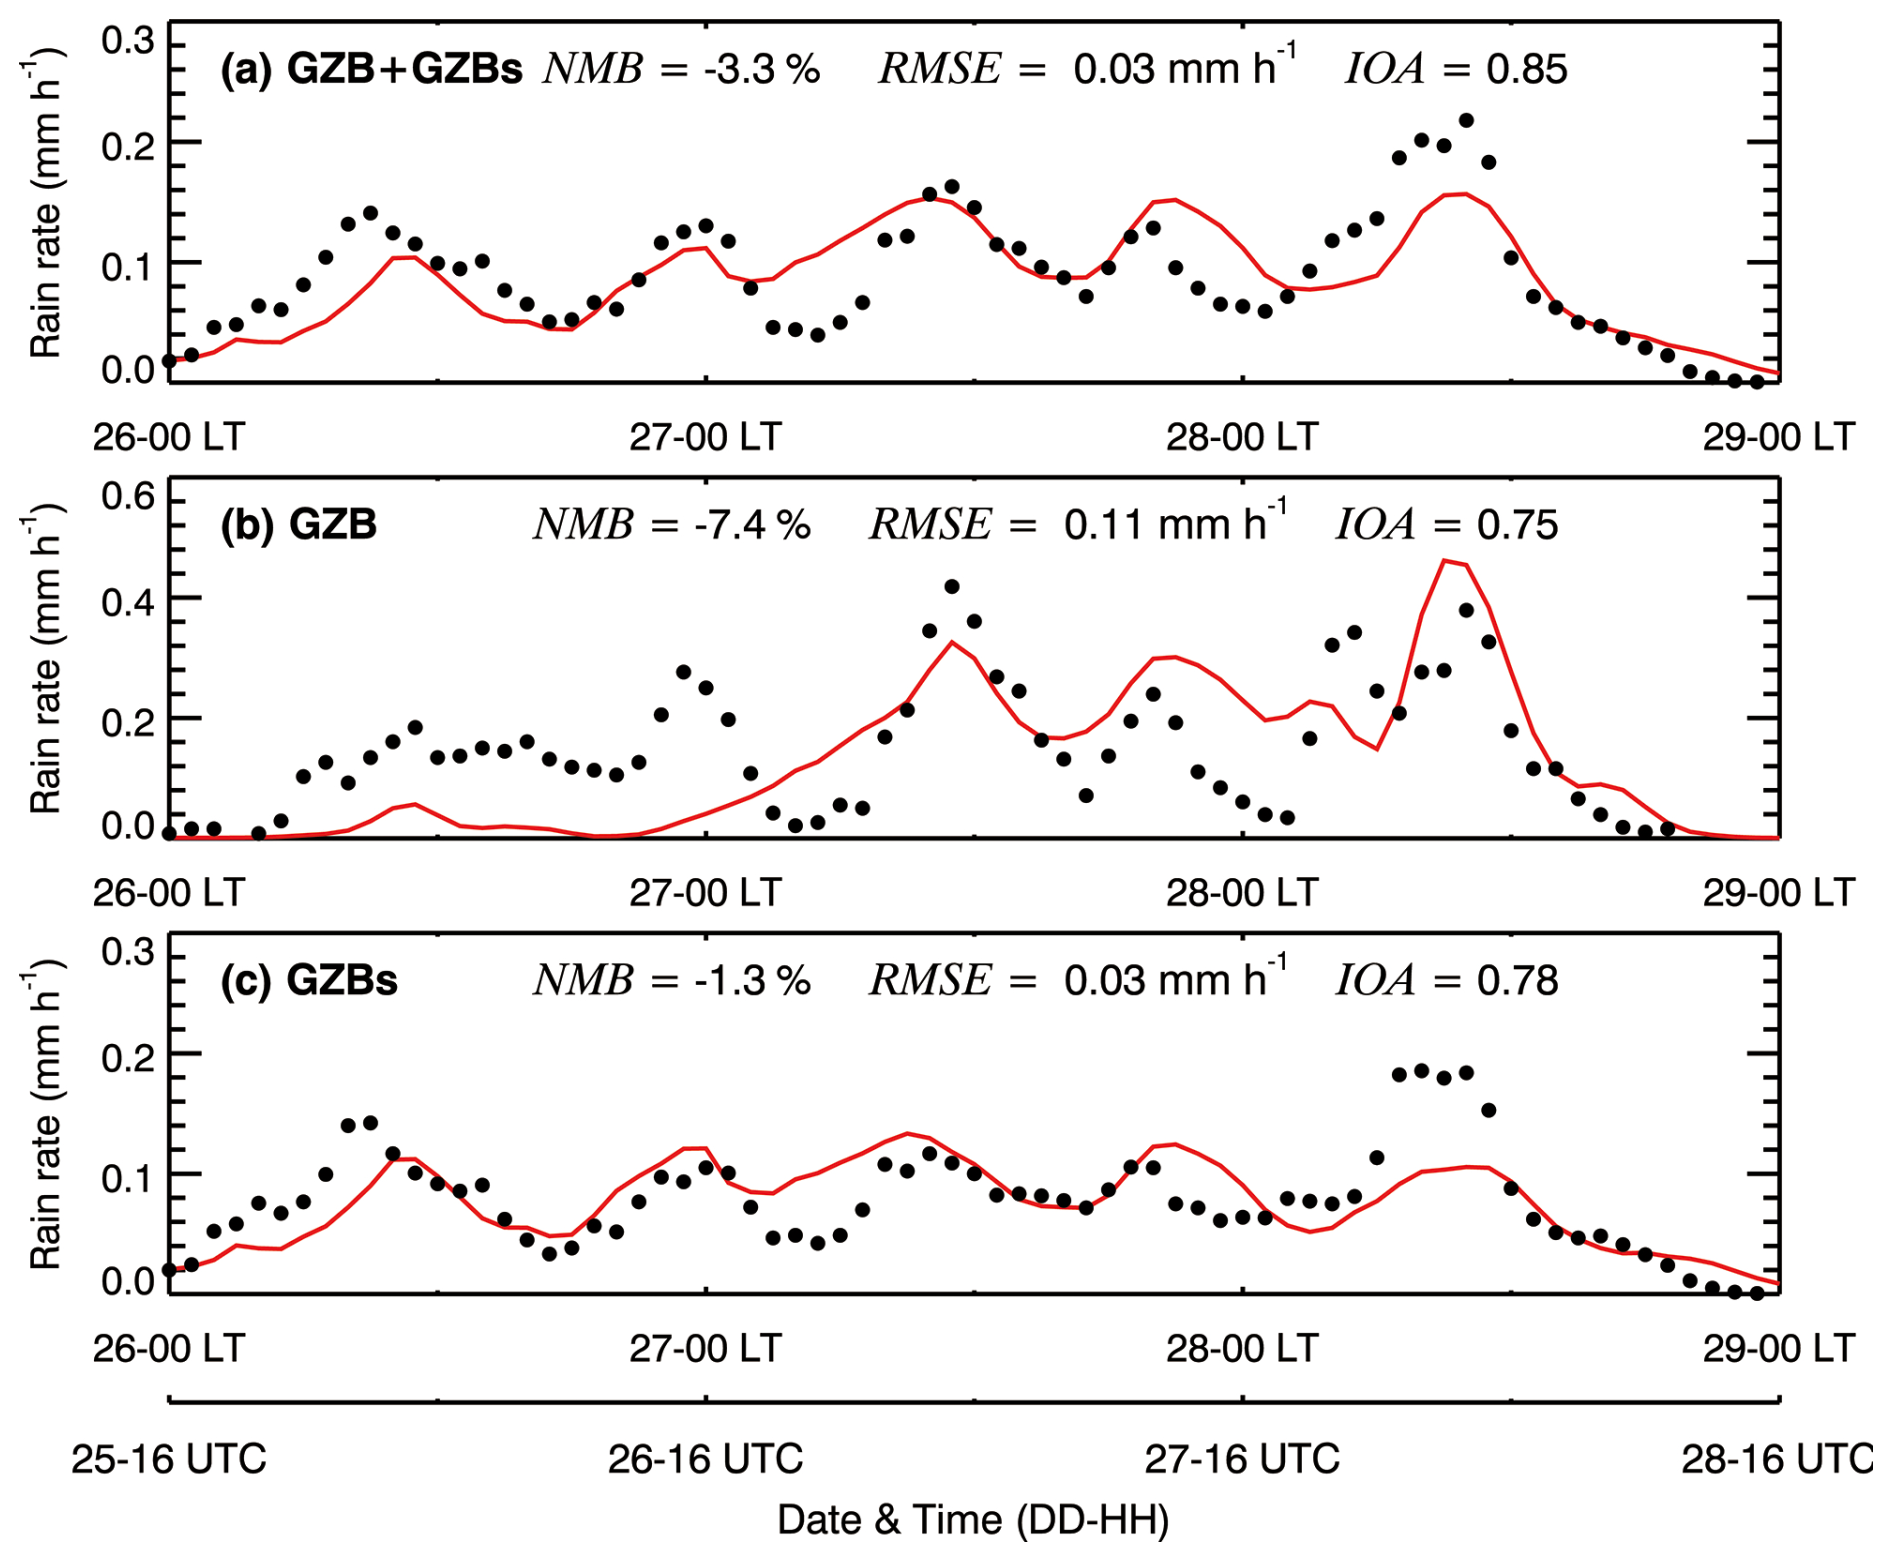
Figure 4Comparison of observed (black dots) and simulated (solid red lines) diurnal profile of hourly rain rate averaged at monitoring sites in (a) GZB + GZBs, (b) GZB, and (c) GZBs from 26 to 28 January 2022.
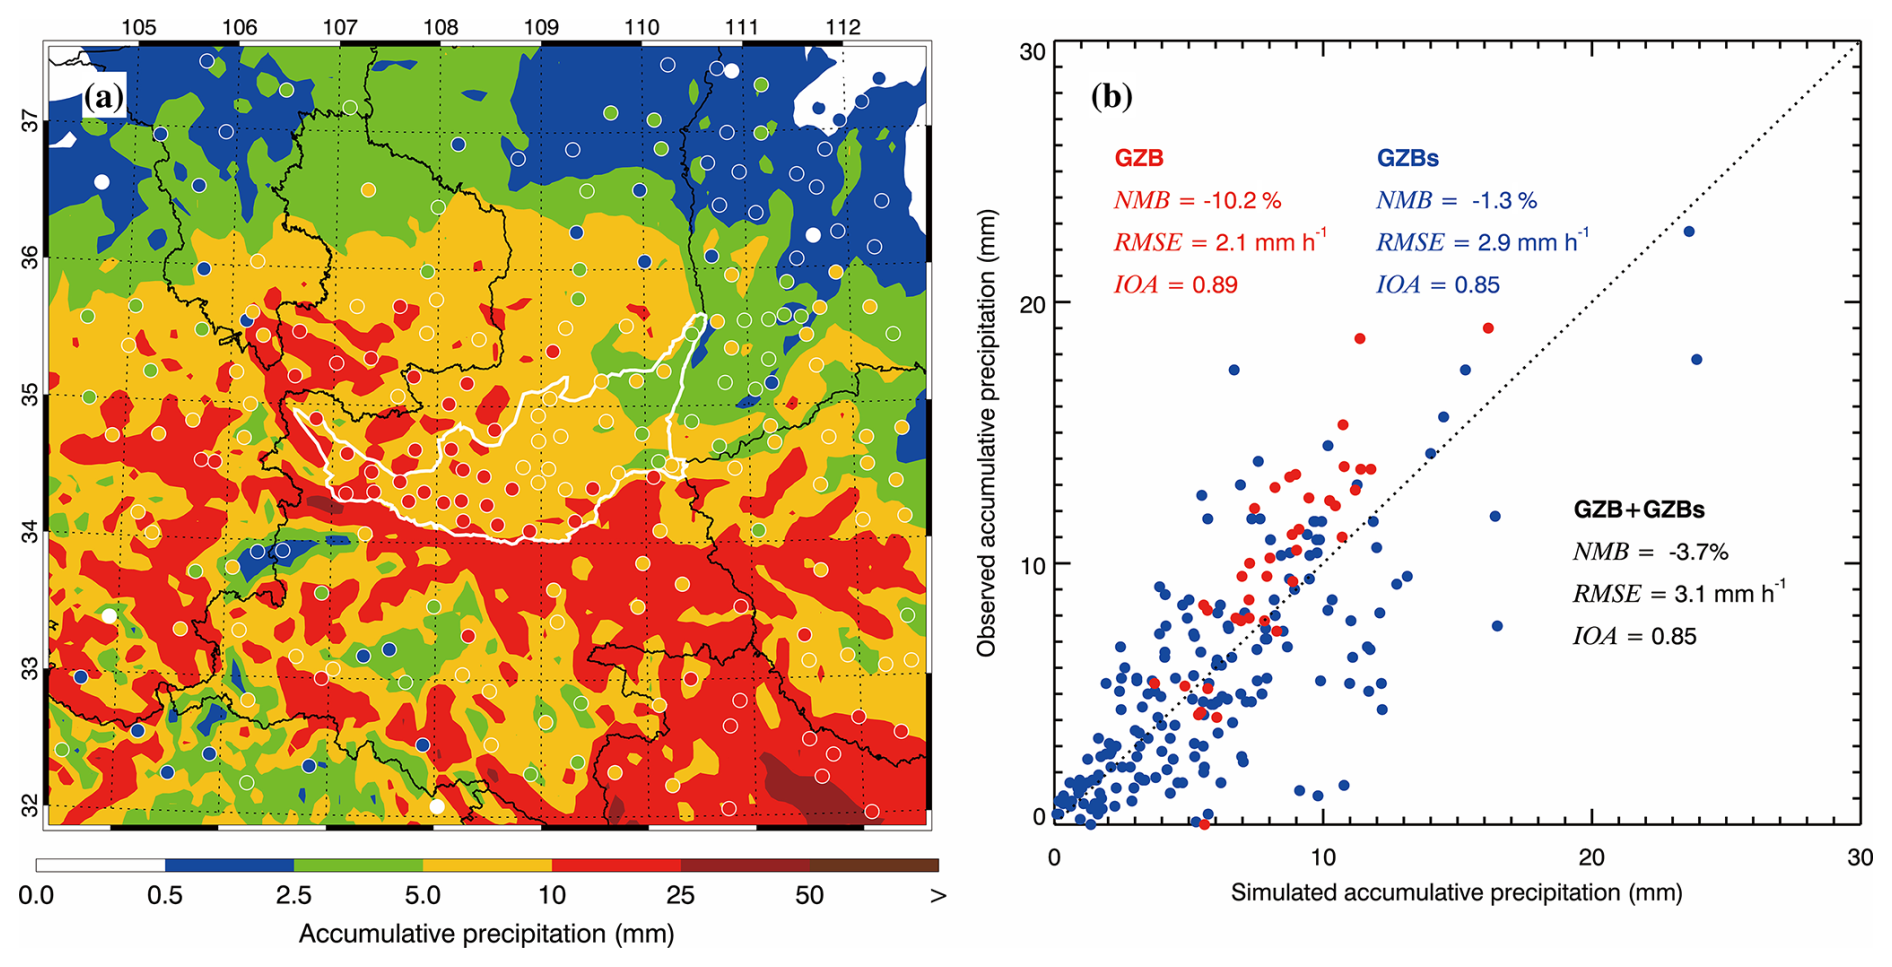
Figure 5(a) Pattern comparisons of simulated (color counters) vs. observed (colored dots) accumulative precipitation, and (b) scatter plot of simulated and observed accumulative precipitation in GZB, GZBs, and GZB + GZBs from 26 to 28 January 2022. The white contour outlines the GZB, and the area outside of GZB in (a) is referred to as GZBs.
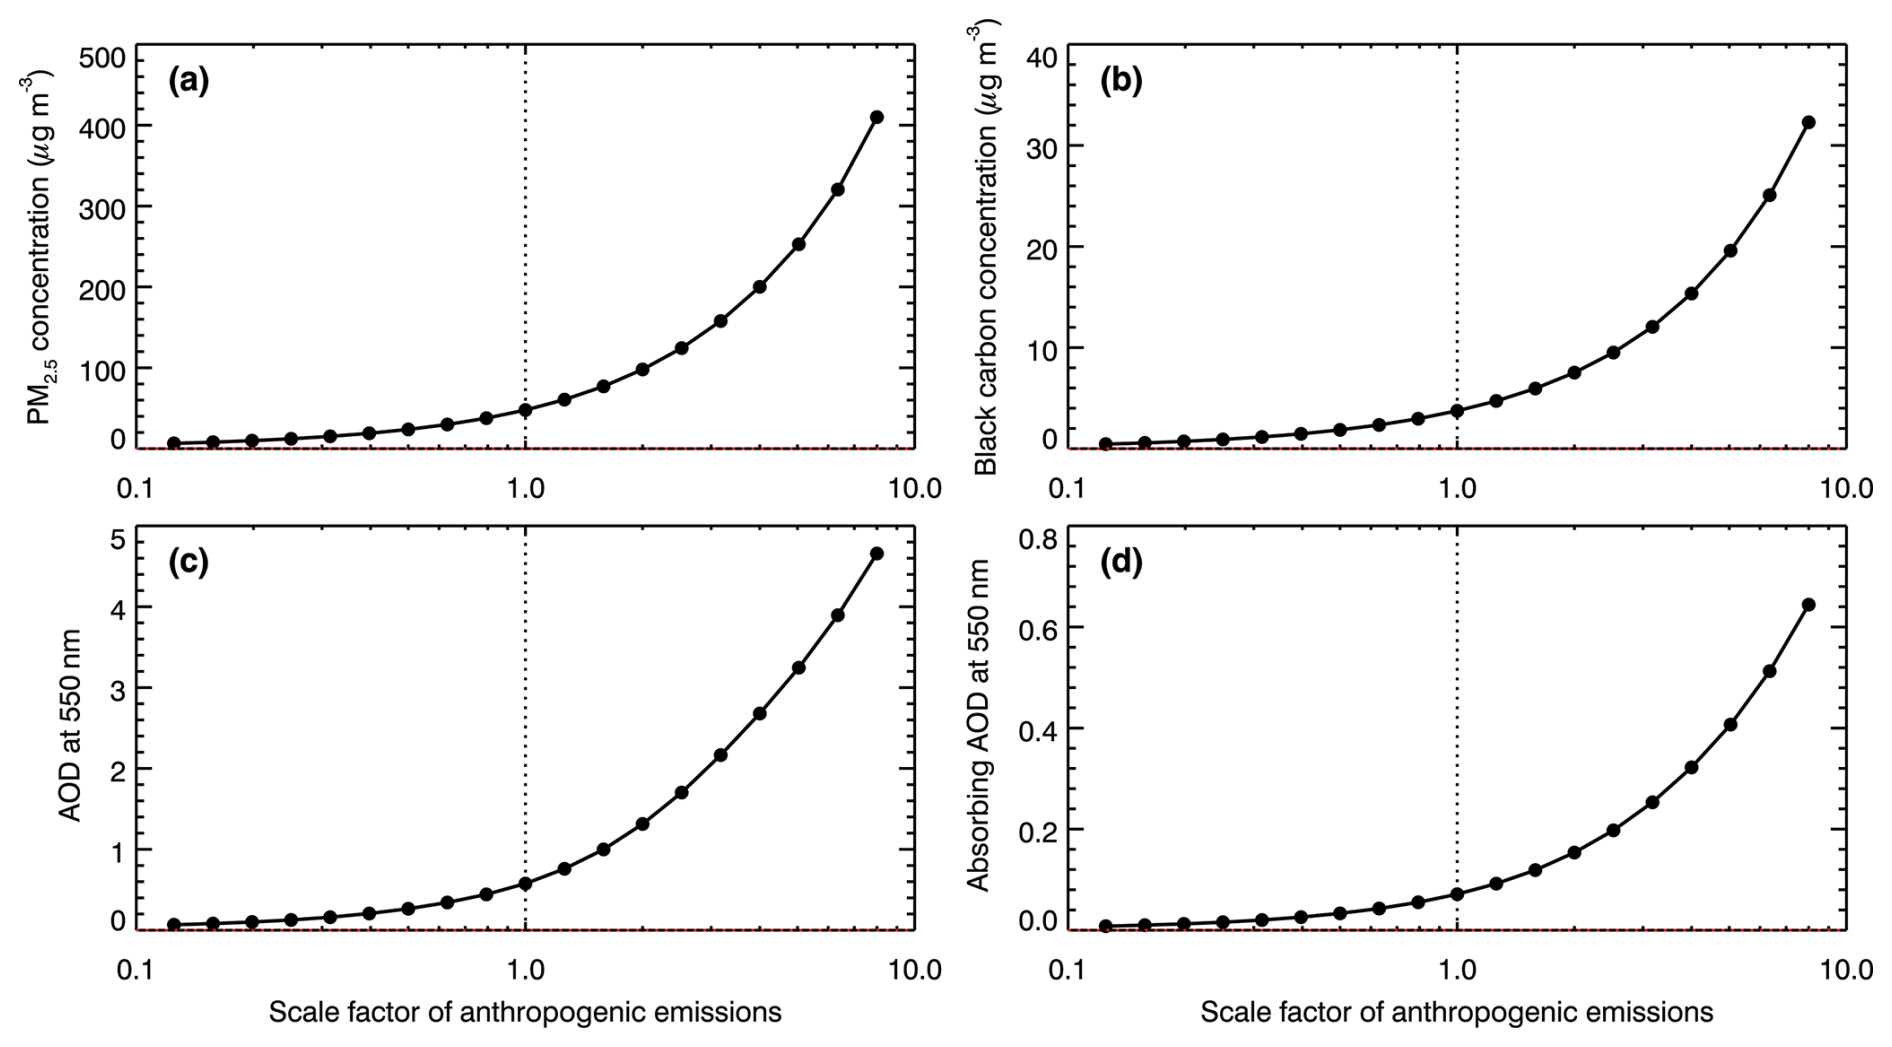
Figure 6Average (a) near-surface PM2.5, (b) black carbon mass concentration, (c) AOD at 550 nm, and (d) absorbing AOD at 550 nm in GZB + GZBs from 26 to 28 January 2022, as a function of the scale factor of anthropogenic emissions.
3.3 Effects of ARIs on meteorological fields in GZB + GZBs
Figure 6a and b provides the variation of [PM2.5] and black carbon concentrations ([BC]) averaged in the GZB + GZBs during the study period with increasing AESF. [PM2.5] and [BC] generally increase with increasing AESF linearly. The ARI effect tends to hinder development of planetary boundary layer (PBL) and decrease the PBL height (PBLH), increasing the near-surface concentration of air pollutants. Sensitivity results show that when the AESF increases from 0.125 to 8.0, the PBLH in GZB + GZBs decreases from approximately 450 to 300 m, a reduction of about 34 % based on model output statistics (see Table S2 for detailed values). The quasi-linear relationship between [PM2.5] and AESF reflects that the variation of [PM2.5] with the AESF is mainly influenced by the emission of primary aerosols and the precipitation change caused by ARIs and ACIs. In addition, it is worth noting the decreased PBLH is also favorable for the formation of secondary aerosols, including sulfate, nitrate, ammonium, and secondary organic aerosol (SOA). However, secondary aerosols are generally water-soluble, and easily removed by wet deposition or activated to form cloud droplets. The aerosol optical depth (AOD) and absorbing AOD show the similar increasing relationship with the AESF in GZB + GZBs as that of [PM2.5] and [BC]. The average AOD and AAOD at 550 nm in GZB + GZBs are 0.58 and 0.071 in the CNTL case, respectively, and the single scattering albedo at 550nm is about 0.88, indicating a moderately absorbing component within an otherwise scattering-dominated aerosol population over GZB + GZBs.
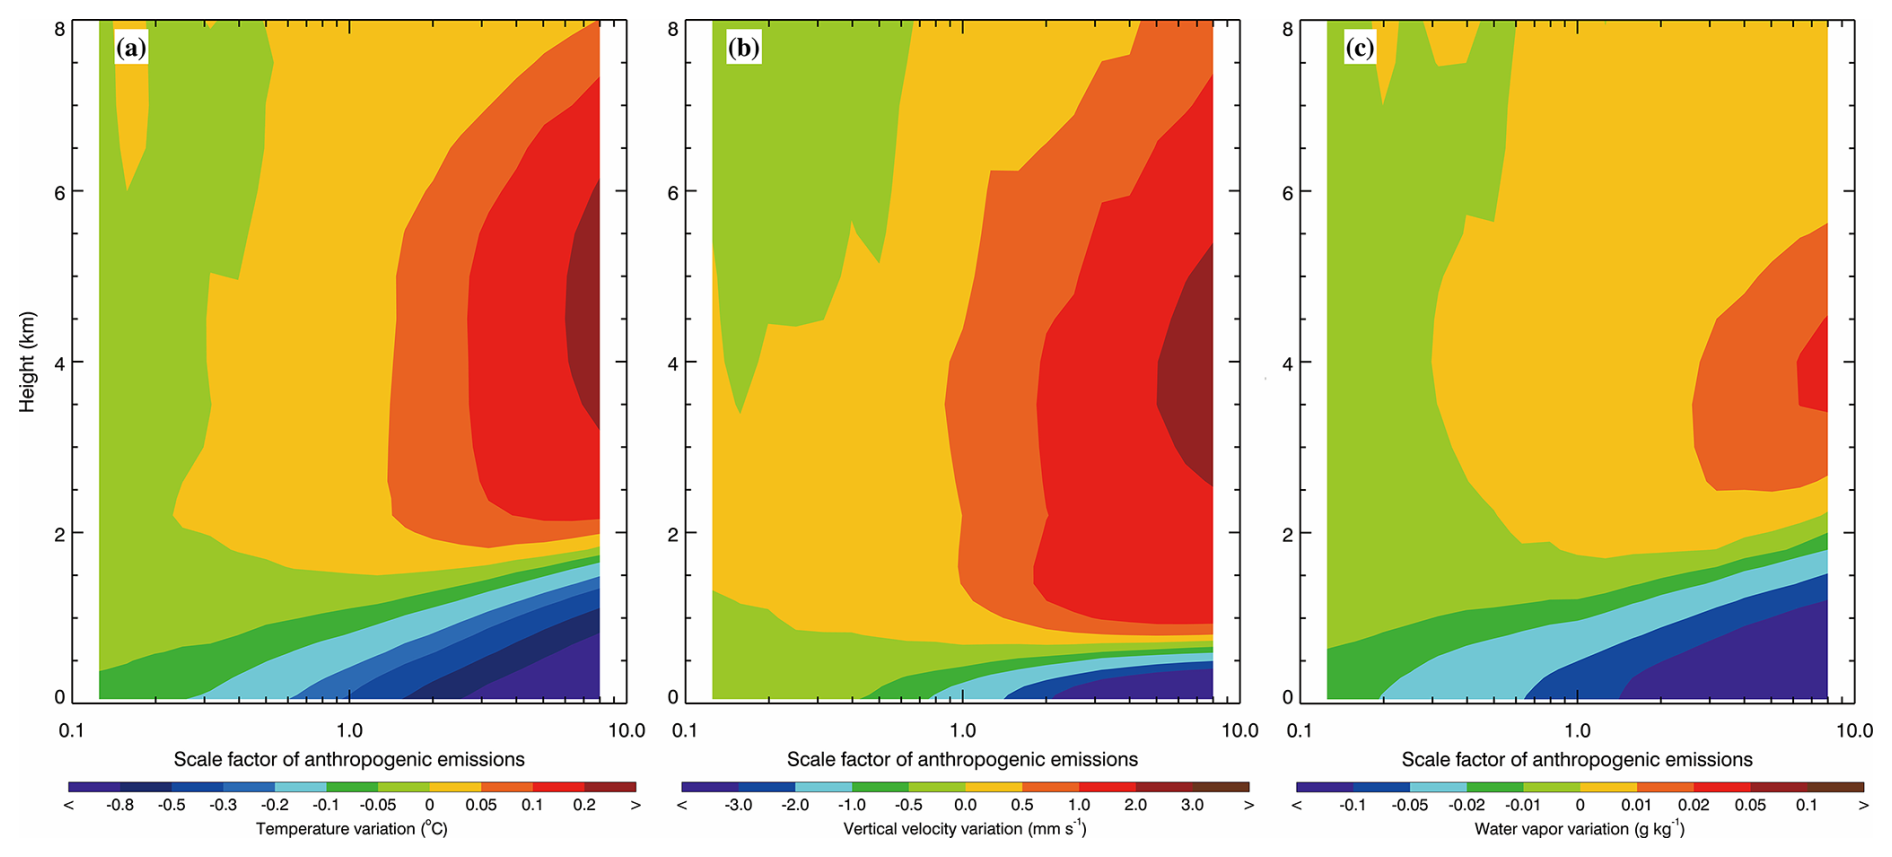
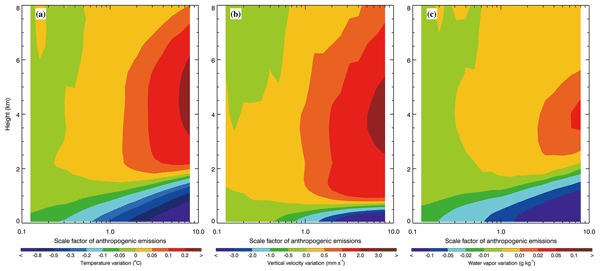
Figure 7Profile variation of average (a) air temperature, (b) vertical velocity, and (c) water vapor over GZB + GZBs from 26 to 28 January 2022 caused by ARIs, as a function of the scale factor of anthropogenic emissions.
ARIs include direct scattering and/or absorbing of incident solar radiation by atmospheric aerosols and the induced adjustments of the surface energy budget, thermodynamic profile and cloudiness (IPCC, 2013). Therefore, aerosols in the atmosphere reduce the solar radiation down to the Earth surface and further sensible heat flux to the atmosphere, lowering the temperature of low-level atmosphere. Furthermore, light-absorbing aerosols also heat the atmosphere. Figure 7a shows the effect of ARIs on the temperature profile averaged in GZB + GZBs during the study period by differentiating the F_BASE and F_ARI0 under various aerosol conditions. It should be noted that the temperature anomalies shown in Fig. 7a represent the total atmospheric response to ARIs, including both the direct aerosol radiative forcing and the subsequent dynamical adjustments, such as changes in vertical motion, heat transport, and boundary-layer mixing. ARIs decrease the air temperature of the low-level atmosphere, and the air temperature decrease is mainly concentrated below 1.8 km and becomes increasingly significant with decreasing height or increasing AESF (Fig. 7a). Previous studies have reported that absorbing aerosols cause a warming effect above the PBL (Ding et al., 2016; Gao et al., 2016; Wilcox et al., 2016; Wu et al., 2025). Consistent with these studies, the ARI-induced temperature response in the present simulation is characterized by cooling below approximately 1.8 km and weak warming aloft (Fig. 7a). The lower-atmospheric cooling is mainly caused by reduced surface solar radiation which decreases the surface sensible heat, whereas the elevated warming is associated with aerosol absorption. The resulting thermal contrast enhances lower-tropospheric stability and suppresses turbulent mixing. Consequently, the average PBLH over GZB + GZBs decreases from about 450 to 300 m with the AESF increasing from 0.125 to 8.0 in the F_BASE, but the warming layer is generally above 1.8 km and can extend to 7–8 km with the AESF exceeding 0.5. It is worth noting that the vertical distribution of aerosol-induced heating does not necessarily coincide with the vertical distribution of absorbing aerosols. As discussed by Wu et al. (2025), radiative heating depends not only on aerosol loading but also on the vertical structure of radiative fluxes, aerosol optical properties, and air density, particularly as well as the decreased surface sensible heat. Therefore, the weak warming above approximately 1.8 km shown in Fig. 7a should be interpreted as the integrated response of aerosol–radiation interactions rather than a direct reflection of aerosol concentration at a given altitude. During the study period, the profile of vertical velocity shows occurrence of downdraft within the PBL and updraft above the PBL (Fig. S4a). The cooling effect of ARIs within the near-surface atmosphere induces a downward motion and meanwhile an upward motion is generated above the PBL, which is resulted from the warming effect caused by absorbing aerosols and enhanced convergence by the ARI-induced downward motion (Fig. 7b). The vertical velocity response shown in Figure 7b does not directly mirror the temperature anomalies at each height. Instead, it reflects a dynamical adjustment to the vertically contrasting radiative forcing. Aerosol scattering cools the lower atmosphere through surface dimming, while aerosol absorption produces weak warming above approximately 1.8 km. The resulting thermal contrast favors ascent above the PBL, while downward motion develops within the boundary layer due to the combined effects of enhanced lower-tropospheric stability and compensating subsidence associated with the ascent aloft. Consequently, ARIs strengthen downward motion in the lower atmosphere and upward motion aloft. These ARI-induced variations in divergence and water vapor flux are shown in Fig. S5. ARIs induce divergence (positive values) below approximately 700 m and convergence (negative values) above this level, with the convergence strengthening as AESF increases. Correspondingly, negative water vapor flux anomalies occur within the divergent layer, indicating moisture export from the lower troposphere, while positive anomalies occur within the convergent layer aloft, indicating moisture accumulation. This circulation pattern contributes to the drying of the PBL. Therefore, the upward motion above the PBL is enhanced by ARIs and more warm and moist air in the lower layer is being transported upward. The ARI-enhanced downward motion within the near-surface atmosphere is subject to transporting more air in the upper layer downward, causing a dry and cold effect, as shown in Fig. 7c.
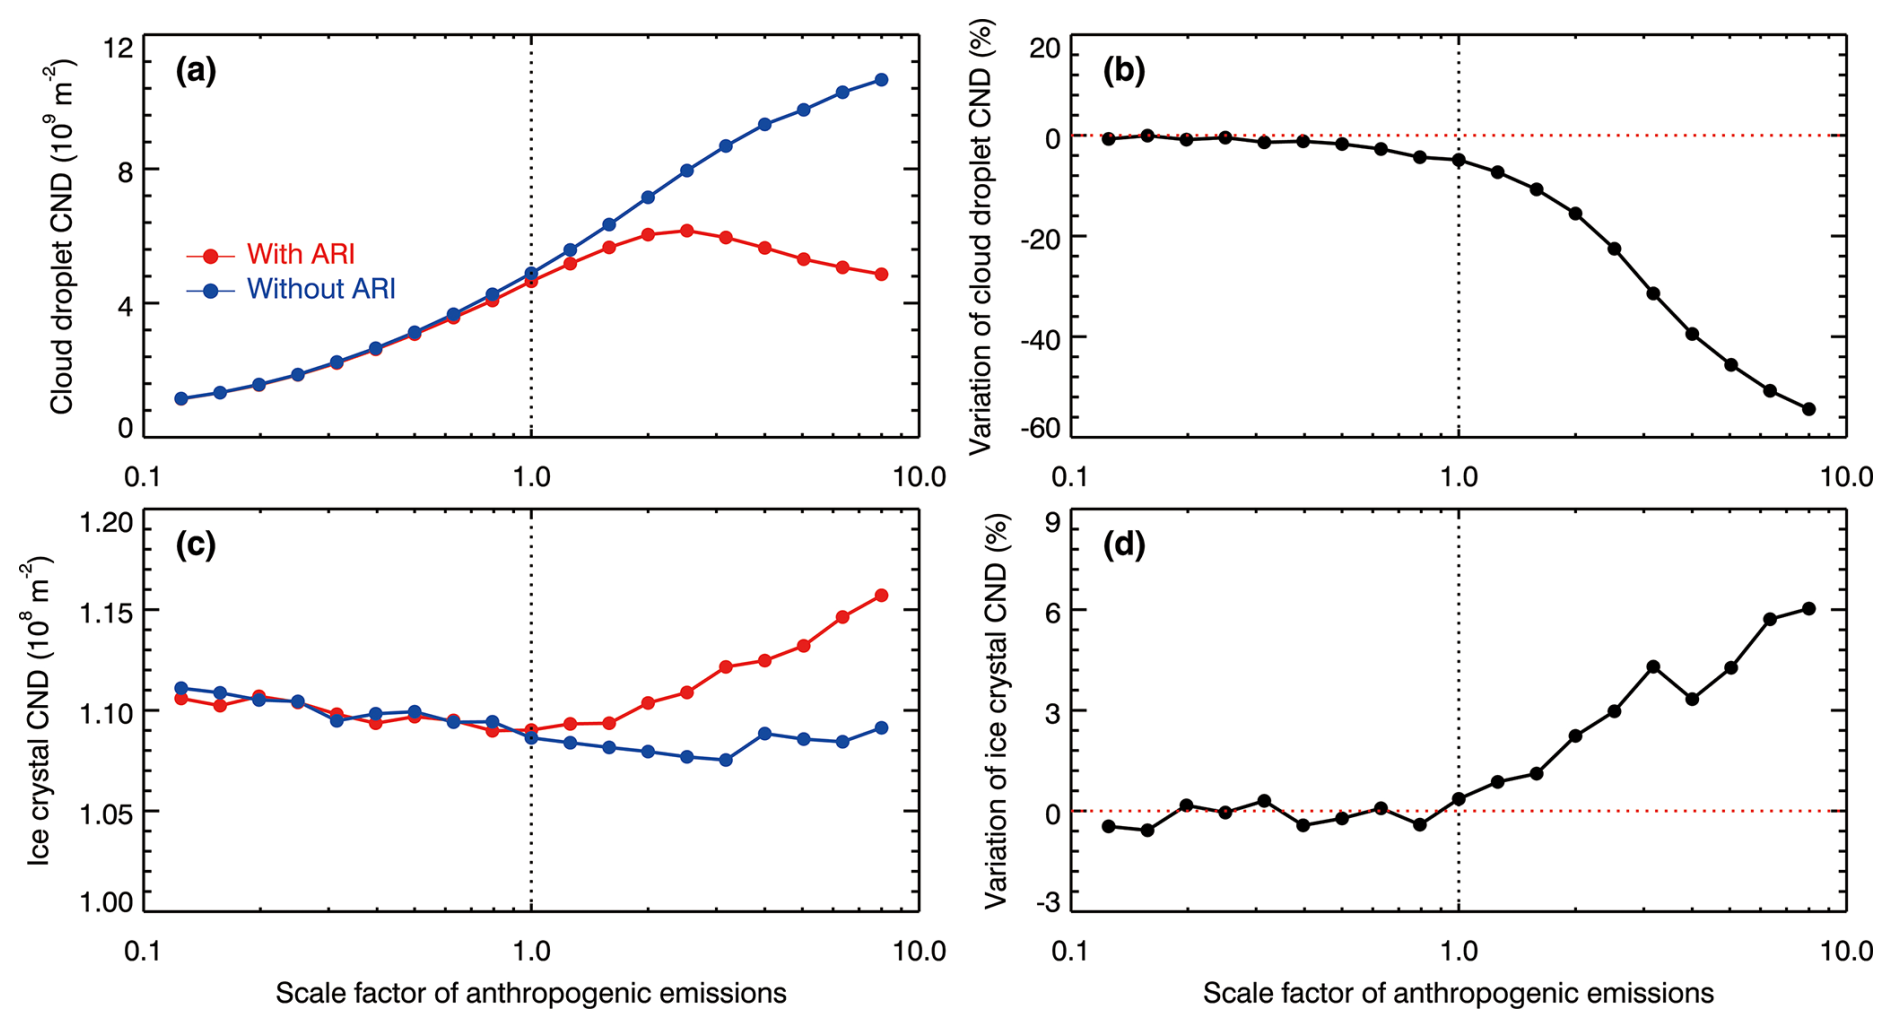
Figure 8Average (a) cloud droplet CND, (b) variation of cloud droplet CND due to ARIs, (c) ice crystal CND, and (d) variation of ice crystal CND due to ARIs over GZB + GZBs from 26 to 28 January 2022, as a function of the scale factor of anthropogenic emissions.
3.4 Response of cloud microphysic properties to aerosols
The impact of aerosols on cloud and precipitation is mediated by the combined effects of ACIs and ARIs (Twomey, 1977; Albrecht, 1989). Figure 8a presents the dependence of the column number density (CND) of cloud droplets and ice crystals over GZB + GZBs during the study period on the AESF. Increasing anthropogenic emissions escalate aerosol concentrations in the atmosphere, providing more CCN and IN to activate to form cloud droplets and ice crystals. Without ARIs, the CND of cloud droplets increases monotonically with increasing AESF, and the impact of increasing AESF on the CND of cloud droplets is not very significant, i.e., when the AESF increases from 0.125 to 8.0 or anthropogenic emissions increase by 64 times, the CND increases by 9.2 times. However, the CND of ice crystals is not sensitive to increasing anthropogenic emissions. The different response of cloud droplets and ice crystals to change of anthropogenic emissions is mainly caused by their formation at different height. The cloud water is mainly formed in the atmosphere below 3 km, which is more susceptible to the influence of anthropogenic emissions (Fig. S4b). However, the formation of ice crystal is concentrated in the atmosphere between 4 and 7 km, which is less affected by anthropogenic emissions due to downward motion within the PBL and continuous wet deposition processes (Fig. S4c).
Furthermore, the CND of ice crystals generally decreases with increasing AESF, which is not consistent with the hypothesis that increasing anthropogenic emissions provide more IN to promote the formation of ice crystals. Since the formation of ice crystals is sensitive to relative humidity (RH), the possible reason for the decreasing trend with the AESF is that ACIs alter the RH in the atmosphere due to increasing anthropogenic emissions. In the F_ARI0, the simulation using an AESF of 2−3 is referred to as the reference simulation (REF0). For discussion convenience, we define the RH relative to water surface as RHW and the RH relative to ice surface as RHI. Figure S6 presents the impact of ACIs on the RHW and RHI profile averaged in GZB + GZBs during the study period by differentiating all members in F_ARI0 with REF0. ACIs generally decrease RHW and RHI in the atmosphere and the decrease in RHW and RHI becomes significant with increasing AESF. Therefore, decreasing RHI with increasing AESF causes the decreasing trend of the CND with the AESF. In addition, the ACI-induced decrease in RHW provides a physical explanation for the relatively slow increase of cloud droplet CND with AESF (Fig. 8a), as lower RHW makes it more difficult for the additional CCN (from increased emissions) to activate into cloud droplets, thus limiting the rate of CND increase.
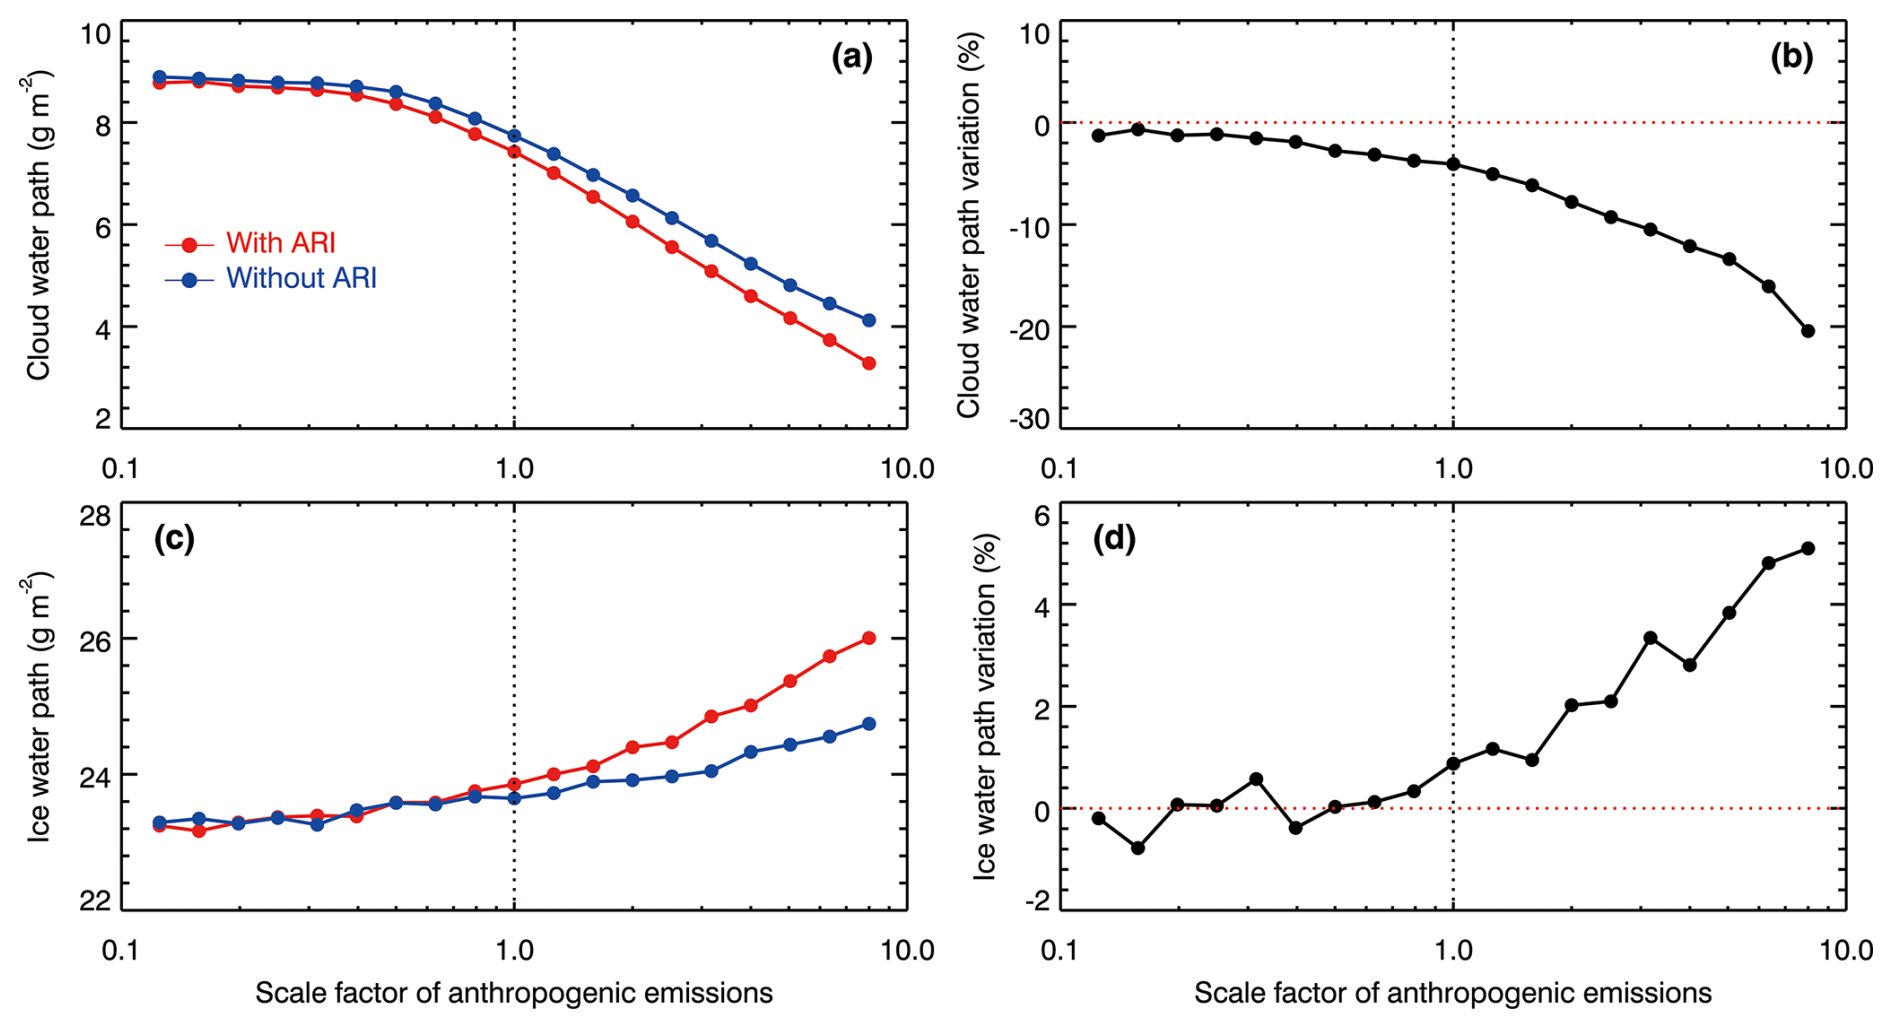
Figure 9Average (a) CWP, (b) variation of CWP due to ARIs, (c) IWP, and (d) variation of IWP due to ARIs over GZB + GZBs from 26 to 28 January 2022, as a function of the scale factor of anthropogenic emissions.
When ARIs are considered, the CND of cloud droplets shows an increasing trend with the AESF when the AESF is less than 2.5, and when the AESF is more than 2.5, the CND decreases with the AESF, which is inconsistent with the Twomey effect (Twomey, 1977). In addition, ARIs decrease the CND at the same AESF, and with the AESF exceeding 2.5, the CND decrease is more than 20 % (Fig. 8b). As shown in Fig. 7, ARIs adjust the profile of air temperature and specific humidity, further modifying the profile of RH. Figure S7a shows impacts of ARIs on the RHW profile averaged in GZB + GZBs during the study period by differentiating the F_BASE and F_ARI0. ARIs decreases RHW in the atmosphere below 3 km where the cloud droplets are formed (Fig. S4b), and the RHW decrease becomes increasingly significant with increasing AESF. Decreased RHW is not favorable for the formation of cloud droplets, so with the same AESF, ARIs decrease the CND of cloud droplets, as shown in Fig. 8b. ARIs progressively decrease RHW with increasing AESF, continuously decreasing activity ability of CCN. Therefore, although increasing anthropogenic emissions provide a large amount of CCN, most of CCN can not be activated due to decreased RH. There exist a threshold AESF (2.5) beyond which the CND commences to decrease (Fig. 8a). For ice crystals, impacts of ARIs on the CND is generally not significant with the AESF less than 1.0 (Fig. 8c), and the CND variation due to ARIs is in the range between -0.5% and 0.5 % (Fig. 8d). When the AESF is more than 1.0, ARIs consistently increase the CND of ice crystals with increasing AESF. The main reason is that with the AESF exceeding 1.0, ARIs increase RHI in the atmosphere between 4 and 7 km, enhancing the formation of ice crystals (Fig. S7b).
In the F_ARI0 without ARIs, cloud water path (CWP) decreases with increasing AESF. Many studies have proposed that increased CCN reduce cloud particle sizes to decrease the efficiency of collision and collection and further hinder auto conversion of cloud water to rainwater, causing more cloud water to exist in the atmosphere (e.g., Li et al., 2008, 2009). The decreasing trend of CWP with the AESF is caused by the decrease in RHW due to ACIs on the one hand (Fig. 9a), as shown in Fig. S7a. On the other hand, the presence of a large amount of small cloud droplets in the atmosphere is also beneficial for the collection of cloud water by ice-phase particles. Therefore, as can be seen from Fig. 9c, although ACIs decrease RHI with increasing AESF, the ice water path (IWP) shows an increasing trend with the AESF. Apparently, ARIs reduce the CWP and the decrease in CWP becomes significant with increasing AESF (Fig. 9a and b), which is mainly caused by the decrease of RHW due to ARIs (Fig. S7a). The impact of ARIs on IWP is insignificant with the AESF less than 1.0, in the range between −1 % and 1 %. When the AESF exceeding 1.0, ARIs increase the IWP due to ARI-induced increase of RHI in the atmosphere between 4 and 7 km (Fig. S7b).
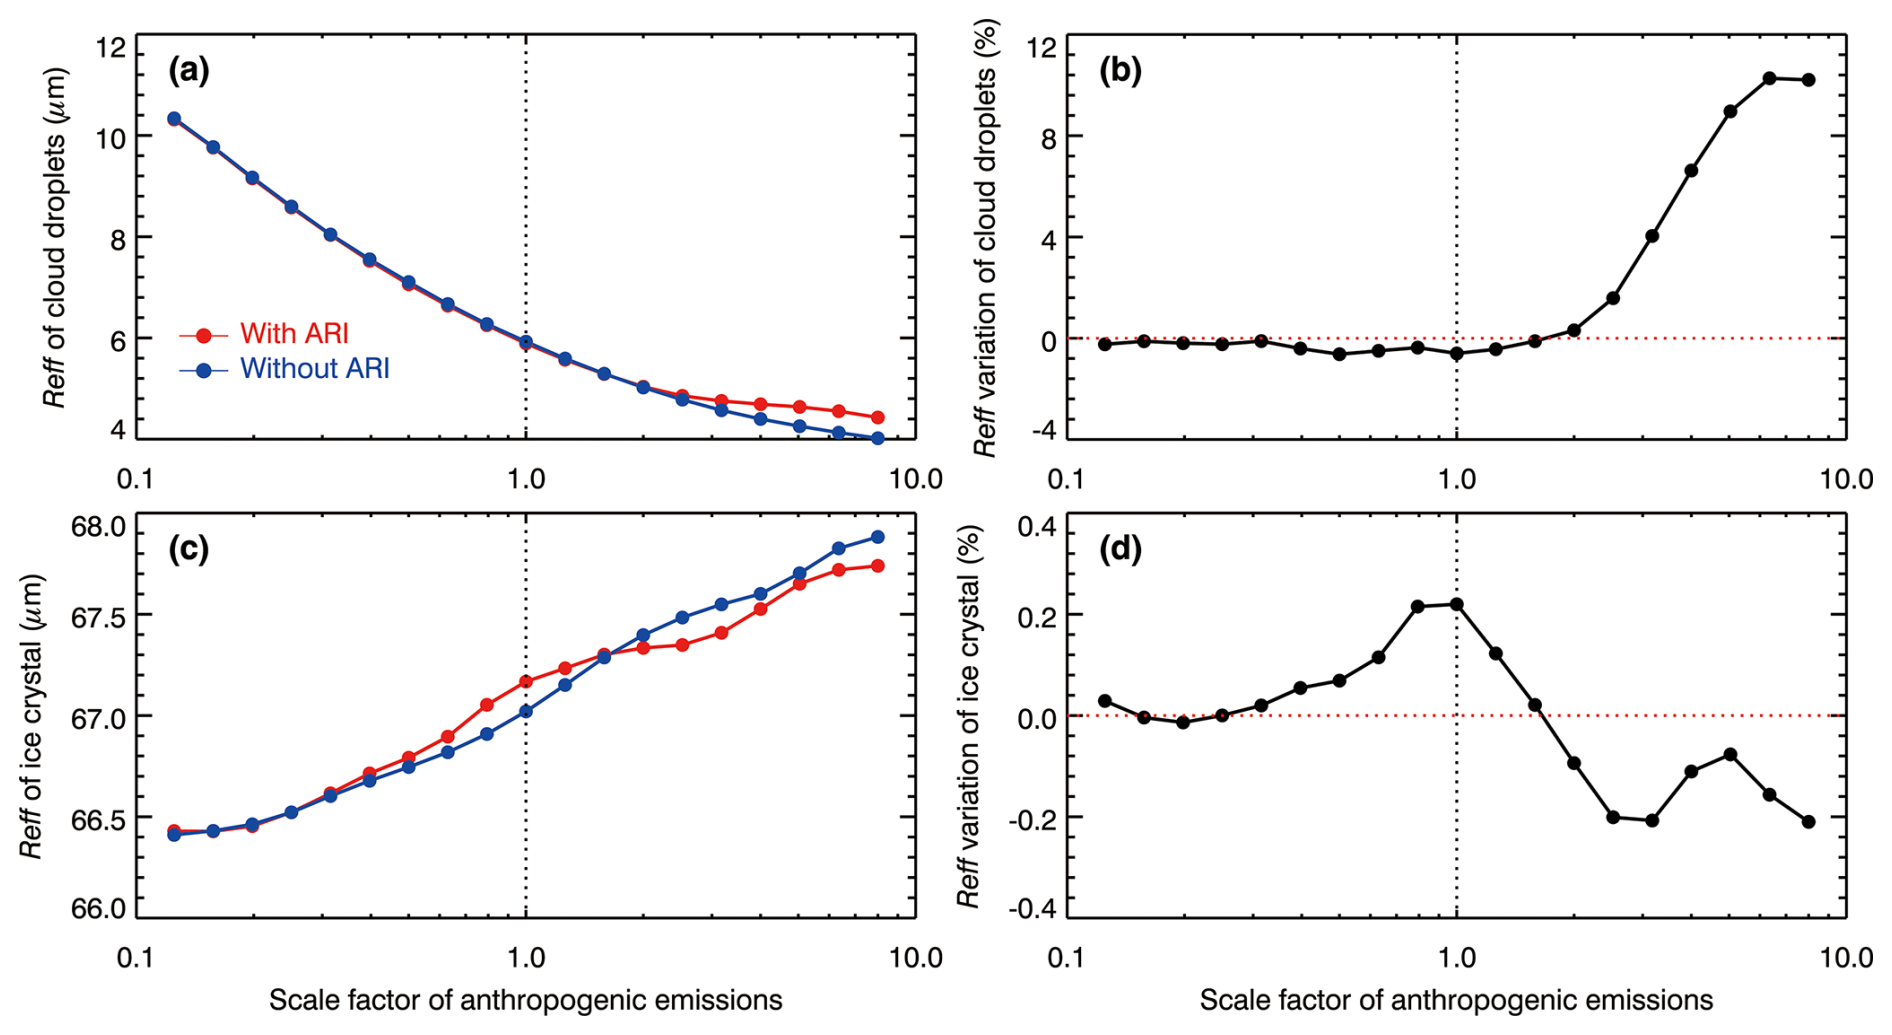
Figure 10(a) p-mean of Reffc, (b) variation of p-mean of Reffc due to ARIs, (c) p-mean of Reffi, and (d) variation of p-mean of Reffi due to ARIs over GZB + GZBs from 26 to 28 January 2022, as a function of the scale factor of anthropogenic emissions.
Figure 10a shows the variation of p-mean of cloud droplet effective radius (Reffc) with the AESF in F_BASE and F_ARI0. Reffc decreases with increasing AESF in the F_BASE and F_ARI0, which is well consistent with the variation of CND and CWP of cloud droplets. Reffc decreases with increasing AESF in both experiments. This decrease is primarily driven by the simultaneous decrease in CWP (Fig. 9a and b). In the F_ARI0, although CND increases monotonically with AESF (Fig. 8a), the reduction in CWP dominates, leading to a decreasing Reffc. In the F_BASE experiment, Reffc continues to decrease even when CND begins to decline after AESF exceeds 2.5 (Fig. 8a), reflecting the dominant role of CWP reduction. When the AESF exceeds 2.5, ARIs increase Reffc (Fig. 10b), which is caused by the ARI-induced decrease in the CND (Fig. 8b). When ARIs are not considered in the F_ARI0, p-mean of ice crystal effective radius (Reffi) increases with increasing AESF, which is caused by the ACI-induced decrease in CND (Fig. 8c) and increase in IWP of ice crystals (Fig. 9c). However, the increase in Reffi is not significant, i.e., when the AESF increases from 0.125 to 8.0, the Reffi increases by about 2.0 % (Fig. 10c). In addition, the impact of ARIs on the Reffi is insignificant, and the variation in the Reffi is less than 0.2 % (Fig. 10d).
3.5 Aerosol effects on precipitation in GZB and GZBs
Considering the difference in aerosol concentrations between GZB and GZBs, we discuss the impact of aerosols on precipitation in each region separately. Figure 11a provides the variation of the average 3 d accumulative precipitation in the GZB with the AESF. When ARIs are excluded (F_ARI0), the accumulative precipitation exhibits a weak increasing trend with the AESF, which is not consistent with previous studies over the GZB that have reported a suppression effect of ACIs on precipitation (e.g., Yang et al., 2013a, b; Bei et al., 2025). Yang et al. (2013a, b) have correlated the decreasing trend of precipitation inside the GZB with deterioration of the air pollution, revealing the microphysically suppressive effect of increased aerosols on precipitation. Bei et al. (2025) have also shown that ACIs tend to decrease convective precipitation in the GZB based on sensitivity simulations of a summertime short-term heavy rainfall event. In this study, as we have discussed above, increasing anthropogenic emissions decrease CWP and Reffc, lowering the conversion of cloud water to rainwater to decrease the liquid-phase precipitation. However, increasing emissions increase IWP and Reffi, facilitating the formation and growth of snow flakes to enhance the ice-phase precipitation. Figure 12 shows dependence of the liquid-phase and ice-phase precipitation at the ground surface in the GZB with the AESF. Liquid-phase precipitation shows a decreasing trend but ice-phase precipitation shows an increasing trend with the AESF. Overall, liquid-phase precipitation is lower at higher AESF, while ice-phase precipitation is higher. The increase in ice-phase precipitation partly compensates for the decrease in liquid-phase precipitation, leading to a net weak increase in total precipitation over the GZB for higher AESF (Fig. 11a).
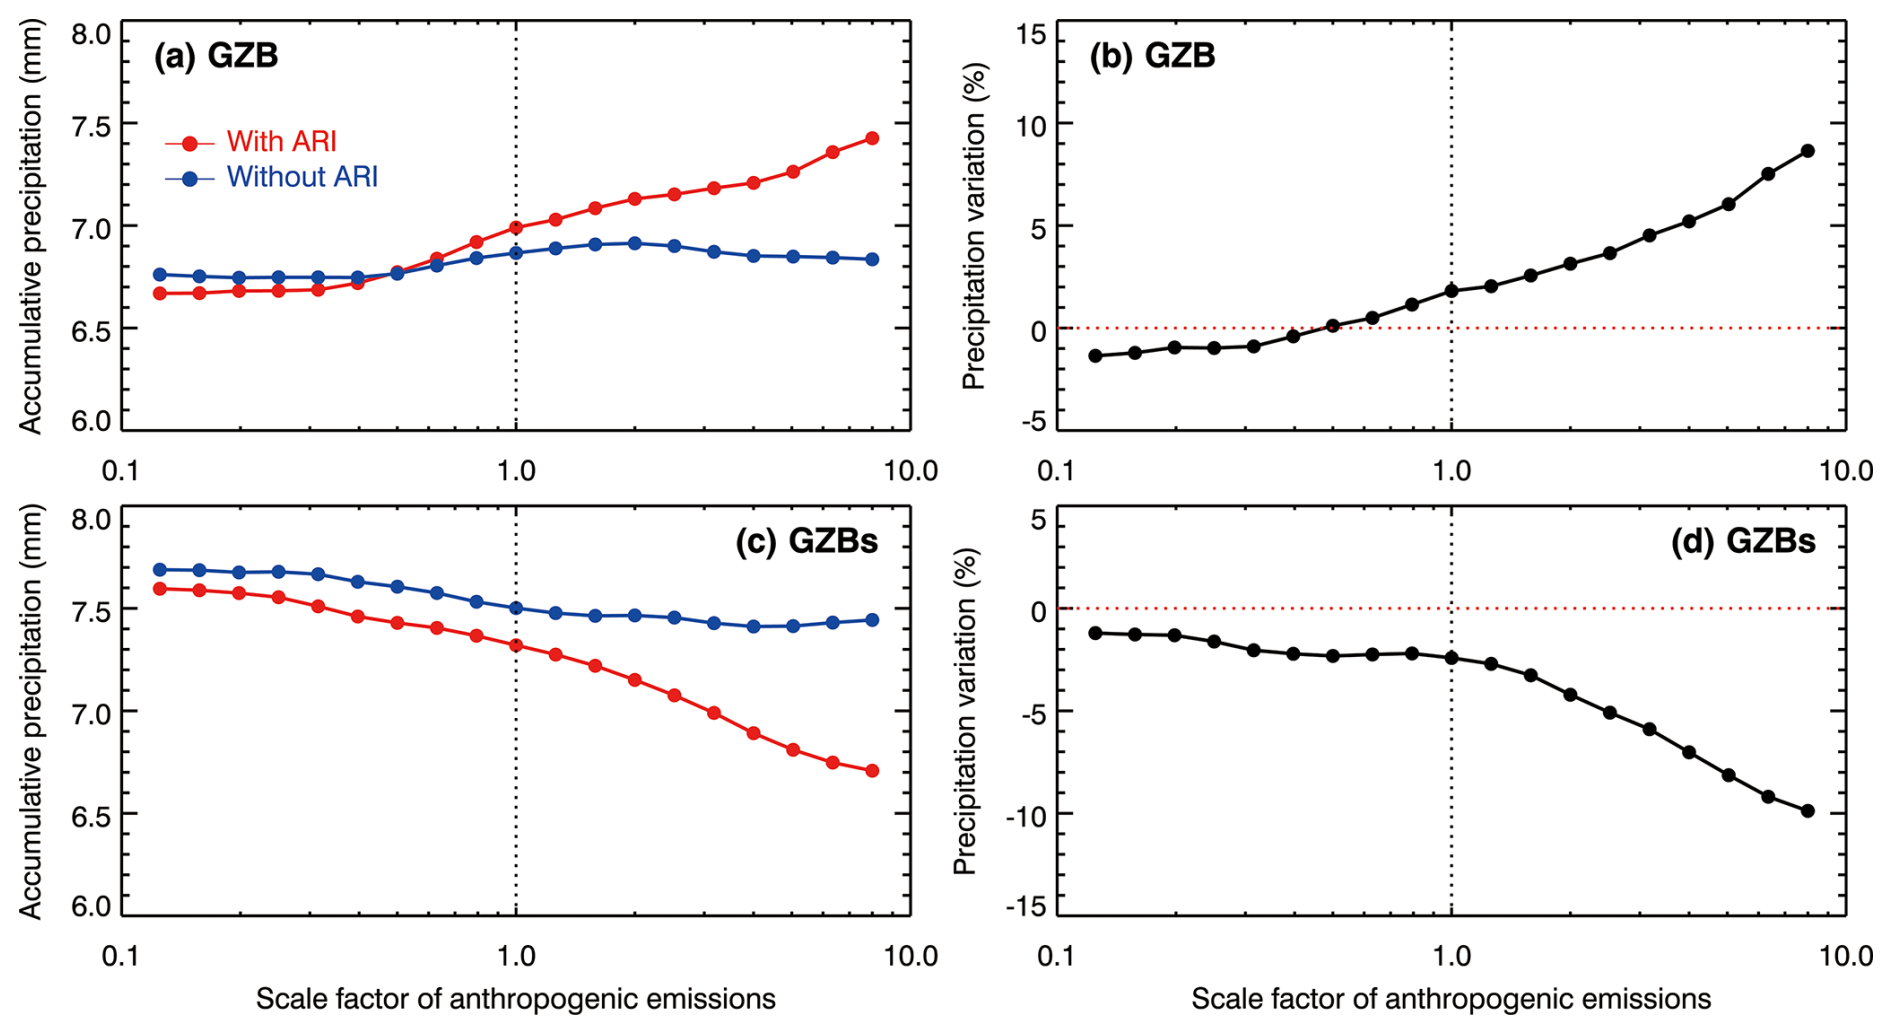
Figure 11Average accumulative precipitation in (a) GZB and (c) GZBs, and variation of precipitation due to ARIs in (b) GZB and (d) GZBs from 26 to 28 January 2022, as a function of the scale factor of anthropogenic emissions.
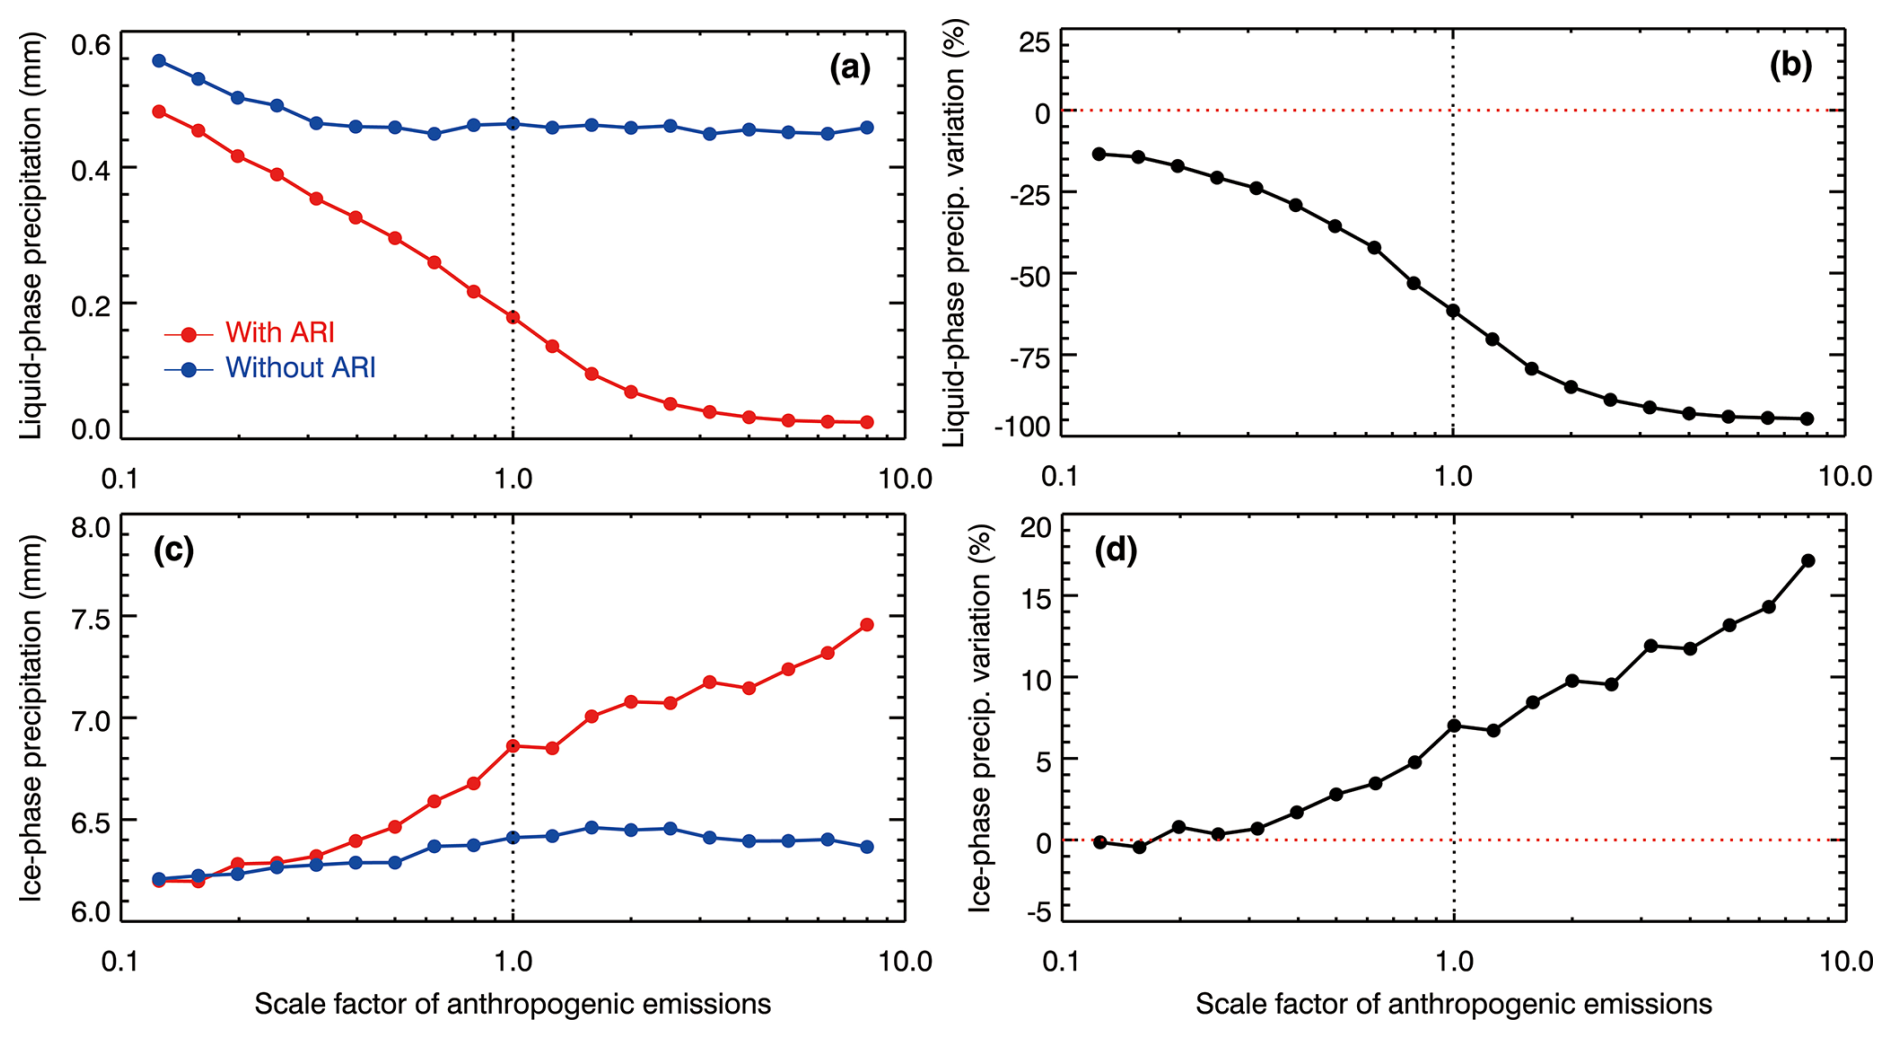
Figure 12Average accumulative (a) liquid-phase and (c) ice-phase precipitation, and variation of (b) liquid-phase and (d) ice-phase precipitation due to ARIs in GZB from 26 to 28 January 2022, as a function of the scale factor of anthropogenic emissions.
ARIs decrease the precipitation with the AESF less than 0.6 and increases it when the AESF is more than 0.6 in the GZB (Fig. 11b). ARIs considerably decrease liquid-phase precipitation and the decrease is more than 50 % with the AESF greater than 1.0 (Fig. 12b). Except the decreasing CWP and Reffc with increasing the AESF, the decrease in RHW below 3 km caused by ARIs also contributes to the decreasing trend of liquid-phase precipitation in the GZB (Fig. S8a). However, ARIs generally increases the ice-phase precipitation monotonically with increasing AESF (Fig. 12c). ARI-induced increase in IWP can partially explain the increase in ice-phase precipitation with the AESF exceeding 0.6. Another possible reason is that ARI-induced increase in RHI facilitates survival ice-phase particles when they fall off from clouds (Fig. S8b). The decrease in liquid-phase precipitation exceeds the increase in ice-phase precipitation when the AESF is less than 0.6 and it is opposite with the AESF more than 0.6 (Fig. 12b and d).
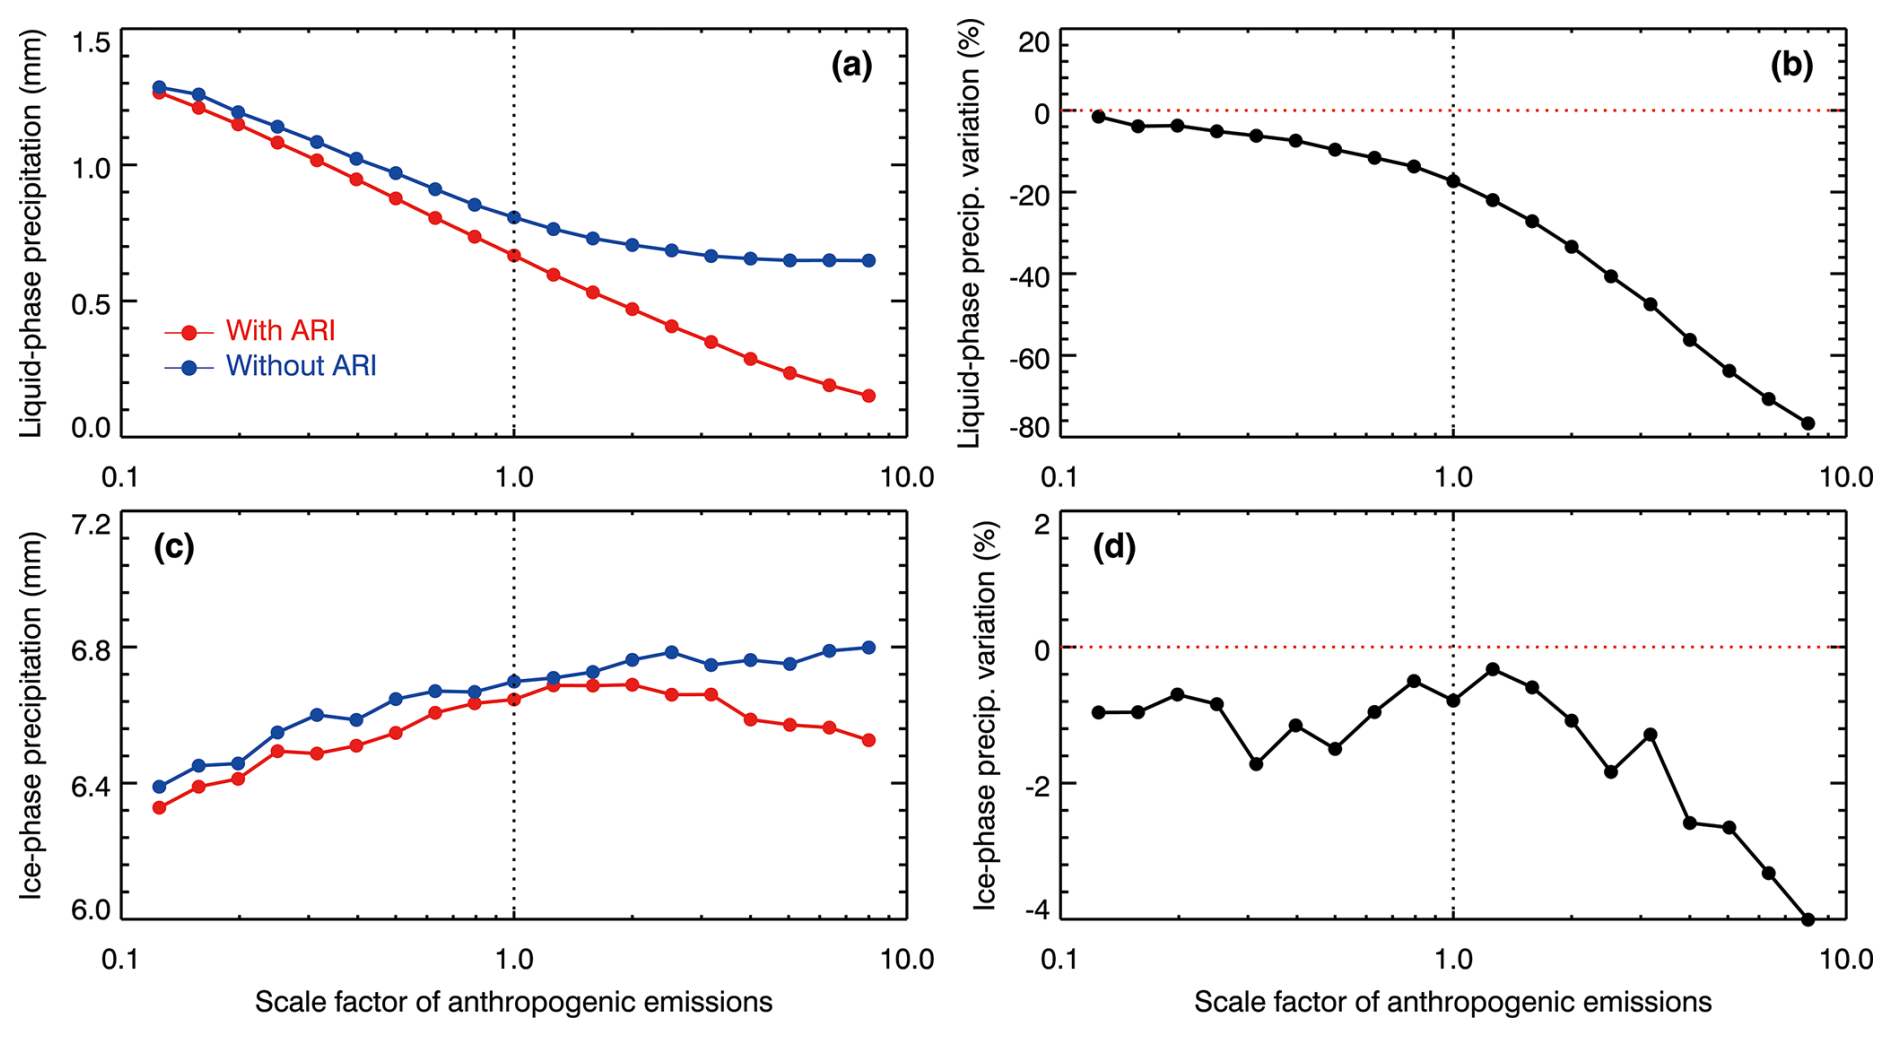
Figure 13Average accumulative (a) liquid-phase and (c) ice-phase precipitation, and variation of (b) liquid-phase and (d) ice-phase precipitation due to ARIs in GZBs from 26 to 28 January 2022, as a function of the scale factor of anthropogenic emissions.
In the GZBs, without ARIs, ACIs decrease precipitation with increasing AESF (Fig. 11c), and ARIs also appreciably decrease the precipitation with the same AESF (Fig. 11c and d), which are generally contrary to those in the GZB (Fig. 11a and b). There are two reasons that can explain the different responses of precipitation to ARIs and ACIs in the GZB and GZBs. In the F_ARI0 without ARIs, the variation of liquid-phase and ice-phase precipitation with increasing AESF in the GZBs is similar to those in the GZB. However, the ratio of liquid-phase precipitation to the total precipitation varies considerably in the GZB and GZBs. The proportion of liquid water path is consistently higher in GZBs than GZB across all emission scenarios (Fig. S9). For example, in the REF0, the ratio in the GZB is 2.5 %, but in the GZBs, it is 9.1 %. To further understand the contrasting precipitation responses between GZB and GZBs, the background thermodynamic and cloud microphysical conditions of the two regions are compared in the F_BASE (Fig. S10). Compared with GZB, GZBs exhibit higher lower-tropospheric relative humidity, substantially larger cloud water content, and smaller ice water content above 6 km. Therefore, aerosol-induced perturbations to liquid cloud microphysics are expected to exert a stronger influence on precipitation in GZBs, providing a physical basis for the contrasting precipitation responses shown in Fig. 11. Meanwhile, when ARIs are excluded, ACIs decrease the liquid-phase precipitation by 50 % when the AESF increases from 0.125 to 8.0 in the GZBs (Fig. 13). Although ACIs increase the ice-phase precipitation with increasing the AESF, the increase is less than the decrease in liquid-phase precipitation, causing the decreasing trend of precipitation with the AESF in the GZBs. In addition, ARIs decrease the liquid-phase and ice-phase precipitation in the GZBs with the same AESF (Fig. 13b and d), This reduction is attributed to the ARI-induced decrease of RHW and RHI in the atmosphere below 3 km (Fig. S11), which would enhance the evaporation of precipitation particles.
Figure 14 presents the 3 d accumulative precipitation distribution under different AESF (0.125, 1.0, and 8.0) in the F_ARI0 and F_BASE. Generally, increasing anthropogenic aerosols do not change the whole precipitation pattern significantly, i.e., the decrease in precipitation from north to south and the occurrence of heavy precipitation in the southeast of GZB + GZBs. However, the variation of different precipitation levels can be observed, for example, the increase in the area with precipitation between 5.0 and 10.0 mm in the GZB and the decrease in the area with precipitation exceeding 10.0 mm in the south. We also classify the simulated daily precipitations into slight (more than 0.0 and less than 0.1 mm d−1), light (0.1–2.5 mm d−1), moderate (2.5–5.0 mm d−1), and heavy (more than 5.0 mm d−1) snowfall according to the Chinese national standard GB/T 28592-2012 Grade of precipitation. In GZB + GZBs, increasing aerosols increase occurrence of slight and light precipitation but decrease moderate and heavy precipitation (Fig. S12).
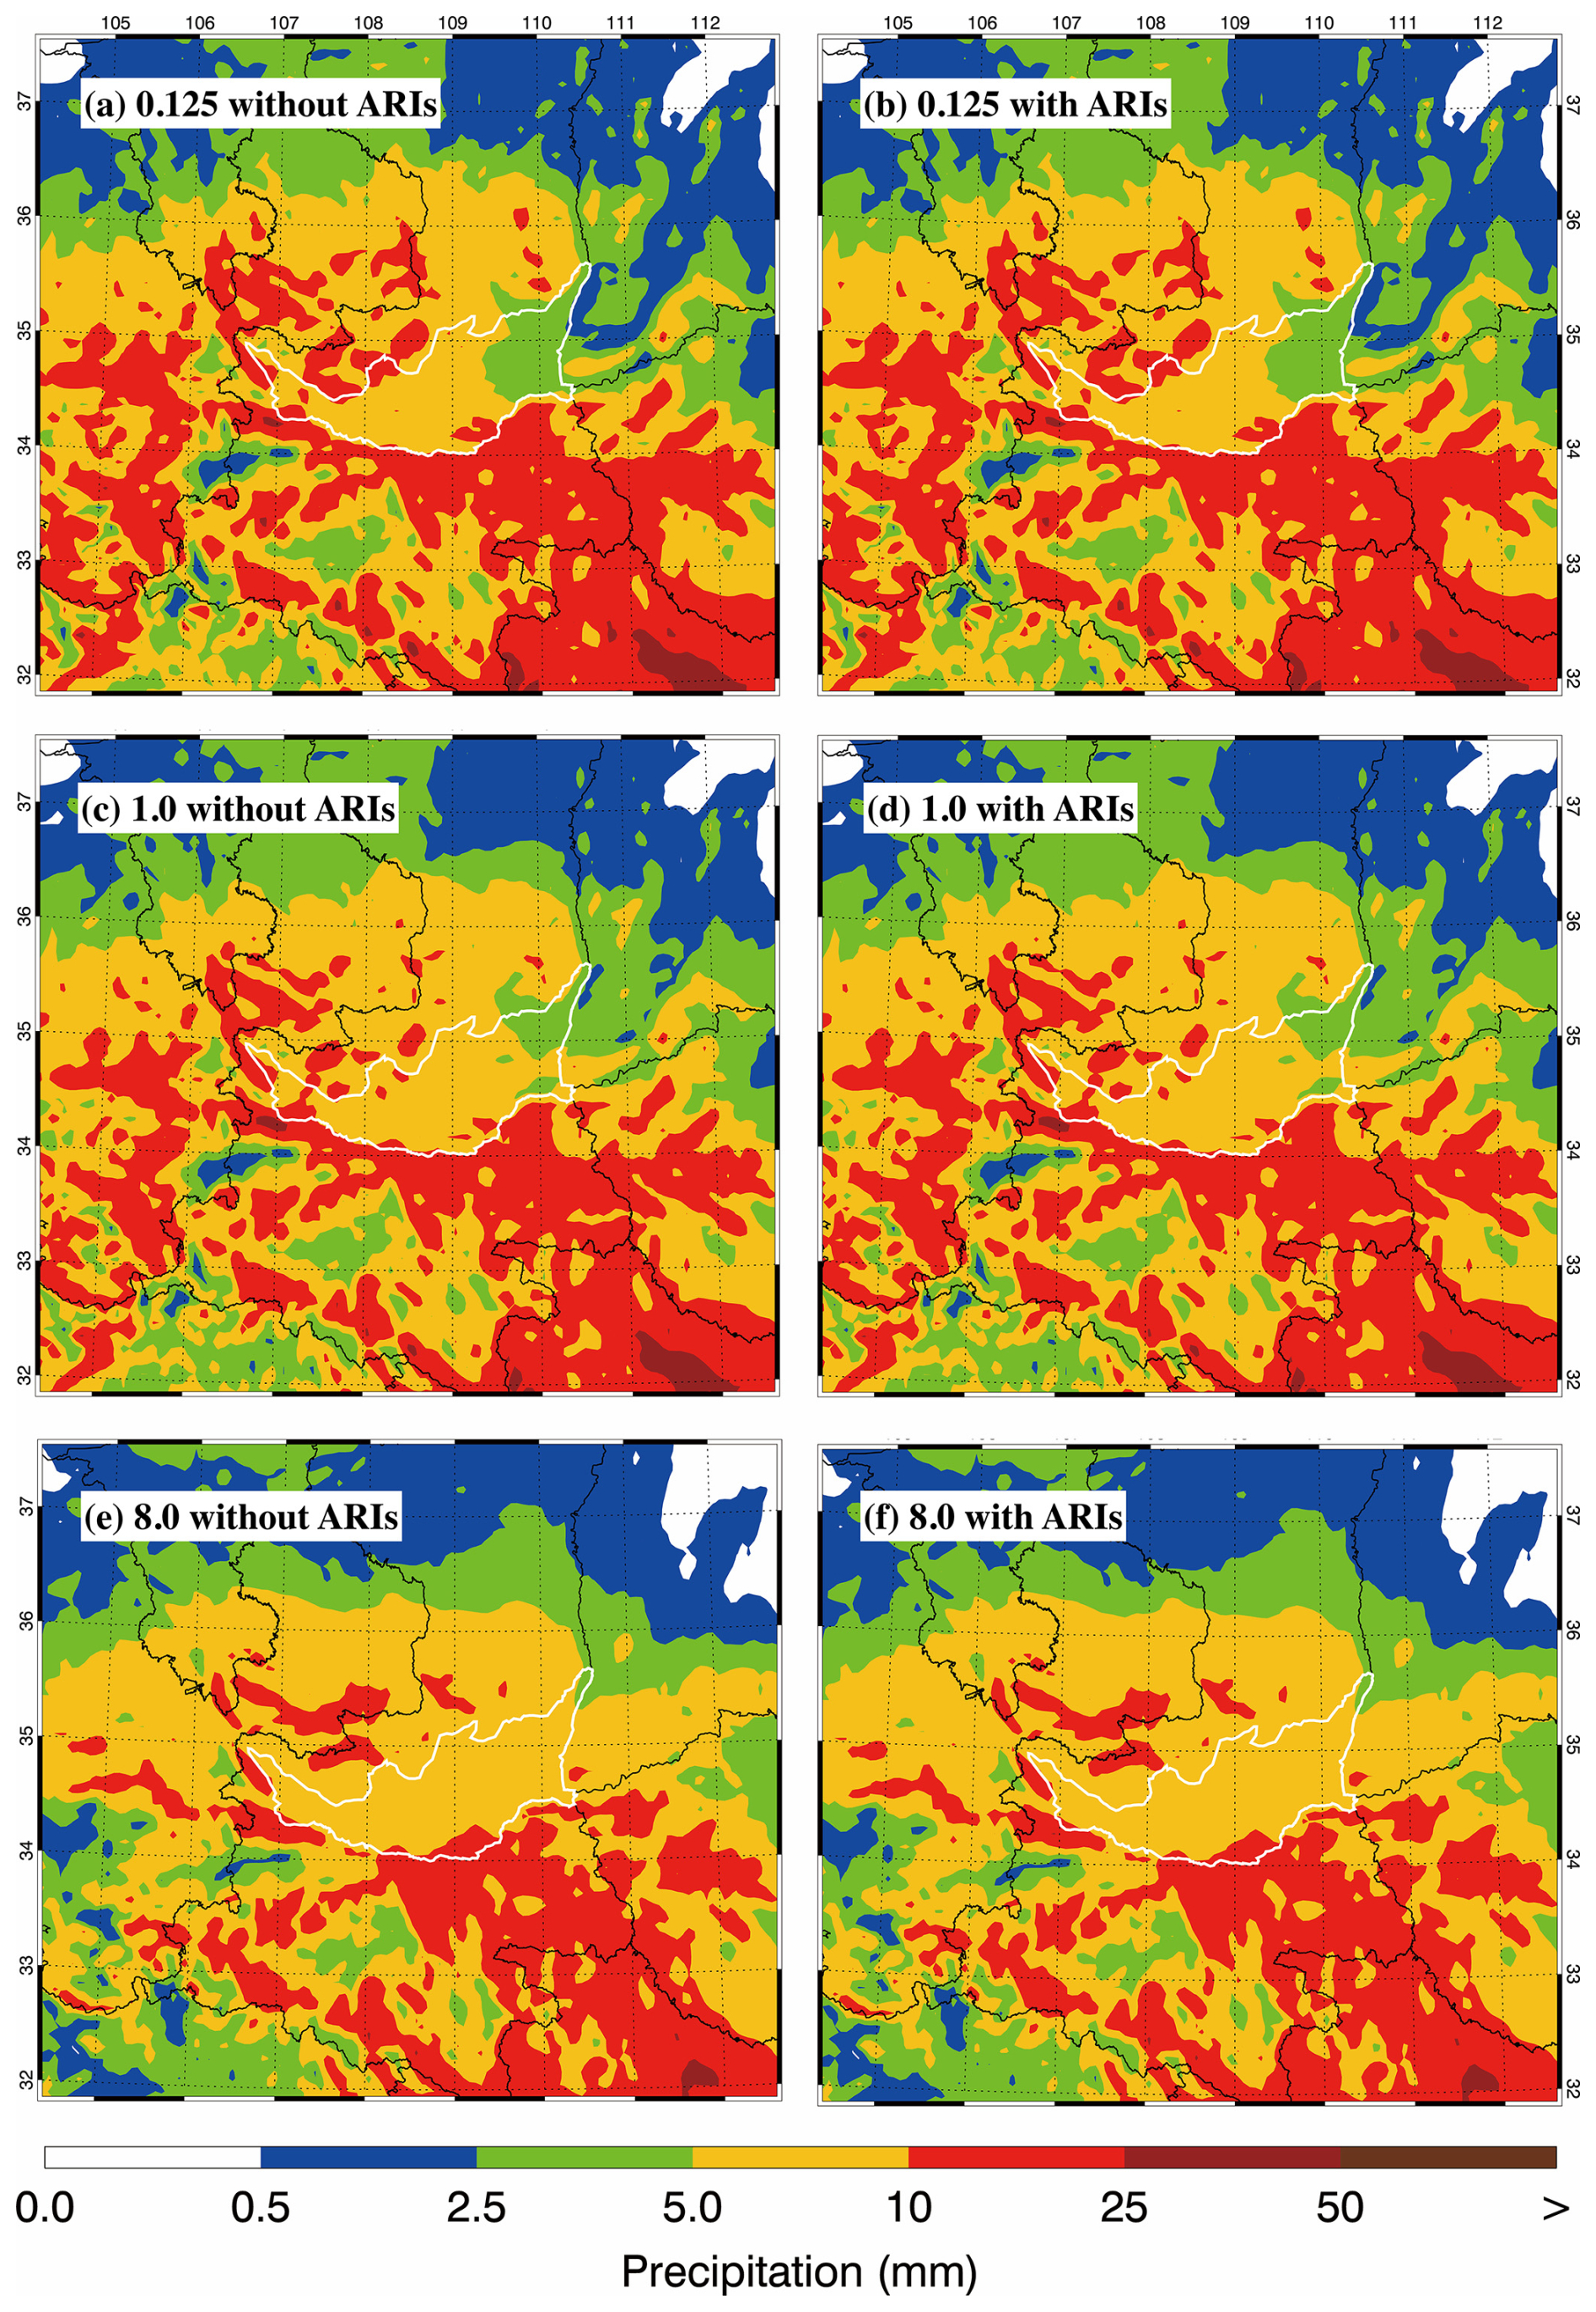
Figure 14Distribution of accumulative precipitation from 26 to 28 January 2022 for various scale factor of anthropogenic emissions when ARIs are (a, c, e) excluded and (b, d, f) included. The white contour outlines the GZB. The white contour outlines the GZB and the area outside of GZB in panels is referred to as GZBs.
Using a cloud-resolving fully coupled WRF-Chem model, this study investigated a heavy snowfall event occurred in GZB + GZBs from 26 to 28 January 2022, with a focus on disentangling the roles of ACIs and ARIs under different aerosol loadings. The model reasonably reproduces the observed evolution of air pollutants and snowfall, with IOAs exceeding 0.60 for PM2.5, O3, and NO2, and 0.85 for accumulated precipitation. A series of sensitivity simulations covering aerosol loadings from relatively clean to heavily polluted conditions are conducted to quantify the nonlinear responses of cloud microphysics and snowfall to anthropogenic aerosols.
Sensitivity results reveal that ARIs substantially modify the thermodynamic structure of the lower troposphere. Increasing aerosol loading reduces the mean PBLH by approximately 34 %, while producing cooling below 1.8 km and weak warming aloft, thereby enhancing lower-tropospheric stability and inducing secondary downward motion within the PBL and upward motion aloft. These dynamical adjustments redistribute atmospheric moisture, decreasing RHW below 3 km while enhancing RHI in the mixed-phase cloud layer under polluted conditions. Consequently, CND of cloud droplets exhibits a nonlinear response to aerosol loading, with a threshold occurring at an AESF of approximately 2.5 when ARIs are included. Meanwhile, the increase in IWP under polluted conditions is primarily associated with enhanced collection of cloud water by ice crystals.
When ARIs are excluded, increasing anthropogenic emissions raise CND of cloud droplets, but decrease LWP which is caused by ACI-induced decrease of RHW. While ACI-induced decrease in RHI reduces CND of ice crystals with increasing emissions, and the increasing trend of IWP with the AESF is mainly caused by enhanced collection of cloud water by ice crystals.
The response of precipitation to ARIs and ACIs is different in GZB and GZBs. In the GZB, excluding ARIs leads to a weak increase in 3 d accumulated precipitation with increasing emissions. Although increasing aerosols considerably decrease the liquid-phase precipitation, the ACI-induced increase in ice-phase precipitation outweighs the decrease in liquid-phase precipitation. ARIs increase the precipitation in the GZB when the AESF exceeds 0.6, due to ARI-induced increase in RHI which increase IWP and facilitate survival ice-phase particles in the atmosphere. In contrast, precipitation in the GZBs decreases with increasing aerosols, reflecting the dominance of liquid-phase precipitation that is strongly suppressed by ACIs and further reinforced by ARI-induced reductions in RHI. Increasing anthropogenic emissions do not substantially alter the precipitation pattern in GZB + GZBs, but can modify the frequency distribution of precipitation intensity.
Compared with previous studies over the GZB, which have primarily reported aerosol-induced suppression of precipitation through cloud microphysical effects (e.g., Yang et al., 2013a, b; Bei et al., 2025), the present study demonstrates that the response of winter snowfall cannot be explained solely by warm-cloud microphysics. Instead, the competition between liquid-phase suppression and ice-phase enhancement, together with ARI-induced thermodynamic adjustments, determines the net snowfall response. These results highlight that aerosol impacts on winter mixed-phase precipitation depend strongly on cloud phase partitioning and ambient thermodynamic conditions, providing new understanding of aerosol–cloud–radiation coupling under polluted winter environments. The identified regional contrast also suggests that aerosol effects on snowfall may vary considerably within the same synoptic system owing to differences in cloud microphysical characteristics and background humidity, emphasizing the importance of representing coupled aerosol–radiation–cloud processes in numerical weather prediction and regional climate models.
The sensitivity experiment design used to separate ARIs and ACIs is subject to uncertainties arising from the nonlinear coupling between radiation, thermodynamics, and cloud microphysics. The differencing approach does not fully isolate pure ARIs but rather includes contributions from nonlinear interactions between ARIs and ACIs. While this approach is widely used in the previous studies (Bei et al., 2025; Ding et al., 2019; Sun and Zhao, 2021), the quantitative ARIs effects reported here may contain some uncertainty, particularly in regions with strong aerosol-cloud-radiation feedbacks. Nevertheless, the robust regional contrast in precipitation responses that enhancement in the GZB vs. suppression in the GZBs is substantially larger than the estimated uncertainty due to nonlinearities, and the qualitative conclusions of this study remain robust. In addition, the present conclusions are based on a single snowfall event, and their broader applicability should be evaluated using additional winter precipitation cases. Future studies combining long-term observations, multi-case simulations, and more advanced radiative perturbation approaches will further improve the quantitative attribution of ARIs and ACIs and help assess the generality of the threshold behaviors identified in this study.
The hourly ambient surface O3, NO2, and PM2.5 mass concentrations were obtained from the China Air Quality Online Monitoring and Analysis Platform (https://www.aqistudy.cn/, last access: 29 May 2026). Precipitation observations at meteorological sites with rain gauge in the GZBs are from China Meteorological Administration, which can be accessed at https://data.cma.cn/data/cdcdetail/dataCode/A.0012.0001.html (last access: 10 January 2026).
The supplement related to this article is available online at https://doi.org/10.5194/acp-26-11923-2026-supplement.
GL and NB, as the corresponding author, provided the ideas and financial support, verified the conclusions, and revised the paper. YY conducted research, designed the experiments, performed the simulation, processed the data, prepared the data visualization, and prepared the manuscript, with contributions from all authors. RW and QJ provided the data and primary data processing and reviewed the manuscript. HH validated the model performance, analyzed the study data, and reviewed the manuscript. ZL analyzed the initial simulation data. XT reviewed the manuscript and provided critical comments.
The contact author has declared that none of the authors has any competing interests.
Publisher's note: Copernicus Publications remains neutral with regard to jurisdictional claims made in the text, published maps, institutional affiliations, or any other geographical representation in this paper. The authors bear the ultimate responsibility for providing appropriate place names. Views expressed in the text are those of the authors and do not necessarily reflect the views of the publisher.
The authors thank the editor and the two anonymous reviewers for their constructive comments and valuable suggestions on this manuscript.
This research has been supported by the National Key Research and Development Program of China (grant no. 2022YFF0802502), the National Natural Science Foundation of China (grant no. 41975175), and the Key Research and Development Projects of Shaanxi Province (grant no. 2024SF-ZDCYL-05-05).
This paper was edited by Jianzhong Ma and reviewed by two anonymous referees.
Ackerman, A. S., Toon, O. B., Stevens, D. E., Heymsfield, A. J., Ramanathan, V., and Welton, E. J.: Reduction of tropical cloudiness by soot, Science, 288, 1042–1047, https://doi.org/10.1126/science.288.5468.1042, 2000.
Albrecht, B. A.: Aerosols, cloud microphysics, and fractional cloudiness, Science, 245, 1227–1230, https://doi.org/10.1126/science.245.4923.1227, 1989.
Bai, Y., Li, J., Guo, J., Xu, H., and Wang, Y.: Simulation of the responses of rainstorm in the Yangtze River Middle Reaches to changes in anthropogenic aerosol emissions, Atmos. Environ., 220, 117081, https://doi.org/10.1016/j.atmosenv.2019.117081, 2020.
Bei, N., Li, G., Huang, R., Cao, J., Meng, N., Feng, T., Liu, S., Zhang, T., Zhang, Q., and Molina, L. T.: Typical synoptic situations and their impacts on the wintertime air pollution in the Guanzhong Basin, China, Atmos. Chem. Phys., 16, 7373–7387, https://doi.org/10.5194/acp-16-7373-2016, 2016a.
Bei, N., Xiao, B., Meng, N., and Feng, T.: Critical role of meteorological conditions in a persistent haze episode in the Guanzhong Basin, China, Sci. Total Environ., 550, 273–284, https://doi.org/10.1016/j.scitotenv.2016.01.124, 2016b.
Bei, N., Wu, J., Elser, M., Feng, T., Cao, J., El-Haddad, I., Li, X., Huang, R. J., Li, Z., Long, X., Zhao, S., Tie, X., Prévôt, A. S. H., and Li, G.: Impacts of meteorological uncertainties on the haze formation in Beijing–Tianjin–Hebei (BTH) during wintertime: a case study, Atmos. Chem. Phys., 17, 14579–14591, https://doi.org/10.5194/acp-17-14579-2017, 2017a.
Bei, N., Zhao, L., Xiao, B., Meng, N., and Feng, T.: Impacts of local circulations on the wintertime air pollution in the Guanzhong Basin, China, Sci. Total Environ., 592, 373–390, https://doi.org/10.1016/j.scitotenv.2017.02.151, 2017b.
Bei, N., Xiao, B., Wang, R., Yang, Y., Liu, L., Han, Y., and Li, G.: Impacts of aerosol–radiation and aerosol–cloud interactions on a short-term heavy-rainfall event – a case study in the Guanzhong Basin, China, Atmos. Chem. Phys., 25, 10931–10948, https://doi.org/10.5194/acp-25-10931-2025, 2025.
Boucher, O., Randall, D., Artaxo, P., Bretherton, C., Feingold, G., Forster, P., Kerminen, V., Kondo, Y., Liao, H., and Lohmann, U.: Clouds and aerosols, in Climate change 2013: The physical science basis, in: Contribution of working group I to the fifth assessment report of the intergovernmental panel on climate change, Cambridge University Press, 571–657, https://doi.org/10.1017/CBO9781107415324.016, 2013.
Braham Jr., R. R.: Cloud physics of urban weather modification – a preliminary report, B. Am. Meteorol. Soc., 55, 100–106, 1974.
Cao, Q., Jiang, B., Shen, X., Lin, W., and Chen, J.: Microphysics effects of anthropogenic aerosols on urban heavy precipitation over the Pearl River Delta, China, Atmos. Res., 253, 105478, https://doi.org/10.1016/j.atmosres.2021.105478, 2021.
Charlson, R. J., Schwartz, S. E., Hales, J. M., Cess, R. D., Coakley Jr., J. A., Hansen, J. E., and Hofmann, D. J.: Climate forcing by anthropogenic aerosols, Science, 255, 423–430, https://doi.org/10.1126/science.255.5043.423, 1992.
Cheng, Y., Yu, Q.-Q., Liu, J.-M., Zhu, S., Zhang, M., Zhang, H., Zheng, B., and He, K.-B.: Model vs. observation discrepancy in aerosol characteristics during a half-year long campaign in Northeast China: the role of biomass burning, Environ. Pollut., 269, 116167, https://doi.org/10.1016/j.envpol.2020.116167, 2021.
Chou, M. D. and Suarez, M. J.: A solar radiation parameterization for atmospheric studies, in: Technical Report Series on Global Modeling and Data Assimilation, edited by: Suarez, M. J., NASA Goddard Space Flight Center, Greenbelt, Maryland, USA, Vol. 15, NASA/TM-1999-104606, 40 pp., https://ntrs.nasa.gov/citations/19990060930 (last access: 22 September 2024), 1999.
Chou, M. D., Suarez, M. J., Liang, X. Z., Yan, M. M. H., and Cote, C.: A thermal infrared radiation parameterization for atmospheric studies, in: Technical Report Series on Global Modeling and Data Assimilation (No. NASA/TM-2001-104606), edited by: Suarez M. J., Goddard Space Flight Center, Greenbelt, Maryland, 19, https://ntrs.nasa.gov/citations/20010072848 (last access: 22 September 2024), 2001.
Ding, A. J., Huang, X., Nie, W., Sun, J. N., Kerminen, V.-M., Petäjä, T., Su, H., Cheng, Y. F., Yang, X.-Q., Wang, M. H., Chi, X. G., Wang, J. P., Virkkula, A., Guo, W. D., Yuan, J., Wang, S. Y., Zhang, R. J., Wu, Y. F., Song, Y., Zhu, T., Zilitinkevich, S., Kulmala, M., and Fu, C. B.: Enhanced haze pollution by black carbon in megacities in China, Geophys. Res. Lett., 43, 2873–2879, https://doi.org/10.1002/2016GL067745, 2016.
Ding, Q., Sun, J., Huang, X., Ding, A., Zou, J., Yang, X., and Fu, C.: Impacts of black carbon on the formation of advection–radiation fog during a haze pollution episode in eastern China, Atmos. Chem. Phys., 19, 7759–7774, https://doi.org/10.5194/acp-19-7759-2019, 2019.
Gao, M., Carmichael, G. R., Wang, Y., Saide, P. E., Yu, M., Xin, J., Liu, Z., and Wang, Z.: Modeling study of the 2010 regional haze event in the North China Plain, Atmos. Chem. Phys., 16, 1673–1691, https://doi.org/10.5194/acp-16-1673-2016, 2016.
Grell, G. A., Peckham, S. E., Schmitz, R., McKeen, S. A., Frost, G., Skamarock, W. C., and Eder, B.: Fully coupled “online” chemistry within the WRF model, Atmos. Environ., 39, 6957–6975, https://doi.org/10.1016/j.atmosenv.2005.04.027, 2005.
Guo, J., Deng, M., Fan, J., Li, Z., Chen, Q., Zhai, P., Dai, Z., and Li, X.: Precipitation and air pollution at mountain and plain stations in northern China: insights gained from observations and modeling, J. Geophys. Res.-Atmos., 119, 4793–4807, https://doi.org/10.1002/2013JD021161, 2014.
Guo, J., Liu, H., Li, Z., Rosenfeld, D., Jiang, M., Xu, W., Jiang, J. H., He, J., Chen, D., Min, M., and Zhai, P.: Aerosol-induced changes in the vertical structure of precipitation: a perspective of TRMM precipitation radar, Atmos. Chem. Phys., 18, 13329–13343, https://doi.org/10.5194/acp-18-13329-2018, 2018.
Guo, L., Fu, D., Xiao, H., Zhang, Y., and Miao, S.: Numerical analysis of the impact of complex urban environment on a snowfall event in Beijing, J. Geophys. Res.-Atmos., 126, e2021JD035442, https://doi.org/10.1029/2021JD035442, 2021.
Horowitz, L. W., Walters, S., Mauzerall, D. L., Emmons, L. K., Rasch, P. J., Granier, C., Tie, X., Lamarque, J.-F., Schultz, M. G., Tyndall, G. S., Orlando, J. J., and Brasseur, G. P.: A global simulation of tropospheric ozone and related tracers: Description and evaluation of MOZART, version 2, J. Geophys. Res.-Atmos., 108, 4784, https://doi.org/10.1029/2002JD002853, 2003.
Hu, Y., Zang, Z., Chen, D., Ma, X., Liang, Y., You, W., Pan, X., Wang, L., Wang, D., and Zhang, Z.: Optimization and evaluation of SO2 emissions based on WRF-Chem and 3DVAR data assimilation, Remote Sens., 14, 220, https://doi.org/10.3390/rs14010220, 2022.
Huang, X. and Ding, A.: Aerosol as a critical factor causing forecast biases of air temperature in global numerical weather prediction models, Sci. Bull., 66, 1917–1924, https://doi.org/10.1016/j.scib.2021.05.009, 2021.
Huo, F., Liu, Y., Li, R., Wang, Y., Li, Z., Zhang, Y., and He, Q.: Reduction in autumn precipitation over Southwest China by anthropogenic aerosol emissions from eastern China, Atmos. Res., 257, 105627, https://doi.org/10.1016/j.atmosres.2021.105627, 2021.
IPCC: Climate Change 2013: The Physical Science Basis, in: Contribution of Working Group I to the Fifth Assessment Report of the Intergovernmental Panel on Climate Change, Cambridge University Press, Cambridge, UK and New York, NY, USA, https://doi.org/10.1017/CBO9781107415324, 2013.
IPCC: Climate Change 2021: The Physical Science Basis, in: Contribution of Working Group I to the Sixth Assessment Report of the Intergovernmental Panel on Climate Change, Cambridge University Press, Cambridge, UK and New York, NY, USA, https://doi.org/10.1017/9781009157896, 2021.
Khain, A., Rosenfeld, D., and Pokrovsky, A.: Aerosol impact on the dynamics and microphysics of deep convective clouds, Q. J. Roy. Meteorol. Soc., 131, 2639–2663, https://doi.org/10.1256/qj.04.62, 2005.
Khain, A., BenMoshe, N., and Pokrovsky, A.: Factors determining the impact of aerosols on surface precipitation from clouds: an attempt at classification, J. Atmos. Sci., 65, 1721–1748, https://doi.org/10.1175/2007JAS2515.1, 2008.
Kogan, Y. L. and Martin, W. J.: Parameterization of bulk condensation in numerical cloud models, J. Atmos. Sci., 51, 1728–1739, https://doi.org/10.1175/1520-0469(1994)051<1728:POBCIN>2.0.CO;2, 1994.
Koren, I., Kaufman, Y. J., Remer, L. A., and Martins, J. V.: Measurement of the effect of Amazon smoke on inhibition of cloud formation, Science, 303, 1342–1345, https://doi.org/10.1126/science.1089424, 2004.
Lee, S. S., Guo, J., and Li, Z.: Delaying precipitation by air pollution over the Pearl River Delta: 2. Model simulations, J. Geophys. Res.-Atmos., 121, 11739–11760, https://doi.org/10.1002/2015JD024362, 2016.
Li, G., Wang, Y., and Zhang, R.: Implementation of a two-moment bulk microphysics scheme to the WRF model to investigate aerosol–cloud interaction, J. Geophys. Res.-Atmos., 113, D15211, https://doi.org/10.1029/2007JD009361, 2008.
Li, G., Wang, Y., Lee, K.-H., Diao, Y., and Zhang, R.: Impacts of aerosols on the development and precipitation of a mesoscale squall line, J. Geophys. Res.-Atmos., 114, D17205, https://doi.org/10.1029/2008JD011581, 2009.
Li, G., Lei, W., Zavala, M., Volkamer, R., Dusanter, S., Stevens, P., and Molina, L. T.: Impacts of HONO sources on the photochemistry in Mexico City during the MCMA-2006/MILAGO Campaign, Atmos. Chem. Phys., 10, 6551–6567, https://doi.org/10.5194/acp-10-6551-2010, 2010.
Li, G., Bei, N., Tie, X., and Molina, L. T.: Aerosol effects on the photochemistry in Mexico City during MCMA-2006/MILAGRO campaign, Atmos. Chem. Phys., 11, 5169–5182, https://doi.org/10.5194/acp-11-5169-2011, 2011a.
Li, G., Zavala, M., Lei, W., Tsimpidi, A. P., Karydis, V. A., Pandis, S. N., Canagaratna, M. R., and Molina, L. T.: Simulations of organic aerosol concentrations in Mexico City using the WRF-CHEM model during the MCMA-2006/MILAGRO campaign, Atmos. Chem. Phys., 11, 3789–3809, https://doi.org/10.5194/acp-11-3789-2011, 2011b.
Li, G., Lei, W., Bei, N., and Molina, L. T.: Contribution of garbage burning to chloride and PM2.5 in Mexico City, Atmos. Chem. Phys., 12, 8751–8761, https://doi.org/10.5194/acp-12-8751-2012, 2012.
Li, Q., Zhang, H., Cai, X., Song, Y., and Zhu, T.: The impacts of the atmospheric boundary layer on regional haze in North China, npj Clim. Atmos. Sci., 4, 9, https://doi.org/10.1038/s41612-021-00165-y, 2021.
Li, Z., He, Y., Yu, S., Wang, H., Fan, F., Qin, C., Chen, Y., Dai, W., Jin, Z., and Zhao, D.: Intercomparison of multiple chemical mechanisms in simulating severe haze event over the North China Plain, Atmos. Environ., 361, 121439, https://doi.org/10.1016/j.atmosenv.2025.121439, 2025.
Lin, Q., Chen, J., Ou, T., Lai, H.-W., Prein, A. F., and Chen, D.: Performance of the WRF model at the convection-permitting scale in simulating snowfall and lake-effect snow over the Tibetan Plateau, J. Geophys. Res.-Atmos., 128, e2022JD038433, https://doi.org/10.1029/2022JD038433, 2023.
Liu, J., Yang, K., Wang, J., Zhou, X., Jiang, Y., Shao, C., Lu, H., Yao, X., Sun, J., and Shi, J.: Impacts of a shallow convection scheme on kilometer-scale atmospheric simulations over the Tibetan Plateau, Clim. Dynam., 62, 8019–8034, https://doi.org/10.1007/s00382-024-07320-0, 2024.
Liu, L., Ma, Y., Menenti, M., Zhang, X., and Ma, W.: Evaluation of WRF modeling in relation to different land surface schemes and initial and boundary conditions: A snow event simulation over the Tibetan Plateau, J. Geophys. Res.-Atmos., 124, 209–226, https://doi.org/10.1029/2018JD029208, 2019.
Makar, P. A., Gong, W., Milbrandt, J., Hogrefe, C., Zhang, Y., Curci, G., Žabkar, R., Im, U., Balzarini, A., Baró, R., Bianconi, R., Cheung, P., Forkel, R., Gravel, S., Hirtl, M., Honzak, L., Hou, A., Jiménez-Guerrero, P., Langer, M., Moran, M. D., Pabla, B., Pérez, J. L., Pirovano, G., San José, R., Tuccella, P., Werhahn, J., Zhang, J., and Galmarini, S.: Feedbacks between air pollution and weather, Part 1: Effects on weather, Atmos. Environ., 115, 442–469, https://doi.org/10.1016/j.atmosenv.2014.12.003, 2015.
Menon, S., Hansen, J., Nazarenko, L., and Luo, Y.: Climate effects of black carbon aerosols in China and India, Science, 297, 2250–2253, https://doi.org/10.1126/science.1075159, 2002.
Mitchell Jr., J. M.: The effect of atmospheric aerosols on climate with special reference to temperature near the earth's surface, J. Appl. Meteorol. Clim., 10, 703–714, https://doi.org/10.1175/1520-0450(1971)010<0703:TEOAAO>2.0.CO;2, 1971.
Moraglia, G. and Crippa, P.: Assessing the influence of aerosols on urban precipitation: a sensitivity study of Dallas–Fort Worth, Atmos. Res., 328, 108436, https://doi.org/10.1016/j.atmosres.2025.108436, 2026.
Morrison, H., Thompson, G., and Tatarskii, V.: Impact of cloud microphysics on the development of trailing stratiform precipitation in a simulated squall line: Comparison of one-and two-moment schemes, Mon. Weather Rev., 137, 991–1007, https://doi.org/10.1175/2008MWR2556.1, 2009.
Myhre, G., Samset, B. H., Schulz, M., Balkanski, Y., Bauer, S., Berntsen, T. K., Bian, H., Bellouin, N., Chin, M., Diehl, T., Easter, R. C., Feichter, J., Ghan, S. J., Hauglustaine, D., Iversen, T., Kinne, S., Kirkevåg, A., Lamarque, J.-F., Lin, G., Liu, X., Lund, M. T., Luo, G., Ma, X., van Noije, T., Penner, J. E., Rasch, P. J., Ruiz, A., Seland, Ø., Skeie, R. B., Stier, P., Takemura, T., Tsigaridis, K., Wang, P., Wang, Z., Xu, L., Yu, H., Yu, F., Yoon, J.-H., Zhang, K., Zhang, H., and Zhou, C.: Radiative forcing of the direct aerosol effect from AeroCom Phase II simulations, Atmos. Chem. Phys., 13, 1853–1877, https://doi.org/10.5194/acp-13-1853-2013, 2013.
Öktem, R., Romps, D. M., and Varble, A. C.: No warm-phase invigoration of convection detected during GoAmazon, J. Atmos. Sci., 80, 2345–2364, https://doi.org/10.1175/JAS-D-22-0241.1, 2023.
Peng, H., Hu, X., Ai, W., Qiao, J., and Zhao, X.: Effects of fine and coarse aerosols on the summer precipitation structure and microphysics over the Yangtze River Delta region, Atmos. Res., 326, 108277, https://doi.org/10.1016/j.atmosres.2025.108277, 2025.
Pinsky, M., Mazin, I. P., Korolev, A., and Khain, A.: Supersaturation and diffusional droplet growth in liquid clouds, J. Atmos. Sci., 70, 2778–2793, https://doi.org/10.1175/JAS-D-12-077.1, 2013.
Pravia-Sarabia, E., Montávez, J. P., Halifa-Marin, A., Jiménez-Guerrero, P., and Gómez-Navarro, J. J.: The Role of Aerosol Concentration on Precipitation in a Winter Extreme Mixed-Phase System: The Case of Storm Filomena, Remote Sens., 15, 1398, https://doi.org/10.3390/rs15051398, 2023.
Quaas, J.: Approaches to observe anthropogenic aerosol–cloud interactions, Curr. Clim. Change Rep., 1, 297–304, https://doi.org/10.1007/s40641-015-0028-0, 2015.
Romps, D. M., Latimer, K., Zhu, Q., Jurkat-Witschas, T., Mahnke, C., Prabhakaran, T., Weigel, R., and Wendisch, M.: Air pollution unable to intensify storms via warm-phase invigoration, Geophys. Res. Lett., 50, e2022GL100409, https://doi.org/10.1029/2022GL100409, 2023.
Rosenfeld, D.: TRMM observed first direct evidence of smoke from forest fires inhibiting rainfall, Geophys. Res. Lett., 26, 3105–3108, https://doi.org/10.1029/1999GL006066, 1999.
Rosenfeld, D., Dai, J., Yu, X., Yao, Z., Xu, X., Yang, X., and Du, C.: Inverse relations between amounts of air pollution and orographic precipitation, Science, 315, 1396–1398, https://doi.org/10.1126/science.1137949, 2007.
Rosenfeld, D., Lohmann, U., Raga, G. B., O'Dowd, C. D., Kulmala, M., Fuzzi, S., Reissell, A., and Andreae, M. O.: Flood or drought: how do aerosols affect precipitation?, Science, 321, 1309–1313, https://doi.org/10.1126/science.1160606, 2008.
Ryu, Y.-H. and Min, S.-K.: Greenhouse warming and anthropogenic aerosols synergistically reduce springtime rainfall in low-latitude East Asia, npj Clim. Atmos. Sci., 5, 69, https://doi.org/10.1038/s41612-022-00295-x, 2022.
Saleeby, S. M., Cotton, W. R., and Fuller, J. D.: The cumulative impact of cloud droplet nucleating aerosols on orographic snowfall in Colorado, J. Appl. Meteorol. Clim., 50, 599–612, https://doi.org/10.1175/2010JAMC2498.1, 2010.
Shao, T., Zhang, H., Xu, X., Li, J., Wu, S., and Liu, Y.: Role of anthropogenic aerosols in affecting different-grade precipitation over eastern China: a case study, Sci. Total Environ., 807, 150886, https://doi.org/10.1016/j.scitotenv.2021.150886, 2022.
Sun, N., Fu, Y., Zhong, L., and Li, R.: Aerosol effects on the vertical structure of precipitation in East China, npj Clim. Atmos. Sci., 5, 60, https://doi.org/10.1038/s41612-022-00284-0, 2022.
Sun, Y. and Zhao, C.: Distinct impacts on precipitation by aerosol radiative effect over three different megacity regions of eastern China, Atmos. Chem. Phys., 21, 16555–16574, https://doi.org/10.5194/acp-21-16555-2021, 2021.
Tao, W. K., Li, X. W., Khain, A., Matsui, T., and Lang, S.: Role of atmospheric aerosol concentration on deep convective precipitation: cloud-resolving model simulation, J. Geophys. Res.-Atmos., 112, D24S18, https://doi.org/10.1029/2007JD008728, 2007.
Thompson, G. and Eidhammer, T.: A study of aerosol impacts on clouds and precipitation development in a large winter cyclone, J. Atmos. Sci., 71, 3636–3658, https://doi.org/10.1175/JAS-D-13-0305.1, 2014.
Travis, K. R., Nault, B. A., Crawford, J. H., Kim, H., Chen, Q., Zheng, Y., Liu, T., Jimenez, J. L., Campuzano-Jost, P., Wennberg, P. O., Crounse, J. D., and Huey, L. G.: Year-round analysis of multiphase sulfate production in aerosol particles in East Asia, ACS ES&T Air, 2, 1758–1769, https://doi.org/10.1021/acsestair.5c00136, 2025.
Twomey, S.: The influence of pollution on the shortwave albedo of clouds, J. Atmos. Sci., 34, 1149–1152, https://doi.org/10.1175/1520-0469(1977)034<1149:TIOPOT>2.0.CO;2, 1977.
Varble, A. C., Igel, A. L., Morrison, H., Grabowski, W. W., and Lebo, Z. J.: Opinion: A critical evaluation of the evidence for aerosol invigoration of deep convection, Atmos. Chem. Phys., 23, 13791–13808, https://doi.org/10.5194/acp-23-13791-2023, 2023.
Wang, W., Chen, G., and Zhang, Y.: Role of aerosol ice-nucleus effect in the development of the “21⋅7” Henan extreme precipitation, J. Geophys. Res.-Atmos., 129, e2024JD041487, https://doi.org/10.1029/2024JD041487, 2024.
Wang, Y., Wan, Q., Meng, W., Liao, F., Tan, H., and Zhang, R.: Long-term impacts of aerosols on precipitation and lightning over the Pearl River Delta megacity area in China, Atmos. Chem. Phys., 11, 12421–12436, https://doi.org/10.5194/acp-11-12421-2011, 2011.
Wilcox, E. M., Thomas, R. M., Praveen, P. S., Pistone, K., Bender, F. A.-M., and Ramanathan, V.: Black carbon solar absorption suppresses turbulence in the atmospheric boundary layer, P. Natl. Acad. Sci. USA, 113, 11794–11799, https://doi.org/10.1073/pnas.1525746113, 2016.
Wu, J., Bei, N., Wang, Y., Su, X., Zhang, N., Wang, L., Hu, B., Wang, Q., Jiang, Q., Zhang, C., Liu, Y., Wang, R., Li, X., Lu, Y., Liu, Z., Cao, J., Tie, X., Li, G., and Seinfeld, J. H.: Aerosol light absorption alleviates particulate pollution during wintertime haze events, P. Natl. Acad. Sci. USA, 122, e2402281121, https://doi.org/10.1073/pnas.2402281121, 2025.
Xiao, Z., Zhu, S., Miao, Y., Yu, Y., and Che, H.: On the relationship between convective precipitation and aerosol pollution in the North China Plain during autumn and winter, Atmos. Res., 271, 106120, https://doi.org/10.1016/j.atmosres.2022.106120, 2022.
Xie, X., Myhre, G., Shindell, D., Faluvegi, G., Takemura, T., Voulgarakis, A., Shi, Z., Li, X., Xie, X., Liu, H., Liu, X., and Liu, Y.: Anthropogenic sulfate aerosol pollution in South and East Asia induces increased summer precipitation over arid Central Asia, Commun. Earth Environ., 3, 328, https://doi.org/10.1038/s43247-022-00660-x, 2022.
Yang, X. and Li, Z.: Increases in thunderstorm activity and relationships with air pollution in southeast China, J. Geophys. Res.-Atmos., 119, 1835–1844, https://doi.org/10.1002/2013JD021224, 2014.
Yang, X., Ferrat, M., and Li, Z.: New evidence of orographic precipitation suppression by aerosols in central China, Meteorol. Atmos. Phys., 119, 17–29, https://doi.org/10.1007/s00703-012-0221-9, 2013a.
Yang, X., Yao, Z., Li, Z., and Fan, T.: Heavy air pollution suppresses summer thunderstorms in central China, J. Atmos. Sol. Terr. Phy., 95, 28–40, https://doi.org/10.1016/j.jastp.2012.12.023, 2013b.
Yun, Y., Zhang, D.-L., Gao, W., Yin, J., Zhao, C., Li, J., Guo, J., and Liu, H.: Spatiotemporal variations of the effects of aerosols on clouds and precipitation in an extreme-rain-producing MCS in South China, J. Geophys. Res.-Atmos., 129, e2023JD040014, https://doi.org/10.1029/2023JD040014, 2024.
Zhang, L., Wu, P., and Zhou, T.: Aerosol forcing of extreme summer drought over North China, Environ. Res. Lett., 12, 034020, https://doi.org/10.1088/1748-9326/aa5fb0, 2017.
Zhang, W., Wang, H., Zhang, X., Huang, L., Peng, Y., Liu, Z., Zhang, X., and Che, H.: Aerosol–cloud interaction in the atmospheric chemistry model GRAPES_Meso5.1/CUACE and its impacts on mesoscale numerical weather prediction under haze pollution conditions in Jing–Jin–Ji in China, Atmos. Chem. Phys., 22, 15207–15221, https://doi.org/10.5194/acp-22-15207-2022, 2022.
Zhang, Y., Easter, R. C., Ghan, S. J., and Abdul-Razzak, H.: Impact of aerosol size representation on modeling aerosol-cloud interactions, J. Geophys. Res.-Atmos., 107, 4558, https://doi.org/10.1029/2001JD001549, 2002.
Zhao, C., Sun, Y., Yang, J., Li, J., Zhou, Y., Yang, Y., Fan, H., and Zhao, X.: Observational evidence and mechanisms of aerosol effects on precipitation, Sci. Bull., 69, 1569–1580, https://doi.org/10.1016/j.scib.2024.03.014, 2024.
Zhou, Y., Zhao, C., and Sun, Y.: A modeling study of aerosol effect on summer nocturnal convective precipitation in Beijing, Atmos. Res., 305, 107430, https://doi.org/10.1016/j.atmosres.2024.107430, 2024.