
the Creative Commons Attribution 4.0 License.
the Creative Commons Attribution 4.0 License.
 | 21 Aug 2026
Strategic design of methane observation networks to improve emission estimates: A case study in Africa
Hui Li

Philippe Ciais
Frédéric Chevallier
Paul I. Palmer
Frank Hase
Morgan Lopez
Elsa M. Ordway
Shushi Peng
Danielle Monteverde
Michel Ramonet
Jason M. St. Clair
Le Bienfaiteur Sagang
Benjamin Poulter
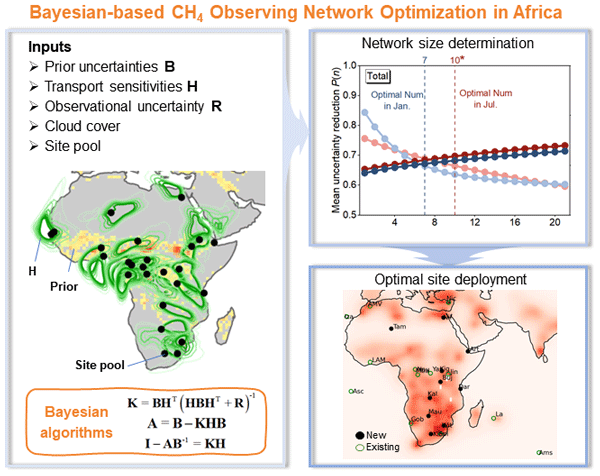
Ground-based and satellite atmospheric observations are essential for reducing uncertainties in methane (CH4) emissions by atmospheric inversion, particularly in data-sparse regions such as Africa. However, adding new observation sites does not yield linear improvements of emission uncertainties because overlapping transport sensitivities reduces marginal information gain. Here we develop a Bayesian framework to strategically optimize CH4 observation network design for column retrievals from upward-looking Fourier Transform Infrared (FTIR) spectrometers (e.g., EM27/SUN), jointly identifying the optimal number of sites and their spatial configuration. The framework quantifies uncertainty reduction for grid-point (1°) total and sectoral emissions while accounting for transport redundancy, cloud screening, and observational errors. Using January and July as representative months, we find that uncertainty reduction increases rapidly during early network expansion but gradually saturates beyond a certain number of additional sites. An optimized configuration of ten new sites added to the existing network achieves over 65 % reduction in prior uncertainty for total African CH4 emissions in both months, with comparable improvements across fire, wetland, and anthropogenic sectors. Sensitivity analyses indicate that while the optimal number of sites varies with assumptions about cloud filtering, the spatial configuration remains robust, supporting cost-effective observation network design in data-sparse regions.
- Article
(4287 KB) - Full-text XML
-
Supplement
(3675 KB) - BibTeX
- EndNote


Methane (CH4) emissions from Africa play a critical role in the global CH4 budget, accounting for approximately 14 %–16 % of global emissions during 2000–2019 (Saunois et al., 2025; Lunt et al., 2019; Ernst et al., 2024). Beyond being a major emitting region over the last two decades, Africa has emerged as a dominant contributor to the recent spike of the global CH4 emission growth rate, contributing nearly 50 % of the global emission increase in recent years (Qu et al., 2022; Feng et al., 2023). This rise has been largely attributed to enhanced wetland emissions linked to intensifying rainfall and hydroclimatic variability (Helfter et al., 2021). The potential for rapid socio-economic development and land-use change in Africa in the coming decades further elevates the region's importance in the global CH4 budget (Ernst et al., 2024; Gunaratne et al., 2025). Despite this growing significance, African methane emissions remain among the most uncertain of all major source regions, underscoring the need for improved constraints given the region's high vulnerability to climate change (Saunois et al., 2025; Gunaratne et al., 2025). These large uncertainties arise not only from bottom-up inventories, where activity data and emission factors are often incomplete or poorly constrained, but also from top-down inversion approaches that rely on atmospheric observations (Mostefaoui et al., 2024). In Africa, the effectiveness of atmospheric inversions is severely limited by the scarcity of observational constraints (Valentini et al., 2014; Ciais et al., 2011). Although satellite observations provide valuable large-scale coverage, their ability to accurately constrain African CH4 emission estimates is hindered by overhead cloud cover, surface reflectance variability, and limited opportunities for independent validation (Mengistu and Mengistu Tsidu, 2020; Western et al., 2021; Cressot et al., 2016). Yet, ground-based measurements needed to calibrate, validate, and compensate for gaps in satellite observations are especially sparse in Africa (Merbold et al., 2021; Gaubert et al., 2023). The Total Carbon Column Observing Network (TCCON) currently includes only four sites (Ascencion, Izaña, La Réunion, and Nicosia) with partial African coverage (Wunch et al., 2011), which are located on surrounding islands, offering limited sensitivity to major inland emission hotspots, particularly across Central Africa (discussed in Sect. 3.1).
Previous studies made the case that strengthening ground-based atmospheric observations can substantially reduce posterior uncertainties in atmospheric inversions, as illustrated by the dense observation networks in Europe, North America, and China (Kadygrov et al., 2015; Palmer et al., 2019; Ganesan et al., 2015; Zhang et al., 2022; Villalobos et al., 2025; Thanwerdas et al., 2026). These networks typically combine multiple observing systems, including tall towers that provide continuous, high-precision measurements of CH4 and other trace gases in the planetary boundary layer, and aircraft profiles that sample vertical concentration gradients over regional scales (Sasakawa et al., 2010; Adame et al., 2024; Sweeney et al., 2022; Liu et al., 2025). While these dense networks should offer strong constraints, they require substantial infrastructure, logistical support, and long-term maintenance, making their deployment particularly challenging in remote regions. As a lower-cost alternative, EM27/SUN Fourier Transform Infrared (FTIR) spectrometers have been increasingly used for ground-based column retrievals of greenhouse gases (such as CO2 and CH4) (Hase et al., 2016; Humpage et al., 2024; Park et al., 2024). Unlike tall tower measurements that mainly capture near-surface concentrations, column observations integrate signals over a deeper tropospheric layer and are therefore representative of broader regional footprints (Keppel-Aleks et al., 2013). EM27/SUN instruments are portable, require relatively limited infrastructure and maintenance, and can be deployed in regions where tall towers or aircraft operations would be impractical or extremely costly (Frey et al., 2019). However, EM27/SUN have limitations, including retrievals restricted to daytime and clear-sky conditions, and the need for careful inter-calibration to ensure network consistency. Despite these constraints, recent studies have demonstrated that EM27/SUN-based networks can effectively enhance observational constraints and reduce posterior uncertainties in atmospheric inversions (Alberti et al., 2022; Kurganskiy et al., 2025; Zhou et al., 2025). Accordingly, the column-average dry-air mole fraction of CH4 (XCH4) is adopted as the assumed observed variable in this study, with EM27/SUN as the default observation platform. This configuration drives our network design framework.
Importantly, simply increasing the number of observation sites is neither scientifically optimal nor economically feasible (Nickless et al., 2020a). As station density increases, the observation footprints of concentrations to the emissions to be retrieved increasingly overlap, leading to diminishing marginal information gain due to redundant transport sensitivities (Kadygrov et al., 2015). Given the costs associated with station deployment, operation, and maintenance, an optimized cost-effective observing strategy is required to balance uncertainty reduction against observational redundancy and resource constraints (Merbold et al., 2021). Information-based network design approaches within Bayesian inversion frameworks have been developed to address this challenge (Kaminski and Rayner, 2017). These methods quantify posterior uncertainty reduction under alternative observing configurations and have been applied at regional scales to evaluate station placement and prior error sensitivity (Merbold et al., 2021). However, most existing studies focus on configuration ranking of tall-tower networks, particularly in the case of Africa (Nickless et al., 2020b; Lauvaux et al., 2012), whereas spatial optimization of FTIR column networks under cloud constraints remains limited.
Here, we use the African continent, a region with enormous observational gaps, as a case study to develop a systematic framework for optimal XCH4 atmospheric observation network design. The proposed framework is built upon a Bayesian approach that strategically and explicitly quantifies uncertainty reduction under incremental network expansion, allowing both the optimal number of stations and their spatial configuration to be identified. Determining the optimal network size provides an evidence-based approach for proposing a realistic number of new stations from a large set of potential candidates, before selecting the most effective spatial configuration. By accounting for footprint (i.e., atmospheric transport) overlap, cloud-related observational limitations, and sector-specific emission characteristics, the framework provides quantitative guidance for cost-effective network design. Sensitivity experiments further demonstrate that while the optimal number of sites responds to assumptions about cloud effects, the resulting spatial configuration of optimized sites is robust across a certain range of parameter settings, underscoring the reliability of the proposed approach.
This section describes the methodological framework developed to evaluate and optimize a future XCH4 observation network over Africa, focusing on observing and quantifying CH4 emissions. The framework quantifies the reduction in emission uncertainty provided by atmospheric observations and identifies cost-efficient network designs under specified observational and deployment constraints. Posterior uncertainty reduction is calculated using the conventional Bayesian principles, while the network-design component evaluates all candidate-site combinations across a range of network sizes to determine both an optimal number of additional stations and their optimal spatial configuration. Site-specific cloud-driven data availability is incorporated, and the candidate pool is restricted to locations considered realistically feasible for EM27/SUN deployment based on consultation and assessment of local hosting and operational capacity. The framework can therefore inform both practical network planning and phased implementation. The analysis focuses on January and July 2025, which represent two contrasting meteorological regimes and emission backgrounds over the African continent. These two periods are selected to capture the seasonal variability of CH4 sources and atmospheric transport that is critical for network design. Section 2.1 introduces the Bayesian inversion principles used to quantify the emission uncertainty reduction, including the formulation of the prior error covariance matrix and the representation of atmospheric transport sensitivities. Section 2.2 presents the strategic Bayesian network design framework developed to efficiently determine both the optimal number of new observation sites and their spatial configuration. Section 2.3 assesses the influence of the assumed spatial error correlation length on posterior variance reduction. Section 2.4 describes the treatment of cloud fraction and its incorporation into observational constraints. The notation in this paper follows Rayner et al. (2019), where uppercase bold symbols denote matrices and lowercase bold italic symbols denote vectors.
2.1 Bayesian algorithms
The impact of atmospheric observations on CH4 emission estimates is quantified using a Bayesian inversion framework, in which prior information on monthly gridded surface emissions is updated by observational constraints through atmospheric transport modelling. The Kalman gain matrix (K) determines the relative influence of observations and prior information in the posterior update (Rodgers, 2000; Rayner et al., 2019):
where B denotes the prior emission error covariance matrix, H is the Jacobian matrix (also known as footprint or transport sensitivity) linking surface emissions to XCH4 observations, R is the observational error covariance matrix. The observational error covariance R is prescribed as diagonal, with a constant standard deviation of 5 parts per billion (ppb) as the default value, consistent with the expected retrieval precision of EM27/SUN spectrometers (Doc et al., 2026). Doing this, we neglect the contributions of H (i.e., the model error) and of the sub-monthly and sub-pixel emission variability (i.e., the aggregation error) in the error budget.
In this study, the prior uncertainty for each grid cell is defined as 150 % of the maximum value of the prior emissions among the eight nearest neighboring grid cells for the corresponding month. The scaling factor adopted here (150 %) is slightly higher than values used in previous studies (e.g., 120 %) (Cressot et al., 2014), in order to account for the higher spatial resolution and the limited number of emission inventories applied in this work. Four emission categories include total (sum of anthropogenic and natural sources), fire, wetlands, and anthropogenic CH4 (data sources are listed in Table S1) (van der Werf et al., 2025, 2017; Kaiser et al., 2012; McDuffie et al., 2020; Crippa et al., 2024). The number of adopted inventories is limited (three datasets for fire and anthropogenic emissions, and four for wetlands, seen in Table S1). While this may influence the exact optimized configurations under the prescribed prior, it does not fundamentally affect the framework performance. As shown in Sect. 3.4, the test with spatially perturbed prior fields demonstrate that the framework adaptively adjusts site layouts in response to changes in prior spatial structure. All prior data are acquired for the year 2023, representing the most up-to-date ensemble of different emission inventories currently available. The reference year of the inventories therefore differs from that of the meteorology used for the transport simulations (2025). This temporal mismatch is not ideal, particularly for meteorology-sensitive natural sources such as wetlands and fires, and may affect the absolute uncertainty reductions or the placement of individual sites. However, because all candidate networks are evaluated consistently using the same prior and transport framework, the main relative spatial priorities and overall methodological conclusions are expected to remain broadly robust. All prior monthly emission fields are first regridded to a common 1° × 1° grid to ensure consistency with H and then the uncertainties are estimated. The prior error covariance matrix is constructed as:
where d is a vector of gridded 1σ prior uncertainties, and C is a spatial correlation matrix. Spatial correlations Cij between grid cells i and j are represented using an exponential decay function:
where dij is the distance between grid cells i and j on the sphere. A land–sea mask is applied to prevent correlations between land and ocean grid cells, and a horizontal correlation length scale of 500 km is assumed over land and ocean. The sensitivity analyses to determine this value are detailed in Sect. 2.3. The resulting covariance matrix B is constructed separately for each target month and emission sector at 1° resolution. The resulting uncertainty budgets are comparable to those reported in previous studies (Fig. S1), as discussed in Sect. 2.3.
Transport sensitivities (H) are derived from adjoint simulations of the LMDZ model (Hourdin et al., 2020) in January and July 2025, run globally at approximately 90 km horizontal resolution using a hexagonal grid and 79 vertical layers. This relatively high resolution for a global transport model allows realistic representation of regional transport patterns while avoiding the need for lateral boundary conditions required by regional models. For simplicity, we assume that the observations are directly XCH4, without any specific averaging kernel and associated retrieval prior profile. Chemical loss processes are neglected, as the analysis focuses on a within-month timescale. Flux sensitivities are reprojected onto the 1° grid within H using the adjoint of a mass-conserving flux interpolation, ensuring consistency between the inversion control vector and the sensitivity matrix. Details of the LMDZ hexagonal-grid simulations are provided in Chevallier et al. (2025). This model is run for full calendar months. In order to avoid running the adjoint over more than one calendar month at a time, we take only XCH4 observations into account during the second half of the month. Thus, the sensitivity of the earliest observation of a month to surface fluxes from previous months is assumed to be sufficiently diluted so as not to significantly improve knowledge of African emissions. Observations at each site are simulated once per day at local noon, and the adjoint model is integrated backward to the first day of the same month, resulting in backward integration lengths ranging from 16 to 30 d depending on the month. Examples of site-specific footprint sensitivities are shown in Fig. S2. The posterior error covariance matrix A is given by:
and the relative reduction in uncertainty brought by these observations can be expressed as:
In this study, posterior uncertainty reduction relative to the prior is used as the primary metric to evaluate and compare different observation network configurations. It is important to note that the uncertainty reductions reported here should be interpreted as a proxy for the potential information gain achievable by an optimized network, rather than as a direct prediction of operational inversion performance. This is partly due to simplifying assumptions adopted for network design purposes, including the use of transport sensitivities derived from half-month adjoint integrations and prescribed, spatially uniform observation uncertainties.
2.2 A strategic Bayesian network design framework
Building on the Bayesian inversion framework described above, we develop a strategic Bayesian network design framework to optimize XCH4 observation networks of new FTIR instruments beyond the existing six stations surrounding Africa and the three in Ivory Coast, Namibia, and shore of Lake Victoria. Among these operational sites, four (Ascension, Izaña, La Réunion, and Nicosia) belong to the TCCON network, which operates high-resolution FTIR spectrometers (typically Bruker Optik GmbH IFS 125HR FTS) (Pollard et al., 2021), whereas the remaining stations use lower-cost EM27/SUN instruments. Three of these stations (LAMTO, AMV, and Amsterdam Island) are operated by the Laboratory for Climate and Environmental Sciences (LSCE), one (Gobabeb) by the Karlsruhe Institute of Technology (KIT), and one (Jinja) by the University of Leicester (Table S2). The framework quantifies how posterior uncertainty in African CH4 emissions responds to incremental network expansion and identifies an optimal balance between information gain and network size. The optimization assumes a predefined candidate site pool reflecting practical deployment constraints. For the African case study, the pool consists of nine existing stations, predominantly located along the continental periphery, four planned African sites outside the current operational network, and 21 additional candidate sites, yielding 34 potential locations in total (Table S2). The candidate locations were identified through consultation with project partners and selected to balance scientific relevance with preliminary deployment feasibility. Specifically, they were chosen to improve coverage of major African methane-emission regions, including areas with high prior emissions, while also considering the prospective availability of local institutional support and basic research infrastructure, such as universities, observatories, or field stations capable of hosting, operating, and maintaining an EM27/SUN instrument. Their inclusion in the candidate pool does not imply a confirmed deployment commitment, and final installation would require further site-specific logistical and technical assessment. The nine operational and four planned African sites are treated as a fixed baseline network, while the remaining candidate sites are considered for incremental expansion. The framework simultaneously determines the optimal number of additional observation sites based on uncertainty-reduction efficiency and identifies the spatial configuration of sites that minimizes posterior uncertainty at the prescribed network size using Bayesian evaluation.
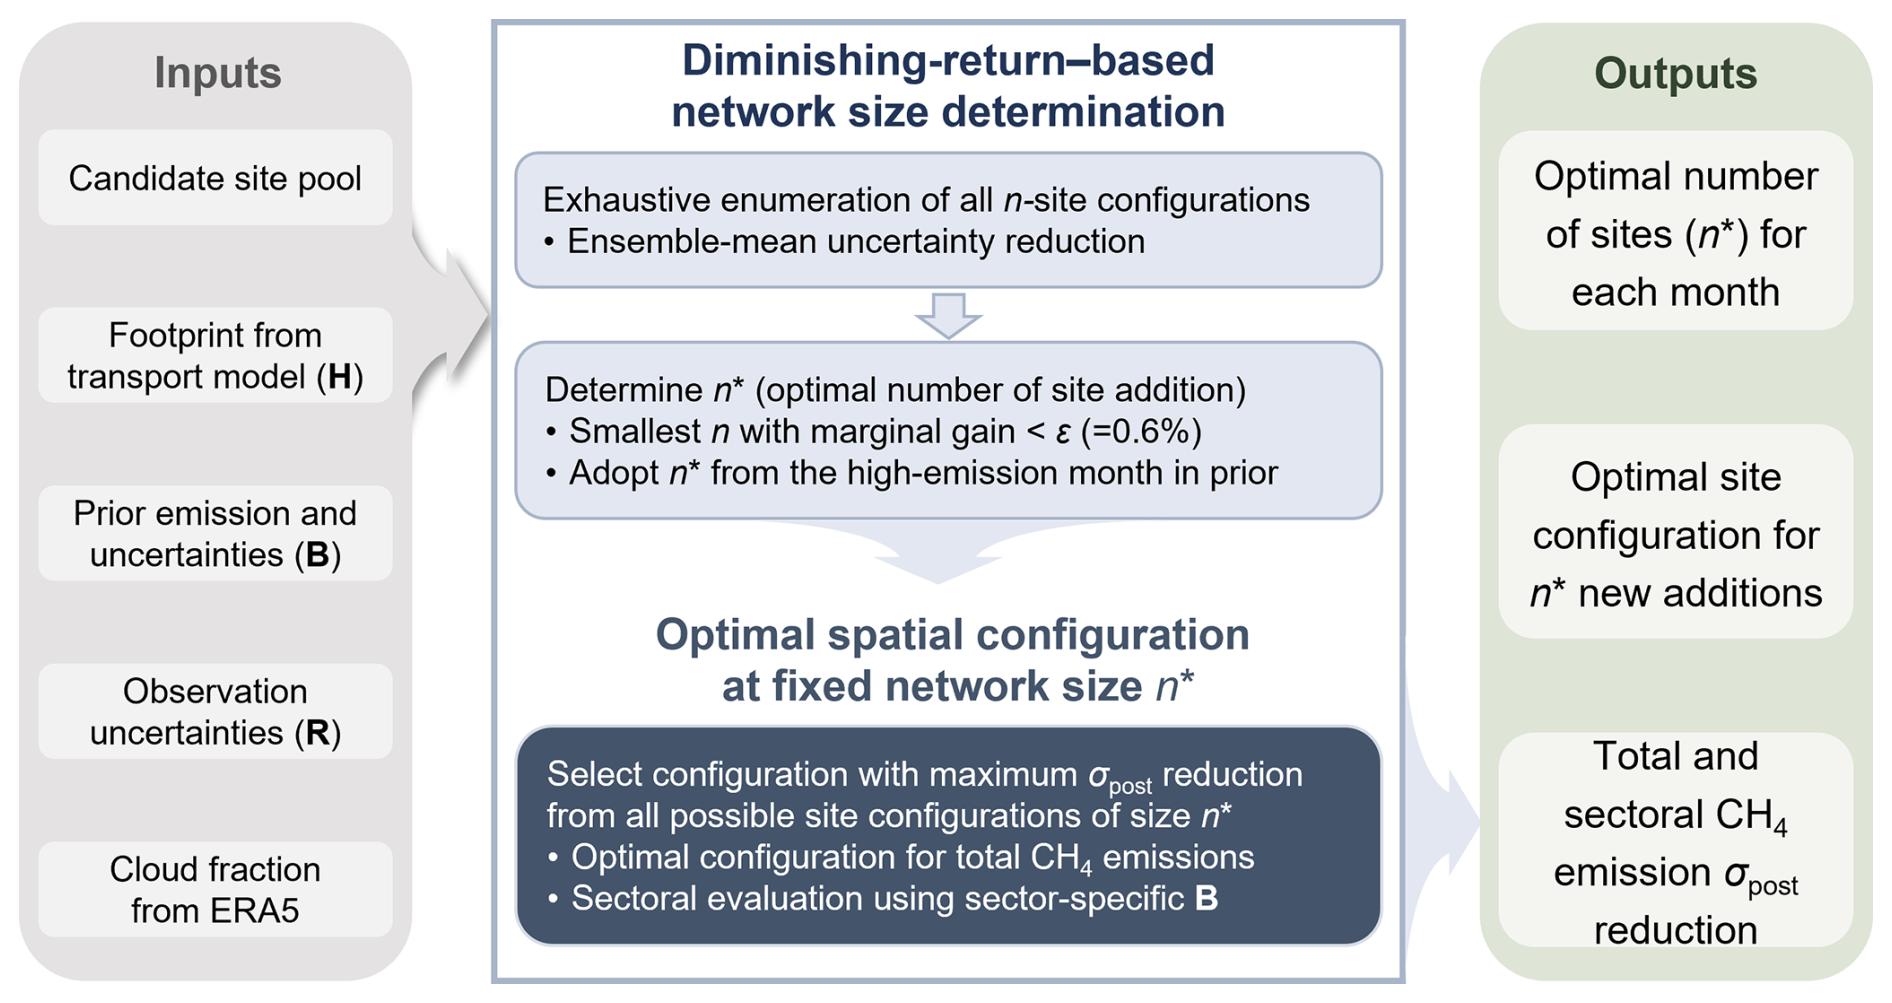
Figure 1The Bayesian network design framework for atmospheric XCH4 observations. The parameter explanation and default settings are listed in Table S3.
This system first quantifies how posterior uncertainty in spatially integrated African CH4 emissions decreases as additional observation sites are introduced, with the goal of determining an efficient network size prior to optimizing the exact site locations. Let x∈ℝN denote the gridded emission state vector. The target quantity is defined as a linear functional of the state:
where l is an aggregation vector (i.e., grid emissions in Africa). The corresponding prior uncertainty is obtained by applying this operator to the prior covariance B:
For a given network configuration c, we construct the observation operator Hc by stacking all available daily column sensitivities from the base network plus the selected candidate sites after cloud filtering, and compute the posterior covariance Ac following the Bayesian update described in Sect. 2.1,
The posterior uncertainty of the same aggregated quantity is then estimated:
We then quantify the information gain for configuration c using the relative uncertainty reduction r(c):
For each candidate number of additional site n, we evaluate an ensemble of configurations formed by combining the fixed base network with all (exhaustively enumerated) n-site subsets from the candidate pool. This yields an ensemble of σpost(c) and thus r(c) values that reflects both transport-sensitivity overlap and cloud-driven data availability constraints. The ensemble-mean uncertainty reduction at network size n is denoted as P(n):
We summarize network-size performance by the ensemble-mean reduction. The optimal number of additional sites n* is determined using a diminishing-return criterion: n* is the smallest n for which the relative marginal gain () falls below a prescribed threshold ϵ=0.6 %, corresponding to a 0.6 % additional reduction per added site (sensitivity tests shown in Sect. 3.4).
Given the optimal network size n*, the optimal configuration is selected from the ensemble of configurations with n=n* as the one that provides the largest uncertainty reduction in total African CH4 emissions. Sector-specific uncertainty reductions are subsequently evaluated by applying sectoral prior covariance matrices B, while retaining the same transport sensitivities H. Differences in uncertainty reduction across sectors therefore primarily reflect contrasts in prior uncertainty structures rather than transport sensitivities.
2.3 The impact of assumed prior error correlation length on uncertainty reduction
The horizontal correlation length determines how prior emission errors are spatially coupled in the covariance matrix B. In simple terms, it controls how strongly emission errors in one grid cell are assumed to be correlated with those in neighboring cells. A larger correlation length implies that flux corrections inferred at one location can spread over a broader surrounding region, effectively distributing observational information across larger spatial scales. This generally leads to more optimistic large-scale uncertainty reduction, whereas shorter correlation lengths confine corrections to local scales and yield more conservative reductions. To assess the sensitivity of our results to this assumption, we conducted experiments with correlation lengths ranging from no spatial correlation to 1000 km (Fig. 2). Posterior uncertainty reduction increases substantially with larger correlation lengths. For example, the reduction achieved by the existing nine operational sites rises from 18 % under no correlation to 76 % at 1000 km. This increase is nonlinear and gradually saturates, with a clear flattening beyond approximately 500 km. We therefore adopt 500 km as the default value, representing a pragmatic compromise between local and large-scale coupling. Under this assumption, the resulting global prior uncertainty budget is approximately 88 Tg yr−1 (∼ 17 %) (Fig. S1), which is close to the ∼ 18 % global uncertainty reported by Saunois et al. (2025). Regional uncertainty budgets over Africa are estimated to range between 33 % and 50 %, which fall within, though slightly below, the broader range of 31 %–90 %. These comparisons suggest that the magnitude of the prescribed prior uncertainties is broadly consistent with current global methane budget assessments.
At present, the lack of dense biogeochemical in situ flux observations over Africa prevents an empirical constraint on spatial error correlations. The adopted length scale should thus be regarded as a structural assumption rather than a directly observed quantity. Given the strong spatial heterogeneity of wetland emissions, true correlations likely vary across regions and seasons. While the assumed correlation length substantially affects the absolute magnitude of posterior uncertainty reduction, it has limited influence on the relative ranking of network configurations. The incremental gains from adding new sites remain consistent across the tested range, indicating that the optimization results are robust to reasonable variations in this parameter.
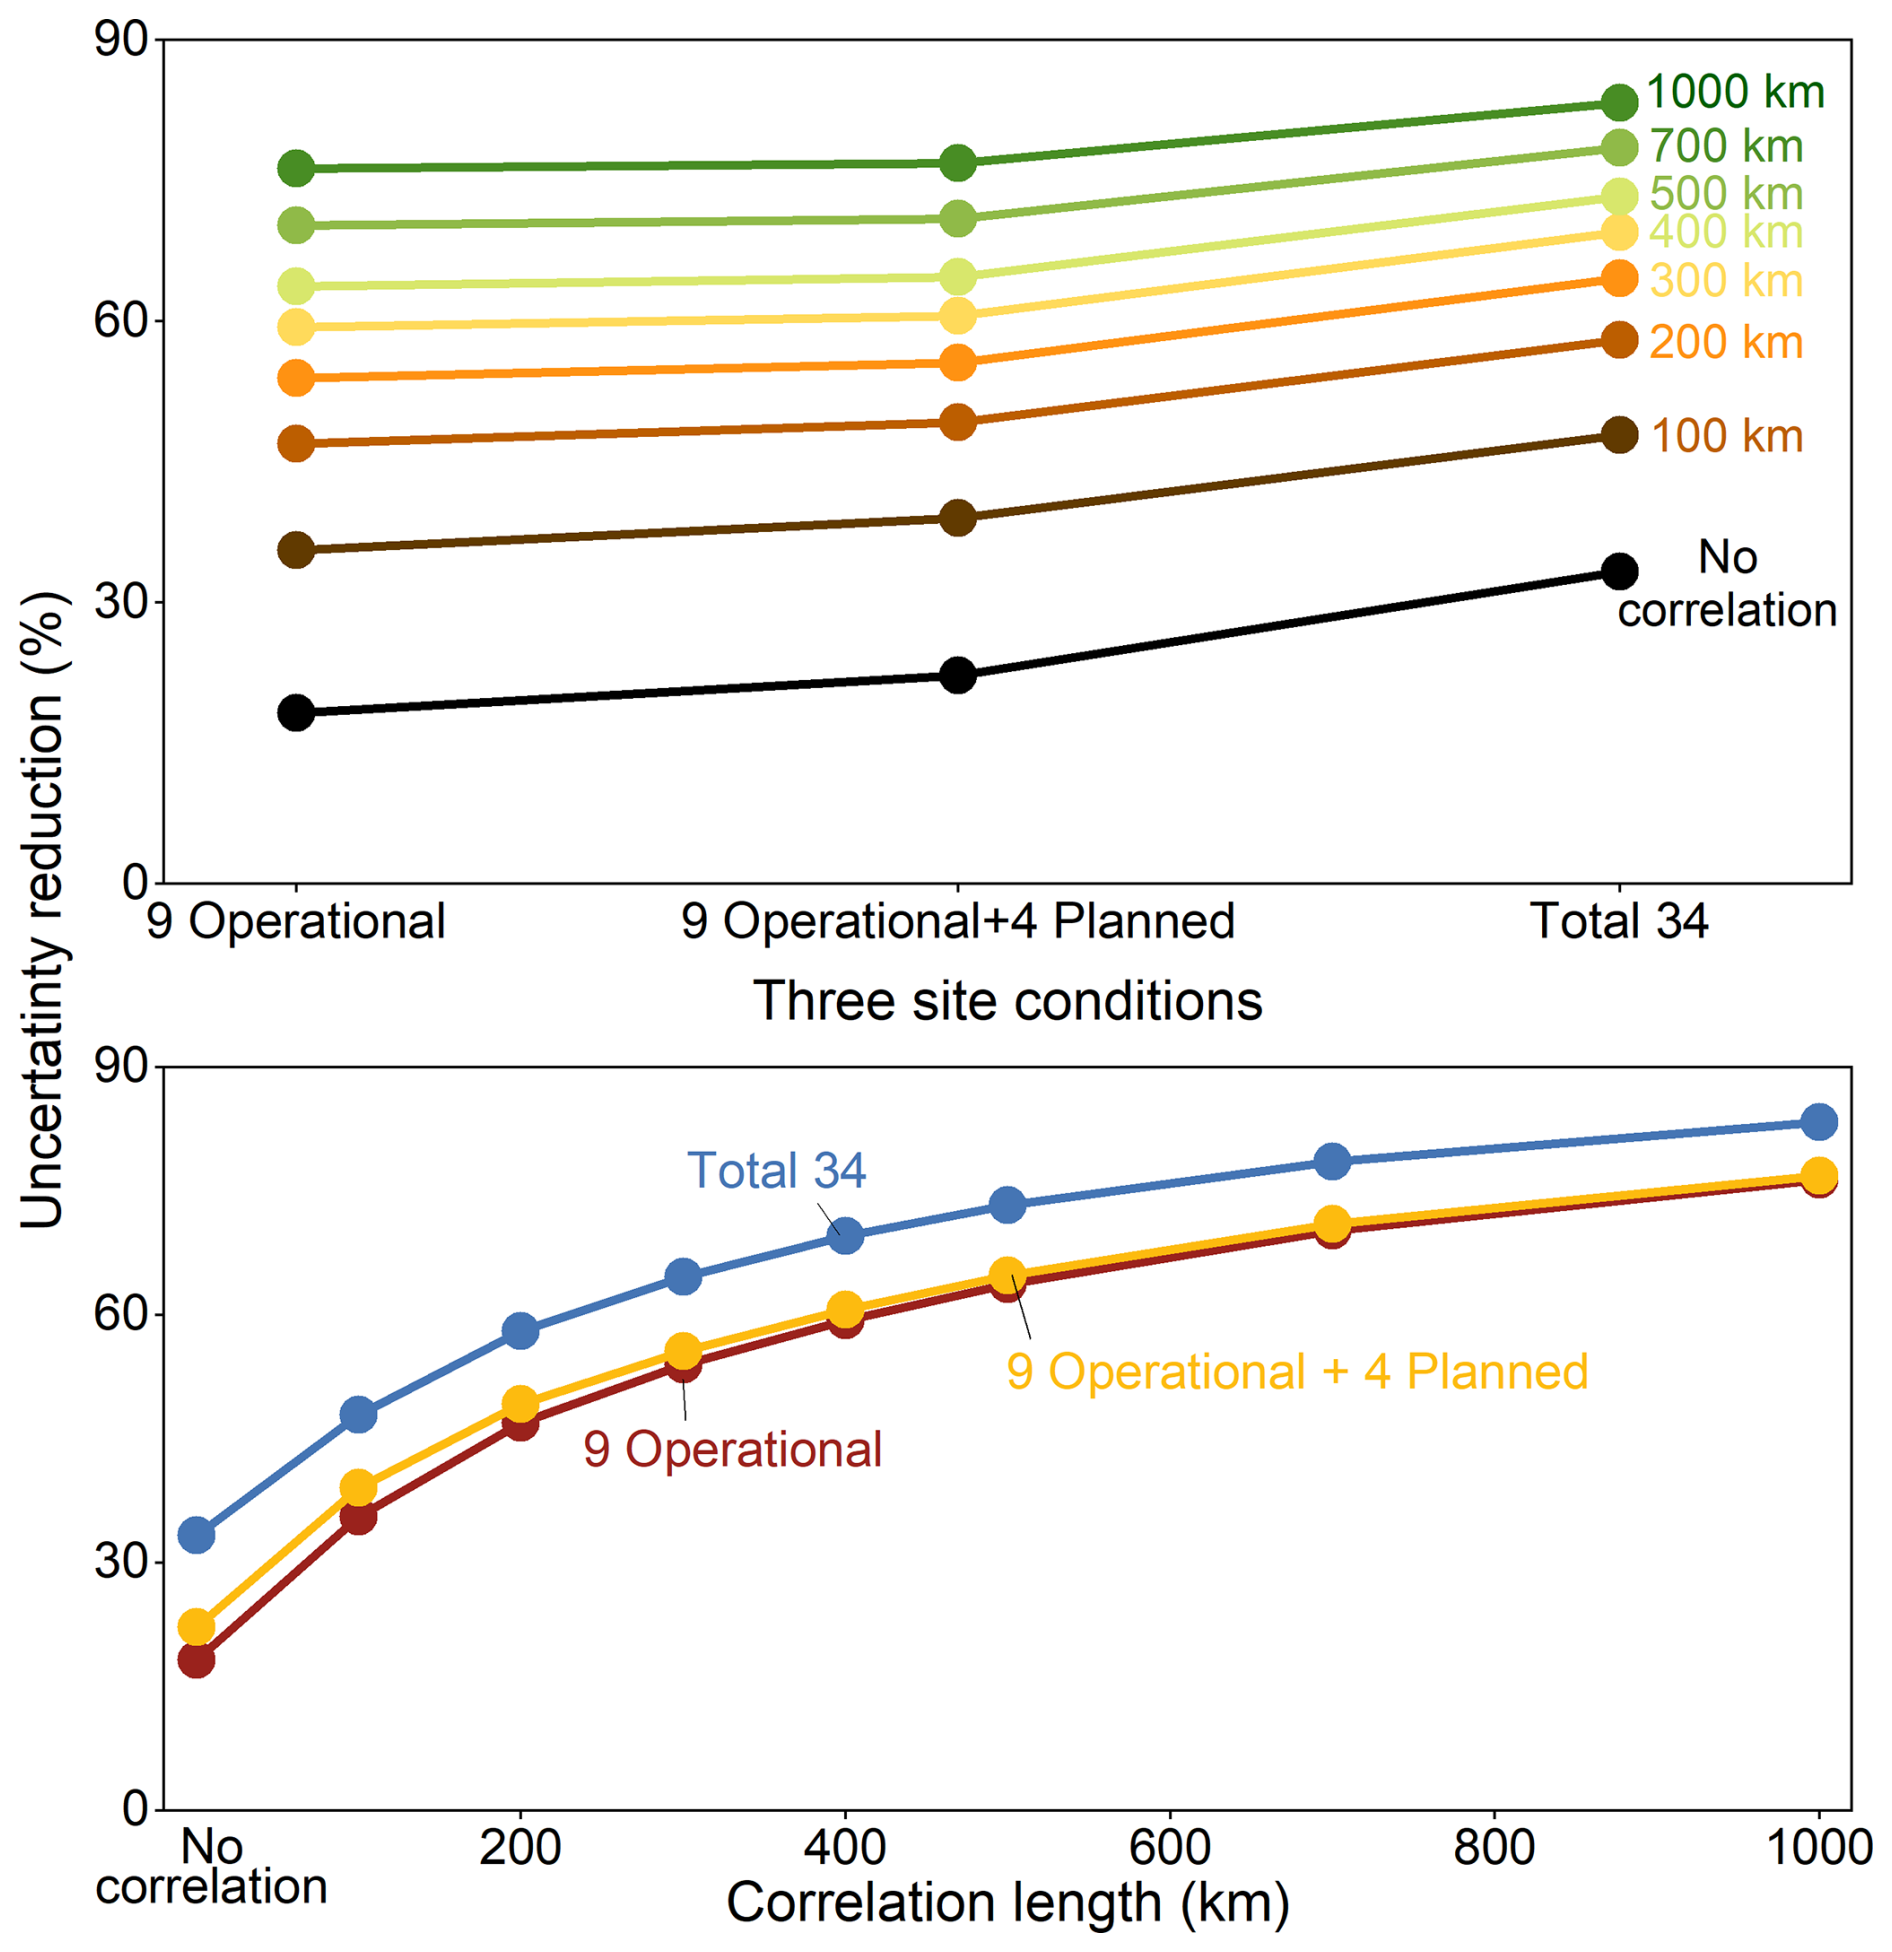
Figure 2The impact of assumed prior error correlation length on uncertainty reduction. Tests on three basic site conditions, including 9 operational sites only, 9 operational and 4 planned sites, and a network with total 34 sites.
2.4 The impact of clouds on uncertainty reduction estimation
Cloud conditions strongly influence the effectiveness of ground-based XCH4 observations by limiting both data availability and the sensitivity of column observations to surface emissions. Cloud cover reduces the number of valid retrievals and weakens the effective constraint that individual stations can provide on surface fluxes (Choudhury and Goren, 2025). To explicitly account for this effect, cloud screening is directly incorporated into the construction of the observational sensitivity matrix H. Hourly total cloud cover (TCC) fields from the fifth generation ECMWF reanalysis for the global climate and weather (ERA5) (Hersbach et al., 2020) are used for January and July 2025. For each baseline and candidate observation site, cloud fraction is extracted from the nearest ERA5 grid cell. Daily cloud conditions are derived from hourly cloud-fraction data between 08:00 and 18:00 local time, corresponding to the typical daytime observation window of the EM27/SUN spectrometer (Frey et al., 2019). Under the default settings, a day is classified as cloud-contaminated and excluded if more than 10 % of the hourly records (maximum cloudy-hour fraction, MF in Table S3) have a cloud fraction (CF) greater than 0.5. This conservative screening is applied to the latter 15 d of each month, corresponding to the period over which transport footprints are simulated. Only days passing the cloud filter are retained, and their corresponding footprints are included as individual rows in the sensitivity matrix H. Cloud-contaminated days are excluded entirely, effectively reducing the number of observational constraints associated with a given station.
Cloud screening affects the inversion by modifying the effective sensitivity matrix H. By reducing the number of valid observations and altering their temporal sampling, cloud filtering decreases the available information content and limits the achievable posterior uncertainty reduction for individual sites. Embedding cloud screening directly into the construction of H therefore allows the framework to account for more realistic observational availability and prevents overestimation of the constraint provided by candidate stations. This treatment also contributes to the diminishing marginal returns observed when adding sites in regions with frequent cloud cover, ensuring that the optimized network design reflects both atmospheric transport sensitivity and practical observing conditions. To assess the robustness of the network design, sensitivity experiments are conducted by varying key cloud-related parameters, together with additional tests of other major system parameters (18 experiments in total; see Sect. 3.4).
3.1 Overview of current EM27/SUN site deployment in Africa
African CH4 emissions exhibit strong spatial heterogeneity across sectors, with anthropogenic and wetland sources dominating the continental total and fire emissions contributing more episodically and regionally (Figs. 3 and S3). In January, anthropogenic sources account for 57.9 % of total African CH4 emissions, followed by wetland (31.5 %) and fire (10.6 %). In July, the corresponding contributions are 52.6 %, 32.3 %, and 15.1 %, respectively (Fig. S4). Anthropogenic emissions exhibit a relatively stable spatial pattern across months, with pronounced hotspots over the Gulf of Guinea, the Nile Delta, and parts of South Africa, reflecting a spatially fragmented and regionally clustered structure (Mostefaoui et al., 2024). Wetland emissions show broadly similar mean spatial patterns in both months, with strong clustering over Central Africa, particularly around the Cuvette Centrale peatland complex in the Congo Basin, a well-recognized hotspot of tropical CH4 emissions (Lunt et al., 2019; Barthel et al., 2022; Xiao et al., 2024). In contrast, fire emissions display pronounced seasonal shifts, concentrating mainly in southern Africa in July and in Central Africa in January, consistent with previous studies (van der Velde et al., 2024; Eames et al., 2025). Across the inventories adopted as priors in this study, biogenic sources exhibit substantially greater variability despite the limited number of available inventories. Fire and wetland CH4 emissions show mean coefficients of variation (CV) of 84 % and 127 %, respectively, whereas anthropogenic emissions exhibit a much smaller CV of 22 % (Fig. S5). This pronounced inter-inventory spread underscores the considerable uncertainty associated with biogenic sources and highlights the need for improved observational constraints, particularly for Africa where natural sources contribute a substantial fraction of total methane emissions.
Against this emission context, we first quantify the constraint provided by the existing observing network. The nine operational sites alone (Fig. 3a) reduce the posterior uncertainty of total African CH4 emissions by 62 % in January and 64 % in July (Fig. S6). It is important to note that the absolute magnitude of posterior uncertainty reduction depends on prior error assumptions (Fig. 2) and should therefore be interpreted primarily as a comparative reference metric. The substantial reduction obtained from only nine sites thus reflects posterior covariance changes under assumed error structures rather than real-world inversion accuracy. Incorporating the four planned African EM27/SUN sites (Yangambi, Mbandaka, Nouabalé-Ndoki, and Spioenkop) outside the current operational network (dots in Fig. 3b) yields marginal additional reductions, reaching 63 % in January and 65 % in July (Fig. S6). Three of these stations are located within the Congo Basin region, forming a dense cluster in Central Africa, while the fourth is situated in southern Africa. The three central African sites therefore sample broadly similar emission regions. In addition, regional wind fields organize coherent transport pathways across the Congo Basin, while high convective available potential energy (CAPE) promotes strong vertical mixing (Fig. S7). Together, these atmospheric conditions lead nearby stations to experience similar upwind sensitivities, resulting in substantial overlap in transport footprints (Fig. S2b and d).
To assess the upper bound of the achievable constraints, we consider an idealized scenario in which all candidate sites are simultaneously deployed. Under this configuration, uncertainty reduction reaches 71 % and 73 % in January and July, respectively (Fig. S6), yet the improvement relative to the current network is clearly sublinear (see Sect. 3.2). As site density increases, transport footprints increasingly overlap (Fig. S2), particularly along dominant seasonal flow structures such as the cross-equatorial pathway in January and the West African monsoon corridor in July (Fig. S7). These organized circulation regimes channel air masses through similar regions, causing additional sites to sample correlated source areas and thereby limiting incremental information gain. Cloud-related data loss further constrains the effectiveness of the network to constrain emissions within the convective Intertropical Convergence Zone (ITCZ), including the southern Congo Basin in January and the Sahelian belt in July (Fig. S7). Together, these results demonstrate that simply increasing the number of observation sites does not guarantee proportional improvements in CH4 emission constraints. Instead, the strong nonlinearity between network size and uncertainty reduction underscores the need to jointly optimize both the number of additional sites and their spatial configuration to achieve cost-effective network design.
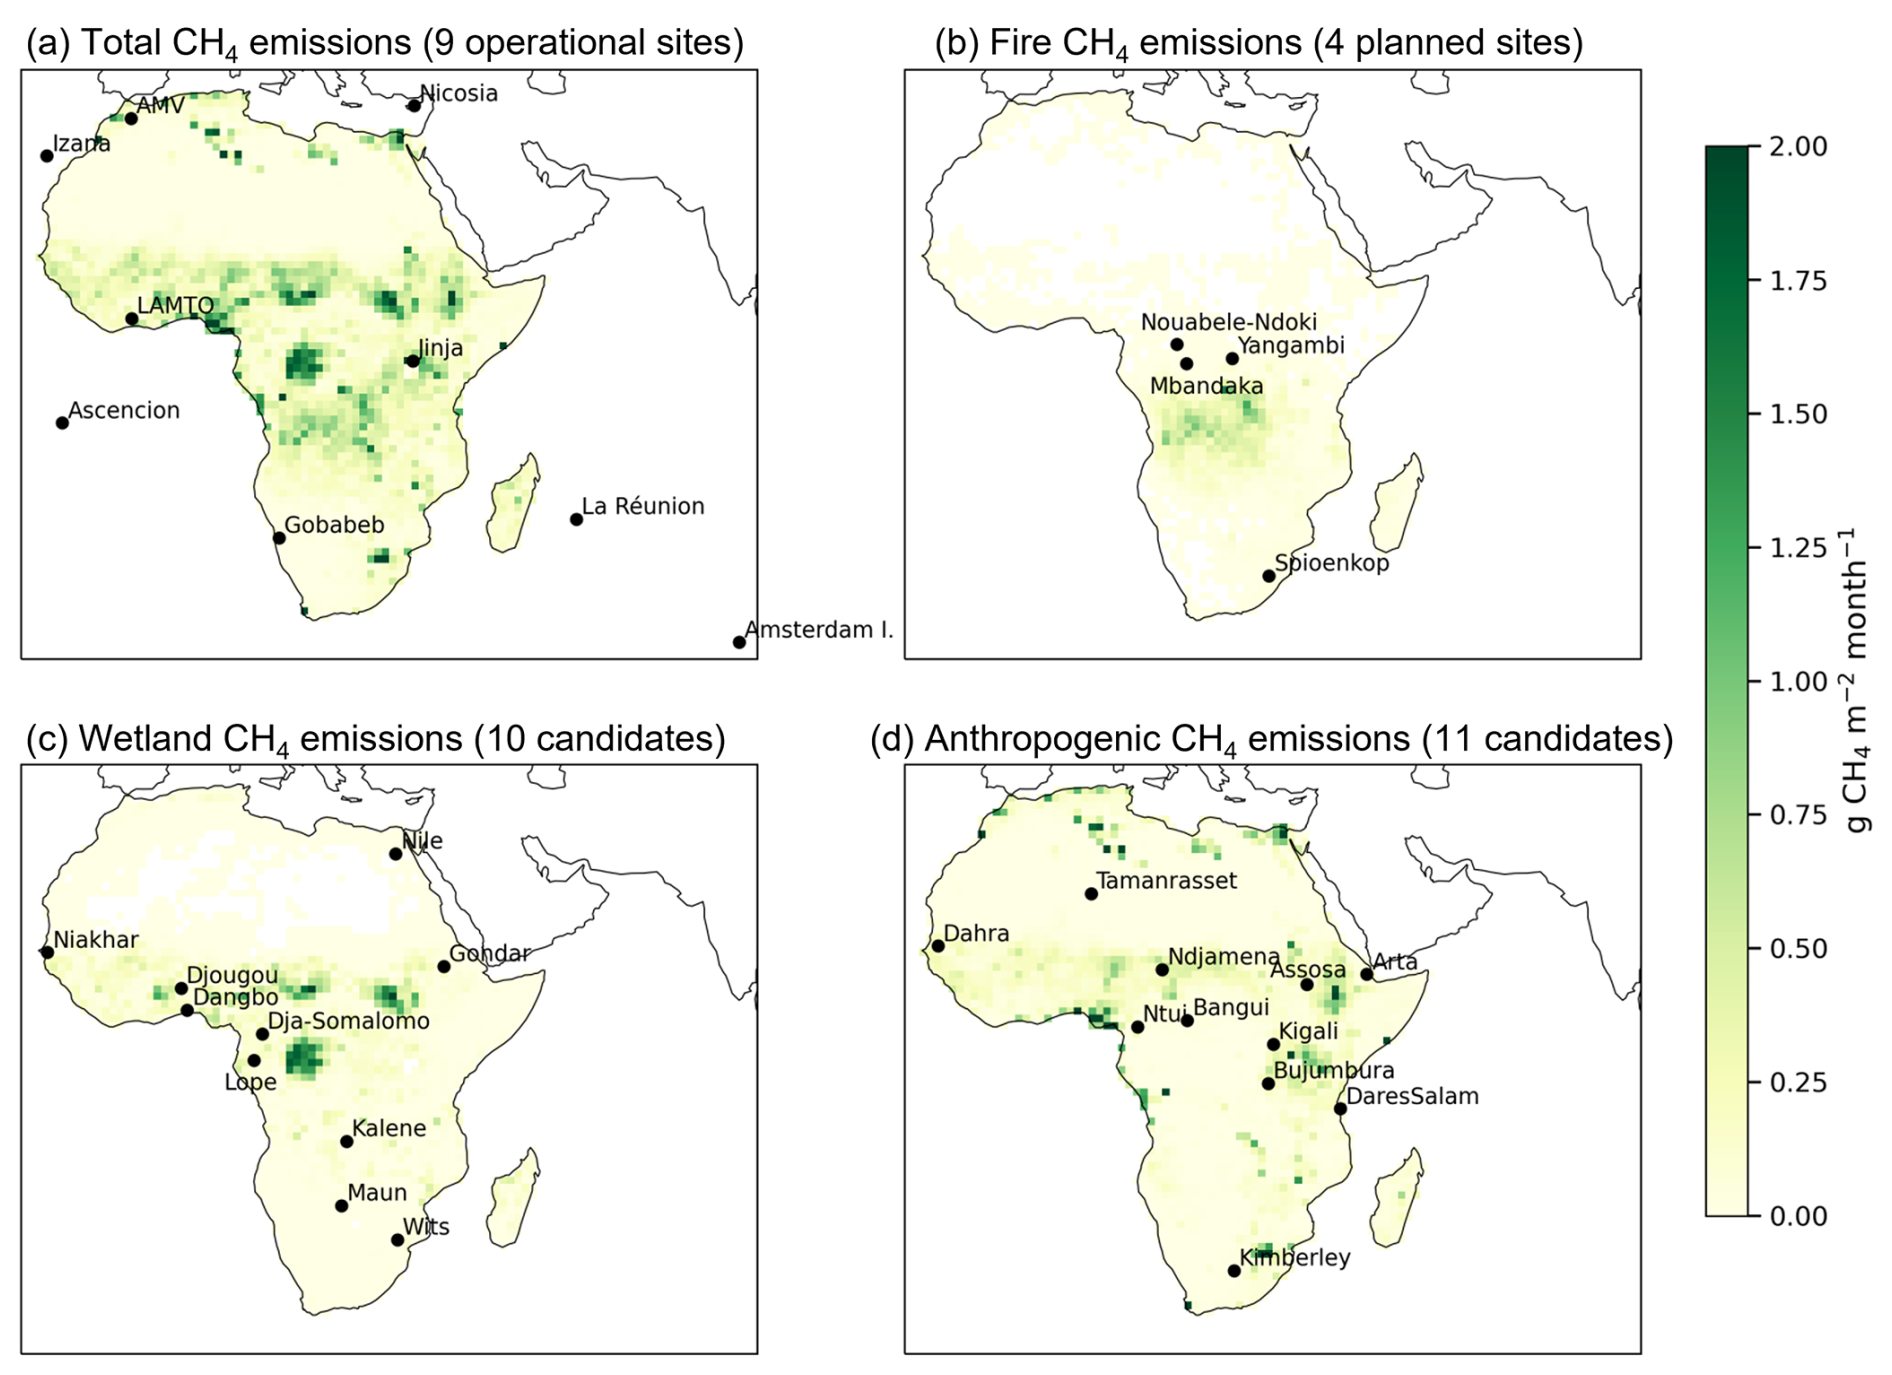
Figure 3Sectoral CH4 emissions and observation coverage over Africa in July. (a) total CH4 emissions with the current nine operational sites (La Réunion, Nicosia, Ascension, Izaña, LAMTO, AMV, Gobabeb, Jinja, Amsterdam Island); (b) fire CH4 emissions with four planned observation sites (Yangambi, Mbandaka, Nouabele-Ndoki, Spioenkop); (c) wetland CH4 emissions with ten candidate sites (Dja-Somalomo, Wits, Niakhar, Nile, Djougou, Dangbo, Kalene, Gondar, Lope, Maun); and (d) anthropogenic CH4 emissions with the remaining eleven candidate sites (Dahra, Ntui, Kigali, Bujumbura, Arta, Assosa, Bangui, Kimberley, Tamanrasset, Ndjamena, DaresSalam). The same plot for January is shown in Fig. S3. Emission background outside Africa has been masked for clarity.
3.2 Optimal number of new observation sites
As the number of observation sites increases, the uncertainty reduction exhibits a clear diminishing-return behavior across all emission sectors (Fig. 4). For both total and sectoral CH4 emissions, the ensemble-mean uncertainty reduction P(n) increases when a small number of sites are added, but progressively saturates as additional sites provide increasingly redundant information due to overlapping transport sensitivities. Correspondingly, the relative marginal gain ΔP(n) decreases monotonically with increasing network size, providing an objective criterion for identifying an optimal number of new stations. This behavior is consistently observed for total, fire, wetland, and anthropogenic emissions, confirming that diminishing returns are an intrinsic feature of network expansion rather than an artifact of sector-specific prior assumptions. It is important to note that the sector-specific experiments vary only the prior covariance (B), with identical transport sensitivities (H), and are designed to diagnose how source heterogeneity affects network-size requirements, rather than to imply perfect sector separability in real-world inversions, where sources are spatially mixed and attribution remains prior-dependent.
Despite this common pattern, the optimal number of additional sites required to satisfy the marginal gain criterion (ϵ=0.6 % in default setting) varies across sectors and between months (Fig. 4), reflecting differences in the spatial heterogeneity and seasonal redistribution of emission sources, as well as in atmospheric transport patterns. Fire emissions require the fewest additional sites, with a single new site sufficient in January and July, respectively, to reach the threshold. This reflects the strong spatial clustering of African fire activity, concentrated in the Sahel–Sudan belt during boreal winter and in the southern miombo woodlands and savannas during boreal summer, which are already well covered by the four planned stations (Figs. 4b and S3b). Wetland emissions require 11 new sites in January and 10 in July. Although their mean emissions are strongly concentrated over Central Africa, seasonal variability extends across large parts of the continent, with increases and decreases spanning both northern and southern Africa (Fig. S8c). Capturing this widespread variability therefore requires a larger number of observing sites. In contrast, anthropogenic emissions exhibit a more spatially dispersed distribution across the continent (Fig. S3d), resulting in the highest demand for additional observation sites. To satisfy the same marginal gain criterion, 21 new sites are required in both January and July. Notably, this value corresponds to the upper limit of the candidate pool, and the marginal gain criterion is not fully satisfied in the January case, suggesting that the true optimal network size for anthropogenic emissions likely exceeds the currently available candidate locations.
As an aggregate of sectoral contributions, the optimal number of additional sites for total CH4 emissions falls between those of the source sectors, yielding optimal values of 7 in January and 10 in July. For the subsequent configuration optimization, we adopt the July-derived optimal site number (10 sites) as the target network size. This choice is motivated by the fact that July represents a season with systematically higher CH4 emissions across most sectors except for anthropogenic sources (Fig. S4), implying stronger atmospheric signals and enhanced spatial overlap among source influences. Designing the network under this more emission-intensive scenario provides a stringent and practically relevant benchmark, ensuring that the selected configuration remains effective during periods of elevated emissions.
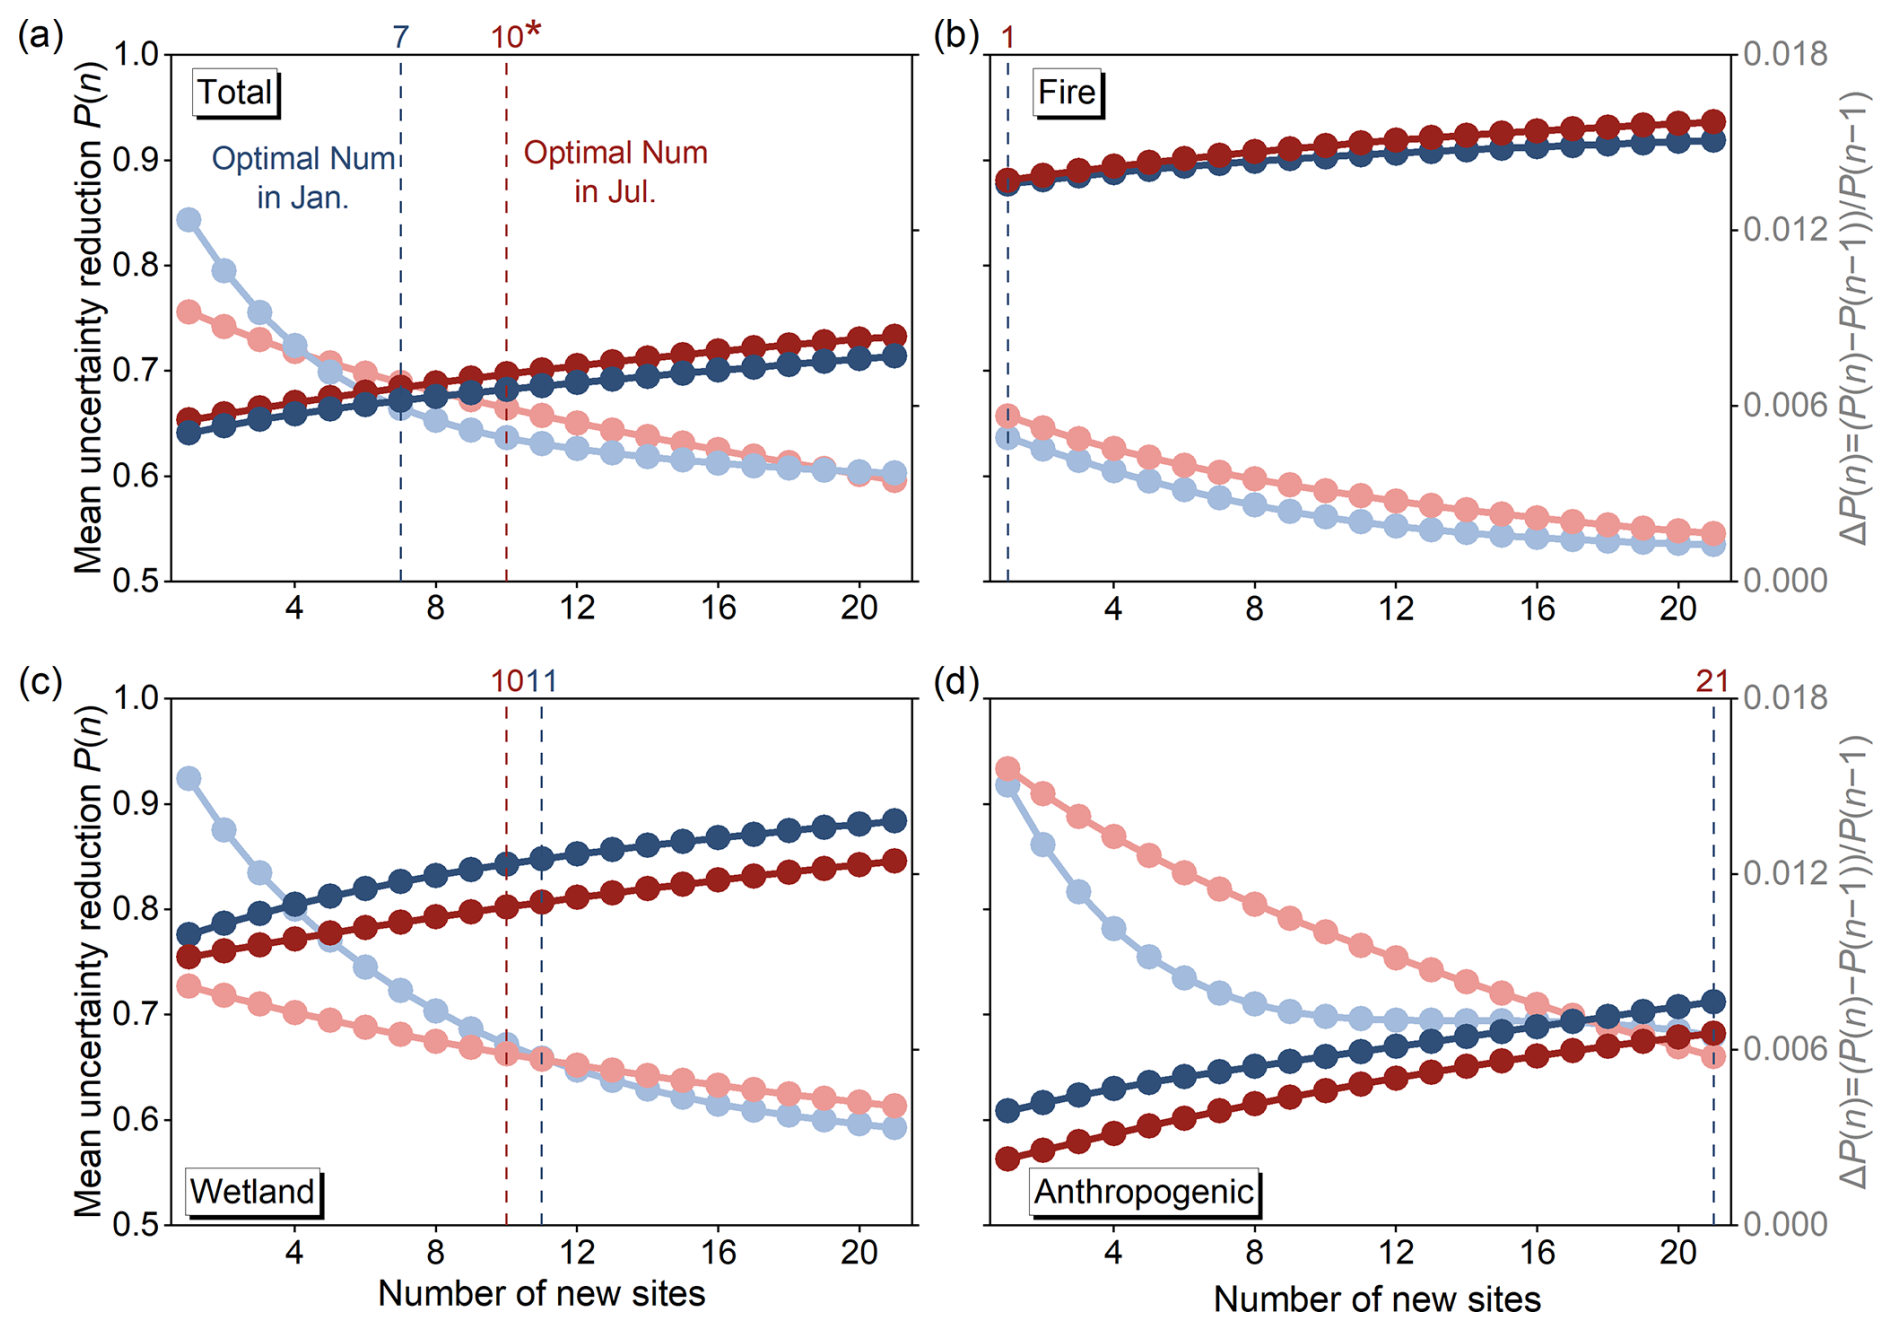
Figure 4Mean uncertainty reduction P(n) as a function of added station number for (a) total, (b) fire, (c) wetland, and (d) anthropogenic CH4 emissions, and for January (blue lines) and July (red lines) separately. The deep-colored lines denote the ensemble mean uncertainty reductions (P(n) on the left axis), while light-colored lines denote the relative marginal gain ΔP(n) on the right axis. The ten-site with star marker in (a) is selected as the optimal new site number.
3.3 Optimal site configurations with the optimal number
We next examine the spatial configuration of observation sites under the optimized network size and assess its effectiveness in constraining total and sectoral CH4 emissions. Figure 5 shows the spatial distribution of uncertainty reduction for total, fire, wetland, and anthropogenic CH4 emissions in July, obtained using the optimal 10-site configuration (January results are shown in Fig. S9). The optimized configuration is selected as the best-performing solution among all candidate site combinations in the ensemble, ensuring comprehensive and robust exploration of the configuration space (Fig. S10).
The ten sites contributing most strongly to the total uncertainty reduction are Nile, Tamanrasset, Arta, Kigali, Bujumbura, DaresSalam, Kalene, Maun, Wits, and Kimberley (closed black circles in Figs. 5 and S9). This configuration reduces the posterior uncertainty of total African CH4 emissions by 69 % in January and 73 % in July. These values are close to the 71 % and 73 % reductions achieved in January and July, respectively, under the idealized scenario in which all 34 sites are deployed (Sect. 3.1). This comparison demonstrates that the majority of the attainable information gain can be captured by a carefully optimized subset of sites, without resorting to a uniformly dense and substantially more costly network. At the sectoral level, the optimized configuration achieves uncertainty reductions of 91 % and 94 % for fire emissions, 87 % and 84 % for wetland emissions, and 68 % and 65 % for anthropogenic emissions in January and July, respectively. Overall, more than 65 % uncertainty reduction is attained across all sectors with only ten additional stations, highlighting the efficiency of the optimized network design.
The spatial arrangement of the selected sites reveals a deliberately dispersed and complementary network across the African continent, designed to balance source-region coverage and inter-site spacing while minimizing redundant transport sensitivities. In northern Africa, the inclusion of site Nile and Tamanrasset substantially enhance sensitivity to anthropogenic CH4 emissions associated with irrigated croplands and densely populated regions, which are weakly constrained by the existing observing network. Across equatorial Africa, sites such as Arta, Kigali, Bujumbura, DaresSalam, and Kalene are distributed along a north–south corridor spanning the Congo Basin and its surroundings. This alignment closely follows the core wetland CH4 emission hotspots while maintaining sufficient separation from existing and planned stations, thereby reducing footprint overlap and maximizing the marginal information gain of each site. In southern Africa, the combination of Maun, Wits, and Kimberley strengthens constraints across multiple sectors simultaneously, improving sensitivity to wetland emissions in the Okavango region as well as to fire and anthropogenic emissions over southern Africa. Although the optimized sites are all located within Africa, their impact on uncertainty reduction is not confined to the continent. Owing to large-scale atmospheric transport, secondary uncertainty reductions extend into adjacent regions such as the Middle East and parts of South Asia (Fig. 5), providing an additional benefit of the optimized African observing network beyond its primary target region.
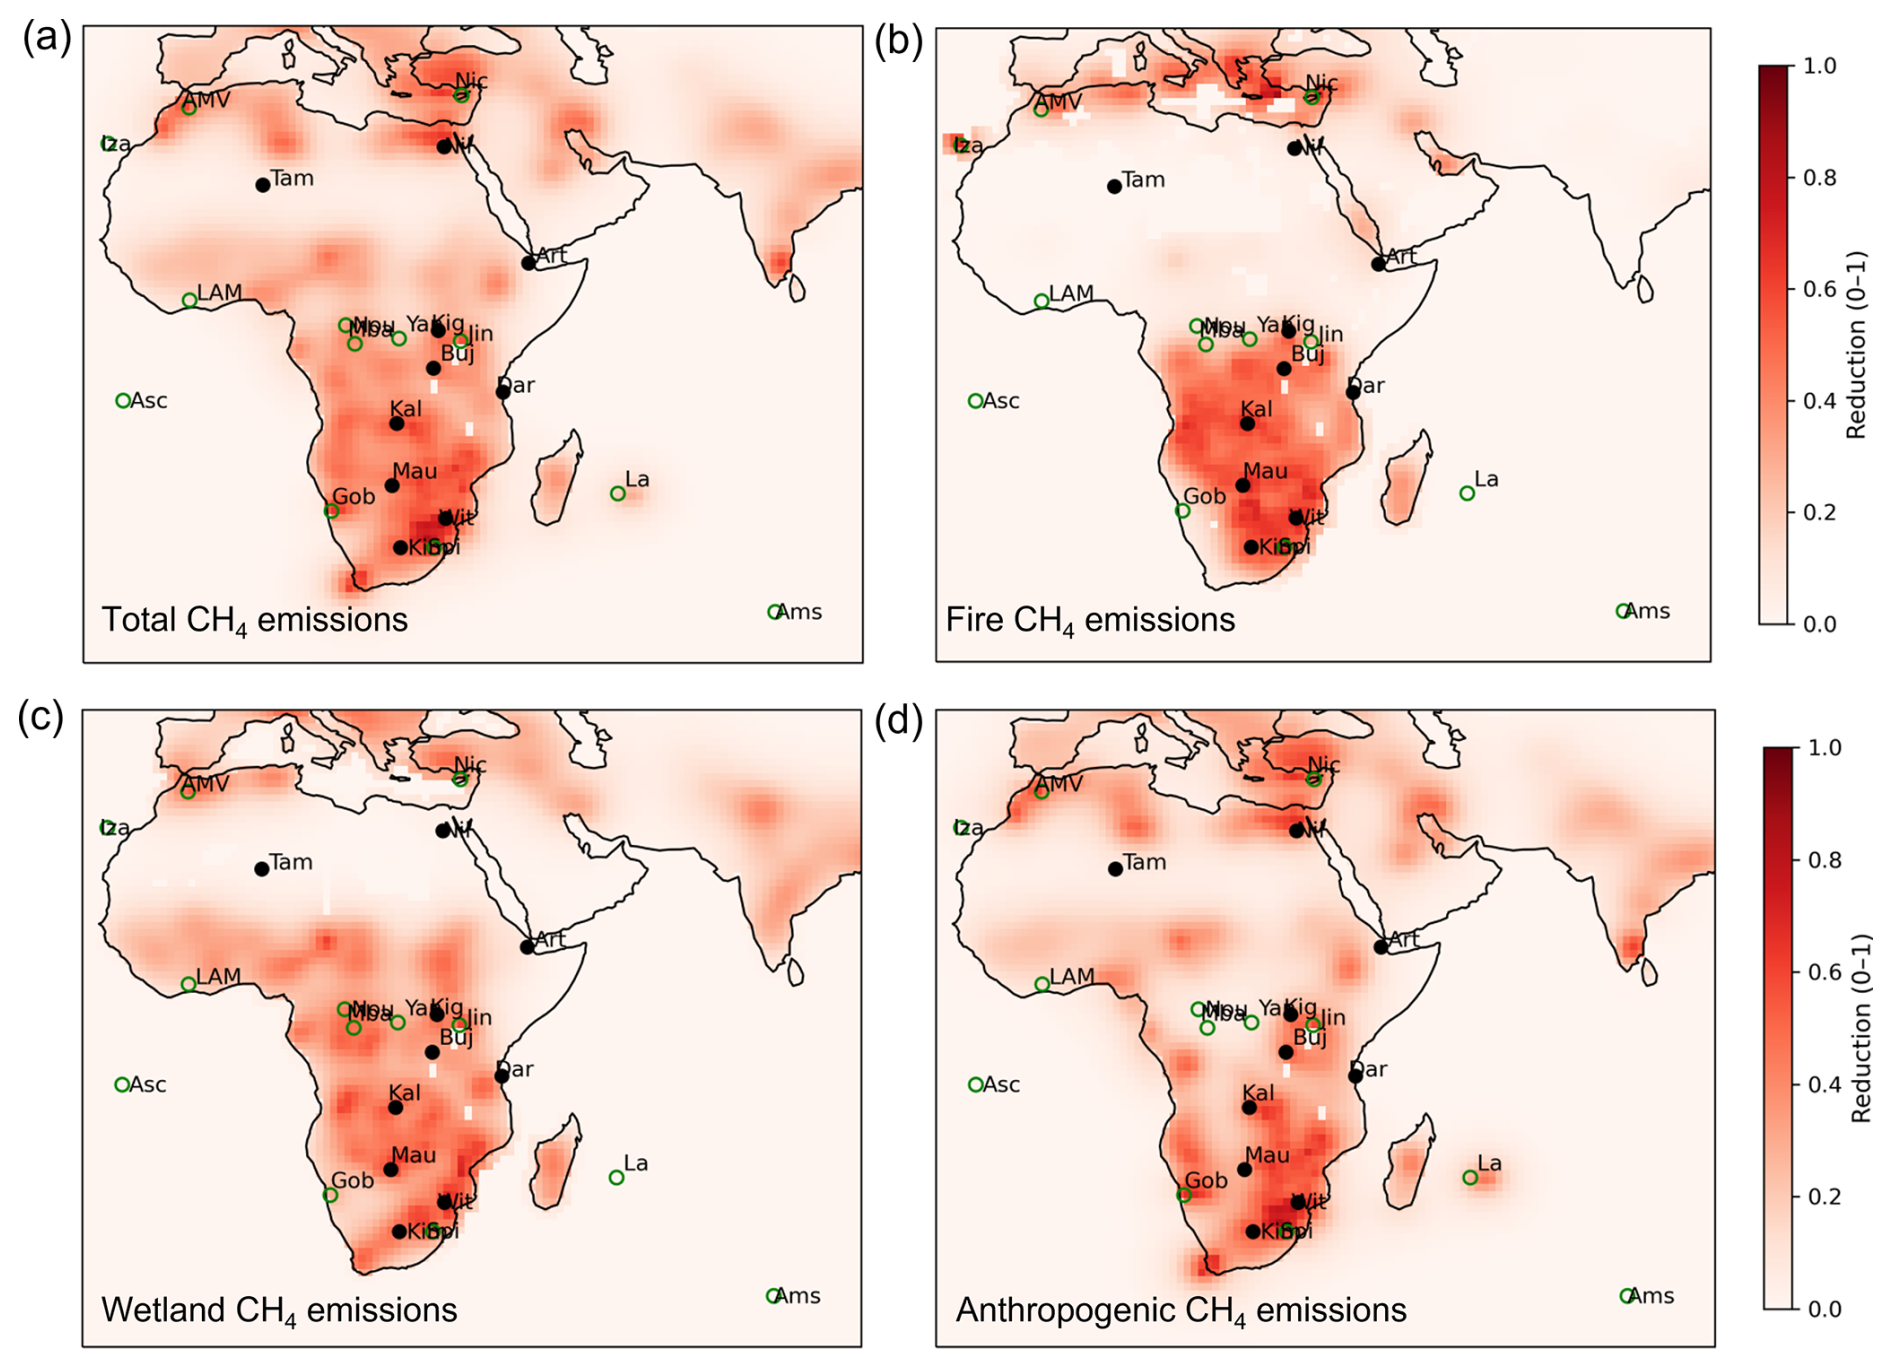
Figure 5Spatial distribution of uncertainty reduction for (a) total; (b) fire; (c) wetland; and (d) anthropogenic CH4 emissions with the 10 optimal site configurations in 2025 July. The 10 optimal sites in this case include Nile, Tamanrasset, Arta, Kigali, Bujumbura, DaresSalam, Kalene, Maun, Wits, and Kimberley. All the site names are abbreviated with their first three letters. The green open circles are 9 operational and 4 planned sites, and the closed black circles are optimized new 10 sites. The map for January is provided in Fig. S9.
3.4 Evaluation of the network design framework
We evaluate the robustness and practical applicability of the optimized network using three complementary analyses based on the July total CH4 emission case, which represents the most emission-intensive season (Fig. S4): sensitivity tests to key assumptions, ranking of candidate sites under the default setting, and a randomly perturbed-prior experiment (Fig. 6).
Sensitivity experiments explore variations in observational uncertainty, cloud-related constraints, and major system parameters (Table S4), examining both the optimal number of additional sites and the corresponding best configurations (Fig. 6a). Across the 18 tests, the optimal site number shows clear dependence on assumptions that control effective observational coverage. In particular, cloud-related parameters exert the strongest influence. Stricter cloud screening, implemented through lower cloud fraction thresholds (i.e., less data available during cloudy periods) or more restrictive maximum allowable cloudy-hour fraction (i.e., a larger required fraction of cloud-free hours) requirements, reduces data availability and increases the number of sites required to satisfy the marginal gain criterion (ϵ). The optimal number of additional sites increases to 13 when the maximum cloudy-hour fraction is set to zero (MF0) and up to 19 when the cloud fraction threshold is reduced below 0.3. Footprint integration length shows a similar effect: as the window decreases from 25 (Int25) to 10 (Int10) days, the optimal network size increases from 11 to 21 sites, reflecting the need for denser spatial sampling when long-range sensitivity is reduced. In contrast, the spatial configuration of selected sites remains highly consistent. The default ten-site solution (Nile, Tamanrasset, Arta, Kigali, Bujumbura, DaresSalam, Kalene, Maun, Wits, and Kimberley) is repeatedly recovered across tests, indicating that once network size is prescribed, the optimization converges toward a stable core set of locations that provide complementary and nonredundant information.
Beyond identifying a single optimal configuration, the framework also provides a quantitative prioritization of candidate sites. Under the default parameter setting, optimization is repeated for prescribed network sizes ranging from 1 to 21 additional sites, and the selection frequency of each site is recorded (Fig. 6b). Sites selected more frequently can be interpreted as having higher priority in sequential network expansion. Notably, the top ten ranked sites correspond exactly to the ten-site optimal configuration, demonstrating internal consistency of the framework. A complementary sequential-growth experiment, in which one site is added at each step to maximize the additional uncertainty reduction conditional on the previously selected network, identifies the same ten sites in the same order (Fig. S12). This agreement further demonstrates the robustness of the site ranking across alternative deployment strategies. The framework can therefore support a practical, prioritized rollout when the number of new stations is constrained by budget or logistics.
To assess dependence on the assumed prior emission distribution, we further conduct a randomly perturbed-prior experiment in which July CH4 emissions are spatially shifted and rescaled, generating modified hotspot patterns (Figs. 6c and S11). The optimized configuration derived under the perturbed prior retains the overall spatial structure of the base solution but exhibits targeted adjustments. Specifically, Kigali is replaced by Dahra, reflecting enhanced sensitivity to regions where emissions increase under the perturbed prior without sufficient observational constraint. The associated transport footprints confirm that these newly selected sites better capture the redistributed emission signals. This adaptive response indicates that the optimization is not rigidly tied to a fixed prior assumption; rather, site placement dynamically adjusts to changes in emission patterns while preserving the physically constrained backbone of the network.
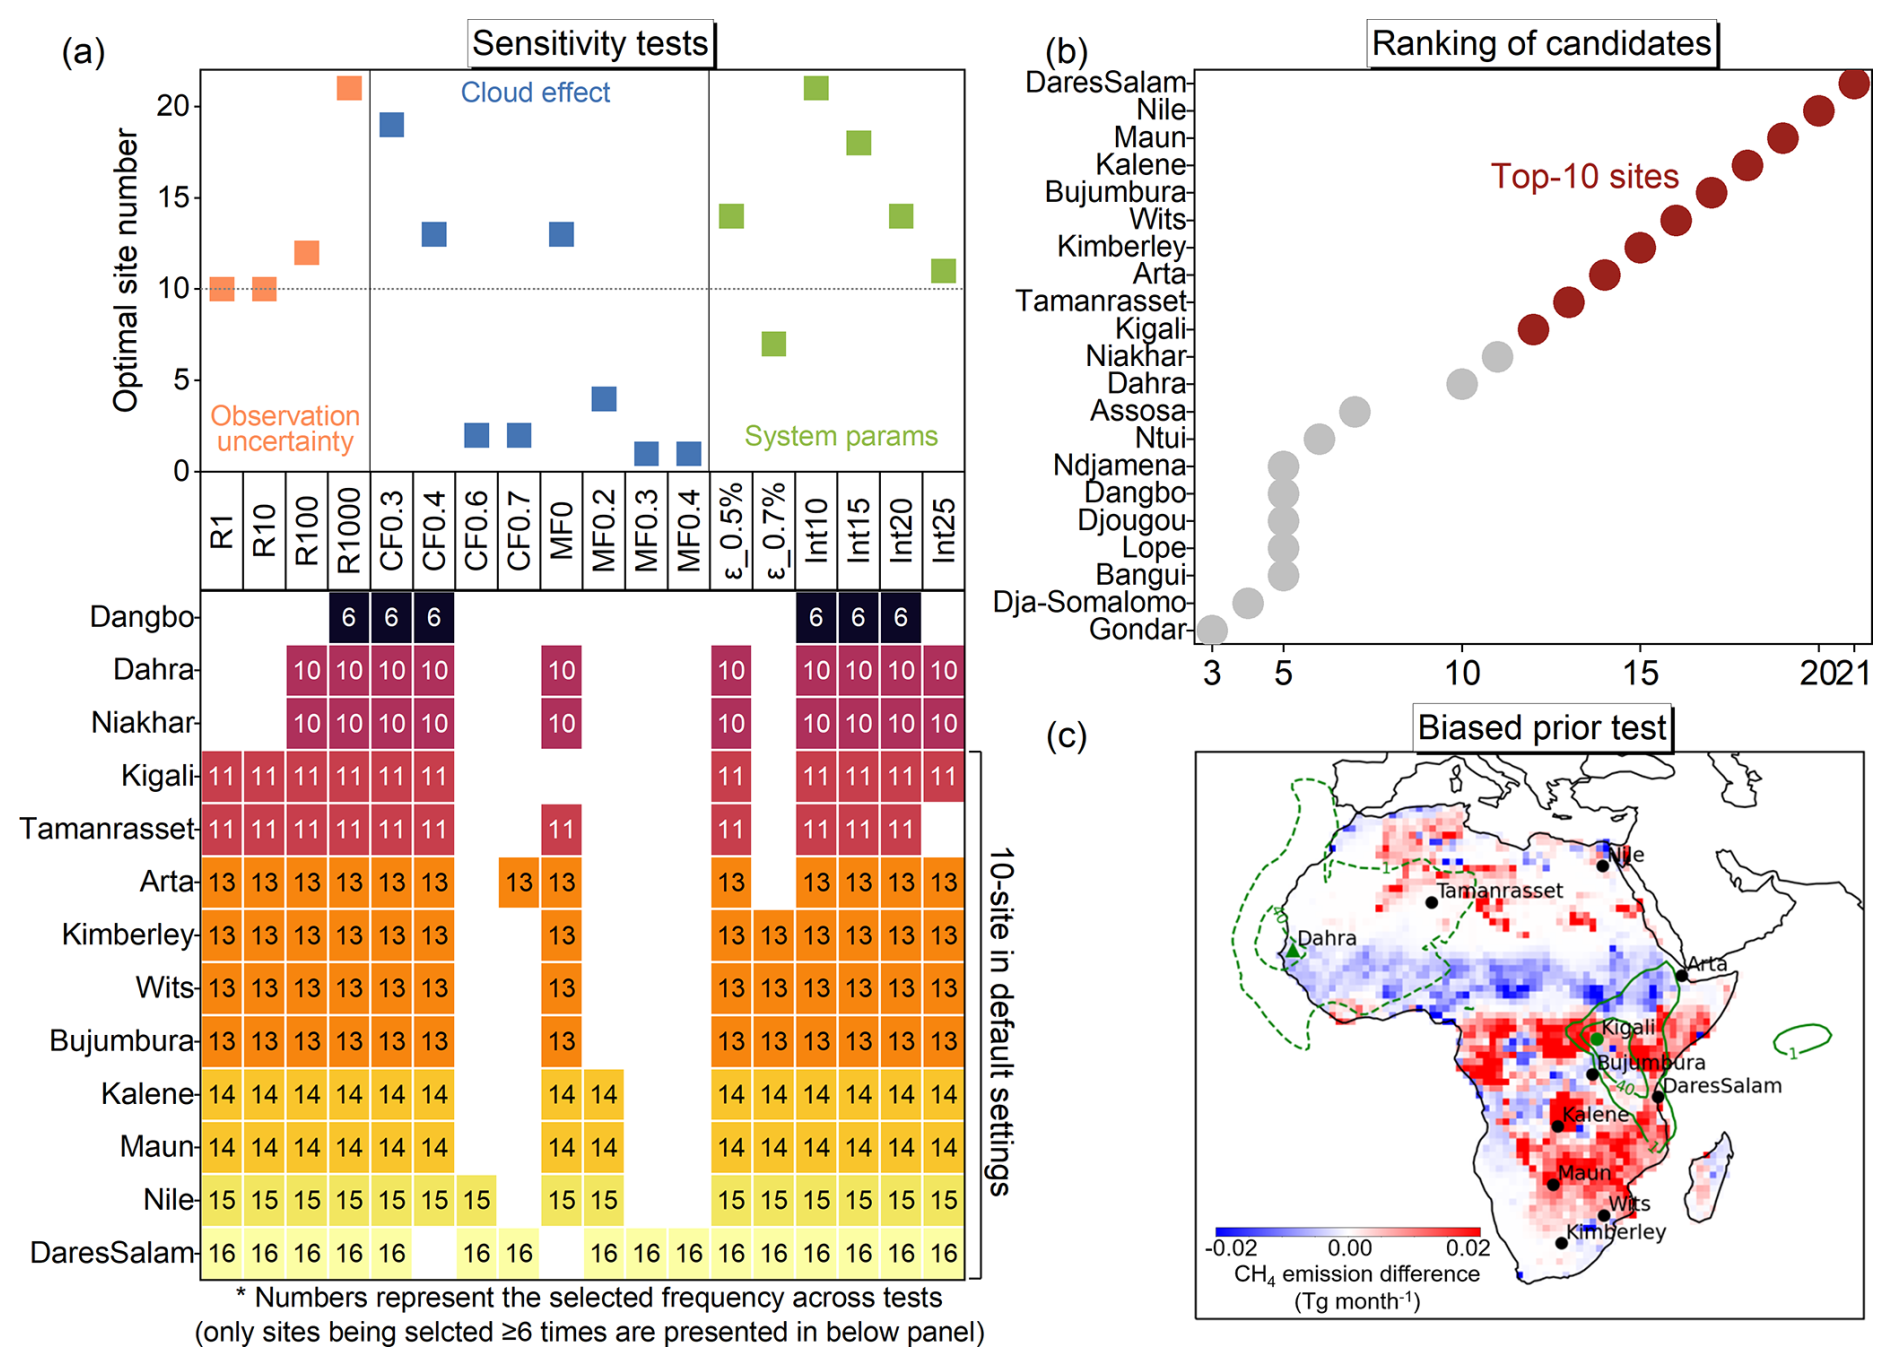
Figure 6Evaluation of site optimization framework. (a) Sensitivity tests. The upper panel shows the optimal number of additional sites under different parameter settings and the lower panel shows the corresponding optimal configurations. See Tables S3–S4 for full test descriptions. R denotes observation uncertainty; CF cloud fraction threshold; MF maximum cloudy-hour fraction; the marginal gain threshold ϵ; and Int the integrated days. (b) Ranking of candidate sites under the default setting, which shows how frequently each site is selected across network sizes from 1 to 21 additional sites. (c) Biased-prior test. Shading shows July CH4 total prior differences (perturbed-base). Black markers denote sites selected under both priors; green circles sites unique to the base prior (Kigali); green triangles sites unique to the perturbed prior (Dahra). Green contours show 3 d footprints for sites unique to each case (solid: base; dashed: perturbed). Sectoral difference of perturbation is seen in Fig. S11.
This study provides a quantitative and transferable framework for designing XCH4 observation networks in data-sparse regions, with Africa serving as a representative and policy-relevant case. By explicitly accounting for diminishing returns in uncertainty reduction, transport sensitivity overlap, and cloud-related observational limitations, the proposed strategic Bayesian framework demonstrates that substantial improvements in emission constraints can be achieved without a uniformly dense network expansion. Importantly, the framework is implemented within a global inversion system, with transport sensitivities derived from adjoint simulations of the LMDZ model at ∼ 90 km resolution and prior error covariance defined over the entire globe. This setup provides a consistent representation of large-scale transport pathways without requiring lateral boundary conditions, while the network-design framework is not tied to a specific transport model and could also be coupled with backward Lagrangian simulations to reduce computational cost and enable higher-resolution regional applications. Applied to Africa, the results show that uncertainty reduction rapidly improves with the first few additional sites but saturates thereafter, highlighting a strong nonlinearity between network size and information gain. For total African CH4 emissions, an optimized configuration of ten additional sites captures more than 65 % of the achievable uncertainty reduction in both January and July, approaching the performance of an idealized scenario in which all candidate sites are deployed. Sectoral diagnostics further show that network-size requirements depend on the spatial heterogeneity and seasonal redistribution of dominant source regions, underscoring the importance of targeted rather than uniform deployment.
The reported uncertainty reductions represent potential information gain within a Bayesian covariance framework rather than direct predictions of operational inversion performance. Several simplifying assumptions are adopted, including the omission of sub-monthly and subpixel emission variability, use of half-month adjoint sensitivities, prescribed and spatially uniform observation uncertainties, and omission of aerosol impacts on retrieval sensitivity. Uncertainty reduction is evaluated under assumed prior covariance structures and does not explicitly account for source mixing, sector attribution errors, representation errors, or structural model biases, which are inherent to most Bayesian inversion systems. These idealized assumptions likely contribute to the relatively high theoretical reductions. For example, neglecting aerosol impacts may overestimate effective data availability and thereby inflate the inferred uncertainty reduction (Schooling et al., 2026). Consequently, the reported reductions serve primarily as relative metrics for network comparison and prioritization rather than absolute estimates of achievable inversion accuracy. Nonetheless, sensitivity experiments indicate that although the optimal network size responds to assumptions affecting observational effectiveness, particularly cloud screening, the spatial configuration of selected sites remains highly robust. This stability suggests that site selection is fundamentally constrained by the large-scale structure of CH4 emissions and atmospheric transport pathways.
Despite these limitations, the framework offers a powerful and flexible tool for guiding observation deployment decisions. Because uncertainty reduction is evaluated at the grid scale and can be spatially aggregated, the results can be readily translated into country- or region-level metrics, enabling the identification and ranking of areas that benefit most from optimized network expansion. In the African case, several major methane emitting countries, including South Africa, the Democratic Republic of the Congo, Angola, and Algeria, consistently achieve uncertainty reductions exceeding 50 % in both January and July under the proposed ten-site optimal configuration (Fig. S13 and Table S5). This demonstrates that a relatively small, strategically designed network can substantially improve emission constraints across national and regional scales. More broadly, the framework can, in principle, be adapted to other greenhouse gases, regions, and observing systems, including hybrid networks that combine ground-based and satellite measurements. Such extensions would require gas-specific prior uncertainty structures, transport sensitivities, and observational characteristics, and would likely lead to different optimization criteria and network configurations. For multi-species networks, species-specific uncertainty reductions could be normalized and combined within a weighted objective function, with the weights reflecting scientific or policy priorities. Alternatively, a multi-objective formulation could be used to identify configurations that balance trade-offs among species. Practical implementation would also need to account for instrument compatibility and shared infrastructure. For example, the EM27/SUN instrument adopted as the default platform in this study can simultaneously provide column observations of CH4, CO2, and CO, enabling the same observational site to contribute to the optimization of multiple species. In this sense, the present study contributes a transferable and systematically implemented framework for evidence-based observation network design, supporting both scientific applications and policy-relevant assessments of greenhouse gas emissions in data-sparse regions.
The LMDZ global model code can be found at https://doi.org/10.5281/zenodo.14765208 (Chevallier, 2025). All the meteorological factors (cloud cover, 10 m wind fields, and convective available potential energy) are acquired from ERA5 dataset at https://doi.org/10.24381/cds.68d2bb30 (Copernicus Climate Change Service, 2022). The sources of prior datasets adopted are detailed in Table S1. The codes and scripts developed for estimation, plotting, and other analysis are accessible upon reasonable request from the corresponding author.
The supplement related to this article is available online at https://doi.org/10.5194/acp-26-11893-2026-supplement.
HL and PC designed this study. HL conducted the system establishment, analyzed the data, and wrote the draft. PC, BZ, PP, and BP supervised the study, helped data analysis, reviewed and edited the paper. FC performed the footprint simulations, helped data analysis, and edited the paper. SP offered the prior file, reviewed and edited the paper. FH, ML, EO, DM, MR, JC, and LS reviewed and edited the paper. All the co-authors contributed to the revision of this paper.
The contact author has declared that none of the authors has any competing interests.
Publisher's note: Copernicus Publications remains neutral with regard to jurisdictional claims made in the text, published maps, institutional affiliations, or any other geographical representation in this paper. The authors bear the ultimate responsibility for providing appropriate place names. Views expressed in the text are those of the authors and do not necessarily reflect the views of the publisher.
The authors thank the editor and the anonymous referees for helpful comments that have improved the paper.
This work was granted access to the HPC resources of CCRT under the allocation CEA/DRF, and of TGCC under the allocation A0190102201 made by GENCI. JMSC acknowledges support from the NASA Enabling Capabilities Ground Networks and the Atmospheric Applications and Research Initiatives under NASA's Earth Action Element.
This paper was edited by Christoph Gerbig and reviewed by two anonymous referees.
Adame, J. A., Padilla, R., Gutierrez-Alvarez, I., Bogeat, J. A., Lopez, A., and Yela, M.: Greenhouse gases in the tall tower of El Arenosillo station in Southwestern Europe: First-year of measurements, Atmos. Res., 299, 107221, https://doi.org/10.1016/j.atmosres.2024.107221, 2024.
Alberti, C., Hase, F., Frey, M., Dubravica, D., Blumenstock, T., Dehn, A., Castracane, P., Surawicz, G., Harig, R., Baier, B. C., Bès, C., Bi, J., Boesch, H., Butz, A., Cai, Z., Chen, J., Crowell, S. M., Deutscher, N. M., Ene, D., Franklin, J. E., García, O., Griffith, D., Grouiez, B., Grutter, M., Hamdouni, A., Houweling, S., Humpage, N., Jacobs, N., Jeong, S., Joly, L., Jones, N. B., Jouglet, D., Kivi, R., Kleinschek, R., Lopez, M., Medeiros, D. J., Morino, I., Mostafavipak, N., Müller, A., Ohyama, H., Palmer, P. I., Pathakoti, M., Pollard, D. F., Raffalski, U., Ramonet, M., Ramsay, R., Sha, M. K., Shiomi, K., Simpson, W., Stremme, W., Sun, Y., Tanimoto, H., Té, Y., Tsidu, G. M., Velazco, V. A., Vogel, F., Watanabe, M., Wei, C., Wunch, D., Yamasoe, M., Zhang, L., and Orphal, J.: Improved calibration procedures for the EM27/SUN spectrometers of the COllaborative Carbon Column Observing Network (COCCON), Atmos. Meas. Tech., 15, 2433–2463, https://doi.org/10.5194/amt-15-2433-2022, 2022.
Barthel, M., Bauters, M., Baumgartner, S., Drake, T. W., Bey, N. M., Bush, G., Boeckx, P., Botefa, C. I., Dériaz, N., Ekamba, G. L., Gallarotti, N., Mbayu, F. M., Mugula, J. K., Makelele, I. A., Mbongo, C. E., Mohn, J., Mandea, J. Z., Mpambi, D. M., Ntaboba, L. C., Rukeza, M. B., Spencer, R. G. M., Summerauer, L., Vanlauwe, B., Van Oost, K., Wolf, B., and Six, J.: Low N2O and variable CH4 fluxes from tropical forest soils of the Congo Basin, Nat. Commun., 13, 330, https://doi.org/10.1038/s41467-022-27978-6, 2022.
Chevallier, F.: LMDz transport model, Version 4.2, Zenodo [software], https://doi.org/10.5281/zenodo.14765208, 2025.
Chevallier, F., Martinez, A., Lloret, Z., Takache, S., and Cozic, A.: Offline Atmospheric Transport on a Global Mesh of Hexagons, J. Geophys. Res.-Atmos., 130, e2025JD043579, https://doi.org/10.1029/2025JD043579, 2025.
Choudhury, G. and Goren, T.: Sampling Bias From Satellite Retrieval Failures of Cloud Properties and Its Implications for Aerosol-Cloud Interactions, Geophys. Res. Lett., 52, e2025GL115429, https://doi.org/10.1029/2025GL115429, 2025.
Ciais, P., Bombelli, A., Williams, M., Piao, S. L., Chave, J., Ryan, C. M., Henry, M., Brender, P., and Valentini, R.: The carbon balance of Africa: synthesis of recent research studies, Philos. T. R. Soc. A, 369, 2038–2057, https://doi.org/10.1098/rsta.2010.0328, 2011.
Copernicus Climate Change Service: ERA5-Land monthly averaged data from 1950 to present, Copernicus Climate Change Service (C3S) Climate Data Store (CDS) [data set], https://doi.org/10.24381/cds.68d2bb30, 2022.
Cressot, C., Chevallier, F., Bousquet, P., Crevoisier, C., Dlugokencky, E. J., Fortems-Cheiney, A., Frankenberg, C., Parker, R., Pison, I., Scheepmaker, R. A., Montzka, S. A., Krummel, P. B., Steele, L. P., and Langenfelds, R. L.: On the consistency between global and regional methane emissions inferred from SCIAMACHY, TANSO-FTS, IASI and surface measurements, Atmos. Chem. Phys., 14, 577–592, https://doi.org/10.5194/acp-14-577-2014, 2014.
Cressot, C., Pison, I., Rayner, P. J., Bousquet, P., Fortems-Cheiney, A., and Chevallier, F.: Can we detect regional methane anomalies? A comparison between three observing systems, Atmos. Chem. Phys., 16, 9089–9108, https://doi.org/10.5194/acp-16-9089-2016, 2016.
Crippa, M., Guizzardi, D., Pagani, F., Schiavina, M., Melchiorri, M., Pisoni, E., Graziosi, F., Muntean, M., Maes, J., Dijkstra, L., Van Damme, M., Clarisse, L., and Coheur, P.: Insights into the spatial distribution of global, national, and subnational greenhouse gas emissions in the Emissions Database for Global Atmospheric Research (EDGAR v8.0), Earth Syst. Sci. Data, 16, 2811–2830, https://doi.org/10.5194/essd-16-2811-2024, 2024.
Doc, J., Bréon, F.-M., Lopez, M., Té, Y., Jeseck, P., Lian, J., Nief, G., Parent, A., Leuridan, H., and Ramonet, M.: Two years of total column measurements of CO2, CH4 and CO in Paris, France, Atmos. Chem. Phys., 26, 8937–8959, https://doi.org/10.5194/acp-26-8937-2026, 2026.
Eames, T., Schutgens, N., Ioannidis, E., van der Velde, I. R., van Gerrevink, M. J., Vernooij, R., and van der Werf, G. R.: Radiative forcing due to shifting southern African fire regimes, Atmos. Chem. Phys., 25, 17429–17453, https://doi.org/10.5194/acp-25-17429-2025, 2025.
Ernst, Y., Archibald, S., Balzter, H., Chevallier, F., Ciais, P., Fischer, C. G., Gaubert, B., Higginbottom, T., Higgins, S., Lawal, S., Lacroix, F., Lauerwald, R., Lourenco, M., Martens, C., Mengistu, A. G., Merbold, L., Mitchard, E., Moyo, M., Nguyen, H., O'Sullivan, M., Rodríguez-Veiga, P., Rosan, T., Rosentreter, J., Ryan, C., Scheiter, S., Sitch, S., Stevens, N., Tagesson, T., Tian, H., Wang, M., Woon, J. S., Zheng, B., Zhou, Y., and Scholes, R. J.: The African Regional Greenhouse Gases Budget (2010–2019), Global Biogeochem. Cy., 38, e2023GB008016, https://doi.org/10.1029/2023GB008016, 2024.
Feng, L., Palmer, P. I., Parker, R. J., Lunt, M. F., and Bösch, H.: Methane emissions are predominantly responsible for record-breaking atmospheric methane growth rates in 2020 and 2021, Atmos. Chem. Phys., 23, 4863–4880, https://doi.org/10.5194/acp-23-4863-2023, 2023.
Frey, M., Sha, M. K., Hase, F., Kiel, M., Blumenstock, T., Harig, R., Surawicz, G., Deutscher, N. M., Shiomi, K., Franklin, J. E., Bösch, H., Chen, J., Grutter, M., Ohyama, H., Sun, Y., Butz, A., Mengistu Tsidu, G., Ene, D., Wunch, D., Cao, Z., Garcia, O., Ramonet, M., Vogel, F., and Orphal, J.: Building the COllaborative Carbon Column Observing Network (COCCON): long-term stability and ensemble performance of the EM27/SUN Fourier transform spectrometer, Atmos. Meas. Tech., 12, 1513–1530, https://doi.org/10.5194/amt-12-1513-2019, 2019.
Ganesan, A. L., Manning, A. J., Grant, A., Young, D., Oram, D. E., Sturges, W. T., Moncrieff, J. B., and O'Doherty, S.: Quantifying methane and nitrous oxide emissions from the UK and Ireland using a national-scale monitoring network, Atmos. Chem. Phys., 15, 6393–6406, https://doi.org/10.5194/acp-15-6393-2015, 2015.
Gaubert, B., Stephens, B. B., Baker, D. F., Basu, S., Bertolacci, M., Bowman, K. W., Buchholz, R., Chatterjee, A., Chevallier, F., Commane, R., Cressie, N., Deng, F., Jacobs, N., Johnson, M. S., Maksyutov, S. S., McKain, K., Liu, J., Liu, Z., Morgan, E., O'Dell, C., Philip, S., Ray, E., Schimel, D., Schuh, A., Taylor, T. E., Weir, B., van Wees, D., Wofsy, S. C., Zammit-Mangion, A., and Zeng, N.: Neutral Tropical African CO2 Exchange Estimated From Aircraft and Satellite Observations, Global Biogeochem. Cy., 37, e2023GB007804, https://doi.org/10.1029/2023GB007804, 2023.
Gunaratne, T., Liyanage, S., Punchihewa, C., Badurdeen, S., and Jayathilaka, R.: Unmasking climate vulnerability in Africa: the role of CO2 and CH4 emissions on rising temperatures and sea levels, Humanities and Social Sciences Communications, 12, 601, https://doi.org/10.1057/s41599-025-04890-0, 2025.
Hase, F., Frey, M., Kiel, M., Blumenstock, T., Harig, R., Keens, A., and Orphal, J.: Addition of a channel for XCO observations to a portable FTIR spectrometer for greenhouse gas measurements, Atmos. Meas. Tech., 9, 2303–2313, https://doi.org/10.5194/amt-9-2303-2016, 2016.
Helfter, C., Gondwe, M., Murray-Hudson, M., Makati, A., and Skiba, U.: From sink to source: high inter-annual variability in the carbon budget of a Southern African wetland, Philos. T. R. Soc. A, 380, https://doi.org/10.1098/rsta.2021.0148, 2021.
Hersbach, H., Bell, B., Berrisford, P., Hirahara, S., Horányi, A., Muñoz-Sabater, J., Nicolas, J., Peubey, C., Radu, R., Schepers, D., Simmons, A., Soci, C., Abdalla, S., Abellan, X., Balsamo, G., Bechtold, P., Biavati, G., Bidlot, J., Bonavita, M., De Chiara, G., Dahlgren, P., Dee, D., Diamantakis, M., Dragani, R., Flemming, J., Forbes, R., Fuentes, M., Geer, A., Haimberger, L., Healy, S., Hogan, R. J., Hólm, E., Janisková, M., Keeley, S., Laloyaux, P., Lopez, P., Lupu, C., Radnoti, G., de Rosnay, P., Rozum, I., Vamborg, F., Villaume, S., and Thépaut, J.-N.: The ERA5 global reanalysis, Q. J. Roy. Meteor. Soc., 146, 1999–2049, https://doi.org/10.1002/qj.3803, 2020.
Hourdin, F., Rio, C., Grandpeix, J.-Y., Madeleine, J.-B., Cheruy, F., Rochetin, N., Jam, A., Musat, I., Idelkadi, A., Fairhead, L., Foujols, M.-A., Mellul, L., Traore, A.-K., Dufresne, J.-L., Boucher, O., Lefebvre, M.-P., Millour, E., Vignon, E., Jouhaud, J., Diallo, F. B., Lott, F., Gastineau, G., Caubel, A., Meurdesoif, Y., and Ghattas, J.: LMDZ6A: The Atmospheric Component of the IPSL Climate Model With Improved and Better Tuned Physics, J. Adv. Model. Earth Sy., 12, e2019MS001892, https://doi.org/10.1029/2019MS001892, 2020.
Humpage, N., Boesch, H., Okello, W., Chen, J., Dietrich, F., Lunt, M. F., Feng, L., Palmer, P. I., and Hase, F.: Greenhouse gas column observations from a portable spectrometer in Uganda, Atmos. Meas. Tech., 17, 5679–5707, https://doi.org/10.5194/amt-17-5679-2024, 2024.
Kadygrov, N., Broquet, G., Chevallier, F., Rivier, L., Gerbig, C., and Ciais, P.: On the potential of the ICOS atmospheric CO2 measurement network for estimating the biogenic CO2 budget of Europe, Atmos. Chem. Phys., 15, 12765–12787, https://doi.org/10.5194/acp-15-12765-2015, 2015.
Kaiser, J. W., Heil, A., Andreae, M. O., Benedetti, A., Chubarova, N., Jones, L., Morcrette, J.-J., Razinger, M., Schultz, M. G., Suttie, M., and van der Werf, G. R.: Biomass burning emissions estimated with a global fire assimilation system based on observed fire radiative power, Biogeosciences, 9, 527–554, https://doi.org/10.5194/bg-9-527-2012, 2012.
Kaminski, T. and Rayner, P. J.: Reviews and syntheses: guiding the evolution of the observing system for the carbon cycle through quantitative network design, Biogeosciences, 14, 4755–4766, https://doi.org/10.5194/bg-14-4755-2017, 2017.
Keppel-Aleks, G., Randerson, J. T., Lindsay, K., Stephens, B. B., Keith Moore, J., Doney, S. C., Thornton, P. E., Mahowald, N. M., Hoffman, F. M., Sweeney, C., Tans, P. P., Wennberg, P. O., and Wofsy, S. C.: Atmospheric Carbon Dioxide Variability in the Community Earth System Model: Evaluation and Transient Dynamics during the Twentieth and Twenty-First Centuries, J. Climate, 26, 4447–4475, https://doi.org/10.1175/JCLI-D-12-00589.1, 2013.
Kurganskiy, A., Feng, L., Humpage, N., Palmer, P. I., Woodwark, A. J. P., Doniki, S., and Weidmann, D.: The Greenhouse gas Emission Monitoring network to Inform Net-zero Initiatives UK (GEMINI-UK): network design, theoretical performance, and initial data, Atmos. Meas. Tech., 18, 7525–7563, https://doi.org/10.5194/amt-18-7525-2025, 2025.
Lauvaux, T., Schuh, A. E., Bocquet, M., Wu, L., Richardson, S., Miles, N., and Davis, K. J.: Network design for mesoscale inversions of CO2 sources and sinks, Tellus B, 64, 17980, https://doi.org/10.3402/tellusb.v64i0.17980, 2012.
Liu, S., Wei, K., Chen, B., Jin, Z., Chen, Z., Wu, Z., Fan, Z., Li, S., Zang, K., Zhang, C., Xu, H., De Maeyer, P., and Fang, S.: Unveiling High-Resolution CH4 Profiles Over Southeast China: Novel Insights From AirCore Balloon Observations, Geophys. Res. Lett., 52, e2025GL116203, https://doi.org/10.1029/2025GL116203, 2025.
Lunt, M. F., Palmer, P. I., Feng, L., Taylor, C. M., Boesch, H., and Parker, R. J.: An increase in methane emissions from tropical Africa between 2010 and 2016 inferred from satellite data, Atmos. Chem. Phys., 19, 14721–14740, https://doi.org/10.5194/acp-19-14721-2019, 2019.
McDuffie, E. E., Smith, S. J., O'Rourke, P., Tibrewal, K., Venkataraman, C., Marais, E. A., Zheng, B., Crippa, M., Brauer, M., and Martin, R. V.: A global anthropogenic emission inventory of atmospheric pollutants from sector- and fuel-specific sources (1970–2017): an application of the Community Emissions Data System (CEDS), Earth Syst. Sci. Data, 12, 3413–3442, https://doi.org/10.5194/essd-12-3413-2020, 2020.
Mengistu, A. G. and Mengistu Tsidu, G.: On the performance of satellite-based observations of XCO2 in capturing the NOAA Carbon Tracker model and ground-based flask observations over Africa's land mass, Atmos. Meas. Tech., 13, 4009–4033, https://doi.org/10.5194/amt-13-4009-2020, 2020.
Merbold, L., Scholes, R. J., Acosta, M., Beck, J., Bombelli, A., Fiedler, B., Grieco, E., Helmschrot, J., Hugo, W., Kasurinen, V., Kim, D.-G., Körtzinger, A., Leitner, S., López-Ballesteros, A., Ndisi, M., Nickless, A., Salmon, E., Saunders, M., Skjelvan, I., Vermeulen, A. T., and Kutsch, W. L.: Opportunities for an African greenhouse gas observation system, Reg. Environ. Change, 21, 104, https://doi.org/10.1007/s10113-021-01823-w, 2021.
Mostefaoui, M., Ciais, P., McGrath, M. J., Peylin, P., Patra, P. K., and Ernst, Y.: Greenhouse gas emissions and their trends over the last 3 decades across Africa, Earth Syst. Sci. Data, 16, 245–275, https://doi.org/10.5194/essd-16-245-2024, 2024.
Nickless, A., Scholes, R. J., Vermeulen, A., Beck, J., López-Ballesteros, A., Ardö, J., Karstens, U., Rigby, M., Kasurinen, V., Pantazatou, K., Jorch, V., and Kutsch, W.: Greenhouse gas observation network design for Africa, Tellus B, https://doi.org/10.1080/16000889.2020.1824486, 2020a.
Nickless, A., Scholes, R. J., Vermeulen, A., Beck, J., López-Ballesteros, A., Ardö, J., Karstens, U., Rigby, M., Kasurinen, V., Pantazatou, K., Jorch, V., and Kutsch, W.: Greenhouse gas observation network design for Africa, Tellus B, 72, 1–30, https://doi.org/10.1080/16000889.2020.1824486, 2020b.
Palmer, P. I., Wilson, E. L., L. Villanueva, G., Liuzzi, G., Feng, L., DiGregorio, A. J., Mao, J., Ott, L., and Duncan, B.: Potential improvements in global carbon flux estimates from a network of laser heterodyne radiometer measurements of column carbon dioxide, Atmos. Meas. Tech., 12, 2579–2594, https://doi.org/10.5194/amt-12-2579-2019, 2019.
Park, H., Jeong, S., Sha, M. K., Lee, J., and Frey, M. M.: Comparisons of Greenhouse Gas Observation Satellite Performances Over Seoul Using a Portable Ground-Based Spectrometer, Geophys. Res. Lett., 51, e2024GL109334, https://doi.org/10.1029/2024GL109334, 2024.
Pollard, D. F., Robinson, J., Shiona, H., and Smale, D.: Intercomparison of Total Carbon Column Observing Network (TCCON) data from two Fourier transform spectrometers at Lauder, New Zealand, Atmos. Meas. Tech., 14, 1501–1510, https://doi.org/10.5194/amt-14-1501-2021, 2021.
Qu, Z., Jacob, D. J., Zhang, Y., Shen, L., Varon, D. J., Lu, X., Scarpelli, T., Bloom, A., Worden, J., and Parker, R. J.: Attribution of the 2020 surge in atmospheric methane by inverse analysis of GOSAT observations, Environ. Res. Lett., 17, 094003, https://doi.org/10.1088/1748-9326/ac8754, 2022.
Rayner, P. J., Michalak, A. M., and Chevallier, F.: Fundamentals of data assimilation applied to biogeochemistry, Atmos. Chem. Phys., 19, 13911–13932, https://doi.org/10.5194/acp-19-13911-2019, 2019.
Rodgers, C. D.: Inverse Methods for Atmospheric Sounding, Inverse Methods for Atmospheric Sounding, in: Series on Atmospheric, Oceanic and Planetary Physics: Volume 2, 256 pp., https://doi.org/10.1142/3171, 2000.
Sasakawa, M., Shimoyama, K., Machida, T., Tsuda, N., Suto, H., Arshinov, M., Davydov, D., Fofonov, A., Krasnov, O., Saeki, T., Koyama, Y., and Maksyutov, S.: Continuous measurements of methane from a tower network over Siberia, Tellus B, 62, 403–416, https://doi.org/10.1111/j.1600-0889.2010.00494.x, 2010.
Saunois, M., Martinez, A., Poulter, B., Zhang, Z., Raymond, P. A., Regnier, P., Canadell, J. G., Jackson, R. B., Patra, P. K., Bousquet, P., Ciais, P., Dlugokencky, E. J., Lan, X., Allen, G. H., Bastviken, D., Beerling, D. J., Belikov, D. A., Blake, D. R., Castaldi, S., Crippa, M., Deemer, B. R., Dennison, F., Etiope, G., Gedney, N., Höglund-Isaksson, L., Holgerson, M. A., Hopcroft, P. O., Hugelius, G., Ito, A., Jain, A. K., Janardanan, R., Johnson, M. S., Kleinen, T., Krummel, P. B., Lauerwald, R., Li, T., Liu, X., McDonald, K. C., Melton, J. R., Mühle, J., Müller, J., Murguia-Flores, F., Niwa, Y., Noce, S., Pan, S., Parker, R. J., Peng, C., Ramonet, M., Riley, W. J., Rocher-Ros, G., Rosentreter, J. A., Sasakawa, M., Segers, A., Smith, S. J., Stanley, E. H., Thanwerdas, J., Tian, H., Tsuruta, A., Tubiello, F. N., Weber, T. S., van der Werf, G. R., Worthy, D. E. J., Xi, Y., Yoshida, Y., Zhang, W., Zheng, B., Zhu, Q., Zhu, Q., and Zhuang, Q.: Global Methane Budget 2000–2020, Earth Syst. Sci. Data, 17, 1873–1958, https://doi.org/10.5194/essd-17-1873-2025, 2025.
Schooling, C. N., Feng, L., Woodwark, A. J. P., and Palmer, P. I.: Potential of point source imaging satellite instruments to infer diffuse methane emissions: a theoretical case study of the Near-Infrared Multispectral Camera (NIMCAM), EGUsphere [preprint], https://doi.org/10.5194/egusphere-2026-812, 2026.
Sweeney, C., Chatterjee, A., Wolter, S., McKain, K., Bogue, R., Conley, S., Newberger, T., Hu, L., Ott, L., Poulter, B., Schiferl, L., Weir, B., Zhang, Z., and Miller, C. E.: Using atmospheric trace gas vertical profiles to evaluate model fluxes: a case study of Arctic-CAP observations and GEOS simulations for the ABoVE domain, Atmos. Chem. Phys., 22, 6347–6364, https://doi.org/10.5194/acp-22-6347-2022, 2022.
Thanwerdas, J., Cristofanelli, P., Fiore, A., Dröge, R., Van Mil, S., Villalobos, Y., Wu, Z., and Brunner, D.: Exploring atmospheric CH4 monitoring network expansion in Italy using inverse modelling, Atmos. Chem. Phys., 26, 10477–10507, https://doi.org/10.5194/acp-26-10477-2026, 2026.
Valentini, R., Arneth, A., Bombelli, A., Castaldi, S., Cazzolla Gatti, R., Chevallier, F., Ciais, P., Grieco, E., Hartmann, J., Henry, M., Houghton, R. A., Jung, M., Kutsch, W. L., Malhi, Y., Mayorga, E., Merbold, L., Murray-Tortarolo, G., Papale, D., Peylin, P., Poulter, B., Raymond, P. A., Santini, M., Sitch, S., Vaglio Laurin, G., van der Werf, G. R., Williams, C. A., and Scholes, R. J.: A full greenhouse gases budget of Africa: synthesis, uncertainties, and vulnerabilities, Biogeosciences, 11, 381–407, https://doi.org/10.5194/bg-11-381-2014, 2014.
van der Velde, I. R., van der Werf, G. R., van Wees, D., Schutgens, N. A. J., Vernooij, R., Houweling, S., Tonucci, E., Chuvieco, E., Randerson, J. T., Frey, M. M., Borsdorff, T., and Aben, I.: Small Fires, Big Impact: Evaluating Fire Emission Estimates in Southern Africa Using New Satellite Imagery of Burned Area and Carbon Monoxide, Geophys. Res. Lett., 51, e2023GL106122, https://doi.org/10.1029/2023GL106122, 2024.
van der Werf, G. R., Randerson, J. T., Giglio, L., van Leeuwen, T. T., Chen, Y., Rogers, B. M., Mu, M., van Marle, M. J. E., Morton, D. C., Collatz, G. J., Yokelson, R. J., and Kasibhatla, P. S.: Global fire emissions estimates during 1997–2016, Earth Syst. Sci. Data, 9, 697–720, https://doi.org/10.5194/essd-9-697-2017, 2017.
van der Werf, G. R., Randerson, J. T., van Wees, D., Chen, Y., Giglio, L., Hall, J., Vernooij, R., Mu, M., Binte Shahid, S., Barsanti, K. C., Yokelson, R., and Morton, D. C.: Landscape fire emissions from the 5th version of the Global Fire Emissions Database (GFED5), Scientific Data, 12, 1870, https://doi.org/10.1038/s41597-025-06127-w, 2025.
Villalobos, Y., Gómez-Ortiz, C., Scholze, M., Monteil, G., Karstens, U., Fiore, A., Brunner, D., Thanwerdas, J., and Cristofanelli, P.: Towards improving top–down national CO2 estimation in Europe: potential from expanding the ICOS atmospheric network in Italy, Environ. Res. Lett., 20, 054002, https://doi.org/10.1088/1748-9326/adc41e, 2025.
Western, L. M., Ramsden, A. E., Ganesan, A. L., Boesch, H., Parker, R. J., Scarpelli, T. R., Tunnicliffe, R. L., and Rigby, M.: Estimates of North African Methane Emissions from 2010 to 2017 Using GOSAT Observations, Environ. Sci. Tech. Let., 8, 626–632, https://doi.org/10.1021/acs.estlett.1c00327, 2021.
Wunch, D., Toon, G. C., Blavier, J.-F. L., Washenfelder, R. A., Notholt, J., Connor, B. J., Griffith, D. W. T., Sherlock, V., and Wennberg, P. O.: The Total Carbon Column Observing Network, Philos. T. R. Soc. A, 369, 2087–2112, https://doi.org/10.1098/rsta.2010.0240, 2011.
Xiao, H., Song, C., Li, S., Lu, X., Liang, M., Xia, X., and Yuan, W.: Global Wetland Methane Emissions From 2001 to 2020: Magnitude, Dynamics and Controls, Earth's Future, 12, e2024EF004794, https://doi.org/10.1029/2024EF004794, 2024.
Zhang, Y., Fang, S., Chen, J., Lin, Y., Chen, Y., Liang, R., Jiang, K., Parker, R. J., Boesch, H., Steinbacher, M., Sheng, J.-X., Lu, X., Song, S., and Peng, S.: Observed changes in China's methane emissions linked to policy drivers, P. Natl. Acad. Sci. USA, 119, e2202742119, https://doi.org/10.1073/pnas.2202742119, 2022.
Zhou, M., Wang, Y., Duan, M., Tian, X., Ding, J., Bi, J., Ma, Y., Ma, W., and Xi, Z.: Greenhouse gas measurement campaign of the Earth Summit Mission-2022: ground-based in situ and FTIR observations and contribution to satellite validation in the Qomolangma region, Atmos. Meas. Tech., 18, 4311–4324, https://doi.org/10.5194/amt-18-4311-2025, 2025.