
the Creative Commons Attribution 4.0 License.
the Creative Commons Attribution 4.0 License.
 | 19 Aug 2026
Evidence of cloud sensitivity to above-cloud CCN as a function of environmental stability in the Southeast Atlantic based on remote sensing observations
Siddhant Gupta
Greg M. McFarquhar
Feng Xu
Richard A. Ferrare
Chris A. Hostetler
Jens Redemann
Information about the vertical distribution of cloud condensation nuclei (CCN) concentrations (NCCN) is necessary for accurately quantifying aerosol-cloud interactions (ACI), as is constraining environmental conditions to separate aerosol effects from meteorological influences on clouds. Utilizing a new machine learning (ML) method for retrieving NCCN from High Spectral Resolution Lidar 2 (HSRL-2) observables, we assess the simultaneous impact of above- and below-cloud NCCN on cloud microphysical properties via clear-sky, cloud-adjacent lidar profiles and collocated polarimetric retrievals of cloud properties. We observe a decrease in cloud droplet effective radius (Reff) and an increase in cloud droplet number concentration (Nd), associated with an increase in above-cloud NCCN. Additionally, we find that the magnitude of these ACI are strongly dependent on LTS. We calculate ACI and ACI and find that ACIREFF decreases from 0.161 to 0.042 (−73.9 %) and ACICDNC decreases from 0.452 to 0.116 (−74.3 %) as LTS increases from 10 to 22 K. We find that above-cloud NCCN – cloud property relationships are similar for cloud edge and cloud center observations. The relationship between below-cloud NCCN and cloud top properties is strongly dependent on LTS, with ACI metrics increasing as LTS increases. This demonstrates the dominance of above-cloud smoke entrainment as a modulator of stratocumulus cloud properties under unstable conditions, while below-cloud NCCN nucleation dominates in stable environments. These findings demonstrate the importance of vertically resolved NCCN and consideration of LTS in ACI studies and establish a remote sensing-based method with which future satellite studies can investigate ACI.
- Article
(7503 KB) - Full-text XML
- BibTeX
- EndNote


Amidst several identified climate forcings that have and will continue to determine current and future climate warming, the highest uncertainty remains linked to aerosol-cloud interactions (ACI; Forster et al., 2021). Clouds play a significant role in the climate system by regulating the atmosphere's radiative budget and surface precipitation. To improve their accuracy in climate model projections, the impact of cloud condensation nuclei (CCN) and ice nucleating particles on cloud properties must be better understood and quantified (Seinfeld et al., 2016). Recent improvements in our understanding of cloud processes have suggested that in a warming climate, clouds may act to amplify warming instead of suppressing it (Forster et al., 2021). The strong dependence of our future climate on clouds and aerosols motivates continued efforts to reduce uncertainty associated with their interactions.
Increases in CCN concentration (NCCN) at a fixed cloud liquid water path (LWP) are generally understood to reduce cloud droplet effective radius (Reff) while increasing cloud droplet number concentration (Nd), thereby increasing the reflectance of clouds (Twomey, 1974). The nucleation of more numerous small droplets may delay or suppress the formation of raindrops by reducing collision-coalescence rates, thereby extending cloud lifetime (Albrecht, 1989) due to precipitation suppression and susceptibility to aerosols (e.g., Gupta et al., 2022a). Delayed precipitation formation can allow the cloud layer to reach higher cloud top heights (Andreae, 2004; Rosenfeld, 2006; Myhre et al., 2007), and the consequent increase in cloud geometric thickness can buffer the initial precipitation suppression via an increase in LWP. The numerous pathways and outcomes of ACI are interlinked, complicating our understanding of their overall effect on Earth's radiative budget because of the uncertainty associated with the sign and magnitude of their effective radiative forcing (Myhre et al., 2007; Forster et al., 2021). Additionally, local meteorology strongly governs cloud properties, making it difficult to disentangle aerosol effects from the effects of dynamics and meteorological regimes (McFarquhar, 2004; Lohmann et al., 2006; Mauger and Norris, 2007; Stevens and Feingold, 2009; Gryspeerdt et al., 2014; Rosenfeld et al., 2014; Zhang et al., 2016; Malavelle et al., 2017; Douglas and L'Ecuyer, 2019). Previous studies have constrained the impact of meteorology or climatological regimes by developing regime-based approaches to constrain ACI as a function of cloud top pressure, cloud optical depth, vertical pressure velocity, lower tropospheric stability (LTS), estimated inversion strength (EIS), precipitation rate, and updraft velocity (Wood and Bretherton, 2006; Gryspeerdt and Stier, 2012; Gryspeerdt et al., 2014; Zhang et al., 2016; Chen et al., 2018; Zhao et al., 2025).
Many studies investigate evidence of ACI using retrievals of cloud microphysical properties from passive satellite instruments such as the Moderate Resolution Imaging Spectroradiometer (MODIS; Myhre et al., 2007; Alam et al., 2010; Goren and Rosenfeld, 2012; Chen et al., 2015; McCoy et al., 2017; Pan et al., 2018; Painemal et al., 2020; Gryspeerdt et al., 2022; Gupta et al., 2022b) and the Spinning Enhanced Visible and Infrared Imager (SEVIRI; Goren and Rosenfeld, 2012; Alexandri et al., 2024) or from active sensors such as CloudSat (Pan et al., 2018; Douglas and L'Ecuyer, 2019). Cloud retrievals from these platforms have been tested and evaluated against airborne in situ observations (Roebeling et al., 2008; Painemal and Zuidema, 2011; Min et al., 2012; King et al., 2013; Gupta et al., 2022b; Wang et al., 2024; Painemal et al., 2025). However, their aerosol observations are limited to columnar products such as aerosol optical depth (AOD), which may serve as an adequate NCCN proxy over large spatiotemporal extents (Stier, 2016) but cannot fully explain NCCN variance and lacks any information about the vertical distribution of NCCN (Andreae, 2009; Shinozuka et al., 2015; Stier, 2016; Choudhury and Tesche, 2022a, b). Additionally, aerosol retrievals from passive remote sensing platforms are limited to clear-sky conditions and are further limited spatially by cloud contamination and near-cloud aerosol humidification effects, meaning that their aerosol products are often limited to those 15 km away from cloud edge (Christensen et al., 2017). Enhanced near-cloud reflectance due to three-dimensional scattering can also occur at sunlit cloud edges (Várnai and Marshak, 2009, 2011), which does not impact active lidar observations. These limitations often make passive aerosol retrievals insufficient for studying ACI.
The vertical distribution of NCCN is especially relevant for ACI since NCCN is of greater interest near the cloud base, where most cloud droplets nucleate. Therefore, many satellite-based studies have incorporated observations from the satellite-based Cloud-Aerosol Lidar with Orthogonal Polarization (CALIOP) to add information about aerosol vertical distributions to ACI analyses (Várnai and Marshak, 2012; Costantino and Bréon, 2013; Pan et al., 2018; Douglas and L'Ecuyer, 2019; Painemal et al., 2020; Alexandri et al., 2024; Li et al., 2026). CALIOP observations allow for estimates of aerosol layer heights relative to cloud and therefore provide more reliable ACI estimates than vertically integrated products. For example, Pan et al. (2018) found a weakening of ACI relationships with increasing cloud base height in South Asia, which was associated with the vertical distribution of aerosols. Painemal et al. (2020) and Li et al. (2026) found strong correlations between droplet number concentration and extinction measured below cloud top, compared to less meaningful relationships seen using AOD. Studies using CALIOP to incorporate vertical aerosol distributions into ACI analyses have facilitated continued efforts in improving vertically resolved aerosol and NCCN information to further constrain ACI uncertainties. Other studies have investigated ACI using ground-based (e.g., Lihavainen et al., 2010; Modini et al., 2015; Dedrick et al., 2025) or airborne in situ observations (e.g., Twohy et al., 2005; Modini et al., 2015; Diamond et al., 2018; Kacarab et al., 2020; Gupta et al., 2021; D'Alessandro et al., 2023; Zheng et al., 2024). Airborne platforms allow for higher spatial resolution than satellite observations and greater spatial coverage than ground-based in situ observations.
Marine stratocumulus clouds cover approximately one-third of global oceans (Warren et al., 1988) and have a strong impact on the shortwave radiation budget. ACI and the radiative properties of stratocumulus clouds are regulated in part by cloud top entrainment, which can cause droplet evaporation and thinning of clouds depending on the moisture content of free tropospheric air (Wood, 2012; Mellado, 2017). One region of particular interest for studying these clouds is the Southeast Atlantic Ocean (SEA), where seasonal biomass burning aerosols (BBA) are emitted from Southern Africa and lofted atop a semi-permanent deck of marine stratocumulus clouds (Redemann et al., 2021). The absorbing nature of these aerosols has implications for the direct aerosol radiative effect (DARE; Doherty et al., 2022; Chang et al., 2025), and the entrainment of BBA into both the cloud layer and the underlying marine boundary layer (BL) has implications for cloud microphysical properties (Kaufman et al., 2003; Ross et al., 2003; Adebiyi et al., 2015; Zuidema et al., 2016). Diamond et al. (2018) found a strong relationship between in situ Nd and below-cloud BBA in the SEA region. Subsequently, Gupta et al. (2021) found in situ-based evidence of ACI that were dependent on not just below-cloud aerosols, but also the vertical separation between cloud tops and the above-cloud BBA plume. While considerable focus is placed on interactions between below-cloud NCCN and cloud microphysics, recent observational and modelling studies address the possibility of cloud droplet nucleation at cloud-environment interfaces above cloud base (Sun et al., 2012; Hernández Pardo et al., 2019; Oh et al., 2023; Sterzinger and Igel, 2024).
The overarching objective of this study is to investigate relationships between stratocumulus cloud properties and NCCN using a remote sensing-based approach. Motivated by the results of Gupta et al. (2021) for the NASA ObseRvations of Aerosols above CLouds and their intEractionS (ORACLES) campaign (Redemann et al., 2021), we expand on this study using remotely-sensed cloud microphysical properties and a new method for retrieving above- and below-cloud NCCN from High Spectral Resolution Lidar 2 (HSRL-2) observables (Redemann and Gao, 2024; Sect. 2.1.1). The use of vertically resolved NCCN from this method allows us to look at ACI as a function of NCCN within 100 m above cloud top and to investigate the simultaneous impact of above- and below-cloud NCCN on cloud top microphysical properties using lidar profiles adjacent to the cloud edge. Specifically, the research discussed here addresses the following questions:
-
Can remote sensing retrievals replicate the relationships between above-cloud NCCN and cloud top microphysical properties identified from in situ measurements for clouds impacted by smoke aerosols?
-
How do above-cloud ACI vary based on meteorological conditions?
-
Can the impacts of below-cloud NCCN be constrained using retrievals from cloud edge lidar profiles? If so, are above- or below-cloud NCCN more strongly related to cloud top microphysical properties?
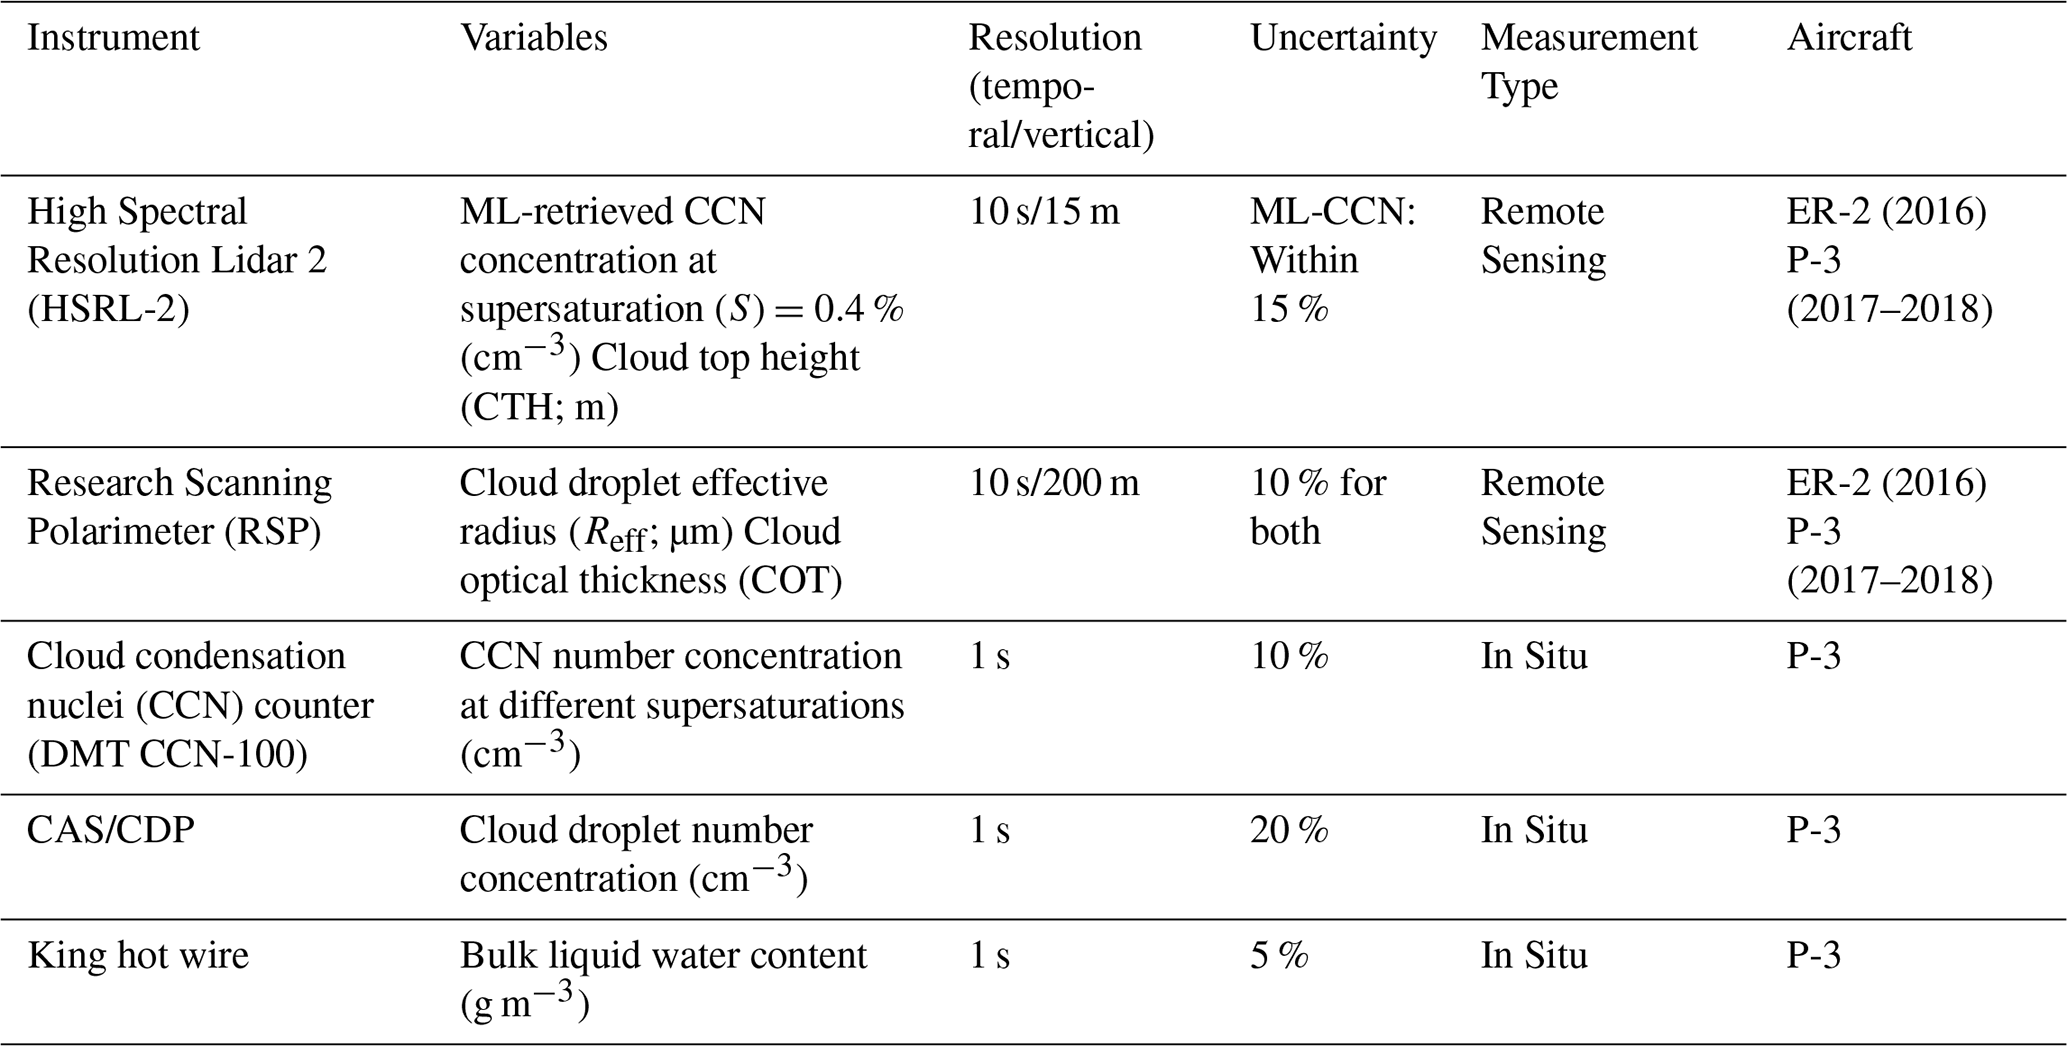
The NASA ORACLES campaign was comprised of three deployments in September 2016, August 2017, and October 2018. Deployments were based out of Walvis Bay, Namibia, in September 2016 and São Tomé and Príncipe in August 2017 and October 2018, and observations were made using a combination of remote sensing and in situ instruments located on the NASA P-3 (2016–2018) and the ER-2 (2016 only) aircraft. In this study, results are based on NCCN and cloud microphysical properties retrieved by remote sensing instrumentation. However, we also use two in situ data sets to provide context and prerequisite information for the analysis. Therefore, the remainder of this section is organized as follows. The primary remote sensing-based data sets used in this study are described in Sect. 2.1, in situ data sets are described in Sect. 2.2, and all data sets are summarized in Table 1. Our method for calculating NCCN autocorrelation and using the results to inform data collocation, in addition to the calculation of LTS, are given in Sect. 2.3.
Table 1List of instruments and data sets used in this study, including their respective resolution, measurement type, and aircraft location.
2.1 Remote Sensing-Based Data Sets
2.1.1 ML-CCN retrievals from HSRL-2
Redemann and Gao (2024) recently developed a machine learning (ML) methodology for retrieving NCCN (ML-CCN) from lidar observables, a method which has significant implications for future spaceborne retrievals of NCCN from systems such as the Atmospheric LIDar (ATLID) on the EarthCARE satellite (Wehr et al., 2023). The ML algorithm was trained using HSRL-2 observables, reanalysis data (temperature and relative humidity), and in situ NCCN from several recent suborbital field campaigns and can predict NCCN with mean relative errors (MRE) of about 15 %. In addition to creating a larger spatial coverage of NCCN data than is available from the in situ measurements, another benefit is the retrieval of the vertical distribution of NCCN possible with this method. This allows us to assess the impact of above- and below-cloud NCCN simultaneously from lidar profiles adjacent to cloud edges (Sect. 2.3). Additionally, since relative humidity (RH) is one of the predictors used to train the model, the effect of aerosol swelling at high RH on lidar observables is considered to predict NCCN under dry conditions (Redemann and Gao, 2024). While Redemann and Gao (2024) use the full suite of HSRL-2 observables to predict NCCN, this study uses the same methodology to predict NCCN at a supersaturation of 0.4 % with a model that uses backscatter coefficients at 532 and 1064 nm and depolarization ratio at 532 and 1064 nm as input. This combination of observables was chosen to maximize the number of available retrievals, as extinction coefficients and all observables at 355 nm are less frequently available at below-cloud altitudes in the ORACLES observations. Compared to the model trained with the full set of HSRL-2 observables (15 % MRE), this adjusted model has an MRE of 19.9 %. This adjustment to improve data availability only results in a modest increase in the MRE of the NCCN prediction.
2.1.2 Research Scanning Polarimeter
Retrievals of cloud top microphysical properties in this study come from the Research Scanning Polarimeter (RSP), which measures total and polarized reflectance at nine spectral channels (Cairns et al., 1999; Alexandrov et al., 2012a). The RSP is generally oriented to scan along the aircraft track at 0.8° intervals, such that observational data from each scan contains about 150 instantaneous Earth viewing measurements (Alexandrov et al., 2012a). Reff retrievals use polarized reflectance in the scattering angle range between 135 and 165°, where the rain- or cloud-bow structure is observed. Since the rainbow is created by single scattering of light by cloud droplets, the structure is characteristic of droplet sizes at cloud top and within a unit optical depth into the cloud layer, or approximately 50 m (Alexandrov et al., 2018). The RSP Reff retrieval is insensitive to spatial inhomogeneities and three-dimensional radiative transfer effects (Alexandrov et al., 2012b), a significant advantage over satellite retrievals, such as those from MODIS, which tend to underestimate COT and Reff in cases with above-cloud absorbing aerosols if not accounted for in the algorithm (Meyer et al., 2013, 2025). The RSP also retrieves cloud optical thickness (COT) using 865 nm unpolarized observations with a 1D radiative transfer model and constraining results using the polarimetric Reff (Alexandrov et al., 2012a; Painemal et al., 2025). While Reff and COT are retrieved quantities and subject to retrieval assumptions and radiative sensitivities, RSP retrievals have been compared and evaluated against in situ observations, demonstrating their accuracy and potential for satellite-based retrievals of this kind, with Reff agreements generally better than 1 µm and effective variance (Veff) agreements better than 0.02 (Alexandrov et al., 2018; Painemal et al., 2021, 2025; Fu et al., 2022).
From RSP retrievals of Reff and cloud COT, we also calculate Nd and LWP. Nd is calculated using the method from Painemal and Zuidema (2011) given in Eq. (1):
and LWP is calculated using the method from Wood (2006), as given in Eq. (2):
where ρw is the density of water. The calculation of Nd assumes a value of 2.0 g m−3 km−1 for the condensation rate of water vapor with height, which is an average based on observations from the Southeast Pacific of offshore clouds with nearly adiabatic LWC profiles and coastal clouds with decreased LWC at cloud top due to increased entrainment, and thus less adiabatic observed profiles (Painemal and Zuidema, 2010). The relative uncertainties for Reff (Alexandrov et al., 2012a, b) and COT (Nakajima and King, 1990) are both assumed to be 10 %, and these values are used in Gaussian error propagation calculations to calculate uncertainties for Nd and LWP, as given in Eqs. (3) and (4), respectively:
where δ represents the error of each variable.
2.2 In Situ Data Sets
2.2.1 CCN counter
The Georgia Institute of Technology (GIT) Droplet Measurement Technologies (DMT) CCN counter (CCN-100) measures in situ NCCN at various water vapor supersaturation (Kacarab et al., 2020), which for ORACLES ranged between 0.1 % and 0.4 % (Redemann et al., 2021). The instrument is designed as a continuous-flow streamwise thermal-gradient chamber, where the continuous transport of heat and water vapor from wetted walls is subject to a temperature gradient, which generates quasi-uniform supersaturation in the center of a cylindrical flow chamber (Roberts and Nenes, 2005). Aerosols that activate into droplets with a radius greater than 0.5 µm at the end of the chamber are counted as CCN. The continuous-flow feature allows for quick (1 Hz) sampling, which is important for airborne sampling that often encounters rapidly changing environments (Roberts and Nenes, 2005). NCCN uncertainty is reported as ±10 % at high signal-to-noise ratios, while supersaturation uncertainty is given as ±0.04 % (Rose et al., 2008). In this study, we use in situ-measured CCN for an autocorrelation analysis to assess over what distances we may reasonably extrapolate cloud edge NCCN values further towards cloud center from the edge (Sect. 2.3–2.4).
2.2.2 In situ cloud probes and cloud base height estimates
To estimate cloud base height, we follow the methodology of Gupta et al. (2021) who derived a relationship between in situ measured cloud top height (ZT) and cloud base height (ZB) for six research flights in the 2016 deployment based on the highest and lowest altitudes at which in situ Nd is greater than 10 cm−3 and bulk liquid water content (LWC) is greater than 0.05 g m−3within sawtooth profiles. We follow their methodology using observations from cloud probes located on the P-3 aircraft during all three ORACLES deployments. Using the resultant statistical relationships between ZB and ZT, we estimate cloud base from HSRL-2 cloud top heights (CTH). This method and the resulting cloud base height distribution are described in Appendix A.
2.3 Collocation methodology and calculations
2.3.1 Horizontal NCCN autocorrelation
As will be described in more detail in Sect. 3.2, we leverage the vertical resolution of the ML-CCN retrievals to assess the simultaneous impact of both above- and below-cloud NCCN on cloud top microphysical properties by sub-selecting clear-sky profiles that are directly adjacent to profiles that detect a cloud. We assume that NCCN retrieved from the clear profile is approximately equal to NCCN observed below the adjacent cloud. To test the validity of this assumption, we perform an in situ-based autocorrelation analysis to assess the self-consistency of NCCN observed below cloud base heights.
Use of the autocorrelation metric for assessing variability of aerosol properties across various spatial scales has been documented by studies such as Anderson et al. (2003), Heintzenberg et al. (2004), Redemann et al. (2006), Shinozuka and Redemann (2011), Chau et al. (2021), LeBlanc et al. (2022), Perkins et al. (2022), and Franco et al. (2024). Here, we focus on the horizontal variability of NCCN isolated from any effects of vertical variability since we are interested in extrapolating below-cloud NCCN at a constant altitude from the nearest clear-sky profile. Therefore, the in situ data used to calculate autocorrelation come from constant altitude flight paths where observations do not vary more than ±25 m in altitude from the first measurement and where data are collected for at least 30 s. This minimum time criterion is required to eliminate flight segments where the aircraft may have been slowly ascending or descending through an aerosol layer. Constant altitude flights where the aircraft turns and re-samples an area are split into separate segments. To display autocorrelation as a function of horizontal distance, we convert the original temporal increments to distance using an estimated P-3 aircraft speed of 150 m s−1.
Data from all constant altitude flight legs are combined and autocorrelation coefficients are calculated at 10 s lag increments (k) between all data pairs yj and yj+k using Eq. (5):
where r(k) is the autocorrelation coefficient at a given lag, N indicates the number of lagged pairs, y is NCCN, and σ+k represent the mean and standard deviation, respectively, of data points located +k away from another data point, and and σ−k are the corresponding quantities for data points located −k away from another data point (Anderson et al., 2003).
Since we are interested in the self-consistency of NCCN below cloud base, we calculate autocorrelation for constant altitude flight legs flown at altitudes below 1000 m to capture the range of most cloud base heights observed in this analysis (Fig. A1b). We limit in situ NCCN to those with a supersaturation between 0.2 %–0.4 %. This range captures the supersaturation at which most in situ NCCN observations were made and eliminates significant variation due to changes in supersaturation. Autocorrelation results for all three deployments are given in Fig. 1. We find that assuming that NCCN retrieved from a clear-sky lidar profile is approximately equal to NCCN below cloud base for the adjacent cloudy profile is reasonable, considering the horizontal resolution of these HSRL-2 based profiles is 2 km, at which the autocorrelation coefficient is around 0.96. Additionally, we find that NCCN autocorrelation remains close to 0.95, as shown by the dashed line, over a horizontal distance of approximately 5 km.
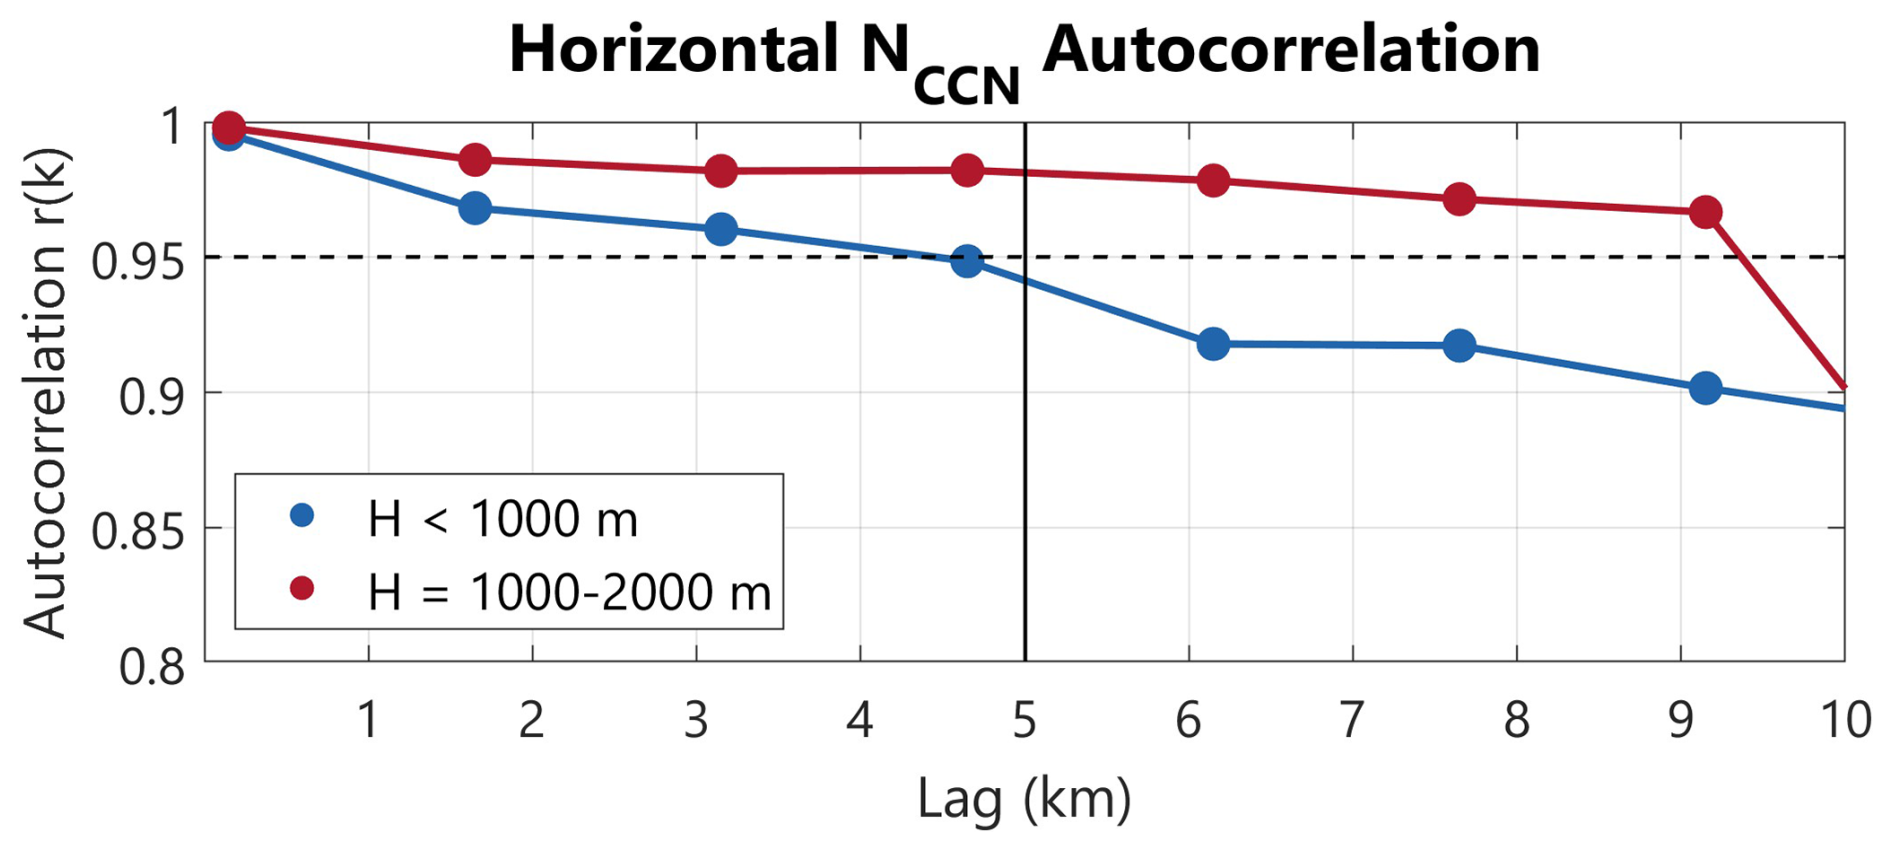
Figure 1The autocorrelation coefficient of in situ NCCN observed in horizontal flight legs is given as a function of lag distance. The dark blue line represents observations from flight legs at altitudes (H)<1000 m, and the red line represents observations from flight legs between H=1000–2000 m. The black dashed line depicts an autocorrelation coefficient of 0.95, and the solid vertical line depicts the 5 km over which we assume that below-cloud NCCN is approximately constant.
We also examine NCCN variability above cloud by calculating autocorrelation for constant altitude flight legs flown at altitudes between 1000–2000 m to capture a broad above-cloud range that does not overlap with most cloud base height altitudes (Fig. A1b). We find that over a horizontal range of 5 km the above-cloud autocorrelation coefficient is slightly higher than for below-cloud observations, with it remaining approximately constant around 0.97. Since autocorrelation patterns are similar for above- and below-cloud NCCN, this suggests that across a horizontal range of 5 km, possible impacts of entrainment of BBA into the BL on below-cloud NCCN homogeneity are reflected in the below-cloud NCCN analysis. That is, we do not see rapid decreases in above-cloud NCCN autocorrelation indicative of entrainment mixing that are not reflected in the below-cloud NCCN autocorrelation trends. Therefore, it appears that the BL was often well-mixed and NCCN did not vary significantly across short distances.
This information will be used when collocating both remote sensing-based data sets by assuming that below-cloud NCCN is constant over 5 km (Sect. 2.3.2) to increase the number of data points in the analysis. However, this assumption comes with a few caveats. First, the constant altitude flight legs below 1000 m include both clear-sky and below-cloud observations. In a separate analysis, we distinguished clear-sky observations from below-cloud observations using changes in downward solar radiation and found that effects of cloud processing result in decreased NCCN autocorrelation in below-cloud observations when compared to clear-sky observations. However, the autocorrelation coefficient remained, on average, above 0.9 at lags between 0 and 5 km (not shown), suggesting reasonable correlation for both below-cloud and clear-sky observations. While not a focus of this study, we plan to expand on these differences between clear-sky and below-cloud NCCN autocorrelation in a future analysis. Additionally, flight segments observed below-cloud assume that the cloud was non-precipitating. Therefore, the precipitation sink of NCCN below-cloud is not accounted for here and we would expect below-cloud NCCN autocorrelation to be lower if it were included. However, LWP in the following analyses is limited to 80 g m−2, and for analyses where we consider below-cloud NCCN it generally falls below 40 g m−2. Therefore, it is unlikely that precipitation is a major below-cloud NCCN sink within 5 km of cloud edge in these cases. These caveats should be considered when interpreting results involving below-cloud NCCN, but we consider the autocorrelation trends in Fig. 1 to be a general approximation of below-cloud NCCN homogeneity across all ORACLES observations and contend that limiting the constant NCCN assumption to 5 km is reasonable and unlikely to introduce significant errors.
2.3.2 Data collocation and case classifications
In this study, we define three main subsets of data, all requiring that the aircraft was flying above 2500 m and that cloud top heights fall below 2000 m to exclude potential mid- or high-level clouds. The collocation process for these subsets is shown in Fig. 2. To assess the simultaneous impact of above- and below-cloud NCCN on cloud top microphysical properties, we define a subset of the data as cloud edge (CE) cases. These cases are found by first identifying clear-sky, cloud-adjacent ML-CCN profiles. That is, we find clear-sky profiles such as profile 1 in Fig. 2 that are adjacent (2 km) to a profile where the HSRL-2 detects a cloud. We average the NCCN retrieved from profile 1 within a 500 m layer below the cloud base height determined by profile 2 and thereby determine below-cloud NCCN. We use a 500 m layer to represent overall BL conditions in the below-cloud region. We find coincident RSP retrievals within 10 s of the profile 2 measurement, and these are also averaged, resulting in a 2 km RSP average corresponding to the 2 km horizontal resolution of the ML-CCN profile. Additionally, we define above-cloud NCCN as an average of the ML-CCN in profile 2 within 100 m of the cloud top, following the vertical spacing criteria used by Gupta et al. (2021). Therefore, the below-cloud NCCN retrieved from profile 1 is then paired with the cloud top RSP average and above-cloud NCCN associated with profile 2. Additionally, since the in situ autocorrelation analysis indicates that within the BL NCCN maintains an autocorrelation coefficient greater than 0.95 over a horizontal range of 5 km, and thus should remain approximately constant, we extend the same below-cloud NCCN value from profile 1 to additional profiles within 5 km. That is, the below-cloud NCCN value from profile 1 is applied to profiles 2–4, and this approach allows us to approximately triple the number of CE cases in the remainder of the analysis. While profiles 2–4 have the same below-cloud NCCN, the above-cloud NCCN is determined independently for each profile using observations made within 100 m of cloud top height.
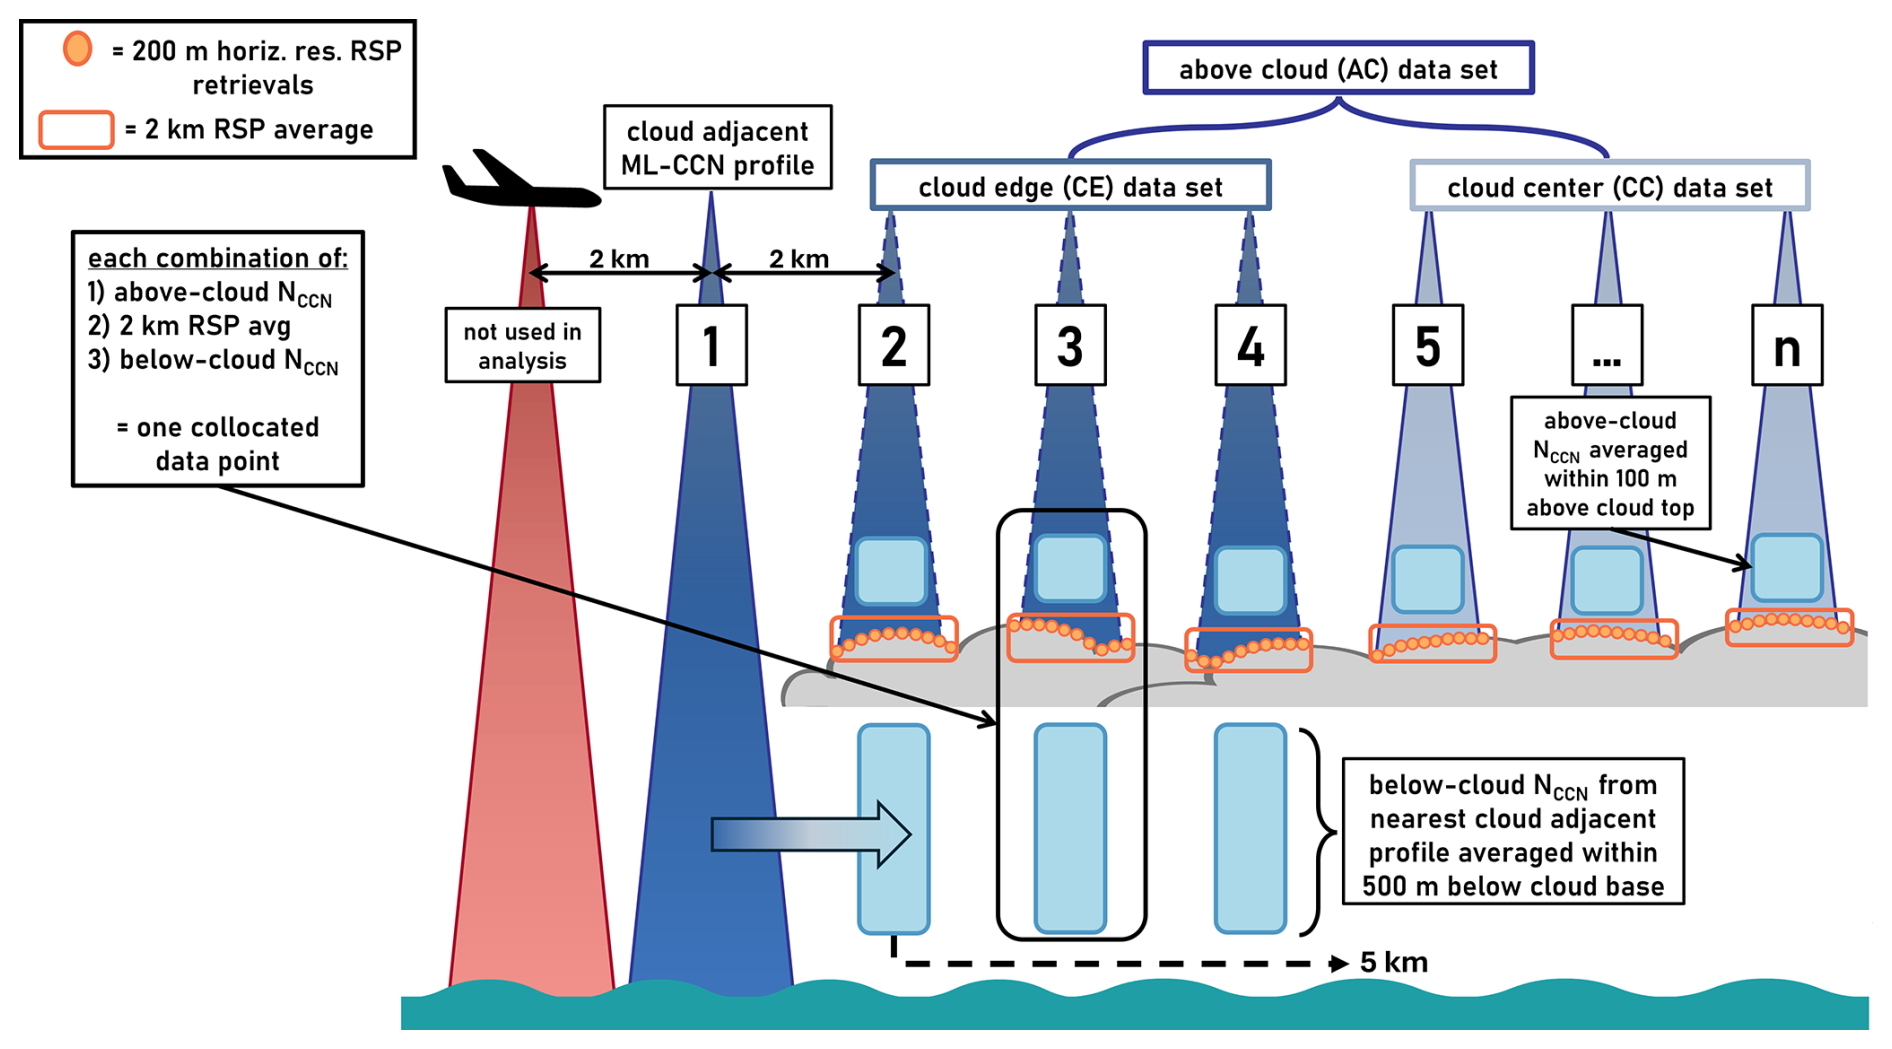
Figure 2Collocation schematic depicting above cloud (AC), cloud edge (CE), and cloud center (CC) cases and the collocation of ML-CCN profiles with RSP retrievals. Profiles 2 through n are included in the AC data set (Sect. 3 and 3.1). Profile 1 is the clear-sky, cloud-adjacent ML-CCN profile used to determine below-cloud NCCN for adjacent cloudy profiles. Profiles 2–4 are cloudy ML-CCN profiles within 5 km of a cloud edge for which above-cloud NCCN is determined from the layer 100 m above cloud top and below-cloud NCCN is extrapolated from profile 1, making up the CE cases (Sect. 3.2). Profiles 5 through n are not within 5 km of a cloud edge and thus are designated as CC cases (Sect 3.3). Profile n represents the variable nature of this collocation process, that is that individual cloud transects have differing numbers of observations that fall within the AC and CC cases. The orange outlined circles represent each 200 m horizontal resolution RSP retrieval, and the orange boxes around them represent 2 km averages to correspond to the 2 km horizontal resolution of the ML-CCN profiles. The red profile represents a ML-CCN profile not adjacent (2 km) to a cloud.
For ML-CCN profiles further than 5 km from cloud edge that are associated with an HSRL-2 detected cloud top and have coincident RSP retrievals within 10 s, we pair 2 km RSP averages with above-cloud NCCN and call these cloud center (CC) cases, which are represented by profiles 5 through n in Fig. 2, representing the variable nature of the number of cases that may fall in this data set depending on the extent of any given cloud transect. Such cases are only used to assess impacts of above-cloud NCCN, as we do not pair any below-cloud NCCN value with profiles further than 5 km from cloud edge. For analyses in Sect. 3.1 where we focus on relationships between cloud top microphysical properties and above-cloud NCCN, the CE and CC cases are combined into a subset called the above cloud (AC) data set. In Sect. 3.2 we compare the impact of above- and below-cloud NCCN, meaning that only data from the CE data set is considered. And in Sect. 3.3 we investigate the dependence of ACI on proximity to cloud edge by comparing above-cloud observations from CE and CC data sets separately.
In summary, for the example given in Fig. 2, the paired above-cloud NCCN and RSP measurements from profiles 2 through n would all be included in the AC data set. The above-cloud NCCN, RSP measurements, and below-cloud NCCN in profiles 2–4 are included in the CE data set. Profiles 5 through n do not fall within 5 km of a cloud edge and therefore are included in the CC data set but not the CE data set. Note that these subsets represent a combination of observations from all cloud transects across all three ORACLES deployments and are not in any way grouped by individual cloud profiles. After applying this collocation methodology to observations from all three ORACLES deployments, the location of all cases is given in Fig. 3. Here we find that CE cases are spatially as well-distributed as AC cases. That is, the locations of both cases are very similar, and while the number of CE cases is smaller, they are not limited to any certain geographic area that is not also represented in the AC data set.
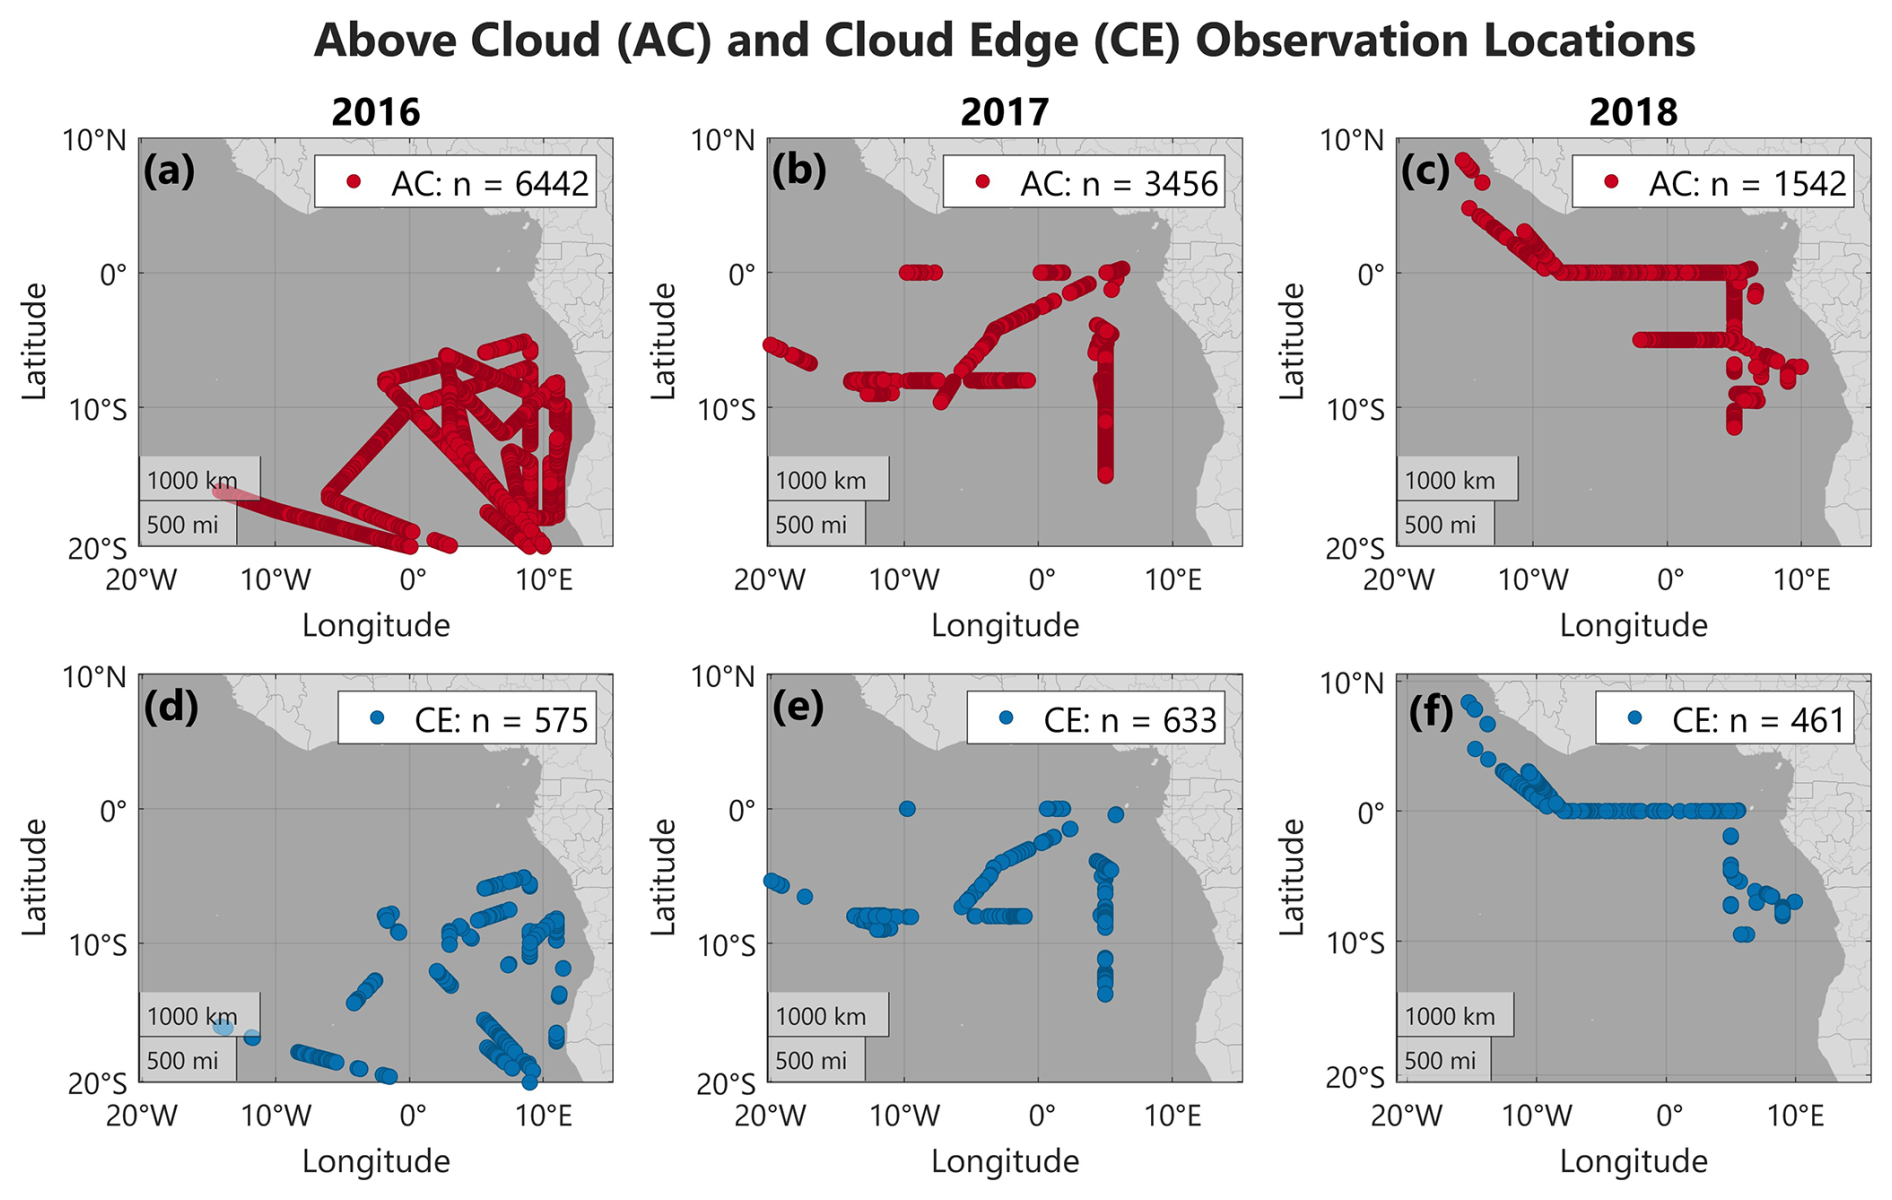
Figure 3Map depicting the location of (a–c) AC and (d–f) CE cases for 2016 (a, d), 2017 (b, e), and 2018 (c–f) deployments. The number of cases is given in the legend.
2.3.3 Lower tropospheric stability calculations
To constrain and assess the impact of environmental stability on ACI, we calculate lower tropospheric stability (LTS) using temperature profiles from Modern-Era Retrospective analysis for Research and Applications, Version 2 (MERRA-2) data that have been interpolated to HSRL-2 spatiotemporal resolution (Global Modeling And Assimilation Office, 2015). LTS is calculated using Eq. (6):
where θ is potential temperature at 800 and 1000 hPa. Though LTS is often calculated using potential temperature at 700 hPa, we use 800 hPa to focus on the BL portion relevant for these low clouds and to avoid the aerosol layer around 700 hPa (Adebiyi and Zuidema, 2016; Ryoo et al., 2021). While several approaches have been used to constrain meteorology in previous ACI studies, LTS is a commonly used metric to constrain the impact of stability on clouds (Matsui et al., 2006; Mauger and Norris, 2007; Gryspeerdt et al., 2014; Zhang et al., 2016; Jia et al., 2019; Murray-Watson and Gryspeerdt, 2022; Zhao et al., 2025).
We start by investigating the relationships between above-cloud NCCN, Reff, Nd, and LWP for AC cases across all three ORACLES deployments (Fig. 4). For this analysis we remove data from any cloudy profiles that had a clear-sky profile on both sides. Such broken cloud regimes are more likely to be impacted by entrainment mixing and evaporation, and here our focus is on determining aerosol effects on cloud properties. This step reduces the AC data set from 11 440 to 11 231 profiles. Additionally, we limit observations to those with LWP ≤ 80 g m−2. This range accounts for most of the ORACLES low cloud observations, limits scatter from a small number of higher LWP values likely formed under different meteorological conditions, and reduces the number of precipitating clouds. This step reduces the AC data set from 11 231 to 9223 profiles.
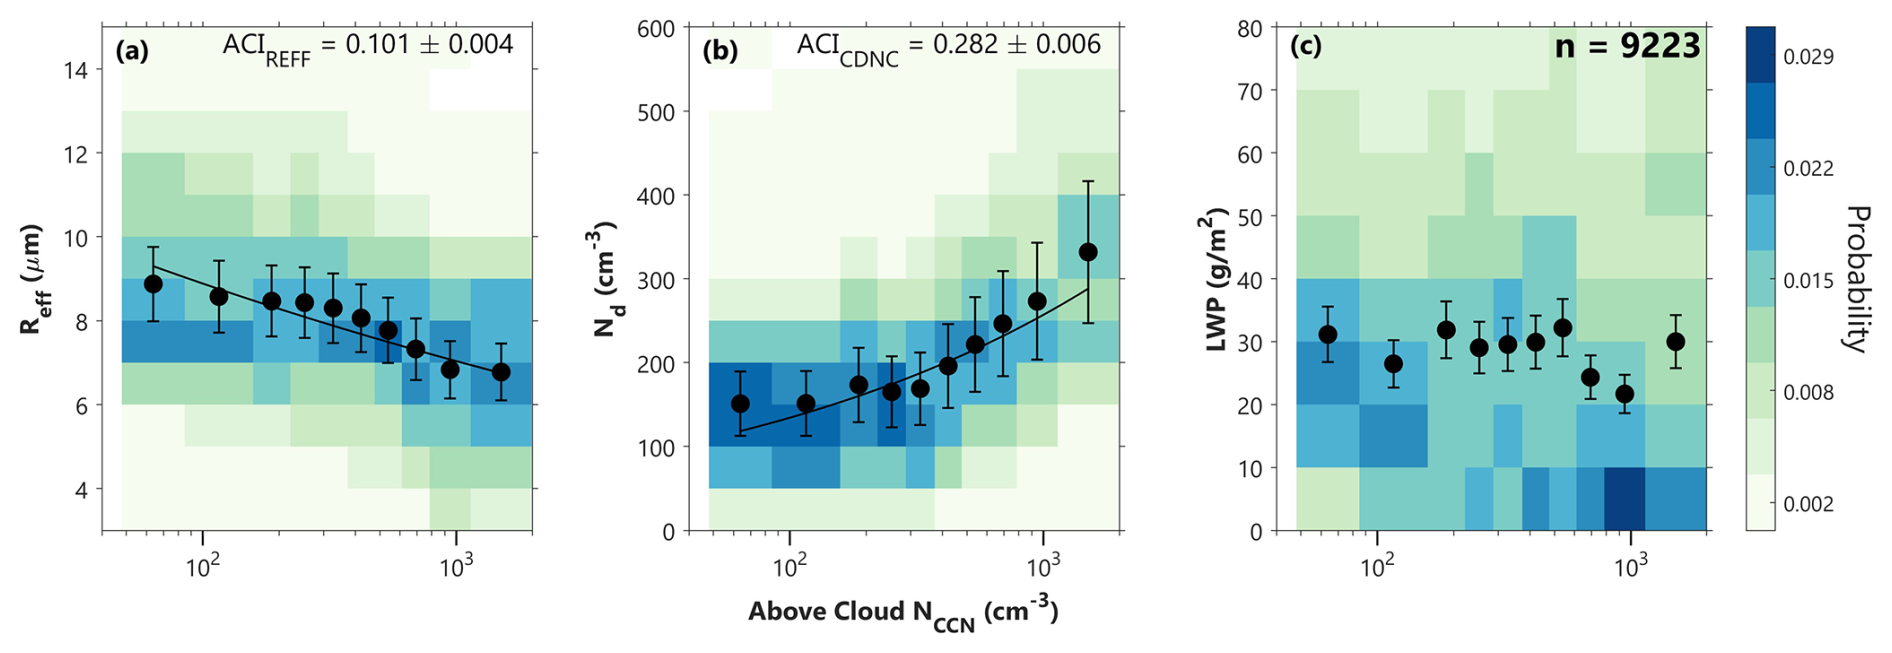
Figure 4Relationship between above-cloud NCCN and (a) Reff, (b), Nd, and (c) LWP across all three ORACLES deployments. Shading in the background represents the probability of where the 9223 individual data points from this AC data set fall within each panel. Data are separated into 10 bins such that each bin contains an equal number of data points. Each scatter point represents the median cloud property within each individual NCCN bin. The error bars represent the median uncertainty of the respective cloud property within that bin. ACI metrics and their SE (±) are given for Reff and Nd. The fit lines correspond to the slope determined by each ACI metric.
For Fig. 4 and those like it in the remainder of Sect. 3, shading on the figures show probability distributions of where individual data points fall, while the scatter points represent the median of each cloud property within ten NCCN bins determined such that each bin contains an equal number of data points. The error bars give the median uncertainty of each cloud property within that bin. We calculate ACI metrics to quantify the Reff (ACIREFF) and Nd (ACICDNC) response to increasing NCCN following the method described in McComiskey et al. (2009), given in Eqs. (7) and (8):
Here, Eq. (7) describes the fractional change in cloud top Reff in response to fractional changes in NCCN at a constant LWP and Eq. (8) captures the fractional change in cloud droplet Nd when there is a fractional change in NCCN. Such ACI metrics describe cloud microphysical responses to aerosol perturbations and are critical components in cloud radiative forcing calculations (McComiskey et al., 2009; Ghan et al., 2016). ACIREFF and ACICDNC correspond to the slope of linear regressions calculated for log-transformed Reff, Nd, and NCCN, and here these regressions are calculated for all data points (not the bin averages). The ACIREFF calculation is done within 20 g m−2 LWP bins, and the final value is a sample size-weighted average of the individual values calculated for each small LWP range. The error associated with these metrics are calculated as the standard error (SE) of the slopes via Eq. (9):
where x represents log(NCCN) and y represents the logarithm of each respective cloud property. These linear regressions calculated for log-transformed data are also used to plot the corresponding fit lines for Reff and Nd relationships by transforming the fit equation back into linear space. These fit lines correspond to the full set of data represented by the probability distributions, not the individual bin averages.
From the combination of data from all three ORACLES deployments, we see clear signals of an above-cloud aerosol influence on the underlying cloud top microphysical properties. As NCCN within the 100 m layer above cloud top increases, there is a decreasing trend in Reff (Fig. 4a) and an increasing trend in Nd (Fig. 4b). ACIREFF is 0.101 and ACICDNC is 0.282, where the former falls within the 0.04–0.17 range observed for continental stratus clouds by Kim et al. (2008) and the latter falls towards the lower end of the 0.18–0.69 range given for stratocumulus clouds by McComiskey et al. (2009). While LWP is limited to 0–80 g m−2, we still see some fluctuations in the LWP with changes in NCCN (Fig. 4c), which is an inherent constraint when using observed data. This analysis also allows us to characterize the average properties of low-level stratocumulus clouds in the SEA, as we see that most clouds have Reff values between approximately 6–10 µm, Nd values between 50–400 cm−3, and an LWP between 10–40 g m−2.
3.1 ACI sensitivity to environmental stability
In this study, we use a k-means clustering approach (Anderberg, 1973) to separate observations of aerosol and cloud properties into different regimes, as has been done in previous studies (Gryspeerdt and Stier, 2012; Gryspeerdt et al., 2014; Di Bernadino et al., 2022). This methodology was tested with several combinations of variables including HSRL-2 CTH, RSP-retrieved COT, Reff, Nd, LWP, and MERRA-2 calculated LTS and EIS. All variables were range-standardized before clustering (Milligan and Cooper, 1988), and standard Euclidean distance metrics are used. Various combinations of these variables were compared using Calinski-Harabasz criterion values to determine which combination resulted in the highest between-cluster variance to within-cluster variance ratio (Calinski and Harabasz, 1974). We determined the final number of clusters by maximizing climatological and geographic distinctions among clusters while preserving adequate sample sizes within each to perform statistically meaningful ACI analyses. These testing steps showed that the clusters determined using only LTS had the highest Calinski-Harabasz criterion values, and we determined that using four clusters resulted in adequate sample sizes between clusters for further analysis.
Previous studies have determined that atmospheric stability is often correlated with stratiform cloud amount (Klein and Hartmann, 1993), and LTS specifically has been used to differentiate between low cloud types in subsidence regimes, such as the SEA (Zhang et al., 2016). Additionally, Painemal et al. (2014) found stability to be a strong control on cloud microphysical properties over the SEA, where Reff and LWP both decrease with LTS for observations north of 5° S, a pattern that is not observed south of 5° S where LTS values are higher. Over the Eastern China Ocean, Zhao et al. (2025) recently found that in high LTS environments, weak entrainment was observed, thus suppressing the negative effects of entrainment observed in environments with low to moderate LTS. While EIS has been suggested to be a better, regime independent predictor of stratus cloud amount than LTS (Wood and Bretherton, 2006), our analysis indicated that using LTS for k-means clustering resulted in higher Calinski-Harabasz criterion values. This could be due to increased uncertainty in the MERRA-2 relative humidity profiles used in the EIS calculation.
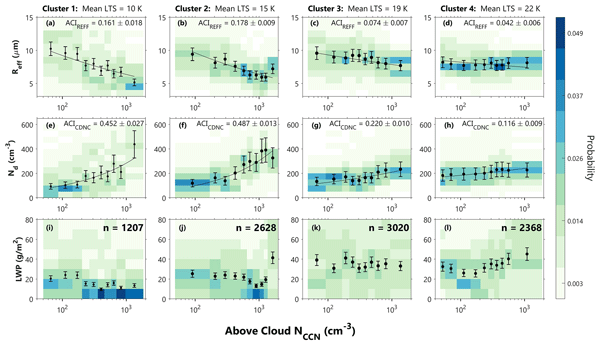
This k-means clustering analysis is applied to the same AC data set as shown in Fig. 4, with results in Fig. 5 given as a function of LTS. Mean LTS ranges from 10 K in cluster 1 to 22 K in cluster 4. As LTS increases, cloud sensitivity to increasing above-cloud NCCN generally decreases, seen as the fit lines become more flat, though ACI metrics increase slightly from cluster 1 to cluster 2 before proceeding to decrease for clusters 3 and 4. This suggests that less stable environments experience increased entrainment mixing, where smoke aerosols located above cloud top are entrained into the cloud and nucleate as cloud droplets. LWP decreases slightly with increasing above-cloud NCCN for lowest LTS (cluster 1) and increases with increasing above-cloud NCCN for highest LTS (cluster 4), while clusters 2 and 3 show mostly constant LWP with an increase for the highest NCCN bin in cluster 2. Most observations in cluster 1 are in the northwestern part of the ORACLES region, and observations in cluster 4 are in the southeastern part of the region, closer to the coast (Fig. 6). This corresponds well with average sea surface temperatures (SST) in the SEA, where values generally decrease from northwest to southeast (Ryoo et al., 2021).
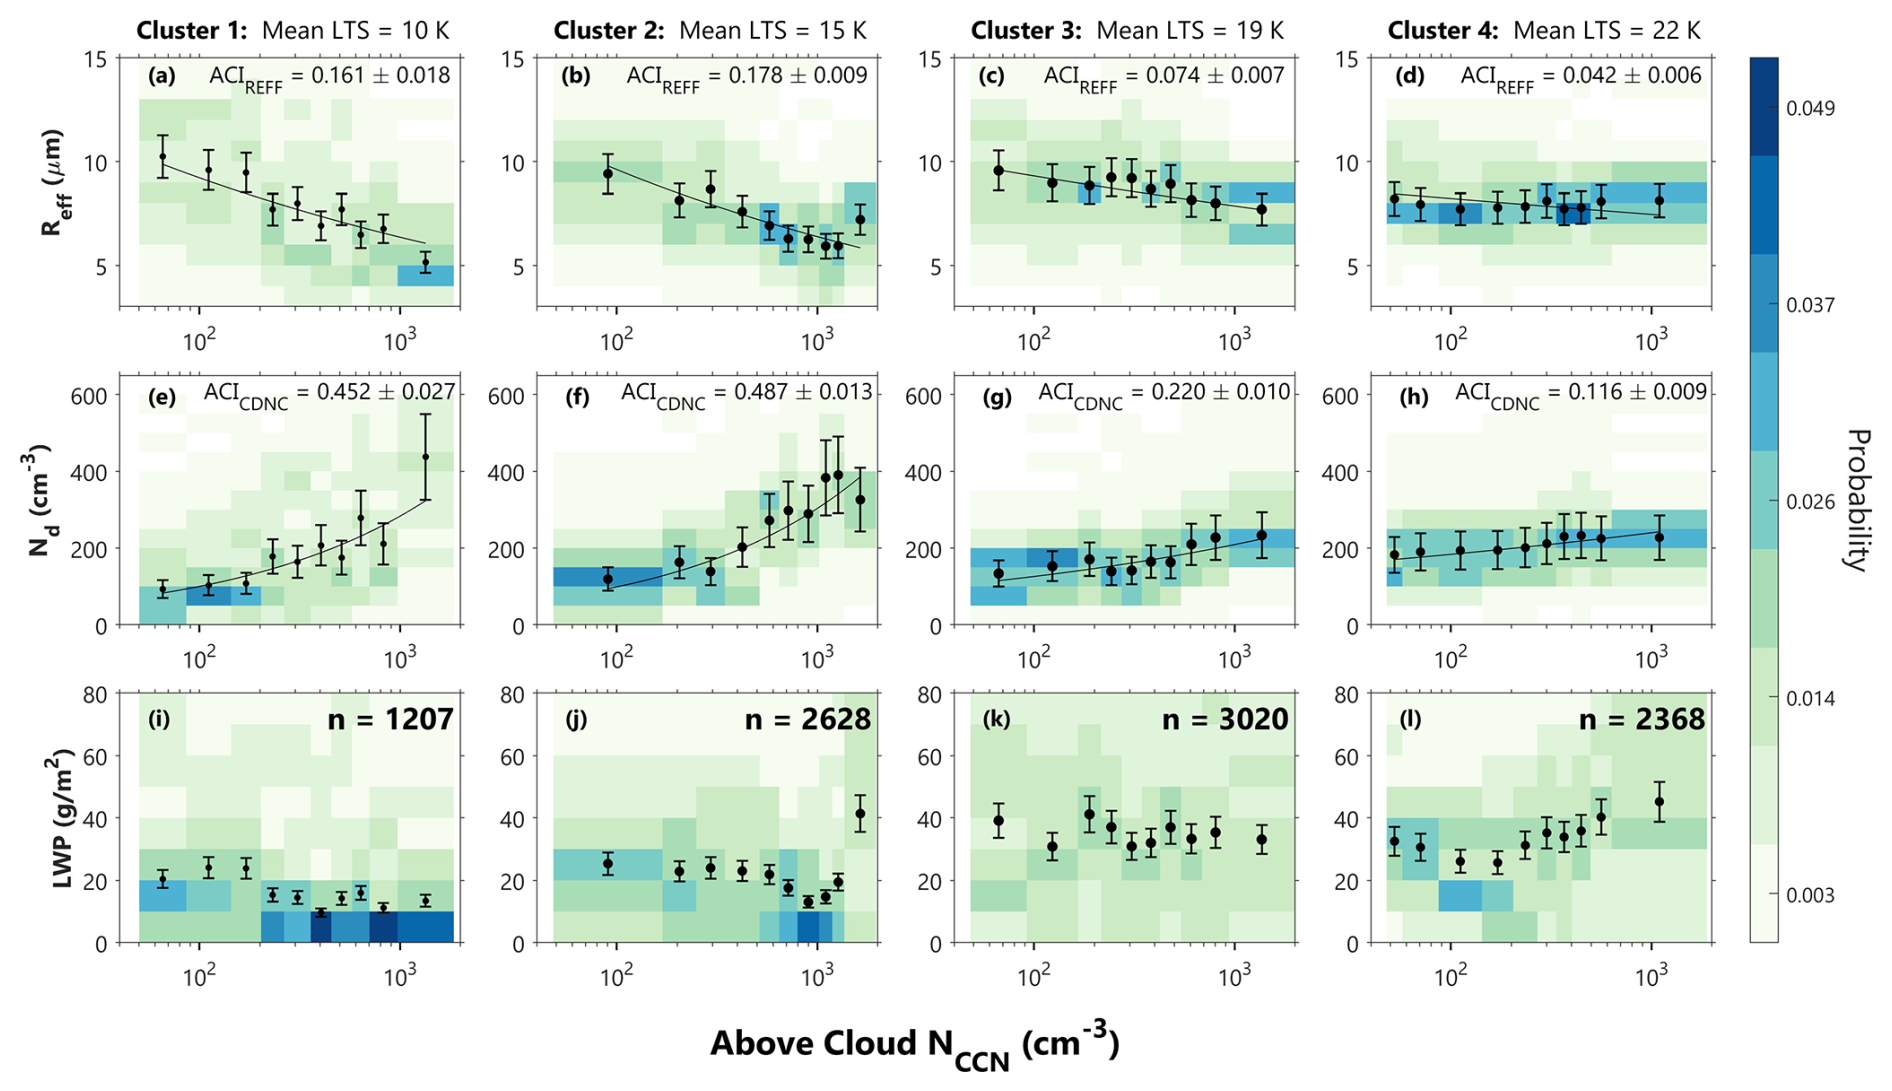
Figure 5Relationship between above-cloud NCCN and (a–d) Reff, (e–h) Nd, and (i–l) LWP across LTS clusters determined using k-means clustering. The shading, scatter points, ACI metrics, and fit lines are calculated and displayed in the same way as Fig. 4.
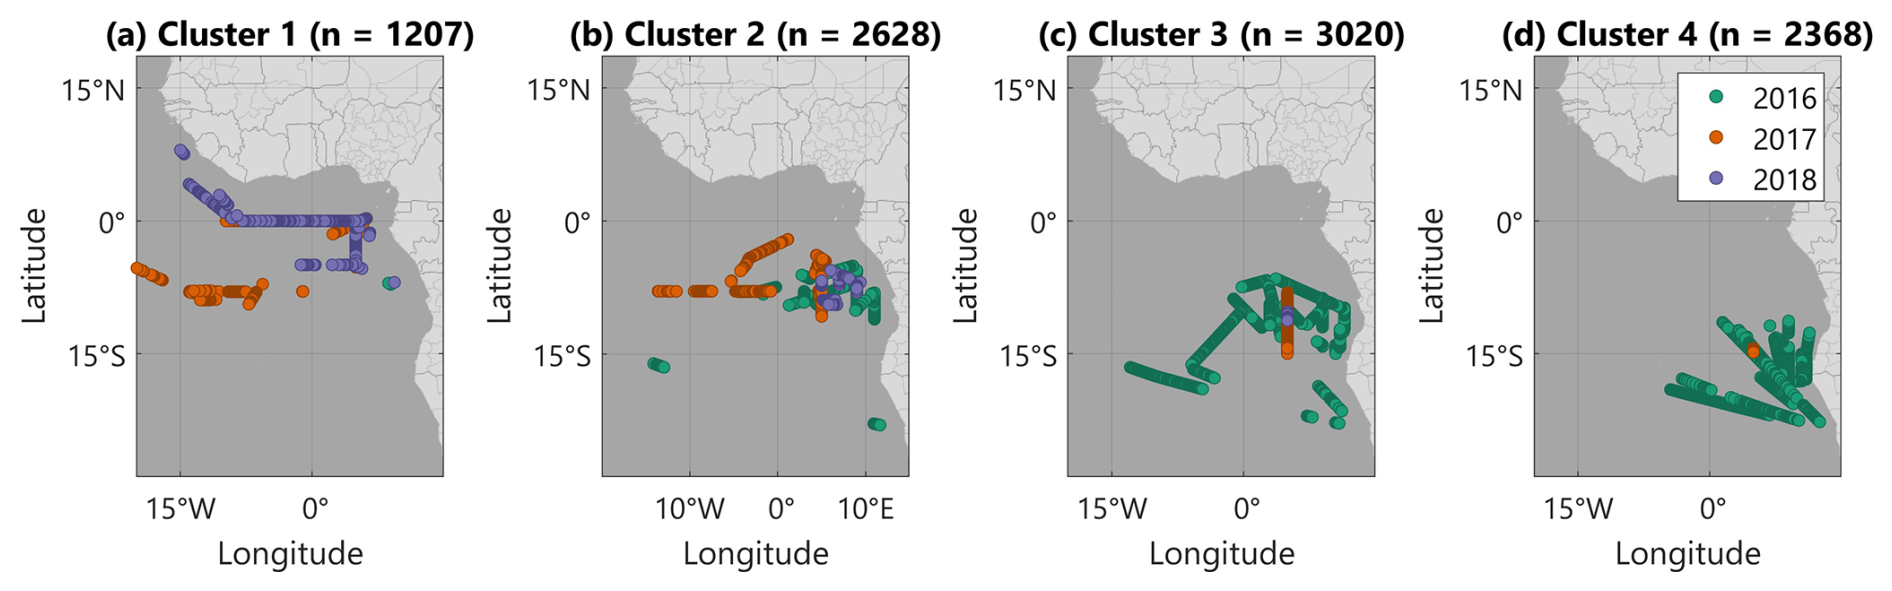
Figure 6Map showing location of observations in (a) cluster 1, (b) cluster 2, (c) cluster 3, and (d) cluster 4. Average LTS in each cluster increases from left to right. The color of each point corresponds to the deployment year of the observation.
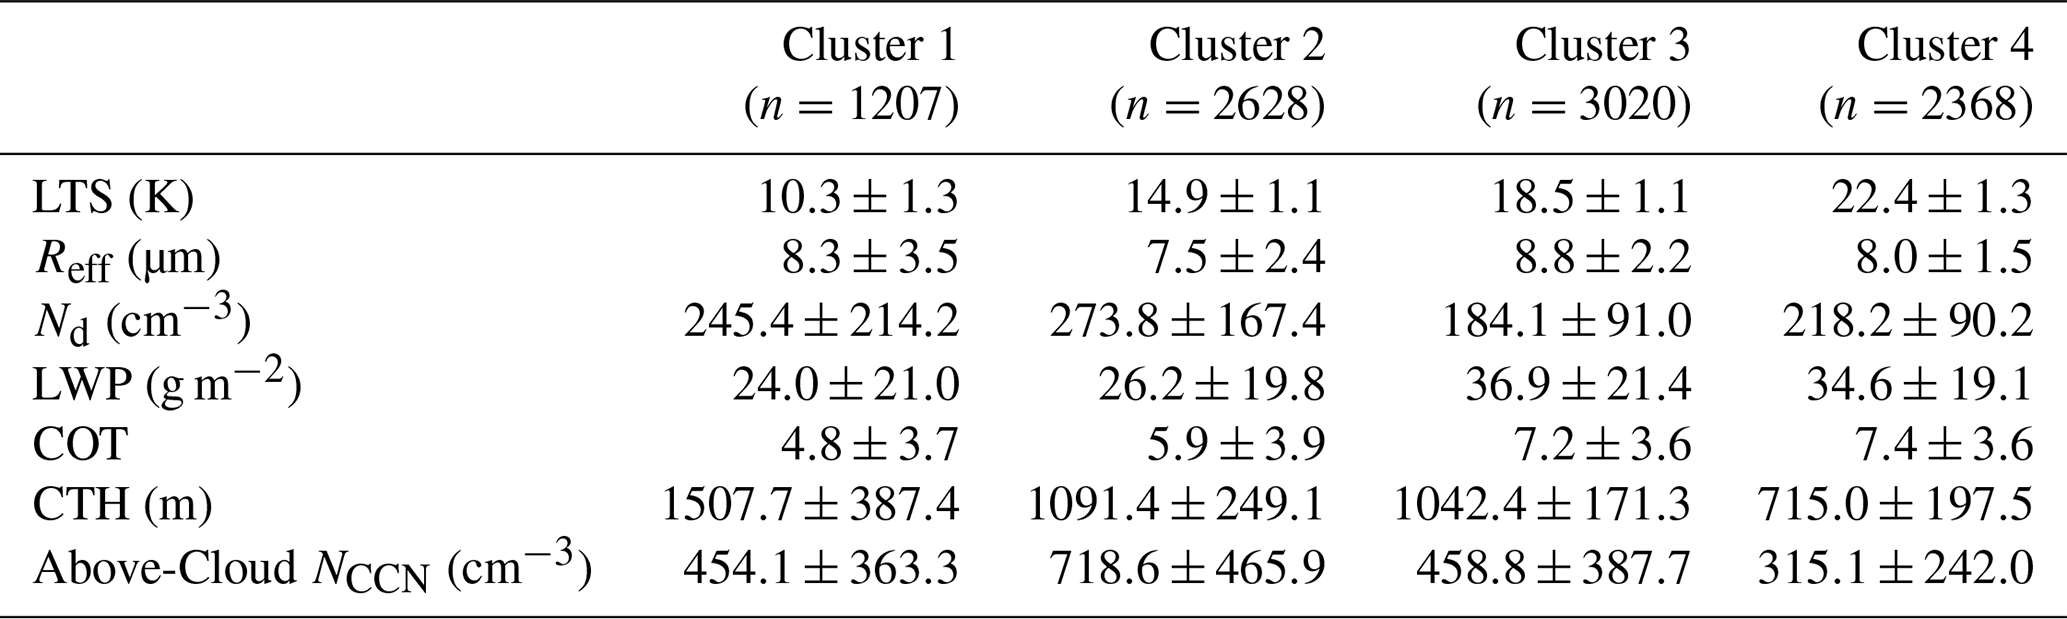
Lastly, we show mean values of cloud properties and above-cloud NCCN within each cluster in Table 2. As LTS increases from cluster 1 to 4, average CTH decreases, indicating that a more stable BL is associated with stronger inversions that restrict cloud vertical development (Costantino and Bréon, 2013). Additionally, cluster 2, where the most dense part of the smoke plume was often observed in 2017, has the highest average Nd, smallest average Reff, and highest average above-cloud NCCN, consistent with in situ analyses (Gupta et al., 2022a). Cluster 3 has the lowest average Nd, highest average Reff, and highest average LWP, with values similar to cluster 4. Variability in above-cloud NCCN is high for each cluster, and findings from Lenhardt et al. (2023) suggest that CCN observed across all three campaigns represent a wide range of smoke ages and a small range of aerosol sizes.
Table 2Mean ± standard deviation of cloud and aerosol properties within each cluster.
3.2 ACI sensitivity to above- and below-cloud NCCN
Next, we use the CE data set to investigate the relationships between above- and below-cloud NCCN and Reff, Nd, and LWP. Here, we again remove cases of cloudy profiles that had a clear profile on both sides to avoid conflating the aerosol effect with effects due to lateral entrainment of ambient air into the cloud layer. This step reduces the CE data set from 1669 to 1269 profiles. Additionally, limiting observations to those with LWP ≤ 80 g m−2 reduces the CE data set from 1269 to 1249 profiles. Limiting cases to those observed at cloud edge inherently constrains cloud properties, which will be further discussed in Sect. 3.3.
The above-cloud relationships at cloud edge are similar to what was seen from the full AC data set in Figs. 4 and 5. In comparison, the below-cloud NCCN analyses show a weaker relationship to the cloud top microphysical properties, with ACI metrics that are smaller in magnitude compared to the above-cloud metrics. The range of average NCCN in the 500 m below-cloud is of similar magnitude as NCCN in 100 m above cloud, with fewer clean cases below-cloud than above-cloud, which is likely evidence of entrainment mixing of BBA from the smoke plume into the BL. Additionally, one major difference from Figs. 4 and 5 is that the range of observed LWP values is much smaller at cloud edge. This will be discussed further in the next section, but a lower LWP does not seem to prohibit observations of above-cloud ACI at cloud edge using this methodology.
We also assess the impact of BL aerosol loading on above-cloud ACI relationships by separating the analysis into two cases. Gupta et al. (2021) found that sensitivity to above-cloud aerosol existed regardless of the BL aerosol loading conditions using an aerosol concentration threshold of 350 cm−3. Therefore, in Fig. 8 we show the data from panels (a), (c), and (e) of Fig. 7 separated into two cases based on each point's corresponding below-cloud NCCN. Here we are again able to corroborate the results of Gupta et al. (2021). We find that regardless of BL aerosol loading, relationships between above-cloud NCCN and cloud properties are evident. However, we also see that above-cloud ACIREFF and ACICDNC are slightly higher when the below-cloud region is relatively clean. When the below-cloud region is more polluted, above-cloud ACIREFF and ACICDNC are slightly decreased. This dampening of the above-cloud impact for polluted below-cloud regions suggests an impact of below-cloud NCCN on cloud top microphysical properties that is lower in magnitude than the above-cloud NCCN impact but non-zero. Additionally, an investigation of the relationship between above- and below-cloud NCCN did not show significant correlation between the two, and we do not hypothesize that the observed correlation between above-cloud NCCN and cloud properties is highly biased by a co-variability with below-cloud NCCN.
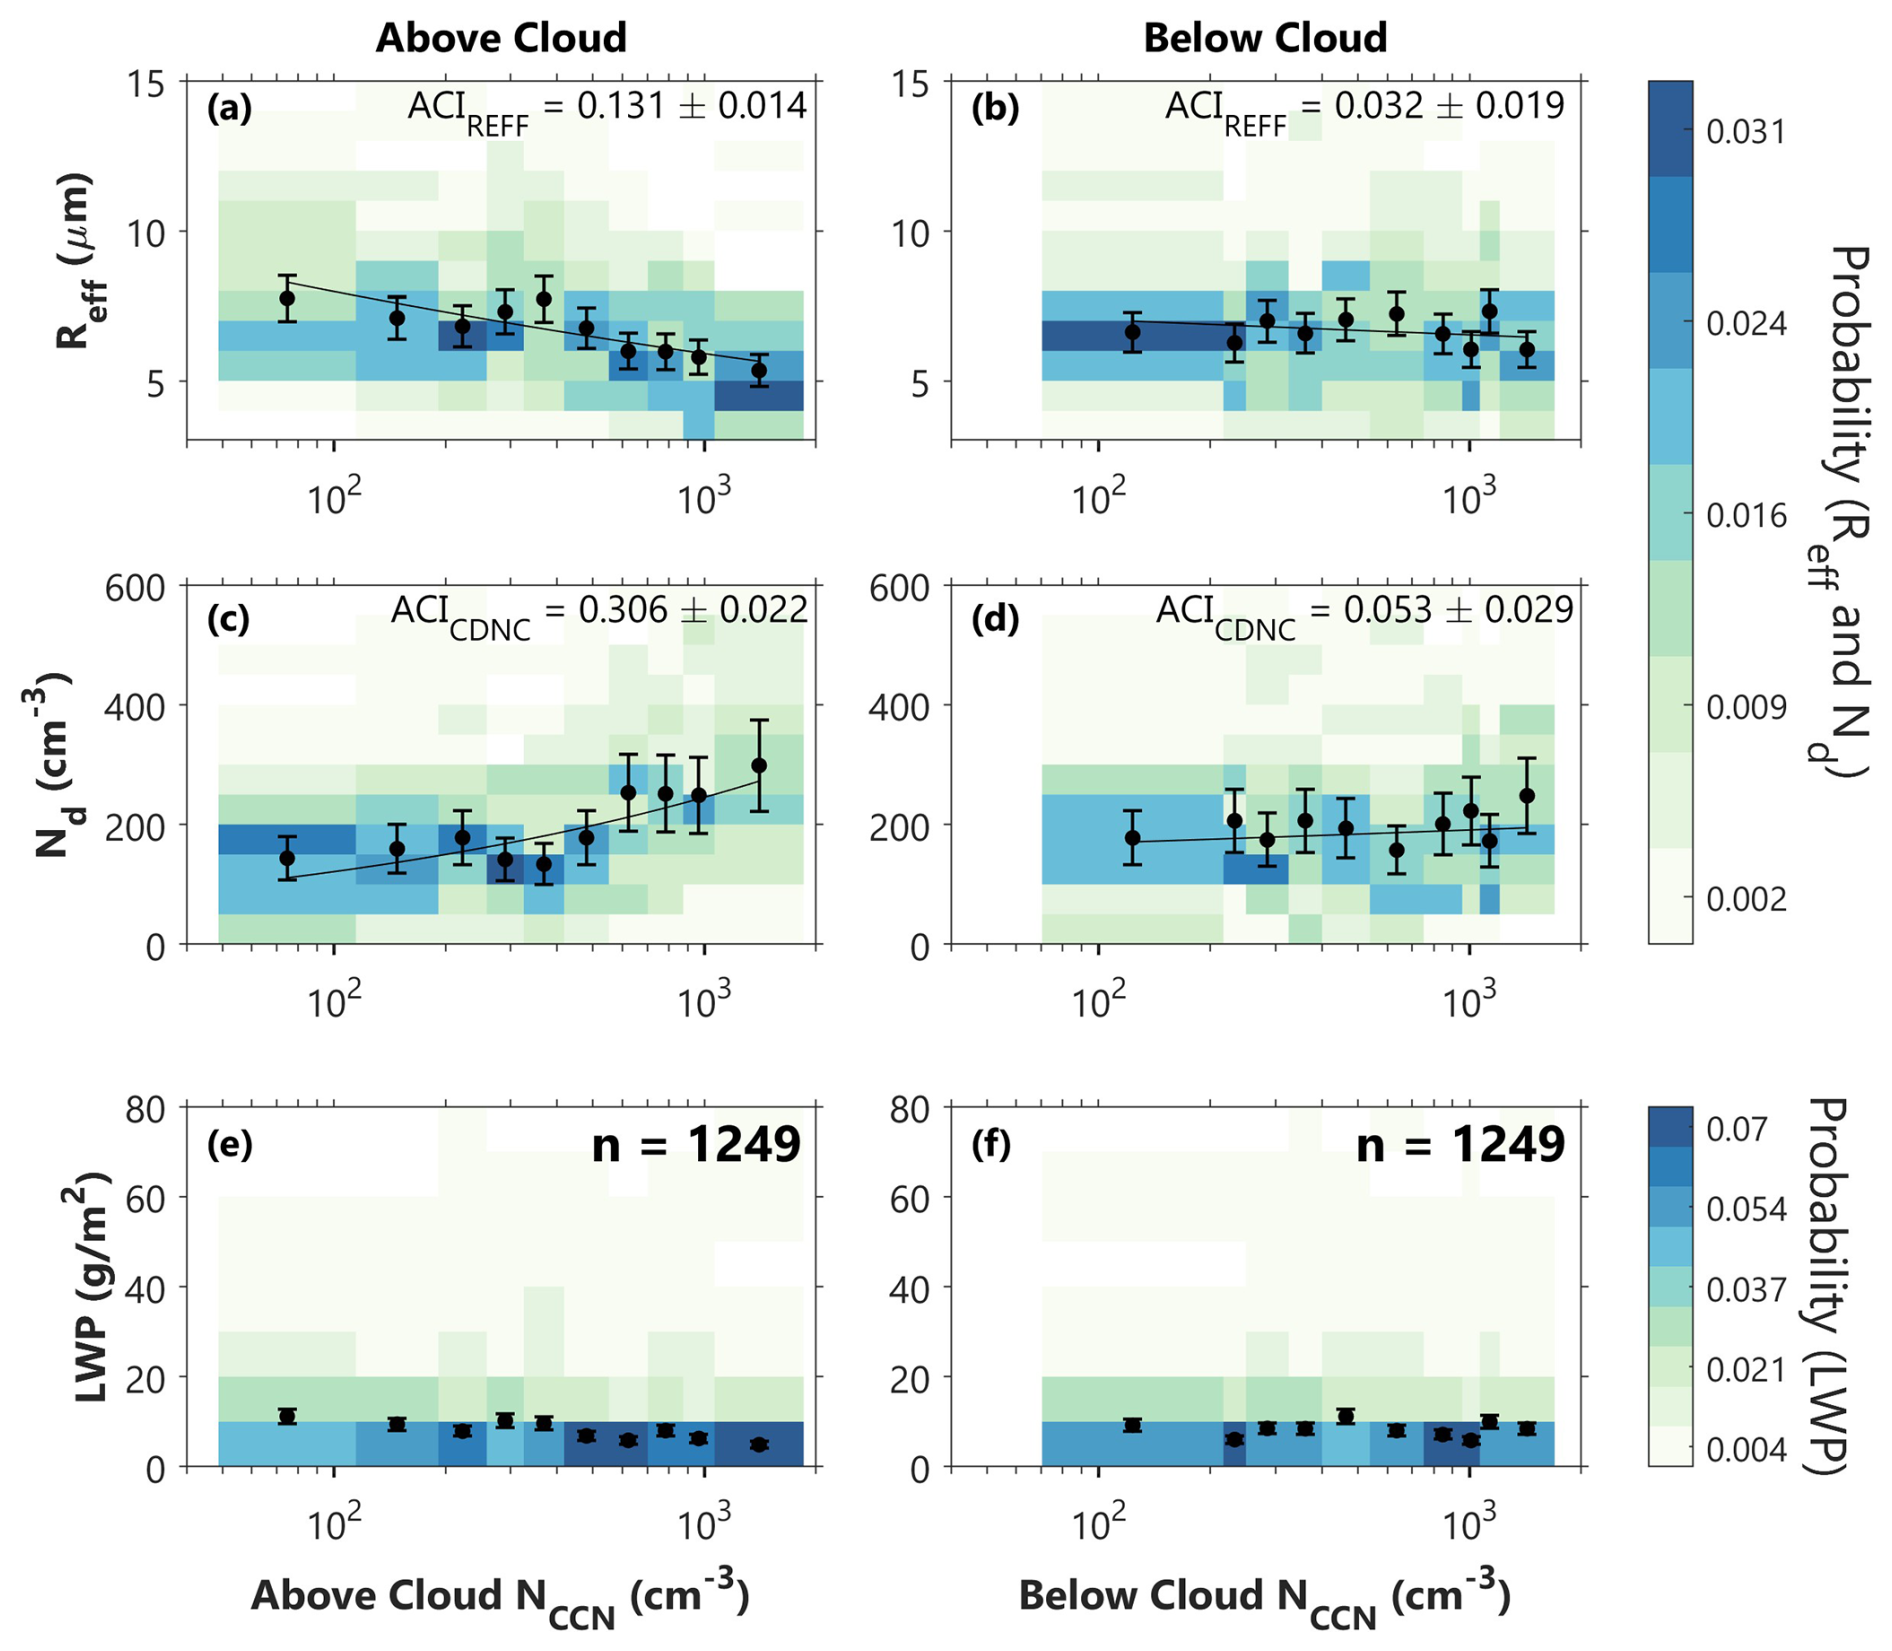
Figure 7Results of from CE data set (n=1249) show the relationship between (a, c, e) above- and (b, d, f) below-cloud NCCN and (a–b) Reff, (c–d) Nd, and (e–f) LWP. The shading, scatter points, ACI metrics, and fit lines are calculated and displayed in the same way as Fig. 4.
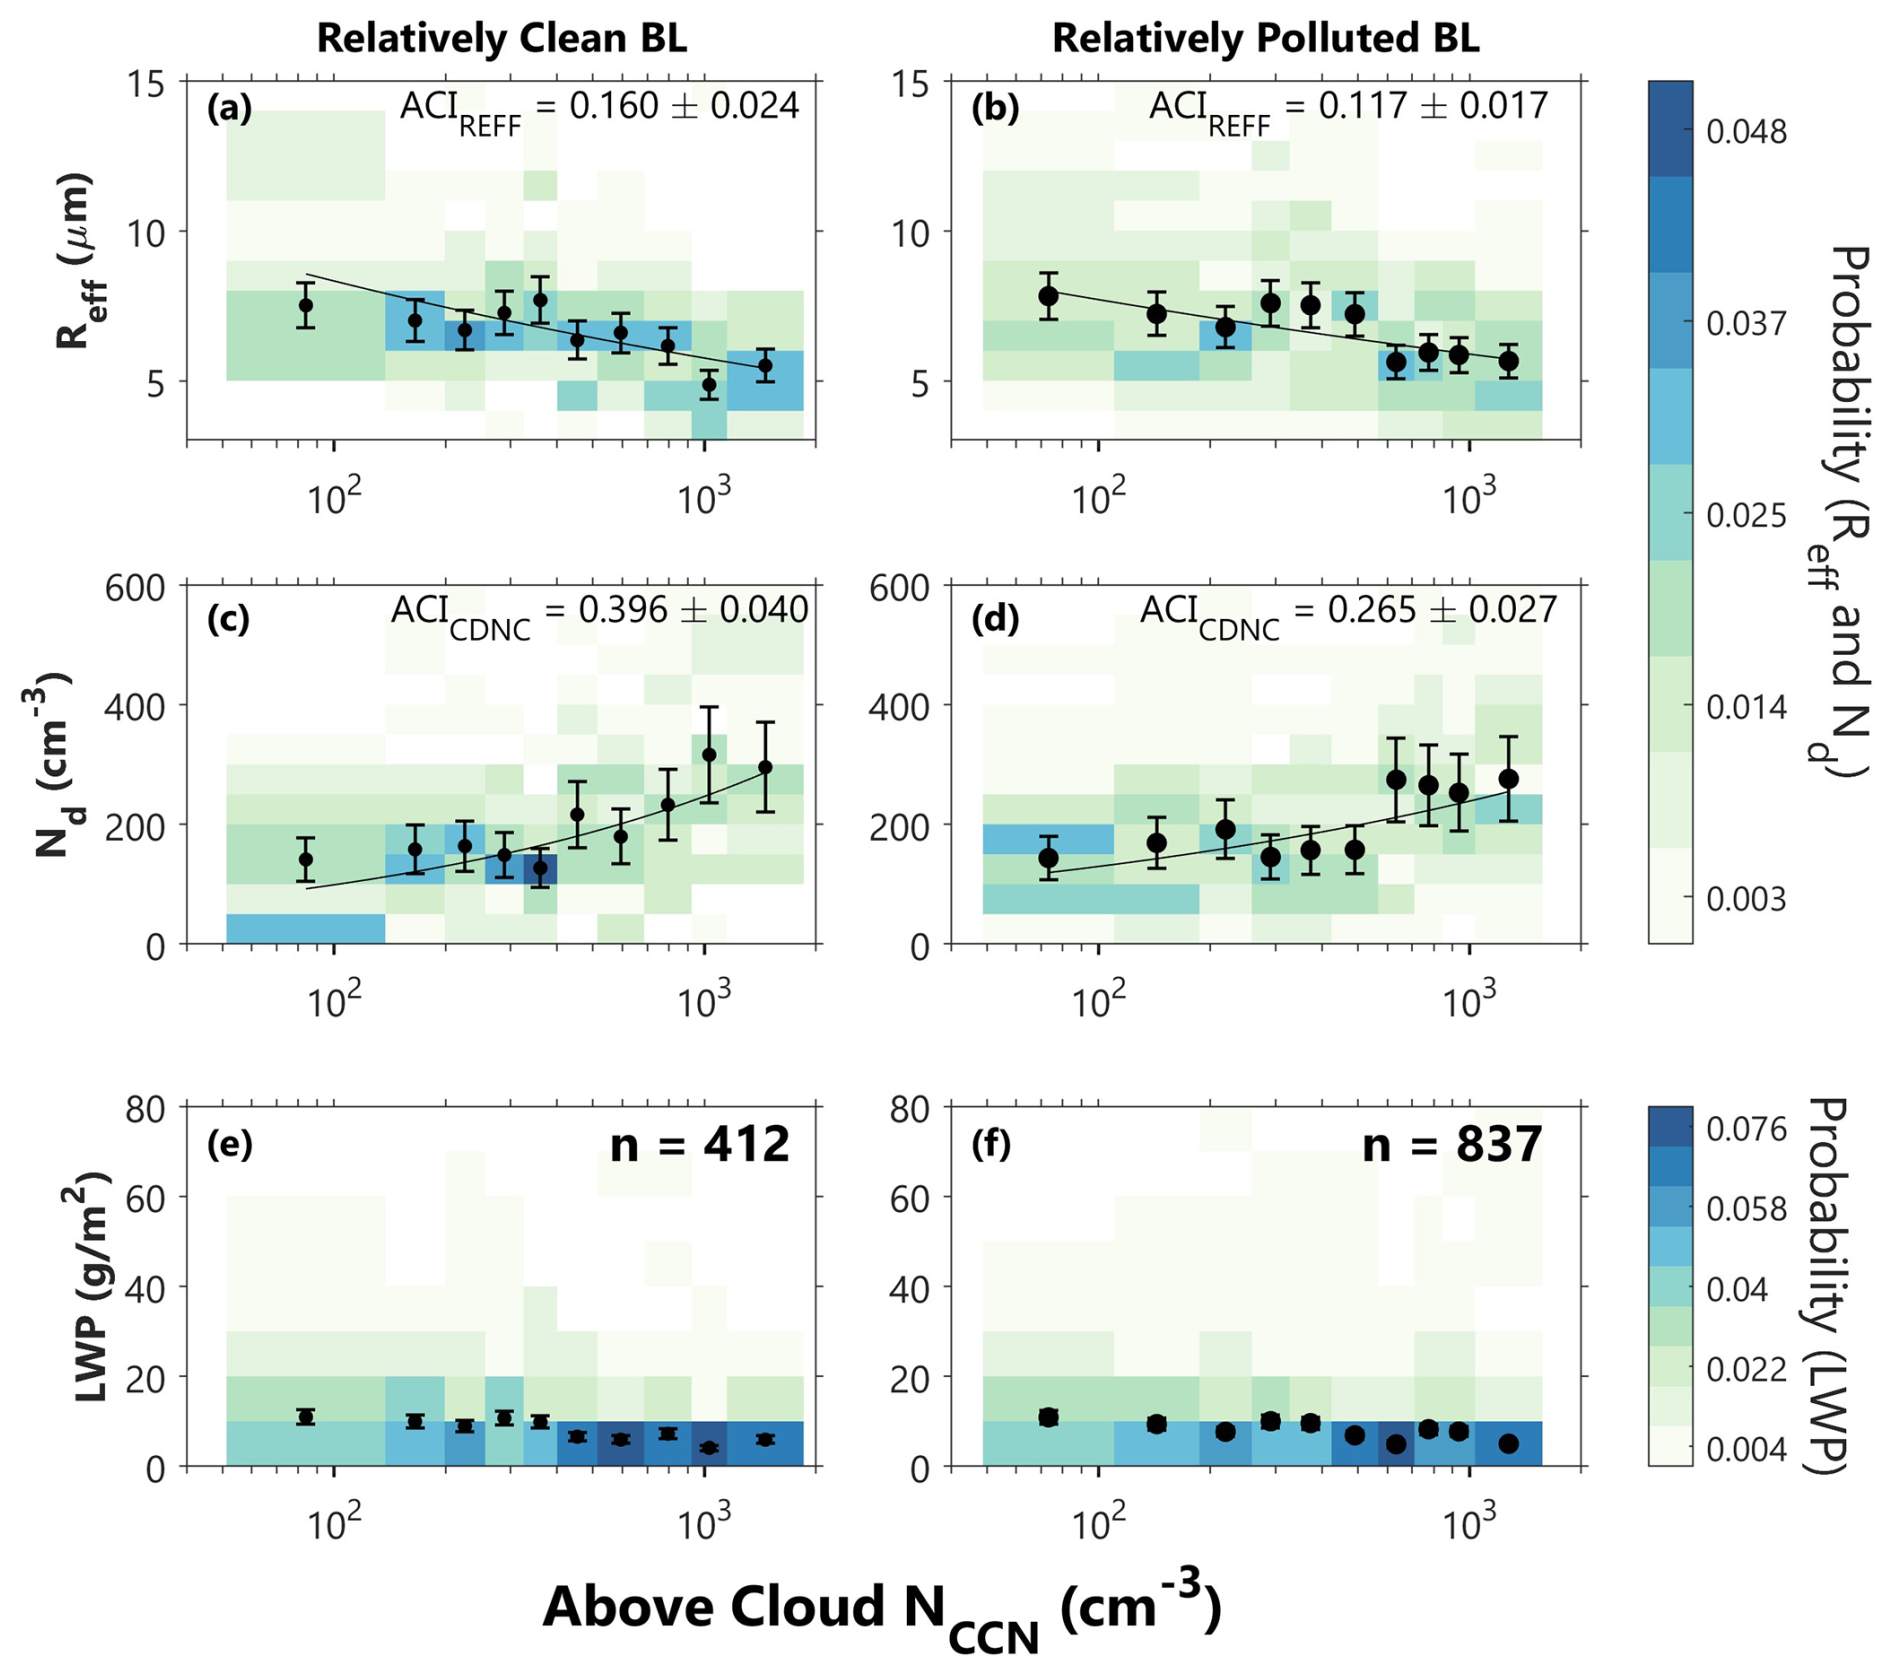
Figure 8Results of from CE data set (n=1249) show the relationship between above-cloud NCCN and (a–b) Reff, (c–d) Nd, and (e–f) LWP for cases with a relatively clean BL (below-cloud NCCN≤350 cm−3) and a relatively polluted BL (below-cloud NCCN>350 cm−3). The shading, scatter points, ACI metrics, and fit lines are calculated and displayed in the same way as Fig. 4.
Lastly, we investigate the LTS dependence of the below-cloud NCCN relationship to cloud top microphysical properties using a similar approach as in Fig. 5. Data from the CE data set are assigned to the existing clusters determined using the AC data set so that both analyses are directly comparable. These results are shown in Fig. 9, where we observe from the fit lines and ACI metrics a trend inverse of that observed for the above-cloud NCCN. That is, as LTS increases, the sensitivity of cloud properties to increasing below-cloud NCCN increases. This suggests that in less stable environments, entrainment mixing of above-cloud BBA into the cloud layer is the dominant process responsible for the microphysical changes to stratocumulus cloud properties. However, in more stable environments, where vertical mixing is suppressed and low-level cloud cover increases, the lack of such entrainment mixing results in a stronger response of cloud properties to increasing below-cloud NCCN. Another important finding from this analysis is that most observations in the CE data set fall into the first two clusters characterized by relatively low LTS. Therefore, when considering the total impact of below-cloud NCCN across all clusters, as done in Fig. 7, low LTS cases dominate the analysis, explaining why the relationship between cloud properties and below-cloud NCCN appears to be weak and nearly negligible.
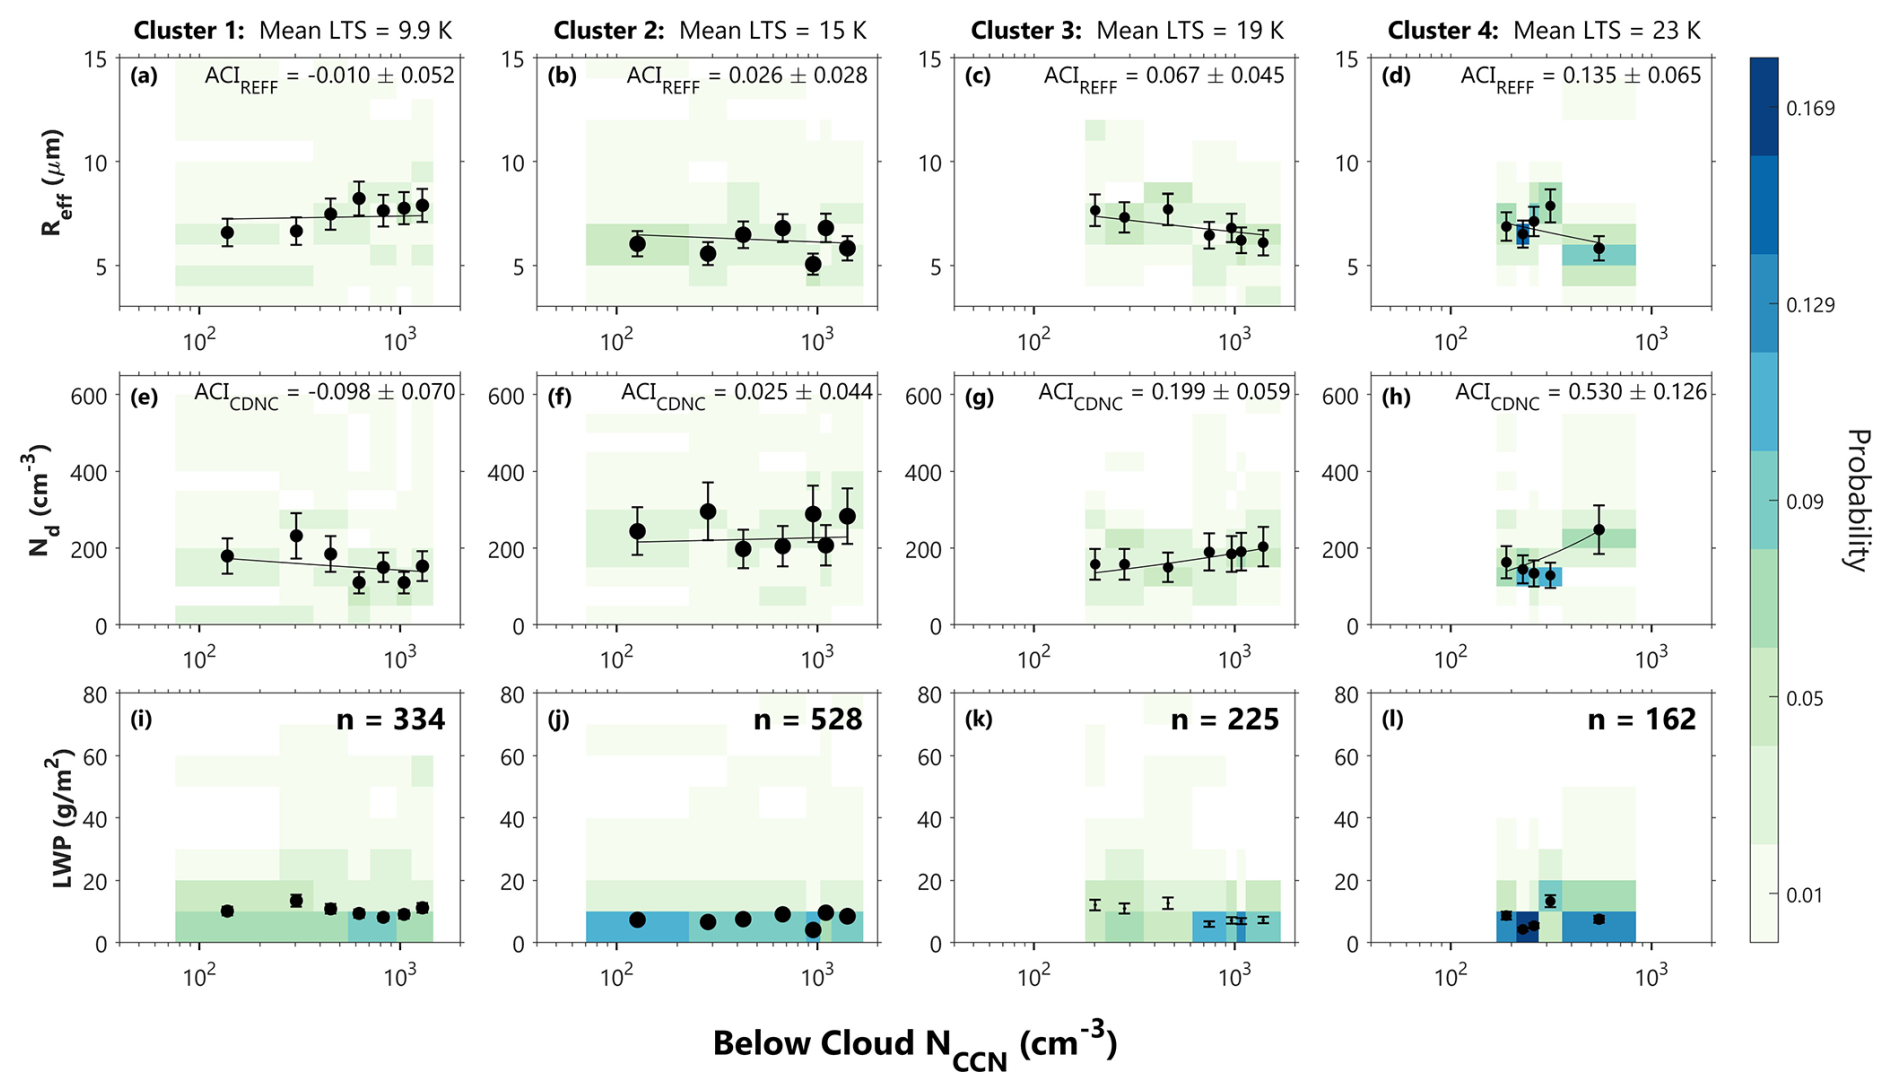
Figure 9Below-cloud observations from Fig. 7 are assigned to clusters determined in Fig. 5. Results of this clustering show the relationship between below-cloud NCCN and (a–d) Reff, (e–h) Nd, and (i–l) LWP. Average LTS in each cluster increases from left to right. The shading, scatter points, ACI metrics, and fit lines are calculated and displayed in the same way as Fig. 4.
3.3 ACI sensitivity to proximity to cloud edge
Lastly, we investigate ACI sensitivity to proximity to cloud edge. In the previous two sections we investigated the entire AC data set, which includes observations made anywhere there is a cloud, and the CE data set, which is limited to observations made when a cloudy profile is directly adjacent to a clear profile. Additionally, we have seen that observations in the CE data set are characterized by a lower mean LWP (Figs. 7 and 8) compared to those in the AC data set (Figs. 4 and 5). Here we investigate the differences between cloud edge and cloud center observations, so we no longer exclude cases where a cloudy profile has clear profiles on both sides. Rather, we include them to retain all cloud edge observations in the analysis. The following analyses are still limited to observations made at LWP ≤ 80 g m−2.
First, we examine differences in LWP and COT between the full AC data set and the CE data set (Fig. 10). This figure reiterates the differences in LWP for observations made at cloud edge, as also seen in Figs. 7 and 8. Cloud edge observations have a median LWP of 7.3 g m−2 while the entire AC data set has a median LWP of 28 g m−2. We see similar differences in COT, where the median COT at cloud edge is 2.0 compared to a median value of 6.1 for the full AC data set. Observations made for the full AC data set also have a much broader distribution in both LWP and COT than those made at cloud edge.
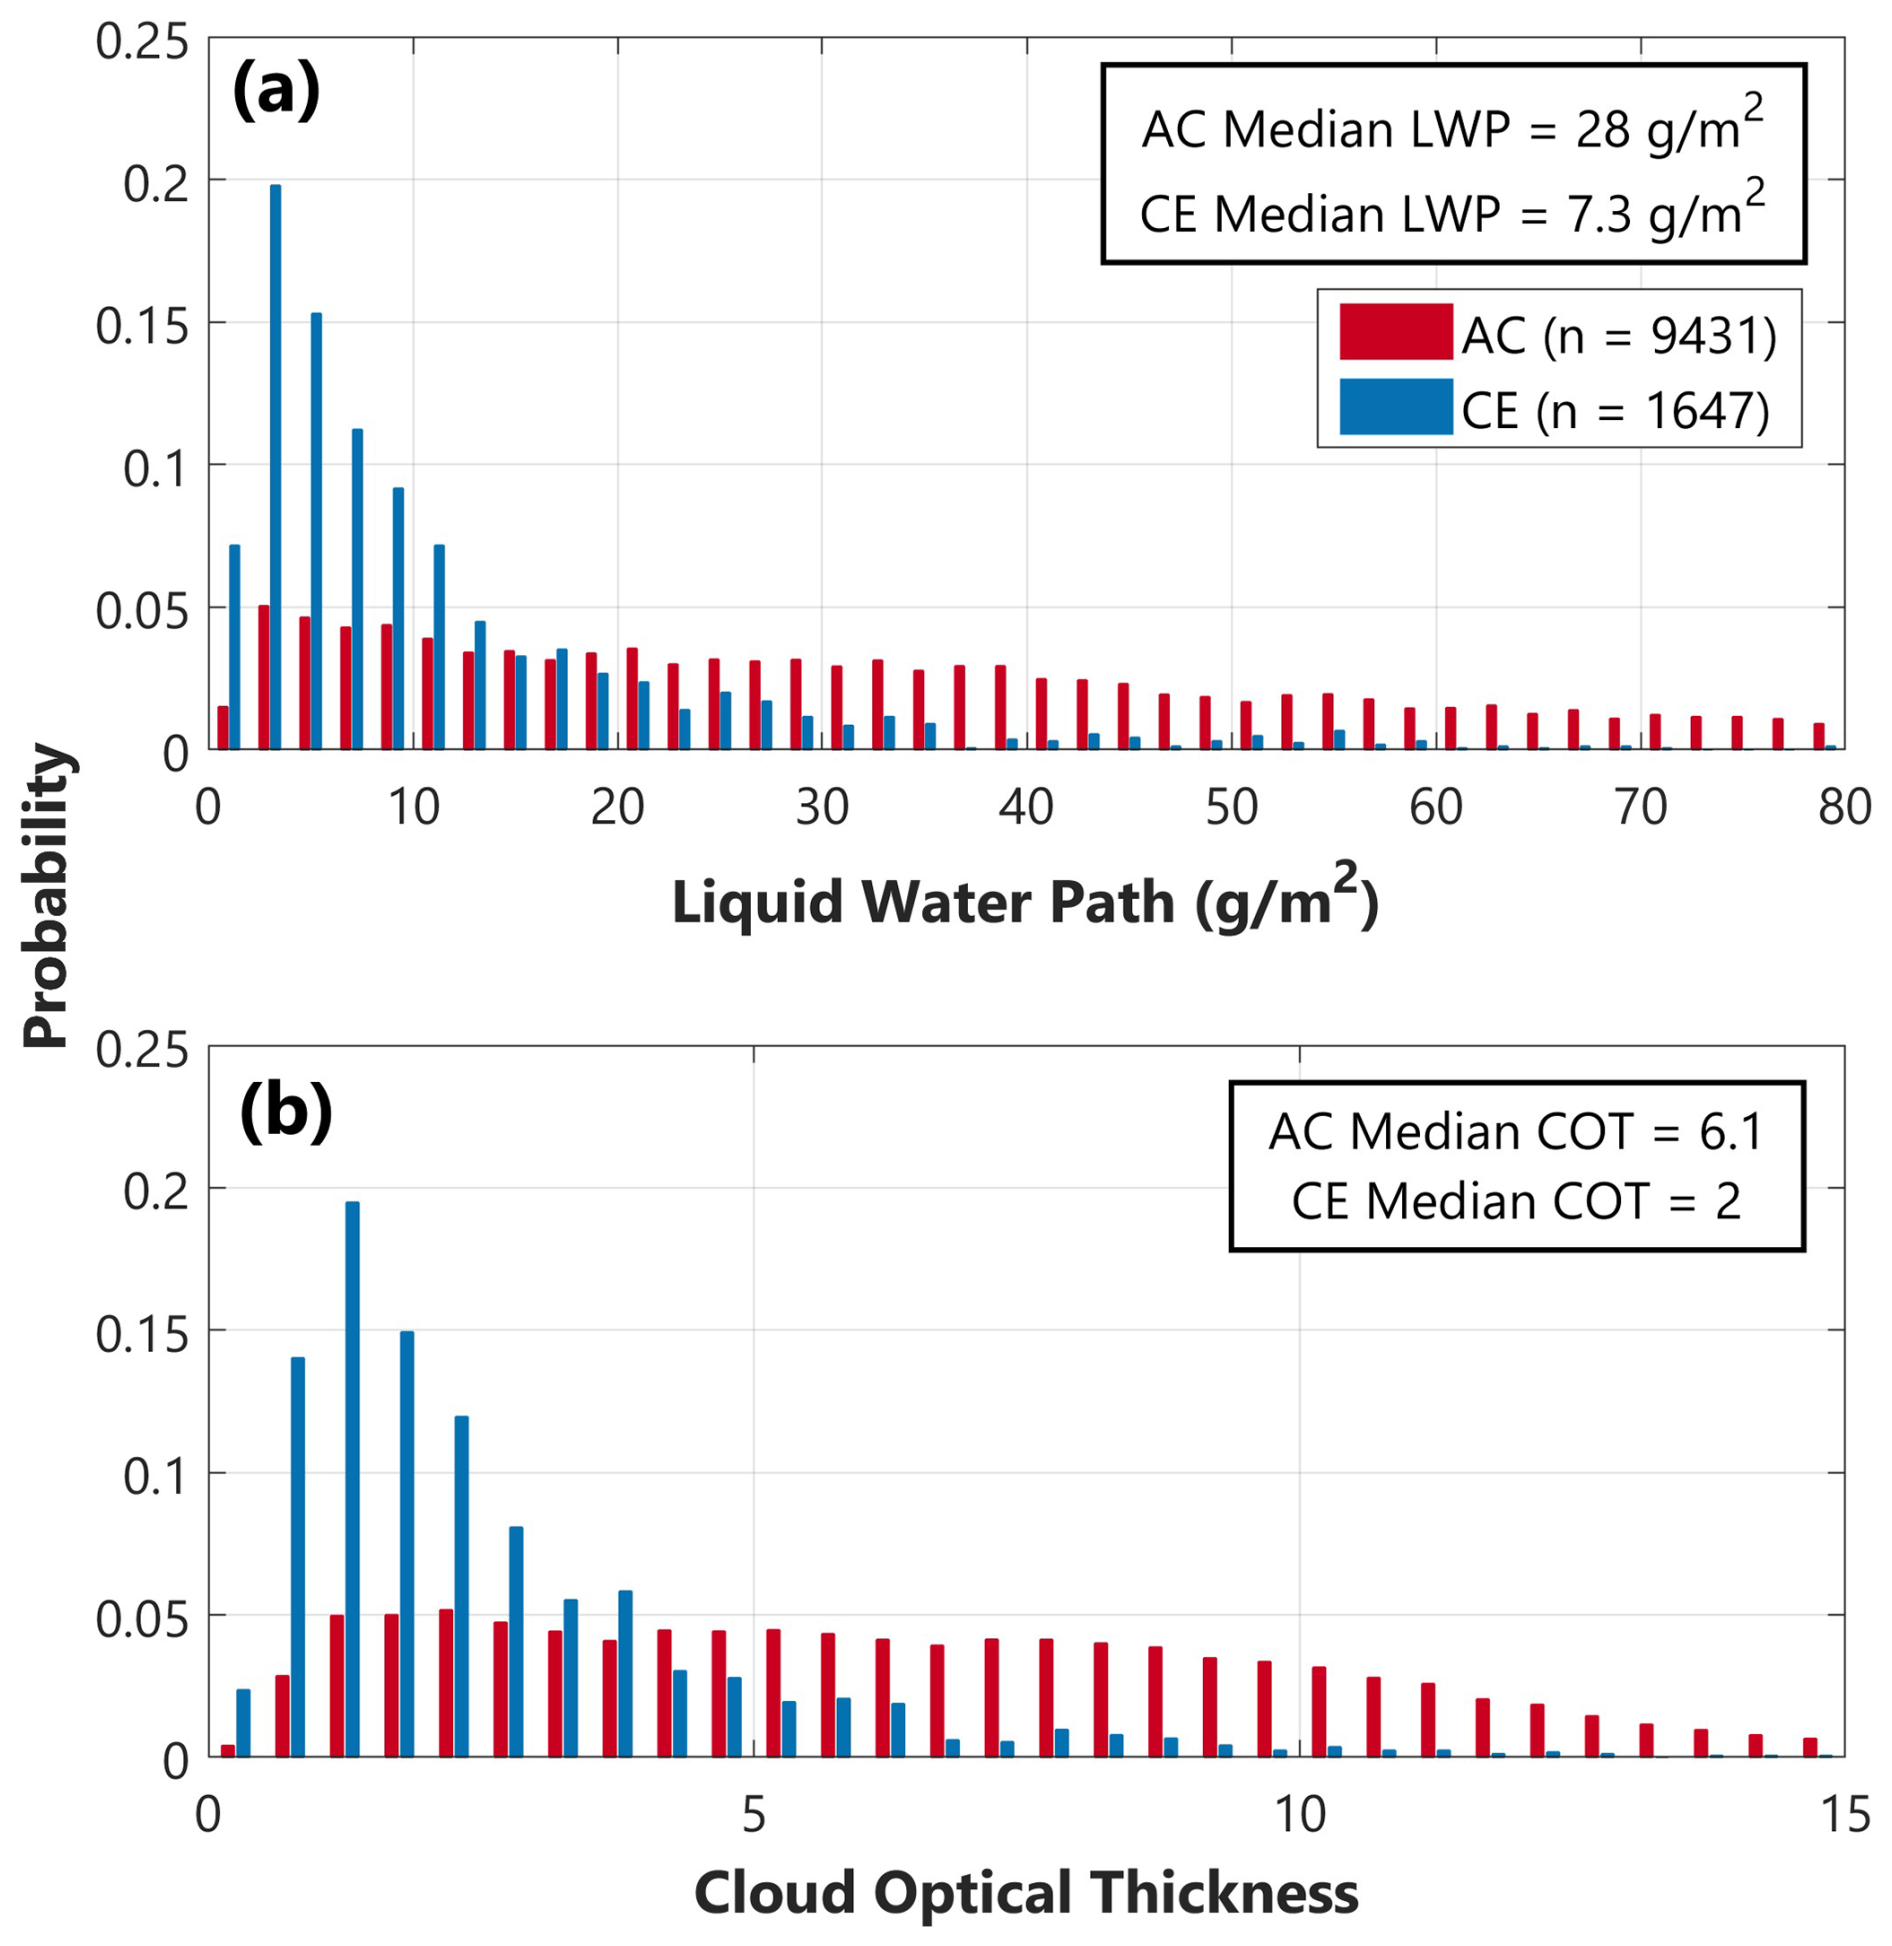
Figure 10Distributions of (a) LWP and (b) COT for all AC data points (red) and CE data points (blue). Median values for both variables and both subsets of data are also shown.
To investigate if lower LWP and COT at cloud edge are associated with any differences in ACIREFF and ACICDNC, we compare results between CE and CC cases (Fig. 11). Like the comparison between cases with relatively clean and polluted BL conditions (Fig. 8), we see that regardless of whether observations are made closer to the center of a cloud or at a cloud edge, the relationships between above-cloud NCCN and cloud top Reff and Nd are similar, with ACI metrics being slightly higher for the cloud edge observations than cloud center observations. This suggests that while increased mixing and entrainment of smoke aerosols into the cloud and nucleation of additional cloud droplets is observed for both cases, it may be occurring more frequently at cloud edges. Furthermore, while we do not have below-cloud NCCN for CC cases using this methodology, the similarity in above-cloud NCCN relationships at cloud center and cloud edge could imply that below-cloud NCCN relationships may also be similar in these two regimes. However, further investigation of below-cloud NCCN relationships towards cloud center would likely require modelling efforts or dependence on in situ observations and is beyond the scope of this study.
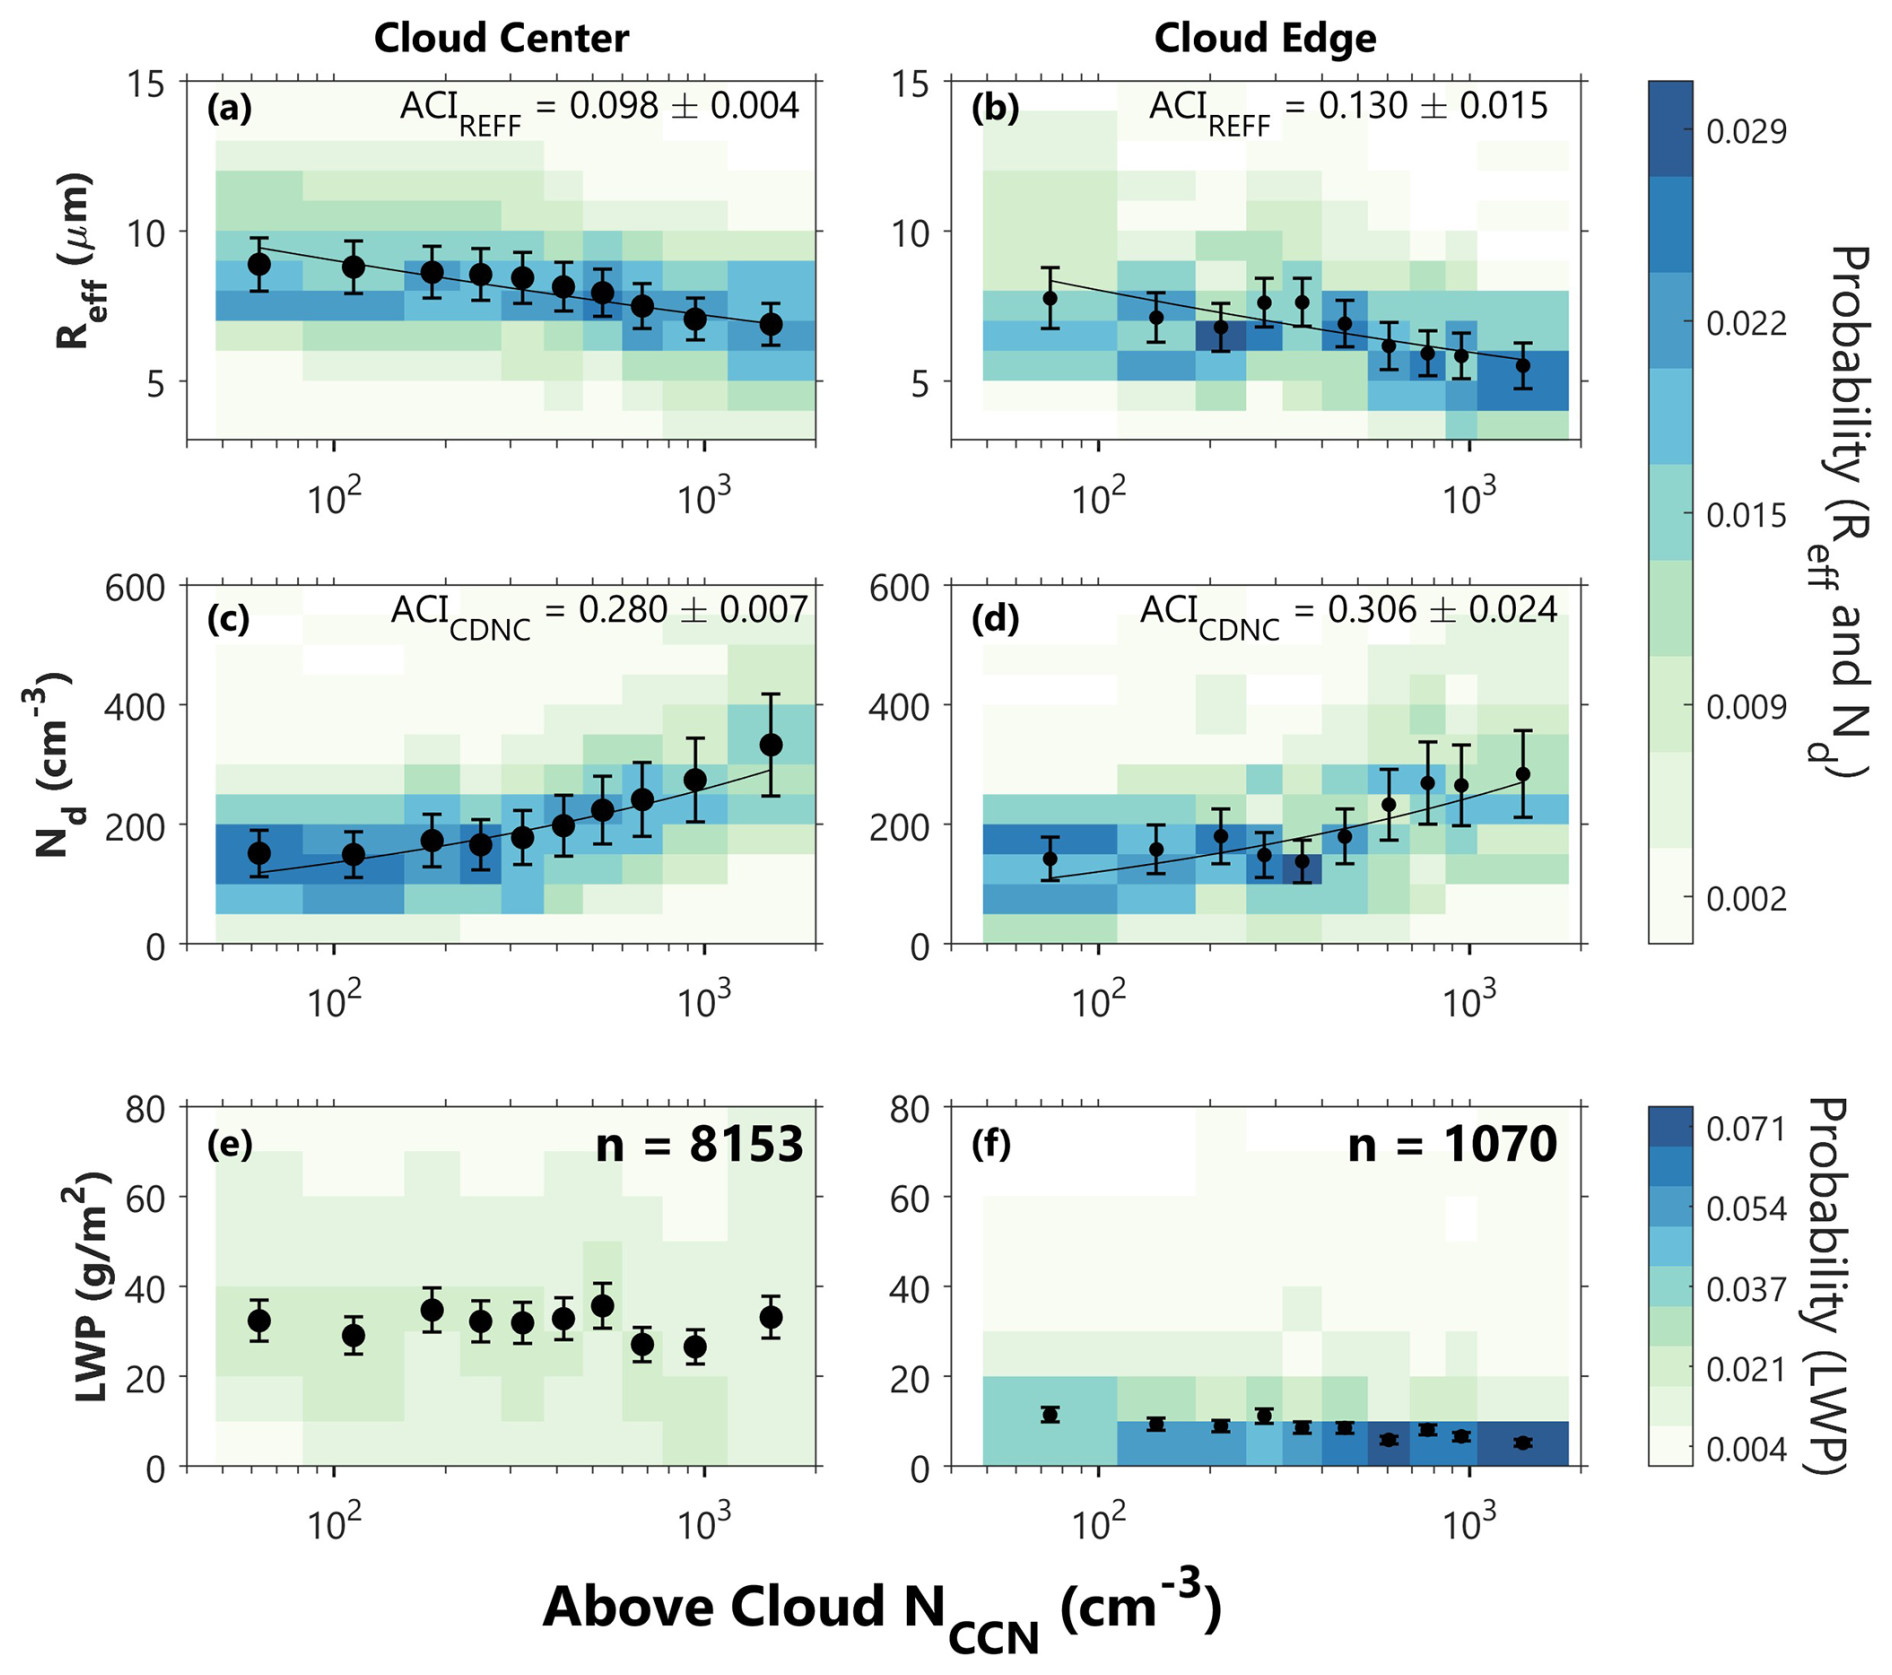
Figure 11Results from cloud center and CE data sets show the relationship between above-cloud NCCN and (a–b) Reff, (c–d) Nd, and (e–f) LWP. The shading, scatter points, ACI metrics, and fit lines are calculated and displayed in the same way as Fig. 4.
In our remote sensing-based analysis of ACI between BBA and the underlying stratocumulus cloud deck in the SEA, we have investigated the relationships between above- and below-cloud NCCN and cloud top microphysical properties as a function of environmental stability, below-cloud aerosol loading, and proximity of observations to the cloud edge. In this section we will further discuss differences in the above- and below-cloud NCCN relationships (Sect. 4.1), cases of a slight reversal in expected cloud responses (Sect. 4.2), and implications for future remote sensing of ACI (Sect. 4.3).
4.1 Above- vs. below-cloud NCCN relationships
Overall, the relationships analyzed here follow the major findings of Gupta et al. (2021), around which this study was formulated. That is, for cases where the smoke plume is in contact with the cloud top, there is evidence of these CCN impacting cloud top microphysical properties. For all cases, increases in above-cloud NCCN were associated with increases in Nd and decreases in Reff. Cases of contact between cloud top and the BBA plume are associated with greater entrainment mixing (Diamond et al., 2018; Gupta et al., 2021), and our finding here reiterates those suggesting that entrainment of BBA that serve as CCN can result in nucleation of cloud droplets near the cloud top. These relationships are evident regardless of BL aerosol loading, with a slightly dampened impact of above-cloud NCCN in cases where the BL is relatively polluted.
Beyond this corroboration of in situ findings, a major focus of this study was the dependence of aerosol–cloud relationships on environmental stability. Based on a k-means clustering analysis using LTS as the sole clustering variable, we stratified observations of the cloud deck with collocated above-cloud NCCN retrievals into four clusters which turn out to be geographically distinct, with LTS increasing from the northwestern part of the SEA toward the southeastern part closest to the African coast. This increase in LTS aligns well with observed decreases in SST and CTH. Using this method, we find that environmental stability is an important governing factor in determining the sensitivity of cloud properties to increases in above-cloud NCCN. As the lower-tropospheric layer becomes more stable, cloud sensitivity to increasing above-cloud NCCN decreases until there is almost no response (cluster 4; Fig. 5d, h). Less stable environments promote greater vertical growth of the cloud layer and mixing led by cloud top entrainment instability (e.g., Mellado, 2017; Gupta et al., 2021). These environments thereby support the modulation of cloud top properties by aerosols from the overlying smoke plume that are entrained into the cloud layer. The percent differences in ACI metrics between cluster 4 and cluster 1 are −73.9 % for ACIREFF and −74.3 % for ACICDNC, again indicating that ACIs depend strongly on environmental conditions. While we see from Fig. 4 that above-cloud ACIs are evident across the full data set, stratifying the data by LTS demonstrates the significant role that climatological regimes with different environmental stability play in determining how clouds respond to increases in above-cloud NCCN. For example, comparing the full data set (Fig. 4a, b) to the cluster of data with the lowest mean LTS (Fig. 5a, e) ACIREFF increases from 0.093 to 0.161 (73.1 %) and ACICDNC increases from 0.275 to 0.452 (64.4 %). Therefore, stratifying data by environmental stability has a large impact on the magnitude, and arguably the accuracy, of the ACI metrics.
Further, we find that constraining the below-cloud NCCN–cloud property relationship using LTS elucidates ACI relationships that are not evident when considering the CE data set as a whole. Observations shown in Fig. 7 suggest that at and within 5 km of cloud edges, below-cloud NCCN have a nearly negligible impact on cloud top microphysical properties, which by itself is a physically implausible result. However, upon assigning CE observations to the clusters determined in Fig. 5, we find that cloud sensitivity to increasing below-cloud NCCN has the opposite dependence on LTS as for above-cloud NCCN (Fig. 9). That is, in more stable environments (cluster 4), decreased entrainment of above-cloud smoke aerosols into the cloud layer results in higher ACI metrics for below-cloud NCCN than above-cloud NCCN. Since high LTS promotes increased cloud fraction, selecting profiles at cloud edges with which to assess the simultaneous impact of above- and below-cloud NCCN preferentially results in a subset of data with lower average LTS. Therefore, when considering all CE cases together, the stronger impact of below-cloud NCCN for high LTS cases is masked. This finding speaks again to the importance of constraining environmental stability when assessing ACI and identifies a limitation of our methodology. Additionally, these stability-related findings corroborate those from other ORACLES ACI-focused studies. Using ORACLES 2016 in situ observations, Diamond et al. (2018) found a weaker relationship between cloud properties and above-cloud BBA compared to the below-cloud effect. Since cloud-focused in situ flight legs often target optically thick and continuous cloud segments, it is likely that these observations are characterized by a higher LTS than most of our CE cases. Moreover, a majority of the 2016 observations in this study are categorized by a high average LTS (Fig. 6), where we, like Diamond et al. (2018) also find stronger below-cloud ACI relationships than those observed above-cloud. Kacarab et al. (2020) discussed the sensitivity of ACI to velocity-limited and aerosol-limited regimes in the ORACLES 2017 observations, and this analysis indirectly suggests a dependence on updraft velocity via environmental stability. Future work exploring differences in aerosol properties, cloud properties, and other meteorological variables within each of these clusters could further assess and constrain ACI in this region.
4.2 Reversals in expected patterns
There are a few small scale variations evident in the bin medians that are not significantly reflected in the fit lines and therefore are not a primary focus of this analysis. These patterns could be an artifact of retrieval uncertainties. However, here we will discuss a few alternative hypotheses based on previous literature. For example, in Fig. 5b and f, we see a slight increase in Reff and decrease in Nd for the highest concentration NCCN bin. Considering this pattern only occurs at NCCN>1000 cm−3, indicating significant contact between cloud top and the smoke plume, one hypothesis for this pattern could be the aerosol semi-direct effect, which describes how absorbing aerosols may act to change cloud properties (Hansen et al., 1997). A study by Koch and Del Genio (2010) that focused on the proximity of absorbing aerosol to different cloud types found that stratocumulus clouds with absorbing aerosol near the cloud top are likely to experience cloud reduction due to the semi-direct effect. Other studies have found a positive correlation between high aerosol loading and cloud droplet size in highly polluted environments without directly characterizing it as the semi-direct effect (Tang et al., 2014; Ma et al., 2018; Jose et al., 2020; Khatri et al., 2022). One commonly proposed pathway is that the aerosol radiative effect reduces moisture content and increases competition for water vapor, causing smaller droplets to evaporate, which could explain the decrease in Nd and increase in Reff. This pattern would also align well with the findings of Kacarab et al. (2020), where ORACLES 2017 in situ observations showed no response in Nd to increasing aerosol concentration >800 cm−3 when water vapor was limited.
Alternatively, these patterns could indicate that at NCCN>1000 cm−3 the environment is saturated by such a large number of small droplets that they begin to coalesce and form precipitation, thus forming fewer droplets that are larger in size. Such a decrease in precipitation susceptibility has been associated with an increase in LWP (Sorooshian et al., 2009), which is also associated with increasing Reff and decreasing Nd here (Fig. 5j). However, untangling the response of LWP to aerosols compared to meteorology is difficult, with many proposed pathways by which LWP may increase or decrease in response to increased aerosol loading (Gryspeerdt et al., 2019). More detailed process modelling would likely be needed to fully understand and untangle the relationships and cause-and-effect pathways between above-cloud NCCN and cloud top Reff, Nd, and LWP for these cases of increased above-cloud aerosol loading, which is outside the scope of this study. Therefore, we hypothesize that the reversal of Reff and Nd trends at high above-cloud NCCN could be indicative of a semi-direct effect due to BBA absorption or the beginning of collision-coalescence due to a highly saturated environment.
A similar reversal in the expected response to increasing NCCN is visible in cluster 4 of Fig. 9, though in this case it occurs at low NCCN, and not within the highest concentration NCCN bin. This increase in Reff and decrease in Nd occurs for NCCN bins between approximately 170–360 cm−3, representing relatively clean BL conditions. Therefore, it is unlikely that these patterns are attributable to the semi-direct effect of above-cloud BBA. Rather, this may be a case in which low NCCN near cloud base creates a low concentration of larger droplets that is maintained by the collision-coalescence process (Saleeby and Cotton, 2005) before NCCN increases above 400 cm−3. Populations of large droplets at cloud base have been observed in clean aerosol regions for convective clouds over the Amazon by Braga et al. (2017), and this effect has been hypothesized to be attributable to the presence of giant CCN (GCCN) by this and other studies (Yin et al., 2000; Saleeby and Cotton, 2005). It is likely that the below-cloud NCCN population in this region includes sea salt particles, which are an aerosol type more likely to reach such sizes to be classified as GCCN. However, this remains a hypothesis to explain the increase in Reff and decrease in Nd at low below-cloud NCCN as the exact composition and size of below-cloud NCCN is outside the scope of this analysis.
4.3 Implications for remote sensing techniques
The major implication of these results confirming those of an in situ-based study (Gupta et al., 2021) is that, with the right considerations regarding environmental stability, ACI can reliably be estimated using only these remote sensing-based observations. We make use of well-collocated HSRL-2 and RSP observations from the ORACLES campaign to investigate relationships between cloud microphysical properties and vertically resolved NCCN both above- and below-cloud. This strategy not only corroborates in situ-based findings using a larger amount of data than is available from in situ observations, but it also demonstrates a methodology that can be used with current and future satellite-based observations.
As previously mentioned, the vertical distribution of NCCN is especially relevant for understanding ACI. For the ORACLES region, where we have the unique scenario of an optically thick and strongly absorbing BBA plume overlying marine stratocumulus clouds, we found that changes in above-cloud NCCN are more strongly related to changes in cloud top microphysical properties under unstable conditions, while changes in the below-cloud NCCN have a more significant impact on cloud properties under stable conditions However, without vertically resolved NCCN from the ML-CCN method, this above- and below-cloud NCCN distinction would not have been possible. Additionally, the high accuracy of the ML-CCN method has an advantage over other active spaceborne sensors such as CALIOP that have routinely misplaced the vertical extent of aerosol plumes and thus misrepresented ACI (Rajapakshe et al., 2017). Another benefit of the ML-CCN method is that it allows us to use data in close proximity (2 km) to cloud edge without concerns about cloud edge humidification effects since environmental relative humidity is considered in the model training.
A similar methodology as that shown here could be done in other regions using Atmospheric LIDar (AtLID) and Multi Spectral Imager (MSI) observations from the recently launched EarthCARE satellite (Wehr et al., 2023) in combination with other satellite-based cloud retrievals. While higher uncertainty and lower signal-to-noise may be associated with ATLID NCCN retrievals, the overall framework presented here remains valid for spaceborne remote sensing of ACI. However, one important limitation inherent to this method is that the selection of cloud edge cases for assessing the simultaneous impact of above- and below-cloud NCCN may preferentially create a subset of primarily low LTS observations, and this needs to be considered when interpreting results. Consequently, the dependence of ACI on LTS speaks to the need to constrain future satellite observations by a stability-related parameter such as LTS to accurately represent the impacts of different climatological regimes on ACI metrics, which may also impact their parameterization in models.
One key component missing from several studies of ACI is the vertical distribution of NCCN relative to cloud height, which in regions with significant tropospheric aerosol loading is critical to understanding how and where aerosols are nucleating as cloud droplets and impacting cloud microphysical properties. Here we use a fully remote sensing-based data set to investigate ACI over the SEA using HSRL-2-based, ML-predicted NCCN curtains and cloud microphysical properties retrieved from the RSP. To assess the simultaneous above- and below-cloud impact of NCCN on cloud properties, we infer below-cloud NCCN values from cloud-edge adjacent profiles. Previous in situ-based studies have found evidence of ACI between smoke plume BBA and the underlying stratocumulus cloud deck. Therefore, the major goals of this study were to investigate these cloud top ACI in more detail and to determine whether such relationships could be observed using only remote sensing data.
We found that our results align well with those of the in situ-based study (Gupta et al., 2021). That is, we see a decrease in Reff and increase in Nd when the BBA concentrations are significant within 100 m of the cloud top, and this finding is independent of horizontal proximity to cloud edge and the magnitude of BL aerosol loading. Additionally, to constrain the impact of environmental stability we cluster the above-cloud and cloud edge data sets by LTS, finding that cloud sensitivity to increasing above- (below-)cloud NCCN decreases (increases) as LTS increases. Therefore, it appears that entrainment of above-cloud BBA into the stratocumulus cloud layer is a major control of cloud top microphysical properties under relatively unstable conditions, while the below-cloud NCCN effect on cloud properties is stronger under more stable conditions. Therefore, both above- and below-cloud NCCN effects are highly dependent on environmental stability. A major implication of this work is the ability to assess ACI using remote sensing-based observations, a method that can be applied to current and future spaceborne observations. We have demonstrated the benefit of the Redemann and Gao (2024) ML-CCN product in that it can be used to separate the impact of above- and below-cloud NCCN on cloud properties in the same column. Additionally, we have used autocorrelation analyses to characterize the variability of NCCN in the SEA BL, which provides a tool to extrapolate clear-sky NCCN retrievals to nearby clouds. We concede that this extrapolation carries its own uncertainty, but it is superior to the inherent spatial homogeneity assumptions in ACI studies that derive ACI metrics from large-scale averaged satellite retrievals of aerosol and cloud properties. Each of these methodologies can be applied to future studies in different regions and cloud types to further work toward reducing uncertainty associated with the radiative impacts of ACI.
As in Gupta et al. (2021), relationships between cloud top height (ZT) and cloud base height (ZB) are developed from in situ data including the Cloud and Aerosol Spectrometer (CAS) on the Cloud, Aerosol and Precipitation Spectrometer (CAPS; Baumgardner et al., 2001), two Cloud Droplet Probes (CDP; Lance et al., 2010), and a King hot-wire (King et al., 1978). The King hot-wire was used to determine bulk liquid water content (LWC). CAS and the CDP measured the cloud droplet size distribution, and the full size distribution spectrum covering diameters between 3–50 µm was determined using the probe most consistent with the King hot-wire LWC (Gupta et al., 2022a). These observations are used to find the highest (cloud top) and lowest (cloud base) altitudes within individual sawtooth profiles at which in situ cloud Nd is greater than 10 cm−3 and bulk liquid water content (LWC) is greater than 0.05 g m−3. Our resulting linear relationships between in situ ZT and ZB are shown in Fig. A1a. We then estimate cloud base height from HSRL-2 cloud top heights using these statistical relationships developed from in situ observations. When this method is applied to each lidar profile observed at a cloud edge (Sect. 2.4), we find that most cloud base heights fall between about 400–750 m (Fig. A1b).
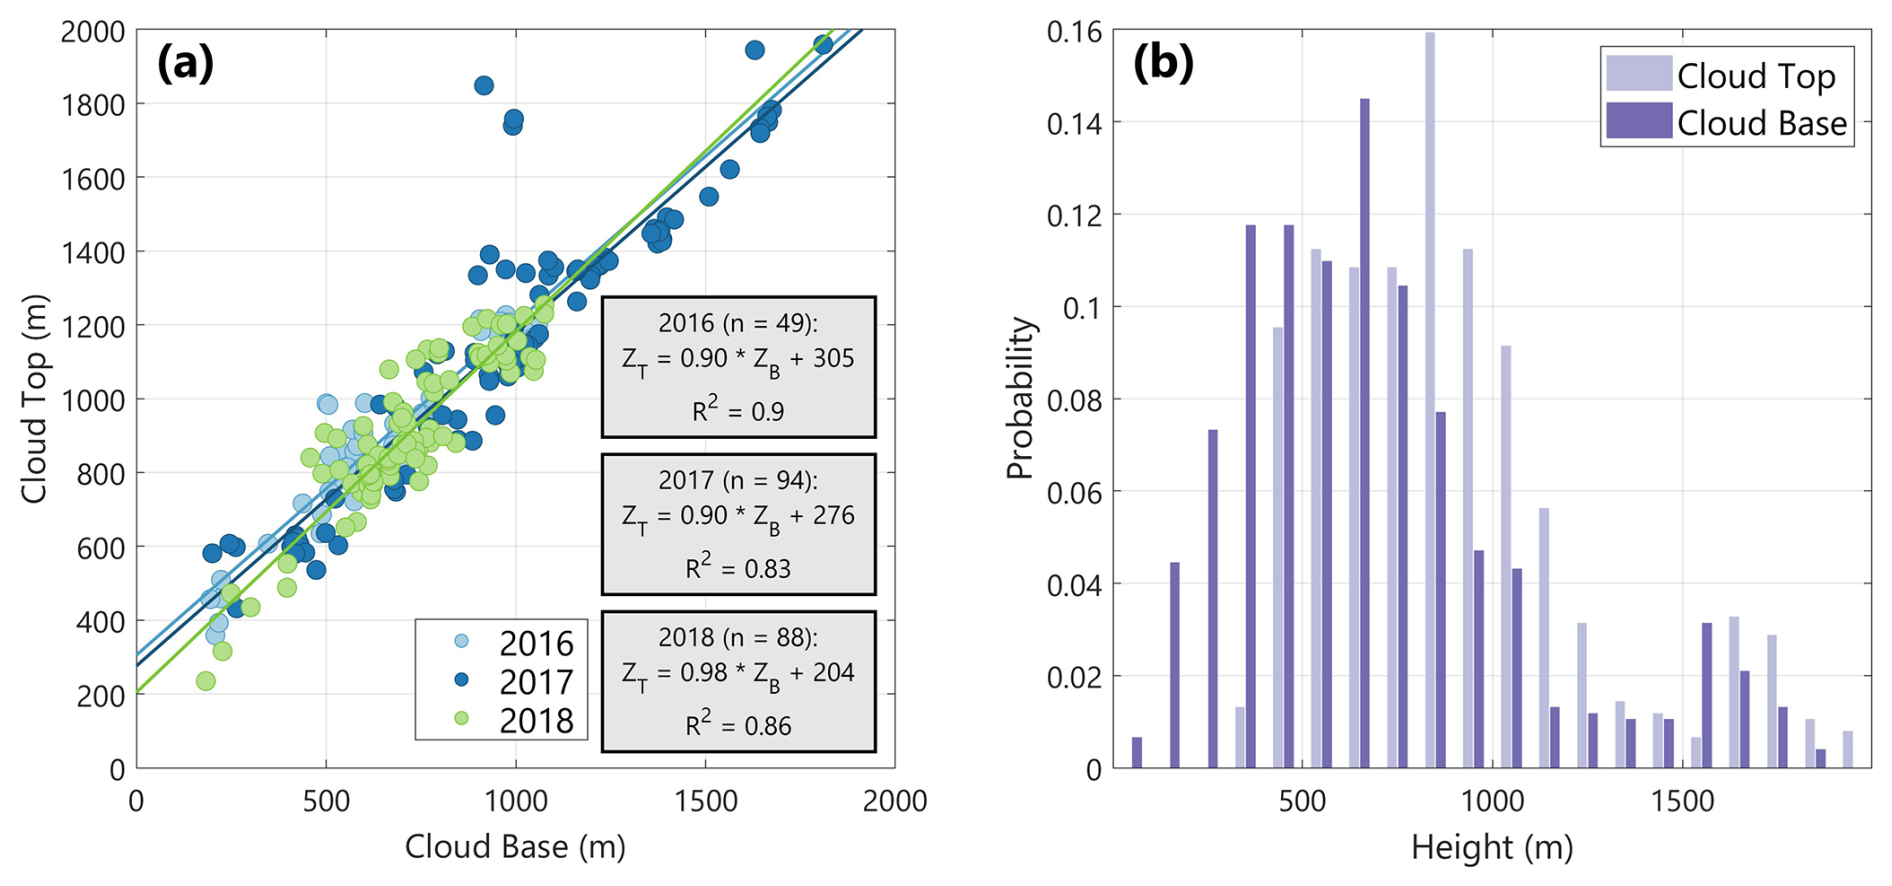
Figure A1(a) In situ derived relationship between cloud top height (ZT) and cloud base height (ZB) based on the methodology of Gupta et al. (2021). These relationships are applied to HSRL-2 cloud top heights measured at cloud edge for all three deployment years of ORACLES. The distributions of these HSRL-2 measured cloud top heights and resultant calculated cloud base heights are given in panel (b).
The ER-2 and P-3 data sets are available at the following links: https://doi.org/10.5067/Suborbital/ORACLES/P3/2016 (ORACLES Science Team, 2021a), https://doi.org/10.5067/Suborbital/ORACLES/ER2/2016 (ORACLES Science Team, 2021b), https://doi.org/10.5067/Suborbital/ORACLES/P3/2017 (ORACLES Science Team, 2021c), and https://doi.org/10.5067/Suborbital/ORACLES/P3/2018 (ORACLES Science Team, 2021d). Machine learning-predicted NCCN data is available at: https://doi.org/10.5281/zenodo.18626083 (Gao et al., 2026).
EDL, LG, and JR formulated the science questions and corresponding analyses. EDL organized all data products, performed analyses, visualized the results, and wrote the draft. LG, SG, GM, FX, RAF, CAH, and JR edited the manuscript and provided insightful discussion and suggestions.
At least one of the (co-)authors is a member of the editorial board of Atmospheric Chemistry and Physics. The peer-review process was guided by an independent editor, and the authors also have no other competing interests to declare.
Publisher's note: Copernicus Publications remains neutral with regard to jurisdictional claims made in the text, published maps, institutional affiliations, or any other geographical representation in this paper. The authors bear the ultimate responsibility for providing appropriate place names. Views expressed in the text are those of the authors and do not necessarily reflect the views of the publisher.
We would like to thank the entire NASA ORACLES science team in addition to the P-3 and ER-2 pilots and flight crews for a successful deployment. In addition, we acknowledge contributions from the HSRL-2, CCN, and RSP instrument teams. Emily D. Lenhardt acknowledges support from NASA FINESST grant 80NSSC24K0008. Siddhant Gupta is supported by Argonne National Laboratory under U.S. DOE contract DE-AC02-06CH11357 and the ARM User Facility, funded by the Office of Biological and Environmental Research in the U.S DOE Office of Science.
This research has been supported by the National Aeronautics and Space Administration (grant no. 80NSSC24K0008).
This paper was edited by Matthias Tesche and reviewed by David Painemal and one anonymous referee.
Adebiyi, A. A. and Zuidema, P.: The role of the southern African easterly jet in modifying the southeast Atlantic aerosol and cloud environments, Q. J. Roy. Meteor. Soc., 142, 1574–1589, https://doi.org/10.1002/qj.2765, 2016.
Adebiyi, A. A., Zuidema, P., and Abel, S. J.: The Convolution of Dynamics and Moisture with the Presence of Shortwave Absorbing Aerosols over the Southeast Atlantic, J. Climate, 28, 1997–2024, https://doi.org/10.1175/JCLI-D-14-00352.1, 2015.
Alam, K., Iqbal, M. J., Blaschke, T., Qureshi, S., and Khan, G.: Monitoring spatio-temporal variations in aerosols and aerosol–cloud interactions over Pakistan using MODIS data, Adv. Space Res., 46, 1162–1176, https://doi.org/10.1016/j.asr.2010.06.025, 2010.
Albrecht, B. A.: Aerosols, Cloud Microphysics, and Fractional Cloudiness, Science, 245, 1227–1230, https://doi.org/10.1126/science.245.4923.1227, 1989.
Alexandri, F., Müller, F., Choudhury, G., Achtert, P., Seelig, T., and Tesche, M.: A cloud-by-cloud approach for studying aerosol–cloud interaction in satellite observations, Atmos. Meas. Tech., 17, 1739–1757, https://doi.org/10.5194/amt-17-1739-2024, 2024.
Alexandrov, M. D., Cairns, B., Emde, C., Ackerman, A. S., and Van Diedenhoven, B.: Accuracy assessments of cloud droplet size retrievals from polarized reflectance measurements by the research scanning polarimeter, Remote Sens. Environ., 125, 92–111, https://doi.org/10.1016/j.rse.2012.07.012, 2012a.
Alexandrov, M. D., Cairns, B., and Mishchenko, M. I.: Rainbow Fourier transform, J. Quant. Spectrosc. Ra., 113, 2521–2535, https://doi.org/10.1016/j.jqsrt.2012.03.025, 2012b.
Alexandrov, M. D., Cairns, B., Sinclair, K., Wasilewski, A. P., Ziemba, L., Crosbie, E., Moore, R., Hair, J., Scarino, A. J., Hu, Y., Stamnes, S., Shook, M. A., and Chen, G.: Retrievals of cloud droplet size from the research scanning polarimeter data: Validation using in situ measurements, Remote Sens. Environ., 210, 76–95, https://doi.org/10.1016/j.rse.2018.03.005, 2018.
Anderberg, M.: Cluster Analysis for Applications, Elsevier, https://doi.org/10.1016/C2013-0-06161-0, 1973.
Anderson, T. L., Charlson, R. J., Winker, D. M., Ogren, J. A., and Holmén, K.: Mesoscale Variations of Tropospheric Aerosols, J. Atmos. Sci., 60, 119–136, https://doi.org/10.1175/1520-0469(2003)060<0119:MVOTA>2.0.CO;2, 2003.
Andreae, M. O.: Smoking Rain Clouds over the Amazon, Science, 303, 1337–1342, https://doi.org/10.1126/science.1092779, 2004.
Andreae, M. O.: Correlation between cloud condensation nuclei concentration and aerosol optical thickness in remote and polluted regions, Atmos. Chem. Phys., 9, 543–556, https://doi.org/10.5194/acp-9-543-2009, 2009.
Baumgardner, D., Jonsson, H., Dawson, W., O'Connor, D., and Newton, R.: The cloud, aerosol and precipitation spectrometer: a new instrument for cloud investigations, Atmos. Res., 59–60, 251–264, https://doi.org/10.1016/S0169-8095(01)00119-3, 2001.
Braga, R. C., Rosenfeld, D., Weigel, R., Jurkat, T., Andreae, M. O., Wendisch, M., Pöschl, U., Voigt, C., Mahnke, C., Borrmann, S., Albrecht, R. I., Molleker, S., Vila, D. A., Machado, L. A. T., and Grulich, L.: Further evidence for CCN aerosol concentrations determining the height of warm rain and ice initiation in convective clouds over the Amazon basin, Atmos. Chem. Phys., 17, 14433–14456, https://doi.org/10.5194/acp-17-14433-2017, 2017.
Cairns, B., Russell, E. E., and Travis, L. D.: Research Scanning Polarimeter: calibration and ground-based measurements, SPIE's International Symposium on Optical Science, Engineering, and Instrumentation, Denver, CO, 186–196, https://doi.org/10.1117/12.366329, 1999.
Calinski, T. and Harabasz, J.: A dendrite method for cluster analysis, Commun. Stat., 3, 1–27, https://doi.org/10.1080/03610927408827101, 1974.
Chang, I., Gao, L., Adebiyi, A. A., Doherty, S. J., Painemal, D., Smith, W. L., Lenhardt, E. D., Fakoya, A. A., Flynn, C. J., Zheng, J., Yang, Z., Castellanos, P., Da Silva, A. M., Zhang, Z., Wood, R., Zuidema, P., Christopher, S. A., and Redemann, J.: Regional aerosol warming enhanced by the diurnal cycle of low cloud, Nat. Geosci., 18, 702–708, https://doi.org/10.1038/s41561-025-01740-1, 2025.
Chau, K., Franklin, M., Lee, H., Garay, M., and Kalashnikova, O.: Temporal and Spatial Autocorrelation as Determinants of Regional AOD-PM2.5 Model Performance in the Middle East, Remote Sens., 13, 3790, https://doi.org/10.3390/rs13183790, 2021.
Chen, J., Liu, Y., Zhang, M., and Peng, Y.: Height Dependency of Aerosol‐Cloud Interaction Regimes, J. Geophys. Res.-Atmos., 123, 491–506, https://doi.org/10.1002/2017JD027431, 2018.
Chen, Y., Christensen, M. W., Diner, D. J., and Garay, M. J.: Aerosol‐cloud interactions in ship tracks using Terra MODIS/MISR, J. Geophys. Res.-Atmos., 120, 2819–2833, https://doi.org/10.1002/2014JD022736, 2015.
Choudhury, G. and Tesche, M.: Assessment of CALIOP-Derived CCN Concentrations by In Situ Surface Measurements, Remote Sens., 14, 3342, https://doi.org/10.3390/rs14143342, 2022a.
Choudhury, G. and Tesche, M.: Estimating cloud condensation nuclei concentrations from CALIPSO lidar measurements, Atmos. Meas. Tech., 15, 639–654, https://doi.org/10.5194/amt-15-639-2022, 2022b.
Christensen, M. W., Neubauer, D., Poulsen, C. A., Thomas, G. E., McGarragh, G. R., Povey, A. C., Proud, S. R., and Grainger, R. G.: Unveiling aerosol–cloud interactions – Part 1: Cloud contamination in satellite products enhances the aerosol indirect forcing estimate, Atmos. Chem. Phys., 17, 13151–13164, https://doi.org/10.5194/acp-17-13151-2017, 2017.
Costantino, L. and Bréon, F.-M.: Aerosol indirect effect on warm clouds over South-East Atlantic, from co-located MODIS and CALIPSO observations, Atmos. Chem. Phys., 13, 69–88, https://doi.org/10.5194/acp-13-69-2013, 2013.
D'Alessandro, J. J., McFarquhar, G. M., Stith, J. L., Diao, M., DeMott, P. J., McCluskey, C. S., Hill, T. C. J., Roberts, G. C., and Sanchez, K. J.: An Evaluation of Phase, Aerosol‐Cloud Interactions and Microphysical Properties of Single‐ and Multi‐Layer Clouds Over the Southern Ocean Using in Situ Observations From SOCRATES, J. Geophys. Res.-Atmos., 128, e2023JD038610, https://doi.org/10.1029/2023JD038610, 2023.
Dedrick, J. L., Pelayo, C. N., Russell, L. M., Lubin, D., Mülmenstädt, J., and Miller, M.: Competition response of cloud supersaturation explains diminished Twomey effect for smoky aerosol in the tropical Atlantic, P. Natl. Acad. Sci. USA, 122, e2412247122, https://doi.org/10.1073/pnas.2412247122, 2025.
Di Bernardino, A., Iannarelli, A. M., Casadio, S., Pisacane, G., Mevi, G., and Cacciani, M.: Classification of synoptic and local-scale wind patterns using k-means clustering in a Tyrrhenian coastal area (Italy), Meteorol. Atmos. Phys., 134, 30, https://doi.org/10.1007/s00703-022-00871-z, 2022.
Diamond, M. S., Dobracki, A., Freitag, S., Small Griswold, J. D., Heikkila, A., Howell, S. G., Kacarab, M. E., Podolske, J. R., Saide, P. E., and Wood, R.: Time-dependent entrainment of smoke presents an observational challenge for assessing aerosol–cloud interactions over the southeast Atlantic Ocean, Atmos. Chem. Phys., 18, 14623–14636, https://doi.org/10.5194/acp-18-14623-2018, 2018.
Doherty, S. J., Saide, P. E., Zuidema, P., Shinozuka, Y., Ferrada, G. A., Gordon, H., Mallet, M., Meyer, K., Painemal, D., Howell, S. G., Freitag, S., Dobracki, A., Podolske, J. R., Burton, S. P., Ferrare, R. A., Howes, C., Nabat, P., Carmichael, G. R., da Silva, A., Pistone, K., Chang, I., Gao, L., Wood, R., and Redemann, J.: Modeled and observed properties related to the direct aerosol radiative effect of biomass burning aerosol over the southeastern Atlantic, Atmos. Chem. Phys., 22, 1–46, https://doi.org/10.5194/acp-22-1-2022, 2022.
Douglas, A. and L'Ecuyer, T.: Quantifying variations in shortwave aerosol–cloud–radiation interactions using local meteorology and cloud state constraints, Atmos. Chem. Phys., 19, 6251–6268, https://doi.org/10.5194/acp-19-6251-2019, 2019.
Forster, P., Storelvmo, T., Armour, K., Collins, W., Dufresne, J.-L., Frame, D., Lunt, D. J., Mauritsen, T., Palmer, M. D., Watanabe, M., Wild, M., and Zhang, H.: The Earth's Energy Budget, Climate Feedbacks and Climate Sensitivity, in: Climate Change 2021 – The Physical Science Basis, edited by: Masson-Delmotte, V., Zhai, P., Pirani, A., Connors, S. L., Péan, C., Berger, S., Caud, N., Chen, Y., Goldfarb, L., Gomis, M. I., Huang, M., Leitzell, K., Lonnoy, E., Matthews, J. B. R., Maycock, T. K., Waterfield, T., Yelekçi, O., Yu, R., and Zhou, B., Cambridge University Press, 571–658, https://doi.org/10.1017/9781009157896.009, 2021.
Franco, M. A., Morais, F. G., Rizzo, L. V., Palácios, R., Valiati, R., Teixeira, M., Machado, L. A. T., and Artaxo, P.: Aerosol optical depth and water vapor variability assessed through autocorrelation analysis, Meteorol. Atmos. Phys., 136, 15, https://doi.org/10.1007/s00703-024-01011-5, 2024.
Fu, D., Di Girolamo, L., Rauber, R. M., McFarquhar, G. M., Nesbitt, S. W., Loveridge, J., Hong, Y., van Diedenhoven, B., Cairns, B., Alexandrov, M. D., Lawson, P., Woods, S., Tanelli, S., Schmidt, S., Hostetler, C., and Scarino, A. J.: An evaluation of the liquid cloud droplet effective radius derived from MODIS, airborne remote sensing, and in situ measurements from CAMP2Ex, Atmos. Chem. Phys., 22, 8259–8285, https://doi.org/10.5194/acp-22-8259-2022, 2022.
Gao, L., Redemann, J., and Lenhardt, E.: Machine Learning Predicted CCN Concentration for ORACLES ACI Study, Zenodo [data set], https://doi.org/10.5281/ZENODO.18626083, 2026.
Ghan, S., Wang, M., Zhang, S., Ferrachat, S., Gettelman, A., Griesfeller, J., Kipling, Z., Lohmann, U., Morrison, H., Neubauer, D., Partridge, D. G., Stier, P., Takemura, T., Wang, H., and Zhang, K.: Challenges in constraining anthropogenic aerosol effects on cloud radiative forcing using present-day spatiotemporal variability, P. Natl. Acad. Sci. USA, 113, 5804–5811, https://doi.org/10.1073/pnas.1514036113, 2016.
Global Modeling And Assimilation Office (GMAO): MERRA-2 inst3_3d_asm_Np: 3d,3-Hourly,Instantaneous,Pressure-Level,Assimilation,Assimilated Meteorological Fields V5.12.4, Greenbelt, MD, USA, Goddard Earth Sciences Data and Information Services Center (GES DISC), https://doi.org/10.5067/QBZ6MG944HW0, 2015.
Goren, T. and Rosenfeld, D.: Satellite observations of ship emission induced transitions from broken to closed cell marine stratocumulus over large areas, J. Geophys. Res., 117, 2012JD017981, https://doi.org/10.1029/2012JD017981, 2012.
Gryspeerdt, E. and Stier, P.: Regime‐based analysis of aerosol‐cloud interactions, Geophys. Res. Lett., 39, 2012GL053221, https://doi.org/10.1029/2012GL053221, 2012.
Gryspeerdt, E., Stier, P., and Partridge, D. G.: Satellite observations of cloud regime development: the role of aerosol processes, Atmos. Chem. Phys., 14, 1141–1158, https://doi.org/10.5194/acp-14-1141-2014, 2014.
Gryspeerdt, E., Goren, T., Sourdeval, O., Quaas, J., Mülmenstädt, J., Dipu, S., Unglaub, C., Gettelman, A., and Christensen, M.: Constraining the aerosol influence on cloud liquid water path, Atmos. Chem. Phys., 19, 5331–5347, https://doi.org/10.5194/acp-19-5331-2019, 2019.
Gryspeerdt, E., Glassmeier, F., Feingold, G., Hoffmann, F., and Murray-Watson, R. J.: Observing short-timescale cloud development to constrain aerosol–cloud interactions, Atmos. Chem. Phys., 22, 11727–11738, https://doi.org/10.5194/acp-22-11727-2022, 2022.
Gupta, S., McFarquhar, G. M., O'Brien, J. R., Delene, D. J., Poellot, M. R., Dobracki, A., Podolske, J. R., Redemann, J., LeBlanc, S. E., Segal-Rozenhaimer, M., and Pistone, K.: Impact of the variability in vertical separation between biomass burning aerosols and marine stratocumulus on cloud microphysical properties over the Southeast Atlantic, Atmos. Chem. Phys., 21, 4615–4635, https://doi.org/10.5194/acp-21-4615-2021, 2021.
Gupta, S., McFarquhar, G. M., O'Brien, J. R., Poellot, M. R., Delene, D. J., Miller, R. M., and Small Griswold, J. D.: Factors affecting precipitation formation and precipitation susceptibility of marine stratocumulus with variable above- and below-cloud aerosol concentrations over the Southeast Atlantic, Atmos. Chem. Phys., 22, 2769–2793, https://doi.org/10.5194/acp-22-2769-2022, 2022a.
Gupta, S., McFarquhar, G. M., O'Brien, J. R., Poellot, M. R., Delene, D. J., Chang, I., Gao, L., Xu, F., and Redemann, J.: In situ and satellite-based estimates of cloud properties and aerosol–cloud interactions over the southeast Atlantic Ocean, Atmos. Chem. Phys., 22, 12923–12943, https://doi.org/10.5194/acp-22-12923-2022, 2022b.
Hansen, J., Sato, M., and Ruedy, R.: Radiative forcing and climate response, J. Geophys. Res., 102, 6831–6864, https://doi.org/10.1029/96JD03436, 1997.
Heintzenberg, J., Birmili, W., Wiedensohler, A., Nowak, A., and Tuch, T.: Structure, variability and persistence of the submicrometre marine aerosol, Tellus B, 56, 357, https://doi.org/10.3402/tellusb.v56i4.16450, 2004.
Hernández Pardo, L., Toledo Machado, L. A., Amore Cecchini, M., and Sánchez Gácita, M.: Quantifying the aerosol effect on droplet size distribution at cloud top, Atmos. Chem. Phys., 19, 7839–7857, https://doi.org/10.5194/acp-19-7839-2019, 2019.
Jia, H., Ma, X., Quaas, J., Yin, Y., and Qiu, T.: Is positive correlation between cloud droplet effective radius and aerosol optical depth over land due to retrieval artifacts or real physical processes?, Atmos. Chem. Phys., 19, 8879–8896, https://doi.org/10.5194/acp-19-8879-2019, 2019.
Jose, S., Nair, V. S., and Babu, S. S.: Anthropogenic emissions from South Asia reverses the aerosol indirect effect over the northern Indian Ocean, Sci. Rep., 10, 18360, https://doi.org/10.1038/s41598-020-74897-x, 2020.
Kacarab, M., Thornhill, K. L., Dobracki, A., Howell, S. G., O'Brien, J. R., Freitag, S., Poellot, M. R., Wood, R., Zuidema, P., Redemann, J., and Nenes, A.: Biomass burning aerosol as a modulator of the droplet number in the southeast Atlantic region, Atmos. Chem. Phys., 20, 3029–3040, https://doi.org/10.5194/acp-20-3029-2020, 2020.
Kaufman, Y. J., Haywood, J. M., Hobbs, P. V., Hart, W., Kleidman, R., and Schmid, B.: Remote sensing of vertical distributions of smoke aerosol off the coast of Africa, Geophys. Res. Lett., 30, https://doi.org/10.1029/2003GL017068, 2003.
Khatri, P., Hayasaka, T., Holben, B. N., Singh, R. P., Letu, H., and Tripathi, S. N.: Increased aerosols can reverse Twomey effect in water clouds through radiative pathway, Sci. Rep., 12, 20666, https://doi.org/10.1038/s41598-022-25241-y, 2022.
Kim, B., Miller, M. A., Schwartz, S. E., Liu, Y., and Min, Q.: The role of adiabaticity in the aerosol first indirect effect, J. Geophys. Res., 113, 2007JD008961, https://doi.org/10.1029/2007JD008961, 2008.
King, N. J., Bower, K. N., Crosier, J., and Crawford, I.: Evaluating MODIS cloud retrievals with in situ observations from VOCALS-REx, Atmos. Chem. Phys., 13, 191–209, https://doi.org/10.5194/acp-13-191-2013, 2013.
King, W. D., Parkin, D. A., and Handsworth, R. J.: A Hot-Wire Liquid Water Device Having Fully Calculable Response Characteristics, J. Appl. Meteor., 17, 1809–1813, https://doi.org/10.1175/1520-0450(1978)017<1809:AHWLWD>2.0.CO;2, 1978.
Klein, S. A. and Hartmann, D. L.: The Seasonal Cycle of Low Stratiform Clouds, J. Climate, 6, 1587–1606, https://doi.org/10.1175/1520-0442(1993)006<1587:TSCOLS>2.0.CO;2, 1993.
Koch, D. and Del Genio, A. D.: Black carbon semi-direct effects on cloud cover: review and synthesis, Atmos. Chem. Phys., 10, 7685–7696, https://doi.org/10.5194/acp-10-7685-2010, 2010.
Lance, S., Brock, C. A., Rogers, D., and Gordon, J. A.: Water droplet calibration of the Cloud Droplet Probe (CDP) and in-flight performance in liquid, ice and mixed-phase clouds during ARCPAC, Atmos. Meas. Tech., 3, 1683–1706, https://doi.org/10.5194/amt-3-1683-2010, 2010.
LeBlanc, S. E., Segal-Rozenhaimer, M., Redemann, J., Flynn, C., Johnson, R. R., Dunagan, S. E., Dahlgren, R., Kim, J., Choi, M., da Silva, A., Castellanos, P., Tan, Q., Ziemba, L., Lee Thornhill, K., and Kacenelenbogen, M.: Airborne observations during KORUS-AQ show that aerosol optical depths are more spatially self-consistent than aerosol intensive properties, Atmos. Chem. Phys., 22, 11275–11304, https://doi.org/10.5194/acp-22-11275-2022, 2022.
Lenhardt, E. D., Gao, L., Redemann, J., Xu, F., Burton, S. P., Cairns, B., Chang, I., Ferrare, R. A., Hostetler, C. A., Saide, P. E., Howes, C., Shinozuka, Y., Stamnes, S., Kacarab, M., Dobracki, A., Wong, J., Freitag, S., and Nenes, A.: Use of lidar aerosol extinction and backscatter coefficients to estimate cloud condensation nuclei (CCN) concentrations in the southeast Atlantic, Atmos. Meas. Tech., 16, 2037–2054, https://doi.org/10.5194/amt-16-2037-2023, 2023.
Li, Z., Painemal, D., Feng, Y., and Zheng, X.: Advancing the quantification of aerosol-cloud interactions with the CALIPSO-CloudSat-Aqua/MODIS record, Atmos. Chem. Phys., 26, 7705–7720, https://doi.org/10.5194/acp-26-7705-2026, 2026.
Lihavainen, H., Kerminen, V.-M., and Remer, L. A.: Aerosol-cloud interaction determined by both in situ and satellite data over a northern high-latitude site, Atmos. Chem. Phys., 10, 10987–10995, https://doi.org/10.5194/acp-10-10987-2010, 2010.
Lohmann, U., Koren, I., and Kaufman, Y. J.: Disentangling the role of microphysical and dynamical effects in determining cloud properties over the Atlantic, Geophys. Res. Lett., 33, 2005GL024625, https://doi.org/10.1029/2005GL024625, 2006.
Ma, X., Jia, H., Yu, F., and Quaas, J.: Opposite Aerosol Index‐Cloud Droplet Effective Radius Correlations Over Major Industrial Regions and Their Adjacent Oceans, Geophys. Res. Lett., 45, 5771–5778, https://doi.org/10.1029/2018GL077562, 2018.
Malavelle, F. F., Haywood, J. M., Jones, A., Gettelman, A., Clarisse, L., Bauduin, S., Allan, R. P., Karset, I. H. H., Kristjánsson, J. E., Oreopoulos, L., Cho, N., Lee, D., Bellouin, N., Boucher, O., Grosvenor, D. P., Carslaw, K. S., Dhomse, S., Mann, G. W., Schmidt, A., Coe, H., Hartley, M. E., Dalvi, M., Hill, A. A., Johnson, B. T., Johnson, C. E., Knight, J. R., O'Connor, F. M., Partridge, D. G., Stier, P., Myhre, G., Platnick, S., Stephens, G. L., Takahashi, H., and Thordarson, T.: Strong constraints on aerosol–cloud interactions from volcanic eruptions, Nature, 546, 485–491, https://doi.org/10.1038/nature22974, 2017.
Matsui, T., Masunaga, H., Kreidenweis, S. M., Pielke, R. A., Tao, W., Chin, M., and Kaufman, Y. J.: Satellite‐based assessment of marine low cloud variability associated with aerosol, atmospheric stability, and the diurnal cycle, J. Geophys. Res., 111, 2005JD006097, https://doi.org/10.1029/2005JD006097, 2006.
Mauger, G. S. and Norris, J. R.: Meteorological bias in satellite estimates of aerosol‐cloud relationships, Geophys. Res. Lett., 34, 2007GL029952, https://doi.org/10.1029/2007GL029952, 2007.
McComiskey, A., Feingold, G., Frisch, A. S., Turner, D. D., Miller, M. A., Chiu, J. C., Min, Q., and Ogren, J. A.: An assessment of aerosol‐cloud interactions in marine stratus clouds based on surface remote sensing, J. Geophys. Res., 114, 2008JD011006, https://doi.org/10.1029/2008JD011006, 2009.
McCoy, D. T., Bender, F. A.-M., Mohrmann, J. K. C., Hartmann, D. L., Wood, R., and Grosvenor, D. P.: The global aerosol‐cloud first indirect effect estimated using MODIS, MERRA, and AeroCom, J. Geophys. Res.-Atmos., 122, 1779–1796, https://doi.org/10.1002/2016JD026141, 2017.
McFarquhar, G. M.: A New Representation of Collision-Induced Breakup of Raindrops and Its Implications for the Shapes of Raindrop Size Distributions, J. Atmos. Sci., 61, 777–794, https://doi.org/10.1175/1520-0469(2004)061<0777:ANROCB>2.0.CO;2, 2004.
Mellado, J. P.: Cloud-Top Entrainment in Stratocumulus Clouds, Annu. Rev. Fluid Mech., 49, 145–169, https://doi.org/10.1146/annurev-fluid-010816-060231, 2017.
Meyer, K., Platnick, S., Oreopoulos, L., and Lee, D.: Estimating the direct radiative effect of absorbing aerosols overlying marine boundary layer clouds in the southeast Atlantic using MODIS and CALIOP, J. Geophys. Res.-Atmos., 118, 4801–4815, https://doi.org/10.1002/jgrd.50449, 2013.
Meyer, K., Platnick, S., Arnold, G. T., Amarasinghe, N., Miller, D., Small-Griswold, J., Witte, M., Cairns, B., Gupta, S., McFarquhar, G., and O'Brien, J.: Evaluating spectral cloud effective radius retrievals from the Enhanced MODIS Airborne Simulator (eMAS) during ORACLES, Atmos. Meas. Tech., 18, 981–1011, https://doi.org/10.5194/amt-18-981-2025, 2025.
Milligan, G. W. and Cooper, M. C.: A study of standardization of variables in cluster analysis, J. Classif., 5, 181–204, https://doi.org/10.1007/BF01897163, 1988.
Min, Q., Joseph, E., Lin, Y., Min, L., Yin, B., Daum, P. H., Kleinman, L. I., Wang, J., and Lee, Y.-N.: Comparison of MODIS cloud microphysical properties with in-situ measurements over the Southeast Pacific, Atmos. Chem. Phys., 12, 11261–11273, https://doi.org/10.5194/acp-12-11261-2012, 2012.
Modini, R. L., Frossard, A. A., Ahlm, L., Russell, L. M., Corrigan, C. E., Roberts, G. C., Hawkins, L. N., Schroder, J. C., Bertram, A. K., Zhao, R., Lee, A. K. Y., Abbatt, J. P. D., Lin, J., Nenes, A., Wang, Z., Wonaschütz, A., Sorooshian, A., Noone, K. J., Jonsson, H., Seinfeld, J. H., Toom‐Sauntry, D., Macdonald, A. M., and Leaitch, W. R.: Primary marine aerosol‐cloud interactions off the coast of California, J. Geophys. Res.-Atmos., 120, 4282–4303, https://doi.org/10.1002/2014JD022963, 2015.
Murray-Watson, R. J. and Gryspeerdt, E.: Stability-dependent increases in liquid water with droplet number in the Arctic, Atmos. Chem. Phys., 22, 5743–5756, https://doi.org/10.5194/acp-22-5743-2022, 2022.
Myhre, G., Stordal, F., Johnsrud, M., Kaufman, Y. J., Rosenfeld, D., Storelvmo, T., Kristjansson, J. E., Berntsen, T. K., Myhre, A., and Isaksen, I. S. A.: Aerosol-cloud interaction inferred from MODIS satellite data and global aerosol models, Atmos. Chem. Phys., 7, 3081–3101, https://doi.org/10.5194/acp-7-3081-2007, 2007.
Nakajima, T. and King, M. D.: Determination of the Optical Thickness and Effective Particle Radius of Clouds from Reflected Solar Radiation Measurements. Part I: Theory, J. Atmos. Sci., 47, 1878–1893, https://doi.org/10.1175/1520-0469(1990)047<1878:DOTOTA>2.0.CO;2, 1990.
Oh, D., Noh, Y., and Hoffmann, F.: Paths From Aerosol Particles to Activation and Cloud Droplets in Shallow Cumulus Clouds: The Roles of Entrainment and Supersaturation Fluctuations, J. Geophys. Res.-Atmos., 128, e2022JD038450, https://doi.org/10.1029/2022JD038450, 2023.
ORACLES Science Team: Suite of Aerosol, Cloud, and Related Data Acquired Aboard P3 During ORACLES 2016, Version 3, NASA Ames Earth Science Project Office (ESPO) [data set], https://doi.org/10.5067/Suborbital/ORACLES/P3/2016_V3, 2021a.
ORACLES Science Team: Suite of Aerosol, Cloud, and Related Data Acquired Aboard ER2 During ORACLES 2016, Version 3, NASA Ames Earth Science Project Office (ESPO) [data set], https://doi.org/10.5067/Suborbital/ORACLES/ER2/2016_V3, 2021b.
ORACLES Science Team: Suite of Aerosol, Cloud, and Related Data Acquired Aboard P3 During ORACLES 2017, Version 3, NASA Ames Earth Science Project Office (ESPO) [data set], https://doi.org/10.5067/Suborbital/ORACLES/P3/2017_V3, 2021c.
ORACLES Science Team: Suite of Aerosol, Cloud, and Related Data Acquired Aboard P3 During ORACLES 2018, Version 3, NASA Ames Earth Science Project Office (ESPO) [data set], https://doi.org/10.5067/Suborbital/ORACLES/P3/2018_V3, 2021d.
Painemal, D. and Zuidema, P.: Microphysical variability in southeast Pacific Stratocumulus clouds: synoptic conditions and radiative response, Atmos. Chem. Phys., 10, 6255–6269, https://doi.org/10.5194/acp-10-6255-2010, 2010.
Painemal, D. and Zuidema, P.: Assessment of MODIS cloud effective radius and optical thickness retrievals over the Southeast Pacific with VOCALS-REx in situ measurements: MODIS VALIDATION DURING VOCALS-REx, J. Geophys. Res., 116, https://doi.org/10.1029/2011JD016155, 2011.
Painemal, D., Kato, S., and Minnis, P.: Boundary layer regulation in the southeast Atlantic cloud microphysics during the biomass burning season as seen by the A-train satellite constellation, J. Geophys. Res.-Atmos., 119, https://doi.org/10.1002/2014JD022182, 2014.
Painemal, D., Chang, F.-L., Ferrare, R., Burton, S., Li, Z., Smith Jr., W. L., Minnis, P., Feng, Y., and Clayton, M.: Reducing uncertainties in satellite estimates of aerosol–cloud interactions over the subtropical ocean by integrating vertically resolved aerosol observations, Atmos. Chem. Phys., 20, 7167–7177, https://doi.org/10.5194/acp-20-7167-2020, 2020.
Painemal, D., Spangenberg, D., Smith Jr., W. L., Minnis, P., Cairns, B., Moore, R. H., Crosbie, E., Robinson, C., Thornhill, K. L., Winstead, E. L., and Ziemba, L.: Evaluation of satellite retrievals of liquid clouds from the GOES-13 imager and MODIS over the midlatitude North Atlantic during the NAAMES campaign, Atmos. Meas. Tech., 14, 6633–6646, https://doi.org/10.5194/amt-14-6633-2021, 2021.
Painemal, D., Smith, W. L., Gupta, S., Moore, R., Cairns, B., McFarquhar, G. M., and O'Brien, J.: Can We Rely on Satellite Visible/Infrared Microphysical Retrievals of Boundary Layer Clouds in Partially Cloudy Scenes? Implications for Climate Research, Geophys. Res. Lett., 52, e2024GL113825, https://doi.org/10.1029/2024GL113825, 2025.
Pan, Z., Mao, F., Wang, W., Logan, T., and Hong, J.: Examining Intrinsic Aerosol‐Cloud Interactions in South Asia Through Multiple Satellite Observations, J. Geophys. Res.-Atmos., 123, https://doi.org/10.1029/2017JD028232, 2018.
Perkins, R. J., Marinescu, P. J., Levin, E. J. T., Collins, D. R., and Kreidenweis, S. M.: Long- and short-term temporal variability in cloud condensation nuclei spectra over a wide supersaturation range in the Southern Great Plains site, Atmos. Chem. Phys., 22, 6197–6215, https://doi.org/10.5194/acp-22-6197-2022, 2022.
Rajapakshe, C., Zhang, Z., Yorks, J. E., Yu, H., Tan, Q., Meyer, K., Platnick, S., and Winker, D. M.: Seasonally transported aerosol layers over southeast Atlantic are closer to underlying clouds than previously reported, Geophys. Res. Lett., 44, 5818–5825, https://doi.org/10.1002/2017GL073559, 2017.
Redemann, J. and Gao, L.: A machine learning paradigm for necessary observations to reduce uncertainties in aerosol climate forcing, Nat. Commun., 15, 8343, https://doi.org/10.1038/s41467-024-52747-y, 2024.
Redemann, J., Zhang, Q., Schmid, B., Russell, P. B., Livingston, J. M., Jonsson, H., and Remer, L. A.: Assessment of MODIS‐derived visible and near‐IR aerosol optical properties and their spatial variability in the presence of mineral dust, Geophys. Res. Lett., 33, 2006GL026626, https://doi.org/10.1029/2006GL026626, 2006.
Redemann, J., Wood, R., Zuidema, P., Doherty, S. J., Luna, B., LeBlanc, S. E., Diamond, M. S., Shinozuka, Y., Chang, I. Y., Ueyama, R., Pfister, L., Ryoo, J.-M., Dobracki, A. N., da Silva, A. M., Longo, K. M., Kacenelenbogen, M. S., Flynn, C. J., Pistone, K., Knox, N. M., Piketh, S. J., Haywood, J. M., Formenti, P., Mallet, M., Stier, P., Ackerman, A. S., Bauer, S. E., Fridlind, A. M., Carmichael, G. R., Saide, P. E., Ferrada, G. A., Howell, S. G., Freitag, S., Cairns, B., Holben, B. N., Knobelspiesse, K. D., Tanelli, S., L'Ecuyer, T. S., Dzambo, A. M., Sy, O. O., McFarquhar, G. M., Poellot, M. R., Gupta, S., O'Brien, J. R., Nenes, A., Kacarab, M., Wong, J. P. S., Small-Griswold, J. D., Thornhill, K. L., Noone, D., Podolske, J. R., Schmidt, K. S., Pilewskie, P., Chen, H., Cochrane, S. P., Sedlacek, A. J., Lang, T. J., Stith, E., Segal-Rozenhaimer, M., Ferrare, R. A., Burton, S. P., Hostetler, C. A., Diner, D. J., Seidel, F. C., Platnick, S. E., Myers, J. S., Meyer, K. G., Spangenberg, D. A., Maring, H., and Gao, L.: An overview of the ORACLES (ObseRvations of Aerosols above CLouds and their intEractionS) project: aerosol–cloud–radiation interactions in the southeast Atlantic basin, Atmos. Chem. Phys., 21, 1507–1563, https://doi.org/10.5194/acp-21-1507-2021, 2021.
Roberts, G. C. and Nenes, A.: A Continuous-Flow Streamwise Thermal-Gradient CCN Chamber for Atmospheric Measurements, Aerosol Sci. Tech., 39, 206–221, https://doi.org/10.1080/027868290913988, 2005.
Roebeling, R. A., Placidi, S., Donovan, D. P., Russchenberg, H. W. J., and Feijt, A. J.: Validation of liquid cloud property retrievals from SEVIRI using ground‐based observations, Geophys. Res. Lett., 35, 2007GL032115, https://doi.org/10.1029/2007GL032115, 2008.
Rose, D., Gunthe, S. S., Mikhailov, E., Frank, G. P., Dusek, U., Andreae, M. O., and Pöschl, U.: Calibration and measurement uncertainties of a continuous-flow cloud condensation nuclei counter (DMT-CCNC): CCN activation of ammonium sulfate and sodium chloride aerosol particles in theory and experiment, Atmos. Chem. Phys., 8, 1153–1179, https://doi.org/10.5194/acp-8-1153-2008, 2008.
Rosenfeld, D.: Aerosol-Cloud Interactions Control of Earth Radiation and Latent Heat Release Budgets, Space Sci. Rev., 125, 149–157, https://doi.org/10.1007/s11214-006-9053-6, 2006.
Rosenfeld, D., Andreae, M. O., Asmi, A., Chin, M., De Leeuw, G., Donovan, D. P., Kahn, R., Kinne, S., Kivekäs, N., Kulmala, M., Lau, W., Schmidt, K. S., Suni, T., Wagner, T., Wild, M., and Quaas, J.: Global observations of aerosol-cloud-precipitation-climate interactions: Aerosol-cloud-climate interactions, Rev. Geophys., 52, 750–808, https://doi.org/10.1002/2013RG000441, 2014.
Ross, K. E., Piketh, S. J., Bruintjes, R. T., Burger, R. P., Swap, R. J., and Annegarn, H. J.: Spatial and seasonal variations in CCN distribution and the aerosol-CCN relationship over southern Africa, J. Geophys. Res., 108, https://doi.org/10.1029/2002JD002384, 2003.
Ryoo, J.-M., Pfister, L., Ueyama, R., Zuidema, P., Wood, R., Chang, I., and Redemann, J.: A meteorological overview of the ORACLES (ObseRvations of Aerosols above CLouds and their intEractionS) campaign over the southeastern Atlantic during 2016–2018: Part 1 – Climatology, Atmos. Chem. Phys., 21, 16689–16707, https://doi.org/10.5194/acp-21-16689-2021, 2021.
Saleeby, S. M. and Cotton, W. R.: A Large-Droplet Mode and Prognostic Number Concentration of Cloud Droplets in the Colorado State University Regional Atmospheric Modeling System (RAMS). Part II: Sensitivity to a Colorado Winter Snowfall Event, J. Appl. Meteorol., 44, 1912–1929, https://doi.org/10.1175/JAM2312.1, 2005.
Seinfeld, J. H., Bretherton, C., Carslaw, K. S., Coe, H., DeMott, P. J., Dunlea, E. J., Feingold, G., Ghan, S., Guenther, A. B., Kahn, R., Kraucunas, I., Kreidenweis, S. M., Molina, M. J., Nenes, A., Penner, J. E., Prather, K. A., Ramanathan, V., Ramaswamy, V., Rasch, P. J., Ravishankara, A. R., Rosenfeld, D., Stephens, G., and Wood, R.: Improving our fundamental understanding of the role of aerosol-cloud interactions in the climate system, P. Natl. Acad. Sci. USA, 113, 5781–5790, https://doi.org/10.1073/pnas.1514043113, 2016.
Shinozuka, Y. and Redemann, J.: Horizontal variability of aerosol optical depth observed during the ARCTAS airborne experiment, Atmos. Chem. Phys., 11, 8489–8495, https://doi.org/10.5194/acp-11-8489-2011, 2011.
Shinozuka, Y., Clarke, A. D., Nenes, A., Jefferson, A., Wood, R., McNaughton, C. S., Ström, J., Tunved, P., Redemann, J., Thornhill, K. L., Moore, R. H., Lathem, T. L., Lin, J. J., and Yoon, Y. J.: The relationship between cloud condensation nuclei (CCN) concentration and light extinction of dried particles: indications of underlying aerosol processes and implications for satellite-based CCN estimates, Atmos. Chem. Phys., 15, 7585–7604, https://doi.org/10.5194/acp-15-7585-2015, 2015.
Sorooshian, A., Feingold, G., Lebsock, M. D., Jiang, H., and Stephens, G. L.: On the precipitation susceptibility of clouds to aerosol perturbations, Geophys. Res. Lett., 36, 2009GL038993, https://doi.org/10.1029/2009GL038993, 2009.
Sterzinger, L. J. and Igel, A. L.: Above-cloud concentrations of cloud condensation nuclei help to sustain some Arctic low-level clouds, Atmos. Chem. Phys., 24, 3529–3540, https://doi.org/10.5194/acp-24-3529-2024, 2024.
Stevens, B. and Feingold, G.: Untangling aerosol effects on clouds and precipitation in a buffered system, Nature, 461, 607–613, https://doi.org/10.1038/nature08281, 2009.
Stier, P.: Limitations of passive remote sensing to constrain global cloud condensation nuclei, Atmos. Chem. Phys., 16, 6595–6607, https://doi.org/10.5194/acp-16-6595-2016, 2016.
Sun, J., Leighton, H., Yau, M. K., and Ariya, P.: Numerical evidence for cloud droplet nucleation at the cloud-environment interface, Atmos. Chem. Phys., 12, 12155–12164, https://doi.org/10.5194/acp-12-12155-2012, 2012.
Tang, J., Wang, P., Mickley, L. J., Xia, X., Liao, H., Yue, X., Sun, L., and Xia, J.: Positive relationship between liquid cloud droplet effective radius and aerosol optical depth over Eastern China from satellite data, Atmos. Environ., 84, 244–253, https://doi.org/10.1016/j.atmosenv.2013.08.024, 2014.
Twohy, C. H., Petters, M. D., Snider, J. R., Stevens, B., Tahnk, W., Wetzel, M., Russell, L., and Burnet, F.: Evaluation of the aerosol indirect effect in marine stratocumulus clouds: Droplet number, size, liquid water path, and radiative impact, J. Geophys. Res., 110, 2004JD005116, https://doi.org/10.1029/2004JD005116, 2005.
Twomey, S.: Pollution and the planetary albedo, Atmos. Environ. (1967), 8, 1251–1256, https://doi.org/10.1016/0004-6981(74)90004-3, 1974.
Várnai, T. and Marshak, A.: MODIS observations of enhanced clear sky reflectance near clouds, Geophys. Res. Lett., 36, 2008GL037089, https://doi.org/10.1029/2008GL037089, 2009.
Varnai, T. and Marshak, A.: Global CALIPSO Observations of Aerosol Changes Near Clouds, IEEE Geosci. Remote S., 8, 19–23, https://doi.org/10.1109/LGRS.2010.2049982, 2011.
Várnai, T. and Marshak, A.: Analysis of co-located MODIS and CALIPSO observations near clouds, Atmos. Meas. Tech., 5, 389–396, https://doi.org/10.5194/amt-5-389-2012, 2012.
Wang, D., Yang, C. A., and Diao, M.: Validation of Satellite‐Based Cloud Phase Distributions Using Global-Scale In Situ Airborne Observations, Earth and Space Science, 11, e2023EA003355, https://doi.org/10.1029/2023EA003355, 2024.
Warren, S., Hahn, C., London, J., Chervin, R., and Jenne, R.: Global Distribution of Total Cloud Cover and Cloud Type Amounts Over the Ocean, NSF National Center for Atmospheric Research, https://doi.org/10.5065/D6QC01D1, 1988.
Wehr, T., Kubota, T., Tzeremes, G., Wallace, K., Nakatsuka, H., Ohno, Y., Koopman, R., Rusli, S., Kikuchi, M., Eisinger, M., Tanaka, T., Taga, M., Deghaye, P., Tomita, E., and Bernaerts, D.: The EarthCARE mission – science and system overview, Atmos. Meas. Tech., 16, 3581–3608, https://doi.org/10.5194/amt-16-3581-2023, 2023.
Wood, R.: Relationships between optical depth, liquid water path, droplet concentration, and effective radius in adiabatic layer cloud, University of Washington, https://atmos.uw.edu/~robwood/papers/chilean_plume/optical_depth_relations.pdf (last access: 20 January 2026), 2006.
Wood, R.: Stratocumulus Clouds, Monthly Weather Review, 140, 2373–2423, https://doi.org/10.1175/MWR-D-11-00121.1, 2012.
Wood, R. and Bretherton, C. S.: On the Relationship between Stratiform Low Cloud Cover and Lower-Tropospheric Stability, J. Climate, 19, 6425–6432, https://doi.org/10.1175/JCLI3988.1, 2006.
Yin, Y., Levin, Z., Reisin, T. G., and Tzivion, S.: The effects of giant cloud condensation nuclei on the development of precipitation in convective clouds – a numerical study, Atmos. Res., 53, 91–116, https://doi.org/10.1016/S0169-8095(99)00046-0, 2000.
Zhang, S., Wang, M., Ghan, S. J., Ding, A., Wang, H., Zhang, K., Neubauer, D., Lohmann, U., Ferrachat, S., Takeamura, T., Gettelman, A., Morrison, H., Lee, Y., Shindell, D. T., Partridge, D. G., Stier, P., Kipling, Z., and Fu, C.: On the characteristics of aerosol indirect effect based on dynamic regimes in global climate models, Atmos. Chem. Phys., 16, 2765–2783, https://doi.org/10.5194/acp-16-2765-2016, 2016.
Zhao, J., Ma, X., Quaas, J., and Yang, T.: How meteorological conditions influence aerosol-cloud interactions under different pollution regimes, Atmos. Chem. Phys., 25, 17701–17723, https://doi.org/10.5194/acp-25-17701-2025, 2025.
Zheng, X., Dong, X., Xi, B., Logan, T., and Wang, Y.: Distinctive aerosol–cloud–precipitation interactions in marine boundary layer clouds from the ACE-ENA and SOCRATES aircraft field campaigns, Atmos. Chem. Phys., 24, 10323–10347, https://doi.org/10.5194/acp-24-10323-2024, 2024.
Zuidema, P., Redemann, J., Haywood, J., Wood, R., Piketh, S., Hipondoka, M., and Formenti, P.: Smoke and Clouds above the Southeast Atlantic: Upcoming Field Campaigns Probe Absorbing Aerosol's Impact on Climate, B. Am. Meteorol. Soc., 97, 1131–1135, https://doi.org/10.1175/BAMS-D-15-00082.1, 2016.