
the Creative Commons Attribution 4.0 License.
the Creative Commons Attribution 4.0 License.
 | 18 Aug 2026
Characteristics of tropical clouds with strong updrafts revealed by Doppler-velocity measurements from EarthCARE/CPR

Kentaroh Suzuki
Maki Kikuchi
Shunsuke Aoki
Takuji Kubota
Updrafts within clouds are important for the climate system, yet global assessments have relied on indirect proxies. EarthCARE's 94 GHz Cloud Profiling Radar (CPR) provides the first global spaceborne Doppler velocity (Vd) profiles of clouds, enabling observational constraints on convective vertical motions, while intense convective cores can be affected by velocity folding. To evaluate how EarthCARE/CPR Doppler-velocity measurements offer more direct insight into convective intensity relative to conventional convective-intensity proxies, we analyze tropical CPR cloud-property products and extract convectively driven columns. We define MaxVd as the maximum upward Vd within the subfreezing portion of each non-folded column. Non-folded columns with MaxVd>2.0 m s−1 are classified as measurable strong-updraft (SU) columns, whereas folded columns are treated separately as extreme-updraft (EU) candidates. SU and EU columns account for 4.88 % and 7.42 % of the Doppler-classifiable convective sample, respectively. Both categories exhibit systematically higher echo-top heights at 0 and 10 dBZ. Their occurrence depends strongly on the separation between the cloud top and the 0 dBZ echo top, with a small separation robustly identifying both categories, even in relatively low-topped systems. Spatiotemporally, SU occurrence varies moderately, whereas EU occurrence is especially high over land at the 14:00 local-time overpass. These results show that MaxVd-based SU statistics and folding-based EU statistics capture different parts of the convective spectrum: measurable upward hydrometeor motion and likely more extreme convection, respectively. The combined constraints from Doppler-derived updraft intensity and radar-echo structure offer a process-oriented benchmark for evaluating convective dynamics-microphysics coupling in numerical models.
- Article
(3435 KB) - Full-text XML
-
Supplement
(571 KB) - BibTeX
- EndNote


Updrafts within tropical deep clouds promote the activation and condensational growth of cloud droplets and the formation of precipitation particles, thereby exerting strong control over the timing, amount, and intensity of rainfall. The strength of these updrafts also contributes to the maximum height reached by convective clouds and the horizontal extent of their anvils. Within the Earth's climate system, convective updrafts therefore constitute a key dynamical element. Through the rapid ascent of moist air and the associated release of latent heat, they drive large-scale overturning circulations such as the Hadley and Walker cells and contribute to meridional energy transport from the tropics to the midlatitudes (Manabe et al., 1965; Tiedtke, 1989; Bechtold et al., 2001). Vigorous updrafts shape the spatial distribution of rainfall and the occurrence of extreme precipitation events. In addition, the heights and lifetimes of deep clouds, which are affected by updrafts, exert a strong influence on the planetary energy budget (Ramanathan et al., 1989; Hartmann et al., 2001). Updrafts are also crucial in the context of global warming projections: the representation of convective mixing and mass flux in global models affects simulated climate sensitivity and helps explain the spread in equilibrium climate sensitivity across models (Zhao, 2014; Sherwood et al., 2014).
Despite this central role, direct observations of updraft vertical velocity (w) in tropical deep clouds remain sparse, limiting our ability to evaluate and improve its representation in atmospheric models. Surface-based and airborne radars have provided invaluable snapshots of hydrometeor Doppler velocities, from which air vertical velocity w can be inferred with assumptions (Heymsfield et al., 2010; Collis et al., 2013; Giangrande et al., 2016; Schiro and Neelin, 2018; Schumacher et al., 2015), but these measurements are episodic, geographically restricted, and heavily concentrated over land. Consequently, global model evaluation still relies primarily on bulk fields and rainfall statistics rather than on the convective processes themselves (Maloney et al., 2019). General circulation models that employ cumulus parameterizations exhibit several persistent, systematic biases, including the double-ITCZ bias and excessively early diurnal peaks in precipitation amount and frequency. These deficiencies point to structural shortcomings in current parameterizations and motivate a fundamental reassessment (Christopoulos and Schneider, 2021; Tian and Dong, 2020). Even at cloud-resolving scales, state-of-the-art numerical models struggle to reproduce the observed statistics and vertical structure of w and its interaction with cloud microphysics. Recent intercomparisons of global km-scale models reveal substantial spread in the magnitude of updrafts: the fraction of columns in which the maximum vertical velocity exceeds 10–20 m s−1 can differ by more than an order of magnitude across models, and simulated regional patterns of convective strength vary widely (Abbott et al., 2025). Takahashi et al. (2025) similarly demonstrated that global km-scale simulations fail to adequately represent the regional variability of convective intensity and exhibit an unrealistic relationship between updrafts and precipitation formation processes. Together, these discrepancies underscore a critical need for global, observation-based constraints on w to calibrate both parameterized convection in general circulation models (GCMs) and explicitly simulated convection in global km-scale models.
Spaceborne measurements have helped address the lack of comprehensive observations of w for model evaluation by providing systematic, globally distributed samples of deep cloud systems. However, because most satellite instruments cannot directly observe vertical motion, satellite-based studies have relied on proxy diagnostics for convective intensity. For instance, infrared imagers use 11–12 µm brightness temperatures to track overshooting tops and to document the diurnal cycle of cloud-top extent (Bedka et al., 2010; Yang and Slingo, 2001). Attempts have been made to infer cloud-top vertical velocities from the temporal evolution of cloud-top temperature; however, methodological uncertainties and a focus on developing clouds have so far prevented these approaches from yielding a comprehensive, global-scale picture across cloud regimes (Adler and Fenn, 1979; Luo et al., 2014; Hamada and Takayabu, 2016). Passive microwave radiometers exploit scattering and absorption at approximately 89 and 166–183 GHz to infer convective intensity (Mohr and Zipser, 1996; Skofronick-Jackson et al., 2017). Other studies use lightning flash rates – which are closely linked to the collision rates of ice particles in strong updrafts – as indicators of the most vigorous convection (Albrecht et al., 2016; Christian et al., 2003; Williams and Stanfill, 2002; Deierling and Petersen, 2008; Cecil et al., 2005). The Tropical Rainfall Measuring Mission (TRMM; 1997–2015) and its successor, the Global Precipitation Measurement (GPM; 2014–present) mission, have provided unprecedented global views of precipitation using spaceborne precipitation radars (Kummerow et al., 1998; Iguchi et al., 2000; Hou et al., 2014; Skofronick-Jackson et al., 2017). From these observations, researchers have developed widely used proxies for convective intensity. One common proxy is the echo-top height (ETH), defined as the highest altitude at which a specified reflectivity threshold (e.g., 20, 30, or 40 dBZ) is detected. ETH is interpreted as the altitude reached by large, precipitating hydrometeors (Zipser et al., 2006; Liu and Zipser, 2005; Romatschke et al., 2010). Collectively, these proxy-based studies have revealed robust climatological features, including enhanced convective intensity over land compared with the ocean (Houze et al., 2015; Williams et al., 2005; Liu and Zipser, 2008; Zipser et al., 2006).
The A-Train constellation further advanced vertical profiling through CloudSat's 94 GHz Cloud Profiling Radar (CPR), which is sensitive to clouds and light-to-moderate precipitation and resolves the vertical structure of clouds with horizontal footprint of approximately 1 km and vertical sampling of 240 m, respectively (Stephens et al., 2002; Tanelli et al., 2008; Stephens et al., 2008). Compared with the TRMM (13.8 GHz) and GPM (13.6 and 35.55 GHz) precipitation radars, CPR has higher sensitivity, detecting clouds with reflectivity as low as about −28 dBZ (Stephens et al., 2008), and its smaller horizontal footprint provides more detailed information on convective cloud structure. Several proxy metrics for convective intensity based on CPR profiles have been proposed. One class of metrics uses cloud-top height (CTH) and echo-top height (ETH) at thresholds of 0 or 10 dBZ. Stronger updrafts are expected to loft larger hydrometeors to higher levels and therefore result in greater ETH (Luo et al., 2011; Takahashi and Luo, 2014). Another class uses the separation between CTH and ETH at 0 or 10 dBZ: when both small and large particles are carried to similarly high levels, CTH and ETH converge (Luo et al., 2008, 2011; Takahashi and Luo, 2014). Regional composites of these proxies reaffirm geographic variations in convective intensity and relate them to environmental controls. For example, Takahashi et al. (2023) demonstrated a strong land–ocean contrast, with hotspots over equatorial Africa and the Amazon, whereas convection over the Maritime Continent is comparatively weaker. Another diagnostic, the cloud center of gravity (COG), defined as the reflectivity-weighted mean height of the cloud within a column, has also been used to characterize convective structure (Koren et al., 2009). COG is especially high over the tropical West African Basin and the Congo Basin (Pilewskie and L'Ecuyer, 2022).
Although many previous studies have sought to characterize convective updraft intensity at the global scale, two major limitations remain. First, a fundamental shortcoming of these approaches is that they do not directly measure vertical motion. Proxy indicators do not have a simple or universal correspondence with w, and their relationships vary across different dynamical regimes (Takahashi and Luo, 2014; Liu et al., 2007). Consequently, even with extensive satellite archives, direct, observation-based constraints on w at the global scale have remained out of reach. Second, most proxy-based climatologies are designed to preferentially sample specific types of clouds. The precipitation radars aboard TRMM and GPM primarily detect fully developed, tall convective systems with strong radar echoes because, owing to their relatively low sensitivity, they must rely on high reflectivity thresholds (20–30 dBZ). These thresholds are intrinsically insensitive to weaker hydrometeor populations. Lightning-based metrics emphasize only the most strongly electrified convective cores, while infrared-based ascent-rate approaches focus exclusively on rapidly developing cloud tops. Even studies using CloudSat, which is capable of detecting weak echoes, have often concentrated on tall, well-developed clouds, partly because only a limited set of observable parameters – essentially radar reflectivity – can be robustly analyzed. Consequently, the resulting “intensity” maps that have guided our understanding of convection primarily reflect the upper tail of convective vigor and under-represent relatively low-topped or weak-echo clouds, as well as life-cycle stages outside peak development (Takahashi and Luo, 2014; Hamada et al., 2015; Xu et al., 2022).
A decisive advance has become possible with the Earth Cloud, Aerosol and Radiation Explorer (EarthCARE), a joint mission of ESA and JAXA launched in May 2024. EarthCARE carries a 94 GHz Doppler Cloud Profiling Radar (CPR), together with a high-spectral-resolution lidar, a multispectral imager, and broadband radiometers (Illingworth et al., 2015; Wehr et al., 2023). Crucially, the EarthCARE CPR provides nadir profiles of both radar reflectivity and Doppler velocity (Vd), enabling the first direct measurements of vertical motions within clouds at the global scale. The high sensitivity of EarthCARE's 94 GHz radar allows the detection of relatively weak clouds within convective cloud systems, thereby providing information across a broader range of convective structures than high-reflectivity precipitation-radar proxies. EarthCARE is therefore well suited for evaluating vertical motions across a broad range of convective clouds (Illingworth et al., 2015). This capability opens a new route for constraining convective vertical motions, but it also requires careful interpretation. The CPR Nyquist velocity is only about ± 5–6 m s−1, so the most intense convective cores can be affected by velocity folding, which limits reliable quantitative interpretation of Vd.
Building on this novel capability with explicit consideration of its limitations, this study presents the first global-scale characterization of convective vertical-motion signatures in tropical deep convective clouds based on Doppler-velocity measurements from the EarthCARE CPR. The primary objectives are threefold: (1) to develop a method for identifying intense convective columns using quality-controlled Vd measurements, distinguishing non-folded measurable strong-updraft (SU) columns from folded columns treated as extreme-updraft (EU) candidates; (2) to investigate how the occurrence of SU and EU columns relates to the vertical structure of radar reflectivity, thereby probing links between cloud dynamics and microphysical processes and comparing these relationships with those inferred from legacy satellite proxies; and (3) to map the global distributions of the SU and EU-candidate columns and examine their dependence on variations in cloud morphological properties. Section 2 describes the EarthCARE CPR data and analysis methodology used in this study, Sect. 3 presents the results, and Sect. 4 summarizes the findings and discusses their implications.
2.1 Datasets
We use measurements from the Cloud Profiling Radar (CPR) aboard the EarthCARE satellite. EarthCARE flies in a sun-synchronous, near-polar orbit (inclination 97.05°) with nominal local equator-crossing times near 02:00 local time (ascending) and 14:00 local time (descending) (Wehr et al., 2023). The 94 GHz CPR provides nadir profiles of radar reflectivity and Doppler radial velocity. Its intrinsic vertical resolution is 500 m, while the profiles are sampled every 100 m in the vertical. The instantaneous, beam-limited horizontal footprint is approximately 750 m at nadir, with profiles sampled at about 500 m intervals along track.
The variables used in this analysis are taken from the standard CPR one-sensor cloud property product (CPR_CLP, version Bb; JAXA, 2025a), specifically the cloud mask, radar reflectivity factor (Ref), Doppler velocity (Vd), and air temperature. These data have a horizontal resolution of 1 km and a vertical sampling of 100 m. In CPR_CLP, the Level-1B received echo power and Vd values are remapped onto the same grid as the cloud mask. Second-trip echoes (mirror images) are screened following Battaglia (2021), as implemented by Aoki et al. (2026). The cloud mask is derived using noise screening, echo-continuity tests, and surface-echo diagnostics (Sato et al., 2025). Air temperature is provided by a JAXA auxiliary product that interpolates temperatures from ECMWF forecasts (Eisinger et al., 2024) to the EarthCARE Level-2 grid (JAXA, 2025b). In this study, positive (negative) Vd denotes upward (downward) motion.
2.2 Column selection criteria
We exploit EarthCARE's Doppler capability to analyze Vd in clouds for radar echoes exceeding the reflectivity threshold of −19 dBZ, which includes clouds that would not be detected by precipitation-radar echo-top proxies. We focus on the tropical region (30° S–30° N) for the period from January to December 2025. Data collected prior to early December 2024 are discarded to avoid known noise in Vd within weaker echoes associated with operation of a redundant side of the signal processing unit in the CPR instrument (JAXA, 2025c), thereby ensuring data quality. Because Doppler-based diagnostics are restricted to range gates with temperatures below 273.15 K (as discussed in Sect. 2.3), we retain only columns that contain a substantial cold portion. To focus on convectively driven clouds, we extract columns that satisfy all of the following conditions:
-
Single-layer cloud. Using the cloud mask, a gate is regarded as “cloudy” when the cloud-mask value is ≥ 20 (weak echo). All gates between the highest and lowest cloudy gates must be classified as cloudy.
-
Thermodynamic bounds. The cloud-top temperature (CTT) is < 258.15 K, and the cloud-base temperature is > 273.15 K.
-
Geometrical thickness. The difference between cloud-top height and cloud-base height exceeds 5 km.
-
Reflectivity strength. The column-maximum Ref exceeds 0 dBZ.
2.3 Doppler-velocity quality control
CPR Doppler-velocity measurements are affected by several sources of error: random noise arising from reduced correlation between successive pulses caused by the rapid motion of the satellite platform (ϵ_random; Doviak and Zrnić, 2014; Hagihara et al., 2023); pointing uncertainty due to satellite attitude perturbations and antenna thermal distortion (ϵ_pointing; Tanelli et al., 2005); multiple scattering (ϵ_MS; Battaglia et al., 2011); non-uniform beam-filling effects (ϵ_NUBF; Kollias et al., 2014); and velocity aliasing beyond the Nyquist limit (ϵ_Nyquist; Sy et al., 2014).
To correct for ϵ_pointing, a bias correction is applied based on the assumption that the Vd averaged horizontally over 100 km at the surface is zero (Aoki et al., 2026; JAXA, 2026). We note that surface Vd values over heterogeneous land can be affected by surface type and orography, and this approach may not fully remove the bias over land (Puigdomènech Treserras et al., 2025). To limit ϵ_random, which are large in weak-reflectivity regions, we retain only gates that simultaneously satisfy a cloud-mask value ≥ 20 and Ref ≥ −19 dBZ. This threshold is used as a quality-control criterion to exclude low-SNR Doppler estimates with large random uncertainty, following the reflectivity-dependent Doppler-error assessment of Hagihara et al. (2023), and should not be interpreted as a physical boundary between cloud regimes. Residual ϵ_NUBF may remain in convective cores with strong along-track reflectivity gradients, because we avoid applying a gradient-based filter that would remove a large fraction of convective scenes. To mitigate ϵ_MS, we follow Battaglia et al. (2011) and exclude range gates for which the cumulative reflectivity from the top of the atmosphere down to that gate exceeds a prescribed threshold. This MS screen is applied at the range-gate level rather than a rejection of the entire profile; therefore, MS-free subfreezing gates that remain in the same column are retained for Doppler-velocity statistics. This MS screen removes 1.9 % of the otherwise valid subfreezing gates. The CPR Nyquist (folding) velocity is approximately ± 5–6 m s−1; therefore, large downward (negative) velocities associated with the sedimentation of large particles can be aliased, especially at temperatures above 273.15 K. For this reason, all Doppler-based diagnostics are restricted to subfreezing gates (i.e., temperatures below 273.15 K).
To further reduce ϵ_random before identifying updraft signatures, we average Vd in pulse-pair covariance space. After applying the Doppler-velocity quality-control filters described above, we construct two averaged Vd fields for different purposes. First, to detect velocity folding, Vd is averaged over a 3 km along-track window while retaining the native 100 m vertical sampling. This 3 km × 100 m field is used because fold-like signatures appear as sharp vertical discontinuities and can be weakened if additional vertical smoothing is applied. Second, to define the column-maximum Vd, MaxVd, Vd is averaged over the same 3 km along-track window and over two vertical gates, corresponding to 200 m in the vertical. This 3 km × 200 m field is used to reduce random errors and small-scale turbulent variability before extracting MaxVd.
For both averaged fields, the averaging is performed in pulse-pair covariance space rather than directly in velocity space. For each valid gate, the observed Doppler velocity Vd is converted to a phase using the local Nyquist velocity Vnyq. We then compute reflectivity-weighted real and imaginary components as,
where Z is linear radar reflectivity. The real and imaginary components are summed over the averaging window, and the averaged Doppler velocity is recovered as
This procedure avoids artificial cancellation and wrap-around artifacts that can occur when velocities close to the Nyquist limit are averaged directly in velocity space. We require all gates in an averaging window to satisfy the cloud-mask, reflectivity, temperature, and multiple-scattering filters; if even one gate in the window fails any of these filters, the averaged value for that window is discarded and is not used in subsequent statistics.
We tested horizontal averaging windows of 1, 3, 5, and 10 km and vertical averaging windows of 100–500 m. For horizontal windows of 1, 3, 5, and 10 km, the folded-column fractions were 14.5 %, 6.4 %, 4.2 %, and 2.2 %, respectively. The MaxVd distribution for the 1 km case retained a noisy tail near the Nyquist limit, whereas the 10 km case excessively suppressed the MaxVd tail (Fig. S1 in the Supplement). Sensitivity tests for the vertical averaging scale showed that increasing the vertical window from 100 to 500 m progressively reduced the occurrence of large MaxVd values, while the 200 m case retained the main positive tail more effectively than cases with stronger vertical smoothing (Fig. S2). Based on these sensitivity analyses, we use a 3 km horizontal and 200 m vertical averaging window as a compromise between reducing Doppler-velocity random error and retaining coherent convective structures on the scale of deep-convective updraft cores (Kollias et al., 2022; Galfione et al., 2025).
2.4 Updraft-signature column classification
Using the filtered and pulse-pair-averaged Doppler-velocity fields described in Sect. 2.3, we classify selected convective columns into three categories: non-strong-updraft (NonSU) columns, MaxVd-based strong-updraft (SU) columns, and columns affected by Doppler-velocity folding, which are treated as extreme-updraft (EU) candidates. For brevity, these columns affected by Doppler-velocity folding are referred to as EU columns hereafter. However, they should be interpreted as EU candidates rather than quantitatively retrieved extreme updrafts.
2.4.1 Detection of columns affected by Doppler-velocity folding as extreme-updraft candidates
Velocity folding is detected from the 3 km-averaged Vd profiles with 100 m vertical sampling in the subfreezing portion of each selected convective column. A vertical discontinuity between adjacent 100 m gates is counted as fold-like when three conditions are simultaneously satisfied: (i) the velocity jump exceeds 1.5Vnyq, (ii) the two adjacent velocities have opposite signs, and (iii) at least one of the two velocities exceeds 0.6Vnyq in magnitude. Columns with at least one such discontinuity are classified as columns affected by Doppler-velocity folding. Because the aliased velocities in these columns cannot be interpreted quantitatively as upward hydrometeor Doppler motion, we exclude them from the MaxVd calculation and analyze them separately as extreme-updraft (EU) candidates.
2.4.2 MaxVd-based strong-updraft definition and occurrence ratios
For selected convective columns that are not flagged as folded, we define MaxVd using the 3 km × 200 m averaged Doppler-velocity field. Specifically, MaxVd is the maximum value of the quality-controlled, pulse-pair-averaged Vd over all valid subfreezing gates in each non-folded column. Thus, the maximum is searched over the full valid subfreezing portion of each column after 3 km horizontal and 200 m vertical averaging. Non-folded columns with MaxVd > 2.0 m s−1 are classified as MaxVd-based strong-updraft (SU) columns, and the remaining non-folded columns are classified as non-SU (NonSU) columns. Because EU columns are excluded from the MaxVd calculation, the MaxVd-based SU category should be interpreted as a subset of columns with measurable upward hydrometeor Doppler motion, not as the absolute strongest convective cores observed by EarthCARE/CPR.
Using an extreme-value metric such as the column-maximum Doppler velocity (MaxVd) preferentially captures embedded updraft cores that dominate momentum and mass transport. In contrast, the mean or median Vd is more sensitive to measurement noise. Similar “maximum” or high-percentile Doppler metrics have been used as proxies for convective intensity and for evaluating model clouds (Heymsfield et al., 2010; Abbott et al., 2025). We also tested an alternative column metric, namely the volume fraction of gates for which Vd exceeds a fixed threshold. The qualitative conclusions are unchanged when this alternative metric is used instead of MaxVd, indicating that our findings are robust to the specific choice of updraft indicator.
All occurrence ratios in this paper are defined using the same denominator, namely, the total number of selected convective columns in the relevant bin or region, including both non-folded columns and EU columns. The total count denotes the number of columns for which Doppler-based classification remains possible after the quality-control procedures, including the multiple-scattering screen. The SU ratio is therefore defined as the number of non-folded columns with MaxVd > 2.0 m s−1 divided by the number of all selected convective columns, whereas the EU ratio is defined as the number of columns affected by Doppler-velocity folding divided by the same denominator. This common basis allows direct comparison between the occurrence of measurable SU columns and that of potentially more extreme, Nyquist-limited EU candidates.
2.5 Case examination of Vd quality control and the updraft metric
To illustrate how the column-selection criteria, range restrictions, folding detection, and spatial averaging described in Sect. 2.2–2.4 affect the Doppler-velocity diagnostics, we examine the example case shown in Fig. 1. In the radar-reflectivity field (Fig. 1a), the cloud structure is readily identifiable. Several active convective cores with spreading anvils (column indices around 80 and 400), together with an extensive stratiform region exhibiting a bright band (column indices 180–380), are evident. Figure 1b shows the input CPR_CLP Doppler-velocity field at 1 km × 100 m resolution, before the filtering and averaging used in this study, with only the cloud-mask threshold (≥ 20) applied. Above the 273.15 K isotherm, indicated by the black line, the field is speckled with incoherent patches, particularly near cloud edges where reflectivity is weak. These features likely arise from random noise or small-scale turbulence rather than from coherent convective updrafts. Below the 273.15 K isotherm, although negative values are more prevalent, sporadic large positive values also appear, suggesting that strongly negative velocities may have been aliased to positive values.
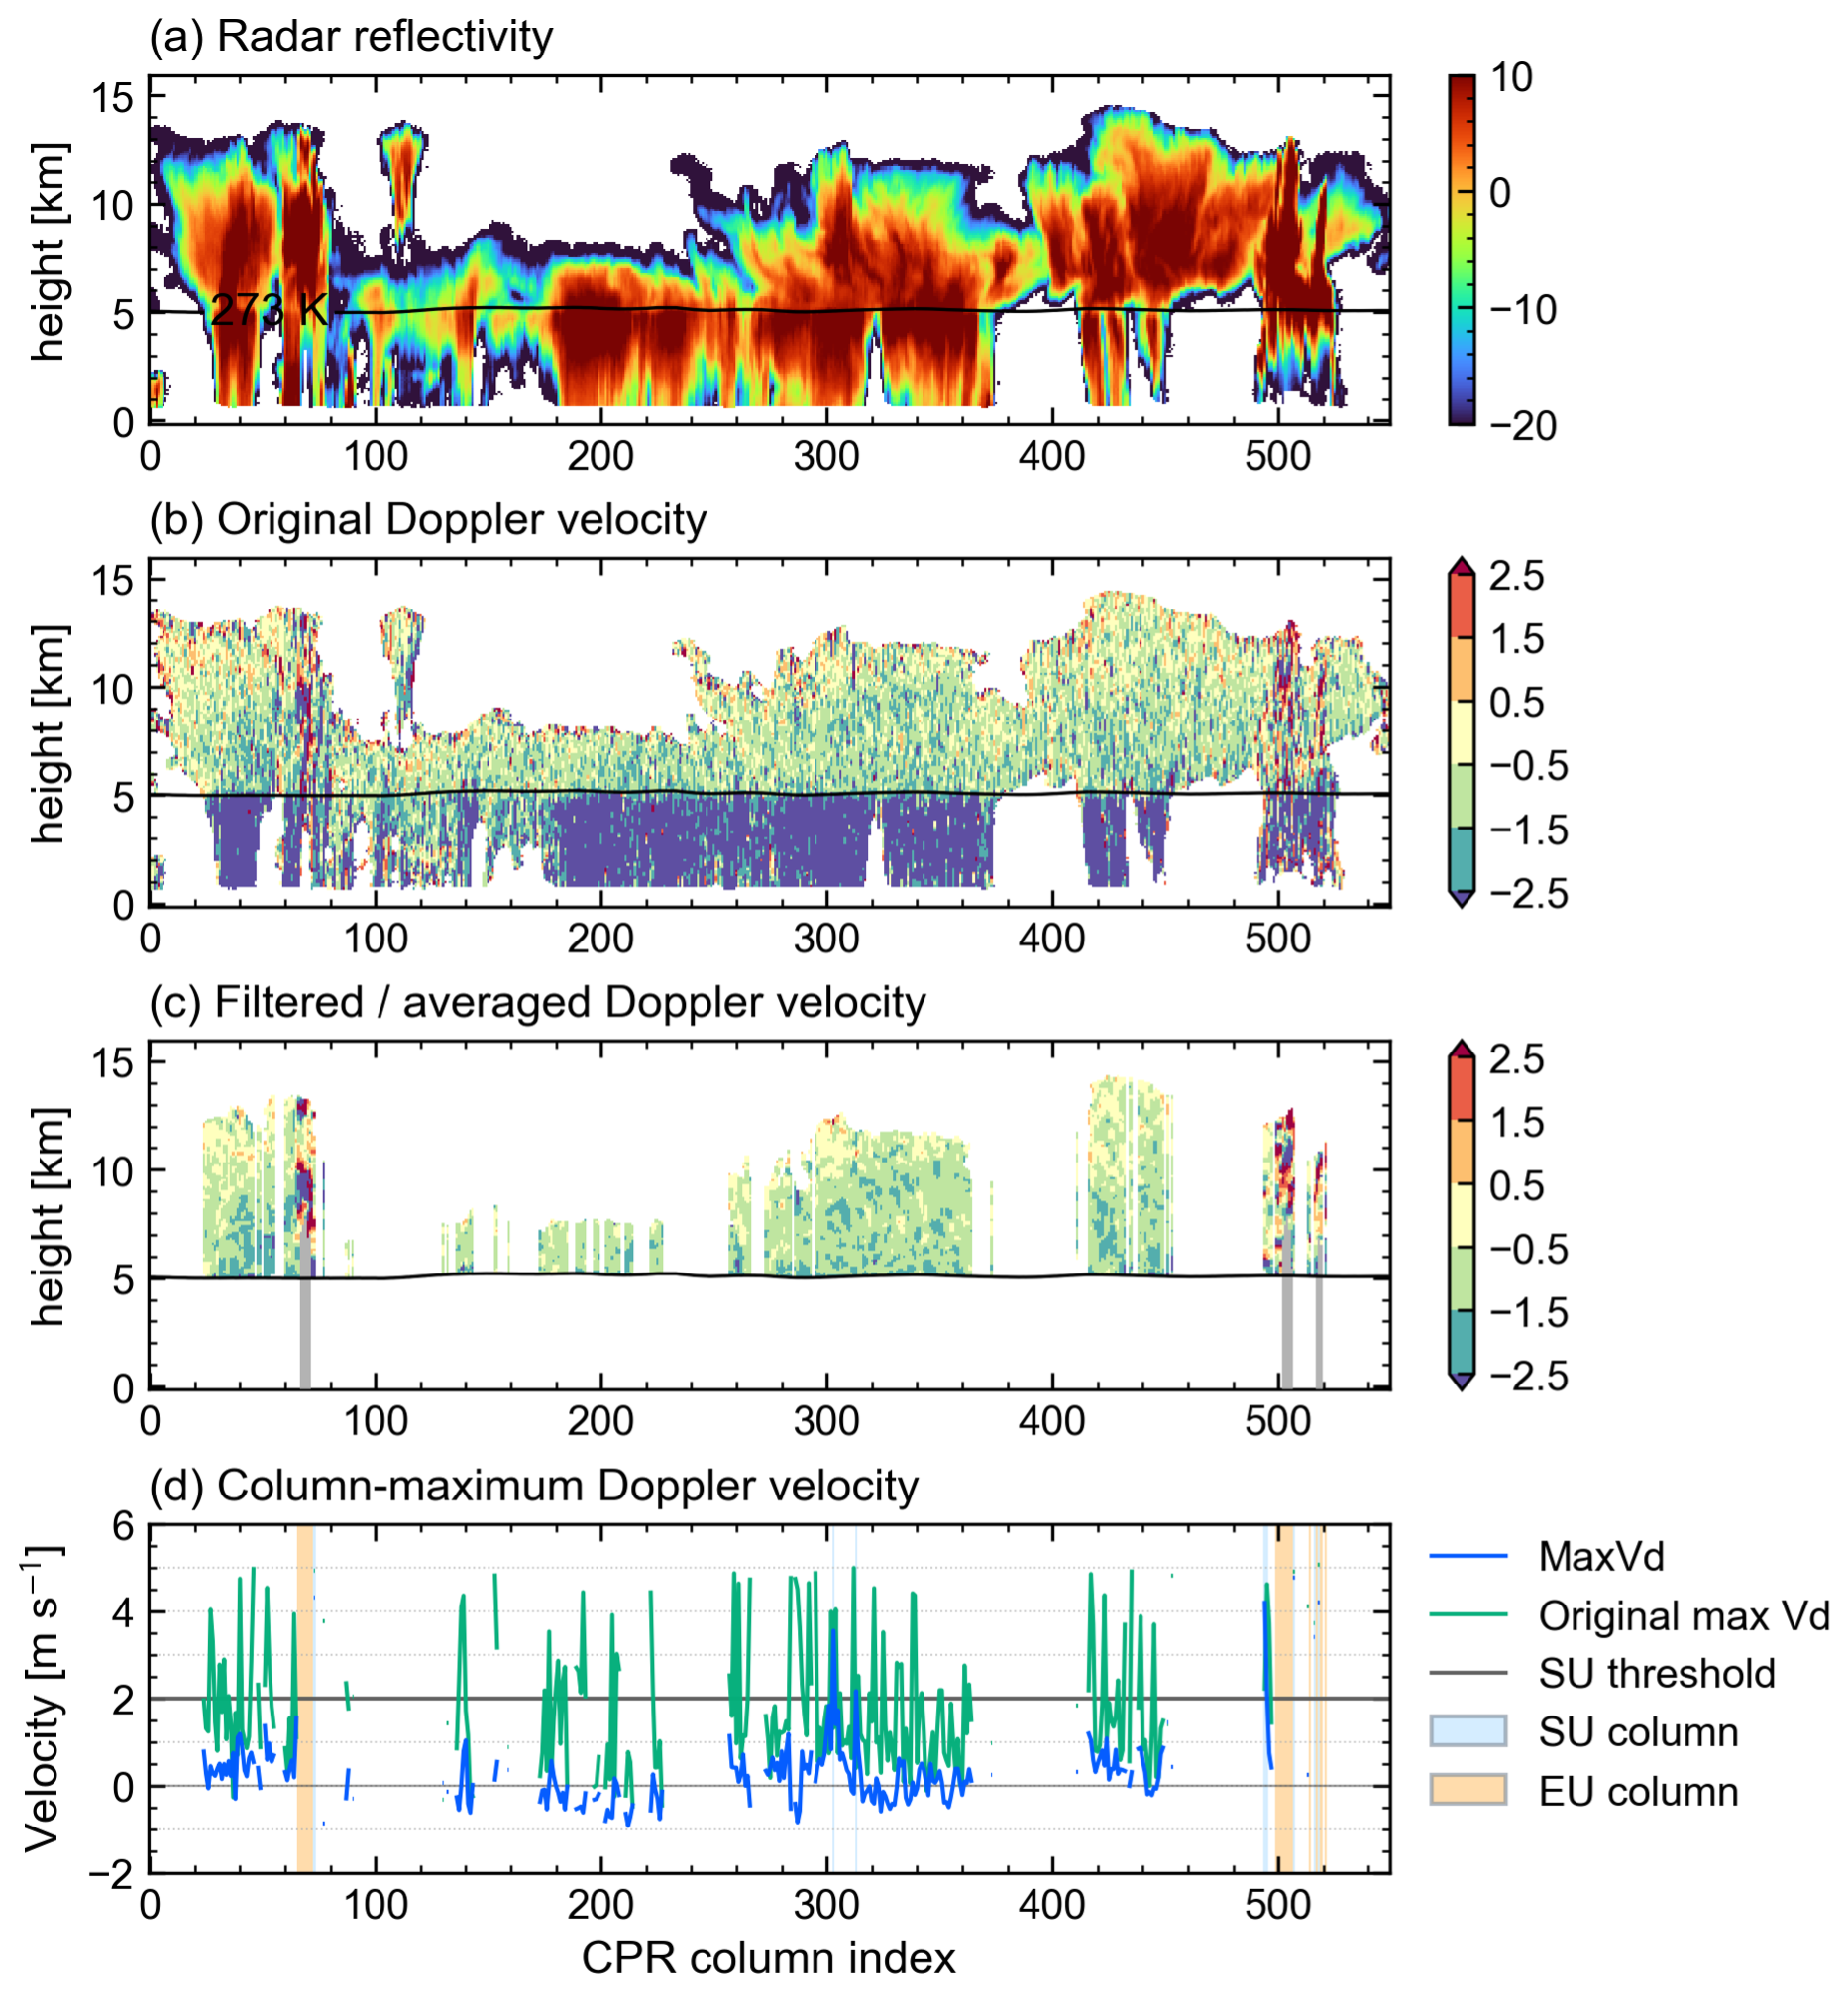
Figure 1Example illustrating Doppler-velocity quality control, folding detection, and the definition of the updraft metric MaxVd for an EarthCARE/CPR scene. (a) Radar reflectivity factor (Ref; dBZ). (b) Input CPR_CLP Doppler velocity (Vd; m s−1) after applying only the cloud-mask threshold (cloud mask ≥ 20); positive values indicate upward motion. The black line marks the 273.15 K isotherm. (c) Vd after applying the column-selection criteria and quality control. Gaps indicate columns or gates for which no valid Vd remains after column selection and quality control. Grey shading near column indices approximately 70, 500, and 510 denotes gates flagged as being affected by multiple scattering. (d) Column-maximum Vd as a function of column index, computed from the input field in (b) for visual comparison (“Original”; green) and from the filtered and averaged field in (c) for the quantitative metric (“MaxVd”; blue). Light-orange shading denotes columns flagged as folded and classified as extreme-updraft (EU) candidate columns. Light-blue shading denotes columns with MaxVd > 2.0 m s−1, classified as strong-updraft (SU) columns.
Figure 1c shows the gates that satisfy the convective-column selection and Doppler-velocity quality-control criteria. Columns that fail the convective-column selection, and gates lacking valid Doppler estimates after quality control, are not shown. The selection criteria in Sect. 2.2 remove multilayer cloud regions (column indices 100–120) and anvil regions near column indices 400 and 480. The quality-control and averaging procedure removes weak-signal outliers that are prone to error, damps small-scale turbulent fluctuations, excludes the impact of folding at temperatures warmer than 273.15 K, and yields smoother and more coherent structures. Multiple-scattering-contaminated gates are explicitly marked as grey shading and are excluded from the Vd statistics.
Figure 1d compares the column-maximum Vd computed directly from the raw Vd field in Fig. 1b (“Original”; green) with the MaxVd, defined as the column-maximum Vd computed from the filtered and averaged field in Fig. 1c for non-folded columns. The MaxVd varies smoothly across adjacent columns and shows distinct peaks near column indices 300 and 500, albeit with reduced amplitudes. This example motivates our use of MaxVd, computed from the quality-controlled Vd field, as the updraft metric. The processing suppresses major sources of error and retains coherent 3 km-scale convective structures, but the 3 km along-track and 200 m vertical averaging reduces the peak amplitude of Vd in narrow updraft cores. The resulting MaxVd should therefore be interpreted as a scale-dependent indicator of upward hydrometeor Doppler motion rather than a point-scale convective-core velocity. The shaded columns summarize the two updraft-related categories. Light-blue shading denotes MaxVd-based strong-updraft (SU) columns, defined as non-folded columns with MaxVd > 2.0 m s−1, whereas light-orange shading denotes columns affected by Doppler-velocity folding, which are treated separately as extreme-updraft (EU) columns.
We identified approximately 1.60 × 10⁶ columns after applying the selection criteria described in Sect. 2.2. Among them, about 1.48 × 10⁶ columns are non-folded and are suitable for quantitative MaxVd analysis, whereas about 1.19 × 10⁵ columns are classified as Doppler-velocity folded. We report MaxVd-based SU and folding-based EU statistics together where relevant. The only exception is Fig. 2 because it characterizes the MaxVd distribution, while folded columns cannot be assigned reliable MaxVd.
3.1 Doppler-classified convective columns and vertical reflectivity structure
To examine the relationship between updraft strength, cloud development, and precipitation formation, and to evaluate the proxies used in CloudSat-based studies, we relate the updraft-intensity metric MaxVd to several diagnostics derived from the vertical structure of radar reflectivity. We first examine the frequency distribution of MaxVd for all non-folded columns to characterize its behavior and compare it with representative updraft velocities reported in previous studies (Fig. 2a). Owing to the Nyquist velocity constraint, MaxVd is limited to approximately +5 m s−1. The distribution peaks between 0 and 1 m s−1, which is smaller than typical values reported from aircraft-borne Doppler radar observations, where column-maximum updrafts often exceed 10 m s−1 (Heymsfield et al., 2010), as well as from cloud-top ascent rates inferred from temporal changes in infrared brightness temperature, which are on the order of 1–3 m s−1 (Hamada and Takayabu, 2016; Li et al., 2021). A likely reason for this apparent underestimation is the difference in the cloud life-cycle stages targeted. Whereas those previous studies primarily sampled fully developed or rapidly developing convective clouds, our statistics also include clouds in their decaying stages, thereby shifting the distribution toward weaker updrafts. It is also important to note that CPR Vd is a reflectivity-weighted hydrometeor Doppler velocity, not the air vertical velocity. Large precipitating ice particles can dominate the reflectivity-weighted signal, and their terminal fall speed can offset the upward air motion. Consequently, Vd can be substantially smaller than the air updraft velocity, or even indicate downward motion, within ascending cloudy air (Heymsfield et al., 2010). In addition, the exclusion of aliased columns and the spatial averaging applied to Vd both tend to shift MaxVd toward smaller values. In terms of its shape, the MaxVd distribution exhibits clear positive skewness, with a long positive (upward) tail, consistent with previous findings (LeMone and Zipser, 1980; Lucas et al., 1994; Hamada and Takayabu, 2016). This indicates that columns with strong updrafts are relatively rare compared with those with weak or moderate updrafts.
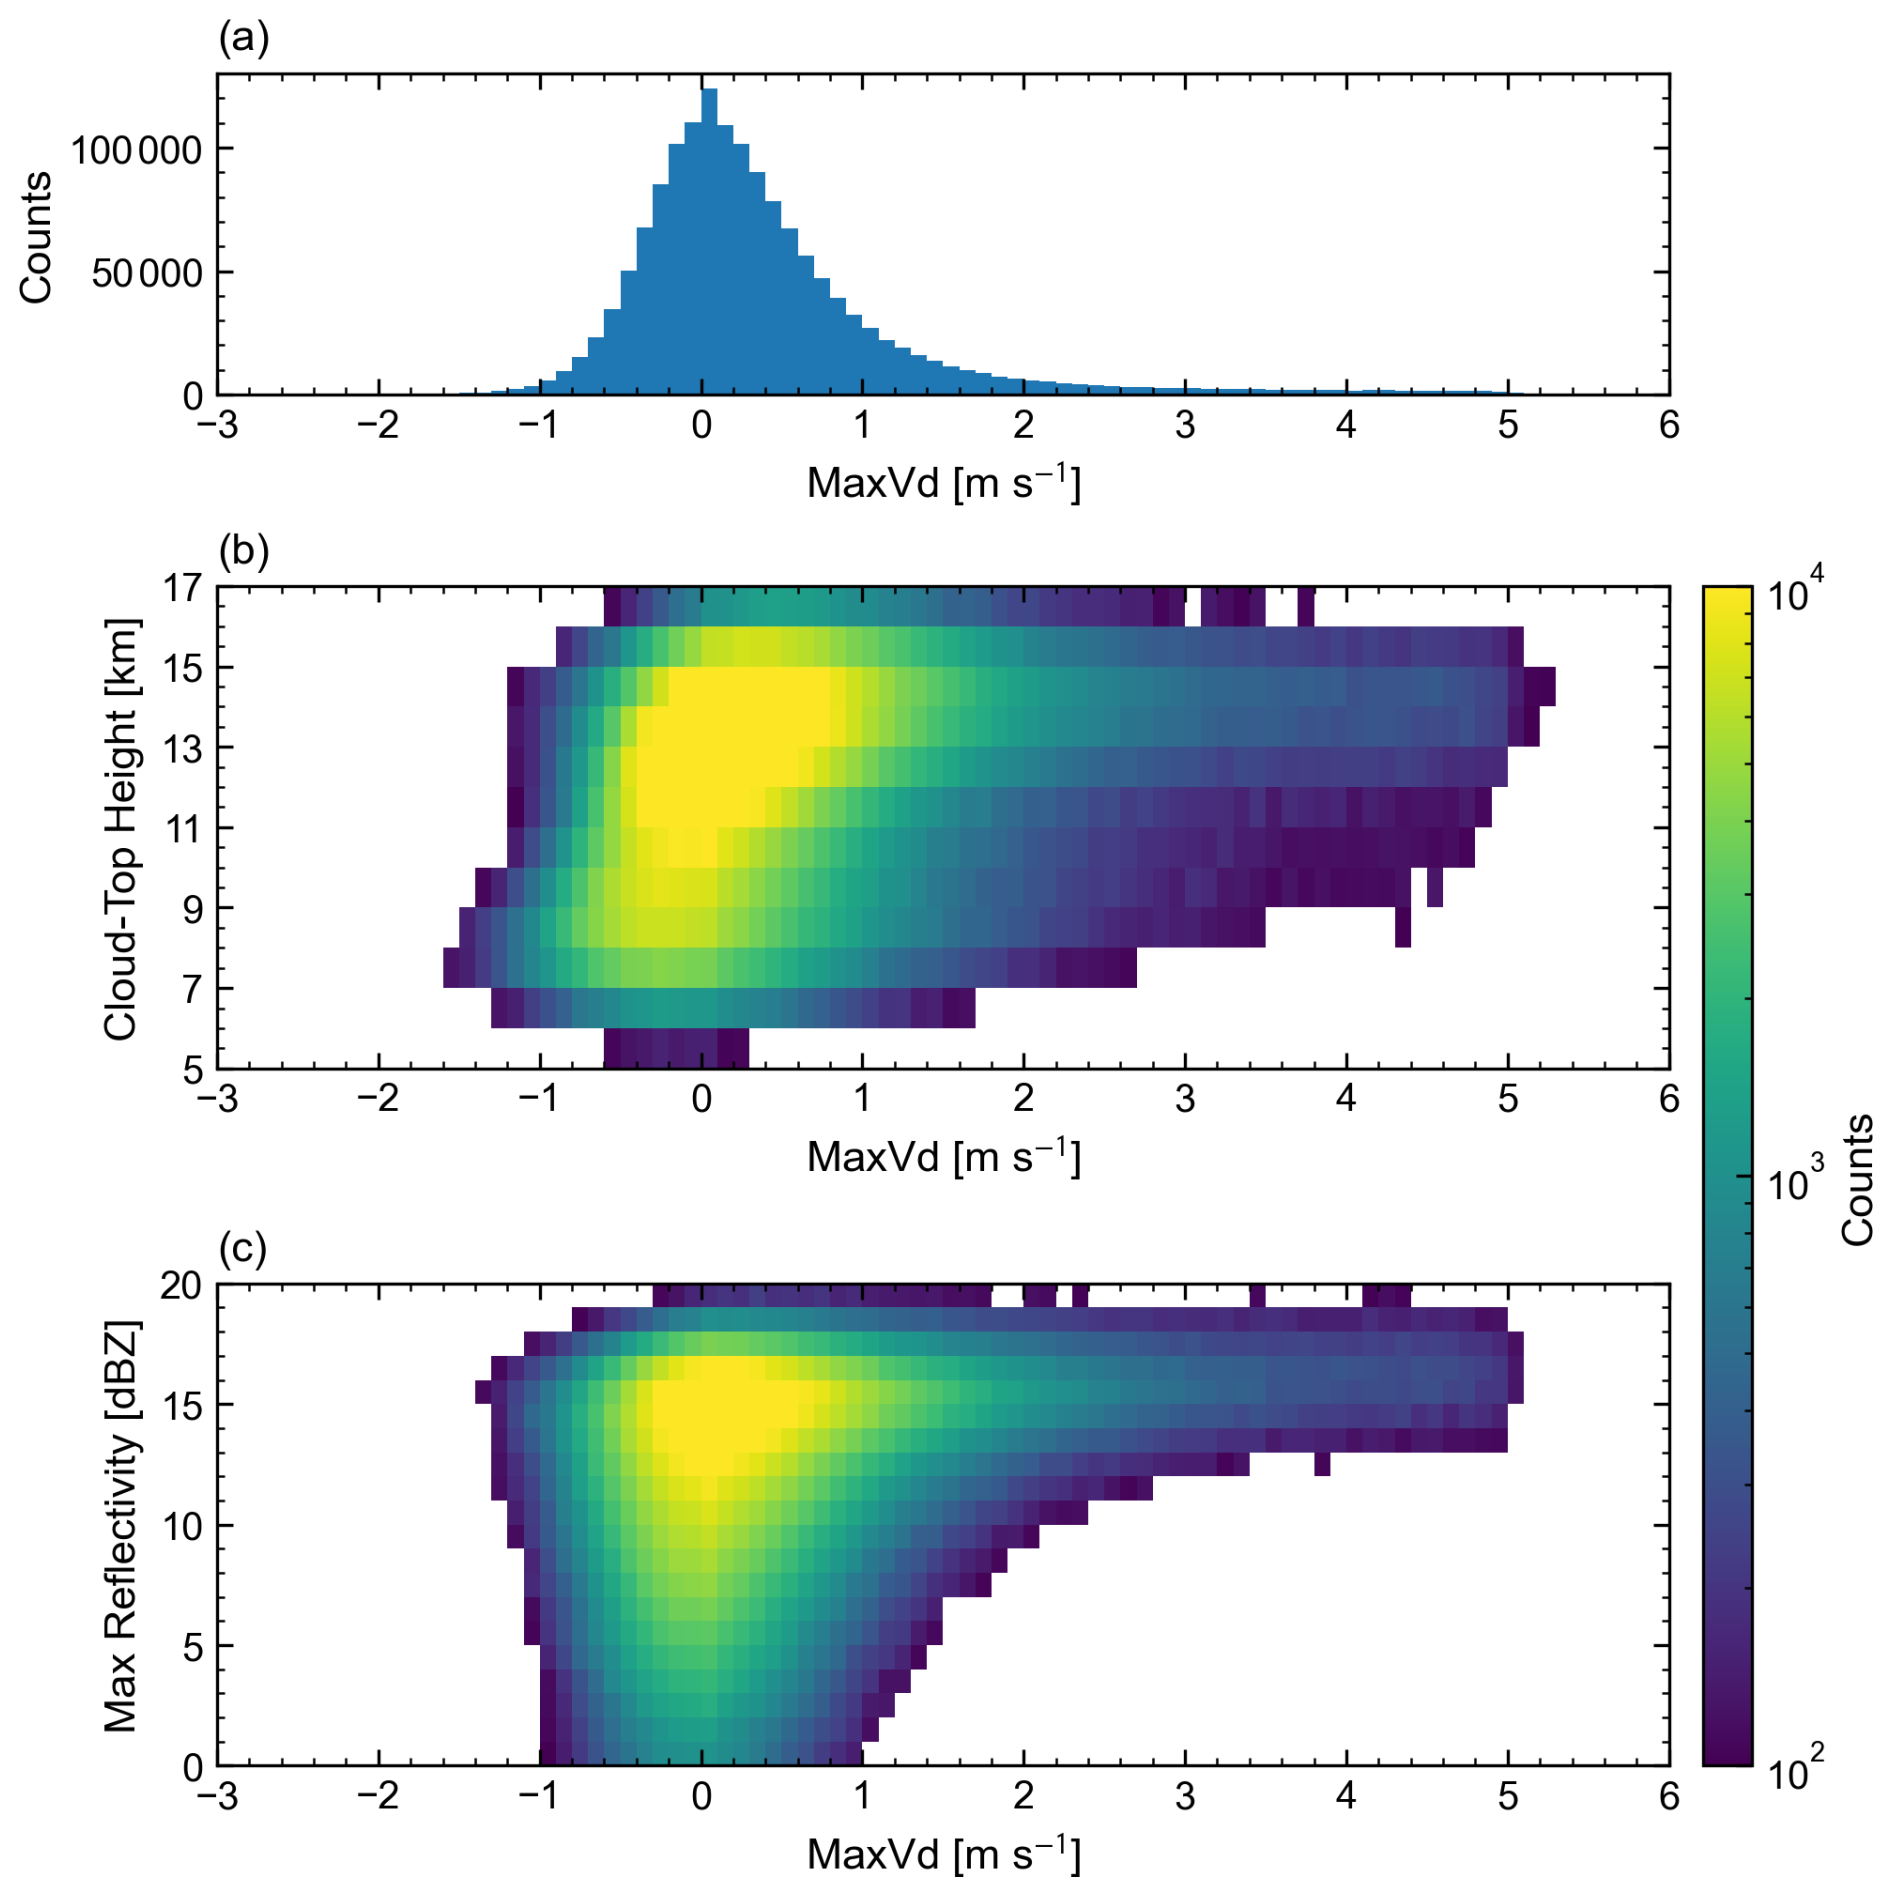
Figure 2Statistical distribution of the Doppler-derived updraft metric (MaxVd) and its relationship to cloud vertical development and precipitation intensity for selected convective cloud columns that are not flagged as affected by Doppler-velocity folding. (a) Histogram of MaxVd (m s−1). (b) Two-dimensional histogram of MaxVd versus cloud-top height. (c) Two-dimensional histogram of MaxVd versus column-maximum radar reflectivity (MaxRef; dBZ). Shading in (b) and (c) indicates sample counts (logarithmic color scale); only bins with ≥ 100 samples are shown.
To relate updraft strength to cloud vertical development, we construct a two-dimensional histogram of CTH versus MaxVd (Fig. 2b). CTH is defined as the highest altitude in a column where the cloud-mask value is ≥ 20. The histogram clearly shows that, as CTH increases, the mode of the MaxVd distribution systematically shifts toward higher values. For example, clouds with CTHs of 8–10 km exhibit a modal MaxVd near 0 m s−1, whereas those with CTHs of 14–16 km show a mode close to 1 m s−1. This pattern indicates that taller convective systems are generally more likely to contain strong updraft cores. This height dependence is qualitatively consistent with previous studies, which have reported that higher cloud tops tend to be associated with stronger convective intensity (Price and Rind, 1992; Song et al., 2020).
The relationship between MaxVd and the column-maximum radar reflectivity (MaxRef), which is closely linked to hydrometeor size and precipitation intensity, is even more apparent (Fig. 2c). The occurrence frequency of large MaxVd values increases nonlinearly with increasing MaxRef, indicating that large particles are more readily generated and/or maintained in environments with relatively strong updrafts. This statistical covariation between reflectivity and updraft strength is consistent with previous observations from aircraft radars, although the absolute magnitudes depend on observational conditions, such as radar frequency (Heymsfield et al., 2010). However, attenuation, non-Rayleigh scattering, and multiple scattering at 94 GHz complicate the interpretation of very high reflectivity values (Matrosov, 2007; Kollias et al., 2022; Chase et al., 2025).
To further investigate the vertical structure of radar reflectivity, we classified the non-folded columns into two categories based on their MaxVd. Non-folded measurable strong-updraft (SU) columns are defined as those with MaxVd > 2.0 m s−1, totaling 7.79 × 10⁴ columns (4.88 % of all convective columns). The remaining non-folded columns are classified as non-SU (NonSU). This threshold isolates a relatively rare but dynamically distinct subset of strong-updraft cases.
We then use normalized Contoured Frequency-by-Altitude Diagrams (normalized CFADs; Luo et al., 2009; Yuter and Houze, 1995) to compare the statistical distributions of reflectivity profiles for the NonSU, SU, and EU categories (Fig. 3). The normalized CFADs reveal clear structural contrasts between SU and NonSU columns. SU columns exhibit a significantly larger fraction of high-reflectivity bins (≥ 10 dBZ) at high altitudes (> 8 km), indicating that strong updrafts loft large hydrometeors deep into the upper troposphere and promote ice production and subsequent growth by deposition, aggregation, and riming at higher altitudes. The observed Vd is the sum of the particle fall speed and the vertical motion of the ambient air. Because greater radar reflectivity generally corresponds to faster particle fall speeds (Seiki et al., 2025), which act to reduce Vd, the occurrence of high reflectivity at high altitudes in SU columns implies particularly strong updrafts. EU columns occupy an even more extreme structural regime: high reflectivities extend to high altitudes, indicating that these columns are closely related to the most vigorous convective structures even though their Vd values cannot be used quantitatively. Below the melting layer (< 5 km), by contrast, reflectivity in EU columns is smaller than in NonSU and SU columns, likely due to stronger radar attenuation, a feature consistent with previous studies (Luo et al., 2014).
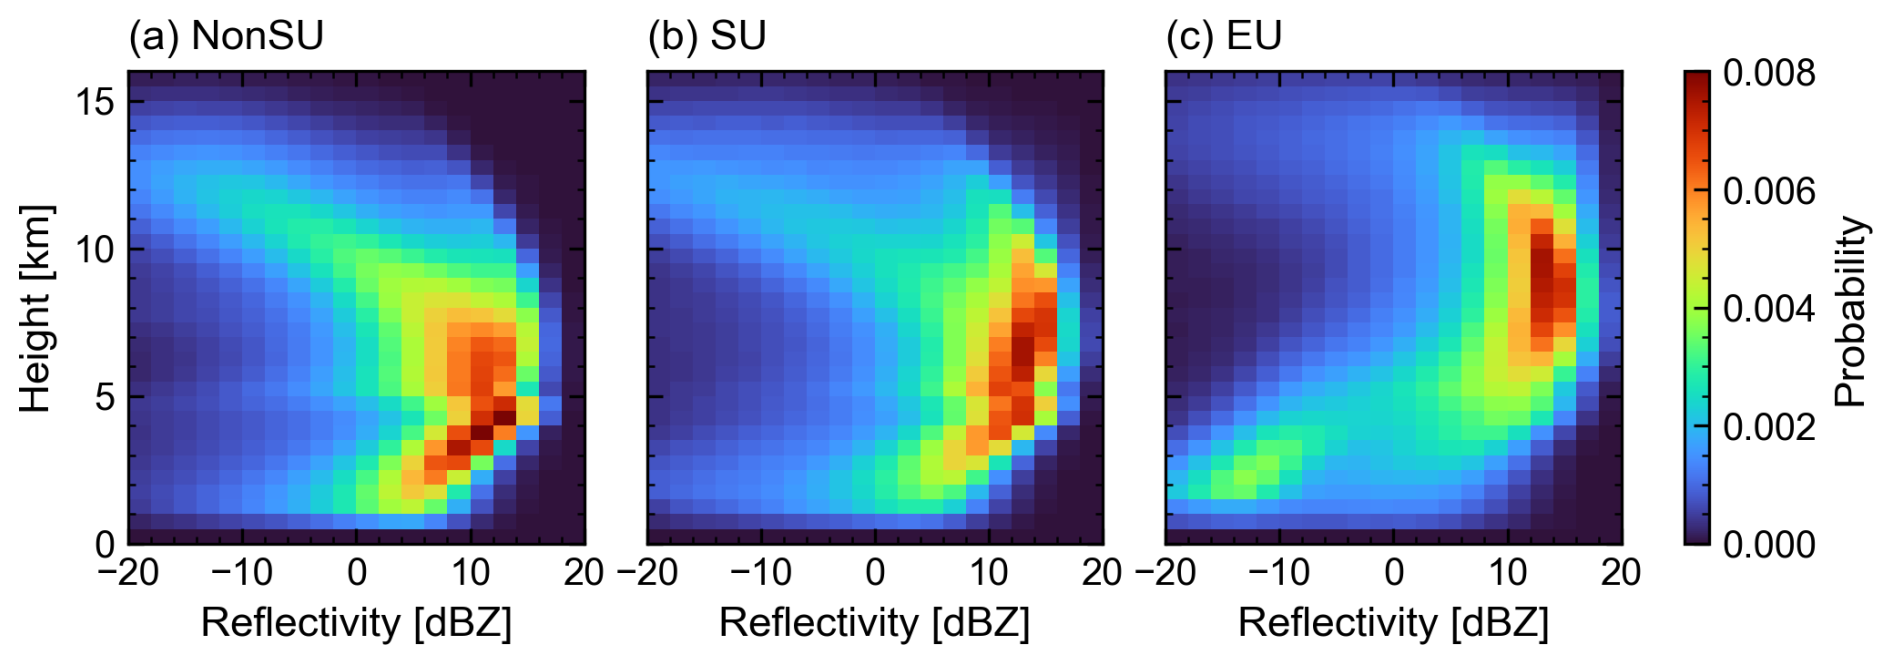
Figure 3Normalized contoured frequency-by-altitude diagrams (CFADs) of EarthCARE/CPR radar reflectivity (Ref; dBZ) for (a) non–strong-updraft (NonSU) columns, (b) strong-updraft (SU) columns, and (c) extreme-updraft (EU) candidate columns. Reflectivity is binned in 2 dB intervals, and the vertical coordinate is binned in 500 m intervals. Each panel is normalized by its total number of height–reflectivity samples such that the color indicates probability (i.e., the sum over all bins in each panel equals 1).
This structural difference in reflectivity among NonSU, SU, and EU columns is further quantified using box-and-whisker plots of cloud-top height and echo-top heights (Fig. 4). The median CTH increases from 12.6 km for NonSU columns to 13.5 km for SU columns and 13.9 km for EU columns, corresponding to increases of 0.9 and 1.3 km relative to NonSU columns, respectively. The contrast is more pronounced for echo-top heights of 0 and 10 dBZ. The median ETH(0) increases from 9.4 km for NonSU to 11.3 km for SU and 12.5 km for EU columns, while the median ETH(10) increases from 7.4 to 9.6 and 10.8 km, respectively. Thus, relative to NonSU columns, the median ETH(0) is higher by about 1.9 km for SU and 3.1 km for EU, and the median ETH(10) is higher by about 2.2 km for SU and 3.4 km for EU. These differences are substantially larger than those in CTH, indicating that echo-top heights of 0 and 10 dBZ are more sensitive than cloud-top height to the dynamical and microphysical structure associated with intense convection. Although EU columns cannot be assigned quantitative MaxVd values because of Doppler-velocity folding, their systematically higher ETH values indicate that folding preferentially occurs in columns where high-reflectivity hydrometeors are lofted to significantly high altitudes.
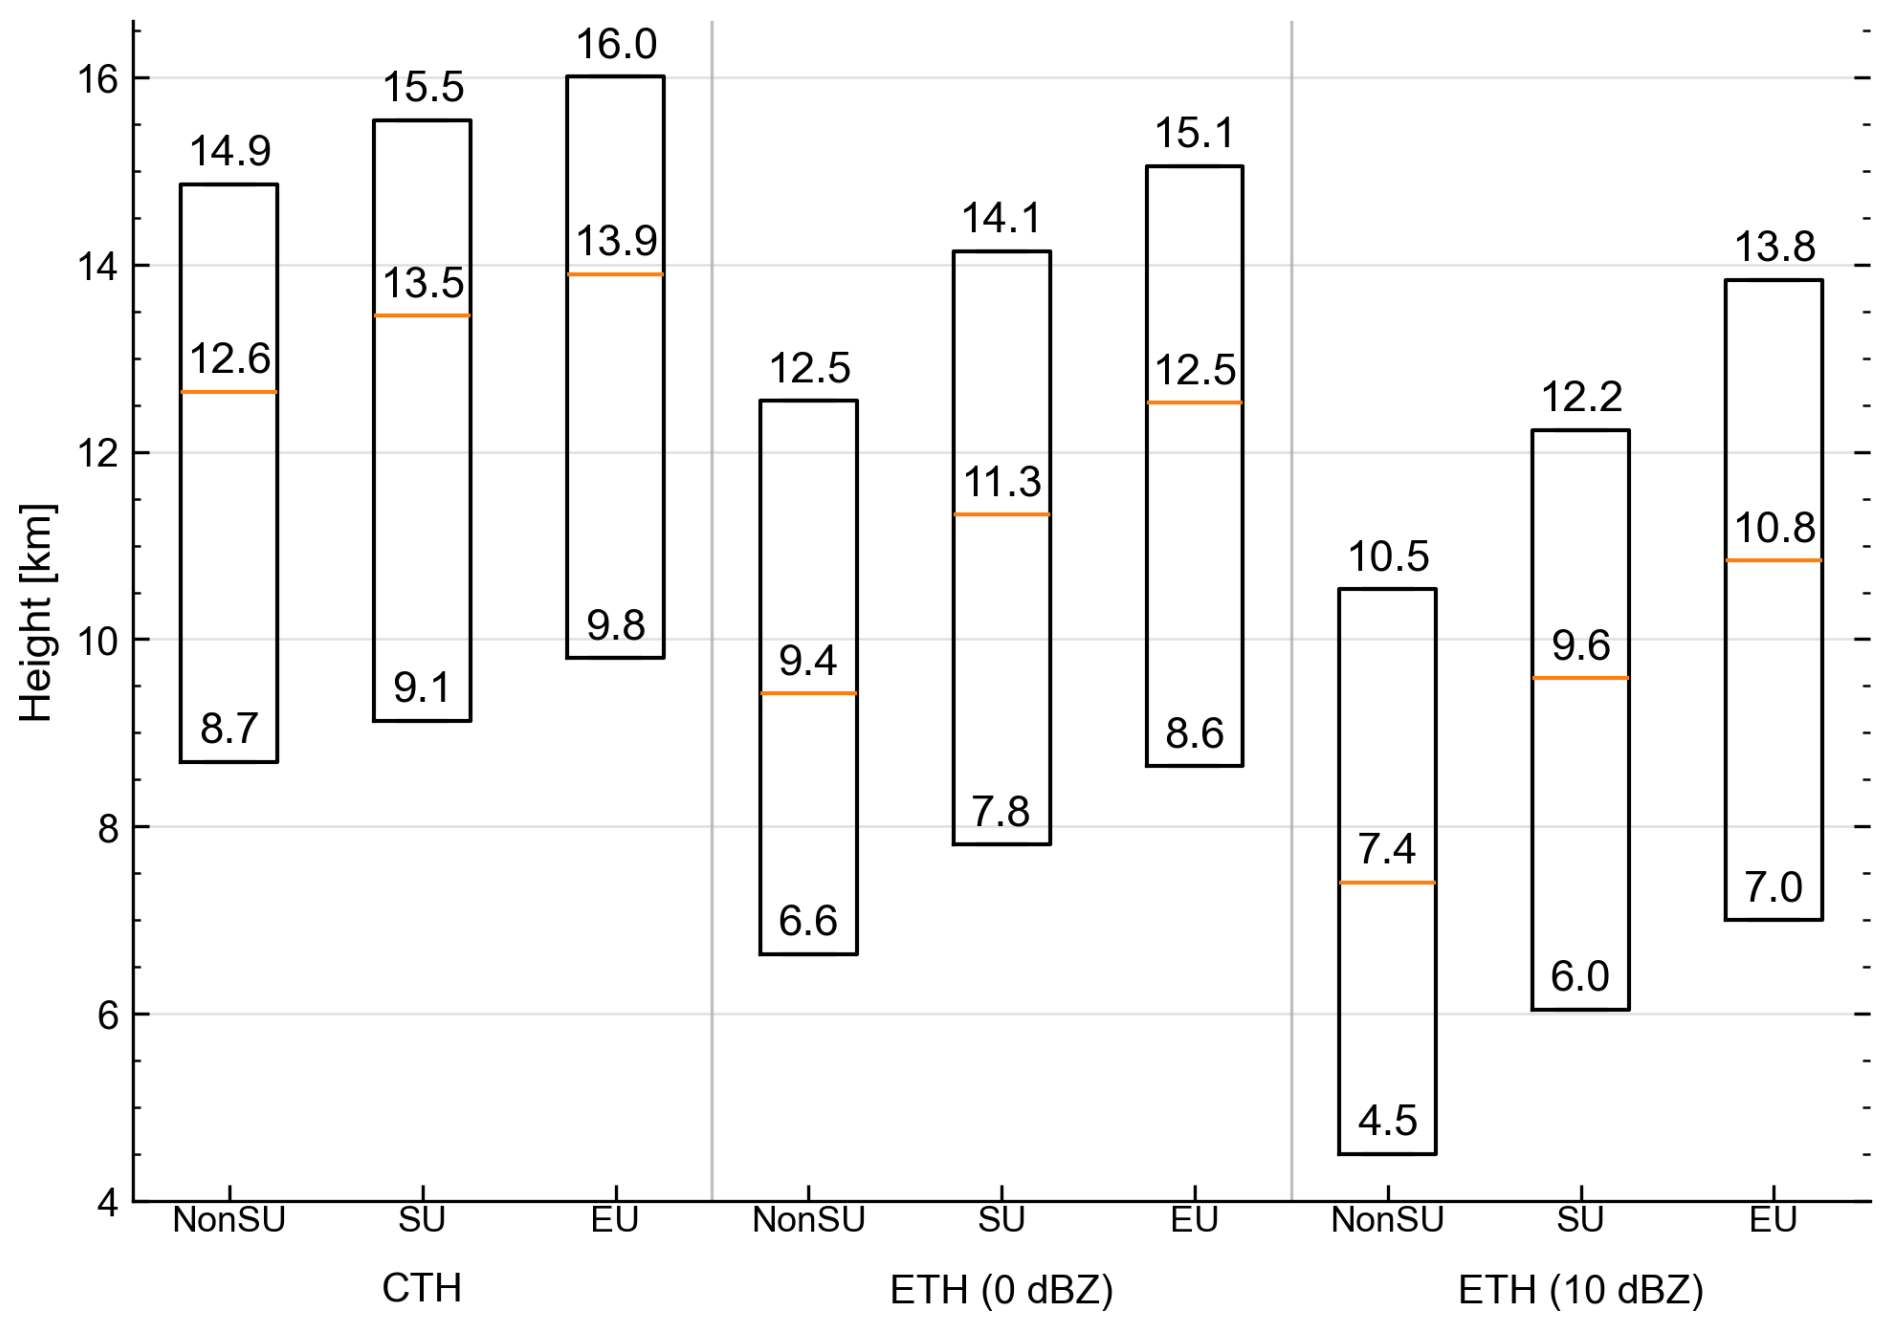
Figure 4Box-and-whisker summaries of cloud vertical extent for non–strong-updraft (NonSU), strong-updraft (SU), and extreme-updraft (EU) columns, shown for cloud-top height (CTH) and echo-top heights at reflectivity thresholds of 0 and 10 dBZ [ETH(0) and ETH(10)]. For each metric, the box spans the 10th–90th percentiles and the central line indicates the median (50th percentile). Numeric labels denote the 10th, 50th, and 90th percentile heights (km).
To further explore the relation between these height-based metrics, we examine the joint distributions of CTH and ETH(0) separately for NonSU (Fig. 5b), SU (Fig. 5e), and EU columns (Fig. 5h). Because ETH(0) is, by definition, equal to or lower than CTH, the populated region in the CTH–ETH(0) plane is confined to the triangular area above the 1 : 1 line. For both SU and NonSU columns, ETH(0) and CTH are strongly and positively correlated, consistent with previous satellite- and radar-based studies that have related differences between cloud-top and precipitation-top heights to convective intensity and life-cycle stage (e.g., Masunaga et al., 2005; Masunaga and Kummerow, 2006; Kikuchi and Suzuki, 2019). However, their detailed characteristics differ markedly. NonSU columns are, on average, shallower and exhibit a broad distribution with a large separation between ETH(0) and CTH. In contrast, SU columns are systematically taller, and their joint distribution lies much closer to the 1 : 1 line, indicating a smaller gap between ETH(0) and CTH.
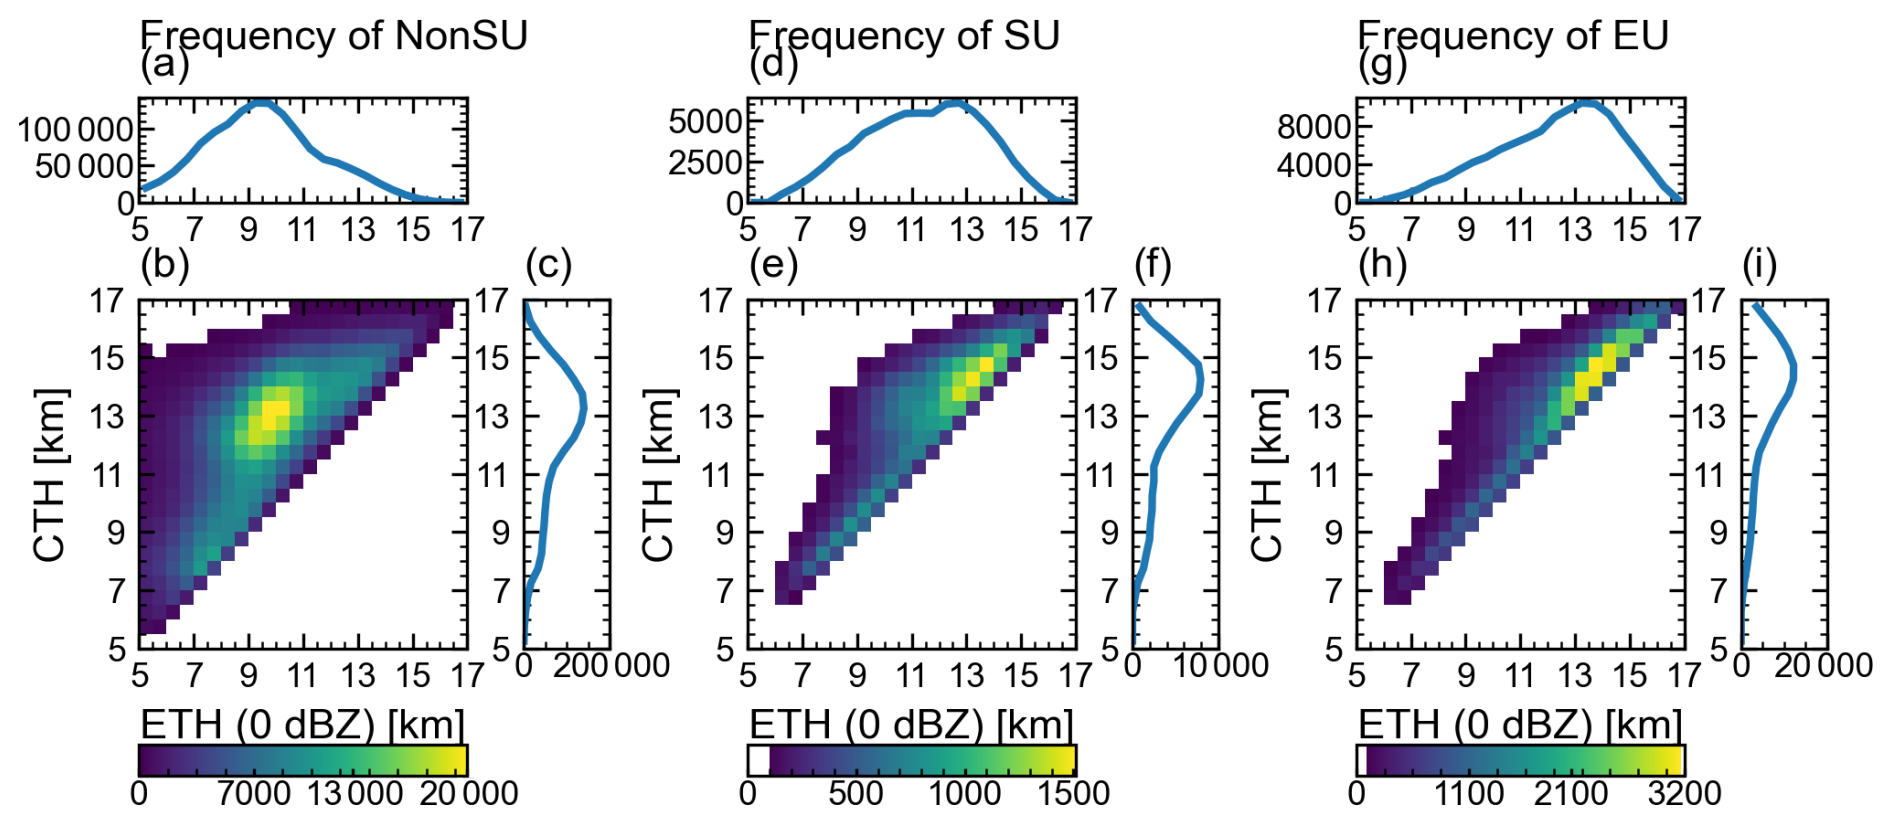
Figure 5Relationship between cloud-top height (CTH) and the 0 dBZ echo-top height [ETH(0)] for non–strong-updraft (NonSU), strong-updraft (SU) columns, and extreme-updraft (EU) columns. Two-dimensional histograms of CTH versus ETH(0) are shown for (b) NonSU, (e) SU, and (h) EU; shading indicates sample counts per bin, and only bins with ≥ 100 samples are colored. The corresponding marginal distributions are shown for ETH(0) in (a) NonSU, (d) SU, and (g) EU, and for CTH in (c) NonSU, (f) SU, and (i) EU.
EU columns show a further shift of population toward the upper-right part of the CTH–ETH(0) plane. Their distribution is concentrated at high CTH and high ETH(0), and it lies close to the 1 : 1 line over a wide height range. This indicates that the 0 dBZ echo top frequently approaches the cloud top in folded columns, suggesting that relatively large hydrometeors are lofted to near-cloud-top levels. Although the Doppler velocities in these columns cannot be used to quantify MaxVd because of velocity folding, their radar-reflectivity structure is consistent with a more extreme convective regime. Together, the three distributions indicate that the separation between CTH and ETH(0), hereafter denoted as ΔH, is a useful structural measure for identifying both SU and EU columns.
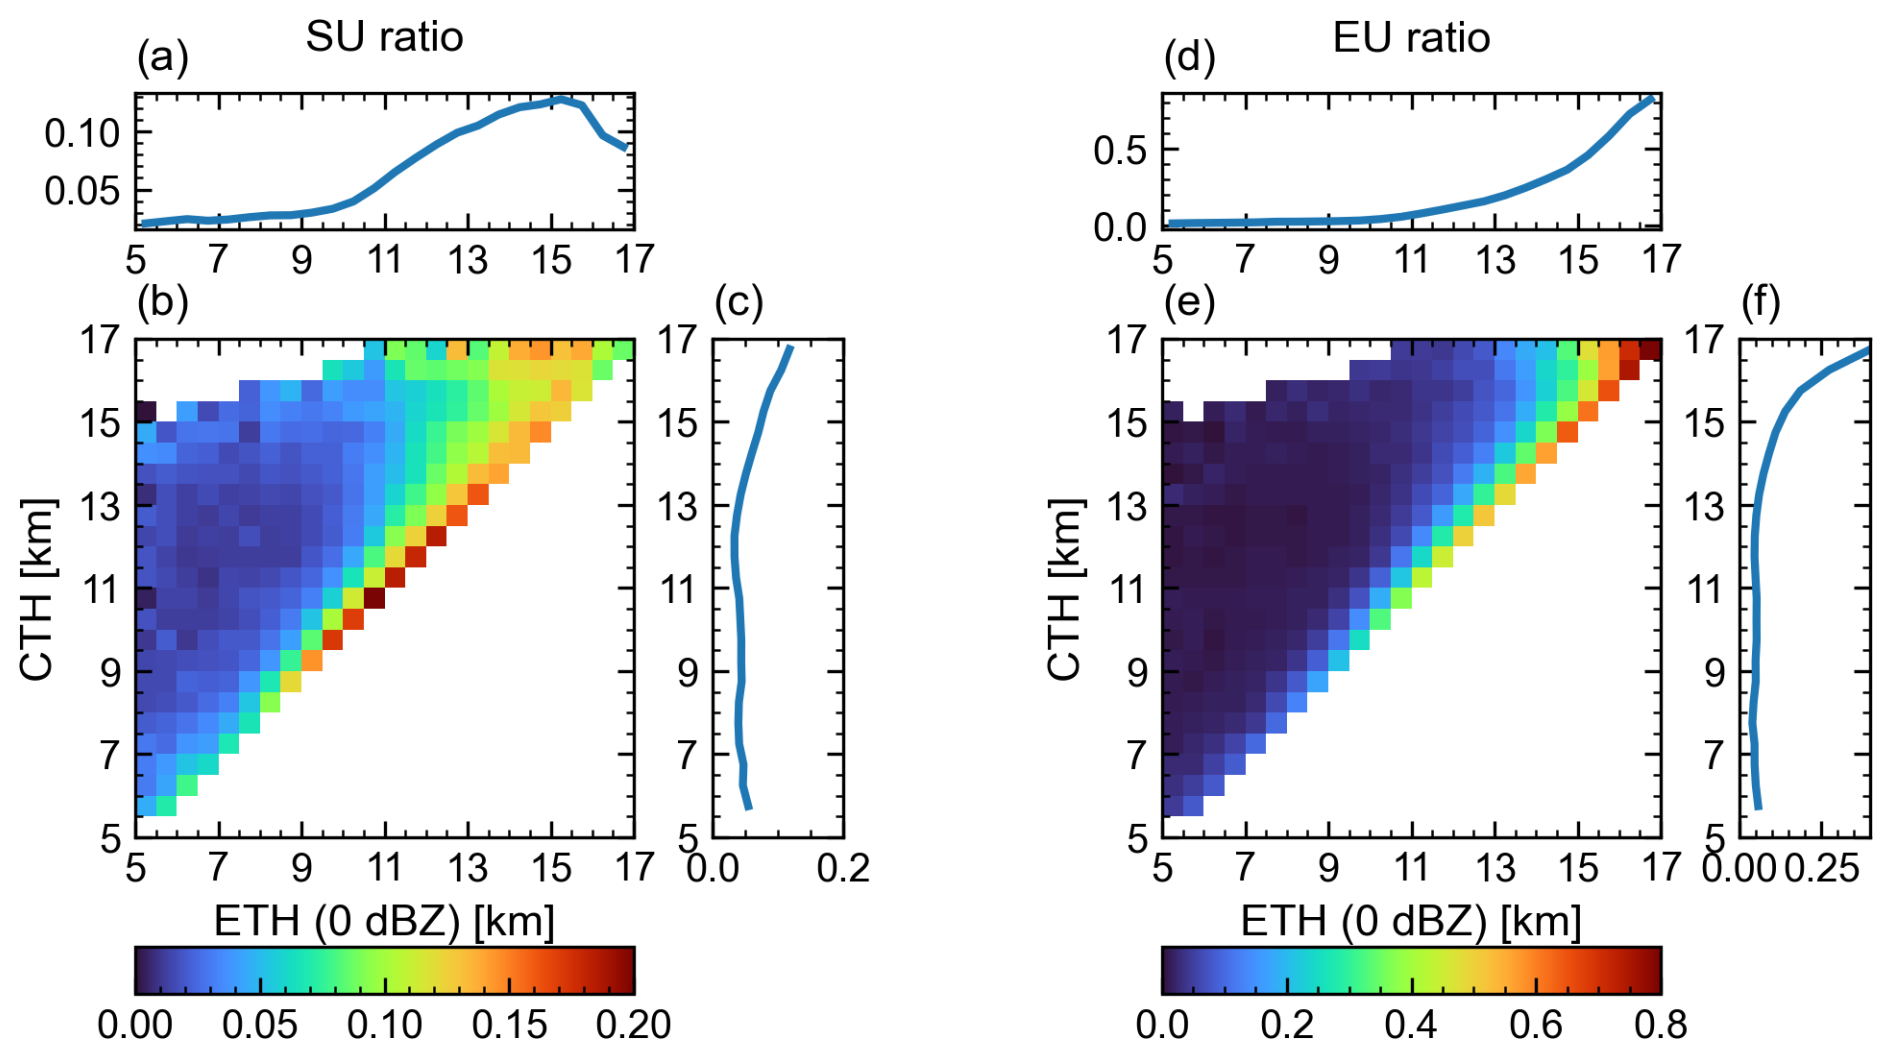
Figure 6Occurrence ratios of SU columns and EU columns as functions of ETH(0) and CTH. (a–c) SU ratio and (d–f) EU ratio. The SU ratio is defined as the number of non-folded columns with MaxVd > 2.0 m s−1 divided by the total number of selected convective columns in each bin. The EU ratio is defined as the number of folded columns divided by the same denominator. Note that the SU and EU panels use different color scales. Panels (b) and (e) show two-dimensional ratios in the CTH–ETH(0) phase space; marginal ratios are shown as functions of ETH(0) and CTH.
Building on Fig. 5, Fig. 6 further quantifies how the occurrence ratios of SU and EU columns vary with CTH and ETH(0), thereby more clearly characterizing the distinct nature of the two Doppler-based categories. Using the common denominator defined in Sect. 2.4.2, Fig. 6 compares the occurrence ratios of SU and EU columns as functions of CTH and ETH(0).
In the one-dimensional projections (Fig. 6a, c, d, f), both ratios increase with each of CTH and ETH(0), but the increase is more pronounced for EU. The SU ratio rises gradually as CTH increases and as ETH(0) reaches the upper troposphere, whereas the EU ratio increases more sharply for the highest echo tops. This contrast indicates that high echo tops are more discriminating indicators of both SU and EU occurrence than CTH alone.
The two-dimensional maps (Fig. 6b and e) further show that the separation between CTH and ETH(0) is a key structural control on updraft velocity. For both SU and EU, the occurrence ratios are highest near the 1 : 1 line, where ETH(0) approaches CTH. For a fixed CTH, bins with larger ETH(0) exhibit higher occurrence ratios, indicating a clear dependence on the separation between CTH and ETH(0). Conversely, when the separation between ETH(0) and CTH is large, i.e., far from the 1 : 1 line, the occurrence of both SU and EU is strongly suppressed. In the most extreme part of this phase space, where CTH exceeds 11 km and ΔH = CTH − ETH(0) is less than 0.5 km, the EU ratio exceeds 0.5, indicating that more than half of the selected convective columns are affected by Doppler-velocity folding. Notably, even at moderate CTH, columns with small CTH–ETH(0) separation still show enhanced SU occurrence, suggesting that this metric can identify relatively low-topped vigorous convection that may be missed by conventional high-altitude echo-top proxies.
These results highlight the importance of the separation between CTH and ETH(0) for characterizing vertical structure of convection. We therefore define ΔH ≡ CTH − ETH(0) as a compact diagnostic that links radar-echo structure to convective dynamics and microphysics. Small ΔH corresponds to the presence of relatively large hydrometeors near the cloud top in developing convective cores, whereas large ΔH characterizes decaying or weakly forced columns in which larger hydrometeors are confined to lower levels. This interpretation is consistent with conceptual models of convective evolution and with CloudSat-based intensity proxies that emphasize small CTH–ETH(0) separation (e.g., Takahashi and Luo, 2014); however, it is here evaluated using EarthCARE CPR Doppler-velocity measurements for non-folded columns and extended to EU-candidate columns affected by Doppler-velocity folding. In this framework, small ΔH identifies not only measurable SU columns but also Nyquist-limited convective columns in which reliable MaxVd quantification is difficult. Thus, ΔH provides a common structural diagnostic for both measurable SU and EU-candidate regimes.
3.2 Spatial and diurnal characteristics
3.2.1 Spatial and local-time patterns of SU and EU columns
To place the column-wise updraft statistics in a geographical and diurnal context, we analyze where and when MaxVd-based SU columns and folding-based EU columns occur at two local times, 02:00 and 14:00 LT, and how their occurrence relates to regional cloud structure. We begin by examining the spatial distribution of all selected convective columns within the analysis domain (Fig. 7a). These columns are predominantly concentrated over well-known hotspots of deep convection (Zipser et al., 2006; Liu and Zipser, 2015), including the eastern Pacific Intertropical Convergence Zone (EPAC-ITCZ), the Amazon basin, central Africa, the Maritime Continent, and the South Pacific Convergence Zone (SPCZ), and are relatively sparse over the subtropical oceans. This geographical pattern confirms that our procedure effectively isolates columns embedded within convective cloud systems. We define five large-sample regions (Fig. 7a): the EPAC-ITCZ, central Africa, the Amazon basin, the Maritime Continent, and the SPCZ. These regions are used throughout the subsequent analysis to quantify regional differences in the occurrence and structure of SU and EU columns.
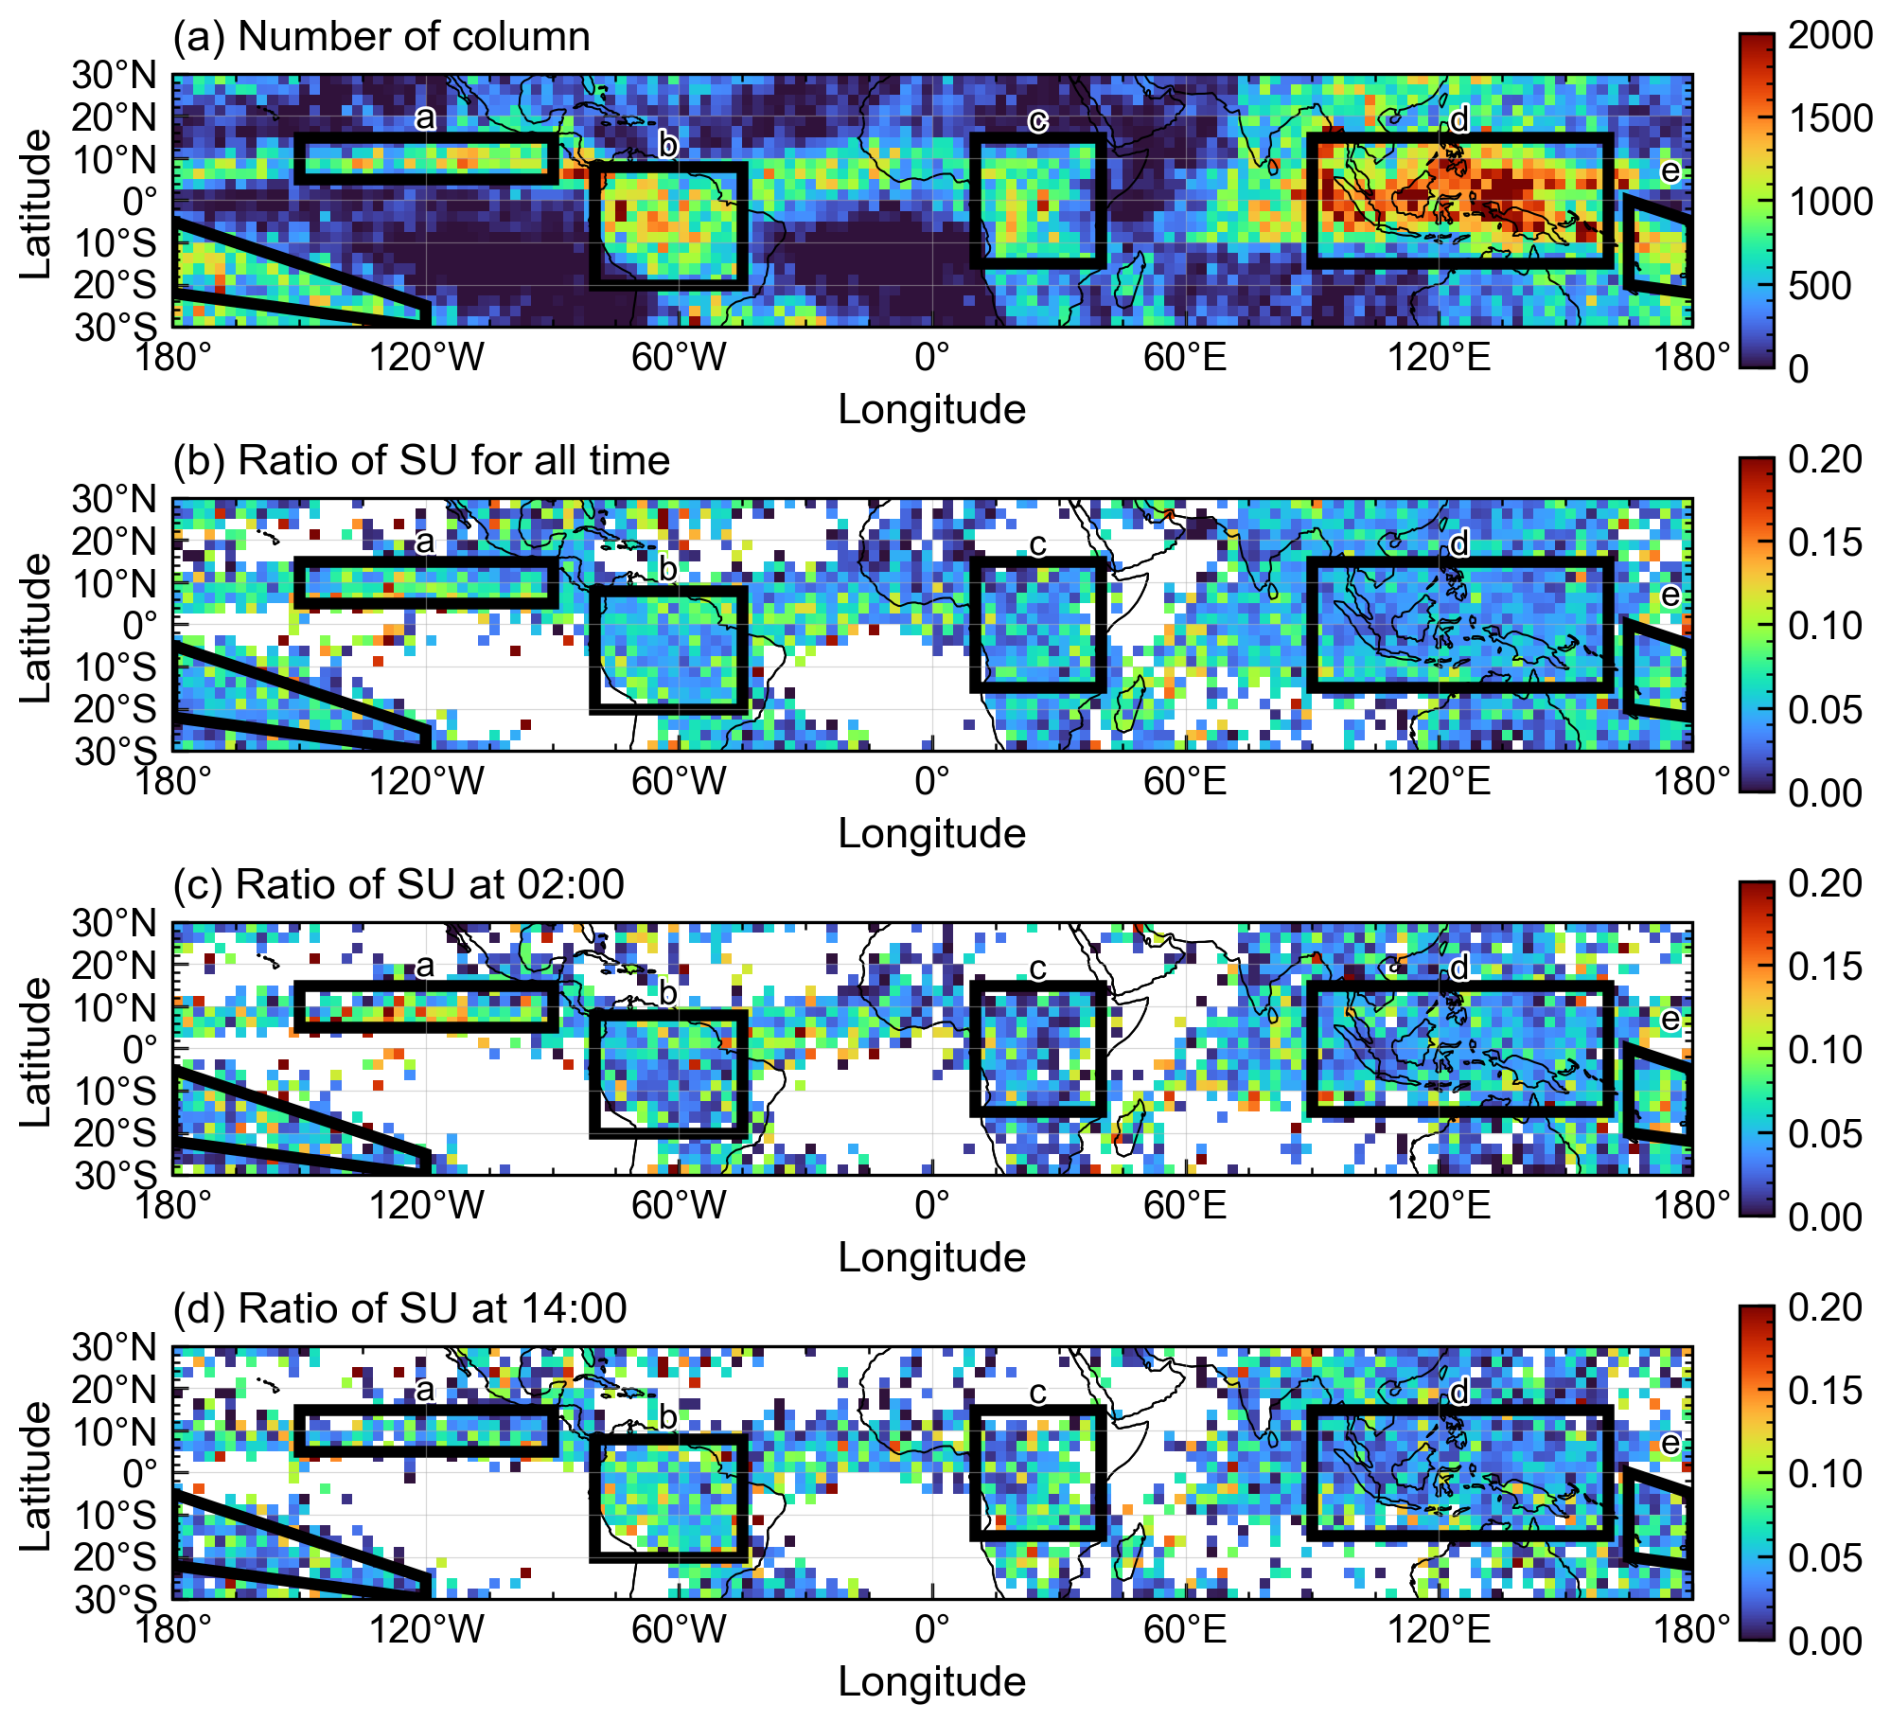
Figure 7Spatial distribution of the analyzed columns and the occurrence of strong-updraft (SU) columns. (a) Number of selected convective columns per 2.5° × 2.5° grid box over 30° S–30° N. (b) Fraction of SU columns (MaxVd > 2.0 m s−1) relative to all convective columns in each grid box. (c–d) Same as (b), but separated by local overpass time: (c) late night (∼ 02:00 LT; ascending node) and (d) early afternoon (∼ 14:00 LT; descending node). Grid boxes with fewer than 100 total columns are masked in (b)–(d). Black rectangles labeled a–e indicate the regions used for the regional analyses (EPAC–ITCZ, Amazon, central Africa, Maritime Continent, and SPCZ).
The MaxVd-based SU ratio, defined as in Sect. 2.4.2 for each 2.5° × 2.5° grid box, exhibits modest regional variability (Fig. 7b). In most grid boxes, the SU ratio remains below 0.10, and only a limited number of boxes exceed 0.15. Representative values for convectively active regions are summarized in Table 1. For all local times combined, the tropical-mean SU ratio is 4.88 %. The all-time SU ratio does not show a simple land–ocean contrast; instead, measurable SU occurrence is enhanced in several organized convective regimes, including both continental (5.50 % over the Amazon) and oceanic convergence regions (5.18 % over the SPCZ and 6.50 % over the EPAC-ITCZ).
Table 1Regional occurrence of MaxVd-based strong-updraft (SU) columns and columns affected by Doppler-velocity folding. For each domain and local overpass time, the table lists the total number of selected convective columns, the number of non-folded columns, the number of non-folded SU columns, the number of folded columns, the SU ratio, and the folded-column ratio. SU columns are defined as non-folded columns with MaxVd > 2.0 m s−1, and folded columns are interpreted as extreme-updraft (EU) candidates. Both ratios use the same denominator: the total number of selected convective columns in the corresponding region and local-time category. “All” denotes the tropical aggregate over 30° S–30° N. Region definitions are shown in Fig. 7a (see Sect. 3.2.1).
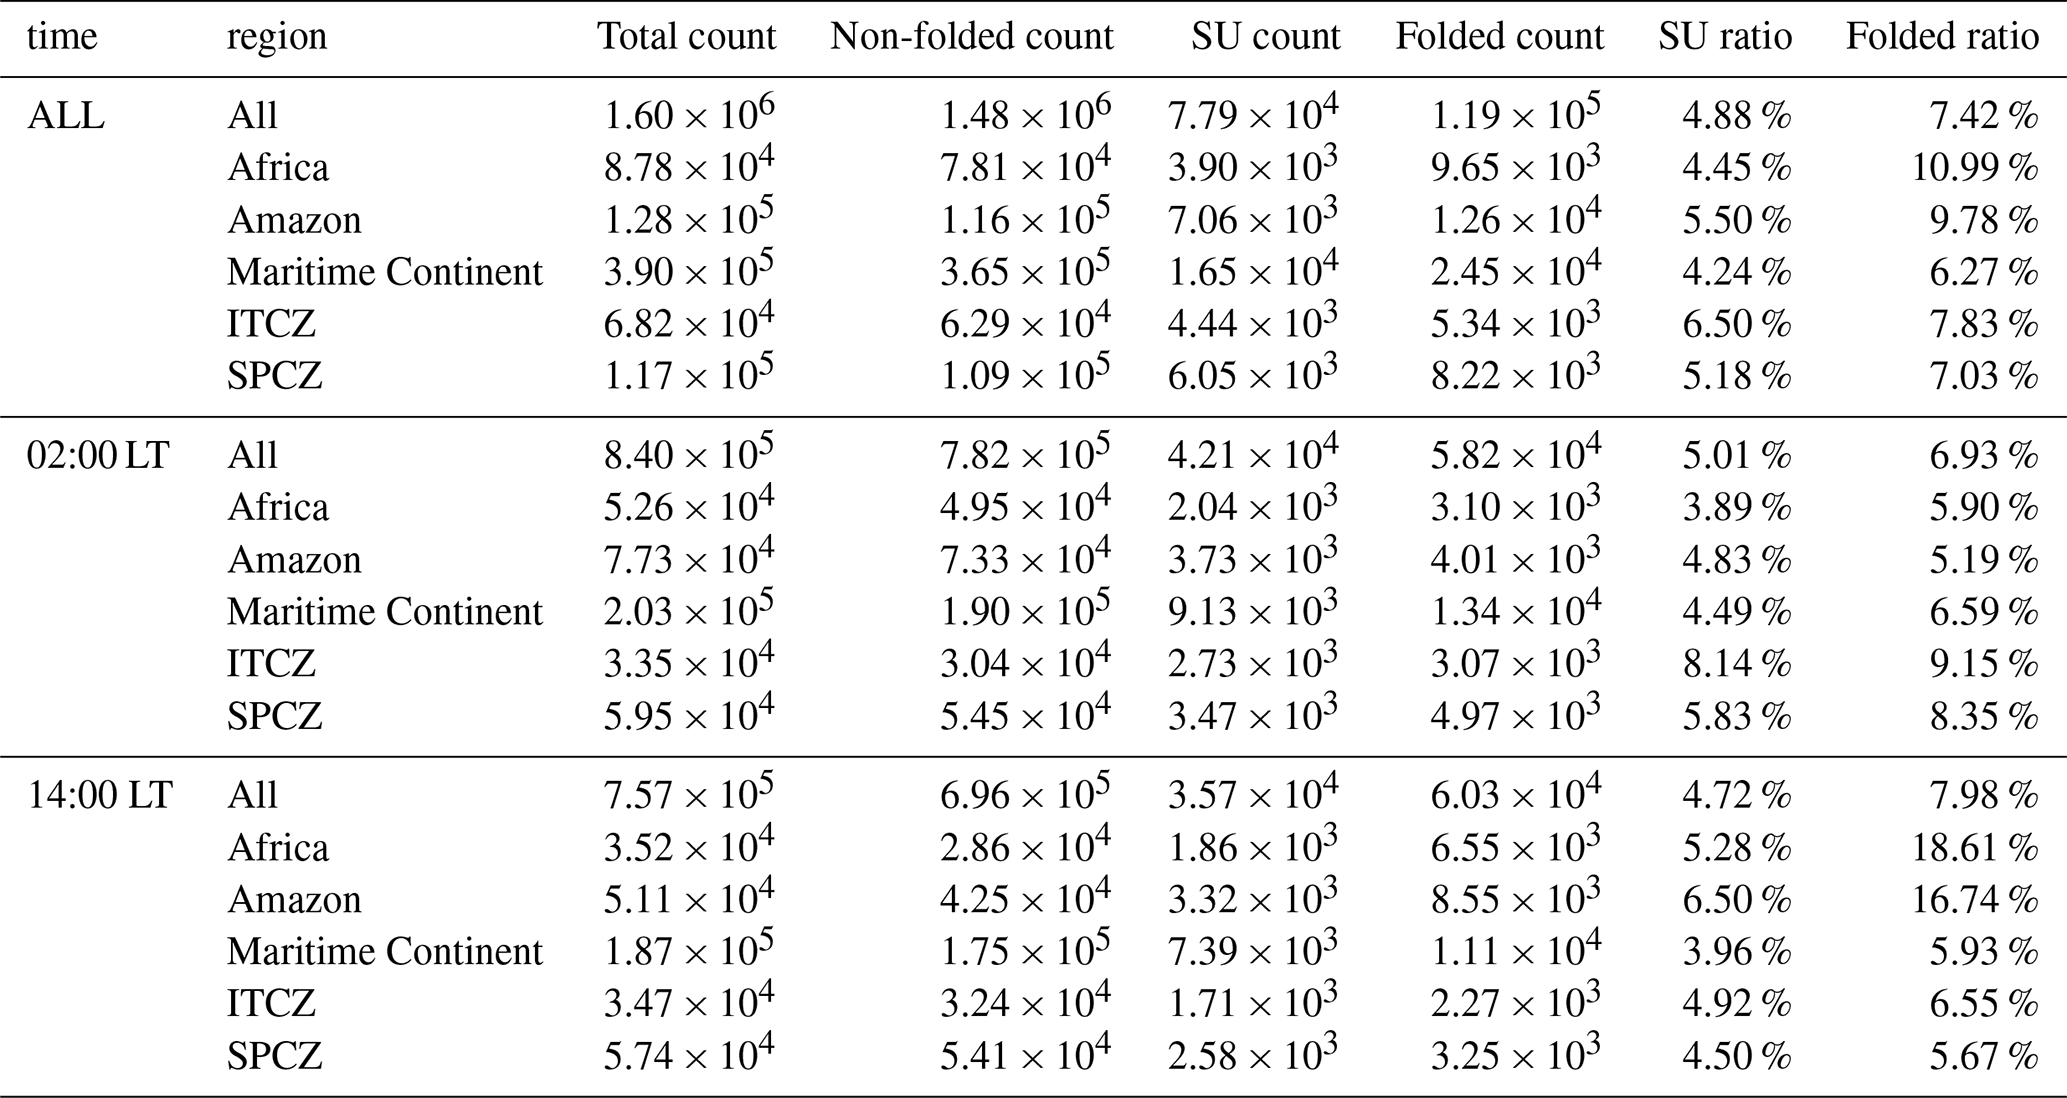
When the statistics are separated by local overpass time – late night (ascending node, around 02:00 LT) versus early afternoon (descending node, around 14:00 LT) – the regional contrast becomes clearer (Fig. 7c–d, Table 1). Over oceanic convergence zones, the SU ratio is generally higher at night or shows only a weak afternoon enhancement. In contrast, continental regions show a moderate afternoon enhancement. These values (5.28 % over central Africa and 6.50 % over the Amazon) are higher than the 14:00 LT tropical mean of 4.72 %, but the contrast is not as strong as in conventional proxy-based climatologies of the most extreme convection. This muted contrast is expected because the MaxVd-based SU category includes only non-folded columns for which quantitative Doppler velocities can be retrieved. The most intense convective cores may instead enter the folded-column category.
The spatial distribution of EU ratio highlights this limitation and provides complementary information (Fig. 8). The EU ratio is defined as the number of columns affected by Doppler-velocity folding divided by the same total number of selected convective columns used for the SU ratio. For all local times combined, the tropical-mean EU ratio is 7.42 % (Table 1). Regional values are largest over central Africa and the Amazon, where the all-time EU ratios reach 10.99 % and 9.78 %, respectively. In contrast, the Maritime Continent region has a lower EU ratio of 6.27 %.
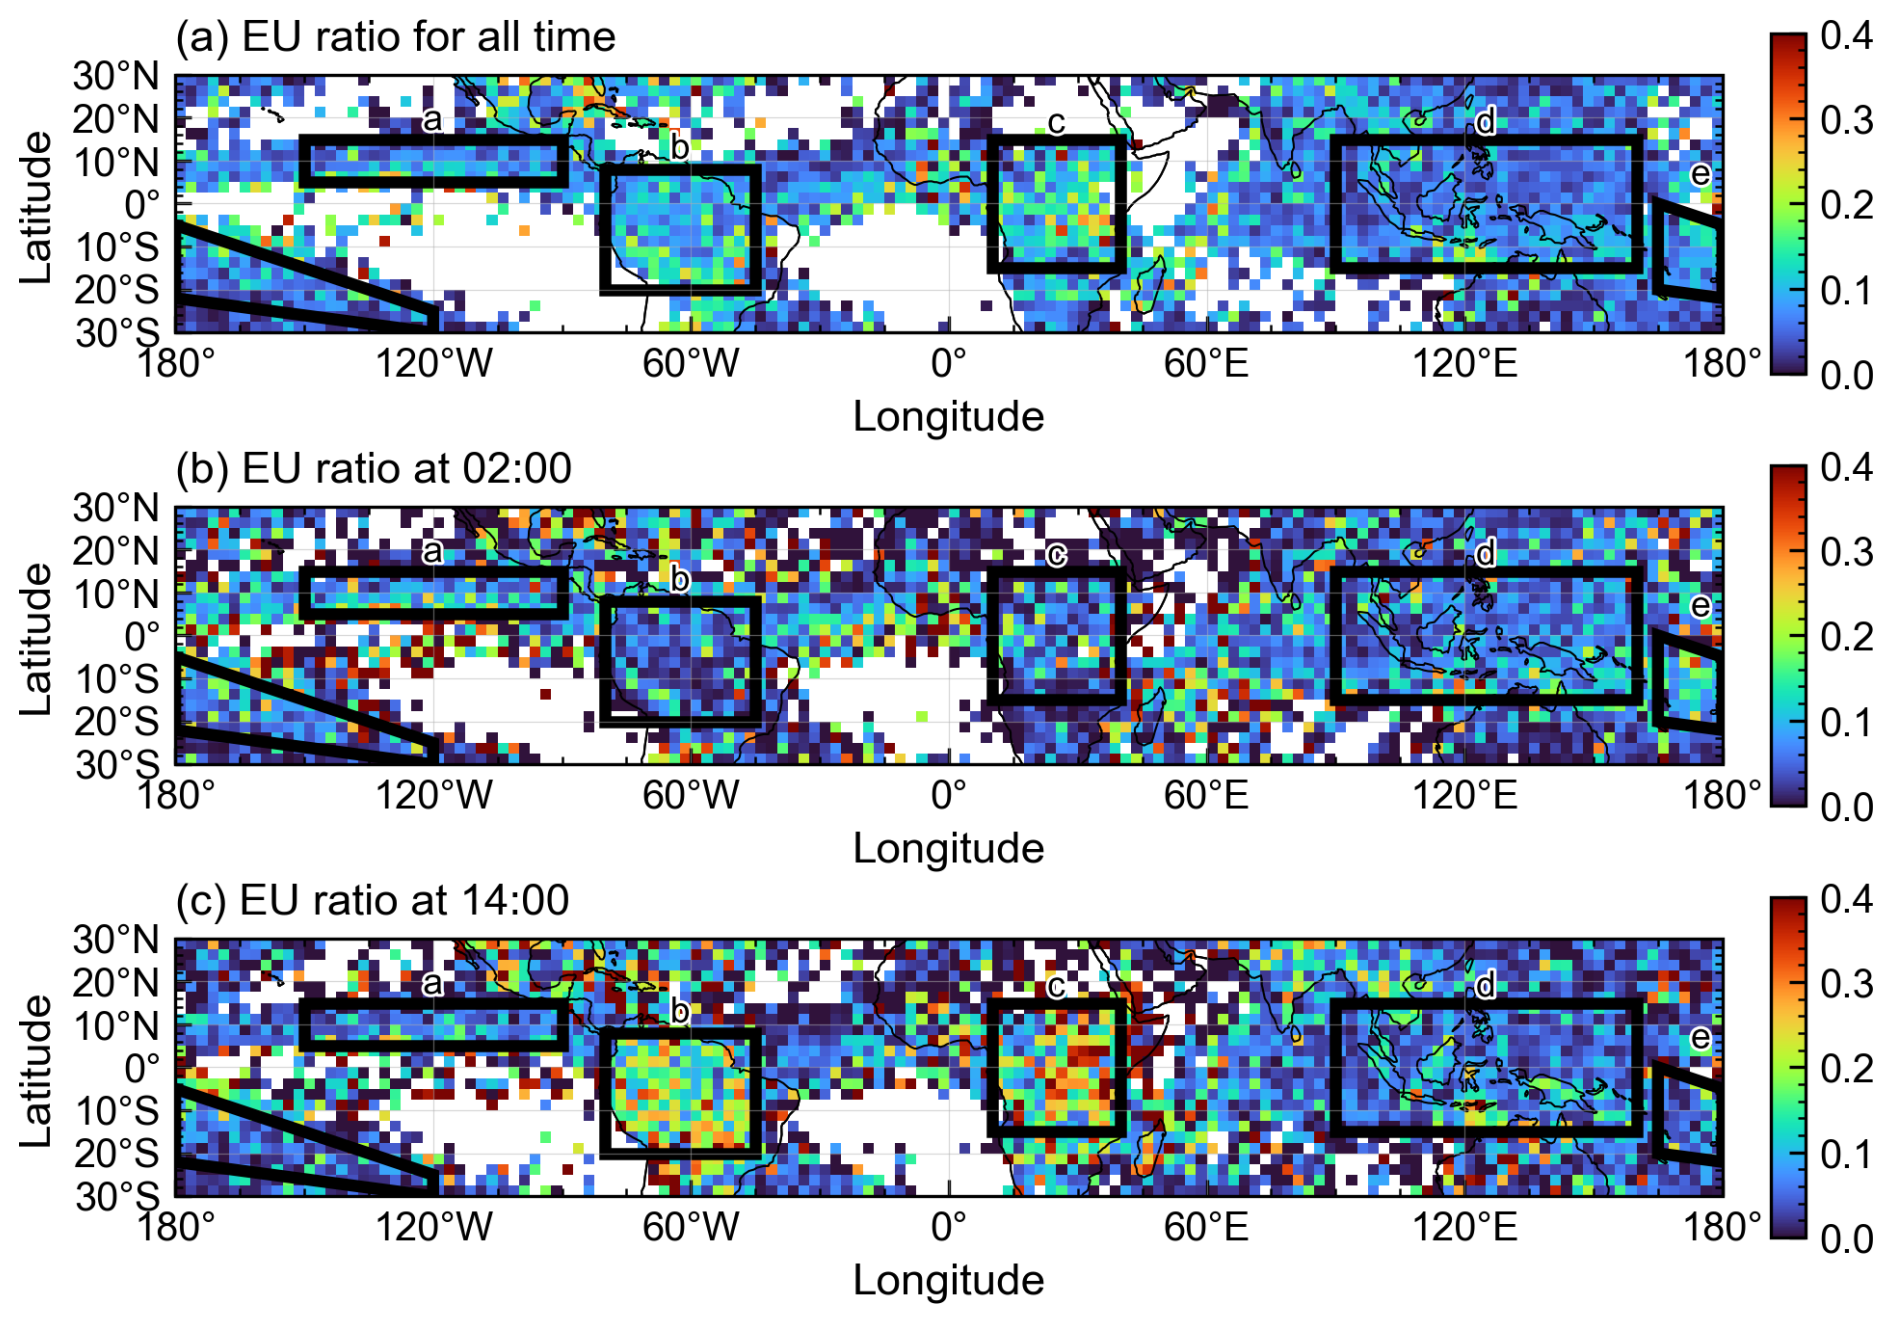
Figure 8Spatial distribution of the occurrence of extreme-updraft (EU) columns. (a) Fraction of EU candidate columns (folded-column) relative to all convective columns in each grid box. (b, c) Same as (a), but separated by local overpass time: (b) late night (∼ 02:00 LT; ascending node) and (c) early afternoon (∼ 14:00 LT; descending node). Grid boxes with fewer than 100 total columns are masked in (a)–(c). Black rectangles labeled a–e indicate the regions used for the regional analyses (EPAC–ITCZ, Amazon, central Africa, Maritime Continent, and SPCZ).
The local-time dependence of the EU ratio is much stronger than that of the SU ratio. At 02:00 LT, the EU ratio is relatively low over central Africa and the Amazon, whereas oceanic convergence zones such as the EPAC-ITCZ and SPCZ show higher nighttime values. At 14:00 LT, however, the EU ratio increases sharply over the continental regions, reaching 18.61 % over central Africa and 16.74 % over the Amazon. These values are far higher than the 14:00 LT tropical mean of 7.98 % and much larger than the corresponding SU ratios of 5.28 % and 6.50 %. By contrast, the 14:00 LT EU ratios remain relatively modest over the Maritime Continent region, the EPAC-ITCZ, and the SPCZ.
Taken together, Figs. 7 and 8 and Table 1 indicate that MaxVd-based SU and folding-based EU statistics capture complementary aspects of intense convection. The SU ratio quantifies the occurrence of columns with measurable upward hydrometeor Doppler motion and shows moderate regional and diurnal variability. The EU ratio, by contrast, identifies Nyquist-limited columns for which MaxVd cannot be quantitatively retrieved, and it reveals a much stronger continental afternoon enhancement. The pronounced 14:00 LT increase in EU occurrence over central Africa and the Amazon suggests that a substantial fraction of the most intense continental convective cores is not represented in the non-folded MaxVd-based SU population. Therefore, the weaker regional contrast in the SU ratio should not be interpreted as evidence that continental afternoon convection is only moderately intense; rather, it reflects the fact that the most extreme Doppler signatures are partly shifted into the Doppler-velocity-folded EU category.
This geographical and diurnal pattern is consistent with prior satellite-based characterizations using other convective-intensity metrics, such as echo-top height and lightning flash rate (Nesbitt and Zipser, 2003; Christian et al., 2003; Liu and Zipser, 2005; Zipser et al., 2006; Liu et al., 2008; Cecil et al., 2014; Pilewskie and L'Ecuyer, 2022). The regional contrast found here is also consistent with the satellite-inferred characteristics of vertical velocity by Jeyaratnam et al. (2021), which show enhanced convective vertical motions over continental regions. The EarthCARE CPR Doppler observations provide a complementary, solely observation-based constraint on this regional variability.
3.2.2 Structural origin of regional and diurnal contrasts
What differences in cloud properties account for the moderate early-afternoon enhancement of SU columns and the much more pronounced enhancement of EU columns over central Africa and the Amazon (Sect. 3.2.1; Table 1)? Guided by the column-wise radar-reflectivity structural analysis in Sect. 3.1, we address this question by examining the median CTH, ETH(0), and their separation, ΔH ≡ CTH − ETH(0). In addition, we consider a simple morphology metric – the cloud length – defined as the along-track length of contiguous cloudy segments.
As summarized in Table 2, clouds over central Africa and the Amazon during the early afternoon do not stand out as being exceptionally tall. The median CTH and ETH(0) over central Africa and the Amazon are comparable to, or even slightly lower than, those in other convective regions. Thus, the enhanced occurrence of intense convective columns in continental afternoon regimes cannot be explained simply by systematically higher cloud or echo tops.
Table 2Regional median structural metrics. Regional medians of cloud-top height (CTH; km), 0 and 10 dBZ echo-top height [ETH(0) and ETH(10); km], their separation from CTH (km), and along-track cloud length (km) for the tropical aggregate and five convective regions (central Africa, Amazon, Maritime Continent, EPAC–ITCZ, and SPCZ), stratified by local overpass time (All, ≈ 02:00 LT, and ≈ 14:00 LT). Region definitions are shown in Fig. 7a (see Sect. 3.2.1).
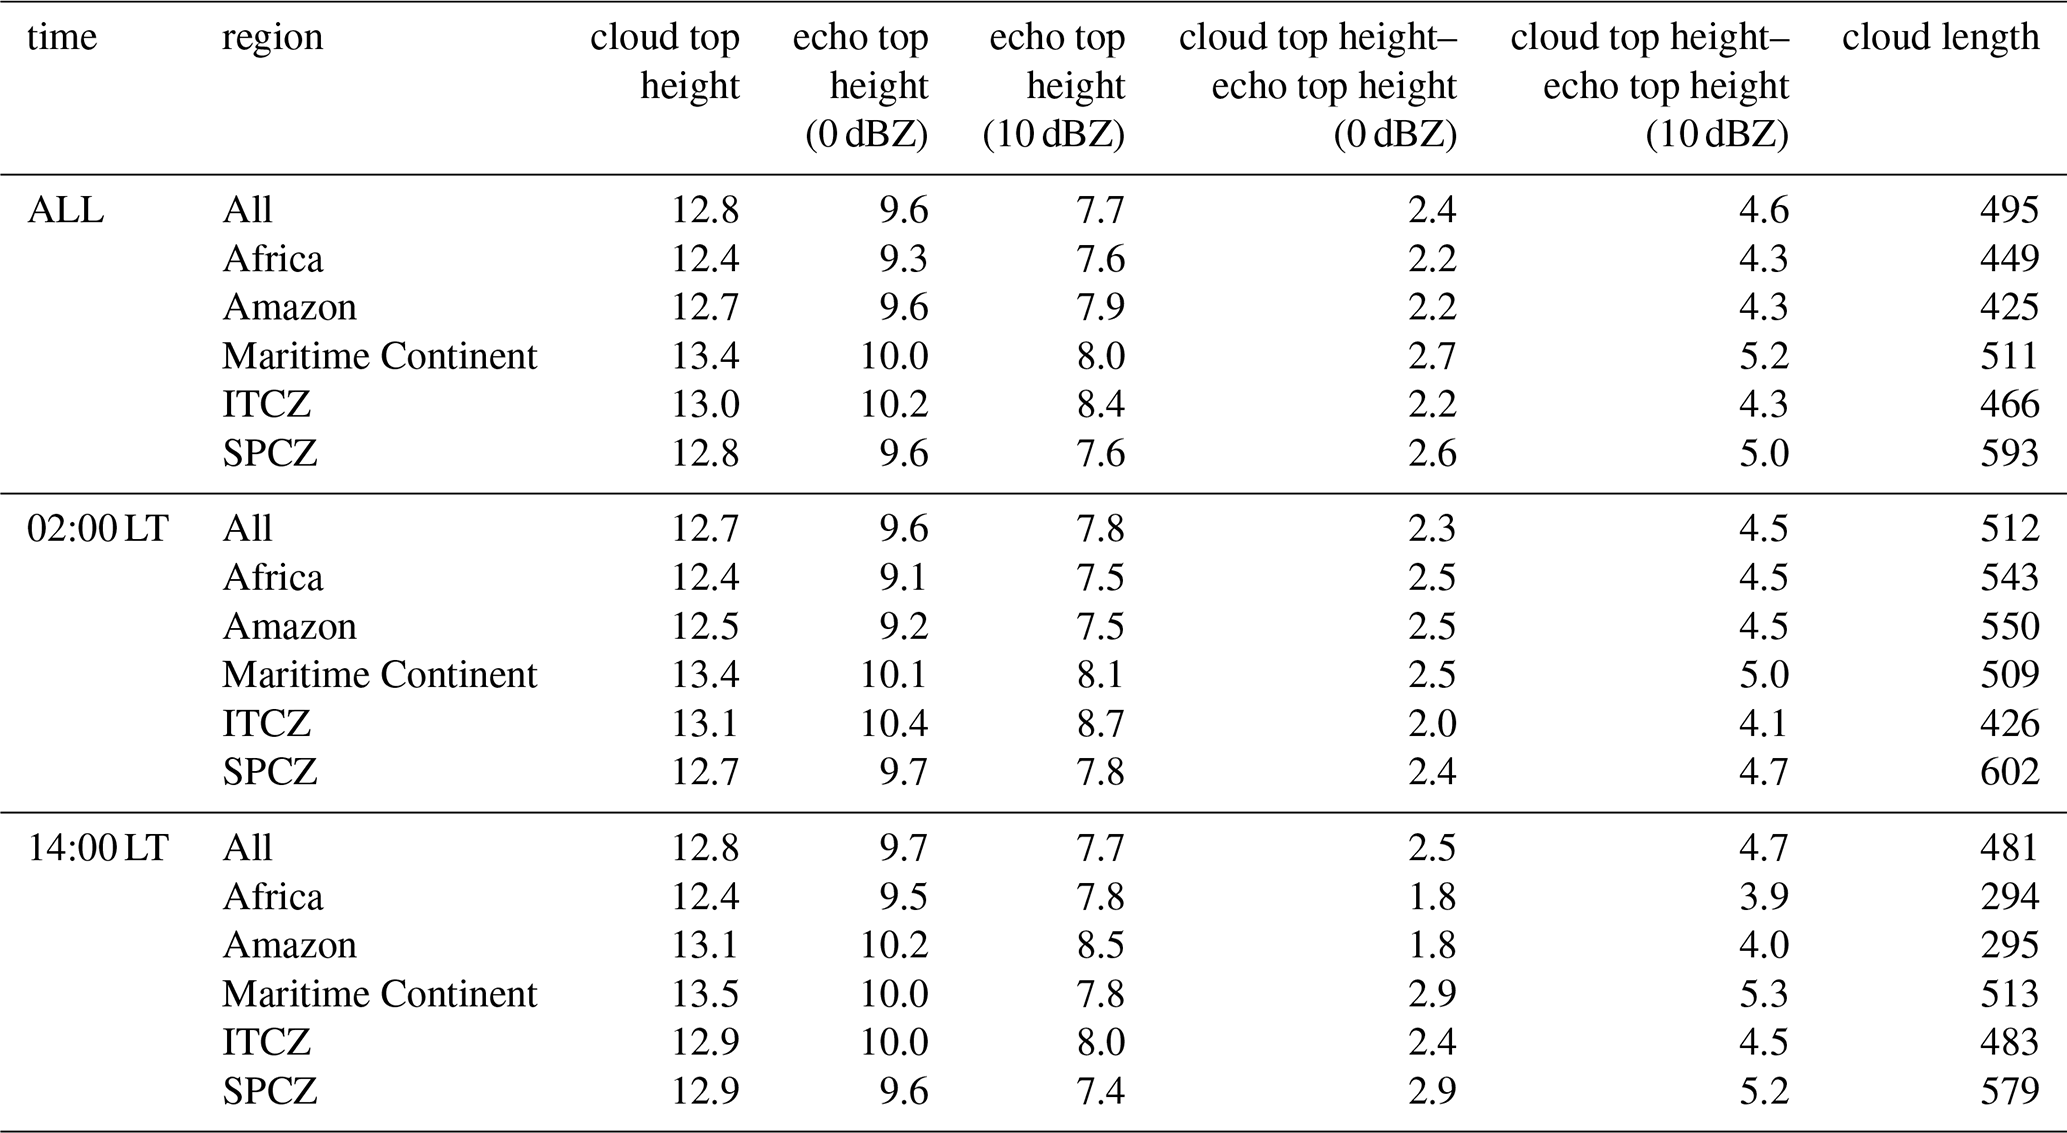
Instead, the most distinctive feature of early-afternoon convection over central Africa and the Amazon is a markedly smaller ΔH. The tropical-mean median ΔH at 14:00 LT is 2.5 km, whereas it is only 1.8 km over central Africa and over the Amazon – smaller than in the other major convective regions listed in Table 2. A complementary perspective is obtained by comparing the median ΔH with the difference between the median CTH and median ETH(0). For afternoon central Africa and the Amazon, the differences between the median CTH and median ETH(0) are approximately 2.9 km, whereas the median ΔH values are only 1.8 km. These comparisons indicate that the ΔH distributions are skewed toward small values and that clouds with small CTH–ETH(0) separation occupy a disproportionately large fraction of the population, with this tendency being particularly pronounced in early-afternoon convection over central Africa and the Amazon.
Horizontal cloud length, summarized in Table 2, provides an additional clue to the nature of the underlying convective systems. The tropical-mean median cloud length at 14:00 LT is 481 km, but it is only 294 and 295 km over central Africa and the Amazon, respectively, during the early afternoon. In contrast, the SPCZ and the Maritime Continent exhibit substantially larger median cloud lengths of 579 and 513 km, respectively, at 14:00 LT. These statistics suggest that early-afternoon convection over central Africa and the Amazon is dominated by relatively compact systems, whereas oceanic regions – especially the SPCZ and the Maritime Continent – more frequently host large, organized systems.
To further characterize regional differences in the CTH–ETH(0) relationship, we examine deviations of the two-dimensional histograms of CTH versus ETH(0) from a tropics-wide reference distribution, constructed by combining all regions and local times, as shown in Fig. 9a–c. For early-afternoon convection over central Africa and the Amazon, the difference maps indicate a reduced occurrence of stratiform-like profiles characterized by large ΔH, together with an enhanced occurrence of profiles exhibiting small ΔH and moderate-to-high cloud tops. When considered alongside the relatively short cloud lengths, these features indicate a cloud population skewed toward developing or mature convective columns, rather than decaying systems with extensive stratiform regions.
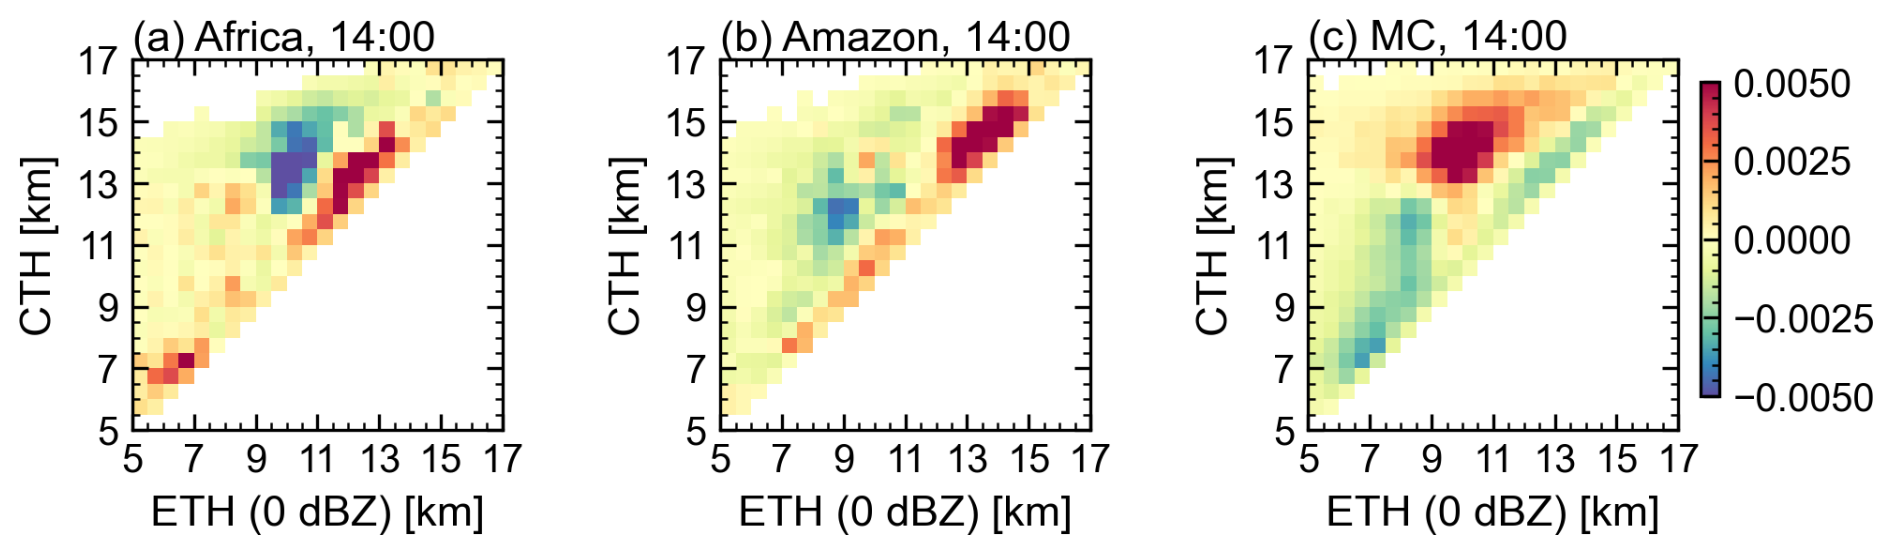
Figure 9Deviations in the joint probability density function (PDF) of cloud-top height (CTH) and the 0 dBZ echo-top height [ETH(0)] relative to the tropics-wide reference distribution (all regions and local times combined). Panels show early afternoon (∼ 14:00 LT) convection over (a) central Africa, (b) the Amazon, and (c) the Maritime Continent. Bin size is 0.5 km in both dimensions; only bins with N ≥ 100 columns are shown.
We next examine in greater detail how these structural differences relate to the occurrence of MaxVd-based SU columns. To this end, we analyze deviations in the SU ratio as a function of CTH and ETH(0) from the tropics-wide relationship shown in Fig. 6, as shown in Fig. 10a–c. Over early-afternoon convection in central Africa and the Amazon, the SU-ratio deviations are generally weak and spatially patchy. In other words, columns with small CTH–ETH(0) separation are more common over central Africa and the Amazon, but they are not necessarily much more likely to be classified as MaxVd-based SU columns than columns with the same CTH–ETH(0) structure in the tropics-wide reference distribution. The elevated regional SU occurrence therefore arises primarily from a shift in the underlying cloud population toward small-ΔH structures, rather than from a systematic increase in the probability that a given small-ΔH column contains measurable strong upward hydrometeor Doppler motion.
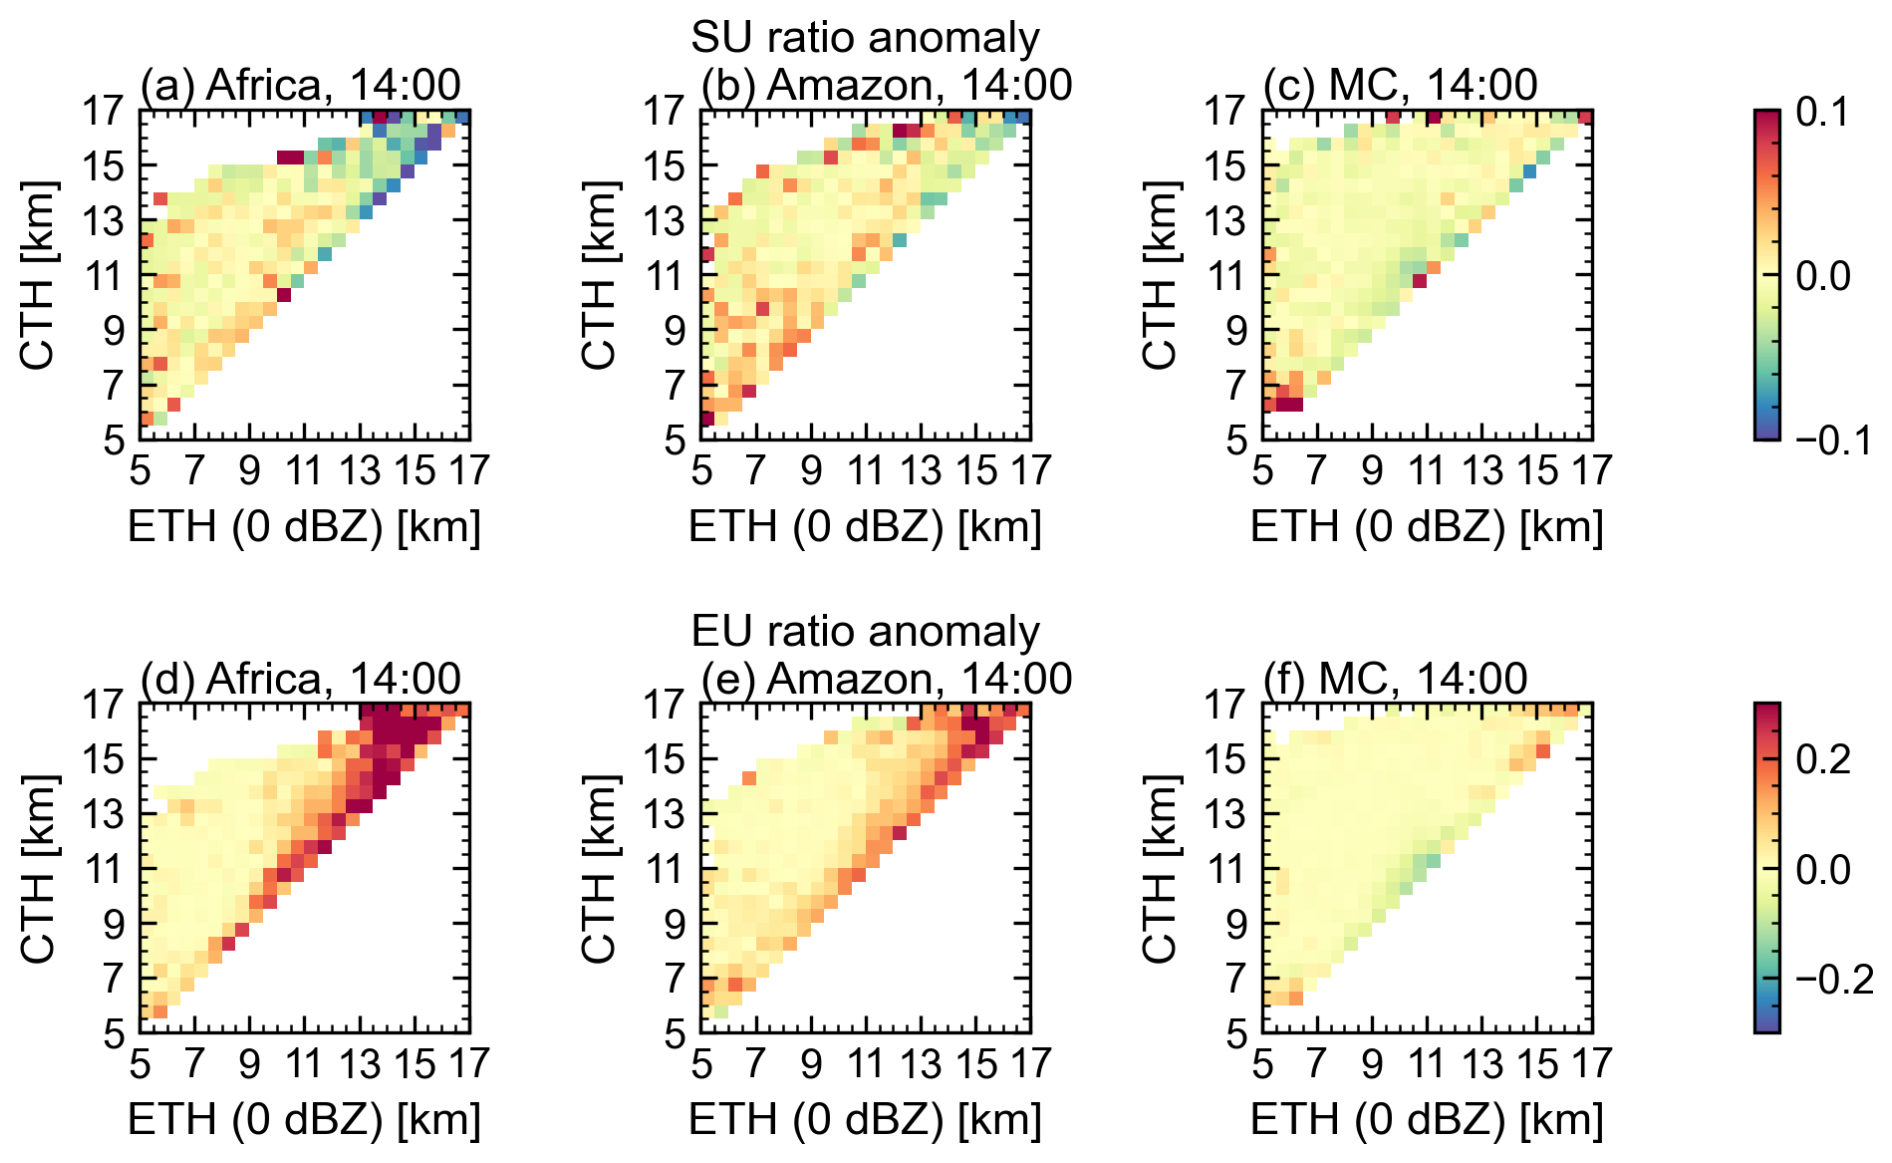
Figure 10Deviations in Doppler-based occurrence ratios conditioned on cloud-top height (CTH) and the 0 dBZ echo-top height [ETH(0)] for early afternoon (∼ 14:00 LT). Panels (a)–(c) show deviations in the MaxVd-based SU ratio, and (d)–(f) show deviations in the Doppler-velocity folded-column ratio, for (a, d) central Africa, (b, e) the Amazon, and (c, f) the Maritime Continent. Bin size is 0.5 km in both dimensions; only bins with N ≥ 100 columns are shown.
The folded-column ratio, interpreted here as the EU ratio, provides an additional perspective on the same structural regime (Fig. 10d–f). In contrast to the weak SU-ratio deviations, the EU ratio shows clear positive anomalies over central Africa and the Amazon at 14:00 LT, particularly near the 1 : 1 line and in the high-CTH and high-ETH(0) regime. This indicates that Doppler-velocity folding occurs preferentially in columns where the 0 dBZ echo top approaches the cloud top. Because reliable MaxVd quantification is difficult in these folded columns, they are excluded from the MaxVd-based SU statistics. The positive EU anomalies therefore suggest that SU statistics alone do not capture the full population of intense continental afternoon convection; part of this population is instead identified through Doppler-velocity folding.
The Maritime Continent provides a useful contrast. Despite having relatively high median CTH and ETH(0), comparable to or exceeding those over central Africa and the Amazon (Table 2), SU occurrence over the Maritime Continent remains close to or slightly below the tropical mean and is therefore substantially lower than that over these continental regions (Table 1). Structurally, clouds over the Maritime Continent tend to exhibit larger ΔH and longer horizontal extents, indicating a greater prevalence of deep convective systems with broad stratiform regions. This pattern is also evident in Fig. 9c, which shows an enhanced frequency of clouds with high CTH but relatively low ETH(0). Furthermore, the both SU and EU ratio at a given CTH–ETH(0) pair (Fig. 10c, f) tends to be weak or negative over parts of the small-ΔH developing-cloud regime. Thus, over the Maritime Continent, the more frequent occurrence of stratiform-like profiles, together with weaker SU and EU enhancements at fixed CTH and ETH(0), leads to an overall smaller occurrence of intense convective columns.
These regional patterns are consistent with previous satellite-based analyses of deep convective intensity across the three major tropical “chimney zones”, which show that convection over tropical Africa exhibits the strongest updrafts, Amazonia is intermediate, and the tropical Maritime Continent regime displays the weakest convective intensity when measured using radar echo-top heights and related proxies (e.g., Takahashi and Luo, 2014; Takahashi et al., 2017, 2023; Liu et al., 2007; Zipser et al., 2006). Our results support these findings by showing a broadly consistent regional ordering using EarthCARE CPR Doppler-velocity measurements while adding two constraints that were not available from proxy-based studies alone. First, the continental-afternoon enhancement of MaxVd-based SU occurrence is mainly linked to a higher frequency of compact small-ΔH cloud structures. Second, the stronger EU signal indicates that part of the most intense continental-afternoon convection lies in the Nyquist-limited regime, where MaxVd cannot be quantified reliably. The combined SU and EU statistics therefore show that regional contrasts in convective intensity are controlled not simply by cloud-top height, but by the joint structure of CTH, ETH(0), ΔH, cloud morphology, and Doppler-velocity folding.
This study exploits the first global Doppler-velocity observations from space using the EarthCARE/CPR to diagnose updraft strength in tropical convective clouds and to relate it to the reflectivity-based vertical structure. While most previous satellite studies have inferred convective intensity using indirect proxies, we directly analyze vertical particle motions with explicit consideration of Doppler-velocity folding. Importantly, while our selection criteria focus on cold-topped, vertically developed convection, the analysis samples a range of cloud-top and echo-top structures and is not limited to the tallest echo-top cases.
In this study, we developed a method to extract measurable strong-updraft (SU) columns and columns affected by Doppler-velocity folding, treated as extreme-updraft (EU) candidates, from quality-controlled EarthCARE/CPR Doppler-velocity profiles. Here, the quality-control procedure consists of: (1) masking weak echoes, (2) restricting quantitative diagnostics to range gates colder than 273.15 K, (3) applying modest spatial averaging, and (4) flagging velocity folding. We define MaxVd as the maximum upward (positive) Doppler velocity within the subfreezing portion of each non-folded profile and classify non-folded measurable strong-updraft columns (SU) as those with MaxVd > 2.0 m s−1, whereas columns affected by Doppler-velocity folding are analyzed separately as extreme-updraft (EU) candidates. Thus, SU and EU are treated as complementary diagnostics: the former quantifies measurable upward hydrometeor Doppler motion, while the latter identifies Nyquist-limited columns likely associated with more extreme updraft regimes. We analyzed EarthCARE/CPR observations from January to December 2025 over the tropical region (30° S–30° N).
Using the common denominator of all the selected convective columns, SU columns account for 4.88 % of the tropical sample, whereas EU columns account for 7.42 %. These occurrence ratios indicate that both categories are relatively rare yet dynamically important, and that a substantial fraction of intense convective columns is represented by the folded EU population rather than by the non-folded MaxVd-based SU population alone. Both SU and EU columns exhibit systematically higher CTH and, more notably, higher ETH(0) and ETH(10) than NonSU columns. We further show that both SU and EU occurrence ratios increase markedly where ΔH ≡ CTH − ETH(0) is small.
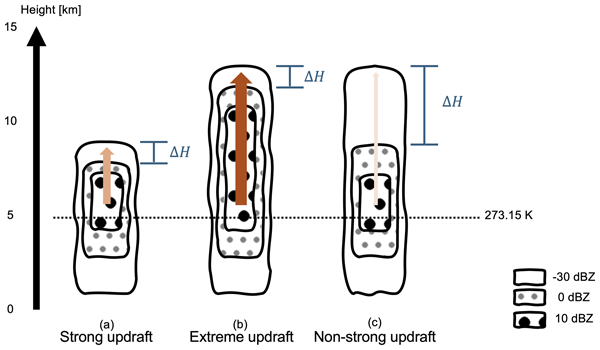
Figure 11 summarizes the relationship between updraft strength and the vertical structure of radar reflectivity. When the 0 and 10 dBZ echo-top heights rise close to the cloud top, the separations CTH–ETH(0) and CTH–ETH(10) become small, indicating that high-reflectivity hydrometeors are lofted to near-cloud-top levels. Columns with small separations can meet the MaxVd-based SU criterion even when the cloud-top height itself is modest (Fig. 11a), whereas EU columns occur preferentially when the same small-separation structure is accompanied by much taller cloud and echo tops (Fig. 11b). In contrast, when reflectivity increases gradually downward from the cloud top and both the 0 and 10 dBZ levels remain well below the CTH, updrafts are typically weak (Fig. 11c). These results indicate that the reflectivity structure beneath the cloud top can serve as a robust proxy for both measurable strong-updraft columns and Nyquist-limited extreme-updraft candidates: smaller CTH–ETH(0) separations correspond to stronger updraft regimes, whereas larger separations correspond to weaker updrafts.
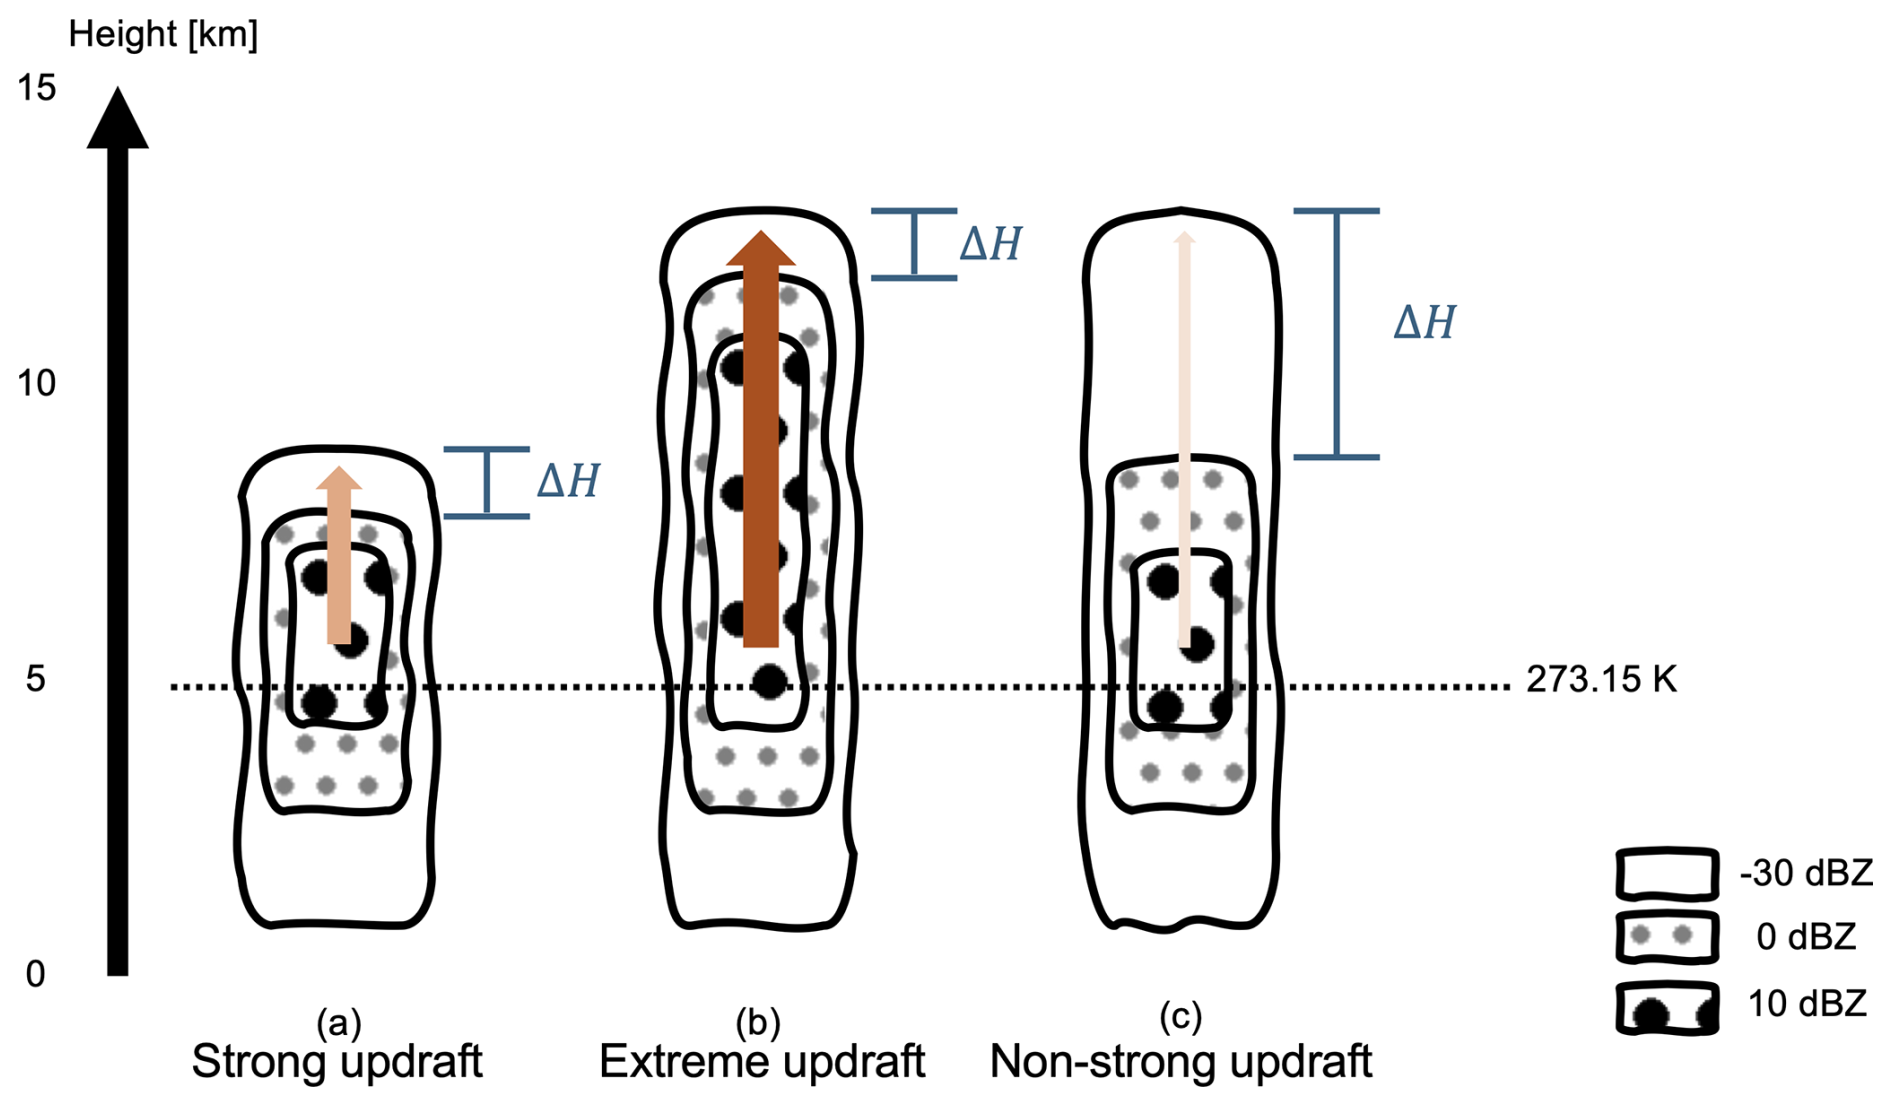
Figure 11Conceptual schematic of typical radar-reflectivity structures associated with strong and weak updraft columns. Grey outlines indicate regions with dBZ, grey stippling indicates regions with Ze>0 dBZ, and large black filled dots indicate regions with Ze>10 dBZ. Orange arrows illustrate updraft strength qualitatively. Panel (a) shows strong-updraft cases in which the 0 and 10 dBZ echo tops rise close to the cloud top (small CTH–ETH(0)) and moderately deep cloud. Panel (b) shows extreme-updraft cases in which the 0 and 10 dBZ echo tops rise close to the cloud top (small CTH–ETH(0)) and exceedingly deep cloud. Panel (c) shows a weak-updraft case characterized by a top-light structure in which reflectivity increases gradually downward and both ETH(0) and ETH(10) remain well below the cloud top.
This finding provides direct observational support for CloudSat-era intensity proxies based on small CTH–ETH(0) separations (e.g., Takahashi and Luo, 2014; Takahashi et al., 2017, 2023; Liu et al., 2007). The novelty of this study lies in leveraging direct Doppler-velocity measurements to move beyond the proxy-based estimates of convective intensity used in previous satellite studies and in extending the same structural interpretation to EU columns. Our results support the central premise of proxy approaches but also refine it by ranking the tested indicators for the measurable SU population: the cloud-top–echo-top separation ΔH (CTH − ETH(0)) is the most informative metric for identifying strong updrafts, followed by ETH(10), ETH(0), and finally CTH. The same small-ΔH structure is also preferentially associated with EU.
Regionally, the combined SU and EU statistics reveal complementary aspects of tropical convective intensity. The all-time SU ratio shows moderate regional variability. By contrast, the all-time EU ratio shows a clearer continental enhancement, reaching 10.99 % over central Africa and 9.78 % over the Amazon, compared with tropical mean of 7.42 %. When comparing the 02:00 and 14:00 LT overpasses, oceanic convergence zones exhibit either a nighttime enhancement or a weak early-afternoon signal in both diagnostics, whereas continental regions show an afternoon enhancement that is modest for SU but pronounced for EU. At 14:00 LT, the SU ratios over central Africa and the Amazon are 5.28 % and 6.50 %, respectively, only moderately higher than the tropical mean of 4.72 %; the corresponding EU ratios, in contrast, reach 18.61 % and 16.74 %, far above the tropical mean of 7.98 %.
Structurally, during the afternoon over Africa and the Amazon, CTH and ETH(0) are not exceptionally large in absolute terms; instead, the separation ΔH = CTH − ETH(0) remains consistently small. The median ΔH at 14:00 LT is 1.8 km over central Africa and over the Amazon, compared with the tropical mean of 2.5 km, and the median cloud lengths are only 294 and 295 km, respectively, compared with the tropical mean of 481 km. In contrast, the Maritime Continent and the SPCZ exhibit larger ΔH and longer horizontal extents, indicating a greater prevalence of deep convective systems with broad stratiform regions. For SU, the regional enhancement therefore primarily reflects a greater contribution from horizontally compact, developing-to-mature convective cores characterized by small ΔH, rather than from unusually tall clouds. For EU, the same structural regime produces a stronger signal: Doppler-velocity folding occurs preferentially where ETH(0) approaches CTH and where high-reflectivity hydrometeors are lofted to near-cloud-top levels.
Taken together, these results reinforce the interpretation in Fig. 11 that ΔH is a key structural discriminator of both SU and EU occurrence, both in column-scale statistics and across regional and local-time contrast. This establishes a physically consistent link between regional contrasts in Doppler-derived updraft signatures and the vertical reflectivity structure of tropical convective systems.
These measurements help close a long-standing observational gap in global constraints on convective updrafts and enable the development of a new dynamical climatology. This climatology can be used to calibrate convective parameterizations in global climate models (GCMs) and to benchmark explicitly resolved convection in global kilometer-scale simulations. A key question for numerical models is whether they reproduce (i) regional and diurnal contrasts in the frequency of measurable strong-updraft columns and EU-candidate columns and (ii) the joint statistics of updraft signatures and radar-echo structure documented here. Takahashi et al. (2025) compared deep convective clouds simulated by global storm-resolving models with CloudSat observations. Within that framework, cloud-top height and radar-derived echo-top metrics could be evaluated against CloudSat observations; however, updraft intensity could not be validated because CloudSat lacks Doppler-velocity measurements. Consequently, comparisons of updraft strength were necessarily limited to inter-model differences and proxy-based diagnostics. These studies identified substantial biases in convective intensity and precipitation formation, indicating inconsistencies between cloud dynamics and microphysics. Our EarthCARE-based diagnostics overcome this limitation by directly linking MaxVd-based SU occurrence and folding-based EU occurrence to the vertical structure of radar reflectivity. These constraints enable rigorous tests of whether models not only reproduce observed cloud-top and precipitation-top heights but also associate these structures with realistic updraft velocities and observationally comparable Doppler-velocity folding occurrence, thereby providing a process-oriented pathway to improve the coupling between convective dynamics and microphysics in both parameterized and explicitly resolved convection.
Despite these advances, this study has several limitations that highlight priorities for future work. First, our analysis is based on a one-year record, which is too short to characterize the full range of intraseasonal and interannual variability, including the Madden–Julian Oscillation (MJO) and the El Niño–Southern Oscillation (ENSO). Extending the analysis to multi-year data sets will be essential for quantifying how long-period variability modulates convective updrafts. Second, to ensure data quality, MaxVd-based SU statistics exclude columns affected by Doppler-velocity folding. Because folding preferentially occurs in the strongest updraft regimes, SU statistics alone likely underestimate both the frequency and magnitude of the most extreme convective events. Treating folded columns as EU candidates partly addresses this under-sampling by retaining them as a qualitative diagnostic, but it does not provide quantitative updraft magnitudes. Developing a physically based unfolding algorithm for the CPR is therefore a high priority to mitigate this bias and to convert EU-candidate occurrence into quantitative velocity information. Third, our Doppler-based diagnosis is restricted to subfreezing gates (temperature < 273.15 K) to avoid Doppler-velocity aliasing associated with large-particle sedimentation, thereby limiting the assessment of updraft signatures to the upper portions of the selected convective clouds. In addition, the column-selection criteria, especially the cloud-top temperature threshold of 258.15 K, exclude many warmer-topped or shallower convective systems. Future advances in physically based velocity-unfolding techniques may partly overcome these limitations and extend the Doppler-based framework to warmer levels and shallower convection. Fourth, because the CPR operates at W band, it is susceptible to strong attenuation in heavy precipitation, non-Rayleigh scattering, and multiple scattering, which can obscure reflectivity at lower altitudes (Chase et al., 2025), as suggested by the lower-level reflectivity patterns in SU and EU columns. As a result, we cannot yet directly evaluate echo-top-height climatologies at 20–40 dBZ derived from the TRMM and GPM precipitation radars.
Future work should integrate this unique Doppler-velocity dataset with complementary observing systems. Combining EarthCARE Doppler-velocity measurements with GPM precipitation estimates (Aoki et al., 2026), lightning observations, and cloud life-cycle metrics from geostationary satellites would enable a more holistic characterization of deep convection. Such an integrated framework would allow for the systematic evaluation and recalibration of legacy intensity proxies and support the development of a comprehensive intensity index that integrates ETH, ΔH, electrification, life-cycle phase, and Doppler-velocity folding.
The EarthCARE/CPR L2A CPR one-sensor Cloud Products (https://doi.org/10.57746/EO.01jdvd2gqq34e6yz9p8kfe68x5, JAXA, 2025a) used in this study can be downloaded from the JAXA G-Portal (https://gportal.jaxa.jp/gpr/, last access: 14 August 2026).
The supplement related to this article is available online at https://doi.org/10.5194/acp-26-11605-2026-supplement.
HH conceptualized the study, performed the formal analysis, developed the methodology, and prepared the visualizations. KS contributed to the conceptualization and acquired the funding. MK and SA conducted the investigation and provided feedback on the results. TK conducted the investigation and supervised the study. HH wrote the original draft of the manuscript. KS, MK, SA, and TK contributed to the review and editing of the manuscript.
At least one of the (co-)authors is a guest member of the editorial board of Atmospheric Chemistry and Physics for the special issue “Early results from EarthCARE (AMT/ACP/GMD inter-journal SI)”. The peer-review process was guided by an independent editor, and the authors also have no other competing interests to declare.
Publisher's note: Copernicus Publications remains neutral with regard to jurisdictional claims made in the text, published maps, institutional affiliations, or any other geographical representation in this paper. The authors bear the ultimate responsibility for providing appropriate place names. Views expressed in the text are those of the authors and do not necessarily reflect the views of the publisher.
This article is part of the special issue “Early results from EarthCARE (AMT/ACP/GMD inter-journal SI)”. It is not associated with a conference.
ChatGPT was used to assist the editing the language of parts of the manuscript. All content was subsequently reviewed and edited by the authors, who take full responsibility for the final version of the manuscript. We would also like to thank Editage (http://www.editage.jp, last access: 14 August 2026) for English language editing. We are grateful to the anonymous reviewers for their careful reading of the manuscript and for their constructive comments, which greatly helped us improve both the analysis and the presentation of the results.
This study was supported by JAXA/EarthCARE project, MEXT program for the Advanced Studies of Climate Change Projection (SENTAN) (Grant JPMXD0722680395), and JST Moonshot R&D (Grant JPMJMS2281).
This paper was edited by Matthew Lebsock and reviewed by four anonymous referees.
Abbott, T. H., Jeevanjee, N., Cheng, K.-Y., Zhou, L., and Harris, L.: The land-ocean contrast in deep convective intensity in a global storm-resolving model, J. Adv. Model. Earth Sy., 17, 5, https://doi.org/10.1029/2024MS004467, 2025.
Adler, R. F. and Fenn, D. D.: Thunderstorm vertical velocities estimated from satellite data, J. Atmos. Sci., 36, 1747–1754, https://doi.org/10.1175/1520-0469(1979)036<1747:TVVEFS>2.0.CO;2, 1979.
Albrecht, R. I., Goodman, S. J., Buechler, D. E., Blakeslee, R. J., and Christian, H. J.: Where Are the Lightning Hotspots on Earth?, B. Am. Meteorol. Soc., 97, 2051–2068, https://doi.org/10.1175/BAMS-D-14-00193.1, 2016.
Aoki, S., Kubota, T., and Turk, F. J.: Exploring vertical motions in convective and stratiform precipitation using spaceborne radar observations: insights from EarthCARE and GPM coincidence dataset, Atmos. Meas. Tech., 19, 79–100, https://doi.org/10.5194/amt-19-79-2026, 2026.
Battaglia, A.: Impact of second-trip echoes for space-borne high-pulse-repetition-frequency nadir-looking W-band cloud radars, Atmos. Meas. Tech., 14, 7809–7820, https://doi.org/10.5194/amt-14-7809-2021, 2021.
Battaglia, A., Augustynek, T., Tanelli, S., and Kollias, P.: Multiple scattering identification in spaceborne W-band radar measurements of deep convective cores, J. Geophys. Res.-Atmos., 116, D19201, https://doi.org/10.1029/2011JD016142, 2011.
Bechtold, P., Bazile, E., Guichard, F., Mascart, P., and Richard, E.: A mass-flux convection scheme for regional and global models, Q. J. Roy. Meteor. Soc., 127, 869–886, https://doi.org/10.1002/qj.49712757309, 2001.
Bedka, K., Brunner, J., Dworak, R., Feltz, W., Otkin, J., and Greenwald, T.: Objective satellite-based detection of overshooting tops using infrared window channel brightness temperature gradients, J. Appl. Meteorol. Clim., 49, 181–202, https://doi.org/10.1175/2009JAMC2286.1, 2010.
Cecil, D. J., Goodman, S. J., Boccippio, D. J., Zipser, E. J., and Nesbitt, S. W.: Three years of TRMM precipitation features. Part I: Radar, radiometric, and lightning characteristics, Mon. Weather Rev., 133, 543–566, https://doi.org/10.1175/MWR-2876.1, 2005.
Cecil, D. J., Buechler, D. E., and Blakeslee, R. J.: Gridded lightning climatology from TRMM-LIS and OTD: Dataset description, Atmos. Res., 135–136, 404–414, https://doi.org/10.1016/j.atmosres.2012.06.028, 2014.
Chase, R. J., Dolan, B., Rasmussen, K. L., Schulte, R. M., Stephens, G. L., Turk, F. J., and van den Heever, S. C.: A multifrequency spaceborne radar perspective of deep convection, J. Appl. Meteorol. Clim., 64, 133–145, https://doi.org/10.1175/JAMC-D-24-0109.1, 2025.
Christian, H. J., Blakeslee, R. J., Boccippio, D. J., Boeck, W. L., Buechler, D. E., Driscoll, K. T., Goodman, S. J., Hall, J. M., Koshak, J. M., Mach, D. M., and Stewart, M. F.: Global frequency and distribution of lightning as observed from space by the Optical Transient Detector, J. Geophys. Res.-Atmos., 108, ACL 4-1–ACL 4-15, https://doi.org/10.1029/2002JD002347, 2003.
Christopoulos, C. and Schneider, T.: Assessing biases and climate implications of the diurnal precipitation cycle in climate models, Geophys. Res. Lett., 48, e2021GL093017, https://doi.org/10.1029/2021GL093017, 2021.
Collis, S., Protat, A., May, P. T., and Williams, C.: Statistics of storm updraft velocities from TWP-ICE including verification with profiling measurements, J. Appl. Meteorol. Clim., 52, 1909–1922, https://doi.org/10.1175/JAMC-D-12-0230.1, 2013.
Deierling, W. and Petersen, W. A.: Total lightning activity as an indicator of updraft characteristics, J. Geophys. Res.-Atmos., 113, D16210, https://doi.org/10.1029/2007JD009598, 2008.
Doviak, R. J. and Zrnić, D. S.: Doppler Radar & Weather Observations, 2nd Edn., Academic Press, ISBN 148329482X, 9781483294827, 2014.
Eisinger, M., Marnas, F., Wallace, K., Kubota, T., Tomiyama, N., Ohno, Y., Tanaka, T., Tomita, E., Wehr, T., and Bernaerts, D.: The EarthCARE mission: science data processing chain overview, Atmos. Meas. Tech., 17, 839–862, https://doi.org/10.5194/amt-17-839-2024, 2024.
Galfione, A., Battaglia, A., Puigdomènech Treserras, B., and Kollias, P.: First insights into deep convection by the Doppler velocity measurements of the EarthCARE Cloud Profiling Radar, Atmos. Meas. Tech., 18, 6747–6763, https://doi.org/10.5194/amt-18-6747-2025, 2025.
Giangrande, S. E., Toto, T., Jensen, M. P., Bartholomew, M. J., Feng, Z., Protat, A., Williams, C. R., Schumacher, C., and Machado, L.: Convective cloud vertical velocity and mass-flux characteristics from radar wind profiler observations during GoAmazon2014/5, J. Geophys. Res.-Atmos., 121, 12891–12913, https://doi.org/10.1002/2016JD025303, 2016.
Hagihara, Y., Ohno, Y., Horie, H., Roh, W., Satoh, M., and Kubota, T.: Global evaluation of Doppler velocity errors of EarthCARE cloud-profiling radar using a global storm-resolving simulation, Atmos. Meas. Tech., 16, 3211–3219, https://doi.org/10.5194/amt-16-3211-2023, 2023.
Hamada, A. and Takayabu, Y. N.: Convective cloud top vertical velocity estimated from geostationary satellite rapid-scan measurements, Geophys. Res. Lett., 43, 5435–5441, https://doi.org/10.1002/2016GL068962, 2016.
Hamada, A., Takayabu, Y. N., Liu, C., and Zipser, E. J.: Weak linkage between the heaviest rainfall and tallest storms, Nat. Commun., 6, 6213, https://doi.org/10.1038/ncomms7213, 2015.
Hartmann, D. L., Moy, L. A., and Fu, Q.: Tropical convection and the energy balance at the top of the atmosphere, J. Climate, 14, 4495–4511, https://doi.org/10.1175/1520-0442(2001)014<4495:TCATEB>2.0.CO;2, 2001.
Heymsfield, G. M., Tian, L., Heymsfield, A. J., Li, L., and Guimond, S.: Characteristics of deep tropical and subtropical convection from nadir-viewing high-altitude airborne Doppler radar, J. Atmos. Sci., 67, 285–308, https://doi.org/10.1175/2009JAS3132.1, 2010.
Hou, A. Y., Kakar, R. K., Neeck, S., Azarbarzin, A. A., Kummerow, C. D., Kojima, M., Oki, R., Nakamura, K., and Iguchi, T.: The Global Precipitation Measurement mission, B. Am. Meteorol. Soc., 95, 701–722, https://doi.org/10.1175/BAMS-D-13-00164.1, 2014.
Houze Jr., R. A., Rasmussen, K. L., Zuluaga, M. D., and Brodzik, S. R.: The variable nature of convection in the tropics and subtropics: A legacy of 16 years of the Tropical Rainfall Measuring Mission (TRMM) satellite, Rev. Geophys., 53, 994–1029, https://doi.org/10.1002/2015RG000488, 2015.
Iguchi, T., Kozu, T., Meneghini, R., Awaka, J., and Okamoto, K.: Rain-profiling algorithm for the TRMM precipitation radar, J. Appl. Meteorol., 39, 2038–2052, https://doi.org/10.1175/1520-0450(2001)040<2038:RPAFTT>2.0.CO;2, 2000.
Illingworth, A. J., Barker, H. W., Beljaars, A., Ceccaldi, M., Chepfer, H., Clerbaux, N., Cole, J., Delanoë, J., Domenech, C., Donovan, D. P., Fukuda, S., Hirakata, M., Hogan, R. J., Huenerbein, A., Kollias, P., Kubota, T., Nakajima, T., Nakajima, T. Y., Nishizawa, T., Ohno, Y., Okamoto, H., Oki, R., Sato, K., Satoh, M., Shephard, M., Velázquez-Blázquez, A., Wandinger, U., Wehr, T., and van Zadelhoff, G.-J.: The EarthCARE Satellite: The next step forward in global measurements of clouds, aerosols, precipitation and radiation, B. Am. Meteorol. Soc., 96, 1311–1332, https://doi.org/10.1175/BAMS-D-12-00227.1, 2015.
JAXA: EarthCARE/CPR L2A CPR one-sensor Cloud Products, JAXA [data set], https://doi.org/10.57746/EO.01jdvd2gqq34e6yz9p8kfe68x5, 2025a.
JAXA: EarthCARE JAXA Level 2 Algorithm Theoretical Basis Document (L2 ATBD), JAXA, https://www.eorc.jaxa.jp/EARTHCARE/document/JAXAL2ProductList/ATBD/NDX-110018N_EarthCARE_L2_ATBD_draft_rev2.pdf (last access: 5 January 2026), 2025b.
JAXA: Release notes for the EarthCARE/CPR Level-1b Product, JAXA, https://www.eorc.jaxa.jp/EARTHCARE/document/L1ProductList/ReleaseNote/CPR/SEC-2024057-0D_Release_Notes_for_EarthCARE_CPR_L1b_Product.pdf (last access: 5 January 2026), 2025c.
JAXA: EarthCARE JAXA Level 2 Algorithm Theoretical Basis Document (L2 ATBD), ver. P, Japan Aerospace Exploration Agency, JAXA, https://www.eorc.jaxa.jp/EARTHCARE/document/JAXAL2ProductList/ATBD/EarthCARE_JAXA_L2_ATBD_verP_Apr2026.pdf (last access: 19 May 2026), 2026.
Jeyaratnam, J., Luo, Z. J., Giangrande, S. E., Wang, D., and Masunaga, H.: A Satellite-Based Estimate of Convective Vertical Velocity and Convective Mass Flux: Global Survey and Comparison With Radar Wind Profiler Observations, Geophys. Res. Lett., 48, e2020GL090675, https://doi.org/10.1029/2020GL090675, 2021.
Kikuchi, M. and Suzuki, K.: Characterizing vertical particle structure of precipitating cloud system from multiplatform measurements of A-Train constellation, Geophys. Res. Lett., 46, 1040–1048, https://doi.org/10.1029/2018GL081244, 2019.
Kollias, P., Tanelli, S., Battaglia, A., and Tatarevic, A.: Evaluation of EarthCARE cloud profiling radar Doppler velocity measurements in particle sedimentation regimes, J. Atmos. Ocean. Tech., 31, 366–386, https://doi.org/10.1175/JTECH-D-11-00202.1, 2014.
Kollias, P., Battaglia, A., Lamer, K., Treserras, B. P., and Braun, S. A.: Mind the Gap – Part 3: Doppler velocity measurements from space, Front. Remote Sens., 3, 860284, https://doi.org/10.3389/frsen.2022.860284, 2022.
Koren, I., Altaratz, O., Feingold, G., Levin, Z., and Reisin, T.: Cloud's Center of Gravity – a compact approach to analyze convective cloud development, Atmos. Chem. Phys., 9, 155–161, https://doi.org/10.5194/acp-9-155-2009, 2009.
Kummerow, C., Barnes, W., Kozu, T., Shiue, J., and Simpson, J.: The Tropical Rainfall Measuring Mission (TRMM) sensor package, J. Atmos. Ocean. Tech., 15, 809–817, https://doi.org/10.1175/1520-0426(1998)015<0809:TTRMMT>2.0.CO;2, 1998.
LeMone, M. A. and Zipser, E. J.: Cumulonimbus vertical velocity events in GATE. Part I: Diameter, intensity and mass flux, J. Atmos. Sci., 37, 2444–2457, https://doi.org/10.1175/1520-0469(1980)037<2444:CVVEIG>2.0.CO;2, 1980.
Li, Y., Liu, Y., Chen, Y., Chen, B., Zhang, X., Wang, W., Shu, Z., and Huo, Z.: Characteristics of Deep Convective Systems and Initiation during Warm Seasons over China and Its Vicinity, Remote Sensing, 13, 4289, https://doi.org/10.3390/rs13214289, 2021.
Liu, C. and Zipser, E. J.: Global distribution of convection penetrating the tropical tropopause, J. Geophys. Res.-Atmos., 110, D23104, https://doi.org/10.1029/2005JD006063, 2005.
Liu, C. and Zipser, E. J.: Diurnal cycles of precipitation, clouds, and lightning in the tropics from 9 years of TRMM observations, Geophys. Res. Lett., 35, L04819, https://doi.org/10.1029/2007GL032437, 2008.
Liu, C. and Zipser, E. J.: The global distribution of largest, deepest, and most intense precipitation systems, Geophys. Res. Lett., 42, 3591–3596, https://doi.org/10.1002/2015GL063776, 2015.
Liu, C., Zipser, E. J., and Nesbitt, S. W.: Global distribution of tropical deep convection: different perspectives from TRMM infrared and radar data, J. Climate, 20, 489–503, https://doi.org/10.1175/JCLI4023.1, 2007.
Liu, C., Zipser, E. J., Cecil, D. J., Nesbitt, S. W., and Sherwood, S.: A cloud and precipitation feature database from nine years of TRMM observations, J. Appl. Meteorol. Clim., 47, 2712–2728, https://doi.org/10.1175/2008JAMC1890.1, 2008.
Lucas, C., Zipser, E. J., and LeMone, M. A.: Vertical velocity in oceanic convection off tropical Australia in early morning: Roles of buoyancy and dynamic pressure, J. Atmos. Sci., 51, 3183–3193, https://doi.org/10.1175/1520-0469(1994)051<3183:VVIOCO>2.0.CO;2, 1994.
Luo, Y., Zhang, R., and Wang, H.: Comparing occurrences and vertical structures of hydrometeors between eastern China and the Indian monsoon region using CloudSat/CALIPSO data, J. Climate, 22, 1052–1064, https://doi.org/10.1175/2008JCLI2606.1, 2009.
Luo, Y., Zhang, R., Qian, W., Luo, Z., and Hu, J.: Intercomparison of deep convection over the Tibetan Plateau–Asian monsoon region and subtropical North America in boreal summer using CloudSat/CALIPSO data, J. Climate, 24, 2164–2177, https://doi.org/10.1175/2010JCLI4032.1, 2011.
Luo, Z. J., Liu, C., and Stephens, G. L.: CloudSat adding new insight into tropical penetrating convection, Geophys. Res. Lett., 35, L19819, https://doi.org/10.1029/2008GL035330, 2008.
Luo, Z. J., Jeyaratnam, J., Iwasaki, S., Takahashi, H., and Anderson, R.: Convective vertical velocity and cloud internal vertical structure: An A-Train perspective, Geophys. Res. Lett., 41, 723–729, https://doi.org/10.1002/2013GL058922, 2014.
Maloney, E. D., Gettelman, A., Ming, Y., Neelin, J. D., Barrie, D., Mariotti, A., Chen, C.-C., Coleman, D. R. B., Kuo, Y.-H., Singh, B., Annamalai, H., Berg, A., Booth, J. F., Camargo, S. J., Dai, A., Gonzalez, A., Hafner, J., Jiang, X., Jing, X., Kim, D., Kumar, A., Moon, Y., Naud, C. M., Sobel, A. H., Suzuki, K., Wang, F., Wang, J., Wing, A. A., Xu, X., and Zhao, M.: Process-Oriented Evaluation of Climate and Weather Forecasting Models, B. Am. Meteorol. Soc., 100, 1665–1686, https://doi.org/10.1175/bams-d-18-0042.1, 2019.
Manabe, S., Smagorinsky, J., and Strickler, R. F.: Simulated climatology of a general circulation model with a hydrologic cycle, Mon. Weather Rev., 93, 769–798, https://doi.org/10.1175/1520-0493(1965)093<0769:SCOAGC>2.3.CO;2, 1965.
Masunaga, H. and Kummerow, C. D.: Observations of tropical precipitating clouds ranging from shallow to deep convective systems, Geophys. Res. Lett., 33, L16805, https://doi.org/10.1029/2006GL026547, 2006.
Masunaga, H., L'Ecuyer, T. S., and Kummerow, C. D.: Variability in the characteristics of precipitation systems in the tropical Pacific. Part I: Spatial structure, J. Climate, 18, 823–840, https://doi.org/10.1175/JCLI-3304.1, 2005.
Matrosov, S. Y.: Potential for attenuation-based estimations of rainfall rate from CloudSat, Geophys. Res. Lett., 34, 5, https://doi.org/10.1029/2006GL029161, 2007.
Mohr, K. I. and Zipser, E. J.: Defining mesoscale convective systems by their 85-GHz ice scattering signatures, B. Am. Meteorol. Soc., 77, 1179–1190, https://doi.org/10.1175/1520-0477(1996)077<1179:DMCSBT>2.0.CO;2, 1996.
Nesbitt, S. W. and Zipser, E. J.: The diurnal cycle of rainfall and convective intensity according to three years of TRMM measurements, J. Climate, 16, 1456–1475, https://doi.org/10.1175/1520-0442(2003)016<1456:TDCORA>2.0.CO;2, 2003.
Pilewskie, J. A. and L'Ecuyer, T. S.: The Global Nature of Early-Afternoon and Late-Night Convection Through the Eyes of the A-Train, J. Geophys. Res.-Atmos., 127, e2022JD036438, https://doi.org/10.1029/2022JD036438, 2022.
Price, C. and Rind, D.: A simple lightning parameterization for calculating global lightning distributions, J. Geophys. Res.-Atmos., 97, 9919–9933, https://doi.org/10.1029/92JD00719, 1992.
Puigdomènech Treserras, B., Kollias, P., Battaglia, A., Tanelli, S., and Nakatsuka, H.: EarthCARE's cloud profiling radar antenna pointing correction using surface Doppler measurements, Atmos. Meas. Tech., 18, 5607–5618, https://doi.org/10.5194/amt-18-5607-2025, 2025.
Ramanathan, V. L., Cess, R. D., Harrison, E. F., Minnis, P., Barkstrom, B. R., Ahmad, E., and Hartmann, D.: Cloud-radiative forcing and climate: Results from the Earth Radiation Budget Experiment, Science, 243, 57–63, https://doi.org/10.1126/science.243.4887.57, 1989.
Romatschke, U., Medina, S., and Houze Jr., R. A.: Regional, seasonal, and diurnal variations of extreme convection in the South Asian region, J. Climate, 23, 419–439, https://doi.org/10.1175/2009JCLI3140.1, 2010.
Sato, K., Okamoto, H., Nishizawa, T., Jin, Y., Nakajima, T. Y., Wang, M., Satoh, M., Roh, W., Ishimoto, H., and Kudo, R.: JAXA Level 2 cloud and precipitation microphysics retrievals based on EarthCARE radar, lidar, and imager: the CPR_CLP, AC_CLP, and ACM_CLP products, Atmos. Meas. Tech., 18, 1325–1338, https://doi.org/10.5194/amt-18-1325-2025, 2025.
Schiro, K. A. and Neelin, J. D.: Tropical continental downdraft characteristics: mesoscale systems versus unorganized convection, Atmos. Chem. Phys., 18, 1997–2010, https://doi.org/10.5194/acp-18-1997-2018, 2018.
Schumacher, C., Stevenson, S. N., and Williams, C. R.: Vertical motions of the tropical convective cloud spectrum over Darwin, Australia, Q. J. Roy. Meteor. Soc., 141, 2277–2288, https://doi.org/10.1002/qj.2520, 2015.
Seiki, T., Horie, H., Hagihara, Y., Aoki, S., and Noda, A. T.: Global identification of dominant ice-particle growth in cirrus clouds using EarthCARE satellite observations, EGUsphere [preprint], https://doi.org/10.5194/egusphere-2025-4819, 2025.
Sherwood, S. C., Bony, S., and Dufresne, J.-L.: Spread in model climate sensitivity traced to atmospheric convective mixing, Nature, 505, 37–42, https://doi.org/10.1038/nature12829, 2014.
Skofronick-Jackson, G., Petersen, W., Berg, W., Kidd, C., Stocker, E., Kirschbaum, D., Kakar, R., Braun, S., Huffman, G., Iguchi, T., Kirstetter, P., Kummerow, C., Meneghini, R., Oki, R., Olson, W., Takayabu, Y., Furukawa, K., and Wilheit, T.: The Global Precipitation Measurement (GPM) mission for science and society, B. Am. Meteorol. Soc., 98, 1679–1695, https://doi.org/10.1175/BAMS-D-15-00306.1, 2017.
Song, H. J., Kim, S., Roh, S., and Lee, H: Difference between cloud top height and storm height for heavy rainfall using TRMM measurements, J. Meteorol. Soc. Jpn., 98, 901–914, https://doi.org/10.2151/jmsj.2020-044, 2020.
Stephens, G., Vane, D. G., Tanelli, S., Im, E., Durden, S., Rokey, M., Reinke, D., Partain, P., Mace, G. G., Austin, R., L'Ecuyer, T., Haynes, J., Lebsock, M., Suzuki, K., Waliser, D., Wu, D., Kay, J., Gettelman, A., Wang, Z., and Marchand, R.: CloudSat mission: Performance and early science after the first year of operation, J. Geophys. Res.-Atmos., 113, https://doi.org/10.1029/2008JD009982, 2008.
Stephens, G. L., Vane, D. G., Boain, R. J., Mace, G. G., Sassen, K., Wang, Z., Illingworth, A. J., O'Connor, E. J., Rossow, W. B., Durden, S. L., Miller, S. D., Austin, R. T., Benedetti, A., Mitrescu, C., and the CloudSat Science Team: The cloudsat mission and the A-train, B. Am. Meteorol. Soc., 83, 1771–1790, https://doi.org/10.1175/BAMS-83-12-1771, 2002.
Sy, O. O., Tanelli, S., Takahashi, N., Ohno, Y., Horie, H., and Kollias, P.: Simulation of EarthCARE spaceborne Doppler radar products using ground-based and airborne data: Effects of aliasing and nonuniform beam-filling, IEEE T. Geosci. Remote Sens., 52, 1463–1479, https://doi.org/10.1109/TGRS.2013.2251639, 2014.
Takahashi, H. and Luo, Z. J.: Characterizing tropical overshooting deep convection from joint analysis of CloudSat and geostationary satellite observations, J. Geophys. Res.-Atmos., 119, 112–121, https://doi.org/10.1002/2013JD020972, 2014.
Takahashi, H., Luo, Z. J., and Stephens, G. L.: Level of neutral buoyancy, deep convective outflow, and convective core: New perspectives based on 5 years of CloudSat data, J. Geophys. Res.-Atmos., 122, 2958–2969, https://doi.org/10.1002/2016JD025969, 2017.
Takahashi, H., Luo, Z. J., Stephens, G., and Mulholland, J. P.: Revisiting the Land-Ocean Contrasts in Deep Convective Cloud Intensity Using Global Satellite Observations, Geophys. Res. Lett., 50, e2022GL102089, https://doi.org/10.1029/2022GL102089, 2023.
Takahashi, H., Wu, L., Smalley, M. A., Stephens, G., Suzuki, K., and Posselt, D. J.: Land‐Ocean Differences in Tropical Deep Convective Clouds: Intercomparison of DYAMOND Simulations and CloudSat Observations, J. Geophys. Res.-Atmos., 130, https://doi.org/10.1029/2025JD044688, 2025.
Tanelli, S., Im, E., Mascelloni, S. R., and Facheris, L.: Spaceborne Doppler radar measurements of rainfall: correction of errors induced by pointing uncertainties, J. Atmos. Ocean. Tech., 22, 1676–1690, https://doi.org/10.1175/JTECH1797.1, 2005.
Tanelli, S., Durden, S. L., Im, E., Pak, K. S., Reinke, D. G., Partain, P., Haynes, J. M., and Marchand, R. T.: CloudSat's Cloud Profiling Radar After Two Years in Orbit: Performance, Calibration, and Processing, IEEE T. Geosci. Remote, 46, 3560–3573, https://doi.org/10.1109/TGRS.2008.2002030, 2008.
Tian, B. and Dong, X.: The Double-ITCZ Bias in CMIP3, CMIP5, and CMIP6 Models Based on Annual Mean Precipitation, Geophys. Res. Lett., 47, e2020GL087232, https://doi.org/10.1029/2020GL087232, 2020.
Tiedtke, M.: A comprehensive mass flux scheme for cumulus parameterization in large-scale models, Mon. Weather Rev., 117, 1779–1800, https://doi.org/10.1175/1520-0493(1989)117<1779:ACMFSF>2.0.CO;2, 1989.
Wehr, T., Kubota, T., Tzeremes, G., Wallace, K., Nakatsuka, H., Ohno, Y., Koopman, R., Rusli, S., Kikuchi, M., Eisinger, M., Tanaka, T., Taga, M., Deghaye, P., Tomita, E., and Bernaerts, D.: The EarthCARE mission – science and system overview, Atmos. Meas. Tech., 16, 3581–3608, https://doi.org/10.5194/amt-16-3581-2023, 2023.
Williams, E. R. and Stanfill, S.: The physical origin of the land-ocean contrast in lightning activity, C.R. Phys., 3, 1277–1292, https://doi.org/10.1016/S1631-0705(02)01407-X, 2002.
Williams, E. R., Mushtak, V., Rosenfeld, D., Goodman, S., and Boccippio, D.: Thermodynamic conditions favorable to superlative thunderstorm updraft, mixed phase microphysics and lightning flash rate, Atmos. Res., 76, 288–306, https://doi.org/10.1016/j.atmosres.2004.11.010, 2005.
Xu, W., Chen, H., Wei, H., Luo, Y., and Zhao, T.: Extreme Precipitation Produced by Relatively Weak Convective Systems in the Tropics and Subtropics, Geophys. Res. Lett., 49, e2022GL098048, https://doi.org/10.1029/2022GL098048, 2022.
Yang, G.-Y. and Slingo, J.: The diurnal cycle in the tropics, Mon. Weather Rev., 129, 784–801, https://doi.org/10.1175/1520-0493(2001)129<0784:TDCITT>2.0.CO;2, 2001.
Yuter, S. E. and Houze Jr., R. A.: Three-dimensional kinematic and microphysical evolution of Florida cumulonimbus. Part II: Frequency distributions of vertical velocity, reflectivity, and differential reflectivity, Mon. Weather Rev., 123, 1941–1963, https://doi.org/10.1175/1520-0493(1995)123<1941:TDKAME>2.0.CO;2, 1995.
Zhao, M.: An investigation of the connections among convection, clouds, and climate sensitivity in a global climate model, J. Climate, 27, 1845–1862, https://doi.org/10.1175/JCLI-D-13-00145.1, 2014.
Zipser, E. J., Cecil, D. J., Liu, C., Nesbitt, S. W., and Yorty, D. P.: Where are the most intense thunderstorms on Earth?, B. Am. Meteorol. Soc., 87, 1057–1071, https://doi.org/10.1175/BAMS-87-8-1057, 2006.