
the Creative Commons Attribution 4.0 License.
the Creative Commons Attribution 4.0 License.
 | 17 Aug 2026
Depolarization ratio of smoke and volcanic ash aerosol particles at 1565 nm using a HALO Doppler lidar
Krista Luoma
Eija Asmi
Klaus Haikarainen
David Brus
Tero Mielonen
Mika Komppula
Annele Virtanen
Olli Sippula
Iida Pullinen
Angela Buchholz
Pasi Miettinen
Snehitha Kommula
Saara Peltokorpi
Liqing Hao
Kajar Köster
Annika Saarto
Sanna Pätsi
Pieter G. van Zyl
Liezl Bredenkamp
Ville Vakkari
Particle linear depolarization ratio is a widely used parameter in lidar research to distinguish different aerosol types and the thermodynamic phase of water. It is most frequently measured at ultraviolet and visible wavelengths (355 and 532 nm), yet multi-wavelength observations suggest that this parameter can vary substantially with wavelength. In this work, we assessed particle linear depolarization ratios at 1565 nm using Halo Photonics StreamLine Doppler lidars. We examined the depolarization ratio through three case studies featuring extremely fresh and aged smoke, and volcanic ash aerosol particles in the troposphere. Both fresh and aged smoke aerosol particles induced low values. Specifically, aerosol layers dominated by extremely fresh smoke showed a depolarization ratio of 0.017 ± 0.004, whereas aged long-range transported smoke particles exhibited marginally higher values. Volcanic aerosol layers induced high depolarization ratios with layer mean values of 0.45 ± 0.01. For the extremely fresh smoke case, we further estimated the smoke mass concentration using the lidar observations at 1565 nm and found good agreement with the in situ observations. These results demonstrate that Halo Doppler lidars operating at 1565 nm wavelength are capable of distinguishing several key aerosol types, enabling a comprehensive characterization of atmospheric conditions by simultaneously observing aerosol properties and wind dynamics.
- Article
(7827 KB) - Full-text XML
- BibTeX
- EndNote


Aerosol particles exert a profound influence on climate, yet their effects remain among the largest sources of uncertainty in quantifying anthropogenic forcing (IPCC, 2021). Despite substantial advances driven by field measurements, laboratory studies, and modeling, the magnitude of this uncertainty has remained largely unchanged over the past two decades, with estimates of aerosol effective radiative forcing being far less constrained than those of greenhouse gases (Kahn et al., 2023). Reducing this uncertainty requires, as a fundamental first step, to reliably detect aerosol particles in the atmosphere and accurately characterize their properties. Active remote sensing techniques, particularly lidars (Ansmann et al., 1990), provide this dual capability by first identifying the vertical distribution of aerosol particles and subsequently enabling the retrieval of intrinsic aerosol properties. One such property is the ratio of cross- to co-polarized backscattered signal known as the particle linear depolarization ratio (δ), after removing the molecular contribution. This parameter has long been recognized as a powerful indicator of particle shape, allowing discrimination between spherical and non-spherical aerosol particles (Schotland et al., 1971; Sugimoto et al., 2002; Tesche et al., 2009), thereby offering critical insights into aerosol type characterization (Nicolae et al., 2018; Papagiannopoulos et al., 2018; Floutsi et al., 2024) and their individual role in air quality, interaction with clouds, and radiative forcing (Noh et al., 2012; Donovan et al., 2015; Xian et al., 2020; Cairo et al., 2024; Papayannis et al., 2025).
Historically, aerosol measurements on δ using lidars have been conducted across a wide range of wavelengths from ultraviolet (355 nm) and visible (532 nm) to less commonly used wavelengths at near-infrared (710, 1064 nm) (Sugimoto and Lee, 2006; Ansmann et al., 2009; Freudenthaler et al., 2009; Tesche et al., 2011; Groß et al., 2013; Pappalardo et al., 2013; Burton et al., 2015). Recent developments have expanded δ observations at 458 nm (Kong et al., 2022), and at longer wavelengths, including 808 nm (González et al., 2025), 910 nm (Bedoya-Velásquez et al., 2022) and 1565 nm (Vakkari et al., 2021). As an outcome, extensive ground-based and airborne campaigns at several locations have established reference δ values for key aerosol types like mineral dust (Sugimoto and Lee, 2006; Groß et al., 2011; Filioglou et al., 2020), volcanic ash particles (Ansmann et al., 2010; Pisani et al., 2012; Shimizu et al., 2025), pollen (Bohlmann et al., 2021; Filioglou et al., 2023), marine (Haarig et al., 2017) and smoke aerosol particles (Murayama et al., 2004; Müller et al., 2005). These studies conclude that non-spherical aerosol particles such as mineral dust, volcanic ash and pollen can maintain high depolarization ratio at longer wavelengths, while smoke and marine aerosols typically induce much lower depolarization ratio, presenting similar or decreasing values with increasing wavelength.
Despite these advances, several gaps remain. Long-term, harmonized datasets at longer wavelengths (particularly 910, 1064 and 1565 nm) are only beginning to be systematically explored and the spectral dependence of δ for many natural aerosol types and mixtures of these require further investigation, particularly under varying relative humidity (RH) conditions and in under-sampled regions. Moreover, case studies demonstrate that δ and its spectral dependence is sensitive to particle size, shape, composition and mixing state. For example, Freudenthaler et al. (2009) studied Saharan desert dust aerosols at 532 and 1064 nm and concluded that δ tend to be slightly higher at 532 nm compared to the longer wavelength. In contrast, Sugimoto and Lee (2006) concluded the opposite for Asian dust particles. In line with Freudenthaler et al. (2009), Haarig et al. (2022) found that mineral dust δ values are slightly higher at 355 and 532 nm compared to the longer wavelength of 1064 nm. In turn, Vakkari et al. (2021) reported higher values at 1565 nm than at 355 and 532 nm for a mineral-dust-dominated case while for dust mixed with other aerosols they reported higher depolarization ratio at 1565 nm compared to the shorter wavelengths. For pollen aerosol particles, Filioglou et al. (2023) concluded that birch pollen particles induce higher δ at 910 and 1565 nm compared to 355 and 532 nm. The opposite is valid for pine pollen particles. They also found that δ is concentration dependent, therefore, the longer wavelengths offer an advantage in the detection of large particles such as pollen particles. For marine and polluted marine aerosols, previous studies report a decreasing trend in δ with increasing wavelength (Vakkari et al., 2021; Haarig et al., 2025). Moreover, Haarig et al. (2018) studied tropospheric smoke particles and found that they induce a less than 3 % δ at 355, 532 and 1064 nm, while higher δ values were reported for stratospheric smoke layers at shorter wavelengths (Burton et al., 2015; Haarig et al., 2018; Hu et al., 2019). To the authors' knowledge, there are no studies of δ at 1565 nm for volcanic ash and smoke aerosol particles.
Multi-wavelength lidar observations, obtained from single or multiple instruments, enhance the reliability of aerosol characterization and typing. In this context, this study estimates the δ for smoke and volcanic ash particles using a Halo Doppler lidar operating at 1565 nm. Furthermore, we extend the applicability of such lidar systems by retrieving smoke aerosol mass concentration at this wavelength. Such estimates are particularly valuable, as they provide vertically resolved, model-ready information that improves the representation of aerosol loading, plume dynamics, and radiative effects in atmospheric models (Benedetti et al., 2009; Sekiyama et al., 2010; Zhang et al., 2014). By addressing the current lack of δ observations at 1565 nm, this study supports the integration of this wavelength into operational aerosol monitoring networks, benefiting from the negligible contribution of molecular scattering and absorption, which simplifies signal processing and enhances retrieval robustness.
Three field campaigns were conducted over the years of 2024, 2020 and 2016 at three different locations: at a Boreal forest site at Kiviniemi, Finland ( N, E, 110 m above sea level), at an urban site at Kumpula (Helsinki), Finland ( N, E, 45 m a.s.l.) and at a grassland savanna site at Welgegund, South Africa ( S, E, 1480 m a.s.l.), respectively. In each location, a HALO Photonics Streamline Doppler lidar was operating. To characterize the δ1565 of extremely fresh and aged smoke as well as volcanic ash particles, three representative case studies, one from each field campaign, were selected and presented in Sect. 3. The extremely fresh smoke case was observed in Kiviniemi (FI), the aged smoke case in Kumpula (FI) and the volcanic ash case in Welgegund (SA). For the extremely fresh smoke case in Kiviniemi (FI), a suite of ground- and drone-based in situ instruments were employed to quantify aerosol physical and chemical properties to support the mass concentration estimation of smoke from the lidar observations. To exclude the influence of biological particles on the analysis, given that the measurements in Kiviniemi (FI) coincided with the active pollen season, a Burkard sampler was operated to monitor airborne pollen concentrations in the near-by station in the city of Kuopio ( N, E).
2.1 Lidar observations
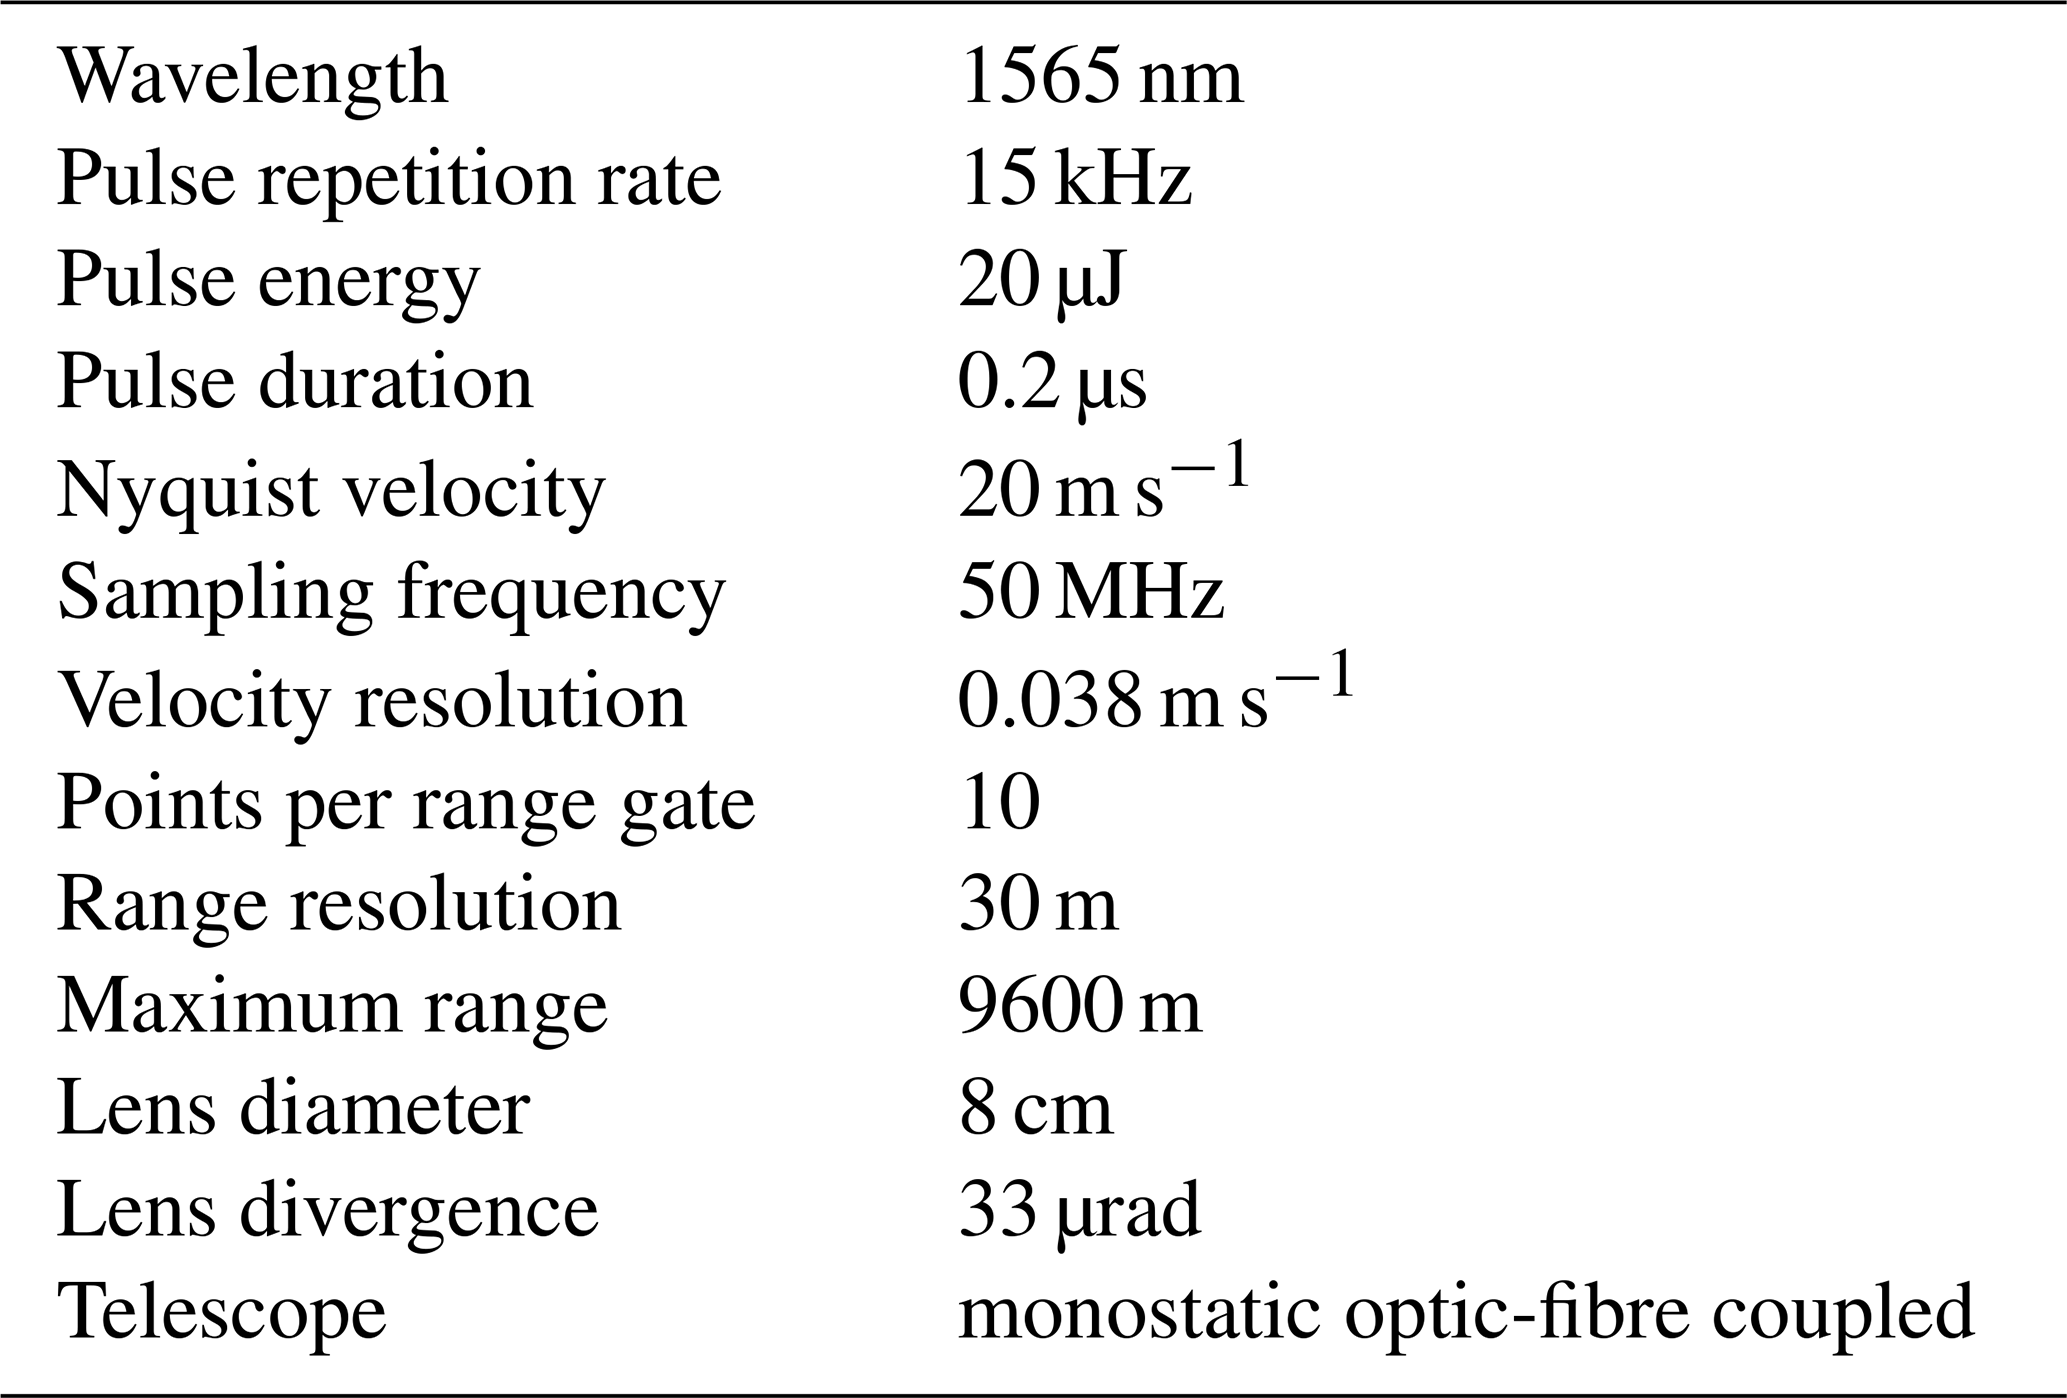
Halo Photonics StreamLine lidars are commercially available pulsed Doppler lidars that operate at 1565 nm wavelength (Pearson et al., 2009). Due to the high pulse-repetition rates and low pulse energies they are eye-safe, enabling continuous long-term operation. Here, we use Halo Doppler lidars that are equipped with a cross-polar receiver channel, which enables consecutive measurement of co- and cross-polar signals and subsequent retrieval of particle linear depolarization ratio (Vakkari et al., 2021). The cross-polar channel is implemented through a fibre-optic switch between the normal receiver path and the path with a fibre-optic polarizer. The lidars were configured with 30 m vertical resolution and focus was set to 2000 m; first 90 m were excluded due to effects from the outgoing pulse. Other technical specifications can be found in Table 1.
Table 1Specifications of Halo Doppler lidars used in this study.
At Kumpula (FI) and Welgegund (SA), the Halo Doppler lidars used were capable of full hemispheric scanning (i.e., model StreamLine). At Kiviniemi (FI), the version with limited scanning (i.e. StreamLine Pro) was used. In this study, we utilize only the vertically-pointing measurements. At Kiviniemi (FI), the vertically-pointing integration time was set to 7 s per ray and 13 min out of every 15 min was vertically-pointing measurement. At Kumpula (FI), the vertically-pointing integration time was set to 3.5 s per ray and 8 min out of every 15 min was vertically-pointing measurement. At Welgegund (SA), the vertically-pointing integration time was set to 7 s per ray and 6 min out of every 15 min was vertically-pointing measurement.
For each Halo Doppler lidar the data was post-processed following Vakkari et al. (2019). The post-processing is based on hourly background checks carried out automatically by the lidar. Quantifying the non-polynomial component in the instrument noise floor, denoted Pamp by Vakkari et al. (2019), requires an extended data set of background checks and internal temperature. We used background checks from the full 11-month campaign at Welgegund (SA), and 12 months centered at the case study for the two other lidars, respectively. We determined also the internal temperature dependency of Pamp, though it has only a very minor effect. For each measured profile, we used the aerosol- and cloud-free parts of the profile to fit the linear and parabolic components of the instrumental noise floor. These fits and the instrument and campaign specific Pamp were then used to process the corrected co- and cross-polar signal-to-noise ratio (SNR) and attenuated backscatter profiles following Vakkari et al. (2019).
Bleed-through, i.e. the incomplete extinction in the lidar internal polarizer where co-polarized signal is leaking into cross-receiver due to imperfect polarization separation in the instrument, was determined from liquid cloud base observations similar to Le et al. (2024). For Kiviniemi (FI), a bleed-through of 0.0165 ± 0.010 was determined. For Kumpula (FI), bleed-through was determined as 0.00715 ± 0.0028. For Welgegund (SA), bleed-through was determined as 0.0085 ± 0.007. These values are in good agreement with the long-term statistics in Le et al. (2024).
At 1565 nm wavelength, the molecular backscatter contribution is about 2 orders of magnitude lower than at 532 nm, being approximately 1.9 × 10⁻⁸ m−1 sr−1 at standard pressure and temperature (Bucholtz, 1995) which is considered negligible. In addition, no evidence of multiple scattering was observed under the prevailing measurement conditions. Therefore, δ1565 as derived directly from the instrument after correcting for the bleed-through, can be regarded as a reasonable approximation of the particle linear depolarization ratio, obtained without applying a correction for the molecular scattering contribution, especially during high aerosol load conditions. The associated uncertainty, , is estimated according to Vakkari et al. (2021) taking into consideration the instrumental noise and the uncertainty in bleed-through. In the absence of hydrometeors, the atmospheric transmittance is very close to unity therefore, the attenuated backscatter coefficient, hereafter ATB1565, can be used as a proxy for the particle backscatter coefficient, hereafter β1565. This assumption is valid provided that extinction within the sampled aerosol layer remains sufficiently small. Attenuation in dense aerosol layers can lead to an underestimation of the true β1565. For the exceptionally fresh smoke case at Kiviniemi (FI), β1565 retrieved using the forward Klett method (Wiegner and Geiß, 2012) as the mass concentration parameter requires an accurate measure of backscatter intensity and could therefore be biased by substantial departures of atmospheric transmittance from unity observed during periods of high plume density. A Lidar Ratio (LR) of 51 sr was used in Klett inversion according to Mie calculations (see Sect. 2.4).
To determine the upper boundary of the smoke layer in the lidar observations at Kiviniemi, we first identified the maximum of the ATB1565 profile within the lowest 500 m. The layer top was then defined as the first altitude above this maximum at which the δ1565 exceeded 0.1. If no such threshold was reached, the layer top was instead assigned to the altitude corresponding to the maximum of the ATB1565 profile. For the Welgegund case, the maximum of the δ1565 profile was first located between 2 and 4 km and then the base and top boundaries were determined using the second derivative of ATB1565. For the Kumpula case, ATB1565 observations with values lower than 0.2 Mm−1 sr−1 or higher than 2 Mm−1 sr−1 were excluded. The remaining observations were subsequently used to define the boundaries of the smoke layer. In all cases, cloud-free layers were considered only.
2.2 Particle mass concentration from lidar observations
Lidar–derived mass concentration (m) has been estimated using the methodology presented in Ansmann et al. (2011). The method requires the mass particle density (ρ), the extinction-to-volume conversion factor (cv), and the particle extinction coefficient for a specific aerosol type at a certain wavelength (λ) to be known according to . A density of ρ=1.35 ± 0.05 g cm−3 was used for smoke particles (Reid et al., 2005).
To derive the mass concentration, we first converted the β1565 into β532 using a Backscatter-related Ångström exponent (BAE) according to . The BAE, as well as, the LRs at both 532 and 1565 nm wavelengths were estimated through Mie calculations (see Sect. 2.4). This wavelength conversion enables us to use a literature value of 0.16 ± Mm for cv at 532 nm (Ansmann et al., 2026), which has not been determined at 1565 nm wavelength, making the mass concentration estimation possible.
2.3 In situ aerosol observations
For the extremely fresh smoke event in Kiviniemi (FI), additional ground- and drone-based in situ aerosol observations were considered. The aerosol size distribution in size range of 15–710 nm was measured with a Scanning Mobility Particle Sizer (SMPS). The SMPS setup (TSI Inc., Model 3080) consists of a DMA (TSI Inc., Model 3081) and a CPC (TSI Inc., Model 3776) and temporal resolution was 3 min. Aerosol particle size distribution in the range between 0.45 and 15.5 µm was measured using an optical particle counter sensor (OPC-N2, Alphasense Ltd.; e.g., Crilley et al., 2018; Hagan and Kroll, 2020; Julaha et al., 2025) mounted onboard a DJI Matrice 600 drone. The OPC was housed within a custom-built module, similar to Brus et al. (2025), designed for uncrewed aerial vehicles. Measurements were obtained by flying the drone horizontally across the smoke plume at multiple altitudes ranging from 50 to 110 m. There was a total of four flights, at 11:30, 12:00, 16:15 and 16:45 UTC, each lasting up to 20 min. Drone data from the first two flights are considered only, as these periods exhibited spatially consistent smoke conditions between the airborne and surface-based observations.
To crosscheck and inter-compare the measurements of OPC and SMPS, the drone platform was positioned adjacent to the measurement station. The inter-comparison was performed at 14:30–15:05 UTC and the size distributions from OPC and SMPS were averaged over this period. The intercomparison showed an approximately twofold difference in particle number size distributions, with lower concentrations measured by the OPC on the drone platform than by the SMPS at the measurement station. This discrepancy is not unexpected, given the different measurement principles of the two instruments, their detection efficiencies and the strong spatial and temporal variability within the smoke plume. Sousan et al. (2016) reported that the OPC-N2 performs well in measuring coarse particles but tends to underestimate number concentrations of submicrometer particles, with a detection efficiency of 78 % for particles smaller than 0.5 µm.
To derive the complete aerosol size distribution, the SMPS and OPC size distributions (hereafter SMPS-OPC) were averaged over the time intervals during which the OPC was operating (i.e., the flight periods), and the corresponding 10th and 90th percentiles were calculated over these overlapping intervals. From the combined SMPS-OPC aerosol size distribution, the total mass of aerosol particles was estimated using a particle density of 1.35 g cm−3.
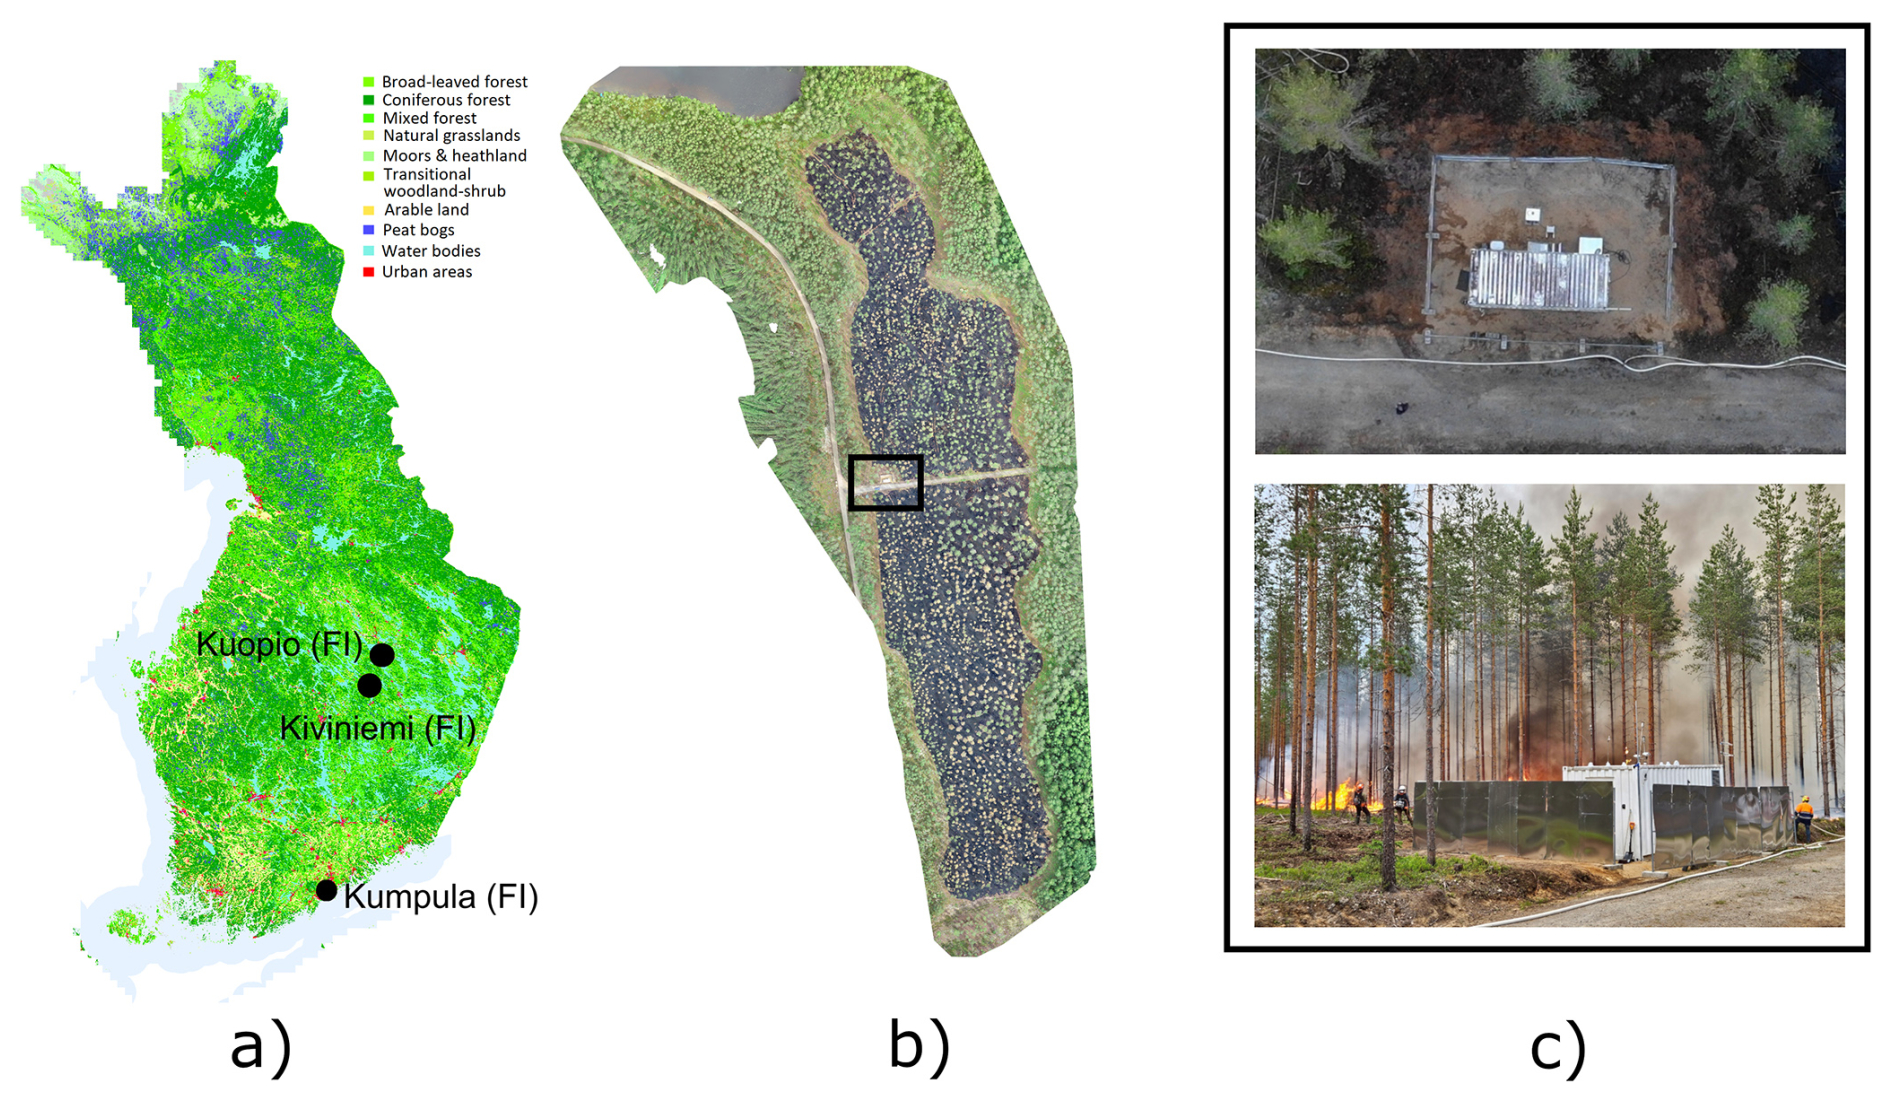
To gain a more detailed understanding of the aerosol composition, and particularly the black carbon (BC) and organic aerosol (OA) content during the burning event, ground-based multi-angle absorption photometer (MAAP, model 5012, Thermo Scientific, Petzold and Schönlinner, 2004) and aerosol mass spectrometer (AMS, HR-ToF-AMS, Aerodyne Research Inc., DeCarlo et al., 2006) measurements from the container (Fig. 1c) were used to estimate the BC-to-organic aerosol ratio (BC OA). MAAP measured dried aerosol particles from the station's main inlet at a flow rate of 7.5 LPM at 1 min time resolution. The aerosol absorption determined by MAAP was converted to BC mass concentration using the instrument manufacturer set default mass absorption cross-section (MAC) of 6.6 m2 g−1, which is commonly accepted value for MAAP and broadly used in scientific literature (e.g. Ohata et al., 2021). AMS measures the mass concentration of organics, sulfate, nitrate, ammonia and chloride compounds and was operated in EI-V mode (tungsten vaporizer) at 2 min time resolution. The instrument was calibrated on-site with ammonia sulfate and ammonia nitrate aerosols to determine the ionization efficiency of nitrate particles and relative ionization efficiency (RIE) of ammonia and sulfate. AMS data analysis was performed using standard tools – SQUIRREL v1.65C and PIKA v1.25C, downloaded from the ToF-AMS-Resources web page (https://cires1.colorado.edu/jimenez-group/ToFAMSResources/, last access: 14 August 2026), in Igor Pro.
SMPS, AMS and MAAP in situ aerosol observations were averaged for 15 min periods to match the temporal resolution in the lidar observations. Regarding the OPC data, only observations inside the smoke plume were considered. For each flight, we derived an average aerosol size distribution by combining measurements across all sampled altitudes.
Pollen concentrations were assessed with a Burkard sampler of Hirst design (Hirst, 1952) at Kuopio ( N E). The site is part of the Finnish pollen network operated by the University of Turku (https://sites.utu.fi/siitepoly/toiminta/, last access: 14 August 2026) and member of the European Aeroallergen Network. For the derivation of the pollen types and their respective concentrations, the recommendations of the European Aeroallergen Society (Galán et al., 2014) were followed to ensure high data quality. Pollen concentrations were utilized in the extremely fresh smoke case in Kiviniemi (FI). The distance between the two sites is about 50 km, and the temporal resolution of the observations is 2 h.
2.4 Mie calculations of smoke particles
Mie-theory predicts the optical properties of spherical particles (Mie, 1908). Here, Mie model was used to calculate the β and α at the lidar wavelengths (355, 532, 1064 and 1565 nm) in order to infer the LR and BAE from the measured in-situ aerosol particle size distributions. Mie model calculations were done using the Python-package PyMieScatt (ver 1.8.1.) (Sumlin et al., 2018a).
To perform this analysis, the particles were assumed spherical without core–shell structures. A dry aerosol was also assumed, as the surface relative humidity (RH) remained below 40 %. The assumption of spherical particles required for Mie theory is supported by the low δ in the lidar observations during the smoke event. From the in-situ observations, the average mass BC OA-ratio during the plume was approximately 1 %.
The complex refractive indices used were 1.5+0.0366i, 1.5+0.0064i, 1.5+0.0003i, 1.5+0.0001i at 355, 532, 1064, and 1565 nm, respectively. The imaginary part (k) was derived according to Mukherjee et al. (2025), who measured the k for fresh boreal forest surface smoldering emissions. A wavelength dependence of k was assumed using their measurements at 365 and 550 nm. The methanol soluble fraction accounted for more than 90 % of the total organic aerosol mass, and was therefore considered representative of the bulk organic aerosol. In contrast, the methanol insoluble fraction was negligible in these fresh emissions. The real part (n) was treated as constant at a value of 1.5 according to Sumlin et al. (2018b), who observed that the n was independent of the λ and was between 1.5–1.7. The absorption by BC was taken into account by assuming an externally mixed aerosol. BC size distribution measured in a chamber for fresh boreal forest surface was used (Peltokorpi et al., 2026; Vakkari et al., 2026). The BC size distribution was scaled so that the mass of BC matched the BC OA-ratio (about 1 %) of the mass of particles smaller than 1 µm. The BC density was assumed to be 1.80 g cm−3. The mass of particles smaller than 1 µm was estimated from the derived size distribution assuming density of 1.35 g cm−3. The complex refractive index for BC was defined according to Eqs. (6) and (7) in Kahnert and Kanngießer (2020).
2.5 FLEXPART airmass trajectories
Air mass history was simulated using the Lagrangian particle dispersion model FLEXPART (FLEXible PARTicle dispersion model) version 11.0 (Bakels et al., 2024). ERA5 reanalysis from European Centre for Medium-Range Weather Forecasts (ECMWF) was used as meteorological input (Hersbach et al., 2023). The ERA5 input data was retrieved at 1 h temporal, 0.25° latitude–longitude resolution and for model levels 40 to 137, which corresponds to approximately the lowest 24 km in the atmosphere. FLEXPART was run in backward simulation mode, with potential emission sensitivity (PES, s−1), describing the sensitivity of the sampled air mass to emissions along its transport history, output at 1 h temporal resolution. PES output vertical resolution was 500 m up to 6 km a.g.l. and remaining PES above 6 km was integrated into one additional output layer.
For the aged smoke case in Kumpula, Finland on 22 September 2020 the FLEXPART simulation retroplume was released at height interval of 3 to 4 km above ground level (a.g.l.) and time interval of 18:00 to 19:00 UTC, respectively. FLEXPART backward simulation was computed for 16 d. For the volcanic ash particles in Welgegund, South Africa on 17 December 2016 the FLEXPART simulation retroplume was released at height interval of 2.5 to 3.2 km a.g.l. and time interval of 04:00 to 05:00 UTC, corresponding to the lidar observation of the elevated layer. The duration of the FLEXPART backward simulation for this event was 14 d.
2.6 MODIS fire radiative power
The fire radiative power (FRP) product from MODIS Aqua and Terra, collection 6.1, (Giglio et al., 2016) was downloaded through the FIRMS interface for the period 7 to 20 September 2020 covering the area of North America to examine the locations of wildfires in the path of the airmass for the Kumpula case.
In this section, we present the observations of extremely fresh and aged smoke and volcanic ash particles. Extremely fresh and aged smoke aerosols were observed in Finland during 2024 and 2020, and volcanic ash particles were observed in South Africa in 2016.
3.1 Case study 1: Extremely fresh smoke
A controlled prescribed burning was conducted on the 6 June 2024 in Kiviniemi ( N, E) in North Savo region in Finland (Fig. 1). Approximately 8 hectares of managed boreal forest ecosystem was burned, with the objective of promoting biodiversity. The area is a 35–75 year old dry Scots pine (Pinus sylvestris) forest, with scattered birch (Betula sp.) within the stand. A commercial thinning was carried out in winter 2022, leaving logging residues unevenly distributed across the area. The understory is sparsely vegetated, with dwarf shrubs (Vaccinium myrtillus, V. vitis-idaea), mosses (Pleurozium schreberi), and Cladonia lichens dominating the forest floor. The prescribed burning was performed by the Finnish Forest Administration (Metsähallitus) and the fire was allowed to extinguish naturally – mostly within 24 h, although isolated smoldering persisted for several days after the burning event. The fire burned as a surface fire of low to moderate intensity, with spatially variable severity ranging from low to high. The prescribed burning was carried out in two events. In the first burning event, the fire started at about 11:00 UTC south from the measurement container along the horizontal road until the whole southernmost section of the area was burned (Fig. 1b). The wind direction in this first burning was towards north, bringing the smoke plumes towards the measurement site. The second burning event started after 15:30 UTC. The fire was initiated at the easternmost area above the horizontal road and progressed northwards until the rest of the area was burned. The fire was made to progress in a direction against the wind to ensure a better control of the burning.
Figure 2 presents the atmospheric conditions over Kiviniemi, Finland on the 6 June 2024, recorded by the HALO Doppler lidar on site. Very high values in the ATB1565 profile are seen close to the surface starting at about 11:00 UTC, caused by high concentrations of smoke particles. In this first aerosol layer, which from now on is referred to as the smoke layer, the δ1565 is very low (Fig. 2b). The bottom and top boundaries of the smoke layer are also marked with red filled circles. As seen by the lidar, the smoke layer had its highest extent during the first burning event in which the direction of the wind was towards the lidar instrument and the fire was at its closest proximity to it. The maximum top height of the smoke layer reached at about 460 m and the average geometrical extent of it was 120 ± 90 m.
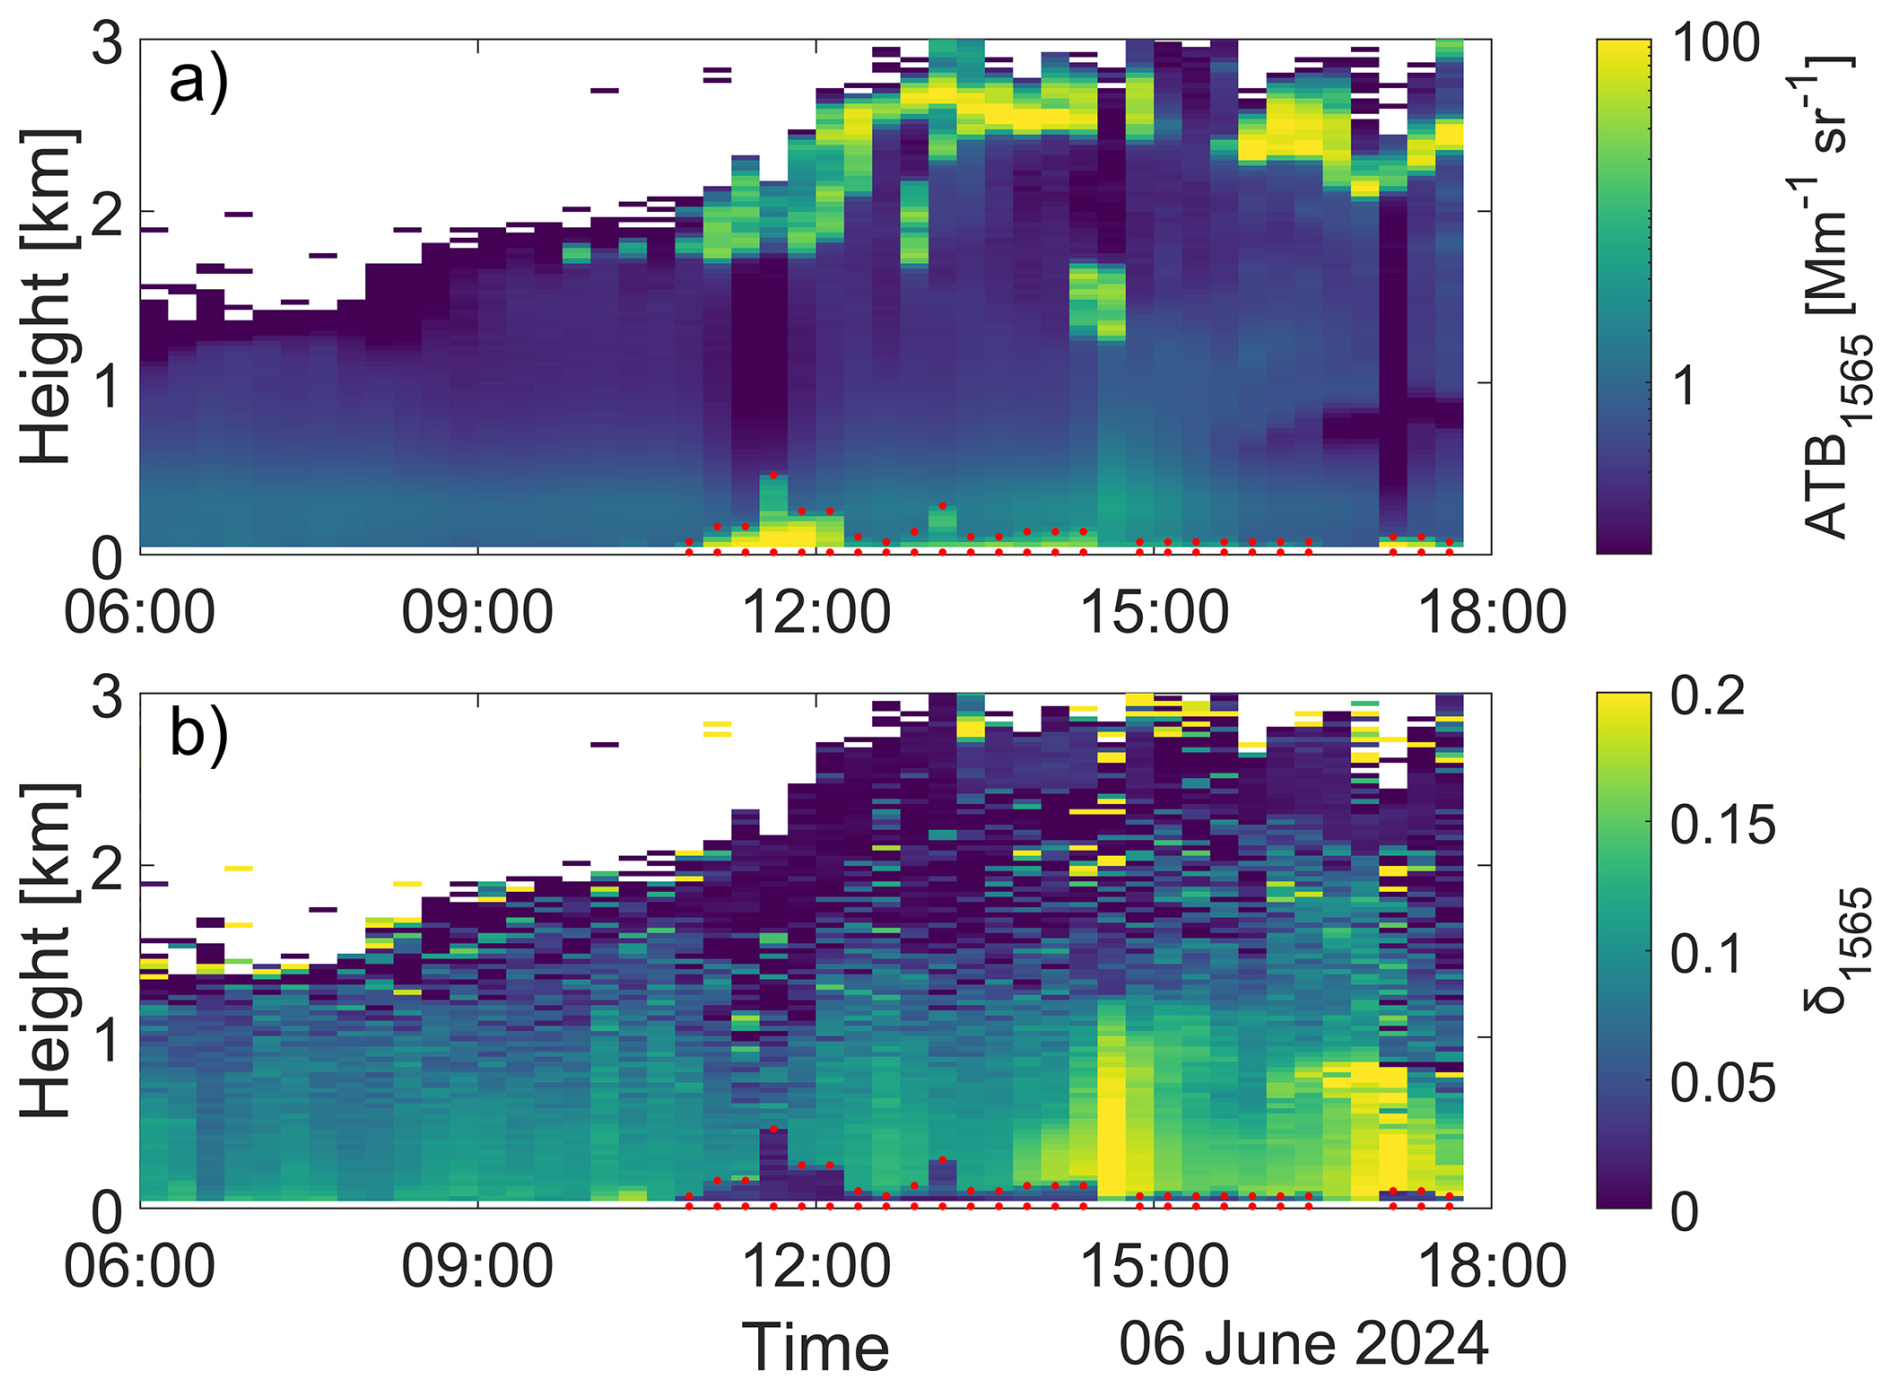
Figure 2Time-height plot of (a) ATB1565 and (b) δ1565 measured in Kiviniemi 6 June 2024, with the HALO Doppler lidar. The red dots indicate the boundaries of the smoke layer. The temporal resolution corresponds to 15 min. The ATB1565 is shown on a logarithmic color scale. A co-polar SNR threshold of 0.0005 was applied to the observations.
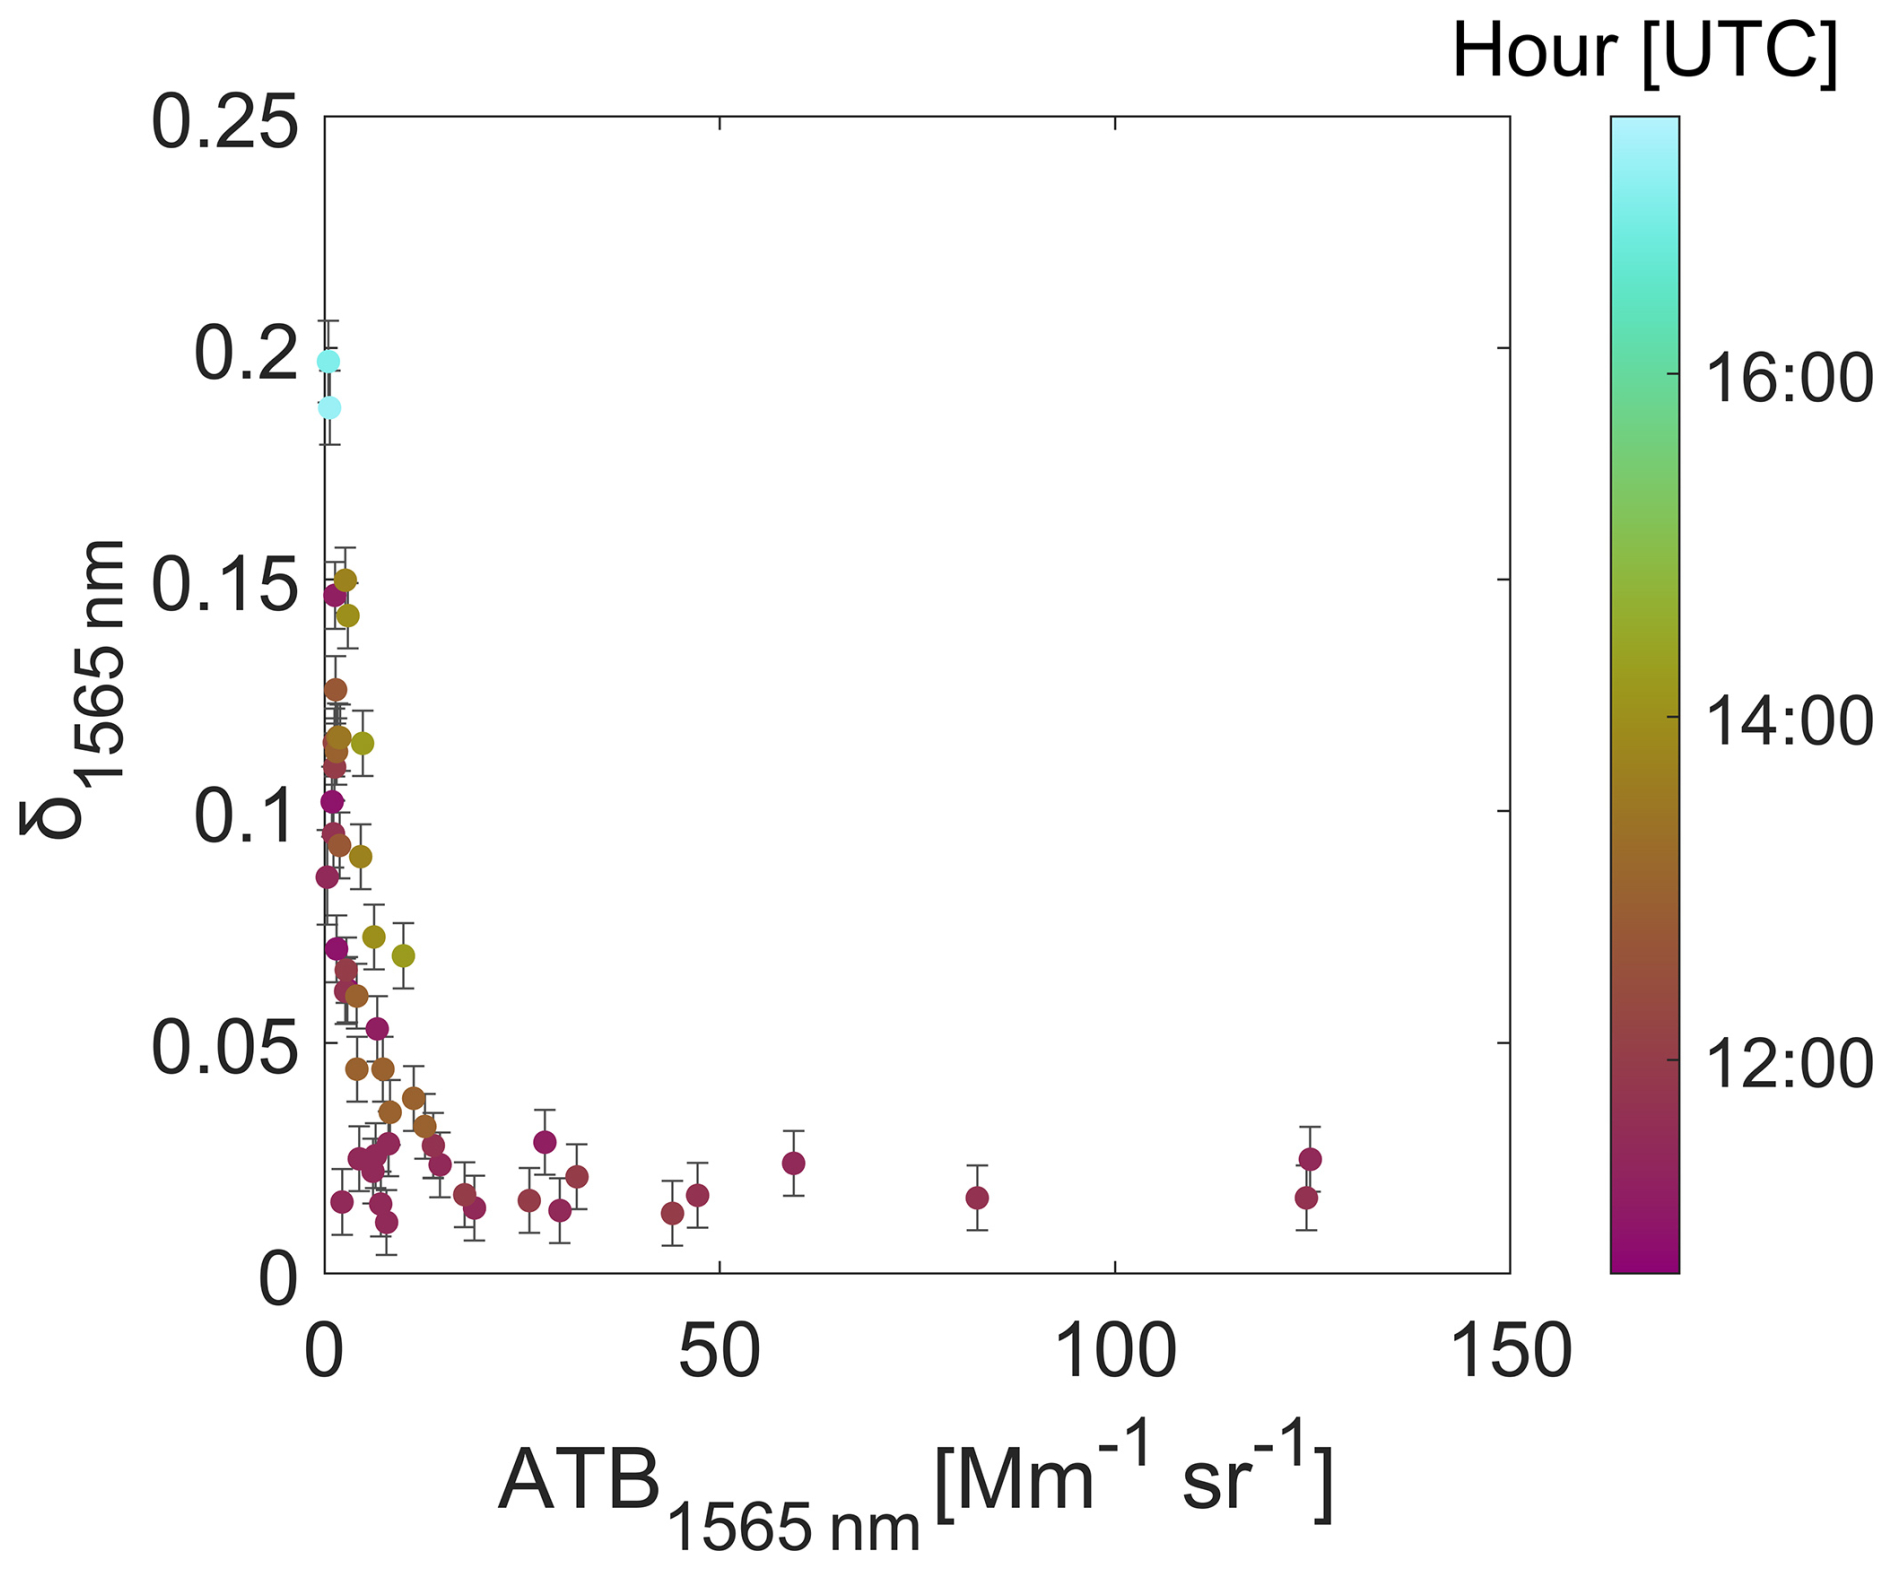
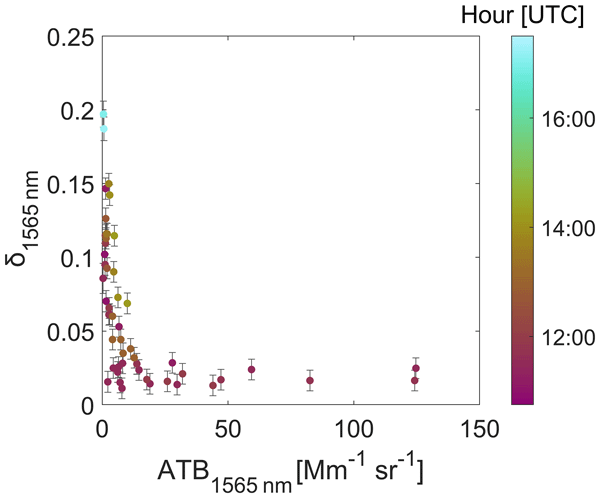
Figure 3Scatterplot of ATB1565 versus δ1565 for all height bins within the boundaries of the smoke layer. The color indicates the time of the observations. The error bars show the absolute uncertainty of δ1565.
Figure 3 shows the relationship between ATB1565 and δ1565 for all height bins inside the smoke layer boundaries. A clear inverse relationship is observed, with increasing ATB1565 corresponding to decreasing δ1565. This behavior is consistent with the presence of fresh smoke, which is characterized by enhanced backscatter and relatively low depolarization. For sufficiently high ATB1565, δ1565 remains effectively constant. This behavior indicates that the signal is primarily governed by a single aerosol type, i.e. fresh smoke, with relatively uniform microphysical properties. Under these conditions, further increases in particle concentration enhance ATB1565 but do not significantly affect δ1565, which is primarily governed by particle shape rather than concentration.
After 14:00 UTC, elevated δ1565 values are detected. At this time, the smoke plume was no longer aligned with the instrument's line of sight, as indicated by the concurrent decrease in ATB1565. Nevertheless, the δ1565 time series reveals the presence of highly depolarizing aerosol particles. Although large fly-ash particles produced during biomass burning can contribute to increased depolarization (Martinent et al., 2025; Kalembkiewicz et al., 2018), the observed δ1565 enhancement extends up to approximately 1 km a.g.l., i.e. substantially higher than the fresh smoke layer observed between 11:00 and 12:00 UTC. This vertical extent suggests that the particles responsible for the elevated δ1565 were not associated with freshly emitted local smoke, but rather were well mixed within the boundary layer. To further examine this, Fig. 4 presents the daily evolution of pollen concentrations measured at a site in Kuopio (approximately 50 km from the lidar location). Pine pollen was the dominant type during the observation period. The elevated δ1565 values observed here are consistent with previous lidar observations of pine pollen (Filioglou et al., 2023). Therefore, the enhanced δ1565 signal is attributed to the regional presence of pine pollen particles.
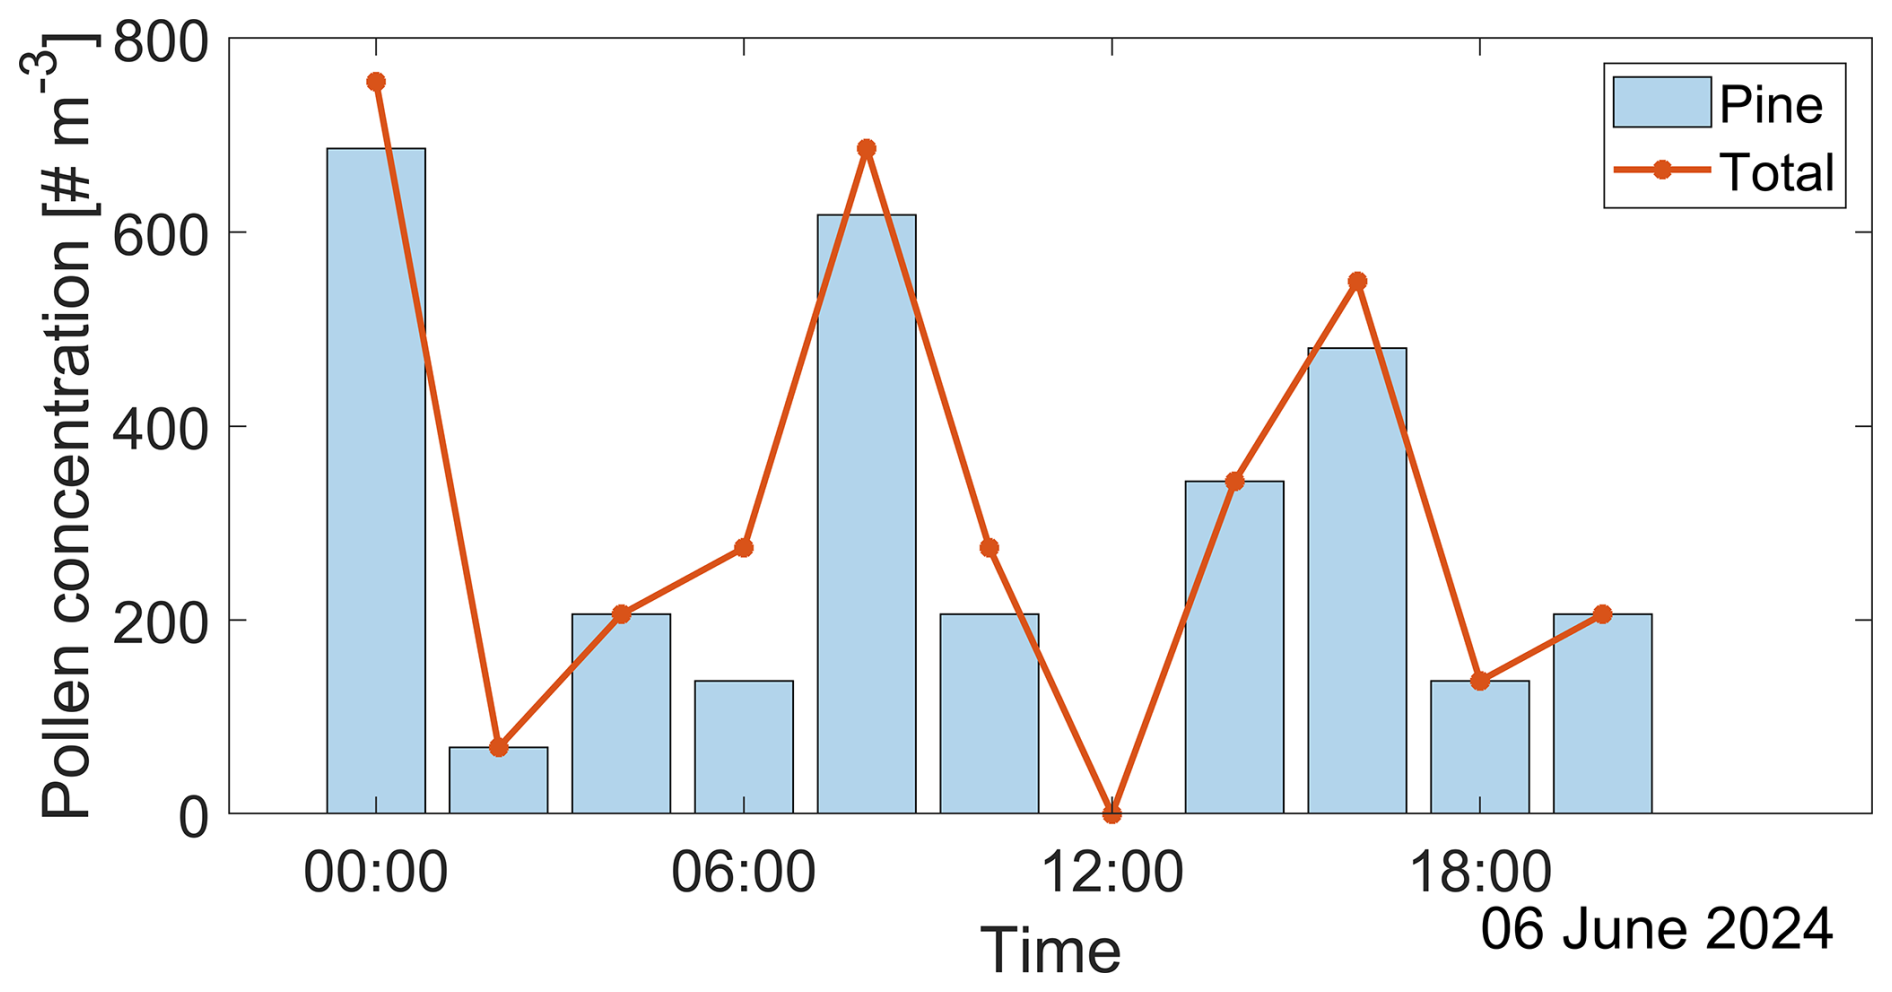
Figure 4Evolution of the pine and total pollen concentration on the 6 June 2024 from the Burkard sampler at Kuopio site.
A mean δ1565 of extremely fresh smoke aerosol particles of 0.017 ± 0.004 was estimated accounting for observations having an ATB1565 higher than 30 Mm−1 sr−1. Previous studies on fresh smoke particle detection report low δ due to the dominance of almost spherical morphology or weakly nonspherical aggregates shortly after emission. Typical tropospheric values of 0.01–0.03 at 355 nm, 0.02–0.06 at 532 nm and 0.01–0.02 at 1064 nm for fresh plumes have been previously reported (Pereira et al., 2014; Haarig et al., 2018; De Rosa et al., 2022). Falling well within the range of δ in shorter wavelengths, the δ1565 shows minimal spectral dependence.
3.1.1 Mass concentration estimation
Going beyond, the lidar–derived mass concentration was determined following the methodology outlined by Ansmann et al. (2010). Since there are no observational values on the LR and cv at 1565 nm, parameters that are needed for the mass concentration calculation, we converted the β1565 from the Doppler lidar into β532 using a BAE (See Sect. 2.2). Furthermore, in order to estimate the mass concentration at 532 nm, the cv,532 and LR532 should be known. A cv,532 of 0.16 ± Mm for fresh smoke has been previously reported in Ansmann et al. (2026) and utilized in this study. A BAE and LR532 of 1.22 ± 0.09 and 28±11 sr were estimated from Mie calculations at 532 nm (see Sect. 2.4). The Mie estimated LRs at 355, 532, 1064 and 1565 nm wavelengths for this specific aerosol mixture during the smoke event were 81±13 sr, 28±11 sr, 45±2 sr and 51±7 sr, respectively. Having the LR1565, the determination of the conversion factor at 1565 nm for boreal smoke aerosol particles was then possible, yielding to a mean value of Mm.
Figure 5 demonstrates that the lidar-derived mass concentrations for the extremely fresh smoke event are in overall good agreement with the SMPS–OPC in situ observations. This consistency indicates that the lidar-based retrieval captures the main features of the near-source smoke plume despite the inherent differences in the sampling approaches. At the same time, both datasets reveal pronounced small-scale variability in smoke concentrations, which is expected given the close proximity of the fire source to the measurement site. This variability is particularly evident in the in situ observations. The vertical lines in Fig. 5 represent the temporal variability of the smoke concentration, expressed as the range between the 10th and 90th percentiles, highlighting strong concentration fluctuations within the plume. The lidar measurements additionally provide information on the temporal evolution and vertical structure of the smoke layer. The mass concentration is dominated by the amount of the larger aerosol particles and during the two flights moderate differences were captured. During these flights, the measurement altitude varied between approximately 50 and 100 m a.g.l., with maximum heights of 70 and 100 m during the first and second flights, respectively. During the 1st flight there is greater agreement between the lidar and in situ observation compared to the 2nd flight but at the same time the range of mass concentration is much larger. This discrepancy is expected, given the different sampling volumes and the inhomogeneity of the smoke plume and assumptions in the mass concentration estimation between these two measuring approaches. Lidar-derived mass concentration estimations are bound to 49 % uncertainty, assuming a 10 % uncertainty in the β1565 and the uncertainty of the rest parameters as noted above. The presence of a dense smoke layer around 12 UTC results in substantial attenuation of the lidar signal, making the forward Klett inversion inherently unstable and strongly dependent on the boundary conditions. Therefore, the retrieved β1565 carries considerable uncertainty and should be regarded as indicative of the plume structure only, rather than a quantitatively robust estimate. Supporting observations from surface and drone indicate that the aerosol composition during the fire event was dominated by OA, while BC contributed less than 1 % to the total mass. This is consistent with the characteristics of surface fires, which burn at relatively low combustion temperatures (e.g. Cahill et al., 2008; Mukherjee et al., 2025; Vakkari et al., 2026). For crown-fire-dominated events, such as those commonly observed in North America (Rogers et al., 2015), a higher BC fraction is typical.
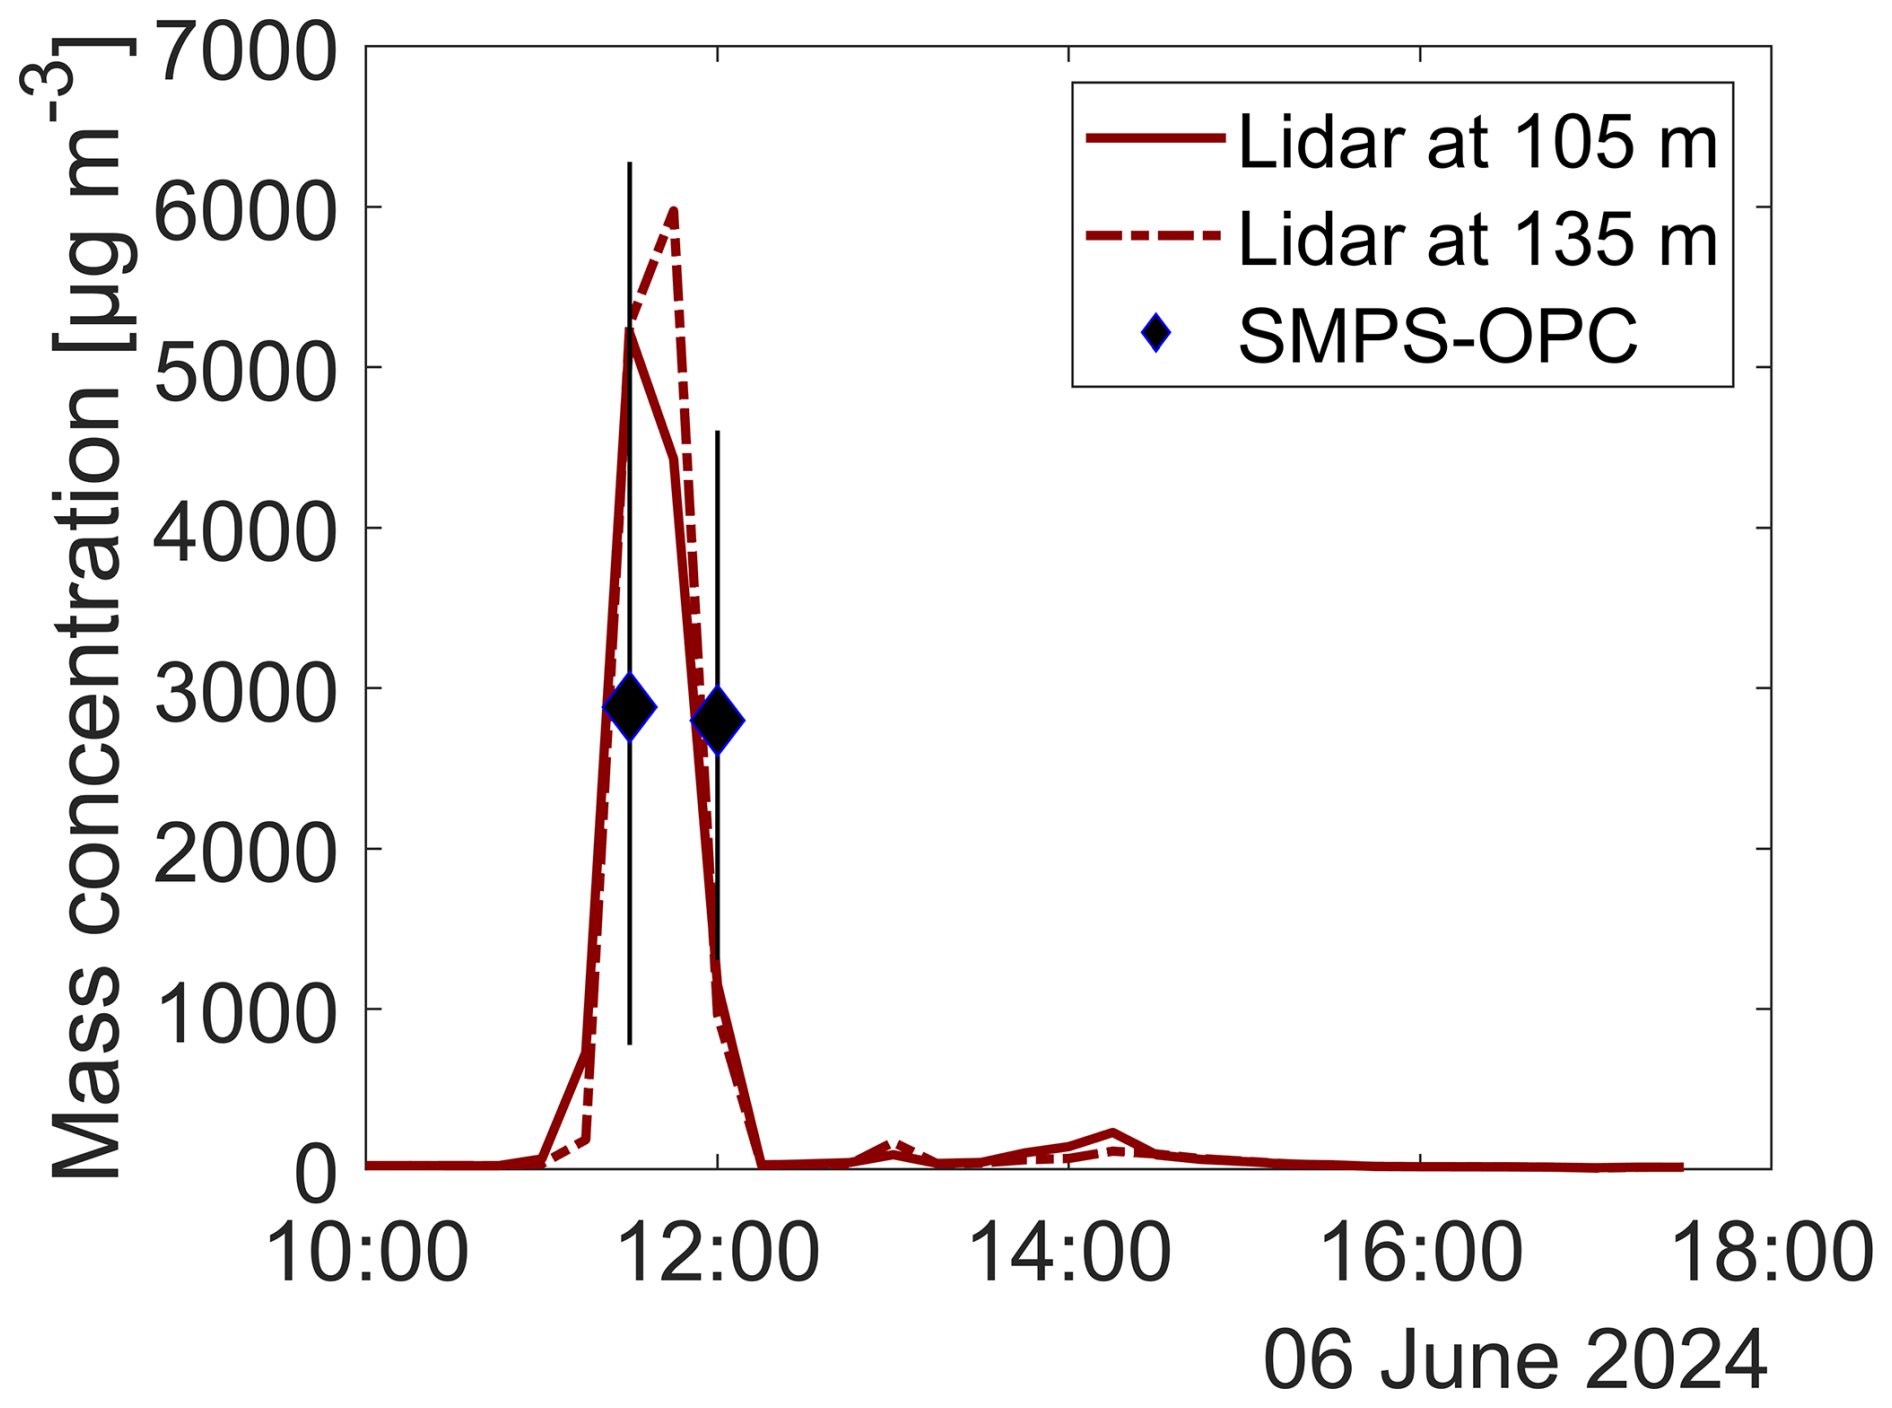
Figure 5Mass concentration estimations from in situ SMPS-OPC observations and from lidar observations at 105 and 135 m. The SMPS-OPC observations are limited to the drone flight times between 11:30–11:40 and 12:00–12:10. The vertical lines indicate the 10th and 90th percentiles.
Related to the Mie-estimated LRs, the LR at 355 and 532 nm are consistent with previous measurements of extremely fresh smoke particles exhibiting a decreasing trend with values of 46 ± 4 sr at 355 nm and 34 ± 3 sr at 532 nm (De Rosa et al., 2025), although the Mie-estimated LR355, in this study is larger than the one reported at De Rosa et al. (2025). More often, there is a neutral or slight increasing spectral dependence (Müller et al., 2005; Nicolae et al., 2013; De Rosa et al., 2022; Janicka et al., 2023) reported for fresh smoke. Although there are no literature values for the LR1565, increasing LR1064 has been previously reported for long-range transported free-tropospheric smoke layers (Haarig et al., 2018; Su et al., 2025). This is not the case in Sayer et al. (2014) where similar LR values at 355 and 532 nm followed by a decrease towards 1064 nm were reported at boreal locations using observations from a plethora of AERONET sites. To this direction, using light-scattering simulations, Liu and Mishchenko (2020) investigated the lidar ratios at 532 and 1064 nm for a range of refractive indexes, particle sizes and shapes and found a decreasing trend with increasing wavelength for aerosol particles with an effective radius smaller than about 0.3 µm as well. In this study, the Mie estimations point to increasing LRs between 1064 and 1565 nm wavelengths but the values are smaller compared to the ones reported in Haarig et al. (2018) and Su et al. (2025), which is attributed to the aging of the smoke particles and the likely higher share of absorbing aerosols like BC in the aerosol mixture in their studies.
The lower LRs estimated from the Mie calculations at the visible and infrared wavelengths could be explained by the contribution of BrC, which absorbs more effectively at shorter wavelengths. Using a laboratory open burning setup Mukherjee et al. (2025) found that optical properties of freshly emitted organic particles are substantially diverse and dependent on the fire type (smoldering, flaming) and burning material. Among others, they used Finnish boreal peat and forest surface samples. Photochemical aging transformed the weakly absorbing particles into less absorbing while the opposite is anticipated in dark-aging conditions. In contrast, BC is more likely to become more absorbing due to the lensing effect Zhang et al. (2018). The wavelength dependence of LR in aged smoke particles (> a few hours) is also related to the composition of the smoke plume as it contains larger aggregates that become optically apparent at longer wavelengths. It is important to emphasize that the case presented here concerns smoke aerosol particles sampled within a few minutes after emission, whereas most previously reported observations of fresh smoke aerosol layers in the literature present substantially longer timescales (from hours to days). Smoke particles undergo rapid aging within hours after emission altering their size and scattering properties (Kleinman et al., 2020; Saide et al., 2022; Vakkari et al., 2018).
3.2 Case study 2: Long-range transported free tropospheric smoke
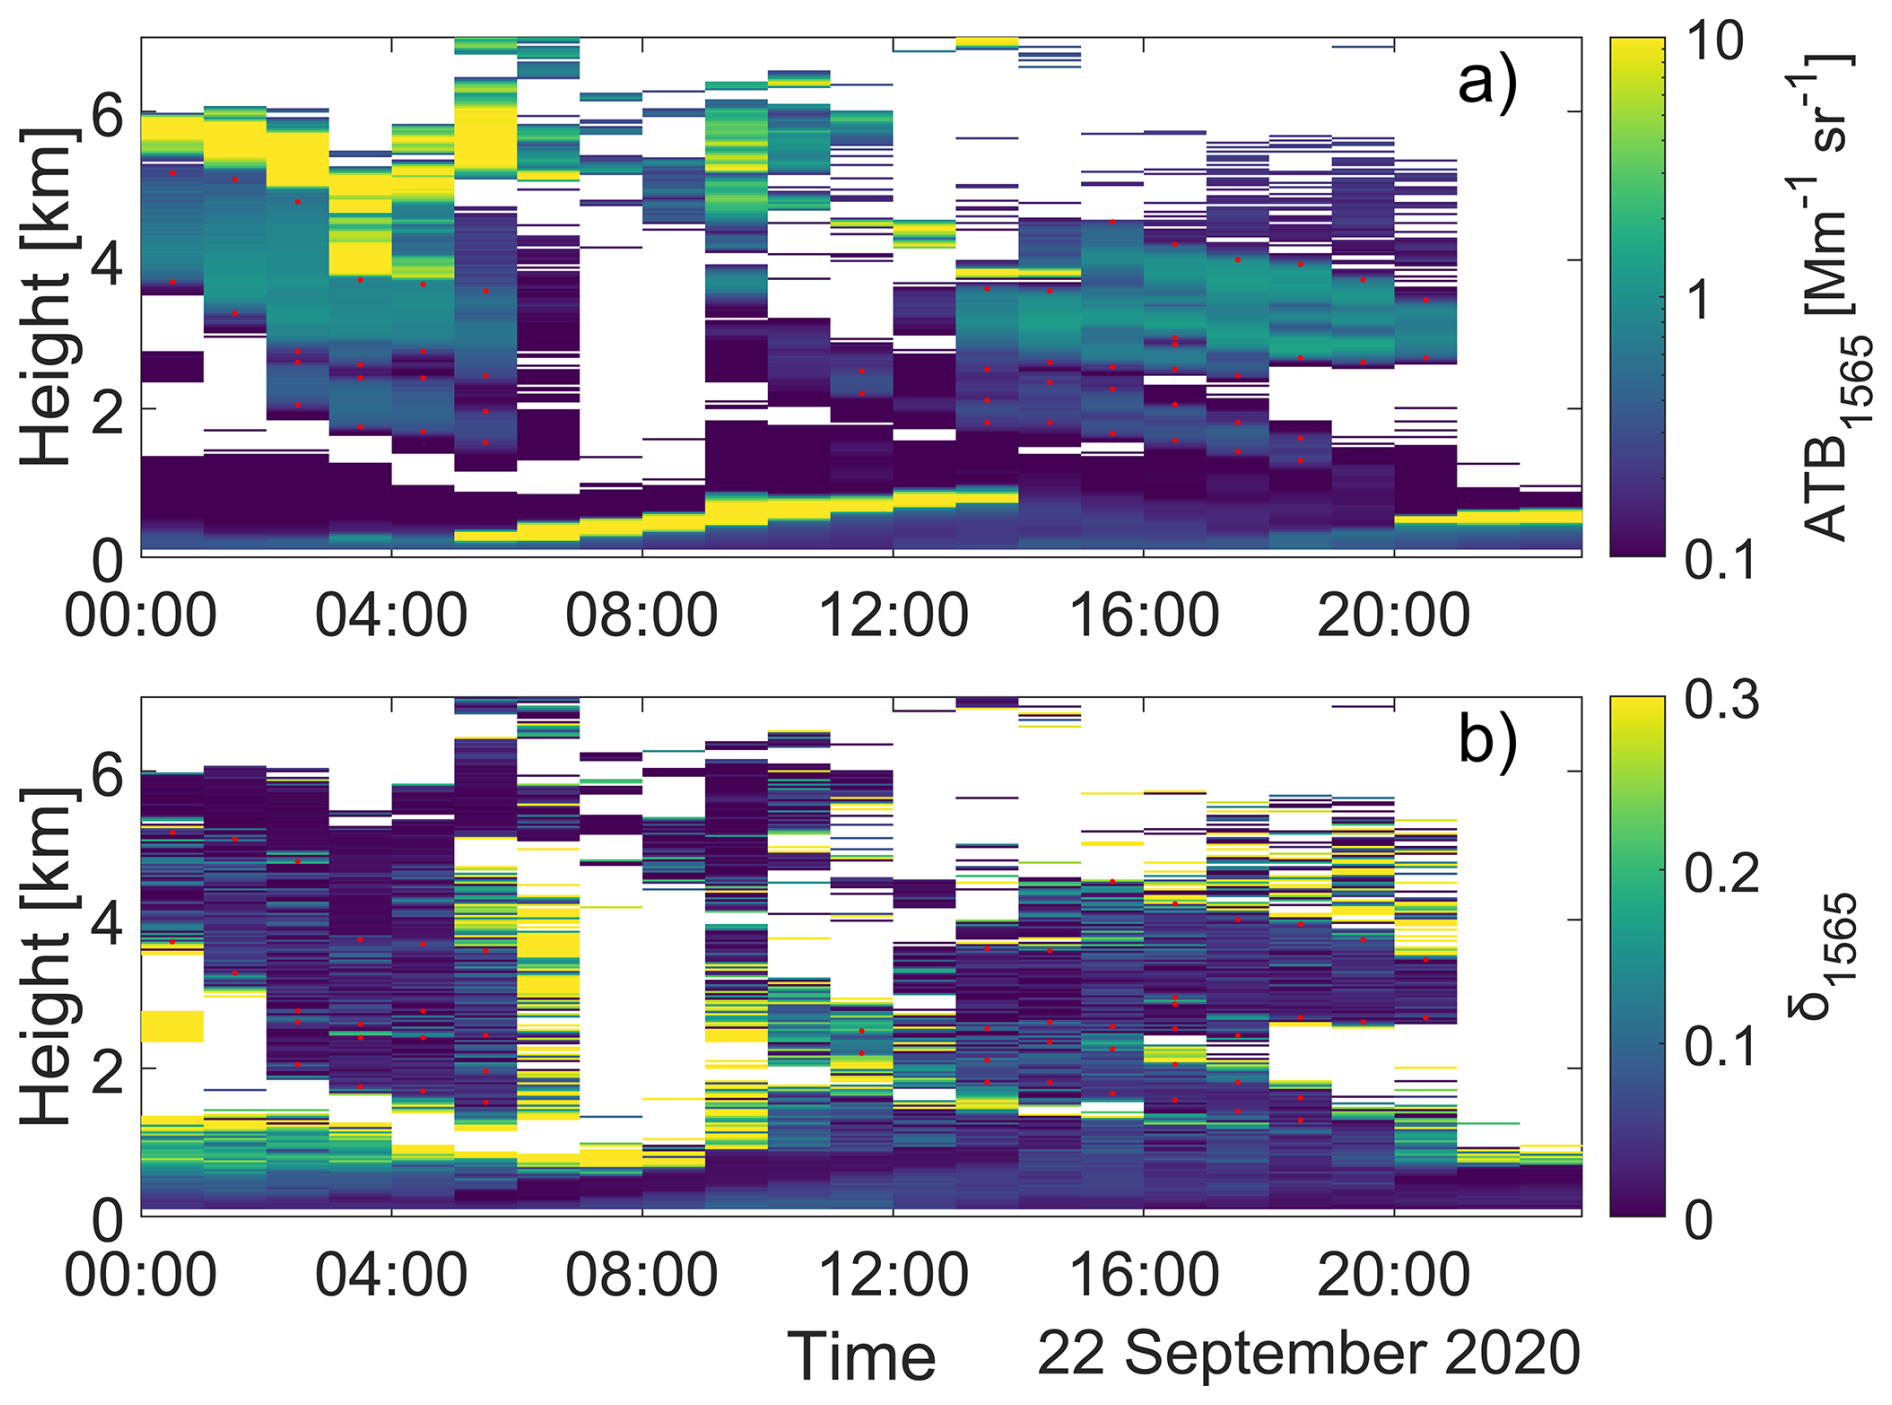
On the 22 September 2020, free-tropospheric aerosol layers were observed over Kumpula site ( N, E) in Finland (Fig. 6). The aerosol layers which extended from 1.3 to 5.1 km in the vertical had a variable geometrical depth with a mean value of 800 m (range: 120 m–2.2 km). An example case of the hourly-averaged Doppler lidar profiles between 17:00 and 18:00 UTC is shown in Fig. 7. Elevated β1565 values can be seen at around 1.6 km and between 2.7 and 4 km with a mean δ1565 of 0.034 ± 0.01 and 0.038 ± 0.017, respectively. For this case, the 16 d FLEXPART backward simulation showed air mass transport from California, which overlapped with very intensive fire locations according to MODIS observations (Fig. 8). In fact, long-range transport from the same wildfire episode in California (USA) was observed a few days earlier in Germany (Baars et al., 2021).
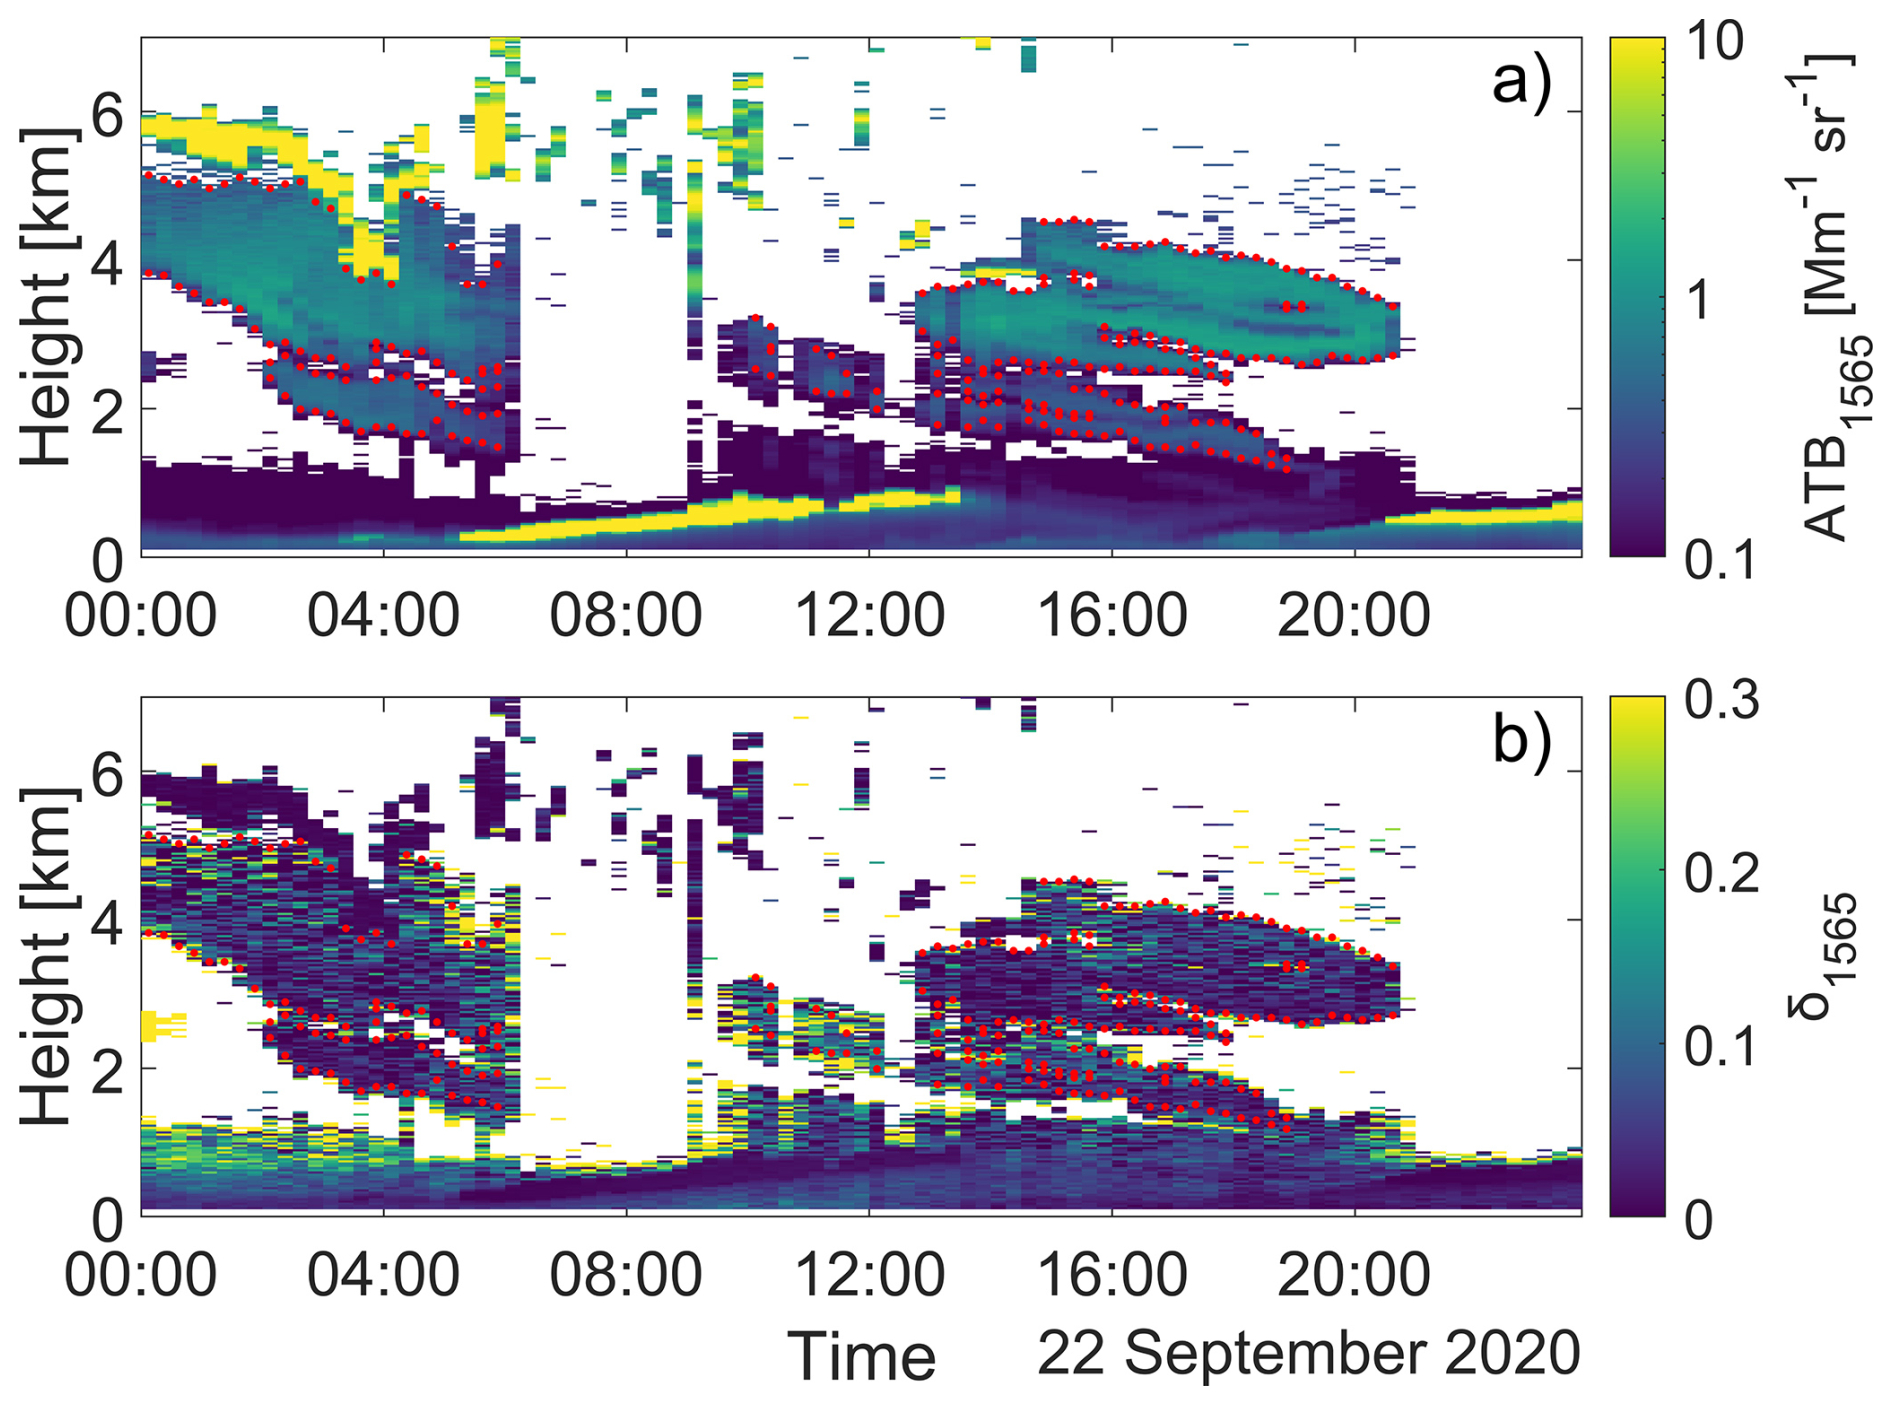
Figure 6Time-height plot of (a) ATB1565 and (b) δ1565 measured in Kumpula 22 September 2020, with the HALO Doppler lidar. The red dots indicate the boundaries of the smoke layer. The temporal resolution corresponds to 15 min. The ATB1565 is shown on a logarithmic color scale. A co-polar SNR threshold of 0.0006 was applied to the observations.
To further investigate the variation of δ1565 in these long-range transported smoke layers, hourly ATB1565 and δ1565 profiles were calculated to enhance the signal-to-noise ratio (SNR). Figure 9 presents the relationship between the hourly-averaged profiles of ATB1565 and δ1565 for all height bins inside the smoke layer boundaries. The smoke layer boundaries for the hourly profiles are indicated in the hourly time-height plot that can be found in the appendix (Fig. A1). Similar to the fresh smoke, lower δ1565 values coincide with higher ATB1565. Since this is long-range transported smoke located in the free troposphere, the ATB1565 is lower and the scatter of δ1565 is larger than in the extremely fresh smoke case. In order to retrieve the mean δ1565, we have accounted both for the relative uncertainty of δ1565 and the intensity of ATB1565 in a way that observations presenting high ATB1565 values and low relative uncertainty in δ1565 are weighted more in the average. A weighted mean δ1565 of smoke aerosol particles of 0.04 ± 0.02 was estimated for the long-range transported smoke particles following Eq. (1). We should note here that the same conclusions are valid when estimating the mean δ1565 using the 15 min resolution information but the uncertainty is higher due to the poorer SNR (not shown).
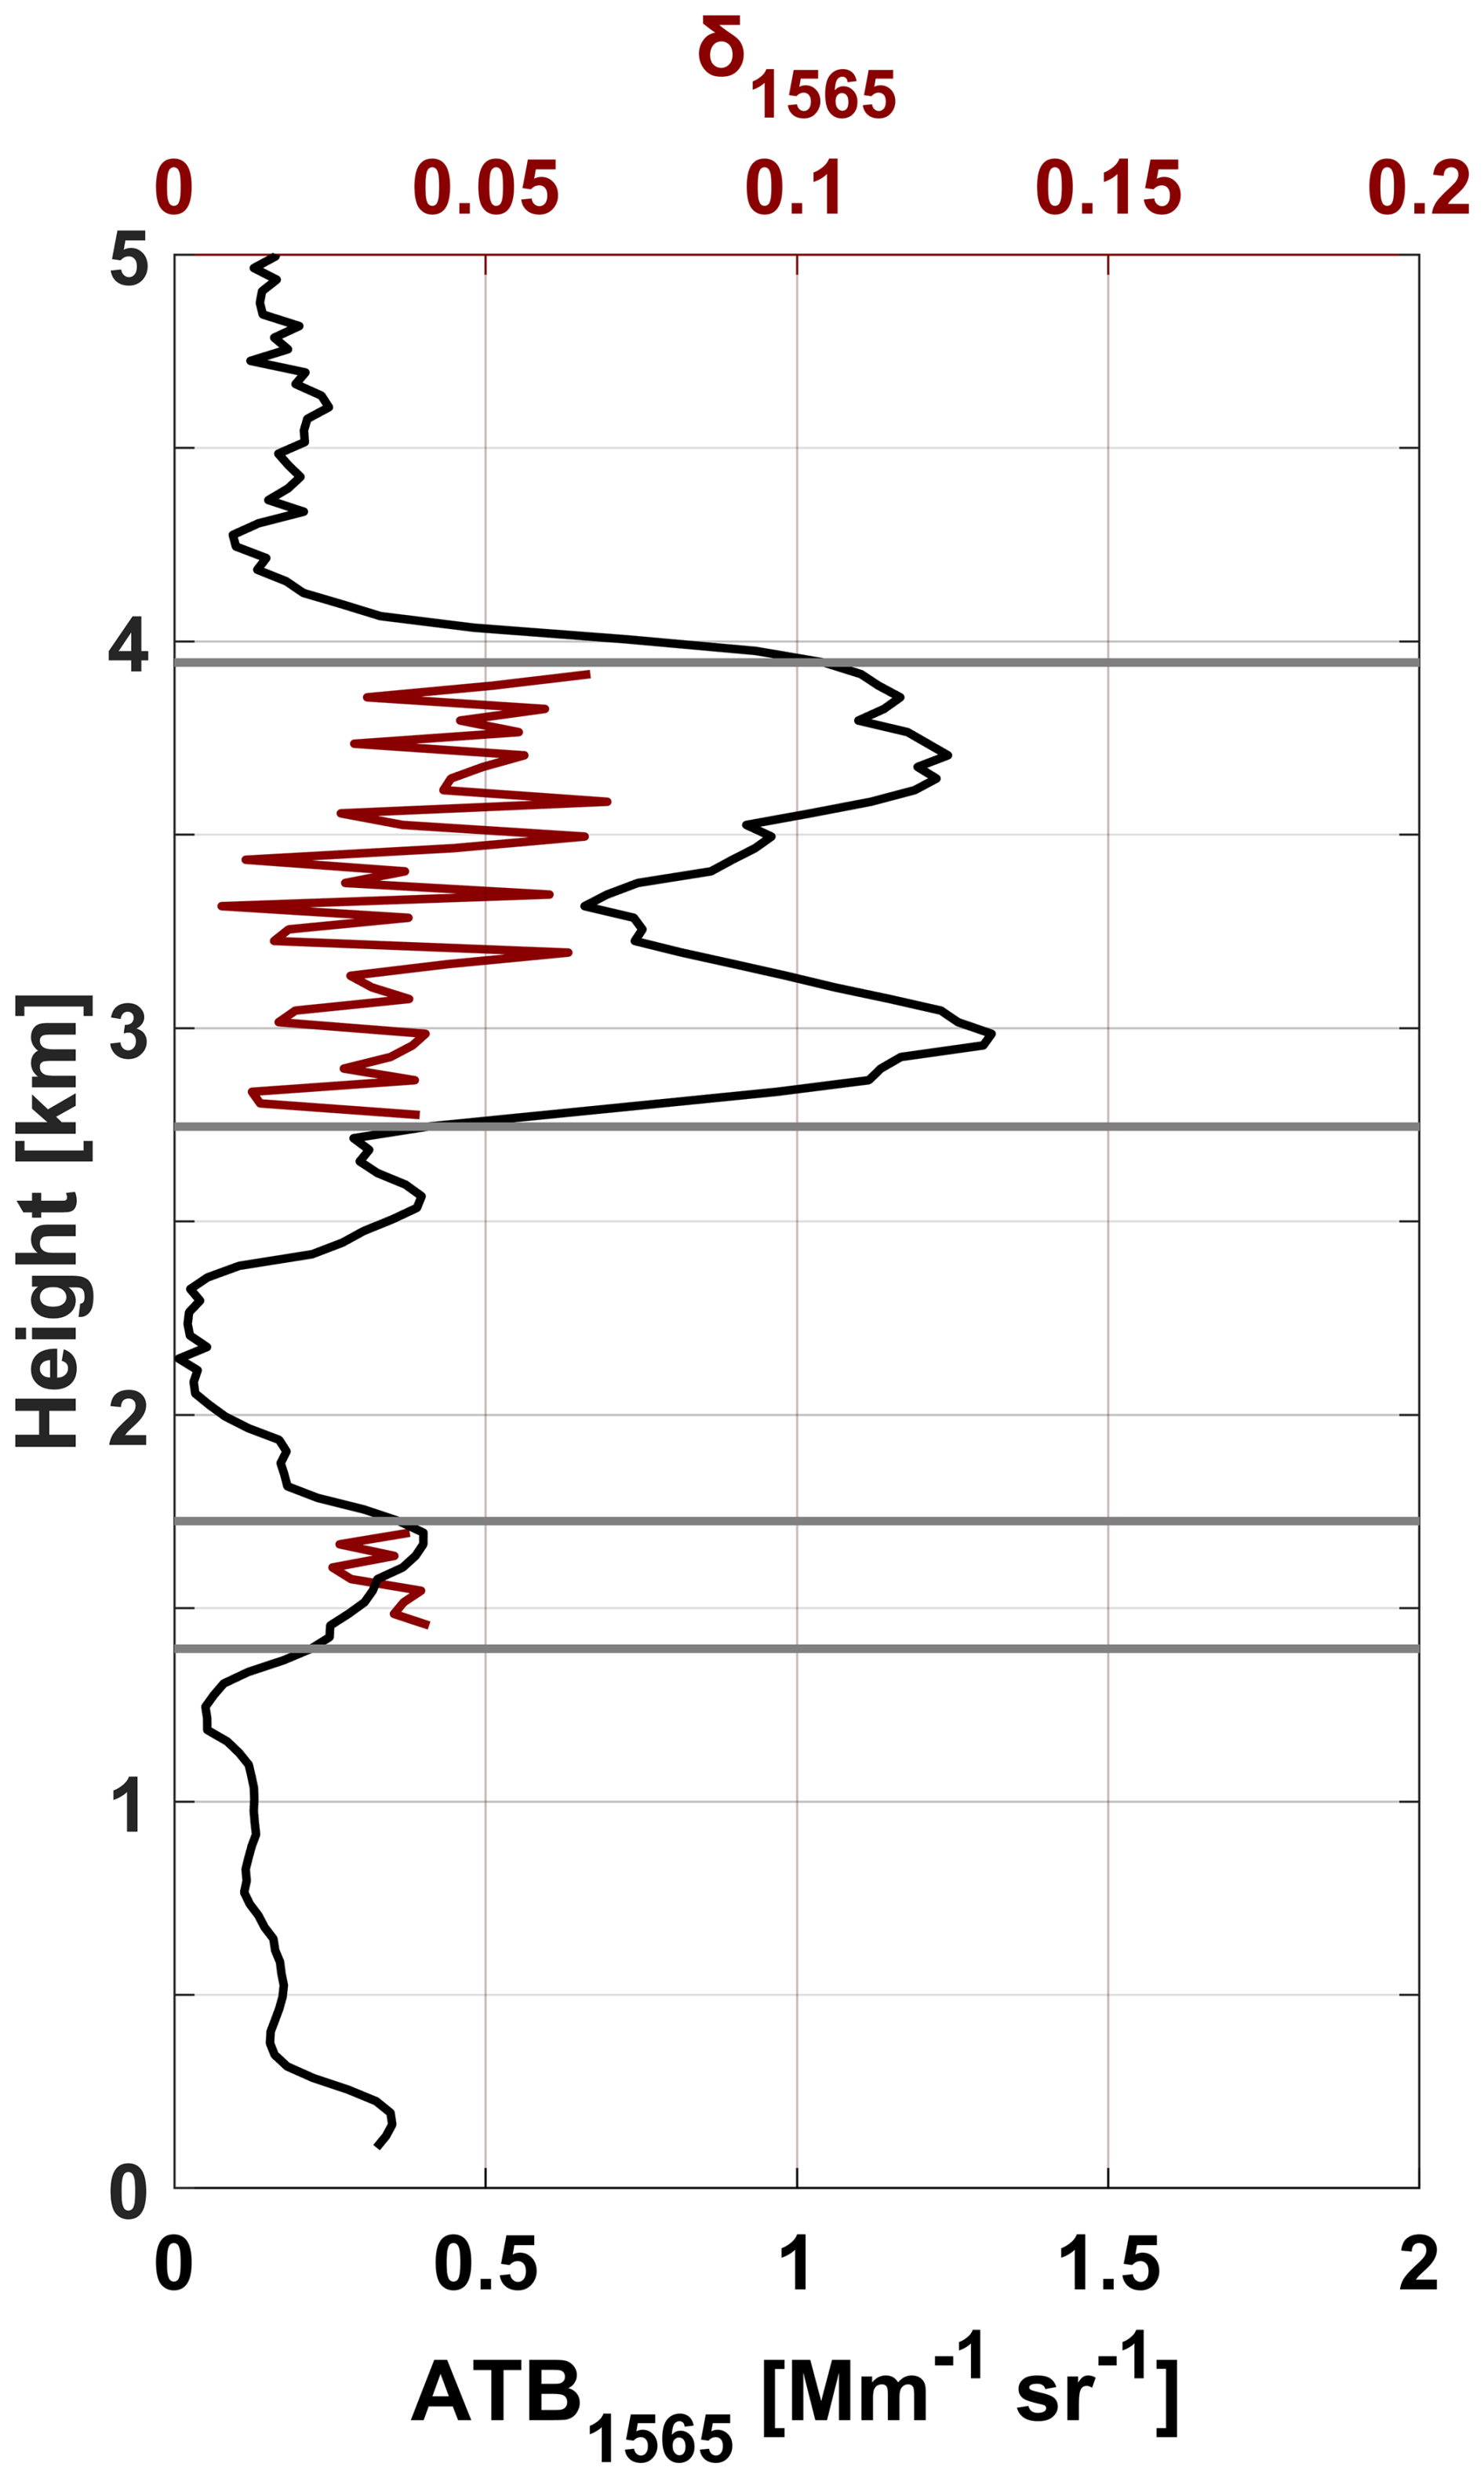
Figure 7Mean ATB1565 (black) and δ1565 (dark red, for the smoke layers only) vertical profiles accounting for a temporal resolution of 1 h starting at 17:00 UTC. The smoke layer base and top heights are indicated by gray horizontal lines.
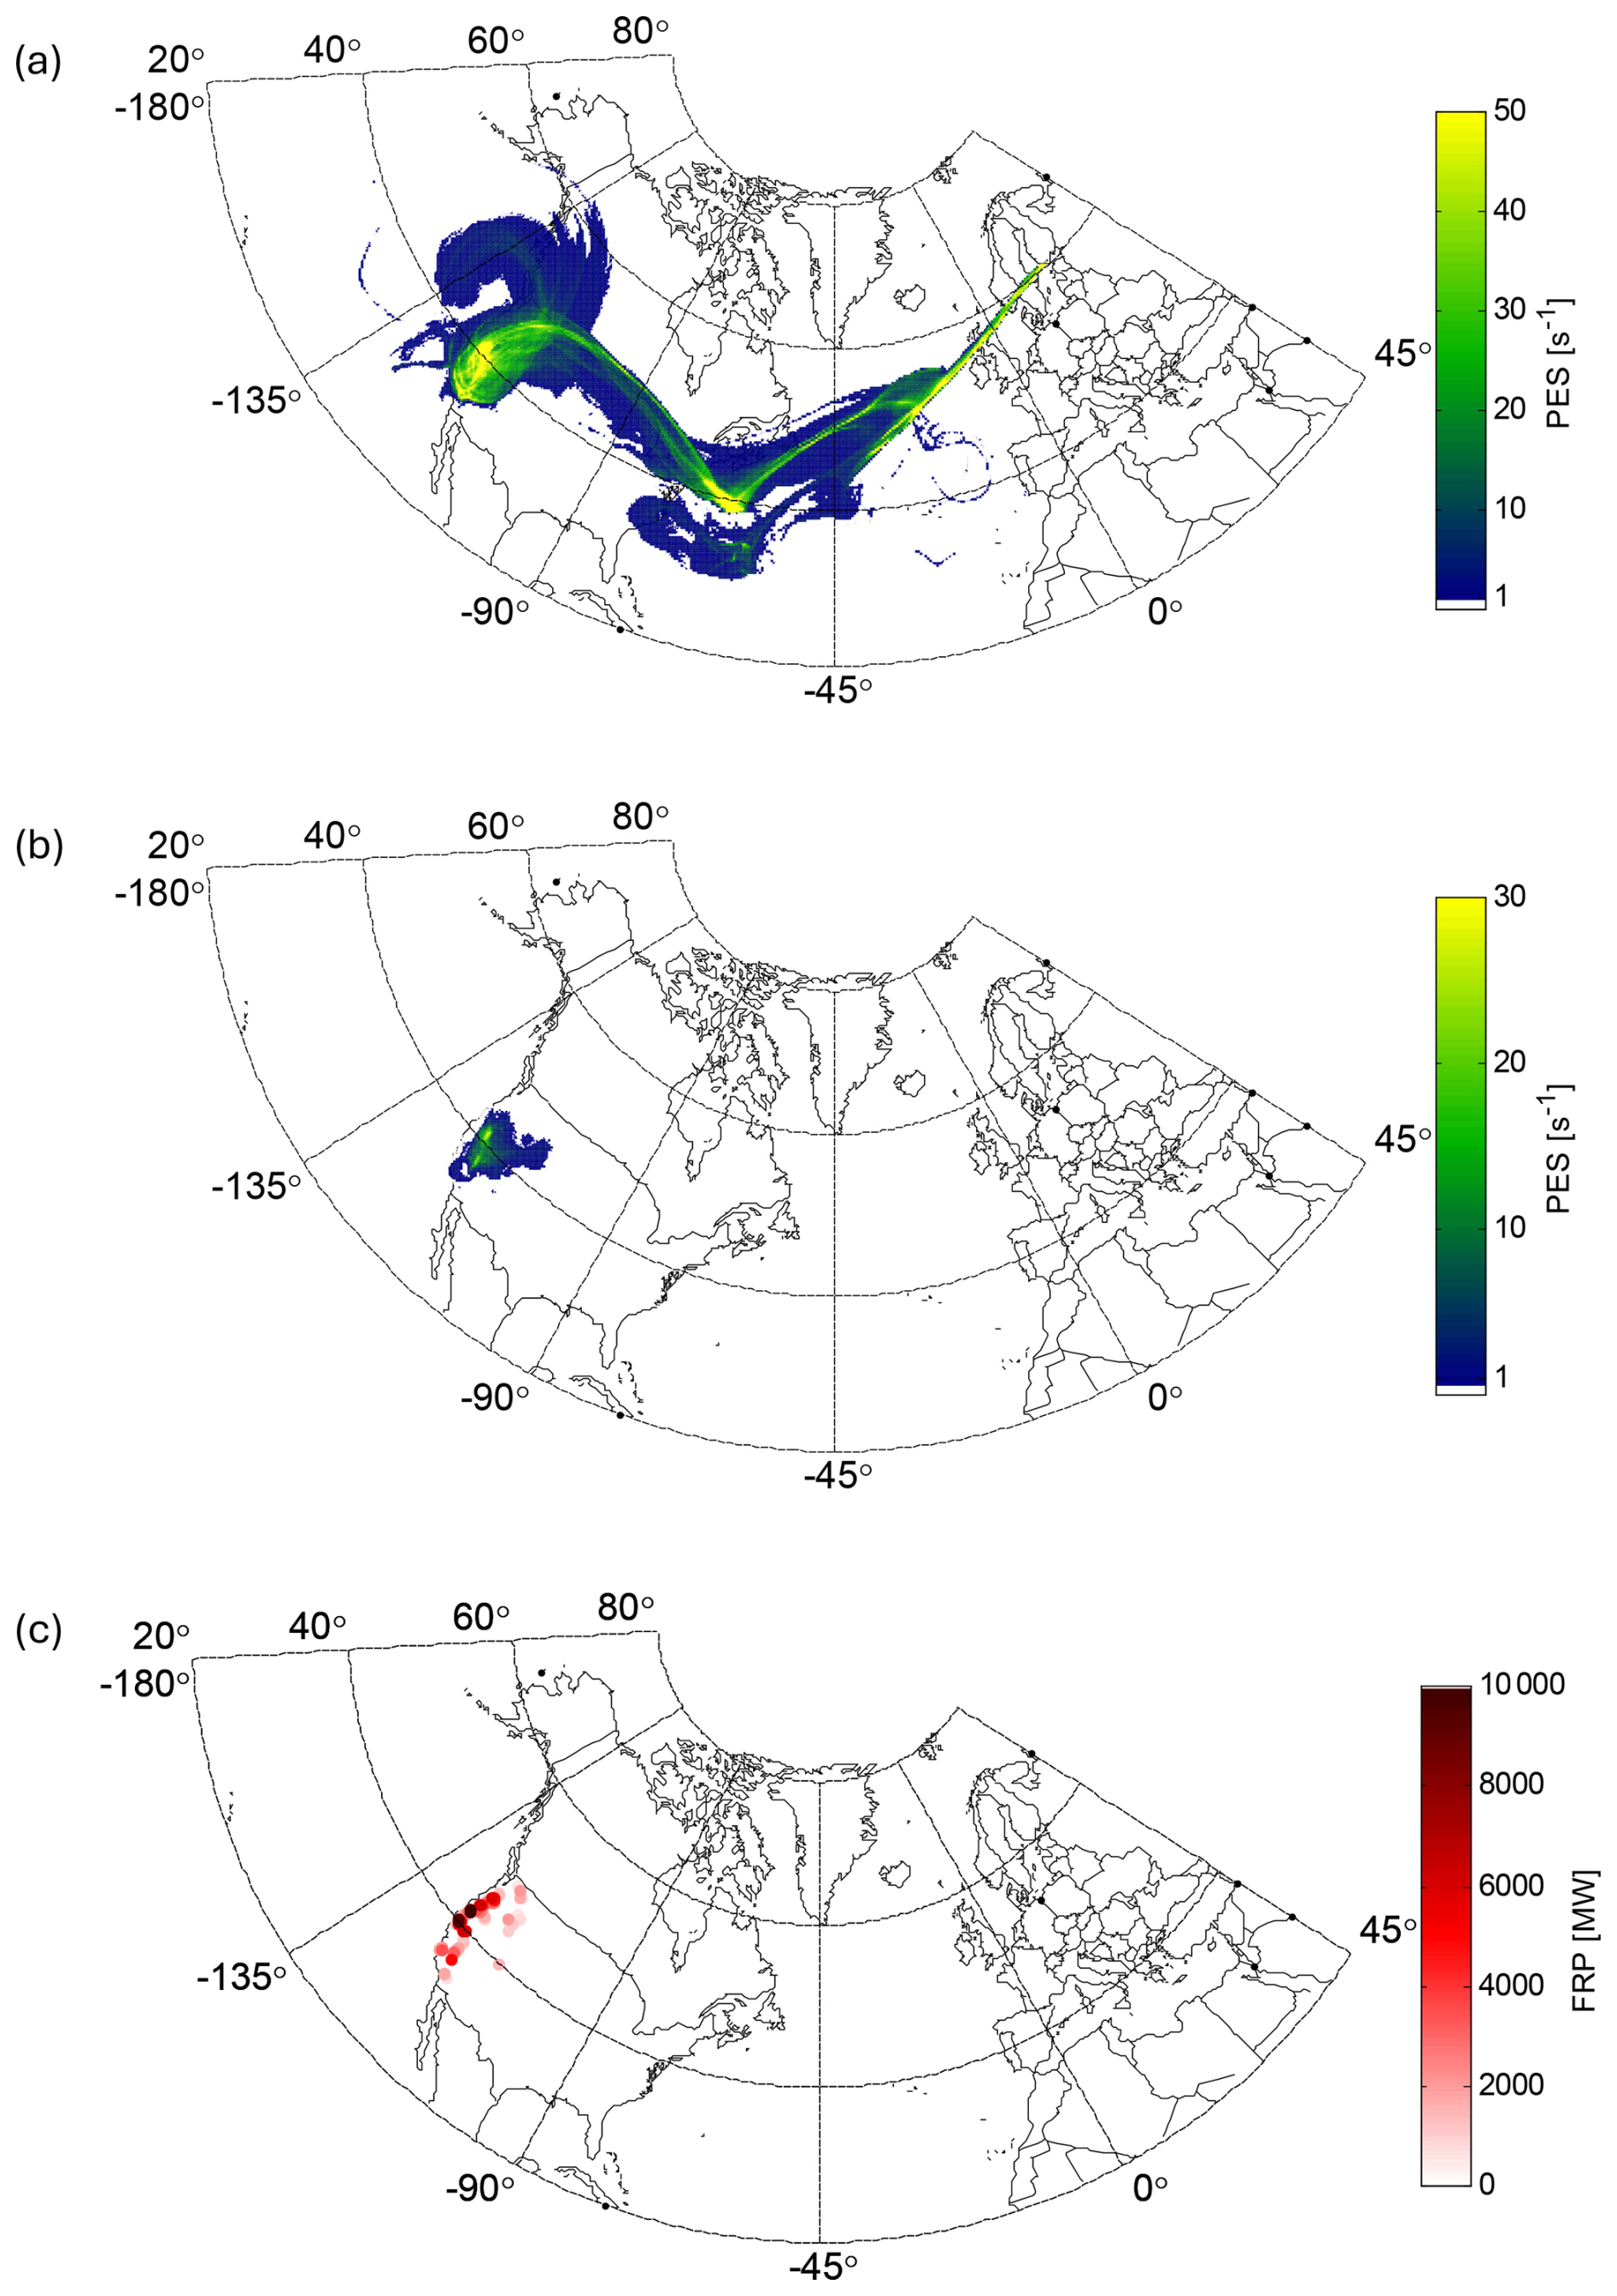
Figure 8Air mass history for the Kumpula case on 22 September 2020 in Finland. (a) Sum of PES at all heights accounting for 16 d back in time. (b) Sum of PES for < 1 km a.g.l. for 16 d back in time. (c) MODIS observations of FRP > 500 MW for the time period 8 to 12 September 2020.
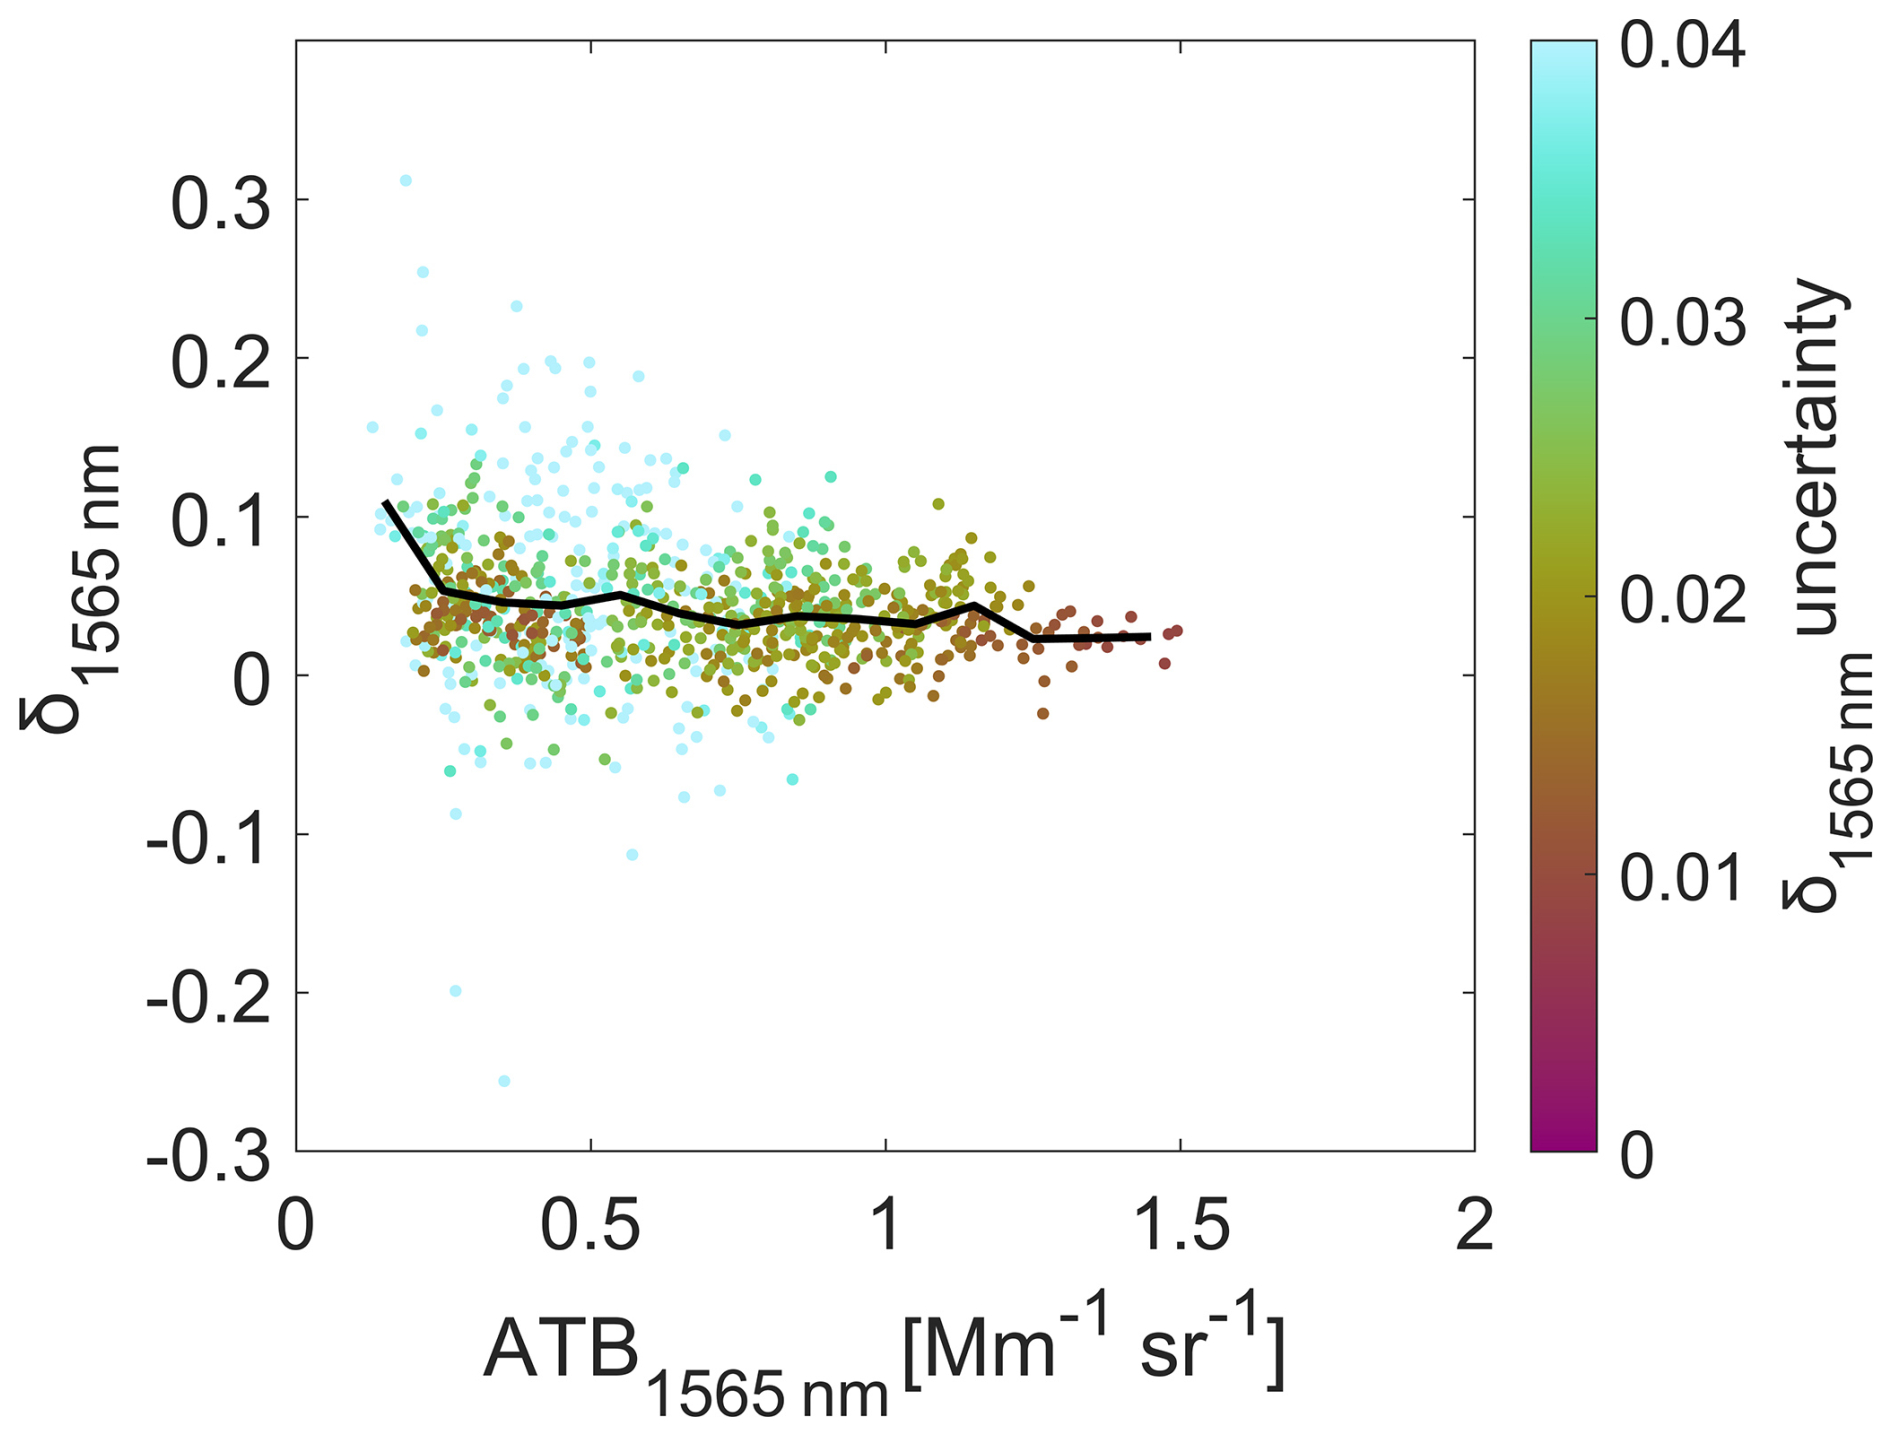
Figure 9Scatterplot of ATB1565 nm versus δ1565 nm at the long-range transported smoke plume layer extracted from hourly lidar data. The black line shows the mean δ1565 nm binned every 0.1 Mm−1 sr−1. The color indicates the absolute uncertainty of δ1565 nm.
Free-tropospheric smoke particles have been reported to produce depolarization ratios below 5 % across lidar wavelengths up to 1064 nm (Pereira et al., 2014; Haarig et al., 2018). The present findings are consistent with these earlier observations. In comparison to the fresh smoke, the free tropospheric smoke δ1565 is larger, indicating that the shape of the particles is more non-spherical. Various factors can contribute to the observed difference in δ1565, including higher fraction of fractal-shaped BC in smoke emitted in fires with high FRP or the presence of soil dust in the smoke plumes. Recent findings also link organic aerosol shape changes to chemical aging (Qin et al., 2024).
3.3 Case study 3: Volcanic ash in free troposphere
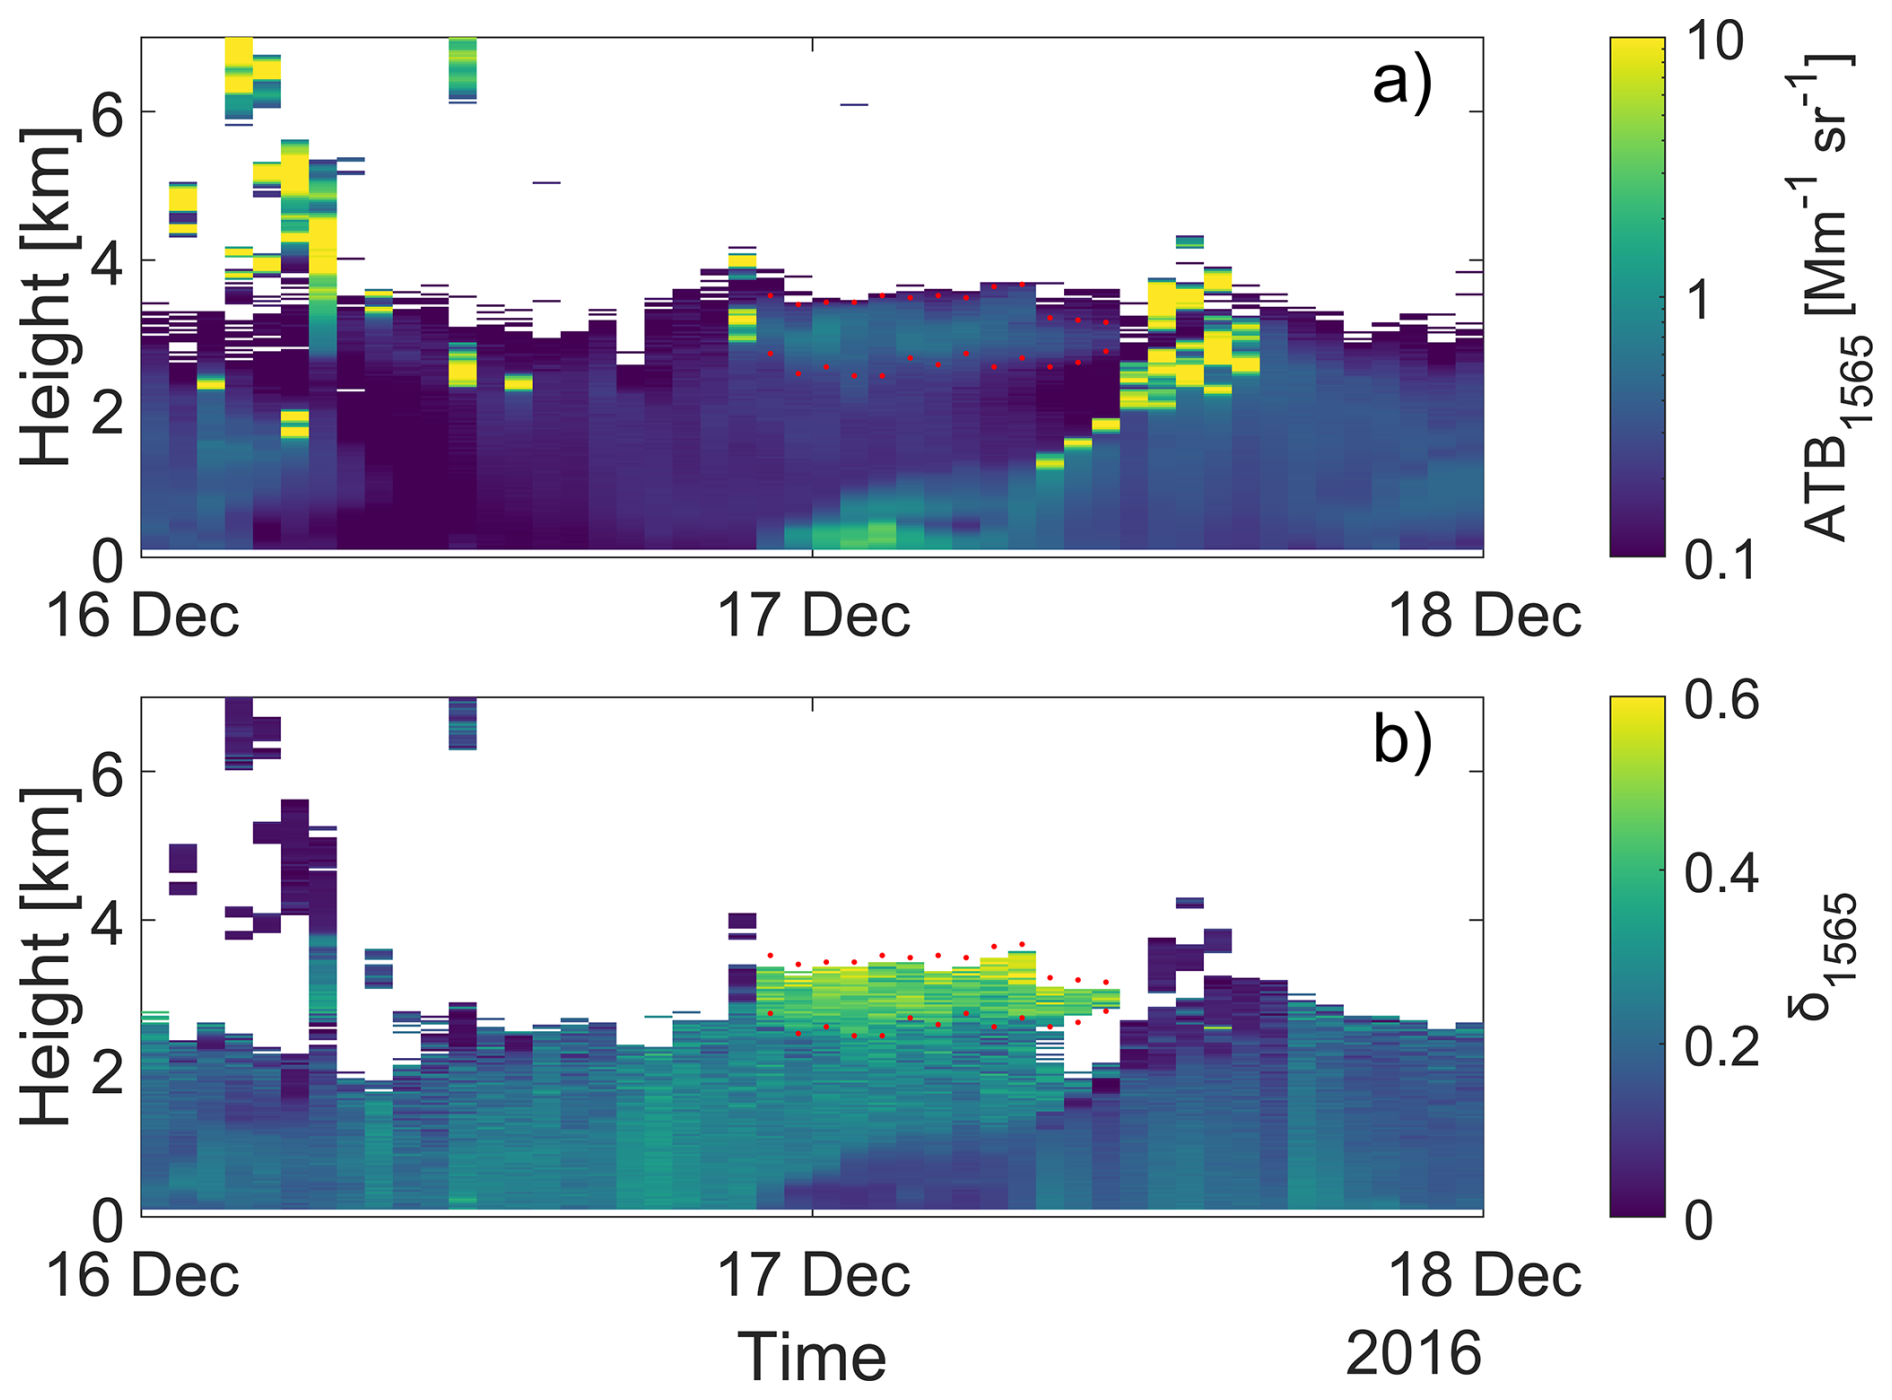
A free tropospheric aerosol layer with very high δ1565 reached the measurement site at Welgegund, South Africa ( S, E) in the night from 16 to 17 December 2016. Figure 10 shows the temporal evolution of the layer's ATB1565 (upper panel) and δ1565 (lower panel) over the measurement site as monitored by the HALO Doppler lidar. The base and top heights of the layer are marked with circles. The increase of backscatter coefficient between 2.5 and 3.5 km clearly demonstrates the existence of a pronounced aerosol layer and the large values of δ1565 are a clear indication of non-spherical particles; a typical feature of volcanic ash (Pisani et al., 2012). Scattered clouds before and after the plume did not prevent the observation of the plume. The plume's altitude remained rather constant during the 12 h observation period as well as the layer's geometrical thickness of 850 m.
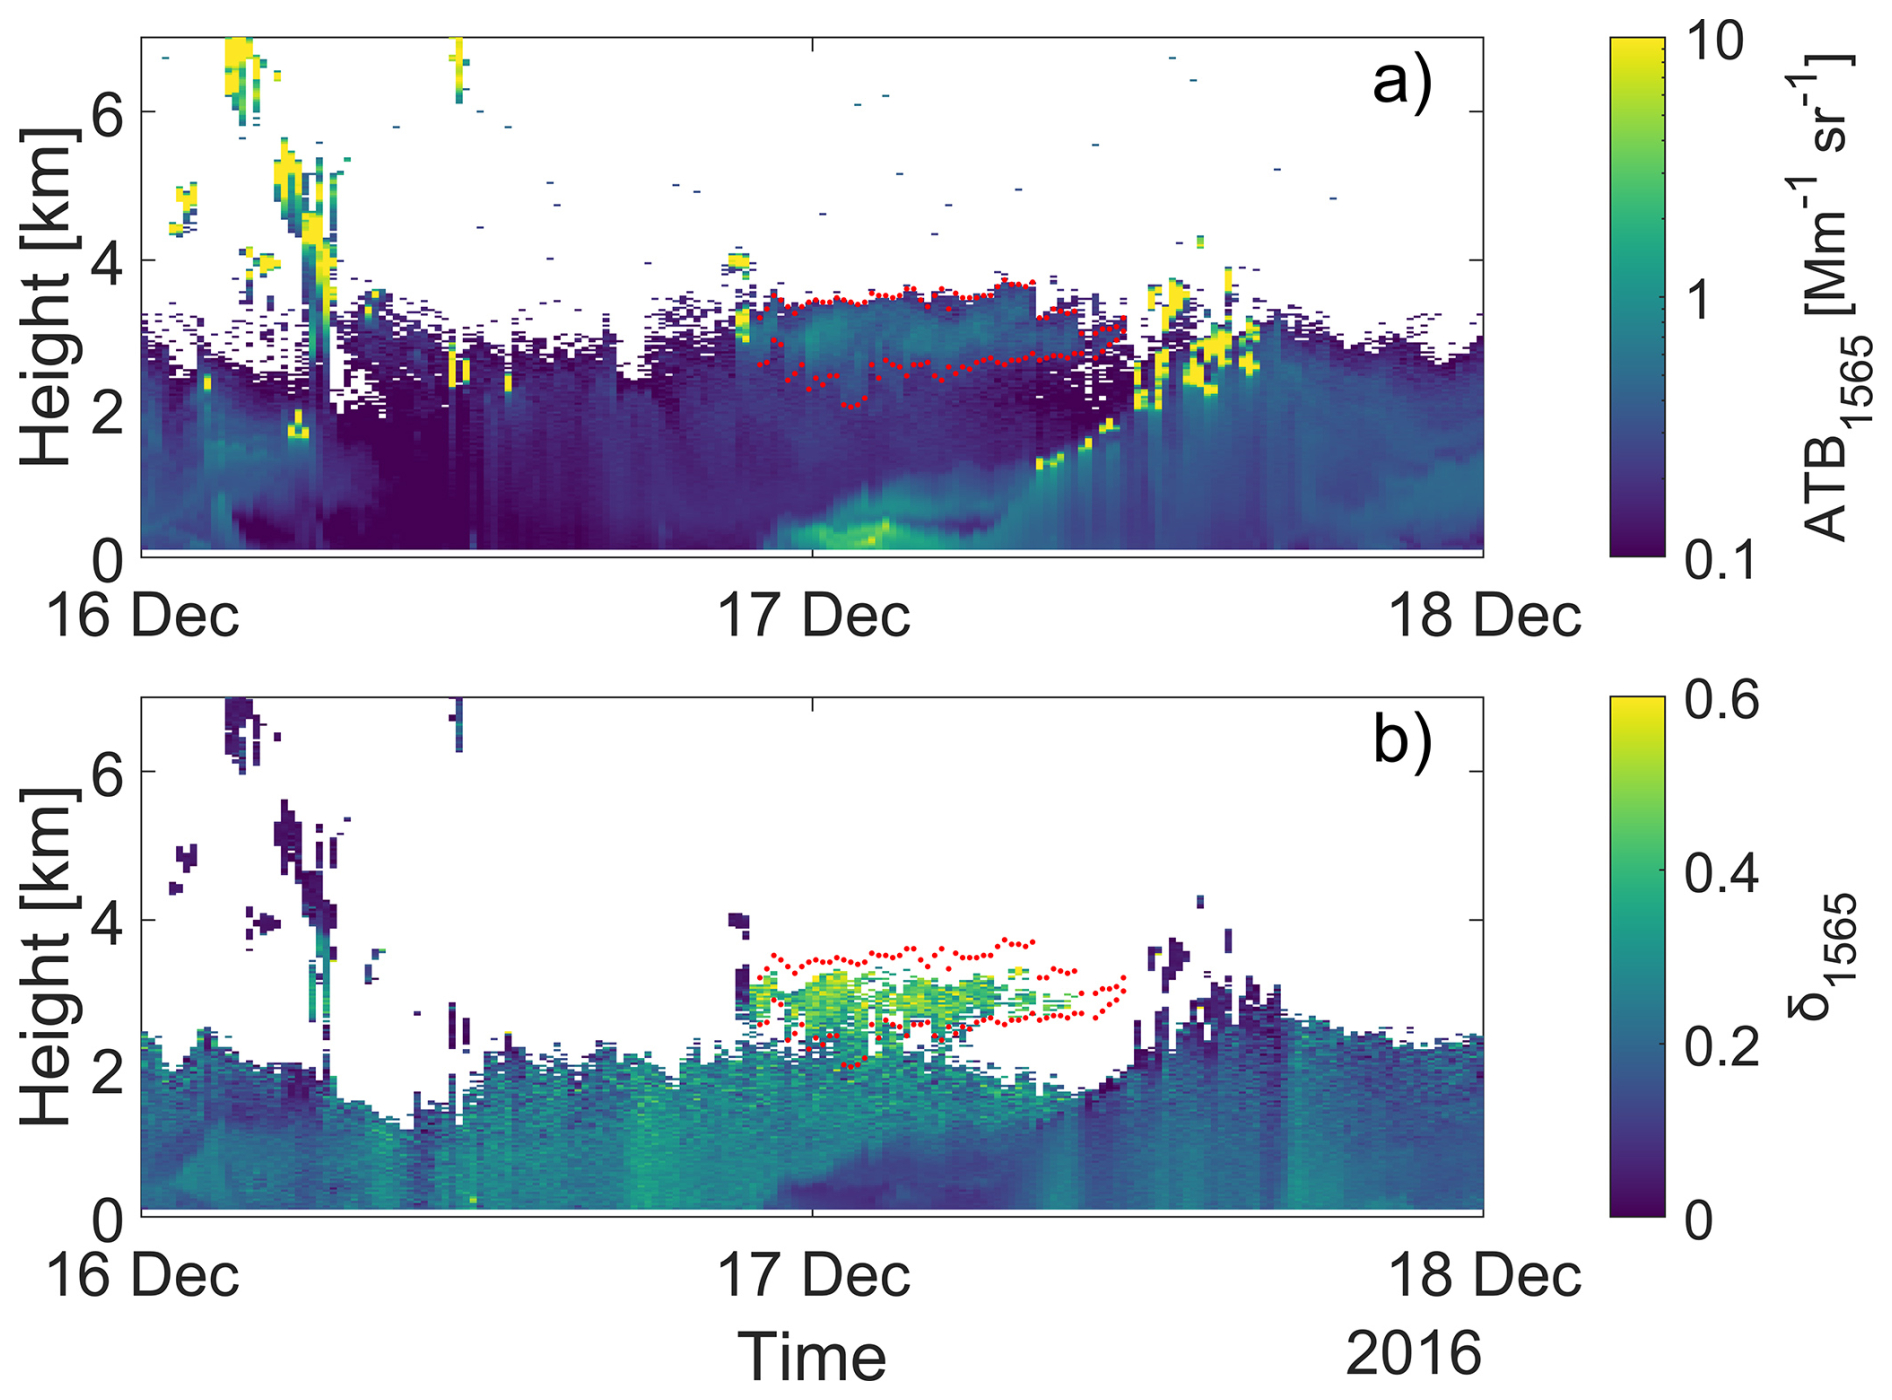
Figure 10Time-height plot of (a) ATB1565 and (b) δ1565 measured between 16 and 17 December 2016 in Welgegund, South Africa, with the HALO Doppler lidar. The red dots indicate the boundaries of the smoke layer. The temporal resolution corresponds to 15 min. The ATB1565 is shown on a logarithmic color scale. A co-polar SNR threshold of 0.0005 was applied to the observations.
FLEXPART airmass history for this layer (Fig. 11) shows substantial contribution from South America and the direction of Copahue Volcano, which is located on the border between Chile and Argentina in the Andes Mountains (37°45′ S, 71°10.2′ W, 2997 m a.s.l.). Historically, the volcano has exhibited intermittent mild-to-moderate explosive activity, with a notable increase in eruptions since the beginning of 2012. During early December 2016, diffuse gas, water vapor, and ash plumes from Copahue rose to altitudes of 3–3.3 km a.s.l. and were transported eastbound (Paez et al., 2021), which overlaps with the air mass history analysis in Fig. 11. Therefore, we attribute the pronounced high δ1565 layer as ash originating from the Copahue Volcano.
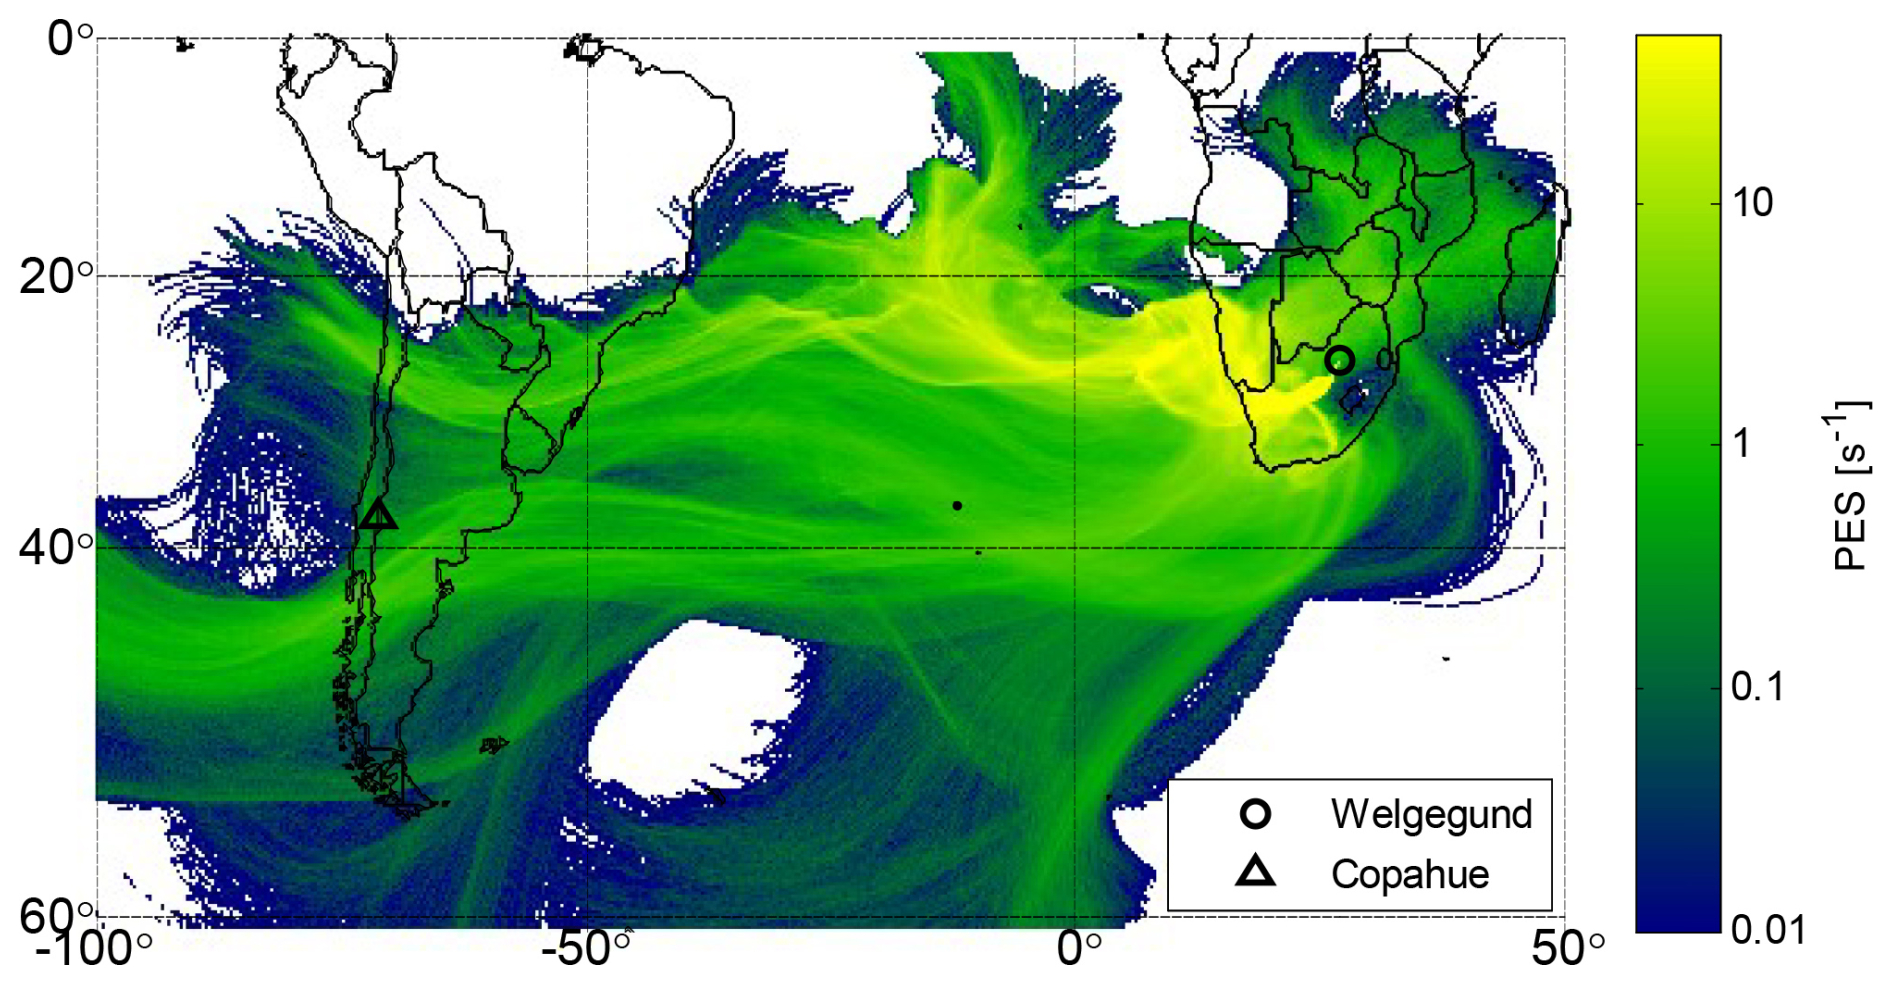
Figure 11FLEXPART PES summed up over all heights accounting for 14 d back in time for the Welgegund case in South Africa on 17 December 2016.
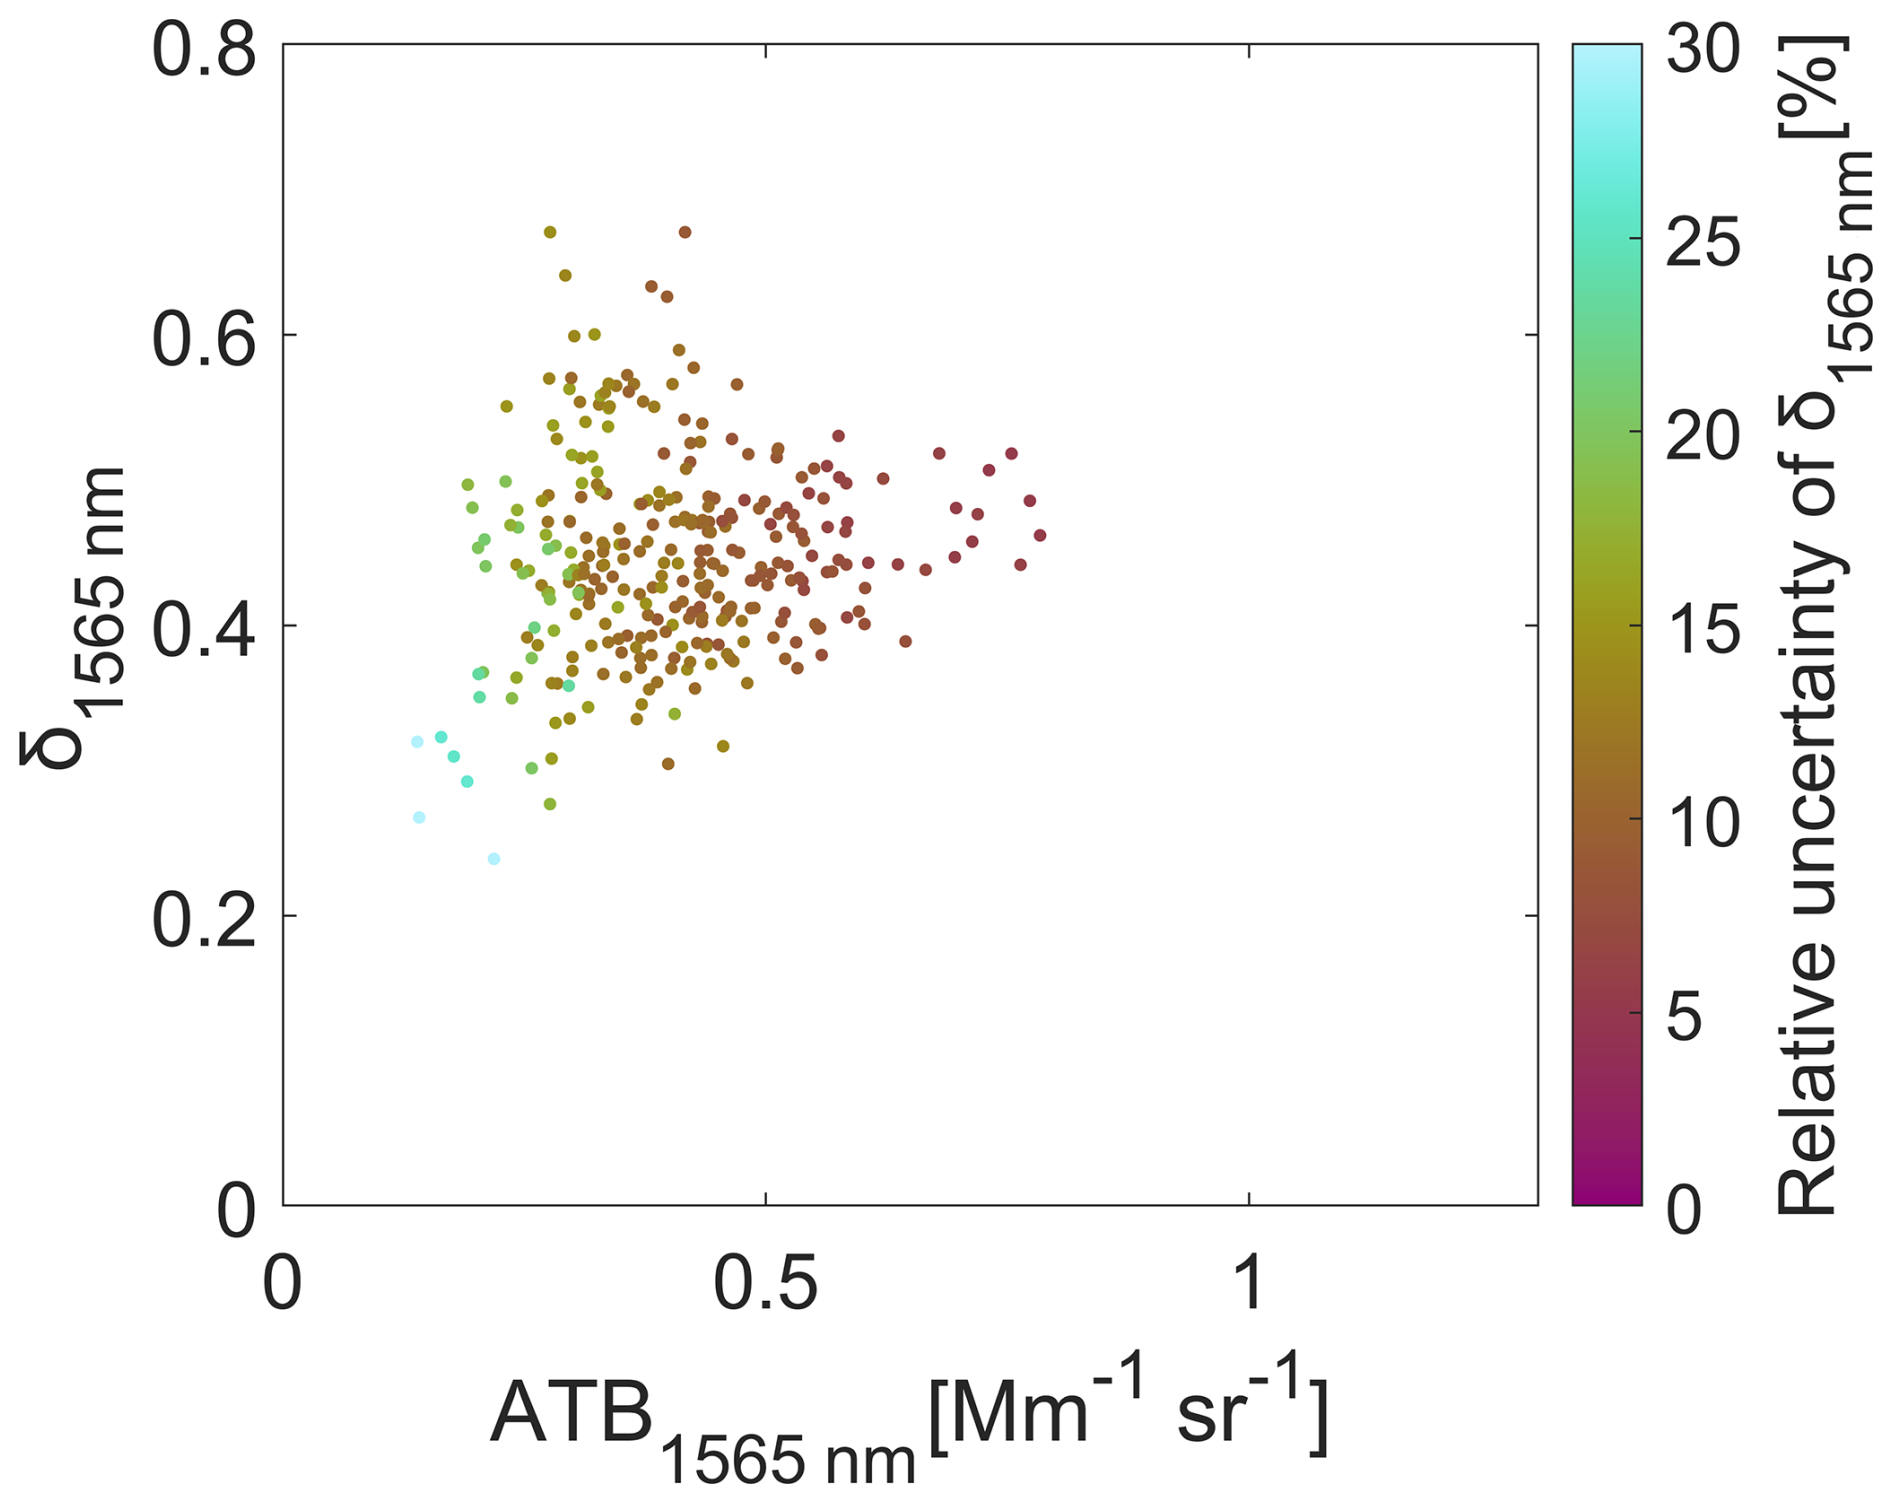
Figure 12Scatterplot of ATB1565 nm versus δ1565 nm at the volcanic plume layer extracted from hourly lidar data. The color indicates the relative uncertainty of δ1565 nm.
Figure 12 presents the hourly extracted lidar information of ATB1565 and δ1565 at the volcanic plume layer only (Fig. A1). The color indicates the relative uncertainty of δ1565. In this highly depolarizing aerosol layer, we can define the δ1565 with a better than 10 % accuracy estimating a depolarization ratio for the volcanic ash aerosols to be 0.46 ± 0.05 at 1565 nm. A δ1565 of 0.45 ± 0.01 is estimated using the weighted mean method described in the previous case study. No significant changes were found between the 15 min and 1 h temporal resolutions apart from the higher uncertainty accompanying the finer temporal resolution observations.
3.4 Depolarization ratio at 1565 nm
Here we summarize the depolarization ratios of the fresh smoke, aged smoke and volcanic ash aerosol particles from this study. We also gather δ1565 information for all studied aerosol particles up-to-date (Table 2). This collection of case studies at 1565 nm for various aerosol types demonstrates that lidar-based classification algorithms could benefit from the extended information at δ1565, particularly for identifying large non-spherical particles. Besides non-sphericity, particle size should also be emphasized, because longer wavelengths are more sensitive to larger particles. The aerosol types with enhanced depolarization ratios at 1565 nm listed in Table 2, including dust, pollen, and volcanic ash, are generally large particles. In contrast, stratospheric smoke observations have shown that small particles may retain low depolarization ratios at longer wavelengths even if they are non-spherical (Haarig et al., 2018). Therefore, δ1565 provides complementary information related to both particle shape and size, highlighting its potential for aerosol classification and air-quality monitoring.
Vakkari et al. (2021)Vakkari et al. (2021)Filioglou et al. (2023)Filioglou et al. (2023)Le et al. (2024)Vakkari et al. (2021)Le et al. (2024)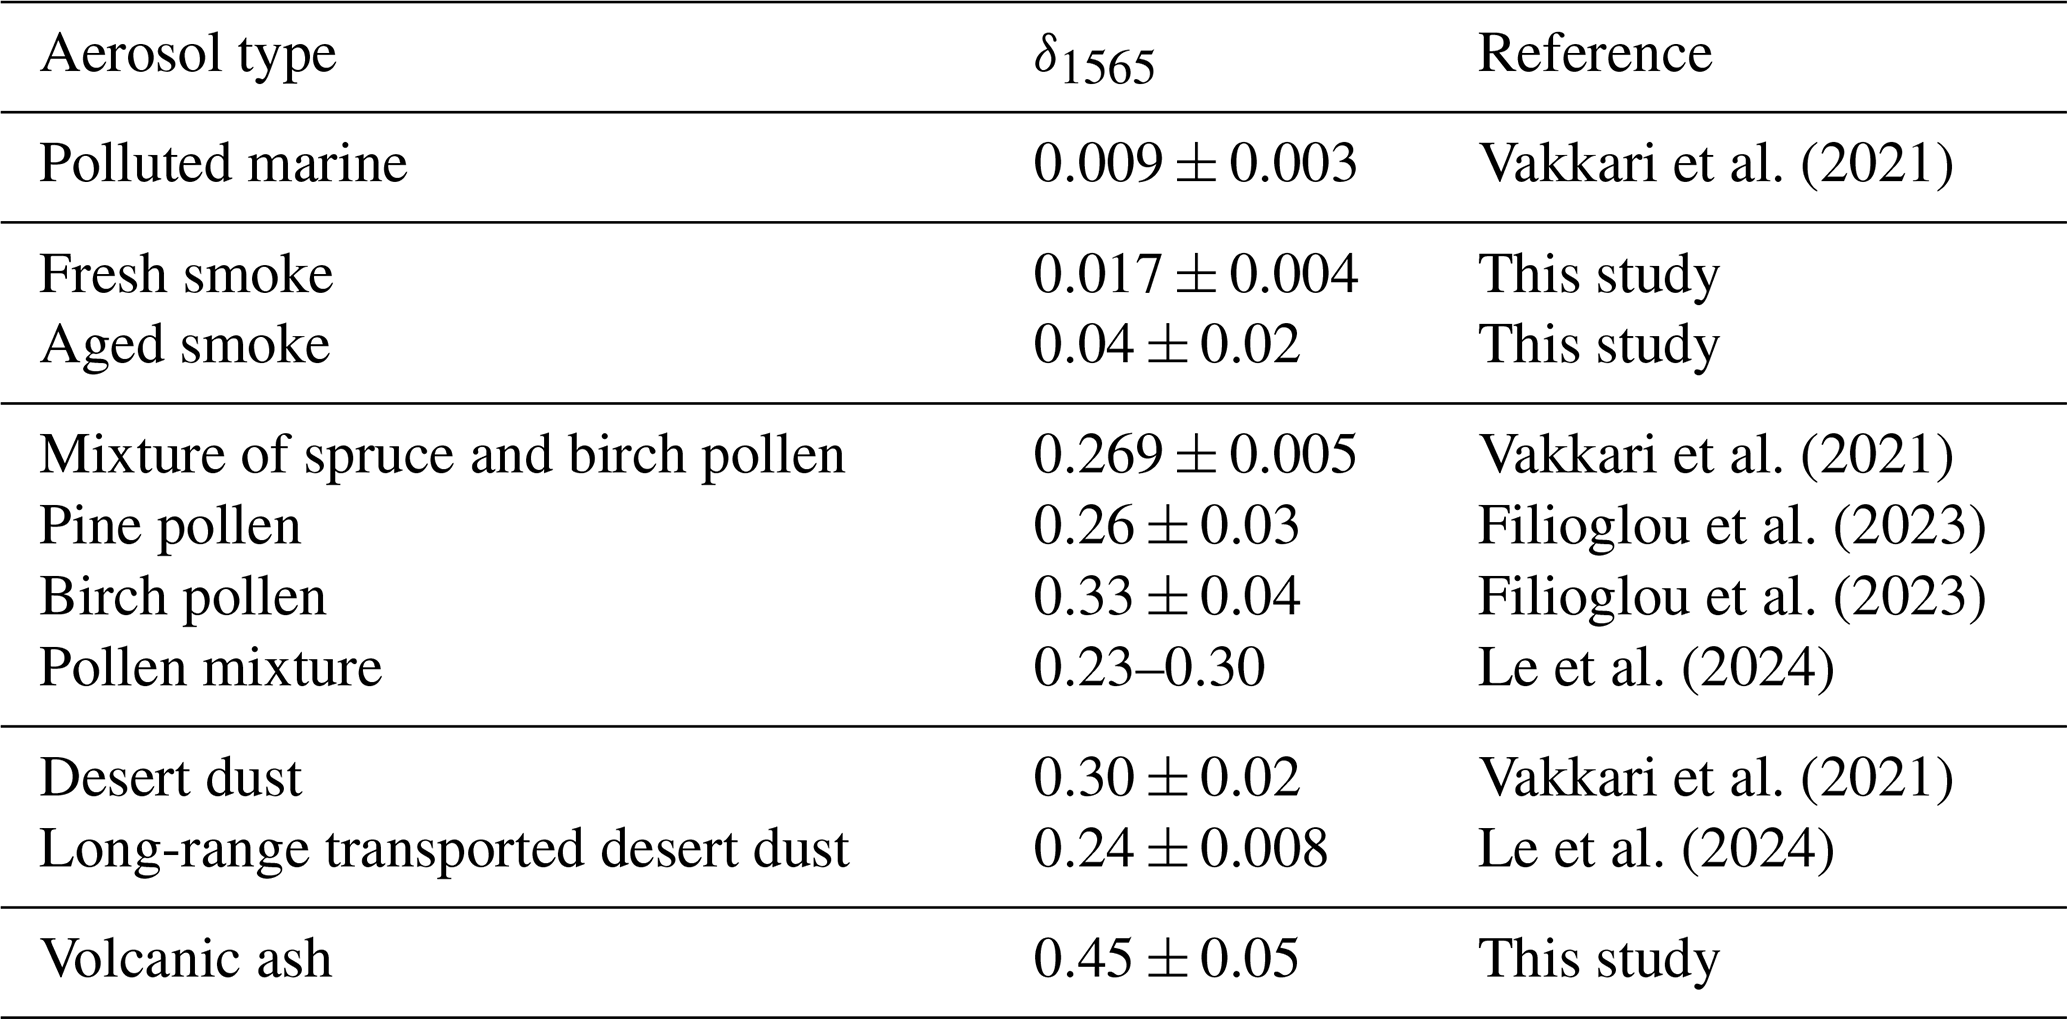
For the three aforementioned aerosol types δ exhibits a wavelength dependence. Specifically, for fresh smoke, depolarization ratios at shorter wavelengths (355 and 532 nm) are typically low due to the almost spherical nature of freshly emitted sub-micron particles; previous multi-wavelength lidar studies report tropospheric smoke depolarization ratios < 0.03 at 355 and 532 nm and 0.01 at 1064 nm; a consistent behavior at 1565 nm was found in this study too, reflecting limited non-sphericity. In aged smoke, particle reshaping and mixing together with the smoke's physical and chemical properties and any co-lifted dust particles can enhance non-sphericity at shorter wavelengths. At longer wavelengths, however, depolarization tends to remain low because small soot aggregates scatter less efficiently, producing a characteristic spectral decline in depolarization with increasing wavelength. In contrast, volcanic ash consists of larger, non-spherical particles that produce high depolarization ratios at both UV and visible wavelengths. Previous studies at 355 and 532 nm report δ of about 0.35–0.38 for ash plumes with little spectral variation among these shorter wavelengths (Groß et al., 2012). Our findings suggest that this non-sphericity persists at 1565 nm and is further enhanced, presenting an increase of δ with increasing wavelength.
For the first time, we report particle linear depolarization ratios for extremely fresh and aged forest fire smoke as well as volcanic ash at 1565 nm. We found that (a) non-spherical large particles such as volcanic ash induce elevated particle linear depolarization ratios at 1565 nm, consistent to the previous observations at shorter wavelengths and (b) smoke aerosols, dominated by almost spherical particles, yield lower depolarization ratio, but aged smoke show some variability probably due to differences in the BC content, dust uplifting and/or processing during the plume transport. We further estimated the mass concentration of extremely fresh smoke using a combination of Mie-derived optical properties and lidar observations with reasonable agreement to in situ observations. The Mie-estimated lidar ratios increased with increasing wavelength except at 355 nm. Whether this behavior is characteristic of extremely fresh smoke particles in boreal forest environments and for this type of surface fire remains uncertain; however, previous observational and light-scattering simulations have demonstrated the high sensitivity of lidar intensive properties such as the lidar ratio to smoke particles.
For the extremely fresh smoke event within the planetary boundary layer, we found very low particle linear depolarization ratio at 1565 nm of 0.017 ± 0.004, which is in good agreement with previous observations at 1064 nm showing minimal wavelength dependence. For long-range transported smoke aerosols in the free troposphere, we observed marginally higher depolarization ratio of 0.04 ± 0.02. The volcanic ash depolarization ratio induced high values of 0.45 ± 0.01 and combined with earlier lidar studies at shorter wavelengths it shows an increase with increasing wavelength. Taken together, our findings show that Halo Doppler lidars provide a valuable additional wavelength information at 1565 nm for investigating the spectral dependence of particle linear depolarization ratio, even up to the lowest 4–5 km of the atmosphere. Therefore, they build towards a more accurate aerosol typing and support the development of new aerosol climatologies, thereby enhancing network-wide utilization of aerosol measurements at this wavelength.
Aerosol observations at 1565 nm benefit from the near absence of molecular scattering and absorption, which greatly simplifies signal pre-processing. At this wavelength, Rayleigh scattering is negligible, so the lidar return is dominated by aerosol particles rather than atmospheric molecules. This provides a clear advantage over the shorter wavelengths and for real-time application of the observations. However, the trade-off is that the aerosol backscatter efficiency is much lower compared to visible wavelengths, making it harder to detect fine particles and aerosol layers with low concentrations. Furthermore, mixtures of different aerosol types could also become challenging due to the weaker scattering contrast.
Future work should further investigate aerosol optical and microphysical properties at 1565 nm, as current understanding at this wavelength emerges from limited case studies. Expanded observational studies with various aerosol mixtures would help clarify how different aerosol types behave in the near-infrared and how these signatures vary with atmospheric conditions. Such efforts are essential for fully assessing the potential of 1565 nm measurements to complement the traditional lidar wavelengths and improve aerosol classification efforts.
HALO Doppler lidar observations are available through Cloudnet portal (https://cloudnet.fmi.fi/file/7fc69d32-56df-48d8-ba9d-d302051bc414, Komppula and O'Connor, 2025). Flexpart version 11.0 is available at https://gitlab.phaidra.org/flexpart/ (last access: 14 August 2026). Fire radiative power (FRP) data are publicly available through FIRMS interface at https://firms.modaps.eosdis.nasa.gov/map/ (last access: 14 August 2026). In situ aerosol and pollen observations are available upon request.
MF conceptualized the original paper, performed the main analysis considering all data sources and wrote the manuscript. VV conceptualized the original paper and provided the Halo Doppler lidar observations, FLEXPART airmass trajectories and MODIS fire radiative power data. KL combined the in situ observations from SMPS and OPC instruments, performed and provided the Mie calculations. EA analyzed and provided the MAAP observations. EA and VL analyzed and provided the OPC observations. DB prepared the drone load and VL and KH performed the flights onsite. SK provided the SMPS observations. LH provided the AMS observations. AS and SPä provided the pollen data. All authors were involved in the editing and discussion of the manuscript.
At least one of the (co-)authors is a member of the editorial board of Atmospheric Chemistry and Physics. The peer-review process was guided by an independent editor, and the authors also have no other competing interests to declare.
Publisher's note: Copernicus Publications remains neutral with regard to jurisdictional claims made in the text, published maps, institutional affiliations, or any other geographical representation in this paper. The authors bear the ultimate responsibility for providing appropriate place names. Views expressed in the text are those of the authors and do not necessarily reflect the views of the publisher.
This study was supported by the Research Council of Finland (grant nos. 337552, 343359, 369600, 369601). The prescribed burning is part of the the project “Climate and air quality impacts of boreal forest fires”, (2023–2027) funded by the Jane and Atos Erkko Foundation. The fire area is part of the Life2Taiga project (2022–2028) funded by the European Union's LIFE Nature and Biodiversity programme, which aims to restore forests in Finland and Sweden through conservation burning. We acknowledge the use of data from NASA's Fire Information for Resource Management System (FIRMS) part of NASA's Land, Atmosphere Near real-time Capability for Earth observations (LANCE) and NASA's Earth Science Data and Information System (ESDIS).
This research has been supported by the Research Council of Finland (grant nos. 337552, 343359, 369600, and 369601).
This paper was edited by Matthias Tesche and reviewed by three anonymous referees.
Ansmann, A., Riebesell, M., and Weitkamp, C.: Measurement of atmospheric aerosol extinction profiles with a Raman lidar, Opt. Lett., 15, 746–748, https://doi.org/10.1364/OL.15.000746, 1990. a
Ansmann, A., Baars, H., Tesche, M., Müller, D., Althausen, D., Engelmann, R., Pauliquevis, T., and Artaxo, P.: Dust and smoke transport from Africa to South America: Lidar profiling over Cape Verde and the Amazon rainforest, Geophys. Res. Lett., 36, https://doi.org/10.1029/2009GL037923, 2009. a
Ansmann, A., Tesche, M., Groß, S., Freudenthaler, V., Seifert, P., Hiebsch, A., Schmidt, J., Wandinger, U., Mattis, I., Müller, D., and Wiegner, M.: The 16 April 2010 major volcanic ash plume over central Europe: EARLINET lidar and AERONET photometer observations at Leipzig and Munich, Germany, Geophys. Res. Lett., 37, https://doi.org/10.1029/2010GL043809, 2010. a, b
Ansmann, A., Tesche, M., Seifert, P., Groß, S., Freudenthaler, V., Apituley, A., Wilson, K. M., Serikov, I., Linné, H., Heinold, B., Hiebsch, A., Schnell, F., Schmidt, J., Mattis, I., Wandinger, U., and Wiegner, M.: Ash and fine-mode particle mass profiles from EARLINET-AERONET observations over central Europe after the eruptions of the Eyjafjallajökull volcano in 2010, J. Geophys. Res.-Atmos., 116, https://doi.org/10.1029/2010JD015567, 2011. a
Ansmann, A., Hofer, J., Mamouri, R.-E., Haarig, M., Baars, H., and Wandinger, U.: Aerosol optical-to-microphysical conversion factors for lidars and ceilometers from extended AERONET data analyses: POLIPHON update, Atmos. Meas. Tech., 19, 3801–3830, https://doi.org/10.5194/amt-19-3801-2026, 2026. a, b
Baars, H., Radenz, M., Floutsi, A. A., Engelmann, R., Althausen, D., Heese, B., Ansmann, A., Flament, T., Dabas, A., Trapon, D., Reitebuch, O., Bley, S., and Wandinger, U.: Californian Wildfire Smoke Over Europe: A First Example of the Aerosol Observing Capabilities of Aeolus Compared to Ground-Based Lidar, Geophys. Res. Lett., 48, e2020GL092194, https://doi.org/10.1029/2020GL092194, 2021. a
Bakels, L., Tatsii, D., Tipka, A., Thompson, R., Dütsch, M., Blaschek, M., Seibert, P., Baier, K., Bucci, S., Cassiani, M., Eckhardt, S., Groot Zwaaftink, C., Henne, S., Kaufmann, P., Lechner, V., Maurer, C., Mulder, M. D., Pisso, I., Plach, A., Subramanian, R., Vojta, M., and Stohl, A.: FLEXPART version 11: improved accuracy, efficiency, and flexibility, Geosci. Model Dev., 17, 7595–7627, https://doi.org/10.5194/gmd-17-7595-2024, 2024. a
Bedoya-Velásquez, A. E., Hoyos-Restrepo, M., Barreto, A., García, R. D., Romero-Campos, P. M., García, O., Ramos, R., Roininen, R., Toledano, C., Sicard, M., and Ceolato, R.: Estimation of the Mass Concentration of Volcanic Ash Using Ceilometers: Study of Fresh and Transported Plumes from La Palma Volcano, Remote Sensing, 14, https://doi.org/10.3390/rs14225680, 2022. a
Benedetti, A., Morcrette, J.-J., Boucher, O., Dethof, A., Engelen, R. J., Fisher, M., Flentje, H., Huneeus, N., Jones, L., Kaiser, J. W., Kinne, S., Mangold, A., Razinger, M., Simmons, A. J., and Suttie, M.: Aerosol analysis and forecast in the European Centre for Medium-Range Weather Forecasts Integrated Forecast System: 2. Data assimilation, J. Geophys. Res., 114, D13205, https://doi.org/10.1029/2008JD011115, 2009. a
Bohlmann, S., Shang, X., Vakkari, V., Giannakaki, E., Leskinen, A., Lehtinen, K. E. J., Pätsi, S., and Komppula, M.: Lidar depolarization ratio of atmospheric pollen at multiple wavelengths, Atmos. Chem. Phys., 21, 7083–7097, https://doi.org/10.5194/acp-21-7083-2021, 2021. a
Brus, D., Le, V., Kuula, J., and Doulgeris, K.: Data collected by a drone backpack for air quality and atmospheric state measurements during Pallas Cloud Experiment 2022 (PaCE2022), Earth Syst. Sci. Data, 17, 5209–5219, https://doi.org/10.5194/essd-17-5209-2025, 2025. a
Bucholtz, A.: Rayleigh-scattering calculations for the terrestrial atmosphere, Appl. Optics, 34, 2765–2773, https://doi.org/10.1364/AO.34.002765, 1995. a
Burton, S. P., Hair, J. W., Kahnert, M., Ferrare, R. A., Hostetler, C. A., Cook, A. L., Harper, D. B., Berkoff, T. A., Seaman, S. T., Collins, J. E., Fenn, M. A., and Rogers, R. R.: Observations of the spectral dependence of linear particle depolarization ratio of aerosols using NASA Langley airborne High Spectral Resolution Lidar, Atmos. Chem. Phys., 15, 13453–13473, https://doi.org/10.5194/acp-15-13453-2015, 2015. a, b
Cahill, C. F., Cahill, T. A., and Perry, K. D.: The size- and time-resolved composition of aerosols from a sub-Arctic boreal forest prescribed burn, Atmos. Environ., 42, 7553–7559, https://doi.org/10.1016/j.atmosenv.2008.04.034, 2008. a
Cairo, F., Di Liberto, L., Dionisi, D., and Snels, M.: Understanding Aerosol-Cloud Interactions through Lidar Techniques: A Review, Remote Sensing, 16, https://doi.org/10.3390/rs16152788, 2024. a
Crilley, L. R., Shaw, M., Pound, R., Kramer, L. J., Price, R., Young, S., Lewis, A. C., and Pope, F. D.: Evaluation of a low-cost optical particle counter (Alphasense OPC-N2) for ambient air monitoring, Atmos. Meas. Tech., 11, 709–720, https://doi.org/10.5194/amt-11-709-2018, 2018. a
DeCarlo, P. F., Kimmel, J. R., Trimborn, A., Northway, M. J., Jayne, J. T., Aiken, A. C., Gonin, M., Fuhrer, K., Horvath, T., Docherty, K. S., Worsnop, D. R., and Jimenez, J. L.: Field-deployable, high-resolution, time-of-flight aerosol mass spectrometer, Anal. Chem., 78, 8281–8289, https://doi.org/10.1021/ac061249n, 2006. a
De Rosa, B., Amato, F., Amodeo, A., D’Amico, G., Dema, C., Falconieri, A., Giunta, A., Gumà-Claramunt, P., Kampouri, A., Solomos, S., Mytilinaios, M., Papagiannopoulos, N., Summa, D., Veselovskii, I., and Mona, L.: Characterization of Extremely Fresh Biomass Burning Aerosol by Means of Lidar Observations, Remote Sensing, 14, https://doi.org/10.3390/rs14194984, 2022. a, b
De Rosa, B., Amodeo, A., D’Amico, G., Papagiannopoulos, N., Rosoldi, M., Veselovskii, I., Cardellicchio, F., Falconieri, A., Gumà-Claramunt, P., Laurita, T., Mytilinaios, M., Papanikolaou, C.-A., Amodio, D., Colangelo, C., Di Girolamo, P., Gandolfi, I., Giunta, A., Lapenna, E., Marra, F., Petracca Altieri, R. M., Ripepi, E., Summa, D., Volini, M., Arienzo, A., and Mona, L.: Characterization of Fresh and Aged Smoke Particles Simultaneously Observed with an ACTRIS Multi-Wavelength Raman Lidar in Potenza, Italy, Remote Sensing, 17, https://doi.org/10.3390/rs17152538, 2025. a, b
Donovan, D. P., Klein Baltink, H., Henzing, J. S., de Roode, S. R., and Siebesma, A. P.: A depolarisation lidar-based method for the determination of liquid-cloud microphysical properties, Atmos. Meas. Tech., 8, 237–266, https://doi.org/10.5194/amt-8-237-2015, 2015. a
EU: CORINE Land Cover 2018 (raster 100 m), Europe, 6-yearly version 2020 20u1, https://sdi.eea.europa.eu/catalogue/copernicus/api/records/960998c1-1870-4e82-8051-6485205ebbac?language=all (last access: 14 November 2025), 2025. a
Filioglou, M., Giannakaki, E., Backman, J., Kesti, J., Hirsikko, A., Engelmann, R., O'Connor, E., Leskinen, J. T. T., Shang, X., Korhonen, H., Lihavainen, H., Romakkaniemi, S., and Komppula, M.: Optical and geometrical aerosol particle properties over the United Arab Emirates, Atmos. Chem. Phys., 20, 8909–8922, https://doi.org/10.5194/acp-20-8909-2020, 2020. a
Filioglou, M., Leskinen, A., Vakkari, V., O'Connor, E., Tuononen, M., Tuominen, P., Laukkanen, S., Toiviainen, L., Saarto, A., Shang, X., Tiitta, P., and Komppula, M.: Spectral dependence of birch and pine pollen optical properties using a synergy of lidar instruments, Atmos. Chem. Phys., 23, 9009–9021, https://doi.org/10.5194/acp-23-9009-2023, 2023. a, b, c, d, e
Floutsi, A. A., Baars, H., and Wandinger, U.: HETEAC-Flex: an optimal estimation method for aerosol typing based on lidar-derived intensive optical properties, Atmos. Meas. Tech., 17, 693–714, https://doi.org/10.5194/amt-17-693-2024, 2024. a
Freudenthaler, V., Esselborn, M., Wiegner, M., Heese, B., Tesche, M., Ansmann, A., Müller, D., Althausen, D., Wirth, M., Fix, A., Ehret, G., Knippertz, P., Toledano, C., Gasteiger, J., Garhammer, M., and Seefeldner, M.: Depolarization ratio profiling at several wavelengths in pure Saharan dust during SAMUM 2006, Tellus B, 61, 165–179, https://doi.org/10.1111/j.1600-0889.2008.00396.x, 2009. a, b, c
Galán, C., Smith, M., Thibaudon, M., Frenguelli, G., Oteros, J., Gehrig, R., Berger, U., Clot, B., Brandao, R., and Group, E. Q. W.: Pollen monitoring: minimum requirements and reproducibility of analysis, Aerobiologia, 30, 385–395, https://doi.org/10.1007/s10453-014-9335-5, 2014. a
Giglio, L., Schroeder, W., and Justice, C. O.: The collection 6 MODIS active fire detection algorithm and fire products, Remote Sens. Environ., 178, 31–41, https://doi.org/10.1016/j.rse.2016.02.054, 2016. a
González, Y., Sánchez-Barrero, M. F., Popovici, I., Barreto, Á., Victori, S., Welton, E. J., García, R. D., Sicilia, P. G., Almansa, F. A., Torres, C., and Goloub, P.: Compact dual-wavelength depolarization lidar for aerosol characterization over the subtropical North Atlantic, Atmos. Meas. Tech., 18, 1885–1908, https://doi.org/10.5194/amt-18-1885-2025, 2025. a
Groß, S., Tesche, M., Freudenthaler, V., Toledano, C., Wiegner, M., Ansmann, A., Althausen, D., and Seefeldner, M.: Characterization of Saharan dust, marine aerosols and mixtures of biomass-burning aerosols and dust by means of multi-wavelength depolarization and Raman lidar measurements during SAMUM 2, Tellus B, 63, 706–724, https://doi.org/10.1111/j.1600-0889.2011.00556.x, 2011. a
Groß, S., Freudenthaler, V., Wiegner, M., Gasteiger, J., Geiß, A., and Schnell, F.: Dual-wavelength linear depolarization ratio of volcanic aerosols: Lidar measurements of the Eyjafjallajökull plume over Maisach, Germany, Atmos. Environ., 48, 85–96, https://doi.org/10.1016/j.atmosenv.2011.06.017, 2012. a
Groß, S., Esselborn, M., Abicht, F., Wirth, M., Fix, A., and Minikin, A.: Airborne high spectral resolution lidar observation of pollution aerosol during EUCAARI-LONGREX, Atmos. Chem. Phys., 13, 2435–2444, https://doi.org/10.5194/acp-13-2435-2013, 2013. a
Haarig, M., Ansmann, A., Gasteiger, J., Kandler, K., Althausen, D., Baars, H., Radenz, M., and Farrell, D. A.: Dry versus wet marine particle optical properties: RH dependence of depolarization ratio, backscatter, and extinction from multiwavelength lidar measurements during SALTRACE, Atmos. Chem. Phys., 17, 14199–14217, https://doi.org/10.5194/acp-17-14199-2017, 2017. a
Haarig, M., Ansmann, A., Baars, H., Jimenez, C., Veselovskii, I., Engelmann, R., and Althausen, D.: Depolarization and lidar ratios at 355, 532, and 1064 nm and microphysical properties of aged tropospheric and stratospheric Canadian wildfire smoke, Atmos. Chem. Phys., 18, 11847–11861, https://doi.org/10.5194/acp-18-11847-2018, 2018. a, b, c, d, e, f, g
Haarig, M., Ansmann, A., Engelmann, R., Baars, H., Toledano, C., Torres, B., Althausen, D., Radenz, M., and Wandinger, U.: First triple-wavelength lidar observations of depolarization and extinction-to-backscatter ratios of Saharan dust, Atmos. Chem. Phys., 22, 355–369, https://doi.org/10.5194/acp-22-355-2022, 2022. a
Haarig, M., Engelmann, R., Baars, H., Gast, B., Althausen, D., and Ansmann, A.: Discussion of the spectral slope of the lidar ratio between 355 and 1064 nm from multiwavelength Raman lidar observations, Atmos. Chem. Phys., 25, 7741–7763, https://doi.org/10.5194/acp-25-7741-2025, 2025. a
Hagan, D. H. and Kroll, J. H.: Assessing the accuracy of low-cost optical particle sensors using a physics-based approach, Atmos. Meas. Tech., 13, 6343–6355, https://doi.org/10.5194/amt-13-6343-2020, 2020. a
Hersbach, H., Bell, B., Berrisford, P., Biavati, G., Horányi, A., Muñoz Sabater, J., Nicolas, J., Peubey, C., Radu, R., Rozum, I., Schepers, D., Simmons, A., Soci, C., Dee, D., and Thépaut, J.-N.: ERA5 hourly data on single levels from 1940 to present, Copernicus Climate Change Service (C3S) Climate Data Store (CDS) [data set], https://doi.org/10.24381/cds.adbb2d47, 2023. a
Hirst, J. M.: An automatic volumetric spore trap, Ann. Appl. Biol.y, 39, 257–265, https://doi.org/10.1111/j.1744-7348.1952.tb00904.x, 1952. a
Hu, Q., Goloub, P., Veselovskii, I., Bravo-Aranda, J.-A., Popovici, I. E., Podvin, T., Haeffelin, M., Lopatin, A., Dubovik, O., Pietras, C., Huang, X., Torres, B., and Chen, C.: Long-range-transported Canadian smoke plumes in the lower stratosphere over northern France, Atmos. Chem. Phys., 19, 1173–1193, https://doi.org/10.5194/acp-19-1173-2019, 2019. a
IPCC: Climate Change 2021: The Physical Science Basis. Contribution of Working Group I to the Sixth Assessment Report of the Intergovernmental Panel on Climate Change, vol. In Press, Cambridge University Press, Cambridge, United Kingdom and New York, NY, USA, https://doi.org/10.1017/9781009157896, 2021. a
Janicka, L., Davuliene, L., Bycenkiene, S., and Stachlewska, I. S.: Long term observations of biomass burning aerosol over Warsaw by means of multiwavelength lidar, Opt. Express, 31, 33150–33174, https://doi.org/10.1364/OE.496794, 2023. a
Julaha, K., Ždímal, V., Mbengue, S., Brus, D., and Zíková, N.: Drone-based vertical profiling of particulate matter size distribution and carbonaceous aerosols: urban vs. rural environment, Atmos. Chem. Phys., 25, 17933–17951, https://doi.org/10.5194/acp-25-17933-2025, 2025. a
Kahn, R. A., Andrews, E., Brock, C. A., Chin, M., Feingold, G., Gettelman, A., Levy, R. C., Murphy, D. M., Nenes, A., Pierce, J. R., Popp, T., Redemann, J., Sayer, A. M., da Silva, A. M., Sogacheva, L., and Stier, P.: Reducing Aerosol Forcing Uncertainty by Combining Models With Satellite and Within-The-Atmosphere Observations: A Three-Way Street, Rev. Geophys., 61, e2022RG000796, https://doi.org/10.1029/2022RG000796, 2023. a
Kahnert, M. and Kanngießer, F.: Modelling optical properties of atmospheric black carbon aerosols, J. Quant. Spectrosc. Ra., 244, 106849, https://doi.org/10.1016/j.jqsrt.2020.106849, 2020. a
Kalembkiewicz, J., Galas, D., and Sitarz-Palczak, E.: The Physicochemical Properties and Composition of Biomass Ash and Evaluating Directions of its Applications, Pol. J. Environ. Stud., 27, 2593–2603, https://doi.org/10.15244/pjoes/80870, 2018. a
Kleinman, L. I., Sedlacek III, A. J., Adachi, K., Buseck, P. R., Collier, S., Dubey, M. K., Hodshire, A. L., Lewis, E., Onasch, T. B., Pierce, J. R., Shilling, J., Springston, S. R., Wang, J., Zhang, Q., Zhou, S., and Yokelson, R. J.: Rapid evolution of aerosol particles and their optical properties downwind of wildfires in the western US, Atmos. Chem. Phys., 20, 13319–13341, https://doi.org/10.5194/acp-20-13319-2020, 2020. a
Komppula, M. and O'Connor, E.: Doppler lidar data from Kiviniemi on 6 June 2024, ACTRIS Cloud remote sensing data centre unit (CLU), ACTRIS Cloud remote sensing data centre unit (CLU) [data set], https://cloudnet.fmi.fi/file/7fc69d32-56df-48d8-ba9d-d302051bc414 (last access: 6 March 2026), 2025. a
Kong, Z., Yu, J., Gong, Z., Hua, D., and Mei, L.: Visible, near-infrared dual-polarization lidar based on polarization cameras: system design, evaluation and atmospheric measurements, Opt. Express, 30, 28514–28533, https://doi.org/10.1364/OE.463763, 2022. a
Le, V., Lobo, H., O'Connor, E. J., and Vakkari, V.: Long-term aerosol particle depolarization ratio measurements with HALO Photonics Doppler lidar, Atmos. Meas. Tech., 17, 921–941, https://doi.org/10.5194/amt-17-921-2024, 2024. a, b, c, d
Liu, L. and Mishchenko, M. I.: Spectrally dependent linear depolarization and lidar ratios for nonspherical smoke aerosols, J. Quant. Spectrosc. Ra., 248, 106953, https://doi.org/10.1016/j.jqsrt.2020.106953, 2020. a
Martinent, B., Santoni, P.-A., Coppalle, A., Quilichini, Y., and Barboni, T.: Investigation of the morphology and composition of aerosols from plant burning, J. Aerosol Sci., 187, 106589, https://doi.org/10.1016/j.jaerosci.2025.106589, 2025. a
Mie, G.: Beiträge zur Optik trüber Medien, speziell kolloidaler Metallösungen, Ann. Phys., 330, 377–445, https://doi.org/10.1002/andp.19083300302, 1908. a
Mukherjee, A., Hartikainen, A., Somero, M., Luostari, V., Ihalainen, M., Rüger, C. P., Kekäläinen, T., Nissinen, V. H., Barreira, L. M. F., Koponen, H., Kokkola, T., Li, D., Vettikkat, L., Yli-Pirilä, P., Shahzaib, M., Ruppel, M. M., Vakkari, V., Jaars, K., Siebert, S. J., Buchholz, A., Köster, K., van Zyl, P. G., Timonen, H., Kinnunen, N., Jänis, J., Virtanen, A., Virkkula, A., and Sippula, O.: Brown carbon emissions from laboratory combustion of Eurasian arctic-boreal and South African savanna biomass, Atmos. Chem. Phys., 25, 16747–16774, https://doi.org/10.5194/acp-25-16747-2025, 2025. a, b, c
Murayama, T., Müller, D., Wada, K., Shimizu, A., Sekiguchi, M., and Tsukamoto, T.: Characterization of Asian dust and Siberian smoke with multi-wavelength Raman lidar over Tokyo, Japan in spring 2003, Geophys. Res. Lett., 31, https://doi.org/10.1029/2004GL021105, 2004. a
Müller, D., Mattis, I., Wandinger, U., Ansmann, A., Althausen, D., and Stohl, A.: Raman lidar observations of aged Siberian and Canadian forest fire smoke in the free troposphere over Germany in 2003: Microphysical particle characterization, J. Geophys. Res.-Atmos., 110, https://doi.org/10.1029/2004JD005756, 2005. a, b
Nicolae, D., Nemuc, A., Müller, D., Talianu, C., Vasilescu, J., Belegante, L., and Kolgotin, A.: Characterization of fresh and aged biomass burning events using multiwavelength Raman lidar and mass spectrometry, J. Geophys. Res.-Atmos., 118, 2956–2965, https://doi.org/10.1002/jgrd.50324, 2013. a
Nicolae, D., Vasilescu, J., Talianu, C., Binietoglou, I., Nicolae, V., Andrei, S., and Antonescu, B.: A neural network aerosol-typing algorithm based on lidar data, Atmos. Chem. Phys., 18, 14511–14537, https://doi.org/10.5194/acp-18-14511-2018, 2018. a
Noh, Y. M., Müller, D., Lee, H., Lee, K., Kim, K., Shin, S., and Kim, Y. J.: Estimation of radiative forcing by the dust and non-dust content in mixed East Asian pollution plumes on the basis of depolarization ratios measured with lidar, Atmos. Environ., 61, 221–231, https://doi.org/10.1016/j.atmosenv.2012.07.034, 2012. a
Ohata, S., Mori, T., Kondo, Y., Sharma, S., Hyvärinen, A., Andrews, E., Tunved, P., Asmi, E., Backman, J., Servomaa, H., Veber, D., Eleftheriadis, K., Vratolis, S., Krejci, R., Zieger, P., Koike, M., Kanaya, Y., Yoshida, A., Moteki, N., Zhao, Y., Tobo, Y., Matsushita, J., and Oshima, N.: Estimates of mass absorption cross sections of black carbon for filter-based absorption photometers in the Arctic, Atmos. Meas. Tech., 14, 6723–6748, https://doi.org/10.5194/amt-14-6723-2021, 2021. a
Paez, P., Cogliati, M., Caselli, A., and Monasterio, A.: An analysis of volcanic SO2 and ash emissions from Copahue volcano, J. S. Am. Earth Sci., 110, 103365, https://doi.org/10.1016/j.jsames.2021.103365, 2021. a
Papagiannopoulos, N., Mona, L., Amodeo, A., D'Amico, G., Gumà Claramunt, P., Pappalardo, G., Alados-Arboledas, L., Guerrero-Rascado, J. L., Amiridis, V., Kokkalis, P., Apituley, A., Baars, H., Schwarz, A., Wandinger, U., Binietoglou, I., Nicolae, D., Bortoli, D., Comerón, A., Rodríguez-Gómez, A., Sicard, M., Papayannis, A., and Wiegner, M.: An automatic observation-based aerosol typing method for EARLINET, Atmos. Chem. Phys., 18, 15879–15901, https://doi.org/10.5194/acp-18-15879-2018, 2018. a
Papayannis, A., Soupiona, O., Gidarakou, M., Papanikolaou, C.-A., Anagnou, D., Foskinis, R., Mylonaki, M., Mandelia, K., and Solomos, S.: Optical Properties and Radiative Forcing Estimations of High-Altitude Aerosol Transport During Saharan Dust Events Based on Laser Remote Sensing Techniques (CLIMPACT Campaign 2021, Greece), Remote Sensing, 17, https://doi.org/10.3390/rs17213607, 2025. a
Pappalardo, G., Mona, L., D'Amico, G., Wandinger, U., Adam, M., Amodeo, A., Ansmann, A., Apituley, A., Alados Arboledas, L., Balis, D., Boselli, A., Bravo-Aranda, J. A., Chaikovsky, A., Comeron, A., Cuesta, J., De Tomasi, F., Freudenthaler, V., Gausa, M., Giannakaki, E., Giehl, H., Giunta, A., Grigorov, I., Groß, S., Haeffelin, M., Hiebsch, A., Iarlori, M., Lange, D., Linné, H., Madonna, F., Mattis, I., Mamouri, R.-E., McAuliffe, M. A. P., Mitev, V., Molero, F., Navas-Guzman, F., Nicolae, D., Papayannis, A., Perrone, M. R., Pietras, C., Pietruczuk, A., Pisani, G., Preißler, J., Pujadas, M., Rizi, V., Ruth, A. A., Schmidt, J., Schnell, F., Seifert, P., Serikov, I., Sicard, M., Simeonov, V., Spinelli, N., Stebel, K., Tesche, M., Trickl, T., Wang, X., Wagner, F., Wiegner, M., and Wilson, K. M.: Four-dimensional distribution of the 2010 Eyjafjallajökull volcanic cloud over Europe observed by EARLINET, Atmos. Chem. Phys., 13, 4429–4450, https://doi.org/10.5194/acp-13-4429-2013, 2013. a
Pearson, G., Davies, F., and Collier, C.: An Analysis of the Performance of the UFAM Pulsed Doppler Lidar for Observing the Boundary Layer, J. Atmos. Ocean. Tech., 26, 240–250, https://doi.org/10.1175/2008JTECHA1128.1, 2009. a
Peltokorpi, S., Kommula, S. M., Buchholz, A., Hao, L., Ihalainen, M., Jaars, K., Köster, K., Rosewig, E. I., Siebert, S. J., Somero, M., Vettikkat, L., Yli-Pirilä, P., van Zyl, P. G., Passig, J., Zimmermann, R., Sippula, O., Vakkari, V., and Virtanen, A.: Savannah and Boreal Biomass Burning as a Source for Cloud Condensation Nuclei, J. Geophys. Res.-Atmos., 131, e2025JD044564, https://doi.org/10.1029/2025JD044564, 2026. a
Pereira, S., Preißer, J., Guerrero-Rascado, J. L., Silva, A. M., and Wagner, F.: Forest Fire Smoke Layers Observed in the Free Troposphere over Portugal with a Multiwavelength Raman Lidar: Optical and Microphysical Properties, The Scientific World Journal, 2014, 421838, https://doi.org/10.1155/2014/421838, 2014. a, b
Petzold, A. and Schönlinner, M.: Multi-angle absorption photometry-a new method for the measurement of aerosol light absorption and atmospheric black carbon, J. Aerosol Sci., 35, 421–441, https://doi.org/10.1016/j.jaerosci.2003.09.005, 2004. a
Pisani, G., Boselli, A., Coltelli, M., Leto, G., Pica, G., Scollo, S., Spinelli, N., and Wang, X.: Lidar depolarization measurement of fresh volcanic ash from Mt. Etna, Italy, Atmos. Environ., 62, 34–40, https://doi.org/10.1016/j.atmosenv.2012.08.015, 2012. a, b
Qin, Z., Wang, H., He, A., Sun, Y., Li, J., Zhang, Y., and Zhang, Q.: Backscattering Linear Depolarization Ratio of Smoke Aerosols From Biomass Burning, J. Geophys. Res.-Atmos., 129, e2024JD041276, https://doi.org/10.1029/2024JD041276, 2024. a
Reid, J. S., Koppmann, R., Eck, T. F., and Eleuterio, D. P.: A review of biomass burning emissions part II: intensive physical properties of biomass burning particles, Atmos. Chem. Phys., 5, 799–825, https://doi.org/10.5194/acp-5-799-2005, 2005. a
Rogers, B. M., Soja, A. J., Goulden, M. L., and Randerson, J. T.: Influence of tree species on continental differences in boreal fires and climate feedbacks, Nat. Geosci., 8, 228–234, https://doi.org/10.1038/ngeo2352, 2015. a
Saide, P. E., Thapa, L. H., Ye, X., Pagonis, D., Campuzano-Jost, P., Guo, H., Schueneman, M. K., Jimenez, J.-L., Moore, R., Wiggins, E., Winstead, E., Robinson, C., Thornhill, L., Sanchez, K., Wagner, N. L., Ahern, A., Katich, J. M., Perring, A. E., Schwarz, J. P., Lyu, M., Holmes, C. D., Hair, J. W., Fenn, M. A., and Shingler, T. J.: Understanding the Evolution of Smoke Mass Extinction Efficiency Using Field Campaign Measurements, Geophys. Res. Lett., 49, e2022GL099175, https://doi.org/10.1029/2022GL099175, 2022. a
Sayer, A. M., Hsu, N. C., Eck, T. F., Smirnov, A., and Holben, B. N.: AERONET-based models of smoke-dominated aerosol near source regions and transported over oceans, and implications for satellite retrievals of aerosol optical depth, Atmos. Chem. Phys., 14, 11493–11523, https://doi.org/10.5194/acp-14-11493-2014, 2014. a
Schotland, R. M., Sassen, K., and Stone, R.: Observations by Lidar of Linear Depolarization Ratios for Hydrometeors, J. Appl. Meteorol. Clim., 10, 1011–1017, https://doi.org/10.1175/1520-0450(1971)010<1011:OBLOLD>2.0.CO;2, 1971. a
Sekiyama, T. T., Tanaka, T. Y., Shimizu, A., and Miyoshi, T.: Data assimilation of CALIPSO aerosol observations, Atmos. Chem. Phys., 10, 39–49, https://doi.org/10.5194/acp-10-39-2010, 2010. a
Shimizu, A., Nakamichi, H., and Iguchi, M.: Long-Term Lidar Observations of Volcanic Ash from Sakurajima, J. Disaster Res., 20, 281–286, https://doi.org/10.20965/jdr.2025.p0281, 2025. a
Sousan, S., Koehler, K., Hallett, L., and Peters, T. M.: Evaluation of the Alphasense optical particle counter (OPC-N2) and the Grimm portable aerosol spectrometer (PAS-1.108), Aerosol Sci. Technol., 50, 1352–1365, https://doi.org/10.1080/02786826.2016.1232859, 2016. a
Su, J., Delgado, R., Berkoff, T. A., Sullivan, J. T., Gronoff, G. P., and Phoenix, D. B.: Observation of fresh wildfire smoke over Hampton, VA in winter, Atmos. Environ., 358, 121370, https://doi.org/10.1016/j.atmosenv.2025.121370, 2025. a, b
Sugimoto, N. and Lee, C. H.: Characteristics of dust aerosols inferred from lidar depolarization measurements at two wavelengths, Appl. Optics, 45, 7468–7474, https://doi.org/10.1364/AO.45.007468, 2006. a, b, c
Sugimoto, N., Matsui, I., Shimizu, A., Uno, I., Asai, K., Endoh, T., and Nakajima, T.: Observation of dust and anthropogenic aerosol plumes in the Northwest Pacific with a two-wavelength polarization lidar on board the research vessel Mirai, Geophys. Res. Lett., 29, 7–1–7–4, https://doi.org/10.1029/2002GL015112, 2002. a
Sumlin, B. J., Heinson, W. R., and Chakrabarty, R. K.: Retrieving the aerosol complex refractive index using PyMieScatt: A Mie computational package with visualization capabilities, J. Quant. Spectrosc. Ra., 205, 127–134, https://doi.org/10.1016/j.jqsrt.2017.10.012, 2018a. a
Sumlin, B. J., Heinson, Y. W., Shetty, N., Pandey, A., Pattison, R. S., Baker, S., Hao, W. M., and Chakrabarty, R. K.: UV–Vis–IR spectral complex refractive indices and optical properties of brown carbon aerosol from biomass burning, J. Quant. Spectrosc. Ra., 206, 392–398, https://doi.org/10.1016/j.jqsrt.2017.12.009, 2018b. a
Tesche, M., Ansmann, A., Müller, D., Althausen, D., Engelmann, R., Freudenthaler, V., and Groß, S.: Vertically resolved separation of dust and smoke over Cape Verde using multiwavelength Raman and polarization lidars during Saharan Mineral Dust Experiment 2008, J. Geophys. Res.-Atmos., 114, https://doi.org/10.1029/2009JD011862, 2009. a
Tesche, M., Gross, S., Ansmann, A., Müller, D., Althausen, D., Freudenthaler, V., and Esselborn, M.: Profiling of Saharan dust and biomass-burning smoke with multiwavelength polarization Raman lidar at Cape Verde, Tellus B, 63, 649–676, https://doi.org/10.1111/j.1600-0889.2011.00548.x, 2011. a
Vakkari, V., Beukes, J. P., Dal Maso, M., Aurela, M., Josipovic, M., Van Zyl, P. G., Tiitta, P., Kulmala, M., and Laakso, L.: Major secondary aerosol formation in southern African open biomass burning plumes, Nat. Geosci., 11, 580–583, https://doi.org/10.1038/s41561-018-0170-0, 2018. a
Vakkari, V., Manninen, A. J., O'Connor, E. J., Schween, J. H., van Zyl, P. G., and Marinou, E.: A novel post-processing algorithm for Halo Doppler lidars, Atmos. Meas. Tech., 12, 839–852, https://doi.org/10.5194/amt-12-839-2019, 2019. a, b, c
Vakkari, V., Baars, H., Bohlmann, S., Bühl, J., Komppula, M., Mamouri, R.-E., and O'Connor, E. J.: Aerosol particle depolarization ratio at 1565 nm measured with a Halo Doppler lidar, Atmos. Chem. Phys., 21, 5807–5820, https://doi.org/10.5194/acp-21-5807-2021, 2021. a, b, c, d, e, f, g, h
Vakkari, V., Vettikkat, L., Kommula, S., Mukherjee, A., Hao, L., Backman, J., Buchholz, A., Gawlitta, N., Ihalainen, M., Jaars, K., Köster, K., Le, V., Miettinen, P., Nissinen, A., Czech, H., Alton, M., Passig, J., Peltokorpi, S., Piedehierro, A. A., Pullinen, I., Rosewig, E. I., Schobesberger, S., Shukla, D., Siebert, S. J., Somero, M., Virkkula, A., Welti, A., Yli-Pirilä, P., Ylisirniö, A., Zimmermann, R., van Zyl, P. G., Virtanen, A., and Sippula, O.: Laboratory Experiments on Savannah and European Boreal Forest Fire Emissions, J. Geophys. Res.-Atmos., 131, e2025JD044543, https://doi.org/10.1029/2025JD044543, 2026. a, b
Wiegner, M. and Geiß, A.: Aerosol profiling with the Jenoptik ceilometer CHM15kx, Atmos. Meas. Tech., 5, 1953–1964, https://doi.org/10.5194/amt-5-1953-2012, 2012. a
Xian, J., Sun, D., Xu, W., Han, Y., Zheng, J., Peng, J., and Yang, S.: Urban air pollution monitoring using scanning Lidar, Environ. Pollut., 258, 113696, https://doi.org/10.1016/j.envpol.2019.113696, 2020. a
Zhang, J., Reid, J. S., Westphal, D. L., Baker, N. L., and Hyer, E. J.: A system for operational aerosol optical depth data assimilation over global oceans, J. Geophys. Res.-Atmos., 119, 2013JD020666, https://doi.org/10.1002/2013JD020666, 2014. a
Zhang, Y., Favez, O., Canonaco, F., Liu, D., Močnik, G., Amodeo, T., Sciare, J., Prévôt, A. S. H., Gros, V., and Albinet, A.: Evidence of major secondary organic aerosol contribution to lensing effect black carbon absorption enhancement, npj Climate and Atmospheric Science, 1, 47, https://doi.org/10.1038/s41612-018-0056-2, 2018. a