
the Creative Commons Attribution 4.0 License.
the Creative Commons Attribution 4.0 License.
 | 13 Aug 2026
Sodium Lidar observed multiple sodium layer structures and their dynamical coupling mechanism
Yuxia Jia
Chao Ban
Xin Fang
Zhaopeng Wu
Jianfei Wu
Weilin Pan
Chengyun Yang
On the night of 13 June 2013, the University of Science and Technology of China (USTC) sodium lidar observed multiple sporadic sodium layers (SSLs) and enhanced sodium patterns (ESPs) over Hefei, China (31.8° N, 117.3° E). These structures appeared at different times, collectively spanning nearly the entire night, and exhibited distinct vertical motions and horizontal propagation behaviors. Their propagation was closely linked to the background horizontal wind, indicating the role of horizontal transport. Combined observations from the nearby meteor radar and ionosonde in Wuhan (∼200 mi west of Hefei) revealed that SSLs occurring before 19:30 UT are closely associated with the sporadic E (Es) layer. The evolution of the Es layer shows an overall downward propagation consistent with tidal wind variations, suggesting that tidal waves may play a role in modulating ion distribution and associated sodium production. Notably, two ESP events exhibit quasi-periodic structures with periods of ∼50–60 min, accompanied by similar oscillations in the Es layer and associated ion convergence regions. This behavior indicates that the atmospheric gravity waves may also modulate the horizontal wind, thereby influencing ion convergence, the Es layer, and sodium density. These observations provide new insights into the roles of wave-modulated horizontal winds in driving sodium-layer variability and underscore the importance of coupled neutral–ion processes in the MLT region.
- Article
(9524 KB) - Full-text XML
- BibTeX
- EndNote


The mesosphere and lower thermosphere (MLT; 80–105 km) is a key region for the coupling between Earth's neutral atmosphere and the ionosphere, where complex dynamical, photochemical, and electrodynamical processes coexist. Processes occurring in this region play a crucial role in the transport of energy and constituents throughout the atmosphere (Fritts and Alexander, 2003; Li et al., 2007, 2022). Narrowband sodium resonance fluorescence lidar can measure MLT region temperature, wind, and sodium density with high temporal and spatial resolutions (She and Yu, 1994; Li et al., 2012), and is widely used for investigating MLT dynamics (Gardner and Liu, 2007; Guo et al., 2017; She et al., 2021).
Among metal-layer phenomena, sporadic sodium layers (SSLs) are particularly striking and can be observed effectively with sodium resonance-fluorescence lidar. The SSL was first reported by Clemesha et al. (1978). It is characterized by a rapid enhancement of neutral sodium number density by several times within a thin vertical layer, typically less than 5 km thick (Collins et al., 2002). Such enhancements usually develop within minutes to tens of minutes and may persist for a few hours (Clemesha, 1995). Owing to its pronounced temporal and spatial variability, the SSL has been widely regarded as a sensitive tracer for probing the coupling among dynamical, chemical, and ionospheric processes in the MLT region (Qiu et al., 2016).
The formation of SSLs has been attributed to multiple mechanisms. Among these, sporadic E (Es) layers are considered a direct source of neutral sodium atoms (Von Zahn and Hansen, 1988; Heinselman et al., 1998). Metallic ions, such as Na+, concentrated within Es layers, can be rapidly neutralized through a sequence of ion–molecule reactions, resulting in the localized release of a large amount of neutral sodium atoms (Cox and Plane, 1998; Plane et al., 2015). Observations have reported strong spatiotemporal correlations between SSLs and Es layers (Von Zahn and Hansen, 1988; Kane et al., 1993). In addition, temperature perturbations may modify chemical reaction rates and shift the balance between sodium production and loss, leading to rapid local enhancements of sodium density (Zhou et al., 1993). Meteoric input has also been suggested as a potential contributor to SSL formation (Dou et al., 2010). The coexistence of these mechanisms indicates that SSLs are likely produced through the combined effects of multiple interacting processes.
Beyond their formation, the dynamical propagation and evolution of SSLs are equally important for understanding the underlying physical processes. Early observations using a steerable sodium lidar revealed horizontal variations in sodium concentration (Thomas et al., 1977). Based on simultaneous measurements at three horizontally separated locations, Batista et al. (1991) identified systematic time delays in the occurrence of SSL events. Tsuda et al. (2015) employed a five-directional sodium lidar in combination with complementary instruments and demonstrated that SSL structures were horizontally advected, with propagation velocities consistent with independently measured background winds. Similarly, using a three-directional sodium lidar in Antarctica, Chen et al. (2021) further confirmed the wind-driven advection of SSLs and revealed their close coupling with a descending Es layer. In addition, Ban et al. (2015) reported an upward motion SSL event exhibiting clear horizontal advection by the background wind field and possibly associated with gravity-wave breaking. This finding suggested that SSLs possess horizontal structures and are advected by the background horizontal wind.
Most studies of SSL dynamical behavior have focused on either a single dominant SSL observed during an individual night (Ban et al., 2015; Tsuda et al., 2015) or on SSL events occurring on different days (Batista et al., 1991). In this study, we investigate the formation and propagation characteristics of multiple SSLs and enhanced sodium patterns (ESPs) occurring within a single night by using the observations from the sodium temperature/wind lidar at the University of Science and Technology of China (USTC). Simultaneous measurements from a meteor radar and an ionosonde located in Wuhan, approximately 200 mi west of the lidar site, are also employed to examine the dynamical and ionospheric conditions associated with these events. Section 2 describes the instruments and datasets, Sect. 3 presents the observational results, Sect. 4 explores possible sources of , Sect. 5 examines the effects of horizontal winds, Sect. 6 discusses the results, and Sect. 7 summarizes the main conclusions.
2.1 USTC Sodium Lidar
The USTC sodium lidar, located in Hefei, China (31.8° N, 117.3° E), can simultaneously measure sodium density, temperature, and wind with high spatial and temporal resolution over an altitude range of 80–105 km. The transmitted laser beam is split into two beams that are alternately directed eastward and westward at a zenith angle of 15°, enabling the derivation of zonal momentum flux from the dual-beam wind measurements (Li et al., 2022). The backscattered signals from the two viewing directions are collected independently by two telescopes, each with an aperture of 76 cm. With a temporal resolution of 15 min and a vertical resolution of 2 km, the lidar achieves measurement uncertainties induced by photon noise and laser locking fluctuation of approximately 1.0 K in temperature and 1.5 m s−1 in wind at the peak of the sodium layer (Li et al., 2012). In this study, sodium number density data with a temporal resolution of 1 min and a vertical resolution of 150 m are used, while zonal wind data are analyzed with a temporal resolution of 30 min and a vertical resolution of 2 km.
In this study, the definition of an SSL follows the criteria proposed by Dou et al. (2009). Specifically, an SSL must satisfy the following three criteria: (1) the peak sodium density is at least twice the background sodium density at the same altitude and exceeds 1000 cm−3 when the SSL occurs above 100 km; (2) the full width at half maximum (FWHM) of the layer is less than 4.0 km; and (3) the layer persists for at least 15 min. The first two criteria are identical to those proposed by Dou et al. (2009), whereas the duration criterion has been modified to account for the high temporal resolution of the sodium lidar observations used in this study. Since the sodium density profiles have a temporal resolution of 1 min, the original requirement of four successive lidar profiles (>16 min) is replaced by a requirement of at least 15 consecutive profiles (15 min), while maintaining essentially the same temporal threshold. In contrast, an ESP is defined as an obvious sodium density enhancement event that does not satisfy one or more of the above SSL identification criteria.
The background sodium profile used for SSL identification is determined iteratively. The all-night averaged sodium density profile is first adopted as the initial background profile. Sodium density profiles whose sodium densities exceed twice the background value are regarded as containing SSLs and are excluded from the background calculation. The remaining profiles are averaged to obtain an updated background profile, and the procedure is repeated until the background profile converges. The converged profile is used as the final background sodium profile.
2.2 Wuhan Meteor Radar and Ionosonde
The Wuhan meteor radar, located in Wuhan, China (30.7° N, 114.5° E), is an important radio sounding instrument for measuring horizontal wind fields in the MLT region. The radar site is approximately 200 mi west of the USTC sodium lidar. The system derives wind information at different altitude layers by detecting radio-wave backscatter from meteor trails. As an all-sky interferometric wideband radar, it provides horizontal wind measurements with a temporal resolution of about 2 h and a vertical resolution of 3 km over an altitude range of approximately 80–100 km (Xiong et al., 2004). In this study, the meteor radar meridional wind observed on 13 June 2013 is used together with the lidar measurements to investigate sodium layer variations.
The Wuhan ionosonde is a standard ground-based instrument used for vertical sounding of the ionospheric structure. It transmits radio waves with frequencies sweeping from 1–30 MHz into the upper atmosphere and receives the echoes reflected from different ionospheric altitudes, thereby deriving the vertical profile of electron density in near real time. The system can directly measure key Es parameters, including the critical frequency of Es (foEs) and the virtual height of Es (h′Es). Here, h′Es represents the virtual reflection height of the Es layer derived from the ionogram. In this study, ionosonde observations with a 15 min temporal resolution are used to provide Es information for the case analysis.
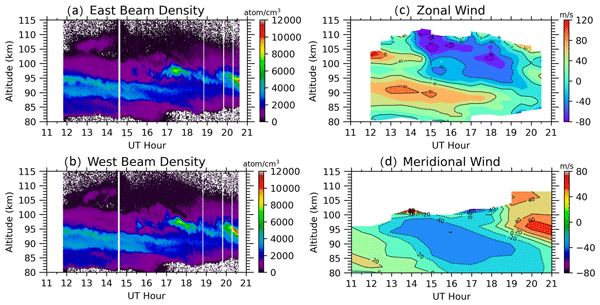
During the night of 13 June 2013, three SSL events were observed by the east and west beams of the sodium lidar during 12:30–14:30, 17:00–18:30, and 20:00–21:00 UT, as shown in Fig. 1a and b. These events are hereafter referred to as SSL1, SSL2, and SSL3. The SSL1 occurred above 100 km and exhibited an upward motion with time. Figure 2a shows the maximum sodium density profiles of the SSL1 in the east and west beams compared with the background sodium density. The maximum sodium density of SSL1 is 1500 cm−3 at 105 km, approximately 15 times the background sodium layer at 105 km. Similarly, Fig. 2b and c shows the maximum sodium density profiles of the SSL2 and SSL3. The maximum sodium densities of SSL2 and SSL3 were 8300 cm−3 at 97.5 km and 12 000 cm−3 at 94 km, respectively.
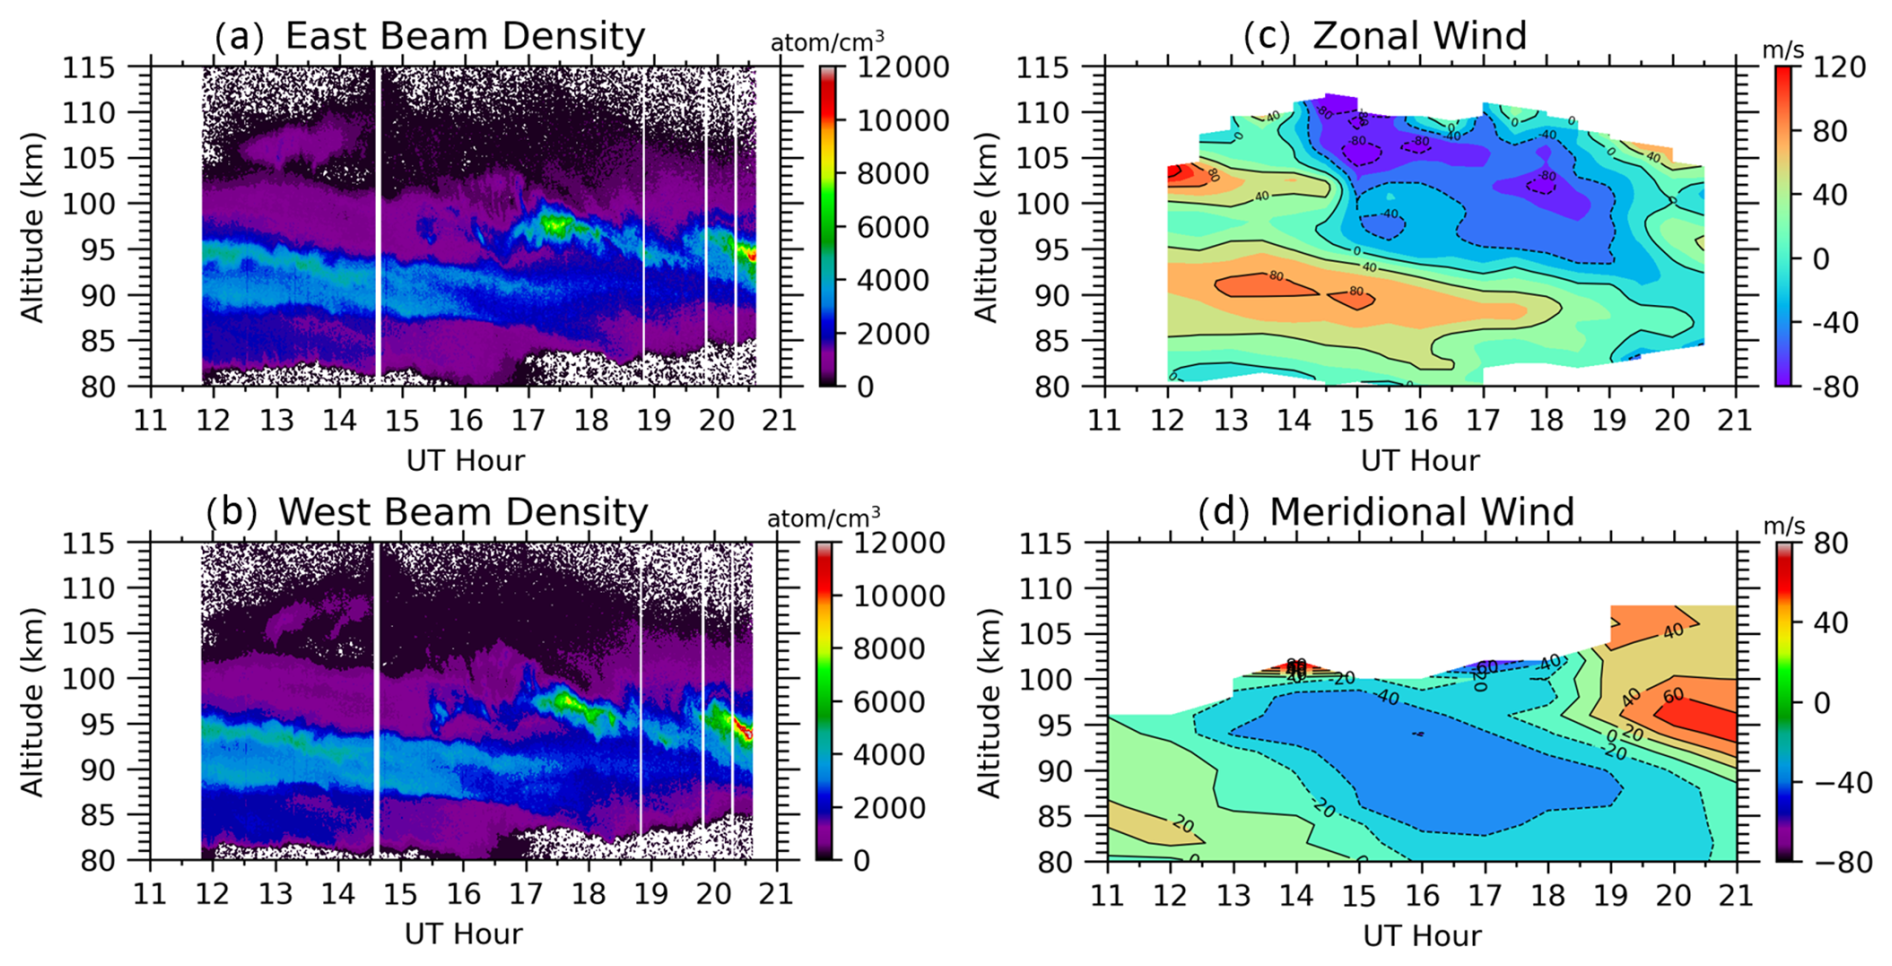
Figure 1Time–height contours of east beam sodium density (a), west beam sodium density (b), zonal wind (c) from USTC Na lidar and meridional wind (d) from Wuhan meteor radar between 11:00 and 21:00 UT, 13 June 2013. The white vertical lines represent data gaps.
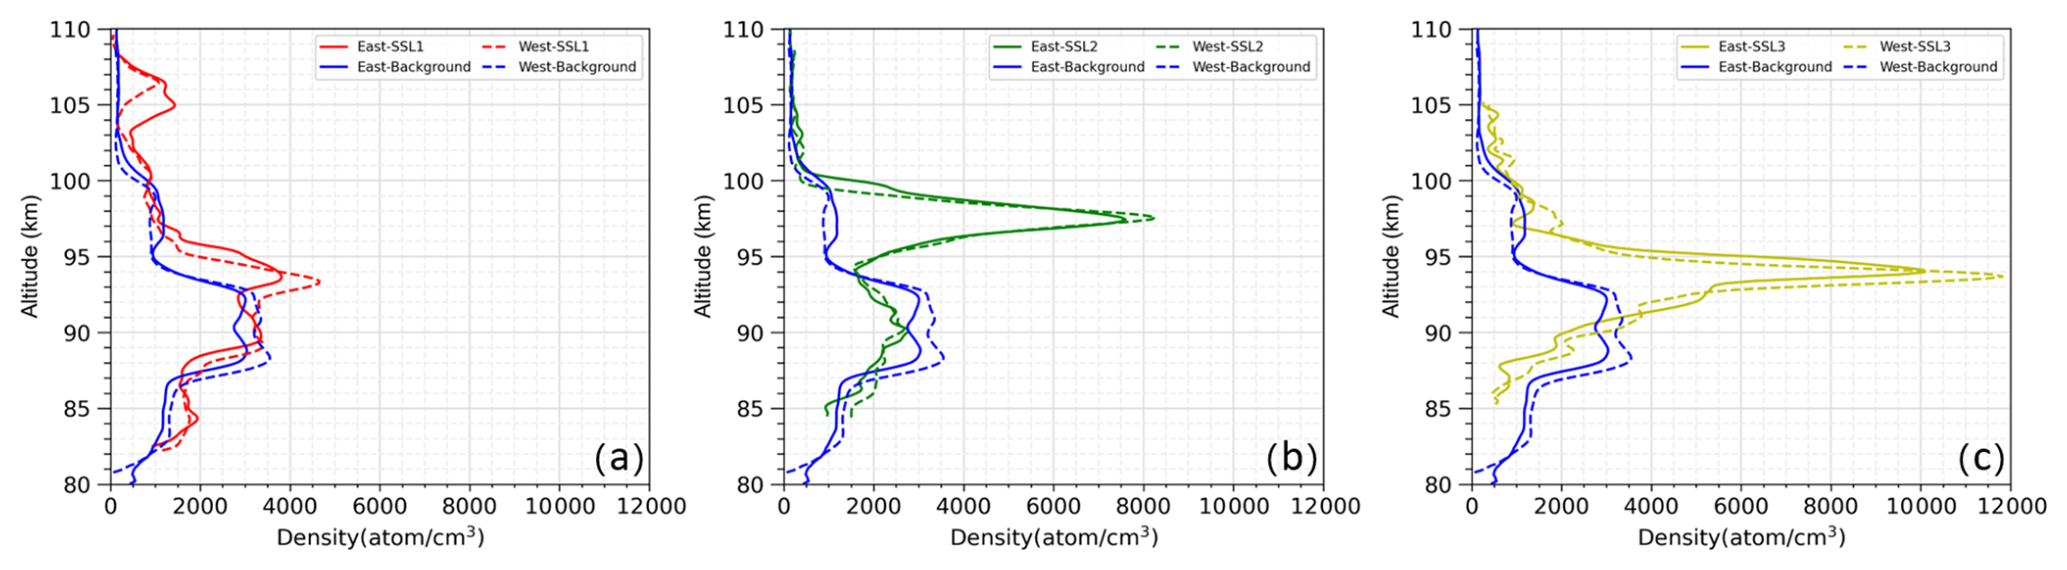
Figure 2Maximum sodium density profiles of the SSL1 (a), SSL2 (b), and SSL3 (c) compared with the background sodium density. The solid line represents the east beam and the dashed line represents the west beam. SSL1, SSL2, SSL3 and background sodium density are plotted in red, green, yellow, and blue respectively.
In addition to the three prominent SSLs on this night, three ESP events were observed at 15:30 UT at 96 km, at 16:18 UT at 96 km, and during 18:30–19:30 UT around 94 km. These are hereafter referred to as ESP1, ESP2, and ESP3. Figure 1c and d shows the zonal wind observed by the sodium lidar and the meridional wind observed by the Wuhan meteor radar. A comparison between sodium density variation and horizontal winds indicates that SSL2, ESP1, ESP2, and ESP3 occurred during periods of westward zonal winds. After 19:00 UT, the zonal wind direction changed from west to east, and the SSL3 appeared with a north-east background wind.
To further investigate the dynamical properties of the SSLs, Fig. 3a and b shows the detailed structure of SSL1 in the east beam and west beam, respectively. Similarly, the fine structures of SSL2 and SSL3 are shown in Fig. 3c–f. As shown in Fig. 3, SSL1 exhibits upward motion, whereas SSL2 and SSL3 show downward motion, with SSL3 descending faster than SSL2. The SSL2 first appeared in the east beam and subsequently in the west beam, whereas SSL3 showed the opposite behavior, appearing earlier in the west beam than in the east beam.
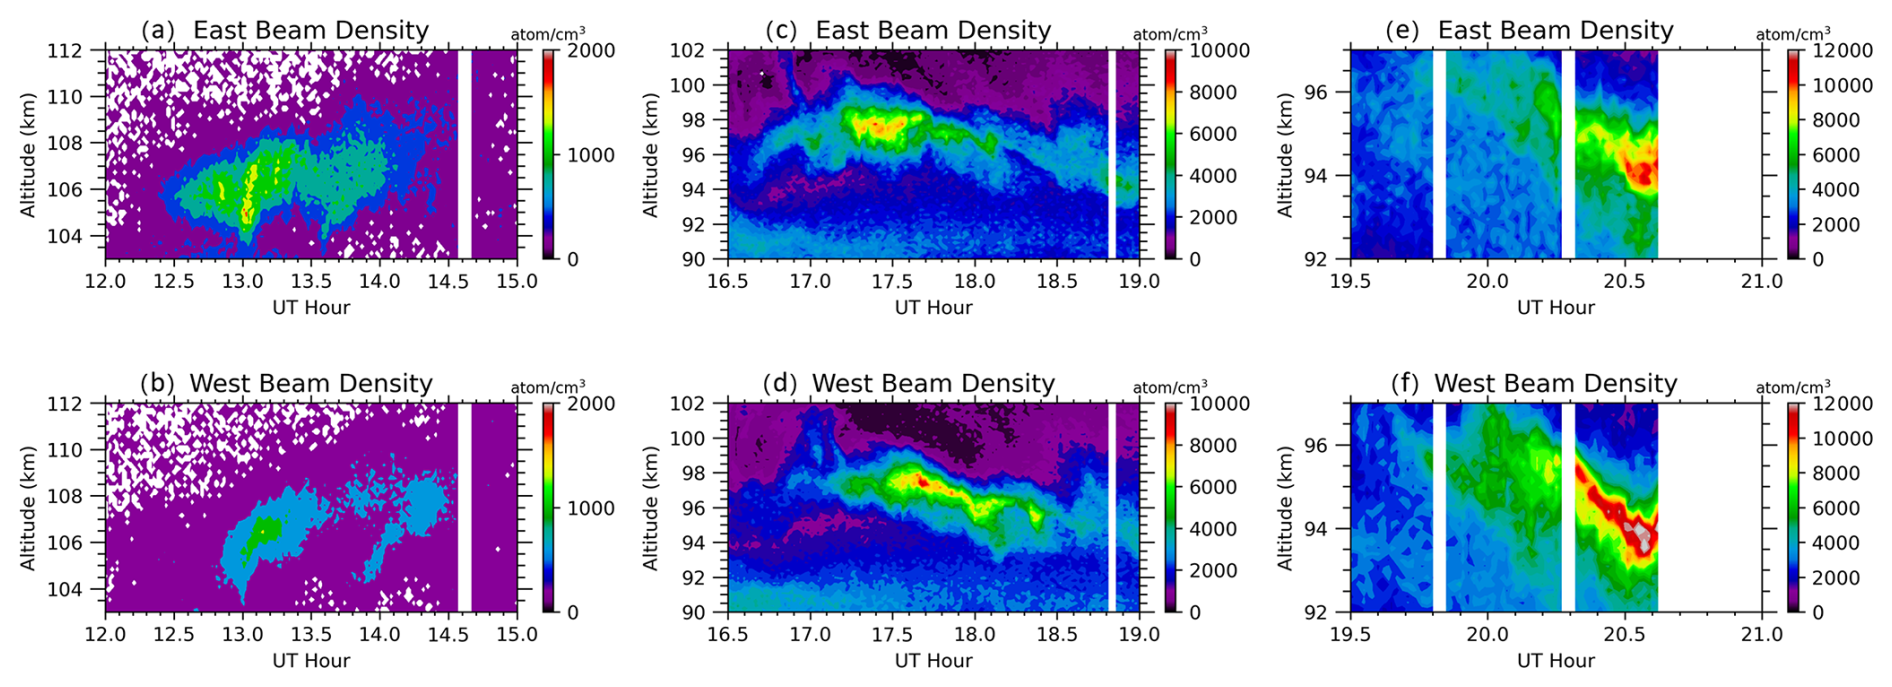
Figure 3Time–height contours of SSL1 (a, b), SSL2 (c, d), and SSL3 (e, f). The upper panels show results from the east beam, and the lower panels show results from the west beam.
To quantify the time delay between the two beams, SSL2 is taken as an example and analyzed using the method described by Chen et al. (2021). Figure 4a and b presents the sodium density variations in the east and west beams during 15:00–19:00 UT. The black dashed lines in Fig. 4a and b indicates the altitudes of 95 and 100 km. SSL2 persisted for approximately 2 h, from ∼16:36–18:30 UT, with its maximum density occurring around 17:30 UT. In addition to the main SSL2 structure, a thin descending layer originating from 102 km at 16:50 UT is observed in the east beam and merges into SSL2 (Fig. 4a). A similar but more complex structure is observed in the west beam (Fig. 4b). Figure 4c and d presents the temporal evolution of sodium density within this height range between 95 and 100 km. The mean, maximum, and median values of the sodium density are compared with the background sodium density. The onset and end of the SSL are shown as vertical dashed lines and defined as the times when the sodium density reached twice the background density. The mean density in the east beam first exceeds twice the background at 16:57 UT (Fig. 4c), followed by the west beam at 17:15 UT, indicating a time delay of ∼18 min.
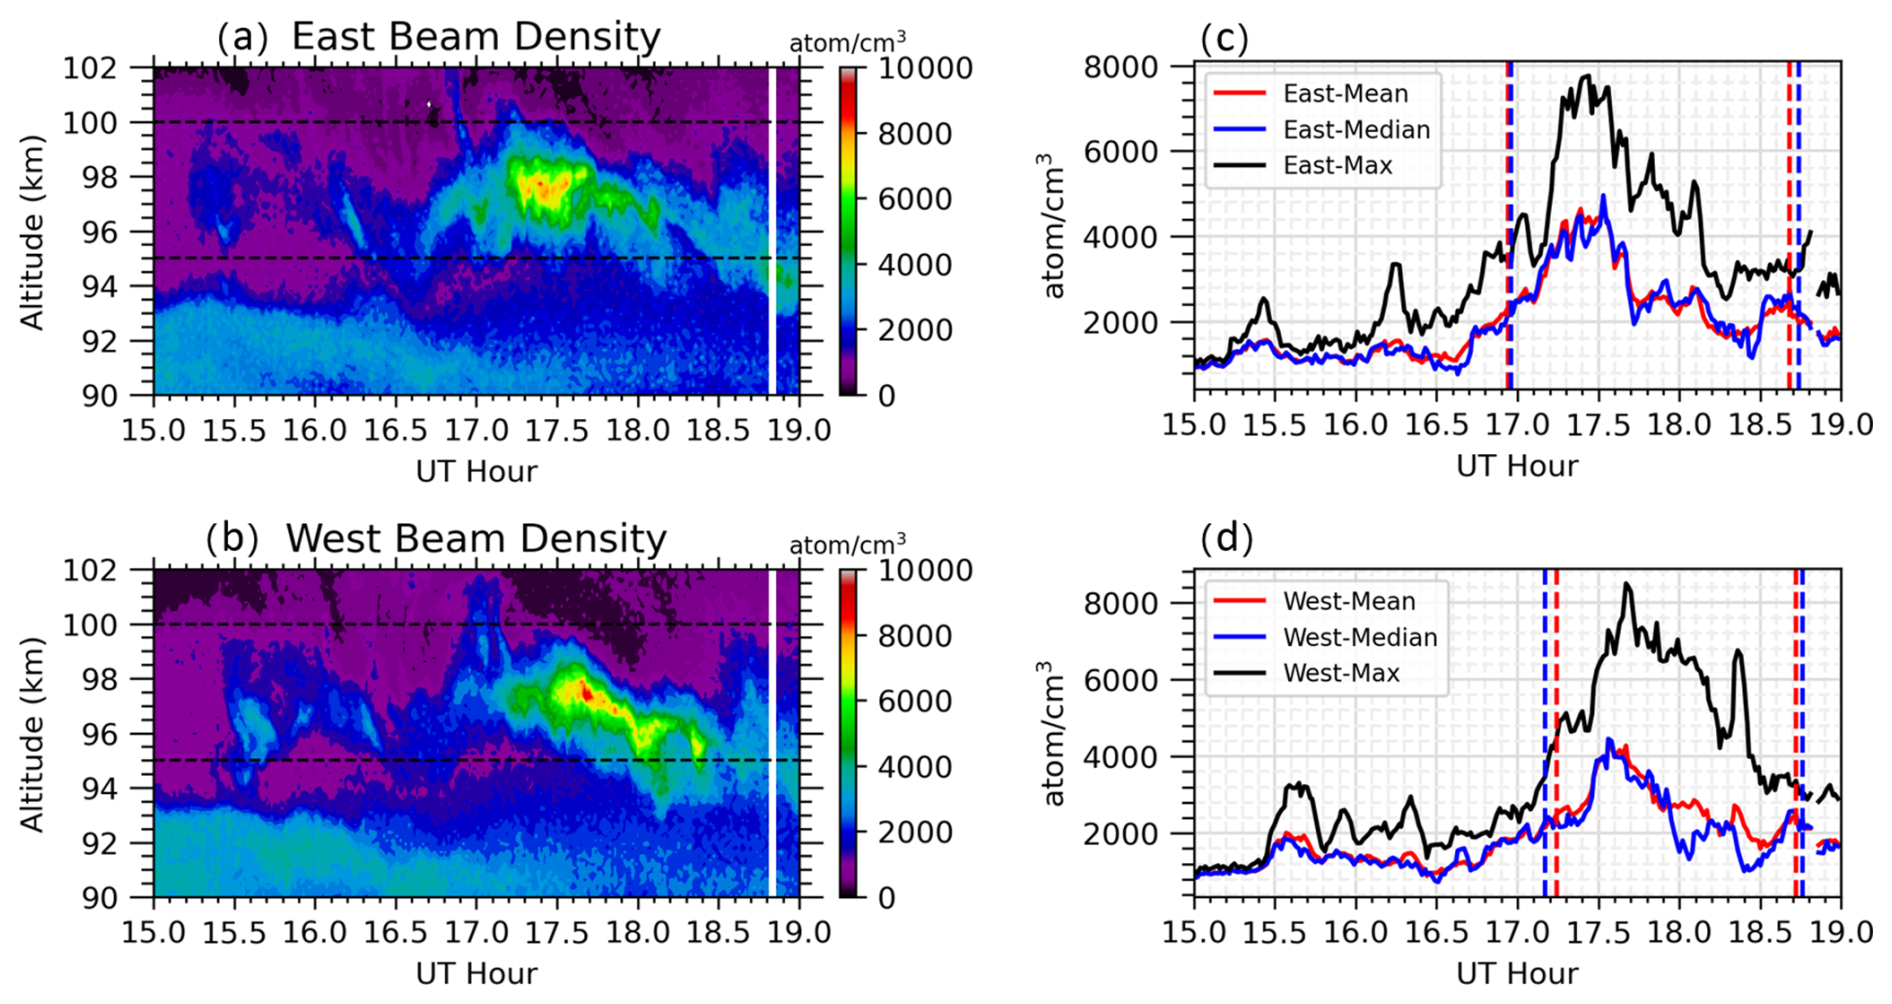
Figure 4Time–height contours of SSL2 observed from the east beam (a) and west beam (b). Panels (c) and (d) show the corresponding time variations of sodium density within the altitude range of 95–100 km for the two beams. Red, blue, and black solid lines represent the mean, median, and maximum sodium densities, respectively. Vertical red and blue dashed lines indicate the onset and end times derived from mean and median sodium densities, defined as twice the background level.
For the ESPs, the sodium density enhancements in Fig. 1 are less pronounced than those of the SSLs. To better characterize their dynamic properties, Fig. 5a and b illustrates the time–height variations of ESP1 and ESP2 in the east and west beams, respectively, while Fig. 5c and d shows those of ESP3. All three ESPs exhibit downward motion, with ESP1 and ESP2 descending faster than ESP3. ESP1 and ESP2 are separated by approximately 1 h and exhibit similar phase speeds. Both ESP1 and ESP2 appear earlier in the east beam than in the west beam. ESP3 persists longer and exhibits higher sodium density than ESP1 and ESP2. Its peak density occurs at ∼94.5 km in the east beam and ∼93 km in the west beam, whereas the peak altitudes of ESP1 and ESP2 are similar in both beams. However, the peak density of ESP1 is significantly higher in the west beam than in the east beam. These differences indicate that small-scale sodium structures are horizontally inhomogeneous.
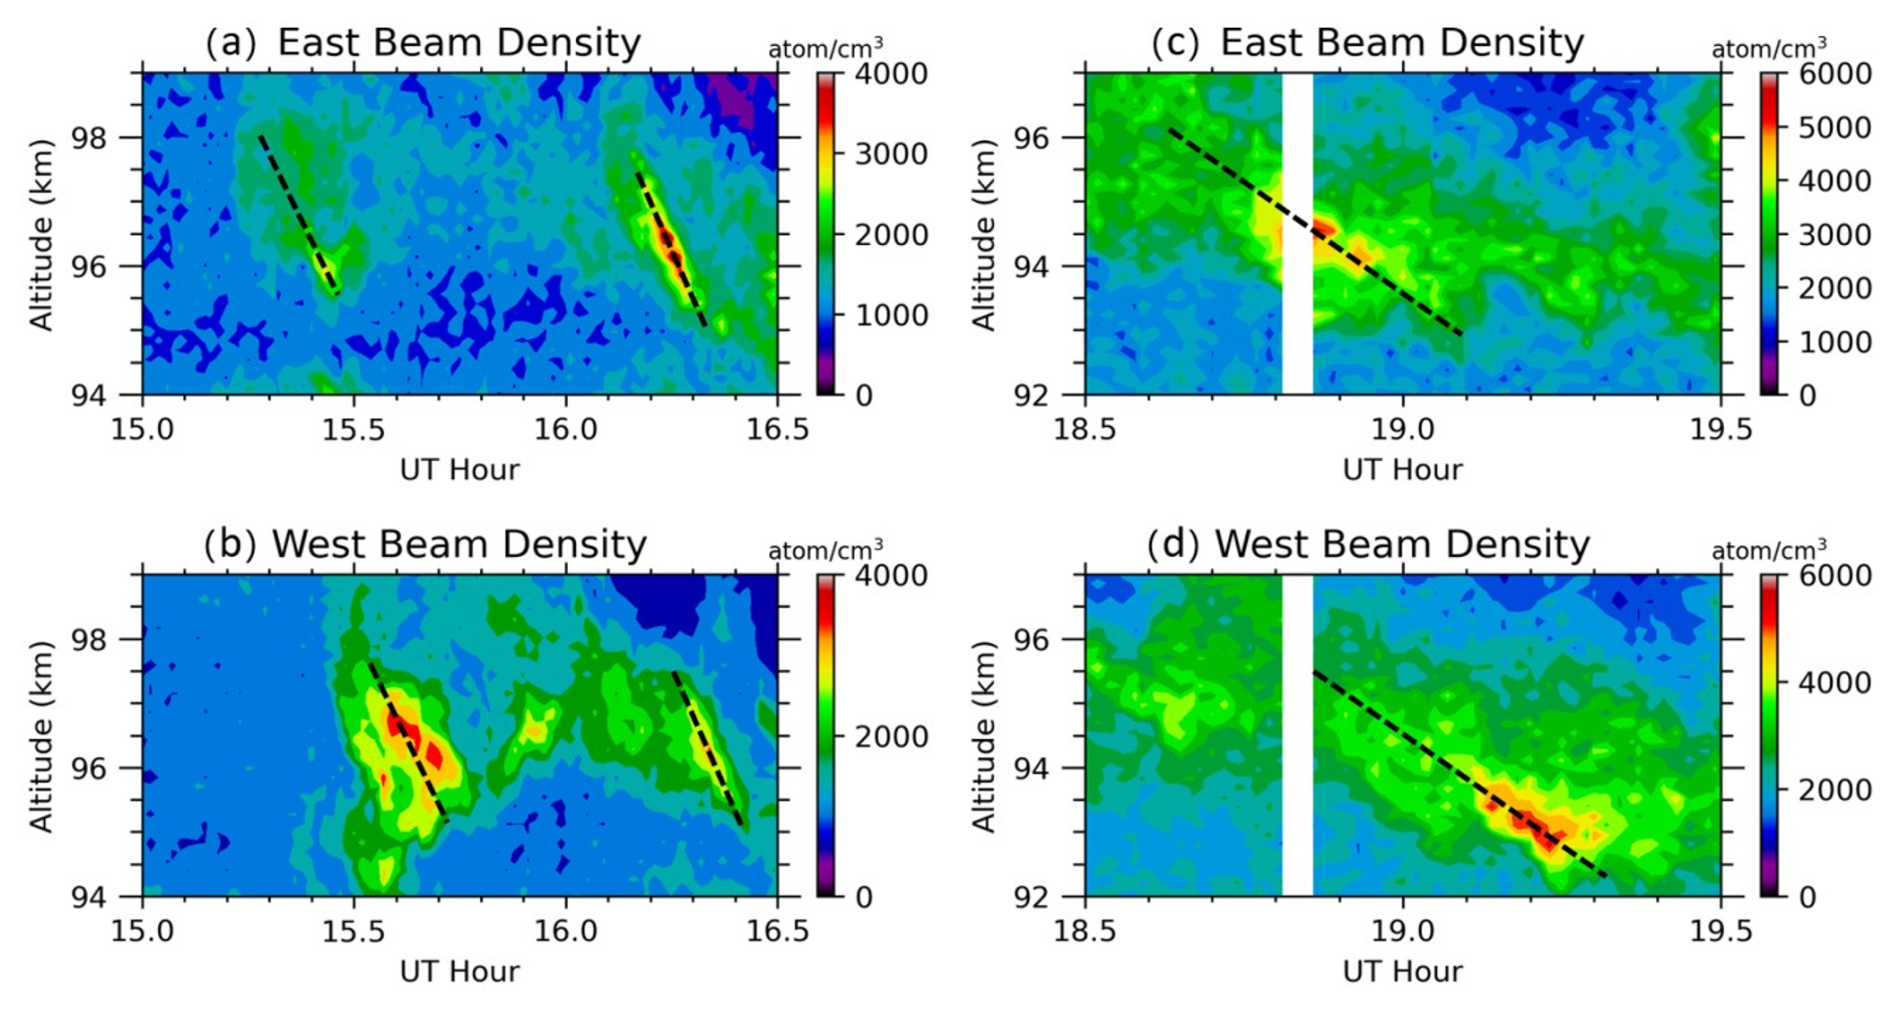
Figure 5Time–height contours showing the detailed structures of ESP1 and ESP2 (a, b) and ESP3 (c, d) observed by the east beam (a, c) and west beam (b, d). Black dashed lines indicate the central regions of the ESPs, which are used to estimate the time delay for each ESP. The black dashed lines are according to the variation trend of the altitude corresponding to the maximum sodium density during each ESP event.
The ESPs have relatively short durations (∼15 min for ESP1 and ESP2) and lower densities than the SSLs, making them unsuitable for estimating propagation delays using the SSL method. However, their clear downward phase structures allow estimation of propagation delays based on phase alignment. Taking ESP1 as an example, the evolution trajectory of the structure in the east beam is identified by a dashed line whose slope is determined from the time–height variation of the maximum sodium density within the ESP (Fig. 5a). The corresponding trajectory in the west beam is approximated using a parallel dashed line. The time difference (∼10 min) between the two trajectories represents the propagation delay of ESP1. Using the same method, the delays for ESP2 and ESP3 are estimated at ∼6 and ∼14 min, respectively.
To investigate the source of sodium atoms associated with the observed SSLs and ESPs, ionosonde measurements from Wuhan, located near Hefei, were analyzed to characterize occurrence and evolution of the Es layer on that day. Figure 6a and b presents the Es layer altitude (h′Es) and critical frequency (foEs) during 11:00–21:00 UT of 13 June 2013. An Es layer was present from 11:00–18:45 UT. To facilitate direct comparison, the temporal evolution of the Es layer altitude is overplotted on the sodium density contour in Fig. 6c. Based on its dynamical behavior, the evolution of the Es layer can be divided into three distinct stages.
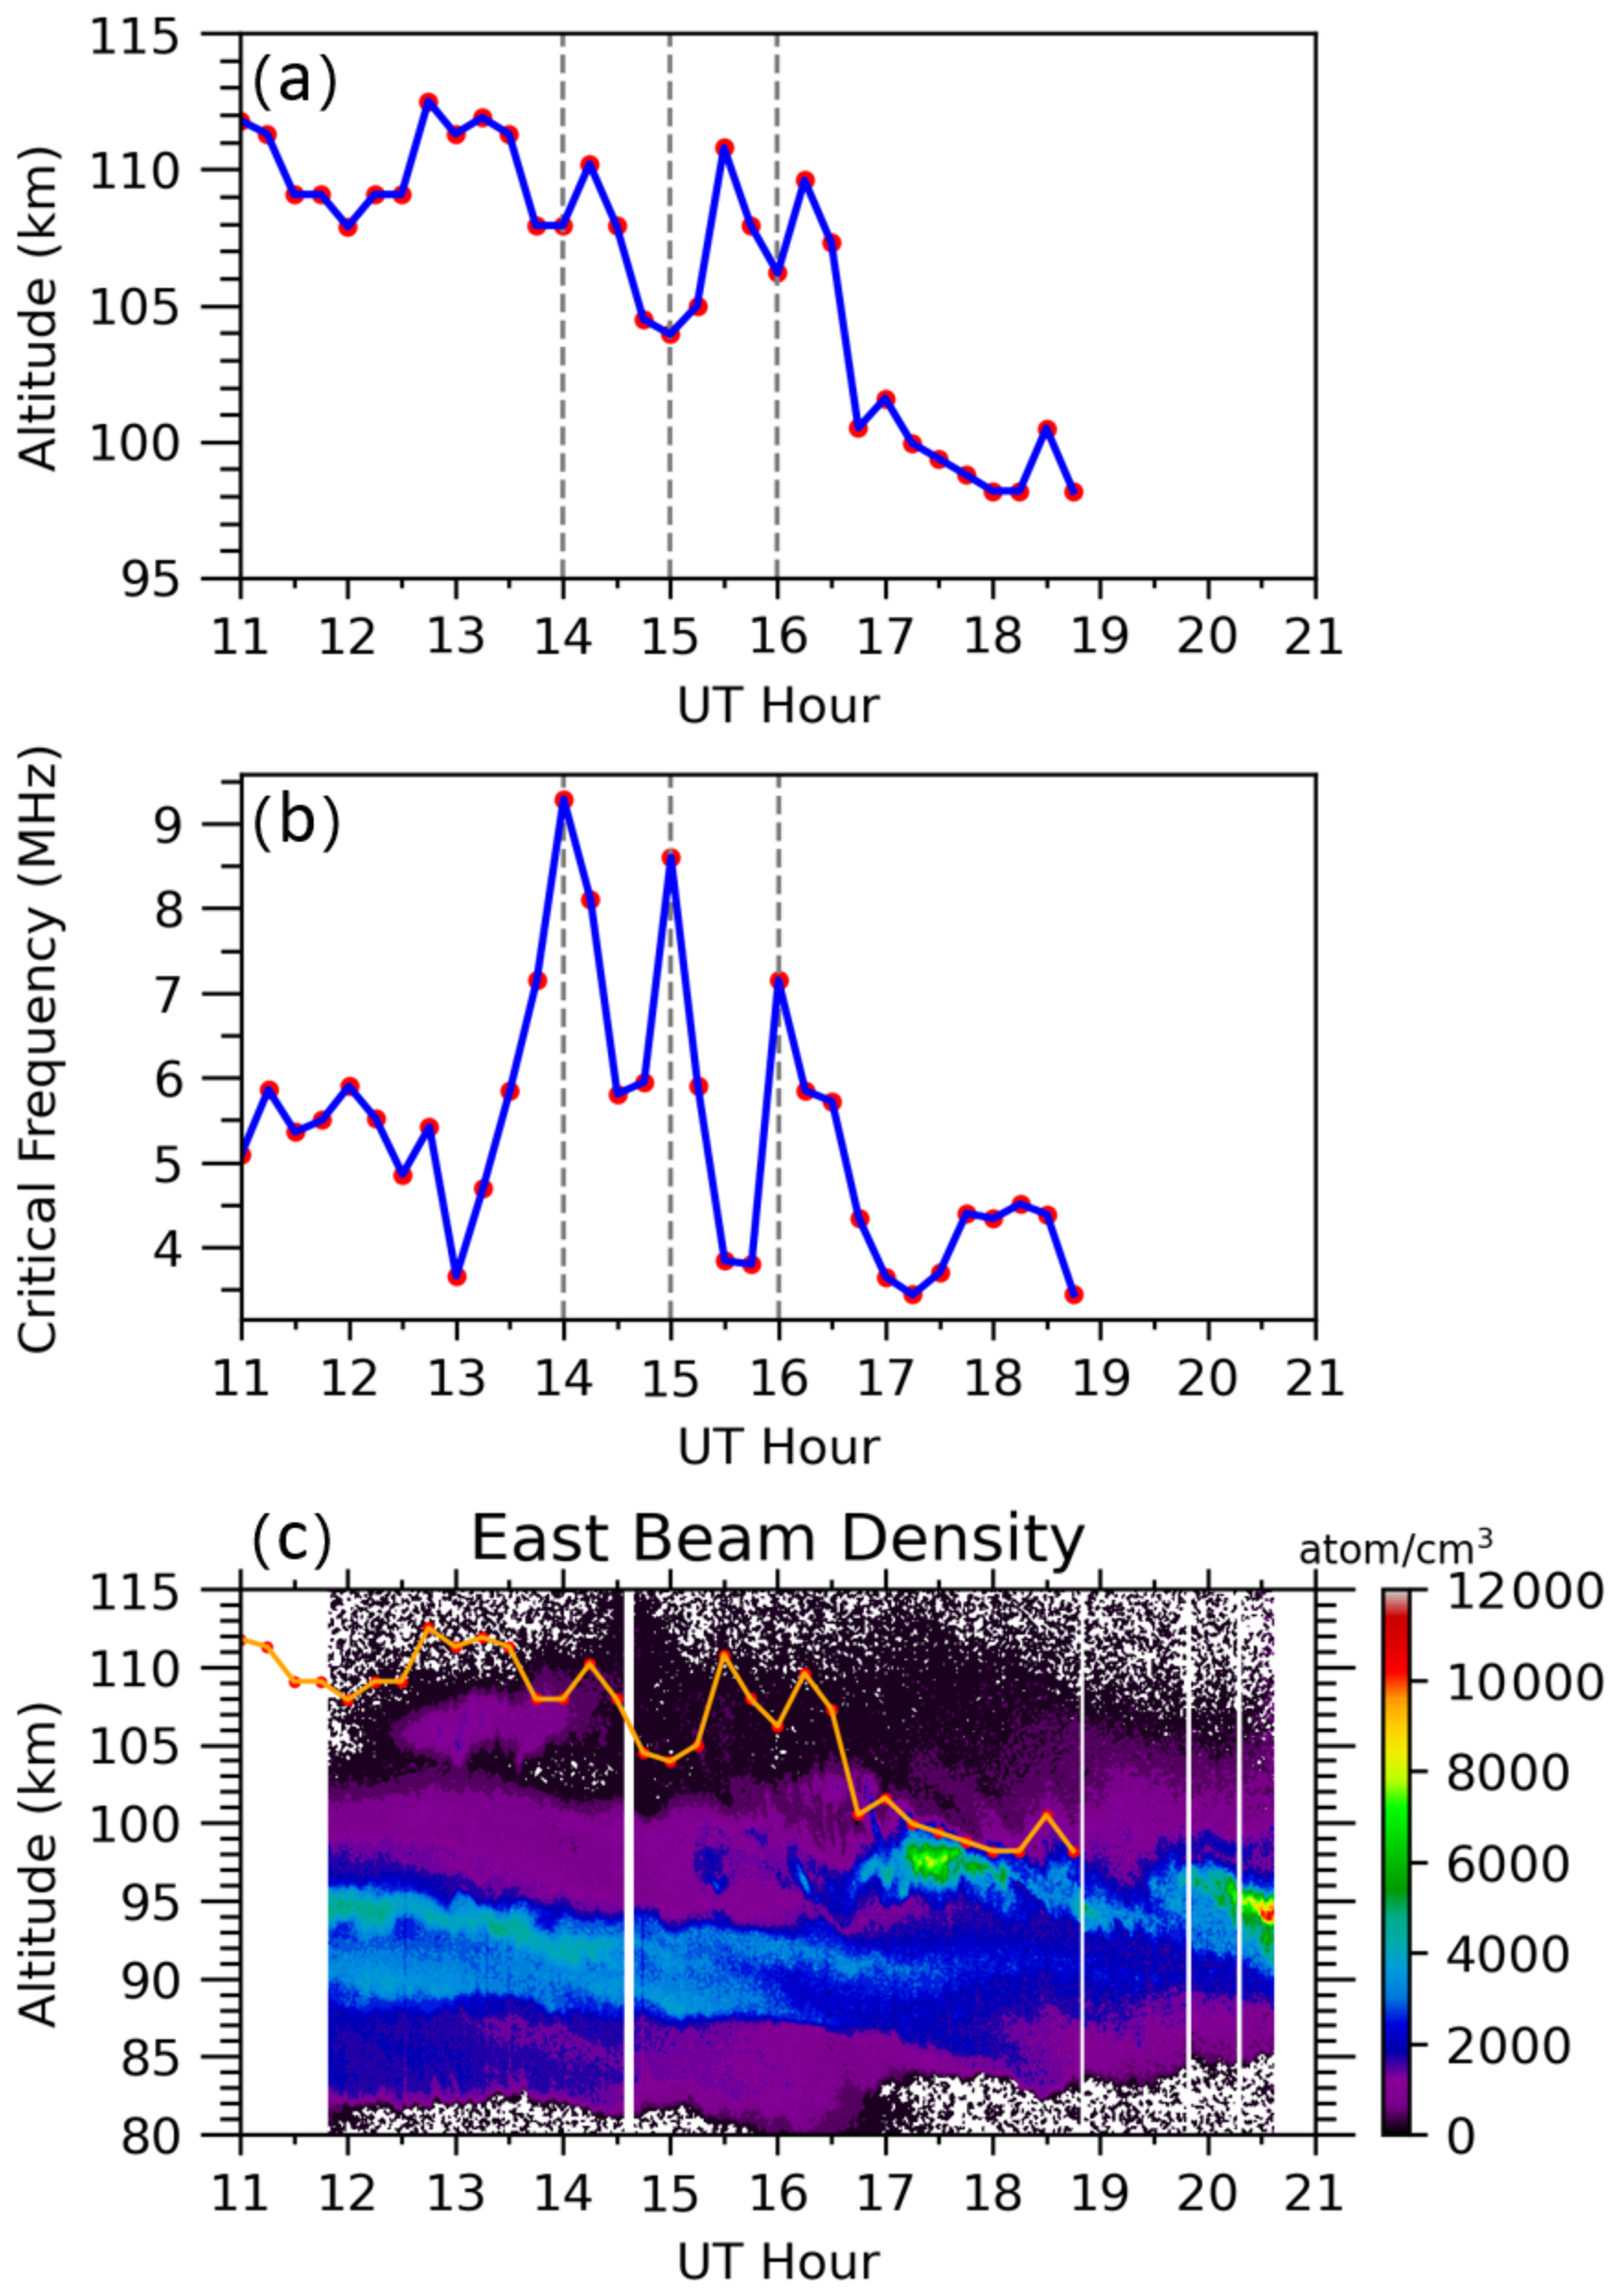
Figure 6(a) Height and (b) critical frequency of the Es layer measured by the Wuhan ionosonde between 11:00 and 21:00 UT on 13 June 2013. Red dots indicate individual measurements. (c) Height variation of the Es layer (orange line) overlaid on the time–height contour of sodium density from the east beam. The dashed lines in (a) and (b) indicate gravity-wave perturbations in the Es layer.
During the first stage (11:00–14:00 UT), the Es layer appeared at 11:00 UT and an altitude of 112 km with a critical frequency of approximately 5.0 MHz. It descended to 108 km at 12:00 UT and then ascended back to 112 km at 13:30 UT, with an average upward velocity of ∼0.7 m s−1. During this ascending phase, SSL1 exhibited a temporal evolution consistent with that of the Es layer, showing clear upward motion with a velocity of ∼0.6 m s−1 (Fig. 6c). The altitude of SSL1 was about 2–3 km lower than that of the Es layer. During this stage, the maximum foEs reached 9.3 MHz, corresponding to the electron density comparable to that reported in Xue et al. (2017). Their chemical modeling suggests that ∼30 min are required to produce sodium densities of ∼1000 cm−3, consistent with the observed growth timescale of SSL1. The close spatiotemporal correspondence between SSL1 and the Es layer, together with the compatible chemical timescale, indicates that the Es layer may have contributed to the formation of SSL1.
During the second stage (14:00–16:15 UT), the Es layer altitude fluctuated between 103 and 110 km, accompanied with variations of the foEs. An anti-correlation between h′Es and foEs was observed: when the Es layer rose to higher altitudes (e.g., 14:30 and 15:30 UT), its foEs decreased, whereas when it descended to lower altitudes (e.g., 14:00, 15:00, and 16:00 UT), its foEs increased. Such quasi-periodic variations suggest that the Es layer during this period was likely modulated by gravity waves with a period of approximately one hour. Similarly, as shown in Fig. 6c, ESP1 and ESP2 exhibit wave-like structures with a period of about 50 min, which is very close to the oscillation period observed in the Es layer. Furthermore, based on the temporal variation of the Es layer altitude, the phase velocities of the Es structures during 14:15–14:45 and 15:30–16:00 UT are estimated to be approximately 3 m s−1. This value is very close to the phase velocity of ESP1 and ESP2 (∼3.3 m s−1) derived from Fig. 5a.
During the third stage (16:15–21:00 UT), the Es layer rapidly descended from 110–100 km between 16:15 and 16:45 UT. It then remained at relatively low altitudes () from 16:45–18:15 UT, with foEs ranging from . As shown in Fig. 6c, SSL2, located below the Es layer, exhibited structural characteristics consistent with those of the Es layer, including similar duration and downward motion progression. This correspondence suggests that SSL2 was closely related to the Es layer.
These results indicate that although SSL1 and SSL2 exhibit different phase velocities and peak densities, both were likely generated by Es layer processes. In contrast, SSL3 represents a different case. Although it was the strongest SSL observed during this night, no corresponding Es layer was detected during its occurrence. This suggests that SSL3 may be associated with other mechanisms, such as neutral dynamical processes related to strong tidal activity (e.g., Clemesha et al., 1996), as indicated by the large tidal amplitudes in Fig. 1d. Overall, the complex variability of sodium density observed on 13 June 2013 is primarily linked to Es-layer processes.
5.1 Direct horizontal transport of sodium layer structures
Using the dual-beam sodium lidar at USTC, with SSL and ESP structures serving as tracers, clear horizontal transport processes in the sodium layer were observed. Table 1 summarizes the transport characteristics of two SSLs and three ESPs, excluding SSL1. SSL1 is excluded because its transport pattern is difficult to define, and it occurred above 100 km, where lidar-derived zonal winds have large uncertainty and corresponding meridional wind measurements from the meteor radar are unavailable. All wind values presented below and in Table 1 are averaged over the temporal and altitude ranges of each SSL and ESP event. As shown in Table 1, four of the five structures (SSL2 and three ESPs) propagated from east to west. During these events, the zonal winds were also westward, with magnitudes generally exceeding 30 m s−1. In contrast, during the occurrence of SSL3, the zonal wind reversed to an eastward direction, and SSL3 propagated from west to east, opposite to the other four events.
Table 1Characteristics of the Propagating SSLs and ESPs.
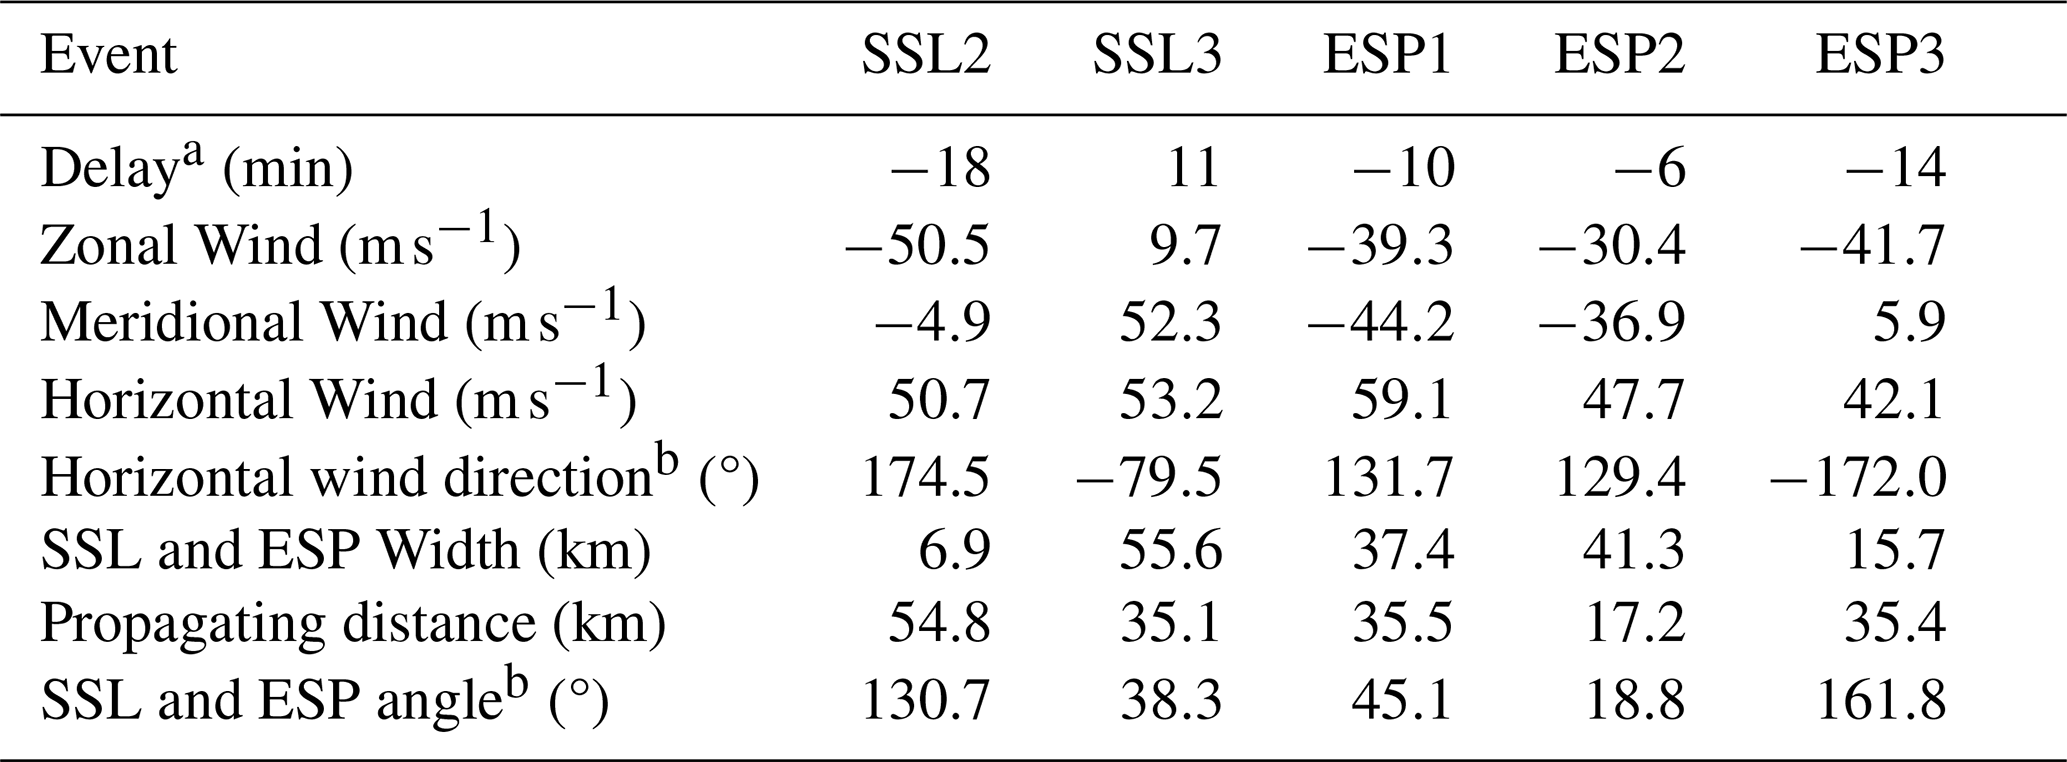
a Positive (negative) delay indicates that the structure appears first in the west (east) beam.
b Angles are referenced to eastward (0°), with positive values defined clockwise and negative values counterclockwise.
To further quantify the propagation characteristics of SSLs and ESPs, the zonal wind from sodium lidar and the meridional wind measurements from the Wuhan meteor radar were combined following the method proposed by Ban et al. (2015). SSL3 is used as an example to illustrate the horizontal transport process (Fig. 7). In Fig. 7, the two lidar beams, separated by ∼50 km at an altitude of 98 km, are shown as red points. During the SSL3 event, the zonal and meridional winds were 9.7 and 52.3 m s−1, respectively. The solid black arrow indicates the horizontal wind vector. Assuming that the front of SSL3 can be approximated as a straight line, the time delay between the beams can be used to estimate the minimum horizontal scale of the event, the propagation distance along the wind vector, and the front orientation angle. For SSL3, the front orientation angle is approximately 38.3° south of east, and the propagation distance along the wind vector is about 35.1 km. The horizontal scale of this SSL is therefore estimated to exceed 55.6 km.
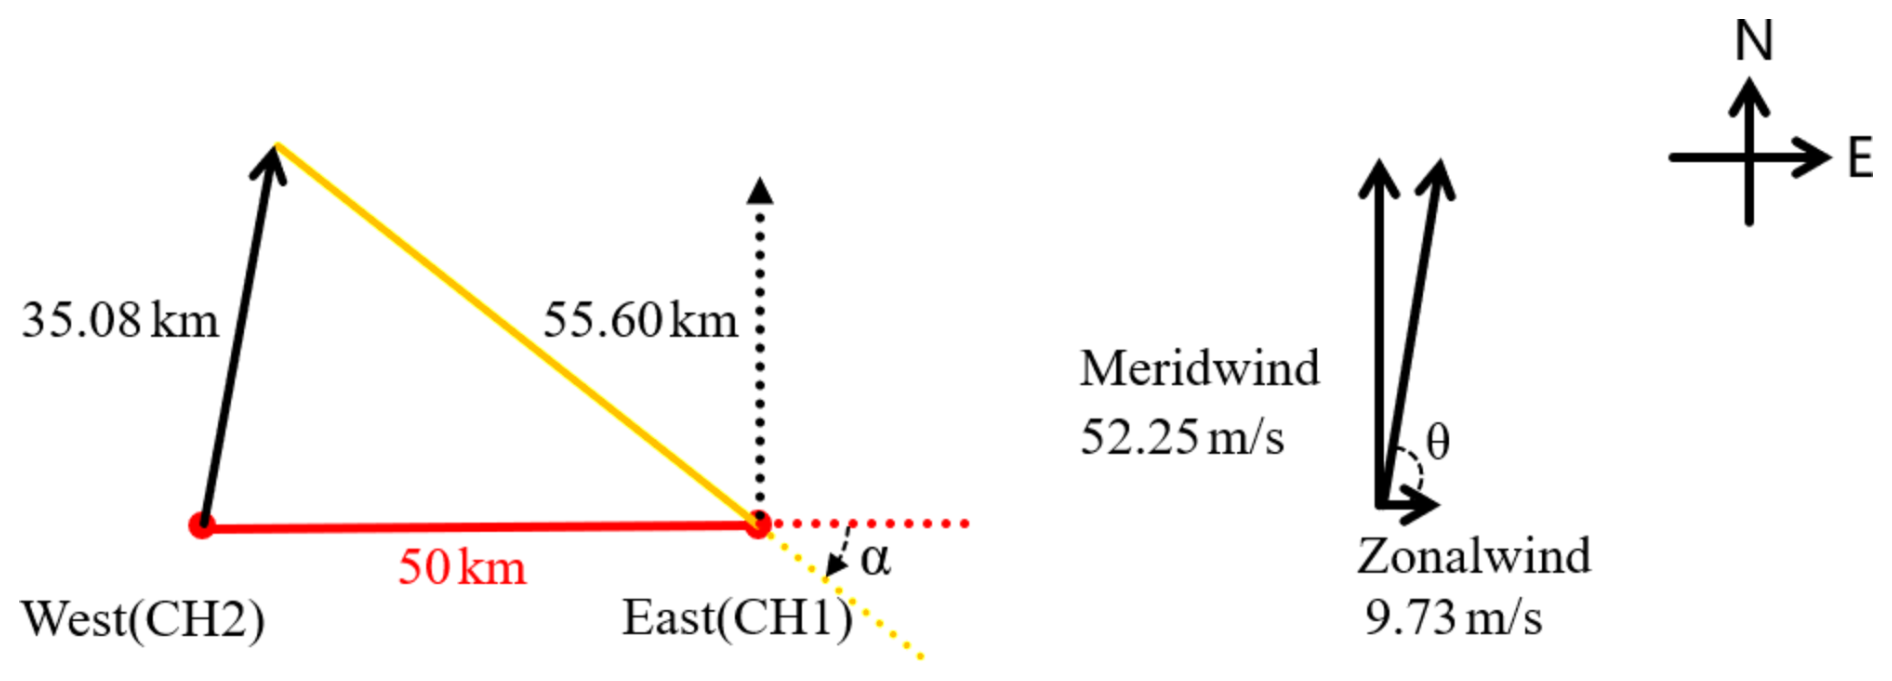
Figure 7Schematic diagram of the SSL3 event. The red line indicates a 50 km separation between the two beams in the mesopause region. The solid black line represents the horizontal wind vector, and the yellow line represents the horizontal extent of the SSL.
Applying the same method to SSL2 and the ESPs, the minimum horizontal scales, propagation distances, and propagation angles of the structures are derived and summarized in Table 1. For SSL2 and ESP3, the zonal wind is approximately an order of magnitude stronger than the meridional wind, indicating that transport is dominated by the zonal component. In these cases, structures with horizontal scales of less than ∼20 km can still be detected by both beams. In contrast, when the zonal wind is comparable to or weaker than the meridional wind, larger horizontal scales are required for simultaneous detection. Under the present beam configuration, the estimated horizontal scales generally exceed ∼35 km, consistent with previous observations (Ban et al., 2015).
5.2 Horizontal wind effects on Es layer
In the MLT region over Hefei, the background wind is strongly influenced by atmospheric tides, as shown by long-term lidar observations (Li et al., 2018). To examine the relationship between the Es layer and horizontal winds, meteor radar data from Wuhan on 13 June 2013 were analyzed to extract the diurnal and semidiurnal tidal components (Fig. 8). The results show that the zonal wind is characterized by pronounced diurnal and semidiurnal tidal components with comparable amplitudes, with the diurnal tide being slightly stronger. Using the fitted tidal parameters shown in Fig. 8, Fig. 9 presents the reconstructed zonal wind between 11:00 and 21:00 UT, overlaid with the observed Es layer altitude (solid orange line). When small-scale fluctuations in Es height are ignored, the overall downward phase progression of the Es layer closely matches that of the reconstructed zonal wind. For reference, the Es altitude shifted downward by 10 km is also shown (dashed orange line), which follows the zero-wind region of the reconstructed wind field. These results suggest that tidal wind may influence the evolution of the Es layer.
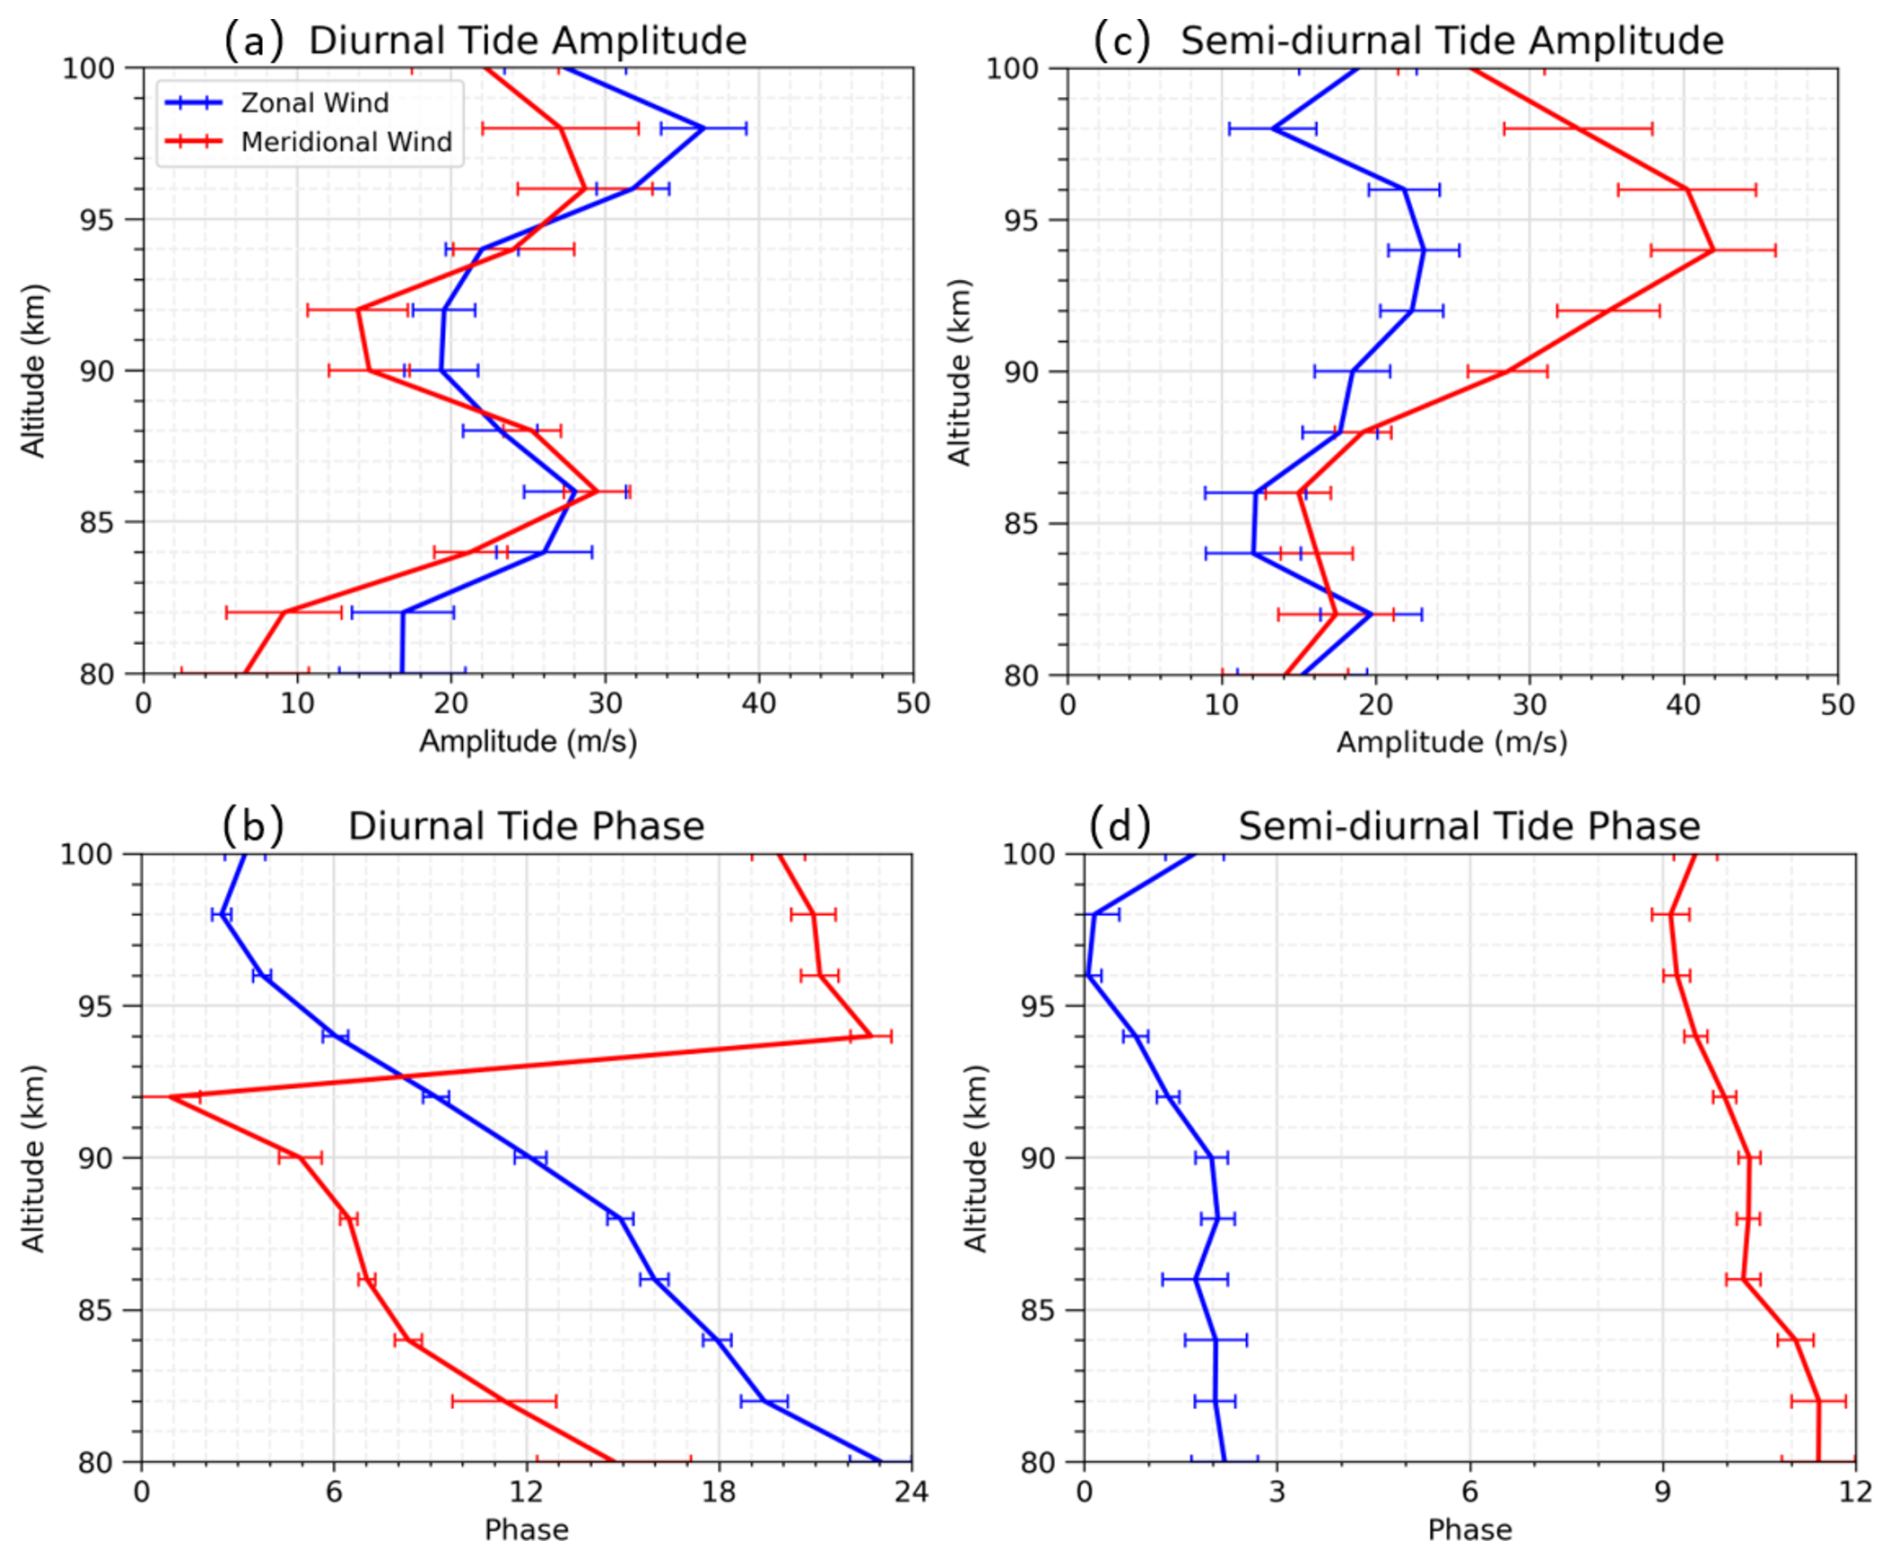
Figure 8Height profiles of (a) amplitude and (b) phase of the diurnal tidal component, and (c) amplitude and (d) phase of the semidiurnal tidal component, derived from wind observations by the Wuhan meteor radar on 13 June 2013. Blue and red lines represent results fitted from the zonal and meridional winds, respectively. Horizontal bars indicate the fitting uncertainties.
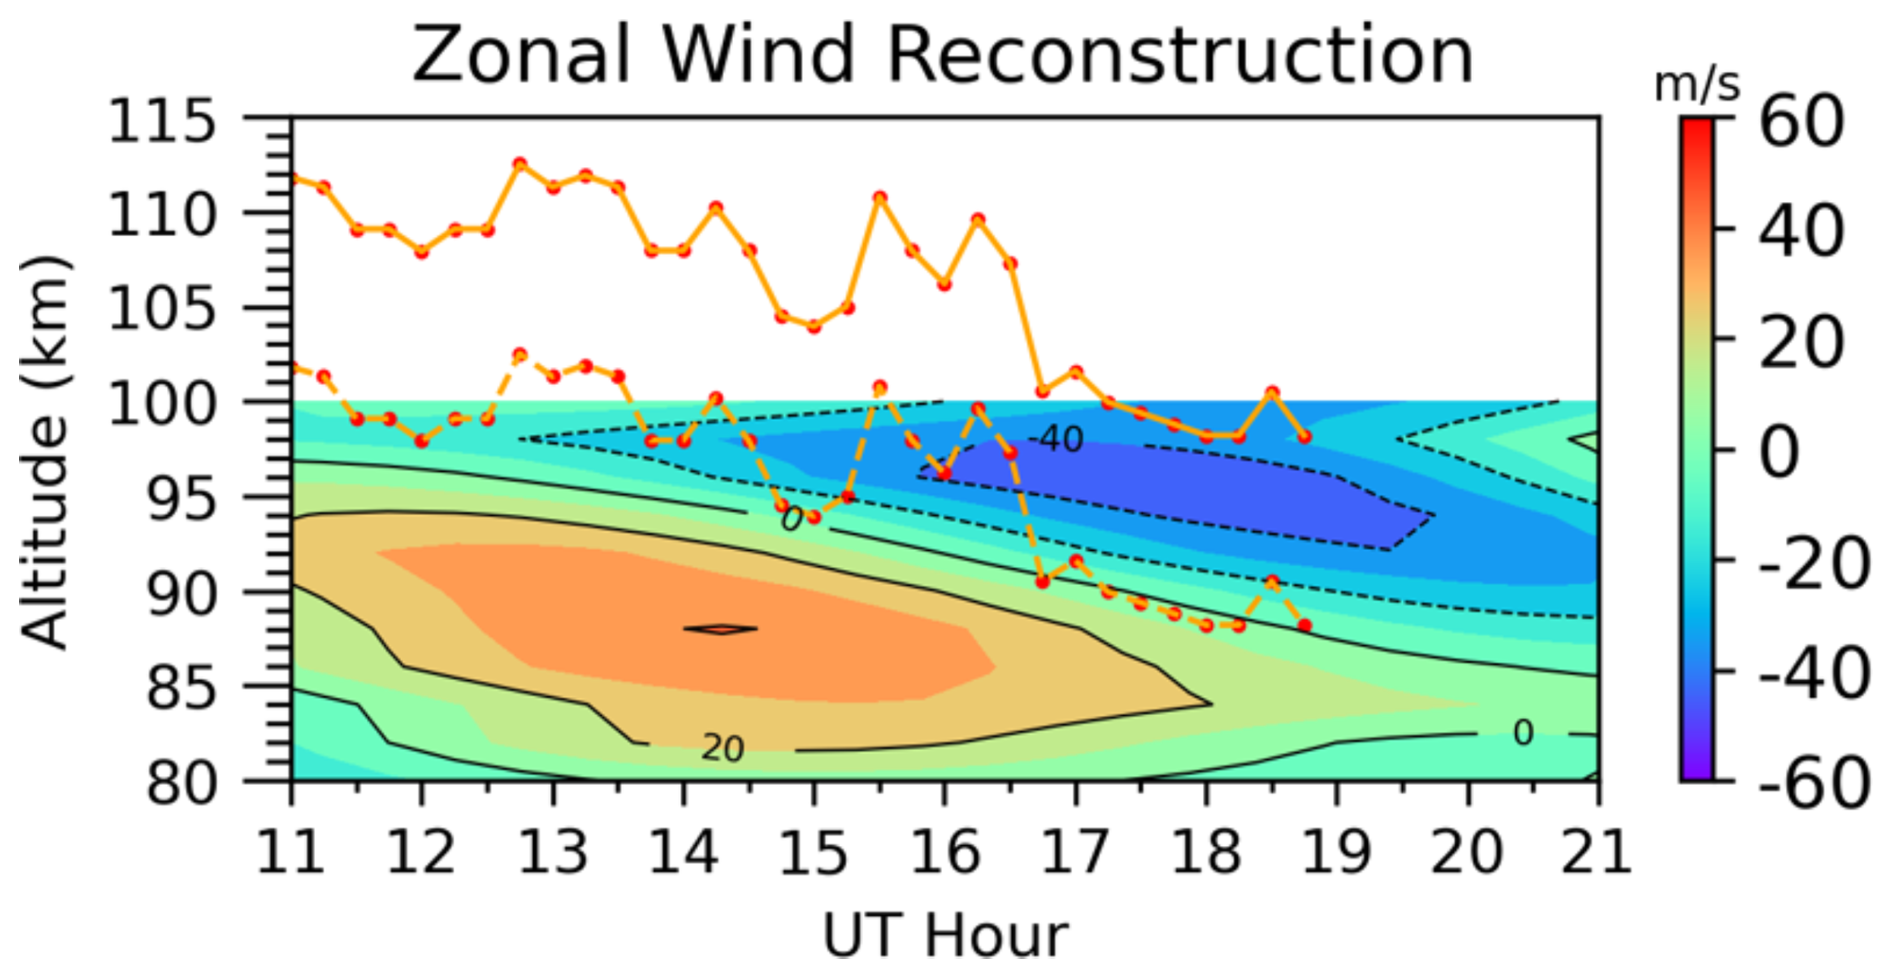
Figure 9Zonal wind reconstruction uses the fitted diurnal and semidiurnal tidal parameters derived from the Wuhan meteor radar. The solid orange line denotes the altitude variation of the Es layer measured by the Wuhan ionosonde, while the dashed orange line represents the solid orange line shifted downward by 10 km for visual comparison only.
To further examine the role of horizontal winds in ion dynamics, ignoring the electric field force and the pressure gradient force, the ion vertical drift induced by neutral wind can be expressed as below (Kirkwood and Nilsson, 2000):
where U, V, and W are zonal, meridional, and vertical wind, respectively, I is the magnetic dip angle (47.9° at Hefei), and ri is the ratio of the ion-neutral collision frequency to the ion gyrofrequency. Below ∼110 km over Hefei, the ion-neutral collision frequency is much larger, resulting in the ri being much larger than 1, so the V influence can be ignored. In addition, W is one order of magnitude smaller compared with the horizontal wind. Overall, the ion vertical motion is primarily modulated by the zonal wind component below 110 km (Xue et al., 2013). Under this approximation, the vertical gradient of the ion vertical drift () can be calculated using the zonal wind observation by the USTC sodium lidar.
Figure 10 shows the vertical gradient of the ion vertical drift (). Regions of negative correspond to ion convergence, while positive indicates ion divergence. Around 12:30 UT, an ion divergence appears near 100 km, while a convergence region is located ∼5 km above. Both structures descend over time, following the progression of the tidal phase. Two ion convergence regions are identified near 104 km (14:30–15:00 UT) and 105 km (16:00 UT), corresponding to perturbations in the Es layer, with foEs reaching 8.6 MHz at 104 km (15:00 UT) and 7.2 MHz at 106 km (16:00 UT), where ion accumulation is enhanced. A more pronounced transition occurs near 17:00 UT, when the divergence region near 98 km weakens and changes into a convergence region, while a new divergence region forms near 103 km. This transition coincides with the rapid downward descent of the Es layer from 110–100 km at 16:45 UT. After 17:00 UT, the region between 90 and 102 km is dominated by ion convergence, while the divergence region remains above ∼100 km. During this period, the Es layer is confined to altitudes of 97–100 km and does not return to higher altitudes. The temporal and vertical evolution of the Es layer is therefore consistent with the variations in the ion convergence regions.
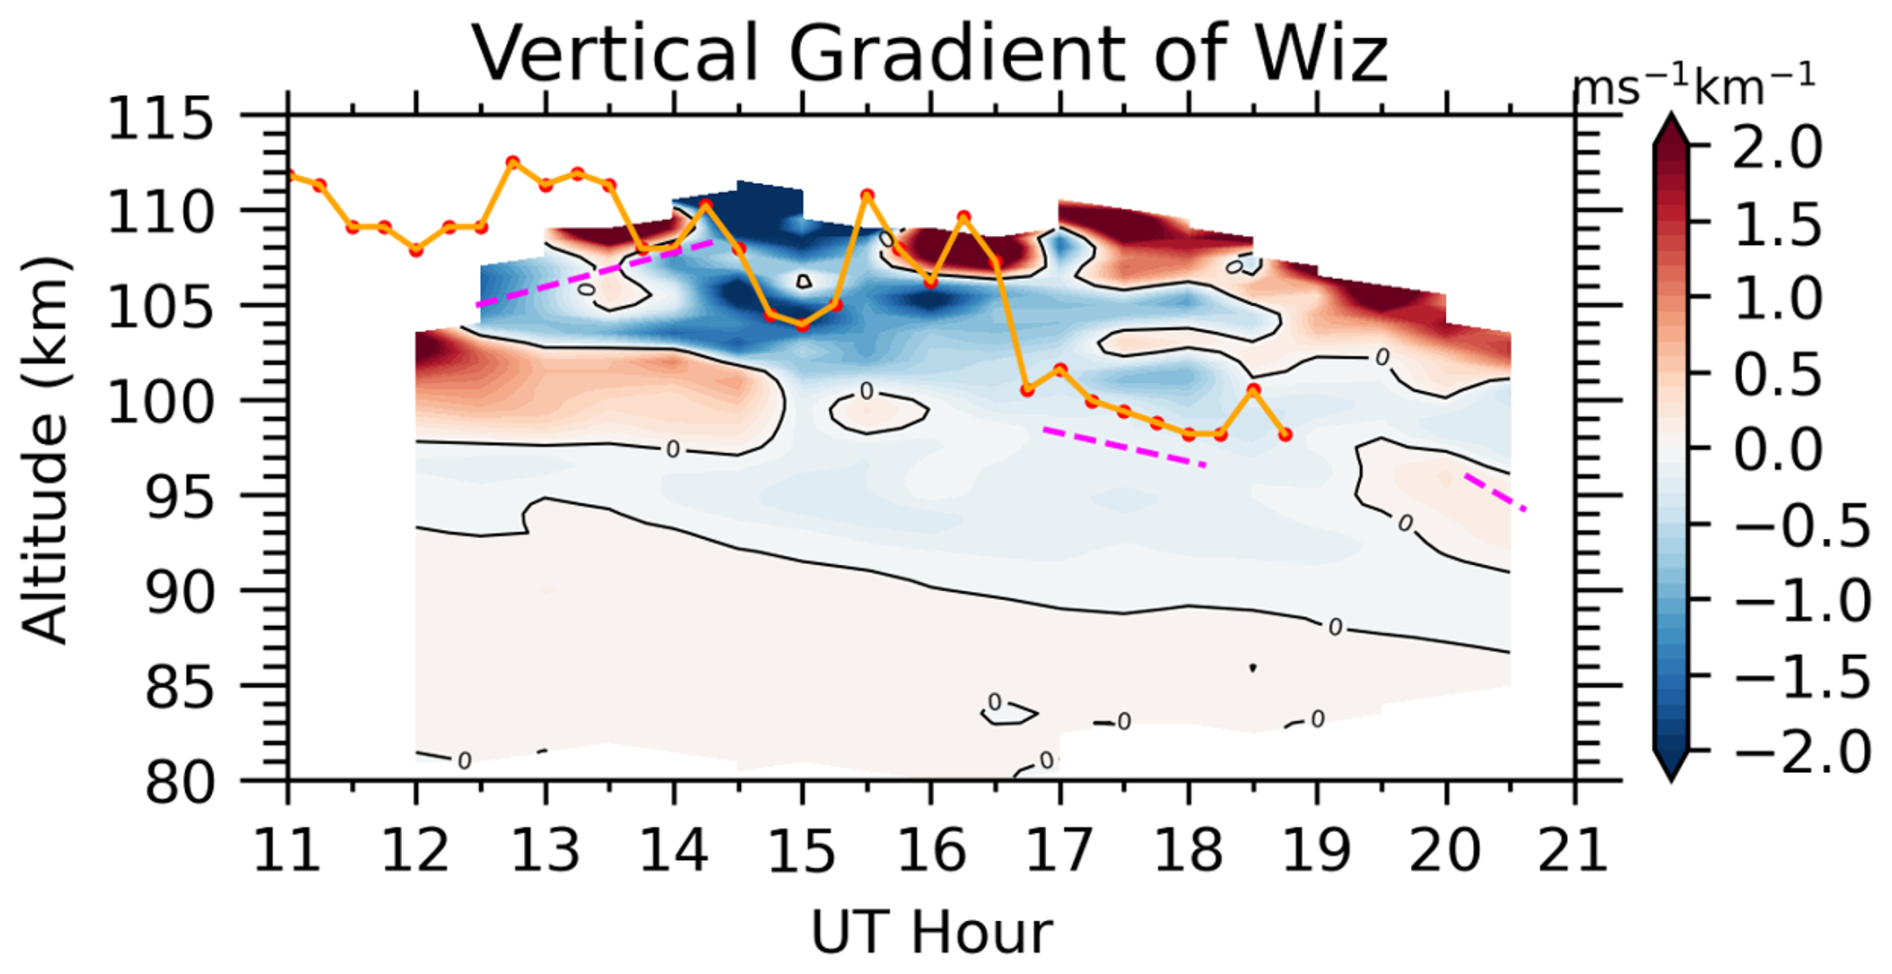
Figure 10Time–height contour of vertical gradient of ion vertical drift derived from zonal wind measured by the USTC sodium lidar on 13 June 2013. Cold colors indicate negative (ion convergence region), while warm colors indicate positive (ion divergence region). The orange line denotes the altitude variation of the Es layer measured by the Wuhan ionosondes, and the dashed purple lines indicate the trajectories of the SSLs.
The observations on 13 June 2013 reveal pronounced and multi-scale variability in the sodium layer, characterized by multiple SSLs and ESPs with distinct dynamical behaviors. These structures provide an opportunity to examine the relative roles of neutral dynamics and ionospheric processes in the MLT region. The observations presented above indicate that horizontal winds play an important role in shaping sodium layer variability through two coupled pathways: (1) direct transport of sodium layer structures and (2) indirect modulation via ion–neutral coupling associated with Es layers.
First, horizontal winds directly control the transport of sodium layer structures. Early lidar observations showed that 12 SSL events exhibit horizontal motion (Batista et al., 1991), and subsequent studies demonstrated that these structures tend to follow the background wind (Ban et al., 2015; Tsuda et al., 2015; Chen et al., 2021). Most previous studies, however, focused on individual events. In this study, two SSLs and three ESPs are observed at different times, collectively spanning nearly the entire night. Their zonal propagation directions are consistent with the observed zonal winds. In particular, the transition from ESP3 to SSL3 provides a clear example: following the reversal of the zonal wind, the propagation directions of ESP3 and SSL3 also reversed, indicating a rapid, direct response of sodium-layer structures to changes in the background wind. These results demonstrate that horizontal winds exert a direct and persistent influence on the transport of sodium layer structures.
Beyond direct transport, horizontal winds also influence sodium density indirectly through ion–neutral coupling processes. Horizontal wind shear can lead to the convergence of long-lived metallic ions and contribute to the formation of Es layers (Clemesha et al., 1978; Haldoupis, 2011; Wu et al., 2021). Meteor radar observations show that the zonal wind during this night is dominated by diurnal and semidiurnal tidal components. The downward phase progression of the Es layer is consistent with that of the tidal wind, suggesting that tidal forcing modulates the vertical evolution of the ion distribution, in agreement with previous studies (Haldoupis et al., 2004, 2006; Zhou et al., 2017; Qiu et al., 2021). The observed changes in the Es layer are closely associated with variations in the ion vertical drift gradient (Fig. 10), including the rapid descent of the Es layer at 16:45 UT and its subsequent confinement below ∼100 km. Such behavior reflects the role of wind-driven ion convergence and divergence in regulating ion distribution. In addition, most SSLs observed by the sodium lidar are located within ion convergence regions (Fig. 10). Consequently, regions of ion convergence enhance ion-neutral chemical reactions, promoting the production of neutral sodium atoms and contributing to the formation of SSLs and ESPs.
Furthermore, the wave-like features of ESP1 and ESP2 (Fig. 5a), with periods of ∼50–60 min, suggest modulation by atmospheric gravity waves, consistent with Cai et al. (2017). The Es altitude and foEs between 13:30 and 16:00 UT also exhibit similar quasi-periodic variations with a period of ∼1 h (Fig. 6a and b), accompanied by ion convergence regions near ∼104–105 km (Fig. 10), where enhanced ion accumulation contributes to the observed increases in foEs. Gravity waves propagating through the MLT region can perturb neutral winds, thereby generating vertical shear in ion velocities and modulating ion convergence and divergence (Haldoupis, 2011). Recent observations by Wang et al. (2026), using incoherent scatter radar in Sanya, provide direct evidence of Es structures modulated by gravity waves. The downward phase speeds of the ESP1 and ESP2 are 3.3 m s−1, consistent with the downward phase progression of the Es layer during 14:15–14:45 and 15:30–16:00 UT.
In addition, when the Es layer descends to lower altitudes, the foEs can reach 8.6 MHz. Such strong foEs conditions are more favorable for the production of sodium atoms. However, the Es layer heights at 14:00, 15:00, and 16:00 UT ( 104, and 106 km, respectively) are about 10 km higher than those of ESP1 and ESP2, making a direct causal relationship uncertain. Two possible explanations are proposed for this discrepancy. First, previous observations have shown that Es layers can be modulated by gravity waves with vertical wavelengths of (Wang et al., 2026). Considering the horizontal separation (∼200 mi) between Wuhan and Hefei, it is hypothesized that gravity-wave-induced vertical phase variations may contribute to differences in Es-layer altitude between the two locations. Under this hypothesis, the Es layer over Hefei may occur at relatively lower altitudes , where ion–neutral chemical reactions could enhance neutral sodium density and produce ESP structures. Alternatively, gravity waves may simultaneously modulate both the sodium layer and the Es layer (Cai et al., 2017; Wang et al., 2026), resulting in coherent variations in both observations.
This study presents coordinated observations of sodium layers, horizontal winds, and Es layers in central China on 13 June 2013, revealing complex variability in the MLT region driven by coupled dynamical and ionospheric processes. The main conclusions are summarized as follows:
-
Multiple SSLs and ESPs were observed within a single night, exhibiting distinct vertical motions, horizontal propagation characteristics, and density structures. These features reflect strong multi-scale variability in the sodium layer.
-
Horizontal winds influence sodium variability through two likely pathways. First, sodium structures are directly transported by the background wind, as evidenced by the alignment between sodium propagation and zonal wind directions. Second, horizontal wind shear modulates ion distribution through ion–neutral coupling, thereby influencing Es evolution and sodium production. The Es layer exhibits a downward phase progression consistent with the tides, suggesting a possible influence of tidal variations on ion dynamics.
-
ESP1 and ESP2, together with the Es layer and associated ion convergence regions, exhibit coherent wave-like variations, suggesting a possible modulation by atmospheric gravity waves. The comparable phase speeds between the ESP and Es layer perturbations suggest a potential dynamical connection. However, the systematic altitude difference between the Es layer and ESPs suggests a more complex relationship, which may involve possible gravity wave related vertical phase variations of the Es layer and possible modulation of both the Es layer and sodium density by gravity waves.
Overall, these results demonstrate that sodium layer variability in the MLT region is controlled by both direct dynamical transport and indirect ionospheric processes. The combined effects of horizontal winds, tidal forcing, and gravity-wave-induced ion–neutral coupling may play a crucial role in shaping the structure and evolution of sodium layers.
The data presented in this manuscript are available at https://doi.org/10.57760/sciencedb.34682 and cited as Jia et al. (2026).
Conceptualization: CB, TL, and YJ; data curation: YJ and CB; formal analysis: YJ; funding acquisition: TL, CB, and CY; methodology: YJ, CB and TL; resources: TL, CB and XF; software: YJ; supervision: TL and CB; validation: YJ and CB; visualization: YJ; writing (original draft preparation): YJ and CB; writing (review and editing): YJ, CB, TL, XF, ZW, JW, WP and CY. All authors have read and agreed to the published version of the paper.
The contact author has declared that none of the authors has any competing interests.
Publisher's note: Copernicus Publications remains neutral with regard to jurisdictional claims made in the text, published maps, institutional affiliations, or any other geographical representation in this paper. The authors bear the ultimate responsibility for providing appropriate place names. Views expressed in the text are those of the authors and do not necessarily reflect the views of the publisher.
We thank the Chinese Meridian Project for the Wuhan ionosonde data and Dr. Jiangang Xiong for the Wuhan meteor radar data.
This research has been supported by the National Key Research and Development Program of China (grant no. 2022YFF0503703) and the National Natural Science Foundation of China (grant nos. 42130203, 42394121, and 42276258).
This paper was edited by John Plane and reviewed by two anonymous referees.
Ban, C., Li, T., Fang, X., Dou, X., and Xiong, J.: Sodium lidar-observed gravity wave breaking followed by an upward propagation of sporadic sodium layer over Hefei, China, J. Geophys. Res.-Space, 120, 7958–7969, https://doi.org/10.1002/2015JA021339, 2015.
Batista, P. P., Clemesha, B. R., and Simonich, D. M.: Horizontal structures in sporadic sodium layers at 23°, Geophys. Res. Lett., 18, 1027–1030, https://doi.org/10.1029/91GL00549, 1991.
Cai, X., Yuan, T., and Eccles, J. V.: A numerical investigation on tidal and gravity wave contributions to the summer time Na variations in the midlatitude E region, J. Geophys. Res.-Space, 122, 10577–10595, https://doi.org/10.1002/2016JA023764, 2017.
Chen, X., Huang, W., Ban, C., Kosch, M. J., Murphy, D. J., Hu, Z., Liu, J., He, F., Wang, R., Yang, H., and Hu, H.: Dynamic properties of a sporadic sodium layer revealed by observations over Zhongshan, Antarctica: A case study, J. Geophys. Res.-Space, 126, e2021JA029787, https://doi.org/10.1029/2021JA029787, 2021.
Clemesha, B. R.: Sporadic neutral metal layers in the mesosphere and lower thermosphere, J. Atmos. Terr. Phys., 57, 725–736, https://doi.org/10.1016/0021-9169(94)00049-T, 1995.
Clemesha, B. R., Kirchhoff, V. W. J. H., Simonich, D. M., and Takahashi, H.: Evidence of an extra-terrestrial source for the mesospheric sodium layer, Geophys. Res. Lett., 5, 873–876, https://doi.org/10.1029/GL005i010p00873, 1978.
Clemesha, B. R., Batista, P. P., and Simonich, D. M.: Formation of sporadic sodium layers, J. Geophys. Res., 101, 19701–19706, https://doi.org/10.1029/96JA00824, 1996.
Collins, S. C., Plane, J. M. C., Kelley, M. C., Wright, T. G., Soldán, P., Kane, T. J., Gerrard, A. J., Grime, B. W., Rollason, R. J., Friedman, J. S., González, S. A., Zhou, Q., Sulzer, M. P., and Tepley, C. A.: A study of the role of ion–molecule chemistry in the formation of sporadic sodium layers, J. Atmos. Sol.-Terr. Phy., 64, 845–860, https://doi.org/10.1016/S1364-6826(02)00129-3, 2002.
Cox, R. M. and Plane, J. M. C.: An ion-molecule mechanism for the formation of neutral sporadic Na layers, J. Geophys. Res., 103, 6349–6359, https://doi.org/10.1029/97JD03376, 1998.
Dou, X. K., Xue, X. H., Chen, T. D., Wan, W. X., Cheng, X. W., Li, T., Chen, C., Qiu, S., and Chen, Z. Y.: A statistical study of sporadic sodium layer observed by Sodium lidar at Hefei (31.8° N, 117.3° E), Ann. Geophys., 27, 2247–2257, https://doi.org/10.5194/angeo-27-2247-2009, 2009.
Dou, X. K., Xue, X. H., Li, T., Chen, T. D., Chen, C., and Qiu, S. C.: Possible relations between meteors, enhanced electron density layers, and sporadic sodium layers, J. Geophys. Res., 115, A06311, https://doi.org/10.1029/2009JA014575, 2010.
Fritts, D. C. and Alexander, M. J.: Gravity wave dynamics and effects in the middle atmosphere, Rev. Geophys., 41, 1003, https://doi.org/10.1029/2001RG000106, 2003.
Gardner, C. S. and Liu, A. Z.: Seasonal variations of the vertical fluxes of heat and horizontal momentum in the mesopause region at Starfire Optical Range, New Mexico, J. Geophys. Res., 112, D09113, https://doi.org/10.1029/2005JD006179, 2007.
Guo, Y., Liu, A. Z., and Gardner, C. S.: First Na lidar measurements of turbulence heat flux, thermal diffusivity, and energy dissipation rate in the mesopause region, Geophys. Res. Lett., 44, 5782–5790, https://doi.org/10.1002/2017GL073807, 2017.
Haldoupis, C.: A tutorial review on sporadic E layers, in: Aeronomy of the Earth's Atmosphere and Ionosphere, vol. 2, edited by: Abdu, M. and Pancheva, D., Springer, 381–394, https://doi.org/10.1007/978-94-007-0326-1_29, 2011.
Haldoupis, C., Pancheva, D., and Mitchell, N. J.: A study of tidal and planetary wave periodicities present in midlatitude sporadic E layers, J. Geophys. Res., 109, A02302, https://doi.org/10.1029/2003JA010253, 2004.
Haldoupis, C., Meek, C., Christakis, N., Pancheva, D., and Bourdillon, A.: Ionogram height-time-intensity observations of descending sporadic E layers at mid-latitude, J. Atmos. Sol.-Terr. Phy., 68, 539–557, https://doi.org/10.1016/j.jastp.2005.03.020, 2006.
Heinselman, C. J., Thayer, J. P., and Watkins, B. J.: A high-latitude observation of sporadic sodium and sporadic E-layer formation, Geophys. Res. Lett., 25, 3059–3062, https://doi.org/10.1029/98GL02215, 1998.
Jia, Y., Ban, C., Li, T., Fang, X., Wu, Z., Wu, J., Pan, W., and Yang, C.: Data of “Sodium Lidar observed multiple sodium layer structures and their dynamical coupling mechanism”, V1, Science Data Bank [data], https://doi.org/10.57760/sciencedb.34682, 2026.
Kane, T. J., Gardner, C. S., Zhou, Q., Mathews, J. D., and Tepley, C. A.: Lidar, radar and airglow observations of a prominent sporadic Na/sporadic E layer event at Arecibo during AIDA-89, J. Atmos. Terr. Phys., 55, 499–511, https://doi.org/10.1016/0021-9169(93)90084-C, 1993.
Kirkwood, S. and Nilsson, H.: High-latitude sporadic-E and other thin layers – The role of magnetospheric electric fields, Space Sci. Rev., 91, 579–613, https://doi.org/10.1023/A:1005241931650, 2000.
Li, T., She, C. Y., Liu, H. L., and Montgomery, M. T.: Evidence of a gravity wave breaking event and the estimation of the wave characteristics from sodium lidar observation over Fort Collins, CO (41° N, 105° W), Geophys. Res. Lett., 34, L05815, https://doi.org/10.1029/2006GL028988, 2007.
Li, T., Fang, X., Liu, W., Gu, S., and Dou, X.: Narrowband sodium lidar for the measurements of mesopause region temperature and wind, Appl. Optics, 51, 5401–5411, https://doi.org/10.1364/AO.51.005401, 2012.
Li, T., Ban, C., Fang, X., Li, J., Wu, Z., Feng, W., Plane, J. M. C., Xiong, J., Marsh, D. R., Mills, M. J., and Dou, X.: Climatology of mesopause region nocturnal temperature, zonal wind and sodium density observed by sodium lidar over Hefei, China (32° N, 117° E), Atmos. Chem. Phys., 18, 11683–11695, https://doi.org/10.5194/acp-18-11683-2018, 2018.
Li, T., Ban, C., Fang, X., Li, F., Cen, Y., Lai, D., Sun, C., Sun, L., Zhang, J., and Xu, C.: Seasonal variation in gravity wave momentum and heat fluxes in the mesopause region observed by sodium lidar, J. Geophys. Res.-Atmos., 127, e2022JD037558, https://doi.org/10.1029/2022JD037558, 2022.
Plane, J. M. C., Feng, W., and Dawkins, E. C. M.: The mesosphere and metals: Chemistry and changes, Chem. Rev., 115, 4497–4541, https://doi.org/10.1021/cr500501m, 2015.
Qiu, L., Zuo, X., Yu, T., Sun, Y., Liu, H., Sun, L., and Zhao, B.: The characteristics of summer descending sporadic E layer observed with the ionosondes in the China region, J. Geophys. Res.-Space, 126, e2020JA028729, https://doi.org/10.1029/2020JA028729, 2021.
Qiu, S., Tang, Y., Jia, M., Xue, X., Dou, X., Li, T., and Wang, Y.: A review of latitudinal characteristics of sporadic sodium layers, including new results from the Chinese Meridian Project, Earth-Sci. Rev., 162, 83–106, https://doi.org/10.1016/j.earscirev.2016.07.004, 2016.
She, C. Y. and Yu, J. R.: Simultaneous three-frequency Na lidar measurements of radial wind and temperature in the mesopause region, Geophys. Res. Lett., 21, 1771–1774, https://doi.org/10.1029/94GL01417, 1994.
She, C. Y., Liu, A. Z., Yuan, T., Yue, J., Li, T., Ban, C., and Friedman, J. S.: MLT Science Enabled by Atmospheric Lidars, in: Upper Atmosphere Dynamics and Energetics, edited by: Wang, W., Zhang, Y., and Paxton, L. J., https://doi.org/10.1002/9781119815631.ch20, 2021.
Thomas, L., Gibson, A. J., and Bhattacharyya, S. K.: Lidar observations of a horizontal variation in the atmospheric sodium layer, J. Atmos. Terr. Phys., 39, 1405–1409, https://doi.org/10.1016/0021-9169(77)90095-2, 1977.
Tsuda, T. T., Nozawa, S., Kawahara, T. D., Kawabata, T., Saito, N., Wada, S., Hall, C. M., Tsutsumi, M., Ogawa, Y., Oyama, S., Takahashi, T., Ejiri, M. K., Nishiyama, T., Nakamura, T., and Brekke, A.: A sporadic sodium layer event detected with five-directional lidar and simultaneous wind, electron density, and electric field observation at Tromsø, Norway, Geophys. Res. Lett., 42, 9190–9196, https://doi.org/10.1002/2015GL066411, 2015.
Von Zahn, U. and Hansen, T. L.: Sudden neutral sodium layers: A strong link to sporadic E layers, J. Atmos. Terr. Phys., 50, 93–104, https://doi.org/10.1016/0021-9169(88)90047-5, 1988.
Wang, J., Yue, X., Zhou, X., Cai, Y., Ding, F., Chau, J. L., Fritts, D. C., Vierinen, J., Liu, A. Z.., and Ning, B.: Direct observational evidence of the mesoscale gravity wave modulations on low-latitude sporadic E layer, Geophys. Res. Lett., 53, e2025GL121033, https://doi.org/10.1029/2025GL121033, 2026.
Wu, J., Feng, W., Liu, H.-L., Xue, X., Marsh, D. R., and Plane, J. M. C.: Self-consistent global transport of metallic ions with WACCM-X, Atmos. Chem. Phys., 21, 15619–15630, https://doi.org/10.5194/acp-21-15619-2021, 2021.
Xiong, J. G., Wan, W., Ning, B., and Liu, L.: First results of the tidal structure in the MLT revealed by Wuhan Meteor Radar (30°40′ N, 114°30′ E), J. Atmos. Sol.-Terr. Phys., 66, 675–682, https://doi.org/10.1016/j.jastp.2004.01.018, 2004.
Xue, X., Li, G., Dou, X., Yue, X., Yang, G., Chen, J., Chen, T., Ning, B., Wang, J., Wang, G., and Wan, W.: An overturning-like thermospheric Na layer and its relevance to Ionospheric field aligned irregularity and sporadic E, J. Atmos. Sol.-Terr. Phy., 162, 151–161, https://doi.org/10.1016/j.jastp.2016.12.006, 2017.
Xue, X. H., Dou, X. K., Lei, J., Chen, J. S., Ding, Z. H., Li, T., Gao, Q., Tang, W. W., Cheng, X. W., and Wei, K.: Lower thermospheric-enhanced sodium layers observed at low latitude and possible formation: Case studies, J. Geophys. Res.-Space, 118, 2409–2418, https://doi.org/10.1002/jgra.50200, 2013.
Zhou, C., Tang, Q., Song, X., Qing, H., Liu, Y., Wang, X., Gu, X., Ni, B., and Zhao, Z.: A statistical analysis of sporadic E layer occurrence in the midlatitude China region, J. Geophys. Res.-Space, 122, 3617–3631, https://doi.org/10.1002/2016JA023135, 2017.
Zhou, Q., Mathews, J. D., and Tepley, C. A.: A proposed temperature-dependent mechanism for the formation of sporadic sodium layers, J. Atmos. Terr. Phys., 55, 513–521, https://doi.org/10.1016/0021-9169(93)90085-D, 1993.
- Abstract
- Introduction
- Instrument Description and Data Analysis
- Observations of SSLs and ESPs
- Possible Source of the SSLs and ESPs
- Horizontal wind effects
- Discussion
- Conclusions
- Data availability
- Author contributions
- Competing interests
- Disclaimer
- Acknowledgements
- Financial support
- Review statement
- References
- Abstract
- Introduction
- Instrument Description and Data Analysis
- Observations of SSLs and ESPs
- Possible Source of the SSLs and ESPs
- Horizontal wind effects
- Discussion
- Conclusions
- Data availability
- Author contributions
- Competing interests
- Disclaimer
- Acknowledgements
- Financial support
- Review statement
- References