
the Creative Commons Attribution 4.0 License.
the Creative Commons Attribution 4.0 License.
 | 12 Aug 2026
Process evaluation suggests models misrepresent the precipitation-driven replenishment of cloud condensation nuclei
Sara M. Blichner
Theodore Khadir
Sini Talvinen
Paulo Artaxo
Liine Heikkinen
Harri Kokkola
Radovan Krejci
Muhammed Irfan
Twan van Noije
Tuukka Petäjä
Christopher Pöhlker
Øyvind Seland
Carl Svenhag
Antti Vartiainen
Ilona Riipinen
Accurately modeling the cloud condensation nuclei (CCN) budget is a key factor in reducing uncertainty in aerosol–cloud interactions in Earth system models. Wet deposition – the removal of particles by precipitation – is a major CCN sink, but rainfall can also trigger a replenishment phase via the formation and growth of new particles, partially offsetting losses. However, the ability of general circulation models (GCMs) to capture this precipitation-driven replenishment and size-dependent losses remains under-explored. Here, we evaluate three GCMs representation the size- and time-resolved effects of precipitation on the particle number size distribution (PNSD) and CCN budget, based on correlations between PNSD and precipitation rate along back trajectories from three long-term measurement stations. To better isolate the role of precipitation from confounding factors, we also apply a Machine Learning approach (XGBoost), training one regression model per site and source using a minimal set of physically relevant predictors. Our results show that at the two high-latitude stations, the models underestimate CCN replenishment following precipitation, with too weak new particle formation and growth. At ATTO, two of the models instead overestimate this effect, simulating an immediate CCN source after rainfall. Observations also suggest that CCN removal is weaker during colder conditions, a pattern that models struggle to capture – either overestimating or underestimating the precipitation effect, depending on the model. The XGBoost analysis confirms the key findings of the correlation analysis while helping to correct for likely confounding influences, showing promise for disentangling spurious correlations in model evaluation in process evaluation.
- Article
(10299 KB) - Full-text XML
-
Supplement
(8143 KB) - BibTeX
- EndNote


Aerosol particles in the atmosphere are vital players in both climate (Forster et al., 2021) and human health (Lelieveld et al., 2019; Schraufnagel, 2020). The climate impact is dominated by aerosol-cloud interactions, mainly through particles that act as cloud condensation nuclei (CCN) (Forster et al., 2021) and thus cooling the surface by making clouds more reflective (Twomey, 1959, 1974) and potentially longer-lived (Albrecht, 1989). Capturing the main features of the CCN budget is therefore a major concern for any climate model.
Although a fair amount of attention has been paid to evaluating model performance of the CCN source term, e.g., studying new particle formation (NPF; see e.g. Svenhag et al., 2024; Olenius and Riipinen, 2017; Roldin et al., 2019) and emissions (see e.g. Moseid et al., 2020; Blichner et al., 2024), less attention has been paid to directly evaluating the sink term. In parts, this is likely because source processes are often easier to observe with “nucleation bananas” (e.g. Kulmala et al., 2004) or emission sources that are obvious in the measurements. Model evaluations focused on sinks, e.g., via precipitation (wet deposition), on the other hand, usually report effects on the average concentration, the vertical profiles, and so on (e.g. Holopainen et al., 2020; Kipling et al., 2016).
The deposition of particles is generally separated into wet deposition and dry deposition, where wet deposition refers to removal via clouds and precipitation, while dry deposition involves the particles depositing onto the surface without the aid of precipitation. For most aerosol species and sizes, wet deposition dominates the removal processes (Textor et al., 2006; Bourgeois and Bey, 2011; Kipling et al., 2016; Emerson et al., 2018). Wet deposition is divided further into in-cloud and below-cloud scavenging. In-cloud scavenging refers to the particles taken up into cloud droplets or ice crystals – either via nucleation (acting as CCN or INP, nucleation scavenging) or via coagulation with cloud droplets or ice crystals (impaction scavenging) – and these are then lost from the atmosphere if the cloud hydrometeors end up forming precipitation which reaches the surface. Below-cloud scavenging refers to the process in which particles are scavenged by falling rain droplets and snow (below-cloud impaction scavenging).
The size dependence of the different loss processes is illustrated in Fig. 1. Nucleation scavenging is efficient for CCN sized particles in general (depending on hygroscopicity and supersaturation conditions), while in-cloud and below-cloud impaction scavenging is more efficient for particles larger or smaller than the accumulation mode: larger particles due to their greater inertia, which makes them more likely to collide with rain drops, and smaller particles due to the effect of Brownian motion, which also increases their collision probability (Greenfield, 1957; Seinfeld and Pandis, 2016).
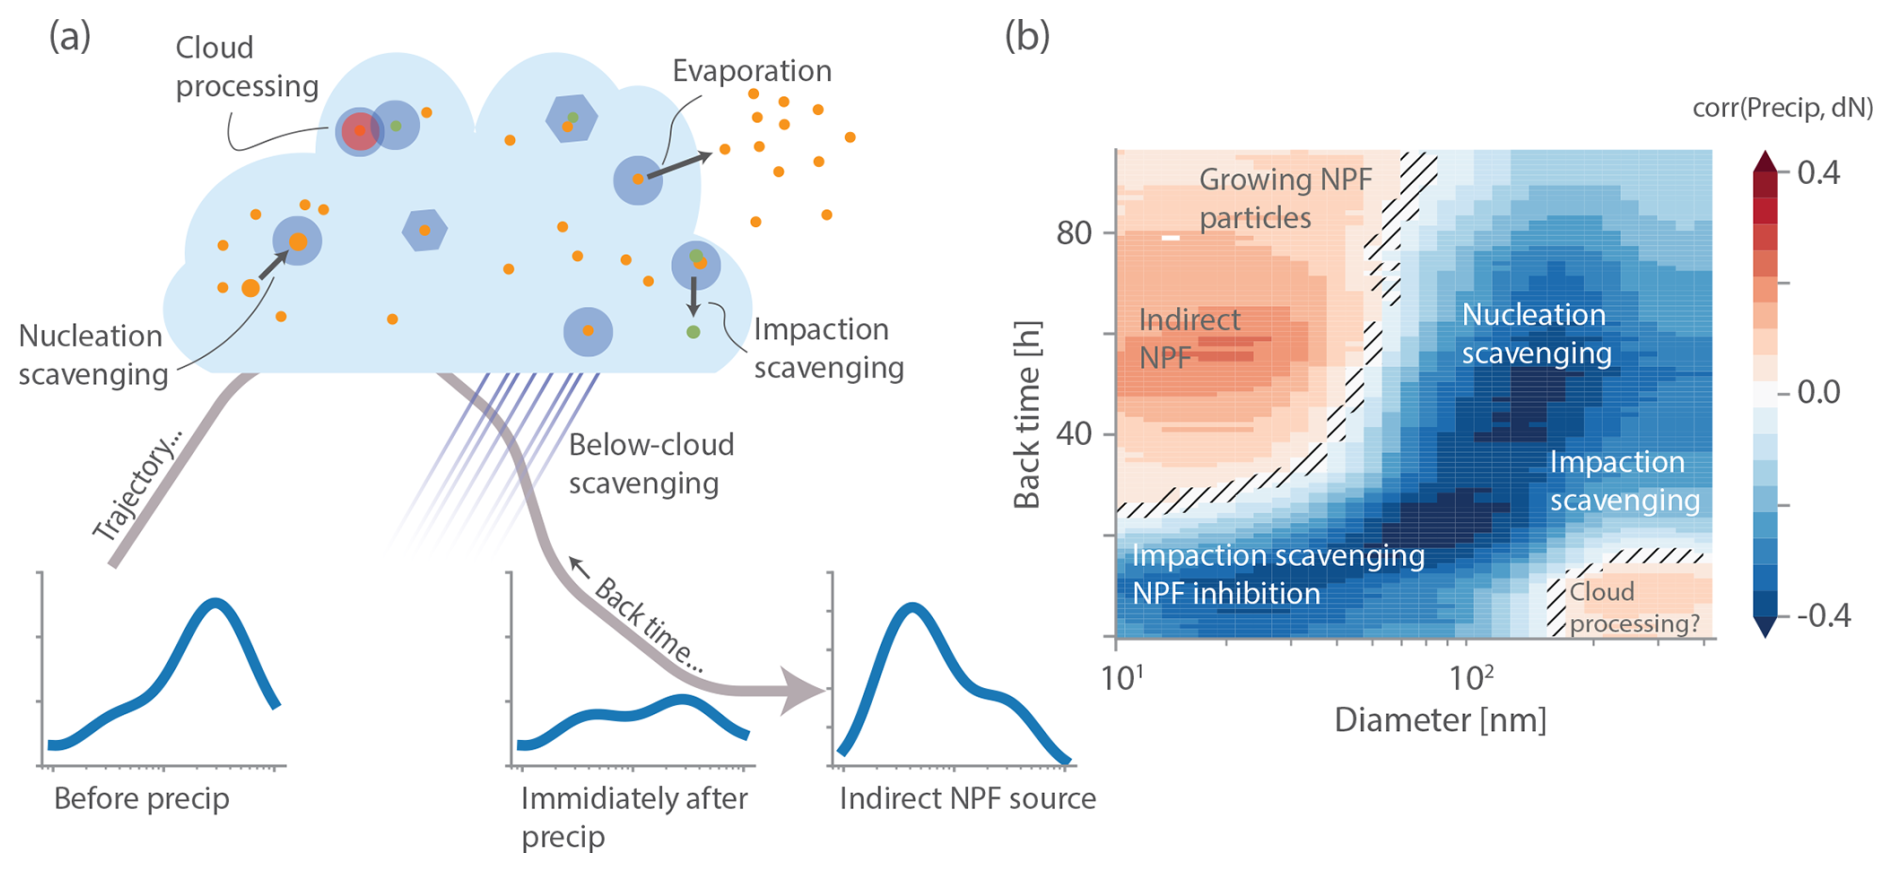
Figure 1Illustration of precipitation impact on particle number size distribution (PNSD). Panel (a) shows an illustration of the main processes and their impact on an idealized size distribution: An imagined accumulation mode dominated size distribution before the rain, is then influenced by in-cloud nucleation and impaction scavenging in addition to below cloud scavenging, reducing in particular the accumulation and coarse mode particle concentration. This primes the atmosphere for new particle formation (NPF) if precursors become available due to the low condensation/coagulation sink (indirect NPF from rain), thus creating a growing NPF and Aitken mode. Panel (b), which is an adaptation of a figure from Khadir et al. (2023), shows how these processes would be expected to show up in the correlation analysis where precipitation rates along the back trajectories at different points back in time (“back time”) are correlated with the observed size distribution at the station. Impaction scavenging (both in and below cloud) shows up strongly for the smallest and largest particles, nucleation scavenging is strongest for particles larger than the activation diameter (usually between 50–200 nm), indirect NPF shows up for less recent precipitation (40+ h back in time) and with a potentially growing mode as back time increases. Finally an observed positive correlation between recent precipitation and accumulation mode particles (bottom right corner) has been hypothesised to be related to cloud processing (Khadir, 2023) The correlation plot in (b) is from observations in Hyytiälä, during spring (MAM). The cloud illustration in (a) is inspired by Hoose et al. (2008a).
Models vary in complexity in their treatment of wet deposition. The simplest approach is to prescribe aerosol scavenging fractions for in-cloud and below-cloud scavenging separately, usually divided into aerosol type (composition and size) (e.g. Stier et al., 2005; Iversen and Seland, 2002) as well as cloud type (convective versus stratiform) and even temperature (to represent cloud phase) (see e.g. discussion in Hoose et al., 2008b). The next step of complexity used for in-cloud scavenging is to explicitly model interstitial versus cloud-borne particles based on, e.g., activation rates and coagulation and then compute wet deposition based on the precipitation production rate (see e.g. Croft et al., 2010; Hoose et al., 2008b). This can be done both diagnostically, where the cloud-borne aerosol is diagnosed in each time step based on various factors (e.g. Hoose et al., 2008a; van Noije et al., 2021), or prognostically, where the cloud-borne aerosol is additionally passed between time steps (e.g. Hoose et al., 2008a).
As mentioned above, in-cloud scavenging can be separated into nucleation and impaction scavenging. If the model uses fixed prescribed scavenging ratios, they will usually implicitly combine the two. However, for more advanced treatments, nucleation scavenging may be connected to the activation rate, and the collection of aerosols by cloud droplets and ice crystals requires a separate treatment. This can then, for example, be done by using a collection kernel for each aerosol type (mode or otherwise) or other parameterizations or look-up table approaches (Hoose et al., 2008a; Croft et al., 2010; Holopainen et al., 2020). Separate treatments are usually applied for convective clouds and stratiform clouds (Croft et al., 2010; Browse et al., 2012), especially because GCMs tend not to represent aerosol effects on cloud microphysics for convective clouds. This means that convective cloud scavenging in these clouds is usually much more simplified than in stratiform clouds.
Additionally, models can have separate treatments for how to treat ice versus liquid clouds and ice versus liquid precipitation (e.g. Seland et al., 2008; Stier et al., 2005; Croft et al., 2010; Ryu and Min, 2022; Holopainen et al., 2020). Precipitation formed via ice formation may be expected to scavenge less particles in-cloud than liquid precipitation formation. This is because while liquid precipitation is formed via collision coalescence, thus scavenging CCN from all collected cloud droplets, precipitation initiated via ice can be formed via deposition growth of a single ice crystal, sometimes at the expense of surrounding supercooled cloud droplets which will then rerelease the CCN particles (the Wegener-Bergeron-Findeisen process Bergeron, 1935; Findeisen, 1938; Wegener, 1911) (see e.g. Browse et al., 2012; Zieger et al., 2023). However, riming is likely to efficiently scavenge CCN as a result of the collection of supercooled droplets. To summarize: Warm precipitation effectively scavenges CCN, precipitation from fully glaciated clouds is likely less efficient, while mixed clouds are a challenge.
Falling rain evaporation is often ignored in GCMs in terms of its impact on aerosol transport (all scavenged aerosols are often assumed to reach the surface) (e.g. Ryu and Min, 2022; Kipling et al., 2016), but it has been explored, for example, in the EC-Earth model (de Bruine et al., 2018) and partially in HadGEM3–UKCA (Kipling et al., 2016). The goal of de Bruine et al. (2018) was to investigate the effects of the rerelease of aerosols from precipitation evaporation. They showed that including this rerelease process leads to higher aerosol concentrations in the lower atmosphere, but it was highly region- and season-dependent. In general, the effect will depend on assumptions concerning the cloud processing of the aerosols, i.e. what happens to composition and size during the cloud and precipitation formation. Kipling et al. (2016) investigated various factors and their effect on the vertical particle profiles in HadGEM3–UKCA including the effect of reevaporation and did not find that reevaporation had a large impact compared to other factors.
For in-cloud scavenging, research suggests that nucleation scavenging dominates over impaction scavenging for accumulation mode particles (Ohata et al., 2016; Moteki et al., 2012; Taylor et al., 2014; Flossmann et al., 1985; Flossmann and Wobrock, 2010). Croft et al. (2010) compared different wet deposition representations for in-cloud scavenging in ECHAM5-HAM and found that with their diagnostic representation of cloud-borne aerosol, aerosol mass was primarily scavenged by nucleation, while number was primarily scavenged by impaction (> 90 %). They also found large differences in predicted global mean aerosol mass burdens (20 %–30 %) depending on the in-cloud deposition scheme, and even larger changes in the accumulation mode number concentration (up to 50 %). Differences were found to be particularly large in areas with mixed phase and ice clouds. Ryu and Min (2022) suggest that below-cloud scavenging may be underestimated (at least in their version of WRF-Chem) based on empirical evidence from Northern China and India. Their updated model decreases the in-cloud wet scavenging fraction from 88 %–95 % to 34 %–37 % with the associated increase in below-cloud scavenging. Holopainen et al. (2020) compare the ECHAM-SALSA model with fixed prescribed scavenging coefficients with an updated, size-dependent scheme for both nucleation and in-cloud impaction scavenging. They find that the new scheme yields higher concentrations of particles larger than 100 nm and a decrease below, when compared to the fixed scavenging fractions. They explain this with more efficient impaction scavenging and less efficient nucleation scavenging as compared to the original formulation using prescribed coefficients.
Finally, uptake of particles in cloud droplets will often not result in them raining out, as most cloud droplets evaporate rather than precipitate. Pruppacher et al. (1998) estimate that an aerosol particle may go through about ten cloud cycles (activation and subsequent evaporation) during their lifetime. As cloud water acts as a reactive medium, it also has the potential to shape the properties of aerosol particles. This means that the properties of an aerosol particle that is activated to form a cloud droplet are different once the cloud water evaporates. Sulfate formation in cloud water is currently recognized as an important cloud processing pathway, significantly contributing to the global sulfate aerosol burden and the growth of CCN while also increasing their hygroscopicity (e.g. Ervens, 2015). The scavenging of interstitial particles can also cause similar effects when the particles are taken up by cloud water. In terms of cloud processing, most models only represent aqueous phase sulfate production with varying choices as to how to distribute this sulfate amongst particles (e.g. Lohmann et al., 2001).
While wet deposition is typically viewed as a sink for aerosols, Khadir et al. (2023) demonstrated that precipitation also has important indirect effects on the aerosol lifecycle. Using a lagged, trajectory-based correlation method applied to size-resolved aerosol data, the study showed that rain events act as a reset of the particle number size distribution (PNSD): by removing existing particles through wet scavenging, precipitation reduces the condensation and coagulation sinks, which creates conditions for NPF and early growth. At the same time, the cloud cover associated with rain suppresses solar radiation and photochemistry, temporarily delaying NPF. The result is a distinct interplay: rain first removes particles, but then creates post-rain conditions that favor the build-up of a new aerosol population – a “replenishment phase” that often occurs hours after rainfall. This framework highlights how precipitation influences both removal and re-formation of particles, offering a process-level interpretation of changes across the aerosol size spectrum.
NPF and subsequent particle growth remain as major uncertainties in climate models. Model estimates of their influence on CCN-relevant particle concentrations (e.g., N100) vary widely and depend strongly on how organic aerosol contributions to growth are represented (see e.g. section V in Stolzenburg et al., 2023). Some models show that NPF increases CCN concentrations (Gordon et al., 2017; Merikanto et al., 2009), while others simulate a decrease: more particles form, but fewer grow large enough (Sullivan et al., 2018; Blichner et al., 2021; Patoulias et al., 2024; Roldin et al., 2019). Observing this growth is difficult at a single station due to air mass variability and boundary layer dynamics (e.g. Hakala et al., 2019), which complicates model evaluation. However, the correlation-based approach developed by Khadir et al. (2023), offers a way to assess these processes systematically. By linking past rainfall to changes in the PNSD, it captures how precipitation resets the aerosol population and sets the stage for post-rain NPF and growth. The results of that study show a growing NPF mode after rainfall at the two high-latitude stations where NPF is frequent, Hyytiälä SMEAR-II (boreal forest) and Zeppelin (Arctic) during the relevant seasons. At the tropical ATTO site, however, the picture is different: NPF is not observed in the boundary layer (Zhu et al., 2025), but recent precipitation correlates positively with an increase in smaller particles. These likely originate from higher altitudes, where particle populations are richer in smaller sizes (Curtius et al., 2024; Andreae et al., 2018), and are likely transported into the boundary layer by downdrafts associated with precipitation (Wang et al., 2016). A competing hypothesis is that precipitation injects ozone into the boundary layer, leading to increased concentrations of oxidized biogenic volatile organic compounds, which might enhance conditions for boundary-layer NPF (Machado et al., 2024). For further discussion of NPF at the two other stations in SMEAR-II and Zeppelin, see e.g. Dada et al. (2017) and Heslin-Rees et al. (2025) respectively.
Khadir et al. (2023) further demonstrated the importance of separating aerosol sizes and the timing of precipitation to obtain a good understanding of the process. This is illustrated in Fig. 1b which shows the correlation between the PNSD measured at Hyytiälä measurement station (Finland) in spring and the precipitation rate along the back trajectories from the same station. With full resolution in both aerosol size and timing of precipitation, patterns emerge which would be overlooked if we were to, for example, look at just number, mass or accumulated precipitation.
In this study, we evaluate the time-resolved precipitation impact on the PNSD using the approach developed in Khadir et al. (2023), in three different general circulation models (GCMs) which can be run as Earth System Models (ESMs). We use nudged simulations with high temporal resolution output, combined with trajectories derived with The Hybrid Single-Particle Lagrangian Integrated Trajectory model (HYSPLIT) to produce trajectories and extract precipitation rate along the back trajectories in the models and re-analysis. This is then used to compute correlations with PNSD at the three measurement stations representing three different environments: Hyytiälä in the boreal forest, Zeppelin in the Arctic and ATTO station in the Amazon rainforest. To further investigate potential confounding factors influencing particle number size distributions (PNSD), we complement our relatively simple correlation analysis with a more flexible machine learning approach. Specifically, we employ eXtreme Gradient Boosting (XGBoost), a powerful and interpretable tree-based ensemble method known for its performance in capturing complex nonlinear relationships and interactions among predictors. By constructing separate XGBoost regression models for each data source (model outputs and observations), we aim to assess the contribution of precipitation to variations in the particle number concentrations, while also accounting for other relevant variables. We incorporate a minimal, yet representative set of meteorologically and chemically relevant predictors: precipitation rate, air mass trajectory position, time of day, and day of year. This approach allows us to further isolate and quantify the effect of rain on PNSD in a more nuanced way, and to evaluate whether modeled and observed systems respond similarly to key environmental drivers.
2.1 Model descriptions
Table 1 summarizes the treatment of wet deposition in the different models and more detailed model descriptions can be found in the Supplement, Sect. S1. All models are run with nudging (see e.g. Kooperman et al., 2012) to ERA-Interim reanalysis data from the European Centre for Medium-Range Weather Forecasts (Berrisford et al., 2011), meaning that their meteorology is forced towards that reanalysis product and hinders the model from deviating too far from it.
(Abdul-Razzak and Ghan, 2000)(Bourgeois and Bey, 2011)van Noije et al. (2021)Abdul-Razzak and Ghan (2002)Croft et al. (2010)Dana and Hales (1976); Balkanski et al. (1993)Barth et al. (2000)Croft et al. (2009)Croft et al. (2009)Croft et al. (2009)Zhang and McFarlane (1995)Tiedtke (1989)(Bechtold et al., 2014)Tiedtke (1989)Nordeng (1994)Table 1Comparison of wet deposition and scavenging processes across NorESM, EC-Earth, and ECHAM-SALSA.

2.1.1 General descriptions
-
ECHAM-SALSA. The global aerosol-climate model ECHAM-SALSA (ECHAM6.3-HAM2.3; Schultz et al., 2018) is widely used to simulate the complex interactions between aerosols, clouds, and the broader climate system. ECHAM-SALSA consists of the general circulation model ECHAM6.3, which captures large-scale atmospheric dynamics by solving equations for divergence, temperature, surface pressure, and vorticity. ECHAM is coupled with HAM (Hamburg Aerosol Model), which is further coupled with the Sectional Aerosol module for Large Scale Applications (SALSA) which provides a size-resolved treatment of aerosol microphysics using a sectional approach (Kokkola et al., 2018; Tegen et al., 2019). ECHAM employs a spectral method for calculating the atmospheric circulation and we use the T63 spectral truncation for the horizontal grid, with 47 flexible vertical levels.
-
EC-Earth. We employ the atmosphere-only AerChem configuration of the Earth system model EC-Earth3.4, which couples a general circulation model (GCM) with an atmospheric chemistry transport model (van Noije et al., 2021, 2014). The GCM component is based on cycle 36r4 of the Integrated Forecasting System (IFS), utilizing a spectral truncation of T255 (approximately 0.7° horizontal resolution) on an N128 reduced Gaussian grid, with 91 vertical levels represented on a hybrid sigma-pressure coordinate system (Döscher et al., 2022). Atmospheric chemistry and aerosol processes are simulated using version 1.2 of the Tracer Model 5 with massively parallel (TM5-MP), which includes the M7 aerosol microphysics module (Vignati et al., 2004; Krol et al., 2005; Williams et al., 2017). TM5-MP operates on a 2° × 3° (latitude × longitude) horizontal grid and 34 hybrid sigma-pressure levels, which are derived from the same vertical structure used in IFS. Precipitation fields for calculating wet deposition in TM5 are received from the IFS model with a coupling time of 6 h.
-
NorESM. The Norwegian Earth System model version 2 (NorESM2 Bentsen et al., 2013; Kirkevåg et al., 2013; Iversen et al., 2013) is based on the Community Earth System Model (CESM Danabasoglu et al., 2020), but features a different ocean model – the Bergen Layered Ocean Model (BLOM) – along with significant modifications to the atmospheric component, including a distinct chemistry and aerosol model (Seland et al., 2020). In this study sea surface temperatures and sea ice data based on the Hadley Centre Sea Ice and Sea Surface Temperature data set (HADISST, Rayner et al., 2003) as described in Hurrell et al. (2008) were read from file, so the ocean component is not in use. The atmospheric component used in NorESM, CAM6-Nor, is heavily based on the Community Atmospheric model version 6 (CAM6, see e.g Bogenschutz et al., 2018) but the aerosol scheme is replaced by OsloAero6 (described below, see also Kirkevåg et al., 2018) and it also includes improvements to the local dry and moist energy conservation, angular momentum conservation and in the computation of air-sea fluxes and deep convection.
-
Nudging. All models were nudged towards ERA-Interim reanalysis data (Berrisford et al., 2011). ECHAM-SALSA nudging was applied for surface pressure, vorticity, and divergence with relaxation times of 24, 6, and 48 h, respectively. In EC-Earth nudging was applied to the IFS model using a relaxation time of 6 h for divergence, vorticity (horizontal winds), and surface pressure. NorESM applied nudging for horizontal winds and surface pressure with a 6-hour relaxation time.
2.1.2 Wet deposition
-
In-cloud scavenging in stratiform clouds. ECHAM-SALSA and NorESM separate between in-cloud nucleation and impaction scavenging, while EC-Earth uses prescribed mode-dependent svanging fractions for both combined following Croft et al. (2010) with coefficients from Stier et al. (2005) for convective clouds and Bourgeois and Bey (2011) for stratiform in-cloud scavenging (see Table 2 in van Noije et al. (2021)). ECHAM-SALSA and NorESM both use the activated fraction of particles in each size class as predicted by Abdul-Razzak and Ghan (2002, 2000) for the nucleation scavenging in liquid clouds. For the impaction scavenging, both base this on coagulation rates of particles (wet diameter) with cloud droplets (assumed to be 10 µm in NorESM). ECHAM-SALSA has separate coefficients for ice crystals, assuming these are monodisperse (see Croft et al., 2010; Holopainen et al., 2020).
For stratiform clouds ECHAM-SALSA uses size dependent schemes for in-cloud nucleation scavenging detailed in Holopainen et al. (2020). For liquid phase, the in-cloud nucleation scavenging coefficients are calculated using the fraction of activated particles in each size class using the parameterization (Abdul-Razzak and Ghan, 2002). For ice phase, size-dependent scavenging coefficients are calculated based on the surface area of each size class.
-
Convective cloud scavenging. For convective clouds, all models use fixed scavenging coefficients, see Sect. S1 for details.
-
Below cloud scavenging. NorESM follows Dana and Hales (1976); Balkanski et al. (1993) Barth et al. (as described in 2000) and uses scavenging factors per mode (see Table S1 in the Supplement) and the precipitation rate. ECHAM-SALSA and EC-Earth both use approaches based on Croft et al. (2009), but EC-Earth has pre-calculated coefficients based on a Marshall-Palmer rain droplet size distribution and precipitation rate of 1 mm h−1, while ECHAM-SALSA uses the method directly with collection efficiency calculated for each size bin (approximated as a log-normal mode) and calculated separately for stratiform and convective clouds, for rain and snow (Croft et al., 2009; Zhang et al., 2012). EC-Earth scavenging by stratiform precipitation applies a scavenging coefficient for each mode separately, and for number and mass separately (see Table 3 in van Noije et al. (2021)). This in effect shifts the size distribution, with nucleation and Aitken modes to larger sizes and accumulation and coarse to smaller (van Noije et al., 2021). For EC-Earth, below cloud scavenging by convective clouds is included in the fractions described above. For NorESM and ECHAM-SALSA, there is no difference between convective and stratiform precipitation in terms of below cloud scavenging.
-
Resuspension of aerosols when precipitation evaporates. NorESM is the only model version in this study that redistributes aerosols vertically when precipitation evaporates. In the case of evaporating precipitation, the aerosol is resuspended proportional to the evaporation rate of precipitation from the layer above and the loss of aerosols from the layer above (if some x percent of the rain evaporates, then x percent of the scavenged aerosol is re-released in the grid box below (Barth et al., 2000). ECHAM-SALSA has resuspension only if the evaporation happens in the same grid box as the precipitation formation. Resuspension has been investigated in EC-Earth in de Bruine et al. (2018), but is not used in the standard version run here.
-
Phase dependency. In ECHAM-SALSA nucleation scavenging in stratiform clouds involves the formation and growth of ice particles, which can grow to precipitation sizes and be removed and the model accounts for ice nucleation rates and defines the scavenging coefficient values based on the surface area of particles in each size class (see Holopainen et al., 2020). Also for below-cloud scavenging, the model considers the collection efficiency of raindrops and snowflakes differently. For EC-Earth, the in-cloud scavenging coefficients are phase dependent for each mode (see again Table 2 in van Noije et al., 2021). NorESM has no impact of precipitation phase.
2.2 Observations
The observational data is identical to that used in Khadir et al. (2023), and details can be found there. For the station data, we use Scanning or Differential Mobility Particle Sizer (S/DMPS) data from the three stations for the PNSD. The data is originally in hourly resolution, but is reduced to 3-hourly resolution to be comparable to the model output. The non-refractory aerosol composition data for Hyytiälä is from an Aerosol Chemical Speciation Monitor (ACSM) from Heikkinen et al. (2020), while the eBC concentrations are attained from Aethalometer measurements (Luoma et al., 2019) as described in Ranjan et al. (2025).
2.3 Re-analysis data for precipitation
For Zeppelin and Hyytiälä, we use ERA5 reanalysis data (“total_precipitation”) in 3 hourly time resolution from C3S (2018), regridded from 0.25 × 0.25 to 1 × 1° resolution in order to be more consistent with the models resolution. This differs from Khadir et al. (2023), where GDAS data was used as extracted by HYSPLIT. This change was done in order to get a cleaner comparison to the models, firstly because we use the same nearest neighbor algorithm to extract the precipitation rate and secondly because HYSPLIT truncates precipitation values close to zero to absolute zero, which was found to impact the correlations (see Figs. S19 and S20 in the Supplement). As in Khadir et al. (2023), for ATTO we use the TRMM 3B42 V7 satellite product (3-hourly time resolution, Michot et al., 2018) due to the limitations of re-analysis data in the tropical region in capturing convective precipitation. Here though, we regridd it from 0.25 × 0.25 to 1 × 1° to be more comparable to the models. For simplicity, we refer to the re-analysis and satellite product as “Observations” below.
2.4 Model data
All models used in this study provided precipitation data at 3-hourly time resolution with full spatial coverage. Aerosol particle size distribution data was also output for the model grid cell covering each station in the same time resolution, together with composition data. All simulations were performed with meteorological nudging to ERA-Interim (Berrisford et al., 2011) reanalysis data (see Sect. 2.1 for details), which ensures that the large-scale dynamics in the models are constrained by observed meteorology.
The composition data from the models used in Fig. 9 include only modes or bins below 1 µm to be comparable to the ACSM data. Note also that for EC-Earth, the sulfate only includes Accumulation mode and Nucleation mode, because the Aitken mode sulfate was unfortunately not output. However, the Accumulation mode dominates the mass signal and should correlate fairly well with the Aitken mode mass, so the error should be minor.
2.5 Trajectory analysis
We use a trajectory-based approach to investigate the relationship between precipitation and aerosol properties. Back trajectories were computed for Khadir et al. (2023) using HYSPLIT (Stein et al., 2015) and were computed at each station every hour during the PNSD measurement period. The meteorological data used to drive HYSPLIT was from the Global Data Assimilation System (GDAS1, 1° × 1° resolution; https://www.ready.noaa.gov/gdas1.php, last access: 13 April 2026). Please see Khadir et al. (2023) for details. The precipitation rate from model output, ERA5 reanalysis data (for Zeppelin and Hyytiälä) and TRMM satellite product (for ATTO) were then co-located to the trajectories with nearest-neighbour method. The approach is similar to Talvinen et al. (2025), but instead of calculating the back trajectories with the model output data – which would require internal wind fields – we assume the GDAS1 derived back trajectories have similar large-scale dynamics as ERA-Interim, to which the models are nudged. Although the nudging is not done with GDAS1 directly, previous work (Heslin-Rees et al., 2024; Isokääntä et al., 2022; Talvinen et al., 2025) has indeed shown that back trajectories computed with GDAS1 and ERA-Interim are comparable. This supports the assumption that air mass paths in the nudged model simulations are sufficiently close to those derived from GDAS1 to allow direct comparisons. As a result, model variables can be sampled along the same air mass histories as observations, enabling a consistent and physically meaningful evaluation. Note also that any uncertainty introduced by using trajectory calculated from re-analysis rather than from the native model data is likely comparable to the uncertainty introduced by using re-analysis to analyse the observations – i.e. the “real” trajectory is likely as far or further away from the re-analysis based one as the “real” model trajectory is. All aerosol size distribution data, both from observations and models, are taken from the station (observations) or the grid cell that covers the station (models).
For “observational” precipitation, we apply the same trajectory-based sampling approach using ERA5 reanalysis data for Zeppelin and Hyytiälä, and the TRMM 3B42 V7 satellite product for ATTO. The supplement Figs. S12–S18 shows a comparison between using GDAS precipitation extracted with HYSPLIT versus using the ERA5 data collocated.
To quantify the link between precipitation and particle concentrations, we calculate Spearman's rank correlation coefficients between precipitation intensity at each back-trajectory time step and the particle number concentrations in each size bin. This nonparametric metric captures monotonic relationships, making it suitable for identifying systematic increases or decreases in particle number concentration with varying precipitation intensity, even when the relationship is not linear.
2.6 XGBoost model
Correlating precipitation with particle concentrations along the trajectories is a useful diagnostic approach for evaluating model behavior. It can highlight process-level differences between models and observations, especially when interpreted through the lens of known atmospheric physics. For instance, Khadir et al. (2023) showed that features in the correlation structure can be attributed to known physical processes – such as NPF, particle growth, or wet scavenging – even when the correlation is not directly driven by precipitation itself. In this way, our physical understanding helps constrain the range of plausible drivers and potential confounders in the observed relationships.
However, separating confounders and process relationships can still be difficult, especially when dealing with many sources of data (multiple models and stations). Using correlations for model evaluation poses some risks in terms of interpretations: confounding factors may in some cases drive the correlation, and then the process under consideration may not be the one actually responsible for the observed agreement or disagreement. To complement the correlation-based analysis and account more systematically for potential confounding factors, we apply an XGBoost regression model (Chen and Guestrin, 2016) to predict particle concentrations based on a minimal set of meteorologically and chemically relevant predictors. The idea is to include core factors that may confound the results, like source regions (through trajectory position) and diurnal variability like boundary layer dynamics (through time of day).
One model is built for each data source (observations/reanalysis and models), for each station, and for each target variable. We present results for the target variables N10–30, N50–100, N100 and N200, representing different aerosol size ranges. The model is thus trained to predict these particle concentrations. The input features include:
-
6 h average trajectory position, converted to polar coordinates relative to the station and discretized to the nearest integer (i.e. r and θ for each 6 h period).
-
6 h average precipitation rate
-
Time of day at the time of the PNSD measurement
-
Day of year at the time of the PNSD measurement
The models are implemented using the Python package XGBoost (Chen and Guestrin, 2016), with squared error as the objective function, a tree method set to “hist”, learning rate of 0.1 and 300 boosting rounds. All other parameters are left at their default values, following a hyperparameter tuning described in Sect. S11.4. In Sect. S11, we show leave-one-year-out validation results to assess model generalization performance (see Fig. S39 for summary) and the feature importance is assessed using SHapley Additive exPlanations (SHAP) values (Lundberg and Lee, 2017), which provide insights into the contribution of each predictor to the model's predictions.
2.7 Definitions and terminology for the analysis
The correlation analysis is performed separately for each season to avoid seasonal influence. The seasons are defined differently for each station according to their local climate, as presented in Table 2.

Number concentrations are analyzed and presented both as full size distribution in and concentrations in size intervals. For the latter, Nx is used to signify the particle number with diameter greater than x nm, while Nx−y indicates the particle number with diameter larger than x but smaller than y nm.
3.1 Precipitation evaluation
Figure 2 shows normalized frequency of precipitation rate for the different stations. The leftmost panels shows the number of absolute zero values versus very low (below 0.05 mm h−1) values. For ATTO, note that the satellite product used for the observations has more instances of zero precipitation, fewer instances of low precipitation, and proportionally more high precipitation rates compared to the models. When averaging over 6 and 96 h (Figs. S4 and S5), the observations are very similar to NorESM and EC-Earth, while ECHAM-SALSA is on average almost half the “observed” value, independently of the choice of data source for observations.

In this study, back trajectories created with HYSPLIT are used to extract precipitation data from nudged model simulations and for the observations, the same procedure is used to extract precipitation from ERA5 reanalysis and TRMM 3B42 V7 satellite product, both of which are regridded to 1 × 1° resolution. Our approach for the observations differs from Khadir et al. (2023) in terms of the re-gridding and that Khadir et al. (2023) used HYSPLIT to extract precipitation from GDAS (relevant for Hyytiälä and Zeppelin stations). The difference between using the HYSPLIT/GDAS data and ERA5 data can be seen in Sect. S4 and shows mainly the same patterns, but a stronger signal when using the ERA5 data. The main exception to this is Zeppelin during the Haze season and Slow-build up, where HYSPLIT/GDAS gives clearer patterns and ERA5 gives less significant results. We find that the stronger correlations with ERA5 are likely due to the truncation to zero (mentioned above) done by HYSPLIT for near-zero values (see e.g. Fig. S3), because when we apply a similar truncation to the model data, the correlations also go down in magnitude (see Sect. S5). The fact that the main features are preserved with the change of dataset gives us confidence both in the methodology in general, and in the usage of the HYSPLIT trajectories to extract model data. The deviations for the cold seasons in Zeppelin give some ground to be cautious when interpreting results from these seasons.
3.2 New particle formation and early growth
In this section, we focus on seasons where NPF is known to be a relevant process in each station: For Hyytiälä, we focus on spring (Dada et al., 2017), for Zeppelin we focus on the summer season (Lee et al., 2020), and for ATTO we focus on the wet season when nucleation mode particles have been frequently observed to be injected into the boundary layer via downdrafts (Franco et al., 2022).
Figures 3–5 show the correlations between the PNSD (diameter along the x-axis) and precipitation along the back trajectories (y-axis) for the stations during the seasons mentioned above (MAM for Hyytiälä, Summer for Zeppelin and Wet season for ATTO). An example on how to interpret this type of plot is: the negative correlation e.g. for particles larger than 100 nm for precipitation rate further back in time than 30 h (i.e. the upper right quadrant in each plot) indicates that precipitation at that time before arrival at the station is consistently associated with less particles in that size range measured at the station, i.e. if it rained heavily 40 h ago, you would expect fewer particles than if it did not.
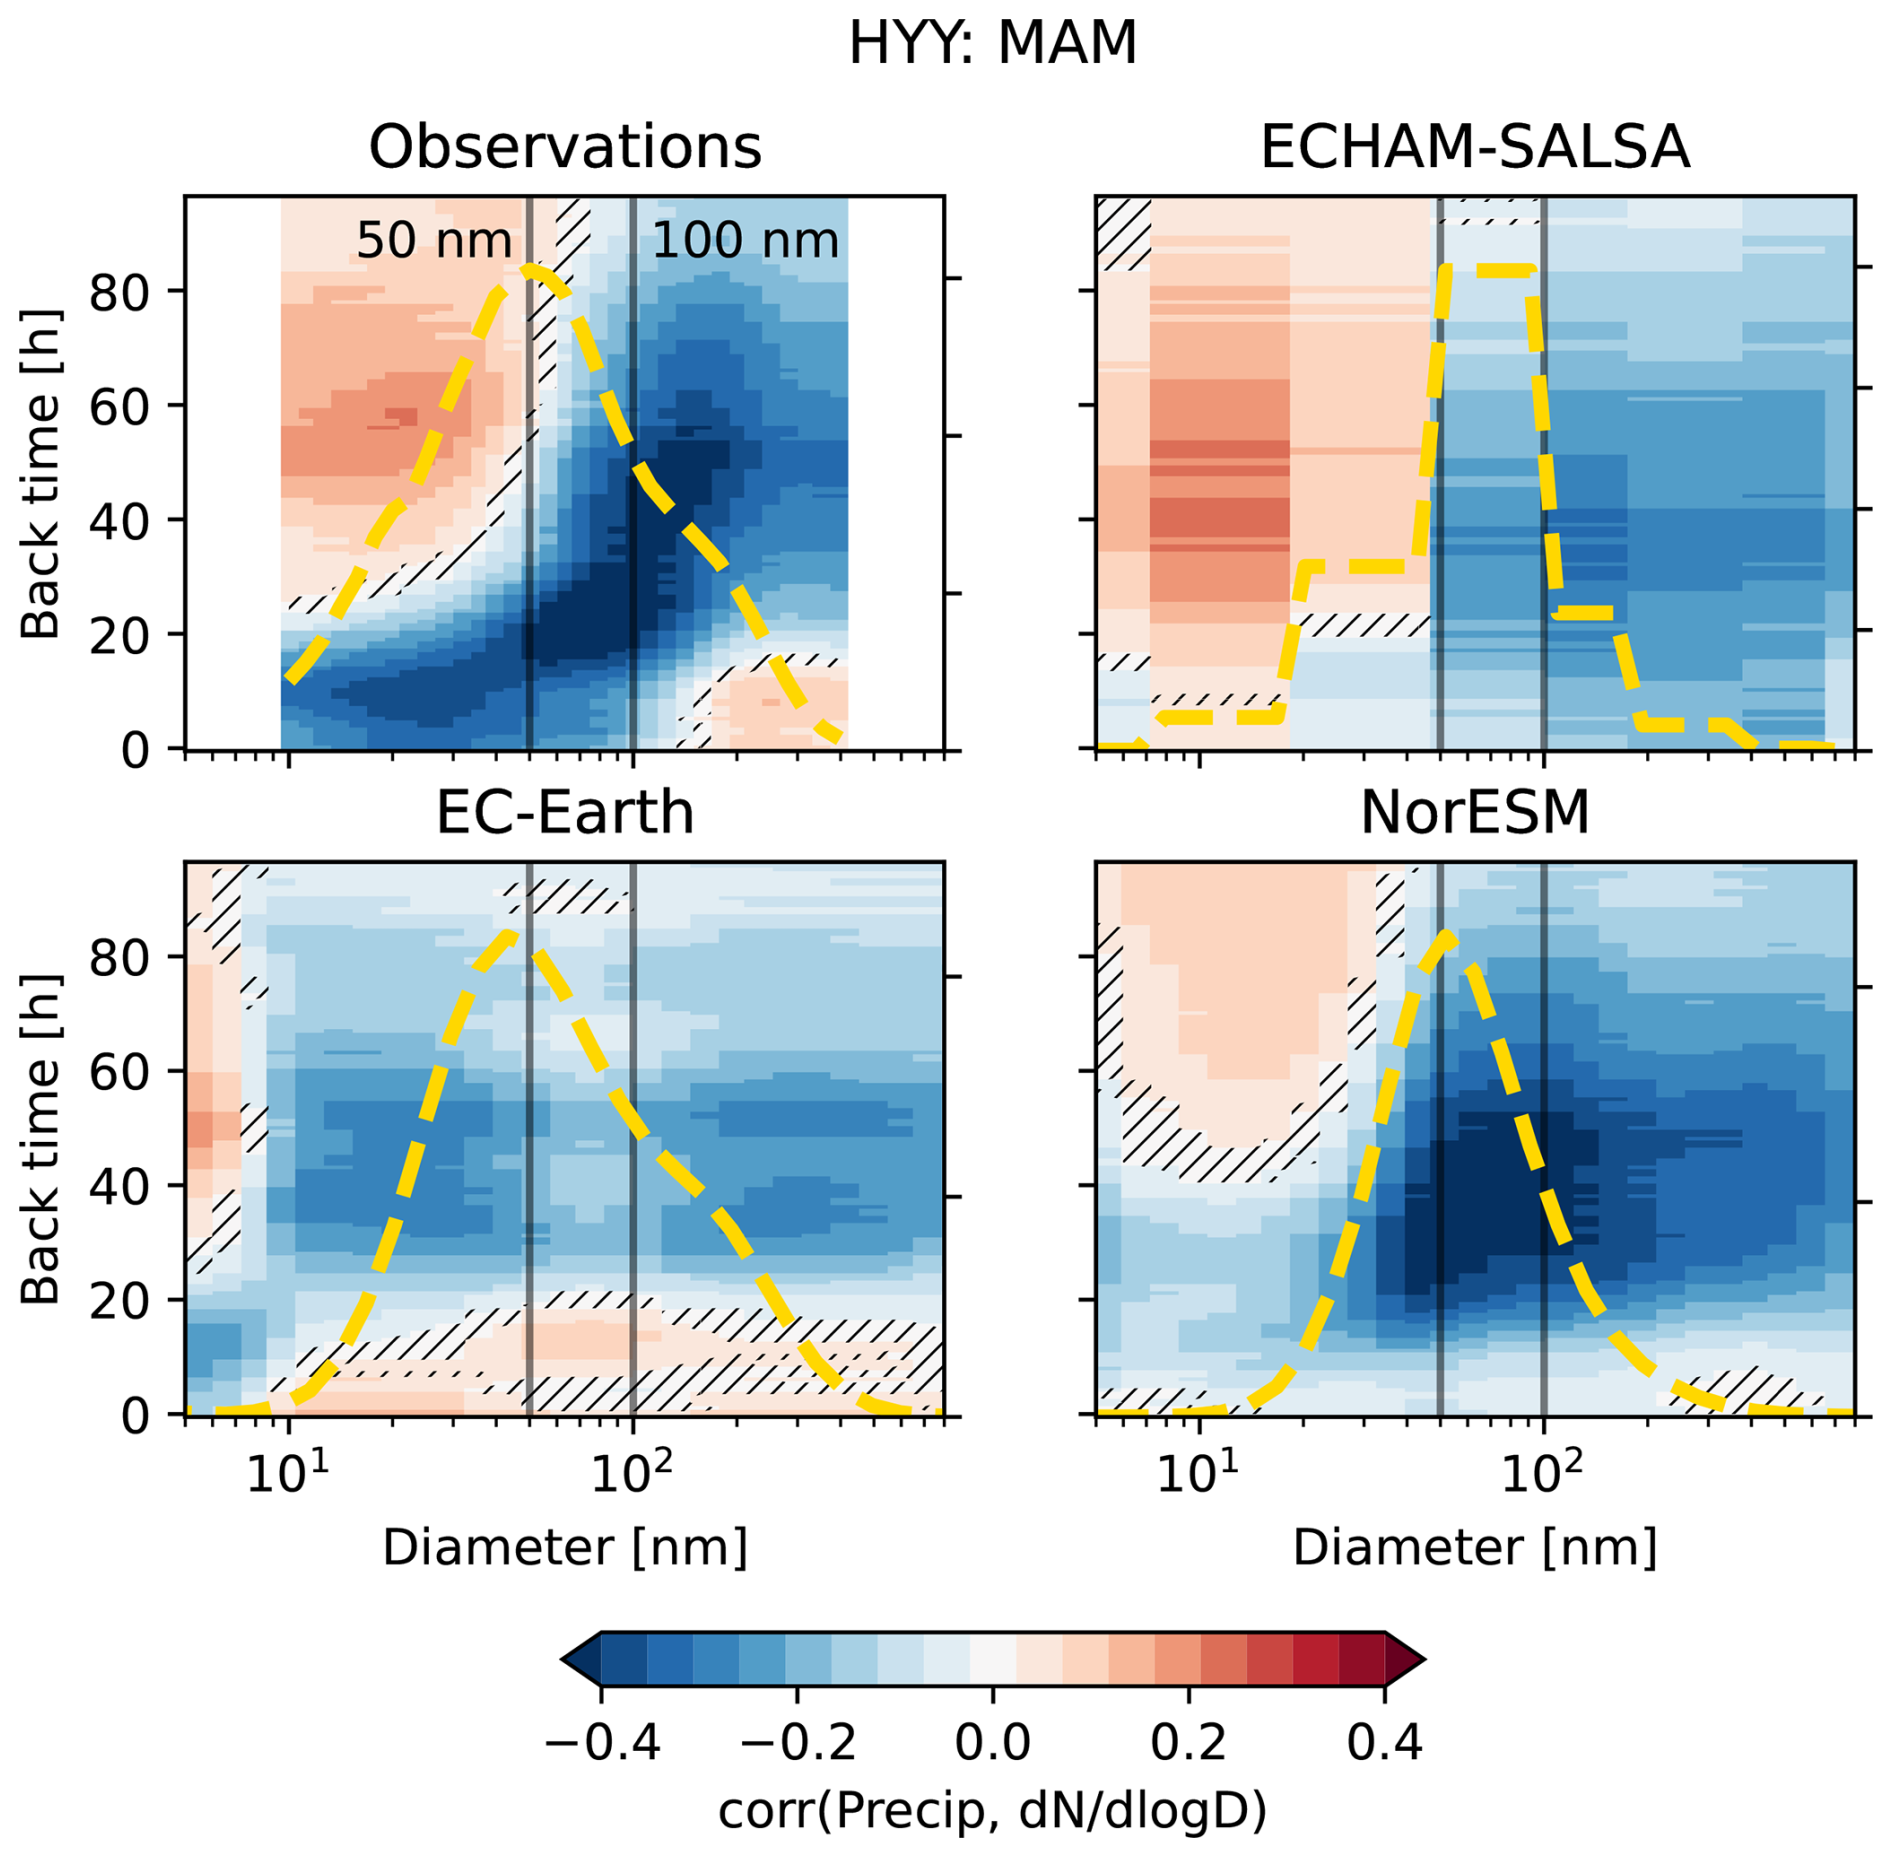
Figure 3Correlation between precipitation rate and PNSD, MAM, Hyytiälä. The yellow lines show the shape of the PNSD during the same time period. Hatched areas indicate regions where the correlations are not statistically significant (p>0.05).
3.2.1 Hyytiälä
The observations (top left panel in Fig. 3) show a positive correlation with the smallest particles (below 20–50 nm) at around 30–65 h back in time. There is a further positive correlation with particles within the 50–100 nm size range with precipitation that occurred earlier, around 60–96 h prior to the observation of the particles. We interpret these positive correlations as originating from NPF indirectly induced by past precipitation. Following this logic, the further into the past the precipitation occurred, the larger the particles originating from this precipitation induced NPF have had time to grow, hence explaining why a positive correlation emerges between larger particles (50–100 nm) and precipitation that occurred a long time ago (90–96 h). Very recent precipitation (approximately 0–20 h), on the other hand, is seen to correlate negatively with the smallest particles (below 100 nm), which is consistent with NPF being inhibited by (1) reduced photochemistry that limits oxidant availability to produce NPF precursors (e.g. Jokinen et al., 2017), (2) a loss of critical NPF precursors (e.g. gas phase sulfuric acid and sulfur dioxide) via wet and dry deposition and (3) a high coagulation sink for newly formed particles associated with rainfall and high humidity (hygroscopic growth of particles) and (4) direct scavenging of smaller particles by precipitation (e.g. Slinn, 1984).
All models show signs of NPF induced by past precipitation, though the timing and the growth differ. The observations show a positive correlation from around 25 h back in time and peaking around 55. ECHAM-SALSA has a slightly too early positive correlation and peak, NorESM has a positive correlation only after approximately 50 h back in time (later than observed), while EC-Earth is quite consistent with the observations. In terms of the growth to larger sizes, which can be seen in the observations (see also Fig. 1), none of the models exhibits significant positive correlations above 50 nm, with the extreme being EC-Earth which shows no positive correlations beyond 10 nm. This is of considerable importance because it suggests that the models (at least the ones in this study) in fact underestimate particle growth to CCN sizes. Note that when using the GDAS precipitation data from HYSPLIT, the particle growth is shown to even larger sizes in the observations (see Fig. S13).
Concerning NPF inhibition by recent precipitation, the models fail to represent the observed strong negative correlation with recent precipitation in the smaller sizes (below 20 nm). Of the NPF inhibition processes mentioned above, the photochemistry effect, can explain this problem in NorESM and ECHAM-SALSA because these have offline oxidant fields (read from file), which means that the effect of clouds (associated with recent precipitation) will not influence the oxidant availability and precursor production. EC-Earth on the other hand, has online oxidant chemistry and has some signs of NPF inhibition in the first 20 h of the back trajectory, consistent with observations. This negative correlation (NPF inhibition) in EC-Earth is only present for the nucleation mode, which is consistent with no positive correlations beyond 10 nm, as EC-Earth does not seem to have a strong growth of NPF particles to larger sizes. The models represent wet scavenging of precursor gases (point 2 above, although not necessarily well constrained, MacDonald et al. (2018); Neu and Prather (2012); Seinfeld and Pandis (2016)), direct below-cloud scavenging of the smallest particles (point 4 above), but only two of the models represent increasing coagulation sink for the nucleating particles at higher relative humidity (point 3 above, NorESM does not). Thus the most likely culprit for the models failure to reproduce the observations is the photochemistry, and potentially the coagulation sink. In observations, EC-Earth and NorESM there is a positive or approximately zero correlation between recent precipitation (less than 20 h) and larger particles. This is likely unrelated to NPF, in spite of protruding onto the Aitken mode for EC-Earth, but rather related to the same process driving the positive blob in the bottom right corner in the observations. We discuss this below in Sect. 3.5.
3.2.2 Zeppelin
At Zeppelin, the observations in Fig. 4 similarly show positive correlations for particles between 10 and 40 nm and precipitation a bit earlier than 40 h back in time. There are also signs of growth up to above 50 nm at around 80 h back in time. The models on the other hand exhibit similar patterns to what is seen at Hyytiälä: A potentially too weak replenishment of CCN from NPF after precipitation manifested as weak positive correlations between precipitation back in time (more than 40 h) and smaller particles, and no sign of growth. ECHAM-SALSA shows positive correlations for the smallest particles even for recent precipitation, but no clear growth pattern. NorESM has a positive correlation only for precipitation around 80 h back in time, and with no clear sign of growth visible. NorESM also has negative correlations for recent precipitation across the size range, which could be due to a lack of explicit representation of the smallest particles, which should in reality be less affected by nucleation scavenging. EC-Earth again has a surprising positive correlation with recent precipitation across the size range (from the smallest up to 130 nm), and contrary to Hyytiälä, it does not show signs of NPF inhibition for concurrent/very recent rain fall.
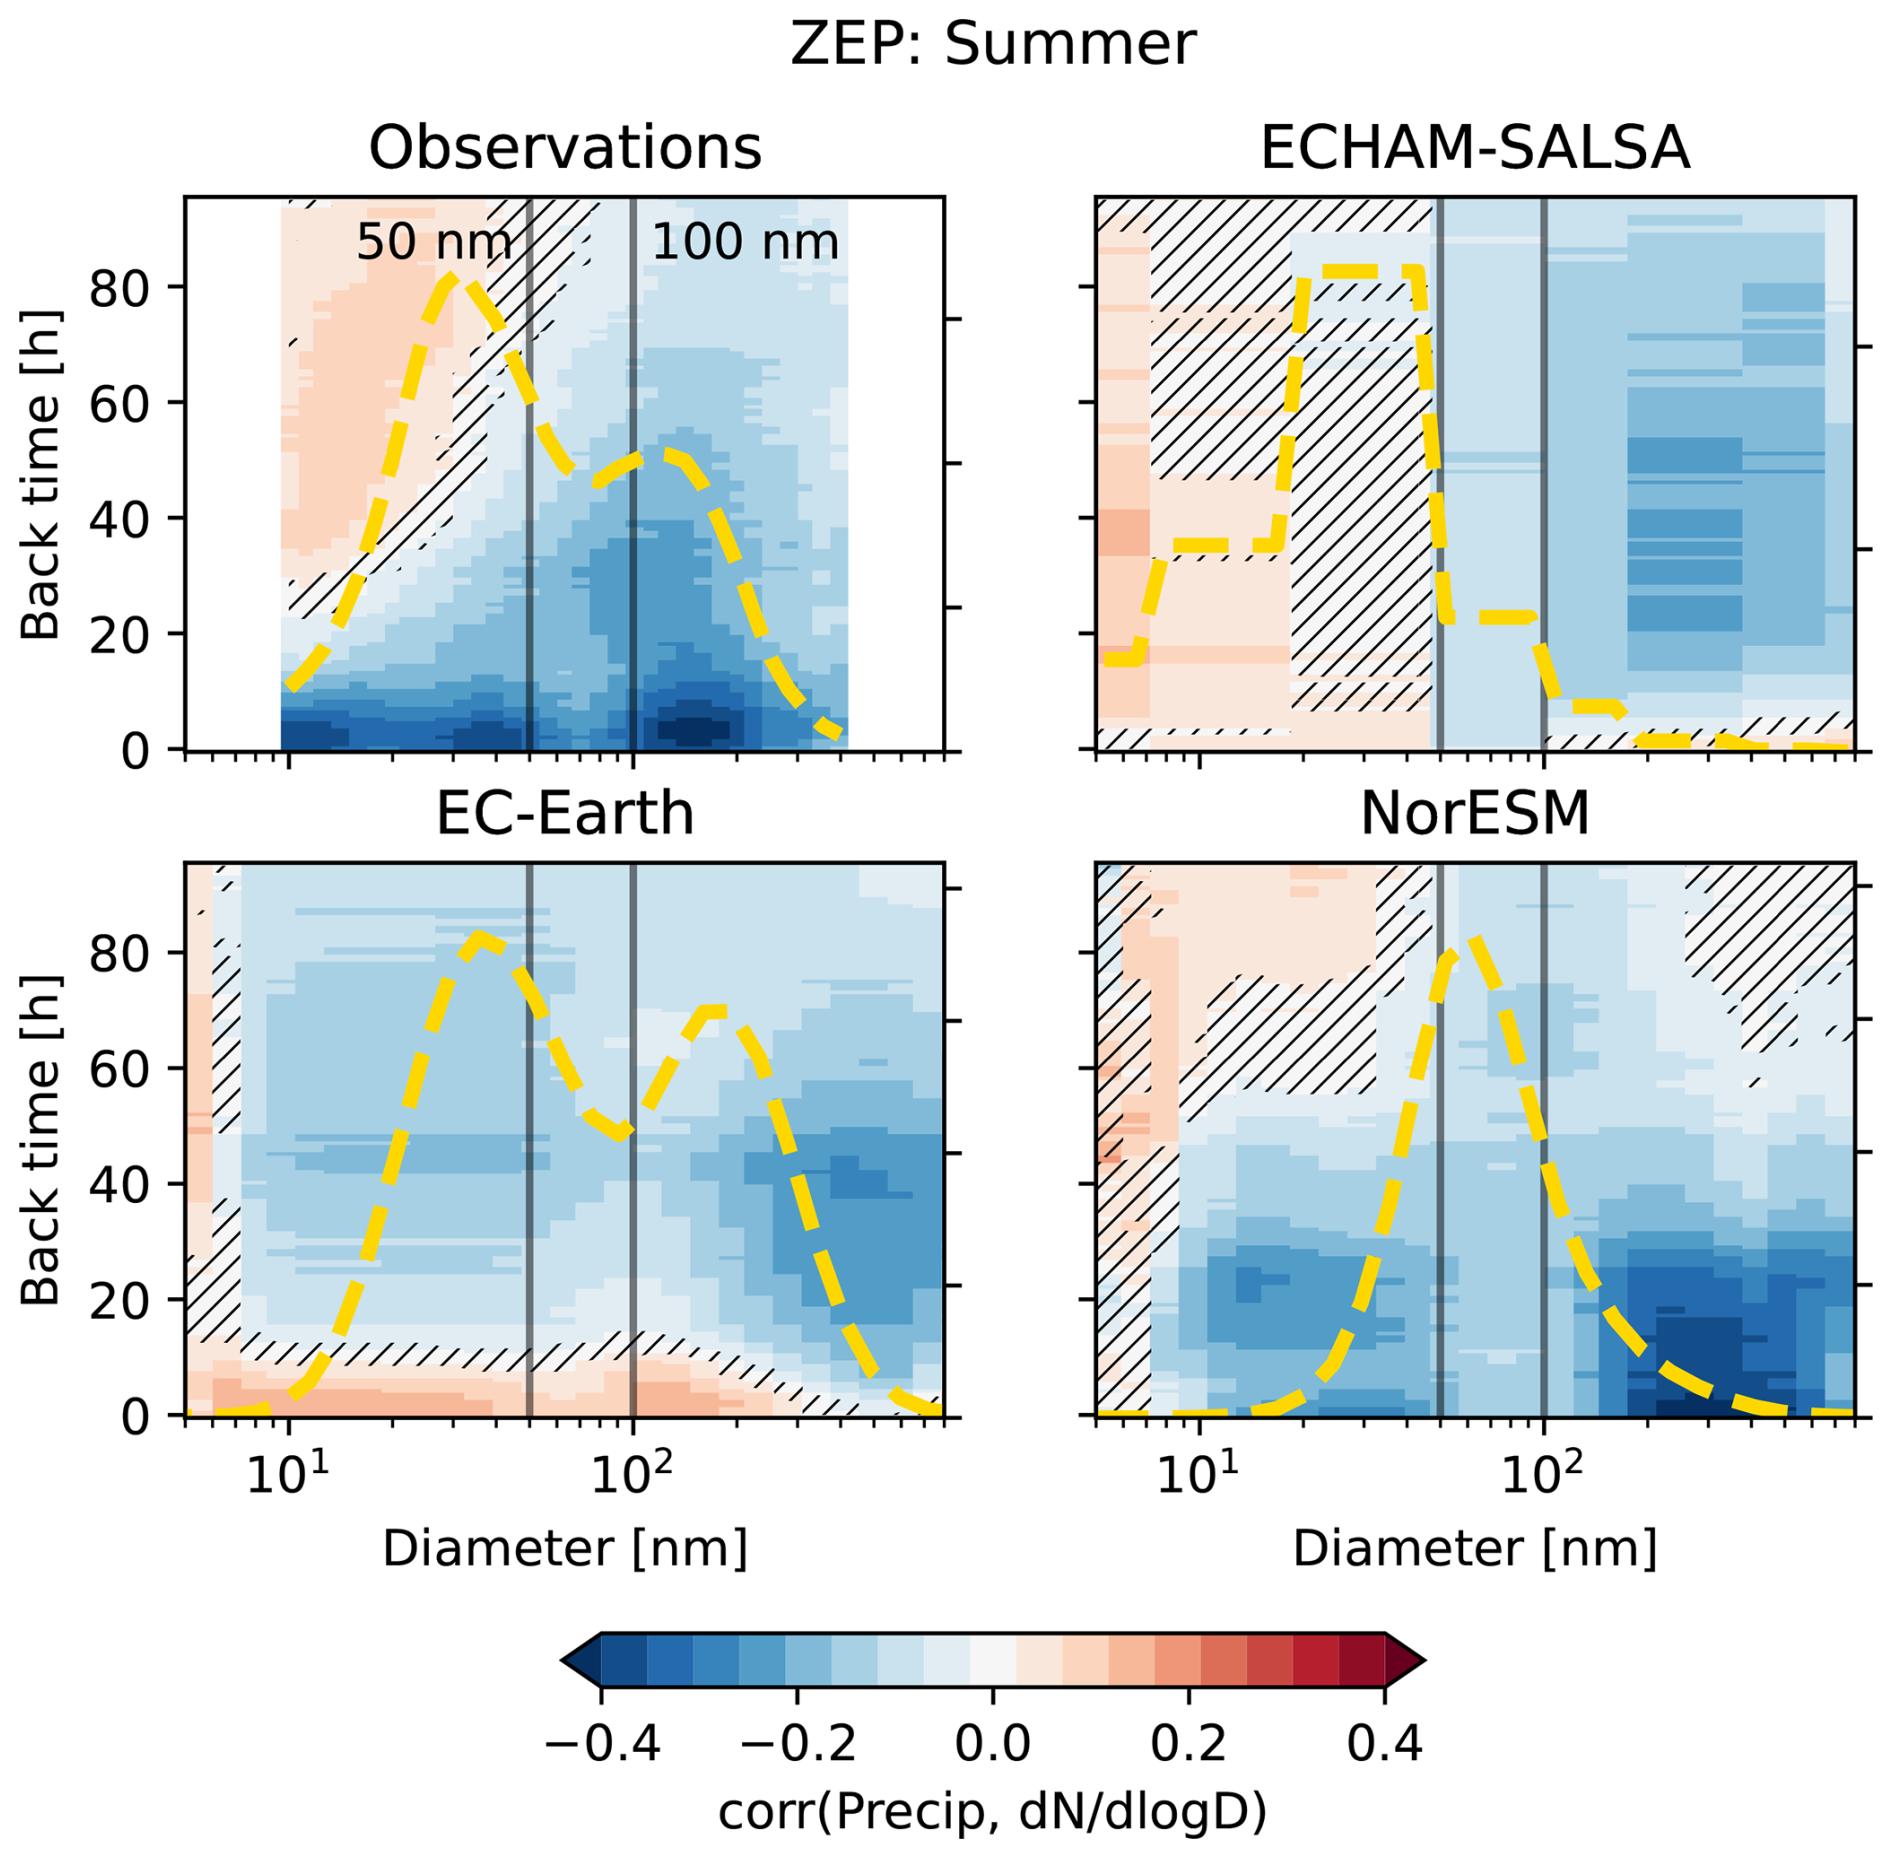
Figure 4Correlation between precipitation rate and PNSD, Summer, Zeppelin. The yellow lines show the shape of the PNSD during the same time period. Hatched areas indicate regions where the correlations are not statistically significant (p>0.05).
Similarly to Hyytiälä, none of the models reproduce the growth up to 50 nm and larger sizes seen in the observations for precipitation further back in time, with EC-Earth again being the weakest, showing essentially no sign of growth for the particles in the smallest sizes.
3.2.3 ATTO
As mentioned above, fine-mode particles at ATTO tend to appear in bursts connected to downdrafts, potentially injecting particles formed in the upper troposphere into the boundary layer (see discussion in the introduction). In fact, this is likely why we see a positive correlation with concurrent/very recent precipitation in the observations in Fig. 5, followed by subsequent growth to the 50–100 nm range, and suggested potential growth to above 100 nm (though not significant). One might not expect ESMs to represent this downdraft transport well, due to the (1) parameterized representation of convection as well as (2) potentially lacking representation of the nucleation mechanisms important in the upper troposphere in the regions (Curtius et al., 2024; Shen et al., 2024; Bardakov et al., 2024). However, we do see models showing positive correlations between very recent precipitation and the smallest particles in ATTO, contrary to what at least NorESM and EC-Earth show at the other stations. It is not, however, entirely clear that the models are getting this right for the right reasons. In fact, the positive correlations between the smallest particles (sub 20 nm) with precipitation in the models at ATTO station may also be due to unrealistic boundary layer nucleation – at least in EC-Earth and NorESM. Figure S24 shows that these models (NorESM and EC-Earth) frequently have NPF events at ATTO (judging by the formation rate in NorESM and the high concentration of sub-10 nm particles in EC-Earth), while ECHAM-SALSA is more realistic in terms of fewer boundary layer NPF events. For EC-Earth and NorESM the positive correlations only peak for precipitation slightly back in time (around 0 correlation for precipitation right before the station), while in the observations they are immediately connected to the precipitation. ECHAM-SALSA, on the other hand, has too few particles in the sub-50 nm range compared to the observations. Therefore, even if the downdraft transport were to be responsible for the positive correlations, it is clearly not strong enough; this could be due to either a lack of particles aloft or insufficient downward transport.
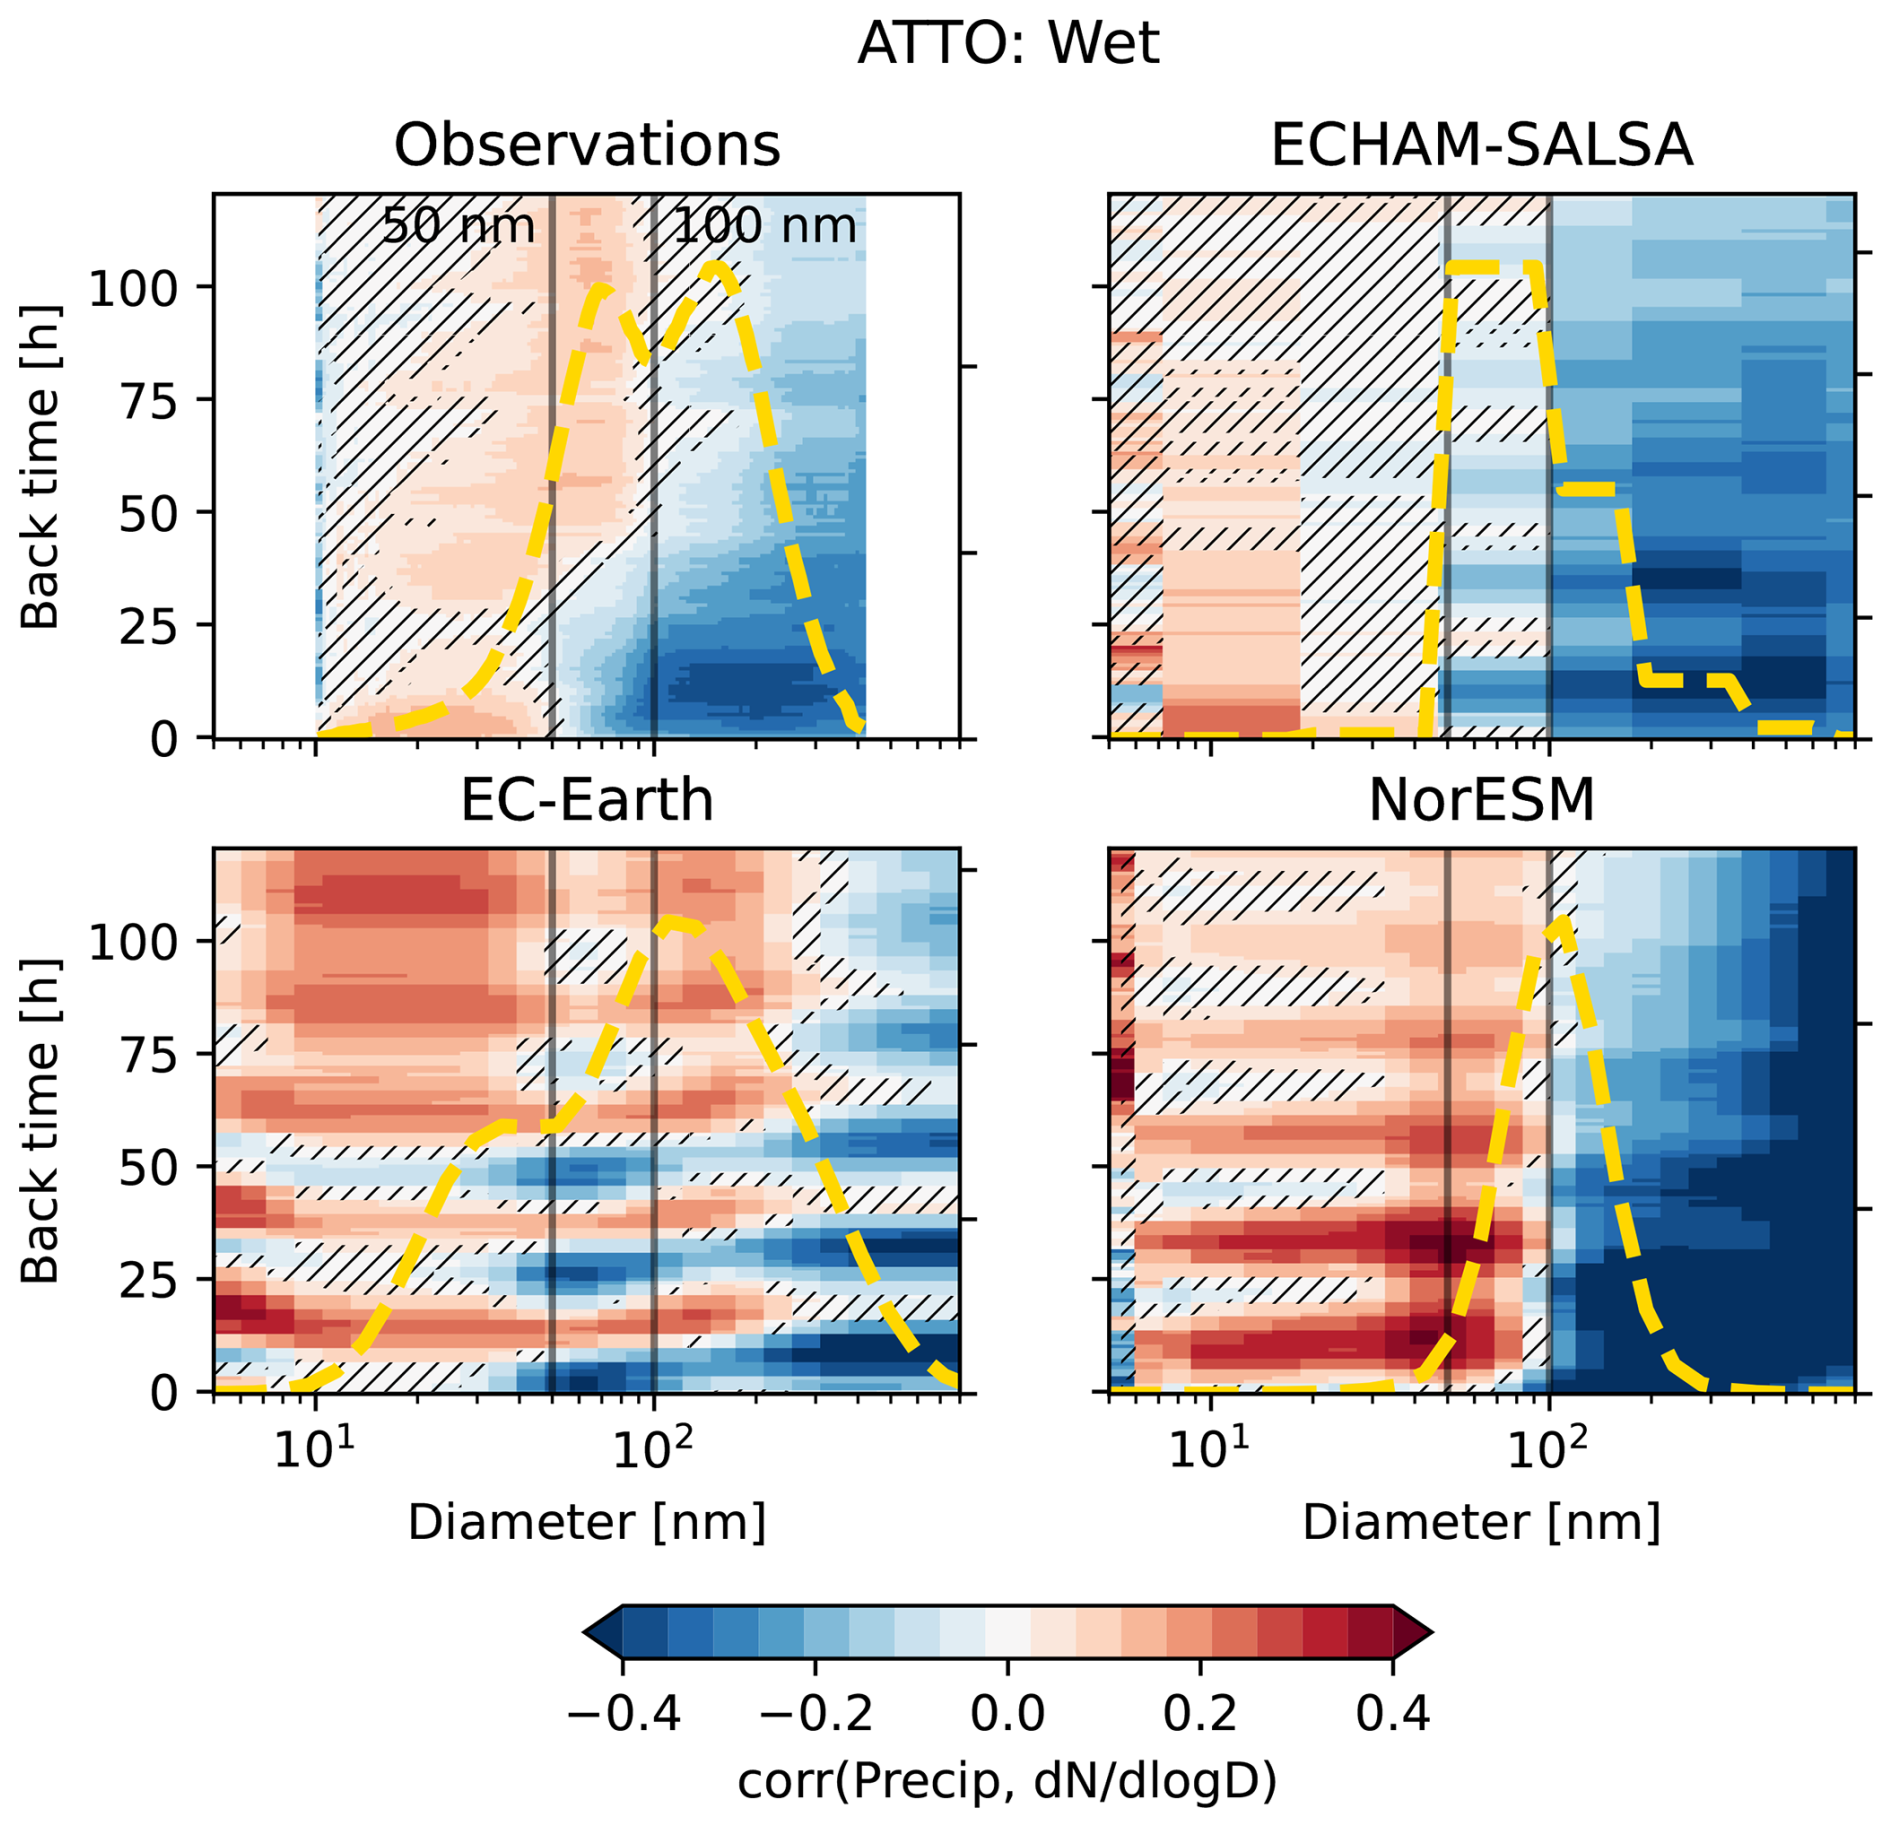
Figure 5Correlation between precipitation rate and PNSD, Wet season, ATTO. The yellow lines show the shape of the PNSD during the same time period. Hatched areas indicate regions where the correlations are not statistically significant (p>0.05).
Note that all the models have diurnally oscillating pattern in the correlations at ATTO when going back in time. This originates from the diurnal pattern in precipitation (Fig. S7 together with a diurnal pattern in number concentrations, Figs. S8–S10). The latter is not well represented in the models: The observations tend to show a relatively stable particle concentration for the larger particles (above 50 nm) with slightly lower concentrations during the night, while the models show the opposite. For the smallest particles (10–30 nm), the observations show a decrease during the day, while the models (except NorESM, which does model nucleation mode particles explicitly), show a flatter pattern. It is beyond the scope of this study to explore the reasons for the models' failure in these regards, but it is likely related to the daytime mixing of the boundary layer with cleaner free tropospheric air.
To understand the overall effect of precipitation without the impact of the diurnal pattern, we show in Fig. 6 the correlations calculated using the daily mean in both PNSD and precipitation rate (see Sect. S10 for the equivalent plots for other stations and seasons). We see that the features observed in the observational data and ECHAM-SALSA remain mostly unchanged, though with stronger correlations. However, the diurnal oscillation pattern is now gone from NorESM and EC-Earth, and there is a strong positive correlation between the smaller particles and precipitation, accompanied with appearant very rapid growth to larger sizes. In NorESM the particles seem to immediately grow to sizes larger than 50 nm, consistent with no explicit representation the of nucleation mode, with some signs of growth to sizes above 100 nm (reduced negative correlation for precipitation further back in time). EC-Earth also shows signs of rapid growth (positive correlations with the Aitken and accumulation mode particles with recent precipitation), as well as potential growth with less recent precipitation in time (stonger positive correlations for accumulation mode from 50 h back in time). EC-Earth has a negative (non-significant) correlation in the transition between the Aitken and the Accumulation mode, caused by the modal structure of the model, where particles are moved to a larger mode once the inital mode grows large enough in median diameter. This very rapid growth is consistent with the findings of Blichner et al. (2024) in the ATTO environment: NorESM and EC-Earth overestimate the amount of secondary organic aerosol in the ATTO environment. In addition, Blichner et al. (2024) also show that ECHAM-SALSA is more consistent with the observations in terms of organic aerosol at ATTO. However, the weak positive correlation in this model is rather due to the lack of particles than a lack of growth: since the model hardly has particles in the sub-50 nm range, it cannot not present a positive correlation.
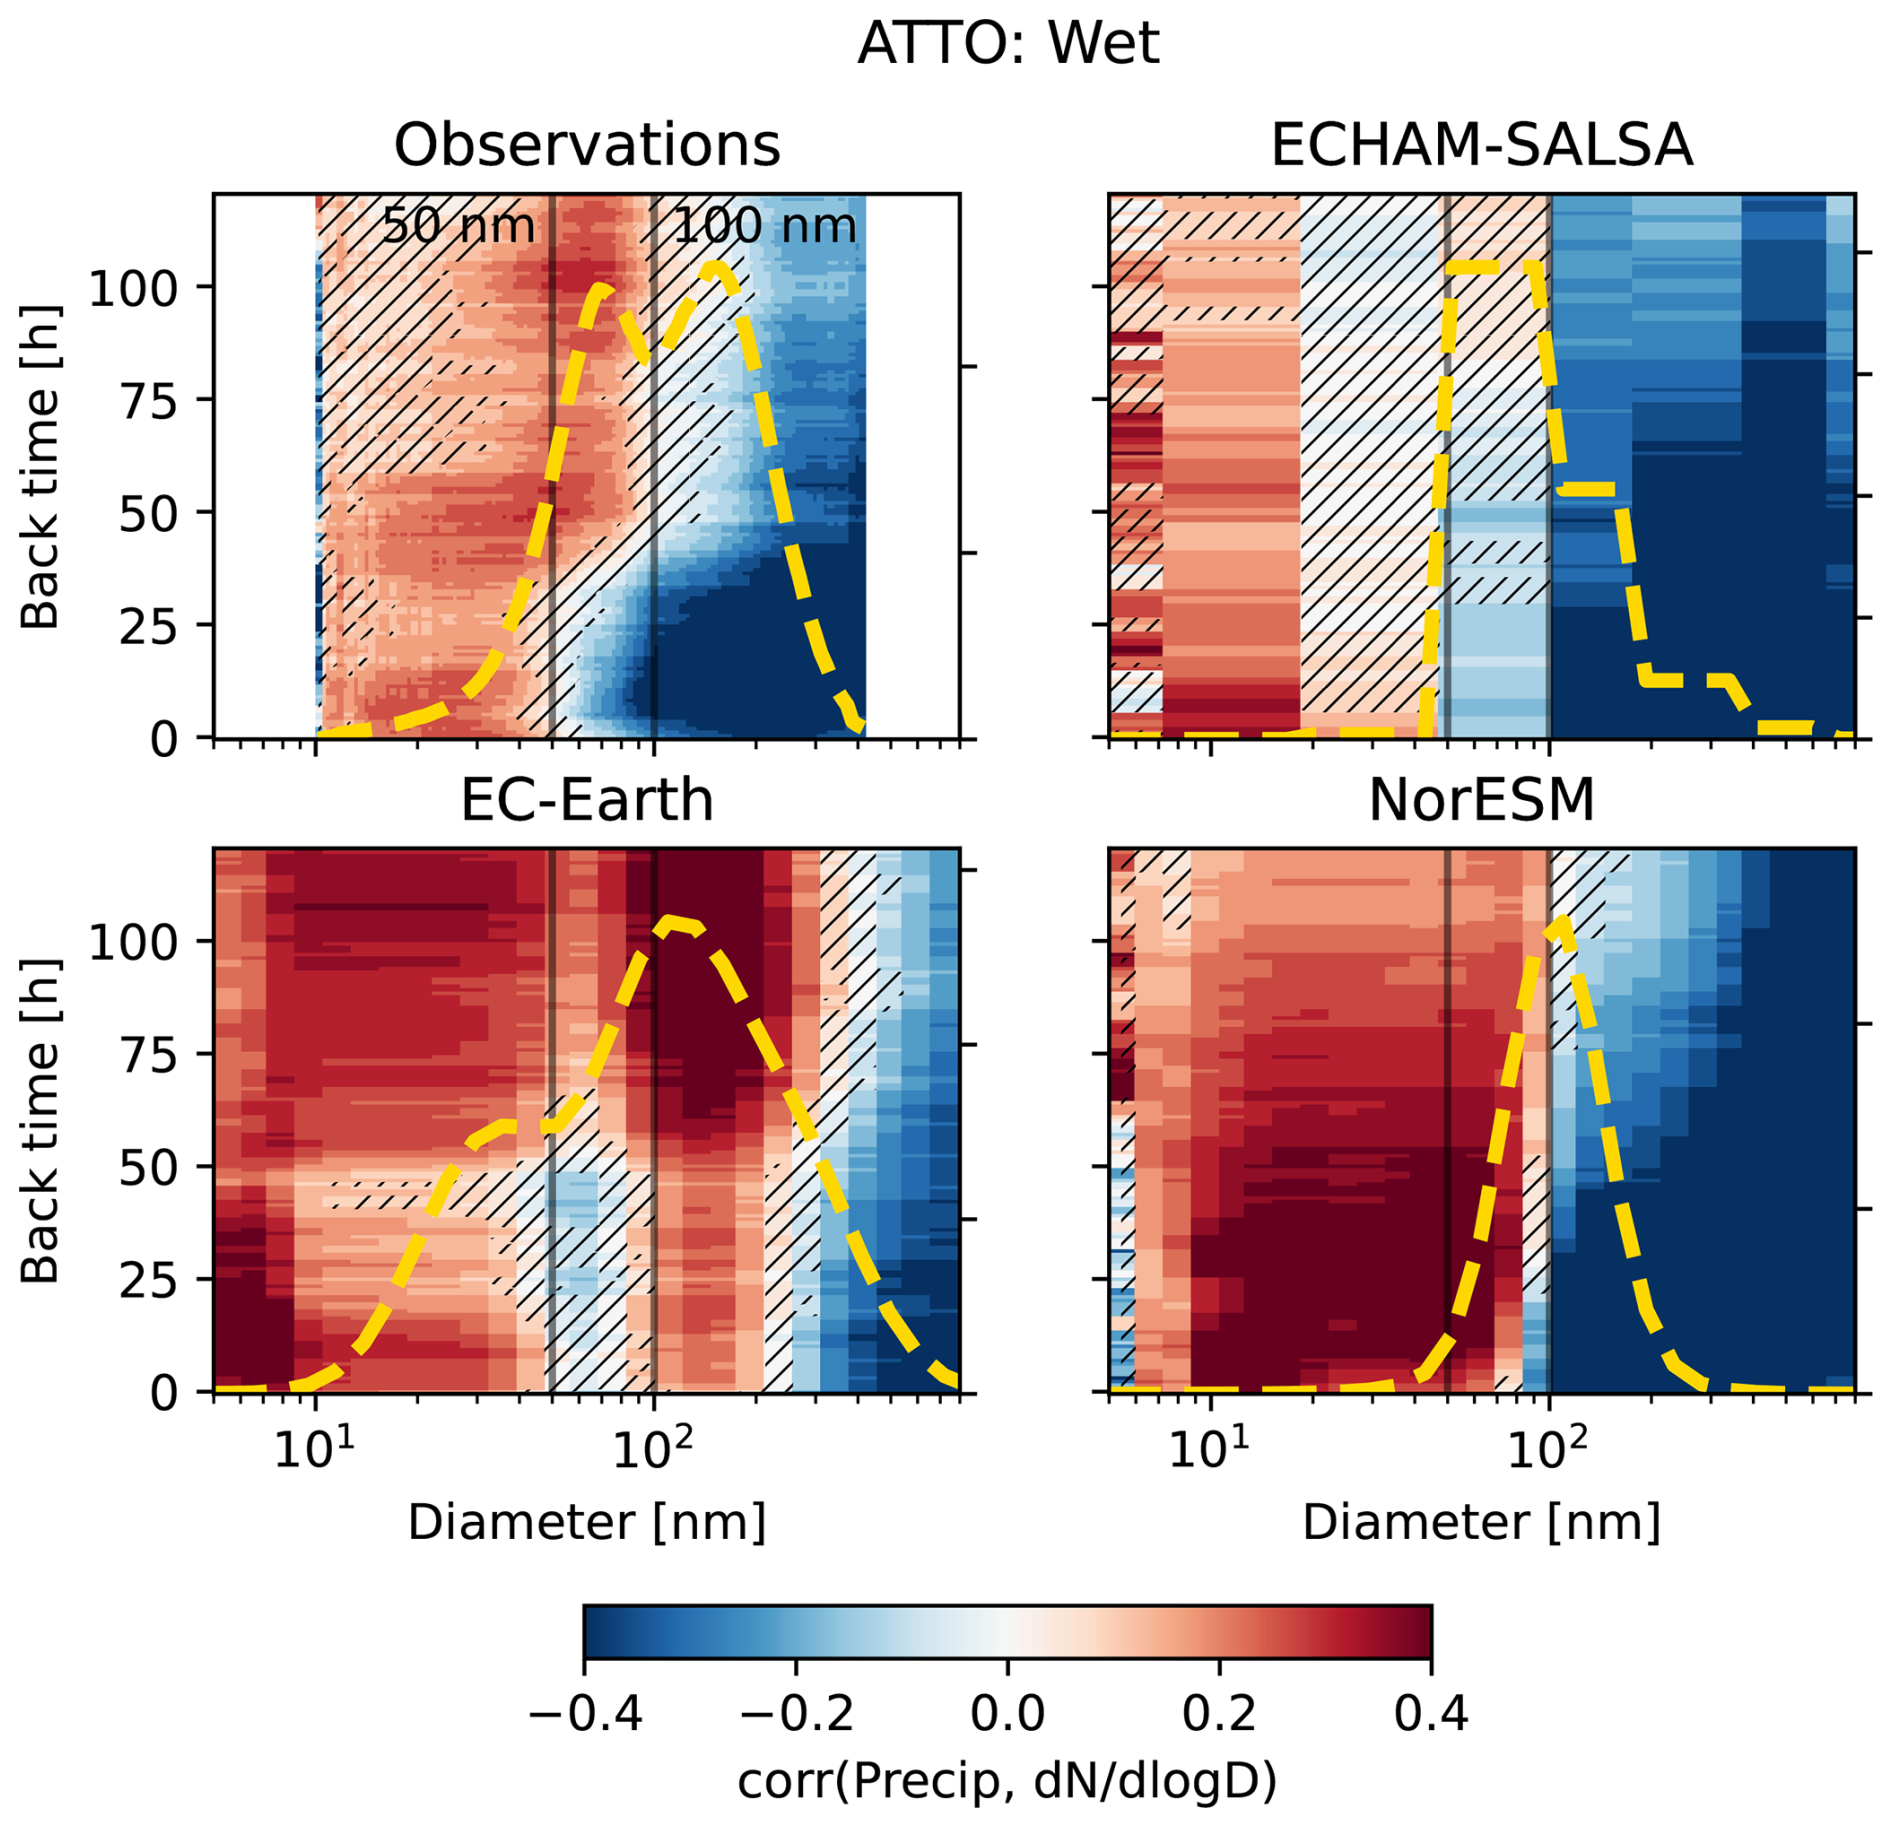
Figure 6Correlation between precipitation rate and PNSD using daily mean values form both the PNSD and the precipitation, Wet season, ATTO. The yellow lines show the shape of the PNSD during the same time period.
Overall, with the analysis presented above, we cannot rule out the possibility that the models represent the bursts of small particles associated with rainfall at ATTO. However, we can clearly show that in NorESM and EC-Earth, the growth to larger sizes is strongly overestimated, and for ECHAM-SALSA, the source of particles is underrated.
3.2.4 Comparison across stations
For both Hyytiälä and Zeppelin, the models all appear to have too weak growth of particles compared to what is observed. At ATTO, EC-Earth and NorESM both have unrealistically strong positive correlations between precipitation and the smallest particles, indicating too much NPF and too strong growth associated with rainfall. It is, however, likely that the particle source in the models is “right” for the wrong reason: while the positive correlations in the observations are thought to be driven by small particles being injected into the boundary layer with downdrafts, models seems to have them due to boundary layer nucleation. ECHAM-SALSA, which has weakly positive correlations and no sign of growth, may thus be equally “good” as the other models – just missing a compensating error.
3.3 Scavenging of particles
3.3.1 Nucleation and small Aitken mode
For the smallest particles, the scavenging is likely to be apparent only for very recent precipitation due to the short lifetime and indirect precipitation source of particles via NPF discussed above. Additionally, whatever relationship is observed will be a combination of NPF inhibition by reduced photochemistry associated with cloudy conditions, wet scavenging of NPF precursor gases and finally direct scavenging of the particles. As mentioned, NorESM and ECHAM-SALSA have offline oxidant chemistry, meaning that the oxidant concentration is read from monthly mean files with an imposed diurnal variability on top of it. This means that the cloud cover has no impact on the photochemistry in these models and they could therefore produce NPF even during cloudy conditions. This is likely the reason why these models in general have a too weak negative correlation for recent precipitation (see Figs. 3–5 and S12b, S14b, S15b, S16b, S17b, S18b). On the other hand, all the models represent the wet removal of NPF precursor gases (sulfur dioxide, gas phase sulfuric acid, organics, etc.), which is effective if the grid box is in the cloud or affected by precipitation.
Separating the impact of NPF inhibition from impact of scavenging of the smallest particles has proved difficult. We have attempted to investigate the impact of precipitation during night time, as NPF is very rare during night, especially with subsequent growth, see Sect. S2. However, this approach was found to give highly inconclusive results. This is likely because the particle concentration in the range (10–30 nm) is highly dependent on NPF happening and night time values will still be affected by NPF the previous day for example. In general attempting to pick times when NPF is not impacting the size range means picking times when there are few particles to scavenge.
In sum, we can see in Fig. S1 that models underestimate the negative impact of recent precipitation on the size range 10–30 nm for Zeppelin and Hyytiälä, with the exception of NorESM at Zeppelin. At ATTO, EC-Earth and NorESM are found to underestimate the percentwise increase in particles associated with recent precipitation, while ECHAM-SALSA overestimates it although in absolute numbers (non-normalized) it still underestimates the source (see Fig. S2).
3.3.2 Accumulation mode and large Aitken mode particles
Figure 7 shows the correlations between N100 and N200 and precipitation along the back trajectories (see also e.g. Figs. 3, 5, S23, S22, S12b, S14b, S15b) separated into seasons and station.
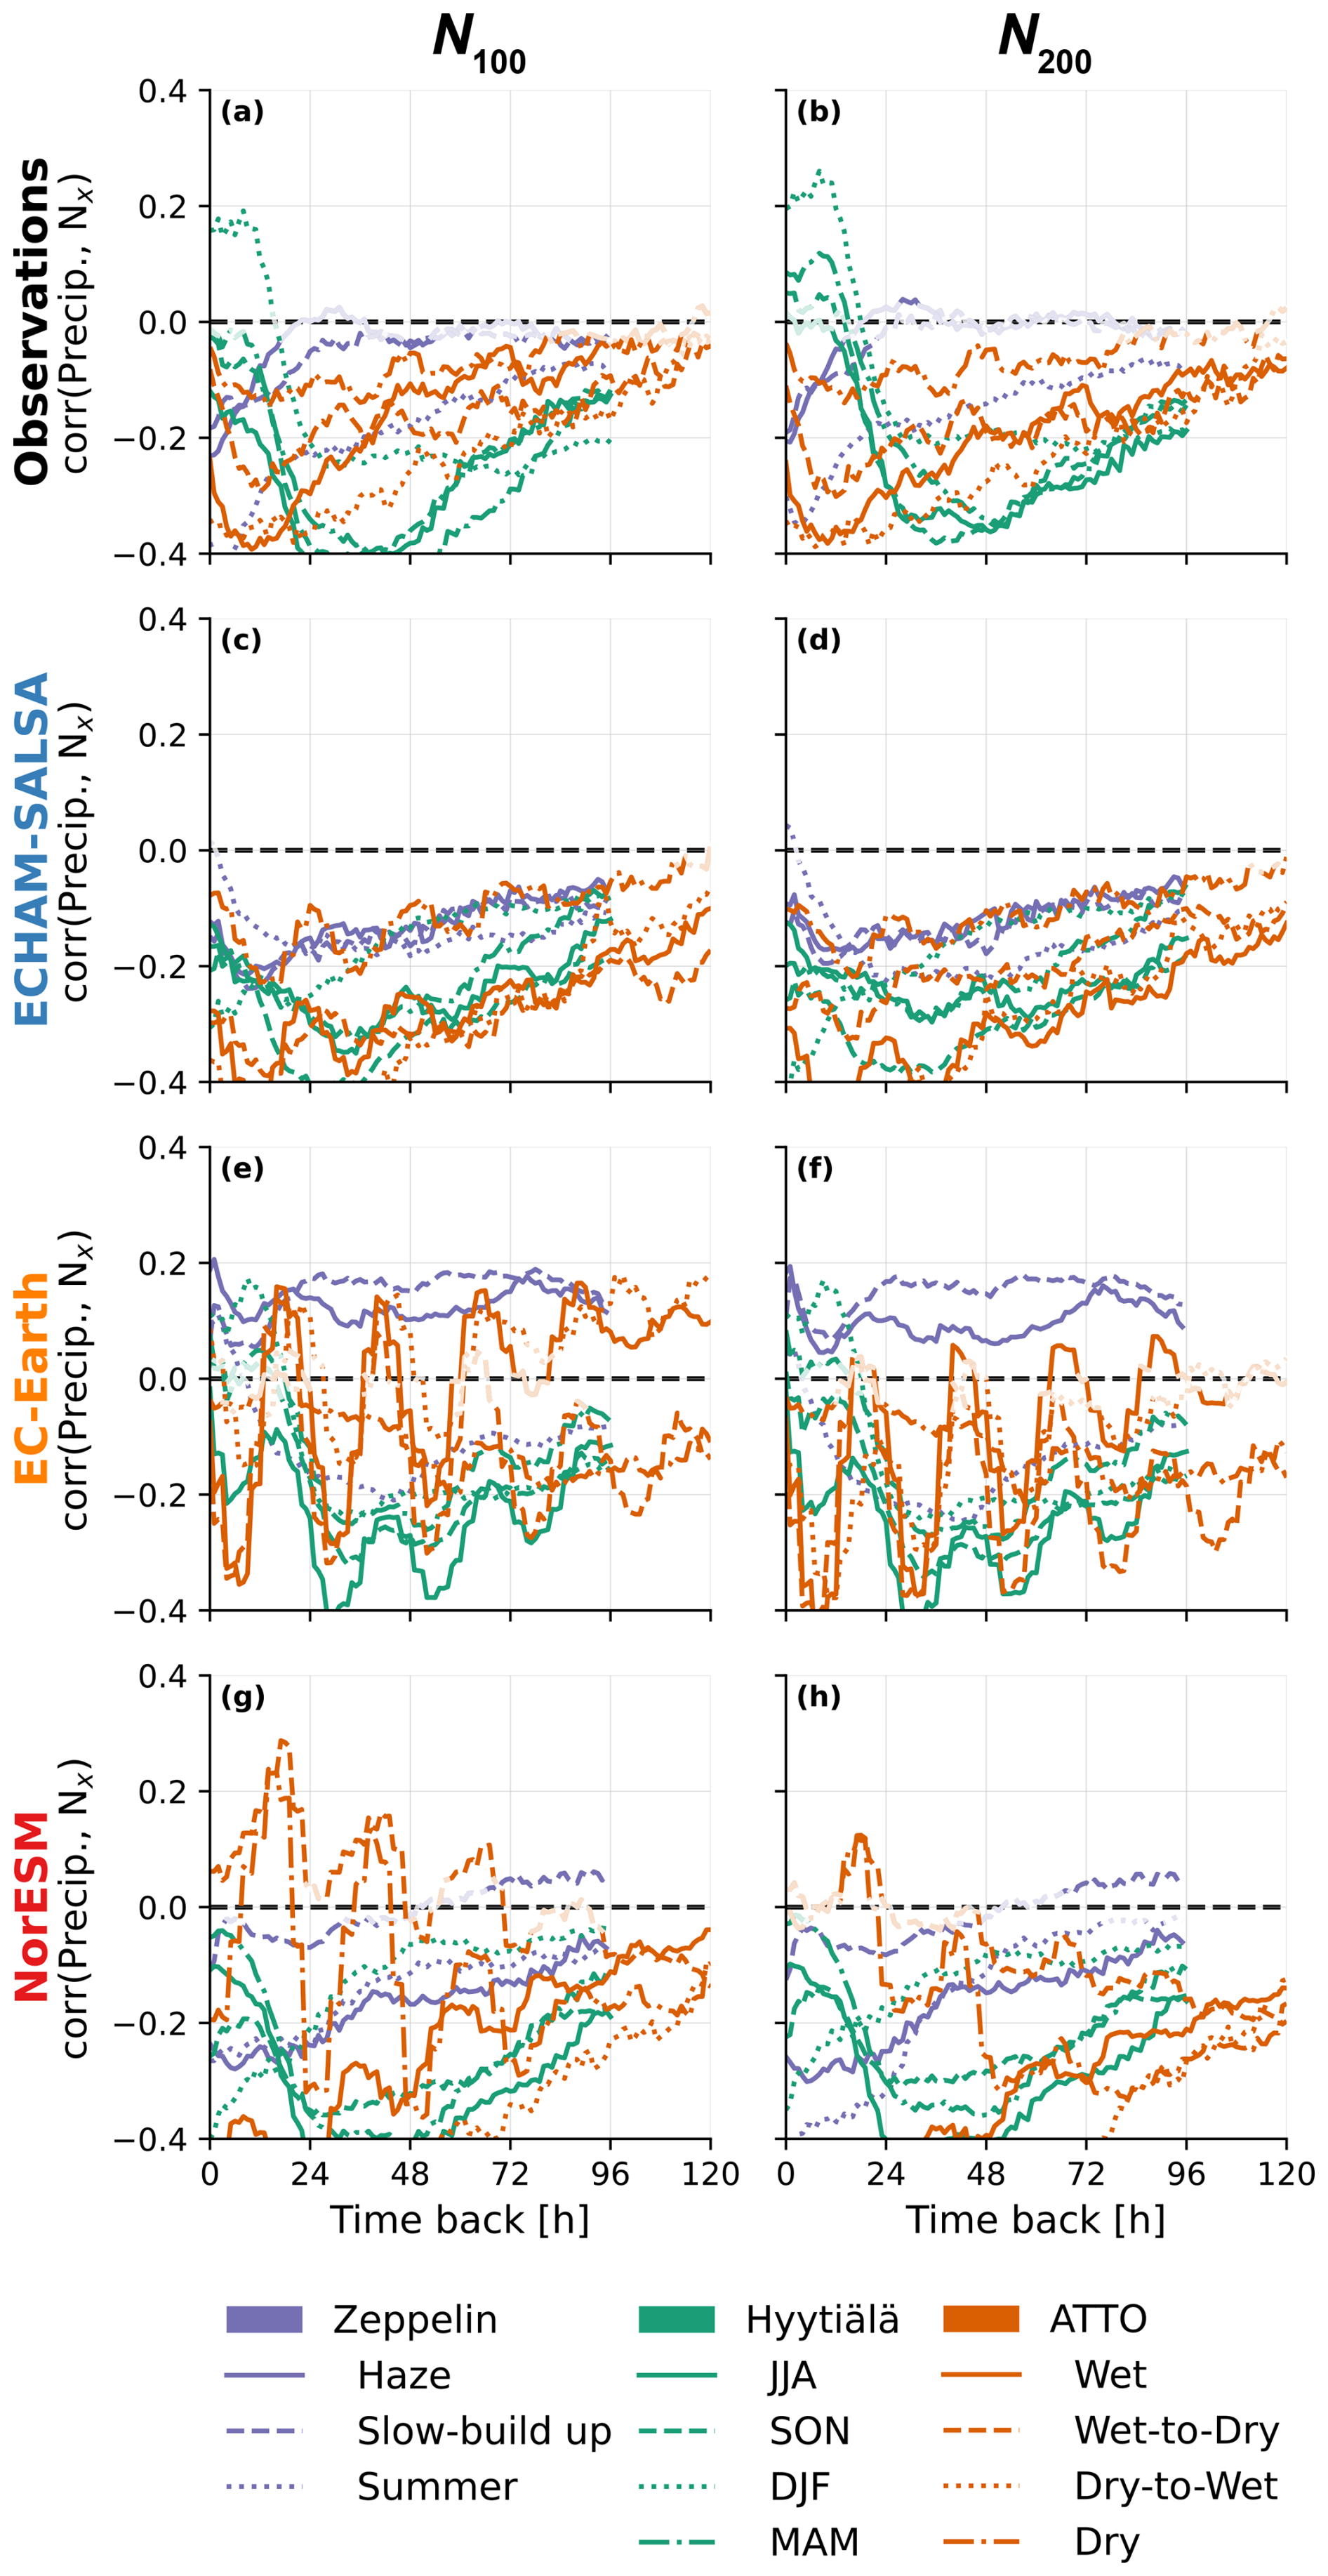
Figure 7Spearman correlations between precipitation rate and (first column; a, c, e, g) N100 and N200 (second column; b, d, f, h) for observations (top row, a and b) and models (c–h). Each line represents a season at a station, with color indicating the station and linestyle indicating the season. Faint lines indicate where the correlation is not significant (p>0.05).
For Hyytiälä, the models agree reasonably well with the observations (Fig. 7), with all of them showing a less negative or even positive correlation for recent precipitation (see discussion below in Sect. 3.5) and a strongly negative correlation for less recent precipitation (older than 24 h). At Hyytälä, during DJF the observations have a weaker negative correlation than the other seasons, and the models reflect this as well.
At Zeppelin, two seasons (Slow-build up and Haze) show no significant correlations between aerosol concentrations and precipitation 24–72 h prior. However, when using precipitation data extracted from the GDAS reanalysis dataset via HYSPLIT, these correlations become more negative and statistically significant (see Khadir et al. (2023) or Figs. S17a and S18a) indicating sensitivity to the choice of meteorological dataset and suggesting that these results should be interpreted with caution. Even with GDAS precipitation data, the correlations remain only weakly negative for these particular months (see Figs. S17 and S18). For these same seasons, EC-Earth shows positive correlations across the entire size range (Slow build-up and Haze, see Figs. S17b and S18b), while NorESM exhibits very weak negative correlations during Slow build-up. Notably, these weak and positive correlations occur exclusively during cold months in the Arctic. This pattern could reflect differences in wet deposition efficiency between snow and rain, though it may also result from reduced quality of reanalysis products during Arctic winter conditions. The temperature dependence of these relationships is discussed further in Sect. 3.4.
For ATTO, observations show negative correlations across all seasons, with particularly strong negative correlations during the Wet and Dry-to-Wet seasons (bottom two lines in Fig. 7a and b). Among the models, ECHAM-SALSA performs best compared to observations, showing only slightly stronger negative correlations with precipitation than observed. EC-Earth and NorESM have pronounced oscillations in their correlation patterns, likely caused by the diurnal cycle in their particle concentrations (discussed above; see Figs. S10 and S11).
For NorESM, the correlations are highly season-dependent, with strongly negative correlations during the Wet season (see also Figs. 6 and 5) and Dry-to-Wet seasons (see Fig. S23), but weak or even positive correlations during the other two seasons. The pattern emerging from the full particle size distribution correlations with precipitation (Figs. S21 and S22) is consistent with the main aerosol mode shifting to larger sizes in response to rainfall (negative correlations below 100 nm, positive above). This may occur when wet removal of larger particles reduces the condensation sink, leading to enhanced growth of the remaining particles. In NorESM, this process can occur instantaneously because condensate is redistributed across the particle size distribution at each time step without memory of the previous distribution (Kirkevåg et al., 2018). EC-Earth likely exhibits similar behavior, with decreasing particle numbers leading to enhanced growth of remaining particles, though this model does not redistribute condensate at each time step, so some time lag would be expected. This is particularly evident during the Dry-to-Wet season, where correlations are negative for the 10–50 nm range but remain positive with indications of growth for the 50–200 nm range (Fig. S23). The absence of these unrealistic positive correlations for larger particles in ECHAM-SALSA suggests this is an artifact of the modal aerosol parameterizations used in NorESM and EC-Earth, from which the sectional scheme in ECHAM-SALSA is less susceptible.
To summarize, ECHAM-SALSA generally performs best among the three models, getting the overall patterns well at all stations. NorESM has greater sensitivity to season and station than observed, and displays particularly unphysical responses to rainfall at ATTO due to artifacts from its modal structure and growth treatment. EC-Earth performs well at Hyytiälä but shows strong oscillation patterns at ATTO and, to some extent, at Hyytiälä. EC-Earth also stands out with significant positive correlations across the entire size range during cold seasons at Zeppelin (discussed further in Sect. 3.4).
3.4 Impact of temperature: indications for cloud phase
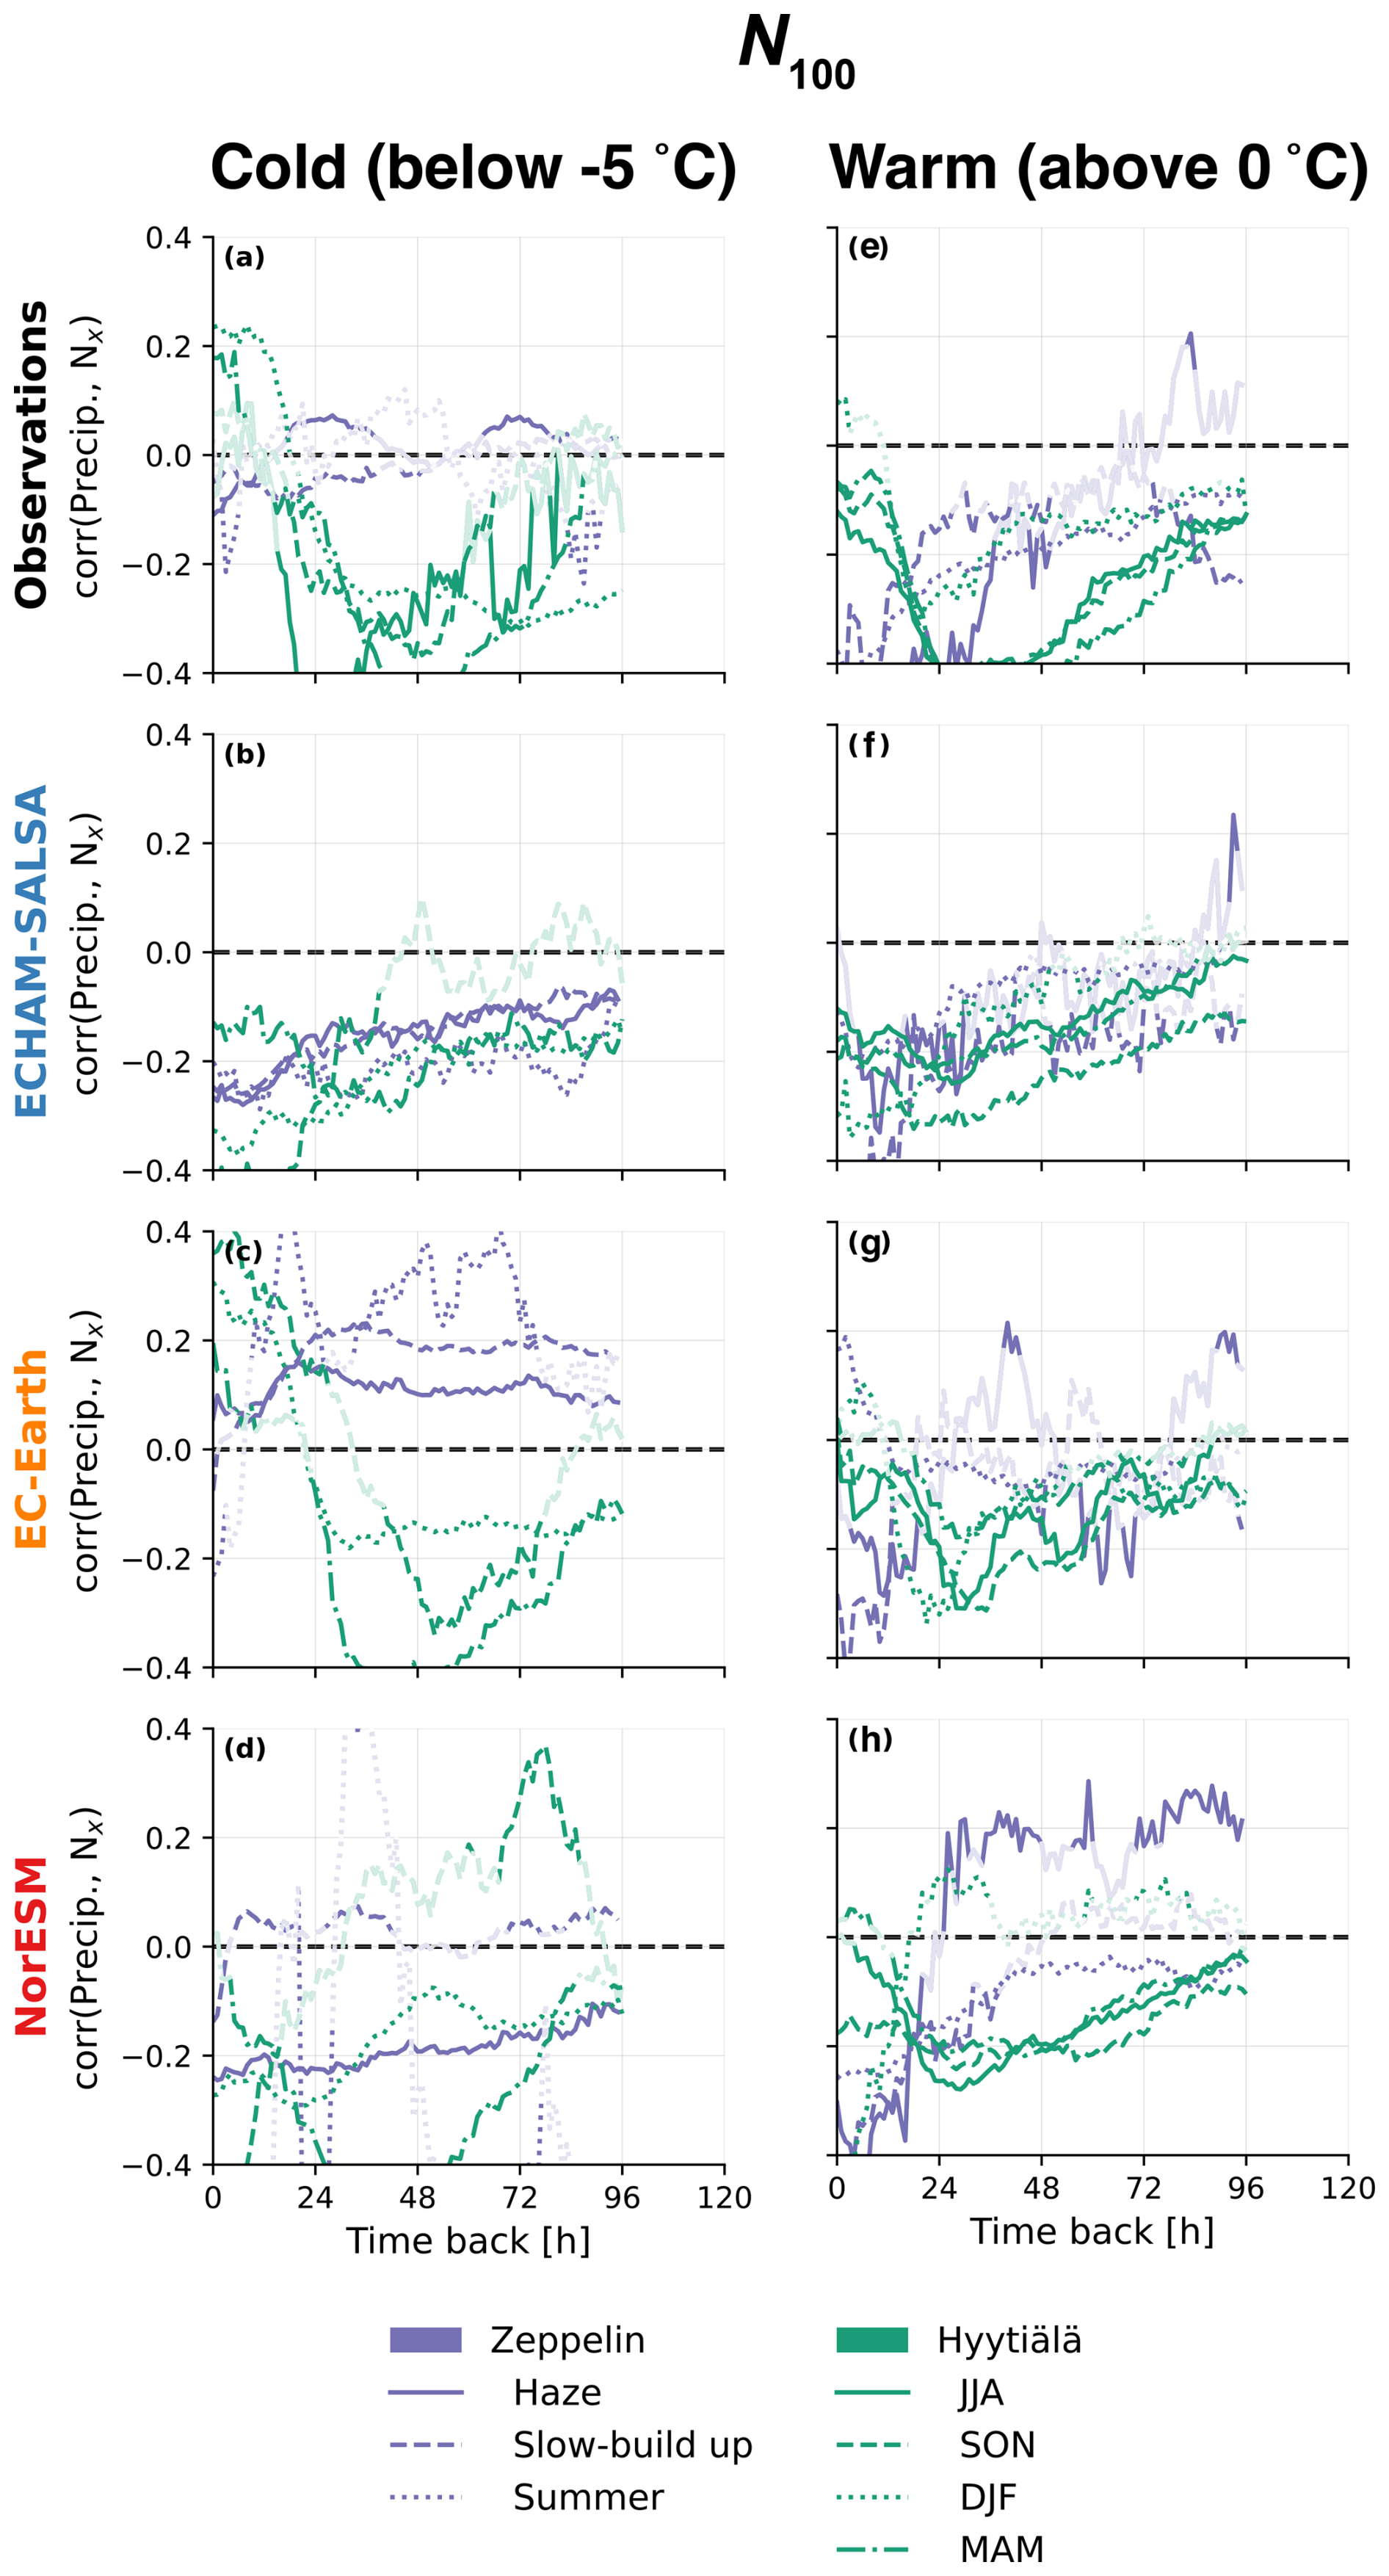
Figure 8Spearman correlations between precipitation rate and N100 for cold (defined as below −5 °C at the station) versus warm (defined as above 0 °C at the station) conditions at the station separately. Otherwise the same as Fig. 7.
As shown in the section above, for Zeppelin, EC-Earth shows a surprising positive correlation between almost all particle size ranges and precipitation, and the only negative correlation is found during summer. Calculating separate correlations for cold (below −5 °C) and warm (above 0 °C) conditions at the stations, shown in Fig. 8, gives indications that cold conditions, and thus likely solid precipitation, are responsible for this positive correlation. Also, when separating the data into cold and warm periods, it becomes clear that the models agree with observations much better in the warm periods, with quite consistent negative correlations for recent precipitation at Zeppelin, and for not so recent precipitation in Hyytiälä. However, for the cold periods, the observations at Zeppelin do not show significant correlations, EC-Earth shows a positive correlation and NorESM displays fairly chaotic behaviour. ECHAM-SALSA is, on the other hand, exactly the same in the cold and the warm period, suggesting precipitation phase has of little importance in this model.
For EC-Earth the difference in the correlations between cold and warm aligns well with a very low in-cloud scavenging for ice and mixed phase clouds (see Table 1) compared to liquid clouds. When separating to cold and warm periods, EC-Earth actually turns out to be among the best-performing models for N100.
3.5 Cloud processing at Hyytiälä?
In Hyytiälä, the observations show that the negative correlation between precipitation and accumulation mode particles tends to have a maximum in negative correlation 20–40 h back in time followed by a positive correlation for recent precipitation (Observations in DJF, MAM, JJA and almost in SON, see Figs. 3, S12b, S14b, S15b). This is partially reproduced in the models: EC-Earth has a positive correlation in DJF, MAM and SON, NorESM only almost has one in MAM but with an almost zero correlation in JJA, ECHAM-SALSA only has a weakened negative correlation for MAM, JJA and SON). Khadir et al. (2023) suggest that this positive signal may be due to cloud processing.

Figure 9Correlations between precipitation rate and aerosol mass for observation (ACSM data and Aethalometer measurements, a–d) and models (e–h). Each line represents a season at a station (see colorbar), while each model is indicated by a different linestyle (see legend). Faint lines indicate where the correlation is not significant (p>0.05). The correlations are shown for Organics (Org, a and e), sulfate (SO4, b and f), Nitrate (NO3, c), Black Carbon (eBC880/BC, d and h) and sea salt aerosol (SS, g).
However, when analysing the observed composition of the particles and how this correlates with precipitation at Hyytiälä (see Fig. 9), it seems that most compounds have a positive correlation with recent precipitation. Typical cloud processing products like sulfate do not stand out in this regard, but rather look similar to eBC, organics and NO3. The models tend to produce a similar pattern: the correlation moves to less negative or even positive for recent precipitation for all species except for sea salt (SS), which does the opposite. Overall, this suggests that both models and observations may be capturing some spurious correlation between source regions and precipitation, since the pattern shows up both for species that may indicate cloud processing and ones that are unlikely to be positively influenced by cloud processing (for example BC). It also does not show up for SS, which is non-anthropogenic in origin.
Furthermore, dividing the trajectories into ones with both low recent precipitation (last 18 h before the airmass arrival at the station) and low N200 (defined as below the mean) and high recent precipitation and high N200 (defined as above the mean) reveals a distinct spatial pattern (Fig. S25) where the first group comes from the north-west and the second comes from the south-east. This adds evidence to the spurious correlation claim. Restricting the data to the “polluted sector” (−175 to 5° centered at the station) does also remove the positive correlation (see Fig. S26), however it is still there when restricted to the “clean sector” (see Fig. S27). This points to some difficulty when interpreting especially recent precipitation influence, because the impact of local sources is naturally higher. In the end, the evidence above is not completely conclusive as to what causes this positive correlation, but does suggest that it cannot be explained solely by a classic cloud processing in the sense of in-cloud sulfate production and droplet collision coalescence.
3.6 A second perspective: Using machine learning (XGBoost)
Finally, we also investigate the relationship between precipitation and the PNSD using the machine learning algorithm XGBoost (see methods in Sect. 2.6). This gives a valuable second perspective as the XGBoost regression we built also takes the trajectory positions, time of day and day of year as input. All these variables may be confounding factors for the relationships we observe. In the best case scenario, the XGBoost regression for each data source (models and observations) can isolate the precipitation signal from other potential confounders, since trajectory path, time of day, and day of year are accounted for by other input features.
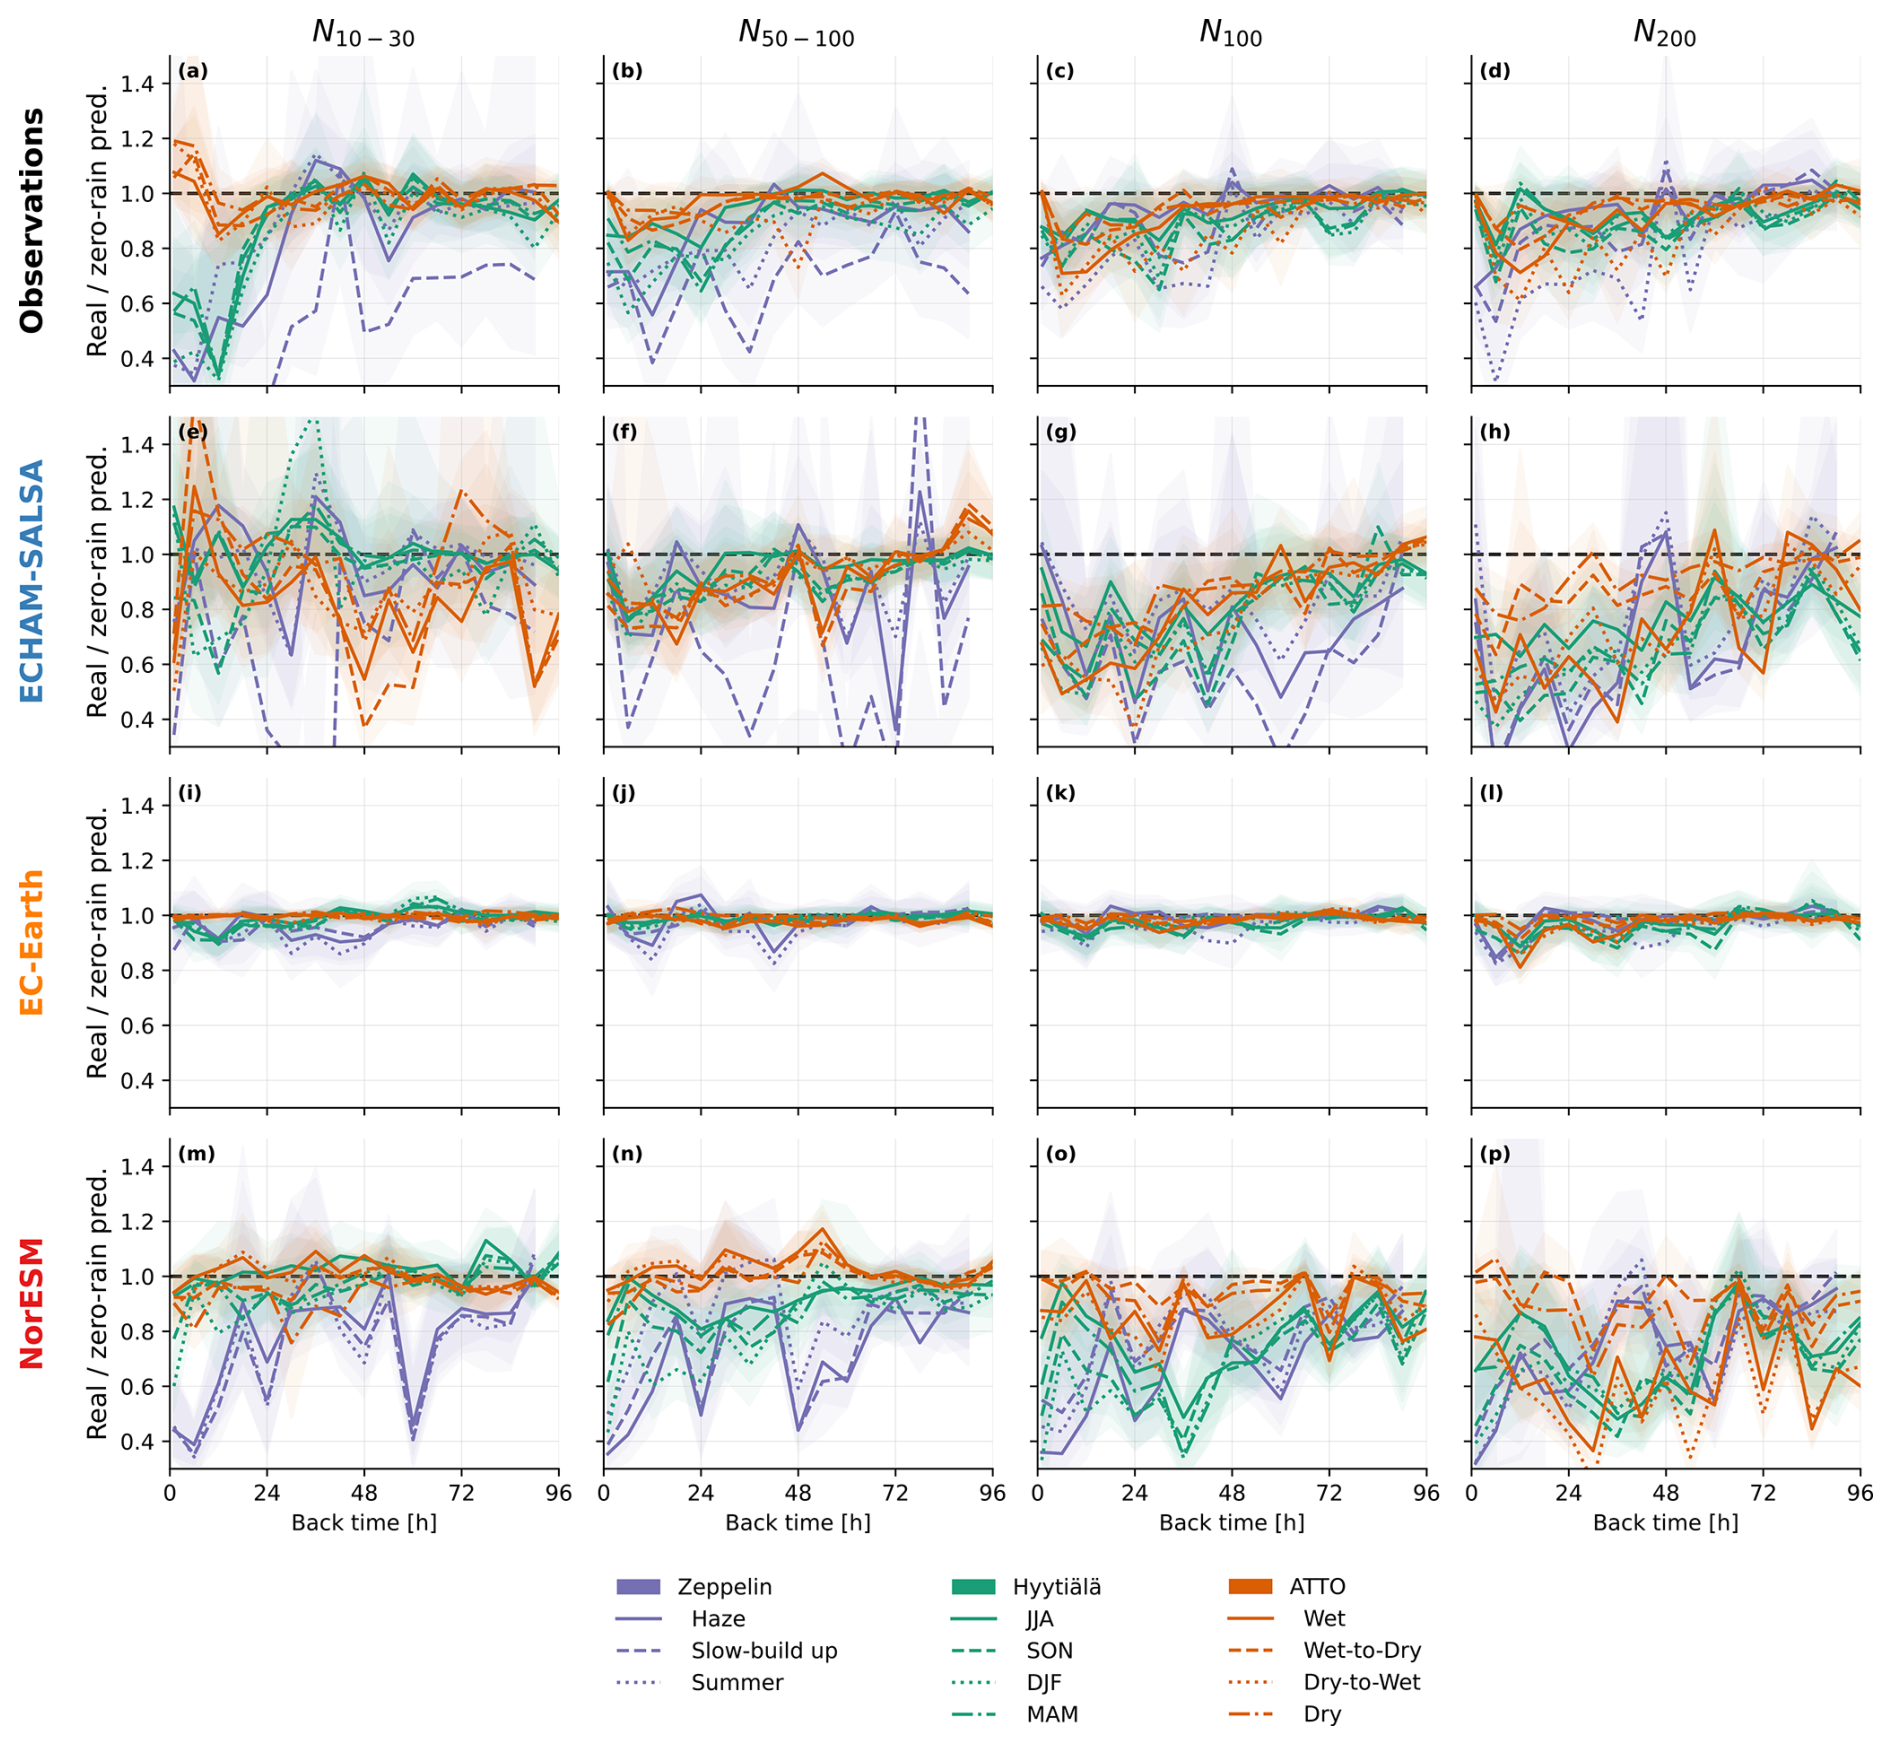
Figure 10The ratio between the predicted number concentration using the actual rain along the back trajectories and the prediction when the rain was set to zero at each 6 h interval back in time separately for N10–30 (first column), N50–100 (second column), N100 (third column) and N200 (last column). Each line represents a season at each station, with linestyle indicating the season and the color indicating the station. For each time along the back trajectories, only trajectories where there actually was a decent amount of precipitation at the back time in question are included, defined as above the 75th percentile observed precipitation for the station in question. The equivalent plot for the correlation analysis can be found in Fig. S19.
In Sect. S11, we present evaluations of the XGBoost model trained on the years up to 2018, and tested on year 2018. It reveals essentially that overall XGBoost captures the main features, but that the smallest particles are the hardest to predict. This applies especially for ATTO where XGBoost struggles to reproduce two of the models (not NorESM) and observations for N10–30, and that Zeppelin is in general hard to predict with the input parameters chosen here. Section S11.2 also presents SHAP (SHapley Additive exPlanations) values for the XGBoost regression models (Shapley, 1953; Lundberg and Lee, 2017). SHAP values are a method from game theory used to explain the output of machine learning models. Essentially, these values explain how much each feature (i.e. our input parameters) contributed to a particular prediction.
Figure 10 shows the ratio of the XGBoost prediction with actual rainfall along the back trajectory and the prediction when the precipitation is set to zero at the given back time for N10–30 (first column), N50–100 (second column), N100 (third column) and N200 (last column) for times when there was considerable precipitation – defined as above the 75th percentile in the observations for each station. In other words, it shows values above one if the “real precipitation” caused an increase in number concentration (e.g. N100) according to XGBoost, and a negative signal if it caused a decrease. When comparing these results to the correlation analysis, it is important to note that this is not a direct apples-to-apples comparison. A positive Spearman correlation tells us that higher precipitation tends to be associated with higher particle number concentrations in a rank sense, but does not quantify the physical magnitude of that relationship – a weak but consistent effect can produce a clearly positive correlation coefficient. The XGBoost results in Fig. 10, on the other hand, directly estimate how much the actual precipitation is predicted to have changed the number concentration relative to a no-rain scenario. A near-unity result therefore does not falsify or contradict a positive correlation, but indicates that while the relationship may be real, its absolute impact on number concentration is modest.
-
The smallest particles, N10–30 and recent precipitation. For these, recent precipitation leads to XGBoost predicting a large decrease (around 60 % decrease) for Hyytiälä and Zeppelin, while predicting a considerable increase for ATTO (up to 20 %), thus aligning with the correlation results shown in Figs. 3–5. The models, in general, do not manage to reproduce this, except that ECHAM-SALSA shows some signs of an increase at ATTO. This is consistent with the correlation analysis and models not reproducing NPF inhibition by clouds and precipitation. Furthermore, EC-Earth and NorESM show strong positive correlations for recent precipitation and N10–30 at ATTO, while XGBoost shows a much more muted response, indicating that the positive correlations found in the correlation analysis are captured by other features in the XGBoost model (e.g. the strong diurnal variability). SHAP values for recent precipitation rates in Fig. 11 (equivalent for Zeppelin and Hyytiälä is found in Figs. S64, S65) show that both models and observations have XGBoost predicting decrease in N10–30 for moderate precipitation, and increase in concentations for high precipitation. Note however that the XGBoost does quite poorly in predicting N10–30 at ATTO for all data sources except NorESM. These results should therefore be interpreted with some caution. If we assume that XGBoost is here picking up real features, however, then this tells us that the models do reproduce a downdraft transport of smaller particles associated with strong convective rainfall, but that it is too weak (note different y-axis limits in Fig. 11).
-
Indirect NPF and growth. The correlation analysis indicated that all the models underestimate the impact or growth of newly formed particles to sizes larger than 50 and 100 nm – except for NorESM and EC-Earth at ATTO (see Figs. 3– 6). The XGBoost analysis largely confirms this. For observations, the negative impact of recent precipitation on N10–30 (less than 24 h) at Zeppelin and Hyytiälä, turns into a positive impact for 24/36 h back in time, while in ATTO it is weakly positive (Fig. 10a) from the very recent precipitation. For N50–100 (Fig. 10b) XGBoost indicates a net zero or weakly positive impact of precipitation around 36 h back in time for ATTO and Hyytiälä, while for Zeppelin it approaches zero around 80 h back in time (again consistent with e.g. Fig. S19. For N100 (Fig. 10c) the negative impact of precipitation persists for longer (around 72–80 h). On the model side, NorESM and ECHAM-SALSA show some sign of increase in N10–30 with precipitation 24/36 h before arrival at the station at Hyytiälä (as in the correlation results), but only ECHAM-SALSA is close to the observations at Zeppelin. In terms of the growth, correlation analysis shows that negative impact of recent precipitation on N50–100 returns to zero or positive values as early as 48 h before arrival at Hyytiälä (JJA) and ATTO (Wet) and somewhat later in Summer at Zeppelin (around 78). Overall the return to zero/positive is earlier (closer to the station) for N50–100 than for N100. These features are broadly reproduced in XGBoost (see Fig. 10b and c). The correlation analysis further shows that the models fail to reproduce the observed growth to larger sizes at Zeppelin and Hyytiälä. The XGBoost analysis shows a similar picture for N50–100: EC-Earth has a negligible impact of precipitation (Fig. 10j), while NorESM and ECHAM-SALSA (Fig. 10f and n) has a negative impact for too long back in time for Hyytiälä, while at Zeppelin XGBoost results are more noisy, perhaps indicating an unclear signal (also seen in seasons in the correlation analysis). Both NorESM and EC-Earth have a slightly positive impact of precipitation at Zeppelin on N50–100 around 18–36 h before arrival at the station. This is not reflected in the correlation analysis, although these models show somewhat chaotic correlations at this station (see e.g. discussion about temperature impact above). For ATTO, XGBoost also shows the rapid growth in NorESM and EC-Earth that the correlation analysis highlighted – although for EC-Earth the signal is too weak to see very well. ECHAM-SALSA also shows a too weak growth or too weak impact of NPF particles by a too persistent negative impact of precipitation on N50–100 – something that was hard to distinguish due to the strong diurnal pattern in the correlation analysis. For NorESM it is worth noting that while N50–100 increases with precipitation from approximately 12 h and persists until 72 h before arrival at the station, for N100 (Fig. 10o) the value remains low and in contrast to the observations (Fig. 10c) does not have a smooth return towards zero. This indicates that the model has both too fast growth to sizes above 50 nm but too slow growth to sizes above 100 nm: As shown in Blichner et al. (2024), NorESM has too much high production of biogenic SOA in the ATTO region, consistent with too fast growth to sizes above 50 nm. However, the aerosol scheme in NorESM does not represent growth out of the Aitken mode, meaning that growth can only shift the whole mode to larger sizes, thus efficiently constraining growth to larger sizes (see e.g. discussion in Blichner et al., 2021).
-
EC-Earth. EC-Earth stands out in all size ranges as having a very weak impact of precipitation on particle number in the XGBoost analysis. This is in spite of EC-Earth apparently being the easiest data source for XGBoost to replicate judging by the r-values in Fig. S39. The EC-Earth number concentration seems to be very predictable mainly by source region (see Sect. S11.2). From the correlation analysis, EC-Earth stands out as having strongly oscillating correlations at ATTO and positive correlations between precipitation and particle concentrations in the cold season in Zeppelin (see e.g. Fig. 7). Also, somewhat weaker negative correlations for EC-Earth than the other models can be seen for Hyytiälä for N100 and N200 (see Fig. 7). Thus, combining these together, it is not completely implausible that EC-Earth has a much weaker impact of precipitation on aerosol number than the other models or what is observed, although the difference is much more marked with the XGBoost analysis than the correlation analysis. It is also the only one among the models that uses fixed scavenging coefficients for nucleation and impaction scavenging even in liquid clouds, which could explain why it behaves differently from the other models.
-
Positive Zeppelin correlations for EC-Earth and NorESM. For Zeppelin, EC-Earth and NorESM have positive or very weakly negative correlations with precipitation, especially in cold seasons (see e.g. Fig. 7), which XGBoost occasionally shows as well especially between 12–36 h before the station for N50–100.
-
Cloud processing at Hyytiälä? As discussed above, the positive or near zero correlations between recent (less than 6 h) precipitation and N200 (see Fig. 7) found for models and the observations at Hyytiälä, has been suggested to be due to cloud processing. The XGBoost results on the other hand do not suggest a positive here (see Fig.10d, h, l and p) for any of the models or the observations. Instead, XGBoost likely attributes the positive correlation to source region, highlighted by Fig. S55 showing the SHAP values for each grid cell versus the SHAP values for recent precipitation in Fig. S73. This gives further evidence that it is indeed a spurious correlation between precipitation and source region, rather than a real process related to cloud processing.
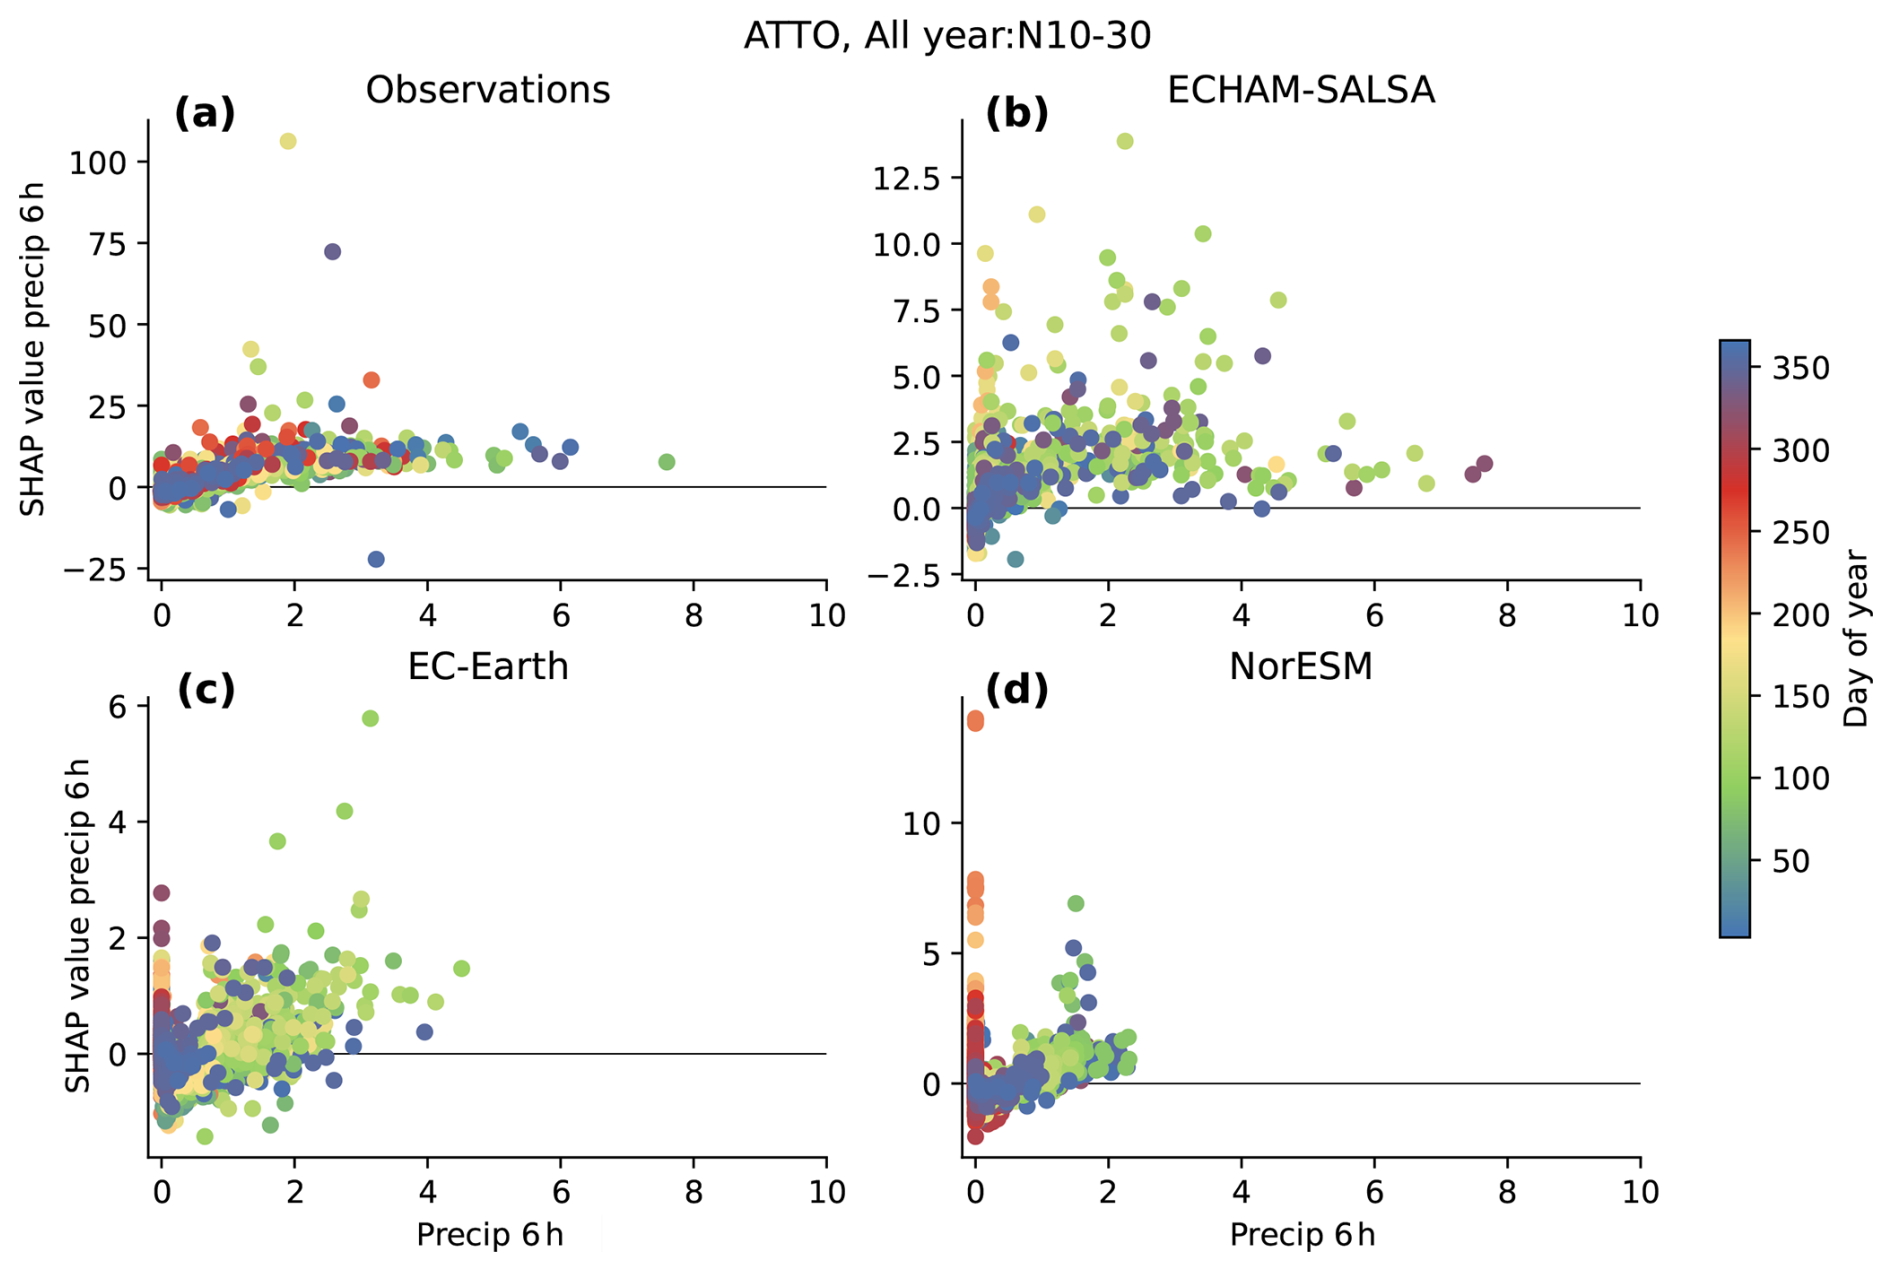
Figure 11ATTO: Scatter plots showing the SHAP values for of the first 6 h average precipitation rate prior to the airmass reaching the station for predicting N10–30. The color indicated the day of the year.
In this study, the timing-resolved impact of precipitation on PNSD is investigated in models versus observations – in other words, what is the impact of precipitation at different times in the past on particles in different parts of the size range (Khadir et al., 2023). This is done for three stations: Zeppelin in the Arctic, Hyytiälä in the boreal forest, and ATTO in the Amazon rain forest.
The objective of this is to evaluate the impact of precipitation on the CCN budget, which again impacts cloud properties and local temperature and climate. We have evaluated three GCMs, NorESM, EC-Earth and ECHAM-SALSA, using primarily the methodology developed by Khadir et al. (2023), where the correlation between precipitation rates along back trajectories and observed (or modeled) PNSD at the stations are utilized. We supplement this analysis by using an XGBoost regression model for each data source (models and observations) trained to predict particle concentrations based on a minimal set of meteorologically and chemically relevant predictors, including precipitation rate, trajectory position, time of day, and day of year. We then examine the impact of precipitation predicted by the XGBoost model for each data source in order to be able to account for potentially confounding factors.
A key goal was to investigate to what extent the models could represent the indirect source of NPF induced by precipitation identified in Khadir et al. (2023), that is, there is a positive correlation in the observations between precipitation several days back in time and particles of the smallest sizes, likely originating from growing particles formed by NPF. The mechanism that causes this is hypothesized to be a lower condensation and coagulation sink due to precipitation, priming the atmosphere for NPF. We see that models tend to represent the positive correlation between precipitation in the past and smaller particles. However, for Zeppelin and Hyytiälä, the positive correlation is less strong than in the observations and also does not extend to as large sizes as in the observations. This indicates that the growth of the newly formed particles is too slow in the models or that the number of particles formed is not enough to induce a positive correlation for particles in CCN sizes (above 50 nm).
ATTO stands out from the other two stations with respect to NPF, because the correlation between rainfall and small particles is immediate, i.e. there is a positive correlation even for rainfall just before arriving at the station (recent rainfall). This has been hypothesized to be driven by downdraft transport of particles during strong convection (Wang et al., 2016) or by injection of ozone by downdrafts (Machado et al., 2024). Our initial hypothesis was that the models would not be able to represent this, due to their coarse resolution and the simplified representation of downdrafts. However, the models do show an almost immediate positive correlation between recent precipitation and small Aitken/nucleation mode particles. The question remains if they have it right for the right reasons: Both EC-Earth and NorESM have local nucleation at ATTO, which has been believed to not occur (see e.g. Wang et al., 2016), so they may instead represent positive correlations due to these. On the other hand, both models clearly respond differently to recent precipitation at ATTO compared to at Zeppelin and Hyytiälä: at the former there is a positive correlation with recent precipitation, and the latter the positive correlation is only for precipitation a day or more in the past. This is also supported by the XGBoost analysis. Furthermore, if the appearance of the smallest particles after rain is driven by ozone injection with downdraft (Machado et al., 2024), then NorESM and ECHAM-SALSA certainly cannot represent these injections and must be representing the positive association for a different reason.
Overall, this seems to suggest that models and observations agree that precipitation correlates with the appearance of smaller particles at ATTO, and this should be further investigated both in terms of whether the models are right for the right reasons and in terms of what the models can tell us about the real mechanism behind the appearance of these particles at ATTO.
Both EC-Earth and NorESM show positive correlations with recent precipitation for very large particles at ATTO. This suggests a much too fast growth of newly formed particles in these models, consistent with the overestimation of organic aerosol found in these models in Blichner et al. (2024). It also may suggest challenges with these models' modal structure, giving increases in too many large particles due to the limited resolution in size and highly parameterized growth.
In terms of particle scavenging, the results were inconclusive for the smallest particles (10–30 nm), although the models did seem to consistently underestimate the scavenging at Hyytiälä, which was also shown in the XGBoost results. For accumulation mode particles (N100 and N200) models mostly agree well with observations for Hyytiälä. For ATTO, ECHAM-SALSA performs fairly well, but the two other models struggle due to highly unrealistic growth of the newly formed particles (see above) and therefore have positive correlation even for N100 and N200.
For Zeppelin, there are considerable discrepancies in the cold seasons. Note that using different re-analysis datasets for the precipitation (GDAS versus ERA5) here also made a larger difference than in the other stations, and caution should therefore be advised in interpreting the results. This is perhaps not surprising, given the wide discrepancies in cloud properties among reanalysis datasets in the Arctic in general (Yeo et al., 2022). However, it is clear that when the data are separated into times with temperatures below −5 °C and above 0 °C, the models do much better when the temperature is above 0°, indicating that the discrepancies originate from cold clouds and the treatment of mixed and glaciated clouds. Note that even the observations do not show a significant negative correlation between N100 and recent precipitation at Zeppelin. ECHAM-SALSA shows similar results for cold and warm periods, which is actually inconsistent with the observations at Zeppelin, which show much stronger negative correlations when temperatures are higher.
The methodology of this study assumes that back trajectories produced with one reanalysis dataset (GDAS) can be used to extract 2D precipitation fields from nudged model simulations and other re-analysis datasets (ERA5) without this significantly influencing the results. Using the HYSPLIT trajectories instead of, for example, trajectories based on model meteorology will naturally introduce some error, but at the same this methodology gives a more representative comparison to the observations, where we also expect some error introduced between the “true” trajectory and the one based on re-analysis data. When comparing the analyses of the observations using data from the two different reanalysis datasets, we find mainly the same features, which give us confidence in both the observational and the model analysis. A potential exception is the two cold seasons at Zeppelin (Slow build-up and Haze), where the two datasets differ more, which gives more grounds for caution when interpreting results from these seasons.
Compared to “reality” there is an, to some extent, unknown error in the trajectory compared to the “real” back trajectory of the airmass arriving at the station and in the precipitation experienced along that trajectory. In other words, the observational constraints include noise from trajectories deviating from the “real” back trajectory and the “real” experienced precipitation. When models are nudged with ERA-Interim data and then we use the GDAS trajectories to extract precipitation history in the models, we are introducing a similar level of noise to what we have in the observations, at least if we assume the difference between ERA-Interim data and GDAS data is similar to the difference between the observations and the GDAS data. Viewed this way, it may actually be considered a more apples-to-apples comparison to use different datasets for nudging and trajectories.
Finally, the XGBoost results mainly align with the correlation analysis, thus strengthening our confidence in the conclusions. In particular, the correlation plots show positive correlations between recent precipitation and N100 and N200 at Hyytiälä, something that was hypothesised in Khadir et al. (2023) to be due to cloud processing. The XGBoost results, on the other hand, do not attribute this to precipitation but rather source region. This demonstrates how using machine learning used like this in model evaluation can serve as a powerful tool for uncovering potential spurious correlations and to control for factors unrelated to the process under investigation.
The model deficiencies highlighted here have implications for climate projections in several ways. Firstly, a misrepresentation of CCN replenishment after rain is a symptom of a more general problem, i.e. that the path from NPF to CCN is not well represented. This matters because NPF becomes more important for the CCN budget in cleaner atmospheres, thus acting as a buffer for changes in other emissions (e.g. Gordon et al., 2017), e.g. reductions in future climate projections. At ATTO station, our results suggest that two models (NorESM and EC-Earth) overestimate the impact of CCN replenishment after rain via NPF, likely due to an overestimation of organic aerosols. At the high latitude stations however, all the models underestimate this same impact. If high-latitude conditions are more representative of the global atmosphere, this bias would lead models to overestimate the climate impact of future changes in aerosol emissions; if ATTO-like conditions dominate, the opposite bias would result. Future research should therefore focus on including more stations and a global perspective as well as model development. Secondly, the poor performance of models in the cold season at Zeppelin station may lead to unrealistic feedback representations as the Arctic warms under global warming, due to shifts from glaciated, to mixed and liquid clouds. Ultimately, narrowing these process-level biases in the precipitation–NPF–CCN pathway will aid in constraining the magnitude of aerosol-driven climate forcing and feedbacks under continued emission reductions.
The analysis is available at https://doi.org/10.5281/zenodo.21701735 (Blichner, 2026). The particle number size distribution and trajectory data used in this study are available to download at https://doi.org/10.5281/zenodo.7907473 (Khadir, 2023), which also includes the precipitation data from TRMM 3B42 V7 satellite product (Michot et al., 2018) used for ATTO. The temperature timeseries can be downloaded from ACTRIS for Zeppelin (https://doi.org/10.48597/RP9S-9PKU, Aas, 2015; https://doi.org/10.48597/2MF2-3X96, Aas, 2016; https://doi.org/10.48597/84JN-CNSP, Aas, 2021b; https://doi.org/10.48597/V3MN-G5X2, Aas, 2021a; https://doi.org/10.48597/3N4J-7DMB, Aas, 2022) and Hyytiälä (https://doi.org/10.48597/N5C6-V7QN, Kulmala and Petäjä, 2024). The aerosol particle composition data from the ACSM and the eBC data from Aethalometer measurements for Hyytiälä is available from the EBAS database at https://www.ebas-data.nilu.no, last access: 8 May 2025. ERA5 data is available for download from https://doi.org/10.24381/CDS.ADBB2D47 (C3S, 2018). The full dataset for the analysis is available to download from https://doi.org/10.5281/zenodo.15528150 (Blichner, 2025).
The supplement related to this article is available online at https://doi.org/10.5194/acp-26-11281-2026-supplement.
SB did the analysis and wrote the paper with help especially from IR, TK and ST. CS, SB and IM ran the models (EC-Earth, NorESM and ECHAM-SALSA respectively). SB, TK, ST and IR conseptualized the study. AV especially gave input and support on the XGBoost analysis. All co-authors commented, edited and gave feedback on the manuscript.
At least one of the (co-)authors is a member of the editorial board of Atmospheric Chemistry and Physics. The peer-review process was guided by an independent editor, and the authors also have no other competing interests to declare.
Publisher's note: Copernicus Publications remains neutral with regard to jurisdictional claims made in the text, published maps, institutional affiliations, or any other geographical representation in this paper. The authors bear the ultimate responsibility for providing appropriate place names. Views expressed in the text are those of the authors and do not necessarily reflect the views of the publisher.
The computations and data processing were enabled by resources provided by the National Academic Infrastructure for Supercomputing in Sweden (NAISS) at at the National Supercomputer Centre (NSC), partially funded by the Swedish Research Council through grant agreement no. 2022-06725. We acknowledge CSC – IT Center for Science, Finland, for providing the computational resources used to run ECHAM-SALSA. The ECHAM-HAMMOZ model is developed by a consortium comprising ETH Zurich, Max Planck Institute for Meteorology, Forschungszentrum Jülich, the University of Oxford, the Finnish Meteorological Institute, and the Leibniz Institute for Tropospheric Research, and is managed by the Leibniz Institute for Tropospheric Research (TROPOS).
Some data used in this study were accessed from EBAS (https://ebas.nilu.no, last access: 10 August 2026) hosted by NILU. Specifically, the use included data affiliated with the framework: GAW-WDCA, ACTRIS, EMEP and NILU. Further, we acknowledge Krista Luoma for valuable help with the black carbon data and Peter Tunved for great discussion and input. Thanks also to Diego Aliaga for always providing good discussions and input.
This research has been supported by the European Commission, EU Horizon 2020 Framework Programme (grant nos. 867599, 101137639 and 101137680), the Vetenskapsrådet (grant nos. 2023-03842, 2022-02836, and 2022-06725), the Knut och Alice Wallenbergs Stiftelse (grant nos. 2015.0162, 2021.0169, 2021.0298, and 2022.0104) and Goran Gustafssons stiftelse.
The publication of this article was funded by the Swedish Research Council, Forte, Formas, and Vinnova.
This paper was edited by Peer Nowack and reviewed by Joseph Carton-Kelly, Anthony Jones, and one anonymous referee.
Aas, W.: Measurement of Temperature at Zeppelin Mountain (Ny-Ålesund), EMEP, NILU, https://doi.org/10.48597/RP9S-9PKU, 2015. a
Aas, W.: Measurement of Temperature at Zeppelin Mountain (Ny-Ålesund), EMEP, NILU, https://doi.org/10.48597/2MF2-3X96, 2016. a
Aas, W.: Measurement of Meteorology at Zeppelin Mountain (Ny-Ålesund), EMEP, NILU, https://doi.org/10.48597/V3MN-G5X2, 2021a. a
Aas, W.: Measurement of Temperature at Zeppelin Mountain (Ny-Ålesund), EMEP, NILU, https://doi.org/10.48597/84JN-CNSP, 2021b. a
Aas, W.: Measurement of Meteorology at Zeppelin Mountain (Ny-Ålesund), EMEP, NILU, https://doi.org/10.48597/3N4J-7DMB, 2022. a
Abdul-Razzak, H. and Ghan, S. J.: A Parameterization of Aerosol Activation: 2. Multiple Aerosol Types, J. Geophys. Res.-Atmos., 105, 6837–6844, https://doi.org/10.1029/1999JD901161, 2000. a, b
Abdul-Razzak, H. and Ghan, S. J.: A Parameterization of Aerosol Activation 3. Sectional Representation, J. Geophys. Res.-Atmos., 107, AAC 1-1–AAC 1-6, https://doi.org/10.1029/2001JD000483, 2002. a, b, c
Albrecht, B. A.: Aerosols, Cloud Microphysics, and Fractional Cloudiness, Science, 245, 1227–1230, https://doi.org/10.1126/science.245.4923.1227, 1989. a
Andreae, M. O., Afchine, A., Albrecht, R., Holanda, B. A., Artaxo, P., Barbosa, H. M. J., Borrmann, S., Cecchini, M. A., Costa, A., Dollner, M., Fütterer, D., Järvinen, E., Jurkat, T., Klimach, T., Konemann, T., Knote, C., Krämer, M., Krisna, T., Machado, L. A. T., Mertes, S., Minikin, A., Pöhlker, C., Pöhlker, M. L., Pöschl, U., Rosenfeld, D., Sauer, D., Schlager, H., Schnaiter, M., Schneider, J., Schulz, C., Spanu, A., Sperling, V. B., Voigt, C., Walser, A., Wang, J., Weinzierl, B., Wendisch, M., and Ziereis, H.: Aerosol characteristics and particle production in the upper troposphere over the Amazon Basin, Atmos. Chem. Phys., 18, 921–961, https://doi.org/10.5194/acp-18-921-2018, 2018. a
Balkanski, Y. J., Jacob, D. J., Gardner, G. M., Graustein, W. C., and Turekian, K. K.: Transport and Residence Times of Tropospheric Aerosols Inferred from a Global Three-Dimensional Simulation of 210Pb, J. Geophys. Res.-Atmos., 98, 20573–20586, https://doi.org/10.1029/93JD02456, 1993. a, b
Bardakov, R., Thornton, J. A., Ekman, A. M. L., Krejci, R., Pöhlker, M. L., Curtius, J., Williams, J., Lelieveld, J., and Riipinen, I.: High Concentrations of Nanoparticles From Isoprene Nitrates Predicted in Convective Outflow Over the Amazon, Geophys. Res. Lett., 51, e2024GL109919, https://doi.org/10.1029/2024GL109919, 2024. a
Barth, M. C., Rasch, P. J., Kiehl, J. T., Benkovitz, C. M., and Schwartz, S. E.: Sulfur Chemistry in the National Center for Atmospheric Research Community Climate Model: Description, Evaluation, Features, and Sensitivity to Aqueous Chemistry, J. Geophys. Res.-Atmos., 105, 1387–1415, https://doi.org/10.1029/1999JD900773, 2000. a, b, c
Bechtold, P., Semane, N., Lopez, P., Chaboureau, J.-P., Beljaars, A., and Bormann, N.: Representing Equilibrium and Nonequilibrium Convection in Large-Scale Models, J. Atmos. Sci., https://doi.org/10.1175/JAS-D-13-0163.1, 2014. a
Bentsen, M., Bethke, I., Debernard, J. B., Iversen, T., Kirkevåg, A., Seland, Ø., Drange, H., Roelandt, C., Seierstad, I. A., Hoose, C., and Kristjánsson, J. E.: The Norwegian Earth System Model, NorESM1-M – Part 1: Description and basic evaluation of the physical climate, Geosci. Model Dev., 6, 687–720, https://doi.org/10.5194/gmd-6-687-2013, 2013. a
Bergeron, T.: On the Physics of Cloud and Precipitation: Mémoire Présenté a L'association de Météorologie de L'UGGI, Lisbonne, September 1933, Imprimerie Paul Dupont, 1935. a
Berrisford, P., Dee, D. P., Poli, P., Brugge, R., Fielding, M., Fuentes, M., Kållberg, P. W., Kobayashi, S., Uppala, S., and Simmons, A.: The ERA-Interim Archive Version 2.0, ECMWF, https://www.ecmwf.int/node/8174 (last access: 7 Augsut 2026), 2011. a, b, c
Blichner, S. M.: Trajectory Precipitation and Station Data for Three GCMs and for Observations, Zenodo [data set], https://doi.org/10.5281/zenodo.15528150, 2025. a
Blichner, S. M.: Sarambl/PRCP2SZDST: Release 1, Zenodo [code], https://doi.org/10.5281/zenodo.21701735, 2026. a
Blichner, S. M., Sporre, M. K., and Berntsen, T. K.: Reduced effective radiative forcing from cloud–aerosol interactions (ERFaci) with improved treatment of early aerosol growth in an Earth system model, Atmos. Chem. Phys., 21, 17243–17265, https://doi.org/10.5194/acp-21-17243-2021, 2021. a, b
Blichner, S. M., Yli-Juuti, T., Mielonen, T., Pöhlker, C., Holopainen, E., Heikkinen, L., Mohr, C., Artaxo, P., Carbone, S., Meller, B. B., Quaresma Dias-Júnior, C., Kulmala, M., Petäjä, T., Scott, C. E., Svenhag, C., Nieradzik, L., Sporre, M., Partridge, D. G., Tovazzi, E., Virtanen, A., Kokkola, H., and Riipinen, I.: Process-Evaluation of Forest Aerosol-Cloud-Climate Feedback Shows Clear Evidence from Observations and Large Uncertainty in Models, Nat. Commun., 15, 969, https://doi.org/10.1038/s41467-024-45001-y, 2024. a, b, c, d, e
Bogenschutz, P. A., Gettelman, A., Hannay, C., Larson, V. E., Neale, R. B., Craig, C., and Chen, C.-C.: The path to CAM6: coupled simulations with CAM5.4 and CAM5.5, Geosci. Model Dev., 11, 235–255, https://doi.org/10.5194/gmd-11-235-2018, 2018. a
Bourgeois, Q. and Bey, I.: Pollution Transport Efficiency toward the Arctic: Sensitivity to Aerosol Scavenging and Source Regions, J. Geophys. Res.-Atmos., 116, https://doi.org/10.1029/2010JD015096, 2011. a, b, c
Browse, J., Carslaw, K. S., Arnold, S. R., Pringle, K., and Boucher, O.: The scavenging processes controlling the seasonal cycle in Arctic sulphate and black carbon aerosol, Atmos. Chem. Phys., 12, 6775–6798, https://doi.org/10.5194/acp-12-6775-2012, 2012. a, b
C3S: ERA5 Hourly Data on Single Levels from 1940 to Present, Copernicus Climate Change Service (C3S) Climate Data Store (CDS) [data set], https://doi.org/10.24381/CDS.ADBB2D47, 2018. a, b
Chen, T. and Guestrin, C.: XGBoost: A Scalable Tree Boosting System, in: Proceedings of the 22nd ACM SIGKDD International Conference on Knowledge Discovery and Data Mining, Kdd '16, ACM, New York, NY, USA, 785–794, ISBN 978-1-4503-4232-2, https://doi.org/10.1145/2939672.2939785, 2016. a, b
Croft, B., Lohmann, U., Martin, R. V., Stier, P., Wurzler, S., Feichter, J., Posselt, R., and Ferrachat, S.: Aerosol size-dependent below-cloud scavenging by rain and snow in the ECHAM5-HAM, Atmos. Chem. Phys., 9, 4653–4675, https://doi.org/10.5194/acp-9-4653-2009, 2009. a, b, c, d, e
Croft, B., Lohmann, U., Martin, R. V., Stier, P., Wurzler, S., Feichter, J., Hoose, C., Heikkilä, U., van Donkelaar, A., and Ferrachat, S.: Influences of in-cloud aerosol scavenging parameterizations on aerosol concentrations and wet deposition in ECHAM5-HAM, Atmos. Chem. Phys., 10, 1511–1543, https://doi.org/10.5194/acp-10-1511-2010, 2010. a, b, c, d, e, f, g, h
Curtius, J., Heinritzi, M., Beck, L. J., Pöhlker, M. L., Tripathi, N., Krumm, B. E., Holzbeck, P., Nussbaumer, C. M., Hernández Pardo, L., Klimach, T., Barmpounis, K., Andersen, S. T., Bardakov, R., Bohn, B., Cecchini, M. A., Chaboureau, J.-P., Dauhut, T., Dienhart, D., Dörich, R., Edtbauer, A., Giez, A., Hartmann, A., Holanda, B. A., Joppe, P., Kaiser, K., Keber, T., Klebach, H., Krüger, O. O., Kürten, A., Mallaun, C., Marno, D., Martinez, M., Monteiro, C., Nelson, C., Ort, L., Raj, S. S., Richter, S., Ringsdorf, A., Rocha, F., Simon, M., Sreekumar, S., Tsokankunku, A., Unfer, G. R., Valenti, I. D., Wang, N., Zahn, A., Zauner-Wieczorek, M., Albrecht, R. I., Andreae, M. O., Artaxo, P., Crowley, J. N., Fischer, H., Harder, H., Herdies, D. L., Machado, L. A. T., Pöhlker, C., Pöschl, U., Possner, A., Pozzer, A., Schneider, J., Williams, J., and Lelieveld, J.: Isoprene Nitrates Drive New Particle Formation in Amazon's Upper Troposphere, Nature, 636, 124–130, https://doi.org/10.1038/s41586-024-08192-4, 2024. a, b
Dada, L., Paasonen, P., Nieminen, T., Buenrostro Mazon, S., Kontkanen, J., Peräkylä, O., Lehtipalo, K., Hussein, T., Petäjä, T., Kerminen, V.-M., Bäck, J., and Kulmala, M.: Long-term analysis of clear-sky new particle formation events and nonevents in Hyytiälä, Atmos. Chem. Phys., 17, 6227–6241, https://doi.org/10.5194/acp-17-6227-2017, 2017. a, b
Dana, M. T. and Hales, J. M.: Statistical Aspects of the Washout of Polydisperse Aerosols, Atmos. Environ., 10, 45–50, https://doi.org/10.1016/0004-6981(76)90258-4, 1976. a, b
Danabasoglu, G., Lamarque, J.-F., Bacmeister, J., Bailey, D. A., DuVivier, A. K., Edwards, J., Emmons, L. K., Fasullo, J., Garcia, R., Gettelman, A., Hannay, C., Holland, M. M., Large, W. G., Lauritzen, P. H., Lawrence, D. M., Lenaerts, J. T. M., Lindsay, K., Lipscomb, W. H., Mills, M. J., Neale, R., Oleson, K. W., Otto-Bliesner, B., Phillips, A. S., Sacks, W., Tilmes, S., van Kampenhout, L., Vertenstein, M., Bertini, A., Dennis, J., Deser, C., Fischer, C., Fox-Kemper, B., Kay, J. E., Kinnison, D., Kushner, P. J., Larson, V. E., Long, M. C., Mickelson, S., Moore, J. K., Nienhouse, E., Polvani, L., Rasch, P. J., and Strand, W. G.: The Community Earth System Model Version 2 (CESM2), J. Adv. Model. Earth Sy., 12, e2019MS001916, https://doi.org/10.1029/2019MS001916, 2020. a
de Bruine, M., Krol, M., van Noije, T., Le Sager, P., and Röckmann, T.: The impact of precipitation evaporation on the atmospheric aerosol distribution in EC-Earth v3.2.0, Geosci. Model Dev., 11, 1443–1465, https://doi.org/10.5194/gmd-11-1443-2018, 2018. a, b, c
Döscher, R., Acosta, M., Alessandri, A., Anthoni, P., Arsouze, T., Bergman, T., Bernardello, R., Boussetta, S., Caron, L.-P., Carver, G., Castrillo, M., Catalano, F., Cvijanovic, I., Davini, P., Dekker, E., Doblas-Reyes, F. J., Docquier, D., Echevarria, P., Fladrich, U., Fuentes-Franco, R., Gröger, M., v. Hardenberg, J., Hieronymus, J., Karami, M. P., Keskinen, J.-P., Koenigk, T., Makkonen, R., Massonnet, F., Ménégoz, M., Miller, P. A., Moreno-Chamarro, E., Nieradzik, L., van Noije, T., Nolan, P., O'Donnell, D., Ollinaho, P., van den Oord, G., Ortega, P., Prims, O. T., Ramos, A., Reerink, T., Rousset, C., Ruprich-Robert, Y., Le Sager, P., Schmith, T., Schrödner, R., Serva, F., Sicardi, V., Sloth Madsen, M., Smith, B., Tian, T., Tourigny, E., Uotila, P., Vancoppenolle, M., Wang, S., Wårlind, D., Willén, U., Wyser, K., Yang, S., Yepes-Arbós, X., and Zhang, Q.: The EC-Earth3 Earth system model for the Coupled Model Intercomparison Project 6, Geosci. Model Dev., 15, 2973–3020, https://doi.org/10.5194/gmd-15-2973-2022, 2022. a
Emerson, E. W., Katich, J. M., Schwarz, J. P., McMeeking, G. R., and Farmer, D. K.: Direct Measurements of Dry and Wet Deposition of Black Carbon Over a Grassland, J. Geophys. Res.-Atmos., 123, 12277–12290, https://doi.org/10.1029/2018JD028954, 2018. a
Ervens, B.: Modeling the Processing of Aerosol and Trace Gases in Clouds and Fogs, Chem. Rev., 115, 4157–4198, https://doi.org/10.1021/cr5005887, 2015. a
Findeisen, W.: Die Kolloidmeteorologischen Vorgänge Bei Der Niederschlagsbildung, Meteorol. Z., 55, 121–133, 1938. a
Flossmann, A. I. and Wobrock, W.: A Review of Our Understanding of the Aerosol–Cloud Interaction from the Perspective of a Bin Resolved Cloud Scale Modelling, Atmos. Res., 97, 478–497, https://doi.org/10.1016/j.atmosres.2010.05.008, 2010. a
Flossmann, A. I., Hall, W. D., and Pruppacher, H. R.: A Theoretical Study of the Wet Removal of Atmospheric Pollutants. Part I: The Redistribution of Aerosol Particles Captured through Nucleation and Impaction Scavenging by Growing Cloud Drops, J. Atmos. Sci., 42, https://doi.org/10.1175/1520-0469(1985)042<0583:ATSOTW>2.0.CO;2, 1985. a
Forster, P., Storelvmo, T., Armour, K., Collins, W., Dufresne, J.-L., Frame, D., Lunt, D. J., Mauritsen, T., Palmer, M. D., Watanabe, M., Wild, M., and Zhang, X.: The Earth's Energy Budget, Climate Feedbacks, and Climate Sensitivity, in: Climate Change 2021: The Physical Science Basis. Contribution of Working Group I to the Sixth Assessment Report of the Intergovernmental Panel on Climate Change, edited by Masson-Delmotte, V., Zhai, P., Pirani, A., Connors, S. L., Péan, C., Berger, S., Caud, N., Chen, Y., Goldfarb, L., Gomis, M. I., Huang, M., Leitzell, K., Lonnoy, E., Matthews, J. B. R., Maycock, T. K., Waterfield, T., Yelekçi, Ö., Yu, R., and Zhou, B., Cambridge University Cambridge, UK and New York, NY, USA, 923–1054, https://doi.org/10.1017/9781009157896.009, 2021. a, b
Franco, M. A., Ditas, F., Kremper, L. A., Machado, L. A. T., Andreae, M. O., Araújo, A., Barbosa, H. M. J., de Brito, J. F., Carbone, S., Holanda, B. A., Morais, F. G., Nascimento, J. P., Pöhlker, M. L., Rizzo, L. V., Sá, M., Saturno, J., Walter, D., Wolff, S., Pöschl, U., Artaxo, P., and Pöhlker, C.: Occurrence and growth of sub-50 nm aerosol particles in the Amazonian boundary layer, Atmos. Chem. Phys., 22, 3469–3492, https://doi.org/10.5194/acp-22-3469-2022, 2022. a
Gordon, H., Kirkby, J., Baltensperger, U., Bianchi, F., Breitenlechner, M., Curtius, J., Dias, A., Dommen, J., Donahue, N. M., Dunne, E. M., Duplissy, J., Ehrhart, S., Flagan, R. C., Frege, C., Fuchs, C., Hansel, A., Hoyle, C. R., Kulmala, M., Kürten, A., Lehtipalo, K., Makhmutov, V., Molteni, U., Rissanen, M. P., Stozkhov, Y., Tröstl, J., Tsagkogeorgas, G., Wagner, R., Williamson, C., Wimmer, D., Winkler, P. M., Yan, C., and Carslaw, K. S.: Causes and Importance of New Particle Formation in the Present-Day and Preindustrial Atmospheres: CAUSES AND ROLE OF NEW PARTICLE FORMATION, J. Geophys. Res.-Atmos., 122, 8739–8760, https://doi.org/10.1002/2017JD026844, 2017. a, b
Greenfield, S. M.: Rain scavenging of radioactive particulate matter from the atmosphere, J. Atmos. Sci., 14, 115–125, https://doi.org/10.1175/1520-0469(1957)014<0115:RSORPM>2.0.CO;2, 1957. a
Hakala, S., Alghamdi, M. A., Paasonen, P., Vakkari, V., Khoder, M. I., Neitola, K., Dada, L., Abdelmaksoud, A. S., Al-Jeelani, H., Shabbaj, I. I., Almehmadi, F. M., Sundström, A.-M., Lihavainen, H., Kerminen, V.-M., Kontkanen, J., Kulmala, M., Hussein, T., and Hyvärinen, A.-P.: New particle formation, growth and apparent shrinkage at a rural background site in western Saudi Arabia, Atmos. Chem. Phys., 19, 10537–10555, https://doi.org/10.5194/acp-19-10537-2019, 2019. a
Heikkinen, L., Äijälä, M., Riva, M., Luoma, K., Dällenbach, K., Aalto, J., Aalto, P., Aliaga, D., Aurela, M., Keskinen, H., Makkonen, U., Rantala, P., Kulmala, M., Petäjä, T., Worsnop, D., and Ehn, M.: Long-term sub-micrometer aerosol chemical composition in the boreal forest: inter- and intra-annual variability, Atmos. Chem. Phys., 20, 3151–3180, https://doi.org/10.5194/acp-20-3151-2020, 2020. a
Heslin-Rees, D., Tunved, P., Ström, J., Cremer, R., Zieger, P., Riipinen, I., Ekman, A. M. L., Eleftheriadis, K., and Krejci, R.: Increase in precipitation scavenging contributes to long-term reductions of light-absorbing aerosol in the Arctic, Atmos. Chem. Phys., 24, 2059–2075, https://doi.org/10.5194/acp-24-2059-2024, 2024. a
Heslin-Rees, D., Tunved, P., Aliaga, D., Lampilahti, J., Riipinen, I., Ekman, A., Park, K.-T., Mazzini, M., Gilardoni, S., Thakur, R., Park, K., Yoon, Y. J., Lee, K., Sipilä, M., Mazzola, M., and Krejci, R.: Drivers governing the seasonality of new particle formation in the Arctic, Aerosol Research Discuss. [preprint], https://doi.org/10.5194/ar-2025-11, in review, 2025. a
Holopainen, E., Kokkola, H., Laakso, A., and Kühn, T.: In-cloud scavenging scheme for sectional aerosol modules – implementation in the framework of the Sectional Aerosol module for Large Scale Applications version 2.0 (SALSA2.0) global aerosol module, Geosci. Model Dev., 13, 6215–6235, https://doi.org/10.5194/gmd-13-6215-2020, 2020. a, b, c, d, e, f, g
Hoose, C., Lohmann, U., Bennartz, R., Croft, B., and Lesins, G.: Global simulations of aerosol processing in clouds, Atmos. Chem. Phys., 8, 6939–6963, https://doi.org/10.5194/acp-8-6939-2008, 2008a. a, b, c, d
Hoose, C., Lohmann, U., Stier, P., Verheggen, B., and Weingartner, E.: Aerosol Processing in Mixed-Phase Clouds in ECHAM5-HAM: Model Description and Comparison to Observations, J. Geophys. Res.-Atmos., 113, https://doi.org/10.1029/2007JD009251, 2008b. a, b
Hurrell, J. W., Hack, J. J., Shea, D., Caron, J. M., and Rosinski, J.: A New Sea Surface Temperature and Sea Ice Boundary Dataset for the Community Atmosphere Model, J. Climate, 21, 5145–5153, https://doi.org/10.1175/2008JCLI2292.1, 2008. a
Isokääntä, S., Kim, P., Mikkonen, S., Kühn, T., Kokkola, H., Yli-Juuti, T., Heikkinen, L., Luoma, K., Petäjä, T., Kipling, Z., Partridge, D., and Virtanen, A.: The effect of clouds and precipitation on the aerosol concentrations and composition in a boreal forest environment, Atmos. Chem. Phys., 22, 11823–11843, https://doi.org/10.5194/acp-22-11823-2022, 2022. a
Iversen, T. and Seland, Ø.: A Scheme for Process-Tagged SO4 and BC Aerosols in NCAR CCM3: Validation and Sensitivity to Cloud Processes, J. Geophys. Res.-Atmos., 107, 4751, https://doi.org/10.1029/2001JD000885, 2002. a
Iversen, T., Bentsen, M., Bethke, I., Debernard, J. B., Kirkevåg, A., Seland, Ø., Drange, H., Kristjansson, J. E., Medhaug, I., Sand, M., and Seierstad, I. A.: The Norwegian Earth System Model, NorESM1-M – Part 2: Climate response and scenario projections, Geosci. Model Dev., 6, 389–415, https://doi.org/10.5194/gmd-6-389-2013, 2013. a
Jokinen, T., Kontkanen, J., Lehtipalo, K., Manninen, H. E., Aalto, J., Porcar-Castell, A., Garmash, O., Nieminen, T., Ehn, M., Kangasluoma, J., Junninen, H., Levula, J., Duplissy, J., Ahonen, L. R., Rantala, P., Heikkinen, L., Yan, C., Sipilä, M., Worsnop, D. R., Bäck, J., Petäjä, T., Kerminen, V.-M., and Kulmala, M.: Solar Eclipse Demonstrating the Importance of Photochemistry in New Particle Formation, Sci. Rep., 7, 45707, https://doi.org/10.1038/srep45707, 2017. a
Khadir, T.: PNSDs and Trajectory History Datasets (Khadir et al., 2023), Zenodo [data set], https://doi.org/10.5281/zenodo.7907473, 2023. a, b
Khadir, T., Riipinen, I., Talvinen, S., Heslin-Rees, D., Pöhlker, C., Rizzo, L., Machado, L. A. T., Franco, M. A., Kremper, L. A., Artaxo, P., Petäjä, T., Kulmala, M., Tunved, P., Ekman, A. M. L., Krejci, R., and Virtanen, A.: Sink, Source or Something In-Between? Net Effects of Precipitation on Aerosol Particle Populations, Geophys. Res. Lett., 50, e2023GL104325, https://doi.org/10.1029/2023GL104325, 2023. a, b, c, d, e, f, g, h, i, j, k, l, m, n, o, p, q, r, s
Kipling, Z., Stier, P., Johnson, C. E., Mann, G. W., Bellouin, N., Bauer, S. E., Bergman, T., Chin, M., Diehl, T., Ghan, S. J., Iversen, T., Kirkevåg, A., Kokkola, H., Liu, X., Luo, G., van Noije, T., Pringle, K. J., von Salzen, K., Schulz, M., Seland, Ø., Skeie, R. B., Takemura, T., Tsigaridis, K., and Zhang, K.: What controls the vertical distribution of aerosol? Relationships between process sensitivity in HadGEM3–UKCA and inter-model variation from AeroCom Phase II, Atmos. Chem. Phys., 16, 2221–2241, https://doi.org/10.5194/acp-16-2221-2016, 2016. a, b, c, d, e
Kirkevåg, A., Iversen, T., Seland, Ø., Hoose, C., Kristjánsson, J. E., Struthers, H., Ekman, A. M. L., Ghan, S., Griesfeller, J., Nilsson, E. D., and Schulz, M.: Aerosol–climate interactions in the Norwegian Earth System Model – NorESM1-M, Geosci. Model Dev., 6, 207–244, https://doi.org/10.5194/gmd-6-207-2013, 2013. a
Kirkevåg, A., Grini, A., Olivié, D., Seland, Ø., Alterskjær, K., Hummel, M., Karset, I. H. H., Lewinschal, A., Liu, X., Makkonen, R., Bethke, I., Griesfeller, J., Schulz, M., and Iversen, T.: A production-tagged aerosol module for Earth system models, OsloAero5.3 – extensions and updates for CAM5.3-Oslo, Geosci. Model Dev., 11, 3945–3982, https://doi.org/10.5194/gmd-11-3945-2018, 2018. a, b
Kokkola, H., Kühn, T., Laakso, A., Bergman, T., Lehtinen, K. E. J., Mielonen, T., Arola, A., Stadtler, S., Korhonen, H., Ferrachat, S., Lohmann, U., Neubauer, D., Tegen, I., Siegenthaler-Le Drian, C., Schultz, M. G., Bey, I., Stier, P., Daskalakis, N., Heald, C. L., and Romakkaniemi, S.: SALSA2.0: The sectional aerosol module of the aerosol–chemistry–climate model ECHAM6.3.0-HAM2.3-MOZ1.0, Geosci. Model Dev., 11, 3833–3863, https://doi.org/10.5194/gmd-11-3833-2018, 2018. a
Kooperman, G. J., Pritchard, M. S., Ghan, S. J., Wang, M., Somerville, R. C. J., and Russell, L. M.: Constraining the Influence of Natural Variability to Improve Estimates of Global Aerosol Indirect Effects in a Nudged Version of the Community Atmosphere Model 5, J. Geophys. Res.-Atmos., 117, https://doi.org/10.1029/2012JD018588, 2012. a
Krol, M., Houweling, S., Bregman, B., van den Broek, M., Segers, A., van Velthoven, P., Peters, W., Dentener, F., and Bergamaschi, P.: The two-way nested global chemistry-transport zoom model TM5: algorithm and applications, Atmos. Chem. Phys., 5, 417–432, https://doi.org/10.5194/acp-5-417-2005, 2005. a
Kulmala, M. and Petäjä, T.: Measurement of Meteorology at Hyytiälä, NILU, https://doi.org/10.48597/N5C6-V7QN, 2024. a
Kulmala, M., Vehkamäki, H., Petäjä, T., Dal Maso, M., Lauri, A., Kerminen, V.-M., Birmili, W., and McMurry, P.: Formation and Growth Rates of Ultrafine Atmospheric Particles: A Review of Observations, J. Aerosol Sci., 35, 143–176, https://doi.org/10.1016/j.jaerosci.2003.10.003, 2004. a
Lee, H., Lee, K., Lunder, C. R., Krejci, R., Aas, W., Park, J., Park, K.-T., Lee, B. Y., Yoon, Y. J., and Park, K.: Atmospheric new particle formation characteristics in the Arctic as measured at Mount Zeppelin, Svalbard, from 2016 to 2018, Atmos. Chem. Phys., 20, 13425–13441, https://doi.org/10.5194/acp-20-13425-2020, 2020. a
Lelieveld, J., Klingmüller, K., Pozzer, A., Burnett, R. T., Haines, A., and Ramanathan, V.: Effects of Fossil Fuel and Total Anthropogenic Emission Removal on Public Health and Climate, P. Natl. Acad. Sci. USA, 116, 7192–7197, https://doi.org/10.1073/pnas.1819989116, 2019. a
Lohmann, U., Leaitch, W. R., Barrie, L., Law, K., Yi, Y., Bergmann, D., Bridgeman, C., Chin, M., Christensen, J., Easter, R., Feichter, J., Jeuken, A., Kjellström, E., Koch, D., Land, C., Rasch, P., and Roelofs, G.-J.: Vertical Distributions of Sulfur Species Simulated by Large Scale Atmospheric Models in COSAM: Comparison with Observations, Tellus B, 53, 646–672, https://doi.org/10.1034/j.1600-0889.2001.530508.x, 2001. a
Lundberg, S. and Lee, S.-I.: A Unified Approach to Interpreting Model Predictions, arXiv [preprint], https://doi.org/10.48550/arXiv.1705.07874, 2017. a, b
Luoma, K., Virkkula, A., Aalto, P., Petäjä, T., and Kulmala, M.: Over a 10-year record of aerosol optical properties at SMEAR II, Atmos. Chem. Phys., 19, 11363–11382, https://doi.org/10.5194/acp-19-11363-2019, 2019. a
MacDonald, A. B., Dadashazar, H., Chuang, P. Y., Crosbie, E., Wang, H., Wang, Z., Jonsson, H. H., Flagan, R. C., Seinfeld, J. H., and Sorooshian, A.: Characteristic Vertical Profiles of Cloud Water Composition in Marine Stratocumulus Clouds and Relationships With Precipitation, J. Geophys. Res.-Atmos., 123, 3704–3723, https://doi.org/10.1002/2017JD027900, 2018. a
Machado, L. A. T., Unfer, G. R., Brill, S., Hildmann, S., Pöhlker, C., Cheng, Y., Williams, J., Hartwig, H., Andreae, M. O., Artaxo, P., Curtius, J., Franco, M. A., Cecchini, M. A., Edtbauer, A., Hoffmann, T., Holanda, B., Khadir, T., Krejci, R., Kremper, L. A., Liu, Y., Meller, B. B., Pöhlker, M. L., Quesada, C. A., Ringsdorf, A., Riipinen, I., Trumbore, S., Wolff, S., Lelieveld, J., and Pöschl, U.: Frequent Rainfall-Induced New Particle Formation within the Canopy in the Amazon Rainforest, Nat. Geosci., 17, 1225–1232, https://doi.org/10.1038/s41561-024-01585-0, 2024. a, b, c
Merikanto, J., Spracklen, D. V., Mann, G. W., Pickering, S. J., and Carslaw, K. S.: Impact of nucleation on global CCN, Atmos. Chem. Phys., 9, 8601–8616, https://doi.org/10.5194/acp-9-8601-2009, 2009. a
Michot, V., Vila, D., Arvor, D., Corpetti, T., Ronchail, J., Funatsu, B. M., and Dubreuil, V.: Performance of TRMM TMPA 3B42 V7 in Replicating Daily Rainfall and Regional Rainfall Regimes in the Amazon Basin (1998–2013), Remote Sensing, 10, 1879, https://doi.org/10.3390/rs10121879, 2018. a, b
Moseid, K. O., Schulz, M., Storelvmo, T., Julsrud, I. R., Olivié, D., Nabat, P., Wild, M., Cole, J. N. S., Takemura, T., Oshima, N., Bauer, S. E., and Gastineau, G.: Bias in CMIP6 models as compared to observed regional dimming and brightening, Atmos. Chem. Phys., 20, 16023–16040, https://doi.org/10.5194/acp-20-16023-2020, 2020. a
Moteki, N., Kondo, Y., Oshima, N., Takegawa, N., Koike, M., Kita, K., Matsui, H., and Kajino, M.: Size Dependence of Wet Removal of Black Carbon Aerosols during Transport from the Boundary Layer to the Free Troposphere, Geophys. Res. Lett., 39, https://doi.org/10.1029/2012GL052034, 2012. a
Neu, J. L. and Prather, M. J.: Toward a more physical representation of precipitation scavenging in global chemistry models: cloud overlap and ice physics and their impact on tropospheric ozone, Atmos. Chem. Phys., 12, 3289–3310, https://doi.org/10.5194/acp-12-3289-2012, 2012. a
Nordeng, T.-E.: Extended Versions of the Convective Parametrization Scheme at ECMWF and Their Impact on the Mean and Transient Activity of the Model in the Tropics, 41, https://doi.org/10.21957/e34xwhysw, 1994. 1994. a
Ohata, S., Moteki, N., Mori, T., Koike, M., and Kondo, Y.: A Key Process Controlling the Wet Removal of Aerosols: New Observational Evidence, Sci. Rep., 6, 34113, https://doi.org/10.1038/srep34113, 2016. a
Olenius, T. and Riipinen, I.: Molecular-Resolution Simulations of New Particle Formation: Evaluation of Common Assumptions Made in Describing Nucleation in Aerosol Dynamics Models, Aerosol Sci. Tech., 51, 397–408, https://doi.org/10.1080/02786826.2016.1262530, 2017. a
Patoulias, D., Florou, K., Pandis, S. N., and Nenes, A.: New Particle Formation Events Can Reduce Cloud Droplets in Boundary Layer Clouds at the Continental Scale, Geophys. Res. Lett., 51, e2023GL106182, https://doi.org/10.1029/2023GL106182, 2024. a
Pruppacher, H. R., Klett, J. D., and Wang, P. K.: Microphysics of Clouds and Precipitation, Aerosol Sci. Technol., 28, 381–382, https://doi.org/10.1080/02786829808965531, 1998. a
Ranjan, R., Dewey, M., Heikkinen, L., Ahonen, L. R., Luoma, K., Bowen, P., Petäjä, T., Ekman, A. M. L., Partridge, D. G., and Riipinen, I.: Optimizing CCN predictions through inferred modal aerosol composition – a boreal forest case study, Atmos. Chem. Phys., 25, 17275–17300, https://doi.org/10.5194/acp-25-17275-2025, 2025. a
Rayner, N. A., Parker, D. E., Horton, E. B., Folland, C. K., Alexander, L. V., Rowell, D. P., Kent, E. C., and Kaplan, A.: Global Analyses of Sea Surface Temperature, Sea Ice, and Night Marine Air Temperature since the Late Nineteenth Century, J. Geophys. Res.-Atmos., 108, https://doi.org/10.1029/2002JD002670, 2003. a
Roldin, P., Ehn, M., Kurtén, T., Olenius, T., Rissanen, M. P., Sarnela, N., Elm, J., Rantala, P., Hao, L., Hyttinen, N., Heikkinen, L., Worsnop, D. R., Pichelstorfer, L., Xavier, C., Clusius, P., Öström, E., Petäjä, T., Kulmala, M., Vehkamäki, H., Virtanen, A., Riipinen, I., and Boy, M.: The Role of Highly Oxygenated Organic Molecules in the Boreal Aerosol-Cloud-Climate System, Nat. Commun., 10, 4370, https://doi.org/10.1038/s41467-019-12338-8, 2019. a, b
Ryu, Y.-H. and Min, S.-K.: Improving Wet and Dry Deposition of Aerosols in WRF-Chem: Updates to Below-Cloud Scavenging and Coarse-Particle Dry Deposition, J. Adv. Model. Earth Sy., 14, e2021MS002792, https://doi.org/10.1029/2021MS002792, 2022. a, b, c
Schraufnagel, D. E.: The Health Effects of Ultrafine Particles, Exp. Mol. Med., 52, 311–317, https://doi.org/10.1038/s12276-020-0403-3, 2020. a
Schultz, M. G., Stadtler, S., Schröder, S., Taraborrelli, D., Franco, B., Krefting, J., Henrot, A., Ferrachat, S., Lohmann, U., Neubauer, D., Siegenthaler-Le Drian, C., Wahl, S., Kokkola, H., Kühn, T., Rast, S., Schmidt, H., Stier, P., Kinnison, D., Tyndall, G. S., Orlando, J. J., and Wespes, C.: The chemistry–climate model ECHAM6.3-HAM2.3-MOZ1.0, Geosci. Model Dev., 11, 1695–1723, https://doi.org/10.5194/gmd-11-1695-2018, 2018. a
Seinfeld, J. H. and Pandis, S. N.: Atmospheric Chemistry and Physics, 3 edn., John Wiley & Sons, Incorporated, New Jersey 2016. a, b
Seland, ø., Iversen, T., KirkevåG, A., and Storelvmo, T.: Aerosol-Climate Interactions in the CAM-Oslo Atmospheric GCM and Investigation of Associated Basic Shortcomings, Tellus A, 60, 459–491, https://doi.org/10.1111/j.1600-0870.2008.00318.x, 2008. a
Seland, Ø., Bentsen, M., Olivié, D., Toniazzo, T., Gjermundsen, A., Graff, L. S., Debernard, J. B., Gupta, A. K., He, Y.-C., Kirkevåg, A., Schwinger, J., Tjiputra, J., Aas, K. S., Bethke, I., Fan, Y., Griesfeller, J., Grini, A., Guo, C., Ilicak, M., Karset, I. H. H., Landgren, O., Liakka, J., Moseid, K. O., Nummelin, A., Spensberger, C., Tang, H., Zhang, Z., Heinze, C., Iversen, T., and Schulz, M.: Overview of the Norwegian Earth System Model (NorESM2) and key climate response of CMIP6 DECK, historical, and scenario simulations, Geosci. Model Dev., 13, 6165–6200, https://doi.org/10.5194/gmd-13-6165-2020, 2020. a
Shapley, L. S.: 17. A Value for n-Person Games, in: Contributions to the Theory of Games (AM-28), Volume II, Princeton University Press, 307–318, ISBN 978-1-4008-8197-0, https://doi.org/10.1515/9781400881970-018, 1953. a
Shen, J., Russell, D. M., DeVivo, J., Kunkler, F., Baalbaki, R., Mentler, B., Scholz, W., Yu, W., Caudillo-Plath, L., Sommer, E., Ahongshangbam, E., Alfaouri, D., Almeida, J., Amorim, A., Beck, L. J., Beckmann, H., Berntheusel, M., Bhattacharyya, N., Canagaratna, M. R., Chassaing, A., Cruz-Simbron, R., Dada, L., Duplissy, J., Gordon, H., Granzin, M., Große Schute, L., Heinritzi, M., Iyer, S., Klebach, H., Krüger, T., Kürten, A., Lampimäki, M., Liu, L., Lopez, B., Martinez, M., Morawiec, A., Onnela, A., Peltola, M., Rato, P., Reza, M., Richter, S., Rörup, B., Sebastian, M. K., Simon, M., Surdu, M., Tamme, K., Thakur, R. C., Tomé, A., Tong, Y., Top, J., Umo, N. S., Unfer, G., Vettikkat, L., Weissbacher, J., Xenofontos, C., Yang, B., Zauner-Wieczorek, M., Zhang, J., Zheng, Z., Baltensperger, U., Christoudias, T., Flagan, R. C., El Haddad, I., Junninen, H., Möhler, O., Riipinen, I., Rohner, U., Schobesberger, S., Volkamer, R., Winkler, P. M., Hansel, A., Lehtipalo, K., Donahue, N. M., Lelieveld, J., Harder, H., Kulmala, M., Worsnop, D. R., Kirkby, J., Curtius, J., and He, X.-C.: New Particle Formation from Isoprene under Upper-Tropospheric Conditions, Nature, 636, 115–123, https://doi.org/10.1038/s41586-024-08196-0, 2024. a
Slinn, W. G. N.: Precipitation Scavenging, in: Atmospheric Science and Power Production, edited by Randerson, D., Chap. 11, Technical Information Center, Office of Scientific and Technical Information, U.S. Department of Energy, Washington, DC, USA, 466–532, ISBN: 0-87079-126-5, 1984. a
Stein, A. F., Draxler, R. R., Rolph, G. D., Stunder, B. J. B., Cohen, M. D., and Ngan, F.: NOAA's HYSPLIT Atmospheric Transport and Dispersion Modeling System, B. Am. Meteorol. Soc., 96, 2059–2077, https://doi.org/10.1175/BAMS-D-14-00110.1, 2015. a
Stier, P., Feichter, J., Kinne, S., Kloster, S., Vignati, E., Wilson, J., Ganzeveld, L., Tegen, I., Werner, M., Balkanski, Y., Schulz, M., Boucher, O., Minikin, A., and Petzold, A.: The aerosol-climate model ECHAM5-HAM, Atmos. Chem. Phys., 5, 1125–1156, https://doi.org/10.5194/acp-5-1125-2005, 2005. a, b, c
Stolzenburg, D., Cai, R., Blichner, S. M., Kontkanen, J., Zhou, P., Makkonen, R., Kerminen, V.-M., Kulmala, M., Riipinen, I., and Kangasluoma, J.: Atmospheric Nanoparticle Growth, Rev. Mod. Phys., 95, 045002, https://doi.org/10.1103/RevModPhys.95.045002, 2023. a
Sullivan, R. C., Crippa, P., Matsui, H., Leung, L. R., Zhao, C., Thota, A., and Pryor, S. C.: New Particle Formation Leads to Cloud Dimming, npj Climate and Atmospheric Science, 1, 1–9, https://doi.org/10.1038/s41612-018-0019-7, 2018. a
Svenhag, C., Sporre, M. K., Olenius, T., Yazgi, D., Blichner, S. M., Nieradzik, L. P., and Roldin, P.: Implementing detailed nucleation predictions in the Earth system model EC-Earth3.3.4: sulfuric acid–ammonia nucleation, Geosci. Model Dev., 17, 4923–4942, https://doi.org/10.5194/gmd-17-4923-2024, 2024. a
Talvinen, S., Kim, P., Tovazzi, E., Holopainen, E., Cremer, R., Kühn, T., Kokkola, H., Kipling, Z., Neubauer, D., Teixeira, J. C., Sellar, A., Watson-Parris, D., Yang, Y., Zhu, J., Krishnan, S., Virtanen, A., and Partridge, D. G.: Towards an improved understanding of the impact of clouds and precipitation on the representation of aerosols over the Boreal Forest in GCMs, Atmos. Chem. Phys., 25, 14449–14478, https://doi.org/10.5194/acp-25-14449-2025, 2025. a, b
Taylor, J. W., Allan, J. D., Allen, G., Coe, H., Williams, P. I., Flynn, M. J., Le Breton, M., Muller, J. B. A., Percival, C. J., Oram, D., Forster, G., Lee, J. D., Rickard, A. R., Parrington, M., and Palmer, P. I.: Size-dependent wet removal of black carbon in Canadian biomass burning plumes, Atmos. Chem. Phys., 14, 13755–13771, https://doi.org/10.5194/acp-14-13755-2014, 2014. a
Tegen, I., Neubauer, D., Ferrachat, S., Siegenthaler-Le Drian, C., Bey, I., Schutgens, N., Stier, P., Watson-Parris, D., Stanelle, T., Schmidt, H., Rast, S., Kokkola, H., Schultz, M., Schroeder, S., Daskalakis, N., Barthel, S., Heinold, B., and Lohmann, U.: The global aerosol–climate model ECHAM6.3–HAM2.3 – Part 1: Aerosol evaluation, Geosci. Model Dev., 12, 1643–1677, https://doi.org/10.5194/gmd-12-1643-2019, 2019. a
Textor, C., Schulz, M., Guibert, S., Kinne, S., Balkanski, Y., Bauer, S., Berntsen, T., Berglen, T., Boucher, O., Chin, M., Dentener, F., Diehl, T., Easter, R., Feichter, H., Fillmore, D., Ghan, S., Ginoux, P., Gong, S., Grini, A., Hendricks, J., Horowitz, L., Huang, P., Isaksen, I., Iversen, I., Kloster, S., Koch, D., Kirkevåg, A., Kristjansson, J. E., Krol, M., Lauer, A., Lamarque, J. F., Liu, X., Montanaro, V., Myhre, G., Penner, J., Pitari, G., Reddy, S., Seland, Ø., Stier, P., Takemura, T., and Tie, X.: Analysis and quantification of the diversities of aerosol life cycles within AeroCom, Atmos. Chem. Phys., 6, 1777–1813, https://doi.org/10.5194/acp-6-1777-2006, 2006. a
Tiedtke, M.: A Comprehensive Mass Flux Scheme for Cumulus Parameterization in Large-Scale Models, Mon. Weather Rev., 117, 1779–1800, https://doi.org/10.1175/1520-0493(1989)117<1779:ACMFSF>2.0.CO;2, 1989. a, b
Twomey, S.: The Nuclei of Natural Cloud Formation Part II: The Supersaturation in Natural Clouds and the Variation of Cloud Droplet Concentration, Geofisica Pura e Applicata, 43, 243–249, https://doi.org/10.1007/BF01993560, 1959. a
Twomey, S.: Pollution and the Planetary Albedo, Atmos. Environ., 8, 1251–1256, https://doi.org/10.1016/0004-6981(74)90004-3, 1974. a
an Noije, T., Bergman, T., Le Sager, P., O'Donnell, D., Makkonen, R., Gonçalves-Ageitos, M., Döscher, R., Fladrich, U., von Hardenberg, J., Keskinen, J.-P., Korhonen, H., Laakso, A., Myriokefalitakis, S., Ollinaho, P., Pérez García-Pando, C., Reerink, T., Schrödner, R., Wyser, K., and Yang, S.: EC-Earth3-AerChem: a global climate model with interactive aerosols and atmospheric chemistry participating in CMIP6 , Geosci. Model Dev., 14, 5637–5668, https://doi.org/10.5194/gmd-14-5637-2021, 2021. a, b, c, d, e, f, g
van Noije, T. P. C., Le Sager, P., Segers, A. J., van Velthoven, P. F. J., Krol, M. C., Hazeleger, W., Williams, A. G., and Chambers, S. D.: Simulation of tropospheric chemistry and aerosols with the climate model EC-Earth, Geosci. Model Dev., 7, 2435–2475, https://doi.org/10.5194/gmd-7-2435-2014, 2014. a
Vignati, E., Wilson, J., and Stier, P.: M7: An Efficient Size-Resolved Aerosol Microphysics Module for Large-Scale Aerosol Transport Models: AEROSOL MICROPHYSICS MODULE, J. Geophys. Res.-Atmos., 109, https://doi.org/10.1029/2003JD004485, 2004. a
Wang, J., Krejci, R., Giangrande, S., Kuang, C., Barbosa, H. M. J., Brito, J., Carbone, S., Chi, X., Comstock, J., Ditas, F., Lavric, J., Manninen, H. E., Mei, F., Moran-Zuloaga, D., Pöhlker, C., Pöhlker, M. L., Saturno, J., Schmid, B., Souza, R. A. F., Springston, S. R., Tomlinson, J. M., Toto, T., Walter, D., Wimmer, D., Smith, J. N., Kulmala, M., Machado, L. A. T., Artaxo, P., Andreae, M. O., Petäjä, T., and Martin, S. T.: Amazon Boundary Layer Aerosol Concentration Sustained by Vertical Transport during Rainfall, Nature, 539, 416–419, https://doi.org/10.1038/nature19819, 2016. a, b, c
Wegener, A.: Thermodynamik Der Atmosphäre, JA Barth, 1911. a
Williams, J. E., Boersma, K. F., Le Sager, P., and Verstraeten, W. W.: The high-resolution version of TM5-MP for optimized satellite retrievals: description and validation, Geosci. Model Dev., 10, 721–750, https://doi.org/10.5194/gmd-10-721-2017, 2017. a
Yeo, H., Kim, M.-H., Son, S.-W., Jeong, J.-H., Yoon, J.-H., Kim, B.-M., and Kim, S.-W.: Arctic Cloud Properties and Associated Radiative Effects in the Three Newer Reanalysis Datasets (ERA5, MERRA-2, JRA-55): Discrepancies and Possible Causes, Atmos. Res., 270, 106080, https://doi.org/10.1016/j.atmosres.2022.106080, 2022. a
Zhang, G. J. and McFarlane, N. A.: Sensitivity of Climate Simulations to the Parameterization of Cumulus Convection in the Canadian Climate Centre General Circulation Model, Atmosphere-Ocean, 33, 407–446, https://doi.org/10.1080/07055900.1995.9649539, 1995. a
Zhang, K., O'Donnell, D., Kazil, J., Stier, P., Kinne, S., Lohmann, U., Ferrachat, S., Croft, B., Quaas, J., Wan, H., Rast, S., and Feichter, J.: The global aerosol-climate model ECHAM-HAM, version 2: sensitivity to improvements in process representations, Atmos. Chem. Phys., 12, 8911–8949, https://doi.org/10.5194/acp-12-8911-2012, 2012. a
Zhu, J., Li, G., Kuhn, U., Meller, B. B., Pöhlker, C., Artaxo, P., Pöschl, U., Cheng, Y., and Su, H.: Measurement report: Number size distribution of sub-40 nm particles in the Amazon rainforest, Atmos. Chem. Phys., 25, 17667–17684, https://doi.org/10.5194/acp-25-17667-2025, 2025. a
Zieger, P., Heslin-Rees, D., Karlsson, L., Koike, M., Modini, R., and Krejci, R.: Black Carbon Scavenging by Low-Level Arctic Clouds, Nat. Commun., 14, 5488, https://doi.org/10.1038/s41467-023-41221-w, 2023. a