
the Creative Commons Attribution 4.0 License.
the Creative Commons Attribution 4.0 License.
 | 30 Jul 2026
Estimation of nocturnal boundary layer height in the central Amazon, supported by gas concentration profiles
Carla M. A. Souza
Anne C. S. Mendonça
Hella van Asperen
Flávio A. F. D'Oliveira
Santiago Botía
Luís G. N. Martins
Denisi H. Hall
Raoni A. Santana
Gilberto Fisch
Leonardo R. Oliveira
Jailson R. Mata
Ranyelli Figueiredo
Rachel Albrecht
Bruno T. T. Portela
Carlos A. Quesada
Cléo Q. Dias-Júnior
The height of the nocturnal boundary layer (hn) is a fundamental parameter for weather and climate prediction. However, because turbulent processes weaken at night, estimating hn remains challenging. In addition, our understanding of its variability is limited, especially due to the predominant use of indirect methods that do not always accurately reflect the physical definition of the boundary layer. In this study we used micrometeorological measurements collected at the Amazon Tall Tower Observatory, in central Amazon. These measurements enable the study of turbulent sensible heat flux (H) profiles from the canopy top up to 300 m above ground, from which hn can be defined. Our analysis focused on the seasonal differences between dry and wet periods for a La Niña year and an El Niño year. Also, we explore how variations in hn affect the vertical distribution of CO and CH4 concentrations. The results revealed significant variations, such as: largest values of hn were observed during the wet season of a year marked by the La Niña phenomenon (∼ 270 m ± 40 m), while smallest values of hn occurred in the dry season associated with El Niño (∼100 m ± 27 m). It was also observed that hn can act as a “barrier” to the entry or exit of air masses with high concentrations of CO and CH4. This study provides important insights into the variability of hn above the Amazon forest, with implications for improving parameterizations in atmospheric models.
- Article
(7743 KB) - Full-text XML
-
Supplement
(9901 KB) - BibTeX
- EndNote


The Atmospheric Boundary Layer (ABL) is the lower part of the atmosphere that is in direct contact with the thermal and mechanical forcings that act near the surface (Garratt, 1980; Keirsbulck et al., 2002). The height of the ABL (zi) plays an important role in the exchange of heat, moisture, gases and particles between the surface and the free atmosphere (Driedonks, 1982; Yuval et al., 2020). Several studies have been carried out with the objective of estimating the height of the ABL, including for remote regions such as the Amazon (Fisch et al., 2004; Guo et al., 2016; Carneiro and Fisch, 2020; Krishnamurthy et al., 2021; Dias-Júnior et al., 2022; Molero et al., 2022; Souza et al., 2023). However, the majority of the studies carried out so far have given special attention to the variability of zi during daytime, thus up to now there is little information about the variability of zi during nighttime (Carneiro and Fisch, 2020; Mendonça et al., 2025).
The daytime variability of zi is well known. For example, in the southwestern Amazon, Fisch et al. (2004) estimated zi from radiosonde data as the height of the main inversion layer, identified from the vertical profile of potential temperature. They showed that zi values differ between pasture and forest areas, with a deeper boundary layer over pasture, up to ∼ 1650 m, compared to forest, ∼ 1100 m. This contrast is attributed to differences in surface energy partitioning, since pasture areas exhibit higher sensible heat fluxes and lower evapotranspiration compared to forests, leading to stronger thermal turbulence and enhanced boundary layer growth. Carneiro and Fisch (2020) used 2 years of data collected during the Green Ocean Amazon (GoAmazon 2014/5) project campaign, carried out in the central Amazon, and observed that the maximum height of the convective boundary layer (CBL) was approximately 1200 m in the wet season and approximately 1600 m in the dry season. In addition to diurnal and seasonal variability, large-scale events such as El Niño and La Niña also influence the evolution of the boundary layer in the Amazon (Carneiro and Fisch, 2020; Dias-Júnior et al., 2022; Souza et al., 2023). During El Niño, the anomalous warming of the equatorial Pacific intensifies the occurrence of drier conditions, favoring a deeper CBL (Dias-Júnior et al., 2022; Souza et al., 2023). In contrast, during La Niña, greater moisture convergence favors increased precipitation that tends to limit its growth (Souza et al., 2023). Dias-Júnior et al. (2022) used ceilometer data, also collected during the GoAmazon project, and reported that daytime zi values are maximum during the dry season in El Niño years.
The height of the boundary layer also plays an important role in the dispersion of pollutants near the surface. Based on ten years of measurements at 1500 stations in China, Su et al. (2018) observed that zi and particulate matter concentrations exhibit a negative correlation, indicating that deeper layers favor the dispersion of pollutants. In a complementary way, Miao et al. (2015) showed that the interaction between zi and local circulations strongly modulates air quality in the Beijing–Tianjin–Hebei region. They showed that in autumn and winter, when zi is generally shallower, and often combined with mountain breezes, it favors the accumulation of pollutants in the region. Meanwhile, in spring and summer, with deeper zi and combined with the sea breeze, they promote more efficient dispersion conditions throughout the day.
On the other hand, the relationship between zi and pollutants has been shown to be bidirectional. For example, Wang et al. (2019) observed that severe air pollution episodes occurred under conditions of weak winds, high humidity, and strong temperature inversions. The accumulation of aerosols reduced the incoming solar radiation and the sensible heat flux, which led to a weakening of vertical mixing and a 44 %–56 % reduction in zi compared to clean days. Kulmala et al. (2023) in a study focused on boreal and Arctic regions within the framework of the Pan-Eurasian Experiment (PEEX), highlighted that the zi also controls the vertical mixing and accumulation of trace gases such as CO2, CH4, and reactive volatile compounds. They emphasized that variations in zi modulate near-surface concentrations of these gases, influencing local chemical reactivity and the radiative balance. Conversely, trace gases and aerosols can feedback on boundary-layer development by altering radiative fluxes, air temperature, and stability conditions.
To date, only a few studies have investigated the nocturnal boundary-layer height (hn) above the Amazon rainforest. Santos et al. (2007), using radiosonde data measured in the southwestern Amazon, showed that hn values were around 250 m. Dias-Júnior et al. (2022) using data from different instruments, showed that hn values in the Central Amazon were 200 m. Recently, Mendonça et al. (2025) used turbulent sensible heat flux (H) profiles measured at 11 levels along the 325 m Amazon Tall Tower Observatory (ATTO) tower and reported that these profiles offer an opportunity to obtain direct measurements of hn. These estimates are based on the height at which H falls below 5 % of its near-surface value, unlike other methodologies that provide indirect measurements, such as radiosondes, ceilometers, and temperature profiles. The authors also observed that hn varies according to atmospheric stability and local topography, with mean hn values around ∼80 m under very stable conditions and ∼170 m under near-neutral conditions. Although the study by Mendonça et al. (2025) has contributed to recent advances in estimates of hn values, the seasonal and interannual variability of hn in the Central Amazon remains poorly understood. Moreover, no studies so far have directly addressed how hn variability influences the near-surface vertical concentration profiles of trace gases.
In view of these gaps, the main objective of this study is to investigate the seasonal and interannual variability of hn in the ATTO region during 2022 and 2023. In addition, it seeks to explore how variations in hn affect the dispersion of selected trace gases in the region. This study extends previous analyses at the ATTO site by investigating the hourly evolution of hn and its influence on near-surface trace gas concentrations. We believe that this work provides an important contribution to advancing knowledge in fields such as micrometeorology, aerosol dynamics, and greenhouse gas studies, all of which require precise descriptions of the structure of the Nocturnal Boundary Layer (NBL) (Santana et al., 2018; Botía et al., 2020; Barbosa et al., 2022; Franco et al., 2024).
2.1 Experimental Site and Data Acquisition
The data used in this work were measured in 2022 and 2023 at the ATTO experimental site, located in the central Amazon, about 150 km northeast of Manaus, in the Uatumã Sustainable Development Reserve (SDR) (Fig. 1a). The site is characterized by dense tropical forest with a relatively uniform canopy, whose tree crowns generally reach a height of around 37 m (Andreae et al., 2015; Gomes Alves et al., 2023). A detailed description of the site is provided by Andreae et al. (2015).
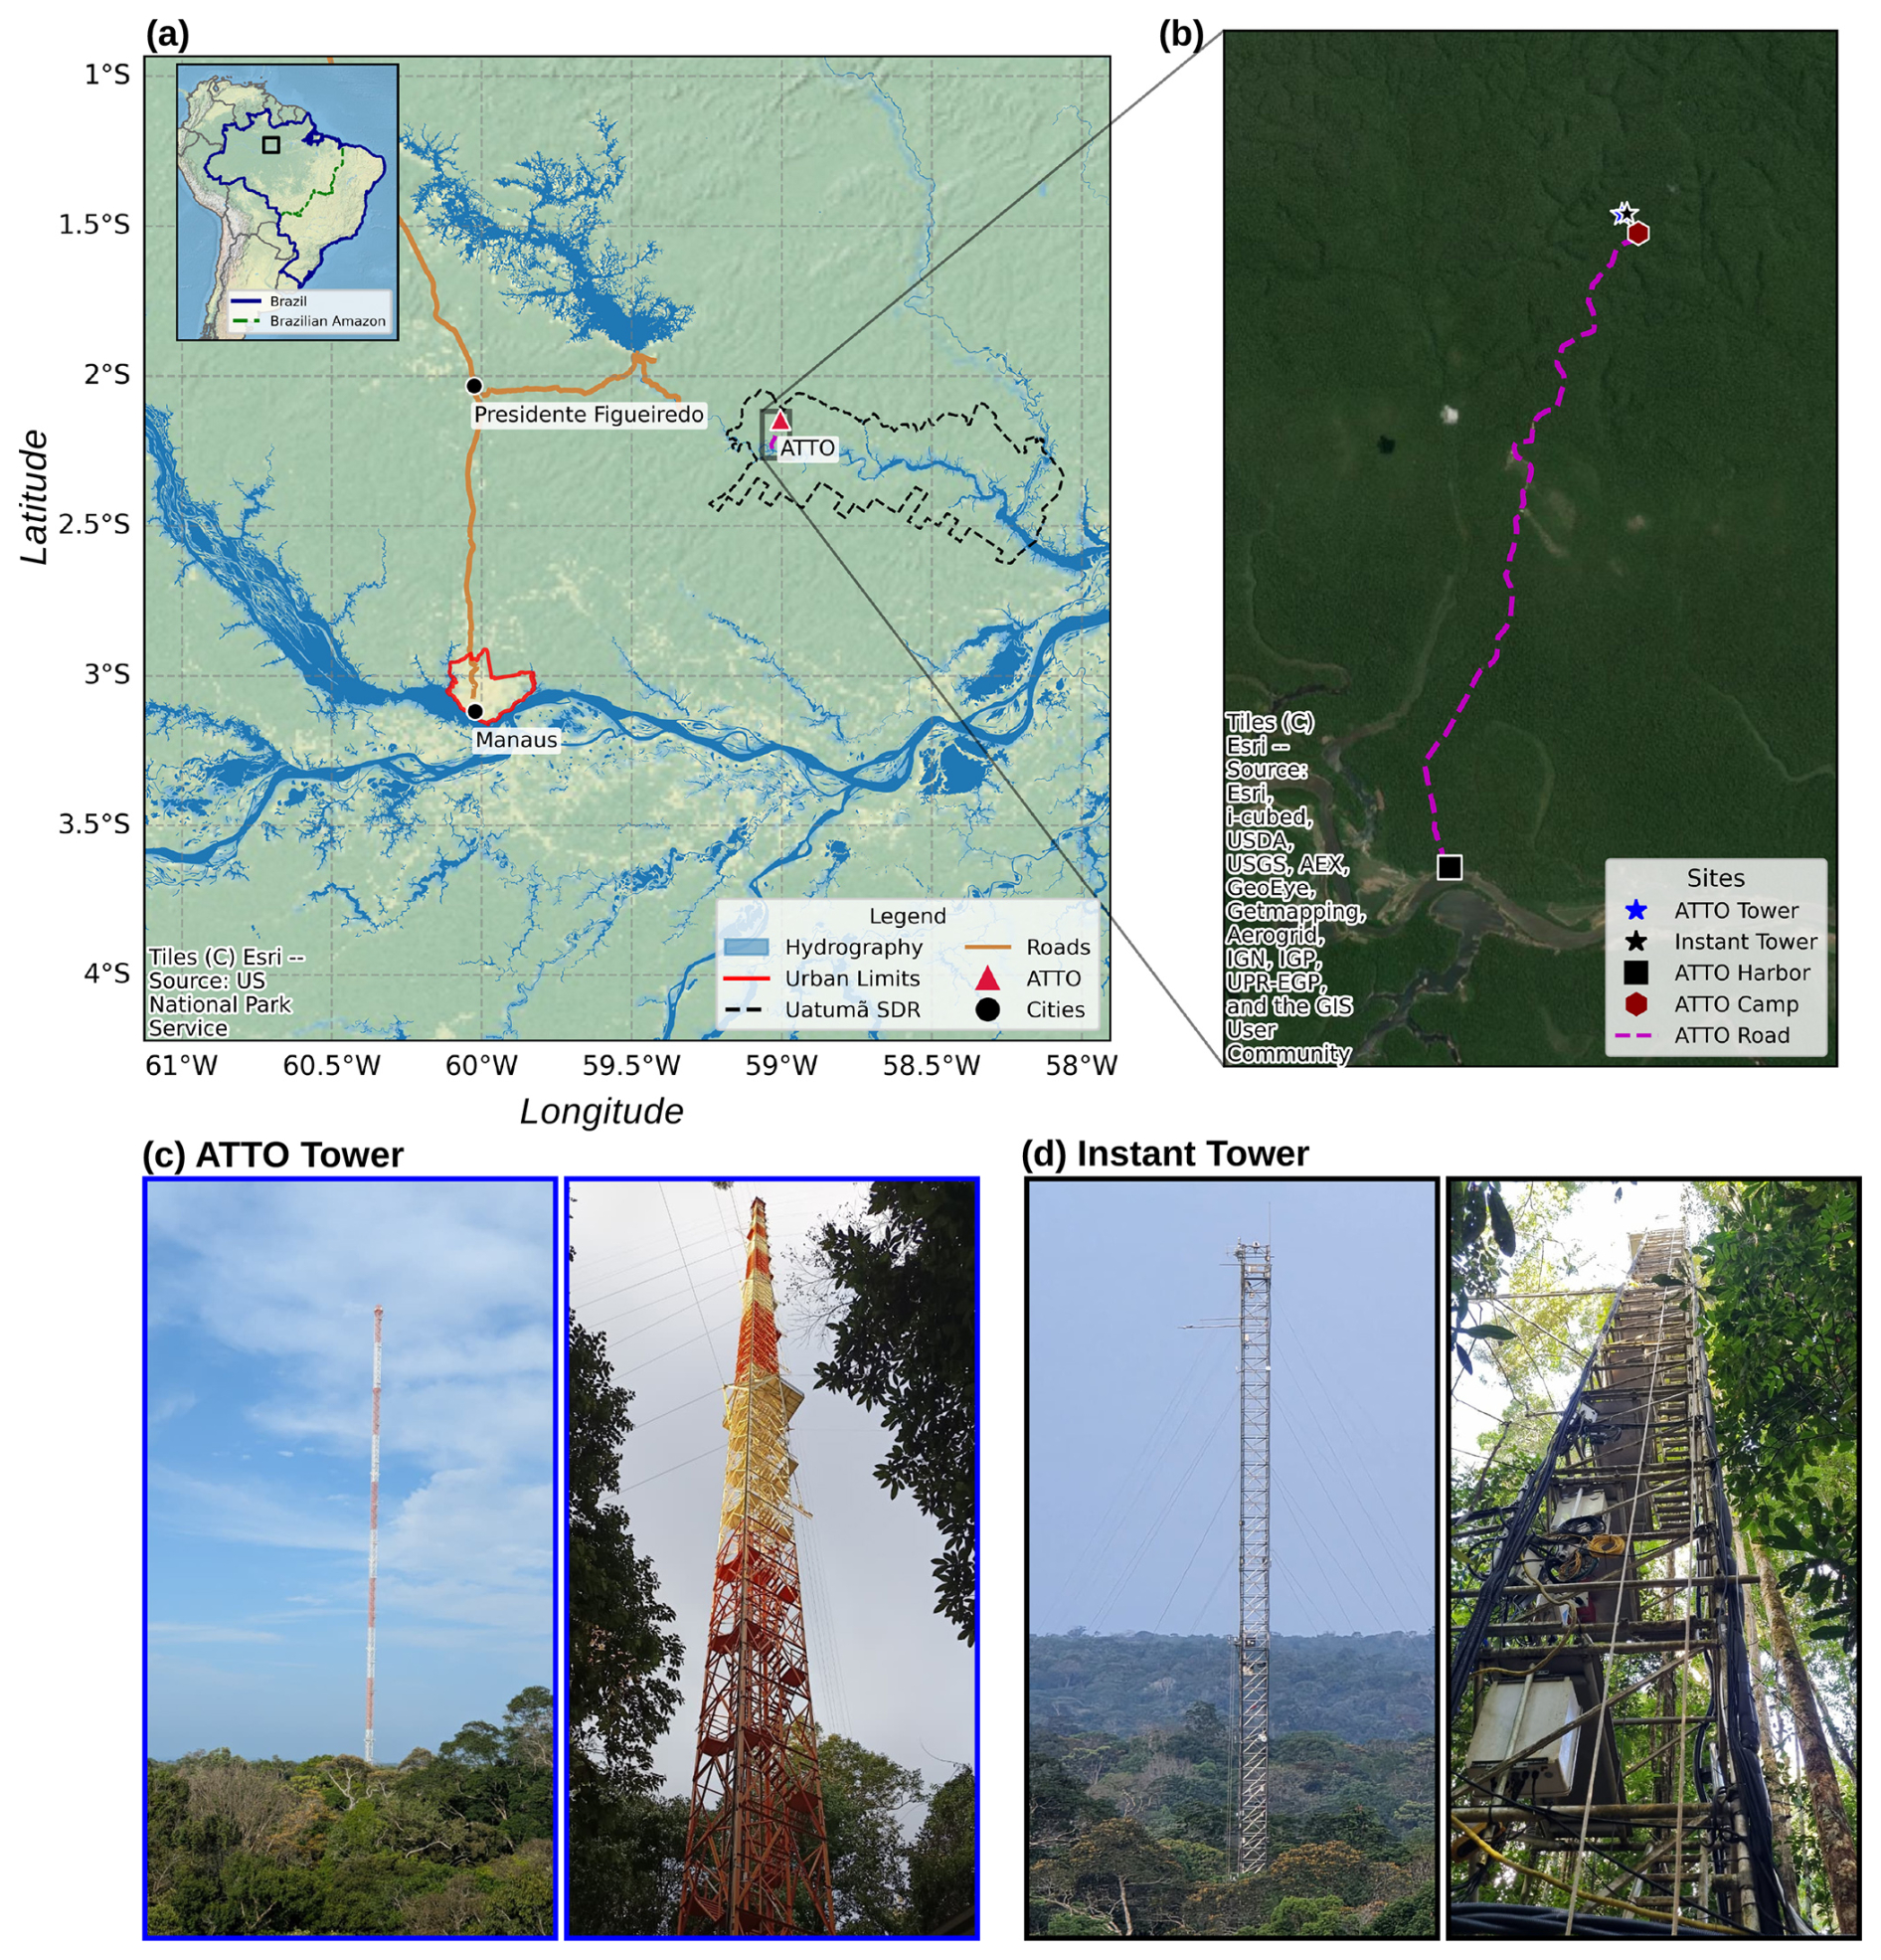
Figure 1Geographic location and infrastructure of the Amazon Tall Tower Observatory (ATTO). (a) Regional map showing the position of ATTO northeast of Manaus, within the Uatumã Sustainable Development Reserve (SDR); (b) High-resolution zoom around the ATTO site based on Esri World Imagery, showing the ATTO Tower (blue star), Instant Tower (black star), ATTO harbor (black square), ATTO Camp (brown hexagon), and the ATTO access road (magenta dashed line); (c) Photographs of the ATTO Tower (325 m) from ground perspective and structural details of its metallic frame; (d) Photographs of the Instant Tower (80 m). All maps were generated using Python 3.11.6, in the WGS84 geographic coordinate system (EPSG:4326). Basemaps: Esri World Physical (a) and Esri World Imagery (b). Sources: Esri, TomTom, FAO, USGS | Powered by Esri.
We used fast-response data (10 Hz) collected by sonic anemometers installed on two towers (located at 2.148° S, 59.0068° W, and 2.1448° S, 59.0008° W) that are 670 m apart (Dias-Júnior et al., 2019). The 81 m tower (INSTANT Tower) and the 325 m tower (ATTO Tower) are on a plateau, located at approximately 130 m a.s.l. (Chamecki et al., 2020). The sensors used included CSAT-3B models from Campbell Scientific, Inc. (Logan, USA) installed at 50 and 81 m on the INSTANT Tower, and 3D Ultrasonic Anemometer model 4.3830 series from Thies Clima3D (Göttingen, Germany) installed at 100, 127, 151, 172, 223, 247, 274, and 298 m on the ATTO tower, all heights positioned above the ground. The variables measured were air temperature (T) and the three components of wind velocity (u, v, and w). Measurements from both towers were integrated into a single vertical profile, since previous studies did not identify significant differences between them (Mendonça et al., 2025).
Relative humidity and air temperature were obtained by thermohygrometers model IAKM I-Series from Galltec-Mela (Bondorf, Germany), and atmospheric pressure was recorded by barometers model 61302V (Young, USA), both operating at 0.01 Hz at the same heights as the anemometers. Net radiation (Rn) was calculated as the sum of the shortwave radiation components (incoming and reflected), measured by a CMP21 pyranometer, and the longwave radiation (incoming and emitted), recorded by a CGR4 pyrgeometer (both Kipp & Zonen, Delft, Netherlands). These measurements were carried out at 81 m on the INSTANT tower, at 0.01 Hz. CO and CH4 concentrations were measured once per hour by a gas analyzer (FTIR Spectrometer) installed at the foot of ATTO tall tower, sampling air at five heights: 42, 81, 150, 273, and 321 m (van Asperen et al., 2023). Cloud fraction derived from the METEK MIRA-35C Cloud Radar Profiler and GOES-16 IR Channel 13 (10.3 µm) brightness temperature over the ATTO site were also used as complementary data for the case-study analysis. All analyses considered the nighttime period from 00:00 to 09:00 UTC (20:00 to 05:00 LT; UTC−4), avoiding transition intervals.
The main analyses were conducted for 2022–2023, when the complete sonic anemometer profile (up to 325 m) was available at ATTO. However, measurements of net radiation (Rn) at 81 m and turbulence measurements from the sonic anemometer at 50 m were available for the period 2016–2024 and were used to provide a broader climatological context.
2.2 Quality Control and Data Processing
As in other micrometeorological studies (Foken and Mauder, 2008; Starkenburg et al., 2016; Dias et al., 2023), the high-frequency data were initially segmented into 30 min intervals (totaling 18 000 measurements) for the application of quality control (QC) procedures. QC was performed for each wind component and for the temperature measured by the sonic anemometers. The QC process included verification of record integrity, detection of error indicators, identification and removal of spikes, as well as the application of stationarity tests. For a detailed description of the quality control protocol adopted at the ATTO Site, it is recommended to consult Zahn et al. (2016) and Dias et al. (2023).
After QC, the planar fit method (Wilczak et al., 2001) was used for tilt correction. For each six-month period, wind velocity components were used to estimate the anemometer tilt angles and define a mean streamline coordinate system. The tilt-corrected wind vectors were then rotated for each 30 min interval to align the horizontal wind components with the mean wind direction (Kaimal and Finnigan, 1994). Subsequently, turbulence statistics were calculated over 5 min windows using Reynolds averaging, after applying linear detrending within each window. This shorter time window reduces the influence of non-turbulent motions, which are relevant under stable boundary-layer conditions (Sun et al., 2002; Oliveira et al., 2018).
H was obtained by the eddy covariance method (Webb et al., 1980), according to the equation: , where ρ is air density (we assumed 1.225 kg m−3), cp is the specific heat of air at constant pressure (J kg−1 K−1). The variables T′ and w′ represent the fluctuations of temperature and of the vertical wind component, respectively. The mean wind speed (Um) was calculated as , where u and v are the zonal and meridional wind components, respectively. The potential temperature (θ) was calculated as , where Th is the air temperature measured by the thermohygrometer (Kelvin), P is atmospheric pressure (hPa), p0 is the reference pressure (1000 hPa), and Rd is the gas constant (287 J kg−1 K−1). Profiles of H were used to estimate hn, while Um and the vertical gradient of θ were used to discuss its variability.
Atmospheric stability was evaluated using the Monin–Obukhov stability parameter (), where L represents the Obukhov length, determined as ), with u* the friction velocity, k the von Kármán constant (0.41), g the acceleration due to gravity, and the kinematic sensible heat flux. The parameter was calculated considering the variables u*, , and T at 50 m, similar to that performed by Cava et al. (2022). Vertical wind shear () was quantified from third-order polynomial fits applied to the wind speed profiles, from which analytical vertical derivatives were calculated.
2.3 Data Filtering and Classification
After QC and calculation of turbulence statistics, two filters were applied to the dataset of the 5 min. First, to avoid the influence of extreme values, outliers in the H measurements were identified by means of histograms by height layer. Based on the observed distribution, the filtering limits were defined empirically, resulting in the following specific ranges: from 50 to 81 m (−50 to 0 W m−2), from 100 to 151 m (−30 to 10 W m−2) and from 172 to 298 m (−20 to 10 W m−2). Values outside these ranges were considered outliers and removed from the analysis. To test the sensitivity of hn to these filtering limits, we applied a more permissive scenario (−60 to 20, −45 to 25, and −35 to 15 W m−2; Scenario 2) and a more restrictive scenario (−30 to 0, −20 to 5, and −10 to 5 W m−2; Scenario 1) for the three height ranges. The normalized profiles were very similar, and the estimated hn differed by less than 15 m among scenarios (Fig. S1 in the Supplement), indicating that the results are robust to the selected thresholds. The application of differentiated limits reflects the expected variation of H among the layers, being more intense in the lower layers due to direct interaction with the canopy, and smoother at higher altitudes (Gao et al., 1989; Shaw and Schumann, 1992; Mendonça et al., 2025).
The second filter considered very stable atmospheric conditions, characterized by very low sensible heat fluxes above the canopy, indicative of minimal energy exchange, configuring a strongly decoupled regime (Cava et al., 2022). In these situations, the vertical profile of H does not present a typical structure (higher values near the canopy and a decrease with height), but rather an irregular pattern, which makes the reliable determination of hn difficult. So, cases in which the H values at 50 m were between 0 and −6 W m−2 were excluded, a range identified as the most frequent based on the data distribution under very stable conditions (, such as Mendonça et al. (2025)).
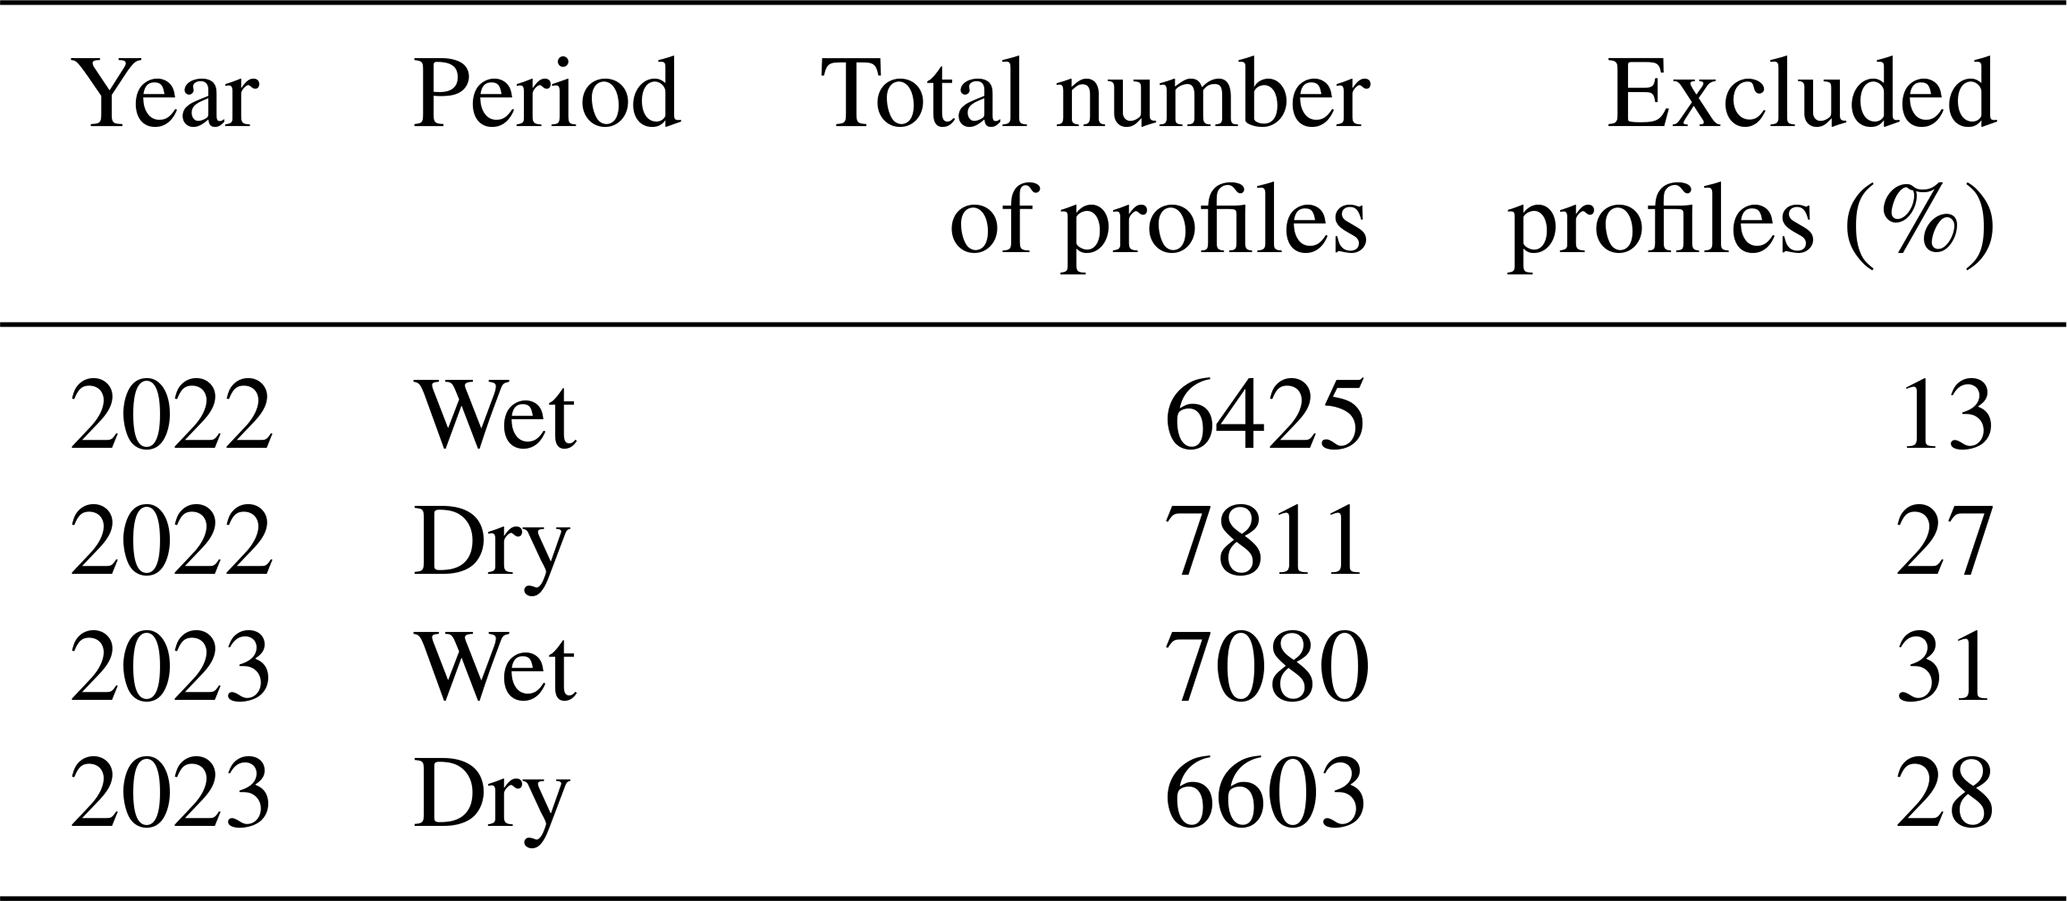
Subsequently, the data were classified by seasonal period (Dry and Wet) in each year, with 2022 associated with La Niña and 2023 with El Niño (Table 1). According to the NOAA Climate Prediction Center, La Niña conditions persisted from late 2021 to early 2023, whereas a strong El Niño developed around May 2023 and lasted until early 2024. In the central Amazon, La Niña typically brings wetter conditions and slightly cooler temperatures, while El Niño tends to produce drier and warmer conditions, particularly during the Dry season, due to reduced convective activity and changes in large-scale atmospheric circulation (Marengo et al., 2018; Jimenez et al., 2018).
Table 1Total number of 5 min profiles and percentage of profiles excluded after data filtering.
The Dry period was defined as the months of August, September, and October, and the Wet period encompassed the months of January to April. The inclusion of January is justified by the scarcity of data available in April, which could compromise the robustness of the analyses. Considering that January still falls within the region’s Wet season, its inclusion increases the representativeness of the data. Moreover, Dias-Júnior et al. (2026) showed that January remains among the rainiest months for ATTO’s area. This division aligns with regional seasonal precipitation patterns in the Central Amazon described by Marengo et al. (2001) and, for ATTO specifically, by Dias-Júnior et al. (2026). From this classification, hourly means of all analyzed variables were calculated at their respective measurement heights.
2.4 Estimation of the Height of the Nocturnal Boundary Layer
After filtering and classification, hourly mean profiles of H were obtained from the 5 min data, allowing the estimation of hn for each hour of the nighttime period, separately for the Dry and Wet seasons of 2022 and 2023. Since the sensible heat flux is greater near the canopy and decreases with height, hn was identified as the height at which H was less than 5 % of the H value measured near the canopy (50 m) (Lenschow et al., 1988; Mendonça et al., 2025). This turbulence-based approach is consistent with the fundamental definition of the atmospheric boundary layer. To allow comparison among profiles, the H values at all heights were normalized by the value measured at 50 m (H50 m).
In addition to the seasonal and hourly analyses, we selected two nights as case studies to investigate the relationship between variability in hn and the vertical concentration profile of CO and CH4: one with a shallow hn layer (hn∼80 m) and another with a deeper layer (hn∼150 m). The idea here was to investigate to what extent hn affects the temporal and spatial gas concentration variations along the tower.
3.1 Atmospheric Stability at the ATTO Site
Figure 2 shows the hourly mean values of Rn and stability parameter () for the Wet and Dry periods in the years 2022 and 2023. Both the Wet and Dry seasons of 2022 presented Rn values with larger magnitude than those observed in the Wet and Dry seasons of 2023 (Fig. 2a, b). In addition, values for the Dry season are greater than those observed in the Wet season, in both years. Cloud cover has a direct relationship with Rn values (Barber and Thomas, 1998; von Randow et al., 2004; de Oliveira et al., 2016). Greater cloud cover is associated with lower radiative loss, that is, smaller values. Therefore, in the Dry season, where cloud cover is lower, there is greater radiative loss. The same reasoning applies to the year 2023, an El Niño year characterized by reduced cloud cover over the central Amazon (Jimenez et al., 2018; Restrepo-Coupe et al., 2023). Atmospheric stability also varies systematically between seasons (Fig. 2c, d). The Wet period is less stable (smaller ), while the Dry period shows stronger stability () consistent with enhanced radiative cooling and reduced turbulent mixing. El Niño in 2023 enhanced this effect (Fig. 2d).
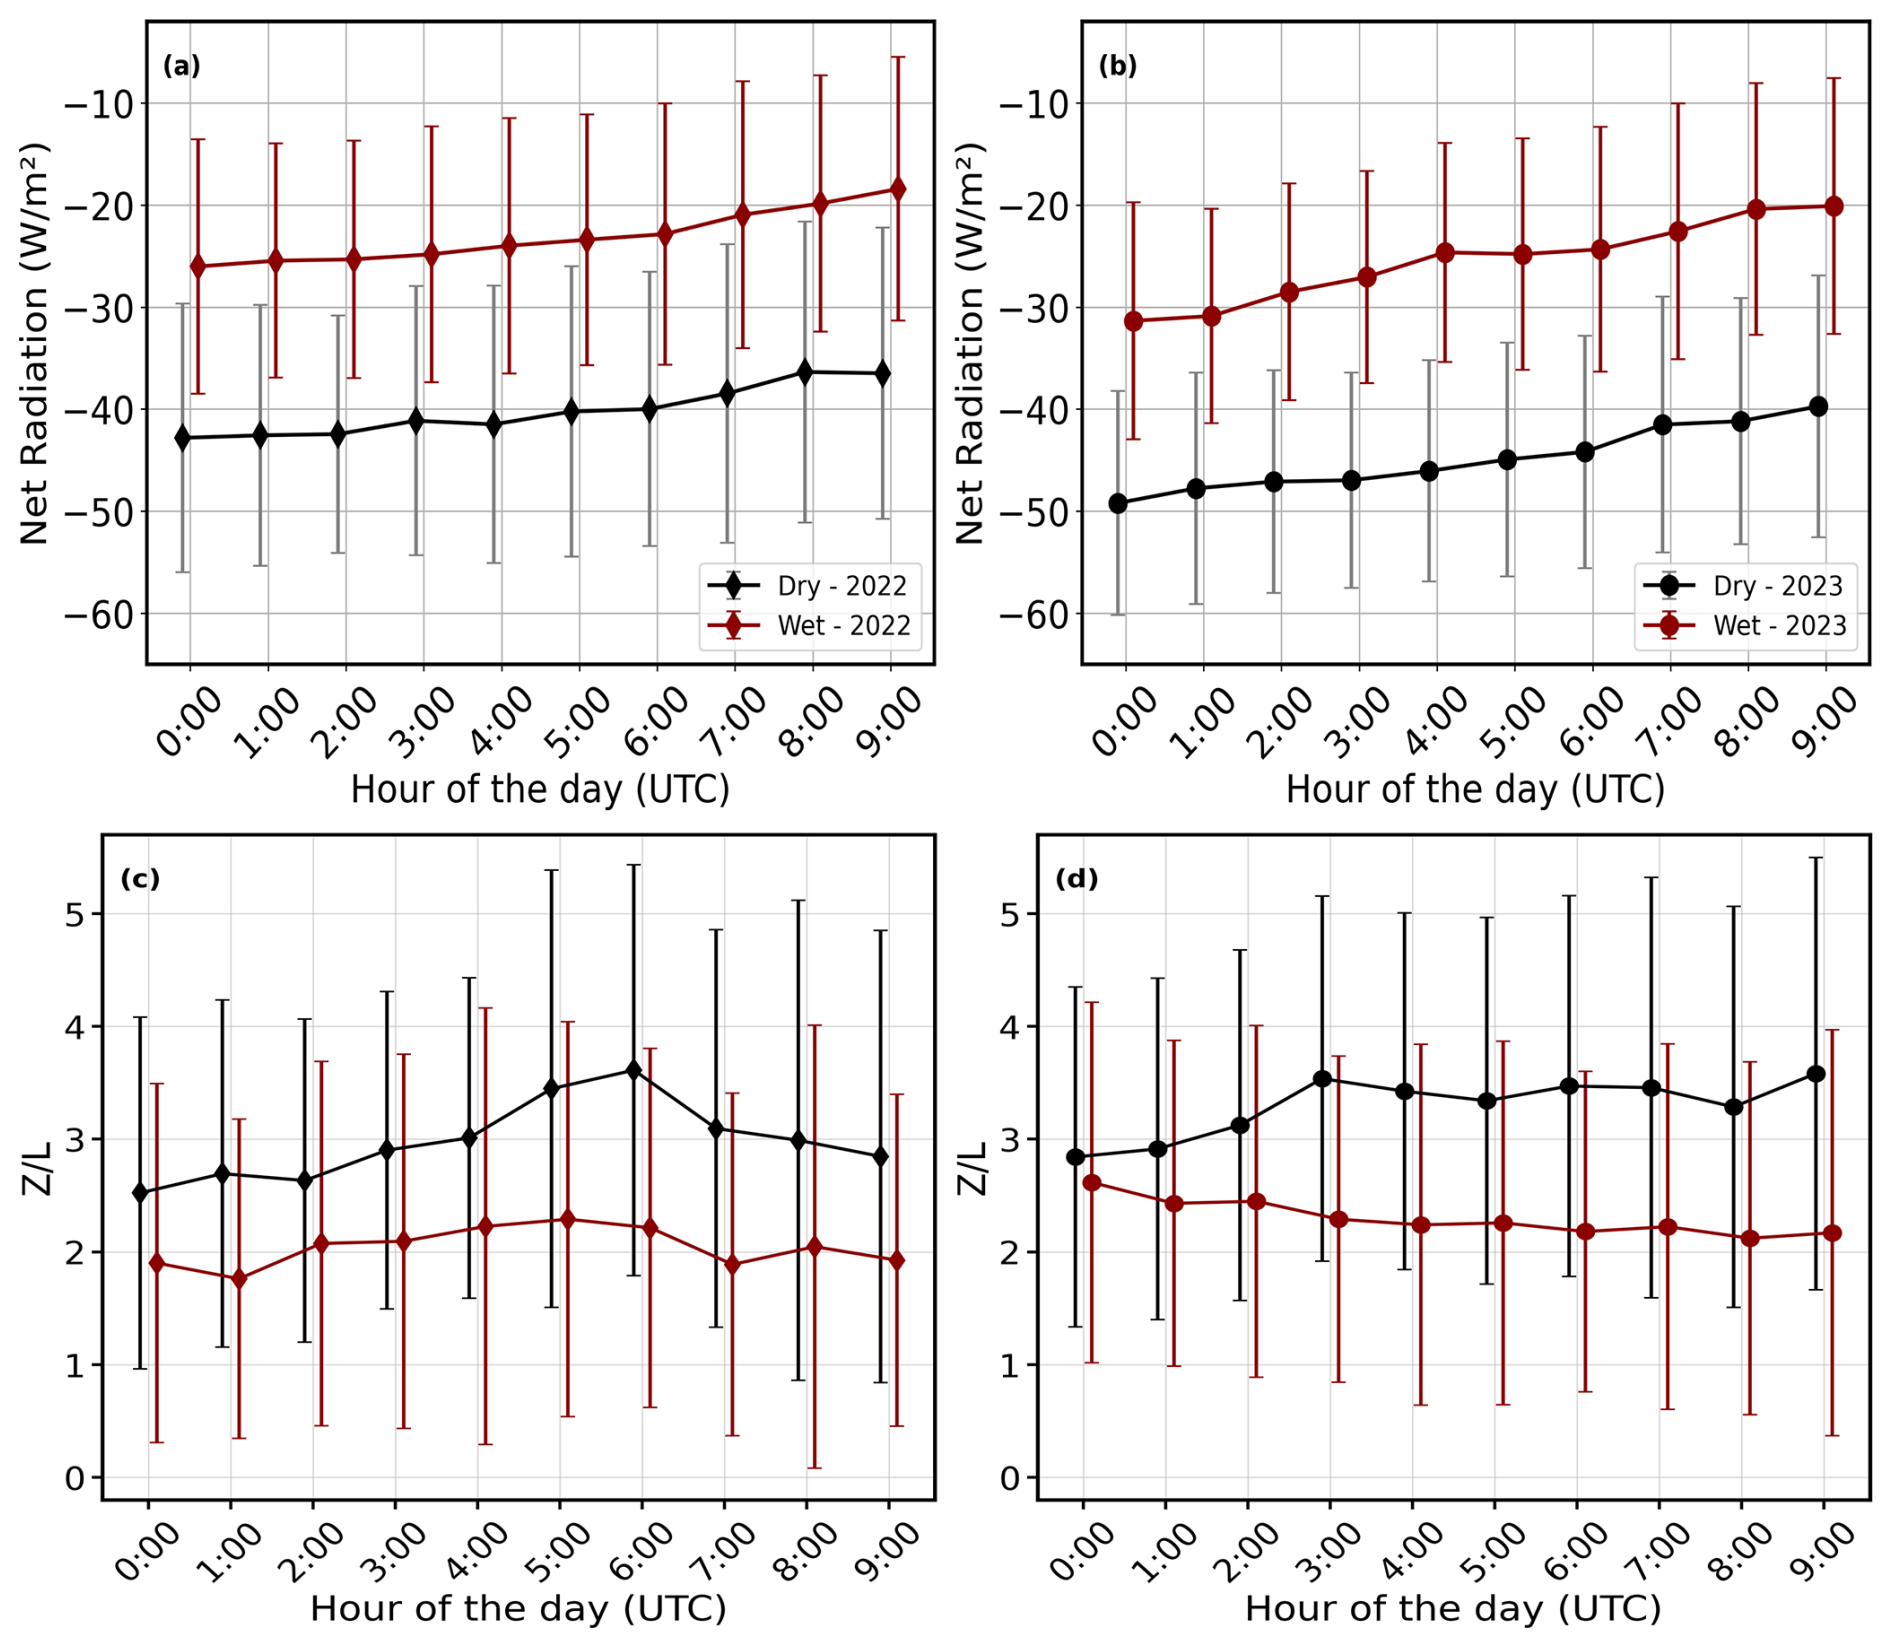
Figure 2Hourly mean values of (a, b) net radiation (Rn) measured at 81 m and (c, d) stability parameter () calculated at 50 m for the Wet season (red) and the Dry season (black) during 2022 (left panels) and 2023 (right panels). The bars indicate the standard deviation.
To place the analyzed years in a broader climatological context, Fig. 3 shows the monthly nocturnal climatology of Rn and for the 2016–2024 period, using the same nighttime interval adopted in this study (00:00–09:00 UTC). The climatology highlights a clear seasonal cycle, with stronger nocturnal radiative cooling during the dry season associated with higher values and therefore more stable atmospheric conditions. In 2023, values were higher than the climatological mean during most months, especially from May onward, whereas 2022 remained closer to, or below, the climatological mean values. These departures from the ATTO climatology indicate that the two analyzed years experienced distinct nocturnal radiative cooling and stability conditions. Since Rn and are relevant controls on turbulence intensity and the vertical structure of the nocturnal boundary layer, these differences may be related to the contrasting hn behavior observed in 2022 and 2023 (discussed in Sect. 3.2).
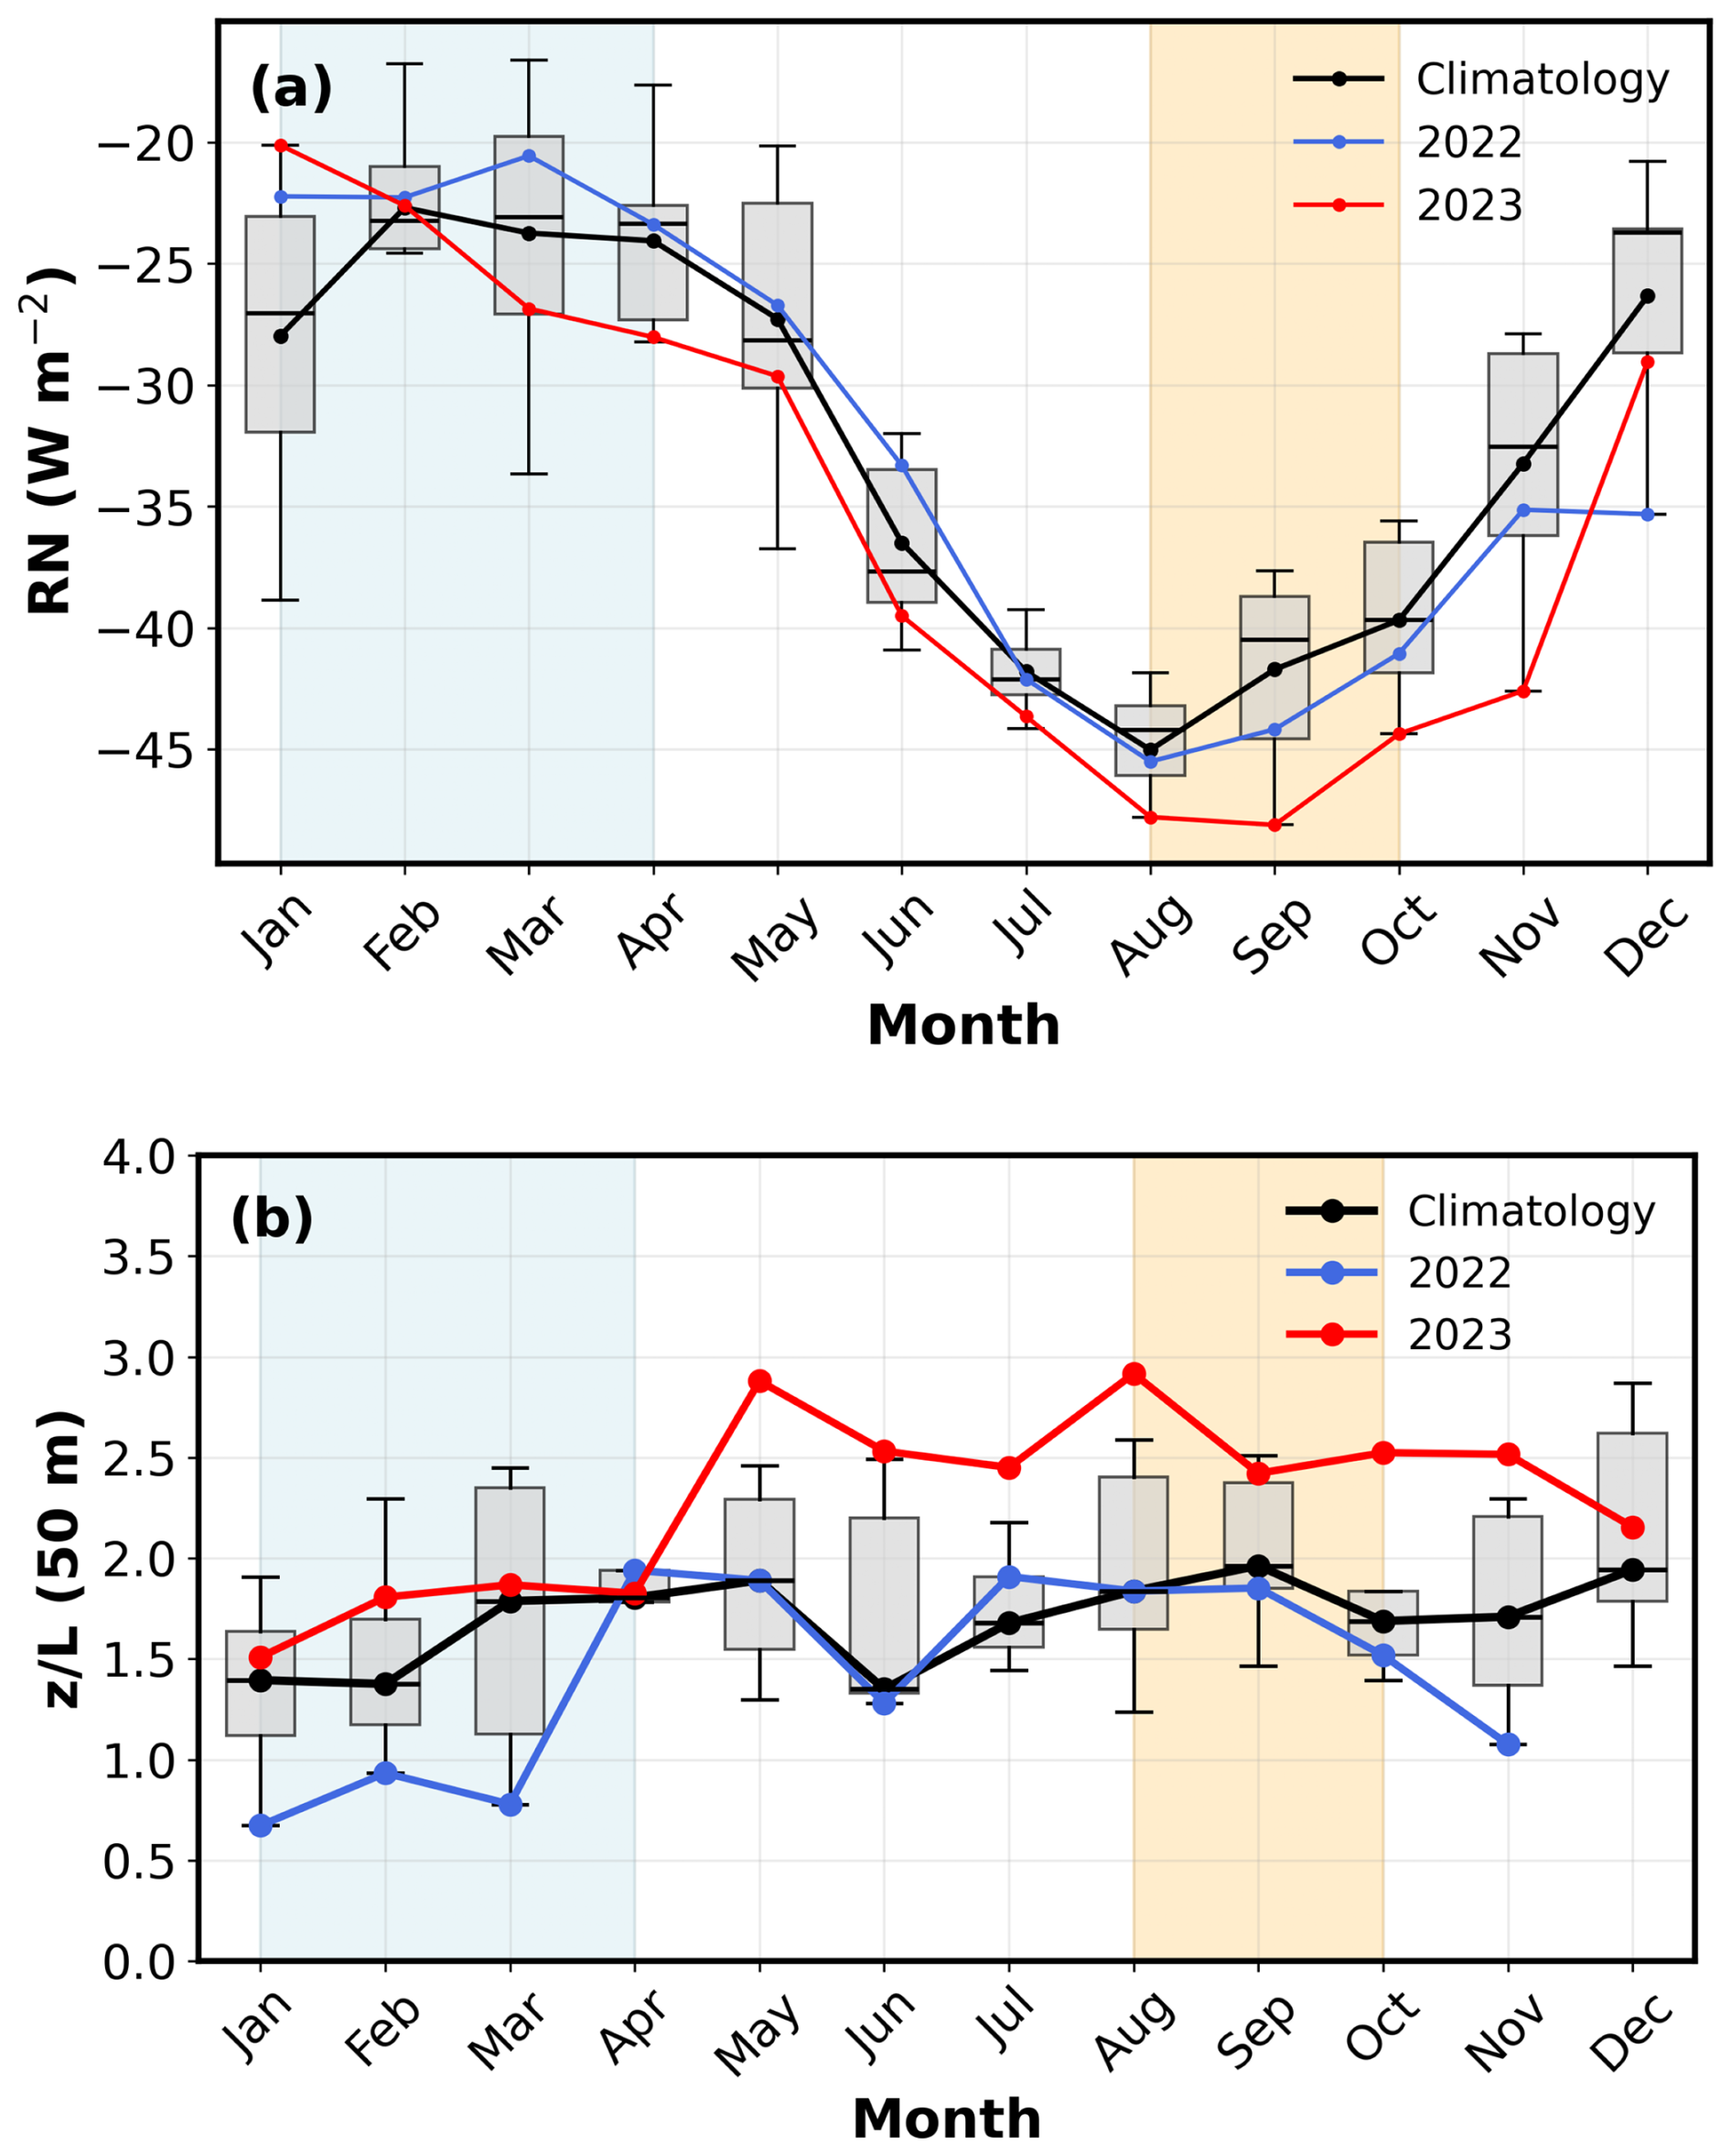
Figure 3Monthly mean of (a) net radiation (Rn) at 81 m and (b) stability parameter () at 50 m for the nighttime period (00:00–09:00 UTC). Grey boxplots represent the monthly climatological distribution for 2016–2024. Shaded blue and orange areas indicate the wet and dry seasons, respectively.
3.2 Seasonal Mean Cycle of NBL Height
Figure 4 presents the normalized vertical profiles of sensible heat (). The turbulent heat fluxes cease at different heights when comparing the Dry and Wet seasons, which indicates important seasonal variations of hn. During the Wet period, turbulence extends up to approximately 200±33 m in 2022 and 150±24 m in 2023, while in the Dry period this height is reduced to about 120±28 m in 2022 and 100±21 m in 2023.
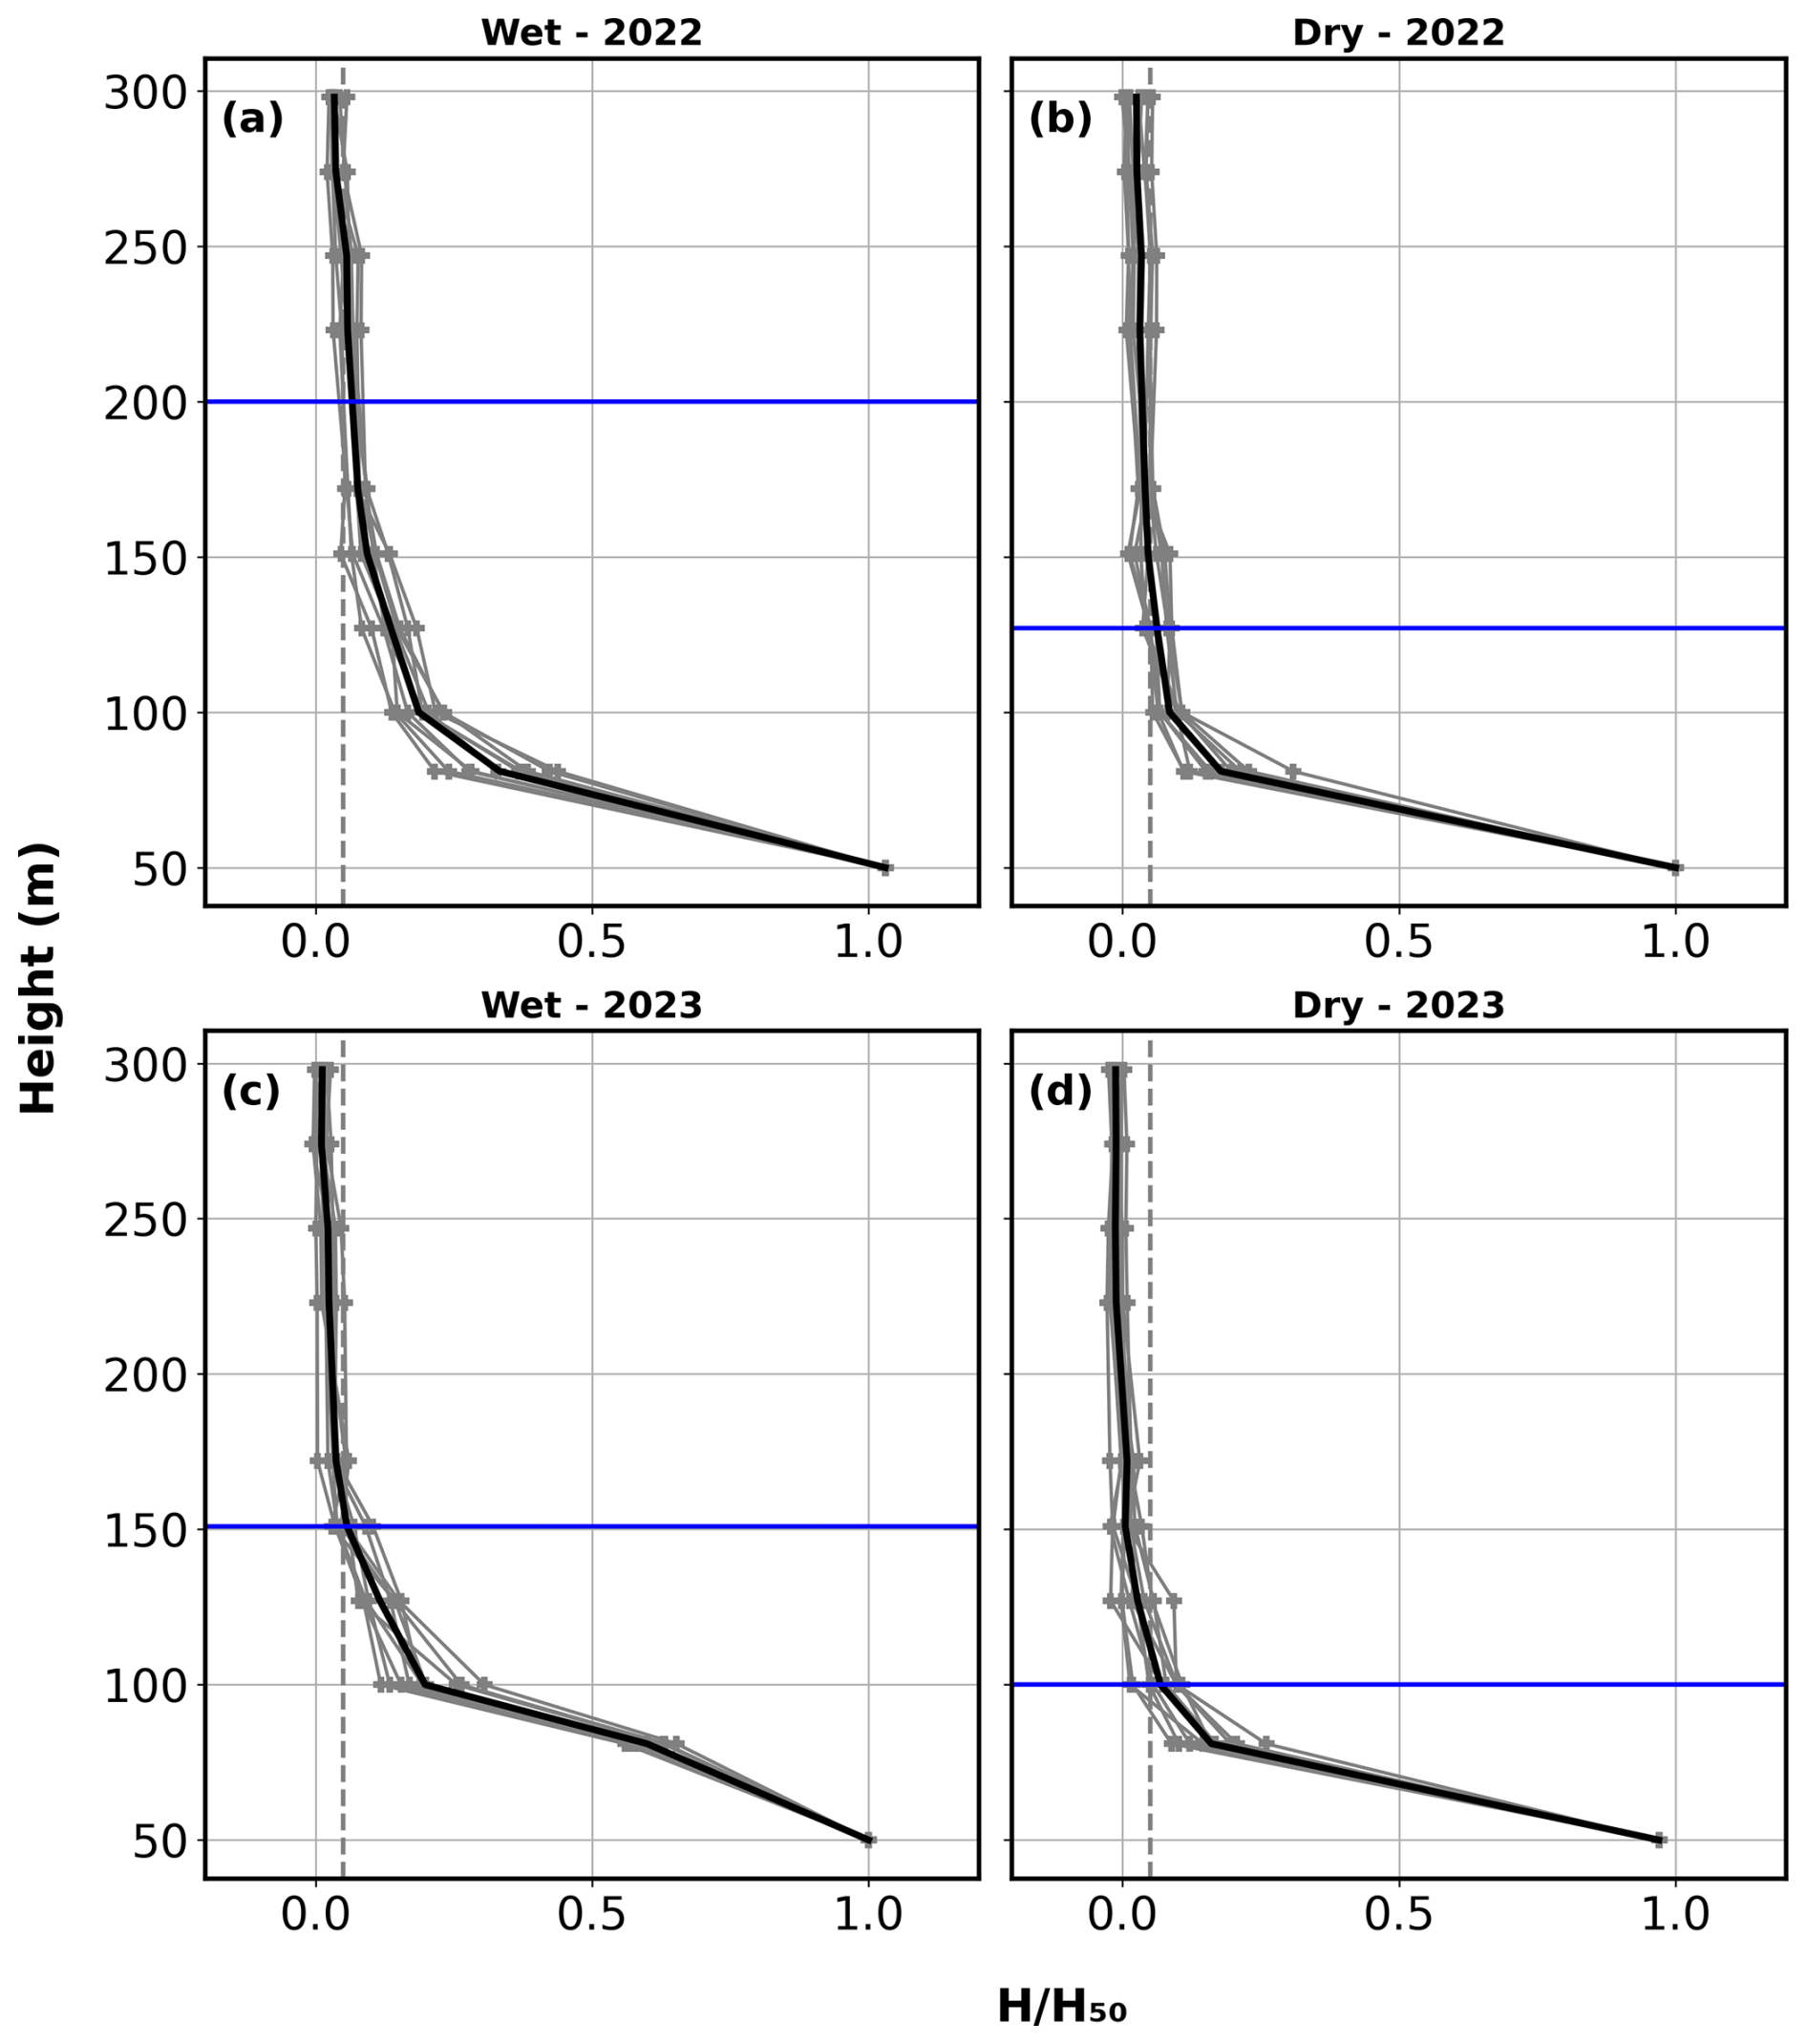
Figure 4Hourly profiles of normalized sensible heat flux () for (a) Wet season 2022, (b) Dry season 2022, (c) Wet season 2023, and (d) Dry season 2023. Grey curves represent the individual hourly nighttime profiles, illustrating the variability in the vertical distribution of throughout the night. The bold solid curve in each panel shows the seasonal mean profile. The vertical dashed grey line marks the 5 % threshold (), and the horizontal blue line marks the seasonal mean height at which this threshold is reached, interpreted as the hn.
Figure 5 presents the hourly mean values of hn for the Wet and Dry periods for the two years analyzed here. In 2022, hn exhibited seasonal variations, being 274 m at the beginning and 151 m at the end of the night during the Wet season, while in the Dry season the values range between 223 m (beginning of the night) and 100 m (end of the night). In 2023, the seasonal variation of hn is smaller between the seasons, ranging between 172 m at 00:00 UTC and 100 m at 09:00 UTC. In addition, regardless of the season or the year, the hn values are higher at the beginning of the night and decrease progressively.
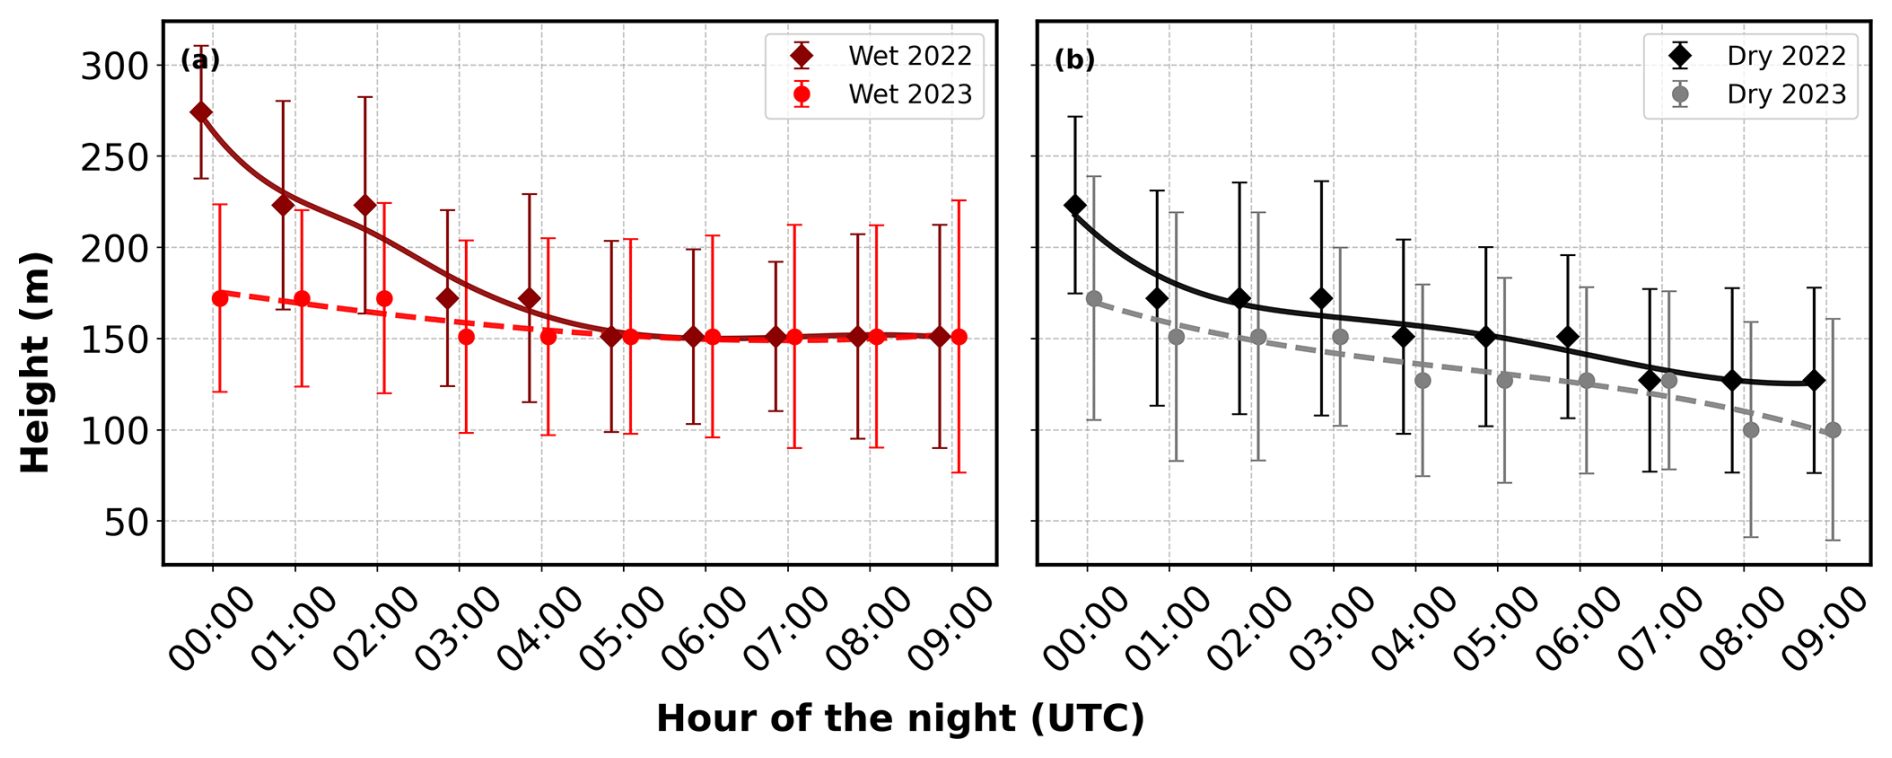
Figure 5Mean values and standard deviation of hn for (a) the Wet period of 2022 and 2023 and (b) the Dry period of 2022 and 2023. The curves represent smooth fits obtained by spline between the mean hn values.
3.3 Temporal Variability of NBL Height and Its Relationship with Greenhouse Gas Concentrations Near the Surface: Case Studies
In general, hn shows a gradual decrease throughout the night (Fig. 5). However, these changes in hn values can be reflected in the vertical profiles of trace gasesmeasured along the tower. In order to explore this relationship, we refer to Fig. 6, which shows two case studies: one in which the hn values remained low throughout the entire night (18 August 2022), with values around 81 m, and another in which hn showed a progressive increase from about 100 to 170 m throughout the night (25 August 2022).
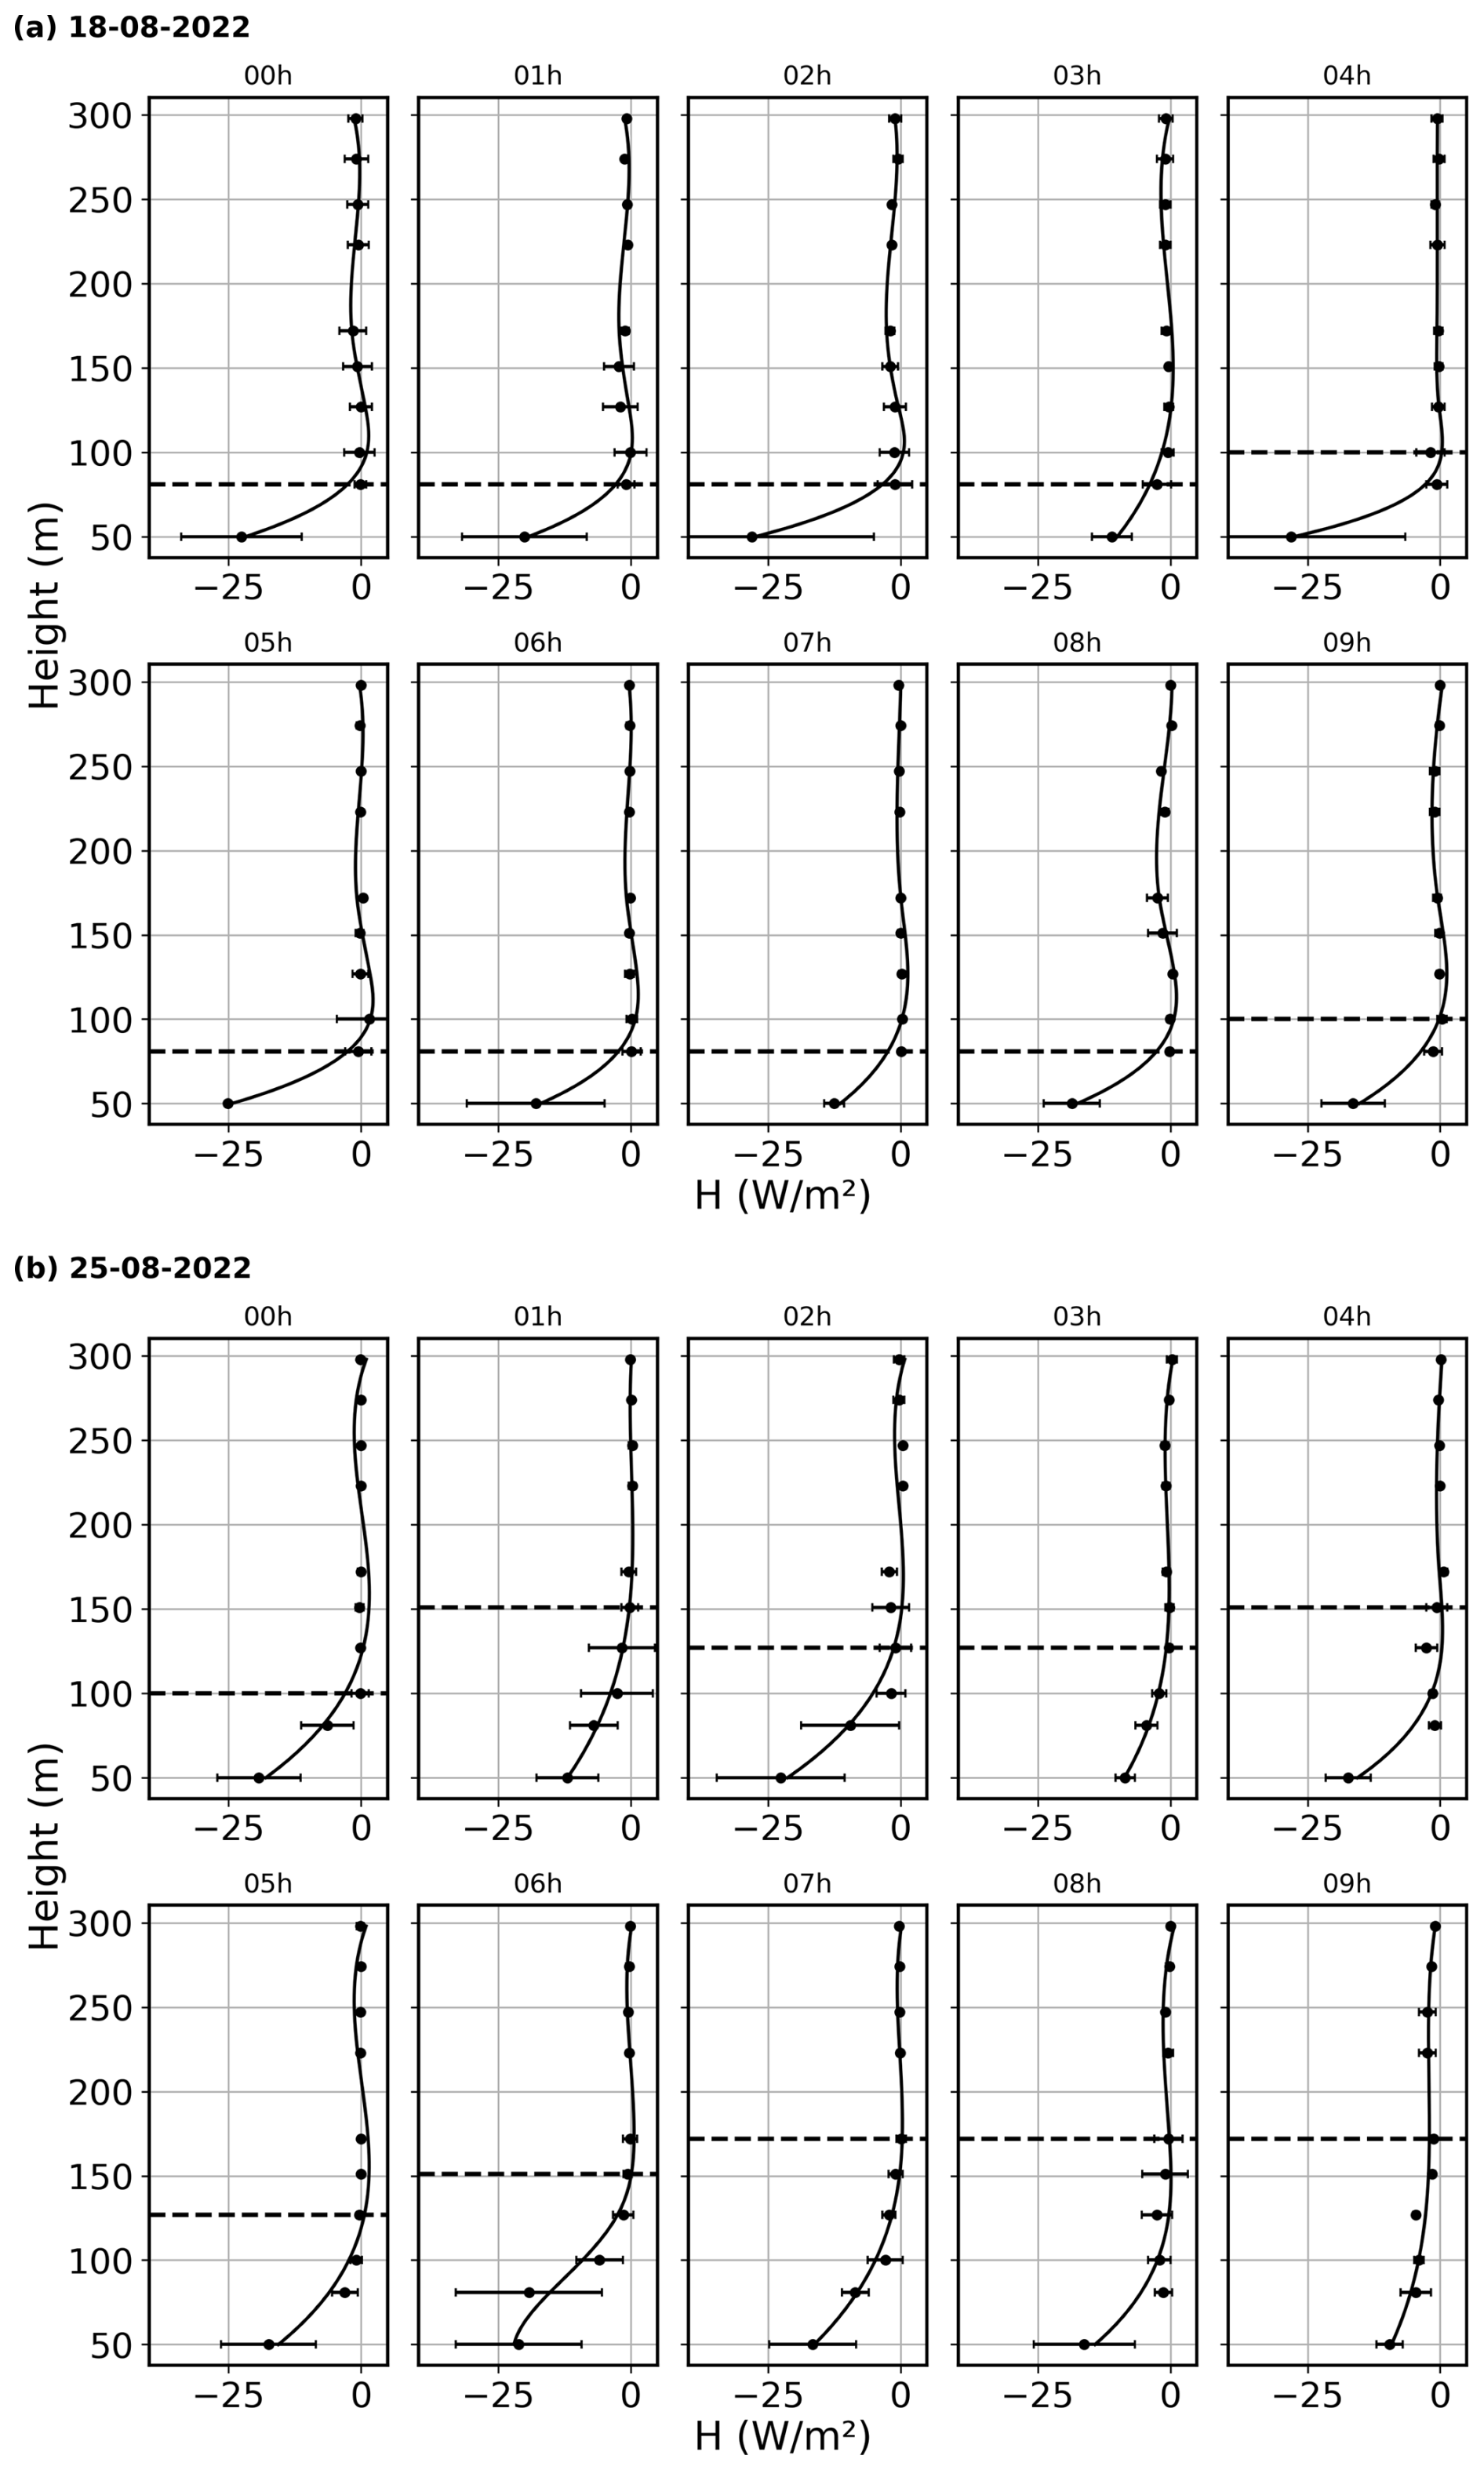
Figure 6Hourly mean profiles of sensible heat flux (black curve), standard deviation, and the corresponding hn (horizontal dotted lines) for (a) 18 August 2022 and (b) 25 August 2022.
The wind profiles (Fig. 7) show the occurrence of low-level jets (LLJs) on both nights, but with distinct characteristics. On the night of 18 August, the jet nose (maximum speed in the wind profile) was located at a height that oscillated around 80 to 100 m, while on the night of 25 August the jet nose was located around 170 m. Another important difference is observed in the dominant wind direction during the two nights (Fig. 8). During the night of 18 August, the predominant wind direction was from the northeast at the lowest levels and from the southeast at the highest levels. During the night of 25 August, the wind direction ranged between north and northeast from the top of the canopy up to 298 m. According to Mendonça et al. (2026), the jet nose (maximum speed in the wind profile) can serve as an indicator of hn, which is consistent with what we observe in our case studies.
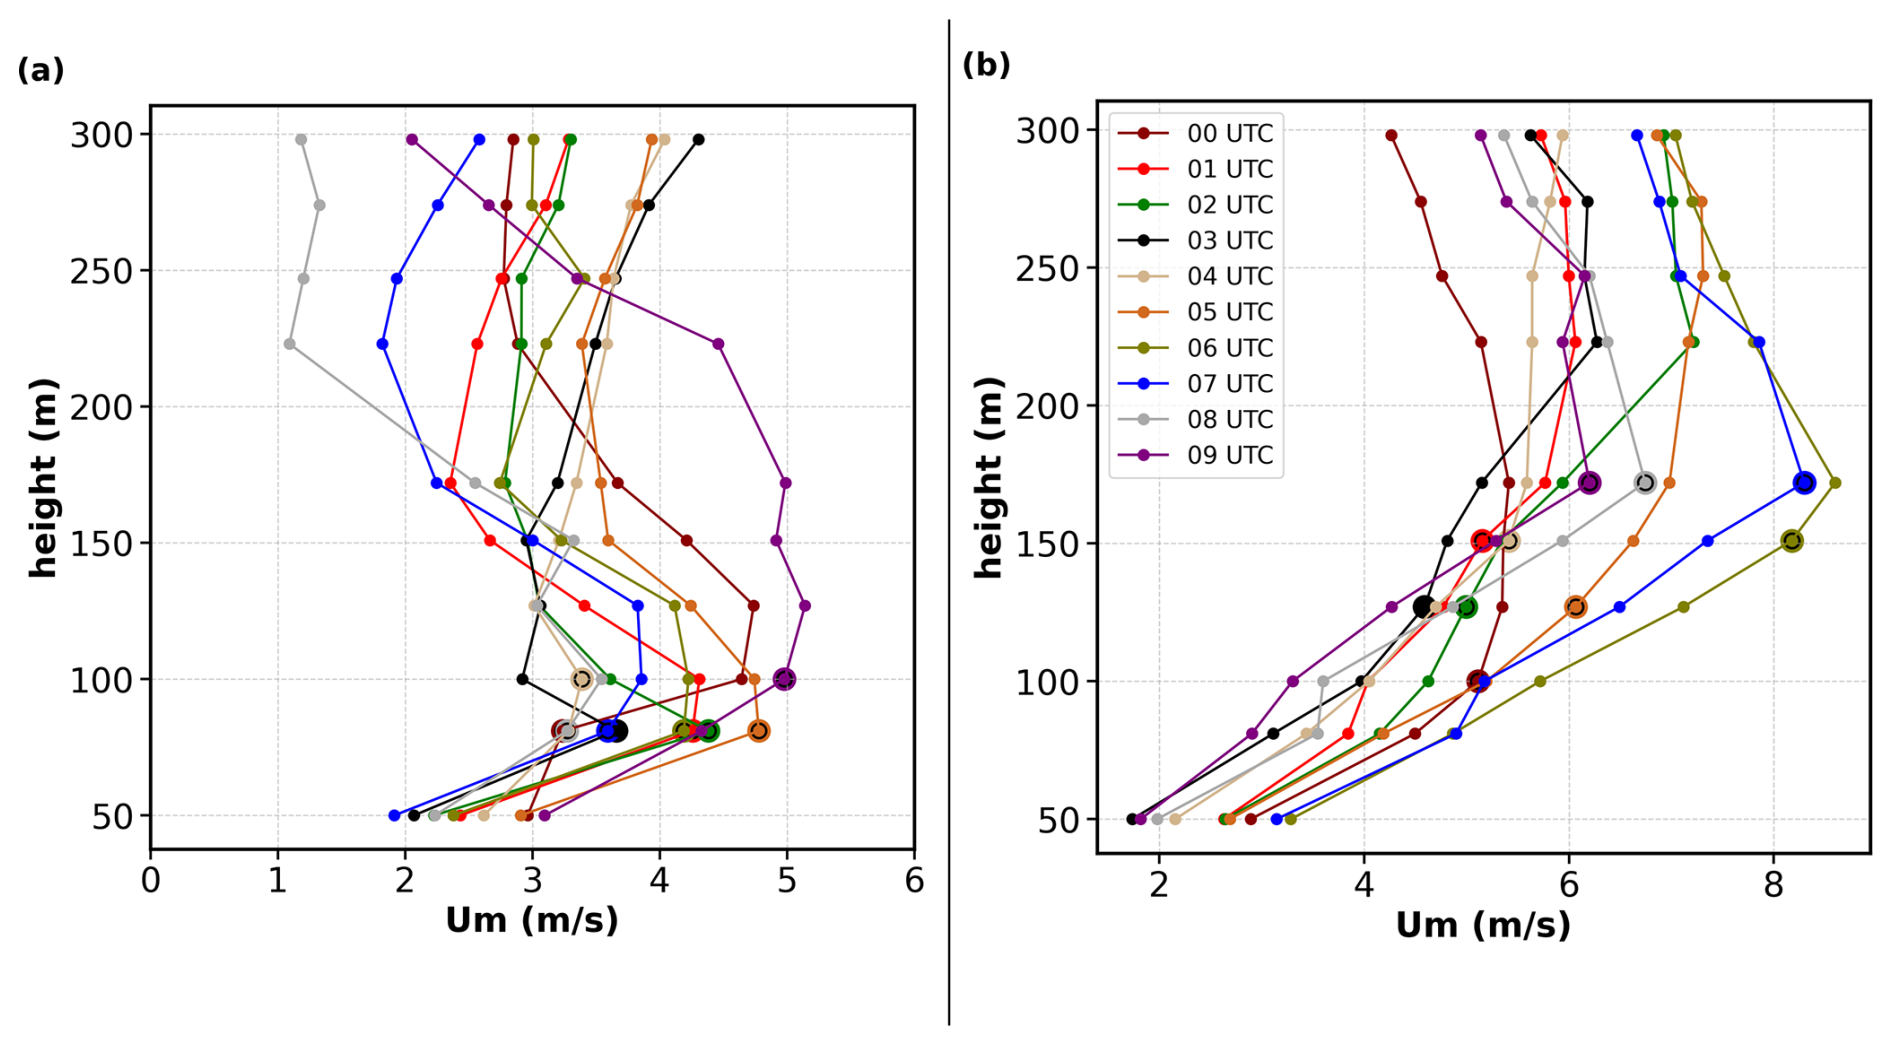
Figure 7Hourly mean wind speed profiles for (a) 18 August 2022 and (b) 25 August 2022. The different colors indicate the different hours. The larger hollow circles mark the hourly estimates of the hn.
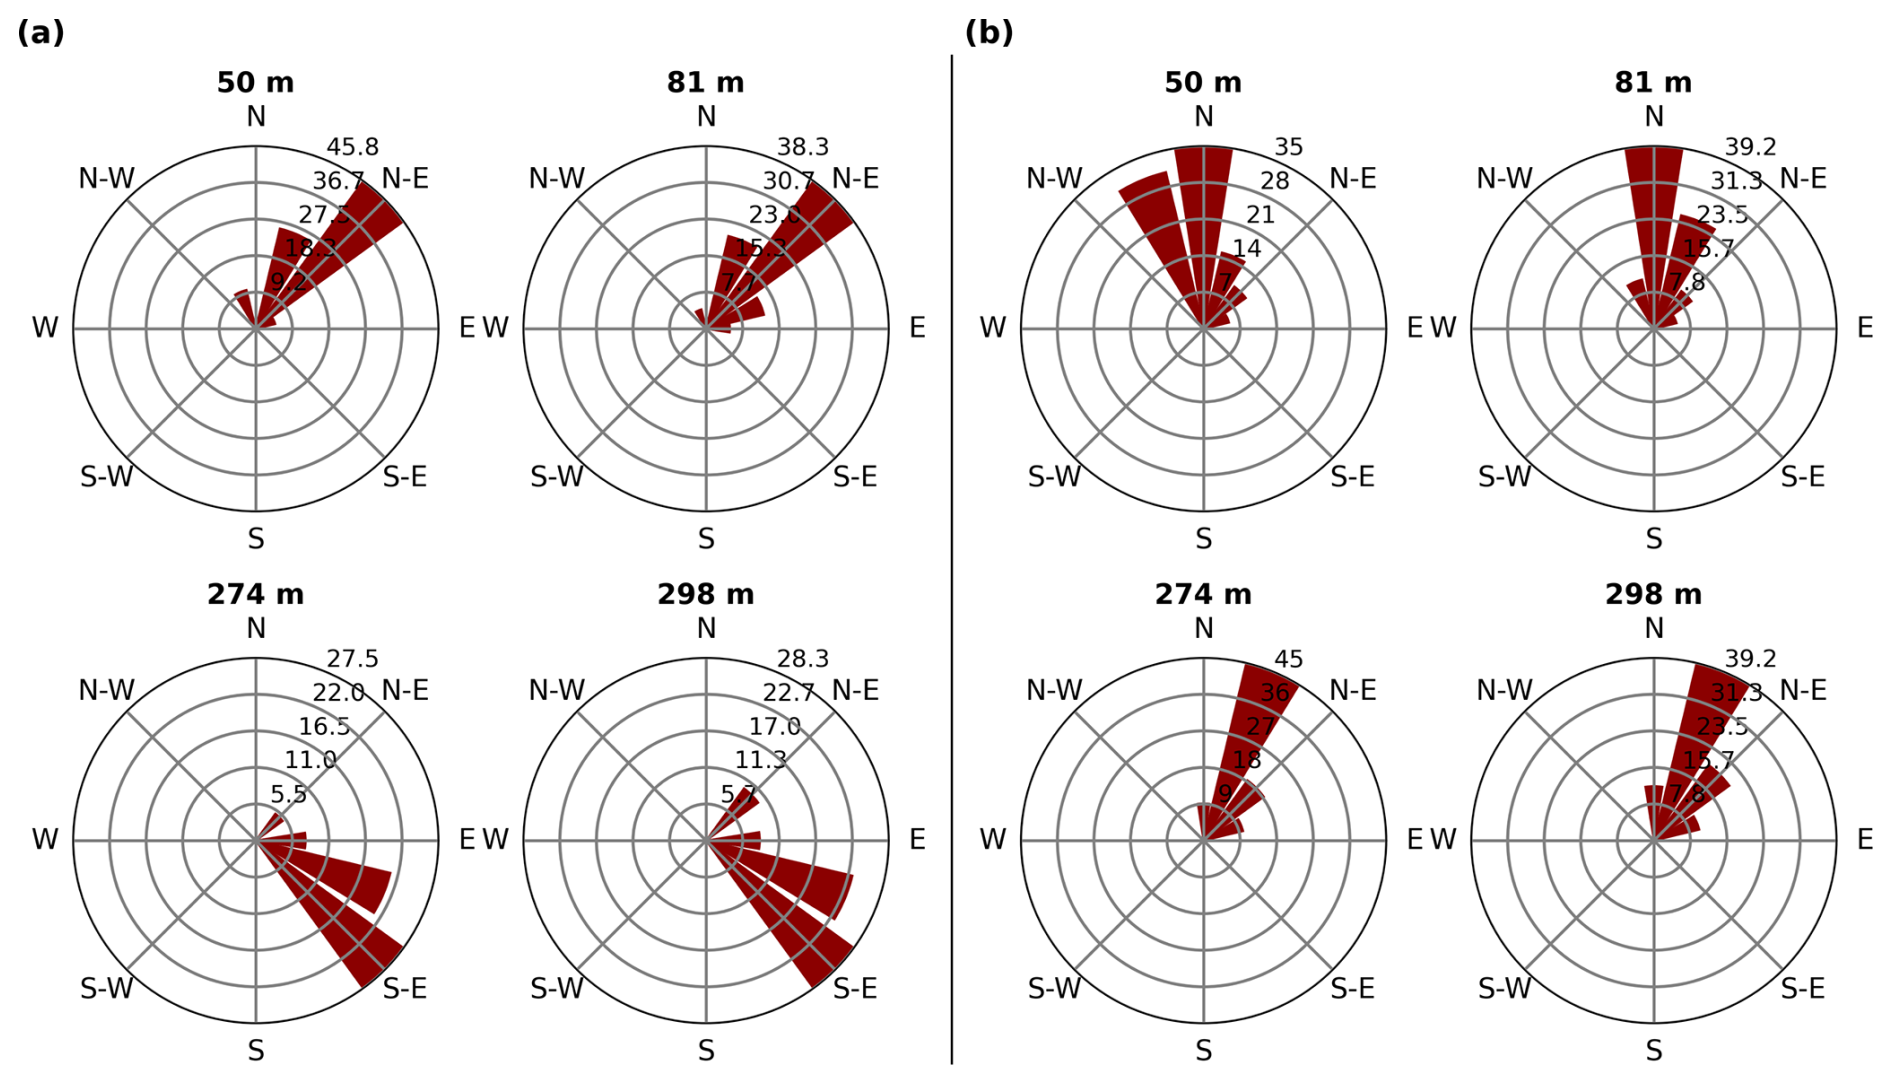
Figure 8Wind direction at four distinct heights for (a) 18 August 2022 and (b) 25 August 2022.
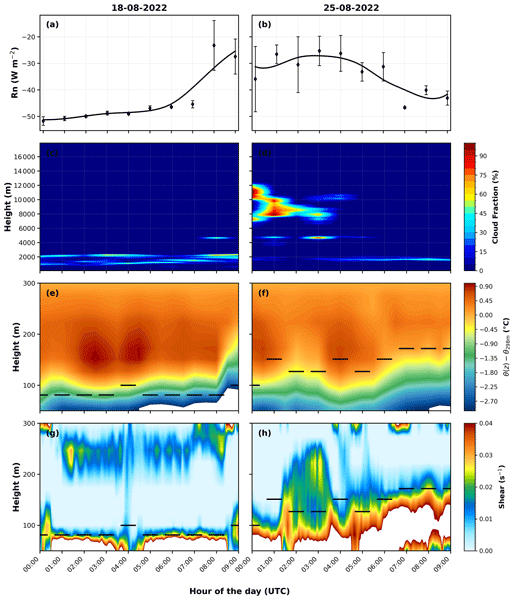
To better identify the main drivers controlling the contrasting hn behavior during the two case-study nights, we further analyzed Rn at 81 m, cloud cover, the vertical profile of θ and wind shear () (Fig. 9). These variables provide complementary information on the local radiative forcing, cloud modulation of nocturnal cooling, thermal stratification, and mechanical turbulence generation. The night of 18 August 2022 was characterized by strong nocturnal radiative cooling (Fig. 9a), reduced cloud occurrence (Figs. 9c and S2), and a pronounced vertical potential temperature gradient (Fig. 9e). These conditions indicate enhanced thermal stratification near the surface. Although wind shear was observed at some levels (Fig. 9g), the strong stratification suggests that mechanically generated turbulence aloft was not efficiently coupled downward toward the canopy. This supports the interpretation that the shallow hn observed on 18 August 2022 reflects not only strong thermal stratification, but also canopy-induced suppression of vertical mixing near the forest top. This configuration is consistent with a shallow surface-based nocturnal layer that remained partly decoupled from the air above, similar to the layered nocturnal structure described by Mahrt and Acevedo (2023). In contrast, the night of 25 August 2022 showed larger cloud cover (Figs. 9d and S3), weaker radiative cooling during the early part of the night (Fig. 9b), and weaker thermal stratification (Fig. 9f). Wind shear extended to higher levels (Fig. 9h), reaching approximately 150–170 m, close to the observed hn. This suggests that, under weaker stratification, mechanically generated turbulence was more effectively coupled over a deeper layer, contributing to the larger and more variable hn observed during this night.
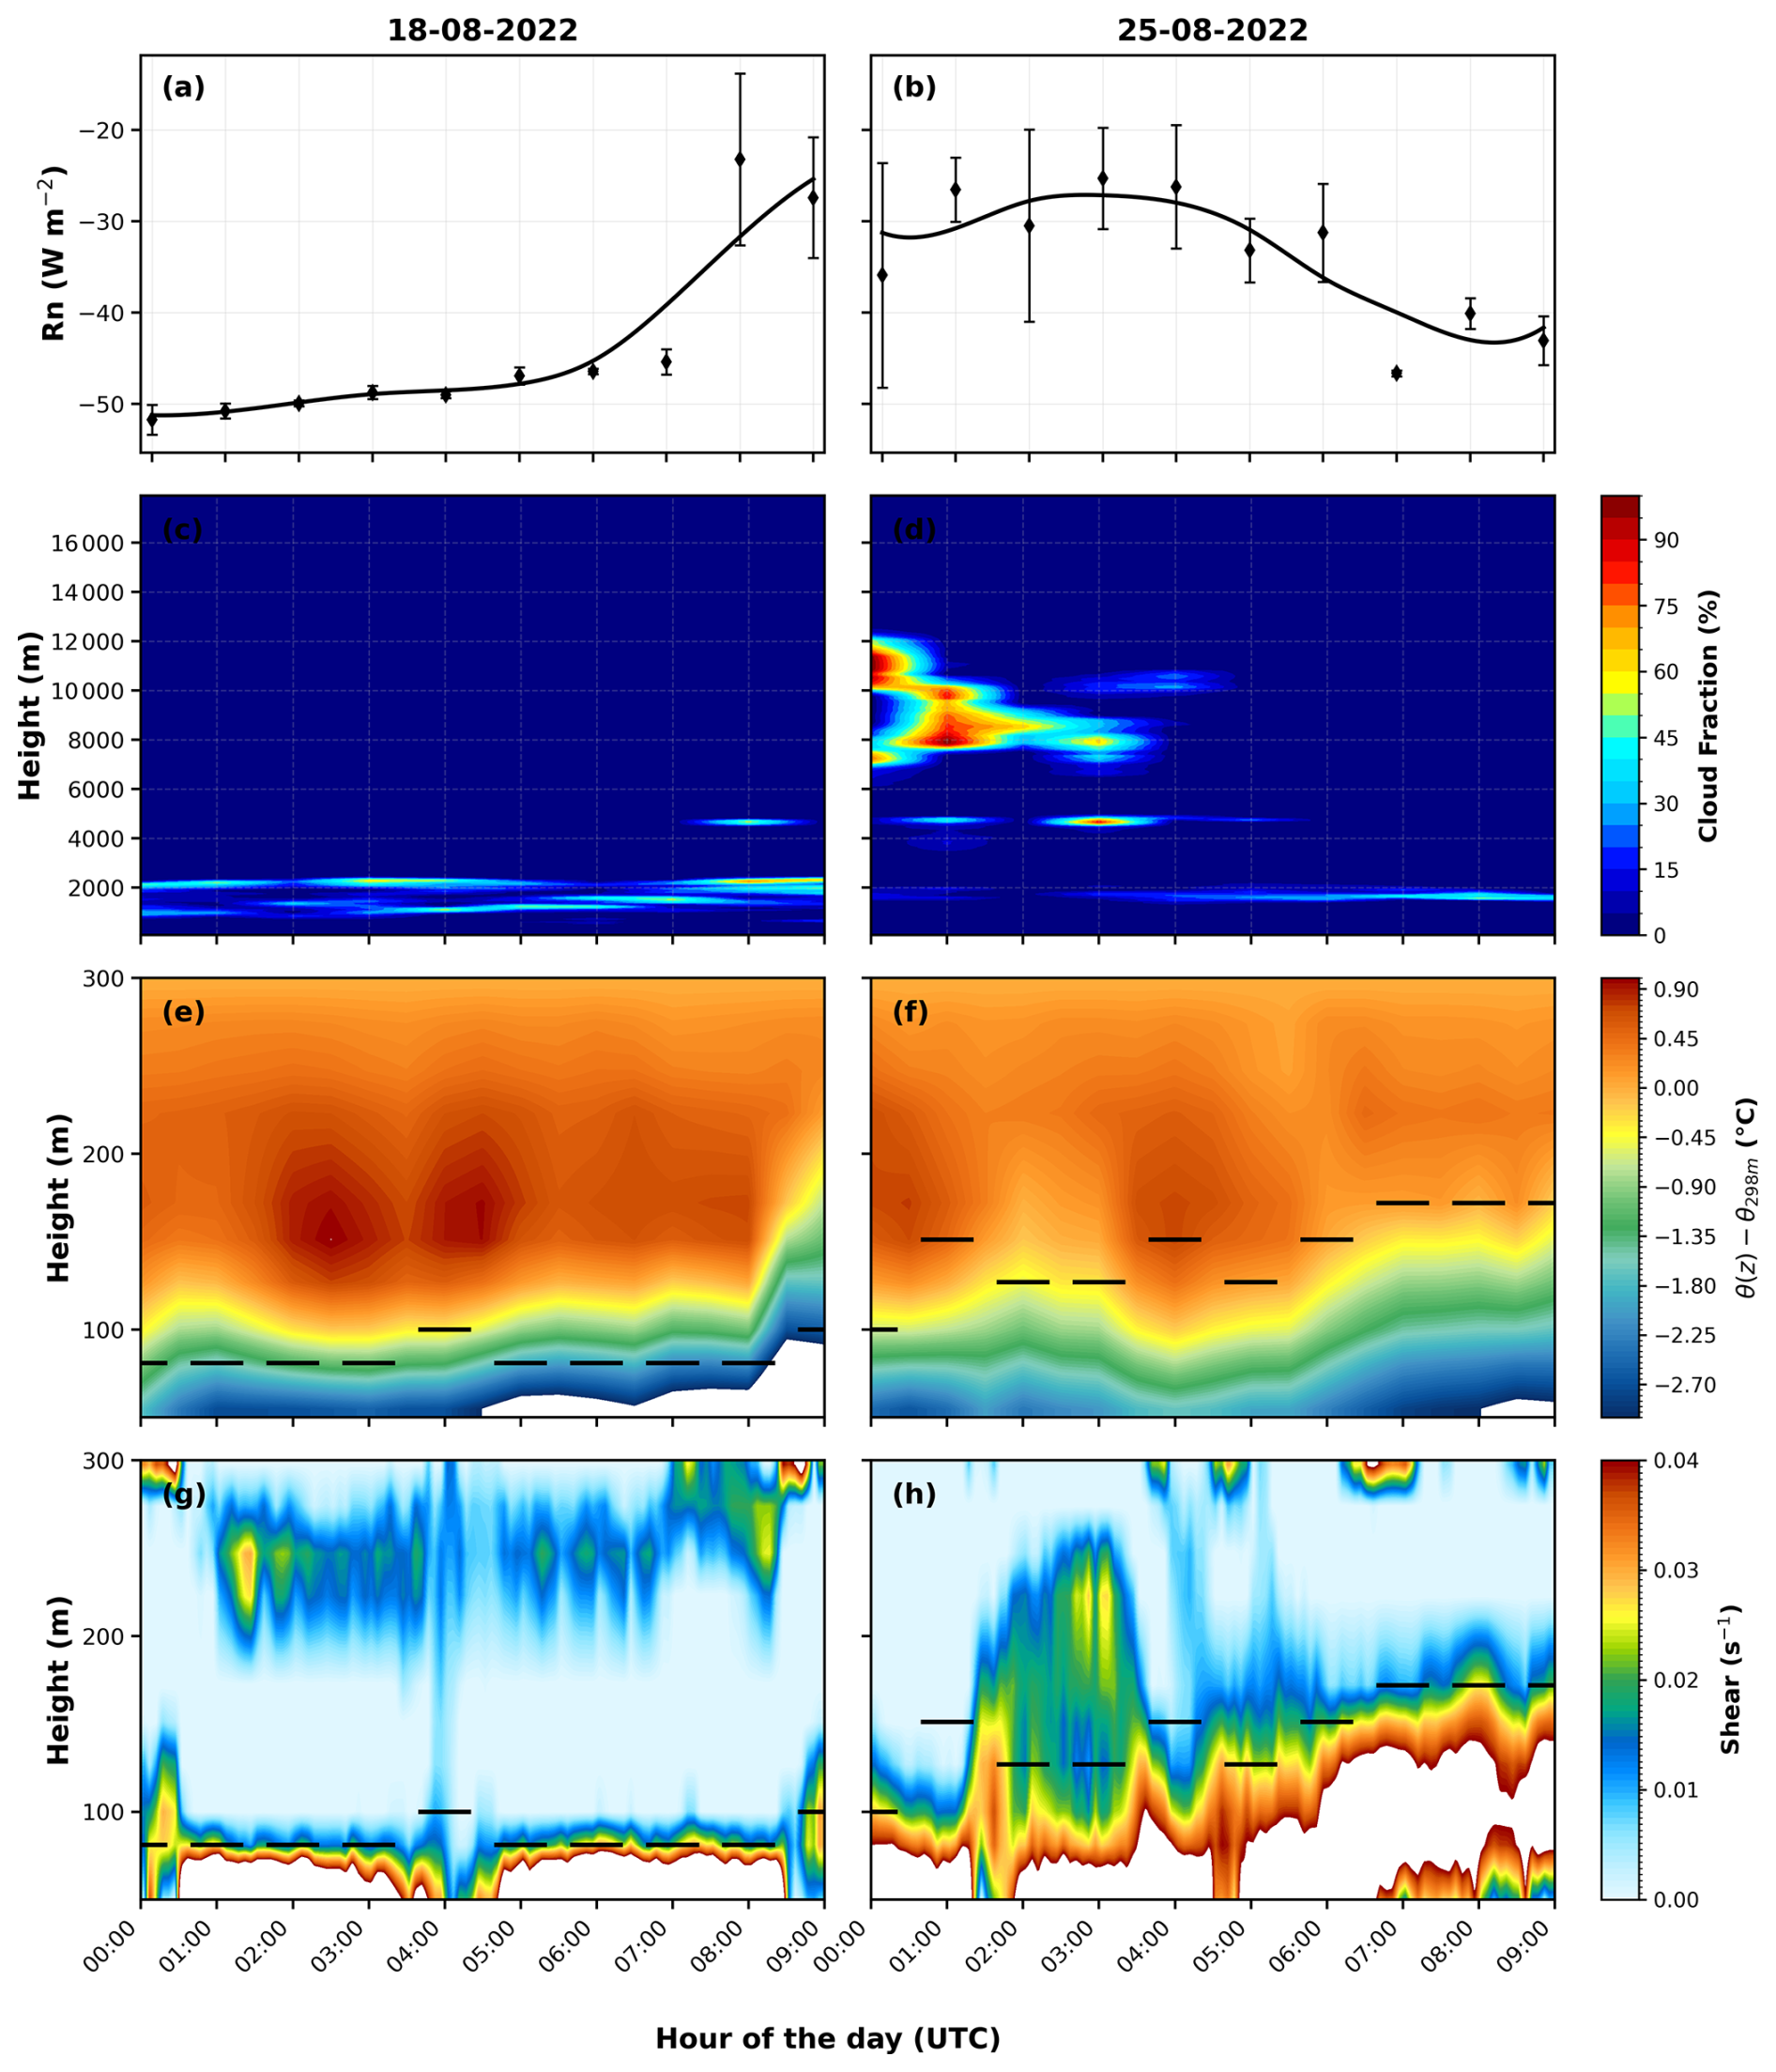
Figure 9Nocturnal evolution of (a, b) hourly mean net radiation (Rn) at 81 m (± standard deviation), (c, d) cloud fraction (%), (e, f) vertical potential temperature (θ) difference from the value observed at 298 m, and (g, h) vertical wind shear () during the case-study nights of 18 August 2022 (left panels) and 25 August 2022 (right panels). Black horizontal segments indicate the estimated nocturnal boundary layer height at each hour.
Figure 10 shows the CO and CH4 concentrations for the two case studies. During the night of 18 August, the propagation of an air plume rich in CO and CH4 that reached the tower was observed. However, this air mass was only detected by the inlets located at the highest heights (321 and 273 m), producing strong vertical differences in the tower CO and CH4 profiles. The observation of elevated CO and CH4 concentrations at higher altitudes, together with the different flow direction above the hn (Figs. 6 and 8), suggests that these air masses originated from more distant sources. Air arriving from the SE–S sector (above the NBL, Fig. 6) likely transported high concentrations of CO and CH4, possibly associated with regional biomass burning plumes (Andreae et al., 2015; van Asperen et al., 2024) (Fig. S4). In addition, it is believed that the plume did not penetrate down to canopy level (50 and 81 m) because the shallow hn that night acted as a barrier (Fig. 6). Meanwhile, air masses originating from the N–NE (below the NBL, Figs. 6 and 8) exhibited lower CO and CH4 concentration. We hypothesize that the height of 150 m is in the transition between the two layers, which explains why the CO and CH4 concentrations coincide partly with those observed at 42 and 81 m. It is also noted that around 07:00 UTC the CO and CH4 concentrations at the higher heights begin to decrease, reaching values similar to those observed at the lower heights at 09:00 UTC, which could indicate that the tower is leaving the concentration plume, caused by a change in wind direction at higher heights which shifted from SE–S to N–NE. To clarify, the layers remain decoupled, but the flow in both layers comes from the same direction and is no longer influenced by air masses with elevated CO and CH4 concentration (Fig. S4a).

Figure 10Vertical profiles of CO and CH4 for the nights of 18 August 2022 and 25 August 2022. CO is shown in panels (a) and (b), and CH4 in panels (c) and (d). Dashed lines indicate CO and solid lines indicate CH4.
On the night of 25 August, CO concentrations were higher than those observed on 18 August, indicating a multi-day pattern in which CO levels were generally elevated across the region (Fig. S6), as more often observed in the region (van Asperen et al., 2024). At 00:00 UTC on 25 August the highest CO and CH4 concentrations were observed at the heights closest to the forest canopy, thereby different than at 18 August (Fig. 10b). Although plumes typically arrive first above the canopy, this apparent inversion can be explained by the slower response of air within the canopy to atmospheric changes. Elevated air from previous days (before 25 August; see Fig. S5) may have penetrated the canopy, and while the passing plume quickly removed high concentrations from the upper layers, ventilation near the canopy occurred more slowly, resulting in higher concentrations at lower levels. Therefore, at 00:00 UTC, it appears that there is more CO and CH4 at the lower levels, but this may simply reflect a delayed residual effect of a previous plume that has not yet been flushed out from the lower layers of the NBL. This is consistent with the difference in wind speed between heights, about 3 m s−1 at 50 m and 5 m s−1 at 150 m (Fig. 7), suggesting slower air renewal at the lower levels.
One hour later (at 01:00 UTC) there is practically no difference between the CO and CH4 concentrations at all measurement levels, remaining so until around 03:00 UTC. This behavior suggests that a new plume arrived at 01:00 UTC. It should be noted that at 03:00 UTC the CO and CH4 concentrations at 321 m start to decrease, while at the lower levels there is a lag in this decrease. From 05:00 UTC the CO and CH4 concentrations begin to decrease rapidly at the higher heights, while at the lower levels they decrease much slower. Overall, these two case studies highlight that the hn is reflected in the vertical CO and CH4 concentration profiles, thereby supporting our estimated hn. When there is strong decoupling between the NBL and the layer above, air within the NBL can become trapped: the CO and CH4 plume may be unable to enter the NBL, as on 18 August, or may be slow to ventilate out, as observed on 25 August.
The results presented here demonstrate that the nocturnal boundary-layer height (hn) above the central Amazon is strongly controlled by the interaction between nocturnal radiative cooling, atmospheric stability, cloud cover, and mechanically generated turbulence. Although previous Amazonian studies have primarily focused on the daytime evolution of the atmospheric boundary layer (Fisch et al., 2004; Carneiro and Fisch, 2020; Dias-Júnior et al., 2022), our results show that the nocturnal boundary layer also exhibits pronounced seasonal and interannual variability, with important implications for turbulence exchange and trace-gas transport above tropical forests.
One of the clearest patterns observed in this study is the systematic reduction of hn during the Dry season and during the El Niño year (2023). These periods were characterized by stronger nocturnal net radiative loss (Fig. 2a) and enhanced atmospheric stability, reflected by larger values (Fig. 2b) and a stronger thermal gradient (Fig. S6b, d). Under these conditions, turbulent exchange becomes increasingly suppressed, limiting the upward transport of sensible heat and favoring the formation of shallower nocturnal layers (Figs. 4d and 5b). In contrast, wetter conditions, particularly during the Wet season of 2022, were associated with weaker radiative cooling (Fig. 2a), reduced stability (Fig. 2b), weak thermal gradient (Fig. S6a, c), and deeper nocturnal layers (Figs. 4a and 5a). These findings reinforce the strong coupling between cloud cover, nocturnal cooling, and turbulence generation over the Amazon rainforest.
The hourly evolution of hn also reveals the importance of the temporal evolution of thermal stratification during the night. In all analyzed periods, hn was generally larger at the beginning of the night and progressively decreased toward the early morning hours (Fig. 5). This behavior is particularly evident during the Wet season of 2022, when the thermal gradient remained relatively weak during the first hours of the night (Figs. 9e, f and S6a), allowing mechanically generated turbulence to sustain a deeper nocturnal boundary layer. As the night progressed, radiative cooling intensified the thermal gradients, suppressing turbulence and leading to a gradual collapse of hn.
The results also demonstrate that the interaction between thermal stratification and mechanically generated turbulence is fundamental for understanding the nocturnal boundary-layer structure above the Amazon forest (Fig. 9). The case studies revealed that low-level jets (LLJs) (Fig. 7) and enhanced vertical wind shear (Fig. 9g, h) may sustain turbulence above the canopy, but the influence of this turbulence on the lower nocturnal boundary layer depends on the degree of vertical coupling between atmospheric layers. This interpretation is consistent with the conceptual framework proposed by Mahrt and Acevedo (2023), in which nocturnal boundary layers may deviate from a vertically monotonic structure and instead exhibit layered configurations composed of shallow surface-based layers, transition layers, and elevated turbulent regions.
Our observations suggest that the forest canopy plays a key role in reinforcing this layered structure. Under strongly stable conditions, the canopy acts as a roughness and drag layer that attenuates momentum transfer toward the surface. Consequently, turbulence generated aloft by LLJs or strong wind shear may remain confined to elevated layers and may not efficiently penetrate downward through the canopy layer. This mechanism likely explains the shallow hn observed on 18 August 2022, when strong thermal stratification and weak vertical coupling produced a highly decoupled nocturnal structure. In contrast, on 25 August 2022, weaker thermal stratification allowed mechanically generated turbulence to penetrate deeper into the lower nocturnal boundary layer, resulting in larger and more vertically connected hn values.
Another important contribution of this study is the demonstration that variations in hn are strongly reflected in the vertical distribution of trace gases such as CO and CH4 (Fig. 10). During nights characterized by shallow nocturnal layers, elevated concentrations observed at upper levels did not penetrate toward the canopy, suggesting that the nocturnal boundary layer acted as a barrier separating air masses above and below the canopy layer. Conversely, deeper nocturnal layers were associated with more vertically homogeneous concentration profiles, indicating enhanced turbulent mixing throughout the tower profile.
The interpretation of these concentration patterns must also consider the background atmospheric composition during previous days. As discussed by Botía et al. (2020), the ATTO site frequently experiences nighttime CH4 accumulation associated with strong thermal stratification, suppressed turbulence, and horizontal transport from likely wetland source regions. In addition, CO concentrations are strongly influenced by regional biomass-burning plumes (Andreae et al., 2015; van Asperen et al., 2024). For example, the elevated CO and CH4 concentrations observed on 25 August 2022 likely reflected the residual influence of previous plume events (Fig. S5) combined with slower ventilation near the canopy. Therefore, rather than associating multi-day concentration variability directly with hn, our interpretation focuses on the short-term vertical concentration gradients and their relationship with nocturnal turbulent structure.
The additional case studies presented in the Supplement further reinforce this interpretation (Fig. S7). Strongly stable nights with shallow hn (Fig. S8a) exhibited clear vertical separation between upper and lower layers (Fig. S7a, c), while less stable nights with deeper hn (Fig. S8b) showed much more homogeneous concentration patterns throughout the tower profile (Fig. S7b, d). The supplementary cases also show the importance of the initial/background concentrations from the previous days in shaping the nocturnal CO and CH4 profiles (Fig. S9). As in the 18 and 25 August cases, the vertical gradients were influenced not only by the evolution of hn, but also by the concentration structure already present before the night. These consistent relationships between hn and the observed concentration gradients provide independent observational support for the turbulence-based estimates of nocturnal boundary-layer height presented here.
Compared to previous Amazonian studies, the turbulence-based methodology adopted in this work provides an important advantage because it estimates hn directly from the vertical decay of turbulent sensible heat fluxes. Most previous studies relied on indirect methods based on thermodynamic profiles, Richardson number, or remote sensing approaches (Santos et al., 2007; Dias-Júnior et al., 2022; Carneiro et al., 2025). More recently, Mendonça et al. (2025) used the same turbulence-based methodology and reported hn values ranging between approximately 81 and 223 m, demonstrating the importance of surface roughness and topography for nocturnal boundary-layer structure. However, their study did not focus on the hourly evolution of hn or on its relationship with trace-gas concentration profiles. In addition, Huitema et al. (2026), using CloudRoots-Amazon22 observations (Vilà-Guerau de Arellano et al., 2024), showed that multiple criteria based on potential temperature, CO2, wind speed, Richardson number, and turbulent kinetic energy reproduce similar nocturnal boundary-layer dynamics, with estimated values between 114 and 241 m. The agreement between these independent approaches and the results presented here supports the robustness of the observed dynamic evolution of hn at the ATTO site.
Finally, the results highlight the importance of continuous high-frequency vertical observations for understanding nocturnal processes above tropical forests. Stable nocturnal boundary layers strongly influence the transport of heat, moisture, aerosols, and greenhouse gases, and therefore directly affect weather prediction, atmospheric chemistry, and carbon-cycle studies over the Amazon Basin. Improving the representation of nocturnal turbulence and vertical coupling in atmospheric models is likely essential for reducing uncertainties in simulations of biosphere–atmosphere interactions in tropical forest regions.
This study investigated the seasonal, interannual, and hourly variability of the Nocturnal Boundary Layer height (hn) above the central Amazon using vertical profiles of turbulent sensible heat flux measured at the ATTO site during a La Niña year (2022) and an El Niño year (2023). The objective was to estimate hn from turbulence profiles and to examine whether its variability is reflected in the vertical distribution of CO and CH4 above the forest. The results show substantial variability in hn between seasons, years, and hours of the night. The deepest nocturnal layers occurred during the Wet season of 2022, with mean values of approximately 270±40 m, whereas the shallowest layers occurred during the Dry season of 2023, with mean values of approximately 100±27 m. A systematic decrease in hn was observed during the night: in 2022, hn decreased from about 274 to 151 m in the Wet season and from about 223 to 100 m in the Dry season, while in 2023 it generally ranged between about 172 and 100 m.
The variability of hn reflects the combined influence of nocturnal radiative cooling, atmospheric stability, cloud cover, thermal stratification, and mechanically generated turbulence. Stronger radiative cooling and enhanced stability, especially during the Dry season and the El Ni no year, favoured shallower and more decoupled nocturnal layers. In contrast, weaker stability and reduced thermal stratification allowed wind shear and low-level jets to maintain deeper and more vertically connected layers.
During nights with shallow hn, enhanced CO and CH4 concentrations above the nocturnal boundary layer did not penetrate efficiently toward the canopy, producing strong vertical gradients along the tower profile. During nights with deeper hn, the CO and CH4 profiles were more vertically homogeneous, consistent with stronger coupling between the canopy layer and the air above. Thus, trace-gas profiles provide observational support for the turbulence-based hn estimates.
By resolving the hourly evolution of hn, this study shows temporal variability in the NBL above the central Amazon that had not yet been resolved at this resolution. Using direct turbulence based estimates, we quantified clear seasonal and interannual differences in hn. We also show that this variability affects the vertical dispersion of trace gases: shallow nocturnal layers limit vertical exchange and produce strong CO and CH4 concentration gradients, whereas deeper layers favor stronger coupling and more vertically homogeneous profiles. The mean hn values obtained here are consistent with those reported by Mendonça et al. (2025) and Huitema et al. (2026), supporting the robustness of our results. Thus, while previous studies provide important reference values for hn, our study adds a new temporal and atmospheric-composition perspective by linking hourly hn variability to trace-gas dispersion above the Amazon forest.
Some limitations should be considered. The main analysis was restricted to 2022–2023, when the complete turbulence profile up to 325 m was available at ATTO. Therefore, the contrast between 2022 and 2023 provides valuable insight into nocturnal boundary-layer variability under different climatic conditions, but should not be interpreted as a full climatological assessment of La Niña and El Niño effects on hn. Finally, the interpretation of CO and CH4 profiles was based on selected case studies and can also be influenced by background air masses, biomass-burning plumes, wetland emissions, and concentration structures established during previous days.
Overall, these findings highlight the importance of the nocturnal boundary layer for the state and behaviour of the lower atmosphere over tropical forests. Because hn controls the depth over which heat, moisture, aerosols, and greenhouse gases are mixed or stored during the night, errors in its representation can affect simulations of atmospheric composition, surface–atmosphere exchange, and carbon-cycle processes over the Amazon Basin. Improving the representation of nocturnal turbulence, canopy–atmosphere coupling, and shallow stable layers in atmospheric and Earth-system models is therefore essential for reducing uncertainties in weather, climate, and biosphere–atmosphere interaction studies in tropical forest regions.
The software code used in this study is publicly available in the Zenodo repository at https://doi.org/10.5281/zenodo.20798853 (Souza et al., 2026).
The research data supporting this study are part of the Amazon Tall Tower Observatory (ATTO) project and are available through the ATTO data portal at https://www.attodata.org/home/ (last access: 22 June 2026). Access to the data requires user registration and a formal data request through the platform, in accordance with the ATTO data policy.
The supplement related to this article is available online at https://doi.org/10.5194/acp-26-10679-2026-supplement.
Conceptualization: CMAS, ACSM, CQDJ, and HvA. Data curation: CQDJ, LGNM, HvA, RA and FAFD. Formal analysis: CMAS, HvA, and CQDJ. Funding acquisition: CQDJ and BTTP. Methodology: CMAS and ACSM. Project administration: CQDJ, BTTP, and CAQ. Software: CMAS. Supervision: CQDJ and SB. Validation: CMAS and HvA. Writing (original draft preparation): CMAS and CQDJ. Writing (review and editing): CMAS, SB, HvA, GF, FAFD, ACSM, RF, LRO, JRM, and DHH.
At least one of the (co-)authors is a member of the editorial board of Atmospheric Chemistry and Physics. The peer-review process was guided by an independent editor, and the authors also have no other competing interests to declare.
Publisher's note: Copernicus Publications remains neutral with regard to jurisdictional claims made in the text, published maps, institutional affiliations, or any other geographical representation in this paper. The authors bear the ultimate responsibility for providing appropriate place names. Views expressed in the text are those of the authors and do not necessarily reflect the views of the publisher.
This study was conducted within the Amazon Tall Tower Observatory (ATTO) project. Institutional support was provided by the Max Planck Society, the Amazonas State Research Foundation (FAPEAM), the São Paulo State Research Foundation (FAPESP), the State University of Amazonas (UEA), the National Institute for Amazonian Research (INPA), the LBA Program, and the Secretariat of Sustainable Development (CEUC/RDS Uatumã). We sincerely thank all partners involved in the long-term operation of the ATTO site for their continuous support. In particular, we acknowledge the essential logistical assistance provided by Roberta de Souza, Wallace Rabelo Costa, Nagib Alberto de Castro Souza, Amauri Rodrigues, Valmir Ferreira, and Antonio Huxley. We further thank the LBA micrometeorology group for their sustained commitment and technical efforts that made this work possible.
This research was conducted within the Amazon Tall Tower Observatory (ATTO) project, supported by the German Federal Ministry of Education and Research (BMBF; contracts 01LB1001A and 01LK1602A), the Brazilian Ministry of Science, Technology and Innovation and FINEP (contract 01.11.01248.00), CAPES (grants 88887.820693/2023-00 and 88881.933987/2024-01; Finance Code 001), and CNPq (grants 440170/2022-8, 406884/2022-6, 307530/2022-1, 406307/2023-7, 407752/2023-4, 444929/2024-0, 445451/2024-6, and 404254/2024-1).
The article processing charges for this open-access publication were covered by the Max Planck Society.
This paper was edited by Michael Tjernström and reviewed by three anonymous referees.
Andreae, M. O., Acevedo, O. C., Araùjo, A., Artaxo, P., Barbosa, C. G. G., Barbosa, H. M. J., Brito, J., Carbone, S., Chi, X., Cintra, B. B. L., da Silva, N. F., Dias, N. L., Dias-Júnior, C. Q., Ditas, F., Ditz, R., Godoi, A. F. L., Godoi, R. H. M., Heimann, M., Hoffmann, T., Kesselmeier, J., Könemann, T., Krüger, M. L., Lavric, J. V., Manzi, A. O., Lopes, A. P., Martins, D. L., Mikhailov, E. F., Moran-Zuloaga, D., Nelson, B. W., Nölscher, A. C., Santos Nogueira, D., Piedade, M. T. F., Pöhlker, C., Pöschl, U., Quesada, C. A., Rizzo, L. V., Ro, C.-U., Ruckteschler, N., Sá, L. D. A., de Oliveira Sá, M., Sales, C. B., dos Santos, R. M. N., Saturno, J., Schöngart, J., Sörgel, M., de Souza, C. M., de Souza, R. A. F., Su, H., Targhetta, N., Tóta, J., Trebs, I., Trumbore, S., van Eijck, A., Walter, D., Wang, Z., Weber, B., Williams, J., Winderlich, J., Wittmann, F., Wolff, S., and Yáñez-Serrano, A. M.: The Amazon Tall Tower Observatory (ATTO): overview of pilot measurements on ecosystem ecology, meteorology, trace gases, and aerosols, Atmos. Chem. Phys., 15, 10723–10776, https://doi.org/10.5194/acp-15-10723-2015, 2015. a, b, c, d
Barber, D. G. and Thomas, A.: The influence of cloud cover on the radiation budget, physical properties, and microwave scattering coefficient (σ) of first-year and multiyear sea ice, IEEE T. Geosci. Remote, 36, 38–50, https://doi.org/10.1109/36.655316, 1998. a
Barbosa, C. G. G., Taylor, P. E., Sá, M. O., Teixeira, P. R., Souza, R. A. F., Albrecht, R. I., Barbosa, H. M. J., Sebben, B., Manzi, A. O., Araújo, A. C., Prass, M., Pöhlker, C., Weber, B., Andreae, M. O., and Godoi, R. H. M.: Identification and quantification of giant bioaerosol particles over the Amazon rainforest, NPJ Climate and Atmospheric Science, 5, 73, https://doi.org/10.1038/s41612-022-00294-y, 2022. a
Botía, S., Gerbig, C., Marshall, J., Lavric, J. V., Walter, D., Pöhlker, C., Holanda, B., Fisch, G., de Araújo, A. C., Sá, M. O., Teixeira, P. R., Resende, A. F., Dias-Junior, C. Q., van Asperen, H., Oliveira, P. S., Stefanello, M., and Acevedo, O. C.: Understanding nighttime methane signals at the Amazon Tall Tower Observatory (ATTO), Atmos. Chem. Phys., 20, 6583–6606, https://doi.org/10.5194/acp-20-6583-2020, 2020. a, b
Carneiro, R. G. and Fisch, G.: Observational analysis of the daily cycle of the planetary boundary layer in the central Amazon during a non-El Niño year and El Niño year (GoAmazon project 2014/5), Atmos. Chem. Phys., 20, 5547–5558, https://doi.org/10.5194/acp-20-5547-2020, 2020. a, b, c, d, e
Carneiro, R. G., Ribeiro, M. M., Gatti, L. V., de Souza, C. M. A., Dias-Júnior, C. Q., Tejada, G., Domingues, L. G., Rykowska, Z., dos Santos, C. A., and Fisch, G.: Assessing the effectiveness of convective boundary layer height estimation using flight data and ERA5 profiles in the Amazon biome, Clim. Dynam., 63, 109, https://doi.org/10.1007/s00382-025-07609-8, 2025. a
Cava, D., Dias-Júnior, C. Q., Acevedo, O., Oliveira, P. E. S., Tsokankunku, A., Sörgel, M., Manzi, A. O., de Araújo, A. C., Brondani, D. V., Cely Toro, I. M., and Mortarini, L.: Vertical propagation of submeso and coherent structure in a tall and dense Amazon Forest in different stability conditions PART I: Flow structure within and above the roughness sublayer, Agr. Forest Meteorol., 322, 108983, https://doi.org/10.1016/j.agrformet.2022.108983, 2022. a, b
Chamecki, M., Freire, L. S., Dias, N. L., Chen, B., Dias-Junior, C. Q., Machado, L. A. T., Sörgel, M., Tsokankunku, A., and de Araújo, A. C.: Effects of vegetation and topography on the boundary layer structure above the Amazon forest, J. Atmos. Sci., 77, 2941–2957, https://doi.org/10.1175/JAS-D-20-0063.1, 2020. a
de Oliveira, G., Brunsell, N. A., Moraes, E. C., Bertani, G., dos Santos, T. V., Shimabukuro, Y. E., and Aragão, L. E. O. C.: Use of MODIS sensor images combined with reanalysis products to retrieve net radiation in Amazonia, Sensors, 16, 956, https://doi.org/10.3390/s16070956, 2016. a
Dias, N. L., Cely Toro, I. M., Dias-Júnior, C. Q., Mortarini, L., and Brondani, D.: The relaxed eddy accumulation method over the Amazon forest: the importance of flux strength on individual and aggregated flux estimates, Bound.-Lay. Meteorol., 189, 139–161, https://doi.org/10.1007/s10546-023-00829-7, 2023. a, b
Dias-Júnior, C. Q., Dias, N. L., dos Santos, R. M. N., Sörgel, M., Araújo, A., Tsokankunku, A., Ditas, F., de Santana, R. A., von Randow, C., Sá, M., Manzi, A., Trebs, I., Andreae, M. O., and Acevedo, O. C.: Is there a classical inertial sublayer over the Amazon forest?, Geophys. Res. Lett., 46, 5614–5622, https://doi.org/10.1029/2019GL083237, 2019. a
Dias-Júnior, C. Q., Carneiro, R. G., Fisch, G., D'Oliveira, F. A. F., Sörgel, M., Botía, S., Machado, L. A. T., Wolff, S., dos Santos, R. M. N., and Pöhlker, C.: Intercomparison of planetary boundary layer heights using remote sensing retrievals and ERA5 reanalysis over Central Amazonia, Remote Sens., 14, 4561, https://doi.org/10.3390/rs14184561, 2022. a, b, c, d, e, f, g
Dias-Júnior, C. Q., Marques Filho, E. P., Araújo, A., Mendonça, A. C. S., Hall, D. H., de Santana, R. A. S., D'Oliveira, F. A. F., Fisch, G., Acevedo, O., Dias, N. L., Oliveira, P. E., Souza, C. M. A., Figueiredo, R., de Souza Farias, C.., Ramos de Oliveira, L., Ramos da Mata, J., de Lima Xavier, T., Teixeira, P. R., Tanaka Portela, B. T., Alves, E. G., Botía, S., van Asperen, H., Komiya, S., Andreae, M. O., Sörgel, M., Trumbore, S., Manzi, A., and Quesada, C. A.: Characterizing long-term meteorological and flux variability of an old-growth tropical forest in the Central Amazon: a decade of ATTO tower observations, SSRN [preprint], https://doi.org/10.2139/ssrn.6468680, 2026. a, b
Driedonks, A. G. M.: Models and observations of the growth of the atmospheric boundary layer, Bound.-Lay. Meteorol., 23, 283–306, https://doi.org/10.1007/BF00121117, 1982. a
Fisch, G., Tota, J., Machado, L. A. T., Silva Dias, M. A. F., da F. Lyra, R. F., Nobre, C. A., Dolman, A. J., and Gash, J. H. C.: The convective boundary layer over pasture and forest in Amazonia, Theor. Appl. Climatol., 78, 47–59, https://doi.org/10.1007/s00704-004-0043-x, 2004. a, b, c
Foken, T. and Mauder, M.: Micrometeorology, vol. 2, Springer, https://doi.org/10.1007/978-3-540-74666-9, 2008. a
Franco, M. A., Valiati, R., Holanda, B. A., Meller, B. B., Kremper, L. A., Rizzo, L. V., Carbone, S., Morais, F. G., Nascimento, J. P., Andreae, M. O., Cecchini, M. A., Machado, L. A. T., Ponczek, M., Pöschl, U., Walter, D., Pöhlker, C., and Artaxo, P.: Vertically resolved aerosol variability at the Amazon Tall Tower Observatory under wet-season conditions, Atmos. Chem. Phys., 24, 8751–8770, https://doi.org/10.5194/acp-24-8751-2024, 2024. a
Gao, W., Shaw, R. H., and Paw U, K. T.: Observation of organized structure in turbulent flow within and above a forest canopy, Bound.-Lay. Meteorol., 47, 349–377, https://doi.org/10.1007/BF00122339, 1989. a
Garratt, J. R.: Surface influence upon vertical profiles in the atmospheric near-surface layer, Q. J. Roy. Meteor. Soc., 106, 803–819, https://doi.org/10.1002/qj.49710645011, 1980. a
Gomes Alves, E., Aquino Santana, R., Quaresma Dias-Júnior, C., Botía, S., Taylor, T., Yáñez-Serrano, A. M., Kesselmeier, J., Bourtsoukidis, E., Williams, J., Lembo Silveira de Assis, P. I., Martins, G., de Souza, R., Duvoisin Júnior, S., Guenther, A., Gu, D., Tsokankunku, A., Sörgel, M., Nelson, B., Pinto, D., Komiya, S., Martins Rosa, D., Weber, B., Barbosa, C., Robin, M., Feeley, K. J., Duque, A., Londoño Lemos, V., Contreras, M. P., Idarraga, A., López, N., Husby, C., Jestrow, B., and Cely Toro, I. M.: Intra- and interannual changes in isoprene emission from central Amazonia, Atmos. Chem. Phys., 23, 8149–8168, https://doi.org/10.5194/acp-23-8149-2023, 2023. a
Guo, J., Miao, Y., Zhang, Y., Liu, H., Li, Z., Zhang, W., He, J., Lou, M., Yan, Y., Bian, L., and Zhai, P.: The climatology of planetary boundary layer height in China derived from radiosonde and reanalysis data, Atmos. Chem. Phys., 16, 13309–13319, https://doi.org/10.5194/acp-16-13309-2016, 2016. a
Huitema, A. C., de Feiter, V. S., González-Armas, R., Hartogensis, O. K., van Asperen, H., Quaresma Dias-Júnior, C., and Vilà-Guerau de Arellano, J.: CO2 and Heat exchange across the Nocturnal Canopy–Atmosphere interface in the Amazon rainforest, EGUsphere [preprint], https://doi.org/10.5194/egusphere-2026-684, 2026. a, b
Jimenez, J. C., Libonati, R., and Peres, L. F.: Droughts over Amazonia in 2005, 2010, and 2015: A cloud cover perspective, Frontiers in Earth Science, 6, 227, https://doi.org/10.3389/feart.2018.00227, 2018. a, b
Kaimal, J. C. and Finnigan, J. J.: Atmospheric boundary layer flows: their structure and measurement, Oxford University Press, ISBN 9780195062397, 1994. a
Keirsbulck, L., Labraga, L., Mazouz, A., and Tournier, C.: Surface roughness effects on turbulent boundary layer structures, J. Fluid. Eng., 124, 127–135, https://doi.org/10.1115/1.1445141, 2002. a
Krishnamurthy, R., Newsom, R. K., Berg, L. K., Xiao, H., Ma, P.-L., and Turner, D. D.: On the estimation of boundary layer heights: a machine learning approach, Atmos. Meas. Tech., 14, 4403–4424, https://doi.org/10.5194/amt-14-4403-2021, 2021. a
Kulmala, M., Kokkonen, T., Ezhova, E., Baklanov, A., Mahura, A., Mammarella, I., Bäck, J., Lappalainen, H. K., Tyuryakov, S., Kerminen, V.-M., Zilitinkevich, S., and Petäjä, T.: Aerosols, clusters, greenhouse gases, trace gases and boundary-layer dynamics: on feedbacks and interactions, Bound.-Lay. Meteorol., 186, 475–503, https://doi.org/10.1007/s10546-022-00769-8, 2023. a
Lenschow, D. H., Li, X. S., Zhu, C. J., and Stankov, B. B.: The stably stratified boundary layer over the Great Plains: I. Mean and turbulence structure, Bound.-Lay. Meteorol., 42, 95–121, https://doi.org/10.1007/BF00119877, 1988. a
Mahrt, L. and Acevedo, O.: Types of vertical structure of the nocturnal boundary layer, Bound.-Lay. Meteorol., 187, 141–161, https://doi.org/10.1007/s10546-022-00716-7, 2023. a, b
Marengo, J. A., Liebmann, B., Kousky, V. E., Filizola, N. P., and Wainer, I. C.: Onset and end of the rainy season in the Brazilian Amazon Basin, J. Climate, 14, 833–852, https://doi.org/10.1175/1520-0442(2001)014<0833:OAEOTR>2.0.CO;2, 2001. a
Marengo, J. A., Souza Jr., C. M., Thonicke, K., Burton, C., Halladay, K., Betts, R. A., Alves, L. M., and Soares, W. R.: Changes in climate and land use over the Amazon region: current and future variability and trends, Frontiers in Earth Science, 6, 228, https://doi.org/10.3389/feart.2018.00228, 2018. a
Mendonça, A. C. S., Dias-Junior, C. Q., Acevedo, O. C., Marra, D. M., Cely-Toro, I. M., Fisch, G., Brondani, D. V., Manzi, A. O., Portela, B. T. T., Quesada, C. A., and Mortarini, L.: Estimation of the nocturnal boundary layer height over the Central Amazon forest using turbulence measurements, Agr. Forest Meteorol., 367, 110469, https://doi.org/10.1016/j.agrformet.2025.110469, 2025. a, b, c, d, e, f, g, h, i
Mendonça, A. C. S., Dias-Junior, C. Q., de Oliveira, M. I., Maroneze, R., Martins, L. G. N., Marra, D. M., D'Oliveira, F. A. F., Costa, F. D., Fisch, G., and Hall, D. H.: Is Low-Level Jet height a good approximation for the top of the nocturnal boundary-layer?, Agr. Forest Meteorol., 380, 111065, https://doi.org/10.1016/j.agrformet.2026.111065, 2026. a
Miao, Y., Hu, X.-M., Liu, S., Qian, T., Xue, M., Zheng, Y., and Wang, S.: Seasonal variation of local atmospheric circulations and boundary layer structure in the Beijing-Tianjin-Hebei region and implications for air quality, J. Adv. Model. Earth Sy., 7, 1602–1626, https://doi.org/10.1002/2015MS000522, 2015. a
Molero, F., Barragán, R., and Artíñano, B.: Estimation of the atmospheric boundary layer height by means of machine learning techniques using ground-level meteorological data, Atmos. Res., 279, 106401, https://doi.org/10.1016/j.atmosres.2022.106401, 2022. a
Oliveira, P. E. S., Acevedo, O. C., Sörgel, M., Tsokankunku, A., Wolff, S., Araújo, A. C., Souza, R. A. F., Sá, M. O., Manzi, A. O., and Andreae, M. O.: Nighttime wind and scalar variability within and above an Amazonian canopy, Atmos. Chem. Phys., 18, 3083–3099, https://doi.org/10.5194/acp-18-3083-2018, 2018. a
Restrepo-Coupe, N., O'Donnell Christoffersen, B., Longo, M., Alves, L. F., Campos, K. S., da Araujo, A. C., de Oliveira Jr., R. C., Prohaska, N., da Silva, R., Tapajos, R., Wiedemann, K. T., Wofsy, S. C., and Saleska, S. R.: Asymmetric response of Amazon forest water and energy fluxes to wet and dry hydrological extremes reveals onset of a local drought-induced tipping point, Glob. Change Biol., 29, 6077–6092, https://doi.org/10.1111/gcb.16933, 2023. a
Santana, R. A., Dias-Júnior, C. Q., da Silva, J. T., Fuentes, J. D., do Vale, R. S., Alves, E. G., dos Santos, R. M. N., and Manzi, A. O.: Air turbulence characteristics at multiple sites in and above the Amazon rainforest canopy, Agr. Forest Meteorol., 260, 41–54, https://doi.org/10.1016/j.agrformet.2018.05.027, 2018. a
Santos, R. M. N., Fisch, G., and Dolman, A. J.: Modelagem da camada limite noturna (CLN) durante a época úmida na Amazônia, sob diferentes condições de desenvolvimento, Revista Brasileira de Meteorologia, 22, 387–407, https://doi.org/10.1590/S0102-77862007000300011, 2007. a, b
Shaw, R. H. and Schumann, U.: Large-eddy simulation of turbulent flow above and within a forest, Bound.-Lay. Meteorol., 61, 47–64, https://doi.org/10.1007/BF02033994, 1992. a
Souza, C. M. A., Dias-Júnior, C. Q., D'Oliveira, F. A. F., Martins, H. S., Carneiro, R. G., Portela, B. T. T., and Fisch, G.: Long-term measurements of the atmospheric boundary layer height in central Amazonia using remote sensing instruments, Remote Sens., 15, 3261, https://doi.org/10.3390/rs15133261, 2023. a, b, c, d
Souza, C. M. A., Dias-Júnior, C. Q., Mendonça, A. C. S. de, and Santana, R. A. S. de.: Python scripts for analyzing nocturnal boundary-layer dynamics and atmospheric drivers at the Amazon Tall Tower Observatory, Zenodo [code], https://doi.org/10.5281/zenodo.20798853, 2026. a
Starkenburg, D., Metzger, S., Fochesatto, G. J., Alfieri, J. G., Gens, R., Prakash, A., and Cristóbal, J.: Assessment of despiking methods for turbulence data in micrometeorology, J. Atmos. Ocean. Tech., 33, 2001–2013, https://doi.org/10.1175/JTECH-D-15-0154.1, 2016. a
Su, T., Li, Z., and Kahn, R.: Relationships between the planetary boundary layer height and surface pollutants derived from lidar observations over China: regional pattern and influencing factors, Atmos. Chem. Phys., 18, 15921–15935, https://doi.org/10.5194/acp-18-15921-2018, 2018. a
Sun, J., Burns, S. P., Lenschow, D. H., Banta, R., Newsom, R., Coulter, R., Frasier, S., Ince, T., Nappo, C., Cuxart, J., Blumen, W., Lee, X., and Hu, X.-Z.: Intermittent turbulence associated with a density current passage in the stable boundary layer, Bound.-Lay. Meteorol., 105, 199–219, https://doi.org/10.1023/A:1019969131774, 2002. a
van Asperen, H., Komiya, S., Jones, S., Botia, S., Lavric, J., Warneke, T., Griffith, D., and Trumbore, S.: Unique Tall Tower Greenhouse Gas Measurements in the Amazon Rainforest: observed patterns and daily cycles, EGU General Assembly 2023, Vienna, Austria, 24–28 Apr 2023, EGU23-10522, https://doi.org/10.5194/egusphere-egu23-10522, 2023. a
van Asperen, H., Warneke, T., Carioca de Araújo, A., Forsberg, B., José Filgueiras Ferreira, S., Röckmann, T., van der Veen, C., Bulthuis, S., Ramos de Oliveira, L., de Lima Xavier, T., da Mata, J., de Oliveira Sá, M., Ricardo Teixeira, P., Andrews de França e Silva, J., Trumbore, S., and Notholt, J.: The emission of CO from tropical rainforest soils, Biogeosciences, 21, 3183–3199, https://doi.org/10.5194/bg-21-3183-2024, 2024. a, b, c
Vilà-Guerau de Arellano, J., Hartogensis, O. K., de Boer, H., Moonen, R., González-Armas, R., Janssens, M., Adnew, G. A., Bonell-Fontás, D. J., Botía, S., Jones, S. P., van Asperen, H., Komiya, S., de Feiter, V. S., Rikkers, D., de Haas, S., Machado, L. A. T., Dias-Junior, C. Q., Giovanelli-Haytzmann, G., Valenti, W. I. D., Figueiredo, R. C., Farias, C. S., Hall, D. H., Mendonça, A. C. S., da Silva, F. A. G., Marton da Silva, J. I., Souza, R., Martins, G., Miller, J. N., Mol, W. B., Heusinkveld, B., van Heerwaarden, C. C., D'Oliveira, F. A. F., Rodrigues Ferreira, R., Acosta Gotuzzo, R., Pugliese, G., Williams, J., Ringsdorf, A., Edtbauer, A., Quesada, C. A., Takeshi Tanaka Portela, B., Gomes Alves, E., Pöhlker, C., Trumbore, S., Lelieveld, J., and Röckmann, T.: CloudRoots-Amazon22: Integrating clouds with photosynthesis by crossing scales, B. Am. Meteorol. Soc., 105, E1275–E1302, https://doi.org/10.1175/BAMS-D-23-0333.1, 2024. a
von Randow, C., Manzi, A. O., Kruijt, B., de Oliveira, P. J., Zanchi, F. B., Silva, R. L., Hodnett, M. G., Gash, J. H. C., Elbers, J. A., Waterloo, M. J., Cardoso, F. L., and Kabat, P.: Comparative measurements and seasonal variations in energy and carbon exchange over forest and pasture in South West Amazonia, Theor. Appl. Climatol., 78, 5–26, https://doi.org/10.1007/s00704-004-0041-z, 2004. a
Wang, L., Liu, J., Gao, Z., Li, Y., Huang, M., Fan, S., Zhang, X., Yang, Y., Miao, S., Zou, H., Sun, Y., Chen, Y., and Yang, T.: Vertical observations of the atmospheric boundary layer structure over Beijing urban area during air pollution episodes, Atmos. Chem. Phys., 19, 6949–6967, https://doi.org/10.5194/acp-19-6949-2019, 2019. a
Webb, E. K., Pearman, G. I., and Leuning, R.: Correction of flux measurements for density effects due to heat and water vapour transfer, Q. J. Roy. Meteor. Soc., 106, 85–100, https://doi.org/10.1002/qj.49710644707, 1980. a
Wilczak, J. M., Oncley, S. P., and Stage, S. A.: Sonic anemometer tilt correction algorithms, Bound.-Lay. Meteorol., 99, 127–150, https://doi.org/10.1023/A:1018966204465, 2001. a
Yuval, Levi, Y., Dayan, U., Levy, I., and Broday, D. M.: On the association between characteristics of the atmospheric boundary layer and air pollution concentrations, Atmos. Res., 231, 104675, https://doi.org/10.1016/j.atmosres.2019.104675, 2020. a
Zahn, E., Chor, T. L., and Dias, N. L.: A simple methodology for quality control of micrometeorological datasets, American Journal of Environmental Engineering, 6, 135–142, 2016. a