
the Creative Commons Attribution 4.0 License.
the Creative Commons Attribution 4.0 License.
 | 29 Jul 2026
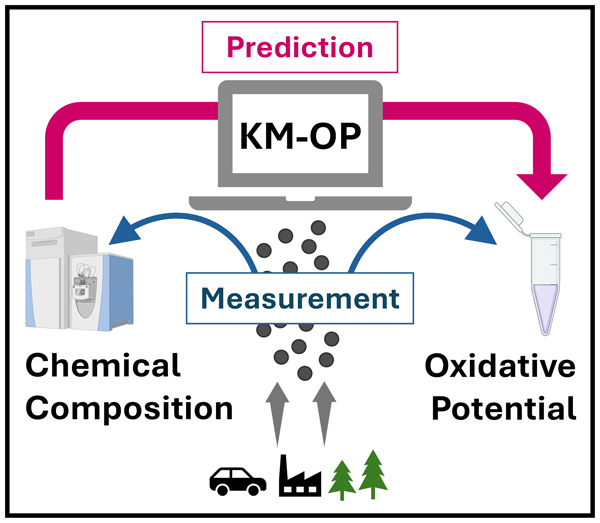
Aerosol oxidative potential and reactive species predicted with a chemical kinetics model (KM-OP)
Steven Lelieveld
Matteo Krüger
Steven J. Campbell
Deepchandra Srivastava
Grazia Maria Lanzafame
Sophie Tomaz
Olivier Favez
Nicolas Bonnaire
Franco Lucarelli
Laurent Y. Alleman
Gaëlle Uzu
Jean-Luc Jaffrezo
Gang I. Chen
David C. Green
Max Priestman
Anja H. Tremper
Alexandre Barth
Markus Kalberer
Benjamin A. Musa Bandowe
Gerhard Lammel
Ulrich Pöschl
Pourya Shahpoury
Alexandre Albinet
Exposure to ambient air pollution is a major risk factor for human health yet, the physiological effects of particulate matter (PM) remain poorly understood. Oxidative stress due to excess formation of reactive oxygen species (ROS) is a leading hypothesis for the molecular mechanism behind the adverse health effects of PM. Thus, measurements of ROS production and antioxidant depletion are widely used to assess the oxidative potential (OP) of PM.
Here we introduce a chemical kinetic model of oxidative potential (KM-OP) to elucidate and quantify the effects of PM on the production of ROS and the consumption of ascorbic acid (AA) and dithiothreitol (DTT). The chemical mechanism of the model is based on literature rate coefficients and a large compilation of laboratory data on the effects of transition metal ions, quinones, and organic aerosol (OA). We apply the model to field measurement data of PM composition and OP from three European cities (Grenoble, Paris, London), obtaining good correlations (R2>0.75) and low model bias (<15 %) for 4 out of 6 data sets.
Previous studies found that PM may inflict damage to biomolecules in the lungs mainly via the production of hydroxyl (•OH) radicals. The antioxidant-based OP assays investigated in this study show a good correlation with modeled •OH production. We identify OA as the strongest contributor to antioxidant-based OP assays, with minor contributions from Cu and Fe ions. Cu dominates the production of hydrogen peroxide (H2O2), but does not substantially affect •OH production. Our model and results provide a basis for further investigation and comparison of different metrics of the potential toxicity of PM.
- Article
(4691 KB) - Full-text XML
-
Supplement
(3980 KB) - BibTeX
- EndNote


Epidemiological studies have shown that inhalation of particulate matter (PM) leads to increased morbidity and mortality (Dockery et al., 1993; Cohen et al., 2017; Brauer et al., 2024), however, the molecular level understanding behind PM-related health effects remains poor (Wang et al., 2025). The ability of the inhaled PM to induce oxidative stress is the leading hypothesis to explain adverse health outcomes of PM (Donaldson et al., 2001; Kelly, 2003; Hayes et al., 2020; Miller, 2020). The oxidative potential (OP) of PM refers to its ability to oxidize specific target molecules over a period of time (Bates et al., 2019; Gao et al., 2020b). OP has received increasing attention as a more comprehensive health-relevant measure of ambient PM toxicity than PM mass concentration (Borm et al., 2007; Ayres et al., 2008; Bates et al., 2015; Abrams et al., 2017; Weichenthal et al., 2016; Gao et al., 2020b). Consequently, OP assay measurements are an increasingly popular means to assess PM toxicity (Cheung et al., 2009; Lin and Yu, 2019; Daellenbach et al., 2020; Hwang et al., 2021).
Many acellular assays, both offline and online, have been developed to evaluate OP (Cho et al., 2005; Ayres et al., 2008; Page et al., 2010; Fang et al., 2015; Laulagnet et al., 2015; Calas et al., 2018; Bates et al., 2019; Campbell et al., 2019; Lin and Yu, 2019; Gao et al., 2020b; Utinger et al., 2023; Carlino et al., 2023). OP assays can be categorized into those that quantify the production of oxidants and those that evaluate the depletion of antioxidants. Common acellular OP assays include electron paramagnetic resonance (OPEPR, Tong et al., 2016), the hydroxyl radical assay (OPOH, Charrier and Anastasio, 2015; Son et al., 2015; Gonzalez et al., 2017, 2021; Shen et al., 2022), the hydrogen peroxide method (, Charrier et al., 2014), a total peroxide assay (OPDCFH, Fuller et al., 2014; Wragg et al., 2016), the dithiothreitol assay (OPDTT, Cho et al., 2005; Charrier and Anastasio, 2012), the ascorbic acid assay, which includes depletion of ascorbic acid (OPAA, Pietrogrande et al., 2019) as well as increase of its oxidation product, dehydroascorbic acid (OPDHA, Shen et al., 2021; Campbell et al., 2023; Utinger et al., 2023), and the glutathione assay (OPGSH, Zielinski et al., 1999; Shahpoury et al., 2019). OPOH and measure the generation of hydroxyl radicals and hydrogen peroxide respectively, while OPEPR measures the total production of free radicals detectable with EPR spectroscopy. OPDTT, OPAA, and OPGSH measure the depletion rate of lung antioxidants (AA, GSH) or surrogates for these (DTT), while OPDHA measures the increase of an antioxidant product. Although OP assays are widely used, the exact methodologies often differ between studies (Calas et al., 2017; Frezzini et al., 2022; Shahpoury et al., 2022; Dominutti et al., 2025; Campbell et al., 2025).
Considerable efforts have been made to determine the specific particle properties, such as chemical composition and size, that most influence OP values (Charrier and Anastasio, 2012; Verma et al., 2014; Xiong et al., 2017; Calas et al., 2017; Fang et al., 2017; Yu et al., 2018; Lin and Yu, 2019; Pietrogrande et al., 2019; Fang et al., 2019; Gao et al., 2020b; Daellenbach et al., 2020; Puthussery et al., 2020; Farahani et al., 2022; Expósito et al., 2024; Bhattu et al., 2024; Shahpoury et al., 2024a, b, 2026). Studies have shown that the AA assay effectively captures the redox activities of transition-metal ions (TMIs) such as iron and copper (Pietrogrande et al., 2019; Shen et al., 2021; Utinger et al., 2023) and organic compounds (Calas et al., 2018; Campbell et al., 2023). The DTT assay is sensitive to TMIs such as iron, copper, and manganese (Netto and Stadtman, 1996; Kachur et al., 1997; Charrier and Anastasio, 2012; Charrier et al., 2015, 2016; Lin and Yu, 2019; Pietrogrande et al., 2019) as well as organic substances (Calas et al., 2017; Janssen et al., 2014), including quinones (Kumagai et al., 2002), humic-like substances (Lin and Yu, 2011), and secondary organic aerosol (SOA) (McWhinney et al., 2013b; Tuet et al., 2017; Daellenbach et al., 2020; Bhattu et al., 2024). The •OH assay is sensitive to iron and copper due to Fenton chemistry (Charrier et al., 2015; Gonzalez et al., 2018; Wei et al., 2019; Campbell et al., 2024b). Some studies have also indicated an association between •OH assays and organic compounds (Tong et al., 2016; Wei et al., 2021; Campbell et al., 2023). Correlation and positive matrix factorization (PMF) analyses (Paatero and Tapper, 1994) have been employed to investigate the relationship between OP assays and the PM sources, as well as to identify the specific PM components that are driving OP activities (Borlaza et al., 2021; Weber et al., 2021; Ngoc Thuy et al., 2024; Camman et al., 2024; Shahpoury et al., 2024a, b; Liu et al., 2025). However, the chemical reactions mainly responsible for the observed effects of PM on OP assays remain unclear. Furthermore, the chemical mechanisms and rate coefficients are not fully elucidated for all assays, making it challenging to extrapolate the OP of PM to chemical stress on the cellular level, and possible health risks. Thus, a kinetic model that estimates the OP based on the composition of PM would be highly beneficial to improve our mechanistic, process-level understanding of the health effects of air pollution. In this study, we develop and apply a detailed chemical kinetics model of aerosol oxidative potential, KM-OP. The predictive model uses PM composition data to estimate the production of ROS (OPOH and ) and the depletion of antioxidant probes in common OP assays (ascorbic acid, OPAA; dithiothreitol, OPDTT). We apply the model to combined measurement data of PM composition and OP at three sites in Europe.
2.1 Kinetic model of oxidative potential (KM-OP)
A kinetic box model was applied to a compilation of multiple experimental data of ROS production (Charrier et al., 2014; Charrier and Anastasio, 2015; Tong et al., 2018), as well as DTT consumption (Charrier and Anastasio, 2012; Xiong et al., 2017; Expósito et al., 2024; Tuet et al., 2017; Fang et al., 2015) and AA oxidation (Shen et al., 2021; Expósito et al., 2024) in the presence of transition metal ions (TMIs: Fe(II), Fe(III), Cu(II), and Mn(II)), quinones (9,10-phenanthrenequinone (PQN), 1,4-naphthoquinone (1,4-NQN), and 1,2-naphthoquinone (1,2-NQN)) as well as organic components (Org). These species were selected due to their abundance in ambient particulate matter, their ability to form ROS, and their high reactivity in OP assays.
Figure 1 illustrates the chemical reaction mechanism used in this study, which integrates and builds on earlier studies investigating the oxidation of AA and DTT (Netto and Stadtman, 1996; Kachur et al., 1997; Kumagai et al., 2002; Shen et al., 2021). The mechanism includes the production of ROS by TMIs, which then oxidize both AA and DTT. Furthermore, TMIs themselves are also able to oxidize AA and DTT. Figure 1A shows the main reaction pathways for ROS formation and interconversion: reduced TMIs and quinones catalyze a redox cascade from O2 to superoxide () and hydrogen peroxide (H2O2). Reduced TMIs react with H2O2, leading to the formation of hydroxyl radical (•OH) through Fenton and Fenton-like reactions. Figure 1B shows that AA can cycle the oxidized forms of the TMIs (Fe(III), Cu(II), Mn(III)) and quinones (Q) back to their reduced forms (Fe(II), Cu(I), Mn(II), SQ). ROS species also react with AA forming the ascorbyl radical (AA•). AA• forms dehydroascorbic acid (DHA) through disproportionation. DHA can undergo hydrolysis reaction to produce 2,3-diketogulonic acid (DKG). Figure 1C shows the oxidation of DTT in the presence of ROS, TMIs, and quinones. We also incorporated the mechanism proposed by Kachur et al. (1997), in which oxidation of DTT in the presence of Cu involves the formation of a Cu–DTT complex. Figure 1D shows the main pathway for ROS formation from organic aerosol (OA). In this study, we group OA from diverse primary (cooking, traffic, biomass burning etc.) and secondary (from biogenic and anthropogenic precursors) sources into a single species, Org, which can react as aliphatic or aromatic compound (RH) and contains a fraction of redox-active organic hydroperoxides (ROOH). The labile organic peroxides can decompose to form •OH and RO• radicals. These radicals can abstract an H atom from RH and can react with ROOH, yielding an alcohol and either a hydroperoxyl radical () or a radical, respectively. In the presence of Fe(II), the hydroperoxide groups can undergo Fenton-like reactions, leading to the heterolytic cleavage of the O–O bond in two ways: one leads to the formation of the •OH radical, while the other forms the RO• radical. The •OH, RO•, and radicals can react with both AA and DTT. KM-OP is an autogenerated model script based on a user-supplied chemical mechanism and consists of a system of differential equations, which are solved iteratively using the stiff differential equation solver ode23tb in Matlab, which has performed well in the past in complex kinetic models (Müller et al., 2022; Rapp et al., 2025; Mishra et al., 2025).
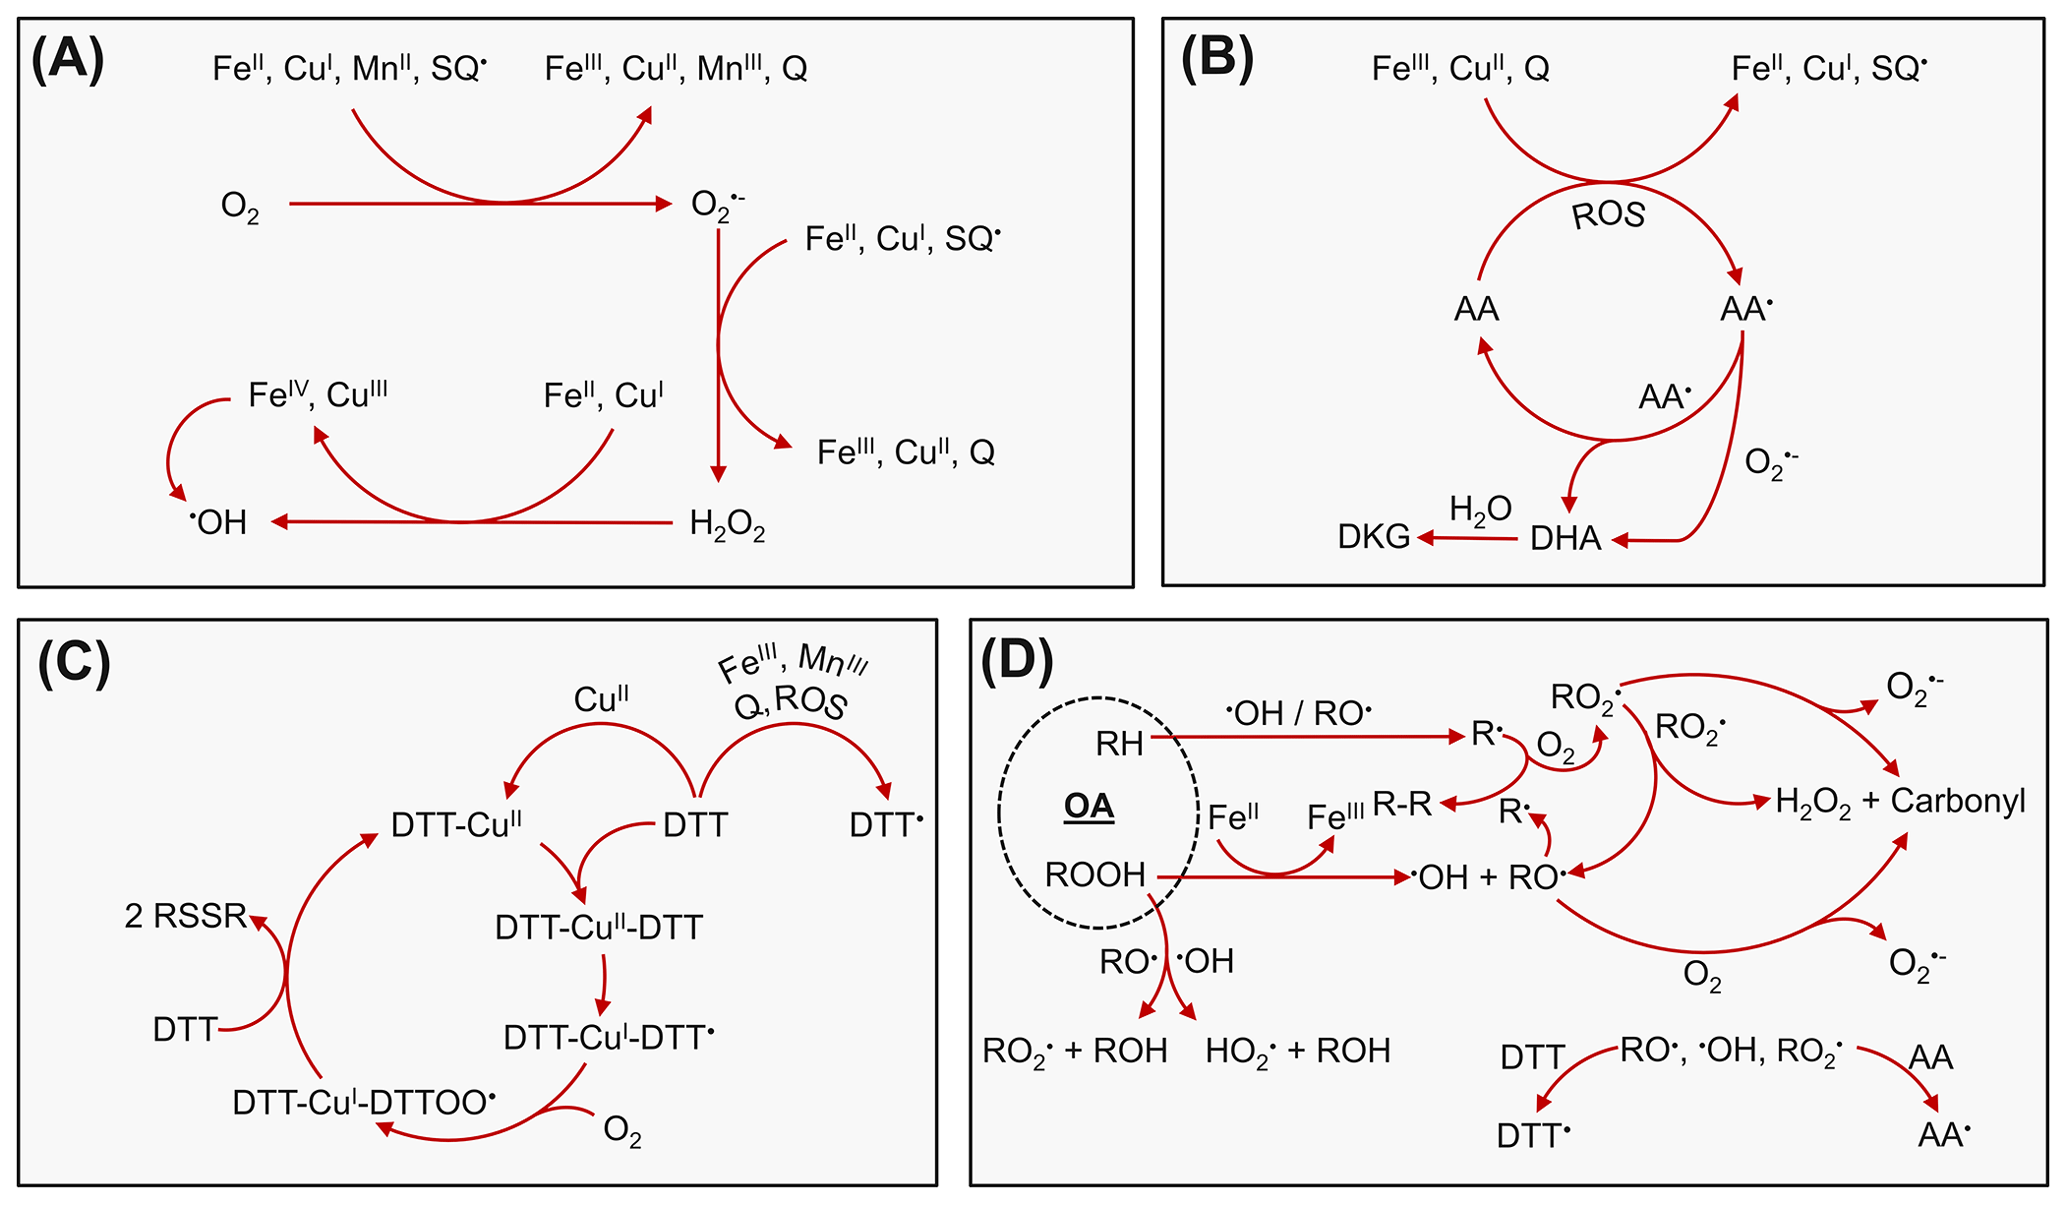
Figure 1Chemical reaction mechanism used in KM-OP. TMIs, quinones, and Org can produce and convert ROS. Panel (A) shows the main reaction pathways for ROS formation and interconversion in the presence of TMIs and quinones. Panels (B) and (C) show the main reaction pathways for ascorbic acid and dithiothreitol oxidation through the reaction with ROS, TMIs, and quinones. Panel (D) shows the main reaction pathways for ROS formation and interconversion in the presence of organic aerosol.
2.2 Comparison with laboratory data
Since some of the kinetic rate coefficients of the chemical reaction mechanism are unknown or uncertain, we inferred them by fitting the kinetic model to experimental observations (inverse modeling). To this end, we set up the kinetic model to mimic the detailed experimental protocols from each experiment. A description of details of each model simulation can be found in Sect. S3.1–S3.7 in the Supplement. In brief, the chemical mechanism was optimized using experimental data from Charrier and Anastasio (2012), Charrier et al. (2014), Charrier and Anastasio (2015), Xiong et al. (2017), Shen et al. (2021), and Expósito et al. (2024).
Inverse modeling was performed using the Monte Carlo Genetic Algorithm (MCGA, Berkemeier et al., 2017). MCGA consists of two steps. The first step is a Monte Carlo search in which model parameters are randomly sampled within predefined boundaries. The globally best-fitting parameter sets are then fed into the starting population of a genetic algorithm, in which they are optimized through processes mimicking survival, recombination, and mutation in evolutionary biology. Ideally, a unique fit would result from global optimization; however, the system investigated in this study is under-determined, since it contains a large number of non-orthogonal parameters (Berkemeier et al., 2021). Therefore, it is more beneficial to identify an ensemble of adequately well-fitting parameter sets and analyze the corresponding kinetic model solutions. The distributions of the optimized rate coefficients across all the parameter sets are shown in Fig. S1 in the Supplement. In this study, we apply MCGA, generate an ensemble of parameter sets, and analyze the corresponding kinetic model solutions collectively.
The chemical mechanism of organic components, Org, was not fitted, but ported from the literature (Walling, 1967; Chevallier et al., 2004; Mouchel-Vallon et al., 2017; Tong et al., 2018; Wei et al., 2022; Campbell et al., 2023). For validation, we compare the model results to DTT activity and radical production rate measured and compiled by Tuet et al. (2017) and Tong et al. (2018), respectively. Table S1 in the Supplement provides a list of all the chemical reactions used in this study and their corresponding rate coefficients.
2.3 Field measurement sites
2.3.1 Grenoble
A detailed description of the sample preparation and measurements can be found in Tomaz et al. (2016, 2017) and Srivastava et al. (2018b). In brief, the sampling site was located at the urban background sampling station of “Les Frênes” in Grenoble (France). PM10 samples were collected every third day for one year from 1 January 2013–1 January 2014 using two parallel high volume samplers (DA-80, Digitel; sampling duration of 24 h at 30 m3 h−1). After collection, samples were wrapped in aluminum foils, sealed in polyethylene bags, and stored at until analysis. PM10 were measured using TEOM-FDMS (TEOM 1405F, Thermo). The organic carbon (OC) concentrations in PM10 were measured using EUSAAR-2 protocol, Sunset analyser. The organic aerosol fraction was obtained by multiplying the OC mass by 1.8 to account for other elements such as hydrogen, oxygen, nitrogen and sulfur present in OA (Tomaz et al., 2017; Font et al., 2024). The metals were measured using ICP-MS after acid digestion. In addition, for this work, the water-soluble fraction of the key metals involved in ROS generation (Cu, Mn and Fe) was determined by ICP-MS/MS analyses on the remaining filter samples. The data used for the model is presented in the Table S3. Quinone concentrations have been obtained by GC-NICI/MS analyses as reported by Tomaz et al. (2016) and the SOA fraction was obtained from the PM source apportionment outputs using positive matrix factorization (PMF, Paatero and Tapper, 1994), as described by Srivastava et al. (2018b).
2.3.2 Paris
A detailed description of the sample preparation and measurements can be found in Srivastava et al. (2018a, 2021). Briefly, the sampling site was located at the ACTRIS SIRTA atmospheric supersite located approximately 25 km southwest from Paris city center. PM10 samples were collected from 6–21 March 2015 using a high-volume sampler (DA-80, Digitel; sampling duration of 4 h at 30 m3 h−1). After collection, samples were wrapped in aluminum foils, sealed in polyethylene bags, and stored at −20°C until analysis. Overall, a total of 92 samples were collected and analyzed for chemical characterization. PM10 concentrations were determined using TEOM-FDMS measurements (1405F model, Thermo). As for Grenoble, additional analyses were performed on the remaining sample filter fractions to determine the water-soluble fraction of Cu, Mn and Fe by ICP-MS/MS. The data used for the model is presented in the Table S4. The organic aerosol fraction was obtained by multiplying the organic carbon mass by 1.8 (Sciare et al., 2011; Font et al., 2024). The SOA fraction was obtained from the PMF outputs and the quinone concentrations from analyses performed by GC-NICI/MS as reported by Srivastava et al. (2018a).
2.3.3 London Summer
A detailed description of the sample preparation and measurements can be found in Campbell et al. (2024a). In brief, the sampling site was located at the Marylebone Road Air Quality Monitoring Station (MY). MY is located adjacent to the A501 (51°31′21′′ N, 0°09′17′′ W), which is a heavily congested six lane East–West road through Central London. PM2.5 mass concentrations were measured using a beta attenuation monitor (BAM 1020, Met One Instruments, USA). The elemental composition analysis in PM2.5 was measured using high time resolution X-ray nondestructive fluorescence (Xact 625i, Cooper Environmental Services, USA) for 19 elements. Organic components of PM2.5 were measured using an aerosol chemical speciation monitor (Q-ACSM, Aerodyne Research Inc, USA). The data used for the model is presented in the Table S5.
2.3.4 London Winter
A detailed description of methods and data associated with the London Winter OP campaign will be presented in an upcoming publication (Campbell et al., 2026). In brief, the measurement campaign took place at the Honor Oak Park Air Quality Monitoring Station (HOP) (UK-AIR ID: UKA00656). HOP is an urban background measurement station located in South-East London within the Kings College Sports Ground (51°26′59′′ N, 0°02′15′′ W). All composition measurements were performed using the same instrumentation described in Sect. 2.3.3. Both of the London datasets use organic components measured using ACSM as input for the model.
2.4 OP measurements
2.4.1 Offline OP measurements
A detailed description of the offline AA and DTT assays can be found in Calas et al. (2018). Briefly, PM samples (10 µg mL−1) were extracted using a Gamble + DPPC (dipalmitoylphosphatidylcholine) solution and vortexed at maximum speed during 2 h at 37 °C. The offline OP procedure was applied for filter samples from Grenoble and Paris.
DTT depletion was monitored using a spectrophotometer for 30 min. 12.5 nmol of DTT (50 µL of 0.25 mM DTT solution in phosphate buffer) was injected to 205 µL of phosphate buffer and 40 µL of PM suspension. For each sample, the quantification of DTT was performed immediately and after 15 and 30 min of exposure to DTT in triplicate. The rate of DTT loss (nmol min−1) was determined from the slope of the linear regression of calculated nmol of consumed DTT vs. time.
AA depletion was monitored using a spectrophotometer. 24 nmol of AA (100 µL of 0.24 mM AA solution in Milli-Q water) was injected to 120 µL of Milli-Q water and 80 µL of PM suspension and absorbance was read at 2 min and then every 4 min for 30 min. The rate of AA loss (nmol min−1) was determined from the slope of the linear regression of calculated nmol of consumed AA vs. time.
2.4.2 Online OP measurements
A detailed description of the online oxidative potential ascorbic acid instrument (OOPAAI) and assay can be found in Campbell et al. (2019) and Utinger et al. (2023). In brief, OP was quantified by measuring the formation of DHA. The online OP procedure was applied for samples from London. The OOPAAI was deployed from 22 May 2023–28 August 2023 at MY and from 10 December 2023–30 January 2024 at HOP. PM2.5 was continuously sampled by the OOPAAI at 16.5 L min−1 after removing all oxidizing gaseous components in the air using a series of honeycomb charcoal denuders. Particles were then directly impinged in a continuous flow through OPDHA assay for OP analysis using a particle-into-liquid sampler (PILS, Brechtel, USA). The PM2.5 sample was washed off the impactor continuously at an AA flow rate of 60 µL min−1, passing through an in-line filter to remove insoluble components. The resulting AA and soluble-aerosol aqueous sample was allowed to react for 20 min at 37 °C. As soluble fractions of the metals were not measured at HOP and MY, we use median values of the soluble metal fraction as determined from field measurement studies (Connell et al., 2006; Manousakas et al., 2014; Heal et al., 2005; Giorio et al., 2025) (Table S6).
2.5 Application to field data
We extrapolate the findings from the laboratory experiments to field data with detailed PM chemical characterization and source apportionment outputs at three different sites across Europe as described above in Sect. 2.3: a suburban background station near Paris, France (SIRTA, Srivastava et al., 2018a); an urban background site in Grenoble, France (Les Frênes, Srivastava et al., 2018b); and a roadside (summer, Campbell et al., 2024a) and urban background site (winter, Campbell et al., 2026) in London, United Kingdom. No fitting of model parameters was performed to match the field data (forward modeling), i.e., the model developed using the laboratory data was simply applied on the chemical composition data measured in the field, including the water-soluble fractions of TMIs, organics, and if available, quinones. While water-insoluble PM may increase total OP via surface reactions (Gao et al., 2020a), these processes are not represented in KM-OP. Organics and quinones were assumed to be fully soluble. The TMIs are initialized as Fe(II), Cu(II), and Mn(II) in the model, and we find that their initial oxidation state has nearly no effect on OP in the calculations due to their low concentrations and fast redox-cycling. We assume an organic peroxide content in organic aerosol of 50 % (Docherty et al., 2005; Chowdhury et al., 2018). Offline OPDTT and OPAA were measured at the Paris and Grenoble sites, while online OPAA was measured in London. At the London site, OPAA was determined by the formation of dehydroascorbic acid (DHA), while at the two sites in France, OPAA was determined as consumption of ascorbic acid. For clarity, the London data will be referred to as OPDHA, while the data from France will be referred to as OPAA.
Note that in the filter-based assays used for this study, there is an extraction step during which the filter samples are shaken at physiological conditions (pH 7, 37.5 °C) in a simulated lining fluid, in the absence of a probe reactant species. While a longer extraction time increases the amount of dissolved material and thus, e.g., DTT activity (Calas et al., 2017), it may also lead to loss of ROS as a result of aqueous-phase chemistry (Campbell et al., 2025). As the extraction kinetics and aqueous-phase chemistry during extraction are less well studied, the extraction period is not explicitly considered in KM-OP and simulations start with addition of the probe species. OP values may depend on the solvent medium used in the assay; however, previous studies suggested that at low PM concentrations, differences between solvents are reduced (Calas et al., 2017). This effect is not explicitly accounted for in the current model and may contribute to inter-site variability.
Figure 2 outlines the methodology used in this study. To summarize, we fit a model to laboratory data in order to infer the rate coefficients of the chemical reaction mechanism (inverse modeling step). After optimizing the model with the laboratory data and inferring the unknown or uncertain reaction rate coefficients, we apply the model using ambient chemical composition data as input, with no further fitting to predict and estimate the OP (forward modeling step).
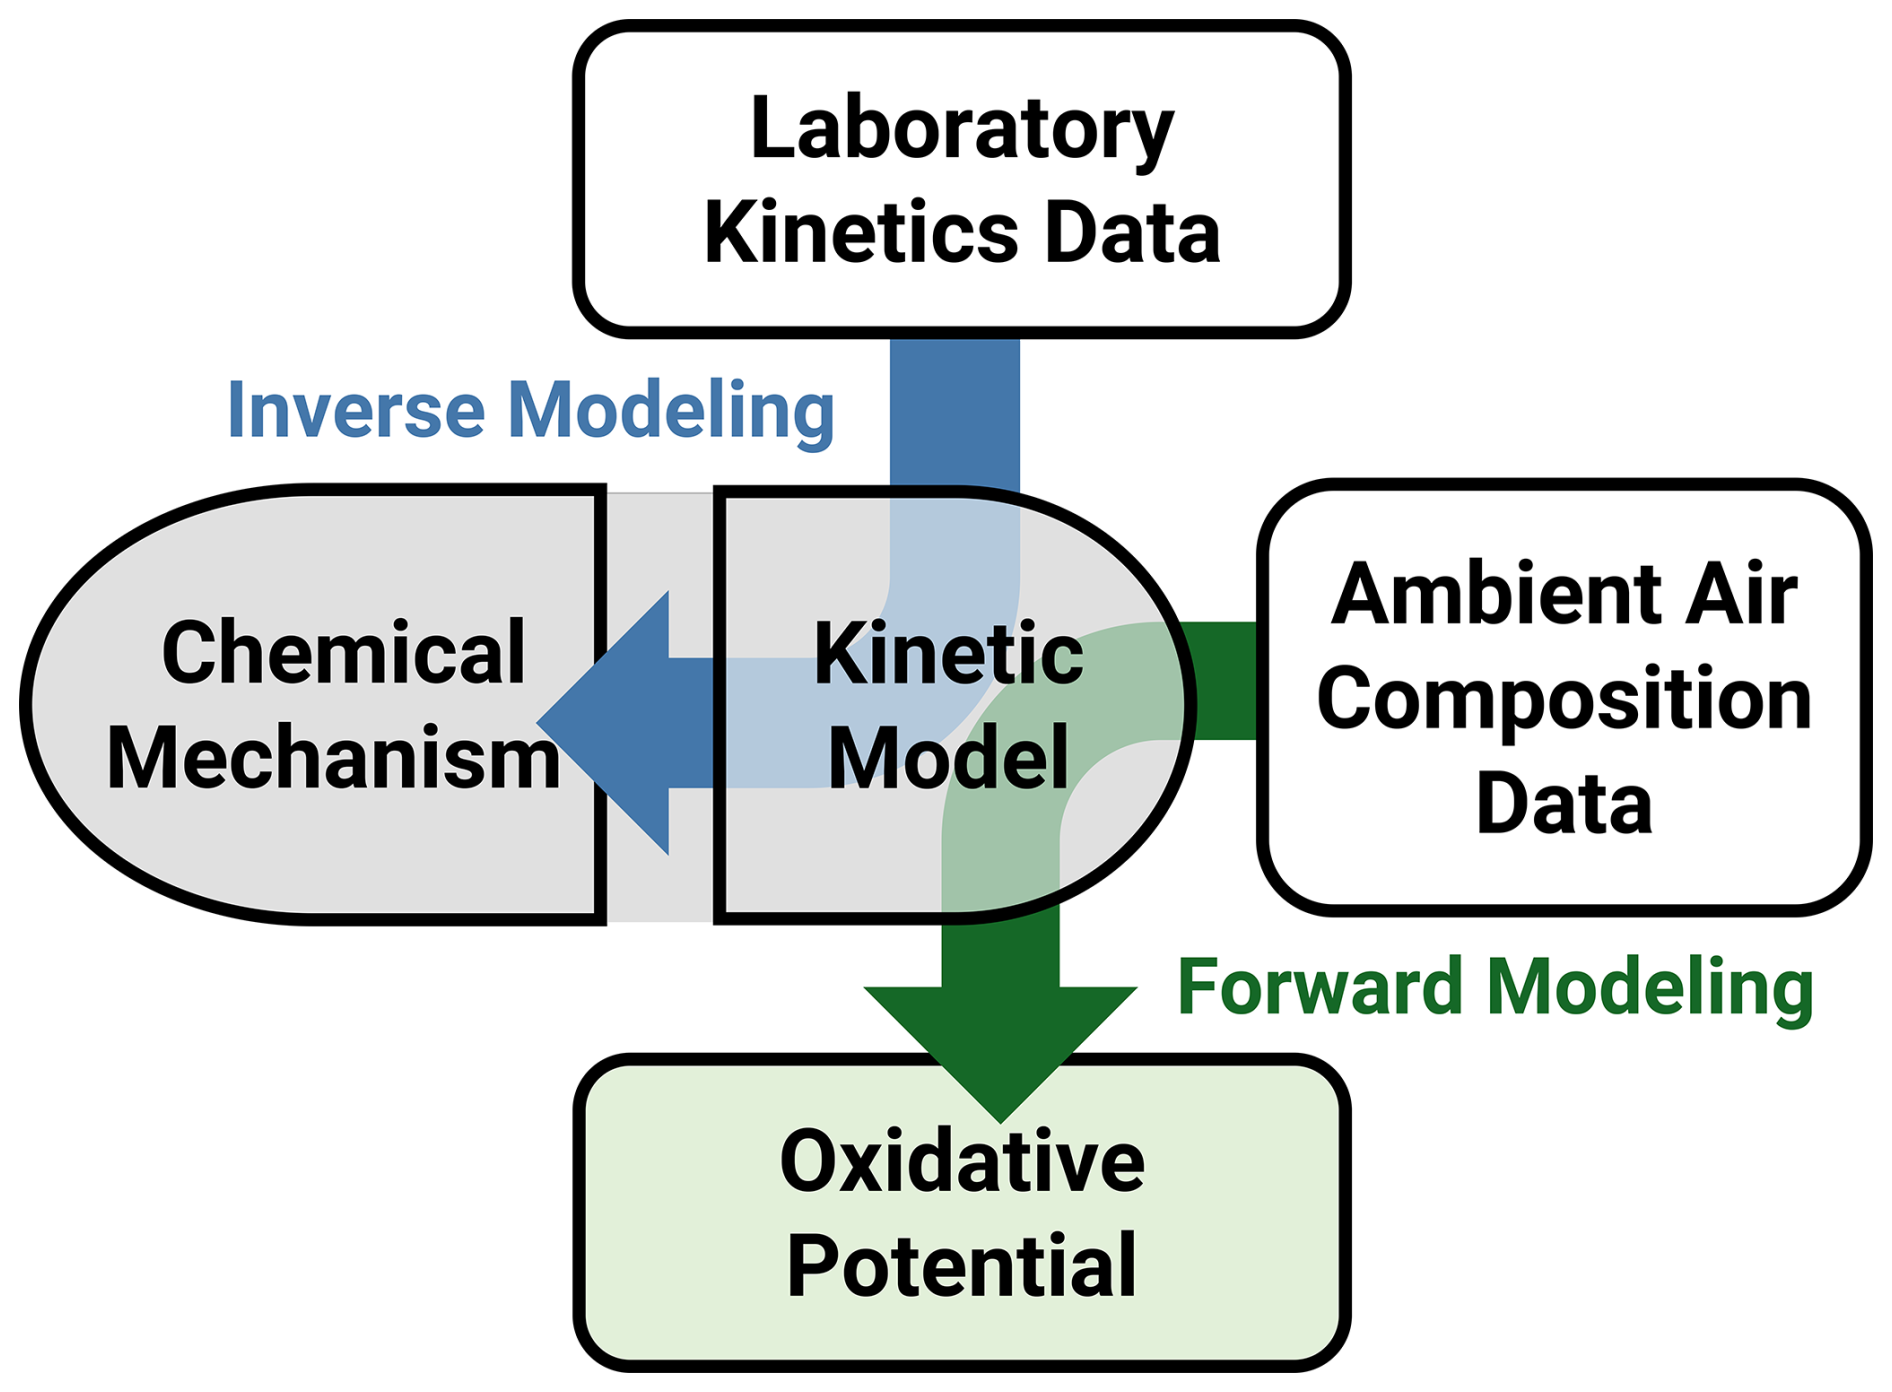
Figure 2Modeling approach applied in this study. Laboratory kinetic data sets are used in conjunction with the kinetic model and a global optimization algorithm (Monte Carlo Genetic Algorithm, MCGA, Berkemeier et al., 2017). Unknown rate coefficients are sampled and improved within boundaries until a good correlation between the model output and experimental data points is achieved (inverse modeling). To the fitted model, we use ambient air composition data (with no additional fitting) to predict OP in a given location (forward modeling).
3.1 H2O2 and •OH formation from transition metals and quinones
Figure 3A shows H2O2 production curves of Cu(II), 1,2-NQN, 1,4-NQN and PQN in a buffered surrogate lung lining fluid containing ascorbic acid, glutathione, uric acid, and citric acid. The experimental data from Charrier et al. (2014) (markers) is compared with KM-OP model results. The lines depict the mean of an ensemble of fits (N=15) to all the laboratory data presented in this study, and the shadings denote two standard deviations around the mean. Generally, production of H2O2 increases as the metal and quinone concentrations increase. For the quinones, the increase of H2O2 production is linear, with 1,2-NQN showing the highest reactivity.
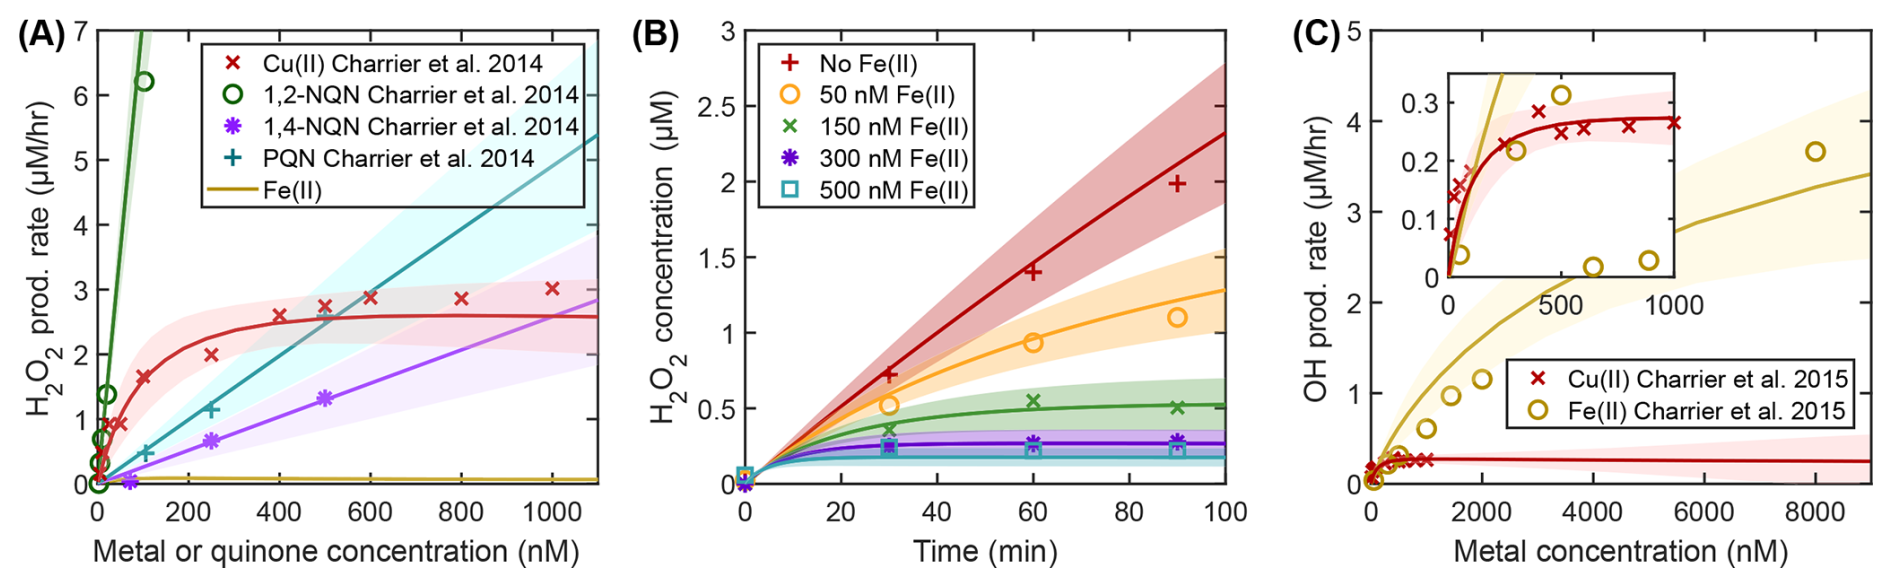
Figure 3Production of reactive oxygen species in surrogate lung lining fluid. Production rate of H2O2 as a function of Cu(II), 1,2-NQN, 1,4-NQN, PQN (A), H2O2 concentration over time at different Fe concentrations (B), and •OH production rate as a function of Cu(II) and Fe(II) (C). The markers are experimental data (for H2O2 (Charrier et al., 2014) and •OH (Charrier and Anastasio, 2015)), and the lines depict the mean of the fit ensemble, while the shadings denote two standard deviations around the mean of the fit ensemble.
The mechanism of H2O2 formation by quinones (Q) in KM-OP is outlined in Fig. 1A and B and listed below. Briefly, AA reduces quinones to semiquinones (SQ), and in turn is converted into the ascorbyl radical (AA•, Reaction R1). The semiquinones then reduce O2 to superoxide (, Reaction R2). A second equivalent of AA then reacts with to H2O2 (Reaction R3), also producing another AA•. SQ and AA• also react with to form H2O2 (Reactions R4 and R5). Figure S2 details the main sources of H2O2 in the simulations. As we do not assume further reaction of H2O2 with quinones or semiquinones, H2O2 formation increases linearly with quinone concentrations.
Conversely, the production of H2O2 increases non-linearly with Cu(II) concentration, with the production rate of H2O2 plateauing at higher Cu concentrations. The H2O2 formation mechanism of Cu in KM-OP is outlined in Fig. 1A and above. Cu(II) is reduced to Cu(I) by AA (Reaction R6). Cu(I) then reacts with O2, forming (Reaction R7). At low Cu concentrations, H2O2 production mostly occurs through the reaction of AA with (Reaction R3), while at higher concentrations of Cu, the reaction of Cu(I) with is most important (Fig. S3, Reaction R8). The non-linearity in H2O2 production in the presence of Cu stems from the destruction of H2O2 through the Fenton-like reaction of H2O2 with Cu(I), leading to a steady state of H2O2 production and destruction.
As experimental data for H2O2 production with Fe(II) alone is not available, we fitted published time series data (Charrier et al., 2014) that contain 20 nM 1,2-NQN at varying Fe(II) concentrations (Fig. 3B). Figure 3B illustrates that H2O2 concentration decreases as Fe(II) concentration increases. As shown in Fig. 3B, H2O2 destruction can equalize H2O2 production in aqueous Fe solutions. Fe(II) reacts rapidly with H2O2 via the Fenton Reaction (R13), leading to a very low steady state concentration of H2O2 (dark yellow solid line) and significant •OH radical production (Fig. 3C).
Figure 3C shows the •OH production-response curve for Cu(II) and Fe(II) in buffered surrogate lung lining fluid containing ascorbic acid, glutathione, uric acid, citric acid, and sodium benzoate, which is used as an •OH probe. The production of •OH increases non-linearly with the concentration of Cu(II), with •OH production plateauing at higher Cu concentrations. At low Cu concentrations, •OH production occurs mostly through the reaction of AA with H2O2 (Reaction R14), while at higher concentrations of Cu, the pseudo-Fenton reaction of Cu(I) with H2O2 (Reaction R9) is the most important (Fig. S4).
3.2 Ascorbic acid assay (OPAA and OPDHA)
Figure 4A shows the modeled concentration-time profiles of ascorbic acid in the presence of Cu(II), Fe(II), and 1,4-NQN. The model output shows agreement with the published experimental data within experimental uncertainty (Expósito et al., 2024). Here, the concentrations of Cu(II), 1,4-NQN, and Fe(II) were 0.5, 1, and 5 µM, respectively. Despite a lower concentration of Cu(II) compared to Fe(II) and 1,4-NQN, AA decays quickest in the presence of Cu. In the model, this is due to the higher reaction rate coefficient of the redox reaction between AA and Cu(II) compared to the reaction with Fe(III) (Table S1, Reactions SR16 and SR33). Note that the direct reactions of the TMIs with AA dominate over the reactions of ROS with AA. For Cu, while H2O2 concentration is higher than the concentration of Cu(II) (Fig. S5A), the best-fitting rate coefficient of AA with Cu(II) is three orders of magnitude higher than the best-fitting rate coefficient of AA with H2O2 (Table S1, Reactions SR33 and SR48), leading to an over 700 times larger turnover of AA with Cu. For Fe, the concentration of Fe(III) is higher than the concentration of ROS (Fig. S5B), and the rate coefficient of AA with Fe(III) is also higher than the rate coefficient of AA with H2O2 (Table S1, Reactions SR16 and SR48), leading to an over 4000 times larger turnover of AA with Fe under these conditions. As shown in Fig. 1A and mentioned above, AA reduces metals and quinones by redox cycling from their oxidized to reduced forms. The reduced metals and semiquinone can react with oxygen, leading to the formation of , which in turn is another reaction partner for AA. As shown in Fig. 1B and outlined below, in the KM-OP mechanism, the oxidation of AA leads to the formation of dehydroascorbic acid (DHA; Shen et al., 2021). Note, while the KM-OP mechanism includes a redox reaction for the reaction of AA and metals, a catalytic reaction mechanism has also been proposed in the literature (Shen et al., 2021). Figure 4B shows DHA concentrations as a function of Cu(II) and Fe(II) concentrations, and compares the model output to experimental data from Shen et al. (2021). We find a linear increase in DHA concentration with increasing Fe(II) concentration. The largest source of DHA is the disproportionation reaction of the ascorbyl radical (AA•), which can be produced by the redox reaction between AA and TMIs such as Fe and Cu ions (Fig. S6). On the contrary, with Cu, the DHA concentration increases non-linearly and saturates at higher Cu(II) concentrations because DHA formation is second order with respect to AA•, however, DHA loss is a (pseudo-)first-order reaction in the mechanism:
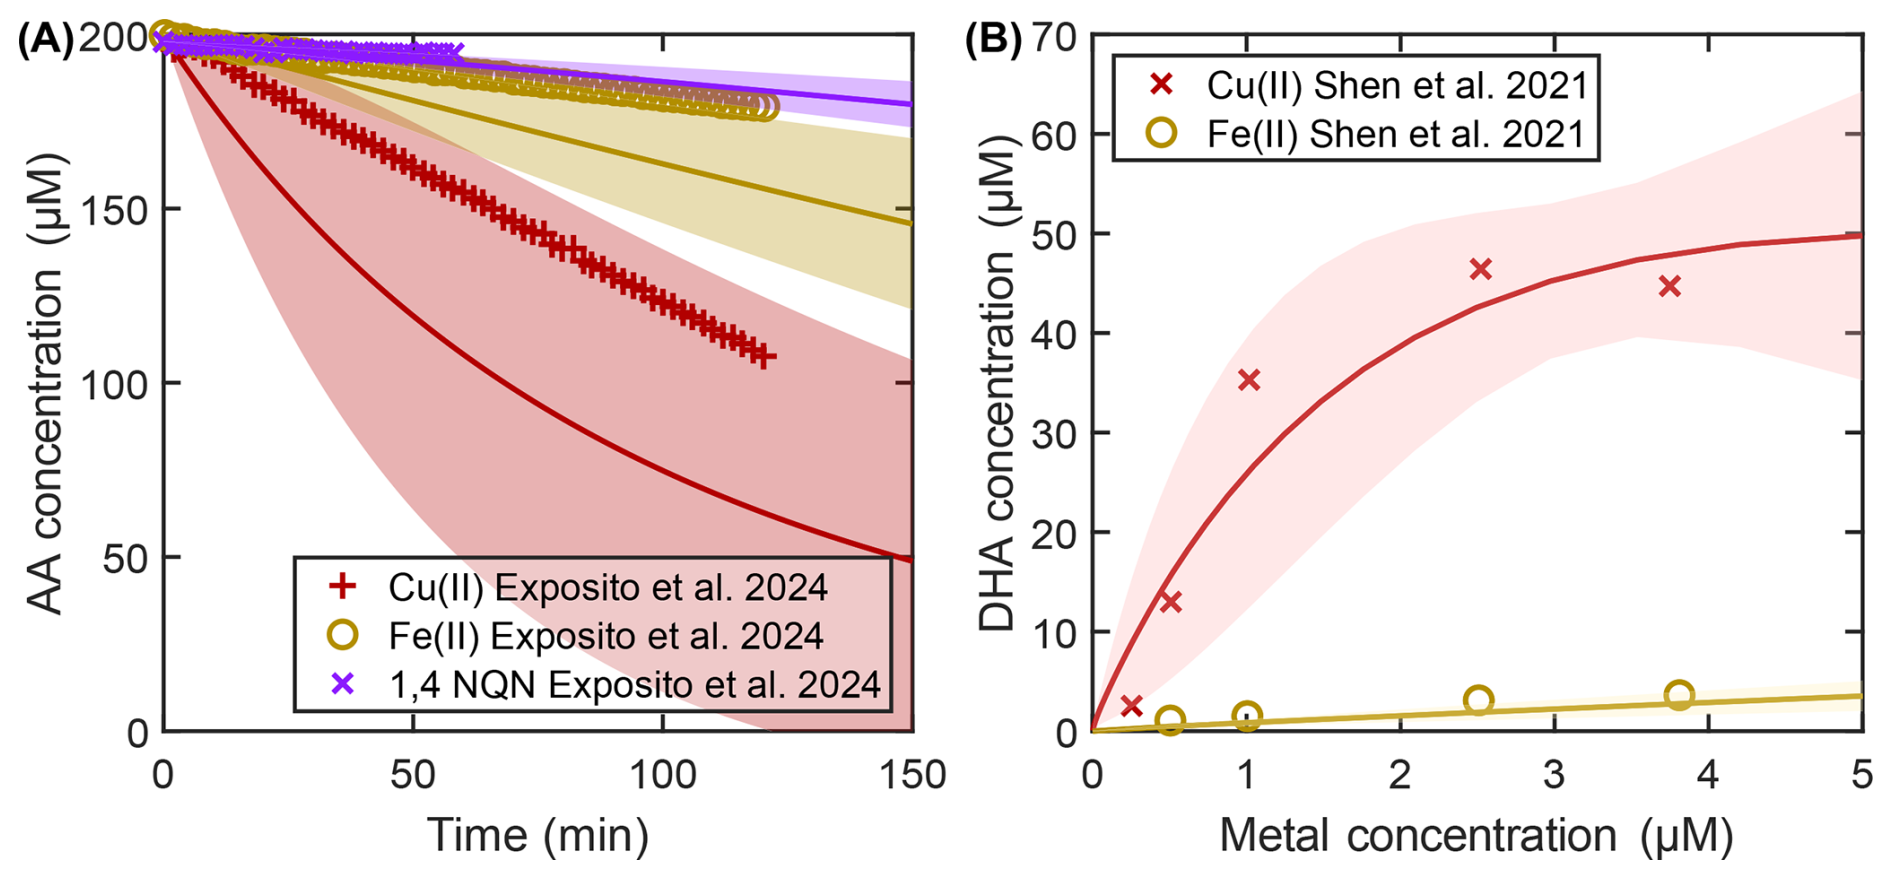
Figure 4Ascorbic acid concentration as a function of time at different concentrations of 1,4-NQN, Fe(II) and Cu(II) ions (A). DHA concentration as a function of Fe(II) and Cu(II) concentration (B). The markers are measurement data points (Shen et al., 2021; Expósito et al., 2024), and the dark-colored lines depict the mean of the fit ensemble, while the shadings denote two standard deviations around the mean.
3.3 DTT assay (OPDTT)
Figure 5A, B, and D show the rates of DTT loss at various concentrations of TMIs and quinones as measured by Charrier and Anastasio (2012) and Expósito et al. (2024). DTT consumption generally increases with increasing TMI and quinone concentrations, and overall, the experimental data is well captured by the model. Figure 5A shows that DTT oxidation in the presence of Cu(II) and Mn(II) is faster than in the presence of Fe(II). There is a linear increase in the rate of DTT loss with increasing Fe concentration. As shown in Fig. 1 and outlined below, in the KM-OP mechanism, DTT reduces Fe(III) to Fe(II) and in turn forms a thiyl radical (Netto and Stadtman, 1996). The experimental data shows a slightly higher rate of DTT loss for Fe(II) compared to Fe(III), which is not captured by the model. This may be related to Fe(III) forming precipitate in the presence of phosphate buffer (Yalamanchili et al., 2022; Campbell et al., 2023), which is currently not considered in the model.
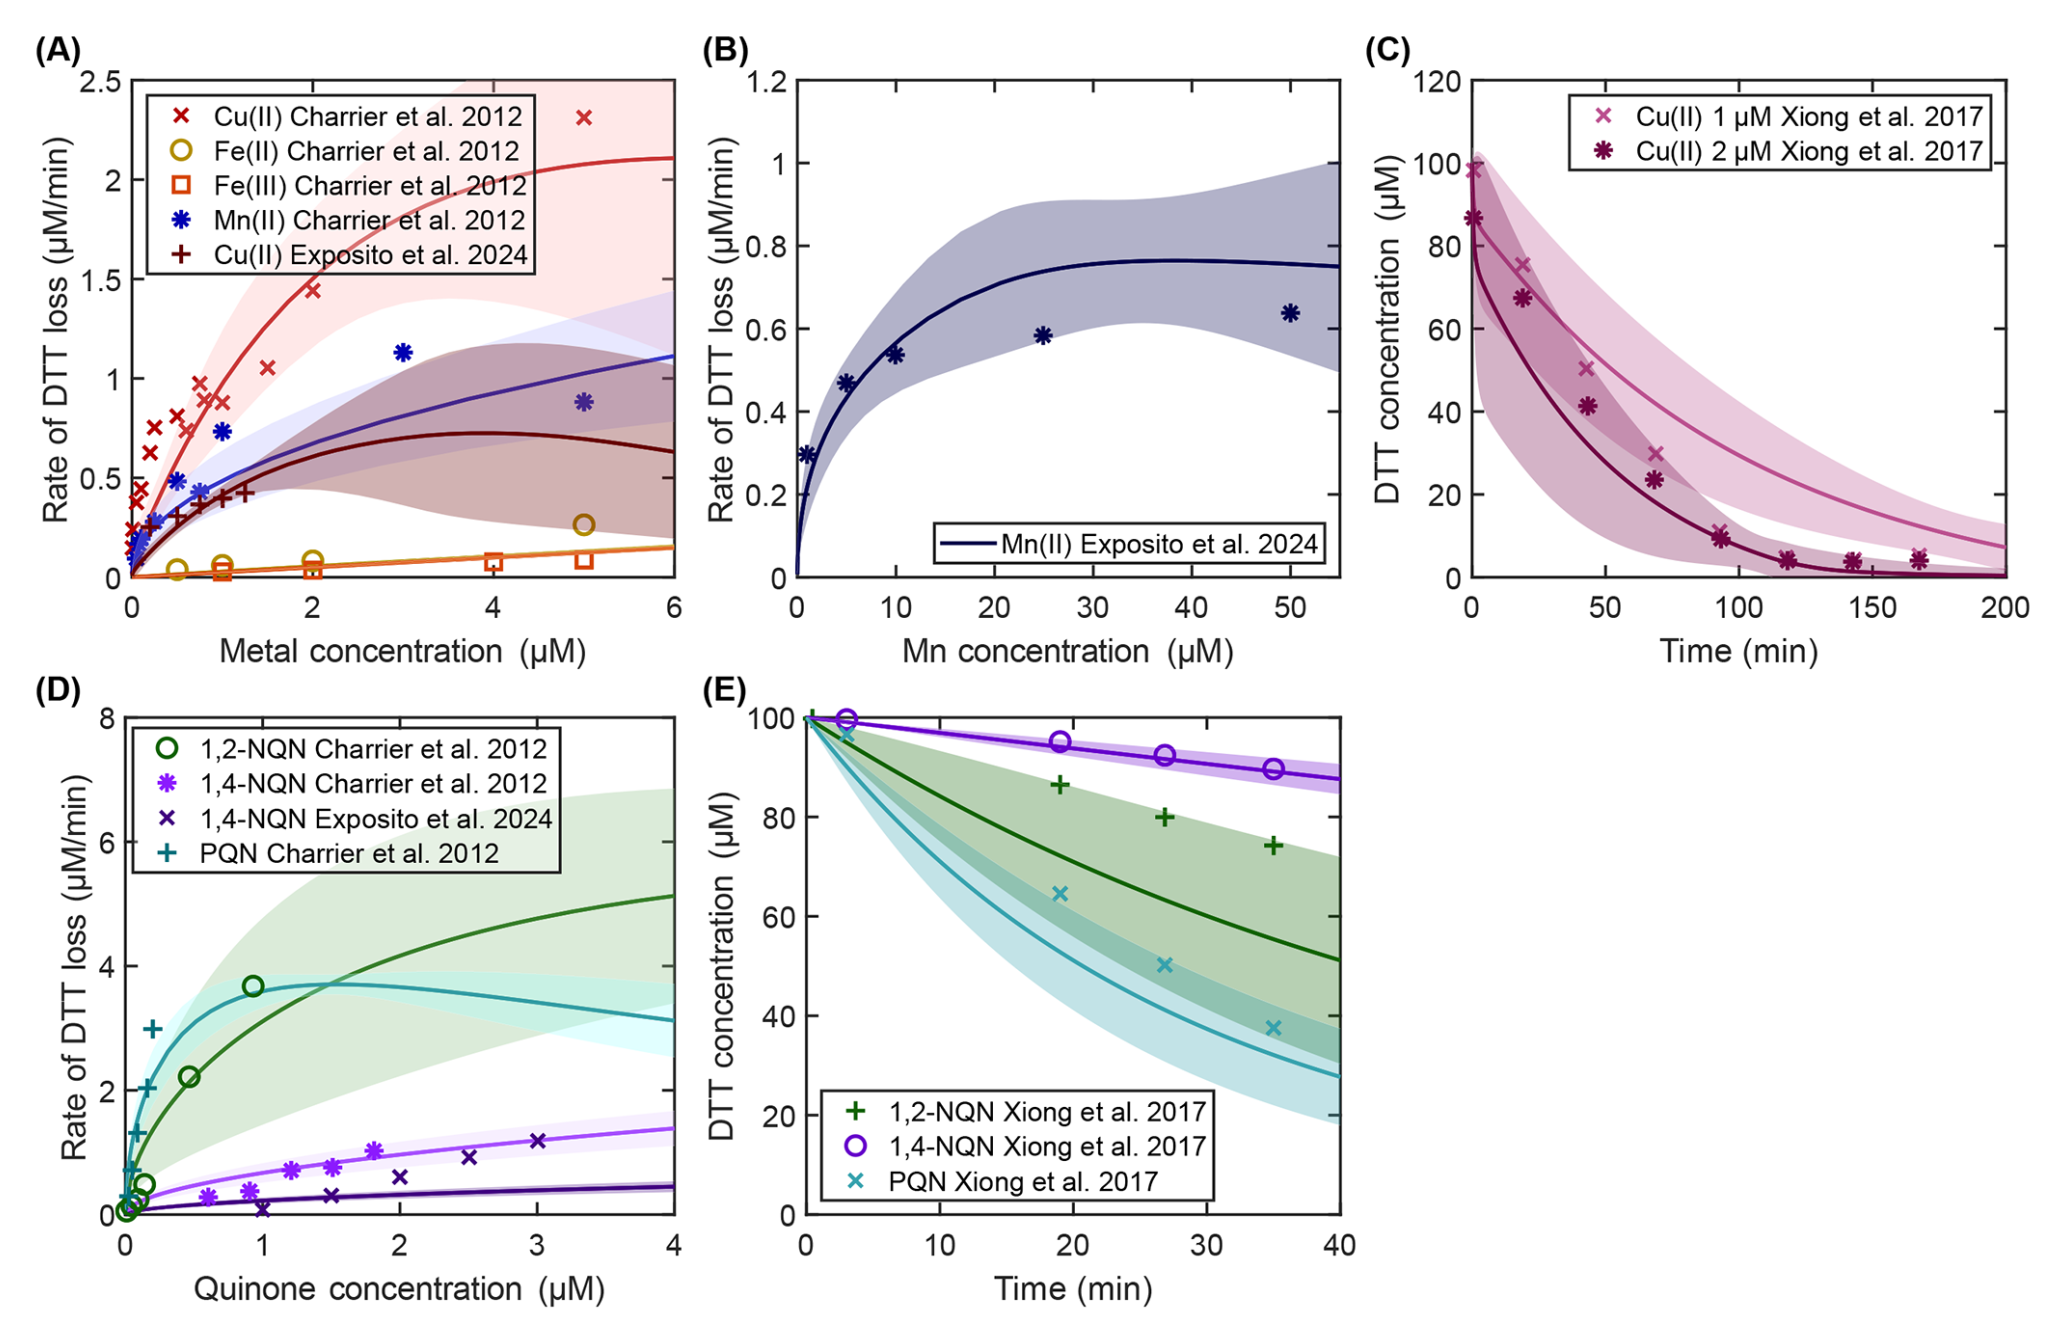
Figure 5Rate of DTT loss as a function of different concentrations of transition metal ions (A, B) and quinones (D). DTT concentration as a function of time at different Cu(II) (C) and quinone (E) concentrations. The symbols are measurement data (Charrier and Anastasio, 2012; Xiong et al., 2017; Expósito et al., 2024), and the dark-colored lines depict the mean of fit ensembles from the model; shadings denote two standard deviations around the mean. The DTT concentration in Charrier and Anastasio (2012) and Xiong et al. (2017) data is 100 µM, while Expósito et al. (2024) use 50 µM of DTT.
Figure 5B shows oxidation rates of DTT in the presence of Mn(II) as measured by Expósito et al. (2024). The data show that the rate of DTT loss increases non-linearly and eventually plateaus at higher Mn(II) concentrations. The largest sink for DTT at low Mn(II) concentrations is (Reaction R18), while at higher concentrations, it is Mn(II) and Mn(III) (Reaction R21, Fig. S7A). This occurs because the rate coefficient of with DTT is larger than the rate coefficients of Mn(II) and Mn(III) with DTT. The non-linearity stems from the fact that at high Mn(II) concentrations (>20 µM), DTT is depleted by more than 50 % (Fig. S7B), leading to an apparent slow down of the kinetics. Moreover, at higher Mn(II) concentrations, undergoes a self-reaction to form H2O2, and also reacts with Mn(II) to form (Fig. S7C), where the latter then accumulates in the kinetic model (Fig. S7D).
Figure 5C shows the temporal evolution of the DTT concentration at two different concentrations of Cu(II) from the study of Xiong et al. (2017). The data shows that the DTT decays faster at higher Cu(II) concentrations. The loss of DTT due to Cu(II) is non-linear over time (Fig. 5A). As shown in Fig. 1, in KM-OP, the oxidation of DTT in the presence of Cu(II) involves the formation of a complex, which has been identified as a catalyst for DTT oxidation (Kachur et al., 1997). The DTT loss rate increases non-linearly with increasing Cu(II) concentrations because the largest sink of DTT is the formation of (Reaction R23, Fig. S8), which is second order with respect to DTT, while the loss of is first order (Table S1, Reaction SR63).
Figure 5D illustrates the oxidation rates of DTT in the presence of quinones, as measured by Charrier and Anastasio (2012). Figure 5E shows that PQN is the most reactive quinone examined in this study, followed by 1,2-NQN and 1,4-NQN, respectively. The kinetic model simulations show that quinones are reduced by DTT, resulting in the formation of the semiquinone radical and a thiyl radical (Reaction R24), both of which react with molecular oxygen to form (Kumagai et al., 2002). We find that at higher 1,2-NQN and PQN concentrations, the main sink of DTT is the quinone itself (Reaction R24), while at lower concentrations of quinones, the main sink is (Reaction R18, Fig. S9A and C). For 1,4-NQN, we find a rate coefficient with DTT that is slower compared to the rate coefficient of PQN and 1,2-NQN. Thus, in the presence of 1,4-NQN, the main sink for DTT is always (Fig. S9B). While the inferred reaction rate coefficient of with DTT (Reaction R18) is larger than the rate coefficient of PQN and 1,2-NQN with DTT (Reaction R24), the concentration does not increase linearly with the concentration of quinones, and therefore the rate of reaction of PQN and 1,2-NQN with DTT becomes dominant at high PQN and 1,2-NQN concentrations. The DTT loss rate increases non-linearly with increasing quinone concentration because at higher concentrations of 1,2-NQN and PQN, the DTT concentration decreases by more than 50 % at the end of the model simulation (Fig. S10), leading to an apparent slow down of the kinetics.
To test the chemical mechanism involving organic components (Fig. 1D), KM-OP results are compared to DTT data presented in Tuet et al. (2017) and radical production rate presented in Tong et al. (2018). Tong et al. (2018) measured the formation of •OH, RO•, , and R• radicals from SOA using electron paramagnetic resonance (EPR) spectroscopy. Figure 6A shows the radical production rate of SOA in aqueous solution. We find a good agreement with the experimental data for isoprene and β-pinene SOA when using an organic hydroperoxide content within SOA of 10 %. For naphthalene SOA, we are able to capture the experimental data by lowering the organic hydroperoxide content to 3 % (Wang et al., 2018).
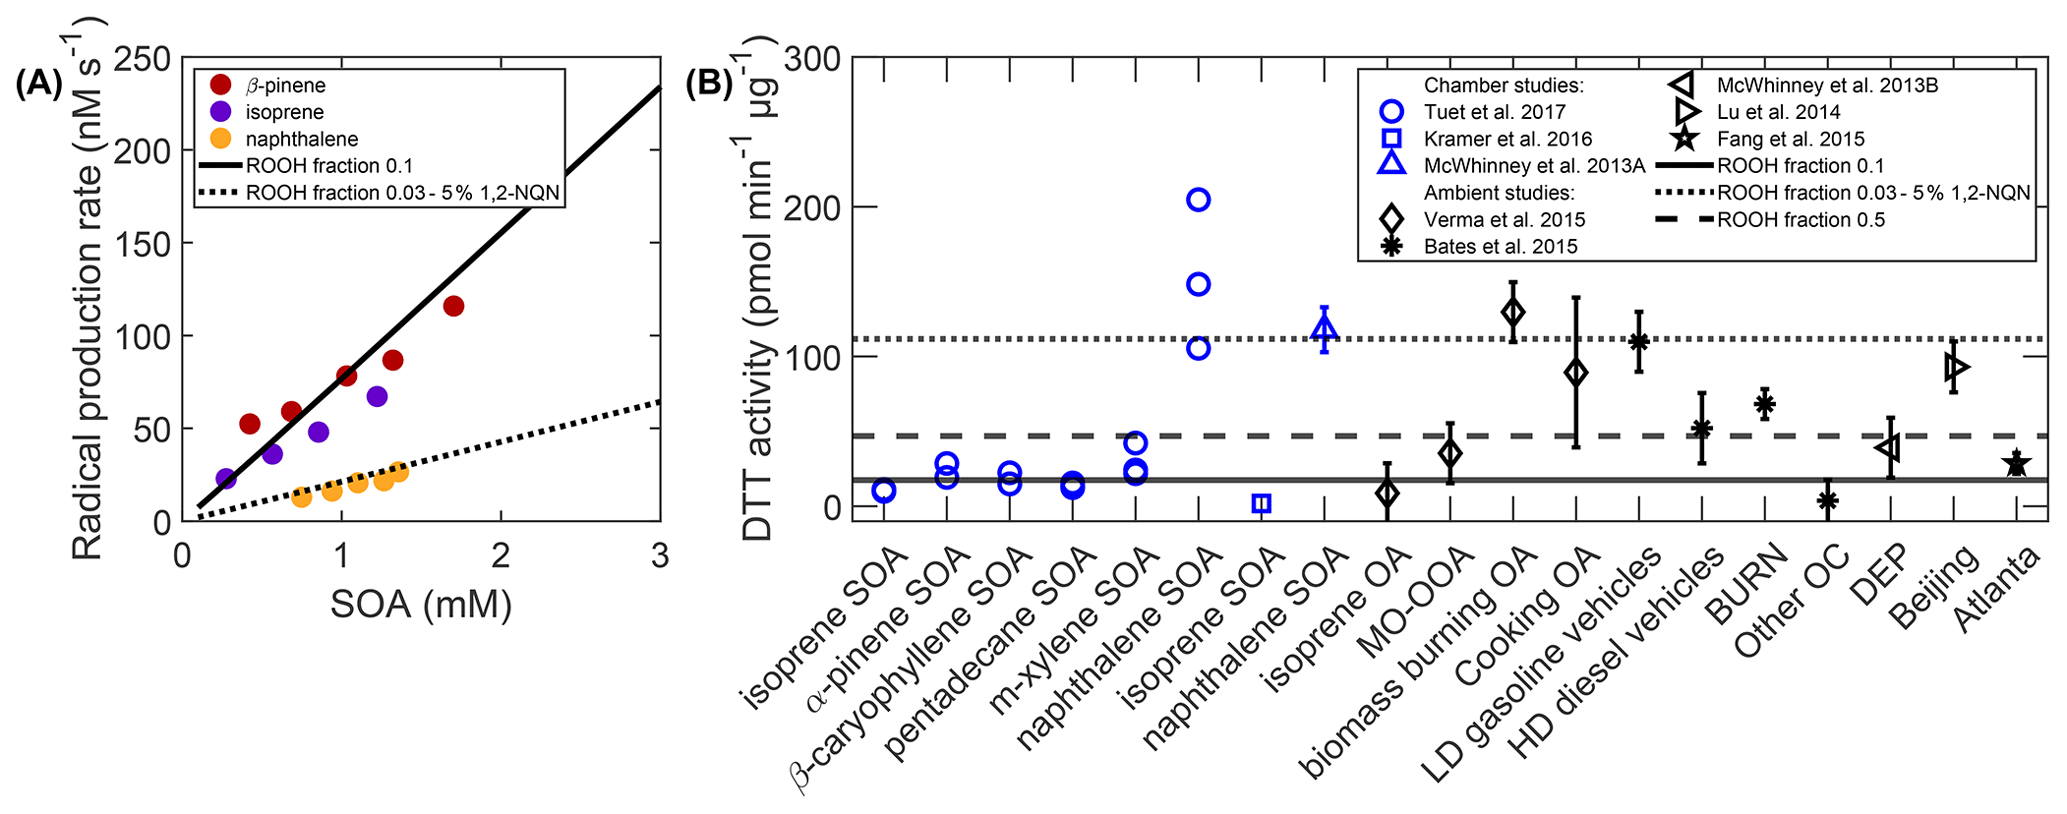
Figure 6Comparison of KM-OP model results with published data of radical production and DTT activity of secondary organic aerosol (SOA). Radical production rates as a function of SOA concentration published in Tong et al. (2018) for three different SOA precursors (markers) (A). Model results are depicted as solid and dotted lines. DTT activity for different types of chamber-generated (blue markers) and ambient SOA (black markers) adapted and including data from Tuet et al. (2017) and studies cited therein (McWhinney et al., 2013a, b; Lu et al., 2014; Bates et al., 2015; Fang et al., 2015; Verma et al., 2015; Kramer et al., 2016; Tuet et al., 2017) (B). Model results are depicted as solid, dashed, and dotted lines. Labels are reproduced from Tuet et al. (2017): Isoprene-OA: isoprene-derived OA, MO-OOA: more-oxidized oxygenated OA, LD: light-duty, HD: heavy-duty, BURN: biomass burning, DEP: diesel exhaust particles.
Figure 6B shows DTT activity using the same model parameters. The model results align well with the DTT activity from a majority of the chamber-generated SOA (solid line in Fig. 6B), including biogenic and anthropogenic precursors (isoprene, α-pinene, β-caryophyllene, pentadecane, m-xylene). However, the model underestimates the DTT activity of naphthalene SOA, which is found to be considerably higher than all other SOA. When assuming that 5 % of naphthalene SOA is 1,2-naphthoquinone (Tong et al., 2018; Daellenbach et al., 2020), the model captures the measured DTT activity (dotted line). Note that this inclusion of naphthoquinone does not affect the results previously shown in Fig. 6A due to the lack of a reductant to induce redox cycling of the quinone in these experiments. However, this mechanistic explanation demands further investigation in the future. Thus, in light of the remaining uncertainties, because naphthalene SOA likely contributes only a small fraction to the total organic aerosol mass, and for simplicity, we will not differentiate between biogenic and anthropogenic organics when modeling ambient data.
Tuet et al. (2017) further find a higher DTT activity of organic components from field studies compared to laboratory chamber measurements. As these organics are likely more aged (Docherty et al., 2005; Chowdhury et al., 2018), we increase the organic hydroperoxide content to 50 %, which in turn increases the concentration of •OH and RO• radicals (Reaction R25), and find that the data are generally well-captured by the model (dashed line). Note that, the DTT assay reported in Tuet et al. (2017) (protocol from Fang et al., 2015) uses EDTA to chelate transition metals. Charrier and Anastasio (2012) have shown that including EDTA when performing OP assay reduces the DTT activity from both transition metals and quinones. In the model, we account for the effects of EDTA by assuming that its addition reduces the original DTT activity to one-tenth of the initial value (Charrier and Anastasio, 2012).
3.4 Comparison to field data
Figure 7 shows the correlation scatter plot of experimentally-determined and simulated OP for particulate matter samples collected at three different sites across Europe (Grenoble, Paris, and London). Overall, we find good agreement between model simulations and field data as evaluated by correlation coefficients, mean squared logarithmic errors (MSLE), and relative biases (bias, Sect. S3.8). For the Grenoble site (Fig. 7A and D), the model shows slightly better correlation (, ) with the data compared to the Paris site (Fig. 7B and E, , ) for both assays. We find that using total organic aerosol mass as input for the species “Org” in the model leads to a much better agreement with the field data than using only the fraction of SOA derived from source apportionment (Srivastava et al., 2018a, b) (Fig. S11), which suggests that organic aerosol from sources such as biomass burning, traffic, or bioaerosols, must have a significant effect on OP. Nonetheless, the model overall slightly underestimates OP in Grenoble (bias: −8.3 % to −5 %) and overestimates OP in Paris (bias: 13.3 %–38.7 %). This deviation of OP likely stems from the limited number of chemical species in the model, which considers only three TMIs, three quinones, as well as organic compounds, and at present does not consider other chemical species such as Zn, surface-chemistry on the insoluble fraction of PM (e.g., elemental carbon-containing particles from combustion), or possible synergetic and antagonistic effects in mixtures (Charrier and Anastasio, 2012; Antiñolo et al., 2015), which all may also contribute to OP. Furthermore, the model does not currently differentiate between biogenic and anthropogenic SOA, the latter of which has shown to be particularly OP-active in the case of naphthalene SOA (Fig. 6B).
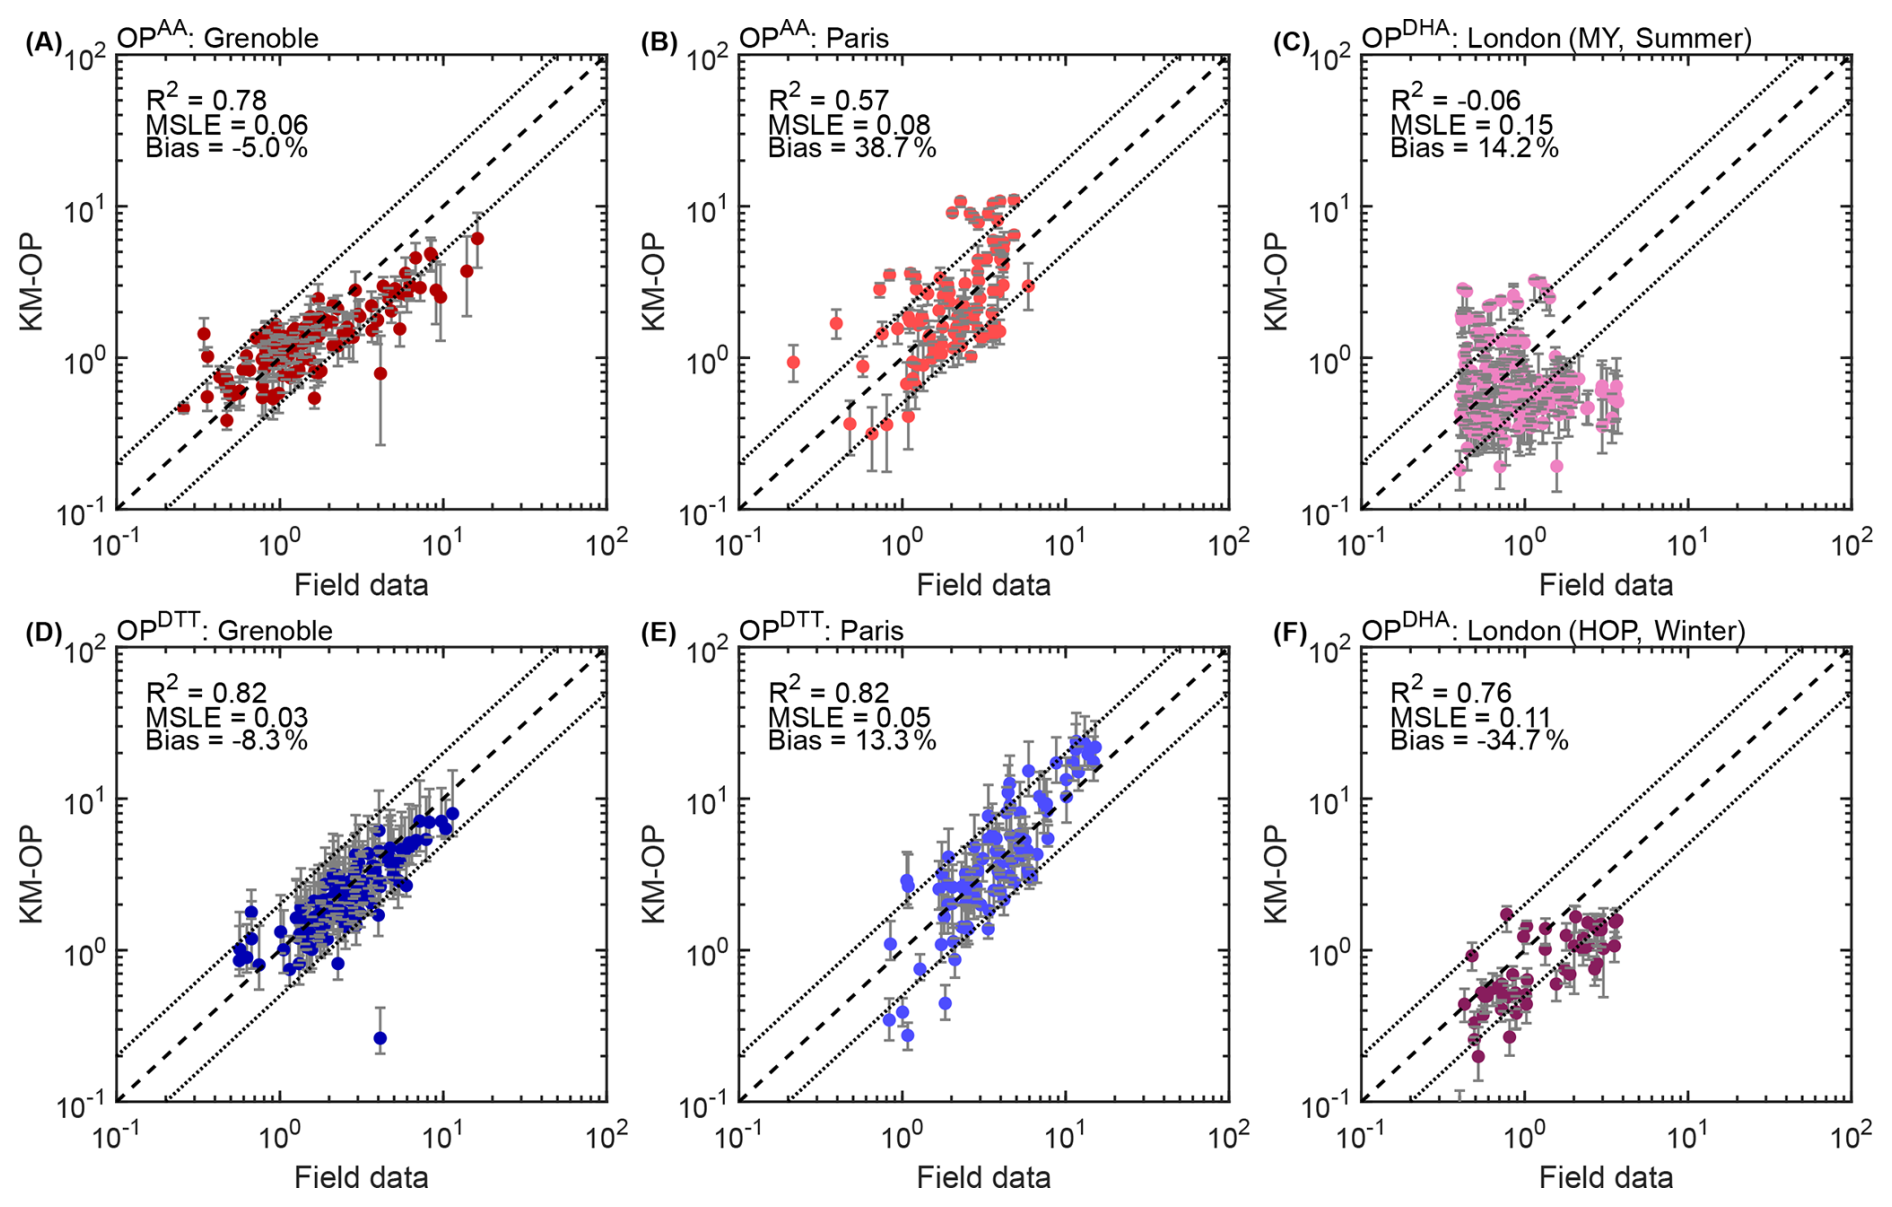
Figure 7Correlation scatter plots of model-predicted and measured OP for particulate matter samples collected in three different sites across Europe: Grenoble (OPAA: A, and OPDTT: D), Paris (OPAA: B, and OPDTT: E), and OPDHA in London during the summer (C) and during the winter (F). Data shown in blue indicate OPDTT (in units of ), while the red and pink data show OPAA (in units of ) and OPDHA (in units of ). The dashed lines indicate the 1:1 line. The dotted lines indicate the 2:1 and 1:2 lines. The error bars indicate the maximum and minimum values from the ensemble fits.
For the London sites (roadside location MY in the summer, Fig. 7C, and urban background location HOP in winter, Fig. 7F), the modeled OP values generally fall within the same order of magnitude as the field data. For the HOP site, the correlation between model and field data is high (R2=0.76), but the model generally underestimates OPDHA (MSLE=0.11, bias: −34.7 %). In contrast, the model shows less bias (14.2 %), but no correlation with the field data at the MY site (, MSLE=0.15).
Overall, the model captures the field data at the French sites better than at the London site. This could be because some OP-active components of PM are short-lived (e.g., labile organic compounds), and while they would affect the online OP assay employed at the London site, likely contributing to more than 50 % of the online OPDHA (Campbell et al., 2019; Utinger et al., 2023; Campbell et al., 2025), such compounds may not have influenced the filter-based laboratory assessment of the OP activity of organic compounds used for training of the model. This may explain why the sites using filter-based, offline, OP assays show better correlation with the model. Peroxides constitute a significant fraction of atmospheric OA, but their abundance varies widely depending on precursors and oxidative processing (Docherty et al., 2005; Krapf et al., 2016; Wang et al., 2023; Li et al., 2024, 2025). A sensitivity analysis over a ROOH fraction range of 20 %–80 % of total OA indicates that the model underestimates OP at an ROOH fraction of 20 % and overestimates OP at an ROOH fraction of 80 % (Figs. S12 and S13). The overall trends and correlations with field measurements, however, remain robust. We note that the simulations with 80 % ROOH fraction resolve the underestimation of the London winter data, which uses online-OP instrumentation, by improving the bias from −34.7 % to −8.3 %, suggesting the presence of short-lived organic species that are only captured using the online instrument (Krapf et al., 2016; Utinger et al., 2023; Campbell et al., 2025). Note that, no site-specific solubility measurements were available and we used solubility factors from the literature, which introduces additional uncertainty when modelling the London datasets. A sensitivity analysis accounting for water-insoluble organic species (Ram et al., 2012; Lammel et al., 2020; Yu et al., 2024) showed reduced absolute OP values, but consistent overall trends and site-to-site comparisons (Fig. S14). Moreover, the compositional analysis for the London dataset presented in Campbell et al. (2024a) does not contain quantitative data for quinones, which may be another reason for the underestimation of OP, especially in the winter. The poor correlation of the summer data may be due to varying degrees of photochemical aging, leading to compositional changes in the organic aerosol fraction that are not considered in the model. Additional analysis with meteorological parameters for the summer data shows some variability in model performance (Fig. S15). Model disagreement occurs at two distinct time periods. The analysis shows a slight tendency of the model to underestimate OP at lower wind speeds and exhibits a slight positive bias with increasing temperature. However, these effects are not consistent across the dataset, and no clear or systematic trends emerge. While such nuances suggest potential influences of meteorological conditions on OP, it remains unclear how these effects could be incorporated into an improved model parameterization. Highly oxygenated organics may produce more ROS directly, and may also act as ligands (e.g., oxalate Shahpoury et al., 2024a), enhancing metal solubility. Previous studies have shown that certain ligands, such as EDTA, can enhance Fenton-like reactivity (Rush and Koppenol, 1990; Gonzalez et al., 2021), but other studies have demonstrated that ligand complexation can reduce OP in DTT assays (Charrier and Anastasio, 2012). Thus, the influence of metal–ligand interactions on OP warrants further experimental investigation before incorporation into kinetic models.
To gain insight into which PM components are the key drivers of OP, we perform model sensitivity studies for each assay and each PM constituent. Figure 8 shows the contribution of the model species towards OPAA, OPDTT, OPOH, and OPH2O2 using the average chemical composition measured in Grenoble (Table 1). The results for the other sites are shown in Figs. S16–S18. The white bar labelled “Mixture” shows the default model result with all pollutants included, as reference. The “Single pollutants” bar shows a sensitivity study that sums the OP values calculated in model runs that only contain a single PM component, determining their direct, solitary, first-order effect. The colored bar segments represent the effect of each PM component. The “Shapley values” bar is a sensitivity study that uses the Shapley method (Shapley, 1953), to determine the total effect of individual PM components by determining their average marginal contribution across all possible combinations of PM component mixtures (unary, binary, tertiary etc.). The Shapley values indicate whether a PM component increases or decreases the OP of the mixture, including interaction effects. To better understand how contributions of individual PM components arise, their total Shapley values for each site are further decomposed by interaction order in Figs. S19–S22.
Table 1Mean PM, Fe, Cu, Org, SOA, and quinone mass concentrations at each of the different locations explored in this study.

Model sensitivity calculations for OPAA (Fig. 8A) show that the dominant contributions come from Cu and organics. In the model, Cu contributes to AA oxidation through direct redox reaction with AA, but also through the production of that further oxidizes AA. Organic compounds contribute towards OPAA through the decomposition of organic peroxides to RO• and •OH (Tong et al., 2016, 2018; Wei et al., 2021; Campbell et al., 2023), which in turn oxidize ascorbic acid (Fig. S23, Table S1, Reactions SR1, SR115). Moreover, RO2 also oxidizes AA (Table S1, SR129). OPDHA, predicted for the London sites (Figs. S21A and S22A), shows high contribution from Cu, Fe, and organics, all of which contribute to the formation of AA•, which then undergoes a disproportionation reaction to form DHA (Fig. S24).
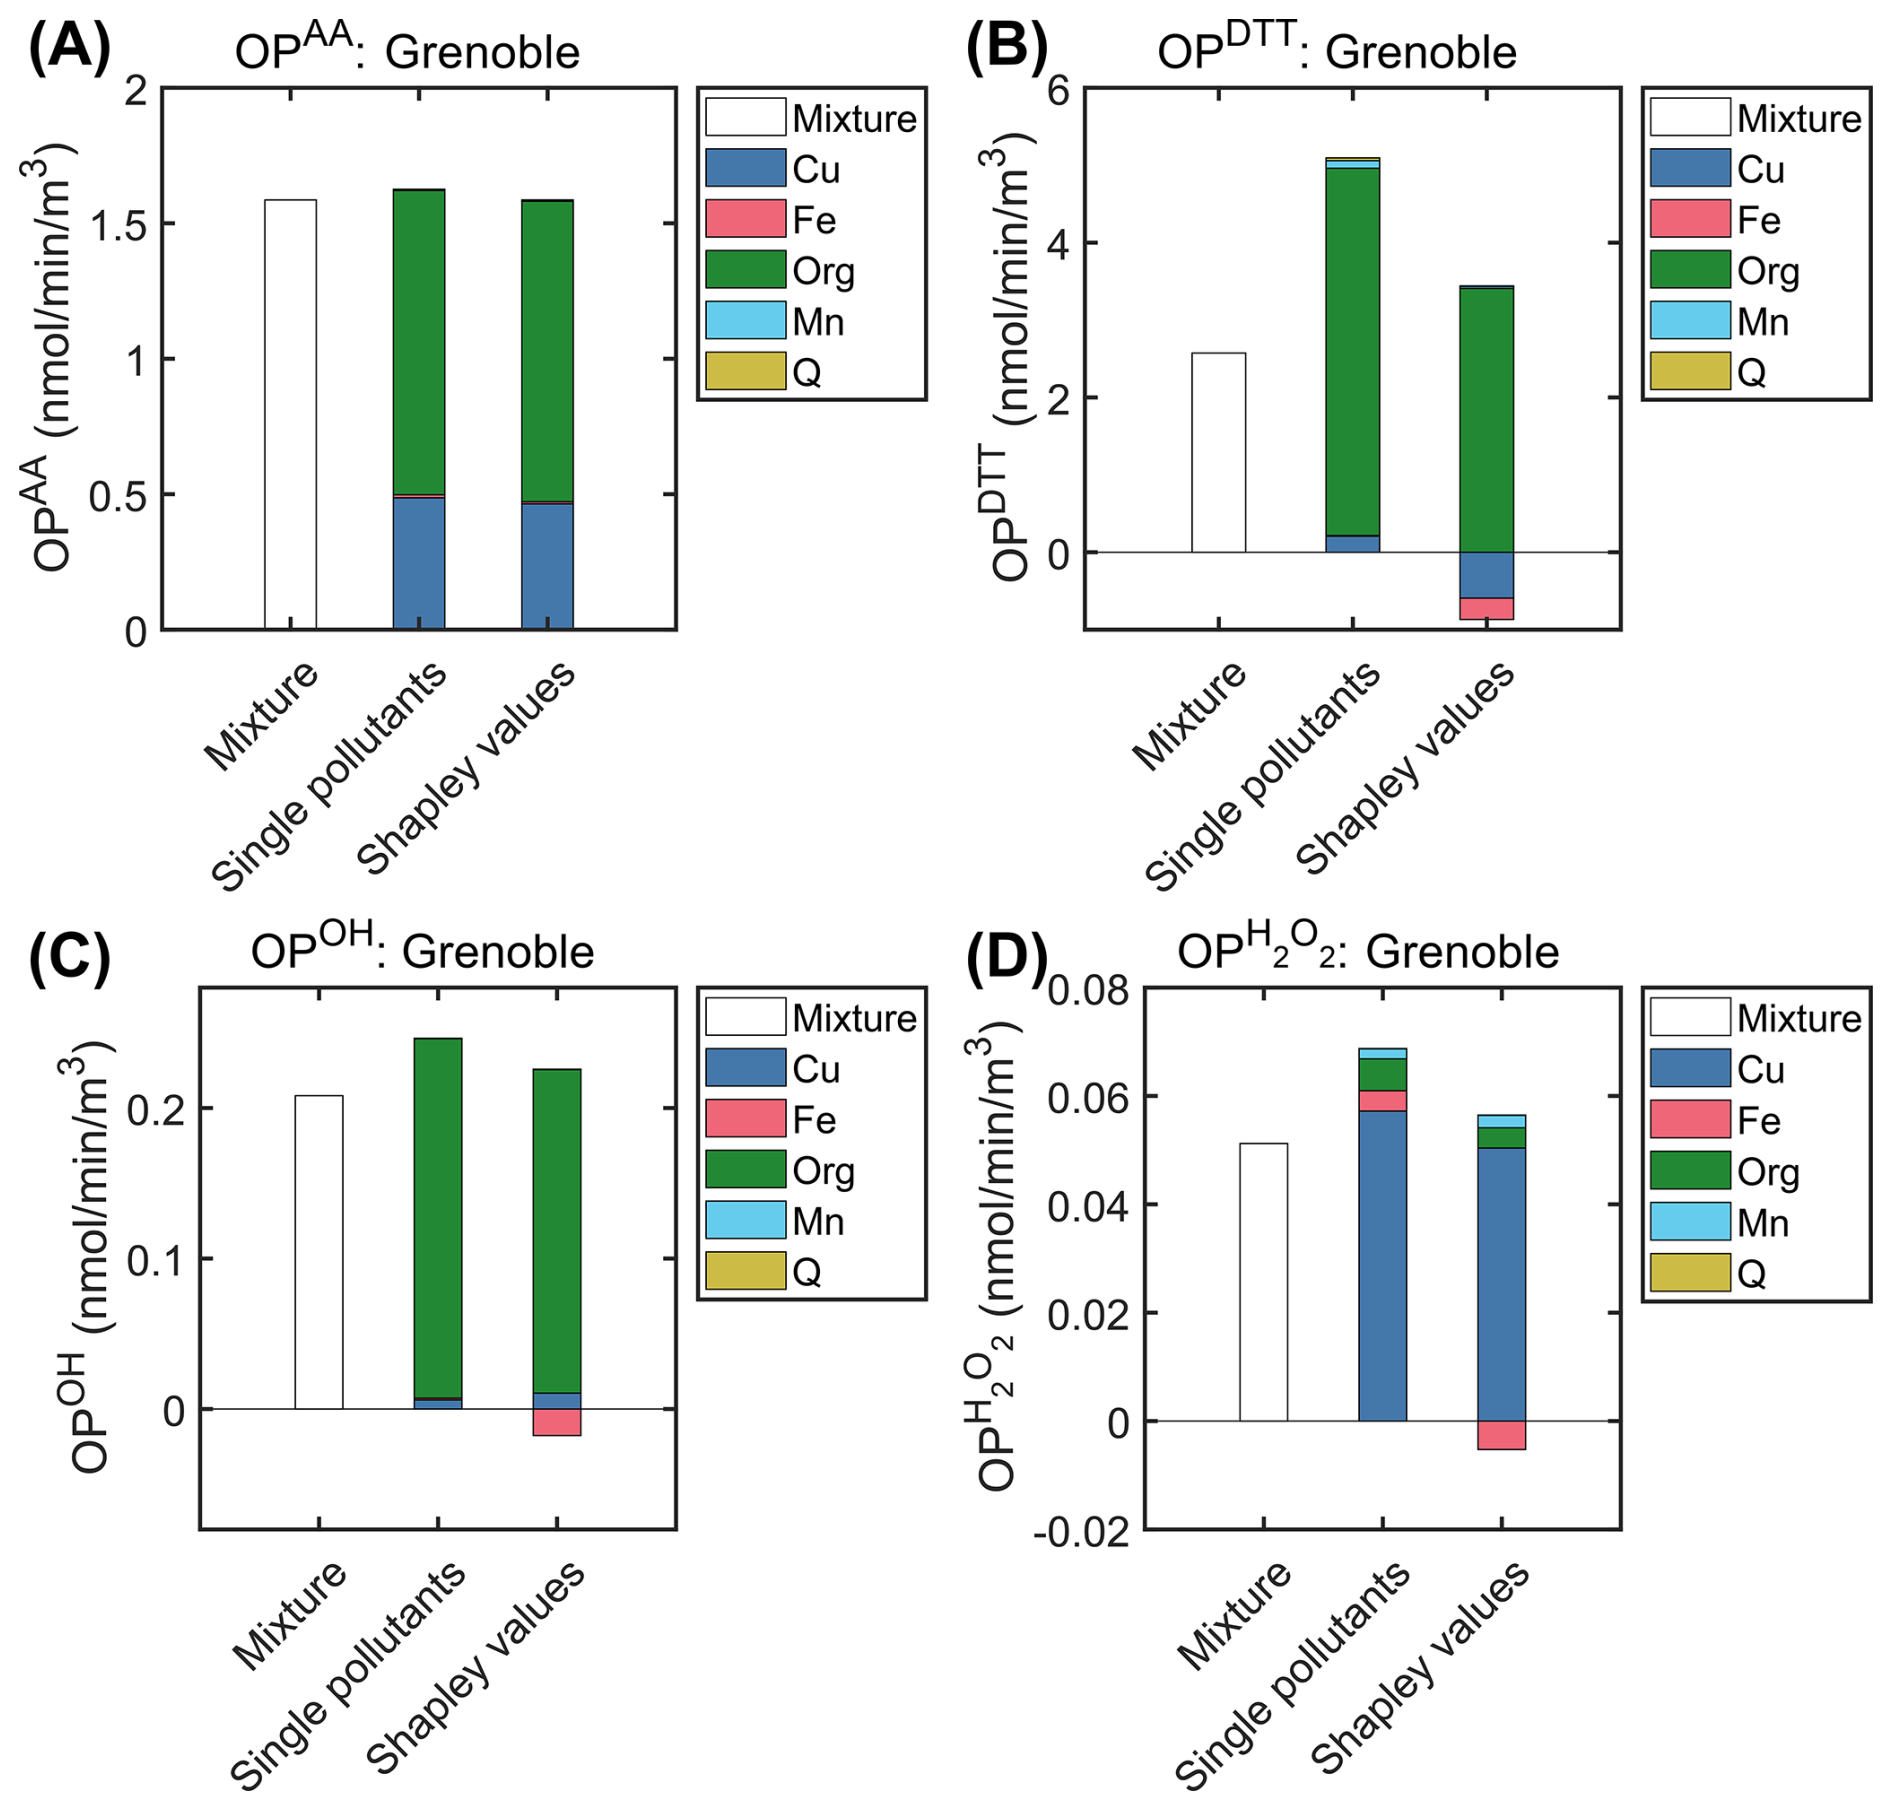
Figure 8Contributions of different PM constituents to OPAA (A), OPDTT (B), OPOH (C), and (D) in Grenoble. The “mixture” bar shows the model result when all species are included in the model. The “single pollutants” bar sums the result of model simulations where only one specific species was included. The “Shapley values” bar is calculated using the Shapley method (Shapley, 1953).
Figure 8B shows the contribution of PM constituents towards OPDTT. We find that organics contribute most to OP, consistent with previous studies that identified organic compounds as strongly correlated with DTT loss (Tuet et al., 2017; Fang et al., 2015; Lu et al., 2014). Cu alone contributes to OP, in line with previous laboratory studies (Charrier and Anastasio, 2012; Pietrogrande et al., 2019; Lin and Yu, 2019). However, as indicated by the negative Shapley values, the presence of both Fe and Cu lowers OP in the mixture. Notably, the Shapley value for organics is smaller than its contribution as a single pollutant. This is due to the interaction with metals as shown by negative values for the respective second-order Shapley interactions in Fig. S19B. Mechanistically, this is caused by the oxidation of to O2 by Cu(II) and Fe(III), (Table S1, Reactions SR21, SR40), leading to removal of ROS (Fig. S25). This is in line with Yu et al. (2018), who show antagonistic effects of Cu and Fe towards OPDTT in mixtures with humic-like substances and Samake et al. (2017), who show antagonistic effects of Cu in mixture with bioaerosols.
Figure 8C shows the normalized contribution of PM constituents towards OPOH in Grenoble. We find that organics is a major contributor to OPOH, through peroxide decomposition pathway (Tong et al., 2016), while Cu shows only a minor contribution (Figs. 8c and S26). Fe can show a negative contribution to OPOH as indicated by a negative second-order Shapley interaction with organics (Fig. S19C). The negative contribution from Fe is especially pronounced using the PM composition typical for Paris (Figs. S16C and S20C). Individually, both Fe and organics contribute to OPOH through Fenton chemistry (Reaction R13) and peroxide decomposition (Reaction R25), respectively. The antagonistic interactions between the PM components can be understood by considering the Fenton-like reaction of ROOH and Fe(II) to RO• (Reaction R34). This reaction is a large sink of both organics and Fe(II) that does not lead to the formation •OH (Figs. S27 and S28), since the reaction of ROOH with Fe(II) preferentially generates RO• (Reaction R34) over •OH (Reaction R35) as radical species (Campbell et al., 2023). Hence, the presence of organics lowers the •OH yield from Reaction (R13) and Fe lowers the •OH yield from Reaction (R25).
These results highlight the importance of capturing reactant interactions, as they can have either synergistic or antagonistic effects in different OP assays. In general, we find that second-order interactions between the pollutants can be of a similar order of magnitude as the first-order effects, while third-order effects are only about 10 % in magnitude of the first-order effects. We note that there may also be synergistic interactions between organics and Fe as a result of Fe-organic complex formation (Yu et al., 2018), which may have a higher rate coefficient for the Fenton reaction than that used in this study (Gonzalez et al., 2017). Nonetheless, the rate coefficient derived in this study is based on experiments containing Fe and citric acid, which form Fe-citrate complexes that likely react faster than free Fe ions (Rush and Koppenol, 1990; Gonzalez et al., 2017).
Figure 8D shows the normalized contribution of PM constituents towards of PM typical for Grenoble. We find that Cu is a major contributor to in the model, while Mn plays a minor role. Although Cu strongly enhances H2O2 production, its contribution to OPAA and OPDTT is small because the reaction of H2O2 with AA and DTT is relatively slow. In contrast, SOA contributes significantly to the production of •OH, which reacts rapidly with AA and DTT. Fe contributes negatively to in mixtures across all locations considered in this study (Figs. S19D, S20D, S21D, and S22D). As shown in Fig. 3b earlier, Fe can react with H2O2 through the Fenton reaction leading to a low steady-state concentration of H2O2, and hence a lowering the OP.
Due to the absence of data on the water-soluble fractions of metals at the London sites, we performed a sensitivity analysis by varying Fe and Cu solubilities within a factor of two (Figs. S29 and S30). The sensitivity analysis shows that, while OPDHA and are influenced by metal solubility, OPDTT and OPOH were less affected (Figs. S31 and S32).
Figure 9A uses the average chemical composition at the Grenoble, Paris, and London sites to compare the model results for the various OP assays. Overall, OP values modeled for the French sites are higher than those modeled for London, both during winter and summer. In the French data sets, the concentrations of organics and Cu are on average higher compared to London (Table 1), and are strong drivers of OP in the model (Figs. 8, S16, S17, and S18). Accordingly, the model predicts similar OP values in Paris and Grenoble due to very similar organics and Cu concentrations. In contrast, Fe concentrations are higher in London during summer, which leads to a slightly higher OPAA compared to OPDTT since Fe has a strong negative contribution to OPDTT. Note that Fig. 9A compares data from two different time periods, with the London data being much more recent, and cannot be used to infer the current state of air pollution at the different sites.
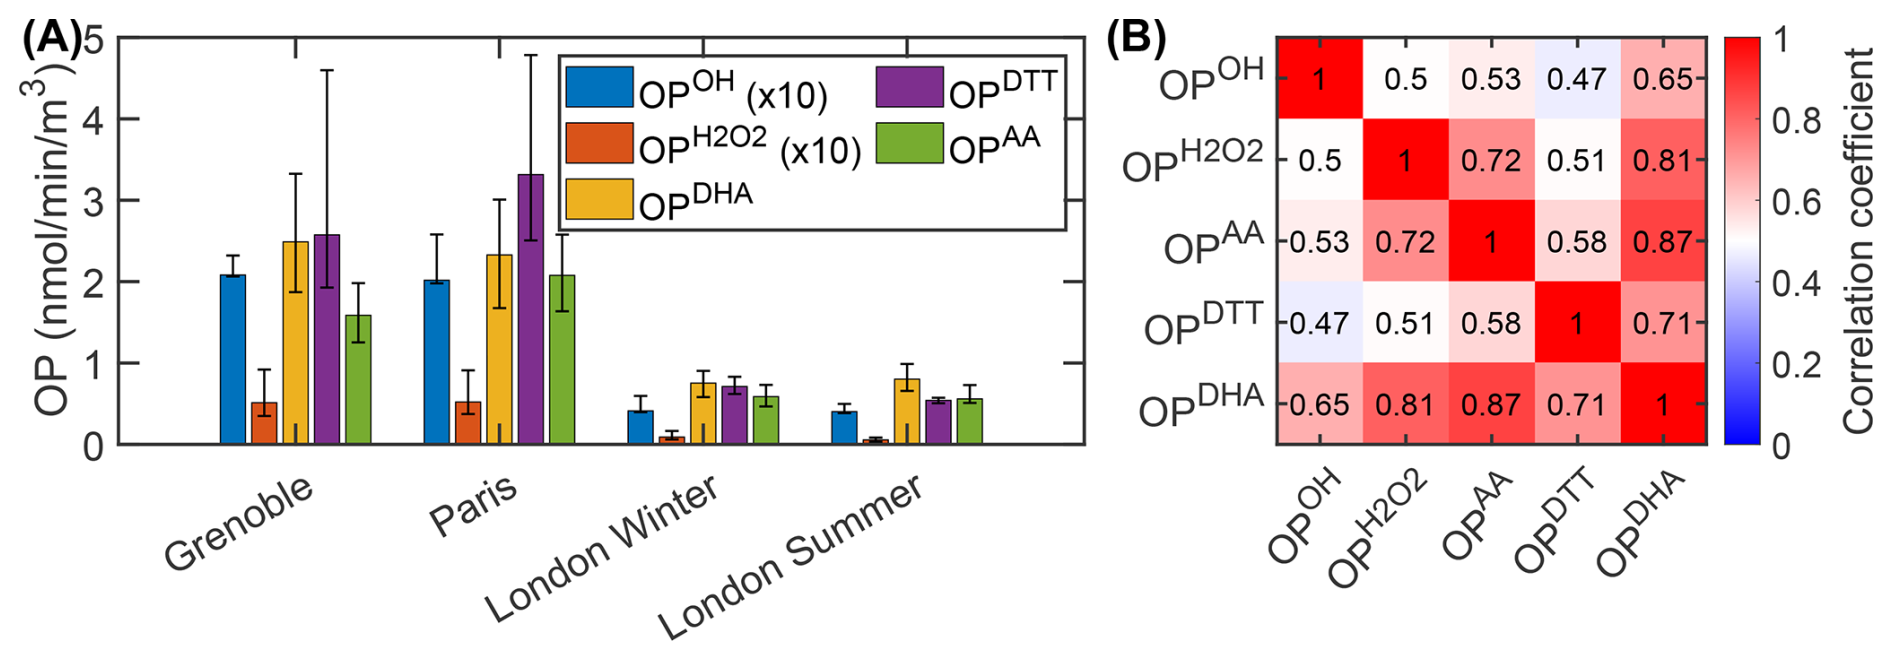
Figure 9Comparison and correlation of different simulated OP assays. (A) Simulations of different OP assays explored in this study using average chemical composition data from measurements in Grenoble, Paris and London (Table 1). OPOH and results are multiplied by 10. The error bars indicate the maximum and minimum values from the ensemble fits. (B) Pearson correlation matrix between intrinsic OP assays explored in this study using data from all study sites.
Figure 9B shows the correlations between the different intrinsic (mass-normalized) OP assays simulated in the study. To obtain the correlation coefficients, intrinsic OP is calculated for the composition data from all locations. We find that OPAA, OPDHA, and OPDTT generally correlate well with OPOH. Nonetheless, the correlation of OPOH with OPDTT is slightly lower than that of OPOH with OPAA, or OPOH with OPDHA. The weaker correlation of OPOH with OPDTT reflects the additional DTT loss pathways not directly linked to ROS production, such as the formation of Cu(II)–DTT complexes, which constitute a sink for DTT in the model. Correlations at individual locations are shown in Figs. S33–S36. At these single locations, the correlation between OPOH and OPAA, OPDHA, and OPDTT is higher than the correlation in the full data set (Fig. 9B). This is because PM composition can be fairly similar at one site, but may differ strongly across sites (Table 1). In France, OPOH, OPDTT, and OPAA simulated in the model are primarily driven by organics, and to a lesser extent Cu. In contrast, in London, OPDHA is also driven by Fe. The simulation results indicate that the differences in OP assays are exacerbated by larger differences in aerosol composition.
shows a lower correlation with OPOH. This can be understood by considering the sensitivities to aerosol components investigated above (Figs. 8, S15, S16, and S17): while the majority of the OP assays are driven by organics, is mostly influenced by the presence of Cu. We find negative contribution of Fe to . Note that, while the model was trained on •OH and H2O2 formation data from the laboratory, a validation of model-predicted OPOH or with field data was not conducted due to the lack of datasets combining detailed PM composition with OP measurements.
In this study, we develop a chemical kinetics model of aerosol oxidative potential, KM-OP, to quantify the effects of particulate pollutants on the production of ROS (•OH, H2O2) and the depletion of ascorbic acid (OPAA, OPDHA), and dithiothreitol (OPDTT). We performed detailed kinetic modeling on a large set of laboratory data from various OP assays to infer the optimal kinetic model parameters. For the first time, a model with a single kinetic parameter set leads to good agreement with such a large set of laboratory data. Previously, fits had only been obtained for single datasets (Campbell et al., 2023; Expósito et al., 2024). The global optimization approach used in this study ensures the general applicability and robustness of the model. Remaining deviations between model and experiment may either be due to simplifying assumptions of the model or due to disagreement of data from different sources. We expect that, as more data sets will be added to the training data set, the model will lean towards a consensus of all data, and may be used to identify differing and potentially inaccurate data sets. We extrapolate the findings from the laboratory experiments to field data from urban sites including detailed PM chemical composition. We find a good agreement between the model and field data at the two French measurement sites. Moreover, the model captures the overall magnitude of OP at the London sites.
Dominutti et al. (2025) recently highlighted the lack of harmonization and robustness of OP assays. In contrast, protocols for the chemical analysis of PM composition have been long established (Pan et al., 2022). The utility of the newly developed KM-OP in this context is illustrated in Fig. 10. KM-OP can predict OP and assess associations with PM health effects using only chemical composition data. The importance of integrating PM chemical composition into epidemiological health assessments when developing new regulatory metrics has been recently emphasized (El Haddad et al., 2024). KM-OP may provide such a link between PM composition and public health outcomes.
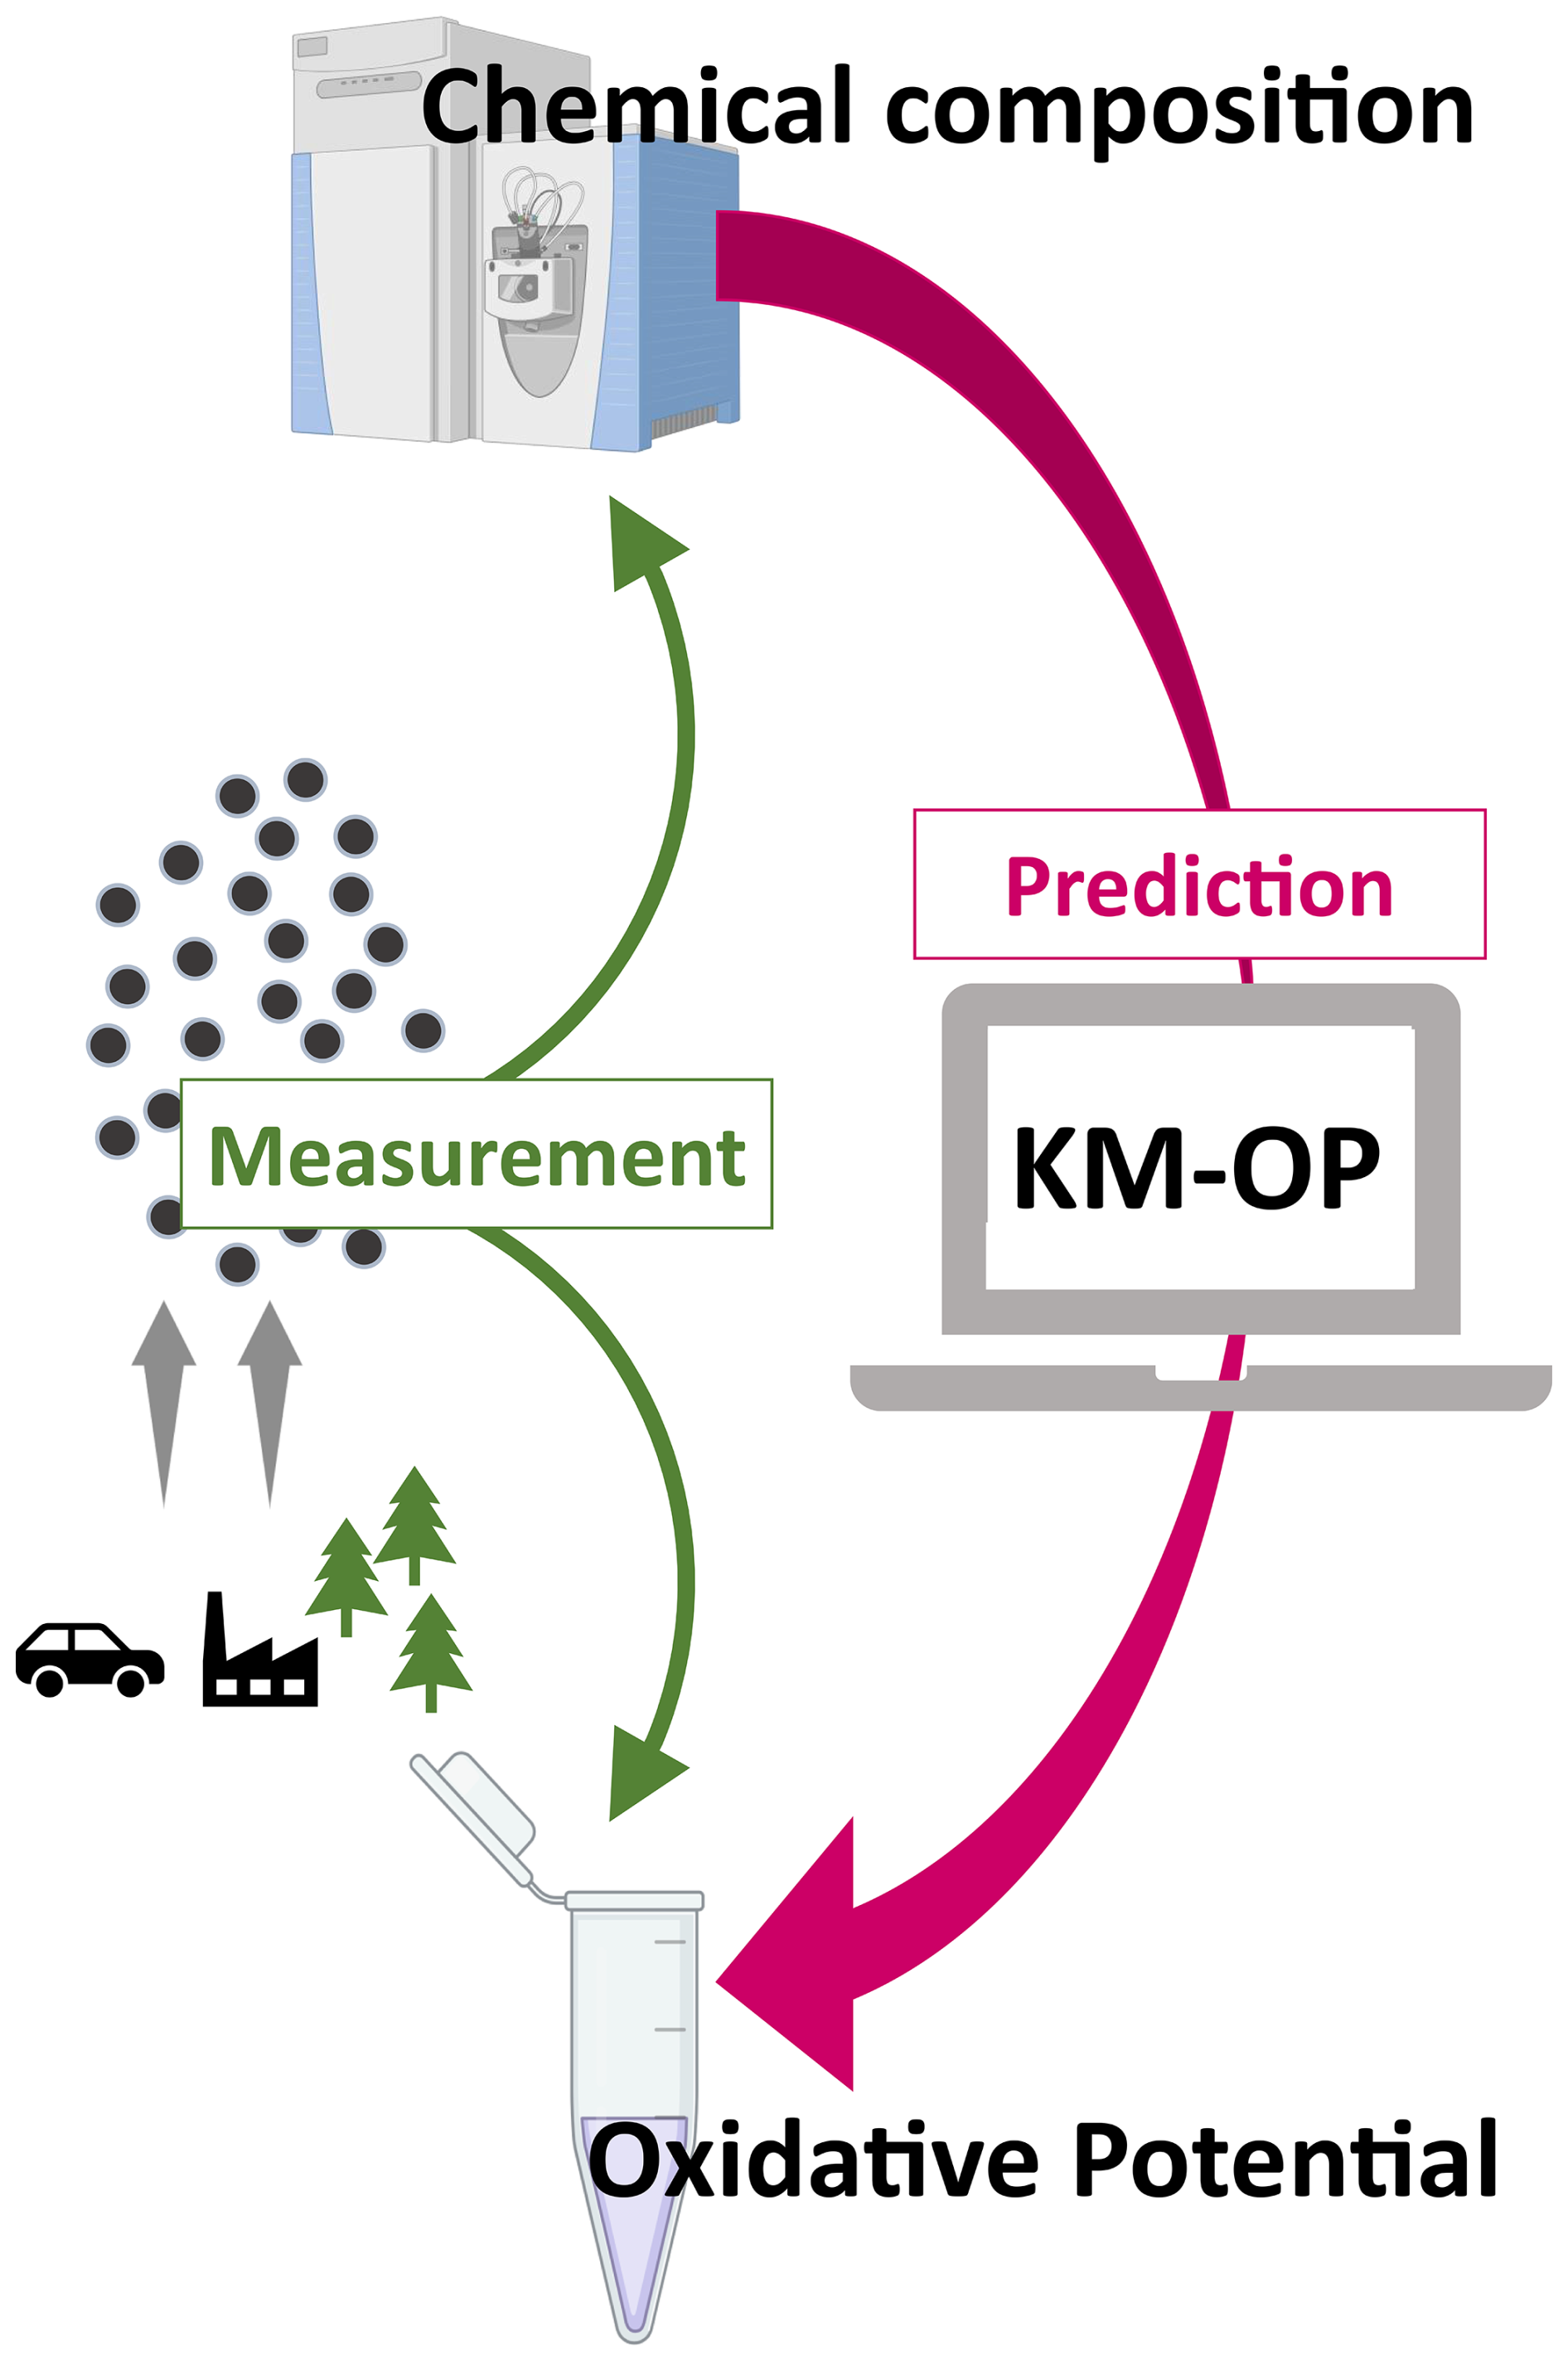
Figure 10Implications of the KM-OP model. Measurements of chemical composition and OP of ambient PM are common. OP cannot be predicted from measurements of chemical composition alone, however the newly developed KM-OP is able to predict OP when chemical composition data are available.
Antioxidant-depleting assays are generally not specific to certain ROS (Bates et al., 2019) and ROS such as and H2O2 are ubiquitous in the lung lining fluid (Fang et al., 2022; Dovrou et al., 2023; Mishra et al., 2023). The presence of ROS alone does not indicate the presence of oxidative distress because the human body possesses many systems that establish and maintain redox homeostasis (Sies, 2017, 2021). Likewise, previous studies have suggested that PM health effects may not be driven by the production of H2O2, but rather by its conversion into the •OH radical, which reacts much more quickly and often irreversibly with biomolecules (Lelieveld et al., 2021; Dovrou et al., 2023; Mishra et al., 2023). Thus, correlation with H2O2 formation may not be a sufficient property of OP assays to capture the health effects of PM, while assays that correlate well with •OH formation may be more suitable. Furthermore, while some PM components efficiently generate ROS, others are more effective at depleting antioxidants or their surrogates (Xiong et al., 2017). Our model results indicate that most OP assays are well correlated with OPOH. Using the kinetic model, we find that OPDTT is primarily driven by organics, while OPOH, OPAA and OPDHA are also influenced by Fe and Cu. Organics only has a marginal effect on , which we find to be strongly associated with Cu and also affected by Mn and quinones. Interestingly, while both OPOH and OPDTT are affected by organics, the correlation between the two assays is lower (R2=0.7) than the correlation between OPOH and OPAA or between OPOH and OPDHA (). This is because some reactive species that originate from the dissolution of organics, such as RO•, react with antioxidants, but are not captured by the •OH assay in the model. Consequently, experimental techniques that capture other radicals in addition to the •OH, such as the EPR, may be particularly useful.
The KM-OP model is calibrated using laboratory data from simple systems and not all synergistic and antagonistic interactions between PM components may be captured by the model. Thus, further experimental studies under controlled laboratory conditions are needed to reduce model uncertainty regarding the interaction of pollutants within the assay, such as mixtures of transition metals. These experiments could encompass substances not yet introduced in KM-OP, such as Zn (Charrier and Anastasio, 2012), elemental carbon, nitro-PAHs (Xia et al., 2013), nitrophenols (Khan et al., 2022), other quinones including p-phenylenediamine-derived quinones (Wang et al., 2022), other oxygenated aromatics (Fang et al., 2024; Wang et al., 2018), and chelating organics. Laboratory studies integrating the measurement of ROS production while simultaneously monitoring the decay of DTT or AA could be particularly helpful (Xiong et al., 2017; Shahpoury et al., 2024a).
This work confirms the large importance of OA for OP that was found in previous studies (Tuet et al., 2017; Daellenbach et al., 2020; Bhattu et al., 2024), however, uncertainties remain that should be addressed in future studies. Here, using total OA obtained in field measurements, with a focus on organic hydroperoxides as reactive species, and ascribing a single peroxide content for all types of OA resulted in a better agreement between field data and model results. The model could be improved by differentiating between types of OA, such as SOA, biomass burning aerosol, bioaerosol, etc and by adding other reactive organic compounds. For this, comprehensive kinetic experiments with different types of OA are needed. In particular, OP response may be affected by both SOA precursor identity (e.g., biogenic vs. anthropogenic) or the degree of SOA aging (Tuet et al., 2017; Antiñolo et al., 2015; Chowdhury et al., 2018), which is currently not represented in the model. The degree of oxygenation of organic compounds may not only affect their ability to produce ROS in aqueous solution directly, but may also influence the solubility of metals in the complex internal mixtures of PM in the atmosphere. Future studies should investigate how to infer and integrate such properties of OA from filter analysis. Furthermore, primary particles resulting from traffic or biomass burning will need to be deconvoluted from organics in the model through identification of components driving their redox chemistry. Ambient PM chemical characterization could include additional water soluble metals and chelating species, such as alcohols and amines. Additionally, incorporating heterogeneous surface chemistry of insoluble particles represents an important direction for future model development. Moreover, online OP assays may capture short-lived compounds that are not captured by filter-based assays. To obtain a kinetic model that can represent such short-lived compounds, it is pertinent to perform well-controlled laboratory experiments for model training under immediate dissolution and exposure of the sampled PM to probe species.
Future work will also include the extrapolation of the chemistry from OP assays into the chemical environment of the lung lining fluid, to translate assay-based OP into markers for physiological health endpoints, and to identify the assays that most closely correlate with markers of oxidative stress. Additionally, we plan to use chemical composition data from global models as inputs for KM-OP in order to predict and compare modeled OP with measurements of OP across the world.
Code and data are available upon request to the corresponding authors.
The supplement related to this article is available online at https://doi.org/10.5194/acp-26-10605-2026-supplement.
AM and TB designed research. AM and TB developed the model. AM performed kinetic model calculations. AM and MKr performed model sensitivity analyses. AM, SL, SJC, DS, GU, AA and TB curated data. SJC, DS, GML, ST, OF, NB, FL, LA, GU, JLJ, GIC, DCG, MP, AHT, AB and MKa provided field measurement data. AM, SL, MKr, SJC, DS, GU, BAMB, GL, UP, PS, AA and TB discussed results. AM and TB wrote the manuscript with input from all co-authors.
At least one of the (co-)authors is a member of the editorial board of Atmospheric Chemistry and Physics. The peer-review process was guided by an independent editor, and the authors also have no other competing interests to declare.
Publisher's note: Copernicus Publications remains neutral with regard to jurisdictional claims made in the text, published maps, institutional affiliations, or any other geographical representation in this paper. The authors bear the ultimate responsibility for providing appropriate place names. Views expressed in the text are those of the authors and do not necessarily reflect the views of the publisher.
AM, SL, and MKr were supported by the Max Planck Graduate Center with the Johannes Gutenberg-Universität Mainz (MPGC). This work was funded by the environmental research consortium MARKOPOLO under the HORIZON call HLTH-2024-ENVHLTH-02-06 (Grant Agreement Number 101156161) funded by the European Union and the Swiss State Secretariat for Education, Research and Innovation (SERI). Views and opinions expressed are however those of the author(s) only and do not necessarily reflect those of the European Union, or the European Health and Digital Executive Agency (HADEA) or the SERI. Neither the European Union nor the granting authorities can be held responsible for them. This work was also supported by the French Ministry of environment and the National reference laboratory for air quality monitoring in France (LCSQA). This work was also supported by the Schweizerischer Nationalfonds zur Förderung der Wissenschaftlichen Forschung (grant number 200021-228007). We thank Zhiqiang Zhang, Hyun Gu Kang, Lucia Iezzi, Nga Lee (Sally) Ng, Cort Anastasio, Karine Sartelet and Basil Landgren for helpful discussions and Jessica G. Charrier and Nga Lee (Sally) Ng for providing published data in tabulated form.
This research has been supported by the HORIZON EUROPE Health (grant no. 101156161), the Schweizerischer Nationalfonds zur Förderung der Wissenschaftlichen Forschung (grant no. 200021-228007), and NERC OSCA Grants (NE/T001909/2 and NE/T001984/1) as well as EPSRC grant EP/X030237/1.
The article processing charges for this open-access publication were covered by the Max Planck Society.
This paper was edited by Roya Bahreini and reviewed by three anonymous referees.
Abrams, J. Y., Weber, R. J., Klein, M., Samat, S. E., Chang, H. H., Strickland, M. J., Verma, V., Fang, T., Bates, J. T., Mulholland, J. A., Russell, A. G., and Tolbert, P. E.: Associations between Ambient Fine Particulate Oxidative Potential and Cardiorespiratory Emergency Department Visits, Environ. Health Persp., 125, 107008, https://doi.org/10.1289/EHP1545, 2017. a
Antiñolo, M., Willis, M. D., Zhou, S., and Abbatt, J. P.: Connecting the oxidation of soot to its redox cycling abilities, Nat. Commun., 6, 6812, https://doi.org/10.1038/ncomms7812, 2015. a, b
Ayres, J. G., Borm, P., Cassee, F. R., Castranova, V., Donaldson, K., Ghio, A., Harrison, R. M., Hider, R., Kelly, F., Kooter, I. M., Marano, F., Maynard, R. L., Mudway, I., Nel, A., Sioutas, C., Smith, S., Baeza-Squiban, A., Cho, A., Duggan, S., and Froines, J.: Evaluating the Toxicity of Airborne Particulate Matter and Nanoparticles by Measuring Oxidative Stress Potential – A Workshop Report and Consensus Statement, Inhal. Toxicol., 20, 75–99, https://doi.org/10.1080/08958370701665517, 2008. a, b
Bates, J. T., Weber, R. J., Abrams, J., Verma, V., Fang, T., Klein, M., Strickland, M. J., Sarnat, S. E., Chang, H. H., Mulholland, J. A., Tolbert, P. E., and Russell, A. G.: Reactive Oxygen Species Generation Linked to Sources of Atmospheric Particulate Matter and Cardiorespiratory Effects, Environ. Sci. Technol., 49, 13605–13612, https://doi.org/10.1021/acs.est.5b02967, 2015. a, b
Bates, J. T., Fang, T., Verma, V., Zeng, L., Weber, R. J., Tolbert, P. E., Abrams, J. Y., Sarnat, S. E., Klein, M., Mulholland, J. A., and Russell, A. G.: Review of Acellular Assays of Ambient Particulate Matter Oxidative Potential: Methods and Relationships with Composition, Sources, and Health Effects, Environ. Sci. Technol., 53, 4003–4019, https://doi.org/10.1021/acs.est.8b03430, 2019. a, b, c
Berkemeier, T., Ammann, M., Krieger, U. K., Peter, T., Spichtinger, P., Pöschl, U., Shiraiwa, M., and Huisman, A. J.: Technical note: Monte Carlo genetic algorithm (MCGA) for model analysis of multiphase chemical kinetics to determine transport and reaction rate coefficients using multiple experimental data sets, Atmos. Chem. Phys., 17, 8021–8029, https://doi.org/10.5194/acp-17-8021-2017, 2017. a, b
Berkemeier, T., Mishra, A., Mattei, C., Huisman, A. J., Krieger, U. K., and Pöschl, U.: Ozonolysis of Oleic Acid Aerosol Revisited: Multiphase Chemical Kinetics and Reaction Mechanisms, ACS Earth Space Chem., 5, 3313–3323, https://doi.org/10.1021/acsearthspacechem.1c00232, 2021. a
Bhattu, D., Tripathi, S. N., Bhowmik, H. S., Moschos, V., Lee, C. P., Rauber, M., Salazar, G., Abbaszade, G., Cui, T., Slowik, J. G., Vats, P., Mishra, S., Lalchandani, V., Satish, R., Rai, P., Casotto, R., Tobler, A., Kumar, V., Hao, Y., Qi, L., Khare, P., Manousakas, M. I., Wang, Q., Han, Y., Tian, J., Darfeuil, S., Minguillon, M. C., Hueglin, C., Conil, S., Rastogi, N., Srivastava, A. K., Ganguly, D., Bjelic, S., Canonaco, F., Schnelle-Kreis, J., Dominutti, P. A., Jaffrezo, J.-L., Szidat, S., Chen, Y., Cao, J., Baltensperger, U., Uzu, G., Daellenbach, K. R., El Haddad, I., and Prévôt, A. S. H.: Local incomplete combustion emissions define the PM2.5 oxidative potential in Northern India, Nat. Commun., 15, 3517, https://doi.org/10.1038/s41467-024-47785-5, 2024. a, b, c
Borlaza, L. J. S., Weber, S., Jaffrezo, J.-L., Houdier, S., Slama, R., Rieux, C., Albinet, A., Micallef, S., Trébluchon, C., and Uzu, G.: Disparities in particulate matter (PM10) origins and oxidative potential at a city scale (Grenoble, France) – Part 2: Sources of PM10 oxidative potential using multiple linear regression analysis and the predictive applicability of multilayer perceptron neural network analysis, Atmos. Chem. Phys., 21, 9719–9739, https://doi.org/10.5194/acp-21-9719-2021, 2021. a
Borm, P. J. A., Kelly, F., Künzli, N., Schins, R. P. F., and Donaldson, K.: Oxidant generation by particulate matter: from biologically effective dose to a promising, novel metric, Occup. Environ. Med., 64, 73, https://doi.org/10.1136/oem.2006.029090, 2007. a
Brauer, M., Roth, G. A., Aravkin, A. Y., et al.: Global burden and strength of evidence for 88 risk factors in 204 countries and 811 subnational locations, 1990–2021: a systematic analysis for the Global Burden of Disease Study 2021, Lancet, 403, 2162–2203, https://doi.org/10.1016/S0140-6736(24)00933-4, 2024. a
Calas, A., Uzu, G., Martins, J. M. F., Voisin, D., Spadini, L., Lacroix, T., and Jaffrezo, J.-L.: The importance of simulated lung fluid (SLF) extractions for a more relevant evaluation of the oxidative potential of particulate matter, Sci. Rep., 7, 11617, https://doi.org/10.1038/s41598-017-11979-3, 2017. a, b, c, d, e
Calas, A., Uzu, G., Kelly, F. J., Houdier, S., Martins, J. M. F., Thomas, F., Molton, F., Charron, A., Dunster, C., Oliete, A., Jacob, V., Besombes, J.-L., Chevrier, F., and Jaffrezo, J.-L.: Comparison between five acellular oxidative potential measurement assays performed with detailed chemistry on PM10 samples from the city of Chamonix (France), Atmos. Chem. Phys., 18, 7863–7875, https://doi.org/10.5194/acp-18-7863-2018, 2018. a, b, c
Camman, J., Chazeau, B., Marchand, N., Durand, A., Gille, G., Lanzi, L., Jaffrezo, J.-L., Wortham, H., and Uzu, G.: Oxidative potential apportionment of atmospheric PM1: a new approach combining high-sensitive online analysers for chemical composition and offline OP measurement technique, Atmos. Chem. Phys., 24, 3257–3278, https://doi.org/10.5194/acp-24-3257-2024, 2024. a
Campbell, S. J., Utinger, B., Lienhard, D. M., Paulson, S. E., Shen, J., Griffiths, P. T., Stell, A. C., and Kalberer, M.: Development of a Physiologically Relevant Online Chemical Assay To Quantify Aerosol Oxidative Potential, Anal. Chem., 91, 13088–13095, https://doi.org/10.1021/acs.analchem.9b03282, 2019. a, b, c
Campbell, S. J., Utinger, B., Barth, A., Paulson, S. E., and Kalberer, M.: Iron and Copper Alter the Oxidative Potential of Secondary Organic Aerosol: Insights from Online Measurements and Model Development, Environ. Sci. Technol., 57, 13546–13558, https://doi.org/10.1021/acs.est.3c01975, 2023. a, b, c, d, e, f, g, h
Campbell, S. J., Barth, A., Chen, G. I., Tremper, A. H., Priestman, M., Ek, D., Gu, S., Kelly, F. J., Kalberer, M., and Green, D. C.: High time resolution quantification of PM2.5 oxidative potential at a Central London roadside supersite, Environ. Int., 193, 109102, https://doi.org/10.1016/j.envint.2024.109102, 2024a. a, b, c
Campbell, S. J., La, C., Zhou, Q., Le, J., Galvez-Reyes, J., Banach, C., Houk, K. N., Chen, J. R., and Paulson, S. E.: Characterizing Hydroxyl Radical Formation from the Light-Driven Fe(II)–Peracetic Acid Reaction, a Key Process for Aerosol-Cloud Chemistry, Environ. Sci. Technol., 58, 7505–7515, https://doi.org/10.1021/acs.est.3c10684, 2024b. a
Campbell, S. J., Utinger, B., Barth, A., Leni, Z., Zhang, Z.-H., Resch, J., Li, K., Steimer, S. S., Banach, C., Gfeller, B., Wragg, F. P. H., Westwood, J., Wolfer, K., Bukowiecki, N., Ihalainen, M., Yli-Pirilä, P., Somero, M., Kortelainen, M., Louhisalmi, J., Sklorz, M., Czech, H., di Bucchianico, S., Streibel, T., Delaval, M. N., Ruger, C., Baumlin, N., Salathe, M., Fang, Z., Pardo, M., D'Aronco, S., Giorio, C., Shi, Z., Harrison, R. M., Green, D. C., Kelly, F. J., Rudich, Y., Paulson, S. E., Sippula, O., Zimmermann, R., Geiser, M., and Kalberer, M.: Short-lived reactive components substantially contribute to particulate matter oxidative potential, Sci. Adv., 11, eadp8100, https://doi.org/10.1126/sciadv.adp8100, 2025. a, b, c, d
Campbell, S. J., Barth, A., Mishra, A., Chen, G. I., Punter, P. B., Tremper, A. H., Voliotis, A., Alfosea-Simon, M., Priestman, M., Kelly, F. J., Berkemeier, T., Kalberer, M., and Green, C. D.: Dynamic Episodes of Elevated PM2.5 Oxidative Potential Driven by Wood Burning Emissions and Firework Activity in Suburban London, in preparation, 2026. a, b
Carlino, A., Romano, M. P., Lionetto, M. G., Contini, D., and Guascito, M. R.: An Overview of the Automated and On-Line Systems to Assess the Oxidative Potential of Particulate Matter, Atmosphere, 14, https://doi.org/10.3390/atmos14020256, 2023. a
Charrier, J. G. and Anastasio, C.: On dithiothreitol (DTT) as a measure of oxidative potential for ambient particles: evidence for the importance of soluble transition metals, Atmos. Chem. Phys., 12, 9321–9333, https://doi.org/10.5194/acp-12-9321-2012, 2012. a, b, c, d, e, f, g, h, i, j, k, l, m, n, o
Charrier, J. G. and Anastasio, C.: Rates of Hydroxyl Radical Production from Transition Metals and Quinones in a Surrogate Lung Fluid, Environ. Sci. Technol., 49, 9317–9325, https://doi.org/10.1021/acs.est.5b01606, 2015. a, b, c, d
Charrier, J. G., McFall, A. S., Richards-Henderson, N. K., and Anastasio, C.: Hydrogen Peroxide Formation in a Surrogate Lung Fluid by Transition Metals and Quinones Present in Particulate Matter, Environ. Sci. Technol., 48, 7010–7017, https://doi.org/10.1021/es501011w, 2014. a, b, c, d, e, f
Charrier, J. G., Richards-Henderson, N. K., Bein, K. J., McFall, A. S., Wexler, A. S., and Anastasio, C.: Oxidant production from source-oriented particulate matter – Part 1: Oxidative potential using the dithiothreitol (DTT) assay, Atmos. Chem. Phys., 15, 2327–2340, https://doi.org/10.5194/acp-15-2327-2015, 2015. a, b
Charrier, J. G., McFall, A. S., Vu, K. K.-T., Baroi, J., Olea, C., Hasson, A., and Anastasio, C.: A bias in the “mass-normalized” DTT response – An effect of non-linear concentration-response curves for copper and manganese, Atmos. Environ., 144, 325–334, https://doi.org/10.1016/j.atmosenv.2016.08.071, 2016. a
Cheung, K. L., Polidori, A., Ntziachristos, L., Tzamkiozis, T., Samaras, Z., Cassee, F. R., Gerlofs, M., and Sioutas, C.: Chemical Characteristics and Oxidative Potential of Particulate Matter Emissions from Gasoline, Diesel, and Biodiesel Cars, Environ. Sci. Technol., 43, 6334–6340, https://doi.org/10.1021/es900819t, 2009. a
Chevallier, E., Jolibois, R., Meunier, N., Carlier, P., and Monod, A.: “Fenton-like” reactions of methylhydroperoxide and ethylhydroperoxide with Fe2+ in liquid aerosols under tropospheric conditions, Atmos. Environ., 38, 921–933, https://doi.org/10.1016/j.atmosenv.2003.10.027, 2004. a
Cho, A. K., Sioutas, C., Miguel, A. H., Kumagai, Y., Schmitz, D. A., Singh, M., Eiguren-Fernandez, A., and Froines, J. R.: Redox activity of airborne particulate matter at different sites in the Los Angeles Basin, Environ. Res., 99, 40–47, https://doi.org/10.1016/j.envres.2005.01.003, 2005. a, b
Chowdhury, P. H., He, Q., Lasitza Male, T., Brune, W. H., Rudich, Y., and Pardo, M.: Exposure of Lung Epithelial Cells to Photochemically Aged Secondary Organic Aerosol Shows Increased Toxic Effects, Environ. Sci. Tech. Let., 5, 424–430, https://doi.org/10.1021/acs.estlett.8b00256, 2018. a, b, c
Cohen, A. J., Brauer, M., Burnett, R., Anderson, H. R., Frostad, J., Estep, K., Balakrishnan, K., Brunekreef, B., Dandona, L., Dandona, R., Feigin, V., Freedman, G., Hubbell, B., Jobling, A., Kan, H., Knibbs, L., Liu, Y., Martin, R., Morawska, L., Pope, III, C. A., Shin, H., Straif, K., Shaddick, G., Thomas, M., van Dingenen, R., van Donkelaar, A., Vos, T., Murray, C. J. L., and Forouzanfar, M. H.: Estimates and 25-year trends of the global burden of disease attributable to ambient air pollution: an analysis of data from the Global Burden of Diseases Study 2015, Lancet, 389, 1907–1918, https://doi.org/10.1016/S0140-6736(17)30505-6, 2017. a
Connell, D. P., Winter, S. E., Conrad, V. B., Kim, M., and Crist, K. C.: The Steubenville Comprehensive Air Monitoring Program (SCAMP): Concentrations and Solubilities of PM2.5 Trace Elements and Their Implications for Source Apportionment and Health Research, J. Air Waste Manage., 56, 1750–1766, https://doi.org/10.1080/10473289.2006.10464580, 2006. a
Daellenbach, K. R., Uzu, G., Jiang, J., Cassagnes, L.-E., Leni, Z., Vlachou, A., Stefenelli, G., Canonaco, F., Weber, S., Segers, A., Kuenen, J. J. P., Schaap, M., Favez, O., Albinet, A., Aksoyoglu, S., Dommen, J., Baltensperger, U., Geiser, M., El Haddad, I., Jaffrezo, J.-L., and Prévôt, A. S. H.: Sources of particulate-matter air pollution and its oxidative potential in Europe, Nature, 587, 414–419, https://doi.org/10.1038/s41586-020-2902-8, 2020. a, b, c, d, e
Docherty, K. S., Wu, W., Lim, Y. B., and Ziemann, P. J.: Contributions of Organic Peroxides to Secondary Aerosol Formed from Reactions of Monoterpenes with O3, Environ. Sci. Technol., 39, 4049–4059, https://doi.org/10.1021/es050228s, 2005. a, b, c
Dockery, D. W., Pope, C. A., Xu, X., Spengler, J. D., Ware, J. H., Fay, M. E., Ferris, B. G., and Speizer, F. E.: An Association between Air Pollution and Mortality in Six US Cities, New Engl. J. Med., 329, 1753–1759, https://doi.org/10.1056/NEJM199312093292401, 1993. a
Dominutti, P. A., Jaffrezo, J.-L., Marsal, A., Mhadhbi, T., Elazzouzi, R., Rak, C., Cavalli, F., Putaud, J.-P., Bougiatioti, A., Mihalopoulos, N., Paraskevopoulou, D., Mudway, I., Nenes, A., Daellenbach, K. R., Banach, C., Campbell, S. J., Cigánková, H., Contini, D., Evans, G., Georgopoulou, M., Ghanem, M., Glencross, D. A., Guascito, M. R., Herrmann, H., Iram, S., Jovanović, M., Jovašević-Stojanović, M., Kalberer, M., Kooter, I. M., Paulson, S. E., Patel, A., Perdrix, E., Pietrogrande, M. C., Mikuška, P., Sauvain, J.-J., Seitanidi, K., Shahpoury, P., Souza, E. J. d. S., Steimer, S., Stevanovic, S., Suarez, G., Subramanian, P. S. G., Utinger, B., van Os, M. F., Verma, V., Wang, X., Weber, R. J., Yang, Y., Querol, X., Hoek, G., Harrison, R. M., and Uzu, G.: An interlaboratory comparison to quantify oxidative potential measurement in aerosol particles: challenges and recommendations for harmonisation, Atmos. Meas. Tech., 18, 177–195, https://doi.org/10.5194/amt-18-177-2025, 2025. a, b
Donaldson, K., Stone, V., Seaton, A., and MacNee, W.: Ambient particle inhalation and the cardiovascular system: potential mechanisms., Environ. Health Persp., 109, 523–527, https://doi.org/10.1289/ehp.01109s4523, 2001. a
Dovrou, E., Lelieveld, S., Mishra, A., Pöschl, U., and Berkemeier, T.: Influence of ambient and endogenous H2O2 on reactive oxygen species concentrations and OH radical production in the respiratory tract, Environ. Sci.: Atmos., https://doi.org/10.1039/D2EA00179A, 2023. a, b
El Haddad, I., Vienneau, D., Daellenbach, K. R., Modini, R., Slowik, J. G., Upadhyay, A., Vasilakos, P. N., Bell, D., de Hoogh, K., and Prevot, A. S. H.: Opinion: How will advances in aerosol science inform our understanding of the health impacts of outdoor particulate pollution?, Atmos. Chem. Phys., 24, 11981–12011, https://doi.org/10.5194/acp-24-11981-2024, 2024. a
Expósito, A., Maillo, J., Uriarte, I., Santibáñez, M., and Fernández-Olmo, I.: Kinetics of ascorbate and dithiothreitol oxidation by soluble copper, iron, and manganese, and 1,4-naphthoquinone: Influence of the species concentration and the type of fluid, Chemosphere, 361, 142435, https://doi.org/10.1016/j.chemosphere.2024.142435, 2024. a, b, c, d, e, f, g, h, i, j, k
Fang, T., Verma, V., Guo, H., King, L. E., Edgerton, E. S., and Weber, R. J.: A semi-automated system for quantifying the oxidative potential of ambient particles in aqueous extracts using the dithiothreitol (DTT) assay: results from the Southeastern Center for Air Pollution and Epidemiology (SCAPE), Atmos. Meas. Tech., 8, 471–482, https://doi.org/10.5194/amt-8-471-2015, 2015. a, b, c, d, e
Fang, T., Zeng, L., Gao, D., Verma, V., Stefaniak, A. B., and Weber, R. J.: Ambient Size Distributions and Lung Deposition of Aerosol Dithiothreitol-Measured Oxidative Potential: Contrast between Soluble and Insoluble Particles, Environ. Sci. Technol., 51, 6802–6811, https://doi.org/10.1021/acs.est.7b01536, 2017. a
Fang, T., Lakey, P. S. J., Weber, R. J., and Shiraiwa, M.: Oxidative Potential of Particulate Matter and Generation of Reactive Oxygen Species in Epithelial Lining Fluid, Environ. Sci. Technol., 53, 12784–12792, https://doi.org/10.1021/acs.est.9b03823, 2019. a
Fang, T., Huang, Y.-K., Wei, J., Monterrosa Mena, J. E., Lakey, P. S. J., Kleinman, M. T., Digman, M. A., and Shiraiwa, M.: Superoxide Release by Macrophages through NADPH Oxidase Activation Dominating Chemistry by Isoprene Secondary Organic Aerosols and Quinones to Cause Oxidative Damage on Membranes, Environ. Sci. Technol., 56, 17029–17038, https://doi.org/10.1021/acs.est.2c03987, 2022. a
Fang, Z., Lai, A., Cai, D., Li, C., Carmieli, R., Chen, J., Wang, X., and Rudich, Y.: Secondary Organic Aerosol Generated from Biomass Burning Emitted Phenolic Compounds: Oxidative Potential, Reactive Oxygen Species, and Cytotoxicity, Environ. Sci. Technol., 58, 8194–8206, https://doi.org/10.1021/acs.est.3c09903, 2024. a
Farahani, V. J., Altuwayjiri, A., Pirhadi, M., Verma, V., Ruprecht, A. A., Diapouli, E., Eleftheriadis, K., and Sioutas, C.: The oxidative potential of particulate matter (PM) in different regions around the world and its relation to air pollution sources, Environ. Sci.: Atmos., 2, 1076–1086, https://doi.org/10.1039/D2EA00043A, 2022. a
Font, A., F. de Brito, J., Riffault, V., Conil, S., Jaffrezo, J.-L., and Bourin, A.: Calculations of the conversion factor from organic carbon to organic matter for aerosol mass balance, Atmos. Pollut. Res., 15, 102301, https://doi.org/10.1016/j.apr.2024.102301, 2024. a, b
Frezzini, M. A., De Francesco, N., Massimi, L., and Canepari, S.: Effects of operating conditions on PM oxidative potential assays, Atmos. Environ., 268, 118802, https://doi.org/10.1016/j.atmosenv.2021.118802, 2022. a
Fuller, S., Wragg, F., Nutter, J., and Kalberer, M.: Comparison of on-line and off-line methods to quantify reactive oxygen species (ROS) in atmospheric aerosols, Atmos. Environ., 92, 97–103, https://doi.org/10.1016/j.atmosenv.2014.04.006, 2014. a
Gao, D., Godri Pollitt, K. J., Mulholland, J. A., Russell, A. G., and Weber, R. J.: Characterization and comparison of PM2.5 oxidative potential assessed by two acellular assays, Atmos. Chem. Phys., 20, 5197–5210, https://doi.org/10.5194/acp-20-5197-2020, 2020a. a
Gao, D., Ripley, S., Weichenthal, S., and Godri Pollitt, K. J.: Ambient particulate matter oxidative potential: Chemical determinants, associated health effects, and strategies for risk management, Free Radical Bio. Med., 151, 7–25, https://doi.org/10.1016/j.freeradbiomed.2020.04.028, 2020b. a, b, c, d
Giorio, C., Borca, C. N., Zherebker, A., D'Aronco, S., Saidikova, M., Sheikh, H. A., Harrison, R. J., Badocco, D., Soldà, L., Pastore, P., Ammann, M., and Huthwelker, T.: Iron Speciation in Urban Atmospheric Aerosols: Comparison between Thermodynamic Modeling and Direct Measurements, ACS Earth Space Chem., 9, 649–661, https://doi.org/10.1021/acsearthspacechem.4c00359, 2025. a
Gonzalez, D. H., Cala, C. K., Peng, Q., and Paulson, S. E.: HULIS Enhancement of Hydroxyl Radical Formation from Fe(II): kinetics of Fulvic Acid–Fe(II) Complexes in the Presence of Lung Antioxidants, Environ. Sci. Technol., 51, 7676–7685, https://doi.org/10.1021/acs.est.7b01299, 2017. a, b, c
Gonzalez, D. H., Kuang, X. M., Scott, J. A., Olimpio Rocha, G., and Paulson, S. E.: Terephthalate Probe for Hydroxyl Radicals: Yield of 2-Hydroxyterephthalic Acid and Transition Metal Interference, Anal. Lett., 51, 2488–2497, https://doi.org/10.1080/00032719.2018.1431246, 2018. a
Gonzalez, D. H., Diaz, D. A., Baumann, J. P., Ghio, A. J., and Paulson, S. E.: Effects of albumin, transferrin and humic-like substances on iron-mediated OH radical formation in human lung fluids, Free Radical Bio. Med., 165, 79–87, https://doi.org/10.1016/j.freeradbiomed.2021.01.021, 2021. a, b
Hayes, J. D., Dinkova-Kostova, A. T., and Tew, K. D.: Oxidative Stress in Cancer, Cancer Cell, 38, 167–197, https://doi.org/10.1016/j.ccell.2020.06.001, 2020. a
Heal, M. R., Hibbs, L. R., Agius, R. M., and Beverland, I. J.: Total and water-soluble trace metal content of urban background PM10, PM2.5 and black smoke in Edinburgh, UK, Atmos. Environ., 39, 1417–1430, https://doi.org/10.1016/j.atmosenv.2004.11.026, 2005. a
Hwang, B., Fang, T., Pham, R., Wei, J., Gronstal, S., Lopez, B., Frederickson, C., Galeazzo, T., Wang, X., Jung, H., and Shiraiwa, M.: Environmentally Persistent Free Radicals, Reactive Oxygen Species Generation, and Oxidative Potential of Highway PM2.5, ACS Earth Space Chem., 5, 1865–1875, https://doi.org/10.1021/acsearthspacechem.1c00135, 2021. a
Janssen, N. A., Yang, A., Strak, M., Steenhof, M., Hellack, B., Gerlofs-Nijland, M. E., Kuhlbusch, T., Kelly, F., Harrison, R., Brunekreef, B., Hoek, G., and Cassee, F.: Oxidative potential of particulate matter collected at sites with different source characteristics, Sci. Total Environ., 472, 572–581, https://doi.org/10.1016/j.scitotenv.2013.11.099, 2014. a
Kachur, A. V., Held, K. D., Koch, C. J., and Biaglow, J. E.: Mechanism of Production of Hydroxyl Radicals in the Copper-Catalyzed Oxidation of Dithiothreitol, Radiat. Res., 147, 409–415, https://doi.org/10.2307/3579496, 1997. a, b, c, d
Kelly, F. J.: Oxidative stress: its role in air pollution and adverse health effects, Occup. Environ. Med., 60, 612, https://doi.org/10.1136/oem.60.8.612, 2003. a
Khan, F., Jaoui, M., Rudziński, K., Kwapiszewska, K., Martinez-Romero, A., Gil-Casanova, D., Lewandowski, M., Kleindienst, T. E., Offenberg, J. H., Krug, J. D., Surratt, J. D., and Szmigielski, R.: Cytotoxicity and oxidative stress induced by atmospheric mono-nitrophenols in human lung cells, Environ. Pollut., 301, 119010, https://doi.org/10.1016/j.envpol.2022.119010, 2022. a
Kramer, A. J., Rattanavaraha, W., Zhang, Z., Gold, A., Surratt, J. D., and Lin, Y.-H.: Assessing the oxidative potential of isoprene-derived epoxides and secondary organic aerosol, Atmos. Environ., 130, 211–218, https://doi.org/10.1016/j.atmosenv.2015.10.018, 2016. a
Krapf, M., El Haddad, I., Bruns, E., Molteni, U., Daellenbach, K., Prévôt, A., Baltensperger, U., and Dommen, J.: Labile Peroxides in Secondary Organic Aerosol, Chem, 1, 603–616, https://doi.org/10.1016/j.chempr.2016.09.007, 2016. a, b
Kumagai, Y., Koide, S., Taguchi, K., Endo, A., Nakai, Y., Yoshikawa, T., and Shimojo, N.: Oxidation of Proximal Protein Sulfhydryls by Phenanthraquinone, a Component of Diesel Exhaust Particles, Chem. Res. Toxicol., 15, 483–489, https://doi.org/10.1021/tx0100993, 2002. a, b, c
Lammel, G., Kitanovski, Z., Kukučka, P., Novák, J., Arangio, A. M., Codling, G. P., Filippi, A., Hovorka, J., Kuta, J., Leoni, C., Příbylová, P., Prokeš, R., Sáňka, O., Shahpoury, P., Tong, H., and Wietzoreck, M.: Oxygenated and Nitrated Polycyclic Aromatic Hydrocarbons in Ambient Air–Levels, Phase Partitioning, Mass Size Distributions, and Inhalation Bioaccessibility, Environ. Sci. Technol., 54, 2615–2625, https://doi.org/10.1021/acs.est.9b06820, 2020. a
Laulagnet, A., Sauvain, J., Concha-Lozano, N., Riediker, M., and Suárez, G.: Sensitive Photonic System to Measure Oxidative Potential of Airborne Nanoparticles and ROS Levels in Exhaled Air, Procedia Eng., 120, 632–636, https://doi.org/10.1016/j.proeng.2015.08.659, 2015. a
Lelieveld, S., Wilson, J., Dovrou, E., Mishra, A., Lakey, P. S. J., Shiraiwa, M., Pöschl, U., and Berkemeier, T.: Hydroxyl Radical Production by Air Pollutants in Epithelial Lining Fluid Governed by Interconversion and Scavenging of Reactive Oxygen Species, Environ. Sci. Technol., 55, 14069–14079, https://doi.org/10.1021/acs.est.1c03875, 2021. a
Li, K., Resch, J., and Kalberer, M.: Synthesis and Characterization of Organic Peroxides from Monoterpene-Derived Criegee Intermediates in Secondary Organic Aerosol, Environ. Sci. Technol., 58, 3322–3331, https://doi.org/10.1021/acs.est.3c07048, 2024. a
Li, K., Zheng, Z., Resch, J., Ma, J., Hansel, A., and Kalberer, M.: Molecular Composition of Organic Peroxides in Secondary Organic Aerosols Revealed by Peroxide-Iodide Reactivity, Environ. Sci. Technol., 59, 17126–17136, https://doi.org/10.1021/acs.est.5c03241, 2025. a
Lin, M. and Yu, J. Z.: Dithiothreitol (DTT) concentration effect and its implications on the applicability of DTT assay to evaluate the oxidative potential of atmospheric aerosol samples, Environ. Pollut., 251, 938–944, https://doi.org/10.1016/j.envpol.2019.05.074, 2019. a, b, c, d, e
Lin, P. and Yu, J. Z.: Generation of Reactive Oxygen Species Mediated by Humic-like Substances in Atmospheric Aerosols, Environ. Sci. Technol., 45, 10362–10368, https://doi.org/10.1021/es2028229, 2011. a
Liu, X., Zhang, X., Jin, B., Wang, T., Qian, S., Zou, J., Dinh, V. N. T., Jaffrezo, J.-L., Uzu, G., Dominutti, P., Darfeuil, S., Favez, O., Conil, S., Marchand, N., Castillo, S., de la Rosa, J. D., Grange, S., Hueglin, C., Eleftheriadis, K., Diapouli, E., Manousakas, M.-I., Gini, M., Nava, S., Calzolai, G., Alves, C., Monge, M., Reche, C., Harrison, R. M., Hopke, P. K., Alastuey, A., and Querol, X.: Source apportionment of PM10 based on offline chemical speciation data at 24 European sites, npj Clim. Atmos. Sci., 8, 255, https://doi.org/10.1038/s41612-025-01097-7, 2025. a
Lu, Y., Su, S., Jin, W., Wang, B., Li, N., Shen, H., Li, W., Huang, Y., Chen, H., Zhang, Y., Chen, Y., Lin, N., Wang, X., and Tao, S.: Characteristics and cellular effects of ambient particulate matter from Beijing, Environ. Pollut., 191, 63–69, https://doi.org/10.1016/j.envpol.2014.04.008, 2014. a, b
Manousakas, M., Papaefthymiou, H., Eleftheriadis, K., and Katsanou, K.: Determination of water-soluble and insoluble elements in PM2.5 by ICP-MS, Sci. Total Environ., 493, 694–700, https://doi.org/10.1016/j.scitotenv.2014.06.043, 2014. a
McWhinney, R. D., Badali, K., Liggio, J., Li, S.-M., and Abbatt, J. P. D.: Filterable Redox Cycling Activity: A Comparison between Diesel Exhaust Particles and Secondary Organic Aerosol Constituents, Environ. Sci. Technol., 47, 3362–3369, https://doi.org/10.1021/es304676x, 2013a. a
McWhinney, R. D., Zhou, S., and Abbatt, J. P. D.: Naphthalene SOA: redox activity and naphthoquinone gas–particle partitioning, Atmos. Chem. Phys., 13, 9731–9744, https://doi.org/10.5194/acp-13-9731-2013, 2013b. a, b
Miller, M. R.: Oxidative stress and the cardiovascular effects of air pollution, Free Radical Bio. Med., 151, 69–87, https://doi.org/10.1016/j.freeradbiomed.2020.01.004, 2020. a
Mishra, A., Lelieveld, S., Pöschl, U., and Berkemeier, T.: Multiphase Kinetic Modeling of Air Pollutant Effects on Protein Modification and Nitrotyrosine Formation in Epithelial Lining Fluid, Environ. Sci. Technol., 57, 12642–12653, https://doi.org/10.1021/acs.est.3c03556, 2023. a, b
Mishra, A., Kilchhofer, K., Iezzi, L., Pöschl, U., Alpert, P. A., Ammann, M., and Berkemeier, T.: Photochemical Degradation of Iron Citrate in Anoxic Viscous Films Enhanced by Redox Cascades, ACS Earth Space Chem., 9, 689–698, https://doi.org/10.1021/acsearthspacechem.4c00364, 2025. a
Mouchel-Vallon, C., Deguillaume, L., Monod, A., Perroux, H., Rose, C., Ghigo, G., Long, Y., Leriche, M., Aumont, B., Patryl, L., Armand, P., and Chaumerliac, N.: CLEPS 1.0: A new protocol for cloud aqueous phase oxidation of VOC mechanisms, Geosci. Model Dev., 10, 1339–1362, https://doi.org/10.5194/gmd-10-1339-2017, 2017. a
Müller, M., Mishra, A., Berkemeier, T., Hausammann, E., Peter, T., and Krieger, U. K.: Electrodynamic balance–mass spectrometry reveals impact of oxidant concentration on product composition in the ozonolysis of oleic acid, Phys. Chem. Chem. Phys., 24, 27086–27104, https://doi.org/10.1039/D2CP03289A, 2022. a
Netto, L. E. and Stadtman, E. R.: The Iron-Catalyzed Oxidation of Dithiothreitol Is a Biphasic Process: Hydrogen Peroxide Is Involved in the Initiation of a Free Radical Chain of Reactions, Arch. Biochem. Biophys., 333, 233–242, https://doi.org/10.1006/abbi.1996.0386, 1996. a, b, c
Ngoc Thuy, V. D., Jaffrezo, J.-L., Hough, I., Dominutti, P. A., Salque Moreton, G., Gille, G., Francony, F., Patron-Anquez, A., Favez, O., and Uzu, G.: Unveiling the optimal regression model for source apportionment of the oxidative potential of PM10, Atmos. Chem. Phys., 24, 7261–7282, https://doi.org/10.5194/acp-24-7261-2024, 2024. a
Paatero, P. and Tapper, U.: Positive matrix factorization: A non-negative factor model with optimal utilization of error estimates of data values, Environmetrics, 5, 111–126, https://doi.org/10.1002/env.3170050203, 1994. a, b
Page, S. E., Arnold, W. A., and McNeill, K.: Terephthalate as a probe for photochemically generated hydroxyl radical, J. Environ. Monit., 12, 1658–1665, https://doi.org/10.1039/C0EM00160K, 2010. a
Pan, S., Qiu, Y., Li, M., Yang, Z., and Liang, D.: Recent Developments in the Determination of PM2.5 Chemical Composition, B. Environ. Contam. Tox., 108, 819–823, https://doi.org/10.1007/s00128-022-03510-w, 2022. a
Pietrogrande, M. C., Bertoli, I., Manarini, F., and Russo, M.: Ascorbate assay as a measure of oxidative potential for ambient particles: Evidence for the importance of cell-free surrogate lung fluid composition, Atmos. Environ., 211, 103–112, https://doi.org/10.1016/j.atmosenv.2019.05.012, 2019. a, b, c, d, e
Puthussery, J. V., Singh, A., Rai, P., Bhattu, D., Kumar, V., Vats, P., Furger, M., Rastogi, N., Slowik, J. G., Ganguly, D., Prevot, A. S. H., Tripathi, S. N., and Verma, V.: Real-Time Measurements of PM2.5 Oxidative Potential Using a Dithiothreitol Assay in Delhi, India, Environ. Sci. Tech. Let., 7, 504–510, https://doi.org/10.1021/acs.estlett.0c00342, 2020. a
Ram, K., Sarin, M. M., and Tripathi, S. N.: Temporal Trends in Atmospheric PM2.5, PM10, Elemental Carbon, Organic Carbon, Water-Soluble Organic Carbon, and Optical Properties: Impact of Biomass Burning Emissions in The Indo-Gangetic Plain, Environ. Sci. Technol., 46, 686–695, https://doi.org/10.1021/es202857w, 2012. a
Rapp, C. N., Niu, S., Armstrong, N. C., Shen, X., Berkemeier, T., Surratt, J. D., Zhang, Y., and Cziczo, D. J.: Ice-nucleating properties of glassy organic and organosulfate aerosol, Atmos. Chem. Phys., 25, 5519–5536, https://doi.org/10.5194/acp-25-5519-2025, 2025. a
Rush, J. and Koppenol, W.: Reactions of Fe(II)-ATP and Fe(II)-citrate complexes with t-butyl hydroperoxide and cumyl hydroperoxide, FEBS Lett., 275, 114–116, https://doi.org/10.1016/0014-5793(90)81452-T, 1990. a, b
Samake, A., Uzu, G., Martins, J. M. F., Calas, A., Vince, E., Parat, S., and Jaffrezo, J. L.: The unexpected role of bioaerosols in the Oxidative Potential of PM, Sci. Rep., 7, 10978, https://doi.org/10.1038/s41598-017-11178-0, 2017. a
Sciare, J., d'Argouges, O., Sarda-Estève, R., Gaimoz, C., Dolgorouky, C., Bonnaire, N., Favez, O., Bonsang, B., and Gros, V.: Large contribution of water-insoluble secondary organic aerosols in the region of Paris (France) during wintertime, J. Geophys. Res.-Atmos., 116, https://doi.org/10.1029/2011JD015756, 2011. a
Shahpoury, P., Harner, T., Lammel, G., Lelieveld, S., Tong, H., and Wilson, J.: Development of an antioxidant assay to study oxidative potential of airborne particulate matter, Atmos. Meas. Tech., 12, 6529–6539, https://doi.org/10.5194/amt-12-6529-2019, 2019. a
Shahpoury, P., Zhang, Z. W., Filippi, A., Hildmann, S., Lelieveld, S., Mashtakov, B., Patel, B. R., Traub, A., Umbrio, D., Wietzoreck, M., Wilson, J., Berkemeier, T., Celo, V., Dabek-Zlotorzynska, E., Evans, G., Harner, T., Kerman, K., Lammel, G., Noroozifar, M., Pöschl, U., and Tong, H.: Inter-comparison of oxidative potential metrics for airborne particles identifies differences between acellular chemical assays, Atmos. Pollut. Res., 13, 101596, https://doi.org/10.1016/j.apr.2022.101596, 2022. a
Shahpoury, P., Lelieveld, S., Johannessen, C., Berkemeier, T., Celo, V., Dabek-Zlotorzynska, E., Harner, T., Lammel, G., and Nenes, A.: Influence of aerosol acidity and organic ligands on transition metal solubility and oxidative potential of fine particulate matter in urban environments, Sci. Total Environ., 906, 167405, https://doi.org/10.1016/j.scitotenv.2023.167405, 2024a. a, b, c, d
Shahpoury, P., Lelieveld, S., Srivastava, D., Baccarini, A., Mastin, J., Berkemeier, T., Celo, V., Dabek-Zlotorzynska, E., Harner, T., Lammel, G., and Nenes, A.: Seasonal Changes in the Oxidative Potential of Urban Air Pollutants: The Influence of Emission Sources and Proton- and Ligand-Mediated Dissolution of Transition Metals, Environ. Sci. Technol. Air, 1, 1262–1275, https://doi.org/10.1021/acsestair.4c00093, 2024b. a, b
Shahpoury, P., Berkemeier, T., Zhang, Z. W., Traub, A., Umbrio, D., Evans, G., Harner, T., Su, K., and Su, Y.: Influence of Particle Size and Gaseous Oxidants on Oxidative Potential of Urban Air, Environ. Sci. Technol. Air, https://doi.org/10.1021/acsestair.5c00203, 2026. a
Shapley, L. S.: Contributions to the Theory of Games, vol. II, Princeton University Press, 307–318, https://doi.org/10.1515/9781400881970-018, 1953. a, b
Shen, J., Griffiths, P. T., Campbell, S. J., Utinger, B., Kalberer, M., and Paulson, S. E.: Ascorbate oxidation by iron, copper and reactive oxygen species: review, model development, and derivation of key rate constants, Sci. Rep., 11, 7417, https://doi.org/10.1038/s41598-021-86477-8, 2021. a, b, c, d, e, f, g, h, i
Shen, J., Taghvaee, S., La, C., Oroumiyeh, F., Liu, J., Jerrett, M., Weichenthal, S., Del Rosario, I., Shafer, M. M., Ritz, B., Zhu, Y., and Paulson, S. E.: Aerosol Oxidative Potential in the Greater Los Angeles Area: Source Apportionment and Associations with Socioeconomic Position, Environ. Sci. Technol., 56, 17795–17804, https://doi.org/10.1021/acs.est.2c02788, 2022. a
Sies, H.: Hydrogen peroxide as a central redox signaling molecule in physiological oxidative stress: Oxidative eustress, Redox Biol., 11, 613–619, https://doi.org/10.1016/j.redox.2016.12.035, 2017. a
Sies, H.: Oxidative eustress: On constant alert for redox homeostasis, Redox Biol., 41, 101867, https://doi.org/10.1016/j.redox.2021.101867, 2021. a
Son, Y., Mishin, V., Welsh, W., Lu, S.-E., Laskin, J. D., Kipen, H., and Meng, Q.: A Novel High-Throughput Approach to Measure Hydroxyl Radicals Induced by Airborne Particulate Matter, Int. J. Env. Res. Pub. He., 12, 13678–13695, https://doi.org/10.3390/ijerph121113678, 2015. a
Srivastava, D., Favez, O., Bonnaire, N., Lucarelli, F., Haeffelin, M., Perraudin, E., Gros, V., Villenave, E., and Albinet, A.: Speciation of organic fractions does matter for aerosol source apportionment. Part 2: Intensive short-term campaign in the Paris area (France), Sci. Total Environ., 634, 267–278, https://doi.org/10.1016/j.scitotenv.2018.03.296, 2018a. a, b, c, d
Srivastava, D., Tomaz, S., Favez, O., Lanzafame, G. M., Golly, B., Besombes, J.-L., Alleman, L. Y., Jaffrezo, J.-L., Jacob, V., Perraudin, E., Villenave, E., and Albinet, A.: Speciation of organic fraction does matter for source apportionment. Part 1: A one-year campaign in Grenoble (France), Sci. Total Environ., 624, 1598–1611, https://doi.org/10.1016/j.scitotenv.2017.12.135, 2018b. a, b, c, d
Srivastava, D., Daellenbach, K., Zhang, Y., Bonnaire, N., Chazeau, B., Perraudin, E., Gros, V., Lucarelli, F., Villenave, E., Prévôt, A., El Haddad, I., Favez, O., and Albinet, A.: Comparison of five methodologies to apportion organic aerosol sources during a PM pollution event, Sci. Total Environ., 757, 143168, https://doi.org/10.1016/j.scitotenv.2020.143168, 2021. a
Tomaz, S., Shahpoury, P., Jaffrezo, J.-L., Lammel, G., Perraudin, E., Villenave, E., and Albinet, A.: One-year study of polycyclic aromatic compounds at an urban site in Grenoble (France): Seasonal variations, gas/particle partitioning and cancer risk estimation, Sci. Total Environ., 565, 1071–1083, https://doi.org/10.1016/j.scitotenv.2016.05.137, 2016. a, b
Tomaz, S., Jaffrezo, J.-L., Favez, O., Perraudin, E., Villenave, E., and Albinet, A.: Sources and atmospheric chemistry of oxy- and nitro-PAHs in the ambient air of Grenoble (France), Atmos. Environ., 161, 144–154, https://doi.org/10.1016/j.atmosenv.2017.04.042, 2017. a, b
Tong, H., Arangio, A. M., Lakey, P. S. J., Berkemeier, T., Liu, F., Kampf, C. J., Brune, W. H., Pöschl, U., and Shiraiwa, M.: Hydroxyl radicals from secondary organic aerosol decomposition in water, Atmos. Chem. Phys., 16, 1761–1771, https://doi.org/10.5194/acp-16-1761-2016, 2016. a, b, c, d
Tong, H., Lakey, P. S. J., Arangio, A. M., Socorro, J., Shen, F., Lucas, K., Brune, W. H., Pöschl, U., and Shiraiwa, M.: Reactive Oxygen Species Formed by Secondary Organic Aerosols in Water and Surrogate Lung Fluid, Environ. Sci. Technol., 52, 11642–11651, https://doi.org/10.1021/acs.est.8b03695, 2018. a, b, c, d, e, f, g, h
Tuet, W. Y., Chen, Y., Xu, L., Fok, S., Gao, D., Weber, R. J., and Ng, N. L.: Chemical oxidative potential of secondary organic aerosol (SOA) generated from the photooxidation of biogenic and anthropogenic volatile organic compounds, Atmos. Chem. Phys., 17, 839–853, https://doi.org/10.5194/acp-17-839-2017, 2017. a, b, c, d, e, f, g, h, i, j, k, l
Utinger, B., Campbell, S. J., Bukowiecki, N., Barth, A., Gfeller, B., Freshwater, R., Rüegg, H.-R., and Kalberer, M.: An automated online field instrument to quantify the oxidative potential of aerosol particles via ascorbic acid oxidation, Atmos. Meas. Tech., 16, 2641–2654, https://doi.org/10.5194/amt-16-2641-2023, 2023. a, b, c, d, e, f
Verma, V., Fang, T., Guo, H., King, L., Bates, J. T., Peltier, R. E., Edgerton, E., Russell, A. G., and Weber, R. J.: Reactive oxygen species associated with water-soluble PM2.5 in the southeastern United States: spatiotemporal trends and source apportionment, Atmos. Chem. Phys., 14, 12915–12930, https://doi.org/10.5194/acp-14-12915-2014, 2014. a
Verma, V., Fang, T., Xu, L., Peltier, R. E., Russell, A. G., Ng, N. L., and Weber, R. J.: Organic Aerosols Associated with the Generation of Reactive Oxygen Species (ROS) by Water-Soluble PM2.5, Environ. Sci. Technol., 49, 4646–4656, https://doi.org/10.1021/es505577w, 2015. a
Walling, C.: Some aspects of the chemistry of alkoxy radicals, Pure Appl. Chem., 15, 69–80, https://doi.org/10.1351/pac196715010069, 1967. a
Wang, Q., Song, H., Dong, H., Guo, S., Yao, M., Wan, Y., and Lu, K.: Multiphase Radical Chemical Processes Induced by Air Pollutants and the Associated Health Effects, Environ. Health-UK, 3, 1–13, https://doi.org/10.1021/envhealth.4c00157, 2025. a
Wang, S., Ye, J., Soong, R., Wu, B., Yu, L., Simpson, A. J., and Chan, A. W. H.: Relationship between chemical composition and oxidative potential of secondary organic aerosol from polycyclic aromatic hydrocarbons, Atmos. Chem. Phys., 18, 3987–4003, https://doi.org/10.5194/acp-18-3987-2018, 2018. a, b
Wang, S., Zhao, Y., Chan, A. W. H., Yao, M., Chen, Z., and Abbatt, J. P. D.: Organic Peroxides in Aerosol: Key Reactive Intermediates for Multiphase Processes in the Atmosphere, Chem. Rev., 123, 1635–1679, https://doi.org/10.1021/acs.chemrev.2c00430, 2023. a
Wang, W., Cao, G., Zhang, J., Chen, Z., Dong, C., Chen, J., and Cai, Z.: p-Phenylenediamine-Derived Quinones as New Contributors to the Oxidative Potential of Fine Particulate Matter, Environ. Sci. Tech. Let., 9, 712–717, https://doi.org/10.1021/acs.estlett.2c00484, 2022. a
Weber, S., Uzu, G., Favez, O., Borlaza, L. J. S., Calas, A., Salameh, D., Chevrier, F., Allard, J., Besombes, J.-L., Albinet, A., Pontet, S., Mesbah, B., Gille, G., Zhang, S., Pallares, C., Leoz-Garziandia, E., and Jaffrezo, J.-L.: Source apportionment of atmospheric PM10 oxidative potential: synthesis of 15 year-round urban datasets in France, Atmos. Chem. Phys., 21, 11353–11378, https://doi.org/10.5194/acp-21-11353-2021, 2021. a
Wei, J., Yu, H., Wang, Y., and Verma, V.: Complexation of Iron and Copper in Ambient Particulate Matter and Its Effect on the Oxidative Potential Measured in a Surrogate Lung Fluid, Environ. Sci. Technol., 53, 1661–1671, https://doi.org/10.1021/acs.est.8b05731, 2019. a
Wei, J., Fang, T., Wong, C., Lakey, P. S. J., Nizkorodov, S. A., and Shiraiwa, M.: Superoxide Formation from Aqueous Reactions of Biogenic Secondary Organic Aerosols, Environ. Sci. Technol., 55, 260–270, https://doi.org/10.1021/acs.est.0c07789, 2021. a, b
Wei, J., Fang, T., Lakey, P. S. J., and Shiraiwa, M.: Iron-Facilitated Organic Radical Formation from Secondary Organic Aerosols in Surrogate Lung Fluid, Environ. Sci. Technol., 56, 7234–7243, https://doi.org/10.1021/acs.est.1c04334, 2022. a
Weichenthal, S., Crouse, D. L., Pinault, L., Godri-Pollitt, K., Lavigne, E., Evans, G., van Donkelaar, A., Martin, R. V., and Burnett, R. T.: Oxidative burden of fine particulate air pollution and risk of cause-specific mortality in the Canadian Census Health and Environment Cohort (CanCHEC), Environ. Res., 146, 92–99, https://doi.org/10.1016/j.envres.2015.12.013, 2016. a
Wragg, F. P. H., Fuller, S. J., Freshwater, R., Green, D. C., Kelly, F. J., and Kalberer, M.: An automated online instrument to quantify aerosol-bound reactive oxygen species (ROS) for ambient measurement and health-relevant aerosol studies, Atmos. Meas. Tech., 9, 4891–4900, https://doi.org/10.5194/amt-9-4891-2016, 2016. a
Xia, Q., Yin, J.-J., Zhao, Y., Wu, Y.-S., Wang, Y.-Q., Ma, L., Chen, S., Sun, X., Fu, P. P., and Yu, H.: UVA Photoirradiation of Nitro-Polycyclic Aromatic Hydrocarbons–Induction of Reactive Oxygen Species and Formation of Lipid Peroxides, Int. J. Env. Res. Pub. He., 10, 1062–1084, https://doi.org/10.3390/ijerph10031062, 2013. a
Xiong, Q., Yu, H., Wang, R., Wei, J., and Verma, V.: Rethinking Dithiothreitol-Based Particulate Matter Oxidative Potential: Measuring Dithiothreitol Consumption versus Reactive Oxygen Species Generation, Environ. Sci. Technol., 51, 6507–6514, https://doi.org/10.1021/acs.est.7b01272, 2017. a, b, c, d, e, f, g, h
Yalamanchili, J., Hennigan, C. J., and Reed, B. E.: Precipitation of aqueous transition metals in particulate matter during the dithiothreitol (DTT) oxidative potential assay, Environ. Sci.-Proc. Imp., 24, 762–772, https://doi.org/10.1039/D2EM00005A, 2022. a
Yu, H., Wei, J., Cheng, Y., Subedi, K., and Verma, V.: Synergistic and Antagonistic Interactions among the Particulate Matter Components in Generating Reactive Oxygen Species Based on the Dithiothreitol Assay, Environ. Sci. Technol., 52, 2261–2270, https://doi.org/10.1021/acs.est.7b04261, 2018. a, b, c
Yu, H., Wang, Y., Puthussery, J. V., and Verma, V.: Sources of acellular oxidative potential of water-soluble fine ambient particulate matter in the midwestern United States, J. Hazard. Mater., 474, 134763, https://doi.org/10.1016/j.jhazmat.2024.134763, 2024. a
Zielinski, H., Mudway, I. S., Bérubé, K. A., Murphy, S., Richards, R., and Kelly, F. J.: Modeling the interactions of particulates with epithelial lining fluid antioxidants, Am. J. Physiol., 277, L719–L726, https://doi.org/10.1152/ajplung.1999.277.4.L719, 1999. a