
the Creative Commons Attribution 4.0 License.
the Creative Commons Attribution 4.0 License.
 | 27 Jul 2026
Applying satellite observations to improve bottom-up national emission inventories for methane: application to Colombia
Sarah E. Hancock
Daniel J. Jacob
Rodrigo Jimenez
Andrés Ardila
Luis Morales-Rincon
Néstor Rojas
Lucas A. Estrada
Nicholas Balasus
James D. East
Melissa P. Sulprizio
Xiaolin Wang
James L. France
Lauren Potyk
Elise Penn
Zichong Chen
Daniel J. Varon
Christian Frankenberg
Marci Baranski
Andreea Calcan
Robert J. Parker
Countries report inventories of methane emissions under the Paris Agreement to the United Nations Framework Convention on Climate Change (UNFCCC), but these estimates can have large uncertainties in activity data and emission factors. Top-down information from inversion of satellite observations can provide constraints to improve these estimates, but has been limited by coarse resolution and the quality of bottom-up inventories used both as prior estimates and to attribute inversion results to specific sectors. Here, we address these issues through partnership between bottom-up and top-down methods to quantify 2023 emissions in Colombia. We use satellite observations from TROPOMI and point source imagers (GHGSat, EMIT, aircraft AVIRIS-NG) in an analytical Bayesian inversion at km2 resolution with the Integrated Methane Inversion v2.0 framework, and evaluate inversion results with independent satellite observations from GOSAT. We construct a spatially resolved version of the emission inventory from Colombia's Biennial Update Report (BUR) to the UNFCCC for use as prior estimate in the inversion, and combine it with high-resolution wetland extent data (GLWDv2) to separate anthropogenic from wetland emissions. The inversion yields posterior methane emissions for Colombia of 8.9 (8.7–9.1) Tg a−1, contributed by wetlands (5.7 (5.5–6.0) Tg a−1) and anthropogenic emissions (3.2 (3.1–3.2) Tg a−1), mainly livestock (2.0 (1.9–2.1) Tg a−1) and waste (0.76 (0.74–0.76) Tg a−1). Adjustments relative to the BUR are +18 % for livestock, +19 % for waste, +60 % for oil/gas, and +92 % for coal. We provide recommendations to improve the BUR, offering a blueprint for combining satellite observations with national inventory data to produce sectorally and spatially resolved emissions estimates that can inform policy.
- Article
(9651 KB) - Full-text XML
-
Supplement
(2602 KB) - BibTeX
- EndNote


Methane is a powerful greenhouse gas whose short lifetime makes it an important target for mitigating near-term warming (Forster et al., 2021). The United Nations Framework Convention on Climate Change (UNFCCC) requires countries to report their anthropogenic methane emissions by sector. The bottom-up approaches used to generate these emission inventories rely on sectoral activity levels and emission factors (EFs), but these inputs can be uncertain. Top-down inverse methods based on satellite observations of atmospheric methane concentrations can evaluate and improve these bottom-up inventories by using a chemical transport model to relate concentrations to emissions (Jacob et al., 2022). This is best done through partnership between the bottom-up and top-down approaches, where a spatially resolved version of the bottom-up inventory serves as prior estimate for the inversion and the inversion results are used to inform the inventory processes. Here we show how such a partnership can improve Colombia's national emission inventory.
Colombia is committed to mitigation of methane emissions (Miranda-González and Banks, 2022) and has submitted national bottom-up emission calculations through its Biennial Update Reports (BURs) to the UNFCCC (Gobierno de Colombia, 2022). Colombia's anthropogenic emissions as reported in the BUR are mostly from livestock but also include significant contributions from oil/gas, coal, solid waste, wastewater, and rice. Emissions from hydroelectric reservoirs could also be important (Delwiche et al., 2022) but are given as negligible in the BUR. Natural emissions are mostly from wetlands (Zhang et al., 2017), with additional contributions from fires, termites, and geological seeps. The BUR applies region-specific information for some sectors (for example, CIPAV et al. (2021) for livestock, Mariño-Martínez et al. (2020) for coal), but other sectors like waste and oil/gas rely more heavily on IPCC default parameters. Colombia's latest BUR (Gobierno de Colombia, 2022) reports a national emission from anthropogenic sources of 2.6 Tg a−1, the third highest reported emission among South American countries after Brazil and Argentina (Hancock et al., 2025).
Satellite observations of atmospheric methane in the shortwave infrared (SWIR) can contribute top-down information for national emission inventories through inverse analyses. The TROPOspheric Monitoring Instrument (TROPOMI) offers global daily coverage at 7×5.5 km2 nadir resolution from 2018 to present (Lorente et al., 2023), though with only 3 % global success rate limited by clouds and dark or heterogeneous surfaces. The Greenhouse Gases Observing Satellite (GOSAT) offers a much sparser data set from 2009 to present, with pixels separated by 250 km, but performs better than TROPOMI over dark or heterogeneous surfaces (Parker and Boesch, 2020). Additional observations for large point sources are available including from the Greenhouse Gas Emissions Monitoring Satellites (GHGSat) (Jervis et al., 2025) and the Earth Surface Mineral Dust Source Investigation (EMIT) (Green et al., 2023).
Inverse analyses to infer emissions using satellite observations apply Bayesian inference that combines the satellite information with prior bottom-up emission inventory estimates, including error statistics from both, to obtain a best posterior estimate (Jacob et al., 2016). This melding of top-down and bottom-up information is essential because the satellite observations alone cannot fully constrain emissions and require bottom-up spatial information to interpret atmospheric gradients in terms of emissions. Colombia is particularly difficult to observe because of dark surfaces and topography. Past inverse analyses for Colombia have been limited to global and continental studies at coarse resolution. In a global GOSAT inversion, Worden et al. (2022) were unable to quantify emissions over Colombia due to sparse coverage. A global TROPOMI inversion for 2019–2024 identified Colombia as a major contributor to rising methane emissions (He et al., 2026). In an inversion using TROPOMI over South America for 2021, Colombia was estimated to have 67 % higher anthropogenic emissions than its BUR (Hancock et al., 2025).
Here we present an improved approach for integrating satellite observations into national methane emission inventories, with application to Colombia (Fig. 1). We apply the open-source, cloud-based Integrated Methane Inversion (IMIv2.0) framework (Estrada et al., 2025) to an inverse analysis of 2023 TROPOMI observations over Colombia at unprecedented 0.125°×0.15625° ( km2) resolution. This involves development of high-resolution bottom-up inventories based on the national BUR to serve as prior estimate. We incorporate into these inventories point source observations from GHGSat, EMIT, and NASA's Next Generation Airborne Visible Infrared Imaging Spectrometer (AVIRIS-NG) aboard Carbon Mapper aircraft (Carbon Mapper, 2023). The high resolution of the inversion combined with a high-quality bottom-up prior estimate allows us to better attribute our posterior emissions to specific sectors and regions, and to integrate bottom-up and top-down methodologies by relating these posterior emissions back to the bottom-up calculations.
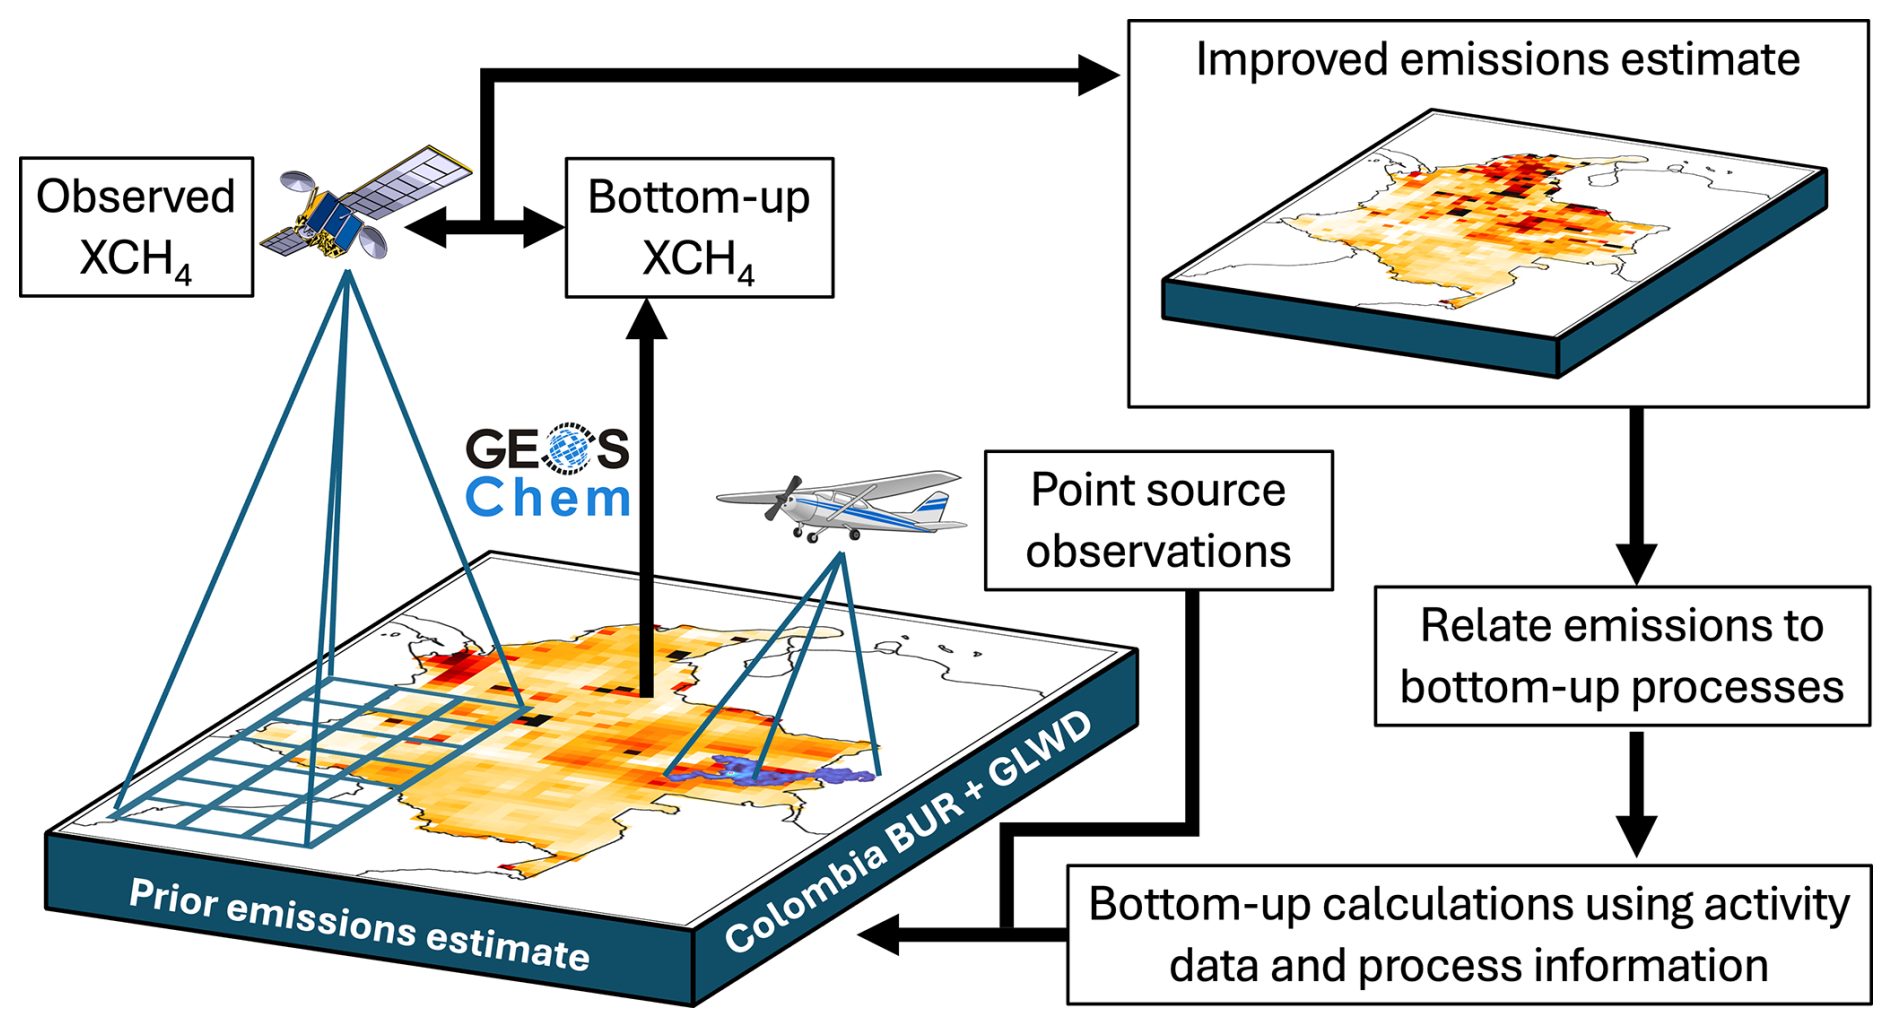
Figure 1Inversion framework used to quantify and interpret methane emissions over Colombia through the integration of bottom-up and top-down methods. National data from the Colombia Biennial Update Report (BUR), with sectoral updates for 2023, are combined with point source observations from Carbon Mapper and GHGSat, wetland data from GLWD v2, and other process information to produce bottom-up emission inventories by sector on the 0.125°×0.15625° inversion grid. These inventories serve as prior estimate in a GEOS-Chem simulation of atmospheric methane dry column mixing ratios (XCH4), which are compared to satellite observations from TROPOMI to optimize emissions through an analytical inversion. Posterior emissions from the inversion are analyzed to improve the process information in the bottom-up inventories.
We first develop a spatially resolved bottom-up anthropogenic emission inventory on the 0.125°×0.15625° inversion grid by drawing from the national BUR (Gobierno de Colombia, 2022) with updates for coal, waste, and livestock (Ardila et al., 2025a). The purpose of constructing this bottom-up inventory rather than relying on standard global emission inventories is to ensure that the prior emission estimates for the inversion are directly relevant to national inventory improvement and that the sectoral attribution of posterior emissions is based on the best available data. The BUR gives national sectoral totals only, so we distribute them spatially with Colombia-specific activity data from Ardila et al. (2025a) for coal, waste, and livestock and the CORINE national land cover map (LCM) (Instituto de Hidrología, Meteorología y Estudios Ambientales (IDEAM), 2021b) for oil/gas and livestock. For oil/gas, coal, solid waste, and wastewater, we also incorporate point source locations detected by satellite (GHGSat, EMIT) and aircraft (AVIRIS-NG) (Jervis et al., 2025; https://data.carbonmapper.org, last access: 19 June 2025) (Fig. 2) to inform the spatial allocation of the prior emissions. We do not use the point-source emission magnitudes in constructing the prior estimate, but instead ensure that prior emissions are present at these locations while preserving the BUR sectoral total emissions. We add the ResME inventory for hydroelectric reservoirs (Delwiche et al., 2022). Anthropogenic emissions in neighboring countries are from spatially distributed (0.1°×0.1°) global inventories including GFEIv3 for fuel exploitation (Scarpelli et al., 2025), EDGARv7 for livestock (Crippa et al., 2022), ResME for hydropower (Delwiche et al., 2022), and EDGARv8 for other sectors (Crippa et al., 2024). We use EDGARv7 for livestock because EDGARv8 has an anomalous spatial distribution concentrated over satellite-observed ammonia hotspots. GFEIv3 incorporates infrastructure data from the Oil and Gas Infrastructure Mapping (OGIM) database (Omara et al., 2023) to spatially allocate oil and gas emissions. Wetland emissions are distributed on the 0.125°×0.15625° grid using the Global Lakes and Wetlands Database (GLWDv2) (Lehner et al., 2025) applied to monthly total wetland emissions over the domain from the LPJ inventory (Zhang et al., 2016). Figure 3 shows the spatial distribution of bottom-up anthropogenic emissions by sector, and Fig. 4 shows the same for wetlands, with national totals given in Table 1. We provide more details on Colombian emissions for each sector below.
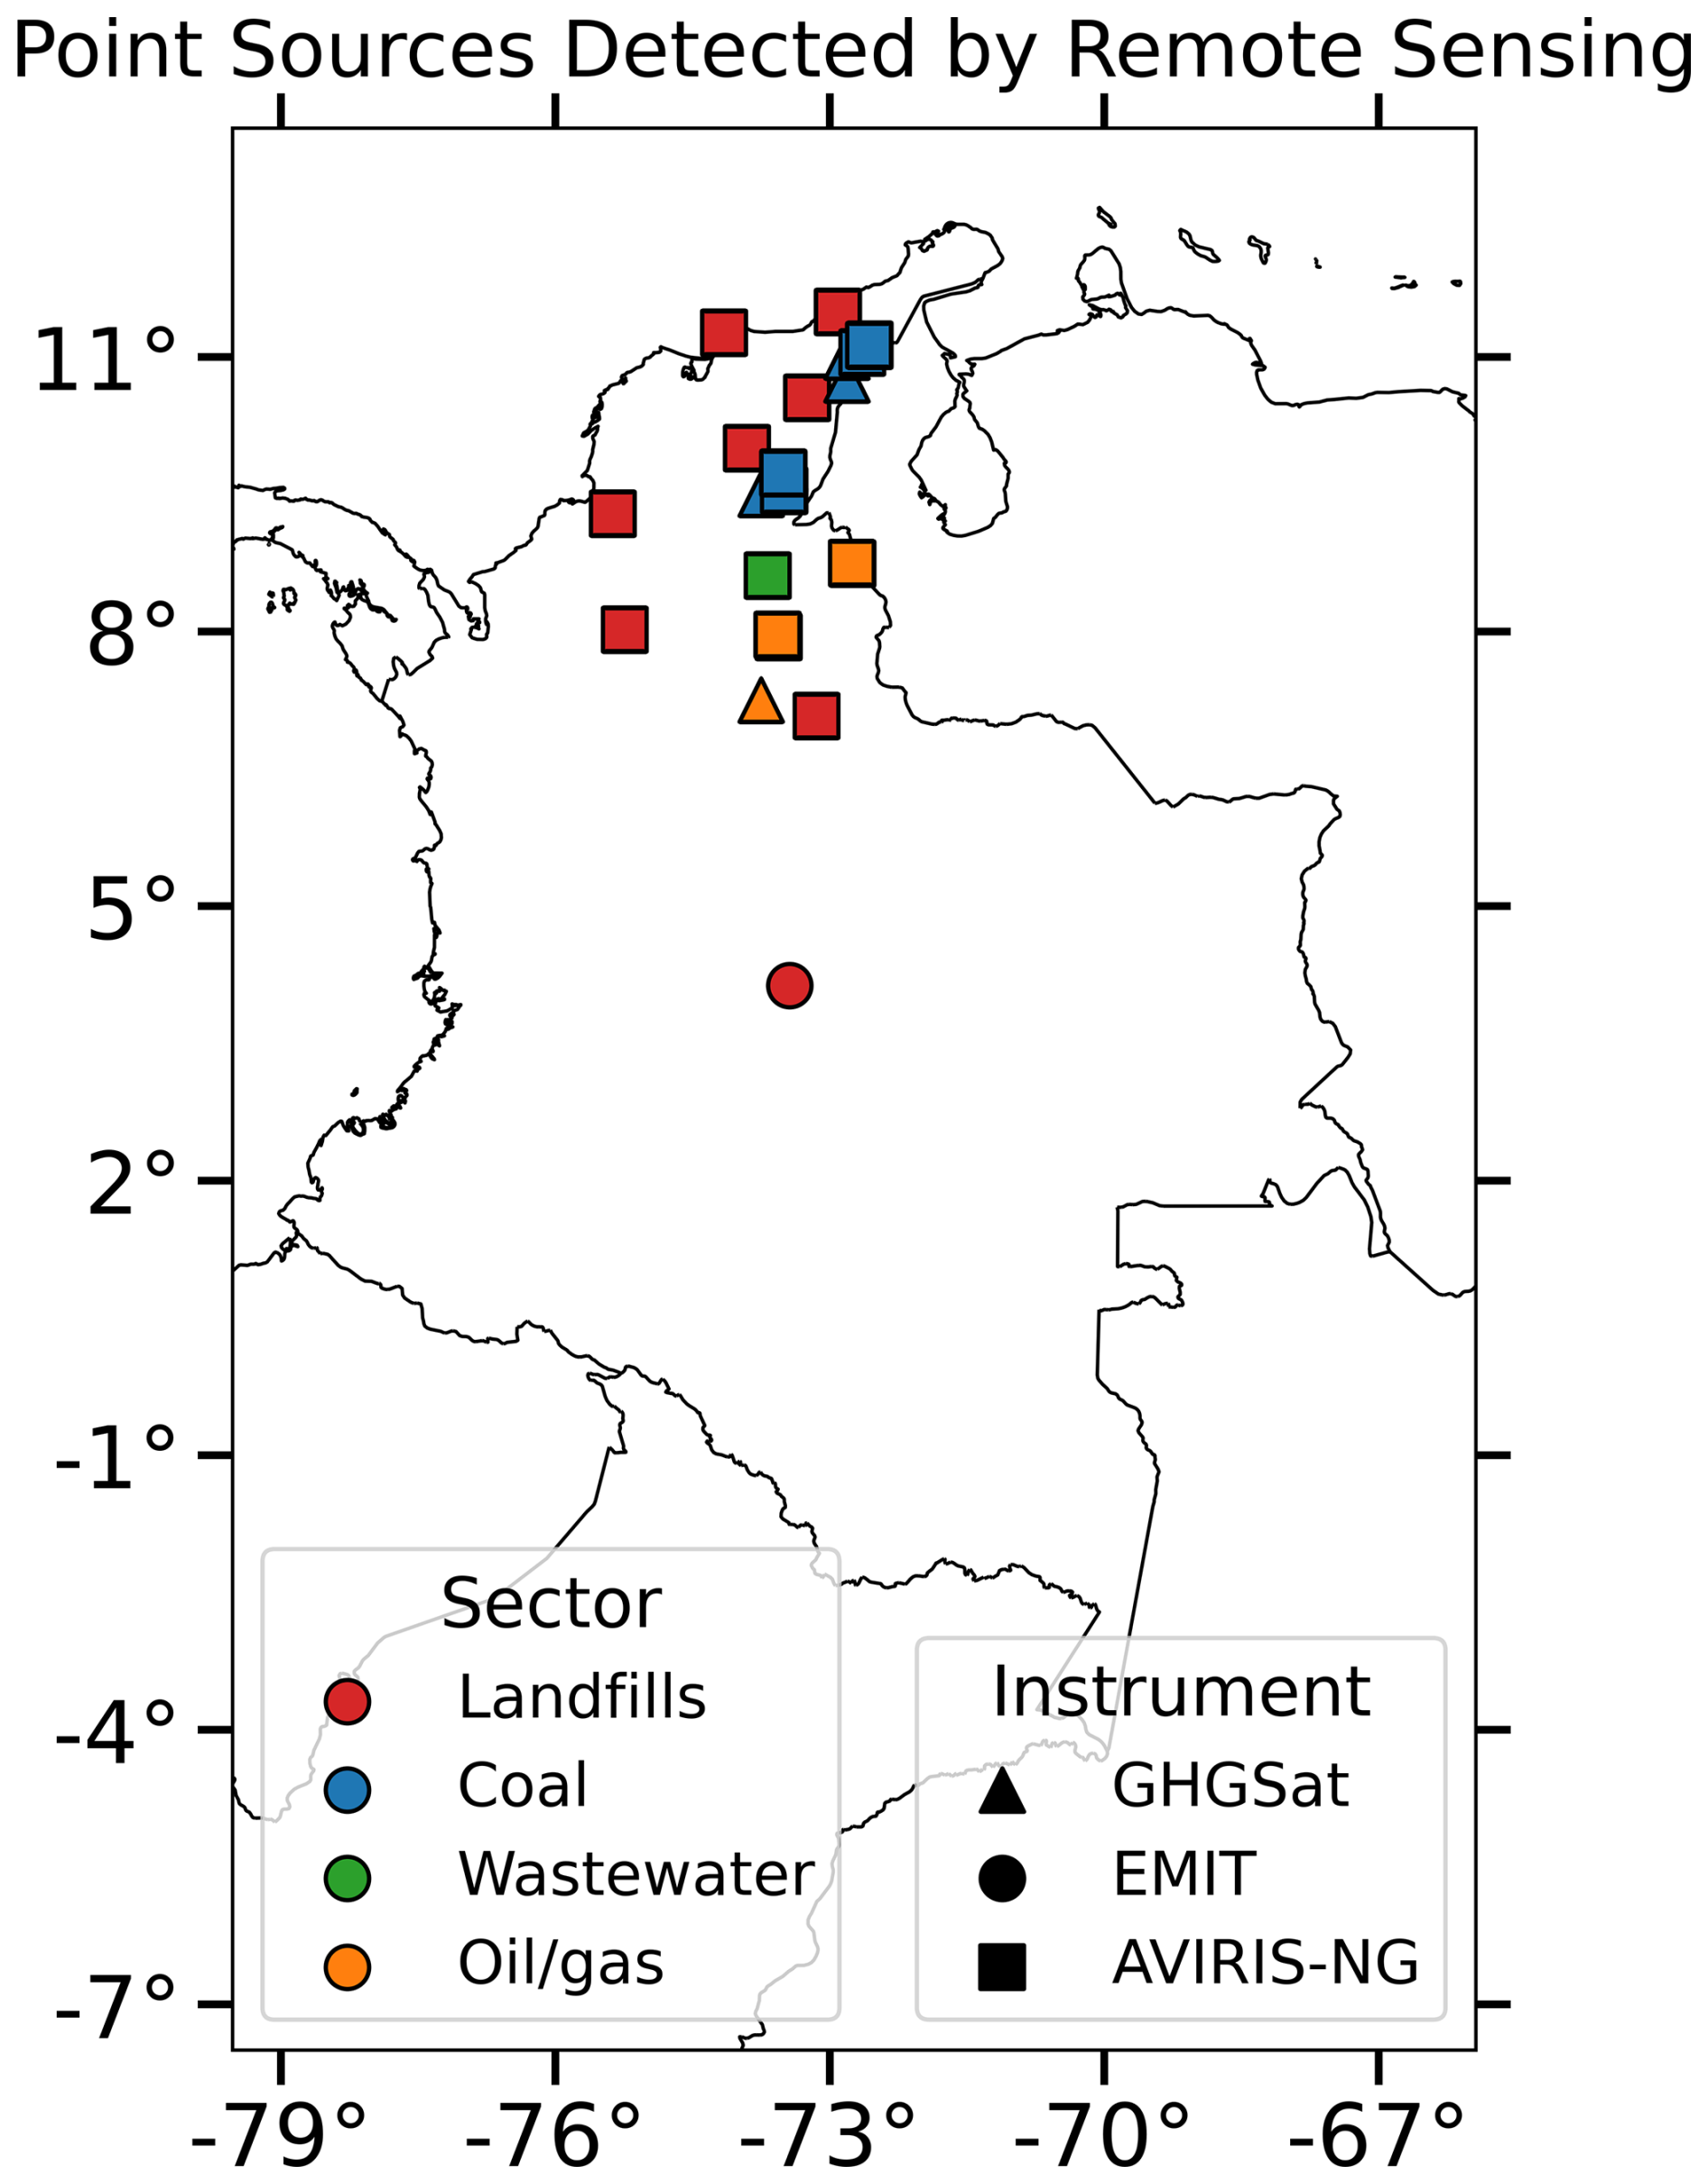
Figure 2Locations of remote sensing point source observations from the GHGSat, EMIT, and AVIRIS-NG instruments used in the construction of the spatially resolved bottom-up emission inventories for Colombia.
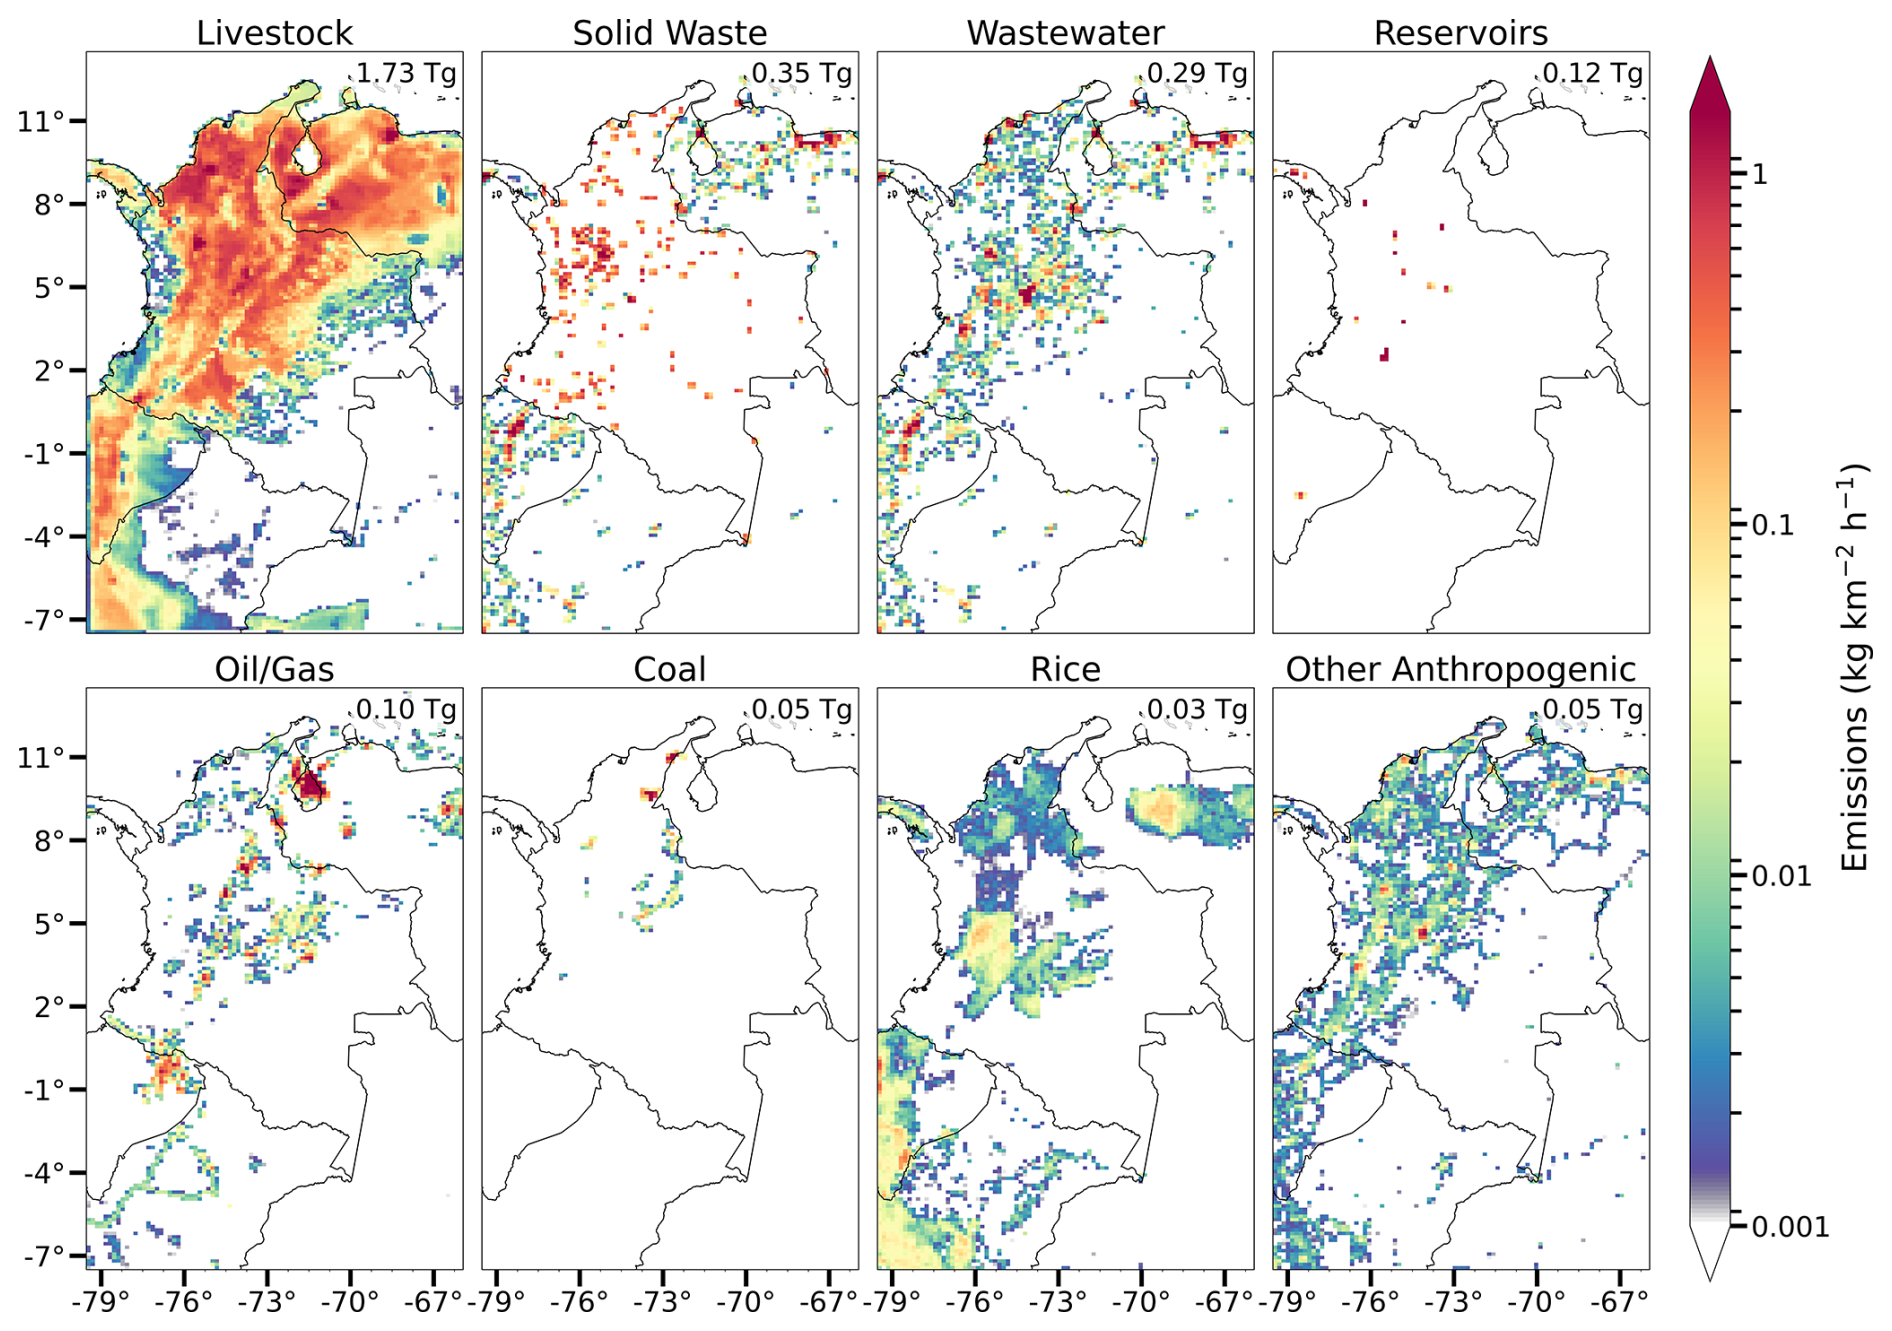
Figure 3Spatial allocation of bottom-up anthropogenic methane emissions from different sectors on the 0.125°×0.15625° grid of the inversion. Sector totals for Colombia (inset) are as in Table 1.
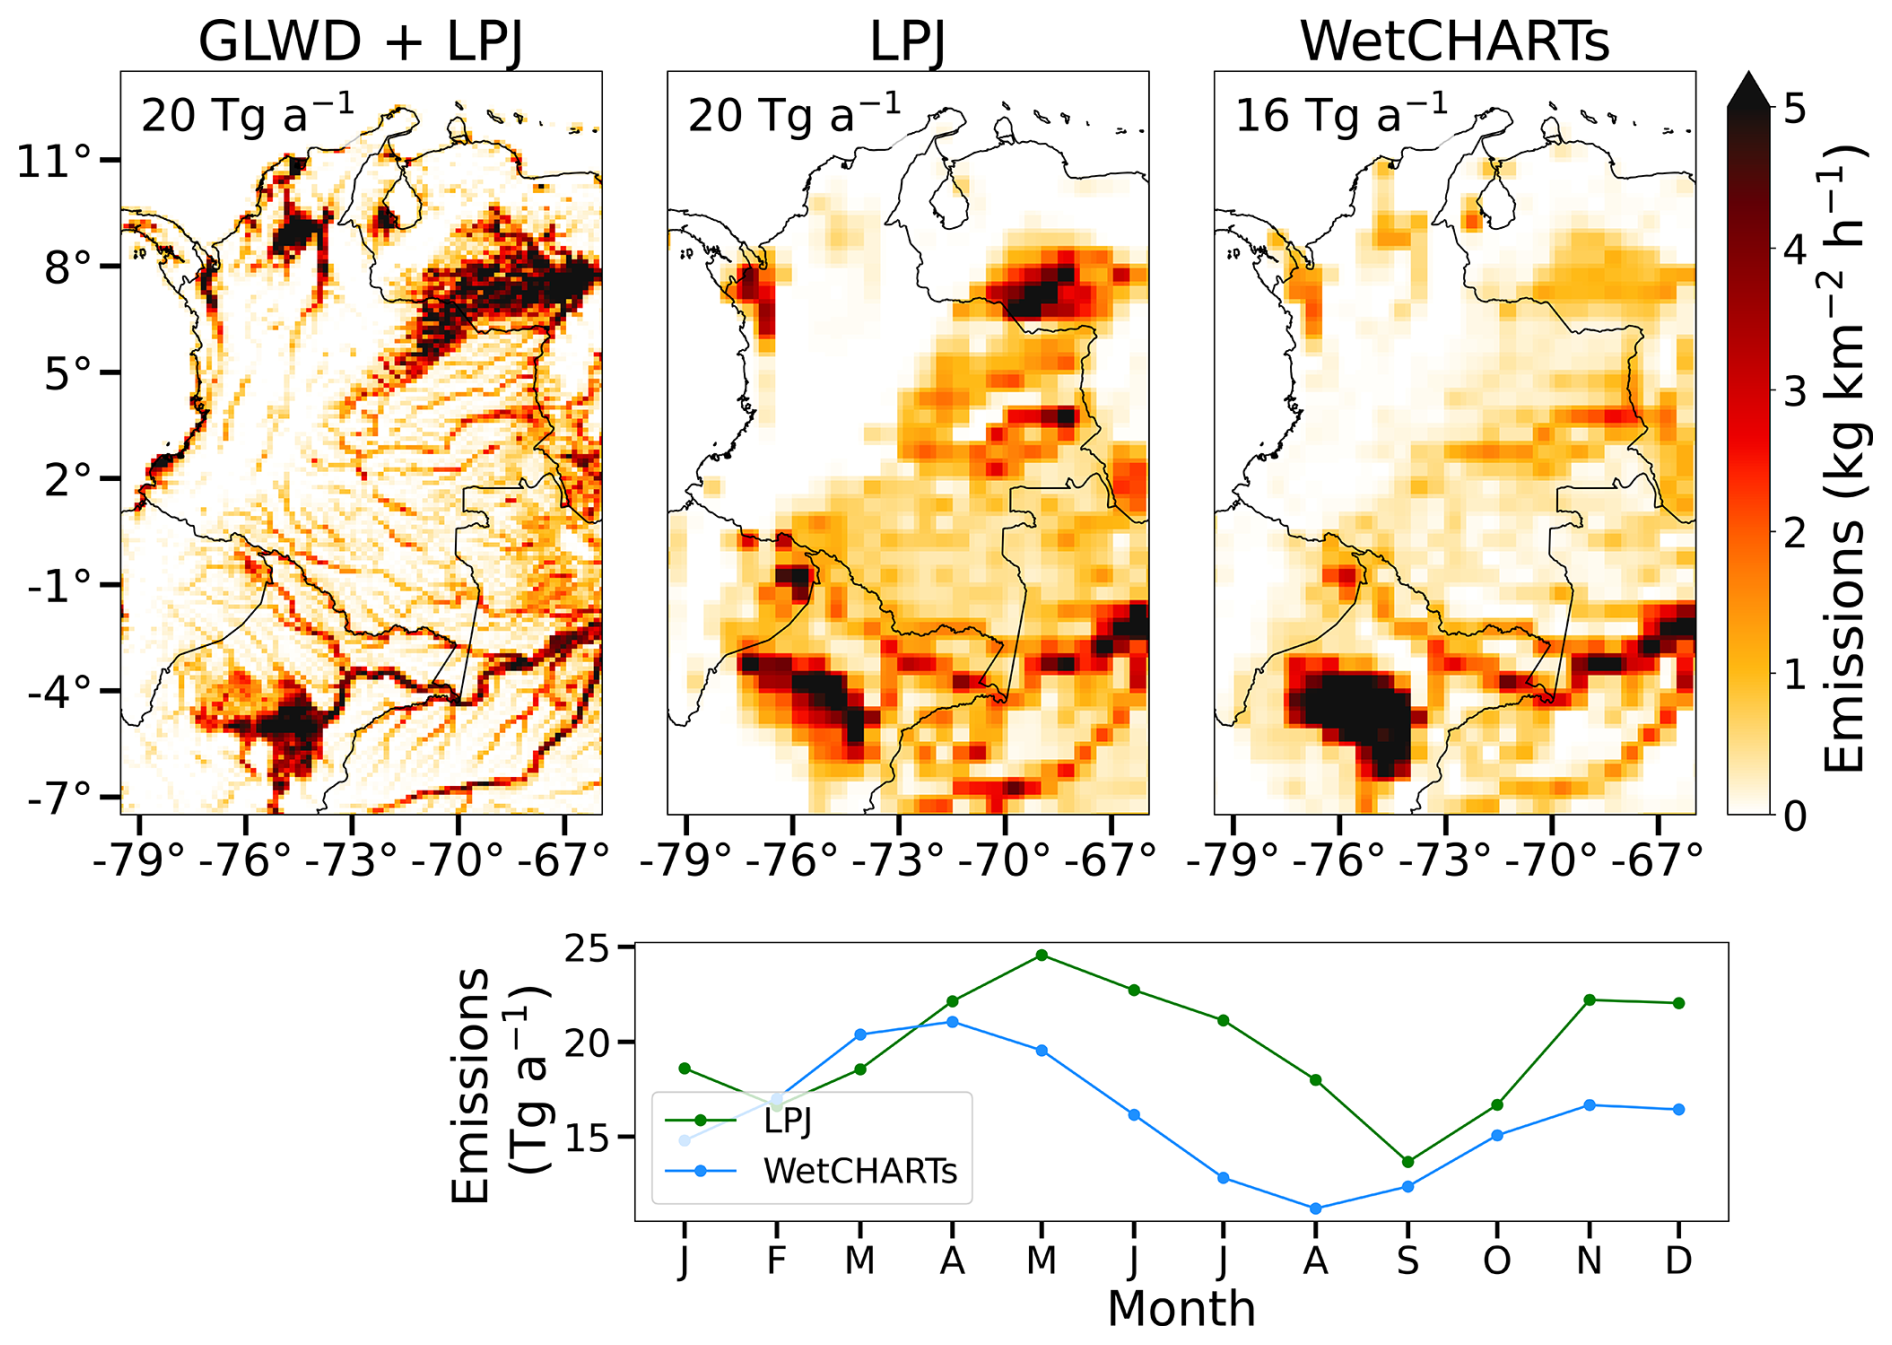
Figure 4Bottom-up wetland emission estimates from GLWD + LPJ, LPJ, and WetCHARTs. LPJ is driven by meteorological data from NASA MERRA-2 for 2023 (Zhang et al., 2018). WetCHARTs is the 2010–2019 mean from the nine high-performance members (Ma et al., 2021). GLWD + LPJ is on the km2 grid of the inversion, while LPJ and WetCHARTs are on a km2 grid. The bottom panel shows the mean LPJ and WetCHARTs seasonalities of emissions for the domain shown in the Figure.
2.1 Livestock
Extensive research on methane emissions from cattle enteric fermentation in Colombia highlights variability in EFs driven by cattle type, diet, age, weaning systems, and regional conditions (Garrido et al., 2022; Ramírez-Restrepo et al., 2019; Caicedo et al., 2023; Vargas et al., 2018; Parra and Mora-Delgado, 2019). This information allows Colombia to use an IPCC Tier 2 methodology in its BUR, calculating EFs by cattle type for 10 distinct regions (Instituto de Hidrología, Meteorología y Estudios Ambientales (IDEAM), 2021a) that vary due to differences in genotype, climate, diet, production systems, and animal traits. These same methods are used by Ardila et al. (2025a) in their update to the BUR.
Here we use cattle enteric fermentation emissions from Ardila et al. (2025a) calculated at the municipal level based on vaccination records and allocate these emissions to pastureland and shrubland on the 0.125°×0.15625° grid within each municipality using the CORINE LCM. Non-cattle livestock contribute 4 % of Colombia's enteric fermentation emissions (Gobierno de Colombia, 2022), and we scale up our cattle emissions by 4.4 % to account for this, resulting in a total of 1.7 Tg a−1 from enteric fermentation. BUR manure management emissions are 0.067 Tg a−1 and we distribute them spatially with the EDGARv7 inventory for 2022. Seasonal variations in forage quality and dry matter intake can impact livestock enteric fermentation emissions (Demarchi et al., 2016) but this is not accounted for here.
Table 1National methane emissions in Colombia.
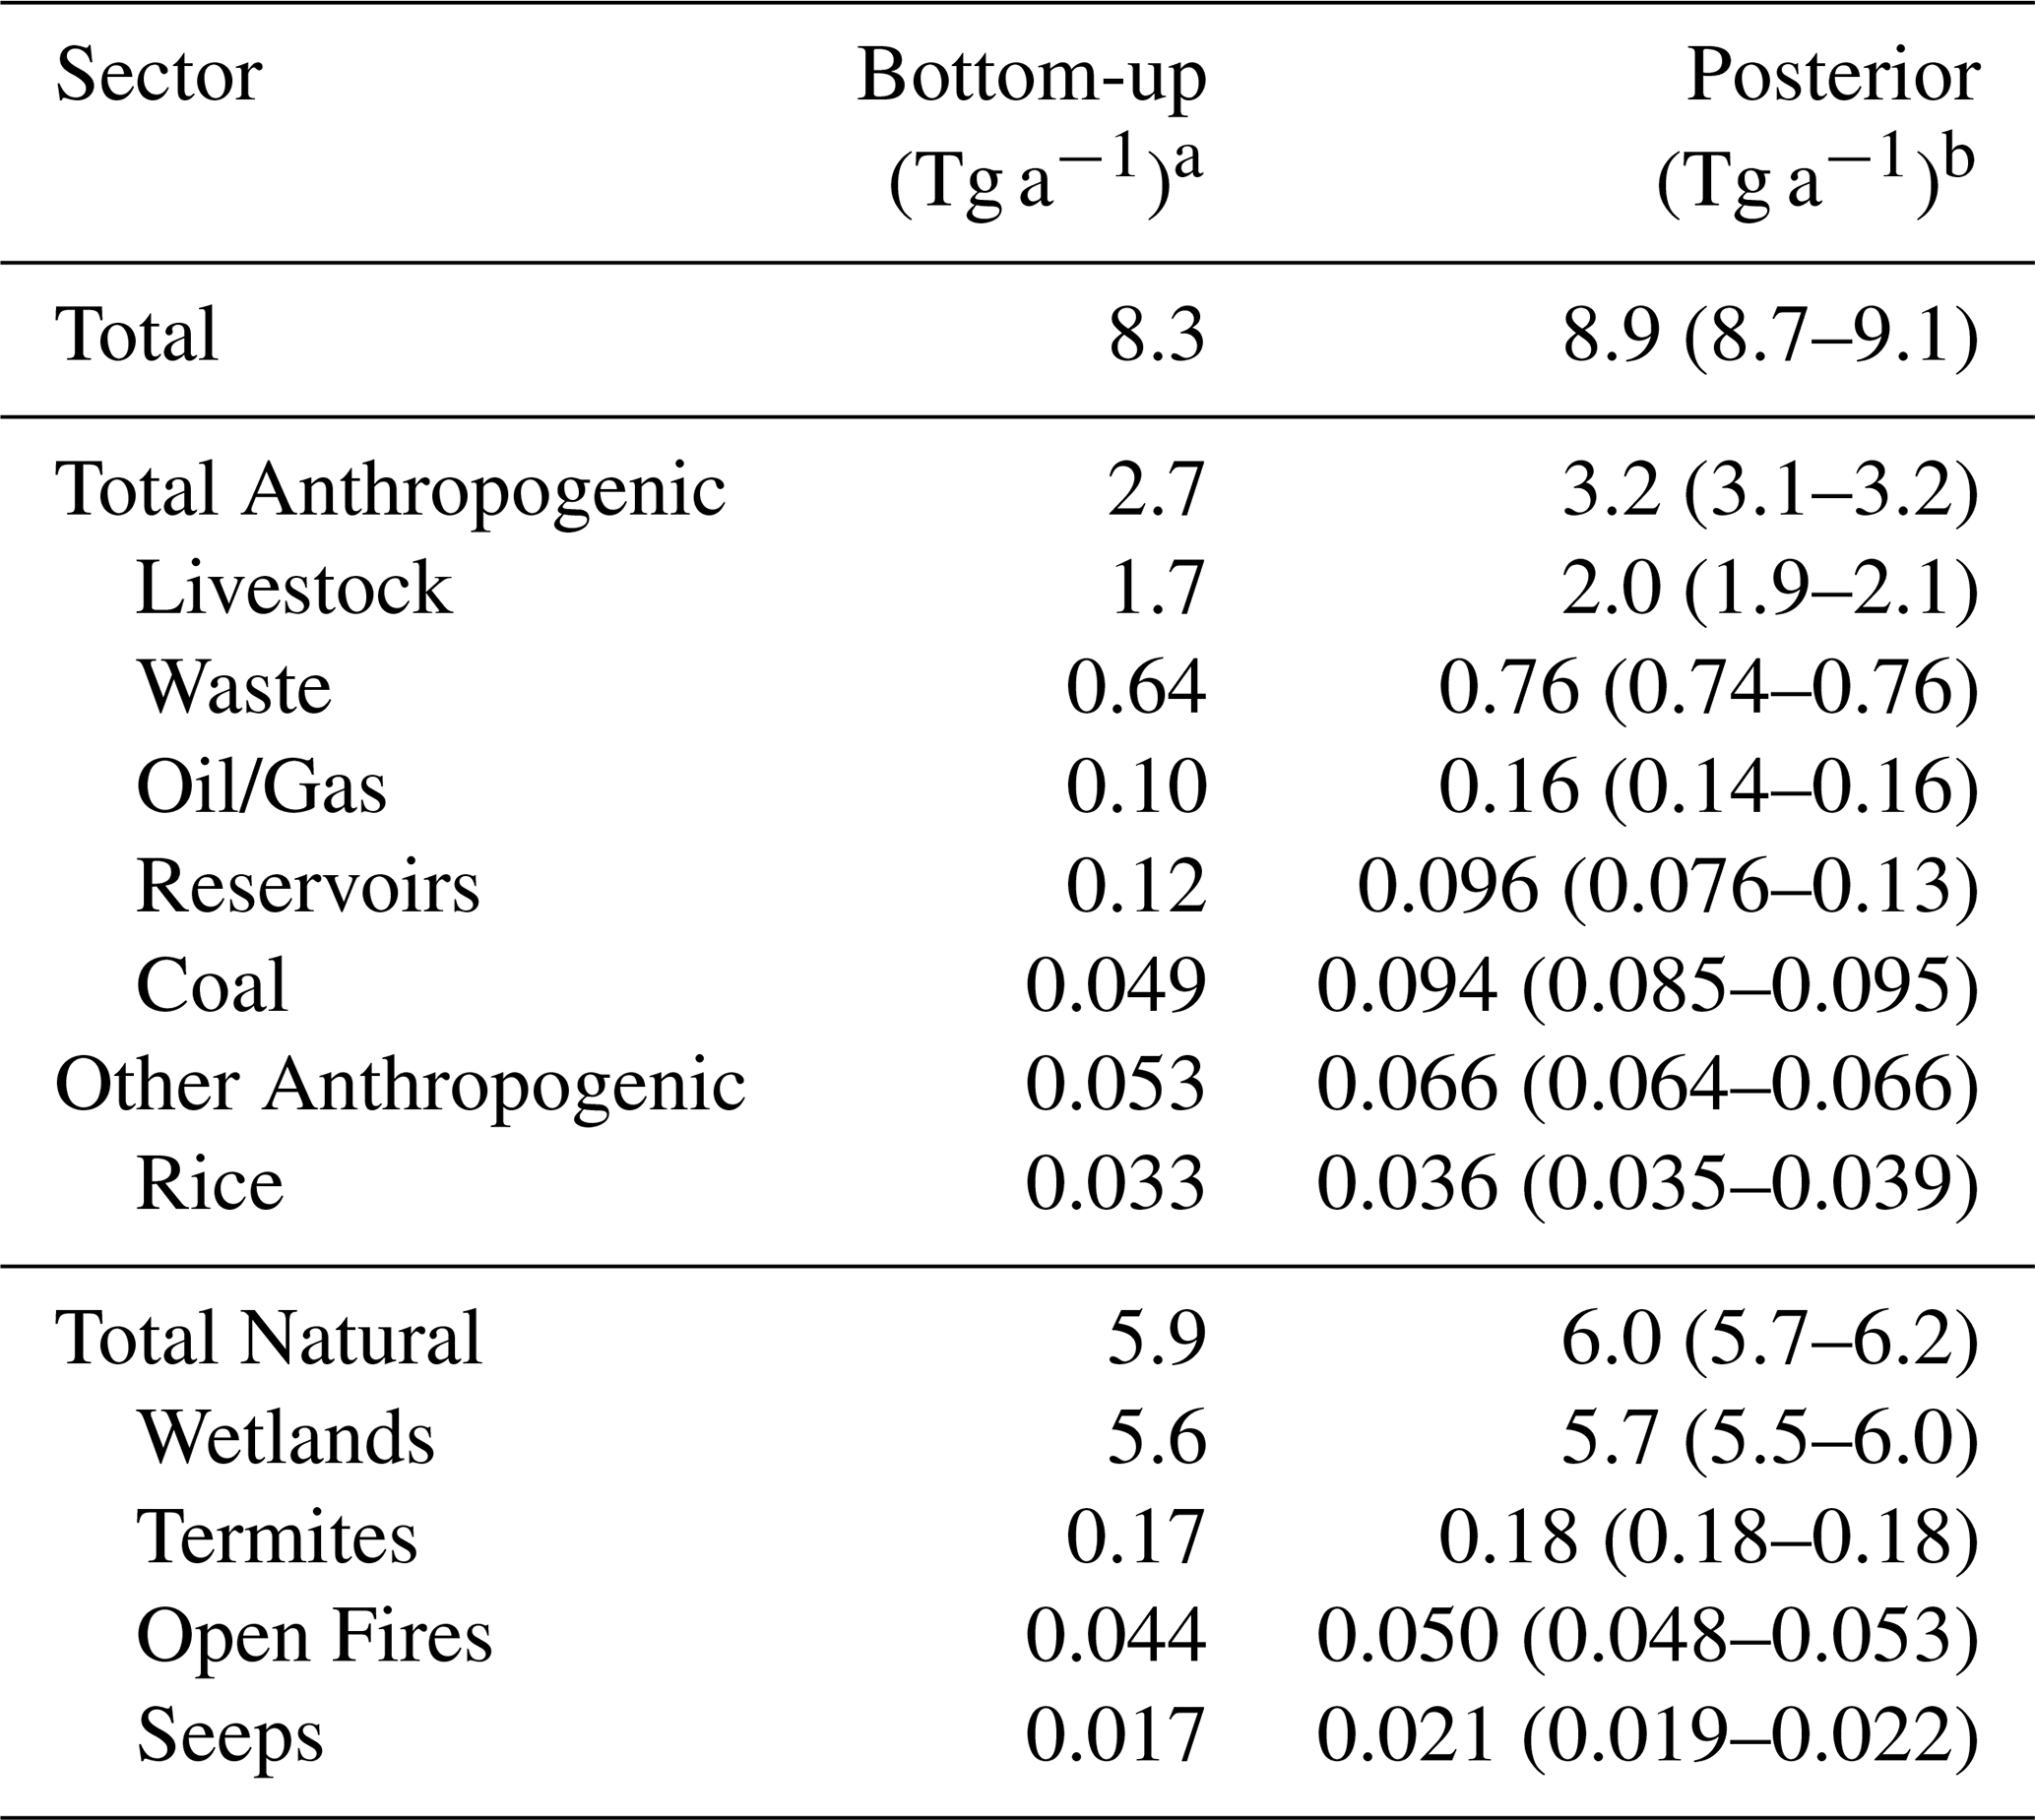
a Bottom-up anthropogenic emissions are from Colombia's third Biennial Update Report (BUR) to the UNFCCC, representing 2018 totals, with updates for livestock, coal, and waste for 2023 from Ardila et al. (2025a), additional hydroelectric reservoir emissions from ResME (Delwiche et al., 2022), and other anthropogenic emissions from EDGARv8 (Crippa et al., 2024). Wetland emissions are from our GLWD + LPJ inventory that applies fine-scale GLWD inundation data to the LPJ inventory. Other natural emissions include termite emissions from Fung et al. (1991), open-fire emissions for 2023 from GFED4s (van der Werf et al., 2017), and geological seepage emissions from Etiope et al. (2019) with global scaling to 2 Tg a−1 (Hmiel et al., 2020). b Results from the base inversion, with the range from the inversion ensemble given in parentheses.
2.2 Waste
Ardila et al. (2025a) identified 254 facility locations for solid waste and 727 for domestic wastewater using data from Colombia's Superintendent of Public Services (Superintendencia de Servicios Públicos Domiciliarios (SSPD), 2025). They estimated emissions for 20 major landfills and 12 wastewater facilities. In both Colombia's BUR and Ardila et al. (2025a), methane emissions from landfills are estimated using a first-order decay model that accounts for the amount and type of waste disposed. In the BUR, emissions from domestic wastewater are estimated using IPCC Tier 1 methods based on population data and default EFs. Ardila et al. (2025a) use the same Tier 1 EFs but with additional facility-specific information on treatment technology, flow rate, and biochemical oxygen demand, which is a measure of the organic matter present in the wastewater.
For solid waste, we first evenly distribute Colombia's latest BUR total of 0.38 Tg a−1 across all facility locations identified by Ardila et al. (2025a) and point-source observation locations (Fig. 2). We initially distribute the emissions evenly in the absence of facility-level data for each location, as the inversion can adjust their magnitude but requires prior location for sectoral attribution. Ardila et al. (2025a) estimate emissions for 20 individual facilities, so we further scale emissions at those locations to match their estimates, resulting in a national total of 0.35 Tg a−1. We do the same for wastewater, but because the 727 locations do not include industrial wastewater that makes up of Colombia's BUR wastewater emissions, we also include wastewater emission fluxes from EDGARv8 for 2022, which includes both domestic and industrial components (BUR: 0.30, our estimate: 0.29 Tg a−1). Industrial wastewater includes industries such as pulp and paper, sugar, dairy products, fertilizers, meat processing, and textiles. Colombia uses IPCC Tier 1 estimates to calculate emissions from these industries considering the different treatment and disposal methods from each industrial sector, but data gaps contribute significant uncertainty (Gobierno de Colombia, 2022). Particularly relevant is palm oil mill effluent (POME) (Ramirez-Contreras et al., 2020). Colombia's BUR references palm oil only in the context of land use change (Gobierno de Colombia, 2022), but methane plumes from POME have been detected by Carbon Mapper AVIRIS-NG flights in northern Colombia (Valverde et al., 2024). Wastewater and solid waste are highly co-located and cannot be separated in the inversion, so we refer to them collectively as waste with a national total of 0.64 Tg a−1.
2.3 Oil/gas
Oil and gas production are listed together as “hydrocarbon exploitation” in the CORINE LCM and are often co-located in GFEI, so we combine them into a single oil/gas sector. We spatially allocate Colombia's BUR total of 0.10 Tg a−1 (0.051 from oil, 0.052 Tg a−1 from gas) to oil/gas infrastructure identified by GFEIv3, the CORINE LCM, and point source observation locations (Fig. 2). GFEI distributes emissions from all upstream, midstream, and downstream sectors (Scarpelli et al., 2020). Most LCM and point source locations already have emissions in GFEIv3, so we preserve the GFEIv3 spatial distribution and assign the mean GFEIv3 value to additional such locations before scaling to match the BUR total.
2.4 Coal
91 % of Colombia's coal production is from surface mines (Gobierno de Colombia, 2022). Surface mines vent methane from disturbed coal seams and surrounding strata, but they are generally thought to emit less than underground mines because of lower gas contents in the shallow coals (Kirchgessner et al., 2000) and constitute half of coal methane emissions in Colombia's BUR. Mariño-Martínez et al. (2020) found that Colombia's basins have lower gas content than other major coal producers due to their age and geologic characteristics, but Colombian open-pit mines are deeper than average with gas content directly related to depth. Methane continues to desorb from coal during post-mining operations (processing, storage, transport), which represent 22 % of surface mining methane in the BUR. While the average EF for surface mining from Colombia's latest BUR is lower than the IPCC default (0.69 vs. 1.20 m3 CH4 t−1), the average factor for surface post-mining is much higher (0.22 vs. 0.10 m3 CH4 t−1), likely due to Colombia's bituminous coal (Global Methane Initiative (GMI), 2019), which has a high methane adsorption capacity (Cheng et al., 2017).
For the coal bottom-up estimate, we use municipality-level coal emissions from Ardila et al. (2025a), evenly spatially distributed within each municipality over active coal mines (Agencia Nacional de Minería, 2024), coal point source locations (Fig. 2), and infrastructure identified by GFEIv3 (Scarpelli et al., 2025) and the CORINE LCM. Ardila et al. (2025a) use IPCC Tier 2 methodology, multiplying coal production by measurement-based basin-specific EFs, resulting in a national total estimate of 0.049 Tg a−1 for 2023. This estimate is much smaller than Colombia's BUR total of 0.12 Tg a−1 for 2018, reflecting a 40 % decrease in coal production from 2018 to 2023 (Unidad de Planeación Minero Energética (UPME), 2025).
2.5 Other anthropogenic
Colombia reports hydroelectric reservoir emissions only for the first 10 years after dam construction, following IPCC 2006 guidelines, resulting in a 2018 total of just 0.006 Tg a−1 from two reservoirs (Gobierno de Colombia, 2022). However, methane continues to be emitted beyond this period (Soued et al., 2022), including from turbine degassing (Delwiche et al., 2022). To better reflect these ongoing emissions, we use seasonal estimates from ResME (0.12 Tg CH4 yr−1) for 12 individual reservoirs in Colombia (Delwiche et al., 2022). Emissions vary widely across reservoirs, ranging from 1 to 40 Gg a−1, and this variability is primarily driven by differences in reservoir size and hydrological inputs, not the date of construction.
Rice is a small emission source for which we spatially allocate the BUR total of 0.03 Tg a−1 using EDGARv8 and additional locations from the CORINE land cover map. EDGARv8 includes other minor anthropogenic emissions missing from the BUR and totaling 0.05 Tg a−1, mostly from energy use in buildings (0.04 Tg a−1) but also from power generation, industrial combustion, aviation, transportation, shipping, chemical production, iron and steel manufacturing, and solid waste incineration. We use EDGARv8 gridded data for these emissions, largely based on population, without adjustment to the BUR totals.
2.6 Natural sources
We use the GLWDv2 static wetland extent map (Lehner et al., 2025) with 15 arcsec resolution, regridded to 0.125°×0.15625°, to define the spatial distribution of wetlands in the inversion domain (Fig. 4). Methane emission totals for our inversion domain are from the LPJ-EOSIM global wetland emission inventory driven by meteorological data from NASA MERRA-2 for 2023 (Zhang et al., 2023; Colligan et al., 2024), henceforth referred to as LPJ. We spatially distribute the LPJ monthly domain totals across the 0.125°×0.15625° grid of our inversion following the GLWDv2 distribution, such that emissions are allocated proportionally to the wetland fraction within each grid cell. We refer to the resulting gridded monthly emissions as GLWD + LPJ.
Figure 4 shows the GLWD + LPJ emissions compared to LPJ and to the mean of the high-performance subset of the WetCHARTs inventory ensemble (Ma et al., 2021). Difference plots are in Fig. S1 in the Supplement. Both LPJ and WetCHARTs have 0.5°×0.5° native resolution. They show similar spatial distributions, with most emissions in the southeastern half of the country. They have similar seasonality, with maxima in April–May and November–December. GLWD + LPJ preserves LPJ's domain-wide seasonal cycle, but because emissions are allocated by the static GLWDv2 wetland fractions, every grid cell follows the same seasonal profile. GLWD + LPJ provides finer spatial definition to better separate wetland from other emissions on our 0.125°×0.15625° inversion grid. It also identifies the La Mojana wetland region in northern Colombia, which is co-located with livestock production and where we see a large seasonal TROPOMI enhancement (Fig. 5) that implies wetland emissions.
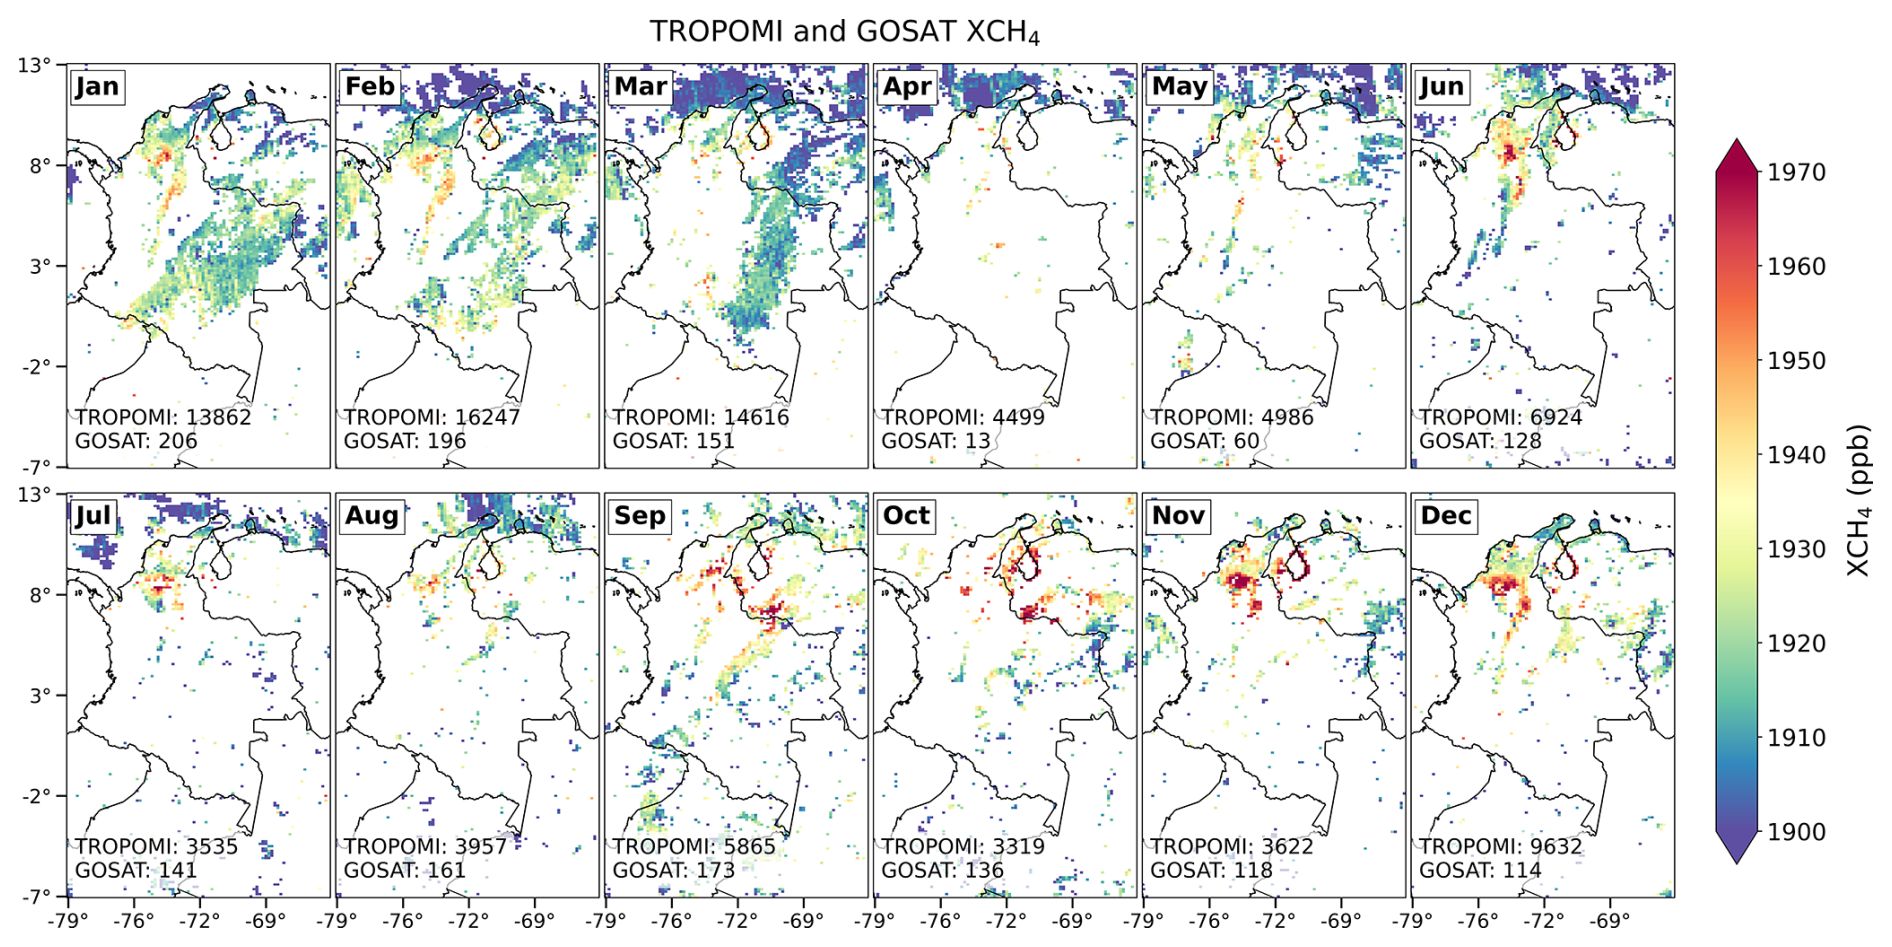
Figure 5Atmospheric methane concentrations from TROPOMI and GOSAT over the inversion domain in 2023. Mean dry-column methane mixing ratios (XCH4) are shown on the native inversion grid (0.125°×0.15625°) for each month, with the number of observations given in each panel.
Other natural sources are termite emissions from Fung et al. (1991) (0.17 Tg a−1), daily open-fire emissions for 2023 from the Global Fire Emissions Database version 4s (GFED4s) (0.04 Tg a−1) (van der Werf et al., 2017), and geological seepage emissions from Etiope et al. (2019) (0.02 Tg a−1) with global scaling to 2 Tg a−1 (Hmiel et al., 2020).
We optimize a state vector of mean methane emissions for 2023 over a rectilinear inversion domain encompassing Colombia and neighboring regions (−7.125 to 13.125° latitude, −79.28125 to −66.6875° longitude, domain of Fig. 2) using methane observations from TROPOMI (Sect. 3.1) with the GEOS-Chem chemical transport model at 0.125°×0.15625° resolution ( km2). We use GOSAT methane observations for independent evaluation of the inversion results. We optimize emissions for 2023 because this is the year for which the most recent bottom-up emission estimates are available (Ardila et al., 2025a), together with point-source observations that we use as independent information to evaluate and interpret inversion results. We obtain posterior estimates of the state vector via an analytical solution for the minimum of the Bayesian cost function (Sect. 3.2). Inversion results are attributed to methane emission sectors and regions following the methodology in Sect. 3.3, and an ensemble of sensitivity inversions varying inversion parameters is performed to characterize posterior uncertainties (Sect. 3.4).
3.1 TROPOMI and GOSAT satellite observations
TROPOMI is carried on the polar sun-synchronous Sentinel-5 Precursor satellite, providing full global daily coverage with a 13:30 local overpass time. TROPOMI offers a spatial resolution of 7×5.5 km2 in the nadir but has a global retrieval success rate over land of only 3 % for methane in the 2.3 µm absorption band limited by clouds and dark or heterogeneous surfaces (Veefkind et al., 2012). We use the blended TROPOMI product from Balasus et al. (2023) (https://registry.opendata.aws/blended-tropomi-gosat-methane, last access: 19 June 2025), which applies a machine-learning-based correction to the TROPOMI v02.04.00 operational product of Lorente et al. (2023) using information from co-located GOSAT retrievals. We include glint observations over the ocean, even though Colombia's offshore emissions are minimal, as they help to better constrain onshore coastal sources. To exclude unphysical outliers, we omit 1289 TROPOMI observations that are more than 25 ppb below a GEOS-Chem simulation with emissions in the domain turned off. We are left with 91 064 successful TROPOMI retrievals for 2023, which we average over 0.125°×0.15625° GEOS-Chem grid cells ( km2) to yield mTROPOMI=32 135 super-observations (Rijsdijk et al., 2025).
TROPOMI observations are ingested into the inversion while GOSAT observations are used for independent evaluation of the inversion results. Launched in 2009, GOSAT provides 10 km diameter pixels separated by ≈250 km along-track and cross-track with a 13:00 local overpass time. It observes methane in the 1.6 µm absorption band, using a CO2 proxy method that corrects for surface and aerosol retrieval errors and results in a retrieval success rate of 27 % over land limited mainly by clouds (Parker et al., 2020). We use the GOSAT v9.0 proxy retrieval from Parker and Boesch (2020). To remove the global mean bias versus the latest TCCON following Balasus et al. (2023), we subtract 9.2 ppb from all GOSAT observations. Again, these observations include a glint mode over the oceans. This yields mGOSAT=1597 observations for 2023 used to evaluate inversion results.
Figure 5 shows the resulting TROPOMI and GOSAT monthly XCH4 data in 2023. Observations from both instruments are densest in January–March, corresponding to the principal dry season, and GOSAT observations are also dense in July–September, corresponding to the second dry season. TROPOMI observations are unavailable 10–30 August due to outage of the Visible Infrared Imaging Radiometer Suite (VIIRS) instrument used for cloud clearing.
3.2 Analytical inversion
For analytical inversion of the TROPOMI data, we use the Integrated Methane Inversion framework (IMI 2.0) (Estrada et al., 2025). We use the nested version of the GEOS-Chem 14.4.1 chemical transport model (https://doi.org/10.5281/zenodo.12584192) as the forward model for the inversion to relate methane emissions to atmospheric concentrations. GEOS-Chem is driven by meteorological fields from NASA Goddard Earth Observing System – Forward Processing (GEOS-FP) assimilated data at 0.125°×0.15625° ( km2) resolution (Wang et al., 2026a, b). We use this resolution in GEOS-Chem (domain of Fig. 2) with dynamic boundary conditions outside the inversion domain from a global archive of smoothed TROPOMI observations (Estrada et al., 2025). We do not optimize the sinks included in the GEOS-Chem methane simulation (chemical loss from oxidation by tropospheric OH, minor losses from oxidation by tropospheric Cl, oxidation in the stratosphere, and uptake by soils, Murguia-Flores et al., 2018) because they have relatively uniform distributions over the domain and are effectively corrected through optimization of the boundary conditions. A TROPOMI observation operator is applied to convert GEOS-Chem vertical profiles to XCH4 and thus mimic the observations (Varon et al., 2022).
We perform the Bayesian analytical inversion with normal error probability density functions (pdfs) for prior emissions and for observations (Brasseur and Jacob, 2017). This method optimizes the state vector x, which includes the emissions and boundary conditions for each domain edge (north, south, west, east), by minimizing the cost function J(x):
where xa(n) is the prior estimate, y(m) is the vector of TROPOMI super-observations, Sa(n×n) is the prior error covariance matrix, and So(m×m) is the observational error covariance matrix. Both Sa and So are assumed to be diagonal, with specified error variances but no covariances for lack of information. We assume prior error standard deviations of 100 % for emissions on the 0.125°×0.15625° grid and 10 ppb for boundary conditions. is the Jacobian matrix that is constructed by perturbing individual elements of x in GEOS-Chem, and describes the sensitivity of atmospheric methane concentrations to changes in emissions. We optimize annual mean emissions, so the inversion assumes that the sub-annual temporal variability of emissions follows that of the prior estimate, with K carrying the effect of that seasonality into the inversion. The regularization factor γ is used in the IMI to prevent overfitting to observations, but this is not an issue here because of our high resolution and relatively sparse observations and hence we use γ=1. By solving for the cost function minimum, the inversion yields the optimized posterior emissions and the corresponding posterior error covariance matrix and averaging kernel matrix A defining the sensitivity of the solution to the true value as described in Brasseur and Jacob (2017).
The most computationally expensive step of the inversion is the column-by-column construction of the Jacobian matrix K by successive GEOS-Chem simulations perturbing individual state vector elements. Recent improvements to the GEOS-Chem configurations to construct K have sped up this process by an order of magnitude (Estrada et al., 2025), allowing us to construct K at native 0.125°×0.15625° resolution over the entire rectilinear domain of Fig. 2 (12 026 elements). We use a native-resolution state vector in the results that follow, along with optimized boundary conditions for four quadrants for a total of n = 12 030 state vector elements.
To estimate observational error variances including contributions from the TROPOMI instrument, the retrieval, and the forward model, we use the residual error method (Heald et al., 2004) to estimate the observational error on the forward model grid using the residual error between the satellite observations and the forward model simulation with prior estimates. We specifically employ the residual error method for super-observations developed by Chen et al. (2023) to account for the error reduction from averaging P individual TROPOMI retrievals into super-observations y on the GEOS-Chem 0.125°×0.15625° grid. We separate the contributions in the individual observations from the transport error variance and the satellite single-retrieval error variance () to calculate the observational error variance of the super-observations ():
where rretrieval is the retrieval error correlation coefficient for the individual observations in a 0.125°×0.15625° grid cell averaged into a super-observation. is perfectly correlated for the individual observations within a GEOS-Chem grid cell. For our inversion domain, the result of the fit of residual errors to Eq. (2) is σtransport=7.4 ppb, σretrieval=10.2 ppb, and rretrieval=0.29, with a mean observational error standard deviation for the TROPOMI super-observations of 11.4 ppb.
3.3 Attributing posterior emissions to regions and sectors
We use a summation matrix W(p×n) to map the posterior state vector (n) onto the p individual source sectors and/or regions of the inversion domain. The rows of W are given by the fractional contribution of the sector and/or region to the prior emission estimate in each individual grid cell (Nesser et al., 2024). The resulting matrix W denotes the linear transformation from the posterior state vector to a reduced state vector (p) of regional or sectoral emissions. We then compute the reduced state vector (), posterior error covariance (), and averaging kernel matrix (Ared) as:
where is the Moore-Penrose pseudo-inverse of W (Calisesi et al., 2005). An important aspect of this approach is that the prior contribution to emissions in each grid cell is retained when attributing the spatial distribution of the posterior prior emission ratio from the inversion. Thus the prior distribution has a strong imprint on the posterior distribution, and spatial overlap between sectors in the prior estimate limits the ability to separate them in the posterior estimate. The higher spatial resolution of our inversion as compared to previous IMI applications should help in that regard.
3.4 Inversion ensemble
The base inversion described above assumes specific choices of inversion parameters including a prior error standard deviation on emissions σe=100 % and an error standard deviation σb=10 ppb for boundary conditions. To account for uncertainties in the choice of inversion parameters and to better represent national-scale uncertainties, we generate a 9-member ensemble of sensitivity inversions varying σe (50 %, 100 %, or 200 %) and σb (5, 10, or 20 ppb), and we report the range of solutions given by this subset as an estimate of the posterior uncertainty. We report the best posterior estimate of emissions as the base inversion with the median choice of inversion parameters, σe=100 % and σb=10 ppb.
Figure S2 shows that the ensemble range is the most conservative measure of uncertainty at all aggregation scales. The posterior standard deviation from follows the reference closely, where L is the aggregation length scale, indicating that the off-diagonal structure in does not substantially increase aggregated uncertainty at regional scales. The standard deviation across ensemble-member means decreases more slowly, showing that sensitivity to inversion parameter choices persists with aggregation. The ensemble standard deviation including the posterior variance of each ensemble member is larger at fine scales, but converges toward the ensemble standard deviation with increasing aggregation as the contribution from member-specific posterior variance becomes small. This supports the use of the ensemble range as a conservative uncertainty estimate for the inversion.
Figure 6 shows the bottom-up and posterior emission estimates on the 0.125°×0.15625° grid for the base inversion. We see a small net upward adjustment to total emissions over Colombia from 8.3 to 8.9 (8.7–9.1) Tg a−1, where values in parentheses indicate the range from the inversion ensemble, reflecting offsets between larger positive or negative local adjustments. Adjustments are heavily concentrated in specific regions including the coal-oriented Cesar and Guajira departments, the inter-Andean region, and parts of the Orinoquia region bordering Venezuela. Figure 7 shows that posterior emissions decrease the mean GEOS-Chem model bias relative to the TROPOMI observations over the inversion domain from 3.5 to 0.7 ppb, and the root-mean-square error (RMSE) from 15 to 13 ppb, indicating that the inversion effectively fits the emissions to the satellite data used in the inversion (improvement in the RMSE is limited by the observational error averaging 11.4 ppb). Most of the correction is in northern Colombia, where the inversion sensitivity to the satellite observations (Fig. S3) is largest, reflecting the observation density.
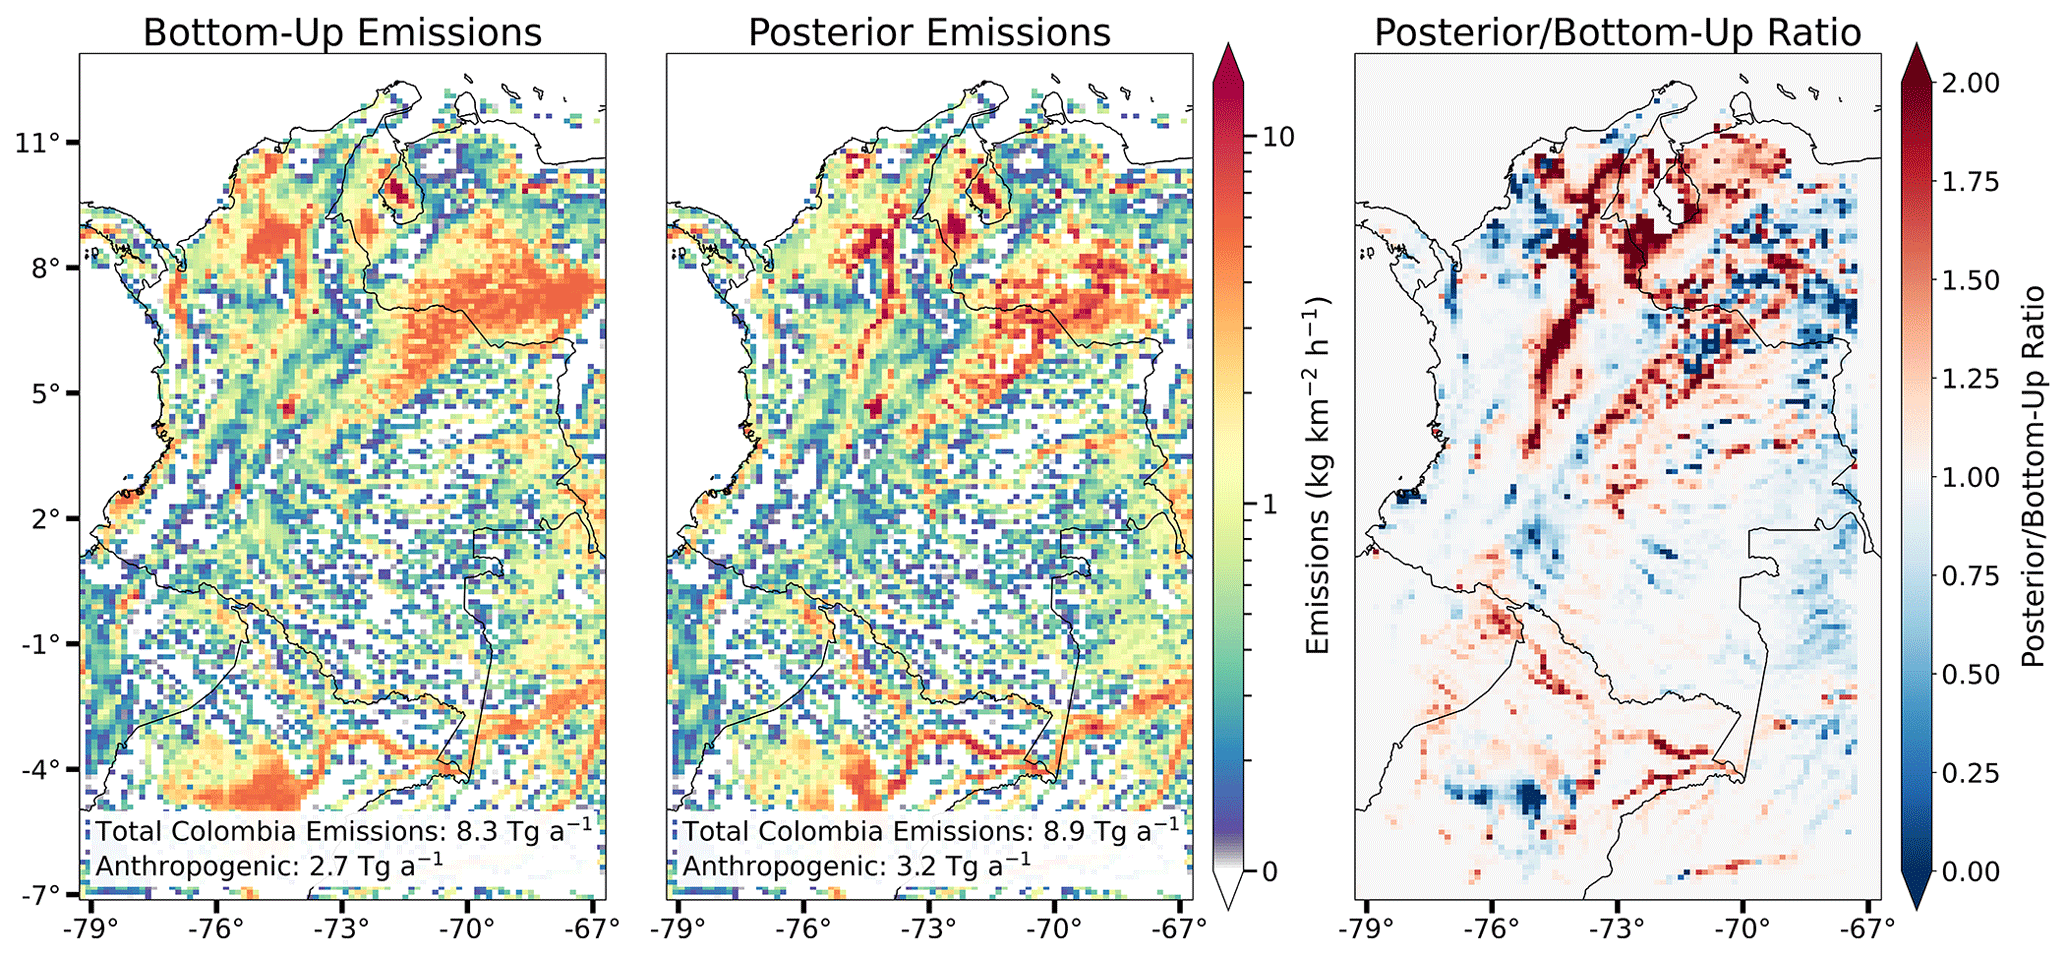
Figure 6Optimization of 2023 methane emissions over Colombia on the 0.125°×0.15625° grid. Prior bottom-up emissions for Colombia are as given in Table 1 and shown in Fig. 3 for anthropogenic sectors and Fig. 4 for wetlands (GLWD + LPJ). Anthropogenic emissions outside Colombia are from GFEIv3 for fuel, EDGARv7 for livestock, ResME for hydroelectric reservoirs, and EDGARv8 for all other sectors. Posterior emissions are from our base inversion of TROPOMI observations. Total Colombia emissions and their anthropogenic component are inset. The right panel gives the ratio of posterior to prior bottom-up emissions. Grid cells with near-zero bottom-up emissions are shown in white in all panels.
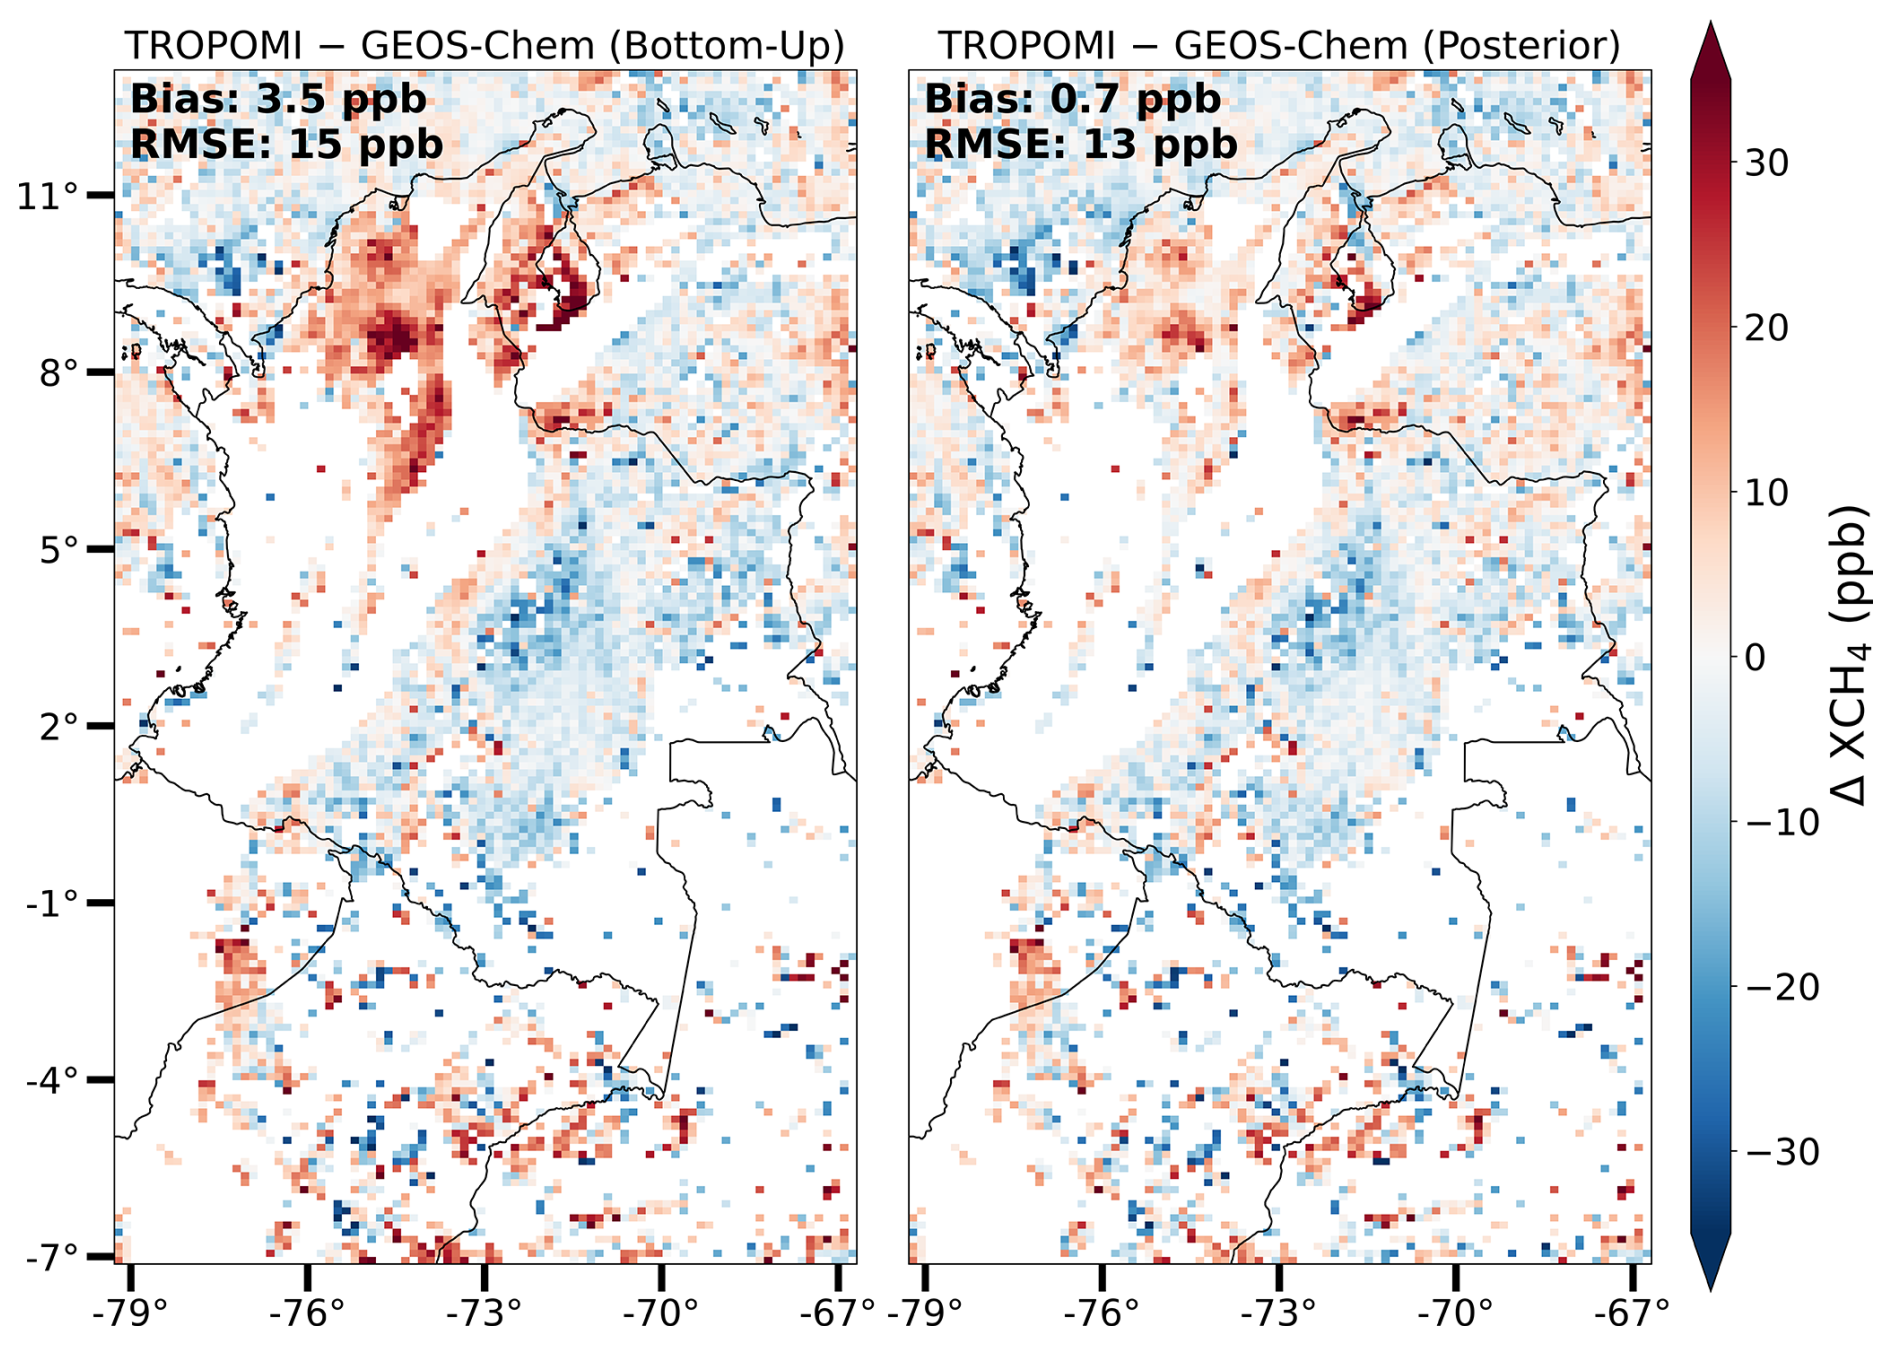
Figure 7Differences between methane dry-column mixing ratios (ΔXCH4) observed by TROPOMI and simulated by GEOS-Chem with bottom-up emissions (left panel) and posterior emissions (right panel). The mean bias and root-mean-square errors (RMSEs) are given inset. Grid cells with no satellite observations are shown in white.
Figure 8 shows an independent evaluation against GOSAT observations for 2023. Prior and posterior simulations were sampled using the GOSAT observation operator for direct comparison with the observations. The posterior simulation shows a reduction in bias from 17.1 to 15.0 ppb; most of the remaining bias is due to the mean difference between TROPOMI and GOSAT observations (9.8 ppb; Fig. 8, right panel). The RMSE decreases from 23.0 to 21.1 ppb, while the correlation coefficient increases from 0.60 to 0.64. The reduced major axis (RMA) slope also decreases from 1.37 to 1.24. The posterior emissions are therefore better able to simulate the GOSAT observations than the prior emissions.
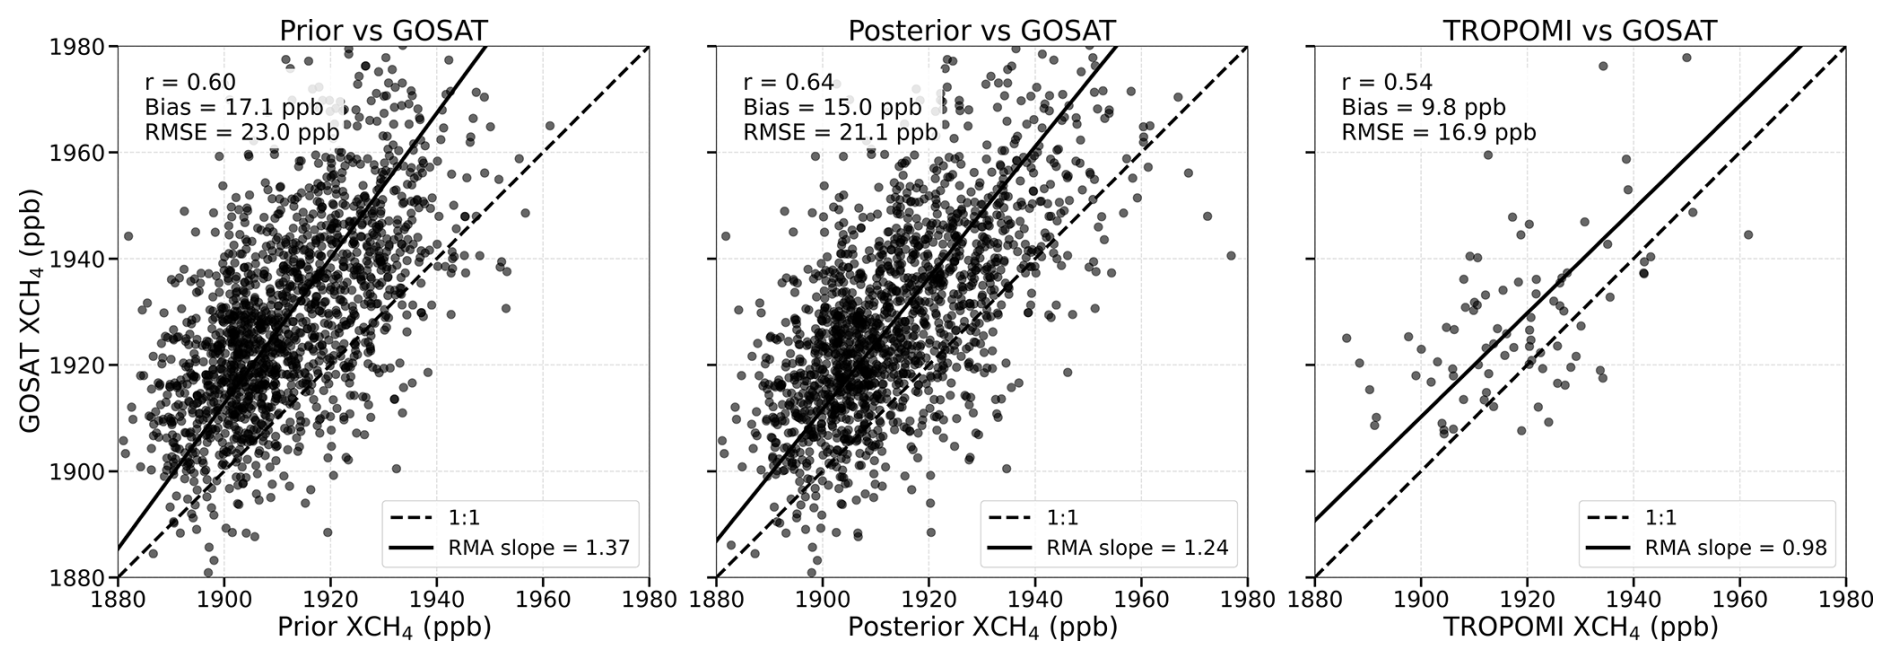
Figure 8Comparison of GOSAT XCH4 observations over the inversion domain with collocated prior simulation XCH4 (left), posterior simulation XCH4 constrained by TROPOMI observations (center), and TROPOMI XCH4 observations (right). For comparison with GOSAT, the prior and posterior simulations were sampled using the GOSAT observation operator. Dashed lines show the 1:1 relationship and solid lines show reduced major axis (RMA) regressions. Correlation coefficients, mean biases, and root-mean-square errors (RMSEs) relative to GOSAT are given inset.
Almost all the upward adjustment to emissions over Colombia is from anthropogenic sources, which are 2.6 in the BUR but 3.2 (3.1–3.2) Tg a−1 in our posterior estimate. Table 1 and Fig. S4 show the bottom-up and posterior national emission totals for all sectors, while Fig. S5 shows differences spatially for major sectors. Wetland total emissions in Colombia do not change significantly (from 5.6 to 5.7 (5.5–6.0) Tg a−1). We find upward adjustments to the major sectors including livestock (+0.3 (0.2–0.4) Tg a−1 or 18 %), waste (+0.12 (0.10–0.12) Tg a−1 or 19 %), oil/gas (+0.06 (0.04–0.06) Tg a−1 or 60 %), and coal (+0.04 (0.04–0.04) Tg a−1 or 92 %). The posterior emission estimate for coal of 0.094 Tg a−1 is a major adjustment from the prior estimate of 0.049 Tg a−1 in 2023 from Ardila et al. (2025a). It is more consistent with the BUR (0.12 Tg a−1 in 2018), which Ardila et al. (2025a) reduced to account for decreased coal production from 2018 to 2023.
Hancock et al. (2025) previously reported a posterior emission total of 10.0 (8.4–13.0) Tg a−1 for Colombia from their inversion of TROPOMI observations for 2019. This is higher but in the range of our posterior estimate of 8.9 (8.7–9.1) Tg a−1. However, they found a much higher contribution of anthropogenic methane emissions (5.2 (4.2–7.2) Tg a−1) compared to ours (3.2 (3.1–3.2) Tg a−1). This can be largely attributed to our improved bottom-up inventories (including wetlands) used as prior estimates and to the higher resolution of our inversion that allows us to better separate anthropogenic contributions from wetlands. For example, we are better able to account for wetland emissions in La Mojana region in northern Colombia through the GLWDv2 wetland extent map.
Figure S6 shows the posterior error correlations that indicate the inversion's ability to distinguish between the different sectors of Table 1. Error correlations are high between waste and the “other” category of anthropogenic emissions (correlation coefficient r=0.65), as these are mostly population-based, but are otherwise low (r < 0.2), indicating that the inversion can effectively separate emissions from the different sectors. The figure also shows the posterior error correlations obtained from inversions using commonly used global inventories (GFEI, EDGAR, LPJ, WetCHARTs) as prior estimates at km2 and km2 resolution. Using our Colombia-specific inventories as prior estimates results in lower posterior error correlations, most notably for livestock and rice. The ability to distinguish between sectors degrades at 25×25 km2 resolution, particularly for the livestock sector.
Figure S7 shows the sectoral averaging kernel matrix aggregated over Colombia, where the diagonal terms (averaging kernel sensitivities) indicate the extent to which emissions are constrained by the satellite observations, and the row-by-row off-diagonal terms indicate the spurious information from other sectors. Most sectors have sensitivities greater than 0.5, implying that the posterior estimates are more strongly constrained by the observations than by the prior estimate, and contain low spurious information from other sectors. The exceptions are livestock (0.41), waste (0.34), and rice (0.10). For livestock, the lower sensitivity reflects overlap with wetlands, while for waste it reflects overlap with other anthropogenic sources. The weak rice emissions are very poorly constrained due to overlap with livestock and wetlands. Reservoir emissions have high averaging kernel sensitivities but also include spurious information from livestock emissions, which are much higher. We focus our sectoral analysis on regions with high observational sensitivity (Fig. S3).
5.1 Livestock
Figure 9 shows Colombia's BUR and posterior cattle emissions and EFs (including both enteric fermentation and manure management) distributed over the Tier 2 regions used in the BUR's methodology (Instituto de Hidrología, Meteorología y Estudios Ambientales, 2021a). Emissions are mainly from enteric fermentation, with manure management contributing only 4 % nationally (Sect. 2.1). Cattle numbers (from vaccination records) and EFs in the BUR for each region include updates from Ardila et al. (2025a). Variability in these EFs between regions is mostly driven by cattle type in each region, with dairy cattle having a higher EF than non-dairy cattle, but variability is small because the fraction of dairy cattle is small (<20 %) across the regions. EFs are within 20 % of the IPCC Tier 1 average enteric fermentation EF for non-dairy cattle in Latin America of 56 kg CH4 head−1 a−1 (IPCC, 2019).
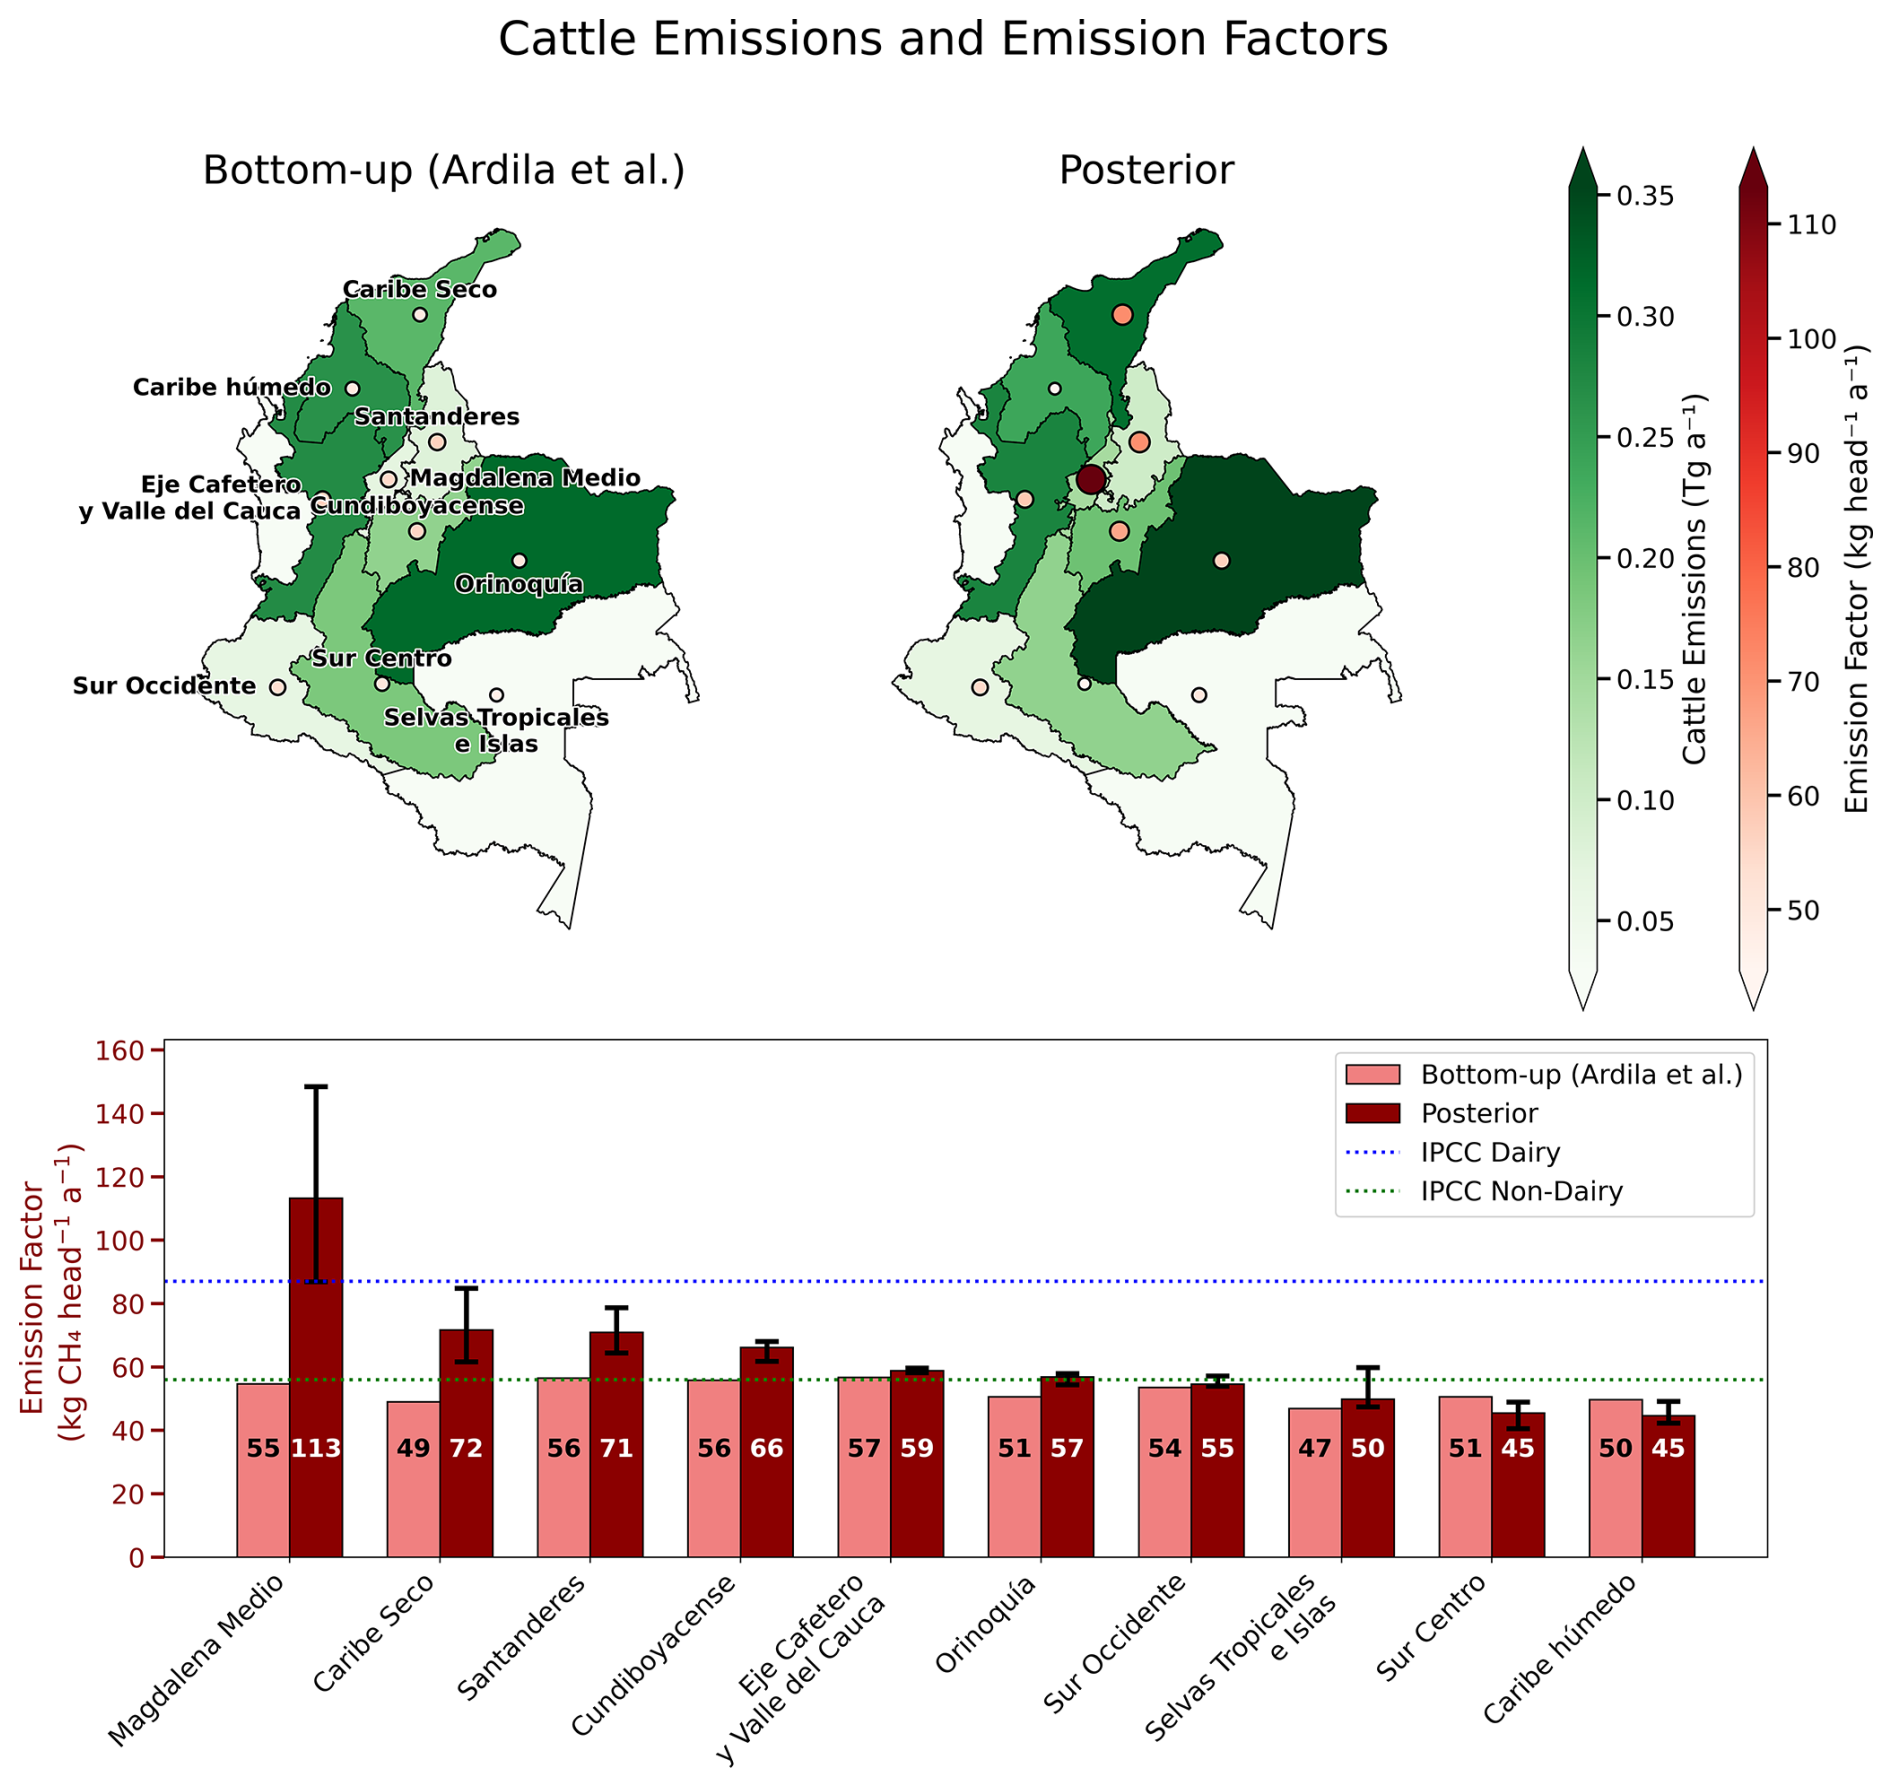
Figure 9Cattle emissions and emission factors (EFs) for Colombia's ten IPCC Tier 2 regions. The top panels show the total emissions in each region and the inferred emission factors (emissions divided by the number of cattle) for both the bottom-up estimate from Ardila et al. (2025a) and the posterior estimate. The marker size corresponds to the emission factor. The bottom panel shows the same bottom-up and posterior EFs for each region as red bars. The error bars denote the range of posterior estimates from the inversion ensemble. Dotted lines show average IPCC Tier 1 enteric fermentation emission factors for Latin America for dairy and non-dairy cattle.
Our posterior cattle emissions are 18 % higher nationally than the BUR, which is a relatively small adjustment, and are distributed by region as shown in Fig. 9. EFs for each region are inferred from the posterior emissions by dividing by the cattle numbers from Ardila et al. (2025a). The largest relative adjustment to emissions is in Magdalena Medio, with a posterior EF of 113 (87–148) kg CH4 head−1 a−1 (+107 %), followed by Caribe Seco (+46 %) and Santanderes (+26 %). In the other seven regions, posterior EFs deviate from the bottom-up EFs by less than 20 % and exhibit similar variability, supporting Colombia's Tier 2 models. They also remain within 20 % of the IPCC Tier 1 non-dairy EF for Latin America. The higher EFs are not evidently correlated with any livestock or region-specific characteristics, and the larger adjustments in Magdalena Medio, Caribe Seco, and Santanderes could reflect underestimates in cattle populations rather than systematically higher EFs. While all cattle in Colombia are required to be vaccinated, cattle can migrate across region boundaries (Parodi et al., 2022; Cárdenas et al., 2019) or be unvaccinated. In smaller regions like Magdalena Medio and Santanderes (∼ 1 million cattle), a minor change in emissions related to inaccurate livestock totals can result in a large upward adjustment to the implied EF.
5.2 Waste
The region of west-central Colombia including Bogotá (population of 8 million), Medellín (2 million), and Cali (2 million), accounts for 65 % of posterior waste emissions and over 90 % of the adjustment to national waste emissions (posterior estimate of 0.76 Tg a−1) (Fig. 10). The largest adjustment is from facilities surrounding Bogotá. The Doña Juana landfill was estimated by Ardila et al. (2025a) to be the highest-emitting in Colombia (0.095 Tg a−1); it represents 25 % of Colombia's solid waste and its collection area is expanding (Martin-Calvo et al., 2021). However, bottom-up emissions are higher in the grid cell encompassing the smaller Nuevo Mondoñedo landfill (0.021 Tg a−1) because two wastewater treatment plants contribute the majority (80 %) of waste emissions in the cell and cannot be disaggregated. We find a 128 % upward adjustment to emissions over the Nuevo Mondoñedo grid cell, but no significant upward adjustment to emissions over Doña Juana, which supports the bottom-up estimate. The other estimates from Ardila et al. (2025a) also do not show a significant upward adjustment.
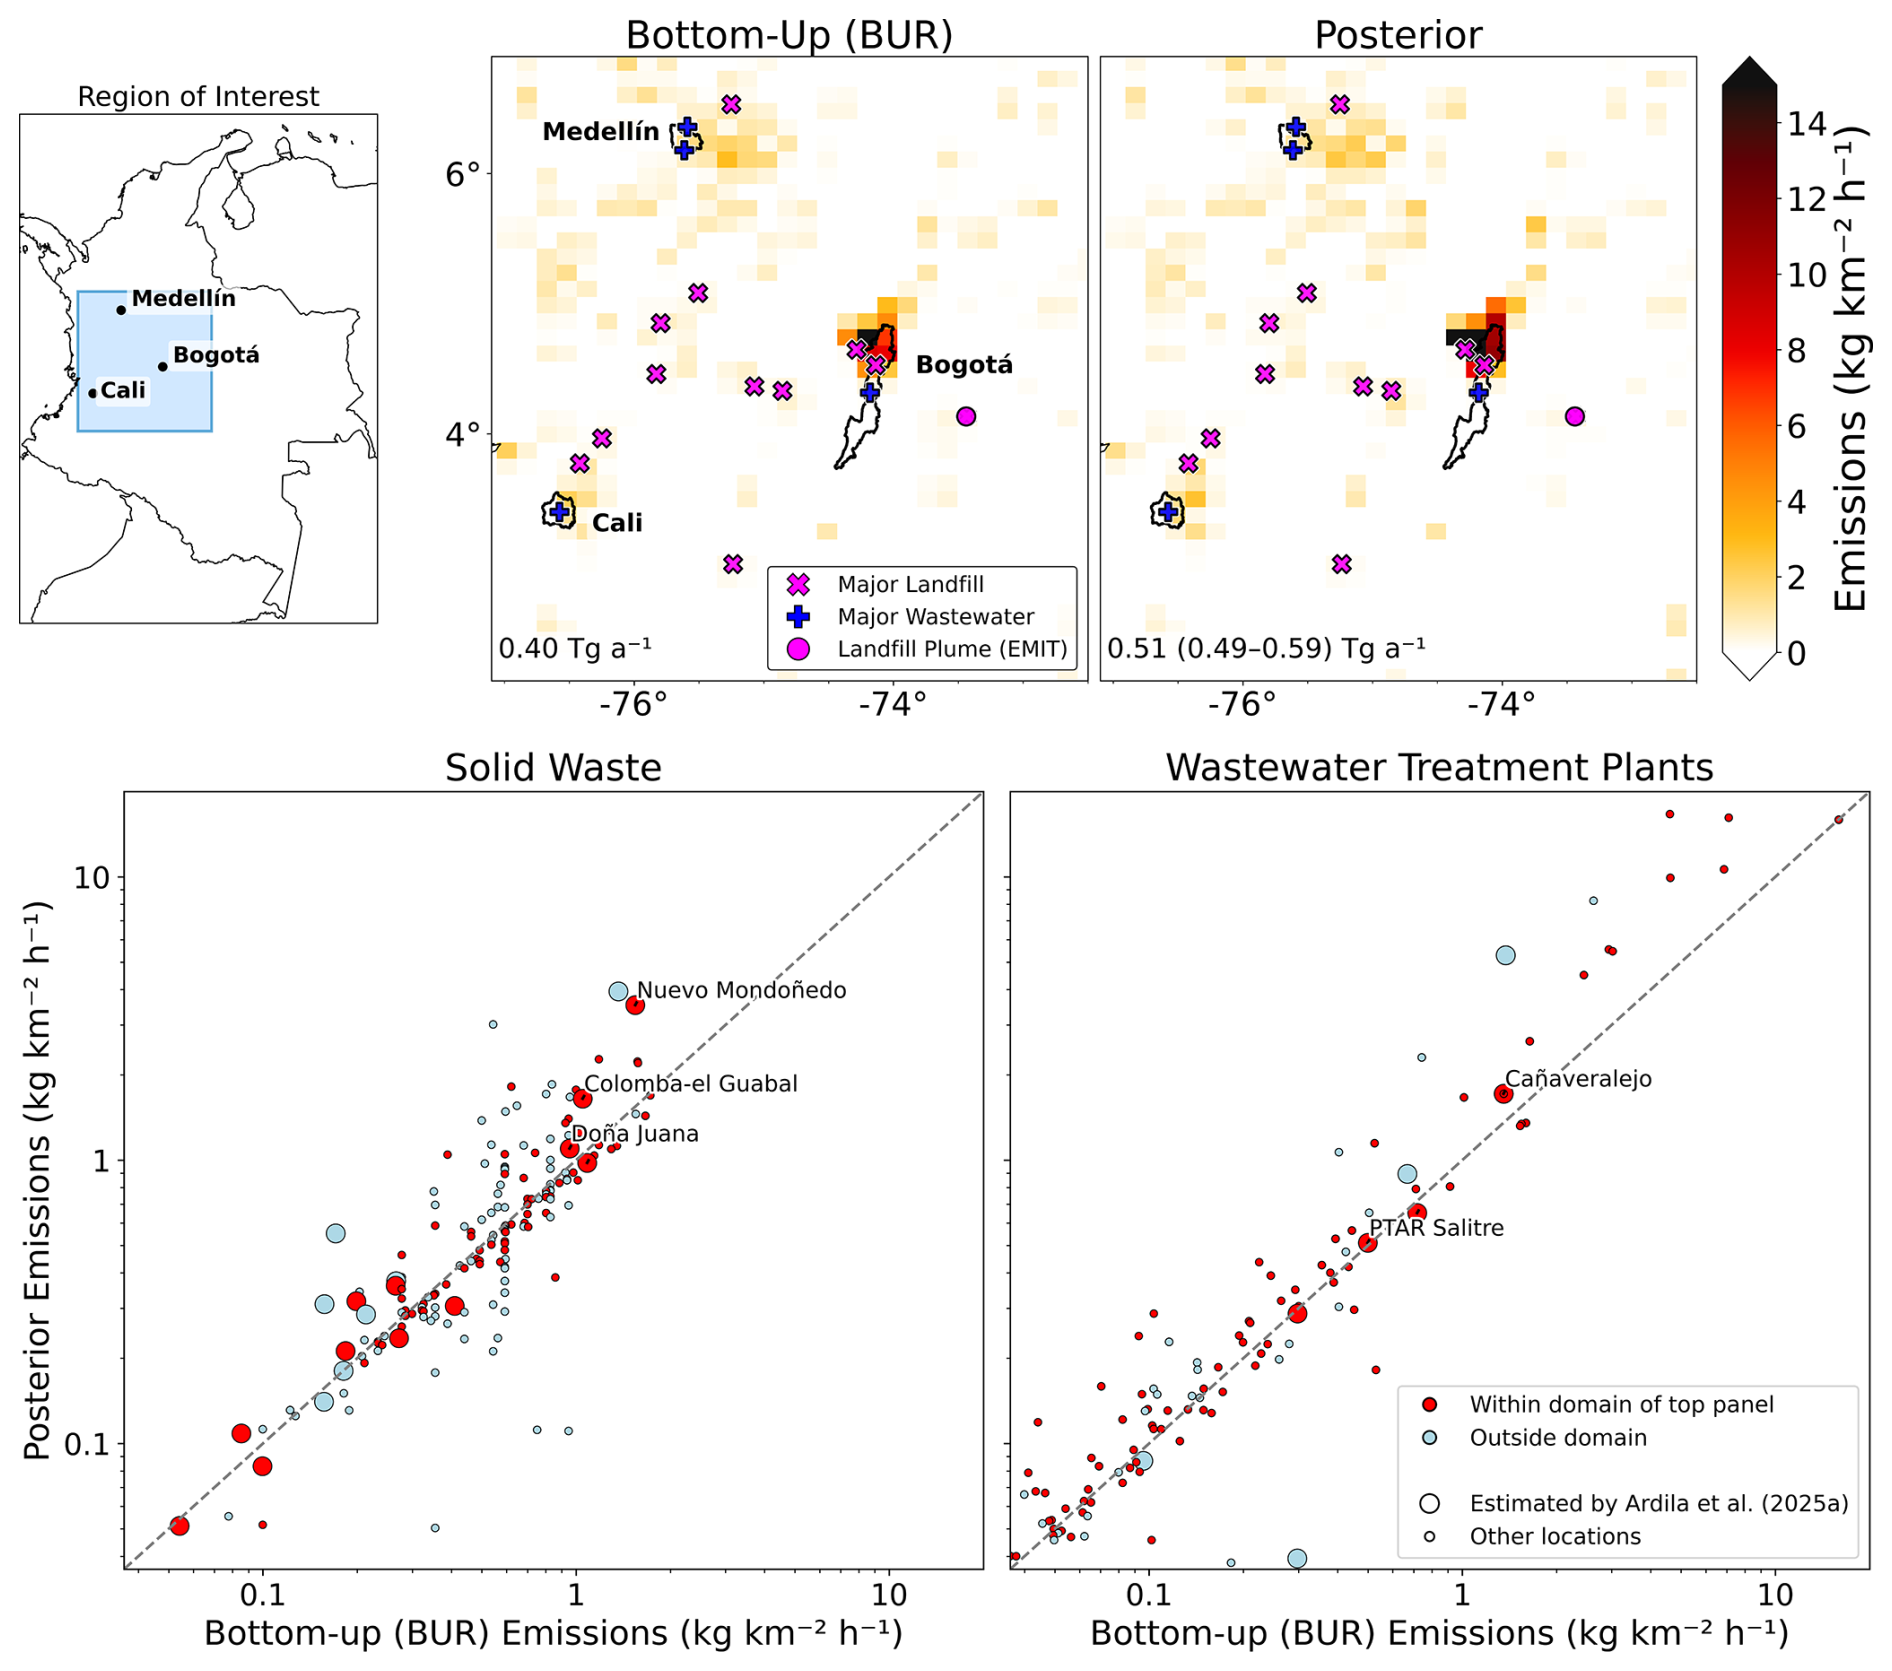
Figure 10Emissions from solid waste and wastewater treatment plants in Colombia on the 0.125°×0.15625° grid of the inversion. The top panels show bottom-up (BUR) and posterior emissions for the west-central region including Bogotá, Medellín, and Cali, which accounts for 65 % of national posterior emissions. Pink and blue crosses and plusses mark major landfills and wastewater treatment plants, respectively, identified by Ardila et al. (2025a); a pink dot indicates a landfill plume observed by EMIT. Region totals inset represent all waste emissions in the plotted domain (2.1 to 6.9° latitude, −77.1 to −72.5° longitude), with parentheses indicating the range across the inversion ensemble. The bottom panels are scatterplots of posterior versus bottom-up solid waste and wastewater emission estimates for individual grid cells, generally representing individual facilities. Facilities with emissions estimated by Ardila et al. (2025a) have larger symbols; additional sites from the Superintendent of Public Services and EDGARv8 are shown in red (if within the Bogotá–Medellín–Cali domain) or light blue (if outside). Major Ardila et al. (2025a) facilities within the Bogotá–Medellín–Cali domain with emissions above 0.5 kg km−2 h−1 are labeled.
The limited correction to the Ardila et al. (2025a) estimates suggests that, where facility-level data exist, the first-order decay model for landfills and the IPCC Tier 1 method for wastewater with up-to-date activity data yield reasonable predictions of methane emissions. However, the grid cells encompassing these facilities make up just 8 % of bottom-up and 9 % of posterior waste emissions. The bottom panel of Fig. 10 shows most of the upward adjustment to emissions (97 %) is from grid cells encompassing solid waste and wastewater facilities lacking facility-level estimates, especially wastewater facilities near Bogotá. The discrepancy between bottom-up and posterior waste estimates is due to the absence of facility-level estimates rather than shortcomings in the bottom-up models. Additional bottom-up calculations for individual wastewater facilities using facility-level flow rate and biochemical oxygen demand estimates like Ardila et al. (2025a) would result in an improved bottom-up estimate.
5.3 Oil/gas
Our posterior estimate of oil/gas emissions in Colombia is 60 % higher than the BUR. We focus our analysis on the Barrancabermeja and Puerto Boyacá municipalities (Fig. 11) that account for 82 % of this upward adjustment. Barrancabermeja hosts Colombia's largest oil refinery, which in 2023 achieved its highest throughput in 16 years (Ecopetrol, 2024). The city lies in the Middle Magdalena Valley Basin, a region of mature oil fields. Puerto Boyacá is another hub for oil production anchored by the Vasconia pumping station, a major node in Colombia's pipeline network (Agencia Nacional de Hidrocarburos, 2010).
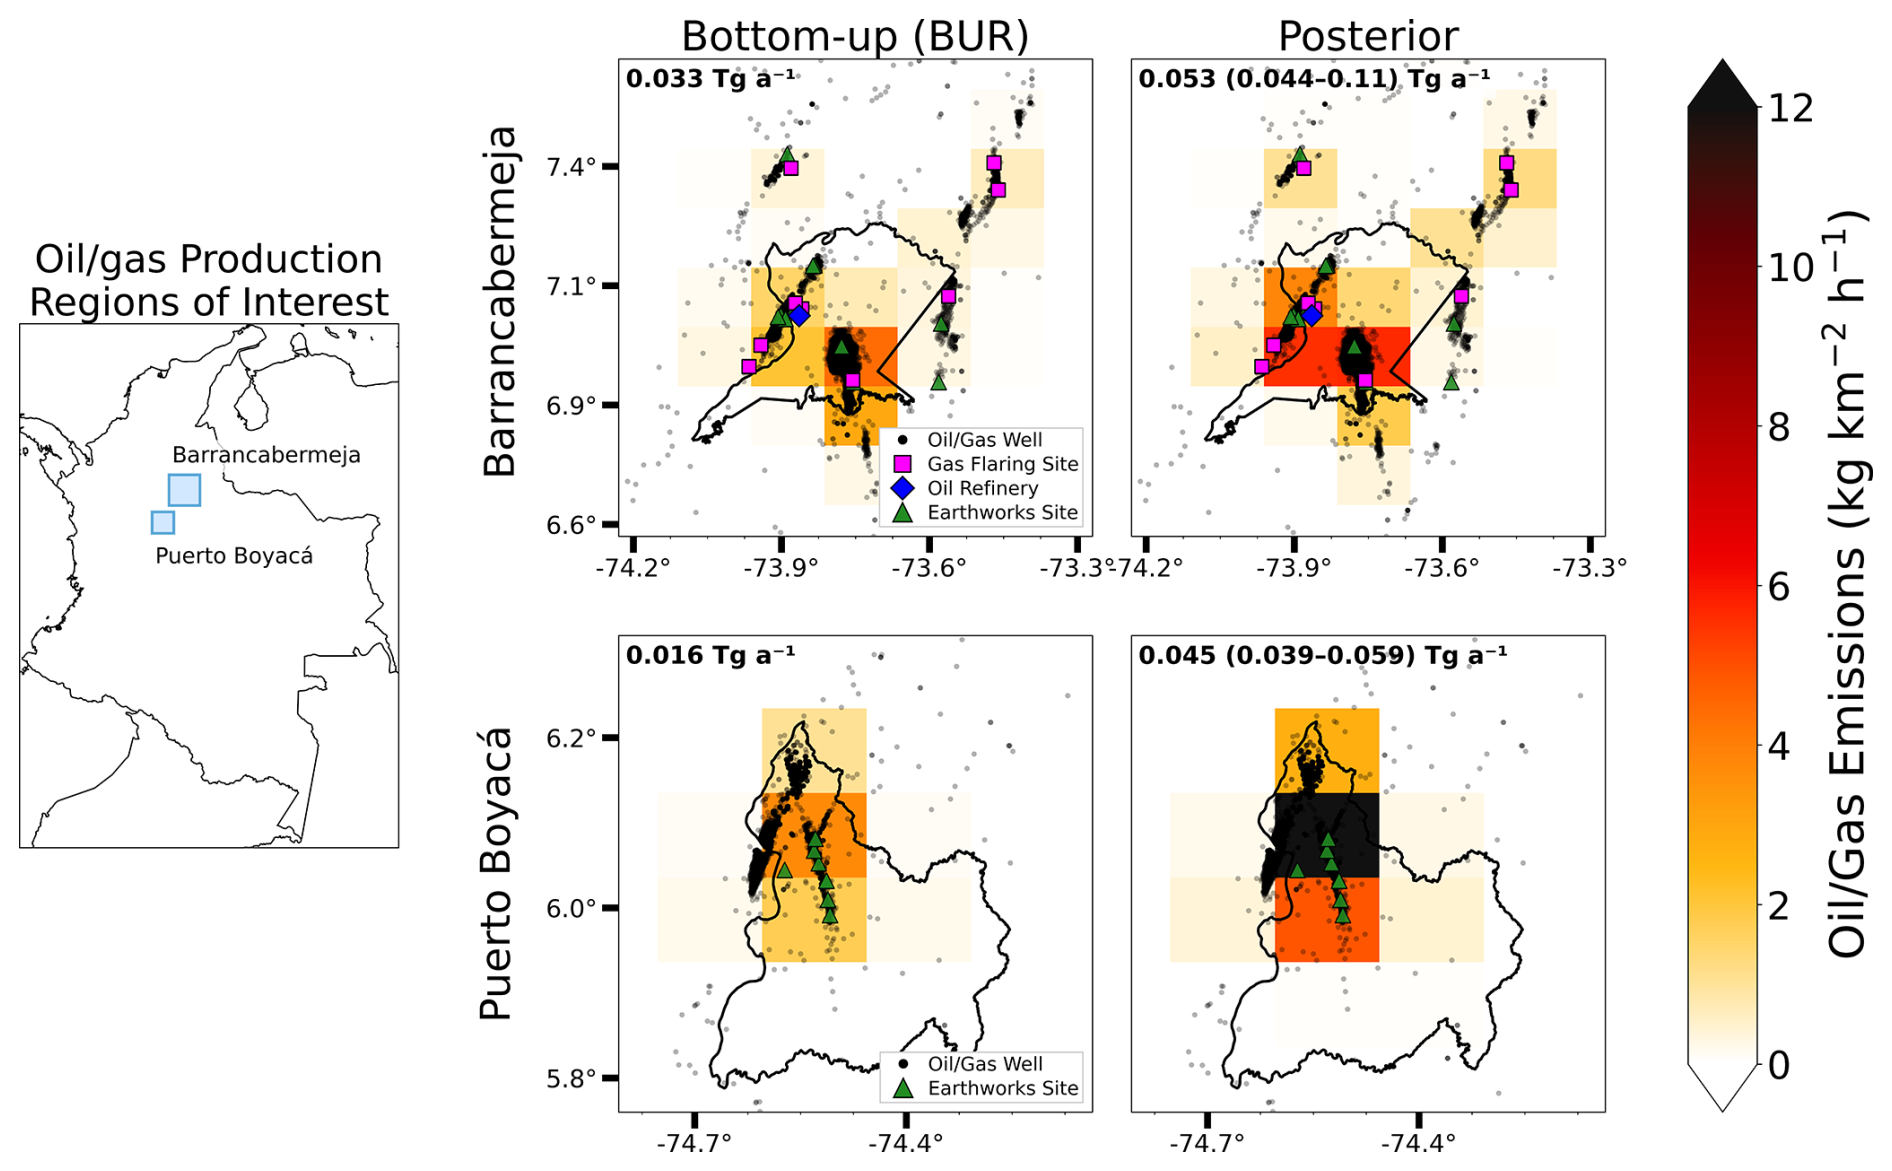
Figure 11Bottom-up (BUR) and posterior oil/gas emissions in the oil production regions of Barrancabermeja and Puerto Boyacá that account for 82 % of the national upward adjustment to oil/gas emissions in the inversion. Totals shown are for all oil/gas emissions in each domain (6.6 to 7.6° latitude, −74.25 to −73.25° longitude for Barrancabermeja, 5.7 to 6.4° latitude, −74.8 to −74.1° longitude for Puerto Boyacá). Black dots, pink squares, and blue diamonds indicate the locations of wells, gas flaring sites, and oil refineries, respectively, identified from the OGIM database (Omara et al., 2023). Green triangles indicate the locations of leaking, venting, or flaring infrastructure documented by Earthworks using shortwave infrared (SWIR) cameras (Earthworks, 2023).
Earthworks (2023) and the Environmental Investigation Agency (2025) documented unintended or underreported venting, incomplete flaring, and fugitive emissions from oil/gas infrastructure at the same locations where we observe the largest upward corrections in Fig. 11. These locations, along with other unobserved venting and incomplete flaring or abandoned infrastructure, could be the cause of a large bottom-up emission underestimate.
5.4 Coal
The upward adjustment to coal emissions (posterior estimate of 0.094, compared to 0.049 Tg a−1 in the Ardila et al. (2025a) bottom-up estimate) is confined to the open-pit mines in the Cesar and La Guajira departments of northern Colombia, which account for 93 % of Colombia's posterior coal emissions. Remaining coal emissions are from other open-pit mines in the Córdoba department, and underground mines, which show no significant adjustment. Figure 12 shows the bottom-up and posterior emissions in the Cesar and La Guajira departments. The highest-emitting grid cell is located near La Cerrejón, Colombia's largest coal mine (point a). The other high-emitting cells are located further south in the Cesar department, which has several large open-pit mines (Agencia Nacional de Minería, 2023). Some cells also have point source observations from GHGSat, EMIT, or AVIRIS-NG and these are added to Fig. 12. Because open-pit mines cover large areas, point-source observations capture emissions from localized hotspots within the mine rather than representing emissions from the entire facility. They also represent a single point in time and thus cannot be directly compared to our grid cell annual-average emissions, but we find that their averages generally align better with our posterior than the bottom-up estimate.
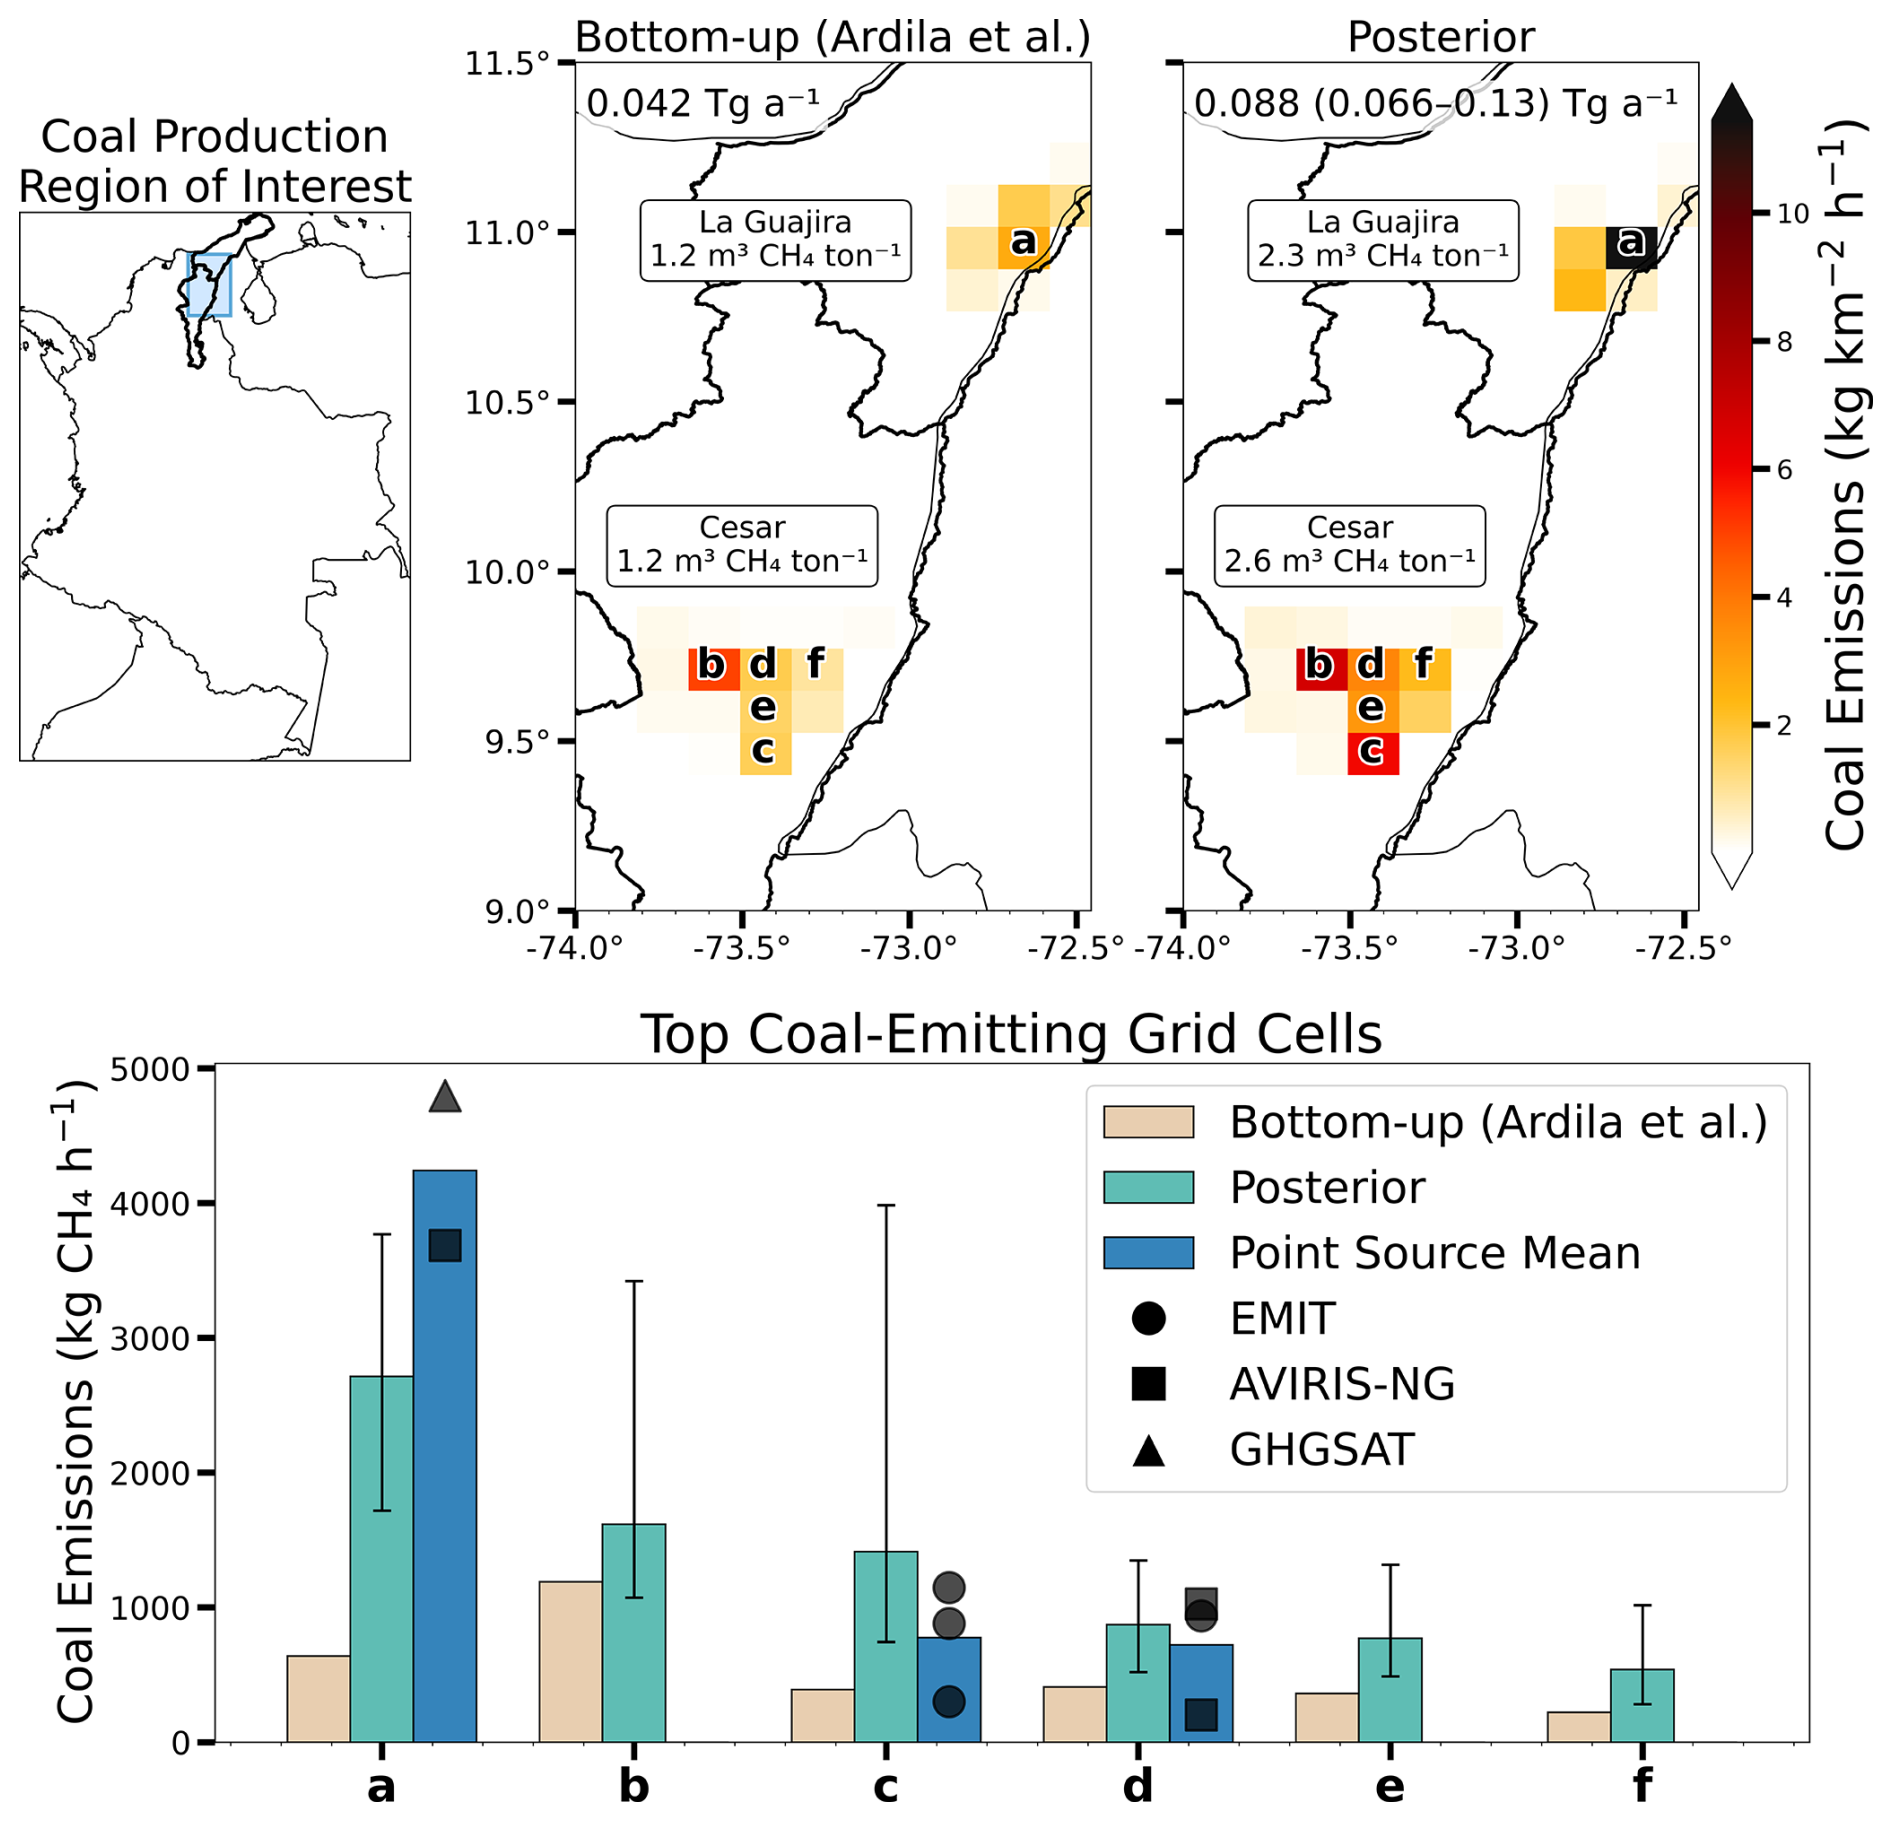
Figure 12Coal mine emissions in the Cesar and La Guajira departments. Posterior emissions on the 0.125°×0.15625° inversion grid are compared to the Ardila et al. (2025a) bottom-up inventory, which updates the BUR to account for declining coal production, and to point source observations. All emissions are from open-pit mines. The letters (a–f) shown on the maps correspond to the locations of the emissions shown on the bottom panel bar chart. Error bars on the posterior estimates show the ranges across the inversion ensemble. The blue bars indicate the means of multiple point source observations in a grid cell.
Although Colombian coal production has declined, emissions may be falling more slowly due to increased mine depth (Kholod et al., 2020). Bottom-up EFs for both Cesar and La Guajira are 0.89 for mining and 0.27 for post-mining, totalling 1.16 m3 CH4 t−1. Assuming the same coal production, posterior EFs are 2.6 for Cesar and 2.3 m3 CH4 t−1 for La Guajira. The bottom-up EFs are based on desorbed gas measurements in samples of coal bed methane in each basin from Unidad de Planeación Minero Energética (UPME) (2016), and an assumed average mine depth of 150 m for both departments. Mariño-Martínez et al. (2020) use these same measurements but assume average mine depths of 300 m in Cesar and 180 m in La Guajira, recommending EFs of 2.55 and 1.26 m3 CH4 t−1, respectively, which are closer to our posterior values than the bottom-up EFs used in the BUR. This suggests that incorporating evolving mine depths into EF estimates could improve the BUR estimate. Also, because coal gas content varies across seams, basin-wide EFs may obscure local variability (IPCC, 2019); Borchardt et al. (2025) recommend deriving EFs from the specific seams being mined. Carbon Mapper surveys have also been shown to successfully estimate basin-specific EFs from underground mines (Penn et al., 2026), which could augment an effort to develop sub-basin-wide EFs.
5.5 Hydroelectric reservoirs
We use the Global Dam Watch (GDW) consensus global database (Lehner et al., 2024), a more up-to-date version of the dam database used to construct ResME, to associate emissions with reservoir characteristics in Colombia. Although the posterior estimate from the base inversion shows a 20 % national decrease in reservoir emissions relative to the ResME bottom-up estimate of 0.12 Tg a−1, this decrease is not robust across our inversion ensemble (0.076–0.13 Tg a−1), which may reflect spurious information propagated from livestock in the posterior estimate (Fig. S7). However, five individual reservoirs show consistent upward adjustments to emissions (Fig. S8). These reservoirs were constructed from 1962 to 2002, so none of their emissions are included in Colombia's BUR estimate for 2018. The largest relative adjustment is to the Prado Reservoir with a posterior estimate of 0.017 Tg a−1. This reservoir has been found to contain high methane concentrations in its water column due to elevated nutrient runoff that fuels algal growth and depletes oxygen (Castro-González and Torres-Valdés, 2015). Colombia could improve its BUR by using updated IPCC 2019 guidelines, which recommend including emissions from all reservoirs, not just those within the 10-year window of construction (IPCC, 2019). Beyond that, collecting data on turbine intake depths, which are the strongest predictor of hydropower emissions but are not available in global dam databases (Delwiche et al., 2022), would improve bottom-up estimates using ResME.
5.6 Natural sources
Although we do not find a significant adjustment to total wetland emissions in Colombia (posterior estimate of 5.7 Tg a−1), we find an upward adjustment to emissions over La Mojana region (Fig. S9). La Mojana is seasonally-inundated swampland (Ricaurte et al., 2019) with significant agricultural production of rice, corn, plantain, and livestock (Caro et al., 2023). DeLucia et al. (2019) found that subtropical wetlands near managed pastures exhibited higher methane emissions due to increased soil wetness and biomass, and Murguia-Flores et al. (2023) found agriculture to be a driver of elevated methane emissions from tropical wetlands due to increased nutrient inputs. These influences from agriculture on wetland emissions would not be accounted for in process-based wetland emission models like LPJ. There is a remaining posterior bias between observations and modelled concentrations over La Mojana because we optimize annual emissions and prescribe wetland emission seasonality, which is uniform across the domain in the GLWD + LPJ prior estimate. Improved knowledge of the seasonality of wetland emissions in La Mojana region would help in separating these emissions from livestock.
5.7 Unresolved uncertainties
A limitation in using the current TROPOMI and GOSAT satellites for improving knowledge of methane emissions in Colombia is the sparse and uneven observational coverage due to coarse pixel resolution and resulting cloud contamination. Coverage over southern Colombia where Amazonian wetland emissions are high is particularly sparse (Figs. 5 and S3). The proposed NASA Carbon-I satellite mission (Frankenberg et al., 2024; Fig. S10) would improve this situation with 68 million valid observations projected annually across our domain. Observations from the expanding Carbon Mapper and GHGSat constellations will improve detection of point sources. In situ data are also critical for validating satellite retrievals and inversion results. The lack of publicly available in situ methane observations over Colombia currently limits independent evaluation of our 2023 inversion. A 2024 airborne LiDAR campaign targeted 3826 oil and gas sites across Colombia (Calderon-Cangrejo et al., 2025), though the data are not yet available. Long-term, regionally representative surface monitoring sites would provide critical validation for satellite-based inversions.
Uncertainties in emission estimates may also arise from inversion uncertainty associated with transport and sectoral attribution. Verkaik (2019) found that enhanced TROPOMI concentrations over the Magdalena region were in part due to mountains blocking the transport of methane towards the south and east; the challenging topography near the Andes could be another source of uncertainty that is unaccounted for in these results (Stanevich et al., 2020; Ardila et al., 2025b). In many parts of Colombia, methane sources overlap, which challenges source attribution based on the prior sectoral contribution in each grid cell. This is particularly relevant for wetlands and livestock, which are diffuse sources that are often co-located and more difficult to separate than concentrated point sources. Uncertainty in the prior wetland distribution could contribute to unexpectedly high livestock emission factors inferred from the inversion, such as in Magdalena Medio. Further refinement of wetland inventories, including understanding seasonal emission patterns, would allow for better quantification of anthropogenic emissions in future work. Improved treatment of errors on prior estimates to account for spatial error correlations by sector (Balasus et al., 2026) would further increase the information content of the inversion and allow better separation between sectors.
Higher temporal resolution and longer temporal extent in the inversion would also improve our results. Monthly (as opposed to annual) inversions using a Kalman Filter approach (Varon et al., 2023) would better isolate the contributions from wetlands because of their large seasonality. Using the full record of TROPOMI observations (2018–present) would provide additional information for quantifying emissions; Colombian emissions appear to have increased rapidly over the TROPOMI record (He et al., 2026), and a long-term Kalman Filter inversion could help explain this increase.
We have shown how satellite observations of atmospheric methane can be used to improve national emission inventories by starting from a detailed, gridded, bottom-up emission estimate, using it as prior estimate in a high-resolution inversion of satellite observations to obtain optimized posterior emissions on the same grid, and circling back to improve the process-based bottom-up estimates. We applied this method to better quantify 2023 emissions in Colombia through a collaboration between atmospheric and inventory scientists anchored by Colombia's Biennial Update Report (BUR) to the United Nations Framework Convention on Climate Change (UNFCCC). Developing bespoke sectoral gridded methane inventories enables the effective use of existing satellite data to improve national inventories. This approach can help governments identify significant discrepancies between bottom-up national inventories and top-down atmospheric inversions.
We constructed 0.125°×0.15625° gridded inventories for major anthropogenic source sectors including livestock, coal, waste, oil/gas, and rice. The purpose of constructing this gridded inventory was to make the inversion results directly relevant to improving the national inventory and to base the sectoral attribution of posterior emissions on the best available data, since that attribution depends strongly on the prior estimate. We spatially allocated sectoral totals from Colombia's latest BUR to the UNFCCC with more recent estimates from Ardila et al. (2025a) by using subnational activity data, land cover classification, and point source detections from GHGSat, EMIT, and aircraft AVIRIS-NG. We also added emissions from hydroelectric reservoirs and energy use in buildings. Total anthropogenic emissions in this bottom-up estimate are 2.7 Tg a−1. Colombia also has major wetland emissions, for which we developed a 0.125°×0.15625° bottom-up estimate by combining GLWDv2 inundation data and LPJ seasonality. Total bottom-up emissions from Colombia are 8.3 Tg a−1, including major sources from wetlands (5.6 Tg a−1), livestock (1.7 Tg a−1), and waste (0.64 Tg a−1).
We then applied an analytical Bayesian inversion at 0.125°×0.15625° resolution to TROPOMI satellite observations. We obtained posterior estimates of 8.9 (8.7–9.1) Tg a−1 for total Colombia emissions, close to the bottom-up estimate, and 3.2 Tg a−1 for anthropogenic emissions, 19 % higher than the bottom-up estimate. We find upward emission adjustments for livestock (18 %), waste (19 %), coal (92 %), and oil/gas (60 %), but a downward adjustment for hydroelectric reservoirs (−20 %). Inversion results show improved agreement with independent GOSAT observations.
We compared our results with bottom-up estimates to inform improvements to the bottom-up BUR. We found that most regions in Colombia have posterior livestock emissions consistent with bottom-up estimates. For waste, over 90 % of the adjustment originates in the Bogotá–Medellín–Cali region, primarily from wastewater facilities near Bogotá; integrating site-level flow rate and biochemical oxygen demand data for these facilities would improve the bottom-up estimate. The upward adjustment to coal emissions is from the open-pit mining regions of Cesar and La Guajira, and indicates that bottom-up EFs need to account for increasing extraction depths (with higher EFs) as a mine ages. For oil/gas, 82 % of the upward adjustment occurs in the Barrancabermeja and Puerto Boyacá oil production fields and appears to reflect underreported flaring, venting, and infrastructure leaks. Hydroelectric reservoir emissions are included in Colombia's BUR only for the first ten years after construction, but we find that emissions persist beyond that age and represent a significant national source. Collecting data on turbine intake depth would help to better quantify these emissions.
By integrating national infrastructure and inventory data into the inversion framework, we achieved posterior emissions that are traceable to sectoral processes and geographically resolved at a scale relevant for national mitigation planning. This work offers a transferable blueprint for integrating satellite observations with bottom-up information to support improvements in national methane inventory development.
The IMI source code and documentation are available at https://carboninversion.com/, last access: 1 June 2025. The blended TROPOMI+GOSAT satellite observations are available at https://registry.opendata.aws/blended-tropomi-gosat-methane (Balasus et al., 2023). The GOSAT methane retrievals version 9.0 are available at https://doi.org/10.5285/18ef8247f52a4cb6a14013f8235cc1eb (Parker and Boesch, 2020).
The supplement related to this article is available online at https://doi.org/10.5194/acp-26-10455-2026-supplement.
SEH and DJJ contributed to the study conceptualization. RJ, AA, and LMR provided bottom-up emission estimates and activity data. SEH conducted the data and modelling analysis with contributions from DJJ, RJ, AA, LMR, NR, LAE, NB, JDE, MPS, XW, LP, ZC, DJV, CF, MB, AC, JLF, EP, and RJP. SEH and DJJ wrote the paper with input from all authors.
The contact author has declared that none of the authors has any competing interests.
Publisher's note: Copernicus Publications remains neutral with regard to jurisdictional claims made in the text, published maps, institutional affiliations, or any other geographical representation in this paper. The authors bear the ultimate responsibility for providing appropriate place names. Views expressed in the text are those of the authors and do not necessarily reflect the views of the publisher.
This work was supported in the framework of UNEP's International Methane Emissions Observatory (IMEO) and by a National Science Foundation Graduate Research Fellowship to SEH (grant no. DGE 2140743). RJP received funding from the UK National Centre for Earth Observation (grant no. NE/W004895/1), the Natural Environment Research Council (grant no. NE/X019071/1, “UK EO Climate Information Service”) and a UKRI Future Leaders Fellowship (grant no. MR/X033139/1).
This paper was edited by Jayanarayanan Kuttippurath and reviewed by two anonymous referees.
Agencia Nacional de Hidrocarburos: Mapa de infraestructura petrolera en Colombia, https://www.anh.gov.co/documents/14498/1357mapa_infraestructura_petrolera.pdf (last access: 19 May 2025), 2010.
Agencia Nacional de Minería: Fact Sheet: Coal–December 2023, https://mineriaencolombia.anm.gov.co/sites/default/files/2023-12/Fact Sheet Coal 12 2023.pdf (last access: 16 May 2025) 2023.
Agencia Nacional de Minería: Visor Geográfico Agencia Nacional de Minería ANM, https://www.anla.gov.co/eureka/geovisores-y-mapas/177-sistema-de-informacion (last access: 19 May 2025), 2024.
Ardila, A. V., Vargas-Burbano, A. C., Morales-Rincon, L. A., and Jimenez, R.: Comparison and critical review of Colombia's anthropogenic methane emissions inventory – Missing and underestimated sources (in Spanish), in: Proceedings of CASAP X (10th Colombian Congress and International Conference on Air Quality, Climate Change, and Public Health), Paper 007_1, https://casap.science/wp-content/uploads/2025/07/007_1_Ardila.pdf (last access: 3 June 2025), 2025a.
Ardila, A. V., González, C. M., Cifuentes, F., Rueda-Saa, G., and Jimenez, R.: Meteorological measurement and simulation datasets to understand the complex circulation over a tropical inter-Andean valley, Data in Brief, 60, 111614, https://doi.org/10.1016/j.dib.2025.111614, 2025b.
Balasus, N., Jacob, D. J., Lorente, A., Maasakkers, J. D., Parker, R. J., Boesch, H., Chen, Z., Kelp, M. M., Nesser, H., and Varon, D. J.: A blended TROPOMI+GOSAT satellite data product for atmospheric methane using machine learning to correct retrieval biases, Atmos. Meas. Tech., 16, 3787–3807, https://doi.org/10.5194/amt-16-3787-2023, 2023.
Balasus, N., Jacob, D. J., Bloom, A. A., East, J. D., Estrada, L. A., Hancock, S. E., He, M., Mooring, T. A., Turner, A. J., and Worden, J. R.: 2019–2024 trends in African livestock and wetland emissions as contributors to the global methane rise, EGUsphere [preprint], https://doi.org/10.5194/egusphere-2025-6251, 2026.
Borchardt, J., Harris, S. J., Hacker, J. M., Lunt, M., Krautwurst, S., Bai, M., Bösch, H., Bovensmann, H., Burrows, J. P., Chakravarty, S., Field, R. A., Gerilowski, K., Huhs, O., Junkermann, W., Kelly, B. F. J., Kumm, M., Lieff, W., McGrath, A., Murphy, A., Schindewolf, J., and Thoböll, J.: Insights into Elevated Methane Emissions from an Australian Open-Cut Coal Mine Using Two Independent Airborne Techniques, Environ. Sci. Technol. Lett., 12, 397–404, https://doi.org/10.1021/acs.estlett.4c01063, 2025.
Brasseur, G. P. and Jacob, D. J.: Modeling of Atmospheric Chemistry, Cambridge University Press, Cambridge, https://doi.org/10.1017/9781316544754, 2017.
Caicedo, Y. C., Garrido Galindo, A. P., Fuentes, I. M., and Vásquez, E. V.: Association of the chemical composition and nutritional value of forage resources in Colombia with methane emissions by enteric fermentation, Trop. Anim. Health Prod., 55, 84, https://doi.org/10.1007/s11250-023-03458-x, 2023.
Calderon-Cangrejo, N., Festa-Bianchet, S. A., Conrad, B. M., Tyner, D. R., Wilde, S. E., and Johnson, M. R.: Progress Toward a First Measurement-Based Oil and Gas Sector Methane Inventory for Colombia, EGU General Assembly 2025, Vienna, Austria, 27 Apr–2 May 2025, EGU25-13193, https://doi.org/10.5194/egusphere-egu25-13193, 2025.
Calisesi, Y., Soebijanta, V. T., and van Oss, R.: Regridding of remote soundings: Formulation and application to ozone profile comparison, J. Geophys. Res.-Atmos., 110, D23306, https://doi.org/10.1029/2005JD006122, 2005.
Carbon Mapper: Carbon Mapper CH4 Point Source Data Portal, https://data.carbonmapper.org/ (last access: 4 June 2025), 2023.
Cárdenas, L., Cañas-Álvarez, J. J., Vázquez, A., Boixadera, E., and Casal, J.: Analysis of domestic animal movements in Colombia (2006–2014) and their possible influence on the bovine brucellosis spread, Tropical Animal Health and Production, 51, 383–388, https://doi.org/10.1007/s11250-018-1701-9, 2019.
Caro, M. A. T., Vargas, R. D. S., and Otero, C. A. O.: Qualitative indicators for community water resilience in floodable areas: Agricultural pantry of La Mojana, Colombia, Economia agro-alimentare, https://doi.org/10.3280/ecag2023oa14638, 2023.
Castro-González, M. and Torres-Valdés, V.: Gases invernadero en aguas con bajo oxígeno en el reservorio eutrófico de Prado (Colombia), Revista de la Academia Colombiana de Ciencias Exactas, Físicas y Naturales, 39, 399–407, https://doi.org/10.18257/raccefyn.228, 2015.
Chen, Z., Jacob, D. J., Gautam, R., Omara, M., Stavins, R. N., Stowe, R. C., Nesser, H. O., Sulprizio, M. P., Lorente, A., Varon, D. J., Lu, X., Shen, L., Qu, Z., Pendergrass, D. C., and Hancock, S.: Satellite quantification of methane emissions and oil/gas methane intensities from individual countries in the Middle East and North Africa: implications for climate action, EGUsphere [preprint], https://doi.org/10.5194/egusphere-2022-1504, 2023.
Cheng, Y., Jiang, H., Zhang, X., Cui, J., Song, C., and Li, X.: Effects of coal rank on physicochemical properties of coal and on methane adsorption, Int. J. Coal Sci. Technol., 4, 129–146, https://doi.org/10.1007/s40789-017-0161-6, 2017.
CIPAV, FEDEGÁN, CIAT, Fondo Acción, The Nature Conservancy, World Bank, Ministerio de Agricultura y Desarrollo Rural, and Ministerio de Ambiente y Desarrollo Sostenible: Reporte Final: NAMA Bovina de Colombia, Centro para la Investigación en Sistemas Sostenibles de Producción Agropecuaria (CIPAV), https://cipav.org.co/wp-content/uploads/2021/10/Reporte-NAMA-Bovina-de-Colombia.pdf (last access: 19 May 2025), 2021.
Colligan, T., Poulter, B., and Quinn, C.: LPJ-EOSIM L2 Global Simulated Monthly Wetland Methane Flux V001, NASA Goddard Earth Sciences Data and Information Services Center (GES DISC) [data set], https://doi.org/10.5067/COMMUNITY/LPJ-EOSIM/LPJ_EOSIM_L2_MCH4E.001, 2024.
Crippa, M., Guizzardi, D., Banja, M., Solazzo, E., Muntean, M., Schaaf, E., and Pagani, F.: EDGAR v7 Greenhouse Gas Emissions [data set], European Commission, Joint Research Centre (JRC), Emissions Database for Global Atmospheric Research (EDGAR), https://edgar.jrc.ec.europa.eu/dataset_ghg70 (last access: 19 July 2024), 2022.
Crippa, M., Guizzardi, D., Pagani, F., Schiavina, M., Melchiorri, M., Pisoni, E., Graziosi, F., Muntean, M., Maes, J., Dijkstra, L., Van Damme, M., Clarisse, L., and Coheur, P.: Insights into the spatial distribution of global, national, and subnational greenhouse gas emissions in the Emissions Database for Global Atmospheric Research (EDGAR v8.0), Earth Syst. Sci. Data, 16, 2811–2830, https://doi.org/10.5194/essd-16-2811-2024, 2024.
DeLucia, N. J., Gomez-Casanovas, N., Boughton, E. H., and Bernacchi, C. J.: The Role of Management on Methane Emissions From Subtropical Wetlands Embedded in Agricultural Ecosystems, J. Geophys. Res.-Biogeo., 124, 2694–2708, https://doi.org/10.1029/2019JG005132, 2019.
Delwiche, K. B., Harrison, J. A., Maasakkers, J. D., Sulprizio, M. P., Worden, J., Jacob, D. J., and Sunderland, E. M.: Estimating Drivers and Pathways for Hydroelectric Reservoir Methane Emissions Using a New Mechanistic Model, J. Geophys. Res.-Biogeo., 127, e2022JG006908, https://doi.org/10.1029/2022JG006908, 2022.
Demarchi, J. J. A. A., Manella, M. Q., Primavesi, O., Frighetto, R., Romero, L., Berndt, A., and Lima, M.: Effect of Seasons on Enteric Methane Emissions from Cattle Grazing Urochloa brizantha, J. Agr. Sci., 8, p106, https://doi.org/10.5539/jas.v8n4p106, 2016.
Earthworks: Oil and Gas Pollution in Colombia – Earthworks SWIR Camera Footage, 2023.
Ecopetrol incrementó en 17% la producción de combustibles en sus refinerías en 2023: https://www.ecopetrol.com.co/wps/portal/Home/es/noticias (last access: 15 July 2026), 2024.
Environmental Investigation Agency: Crude Lies: Colombia's Oil Industry Hidden Impacts on People, Biodiversity, and Climate, Environmental Investigation Agency, https://eia.org/wp-content/uploads/2025/03/EIA_US_Colombia_Crude_Oil_Report_0325_ONLINE_FINAL.pdf (last access: 19 May 2025), 2025.
Estrada, L. A., Varon, D. J., Sulprizio, M., Nesser, H., Chen, Z., Balasus, N., Hancock, S. E., He, M., East, J. D., Mooring, T. A., Oort Alonso, A., Maasakkers, J. D., Aben, I., Baray, S., Bowman, K. W., Worden, J. R., Cardoso-Saldaña, F. J., Reidy, E., and Jacob, D. J.: Integrated Methane Inversion (IMI) 2.0: an improved research and stakeholder tool for monitoring total methane emissions with high resolution worldwide using TROPOMI satellite observations, Geosci. Model Dev., 18, 3311–3330, https://doi.org/10.5194/gmd-18-3311-2025, 2025.
Etiope, G., Ciotoli, G., Schwietzke, S., and Schoell, M.: Gridded maps of geological methane emissions and their isotopic signature, Earth Syst. Sci. Data, 11, 1–22, https://doi.org/10.5194/essd-11-1-2019, 2019.
Forster, P., Storelvmo, T., Armour, K., Collins, W., Dufresne, J.-L., Frame, D., Lunt, D. J., Mauritsen, T., Palmer, M. D., Watanabe, M., Wild, M., and Zhang, H.: The Earth’s Energy Budget, Climate Feedbacks, and Climate Sensitivity, in: Climate Change 2021: The Physical Science Basis. Contribution of Working Group I to the Sixth Assessment Report of the Intergovernmental Panel on Climate Change, edited by: Masson-Delmotte, V., Zhai, P., Pirani, A., Connors, S. L., Péan, C., Berger, S., Caud, N., Chen, Y., Goldfarb, L., Gomis, M. I., Huang, M., Leitzell, K., Lonnoy, E., Matthews, J. B. R., Maycock, T. K., Waterfield, T., Yelekçi, O., Yu, R., and Zhou, B., Cambridge University Press, Cambridge, United Kingdom and New York, NY, USA, 923–1054, https://doi.org/10.1017/9781009157896.009, 2021.
Frankenberg, C., Bar-On, Y. M., Yin, Y., Wennberg, P. O., Jacob, D. J., and Michalak, A. M.: Data Drought in the Humid Tropics: How to Overcome the Cloud Barrier in Greenhouse Gas Remote Sensing, Geophysical Research Letters, 51, e2024GL108791, https://doi.org/10.1029/2024GL108791, 2024.
Fung, I., John, J., Lerner, J., Matthews, E., Prather, M., Steele, L. P., and Fraser, P. J.: Three-dimensional model synthesis of the global methane cycle, J. Geophys. Res.-Atmos., 96, 13033–13065, https://doi.org/10.1029/91JD01247, 1991.
Garrido, A. P., Bernal, F. T., Fontanilla, J. D., Caicedo, Y. C., and Vélez-Pereira, A. M.: Assessment of livestock greenhouse gases in Colombia between 1995 and 2015, Heliyon, 8, https://doi.org/10.1016/j.heliyon.2022.e12262, 2022.
Global Methane Initiative (GMI): Colombia Coal Mine Methane Market Study, Global Methane Initiative, https://www.globalmethane.org/documents/Colombia CMM Market Study-2019.pdf (last access: 15 May 2025), 2019.
Gobierno de Colombia: Tercer Informe Bienal de Actualización ante la CMNUCC (BUR-3), Ministerio de Ambiente y Desarrollo Sostenible, https://unfccc.int/documents/424157 (last access: 15 May 2025), 2022.
Green, R. O., Thorpe, A. K., Brodrick, P. G., Chadwick, K. D., Lopez, A. J., Elder, C. D., Villanueva-Weeks, C., Fahlen, J. E., Coleman, R. W., Jensen, D., Bender, H. A., Vinckier, Q., Xiang, C., Olson-Duvall, W., Lundeen, S. R., and Thompson, D. R.: EMIT L2B Estimated Methane Plume Complexes 60 m V001, NASA Land Processes Distributed Active Archive Center (LP DAAC), https://doi.org/10.5067/EMIT/EMITL2BCH4PLM.001, 2023.
Hancock, S. E., Jacob, D. J., Chen, Z., Nesser, H., Davitt, A., Varon, D. J., Sulprizio, M. P., Balasus, N., Estrada, L. A., Cazorla, M., Dawidowski, L., Diez, S., East, J. D., Penn, E., Randles, C. A., Worden, J., Aben, I., Parker, R. J., and Maasakkers, J. D.: Satellite quantification of methane emissions from South American countries: a high-resolution inversion of TROPOMI and GOSAT observations, Atmos. Chem. Phys., 25, 797–817, https://doi.org/10.5194/acp-25-797-2025, 2025.
He, M., Jacob, D. J., Estrada, L. A., Varon, D. J., Sulprizio, M., Balasus, N., East, J. D., Penn, E., Pendergrass, D. C., Chen, Z., Mooring, T. A., Maasakkers, J. D., Brodrick, P. G., Frankenberg, C., Bowman, K. W., and Bruhwiler, L.: Attributing 2019–2024 methane growth using TROPOMI satellite observations, Science Advances, 12, eadz9007, https://doi.org/10.1126/sciadv.adz9007, 2026.
Heald, C. L., Jacob, D. J., Jones, D. B. A., Palmer, P. I., Logan, J. A., Streets, D. G., Sachse, G. W., Gille, J. C., Hoffman, R. N., and Nehrkorn, T.: Comparative inverse analysis of satellite (MOPITT) and aircraft (TRACE-P) observations to estimate Asian sources of carbon monoxide, J. Geophys. Res.-Atmos., 109, https://doi.org/10.1029/2004JD005185, 2004.
Hmiel, B., Petrenko, V. V., Dyonisius, M. N., Buizert, C., Smith, A. M., Place, P. F., Harth, C., Beaudette, R., Hua, Q., Yang, B., Vimont, I., Michel, S. E., Severinghaus, J. P., Etheridge, D., Bromley, T., Schmitt, J., Faïn, X., Weiss, R. F., and Dlugokencky, E.: Preindustrial 14CH4 indicates greater anthropogenic fossil CH4 emissions, Nature, 578, 409–412, https://doi.org/10.1038/s41586-020-1991-8, 2020.
Instituto de Hidrología, Meteorología y Estudios Ambientales (IDEAM): Factores de Emisión de Metano por Fermentación Entérica en Sistemas de Producción de Ganado Bovino en Colombia: Aplicación del Enfoque Tier 2, IDEAM, https://biocarbono.org/wp-content/uploads/2021/09/01-boletin-tecnico-factores-emision-metano-tier-2.pdf (last access: 15 May 2025), 2021a.
Instituto de Hidrología, Meteorología y Estudios Ambientales (IDEAM): Mapa de cobertura de la tierra de Colombia 2020: Metodología CORINE Land Cover adaptada a Colombia, Instituto de Hidrología, Meteorología y Estudios Ambientales (IDEAM), Colombia, 2021b.
IPCC: Chapter 7: Wetlands, in: 2019 Refinement to the 2006 IPCC Guidelines for National Greenhouse Gas Inventories, Volume 4: Agriculture, Forestry and Other Land Use, Intergovernmental Panel on Climate Change, Switzerland, https://www.ipcc-nggip.iges.or.jp/public/2019rf/pdf/4_Volume4/19R_V4_Ch07_Wetlands.pdf (last access: 15 May 2025), 2019.
Jacob, D. J., Turner, A. J., Maasakkers, J. D., Sheng, J., Sun, K., Liu, X., Chance, K., Aben, I., McKeever, J., and Frankenberg, C.: Satellite observations of atmospheric methane and their value for quantifying methane emissions, Atmos. Chem. Phys., 16, 14371–14396, https://doi.org/10.5194/acp-16-14371-2016, 2016.
Jacob, D. J., Varon, D. J., Cusworth, D. H., Dennison, P. E., Frankenberg, C., Gautam, R., Guanter, L., Kelley, J., McKeever, J., Ott, L. E., Poulter, B., Qu, Z., Thorpe, A. K., Worden, J. R., and Duren, R. M.: Quantifying methane emissions from the global scale down to point sources using satellite observations of atmospheric methane, Atmos. Chem. Phys., 22, 9617–9646, https://doi.org/10.5194/acp-22-9617-2022, 2022.
Jervis, D., Girard, M., MacLean, J.-P., Marshall, D., McKeever, J., Ramier, A., Strupler, M., Tarrant, E., Young, D., Maasakkers, J. D., Aben, I., and Scarpelli, T. R.: Global energy sector methane emissions estimated by using facility-level satellite observations, Science, https://doi.org/10.1126/science.adv3183, 2025.
Kholod, N., Evans, M., Pilcher, R. C., Roshchanka, V., Ruiz, F., Coté, M., and Collings, R.: Global methane emissions from coal mining to continue growing even with declining coal production, Journal of Cleaner Production, 256, 120489, https://doi.org/10.1016/j.jclepro.2020.120489, 2020.
Kirchgessner, D. A., Piccot, S. D., and Masemore, S. S.: An Improved Inventory of Methane Emissions from Coal Mining in the United States, J. Air Waste Manage., 50, 1904–1919, https://doi.org/10.1080/10473289.2000.10464227, 2000.
Lehner, B., Beames, P., Mulligan, M., Zarfl, C., De Felice, L., van Soesbergen, A., Thieme, M., Garcia de Leaniz, C., Anand, M., Belletti, B., Brauman, K. A., Januchowski-Hartley, S. R., Lyon, K., Mandle, L., Mazany-Wright, N., Messager, M. L., Pavelsky, T., Pekel, J.-F., Wang, J., Wen, Q., Wishart, M., Xing, T., Yang, X., and Higgins, J.: The Global Dam Watch database of river barrier and reservoir information for large-scale applications, Scientific Data, 11, 1069, https://doi.org/10.1038/s41597-024-03752-9, 2024.
Lehner, B., Anand, M., Fluet-Chouinard, E., Tan, F., Aires, F., Allen, G. H., Bousquet, P., Canadell, J. G., Davidson, N., Ding, M., Finlayson, C. M., Gumbricht, T., Hilarides, L., Hugelius, G., Jackson, R. B., Korver, M. C., Liu, L., McIntyre, P. B., Nagy, S., Olefeldt, D., Pavelsky, T. M., Pekel, J.-F., Poulter, B., Prigent, C., Wang, J., Worthington, T. A., Yamazaki, D., Zhang, X., and Thieme, M.: Mapping the world's inland surface waters: an upgrade to the Global Lakes and Wetlands Database (GLWD v2), Earth Syst. Sci. Data, 17, 2277–2329, https://doi.org/10.5194/essd-17-2277-2025, 2025.
Lorente, A., Borsdorff, T., Martinez-Velarte, M. C., and Landgraf, J.: Accounting for surface reflectance spectral features in TROPOMI methane retrievals, Atmos. Meas. Tech., 16, 1597–1608, https://doi.org/10.5194/amt-16-1597-2023, 2023.
Ma, S., Worden, J. R., Bloom, A. A., Zhang, Y., Poulter, B., Cusworth, D. H., Yin, Y., Pandey, S., Maasakkers, J. D., Lu, X., Shen, L., Sheng, J., Frankenberg, C., Miller, C. E., and Jacob, D. J.: Satellite Constraints on the Latitudinal Distribution and Temperature Sensitivity of Wetland Methane Emissions, AGU Advances, 2, e2021AV000408, https://doi.org/10.1029/2021AV000408, 2021.
Mariño-Martínez, J. E., Chanci-Bedoya, R. D., and González-Preciado, A. J.: Methane emissions from coal open pits in Colombia, DYNA, 87, 139–145, https://doi.org/10.15446/dyna.v87n214.84298, 2020.
Martin-Calvo, J. and Castañeda-Gomez, J.: Estimation of methane, carbon dioxide and organic compounds in the Doña Juana landfill in Bogotá, Colombia, Revista de Ciencias Ambientales, 55, 307–320, https://doi.org/10.15359/rca.55-2.16, 2021.
Miranda-González, A. and Banks, J.: A Methane Champion: Colombia becomes first South American country to regulate methane from oil and gas: https://www.catf.us/2022/02/methane-champion-south-america (last access: 3 February 2025), 2022.
Murguia-Flores, F., Arndt, S., Ganesan, A. L., Murray-Tortarolo, G., and Hornibrook, E. R. C.: Soil Methanotrophy Model (MeMo v1.0): a process-based model to quantify global uptake of atmospheric methane by soil, Geosci. Model Dev., 11, 2009–2032, https://doi.org/10.5194/gmd-11-2009-2018, 2018.
Murguia-Flores, F., Jaramillo, V. J., and Gallego-Sala, A.: Assessing Methane Emissions From Tropical Wetlands: Uncertainties From Natural Variability and Drivers at the Global Scale, Global Biogeochem. Cy., 37, e2022GB007601, https://doi.org/10.1029/2022GB007601, 2023.
Nesser, H., Jacob, D. J., Maasakkers, J. D., Lorente, A., Chen, Z., Lu, X., Shen, L., Qu, Z., Sulprizio, M. P., Winter, M., Ma, S., Bloom, A. A., Worden, J. R., Stavins, R. N., and Randles, C. A.: High-resolution US methane emissions inferred from an inversion of 2019 TROPOMI satellite data: contributions from individual states, urban areas, and landfills, Atmos. Chem. Phys., 24, 5069–5091, https://doi.org/10.5194/acp-24-5069-2024, 2024.
Omara, M., Gautam, R., O'Brien, M. A., Himmelberger, A., Franco, A., Meisenhelder, K., Hauser, G., Lyon, D. R., Chulakadabba, A., Miller, C. C., Franklin, J., Wofsy, S. C., and Hamburg, S. P.: Developing a spatially explicit global oil and gas infrastructure database for characterizing methane emission sources at high resolution, Earth Syst. Sci. Data, 15, 3761–3790, https://doi.org/10.5194/essd-15-3761-2023, 2023.
Parker, R. and Boesch, H.: University of Leicester GOSAT Proxy XCH4 v9.0, Centre for Environmental Data Analysis (CEDA), https://doi.org/10.5285/18EF8247F52A4CB6A14013F8235CC1EB, 2020.
Parker, R. J., Webb, A., Boesch, H., Somkuti, P., Barrio Guillo, R., Di Noia, A., Kalaitzi, N., Anand, J. S., Bergamaschi, P., Chevallier, F., Palmer, P. I., Feng, L., Deutscher, N. M., Feist, D. G., Griffith, D. W. T., Hase, F., Kivi, R., Morino, I., Notholt, J., Oh, Y.-S., Ohyama, H., Petri, C., Pollard, D. F., Roehl, C., Sha, M. K., Shiomi, K., Strong, K., Sussmann, R., Té, Y., Velazco, V. A., Warneke, T., Wennberg, P. O., and Wunch, D.: A decade of GOSAT Proxy satellite CH4 observations, Earth Syst. Sci. Data, 12, 3383–3412, https://doi.org/10.5194/essd-12-3383-2020, 2020.
Parodi, A., Valencia-Salazar, S., Loboguerrero, A. M., Martínez-Barón, D., Murgueitio, E., and Vázquez-Rowe, I.: The sustainable transformation of the Colombian cattle sector: Assessing its circularity, PLOS Climate, 1, e0000074, https://doi.org/10.1371/journal.pclm.0000074, 2022.
Parra, A. S. and Mora-Delgado, J.: Emission factors estimated from enteric methane of dairy cattle in Andean zone using the IPCC Tier-2 methodology, Agroforest. Syst., 93, 783–791, https://doi.org/10.1007/s10457-017-0177-3, 2019.
Penn, E., Jacob, D. J., Bon, D. M., Howell, K., O’Neill, K., Scarpelli, T. R., Chen, Z., Field, R. A., Karacan, C. Ö., Roy, E., and Cusworth, D. H.: Remote Sensing Enables Basin-Scale Inventories of Coal Mine Methane, Environ. Sci. Technol., 60, 14924–14933, https://doi.org/10.1021/acs.est.5c14976, 2026.
Ramirez-Contreras, N. E., Munar-Florez, D. A., Garcia-Nuñez, J. A., Mosquera-Montoya, M., and Faaij, A. P. C.: The GHG emissions and economic performance of the Colombian palm oil sector; current status and long-term perspectives, J. Clean. Prod., 258, 120757, https://doi.org/10.1016/j.jclepro.2020.120757, 2020.
Ramírez-Restrepo, C. A. and Vera-Infanzón, R. R.: Methane emissions of extensive grazing breeding herds in relation to the weaning and yearling stages in the Eastern Plains of Colombia, Revista de la Facultad de Medicina Veterinaria y de Zootecnia, 66, 111–130, https://doi.org/10.15446/rfmvz.v66n2.82429, 2019.
Ricaurte, L. F., Patiño, J. E., Zambrano, D. F. R., Arias-G, J. C., Acevedo, O., Aponte, C., Medina, R., González, M., Rojas, S., Flórez, C., Estupinan-Suarez, L. M., Jaramillo, Ú., Santos, A. C., Lasso, C. A., Nivia, A. A. D., Calle, S. R., Vélez, J. I., Acosta, J. H. C., Duque, S. R., Núñez-Avellaneda, M., Correa, I. D., Rodríguez-Rodríguez, J. A., Vilardy Q, S. P., Prieto-C, A., Rudas-Ll, A., Cleef, A. M., Finlayson, C. M., and Junk, W. J.: A Classification System for Colombian Wetlands: an Essential Step Forward in Open Environmental Policy-Making, Wetlands, 39, 971–990, https://doi.org/10.1007/s13157-019-01149-8, 2019.
Rijsdijk, P., Eskes, H., Dingemans, A., Boersma, K. F., Sekiya, T., Miyazaki, K., and Houweling, S.: Quantifying uncertainties in satellite NO2 superobservations for data assimilation and model evaluation, Geosci. Model Dev., 18, 483–509, https://doi.org/10.5194/gmd-18-483-2025, 2025.
Scarpelli, T. R., Jacob, D. J., Maasakkers, J. D., Sulprizio, M. P., Sheng, J.-X., Rose, K., Romeo, L., Worden, J. R., and Janssens-Maenhout, G.: A global gridded (0.1° × 0.1°) inventory of methane emissions from oil, gas, and coal exploitation based on national reports to the United Nations Framework Convention on Climate Change, Earth Syst. Sci. Data, 12, 563–575, https://doi.org/10.5194/essd-12-563-2020, 2020.
Scarpelli, T. R., Roy, E., Jacob, D. J., Sulprizio, M. P., Tate, R. D., and Cusworth, D. H.: Using new geospatial data and 2020 fossil fuel methane emissions for the Global Fuel Exploitation Inventory (GFEI) v3, Earth Syst. Sci. Data, 17, 7019–7033, https://doi.org/10.5194/essd-17-7019-2025, 2025.
Soued, C., Harrison, J. A., Mercier-Blais, S., et al.: Reservoir CO2 and CH4 emissions and their climate impact over the period 1900–2060, Nat. Geosci. 15, 700–705, https://doi.org/10.1038/s41561-022-01004-2, 2022.
Stanevich, I., Jones, D. B. A., Strong, K., Parker, R. J., Boesch, H., Wunch, D., Notholt, J., Petri, C., Warneke, T., Sussmann, R., Schneider, M., Hase, F., Kivi, R., Deutscher, N. M., Velazco, V. A., Walker, K. A., and Deng, F.: Characterizing model errors in chemical transport modeling of methane: impact of model resolution in versions v9-02 of GEOS-Chem and v35j of its adjoint model, Geosci. Model Dev., 13, 3839–3862, https://doi.org/10.5194/gmd-13-3839-2020, 2020.
Superintendencia de Servicios Públicos Domiciliarios (SSPD): Sistema Único de Información (SUI), https://sui.superservicios.gov.co (last access: 19 May 2025), 2025.
Unidad de Planeación Minero Energética (UPME): Informe sobre factores de emisión de carbono del sector minero energético colombiano, UPME, Bogotá, Colombia, https://www1.upme.gov.co/simco/Cifras-Sectoriales/EstudiosPublicaciones/Informe_factores_emision_carbon_21_09_2016.pdf (last access: 27 June 2025), 2016.
Unidad de Planeación Minero Energética (UPME): Carbón – Cifras Sectoriales, Unidad de Planeación Minero Energética (UPME), https://www1.upme.gov.co/simco/Cifras-Sectoriales/Paginas/carbon.aspx (last access: 12 May 2025), 2025.
Valverde, A., Roger, J., Gorroño, J., Irakulis-Loitxate, I., and Guanter, L.: Detecting methane emissions from palm oil mills with airborne and spaceborne imaging spectrometers, Environ. Res. Lett., 19, 124003, https://doi.org/10.1088/1748-9326/ad8806, 2024.
van der Werf, G. R., Randerson, J. T., Giglio, L., van Leeuwen, T. T., Chen, Y., Rogers, B. M., Mu, M., van Marle, M. J. E., Morton, D. C., Collatz, G. J., Yokelson, R. J., and Kasibhatla, P. S.: Global fire emissions estimates during 1997–2016, Earth Syst. Sci. Data, 9, 697–720, https://doi.org/10.5194/essd-9-697-2017, 2017.
Vargas, J. J., Pabón, M. L., and Carulla, J. E.: Methane production from four forages at three maturity stages in a ruminal in vitro system, Rev. Colomb. Cienc. Pec., 31, 120–129, https://doi.org/10.17533/udea.rccp.v31n2a05, 2018.
Varon, D. J., Jacob, D. J., Sulprizio, M., Estrada, L. A., Downs, W. B., Shen, L., Hancock, S. E., Nesser, H., Qu, Z., Penn, E., Chen, Z., Lu, X., Lorente, A., Tewari, A., and Randles, C. A.: Integrated Methane Inversion (IMI 1.0): a user-friendly, cloud-based facility for inferring high-resolution methane emissions from TROPOMI satellite observations, Geosci. Model Dev., 15, 5787–5805, https://doi.org/10.5194/gmd-15-5787-2022, 2022.
Varon, D. J., Jacob, D. J., Hmiel, B., Gautam, R., Lyon, D. R., Omara, M., Sulprizio, M., Shen, L., Pendergrass, D., Nesser, H., Qu, Z., Barkley, Z. R., Miles, N. L., Richardson, S. J., Davis, K. J., Pandey, S., Lu, X., Lorente, A., Borsdorff, T., Maasakkers, J. D., and Aben, I.: Continuous weekly monitoring of methane emissions from the Permian Basin by inversion of TROPOMI satellite observations, Atmos. Chem. Phys., 23, 7503–7520, https://doi.org/10.5194/acp-23-7503-2023, 2023.
Veefkind, J. P., Aben, I., McMullan, K., Förster, H., de Vries, J., Otter, G., Claas, J., Eskes, H. J., de Haan, J. F., Kleipool, Q., van Weele, M., Hasekamp, O., Hoogeveen, R., Landgraf, J., Snel, R., Tol, P., Ingmann, P., Voors, R., Kruizinga, B., Vink, R., Visser, H., and Levelt, P. F.: TROPOMI on the ESA Sentinel-5 Precursor: A GMES mission for global observations of the atmospheric composition for climate, air quality and ozone layer applications, Remote Sens. Environ., 120, 70–83, https://doi.org/10.1016/j.rse.2011.09.027, 2012.
Verkaik, J.: Evaluation of Colombian methane emissions combining WRF-Chem and TROPOMI, Master’s thesis, Wageningen University & Research, https://edepot.wur.nl/496227 (last access: 16 April 2025), 2019.
Wang, X., Jacob, D. J., Nesser, H., Balasus, N., Estrada, L. A., Sulprizio, M. P., Cusworth, D. H., Scarpelli, T. R., Chen, Z., East, J. D., and Varon, D. J.: Quantifying urban and landfill methane emissions in the United States using TROPOMI satellite data, Science Advances, 12, eadz9308, https://doi.org/10.1126/sciadv.adz9308, 2026a.
Wang, X., Sulprizio, M. P., Zhuge, Y., Martin, R. V., and Jacob, D. J.: Technical note: 12-km resolution capability for the global GEOS-Chem model of atmospheric composition, EGUsphere [preprint], https://doi.org/10.5194/egusphere-2025-5811, 2026b.
Worden, J. R., Cusworth, D. H., Qu, Z., Yin, Y., Zhang, Y., Bloom, A. A., Ma, S., Byrne, B. K., Scarpelli, T., Maasakkers, J. D., Crisp, D., Duren, R., and Jacob, D. J.: The 2019 methane budget and uncertainties at 1° resolution and each country through Bayesian integration of GOSAT total column methane data and a priori inventory estimates, Atmos. Chem. Phys., 22, 6811–6841, https://doi.org/10.5194/acp-22-6811-2022, 2022.
Zhang, B., Tian, H., Lu, C., Chen, G., Pan, S., Anderson, C., and Poulter, B.: Methane emissions from global wetlands: An assessment of the uncertainty associated with various wetland extent data sets, Atmos. Environ., 165, 310–321, https://doi.org/10.1016/j.atmosenv.2017.07.001, 2017.
Zhang, Z., Zimmermann, N. E., Kaplan, J. O., and Poulter, B.: Modeling spatiotemporal dynamics of global wetlands: comprehensive evaluation of a new sub-grid TOPMODEL parameterization and uncertainties, Biogeosciences, 13, 1387–1408, https://doi.org/10.5194/bg-13-1387-2016, 2016.
Zhang, Z., Zimmermann, N. E., Calle, L., Hurtt, G., Chatterjee, A., and Poulter, B.: Enhanced response of global wetland methane emissions to the 2015–2016 El Niño-Southern Oscillation event, Environ. Res. Lett., 13, 074009, https://doi.org/10.1088/1748-9326/aac939, 2018.
Zhang, Z., Poulter, B., Feldman, A. F., Ying, Q., Ciais, P., Peng, S., and Li, X.: Recent intensification of wetland methane feedback, Nat. Clim. Change, 13, 430–433, https://doi.org/10.1038/s41558-023-01629-0, 2023.
- Abstract
- Introduction
- Spatially resolved bottom-up inventory
- Top-down information and inversion methods
- Posterior national emissions for Colombia informed by TROPOMI
- Implications for improving bottom-up emission inventories
- Conclusions
- Data availability
- Author contributions
- Competing interests
- Disclaimer
- Financial support
- Review statement
- References
- Supplement
- Abstract
- Introduction
- Spatially resolved bottom-up inventory
- Top-down information and inversion methods
- Posterior national emissions for Colombia informed by TROPOMI
- Implications for improving bottom-up emission inventories
- Conclusions
- Data availability
- Author contributions
- Competing interests
- Disclaimer
- Financial support
- Review statement
- References
- Supplement