the Creative Commons Attribution 4.0 License.
the Creative Commons Attribution 4.0 License.
 | 22 Jan 2026
Impact on cloud properties of reduced-sulphur shipping fuel in the Eastern North Atlantic
Sally Benson
Peter Gombert
Tiffany Smallwood
The global reduction in shipping fuel sulphur that culminated in 2020 with an ∼ 80 % reduction has created a large-scale natural experiment on the role of aerosol-cloud interaction (ACI) in the climate system. We compare observations from the Atmospheric Radiation Measurement program's Eastern North Atlantic site (ARM-ENA; 39.1° N, 28.0° W) during two June to September periods: 2016–2018 (pre-2020) and 2021–2023 (post-2020). We find a significant (∼ 15 %) decrease in cloud condensation nuclei concentrations post-2020, which resulted in a decrease in cloud droplet number (Nd) and an increase in effective radius (re) of marine boundary layer clouds. However, cloud liquid water path (LWP) increased post-2020. The increase in LWP offset the increase in re, resulting in insignificant changes to optical depth. MODIS and CERES data in the vicinity of ENA during these periods produce similar results also with negligible change in albedo and optical depth. Regional cloud occurrence declined in line with changes in the large-scale meteorology. Our results highlight the complex interplay of factors that modulate cloud feedbacks in the Eastern North Atlantic.
- Article
(1720 KB) - Full-text XML
-
Supplement
(1680 KB) - BibTeX
- EndNote


Liquid clouds in the marine boundary layer (hereafter MBL clouds) are significant cooling agents in the climate system. Extended sheets of geometrically thin but optically thick stratocumulus cover broad regions of the subtropical eastern ocean basins in both hemispheres (Wood, 2012; Klein and Hartman, 1993) and influence the Earth's albedo and climate sensitivity (Klein et al., 2017). Indeed, uncertainties in simulating potential changes to MBL clouds in a warming climate contribute significantly to the uncertainty in our knowledge of the Earth's climate sensitivity (Sherwood et al., 2020). In the past decade, MBL clouds have decreased measurably and are responsible for an accelerating imbalance in the Earth's energy budget (Goessling et al., 2025). This persistent uncertainty in MBL cloud-climate interaction stems from their coupling with the large-scale atmosphere (Klein et al., 2017) and the local conditions that control MBL cloud properties when present such as the aerosol particles on which cloud droplets form (hereafter cloud condensation nuclei, CCN). This coupled system is further complicated by the occurrence of precipitation that redistributes water and heat within the MBL and removes water entirely from the atmosphere when the precipitation reaches the surface thereby influencing cloud character and coverage (Albrecht, 1989; Wood, 2005).
The amount of sunlight reflected to space relative to what enters the earth system at the top of atmosphere (albedo) depends on the total droplet surface area in the vertical column that, in turn, can be related to the vertically integrated condensed liquid water mass (hereafter, liquid water path, LWP) and the number of drops per unit volume (Nd) within which the water is partitioned. Often a characteristic droplet size such as the effective radius (re) is used as a proxy for Nd (Stephens, 1978). Twomey (1977) identified how increasing droplet surface area due to higher concentrations of CCN can influence the cloud optical depth and albedo for a given LWP.
A direct example of how anthropogenic aerosols influence marine low cloud properties and radiative effects is the ship track phenomenon that became apparent at the dawn of the satellite era (Conover, 1966). Sulphur dioxide emitted from ship stacks oxidizes into sulphuric acid aerosols to produce anomalously high CCN concentrations. Because they are often readily identifiable on satellite imagery, ship tracks have been used for decades to understand how CCN influences marine cloud albedo (e.g. Christensen and Stephens, 2011). More recently, ship tracks that are not visibly evident in imagery have been shown to produce heavily modified cloud properties (Manshausen et al., 2022). What has been more difficult to establish until recently is how shipping-related aerosol influenced clouds globally. While Diamond et al. (2020) estimate that all anthropogenic aerosol–cloud interactions produce a global cooling of about −1 W m−2, shipping emissions constitute an important subset of this effect.
A series of regulation changes from the International Maritime Organization (Osipova et al., 2024) that culminated in 2020 reduced the sulphur content of global shipping fuel from ∼ 3.5 % to 0.5 %. This change has been shown to dramatically reduce the occurrence of visible ship tracks in satellite imagery (Yuan et al., 2022). Regional changes in marine low cloud microphysics associated with the IMO 2020 regulation have also been documented in a major shipping lane in the tropical Southeast Atlantic off the African continent (Diamond, 2023). Most recently, Yuan et al. (2024) have attempted to quantify the global impact of the IMO 2020 regulation concluding that the reduction in sulphur will produce an increase in net radiation absorbed by the Earth of 0.2 W m−2. While recent studies have identified substantial reductions in marine low clouds that are directly implicated in rapid and accelerating imbalances in the Earth's energy budget (Goessling et al., 2025), the role of aerosols in these changes are a subject of debate (Goessling et al., 2025; Hodnebrog et al., 2024; Hansen et al., 2023). Yuan et al. (2024) hypothesized that this inadvertent change to marine low clouds could result in accelerated warming of the Earth. While Yuan et al (2024) suggest that some number of years will be necessary to observe the effects of the fuel change globally, regional changes such as in the heavy shipping lanes of the Eastern Atlantic may be identifiable sooner. We take up that challenge in this study.
We focus on data collected at the U.S. Department of Energy Atmospheric Radiation Measurement (ARM) Eastern North Atlantic (ENA) site located on the Portuguese Island of Graciosa in the Azores Archipelago. ARM established the ENA site in 2015 (Wood et al., 2015). We examine the warm season (June–September) when the Azores anticyclone migrates northward and brings a higher frequency of northeasterly flows to the Azores and a high occurrence of MBL clouds over the ARM-ENA site (Albrecht et al., 1995). As detailed in Appendix A, we examine cloud properties derived from ARM data collected during periods of northeasterly flow that have been shown to have unmodified marine characteristics. We divide the data into pre-2020 (2016, 2017, 2018) and post-2020 (2021, 2022, 2023) periods (hereafter referred to as pre and post, respectively). In addition, we also examine cloud properties from those months and years derived from MODIS and CERES data in the region around the ARM site.
2.1 Large-Scale Cloud Controlling Factors
Since the large-scale atmosphere creates the conditions for MBL cloud occurrence, we examine the extent to which several Cloud Controlling Factors (CCFs; Klein et al. (2017)) varied in the region surrounding the ARM-ENA site (Fig. 1 and Table S1 in the Supplement). We find measurable changes in aspects of the large-scale atmosphere. While the large-scale subsidence, the mid-tropospheric humidity, and the low-level temperature advection remained nearly constant, the estimated inversion strength (EIS; Wood and Bretherton, 2006) and the near-surface wind speed distributions are measurably different. The EIS quantifies the strength of the temperature inversion that typically exists at the top of the MBL that separates the generally well-mixed and humid MBL from the drier and stratified free troposphere. The tendency for dry air to be entrained into the MBL is a direct product of the EIS with stronger inversions resulting in less mixing and more humid MBLs with higher cloud cover. Stronger near-surface winds tend to enhance evaporation and mechanical mixing within the MBL promoting increased cloud cover (Brueck et al., 2015; Bretherton et al., 2013). The MERRA data suggest that EIS is lower in the post period while near surface winds are slightly stronger. These CCFs are likely not entirely independent since more mixing would increase near surface winds.
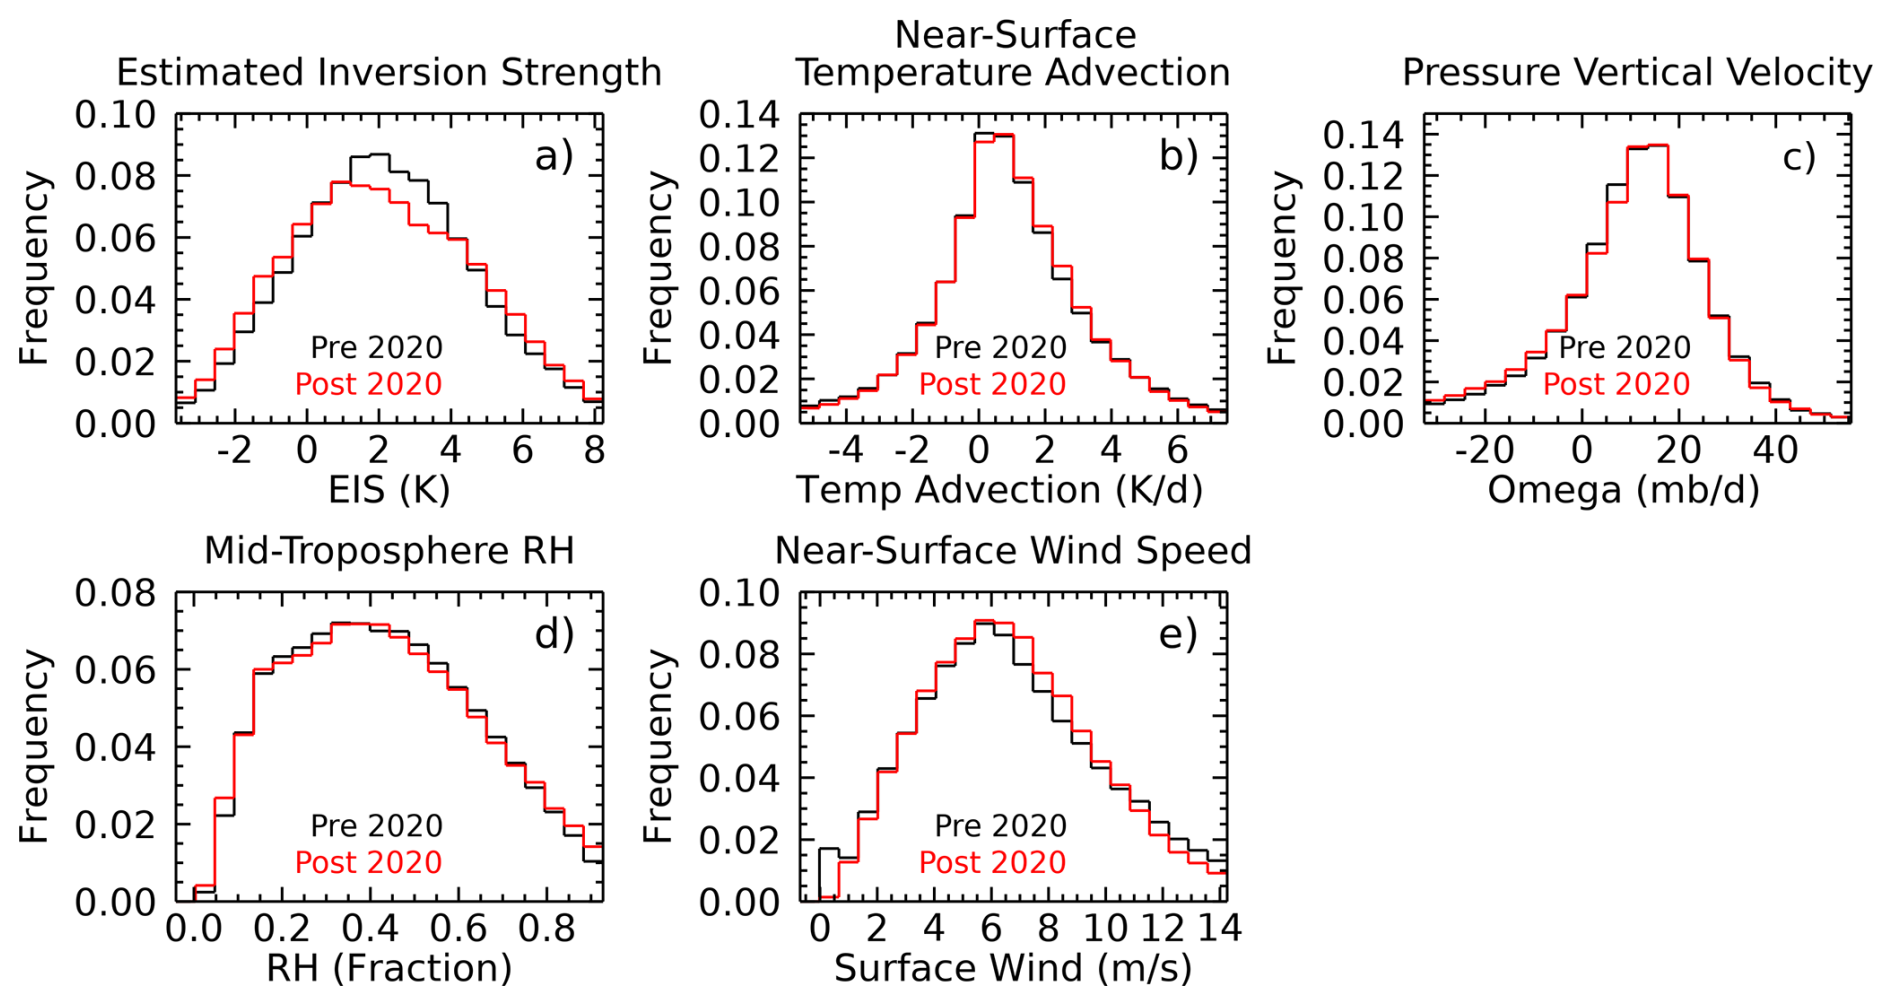
Figure 1Comparison of the cloud controlling factors derived from MERRA for the pre- (Black) and post-2020 (red) periods. (a) Estimated Inversion Strength (K), (b) Near-Surface Temperature Advection (K d−1), (c) pressure vertical velocity (omega, mb d−1), (d) mid-troposphere relative humidity (RH), and (e) Near-surface wind speed (m s−1). Statistics of these distributions are given in Table S1.
The increase in surface winds has the potential to modify the mesoscale organization of the marine stratocumulus fields. (Wood and Hartmann, 2006; Wang and Feingold, 2009; Yamaguchi and Feingold, 2015; Goren et al., 2019). Increases in wind speed can enhance turbulent fluxes and drizzle, occasionally promoting transitions toward more open or organized cellular convection. However, the ENA warm-season clouds analysed here generally occur in moderate-wind conditions below the threshold where such mesoscale transitions are pronounced. We therefore expect mesoscale organization to have limited influence on the observed cloud property changes. However, this topic would be an interesting topic of follow up studies.
We also note that the sea surface temperatures (SST) increased modestly (not shown) from the pre to post periods (∼ 0.3 K). However, while increased near-surface temperatures have the potential to increase LWP because of a less steep moist adiabatic lapse rate, warmer near-surface temperatures are also strongly coupled to EIS-related drying. The studies by Gordon and Klein (2014), Eitzen et al. (2011), and Sherwood et al. (2014) address the role of warmer temperatures on MBL clouds and conclude that the mixing-induced drying is predominant in subtropical stratocumulus.
2.2 ARM-ENA Observations
MBL cloud occurrence fractions at the ARM-ENA site derived from the times when the microwave radiometer provided positive LWP and the rain indicator suggested the instrument was dry were 0.787 and 0.720 in the pre and post periods, respectively. Figure 2 shows the frequency distributions of the CCN, cloud, and precipitation statistics of MBL clouds when the winds were within the directional limits for which we can be confident that the aerosol was representative of marine air during the pre and post periods. Table S2 summarizes the statistics of these distributions.
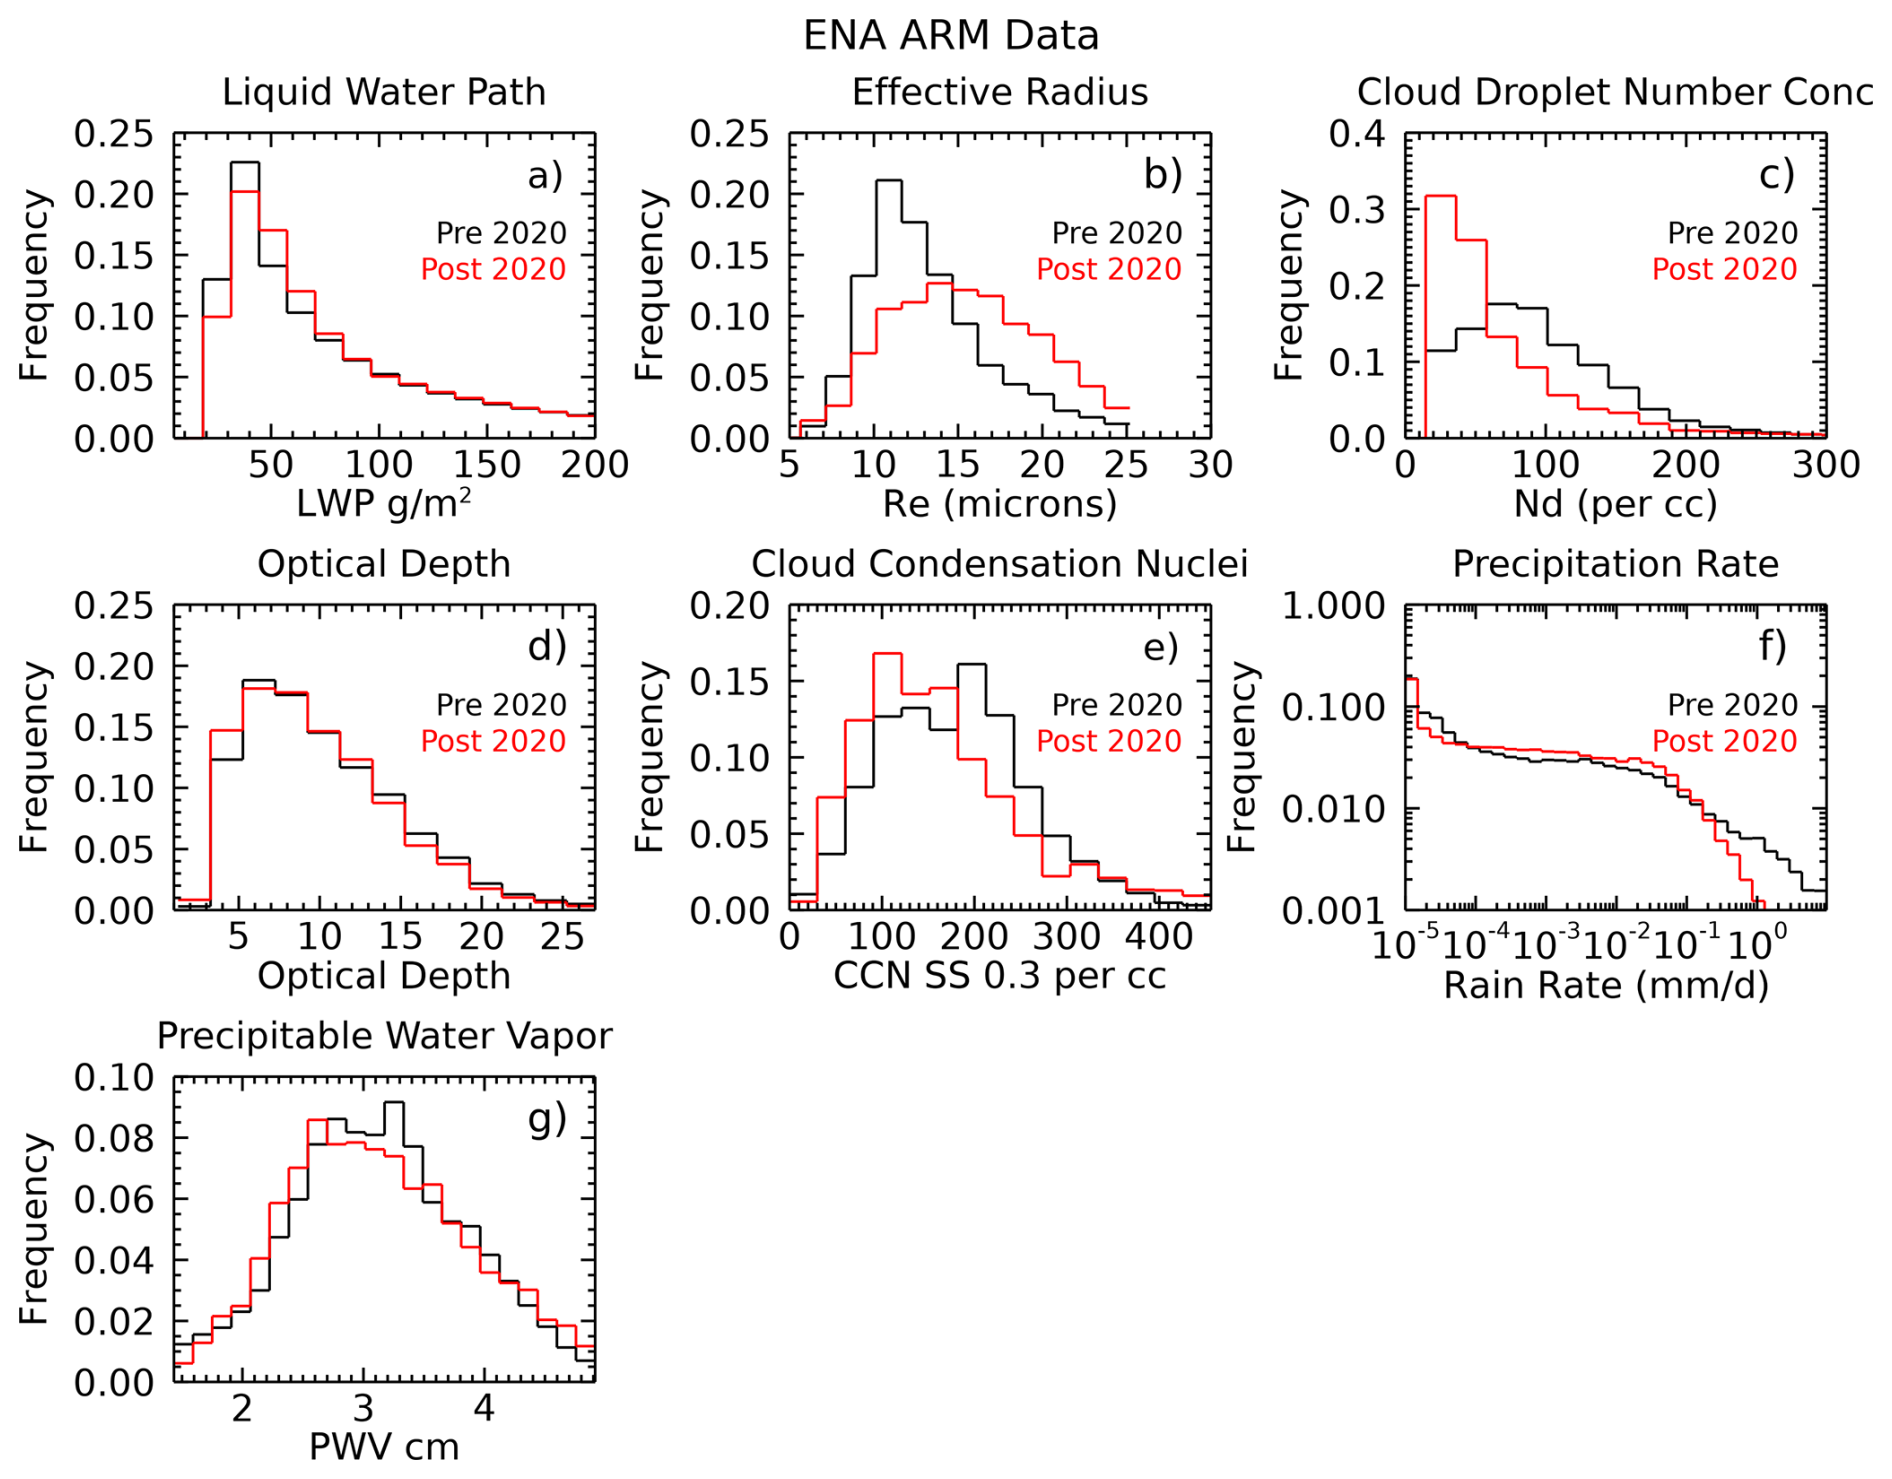
Figure 2Cloud and precipitation derived property distributions measured during the pre (black) and post (red) periods at the ARM ENA site when wind and cloud conditions were appropriate. There are 20 990 and 15 650 5 min samples of data in the pre and post periods, respectively. There are 187 and 134 unique days in the pre and post periods, respectively.
We find a significant decrease in the 0.2 % supersaturation (SS) CCN concentrations from the pre to post periods. The mean 0.2 % SS CCN concentrations decreased from 179 to 160 cm−3, and the KS test suggests rejection of the null hypothesis that the distributions were drawn from the same sample. With a clear decrease of ∼ 12 % in the CCN concentrations, the microphysical properties of MBL clouds change in a manner consistent with Twomey (1977). We find that the Nd distribution shifts significantly to lower values in the post period with the mean decreasing from 93 to 62 cm−3 while re increase from 12 to 15 µm. These changes in re and Nd would normally be associated with decreases in MBL cloud optical thickness (; Stephens (1978), where ρ is the density of liquid water). However, we find that the τ distributions between the pre and post periods are statistically indistinguishable from one another. Examining the LWP, we can see why this is so. From the pre to post periods the LWP increased from a mean of 68 to 73 g m−2. KS tests indicate the null hypothesis can be rejected at the 95 % confidence level suggesting that the LWP distributions appear not to be drawn from a similar sample population.
The formation of drizzle in marine stratocumulus clouds is strongly linked to microphysics with large cloud droplets increasing the propensity for drizzle formation (Kang et al., 2022). Defining precipitation as the occurrence of measurable radar reflectivity 100 m below the lidar identified cloud base, we find that the occurrence frequency of drizzle when clouds are present increases from 0.62 to 0.69 between the pre and post periods consistent with the increase in re. However, the drizzle rate distribution, derived using the Comstock et al. (2004) method applied to KAZR data 100 m below cloud base, changes markedly: the occurrence of heavier drizzle (> 0.1 mm d−1) decreases in the post period.
2.3 MODIS and CERES Observations
Figure 3 and Table S3 summarize the MODIS and CERES properties from MBL cloud data collected within 250 km of the ARM-ENA site. These statistics are compiled from cloud covered pixels deemed to contain MBL clouds following the method outlined in Mace et al. (2023) and represent the properties of clouds when clouds are present. For these statistics we sample all overpasses of the region and do not filter by wind direction as was done in the ARM-ENA data. The qualitative results comparing the pre and post periods are similar from ARM-ENA and MODIS. Recall that the MODIS bispectral algorithm retrieves the re and τ from visible and near infrared solar reflectance measurements of 1km pixels (Platnick et al., 2003), and the LWP and Nd are inferred from the retrieved τ and re (Grosvenor et al., 2018). The MBL cloud data suggest that re increased while τ remained largely the same during the pre and post periods. This result implies that, like the surface-based data, the Nd and LWP would have decreased and increased respectively which is what the MODIS data demonstrate. Also like the surface-based data, the τ distributions are very similar although not statistically indistinguishable at the 99 % confidence level. We do note, however, that the MODIS decrease in Nd is much closer to the decrease in CCN found at ENA than the larger increase in the derived Nd at the surface (Fig. 2c). We do not have a ready explanation for this difference aside from the possibility that the MODIS observations are weighted to cloud top while the surface results are weighted to the cloud base region.
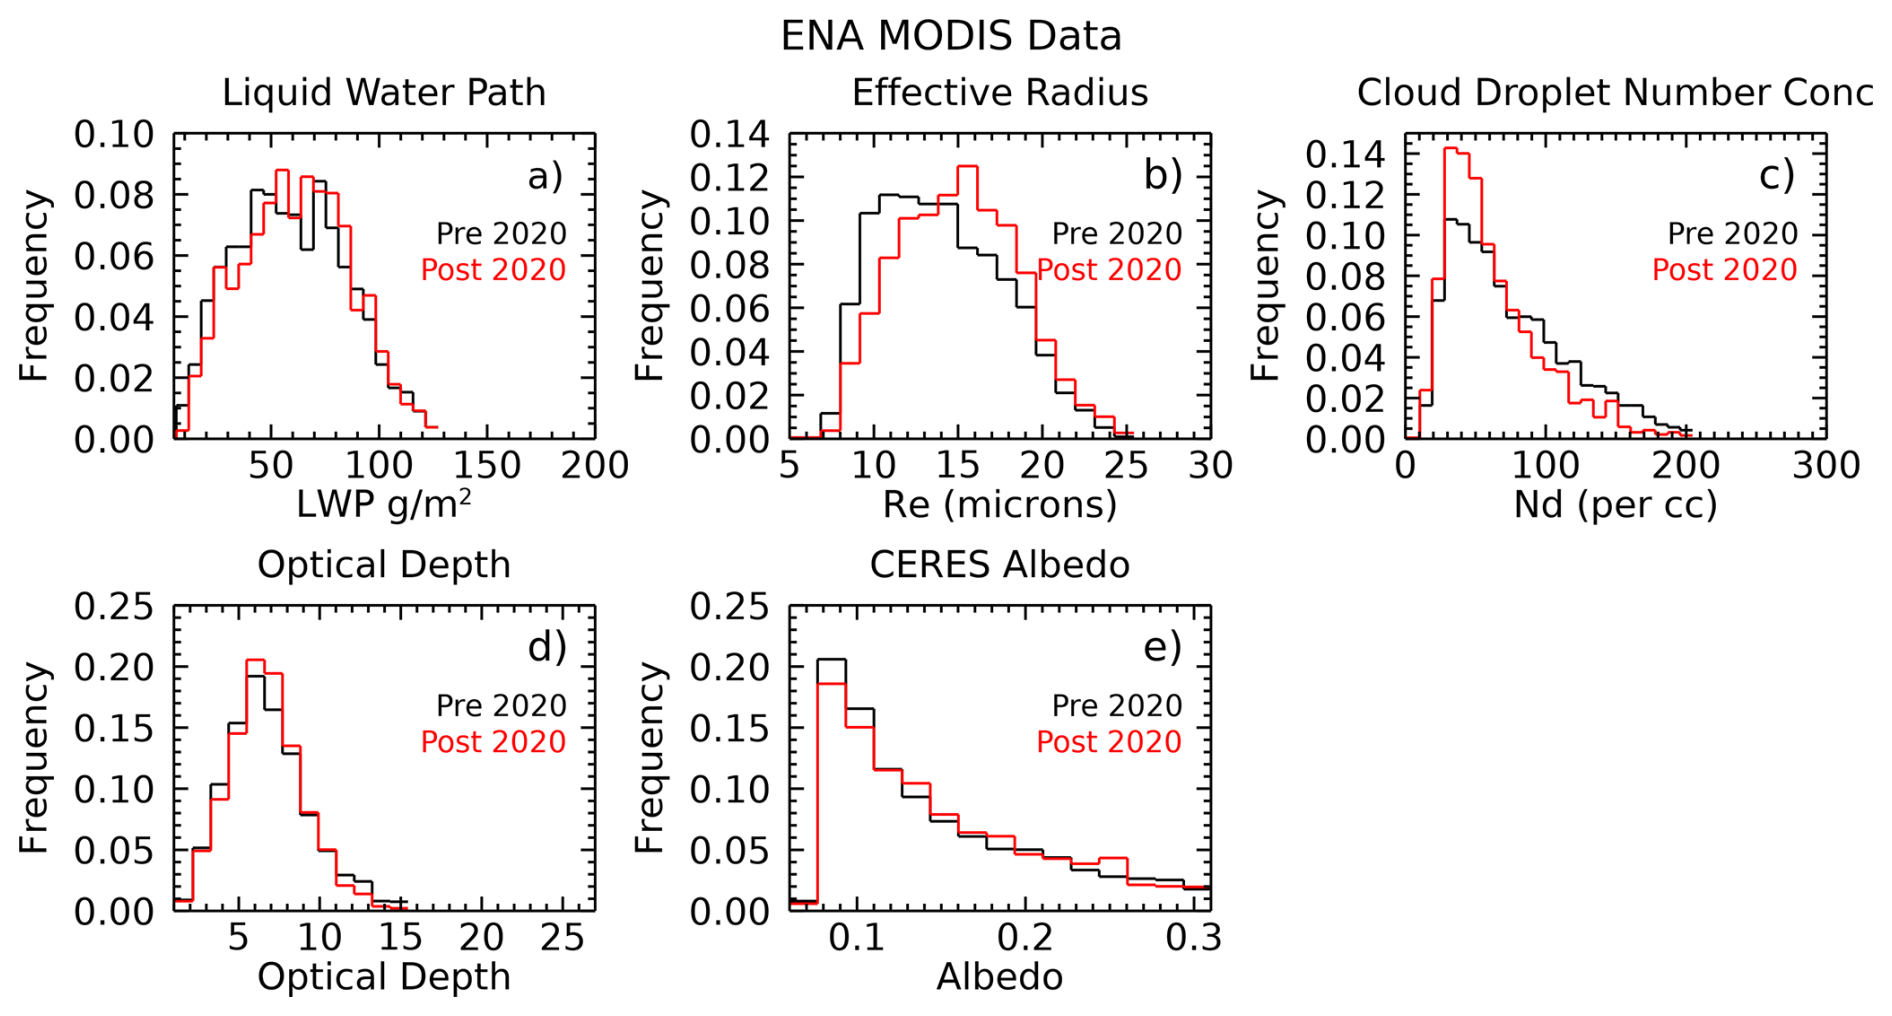
Figure 3MODIS cloud property distributions from data collected using the criteria listed in the Methods section within 100 km of the ARM ENA site. See the Supplement for a 250 km version of these plots.
The Terra and Aqua satellites have the CERES instrument to directly infer the planetary albedo (Ap) that is defined as the fraction of sunlight reflected to space. The CERES data are measured at coarser resolution than MODIS (∼ 20 km versus ∼ 1 km). We find that the CERES Ap distributions from the pre and post periods when clouds are present are also very similar.
We emphasize that our cloud property analysis applies only to periods when clouds are present. MODIS allows us to examine the occurrence frequency of low clouds. Figure 4 illustrates that the Azores Archipelago sits within a southeasterly gradient in low cloud occurrence. The data, however, show that the pre and post periods had significantly different distributions of MBL clouds with the gradient weakening and overall cloud occurrence decreasing between the two periods. Recall also that the ARM-ENA cloud fraction decreased from the pre to the post periods by an amount like that shown in Fig. 4. The MODIS cloud fraction of the 1 pixel located over the ARM-ENA site decreased from 0.76 to 0.64 in the pre and post periods, respectively. These findings are consistent with the results presented in Goessling et al. (2025) who show that the Eastern Subtropical Atlantic is within a region of increasing absorbed solar radiation anomalies and decreasing cloud cover.
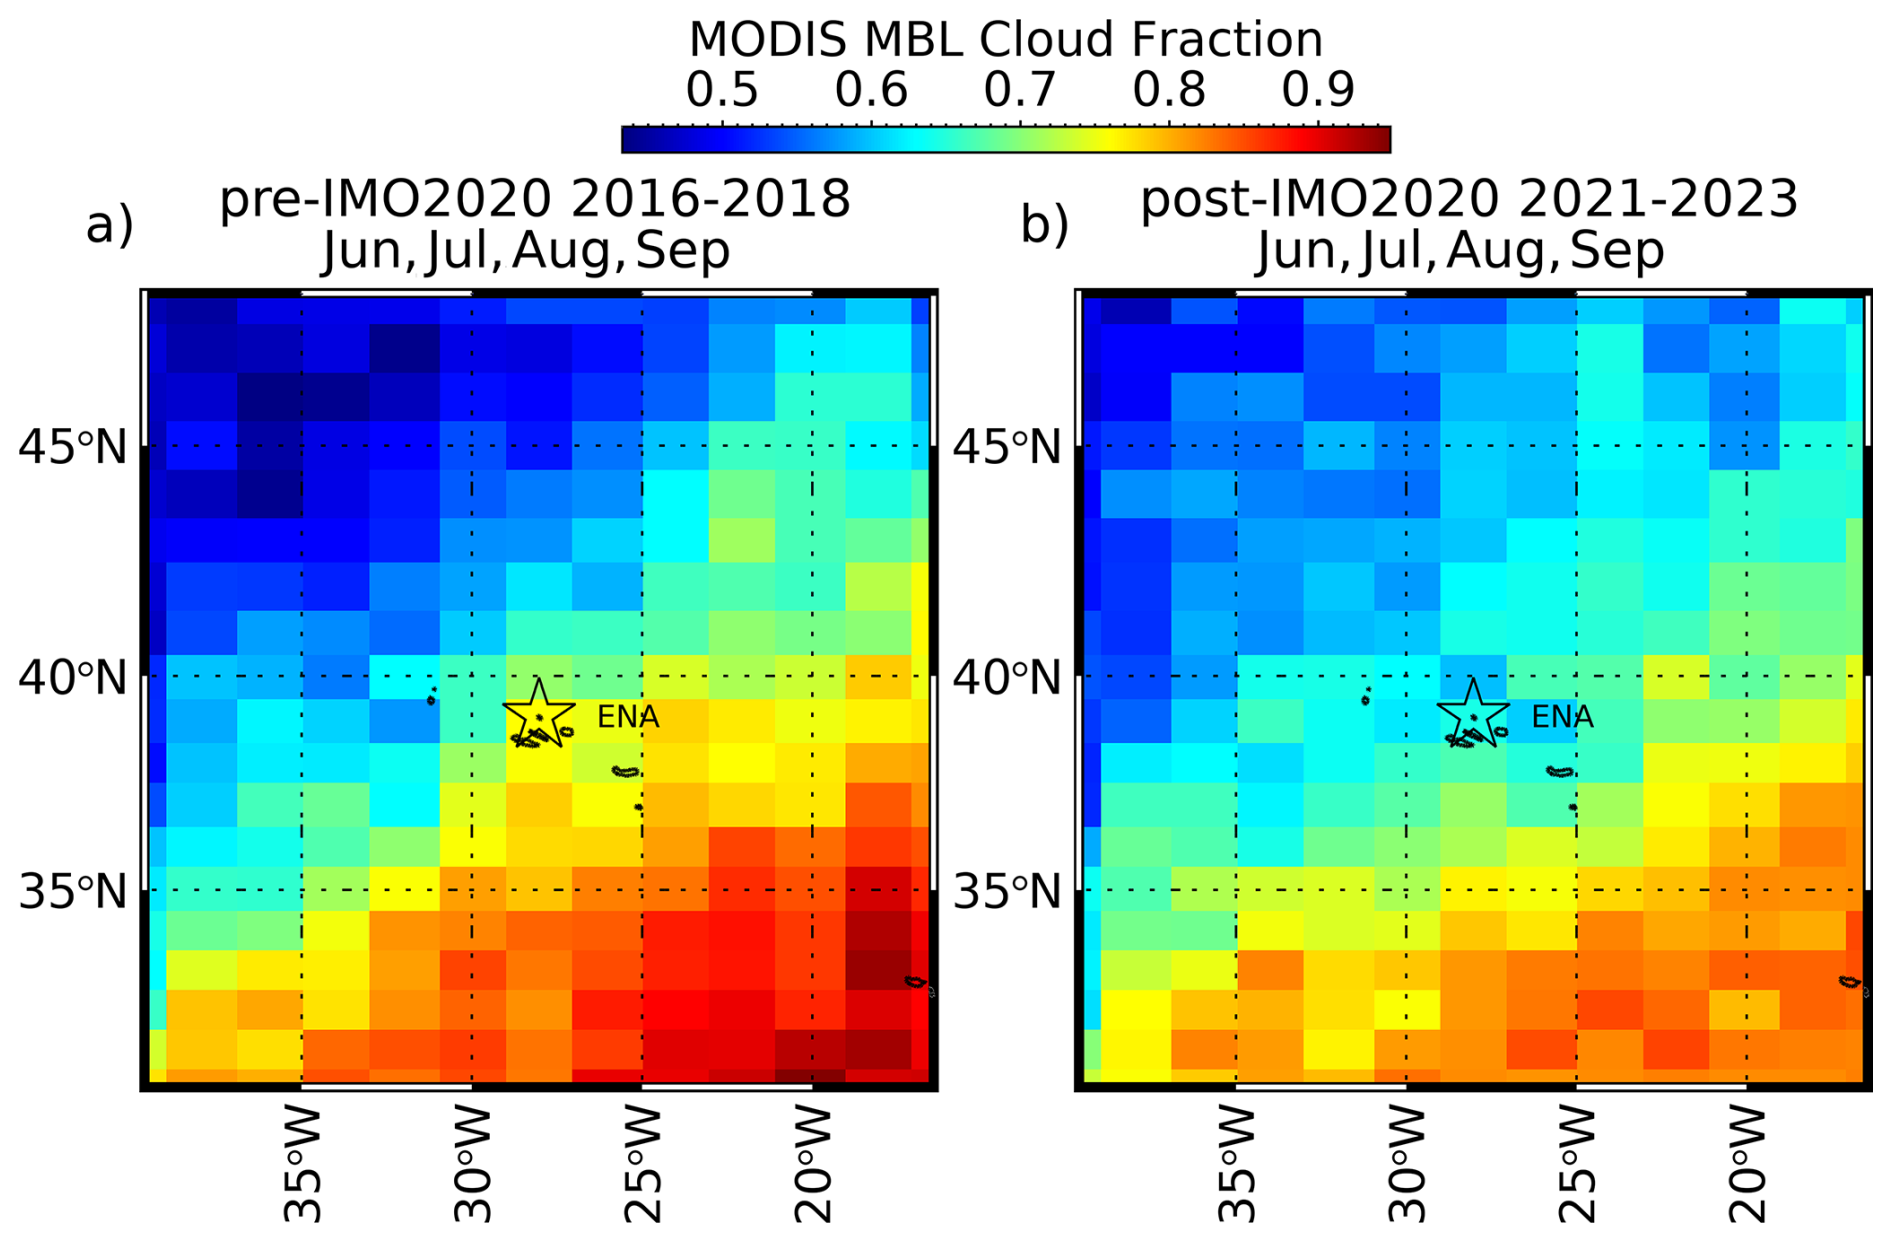
Figure 4Occurrence of MBL clouds during the respective years diagnosed from MODIS data. There were approximately 400 Terra and Aqua daytime overpasses of this domain during each of the pre and post periods.
The ENA region, dominated by MBL clouds during the warm season months and a major route for international shipping (Osipova et al., 2024), has undergone substantial change in the past decade. However, the aerosol changes did not occur in isolation. The large-scale atmosphere also changed during this time with the EIS becoming measurably weaker while near-surface winds increased. These changes occurred during a period of persistently weak La Nina conditions during the post period that could also have influenced the large-scale atmosphere of the Eastern North Atlantic (Knight and Scaife, 2024). Unfortunately, the simultaneous changes in aerosol and large-scale forcing complicate any simple conclusions that can be drawn from the surface- and satellite-based measurements of low cloud properties and occurrence.
We find both a long-term change in cloud occurrence and a microphysical response in MBL cloud properties to a decrease in CCN that is contemporaneous with the reduction in shipping fuel sulphur content. However, both the ARM, MODIS and CERES data suggest that the radiative effect of this change to microphysics is buffered by a slight upward adjustment to the LWP that mostly offsets the Twomey effect when clouds are present. LWP adjustments in MBL clouds under varying aerosol have been reported to be both positive and negative (Chen et al., 2014; Manshausen et al., 2022; Lebsock et al., 2008; Toll et al., 2019; Christensen and Stephens, 2011). The adjustments are often shown to be associated with changes to precipitation since precipitation is anticorrelated with increases in aerosol (Toll et al., 2019). While we find that the occurrence frequency of precipitation does increase slightly as the re increases as theoretically expected, the occurrence of heavier drizzle (> 0.1 mm d−1) decreases. To determine if the change to precipitation rate distribution is significant, we integrate the frequency distributions in Figure 2f as described in Appendix Sect. A5. We find that in the pre period the drizzle loss to LWP by precipitation () amounted to 0.159 mm per unit cloud fraction while in the post period the loss was 0.103 mm per unit cloud fraction. Thus, while drizzle occurs slightly more frequently in the post period with higher re, the change in precipitation rate distribution is significant and cuts the loss of cloud water due to precipitation per unit cloud fraction by a factor of ∼ 40 %. Had the large-scale cloud controlling factors remained unchanged, we speculate that the MBL cloud fraction would have perhaps increased due to the reduction in loss of cloud water to drizzle perhaps resulting in a negative feedback to the climate system. While this scenario runs counter to the conclusions of Manshausen et al. (2023), such a negative feedback was hypothesized theoretically by Stevens and Seifert (2008) and Glassmeier et al. (2021).
It appears that, at least in the region near the ARM-ENA site, the aerosol impact on the radiative balance since the fuel change in 2020 is negligible. This conclusion is consistent with the findings of Goessling et al. (2025) in a global study who find that the role of aerosol in the long term upward trending radiative imbalance is unclear. Goessling et al. (2025) do, however, link the trend in radiative imbalance to decreasing coverage of MBL clouds – especially in the Subtropical Eastern Atlantic – also see our Fig. 4. The change we find in the MERRA EIS is consistent with a decrease in MBL cloud cover during the period under study. There have been many papers based on both observations and modelling that have suggested that increased mixing of dry air into the MBL can act to decrease cloud cover and may constitute a positive climate feedback (Sherwood et al., 2020). As an independent constraint on the MERRA EIS, we hypothesize that if mixing into the lower troposphere increased between the pre and post periods, then this should be measurable as a reduction in column water vapor. Figure 2g shows that this is indeed the case with the column integrated water vapor measured at the ARM ENA site decreasing slightly but significantly in the post period consistent with the idea that increased mixing of mid tropospheric dry air increased during this period due to a weaker marine inversion.
Finally, returning to cloud properties, the question remains whether the near cancellation in the radiative response of the clouds by offsetting changes in LWP and re is a case of buffering in the guise of Stevens and Feingold (2009) or if the small decrease in column water vapor and/or the weaker inversion strength acted to influence the distribution of drizzle rates. Given the extensive measurements at the ARM ENA site, there remains much to explore regarding the interactions between MBL clouds observed at the ENA site, sensitivity to aerosol, and interactions with local meteorology and boundary layer structure. In summary, changes in the Eastern North Atlantic are acting in concert to decrease the cooling effect on the climate system imposed by MBL clouds and much work remains to understand the intricate interactions on multiple scales that are acting to drive the climate system farther from radiative balance.
We examine warm season (June–September) aerosol and cloud properties from the 2016–2019 period and compare it with data collected in the same months from the 2021–2023 period after the IMO 2020 change was fully implemented. We refer to these periods as “pre” and “post” periods, respectively.
A1 ARM Data
The ARM ENA data streams used in this study include the following
-
Cloud Condensation Nuclei: CCN were measured using the DMT CCN 100 (2016–2019) and the DMT CCN 200 (2021–2023). The two models share identical technology with the difference being that the DMT 200 adds the ability to measure CCN at two supersaturations simultaneously (Uin and Enekwizu, 2024). These instruments cycle through multiple supersaturations (SS) between 0.05 and 1, typically spending ∼ 5 min at each SS, completing a full cycle about once per hour. Because the CCN 100 became unreliable at SS exceeding 0.3 in 2019 and was replaced in 2021, and because the SS measured were slightly different during the pre and post periods, we estimate the CCN at 0.2 SS by linearly interpolating the CCN at supersaturations below 0.3 during both periods. Mirrielees and Brooks (2018) evaluated sources of uncertainty in the DMT CCN instruments and found that the greatest uncertainties occurred for undercounting under high aerosol conditions. Such conditions are rare at ARM-ENA. Under ideal conditions Mirrielees and Brooks (2018) report that uncertainty in CCN concentrations are typically less than 5 %.
-
Cloud Radar: The Ka ARM Zenith Radar (KAZR, Widener et al., 2012) has been deployed at the ENA site since 2015. The radar collects zenith profiles of radar Doppler spectra using several operational modes designed to optimize detection of various hydrometeor types with a beamwidth of 0.3° and time resolution of ∼ 10 s in 30 m range bins. For this study we use the General Mode that is characterized by no pulse compression that allows for detection of drizzle to the lowest useful range bins. For this study, we use only the zeroth moment of the Doppler spectrum or equivalent radar reflectivity factor. We apply a +3 dB correction factor to the radar reflectivity as reported by Kollias et al. (2019) and assume an uncertainty in radar reflectivity factor of 3 dB.
-
Microwave Radiometer (MWR): The MWR deployed at ENA is an RPG-LWP-U90 system that measures downwelling radiances at 23.8 and 31.4 and 90 GHz with a temporal resolution of approximately 3 s. Integrated water vapor mass known as precipitable water vapor (PWV) and integrated condensed liquid water also known as liquid water path (LWP) are derived using the algorithm described by Turner et al. (2016) with an uncertainty in LWP of approximately 20 % for LWP exceeding 20 g m−2.
-
Micro Pulse Lidar (MPL): The MPL (Muradyan et al., 2010) provides copolarized and cross polarized zenith profiles of attenuated backscattered 523 nm laser light in 15 m vertical bins with a time resolution of ∼ 10 s. For the methods described below we do not require calibrated attenuated backscattered measurements.
In addition, twice daily radiosonde soundings (Keeler et al., 2012) are used as well as a surface meteorological data (Kyrouac et al., 2024) that includes wind speed and direction. To ensure that the data are minimally modified by flow over the island and the CCN are representative of marine clouds, we filter measurements to when the surface wind at the ENA Site are at least 2.5 m s−1 and from directions between 330 and 70° and between 220 and 280° (Gallo et al., 2020).
A2 Cloud Properties from ARM Data
In addition to LWP derived from the MWR, we also derive Nd and re using a method described in Mace (2024) that combines the MPL vertical profile of attenuated backscatter, the cloud boundaries from KAZR and MPL, and the near cloud top radar reflectivity with constraints provided by the CCN measurements. This method attempts to exploit the information available from the lidar near cloud base. We find (Mace, 2024) that the vertical rate of change of the lidar signal above cloud base provides a quantitative constraint on Nd when we have additional constraints on LWP from an MWR and cloud layer thickness from the combination of a cloud radar (top) and lidar (base) that takes the following form:
where rmax is the distance from cloud base to where the vertical rate of change of the lidar attenuated backscatter changes sign. B is a proportionality constant, η is the lidar multiple scattering factor, Γl is the temperature dependent adiabatic liquid water lapse rate, fad is the adiabaticity of the cloud layer. The cloud top re then follows using an equation from Grosvenor et al. (2018):
where h is the cloud layer thickness and k is the cubed ratio of the volume mean droplet radius to re. A drawback of the analytical expressions is their sensitivity to rmax and their requirement for vertical resolution better than 5 m. Therefore, as described in Mace (2024), we add additional information such as cloud top radar reflectivity, and lidar derived extinction (Li et al., 2011) and cast the solution to Nd and re in terms of a Bayesian Optimal Estimation Inversion algorithm (Maahn et al., 2020) using Eqs. (A1) and (A2) as first guesses. This approach allows us to derive Nd to within ∼ 100 % and re to within 30 % for 30 s averaged observations. Note that the derived Nd is not entirely independent of CCN, since CCN concentration is used as an upper constraint in the inversion algorithm. We further restrict our analysis of the ARM ENA microphysical retrievals to when cloud base and top are less than 4 km above the surface and the LWP is greater than 20 g m−2 and the “rain flag” indicates that the MWR instrument was dry.
A3 Satellite Data
We also examine cloud properties derived from MODIS instruments on the Terra and Aqua satellites when they pass within 500 km of the ARM ENA site (Platnick et al., 2015a, b). The MODIS algorithm uses reflected sunlight in visible and near infrared spectral bands to derive the optical depth (τ) and re (Nakajima and King, 1990) from which LWP and Nd are derived (Grosvenor et al., 2018). Our approach to compiling MODIS cloud property statistics is described in Mace et al. (2023) where we restrict analysis to ice-free MBL cloud scenes with LWP < 300 g m−2 to avoid drizzle that complicates the retrieval (Xu et al., 2022). Furthermore, we restrict our analysis to view zenith angles less than 30. Our analysis is restricted to the June-September periods of the years considered for the ARM ENA data (2016–2019 and 2021–2023). In Mace (2024) and Mace et al. (2024) we present comparisons of MODIS and surface-based retrievals of Nd, re, LWP, and τ. In addition, we use the observed collocated MBL cloud albedo from the Clouds and the Earth's Radiant Energy System (CERES) Energy Balanced and Filled (EBAF) v 4.0 (Loeb et al., 2018) data from instruments on the Terra and Aqua satellites that are coincident with the MODIS MBL cloud scenes. For this analysis we have ∼ 400 MODIS passes during each 3-year period that provide data within 500 km of the ARM ENA site.
A4 Large-Scale Meteorology
The large-scale meteorology was obtained from the Modern-Era Retrospective analysis for Research and Applications 2 (MERRA2) product (Gelaro et al. 2017). We focus on the cloud controlling factors (CCFs) highlighted in Klein et al. (2017) and examine the Estimated Inversion Strength (EIS, Wood and Bretherton, 2006), free tropospheric subsidence, cold air advection, free tropospheric humidity, sea surface temperature, and surface wind speed. Like the surface-based and satellite cloud data, we compare the CCFs within 500 km of the ARM ENA site for the warm season months (May-September) and in the 2016–2019 and 2021–2023 periods. We make no attempt to subsample the MERRA2 data in the region for the presence of MBL clouds.
A5 Statistical Significance Testing
We compare frequency distributions of quantities observed and calculated from the pre and post periods. Our goal is to assess whether the distributions changed significantly. To quantify this evaluation, we use Kolmogorov–Smirnov (KS) statistical tests as described in Peacock (1983) and Lopes et al. (2009). The KS statistic uses differences in the cumulative probability distributions of two samples to quantify the likelihood that the two samples are drawn from the same population. It can be shown that if two samples are drawn from the same population, then the maximum difference Dmax in their cumulative distribution functions is expected to be where Ne is the effective number of independent measurements. The sampling distribution of the test statistic is well known for large Ne and allows for a determination of the probability p that Zsim is greater than a value of Z derived from two measured distributions. As p increases, it becomes increasingly likely that the two measured distributions are drawn from the same population (the null hypothesis). As commonly implemented (Press et al., 1993), we reject the null hypothesis when p<0.01 (i.e., 99 % confidence) and infer that the two distributions cannot be claimed with certainty to have been drawn from the same population. Because the number of independent samples, Ne, is an important but potentially ill-defined parameter, we assume that measurements collected during a particular day or during a particular overpass of the satellite occurred within the same large-scale regime and were likely not necessarily independent. Therefore, Ne is taken to be the average number of MODIS overpasses in the pre and post periods for the MODIS data (400 overpasses in each period), the average number of sampled days for the ARM ENA periods when clouds were present from the appropriate wind direction (150 d) and days of MERRA reanalysis data in each period (600). For the LWP and PWV data presented in Fig. 2, we did not filter by wind direction and therefore use the number of individual days in the pre and post periods.
A6 Evaluation of Precipitation
Our objective is to compare how the clouds in each period lost water to precipitation, , where period refers to pre and post with units of mm per unit cloud fraction. Each observation of precipitation (P) is given as a rate (mm s−1, let's say). There exist some number of occurrences (n) of P in some number (N) of precipitation rate bins (Pbins) as depicted in Fig. 2f. Each observation of P represents a 30 s interval (dt). Therefore, each observation of P*dt would have units of mm, and summing all the observations in each rate bin (Pbins) would have units of mm of water lost from the clouds at that rate. In other words, simply summing approximates the total water in mm lost to precipitation in that P bin. Summing across the N Pbins bins gives the total number of mm of precipitation that the frequency distribution represents, . In other words
However, to compare the efficiency at which water is lost to precipitation between the two periods, pre and post, to evaluate which loses more water to precipitation in a relative sense, we find it instructive to normalize by the cloud occurrence, f, of a period, fperiod. Let's say that there were twice as many clouds in the post period as the pre period, but the precipitation rate frequency distributions were the same, then . In our case, we have less clouds in the post period but more precipitation overall and comparing with would be ambiguous without some normalization. So, normalizing by the cloud fraction, f, of that period, allows us to compare the efficiency with which clouds in each period lost water to precipitation relative to the other, or
All data sets used in this study were acquired from public archives and are fully cited in the text with DOIs given in the reference section. The data sets include: Cadeddu et al. (2020, https://doi.org/10.5439/1025248); Feng et al., (2025, https://doi.org/10.5439/1891991); Keeler et al., (2012, https://doi.org/10.5439/1595321): Koontz et al. (2010, https://doi.org/10.5439/1323896); Muradyan et al. (2010, https://doi.org/10.5439/1320657); Kyrouac et al. (2024, https://doi.org/10.5439/1786358); Platnick et al. (2015a, https://doi.org/10.5067/MODIS/MOD06_L2.006); NASA/LARC/SD/ASDC, (2014a, https://doi.org/10.5067/TERRA/CERES/SSF-FM2_L2.004A); NASA/LARC/SD/ASDC (2014b, https://doi.org/10.5067/AQUA/CERES/SSF-FM3_L2.004A). Interim data files and the code used to create the results and figures in this paper are freely available at Benson and Mace (2025, https://doi.org/10.7278/S5d-ppzy-3nkj).
The supplement related to this article is available online at https://doi.org/10.5194/acp-26-1041-2026-supplement.
GM led the overall conception, data analysis, interpretation of results, and writing of the text of the article. SB was responsible for implementing data analysis code and generation of figures. TS and PG contributed to data analysis and interpretation.
The contact author has declared that none of the authors has any competing interests.
Publisher’s note: Copernicus Publications remains neutral with regard to jurisdictional claims made in the text, published maps, institutional affiliations, or any other geographical representation in this paper. While Copernicus Publications makes every effort to include appropriate place names, the final responsibility lies with the authors. Views expressed in the text are those of the authors and do not necessarily reflect the views of the publisher.
Data were obtained from the Atmospheric Radiation Measurement (ARM) user facility, a U.S. Department of Energy (DOE) Office of Science user facility managed by the Biological and Environmental Research Program. The authors gratefully acknowledge the ARM instrument mentors, site operations staff, and data quality office for their contributions to producing the datasets used in this study. This material is based upon work supported by the National Science Foundation under Grant No. 2246488. Any opinions, findings, and conclusions or recommendations expressed in this material are those of the authors and do not necessarily reflect the views of the National Science Foundation. This work was supported by the NASA Science Mission Directorate, Earth Science Division, under Grant 80NSSC21k1969. Any opinions, findings, and conclusions or recommendations expressed in this material are those of the authors and do not necessarily reflect the views of NASA. The authors thank Dr. Alain Protat for providing inciteful comments on an early version of this paper.
This research has been supported by the Office of Science (grant no. DE-SC0025266), the NASA Headquarters (grant no. 80NSSC21k1969), and the Directorate for Geosciences (grant no. 2246488).
This paper was edited by Ken Carslaw and Barbara Ervens and reviewed by Mark Miller and one anonymous referee.
Albrecht, B. A.: Aerosols, cloud microphysics, and fractional cloudiness, Science, 245, 1227–1230, https://doi.org/10.1126/science.245.4923.1227, 1989.
Albrecht B. A., Bretherton C. S., Johnson D., Schubert, W. H., and Frisch, A. S.: The Atlantic Stratocumulus Transition Experiment–ASTEX, Bulletin of the American Meteorological Society, 76, 889–904, https://doi.org/10.1175/1520-0477(1995)076<0889:taste>2.0.co;2, 1995.
Benson, S. and Mace, G. G.: Impact on cloud properties of reduced sulfur fuel in the Eastern North Atlantic, University of Utah Hive [code and data set], https://doi.org/10.7278/S5d-ppzy-3nkj, 2025.
Bretherton, C. S., Blossey, P. N., and Jones, C. R.: Mechanisms of marine low cloud sensitivity to idealized climate perturbations: A single-Les exploration extending the CGILS cases, Journal of Advances in Modeling Earth Systems, 5, 316–337, https://doi.org/10.1002/jame.20019, 2013.
Brueck, M., Nuijens, L., and Stevens, B.: On the seasonal and synoptic time-scale variability of the North Atlantic trade wind region and its low-level clouds, Journal of the Atmospheric Sciences, 72, 1428–1446, https://doi.org/10.1175/jas-d-14-0054.1, 2015.
Cadeddu, M., Gibler, G., Koontz, A., and Tuftedal, M.: Microwave Radiometer, 3 Channel (MWR3C). Atmospheric Radiation Measurement (ARM) User Facility [data set], https://doi.org/10.5439/1025248, 2020.
Chen, Y.-C., Christensen, M. W., Stephens, G. L., and Seinfeld, J. H.: Satellite-based estimate of global aerosol–cloud radiative forcing by marine warm clouds, Nature Geoscience, 7, 643–646, https://doi.org/10.1038/ngeo2214, 2014.
Christensen, M. W. and Stephens, G. L.: Microphysical and macrophysical responses of marine stratocumulus polluted by underlying ships: Evidence of cloud deepening, Journal of Geophysical Research, 116, https://doi.org/10.1029/2010jd014638, 2011.
Comstock, K. K., Wood, R., Yuter, S. E., and Bretherton, C. S.: Reflectivity and rain rate in and below drizzling stratocumulus. Quarterly Journal of the Royal Meteorological Society, 130, 2891–2918, https://doi.org/10.1256/qj.03.187, 2004.
Conover, J. H.: Anomalous Cloud Lines, Journal of the Atmospheric Sciences, 23, 778–785, https://doi.org/10.1175/1520-0469(1966)023<0778:acl>2.0.co;2, 1966.
Diamond, M. S.: Detection of large-scale cloud microphysical changes within a major shipping corridor after implementation of the International Maritime Organization 2020 fuel sulfur regulations, Atmos. Chem. Phys., 23, 8259–8269, https://doi.org/10.5194/acp-23-8259-2023, 2023.
Diamond, M. S., Director, H. M., Eastman, R., Possner, A., and Wood, R.: Substantial cloud brightening from shipping in subtropical low clouds, AGU Advances, 1, https://doi.org/10.1029/2019av000111, 2020.
Eitzen, Z. A., Xu, K.-M., and Wong, T.: An Estimate of Low-Cloud Feedbacks from Variations of Cloud Radiative and Physical Properties with Sea Surface Temperature on Interannual Time Scales, Journal of Climate, 24, 1106–1121, https://doi.org/10.1175/2010jcli3670.1, 2011.
Feng, Y.-C., Lindenmaier, I., Johnson, K., Nelson, D., Isom, B., Matthews, A., Wendler, T., Melo de Castro, V., Deng, M., and Rocque, M.: Ka ARM Zenith Radar (KAZR2CFRGE). Atmospheric Radiation Measurement (ARM) User Facility [data set], https://doi.org/10.5439/1891991, 2025.
Gallo, F., Uin, J., Springston, S., Wang, J., Zheng, G., Kuang, C., Wood, R., Azevedo, E. B., McComiskey, A., Mei, F., Theisen, A., Kyrouac, J., and Aiken, A. C.: Identifying a regional aerosol baseline in the eastern North Atlantic using collocated measurements and a mathematical algorithm to mask high-submicron-number-concentration aerosol events, Atmos. Chem. Phys., 20, 7553–7573, https://doi.org/10.5194/acp-20-7553-2020, 2020.
Gelaro, R., McCarty, W., Suárez, M. J., Todling, R., Molod, A., Takacs, L., Randles, C. A., Darmenov, A., Bosilovich, M. G., Reichle, R., Wargan, K., Coy, L., Cullather, R., Draper, C., Akella, S., Buchard, V., Conaty, A., da Silva, A. M., Gu, W., Kim, G., Koster, R., Lucchesi, R., Merkova, D., Nielsen, J. E., Partyka, G., Pawson, S., Putman, W., Rienecker, M., Schubert, S. D., Sienkiewicz, M., and Zhao, B.: The Modern-Era Retrospective Analysis for Research and Applications, Version 2 (MERRA-2), J. Climate, 30, 5419–5454, https://doi.org/10.1175/JCLI-D-16-0758.1, 2017.
Glassmeier, F., Hoffmann, F., Johnson, J. S., Yamaguchi, T., Carslaw, K. S., and Feingold, G.: Aerosol-cloud-climate cooling overestimated by ship-track data, Science, 371, 485–489, https://doi.org/10.1126/science.abd3980, 2021.
Goessling, H., Rackow, T., and Jung, T.: Recent global temperature surge intensified by record-low planetary albedo, EGU General Assembly 2025, Vienna, Austria, 27 Apr–2 May 2025, EGU25-15920, https://doi.org/10.5194/egusphere-egu25-15920, 2025.
Gordon, N. D. and Klein, S. A.: Low-cloud Optical Depth Feedback in Climate Models, Journal of Geophysical Research: Atmospheres, 119, 6052–6065, https://doi.org/10.1002/2013jd021052, 2014.
Goren, T., Kazil, J., Hoffmann, F., Yamaguchi, T., and Feingold, G.: Anthropogenic air pollution delays marine stratocumulus break-up to open-cells, Geophysical Research Letters, 46, 14135–14144, https://doi.org/10.1029/2019GL085412, 2019.
Grosvenor, D. P., Sourdeval, O., Zuidema, P., Ackerman, A., Alexandrov, M. D., Bennartz, R., Boers, R., Cairns, B., Chiu, J. C., Christensen, M., Deneke, H., Diamond, M., Feingold, G., Fridlind, A., Hünerbein, A., Knist, C., Kollias, P., Marshak, A., McCoy, D., and Quaas, J.: Remote sensing of droplet number concentration in warm clouds: A review of the current state of knowledge and perspectives, Rev. Geophys., 56, 409–453, https://doi.org/10.1029/2017RG000593, 2018.
Hansen, J. E., Sato, M., Simons, L., Nazarenko, L. S., Sangha, I., Kharecha, P., Zachos, J. C., von Schuckmann, K., Loeb, N. G., Osman, M. B., Jin, Q., Tselioudis, G., Jeong, E., Lacis, A., Ruedy, R., Russell, G., Cao, J., and Li, J.: Global warming in the pipeline, Oxford Open Climate Change, 3, https://doi.org/10.1093/oxfclm/kgad008, 2023.
Hodnebrog, Ø., Myhre, G., Jouan, C., Andrews, T., Forster, P. M., Jia, H., Loeb, N. G., Olivié, D. J., Paynter, D., Quaas, J., Raghuraman, S. P., and Schulz, M.: Recent reductions in aerosol emissions have increased Earth's energy imbalance, Communications Earth & Environment, 5, https://doi.org/10.1038/s43247-024-01324-8, 2024.
Kang, L., Marchand, R. T., Wood, R., and McCoy, I. L.: Coalescence scavenging drives droplet number concentration in Southern Ocean low clouds, Geophysical Research Letters, 49, https://doi.org/10.1029/2022gl097819, 2022.
Keeler, E., Burk, K., and Kyrouac, J.: Balloon-Borne Sounding System (SONDEWNPN), Atmospheric Radiation Measurement (ARM) User Facility [data set], https://doi.org/10.5439/1595321, 2012.
Klein, S. A. and Hartmann, D. L.: The seasonal cycle of low stratiform clouds, Journal of Climate, 6, 1587–1606, https://doi.org/10.1175/1520-0442(1993)006<1587:tscols>2.0.co;2, 1993.
Klein, S. A., Hall, A., Norris, J. R., and Pincus, R.: Low-cloud feedbacks from cloud-controlling factors: A Review, Surveys in Geophysics, 38, 1307–1329, https://doi.org/10.1007/s10712-017-9433-3, 2017.
Knight, J. R. and Scaife, A. A.: Influences on North-atlantic Summer Climate from the El Niño-southern Oscillation, Quarterly Journal of the Royal Meteorological Society, 150, 4498–4510, https://doi.org/10.1002/qj.4826, 2024.
Kollias, P., Puigdomènech Treserras, B., and Protat, A.: Calibration of the 2007–2017 record of Atmospheric Radiation Measurements cloud radar observations using CloudSat, Atmos. Meas. Tech., 12, 4949–4964, https://doi.org/10.5194/amt-12-4949-2019, 2019.
Koontz, A., Uin, J., Andrews, E., Enekwizu, O., Hayes, C., and Salwen, C.: Cloud Condensation Nuclei Particle Counter (AOSCCN2COLASPECTRA), Atmospheric Radiation Measurement (ARM) User Facility [data set], https://doi.org/10.5439/1323896, 2010.
Kyrouac, J., Shi, Y., and Tuftedal, M.: Surface Meteorological Instrumentation (MET), Atmospheric Radiation Measurement (ARM) User Facility [data set], https://doi.org/10.5439/1786358, 2024.
Lebsock, M. D., Stephens, G. L., and Kummerow, C.: Multisensor satellite observations of aerosol effects on warm clouds, Journal of Geophysical Research: Atmospheres, 113, https://doi.org/10.1029/2008jd009876, 2008.
Li, J., Hu, Y., Huang, J., Stamnes, K., Yi, Y., and Stamnes, S.: A new method for retrieval of the extinction coefficient of water clouds by using the tail of the CALIOP signal, Atmos. Chem. Phys., 11, 2903–2916, https://doi.org/10.5194/acp-11-2903-2011, 2011.
Loeb, N. G., Doelling, D. R., Wang, H., Su, W., Nguyen, C., Corbett, J. G., Liang, L., Mitrescu, C., Rose, F. G., and Kato, S.: Clouds and the Earth's radiant energy system (ceres) energy balanced and filled (EBAF) top-of-atmosphere (TOA) edition-4.0 data product, Journal of Climate, 31, 895–918, https://doi.org/10.1175/jcli-d-17-0208.1, 2018.
Lopes, R. H. C., Reid, I. D., and Hobson, P. R.: A two-dimensional Kolmogorov-Smirnov test, in: XI International Workshop on Advanced Computing and Analysis Techniques in Physics Research (ACAT 2007), Proceedings of Science, Vol. 050, https://doi.org/10.22323/1.050.0045, 2009.
Maahn, M., Turner, D. D., Löhnert, U., Posselt, D. J., Ebell, K., Mace, G. G., and Comstock, J. M.: Optimal estimation retrievals and their uncertainties: What every atmospheric scientist should know, Bulletin of the American Meteorological Society, 101, https://doi.org/10.1175/bams-d-19-0027.1, 2020.
Mace, G. G.: Deriving cloud droplet number concentration from surface-based remote sensors with an emphasis on lidar measurements, Atmos. Meas. Tech., 17, 3679–3695, https://doi.org/10.5194/amt-17-3679-2024, 2024.
Mace, G. G., Benson, S., Humphries, R., Gombert, P. M., and Sterner, E.: Natural marine cloud brightening in the Southern Ocean, Atmos. Chem. Phys., 23, 1677–1685, https://doi.org/10.5194/acp-23-1677-2023, 2023.
Mace, G. G., Benson, S., Sterner, E., Protat, A., Humphries, R., and Hallar, A. G.: The association between cloud droplet number over the summer Southern Ocean and air mass history, Journal of Geophysical Research: Atmospheres, 129, https://doi.org/10.1029/2023jd040673, 2024.
Manshausen, P., Watson-Parris, D., Christensen, M. W., Jalkanen, J.-P., and Stier, P.: Rapid saturation of cloud water adjustments to shipping emissions, Atmos. Chem. Phys., 23, 12545–12555, https://doi.org/10.5194/acp-23-12545-2023, 2023.
Manshausen, P., Watson-Parris, D., Christensen, M. W., Jalkanen, J.-P., and Stier, P.: Invisible ship tracks show large cloud sensitivity to aerosol, Nature, 610, 101–106, https://doi.org/10.1038/s41586-022-05122-0, 2022.
Mirrielees, J. A. and Brooks, S. D.: Instrument artifacts lead to uncertainties in parameterizations of cloud condensation nucleation, Atmos. Meas. Tech., 11, 6389–6407, https://doi.org/10.5194/amt-11-6389-2018, 2018.
Muradyan, P., Cromwell, E., Koontz, A., Coulter, R., Flynn, C., Ermold, B., and OBrien, J.: Micropulse Lidar (MPLPOLFS). Atmospheric Radiation Measurement (ARM) User Facility [data set], https://doi.org/10.5439/1320657, 2010.
Nakajima, T. and King, M. D.: Determination of the optical thickness and effective particle radius of clouds from reflected solar radiation measurements. part I: Theory, Journal of the Atmospheric Sciences, 47, 1878–1893, https://doi.org/10.1175/1520-0469(1990)047<1878:dotota>2.0.co;2, 1990.
NASA/LARC/SD/ASDC: CERES Single Scanner Footprint (SSF) TOA/Surface Fluxes, Clouds and Aerosols Terra-FM2 Edition4A, NASA Langley Atmospheric Science Data Center DAAC [data set], https://doi.org/10.5067/TERRA/CERES/SSF-FM2_L2.004A, 2014a.
NASA/LARC/SD/ASDC: CERES Single Scanner Footprint (SSF) TOA/Surface Fluxes, Clouds and Aerosols Aqua-FM3 Edition4A, NASA Langley Atmospheric Science Data Center DAAC [data set], https://doi.org/10.5067/AQUA/CERES/SSF-FM3_L2.004A, 2014b.
Osipova, L., Ferrini Rodrigues, P., Carvalho, F., and Gore, K.: From concept to impact: Evaluating the potential for emissions reduction in the proposed North Atlantic Emission Control Area under different compliance scenarios. International Council on Clean, Transportation, https://theicct.org/publication/evaluating-the-potential-for-emissions-reduction-in-the-proposed-atleca-under-different-compliance-scenarios-june24/ (last access: April 2025), 2024.
Peacock, J. A.: Two-dimensional goodness-of-fit testing in astronomy, Mon. Not. R. Astron. Soc., 202, 615–627, https://doi.org/10.1093/mnras/202.3.615, 1983.
Platnick, S., King, M. D., Ackerman, S. A., Menzel, W. P., Baum, B. A., Riedi, J. C., and Frey, R. A.: The Modis Cloud Products: Algorithms and examples from Terra, IEEE Transactions on Geoscience and Remote Sensing, 41, 459–473, https://doi.org/10.1109/tgrs.2002.808301, 2003.
Platnick, S., Ackerman, S. A., King, M. D., Meyer, K., Menzel, W. P., Holz, R. E., Baum, B. A., and Yang, P.: MODIS atmosphere L2 cloud product (06_L2), Terra, NASA MODIS Adaptive Processing System, Goddard Space Flight Center [data set], https://doi.org/10.5067/MODIS/MOD06_L2.006, 2015a.
Platnick, S., Ackerman, S. A., King, M. D., Meyer, K., Menzel, W. P., Holz, R. E., Baum, B. A., and Yang, P.: MODIS atmosphere L2 cloud product (06_L2), Aqua, NASA MODIS AdaptiveProcessing System, Goddard Space Flight Center [data set], https://doi.org/10.5067/MODIS/MYD06_L2.006, 2015b.
Press, W. H., Teukolsky, S. A., Vetterling, W. T., and Flannery, B. P.: Numerical Recipes in C: The Art of Scientific Computing, 2nd edn., Cambridge University Press, Cambridge, UK, 994 pp., ISBN 978-0-521-43108-8, 1993.
Sherwood, S. C., Bony, S., and Dufresne, J.-L.: Spread in model climate sensitivity traced to atmospheric convective mixing, Nature, 505, 37–42, https://doi.org/10.1038/nature12829, 2014.
Sherwood, S. C., Webb, M. J., Annan, J. D., Armour, K. C., Forster, P. M., Hargreaves, J. C., Hegerl, G., Klein, S. A., Marvel, K. D., Rohling, E. J., Watanabe, M., Andrews, T., Braconnot, P., Bretherton, C. S., Foster, G. L., Hausfather, Z., von der Heydt, A. S., Knutti, R., Mauritsen, T., and Zelinka, M. D.: An assessment of Earth's climate sensitivity using multiple lines of evidence, Rev. Geophys., 58, e2019RG000678, https://doi.org/10.1029/2019RG000678, 2020.
Stephens, G. L.: Radiation profiles in extended water clouds. II: Parameterization schemes, Journal of the Atmospheric Sciences, 35, 2123–2132, https://doi.org/10.1175/1520-0469(1978)035<2123:rpiewc>2.0.co;2, 1978.
Stevens, B. and Feingold, G.: Untangling aerosol effects on clouds and precipitation in a buffered system, Nature, 461, 607–613, https://doi.org/10.1038/nature08281, 2009.
Stevens, B. and Seifert, A.: Understanding macrophysical outcomes of microphysical choices in simulations of shallow cumulus convection, Journal of the Meteorological Society of Japan. Ser. II, 86, 143–162, https://doi.org/10.2151/jmsj.86a.143, 2008.
Toll, V., Christensen, M., Quaas, J., and Bellouin, N.: Weak average liquid-cloud-water response to anthropogenic aerosols, Nature, 572, 51–55, https://doi.org/10.1038/s41586-019-1423-9, 2019.
Turner, D. D., Kneifel, S., and Cadeddu, M. P.: An improved liquid water absorption model at microwave frequencies for supercooled liquid water clouds. Journal of Atmospheric and Oceanic Technology, 33, 33–44, https://doi.org/10.1175/jtech-d-15-0074.1, 2016.
Twomey, S.: The influence of pollution on the shortwave albedo of clouds, Journal of the Atmospheric Sciences, 34, 1149–1152, https://doi.org/10.1175/1520-0469(1977)034<1149:tiopot>2.0.co;2, 1977.
Wang, H. and Feingold, G.: Modeling Mesoscale Cellular Structures and Drizzle in Marine Stratocumulus. Part I: Impact of Drizzle on the Formation and Evolution of Open Cells, Journal of the Atmospheric Sciences, 66, 3237–3256, https://doi.org/10.1175/2009jas3022.1, 2009.
Widener, K, Bharadwaj, N., and Johnson, K.: Ka-Band ARM Zenith Radar Handbook, U.S. Department of Energy, DOE/SC-ARM/TR-106, https://doi.org/10.2172/1035855, 2012.
Uin, J. and Enekwizu, O.: Cloud Condensation Nuclei Particle Counter Instrument Handbook, U.S. Department of Energy, Atmospheric Radiation Measurement (ARM) user facility, Richland, Washington, DOE/SC-ARM-TR-168, https://www.arm.gov/publications/tech_reports/handbooks/ccn_handbook.pdf, last access: June 2024.
Wood, R.: Drizzle in stratiform boundary layer clouds. part I: Vertical and horizontal structure, Journal of the Atmospheric Sciences, 62, 3011–3033, https://doi.org/10.1175/jas3529.1, 2005.
Wood, R.: Stratocumulus clouds, Monthly Weather Review, 140, 2373–2423, https://doi.org/10.1175/mwr-d-11-00121.1, 2012.
Wood, R. and Bretherton, C. S.: On the relationship between stratiform low cloud cover and lower-tropospheric stability, Journal of Climate, 19, 6425–6432, https://doi.org/10.1175/jcli3988.1, 2006.
Wood, R. and Hartmann, D. L.: Spatial Variability of Liquid Water Path in Marine Low Cloud: The Importance of Mesoscale Cellular Convection, Journal of Climate, 19, 1748–1764, https://doi.org/10.1175/jcli3702.1, 2006.
Wood, Robert, Wyant, M., Bretherton, C. S., Rémillard, J., Kollias, P., Fletcher, J., Stemmler, J., de Szoeke, S., Yuter, S., Miller, M., Mechem, D., Tselioudis, G., Chiu, J. C., Mann, J. A., O'Connor, E. J., Hogan, R. J., Dong, X., Miller, M., Ghate, V., Jefferson, A., Min, Q., Minnis, P. , Palikonda, R., Albrecht, B., Luke, E., Hannay, C., and Lin, Y.: Clouds, aerosols, and precipitation in the Marine Boundary Layer: An ARM Mobile, 2015 facility deployment, Bulletin of the American Meteorological Society, 96, 419–440, https://doi.org/10.1175/bams-d-13-00180.1, 2015.
Xu, Z., Mace, G. G., and Posselt, D. J.: Impact of Rain on Retrieved Warm Cloud Properties Using Visible and Near-Infrared Reflectances Using Markov Chain Monte Carlo Techniques, IEEE Transactions on Geoscience and Remote Sensing, 60, 4110110, https://doi.org/10.1109/TGRS.2022.3208007, 2022.
Yamaguchi, T. and Feingold, G.: On the relationship between open cellular convective cloud patterns and the spatial distribution of precipitation, Atmos. Chem. Phys., 15, 1237–1251, https://doi.org/10.5194/acp-15-1237-2015, 2015.
Yuan, T., Song, H., Wood, R., Wang, C., Oreopoulos, L., Platnick, S. E., von Hippel, S., Meyer, K., Light, S., and Wilcox, E.: Global reduction in ship-tracks from Sulphur Regulations for shipping fuel, Science Advances, 8, https://doi.org/10.1126/sciadv.abn7988, 2022.
Yuan, T., Song, H., Oreopoulos, L., Wood, R., Bian, H., Breen, K., Chin, M., Yu, H., Barahona, D., Meyer, K., and Platnick, S.: Abrupt reduction in shipping emission as an inadvertent geoengineering termination shock produces substantial radiative warming, Communications Earth & Environment, 5, https://doi.org/10.1038/s43247-024-01442-3, 2024.