
the Creative Commons Attribution 4.0 License.
the Creative Commons Attribution 4.0 License.
 | 24 Jul 2026
Sources and variability of surface ozone over the Tibetan Plateau revealed by in situ observations and EMAC model simulations
Yihan Zou
Ningwei Liu
Weili Lin
Xiaobin Xu
Yunjia Li
Siyang Cheng
Xiangdong Zheng
Andrea Pozzer
Jos Lelieveld
Ozone variability over the Tibetan Plateau (TP) is complex, and our understanding of the factors driving surface ozone variations on the plateau remains incomplete. We combine in-situ observations from the Nam Co (NMC) and Nepal Climate Observatory-Pyramid (PYR) stations with the global atmospheric chemistry-climate model EMAC to analyze the sources and spatiotemporal variations of surface ozone over TP. The three ozone source regions, i.e., the Northern Hemisphere and Tropical Stratospheric Source (NTST), Northern Hemisphere Mid-High Latitude Tropospheric Source (NHTS), and Tropical Tropospheric Source (TRTS), are considered. The results reveal strong seasonal and daily variability in the contributions of these sources to TP surface ozone. Regulated by the changes in the position and intensity of the subtropical westerly jet, surface NTST-O3 is highest in spring, reaching a daily maximum contribution of 30 % at both stations. The efficient transport of NHTS-O3 by zonal circulation from source areas, including Central Asia, West Asia, and Europe, results in a summertime maximum of surface ozone in the northern TP, and even influences surface ozone on the central and southern TP, with a daily maximum contribution of 62 % at NMC and 58 % at PYR in summer. During the pre-monsoon period, enhanced TRTS-O3 in South and Southeast Asia leads to annual surface ozone peaks in the southern and central TP, with a daily maximum contribution of 93 % at NMC and 98 % at PYR. With ongoing changes in the emissions of ozone precursors from the aforementioned areas, impacts on surface ozone over TP require continued investigation.
- Article
(16458 KB) - Full-text XML
-
Supplement
(2009 KB) - BibTeX
- EndNote


Tropospheric ozone (O3) is an important greenhouse gas, with a radiative forcing second only to carbon dioxide and methane (Myhre et al., 2013; Ramanathan et al., 1987). It is also a major source of hydroxyl radicals (OH), which controls the oxidizing capacity of the atmosphere (Lelieveld et al., 2016; Levy, 1971; Weinstock and Niki, 1972). As an oxidant and pollutant, elevated surface O3 poses serious risks to human health and terrestrial vegetation (Desqueyroux et al., 2002; Lefohn et al., 2018; Shindell et al., 2012). Since the Industrial Revolution, increased global pollutant emissions driven by anthropogenic activities have resulted in a marked rise in tropospheric O3 concentrations across many regions (Hough and Derwent, 1990; Monks et al., 2015; Vingarzan, 2004).
Stratospheric intrusion constitutes a significant source of tropospheric O3 (Cristofanelli et al., 2003; Holton et al., 1995; Stohl et al., 2003; Tang et al., 2011). Typically, stratospheric intrusions are characterized by elevated O3 concentrations at the tropopause and in the mid-troposphere, accompanied by high potential vorticity (PV) and low relative humidity (RH) (James et al., 2003; Kim and Lee, 2010; Zhao et al., 2021b). Stratospheric intrusion events are associated with upper-level jet streams. Seasonal variations in the frequency and intensity of these intrusions have been observed between low-latitude and mid-latitude regions, where jet stream activity is more pronounced (Ding and Wang, 2006; Ni et al., 2019). Long-term climatological analyses have identified the Tibetan Plateau as a global hotspot for deep stratosphere-to-troposphere exchange events, particularly during the boreal winter and spring (Škerlak et al., 2014). Due to its high elevation and correspondingly elevated boundary layer height, the Tibetan Plateau is recognized as a region where stratospheric O3 intrusions exert a substantial impact on surface O3 concentrations (Ding and Wang, 2006; Ma et al., 2002a; Yin et al., 2023).
Near-surface O3 pollution episodes frequently occur in regions with substantial anthropogenic emissions of ozone-precursors. However, O3 and its precursors can be transported over thousands of kilometers via atmospheric circulation, reaching even remote regions and thereby significantly altering the distribution of surface O3 (Jacob et al., 1999). When O3 and its precursors are transported from the boundary layer into the free troposphere by atmospheric circulation, their lifetimes are extended, allowing pollutants to be conveyed from sources in Europe, Asia, and North America to hemispheric and even global scales (Lelieveld and Dentener, 2000). Studies have shown that pollutants from North America can affect the central Atlantic within just 6 to 15 d, especially in spring and summer, contributing 3 to 5 ppbv and 10 to 13 ppbv to O3 concentrations in Europe, respectively (Guerova et al., 2006). Trans-Eurasian pollutant transport also exerts a significant impact on O3 concentrations in China and East Asia (Yoshitomi et al., 2011); while pollutants from India and the Middle East significantly affect O3 concentrations in western China during the summer (Li et al., 2014). Within the Chinese domain, the Asian Summer Monsoon circulation transports pollutants from the southern to northern regions in eastern China, resulting in elevated regional background O3 concentrations (Liu et al., 2020). Model simulations indicate that the Tibetan Plateau acts as a net sink for tropospheric O3 in summer, with its surface O3 primarily transported from the regions outside China (Ma et al., 2002a, c).
Due to its sparse population and low level of industrialization, the Tibetan Plateau ranks among the cleanest regions on Earth, and the spatiotemporal distribution of tropospheric O3 over the plateau is primarily governed by dynamical transport (Ma et al., 2022). Long-term in situ measurements of surface O3 on the Tibetan Plateau began at the Waliguan baseline station in 1994 (Ma et al., 2002b). Subsequent observations have shown significant differences in the seasonal variation characteristics of surface O3 across different latitudes on the Tibetan Plateau, which have been categorized into two types: the spring maximum type and the summer maximum type (Ma et al., 2022; Yin et al., 2017). The Waliguan station in the northeastern Tibetan Plateau is a typical summer maximum type location, where surface O3 exhibits a seasonal variation pattern with the maximum mostly occurring in summer and the minimum in winter (Ma et al., 2002b; Xu et al., 2016, 2018a; Zhu et al., 2004). In contrast, surface O3 at the Nam Co Comprehensive Observation Station, Dangxiong Station, and Lhasa Station in the central Tibetan Plateau shows a regular seasonal cycle, with a maximum in spring (Lin et al., 2015; Ran et al., 2014; Yin et al., 2017). At the southern edge of the plateau, surface O3 concentrations at the Nepal Climate Observatory-Pyramid (a global atmospheric background station) and China's Xianggelila Regional Atmosphere Background Station have an annual maximum during the pre-monsoon period (March–May),and a minimum during the summer monsoon season. This pattern is closely linked to the strong moisture transport and enhanced precipitation brought by the Asian summer monsoon (Cristofanelli et al., 2010; Ma et al., 2014).
Numerous studies have been conducted, and various mechanisms have been proposed to explain the causes of surface O3 seasonal peaks at various stations on the Tibetan Plateau. For example, the summer O3 peak at Waliguan has been attributed by some studies to frequent stratospheric intrusion events (Ding and Wang, 2006; Liang et al., 2008), while other studies suggest that it is influenced by air mass transport from central-eastern China, South Asia, Central Asia, and even Europe (Li et al., 2009; Xue et al., 2011; Zhu et al., 2004). Still others argued that it results from the combined effect of stratospheric intrusion and long-range transport from outside the region .(Lee et al., 2007; Ma et al., 2002c; Xu et al., 2018a). Additionally, some studies have shown that the increase in surface O3 at Waliguan in late spring is due to enhanced tropospheric photochemistry (Zheng et al., 2011). Recent research indicates that the monthly variability of surface O3 across the Tibetan Plateau is largely controlled by stratospheric intrusion (Yin et al., 2023). Observational studies at Xianggelila Station and Nepal Pyramid Station have shown that abundant water vapor from the South Asian Summer Monsoon increases cloud cover and precipitation, significantly reducing surface O3 concentrations during the summer (Ma et al., 2014; Marinoni et al., 2013; Putero et al., 2014).
While observational and modeling studies have confirmed the importance of stratospheric intrusions and dynamic transport to surface O3 over the plateau, debate persists over the relative contributions of stratospheric intrusions versus long-range tropospheric transport for different sites and seasons. Furthermore, quantitative analyses of the sources of surface O3 at individual stations lack consistent conclusions. Therefore, research integrating both observational and modeling evidence is needed to reduce these attribution uncertainties. Given that the central and southern Tibetan Plateau lies adjacent to the heavily polluted South Asian region and is significantly influenced by the South Asian monsoon, the sources and variability of surface O3 in this area warrant further investigation.
Extensive in situ and satellite observations may provide information on the distribution and trends of tropospheric O3 (Archibald et al., 2020; Tarasick et al., 2019). However, constrained by incomplete observational station coverage and the limited ability of satellites to detect surface O3 (Hayashida et al., 2018), the understanding of the spatiotemporal distribution and variation mechanisms of O3 across the globe is still incomplete, in particular over the Tibetan Plateau (Ma et al., 2022; Oltmans et al., 1996). Global atmospheric chemistry-circulation models can not only fill these observational gaps, but also help interpret observational results, revealing key processes and factors influencing O3 distribution, variability and trends (Young et al., 2018).
This study aims to investigate surface O3 sources and their variation characteristics in the central and southern Tibetan Plateau using measurements from two stations and ECHAM/MESSy atmospheric chemistry-climate model (EMAC) simulations. Section 2 presents basic information on the two stations located in the central and southern Tibetan Plateau and the EMAC model used in this study. Section 3 evaluates the EMAC model's simulation performance in reproducing surface O3 variability at the two stations. Sections 4 and 5 present the contributions of stratospheric O3 and tropospheric O3 generated in different latitude bands to surface O3 at the two stations, and examine the impacts of stratospheric O3 intrusion and tropospheric O3 transport from different source regions on surface O3 over the Tibetan Plateau. Section 6 summarizes the conclusions of this study.
2.1 Observational stations
The Nam Co Comprehensive Observation Station (30.77° N, 90.98° E, 4730 m a.s.l. (above sea level), and hereafter referred to as NMC) is located between the southeastern shore of Nam Co Lake and the northern hills of the Nyainqêntanglha Mountains in the central and southern Tibetan Plateau (Fig. 1). NMC experiences a dry and cold climate and is representative of typical alpine regions. The station is primarily influenced by three major synoptic systems: the South Asian Anticyclone, the subtropical high-pressure system, and southeastern warm and humid air masses. There are no concentrated industrial areas within a 100 km radius of NMC, and even during the tourist peak season, local traffic is limited to a few vehicles passing through the area. Thus, the station is not locally influenced by major anthropogenic pollution sources (Xu et al., 2018b; Yin et al., 2017). For this study, surface O3 was observed at NMC from 24 April 2011 to 14 July 2012.
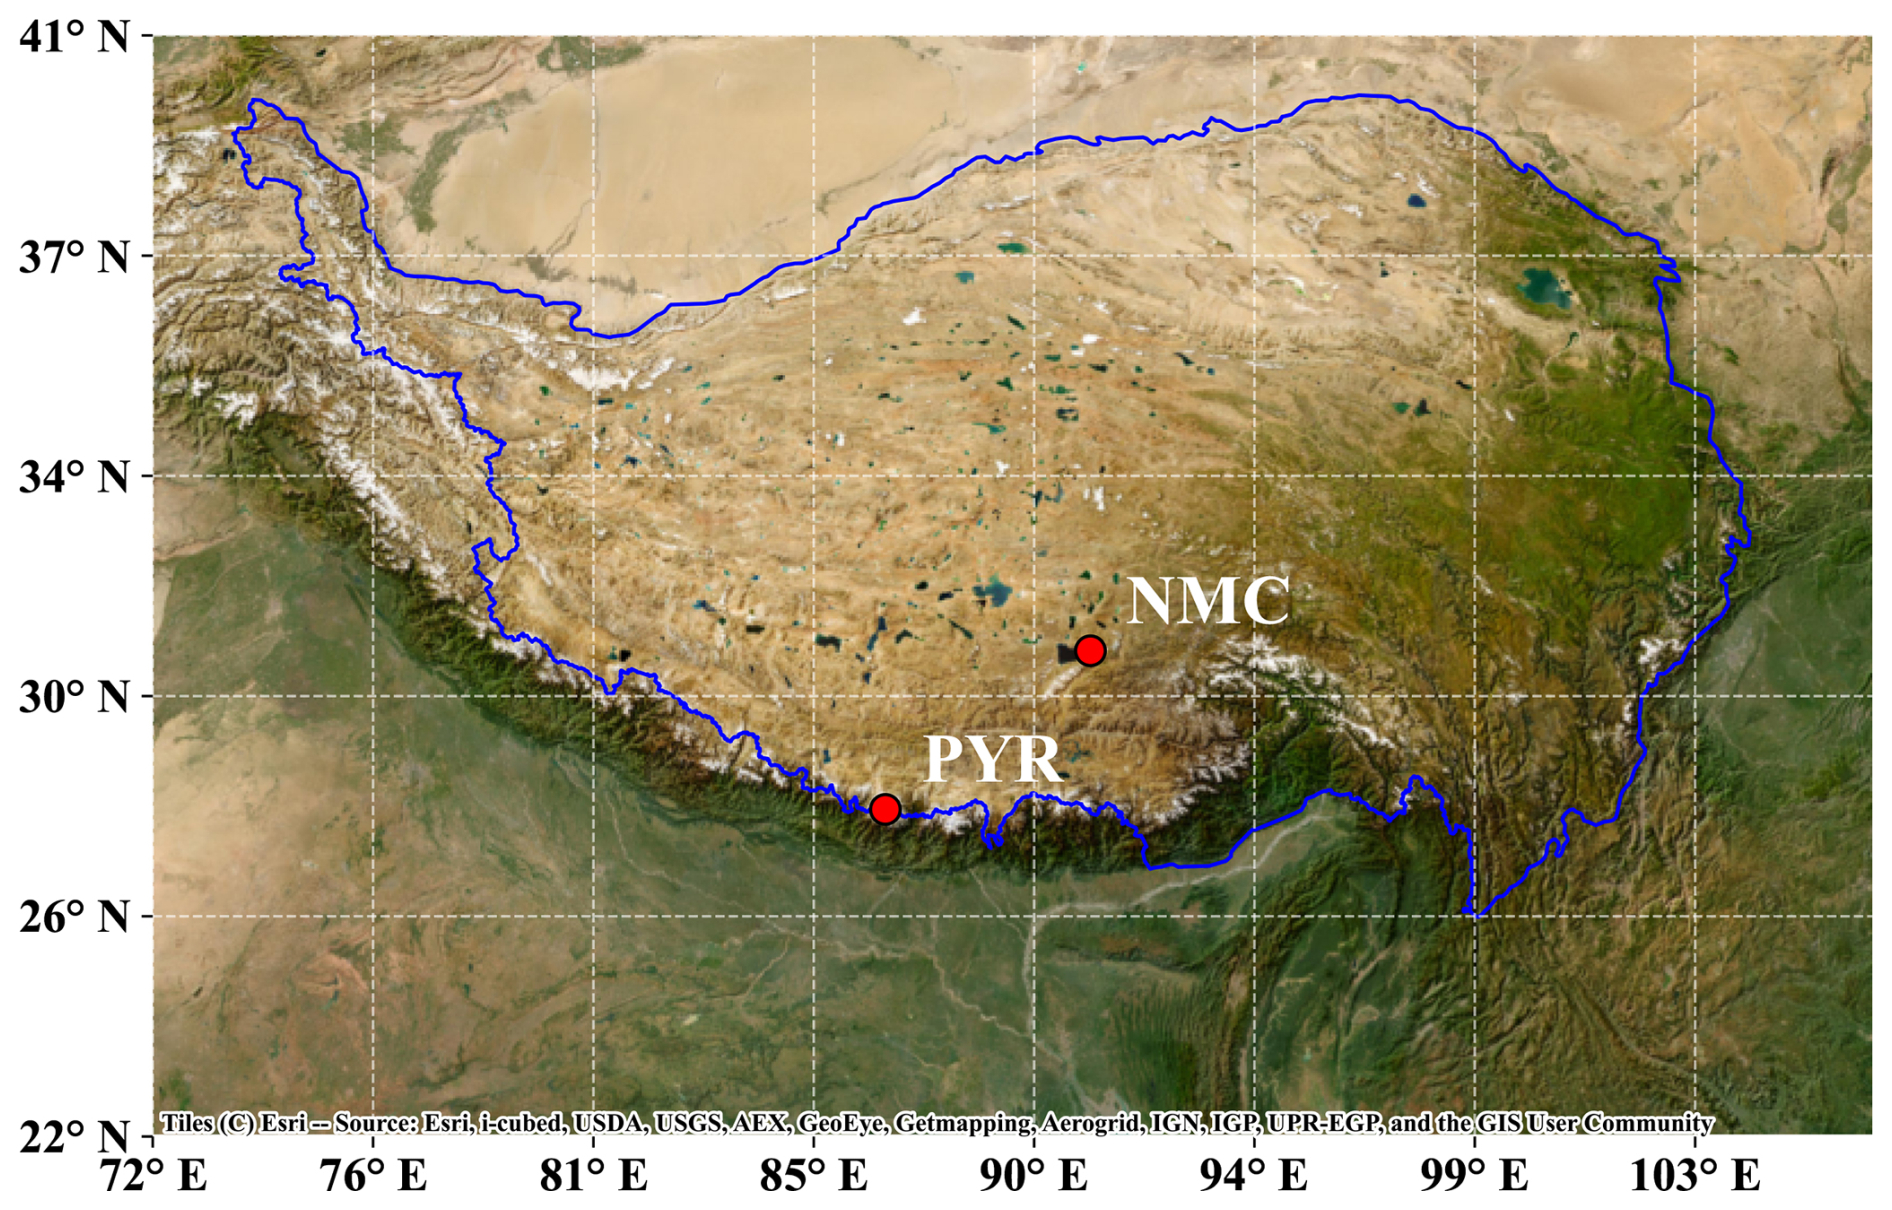
Figure 1Location map of the NMC and PYR stations. The topographic background is provided by the ArcGIS World Imagery Map (https://doc.arcgis.com/en/data-appliance/6.4/maps/world-imagery.htm, last access: 23 May 2025). The blue lines refer to the 3000 m terrain height contour, highlighting the Tibetan Plateau. Sources: Esri, i-cubed, USDA, USGS, AEX, GeoEye, Getmapping, Aerogrid, IGN, IGP, UPR-EGP, and the GIS User Community | Powered by Esri.
The Nepal Climate Observatory at Pyramid (27.57° N, 86.48° E, 5079 m a.s.l., and hereafter referred to as PYR) is situated at the confluence of the Lobuche and Khumbu glacier valleys (Fig. 1). PYR is located on the southern edge of the Tibetan Plateau, with tundra as its primary vegetation cover. The air masses at PYR are strongly influenced by synoptic-scale circulations and local mountain winds, and thus by the transition between the summer and winter monsoons. PYR is remote from major anthropogenic pollution sources, with only small villages along the valley; the nearest major urban area is Kathmandu, approximately 200 km to the southwest (Bonasoni et al., 2008, 2010; Cristofanelli et al., 2010). PYR is one of the 32 baseline stations within the World Meteorological Organization (WMO) Global Atmosphere Watch (GAW) programme. The surface O3 data for PYR used in this study were obtained from the World Data Centre for Reactive Gases (WDCRG), which serves as the central repository and archive for reactive gas data under the WMO/GAW programme (https://ebas-data.nilu.no, last access: 12 November 2024). For this study, the surface O3 data at PYR span from 1 January 2010 to 31 December 2012.
2.2 Model description
The EMAC (ECHAM/MESSy Atmospheric Chemistry) model is an Earth system model that combines the fifth-generation general circulation model (ECHAM5), with the Modular Earth Submodel System (MESSy) (Jöckel et al., 2006, 2010). This model incorporates numerous submodels designed to simulate processes in the troposphere and middle atmosphere, as well as their interactions with the ocean, land, and human activities (Jöckel et al., 2005, 2010, 2016). EMAC has been widely applied in studies related to atmospheric chemical and climatic effects. Numerous studies have evaluated the EMAC model using observational data from surface stations, aircraft, and satellite measurements of trace gases and aerosols in both the troposphere and stratosphere (Eckstein et al., 2017; Jöckel et al., 2006; Kluge et al., 2023; Liu et al., 2020; Ma et al., 2019). By integrating processes such as chemical integral, physical processes, parameterization, and diagnostic calculations, the model system can effectively simulate complex dynamical, cloud, radiation, chemistry, emission, and deposition processes in the troposphere and stratosphere (Jöckel et al., 2005, 2010).
The EMAC model version used in this study is a combination of ECHAM5 version 5.3.02 and MESSy version 2.52. Detailed information on the modules and operational parameter settings used in the simulation can be found in Ma et al. (2019); only a brief overview is provided here. The chemical kinetics module of EMAC employs the MECCA (Module Efficiently Calculating the Chemistry of the Atmosphere) gas-phase and heterogeneous chemical reaction module, which includes various chemical reactions that comprehensively describe the variations of O3 and free radicals in the stratosphere and troposphere. Emission sources from fossil fuel combustion and biomass burning were simulated based on the Representative Concentration Pathways scenario 8.5 (RCP8.5) inventory (Jöckel et al., 2016). The RCP emission inventories have been used within the global atmospheric chemistry-climate model simulations in support of World Meteorological Organization (WMO)/United Nations Environment Programme (UNEP) ozone and International Global Atmospheric Chemistry (IGAC) climate assessments (Jöckel et al., 2016). The RCP8.5 global emission inventory has a horizontal grid resolution of 0.5° by 0.5° at monthly intervals and vertical distributions as described in Pozzer et al. (2009), and it is a reasonable choice for anthropogenic emissions over the period from 2000 to 2010 (Granier et al., 2011; Pozzer et al., 2015). The monthly RCP8.5 emissions in 2010 are used in this study.
The model spectral resolution used in this study was T106L90, which corresponds to a horizontal grid resolution of approximately 1.125°×1.125° and 90 vertical layers extending from the surface to an altitude of 0.01 hPa. The model simulation period spans from 2010 to 2012, with an integration time step of 6 min. In the simulation, the meteorology was nudged by Newtonian relaxation towards the European Centre for Medium-Range Weather Forecasts (ECMWF) operational analysis data (including temperature, vorticity, divergence, and surface pressure). This approach makes the simulation results closely match the actual atmospheric state and facilitates comparison with observational data. The simulation results were output at one-hour intervals for analysis.
We use the model lowest layer, which is approximately at 60 m a.g.l. (above ground level), for surface ozone analyses. In the EMAC model, the nearest grid point to NMC is located at 30.84° N, 91.13° E, with a topographic height of 4644 m, which is 86 m lower than the observational site altitude. This grid point is suitable for capturing the topographic characteristics of NMC. PYR is located on the southern edge of the Tibetan Plateau, where the terrain is steep and highly heterogeneous. At a model resolution of 1.125°×1.125°, subgrid-scale topographical features and local dynamics cannot be fully resolved. The model grid cell closest to PYR (27.48° N, 86.63° E) has a terrain elevation of only 2307 m, resulting in a discrepancy of 2772 m relative to PYR's actual elevation, and therefore cannot represent PYR. We instead selected the neighboring grid cell at 28.60° N, 86.63° E, whose elevation (4865 m) is much closer to the station altitude and better captures the surrounding topographic setting. A comparison among the nearby candidate grid cells shows that the lower-elevation cell would produce even higher surface O3, which would further increase the positive bias at PYR. We therefore regard the remaining PYR bias as a consequence of the model's limited ability to represent complex topography and local meteorology, rather than as a problem that can be removed by choosing a different nearby grid cell.
The EMAC model employs the O3 source-tagging technique (O3_ORIG) to conduct tagging simulations of O3 produced at 14 different latitude and altitude bands worldwide (Grewe, 2006; Jöckel et al., 2016; Roelofs and Lelieveld, 1997). The 14 O3 tracer source regions defined in the model are illustrated in Fig. S2. Each O3 tracer is generated exclusively within its corresponding source region but is subject to chemical loss and transport throughout the entire simulation domain. Based on a quantitative analysis of the relative percentage contributions of each source region to surface O3 at NMC and PYR (Table S2), the 14 original source regions were consolidated into three broader categories, i.e., the Northern Hemisphere and Tropical Stratospheric Source (NTST), the northern mid-high latitude troposphere (NHTS), and the tropical troposphere (TRTS) (Fig. S3).
Figure 2 presents the variations in the observed and simulated surface O3 mixing ratios as a function of time at NMC (April 2011–July 2012) and PYR (January 2010–December 2012). The observed surface O3 mixing ratio at NMC exhibits significant interdaily variability, with a maximum of 24.7 ppbv and an average of 4.7 ppbv; this variability is most pronounced in summer (Fig. 2a). The observed interdaily variation in surface O3 at PYR is relatively smaller than at NMC, with a maximum interdaily difference of 17.9 ppbv and an average of 3.4 ppbv; the interdaily variability is also most pronounced in summer. One can see from Fig. 2a that surface O3 simulated by EMAC shows interdaily variation trends similar to the observations for both NMC and PYR. As shown in Fig. S1 in the Supplement, the EMAC simulated O3 mixing ratios exhibit strong daily correlations with the observations at both NMC and PYR. The correlation coefficients (R) between the simulated and observed daily surface O3 mixing ratios are 0.72 for NMC and 0.78 for PYR. It can be concluded that the model performs well in capturing the daily variability of surface O3 at the two sites, with a tendency towards higher O3 levels in late spring/early summer.
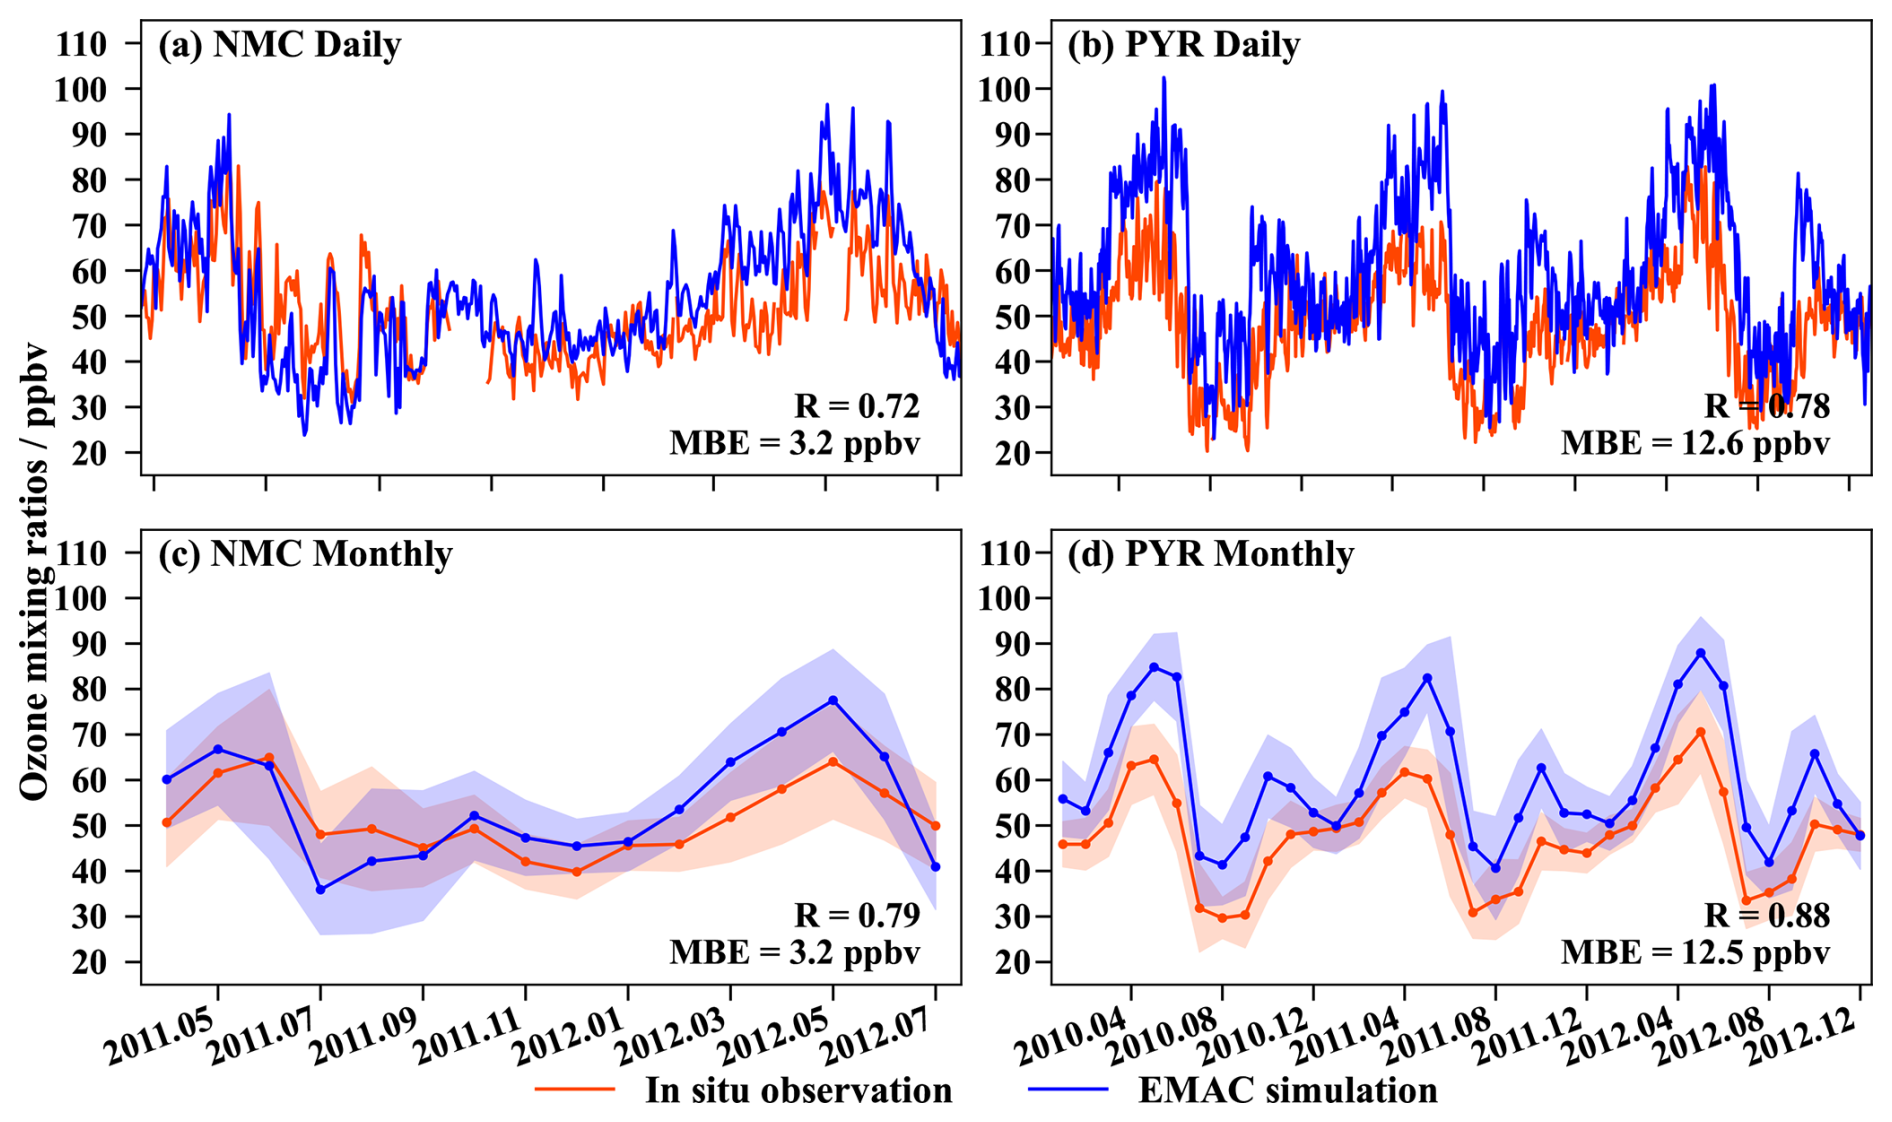
Figure 2Comparisons between EMAC-simulated (blue) and observed (red) surface O3 mixing ratios (ppbv) at NMC (April 2011 to July 2012; panels a, c) and PYR (January 2010 to December 2012; panels b, d), where panels (a, b) show daily time series and panels (c, d) show monthly time series.
Table 1Statistical comparison of observed and EMAC-simulated surface O3 at NMC and PYR (daily and monthly scales).
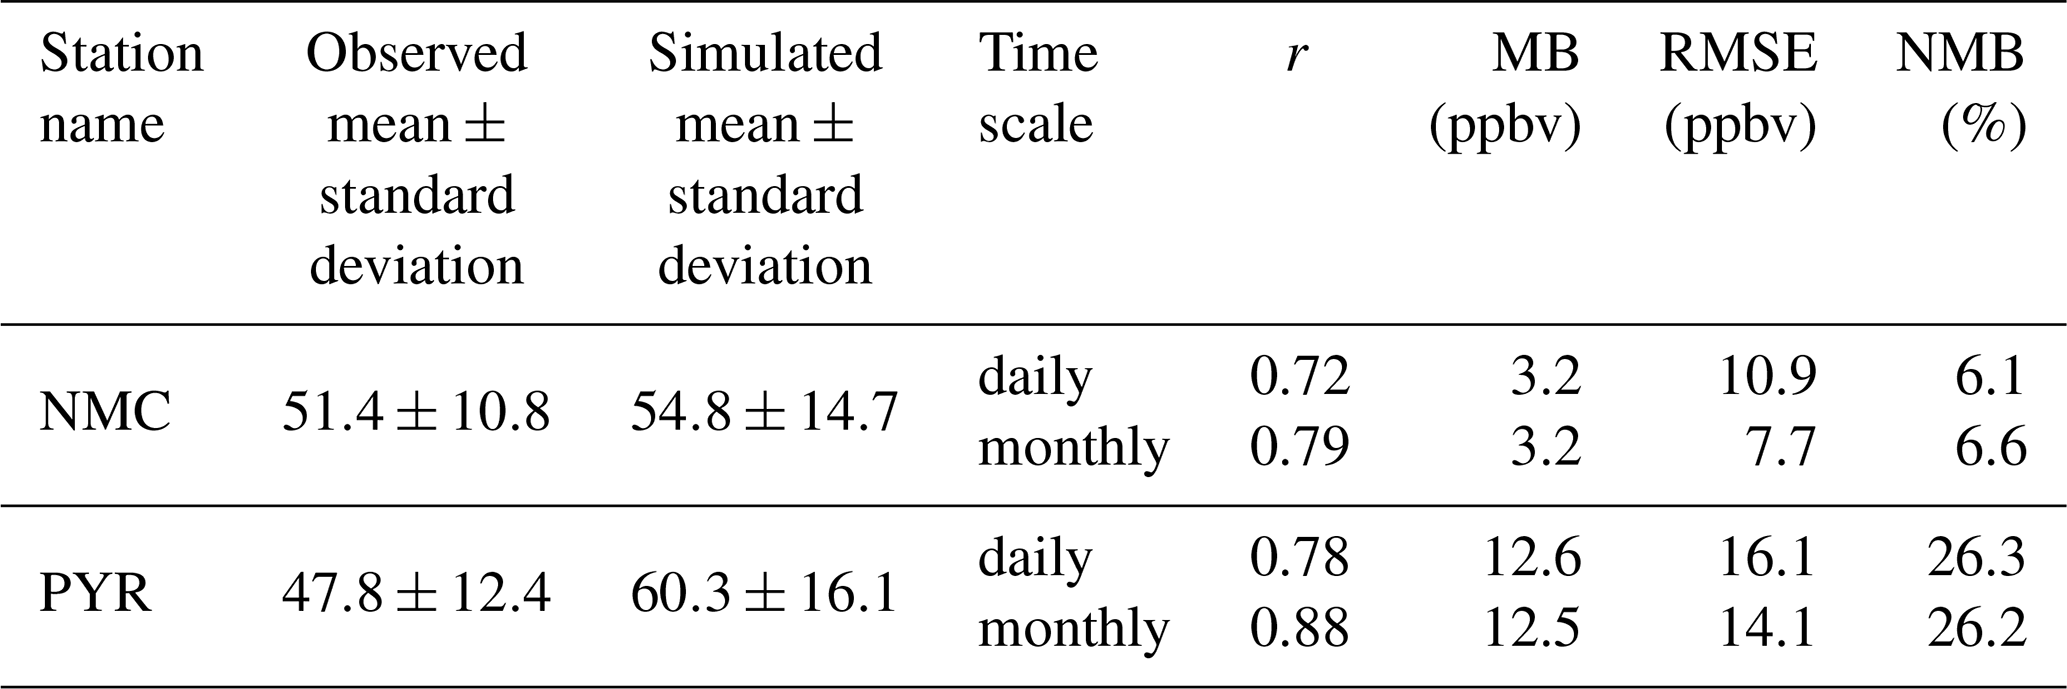
Table 2Average contributions of the three major sources to surface ozone at NMC and PYR stations in different seasons and monsoon phases.
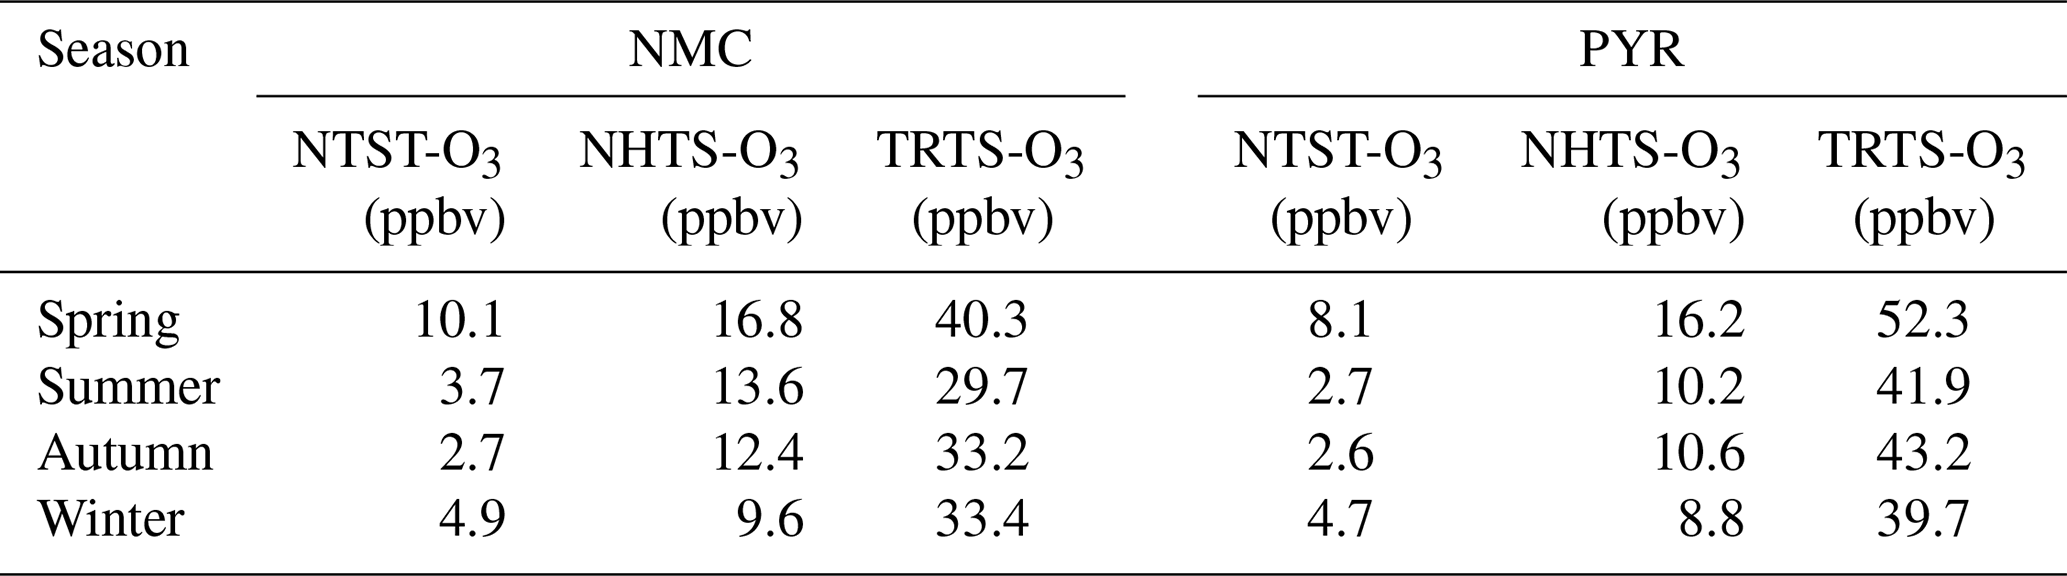
Table 1 presents differences in the quantitative simulation accuracy of the EMAC model for surface O3 mixing ratios at the two stations. A statistical analysis of observational data shows that during the observation period, the surface O3 mixing ratio at NMC has a mean and standard deviation of 51.4±10.8 ppbv, which is consistent with the range of 47.6±11.6 ppbv reported for the region by Yin et al. (2017). At PYR, the observed mean surface O3 mixing ratio was 47.8±12.4 ppbv (Fig. 2b), which falls within the range of historical observations (49±12 ppbv) reported by Cristofanelli et al. (2010). For the investigated period, the model-simulated daily surface O3 mixing ratios at NMC have a mean bias (MB) of 3.2 ppbv, a normalized mean bias (NMB) of 6.1 %, and a relatively small simulation error (root-mean-square error, RMSE = 10.9 ppbv). The simulated daily surface O3 mixing ratios at PYR show an MB of 12.6 ppbv, an NMB of 26.3 %, and an RMSE of 16.1 ppbv. This indicates a significant overestimation of surface O3 at PYR by the model.
Figure 2c and d displays the monthly variations in the surface O3 mixing ratios at NMC and PYR, respectively. The surface O3 mixing ratios at NMC exhibit a seasonal variation pattern characterized by the highest values in spring and the lowest in winter, while those at PYR show a yearly cycle with a maximum in spring and a minimum in summer. The correlation coefficients between the simulated and observed monthly surface O3 mixing ratios are 0.79 for NMC and 0.88 for PYR (Table 1), indicating that the model has a strong capability to reproduce monthly-scale trends at the two sites. For the monthly surface O3 mixing ratios, the EMAC model exhibits an MB of 3.2 ppbv and an NMB of 6.6 % at NMC, and an MB of 12.5 ppbv and an NMB of 26.2 % at PYR. The RMSE at PYR (14.1 ppbv) is nearly twice as large as the RMSE at NMC (7.7 ppbv).
The persistent positive bias at PYR indicates that the model tends to overestimate surface O3 over the southern Tibetan Plateau, particularly during late spring and early summer when stratospheric influence and photochemical O3 formation are strongest. Because the model performance at NMC is much better, the PYR bias is unlikely to arise from a uniform overestimation across the entire Tibetan Plateau. Instead, it likely reflects the difficulty of representing the complex topography, local wind systems, precipitation, and boundary-layer exchange at PYR, as well as potentially underestimated dry deposition (e.g., due to underestimated vegetated surfaces, also because the bias is largest in the growing season). While the bias affects the absolute magnitudes, the simulated seasonal cycles and relative source contributions remain robust. Consequently, we interpret the PYR source contributions as physically meaningful within the current model configuration, while noting that their absolute magnitudes are subject to local terrain uncertainty.
4.1 Contributions from ozone generated in the stratosphere
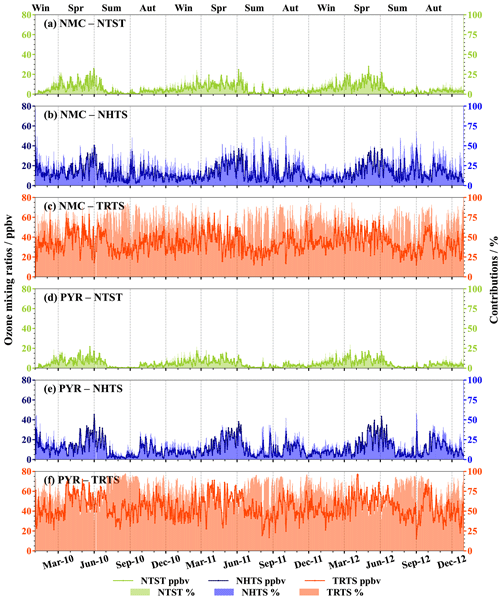
Figure 3 presents the daily absolute contributions and relative contributions of O3 generated from the three source regions to surface O3 at NMC (30.77° N, located in the mid-latitudes of the Northern Hemisphere and central Tibetan Plateau) and PYR (27.57° N, located in the low latitudes of the Northern Hemisphere and southern Tibetan Plateau). Table 2 summarizes the average contributions of the three major sources to surface O3 at NMC and PYR in different meteorological seasons. The temporal variation characteristics of NTST-O3 at NMC (Fig. 3a) are highly consistent with the seasonal cycle of surface O3 at this site (Fig. 2a). Values of NTST-O3 at NMC are most prominent in spring, with a typical range of 10–25 ppbv (a relative contribution range of 10 %–20 %) and a maximum of 28 ppbv (a maximum relative contribution of 30 %). The interdaily variation amplitude of NTST-O3 at NMC is large, with a maximum of 15 ppbv. NTST-O3 at NMC is notably smaller in summer than in spring. NTST-O3 at NMC is lowest in autumn, with a maximum (and relative contribution) of only 7 ppbv (and 9 %). The interdaily variation amplitude is also small in this season, with a maximum of 5 ppbv. In winter, NTST-O3 at NMC ranges from 1 to 18 ppbv, with a maximum relative contribution of 30 %.
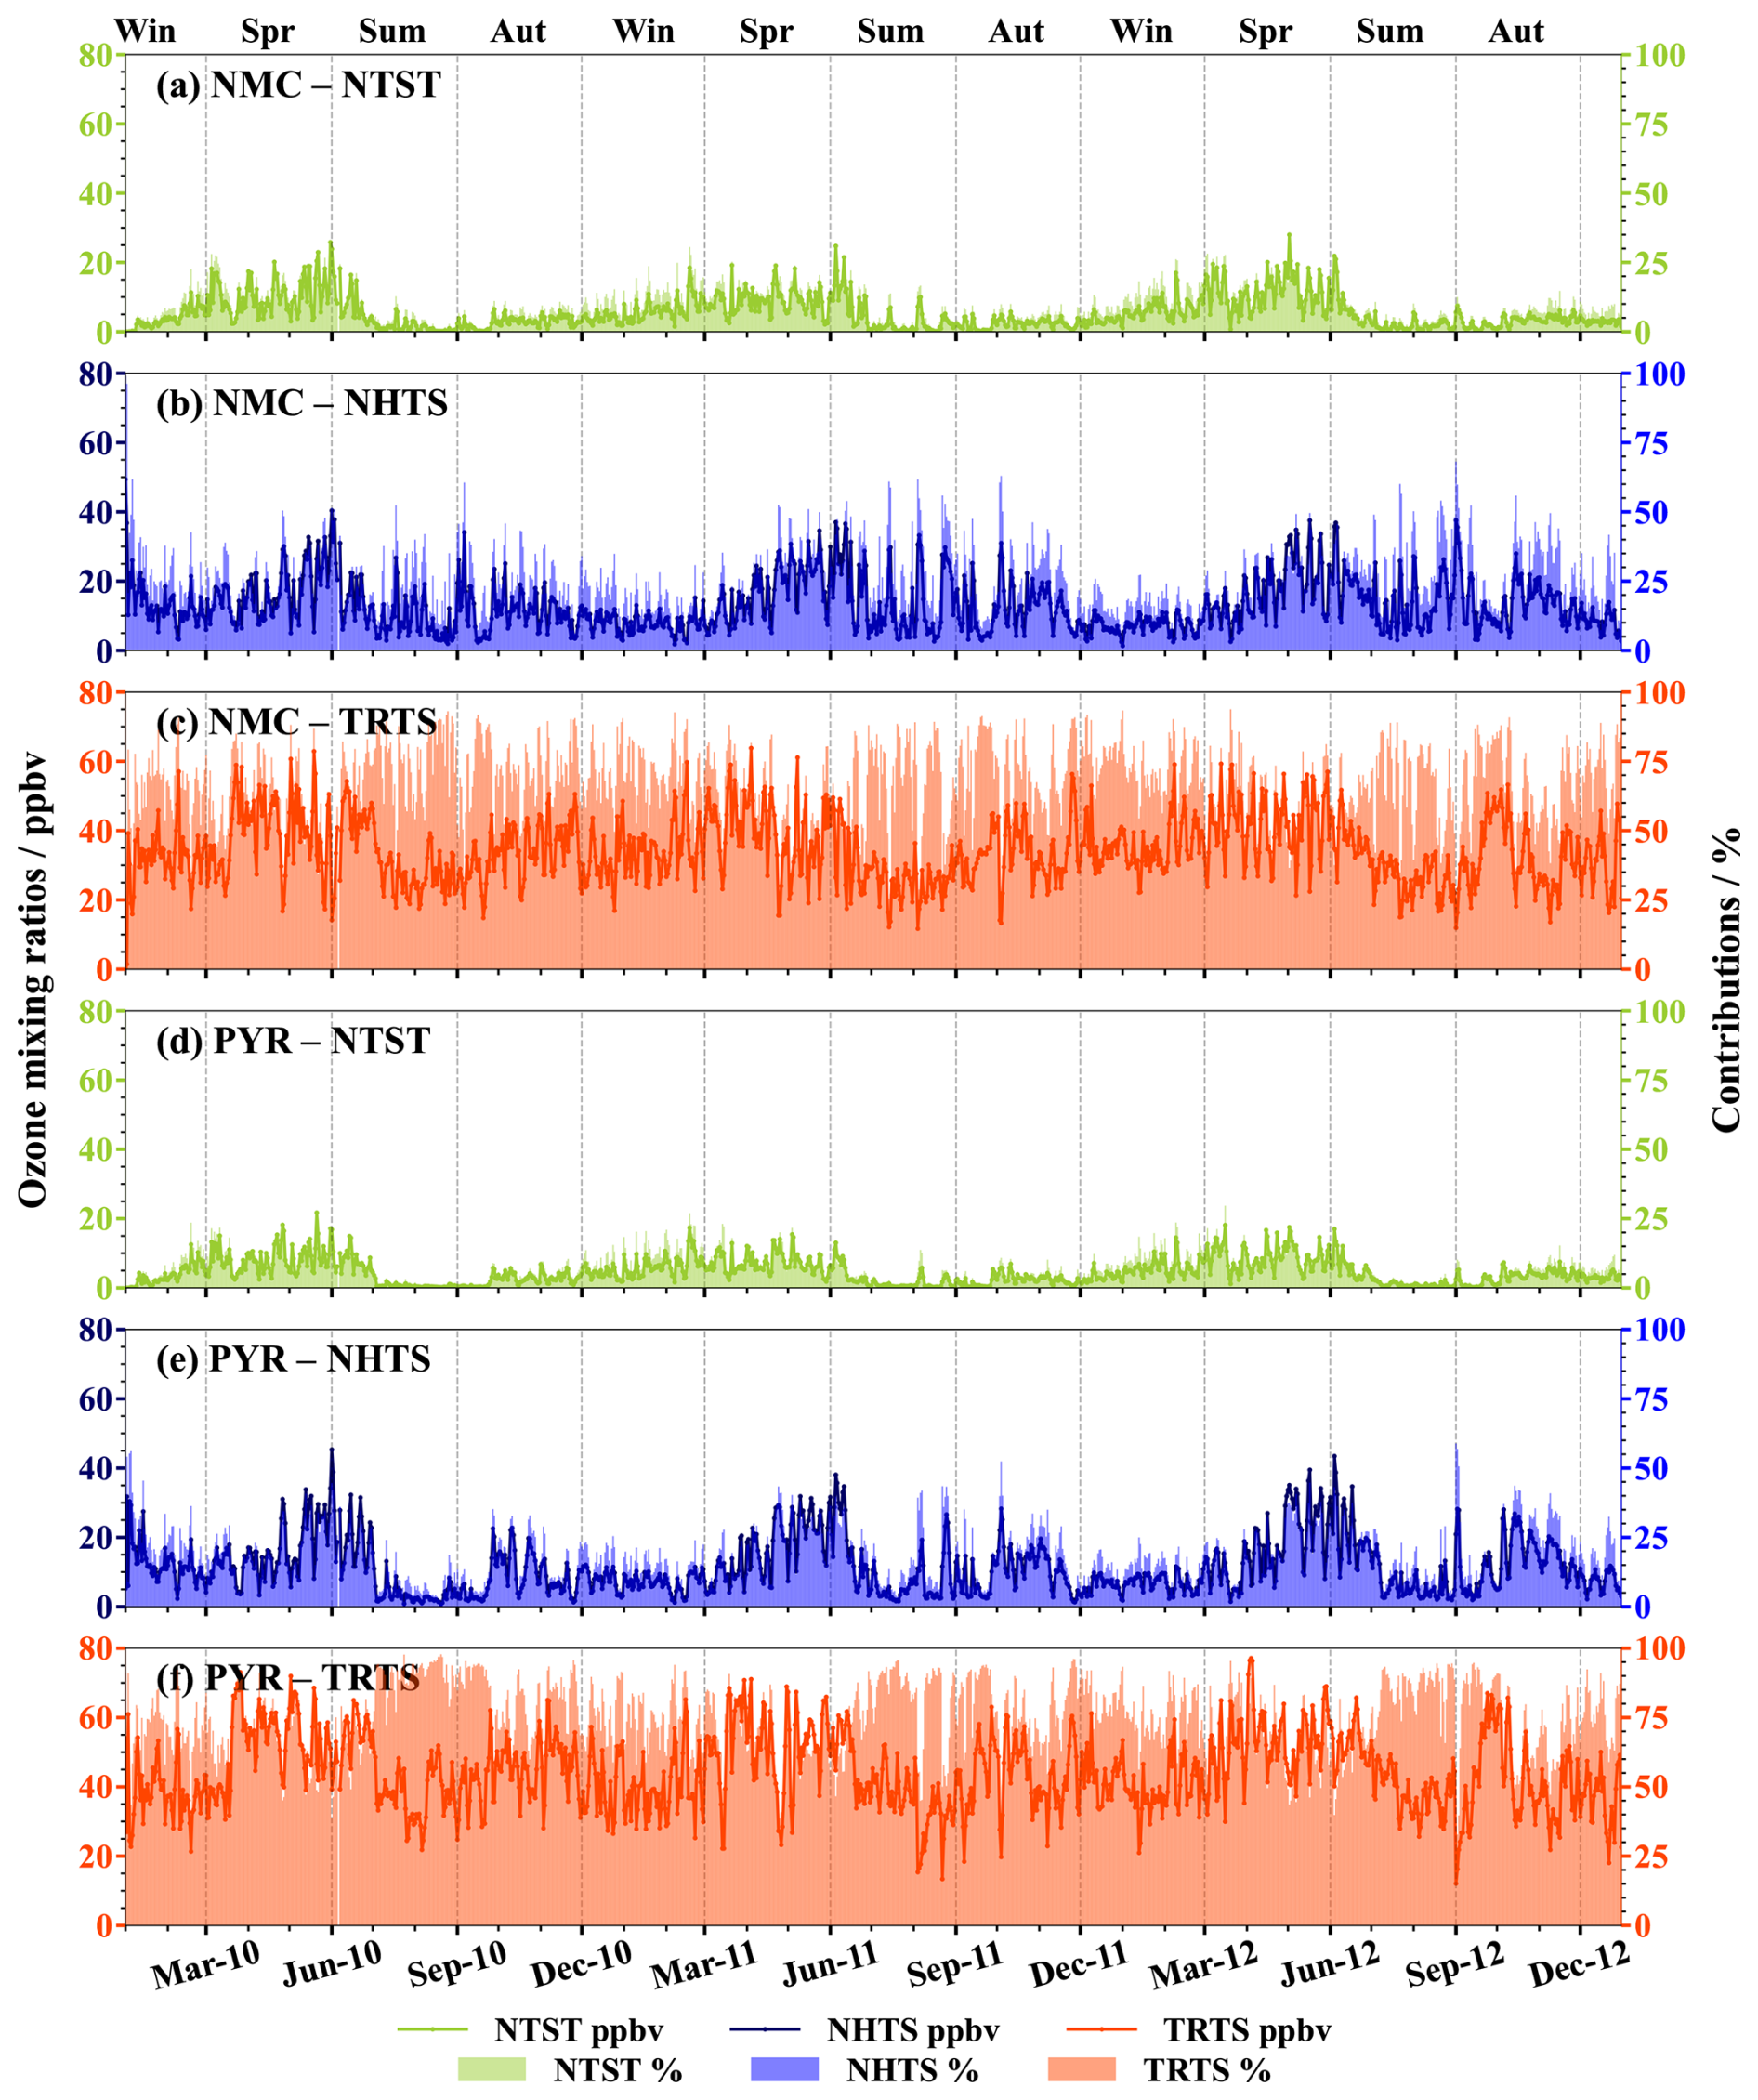
Figure 3Daily absolute (solid lines) and relative (shaded bars) contributions of O3 produced in the three source regions (TRTS: red, NHTS: blue, NTST: green) to surface O3 at NMC (a–c) and PYR (d–f) during 2010–2012, simulated by the EMAC model.
As shown in Fig. 3d, NTST-O3 at PYR also exhibits a characteristic spring peak, with a maximum of 22 ppbv (corresponding to a relative contribution of 30 %). The interdaily variation amplitude of NTST-O3 at PYR is large, with a maximum interdaily difference of 11 ppbv. Under the influence of the monsoon circulation, NTST-O3 at PYR drops to the lowest level in summer and autumn throughout the year. In winter, NTST-O3 at PYR ranges from 1 to 17 ppbv, with a maximum relative contribution of 27 %. Comparison between NMC and PYR reveals that the contribution of NTST-O3 to surface O3 features higher peaks and more pronounced fluctuations at NMC than at PYR, indicating that the mid-latitude location is more susceptible to stratospheric intrusion events.
4.2 Contributions from ozone generated in the troposphere
The NMC site is located in the Northern Hemisphere mid-latitudes, falling within the latitude range of the NHTS for O3 sources in the model. The PYR site is situated in the low latitudes of the Northern Hemisphere, lying within the latitude range of the TRTS for O3 sources in the model. Compared to the stratospheric source (NTST-O3), the variations of O3 from the two tropospheric sources (NHTS-O3 and TRTS-O3) are significantly influenced by the monsoon, showing distinct characteristics across different monsoon phases. Based on monsoon regularity, we divide the calendar year into four phases, the pre-monsoon period (1 March to 20 June), the monsoon period (21 June to 10 September), the post-monsoon period (11 September to 30 November), and the winter period (December to February of the following year).
Figure 3b shows that NHTS-O3 at NMC ranges from 1 to 40 ppbv, with relative contributions ranging from 3 % to 68 %. During the pre-monsoon period, NHTS-O3 at NMC is most prominent with a maximum of 40 ppbv, and the relative contribution ranges from 4 % to 54 %. In the monsoon period, NHTS-O3 at NMC is slightly lower than that in the pre-monsoon period, but exhibits a large interdaily variation amplitude, with a maximum of 22 ppbv. Notably, although simulated O3 level is at its minimum (Fig. 2a and c), NHTS-O3 at NMC has relatively high relative contributions (a peak of 62 %) in the monsoon period. During the post-monsoon period, the interdaily variation amplitude of the relative contributions of NHTS-O3 at NMC is large, with a maximum of 40 %. In winter, NHTS-O3 at NMC ranges from 1 to 22 ppbv, with a relative contribution range of 3 %–40 %. The interdaily variation amplitude of NHTS-O3 is much larger than that of NTST-O3 at NMC, reflecting higher variability in transport of O3 from the mid-to-high latitude tropospheric sources than from the stratospheric sources.
Figure 3e shows that NHTS-O3 at PYR exhibits a large interdaily variation amplitude, with a maximum of 22 ppbv (and 38 %) for the absolute (and relative) contributions. During the pre-monsoon period, NHTS-O3 at PYR is most prominent, with a maximum absolute contribution of 45 ppbv and a relative contribution ranging from 2 % to 45 %. In the monsoon period, NHTS-O3 at PYR decreases significantly to the lowest level of the year, with a maximum of 28 ppbv. However, despite its low absolute values, NHTS-O3 at PYR still exhibits relatively high relative contributions (with a peak of 58 %) during this period. During the post-monsoon period, NHTS-O3 at PYR ranges from 1 to 28 ppbv (with a relative contribution range of 1 %–52 %). In winter, it ranges from 1 to 27 ppbv (with a relative contribution range of 2 %–45 %). Comparison between the two stations reveals that NHTS-O3 at both sites exhibits large interdaily variation amplitudes, but the overall interdaily difference is larger at NMC than at PYR, indicating that transport of O3 from the mid-high latitude tropospheric sources has a more prominent fluctuating impact on the interdaily variations of surface O3 at NMC (mid-latitudes) than at PYR (low latitudes).
Figure 3c presents the variations in the contributions of TRTS-O3 to surface O3 at NMC. The interdaily variation amplitude of TRTS-O3 at NMC is large, with a maximum of 22 ppbv (and 40 %) for the absolute (and relative) contributions. During the pre-monsoon period, TRTS-O3 at NMC is significantly higher than that in other periods, ranging from 15 to 64 ppbv. During the monsoon period, it decreases to 12–46 ppbv, which is significantly lower than in other periods. However, the relative contribution of TRTS-O3 at NMC reaches the annual peaks during the monsoon period, with a maximum of 93 %. TRTS-O3 levels at NMC begin to recover in the post-monsoon period and during winter.
Figure 3f presents the variations in the contributions of TRTS-O3 to surface O3 at PYR. The interdaily variation amplitude of TRTS-O3 at PYR is large, with a maximum of 30 ppbv (and 43 %) for the absolute (and relative) contributions. During the pre-monsoon period, TRTS-O3 at PYR is the highest, ranging from 22 to 77 ppbv. During the monsoon period, it decreases to 12–60 ppbv, which is significantly lower than in other periods. However, the relative contribution of TRTS-O3 at PYR reaches the annual peaks during the monsoon period, with a maximum of 98 %. Compared to NMC, TRTS-O3 at PYR is generally higher and exhibits a greater peak contribution and a longer duration in the pre-monsoon period, indicating that TRTS-O3 exerts a more direct and sustained impact on the low-latitude region of the Tibetan Plateau.
In the above section, we have examined the contributions of O3 from different source regions (NTST, NHTS, and TRTS) to the temporal variations of surface O3 at the two stations (NMC and PYR). In this section, we conduct a detailed analysis of how O3 from these three source regions influences surface O3 variations at the two stations and across the Tibetan Plateau through dynamics and transport.
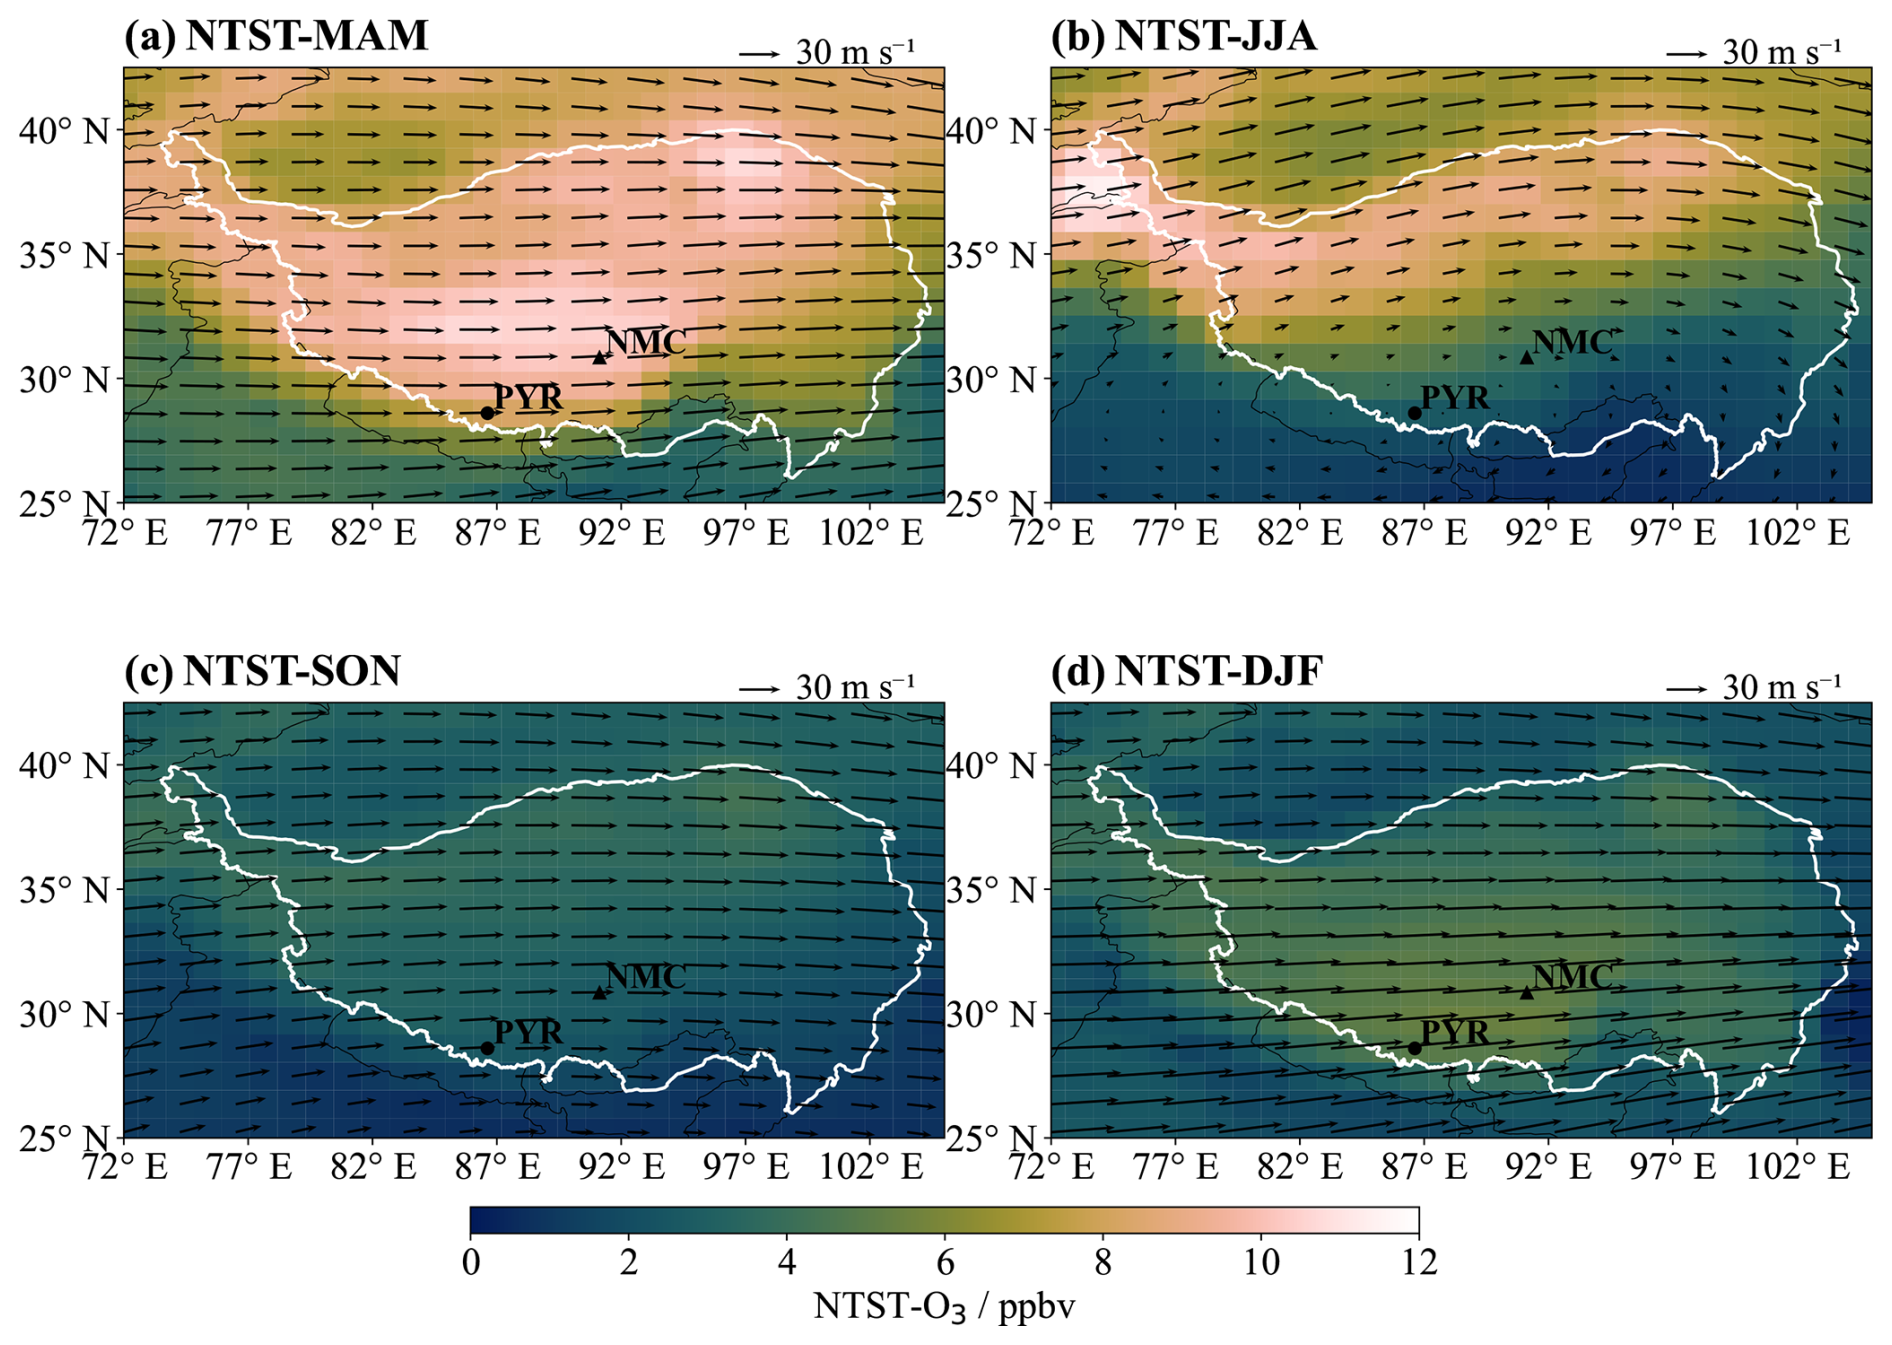
Figure 4EMAC simulated regional distributions of surface NTST-O3 and 200 hPa wind field over the Tibetan Plateau in different seasons during 2010–2012: (a) Spring, (b) Summer, (c) Autumn, (d) Winter. Color shading denotes NTST-O3 volume mixing ratio (units: ppbv), and black arrows represent the wind field (units: m s−1). White lines refer to the 3 km terrain height contour, highlighting the Tibetan Plateau area. White dots mark the locations of the PYR (circle) and NMC (triangle) stations.
5.1 Influences of ozone from the stratospheric sources
5.1.1 Seasonal patterns of surface ozone from the stratospheric sources
Figure 4 presents the regional distributions of surface NTST-O3 and 200 hPa wind fields in different seasons averaged from 2010 to 2012. The corresponding distributions of the relative contribution of surface NTST-O3 to total modelled O3 are provided in Fig. S4. For the spring 200 hPa wind field (Fig. 4a), the high wind speed center over the Tibetan Plateau is located within 29 and 35° N, with the jet axis situated in the hinterland of the Tibetan Plateau. In spring, there are two high-value centers of NTST-O3 with concentrations exceeding 10 ppbv over the central (82–93° E, 30–34° N) and northeastern (95–99° E, 36–40° N) Tibetan Plateau. This is consistent with the simulation results of Ye et al. (2024) using the GEOS-Chem High Performance global atmospheric chemistry model, which showed that the contribution of stratospheric O3 to the background O3 over the Tibetan Plateau exceeds 10 ppbv in spring (Ye et al., 2024). In spring, the NMC station is located within the high-value zone of surface NTST-O3 mixing ratios, which is consistent with previous research findings (Lin et al., 2016; Yin et al., 2017). The subtropical westerly jet is often accompanied by the eastward propagation of Rossby waves. Due to the breaking of Rossby waves, large-scale downward motion occurs near the core of the subtropical westerly jet, generating strong vertical wind shear that is prone to inducing tropopause folding, thereby promoting the downward transport of stratospheric O3 to the troposphere (Chen et al., 2011; Luo et al., 2019; Xu et al., 2018a, 2023; Yin et al., 2023; Zhao et al., 2021a, b). To quantify dynamical transport processes related to the stratosphere, we calculated the tropopause fold frequency using the 3D labeling algorithm refined by Škerlak et al. (2015). The air masses were classified by detecting multiple crossings of the dynamical tropopause interface, defined by the 2 PVU isosurface and specific humidity threshold (0.1 g kg−1). Folds are characterized by their vertical extent (ΔP). In this study, instances with a pressure difference ΔP≥50 hPa within the interconnected fold grids were cataloged as tropopause folding events to compute the seasonal occurrence frequencies (Fig. S5). In spring, the region of maximum tropopause fold frequency is concentrated within the 28–34° N latitudinal band, where the occurrence frequency exceeds 35 % and reaches a peak of 48 % (Fig. S5a).
In summer (Fig. 4b), the subtropical westerly jet shifts northward (Schiemann et al., 2009), with the jet core located on the northern side of the Tibetan Plateau, and the frequent tropopause folding zone migrates to the northern edge of the plateau (Fig. S5b). Correspondingly, the high-value center of NTST-O3 moves to the northwestern part of the plateau, and the overall NTST-O3 mixing ratio is lower than that in spring. Previous studies have indicated that the summer surface O3 peak at Waliguan in the northeastern Tibetan Plateau is attributed to downward transport of O3 from the upper troposphere and lower stratosphere (Ding and Wang, 2006; Ma et al., 2005). In autumn (Fig. 4c), with the southward retreat of the jet stream and the significant decrease in tropopause fold frequency over the plateau (Fig. S5c), the surface NTST-O3 mixing ratio over the Tibetan Plateau drops sharply to the lowest value of the year, with surface NTST-O3 across the entire plateau being lower than 5 ppbv. For the winter 200 hPa wind field (Fig. 4d), the jet stream exhibits the strongest intensity during this season, and its center has retreated to the southern Tibetan Plateau, leading to a resurgence of tropopause folding events along the southern edge (Fig. S5d), and the NTST-O3 mixing ratio shows a slight increase compared to that in autumn.
In summary, changes in the position and intensity of the subtropical westerly jet constitute the key meteorological background regulating the seasonal differences in the influence of NTST-O3 on the Tibetan Plateau. This background also helps explain the inter-station differences. NMC is located at the edge of the NTST-O3 high-value center, indicating a higher contribution of stratospheric sources to surface ozone at NMC. In contrast, PYR is situated on the southern edge of the plateau, affected by the topographic influence of the Himalayas on the one hand, and by the monsoon circulation in summer and autumn on the other. Thus, the overall influence of NTST-O3 on PYR is smaller than that on NMC. Previous studies on the influence of stratospheric O3 on the Tibetan Plateau often used screening methods designed based on in-situ observational data (such as O3, RH, CO, total column ozone, PV, etc.) to identify stratospheric intrusion events (Chen et al., 2011; Cristofanelli et al., 2010; Ma et al., 2014), and these screening methods have certain limitations. Our tracer method clearly identifies the source regions of O3 and can accurately reflect the impact of stratospheric source O3 on the study area.
5.1.2 Analysis of stratospheric intrusion events
The aforementioned analysis demonstrates the seasonal variation and regional distribution characteristics of surface NTST-O3 over the Tibetan Plateau. However, it cannot account for the frequently observed interdaily variability in surface NTST-O3 at the stations during spring, which occurs on a shorter time scale, as presented in Sect. 4.1. To further reveal the physical mechanism underlying this rapid variation, we select an event in spring (4–5 March 2010), which shows a strong interdaily variability of NTST-O3 at the stations, for case analysis (Fig. 5). The temporal variations in the relative contribution of NTST-O3 to total modelled O3 during this event are illustrated in Fig. S6. This event was specifically chosen because both the absolute and relative contributions of NTST-O3 at the sites exceeded the 95th percentile for the 2010–2012 period, representing a robust stratospheric intrusion.
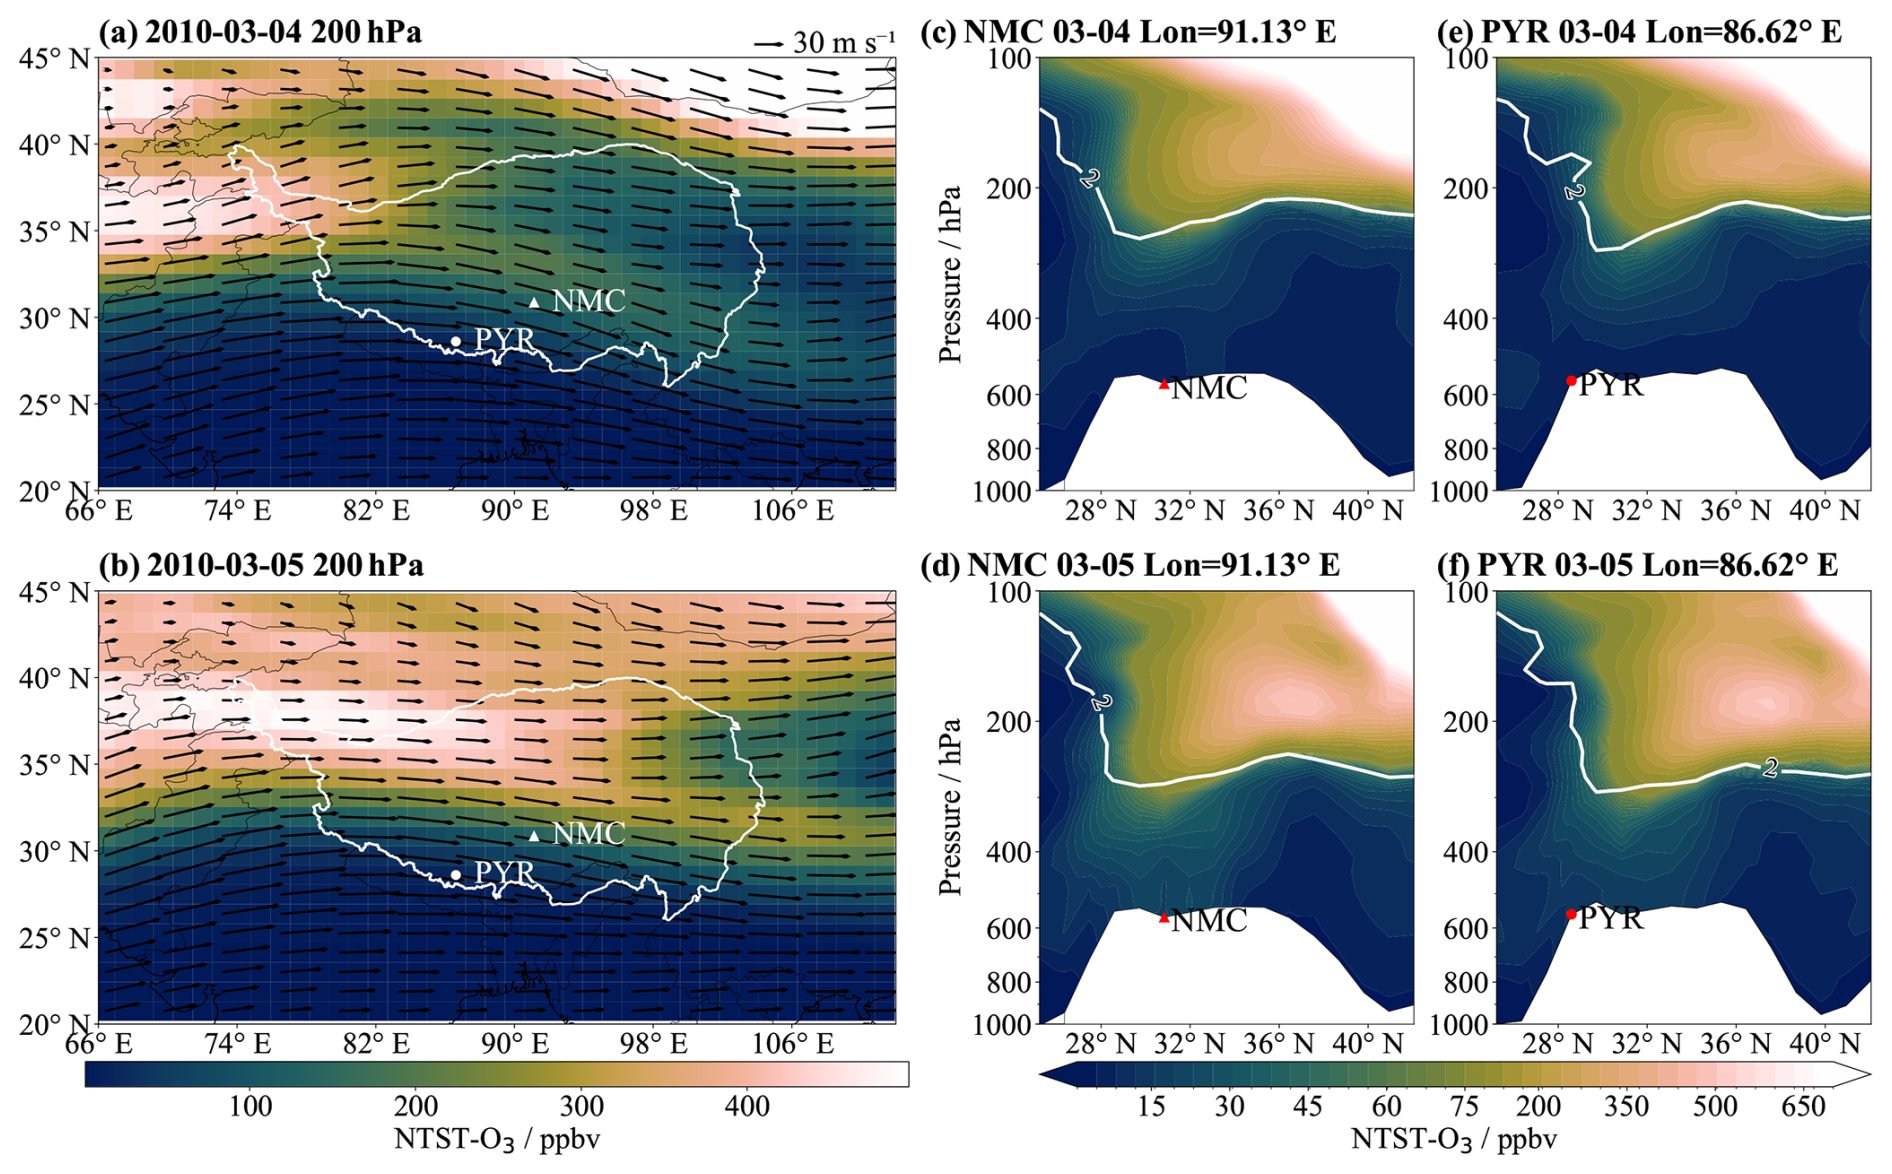
Figure 5Upper-level tracer distribution and vertical dynamical structure of a stratospheric intrusion event in spring 2010 simulated by the EMAC model: Row 1 (a, c, e) corresponds to 4 March 2010, and Row 2 (b, d, f) corresponds to 5 March 2010. Column 1 (a, b) shows the regional distributions of NTST-O3 at 200 hPa (color shading) overlaid with wind fields (arrows); White lines highlight the Tibetan Plateau area, and white dots mark the locations of the PYR (circle) and NMC (triangle) stations. Column 2 (c, d) and Column 3 (e, f) present the meridional cross-sections of NMC (Lon = 91.13° E) and PYR (Lon = 86.62° E), respectively; thick white solid lines denote 2 PVU isopleths, red dots indicate the station locations, and color shading represents NTST-O3 volume mixing ratio (units: ppbv).
On 4 March (Fig. 5a), at the 200 hPa level, distinct high-NTST-O3 zones appear in the mid-latitude belts over the northwestern (60–77° E, 33–39° N) and northeastern (89–115° E, 40–45° N) Tibetan Plateau, adjacent to the northern part of the westerly jet axis. The 200 hPa wind field shows that the high-wind speed center is located between 25 and 33° N, and the wind direction shifts from southwest to northwest over the southeastern Tibetan Plateau. On 5 March (Fig. 5b), the high-NTST-O3 center over the northeastern region from the previous day is advected southeastward by the westerly jet stream, moving to the area above the northern Tibetan Plateau (71–98° E, 33–40° N), and the NTST-O3 mixing ratio above the southern plateau also increases compared to the previous day. The 200 hPa wind field indicates that the span of the jet stream expands compared to the previous day, with the range of the jet axis extending to 23–35° N.
Figure 5c and e is the meridional vertical cross-section of NTST-O3 mixing ratios at the two stations on 4 March. Above 200 hPa, the high NTST-O3 mixing ratio center is located over the northern part of the plateau. The NTST-O3 distribution in the upper atmosphere presents a tongue-like structure sloping southward and extending to the middle troposphere, with the NTST-O3 mixing ratios above 400 hPa over both stations being higher than 30 ppbv, while the surface NTST-O3 mixing ratio at the stations is relatively low. A high potential vorticity (PV) tongue (marked by the 2 PVU isopleth) exists in the cross-sections, and it basically overlaps with the distribution of the NTST-O3 tongue-like structure. The cross-section at NMC shows that the tip of the high PV tongue near the station reaches approximately 260 hPa. The cross-section at PYR shows that the tip of the high PV tongue near the station reaches around 280 hPa. On 4 March, neither the NTST-O3 tongue tip nor the high PV tongue tip is directly above the stations, with NMC located north of the tongue tips and PYR located south of them.
Figure 5d and f is the meridional vertical cross-section of NTST-O3 mixing ratios at the two stations on 5 March. It can be observed that a high NTST-O3 center appears at 200 hPa above the range of 33–38° N. The NTST-O3 distribution in the upper atmosphere has a tongue-like structure sloping southward and extending to lower levels, with the NTST-O3 mixing ratio down to 450 hPa over the stations reaching approximately 40 ppbv, and the surface NTST-O3 mixing ratios at both stations increasing by nearly 5–10 ppbv compared to the previous day. The high PV tongue extends significantly downward compared to the previous day, with the cross-section at NMC showing the tip of the high PV tongue near the station reaching 290 hPa, and the cross-section at PYR showing the tip of the high PV tongue near the station reaching around 300 hPa. Similar to the previous day, neither the NTST-O3 tongue tip nor the high PV tongue tip is directly above the stations, but both are closer to the stations than on 4 March.
Our analysis of the aforementioned case reveals that the intensification and development of the jet stream promote the transport of stratospheric air masses with high O3 from the mid-high latitudes north of the Tibetan Plateau down to the central and southern areas above the plateau. The interaction between the jet stream and planetary waves facilitates the occurrence of tropopause folding events, which correspond to the emergence of PV tongues. When the developing high PV tongue, i.e., the deepening of tropopause folding from shallow to deep, is sufficiently close to the stations in both horizontal and vertical dimensions, stratospheric air masses can be effectively mixed into the lower troposphere, leading to the occurrence of stratospheric intrusion events and subsequently resulting in a significant increase in near-surface NTST-O3.
5.2 Influences of ozone from the tropospheric sources
Figure 6 presents the regional distributions of seasonal mean net photochemical ozone production rates within the planetary boundary layer of Eurasia (30–140° E, 0–70° N) in different seasons averaged over the period 2010–2012. A stark spatial contrast is evident across all seasons: the Tibetan Plateau primarily acts as a pristine ozone receptor region, whereas its surrounding densely populated and industrialized areas serve as massive regional ozone sources. In spring (Fig. 6a), intense net photochemical ozone production is concentrated in South Asia and Southeast Asia with rates commonly exceeding 20 ppbv d−1. In contrast, the net production rate over the entire Tibetan Plateau, including the central and southern plateau where NMC and PYR are located, hovers near zero. In summer (Fig. 6b), the photochemical ozone production over Eurasia reaches its annual peak, driven by strong solar radiation and abundant precursor emissions. Extensive areas in southern Central Asia, further West Asia and Europe, East Asia and South Asia exhibit prominent production rates exceeding 15 ppbv d−1. Strikingly, while the surrounding external sources peak, the Tibetan Plateau acts as a weak chemical sink with negative net production rates (ranging from −1 to 0 ppbv d−1), though its eastern and northern peripheries show slightly positive values (1–2 ppbv d−1). In autumn (Fig. 6c), the net photochemical production in the external source regions begins to decline, but South Asia and southern China remain active sources. In winter (Fig. 6d), the high net production belt retreats to lower latitudes (South and Southeast Asia), and the boundary layer over the plateau acts predominantly as a weak sink. This persistent absence of local net photochemical generation confirms that surface ozone over the plateau is overwhelmingly transported from external source regions.
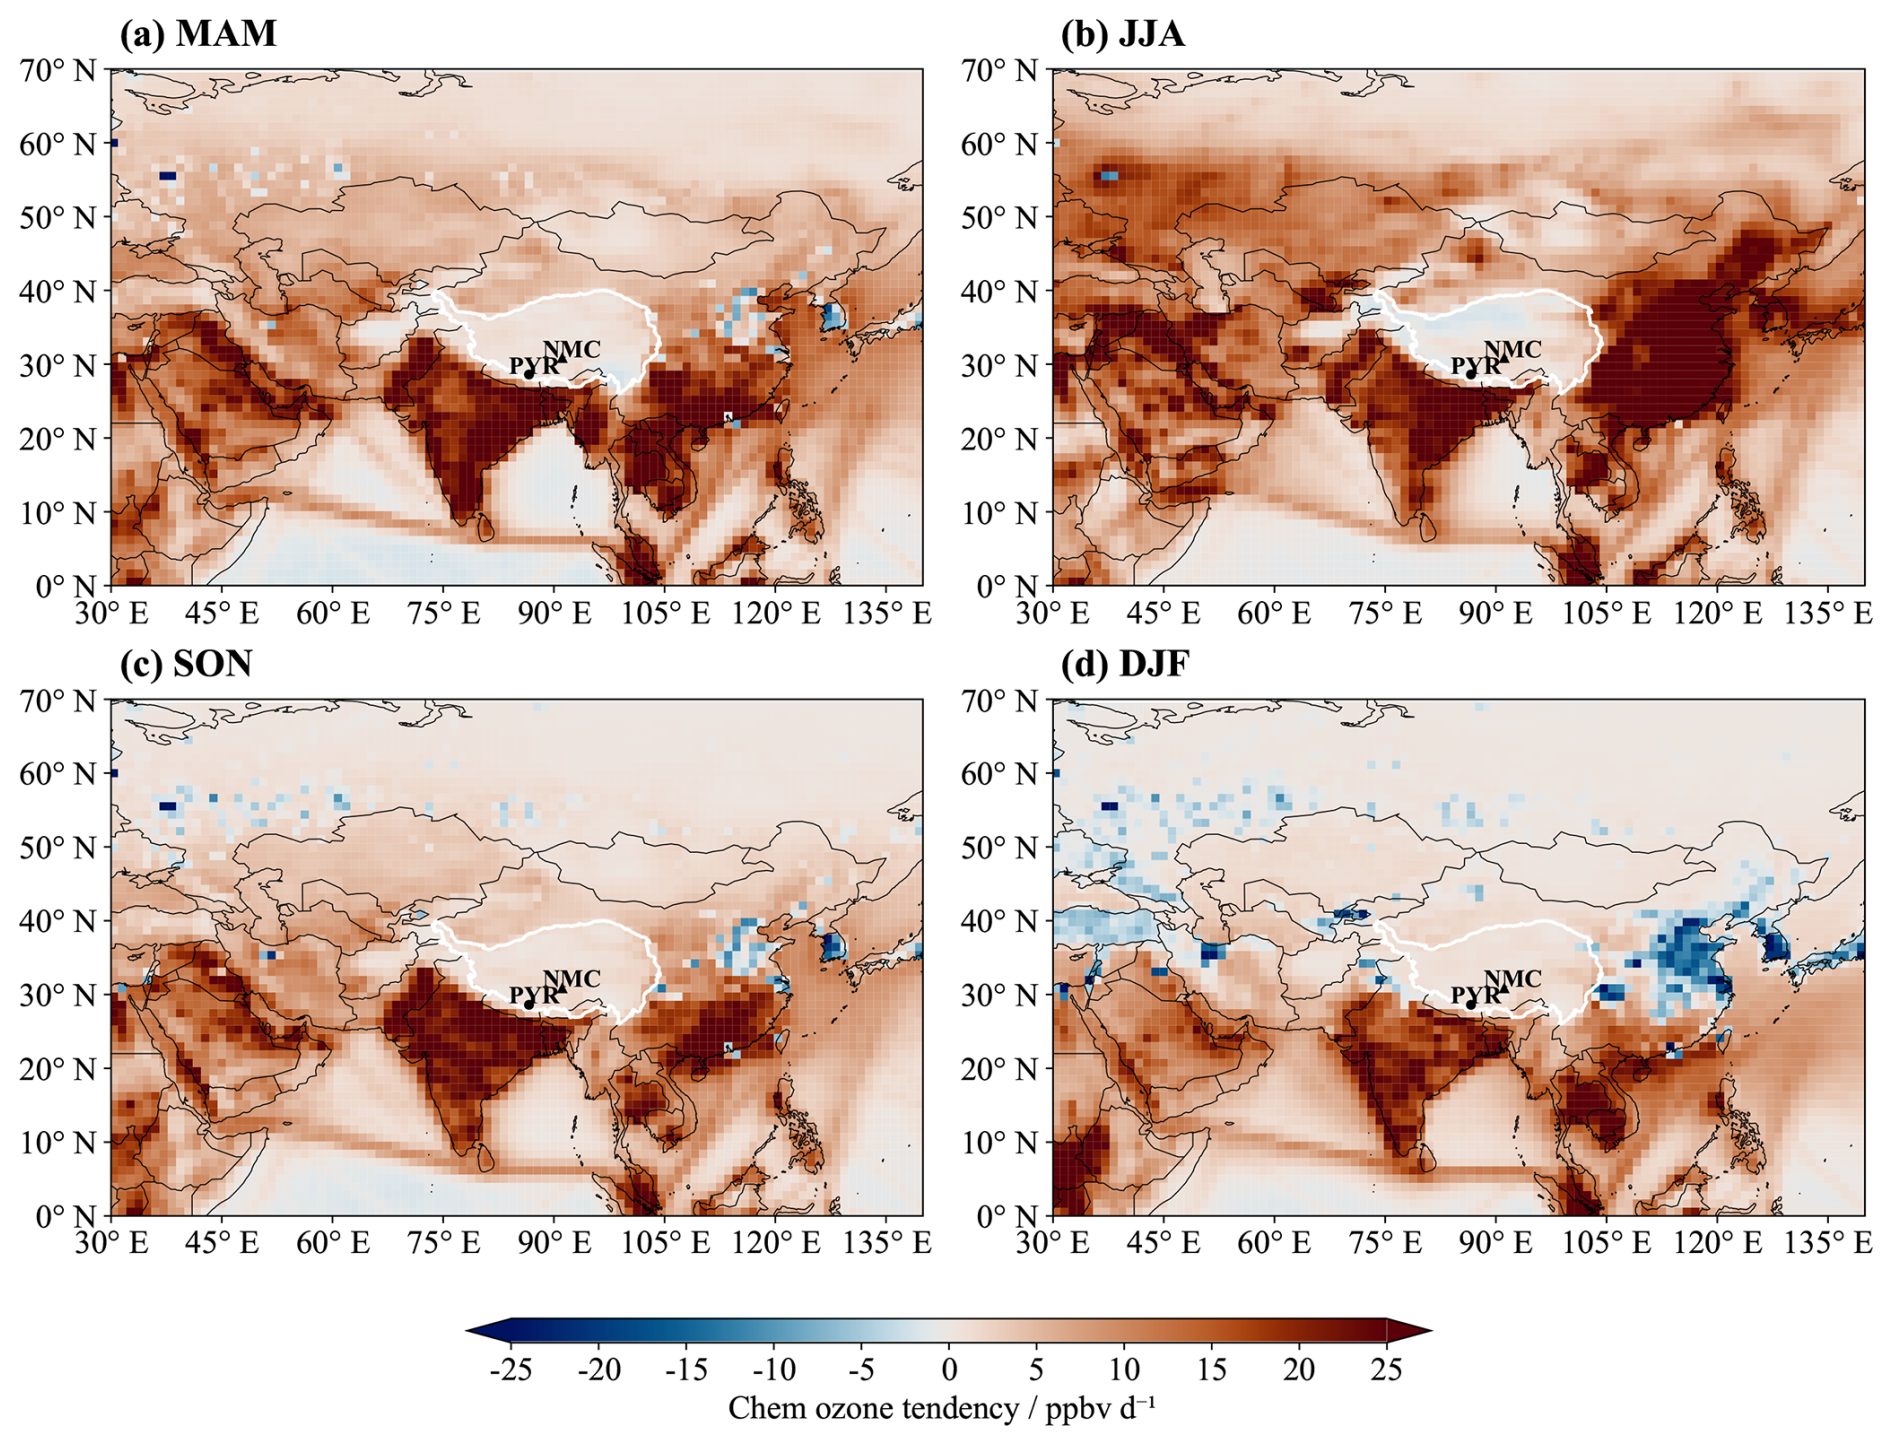
Figure 6EMAC simulated regional distributions of net photochemical ozone production rates within the planetary boundary layer over parts of Eurasia (35–125° E, 20–70° N) in different seasons averaged over the period 2010–2012: (a) Spring, (b) Summer, (c) Autumn, (d) Winter. Color shading denotes the net photochemical ozone production rate (units: ppbv d−1). White lines highlight the Tibetan Plateau area, and black dots mark the locations of the PYR (circle) and NMC (triangle) stations.
5.2.1 Seasonal patterns of surface ozone from the tropospheric sources
Strong convective activity and updrafts can lift boundary-layer ozone and its precursors into the mid-troposphere over the source and pollution-plume areas. Once lofted to the mid-troposphere, these ozone-rich air masses are captured by large-scale circulation systems at mid-to-high latitudes and then horizontally advected toward the Tibetan Plateau by broad “steering winds”, as shown in the 500 hPa wind fields in Fig. 7. Upon encountering the massive topography of the plateau, large-scale subsidence and terrain-following downdrafts ultimately transport ozone generated from external source regions down to the surface layer of the Tibetan Plateau.
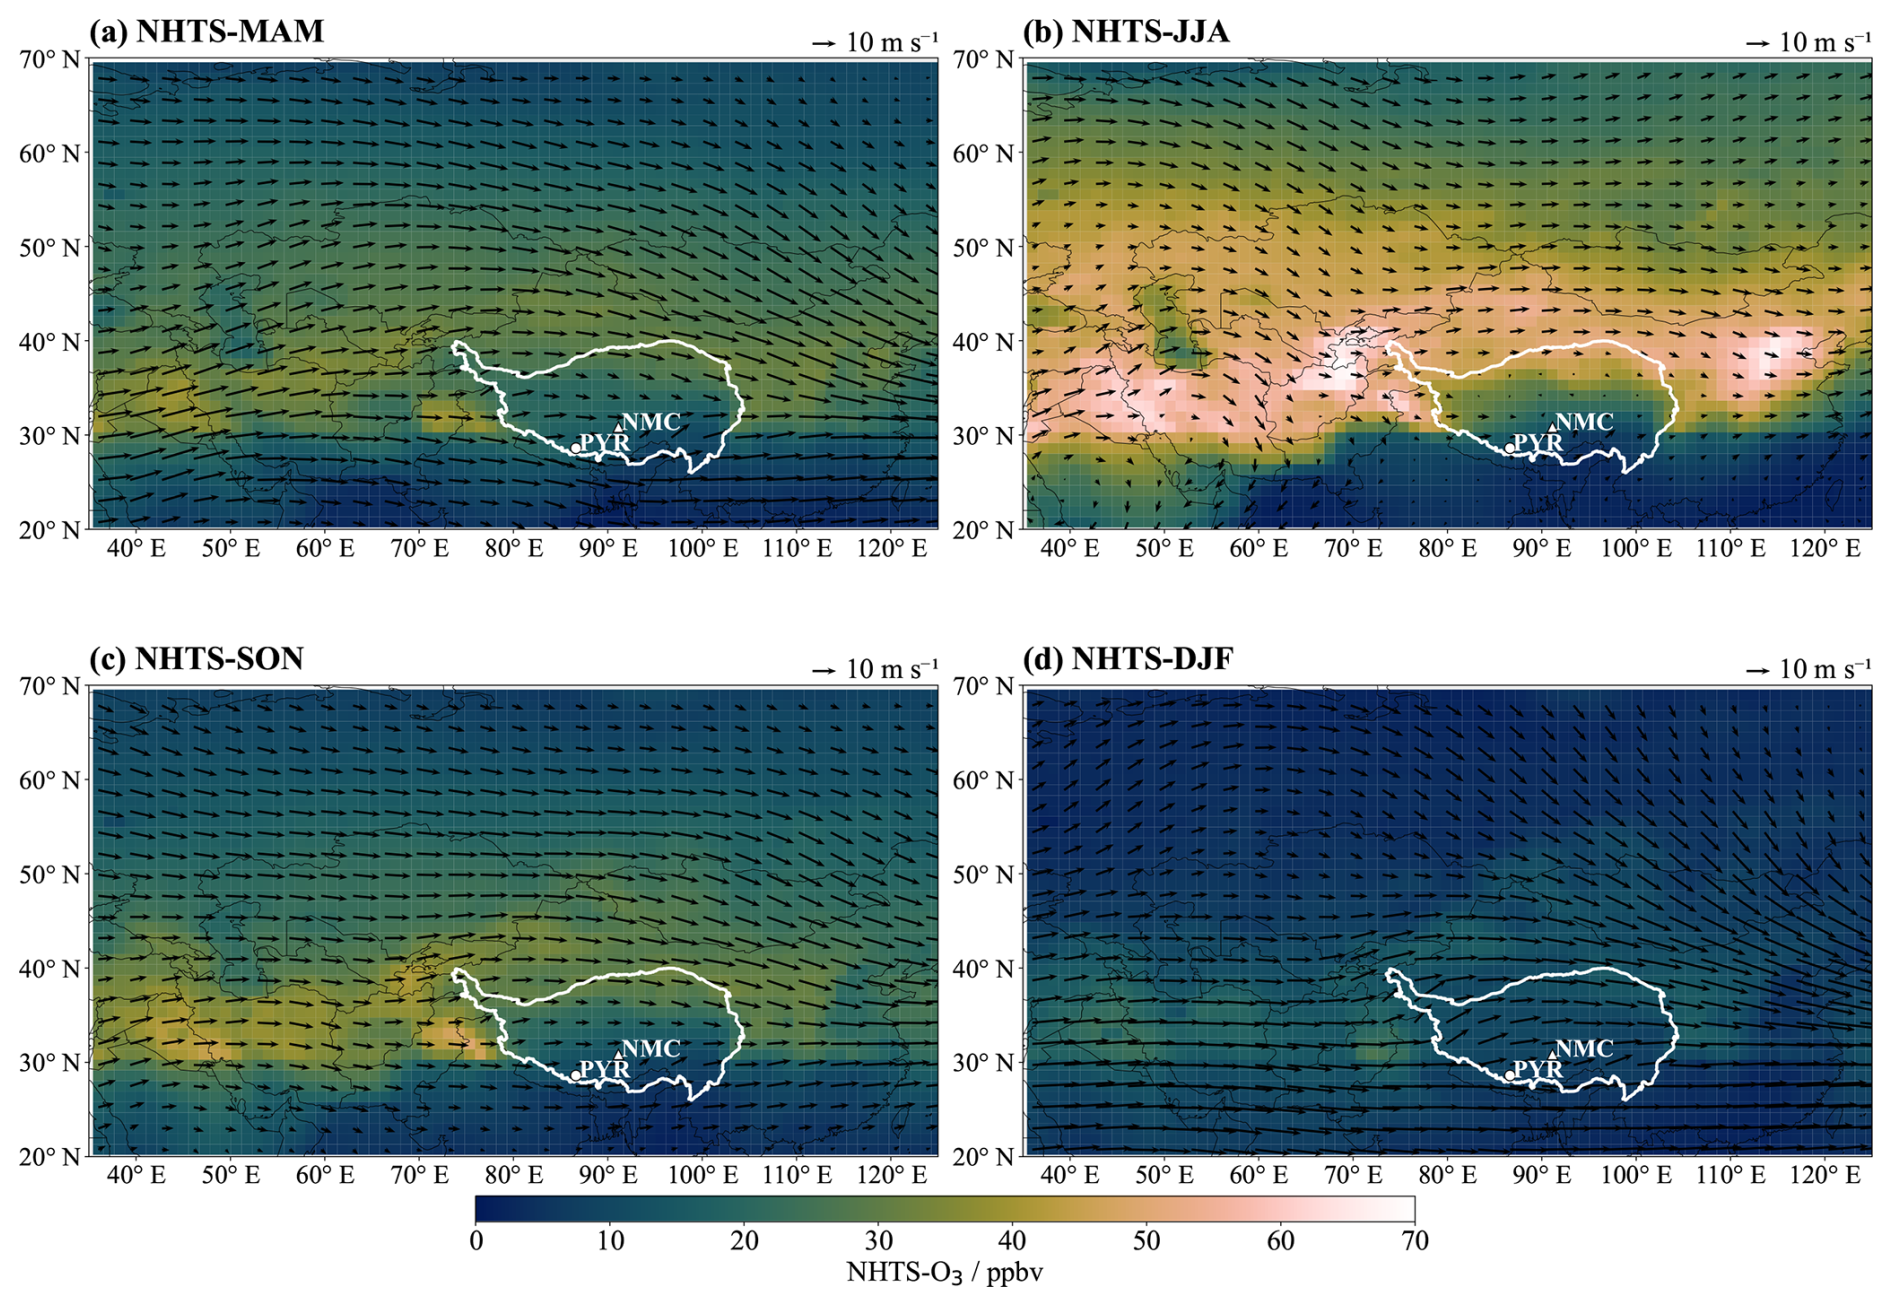
Figure 7EMAC simulated regional distributions of surface NHTS-O3 and 500 hPa wind field over parts of Eurasia (35–125° E, 20–70° N) in different seasons averaged over the period 2010–2012: (a) Spring, (b) Summer, (c) Autumn, (d) Winter. Color shading denotes NHTS-O3 volume mixing ratio (units: ppbv), and black arrows represent the wind field (units: m s−1). White lines highlight the Tibetan Plateau area, and white dots mark the locations of the PYR (circle) and NMC (triangle) stations.
Figure 7 presents the regional distributions of surface NHTS-O3 and 500 hPa mean wind field over parts of Eurasia (35–125° E, 20–70° N) in different seasons averaged over the period 2010–2012. The relative contributions of NHTS-O3 to total surface ozone are shown correspondingly in Fig. S7. The NHTS-O3 high-value belt is concentrated in the north-central Eurasian region between 30 and 50° N, and its impact on surface O3 over the Tibetan Plateau is mutually regulated by source-region concentrations and the 500 hPa westerly circulation. In spring (Fig. 7a), surface NHTS-O3 mixing ratios over Eurasia are relatively low, typically below 40 ppbv. Influenced by the split circulation of the westerly belt, strong northwest winds dominate the northern Tibetan Plateau. At the northern edge of the plateau (35–40° N) surface NHTS-O3 mixing ratios reach 25–32 ppbv, larger than those of the central and southern plateau where NMC and PYR are located. In summer (Fig. 7b), surface NHTS-O3 mixing ratios over Eurasia are largest annually, with several prominent NHTS-O3 sources (mixing ratios exceeding 55 ppbv) located in the upstream regions of the Tibetan Plateau. During this season, the zonal circulation transports NHTS-O3 from these external source areas, including southern Central Asia and further West Asia and Europe, to the plateau, resulting in an annual maximum of surface NHTS-O3 mixing ratios in the northern plateau (reaching 40–50 ppbv). The southern plateau, where PYR is located, is relatively less affected by transport of NHTS-O3 from these source regions compared to the central plateau, where NMC is located. In autumn (Fig. 7c), NHTS-O3 in the aforementioned external sources appears to decrease, and the transport effects on surface O3 over the plateau decrease. In winter (Fig. 7d), surface NHTS-O3 mixing ratios over Eurasia are generally below 25 ppbv, and those over the plateau drop to their annual minimum.
Figure 8 presents the regional distributions of surface TRTS-O3 and boundary layer mean wind field over a larger Tibetan Plateau, South Asia, and Southeast Asia area in different seasons, averaged over the period 2010–2012. For reference, the corresponding relative contributions of TRTS-O3 to total modelled O3 are presented in Fig. S8. TRTS-O3 mixing ratios reach their annual maximum in spring (Fig. 8a). During this season, frequent crop residue burning after harvest and wildfires occur in South Asia and Southeast Asia (Xue et al., 2020), leading to strong emissions of O3 precursors in this region (Lalitaporn, 2018; Lalitaporn and Boonmee, 2019) and subsequent substantial O3 production via photochemical reactions (Li et al., 2025; Sukkhum et al., 2022; Yang et al., 2022). Consequently, TRTS-O3 mixing ratios exceed 60 ppbv in northeastern South Asia and northern Southeast Asia, and the air masses with high TRTS-O3 can be transported to the southern Tibetan Plateau by southwesterly airflows, resulting in a spatial pattern where surface TRTS-O3 mixing ratios decrease progressively from the southern to the northern parts of the plateau, with larger impacts on PYR than on NMC. Surface TRTS-O3 mixing ratios over the southern plateau (26–30° N) range from 45 to 60 ppbv. With the northward advance of the Asian summer monsoon, the summer boundary layer wind field (Fig. 8b) shows that South and Southeast Asia are strongly influenced by southwesterly winds. Abundant water vapor (through O(1D) + H2O) and frequent precipitation reduce O3 production in South Asia and Southeast Asia (Gao et al., 2020; Lu et al., 2018; Wang et al., 2022), causing TRTS-O3 to drop to its annual minimum. Surface TRTS-O3 mixing ratios in the southern plateau range from 30 to 40 ppbv, decreasing progressively from the south to the north. In autumn (Fig. 8c), the monsoon retreats southward, accompanied by reduced precipitation and weakened convection. This leads to increased O3 production in South and Southeast Asia, and a subsequent rise in surface TRTS-O3 mixing ratios over the Tibetan Plateau. In winter (Fig. 8d), increased fire activity leads to a sharp rise in O3 production in South Asia (Yang et al., 2022). However, surface TRTS-O3 over the Tibetan Plateau does not increase so significantly as expected from its source variations, due to the wind fields in this season that are unfavorable for the transport of air masses to the plateau.
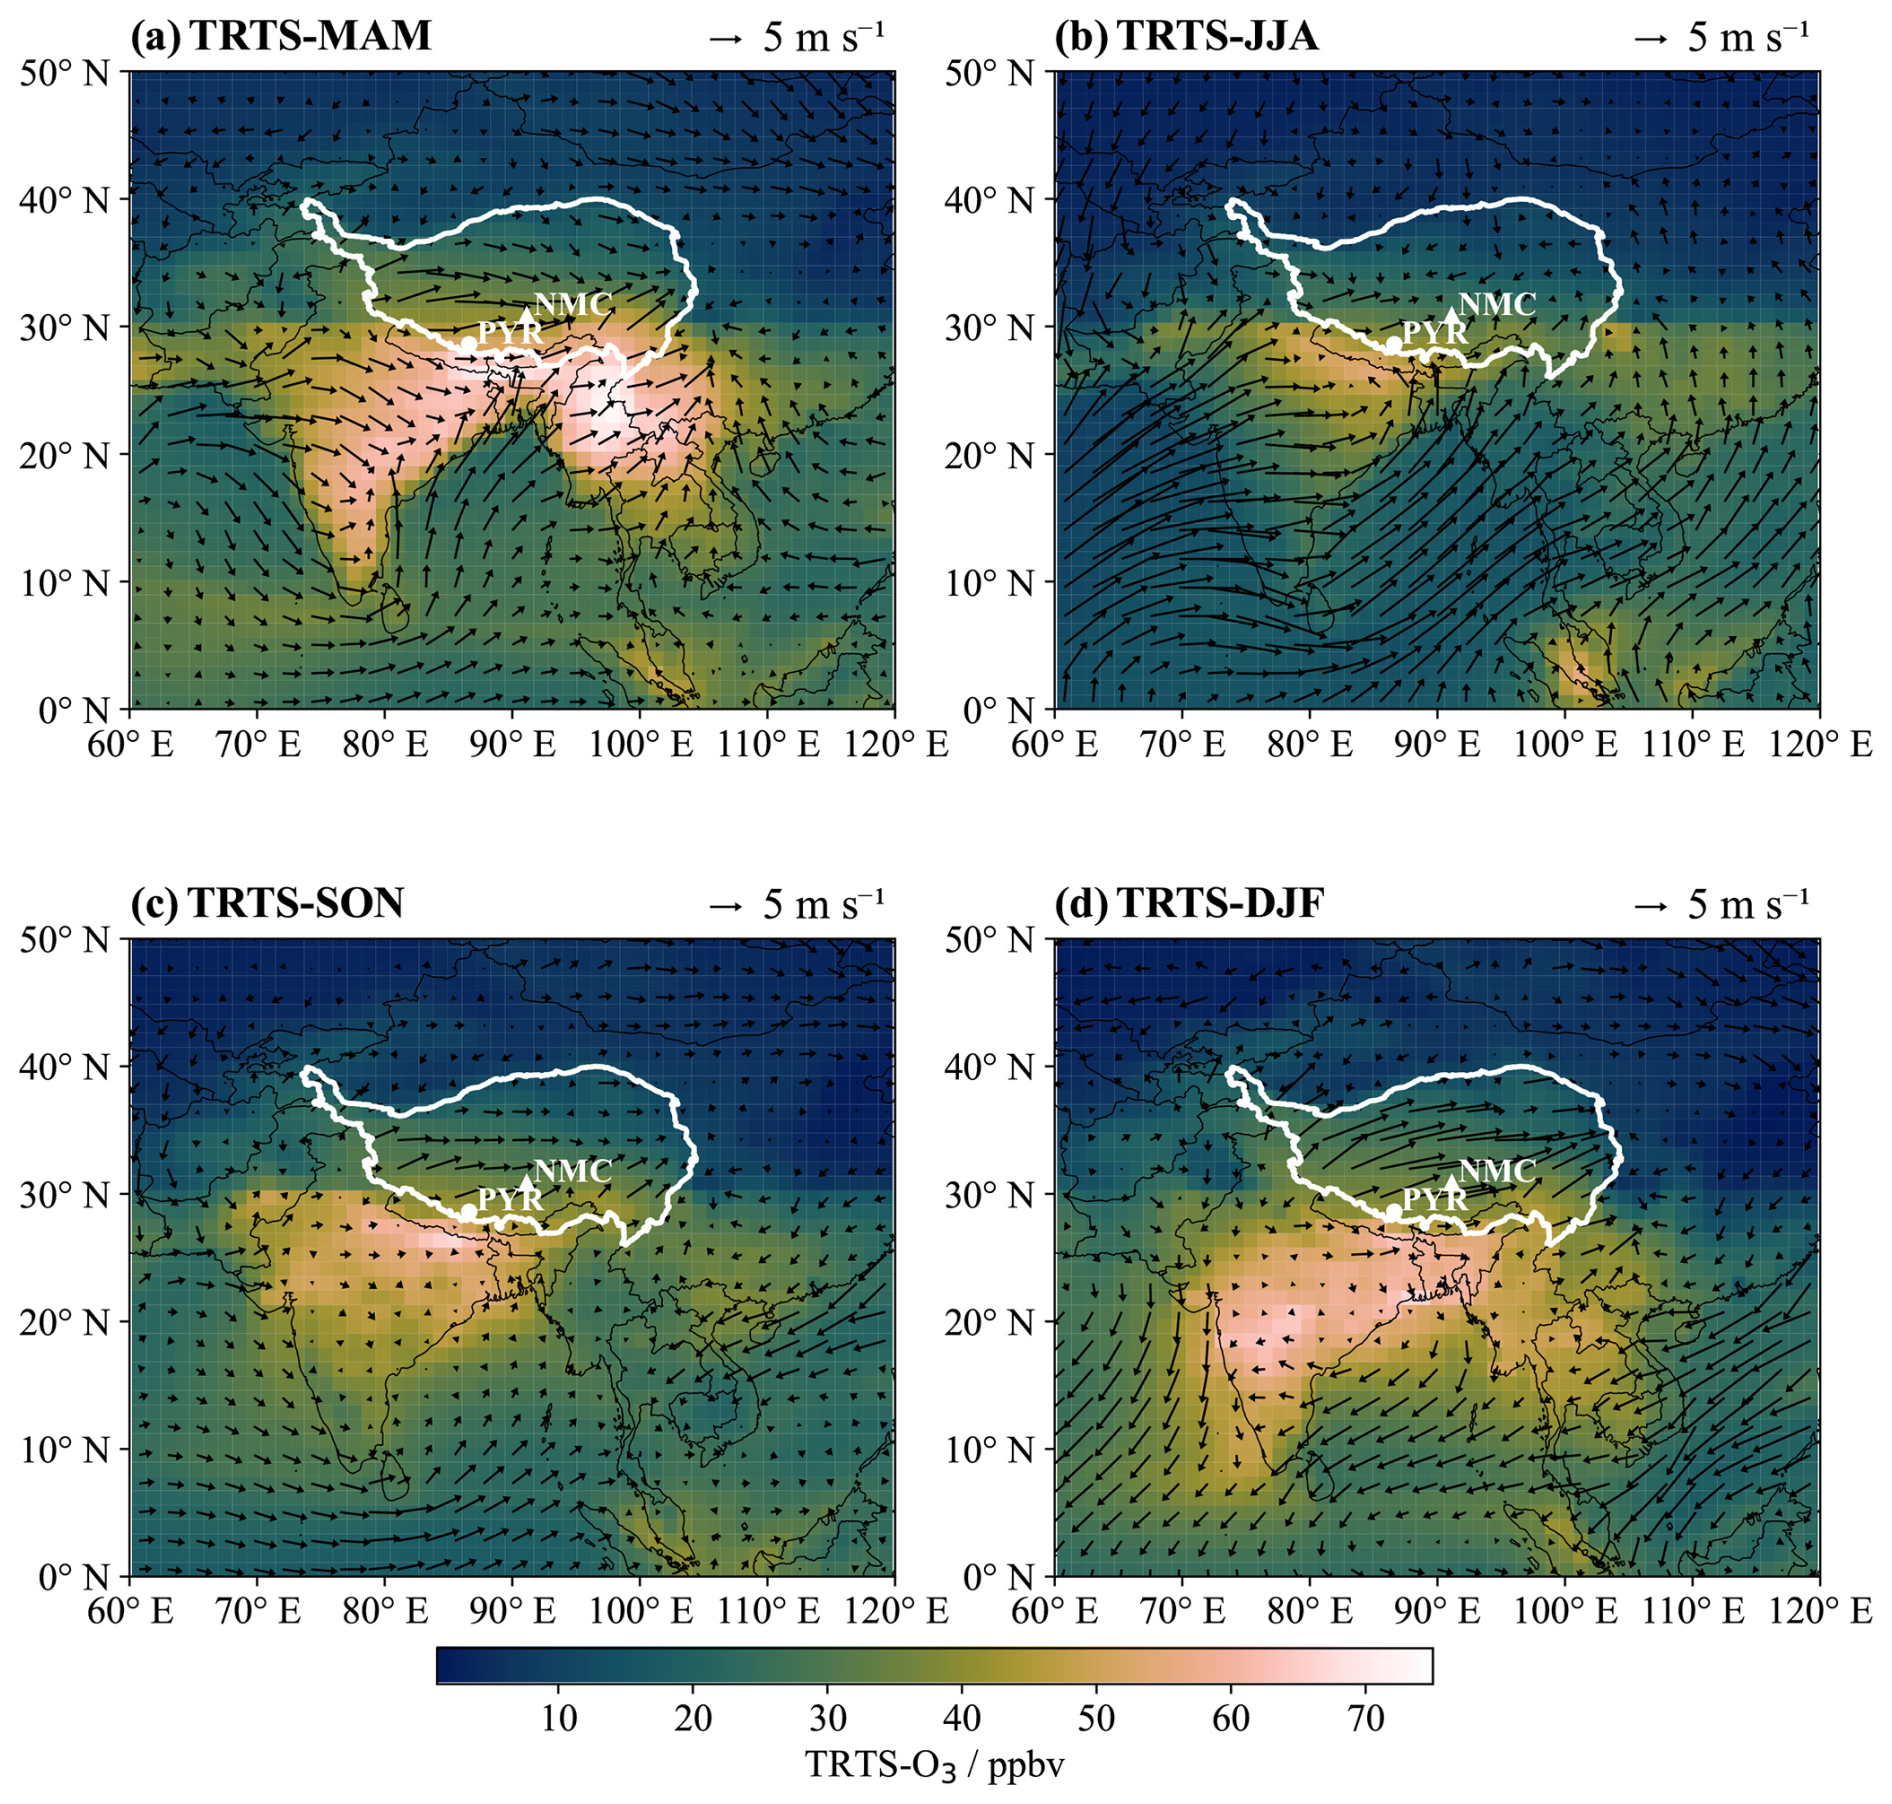
Figure 8EMAC simulated regional distributions of surface TRTS-O3 and boundary layer average wind field over a larger area covering the Tibetan Plateau, South Asia, and Southeast Asia in different seasons averaged over the period 2010–2012: (a) Spring, (b) Summer, (c) Autumn, (d) Winter. Color shading denotes TRTS-O3 volume mixing ratio (units: ppbv), and black arrows represent the wind field (units: m s−1). White lines highlight the Tibetan Plateau area, and white dots mark the locations of the PYR (circle) and NMC (triangle) stations.
5.2.2 Surface ozone from the tropospheric sources at different monsoon phases
The Asian summer monsoon has a large impact on the changes of surface ozone over the Tibetan Plateau (Ma et al., 2022). Here, we further investigate variations of surface NHTS-O3 and TRTS-O3 over the Tibetan Plateau during different monsoon phases, using 2012 as an example. Figure 9 presents the time series of daily surface NHTS-O3, TRTS-O3, specific humidity (qv), and precipitation at 88.88° E (the midpoint of the longitudes of NMC and PYR, spanning the zonal extent of the Tibetan Plateau) at different latitudes throughout 2012. The relative contributions of tagged O3 from these two sources to total modeled ozone along the same cross-section are detailed in Fig. S9. Specific humidity and precipitation data are also analyzed here, considering that their variations are useful indicators for different monsoon phases (Fig. 9c and d). Figure 9a shows that, within the Tibetan Plateau domain, the NHTS-O3 mixing ratio high-value belt is stably distributed north of 35° N. NHTS-O3 mixing ratios in this high-value belt reach their annual maximum (exceeding 60 ppbv) in June-August. The figure shows that within the NHTS domain (the region north of 29.3° N, marked by the black dashed line), the summer monsoon has negligible influence; the distribution of NHTS-O3 is only regulated by the seasonal variation of source-region concentrations and mid-high latitude circulation. In contrast, from 29.3° N to the southern boundary of the Tibetan Plateau (marked by the thick black dashed line), NHTS-O3 mixing ratios remain low during the summer monsoon period, due to weakened transport and precipitation scavenging. Figure 9b shows that the distribution of TRTS-O3 mixing ratios exhibits a distinct spatial pattern of progressive decrease from the southern boundary of the plateau to its northern part, directly reflecting the transport attenuation pattern of TRTS-O3 to the Tibetan Plateau. During the pre-monsoon period, TRTS-O3 mixing ratios south of 29.3° N reach their annual peak (exceeding 60 ppbv in some periods). There is strong transport of TRTS-O3 from the southern boundary of the plateau to its northern interior, with TRTS-O3 mixing ratios near 33° N reaching 45 ppbv. During the monsoon period, TRTS-O3 mixing ratios south of 29.3° N decrease significantly. Meanwhile, specific humidity and precipitation in this region increase synchronously. This suppresses TRTS-O3 production in the source regions, thereby leading to lower TRTS-O3 mixing ratios over the plateau. During the post-monsoon period, the monsoon exerts less influence on the source regions, and TRTS-O3 mixing ratios rebound. This process clearly demonstrates the regulatory effect of the monsoon on the production of O3 in the TRTS source regions directly, and its subsequent impact on surface O3 levels over the plateau through the transport.
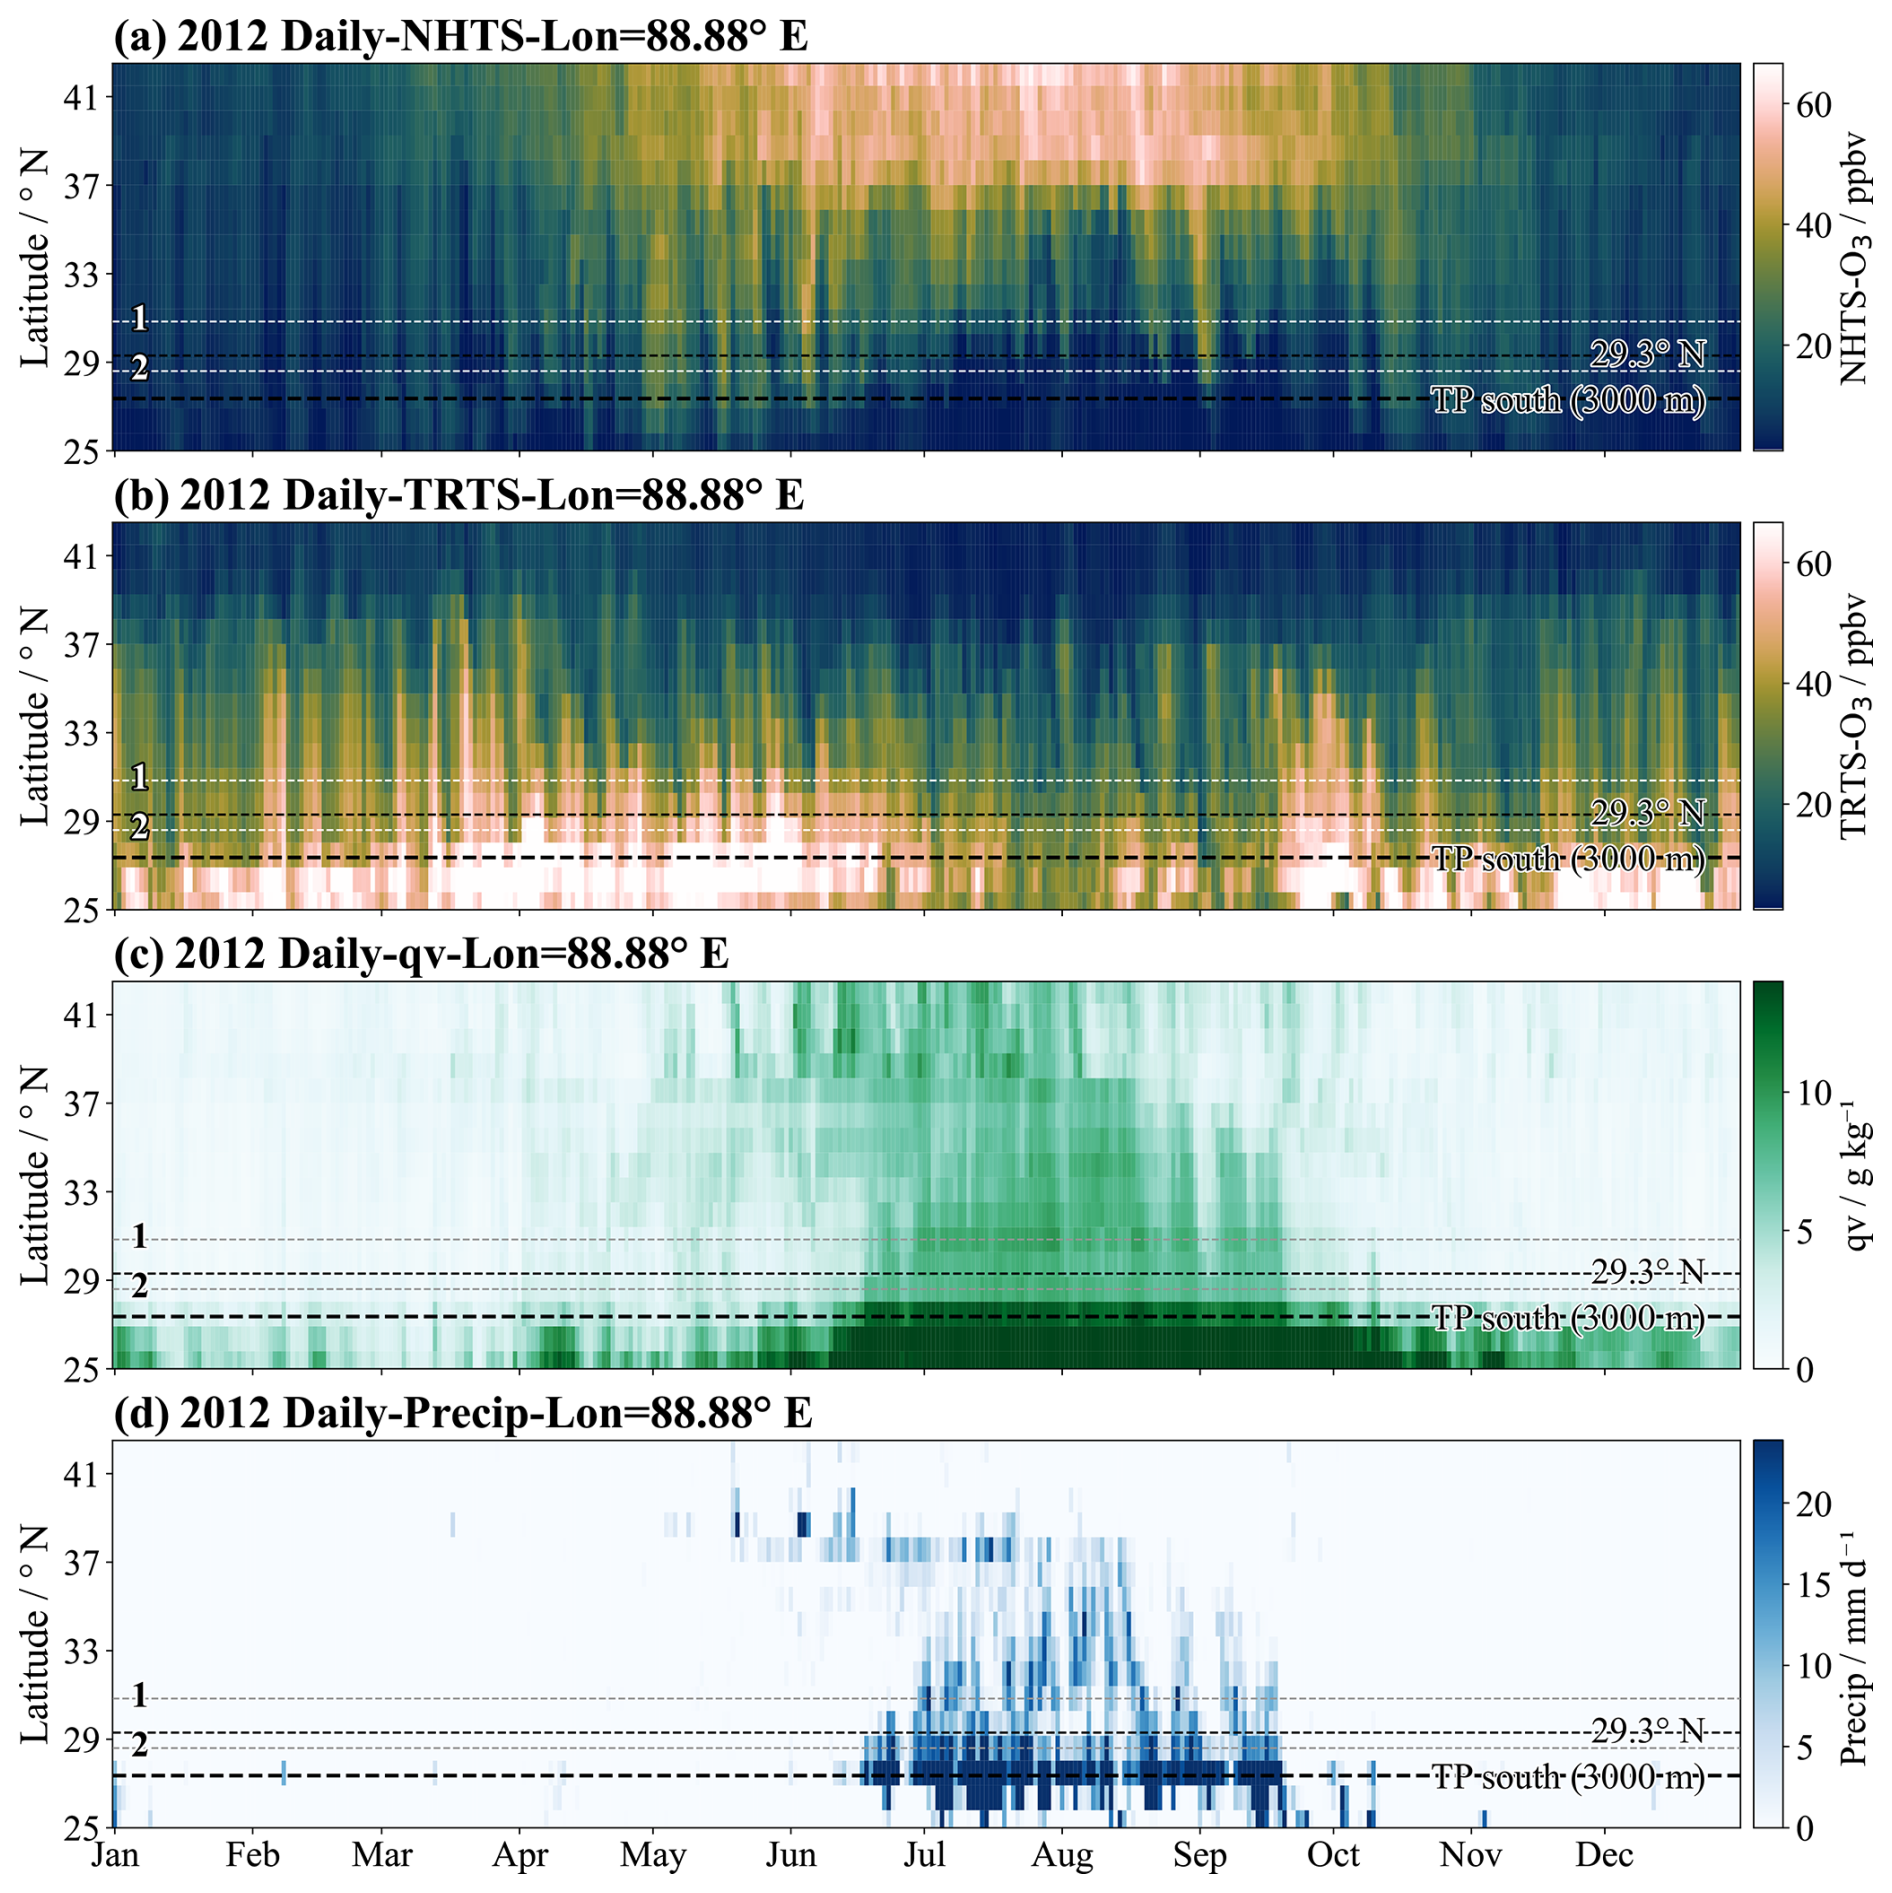
Figure 9Time series of daily average surface (a) NHTS-O3 mixing ratio (units: ppbv), (b) TRTS-O3 mixing ratio (units: ppbv), (c) specific humidity (qv, units: g kg−1), and (d) precipitation (units: mm d−1) over the Tibetan Plateau at 88.88° E longitude (the midpoint of the longitudes of the two stations, NMC and PYR) in 2012, simulated by the EMAC model. The latitude 29.3° N (the boundary between the NHTS and TRTS source regions) is marked by a black dashed line, and dashed gray lines with numbered labels indicate the latitudes of the two stations (with “1” for NMC and “2” for PYR). The thick black dashed line indicates the southern boundary of the Tibetan Plateau at this longitude.
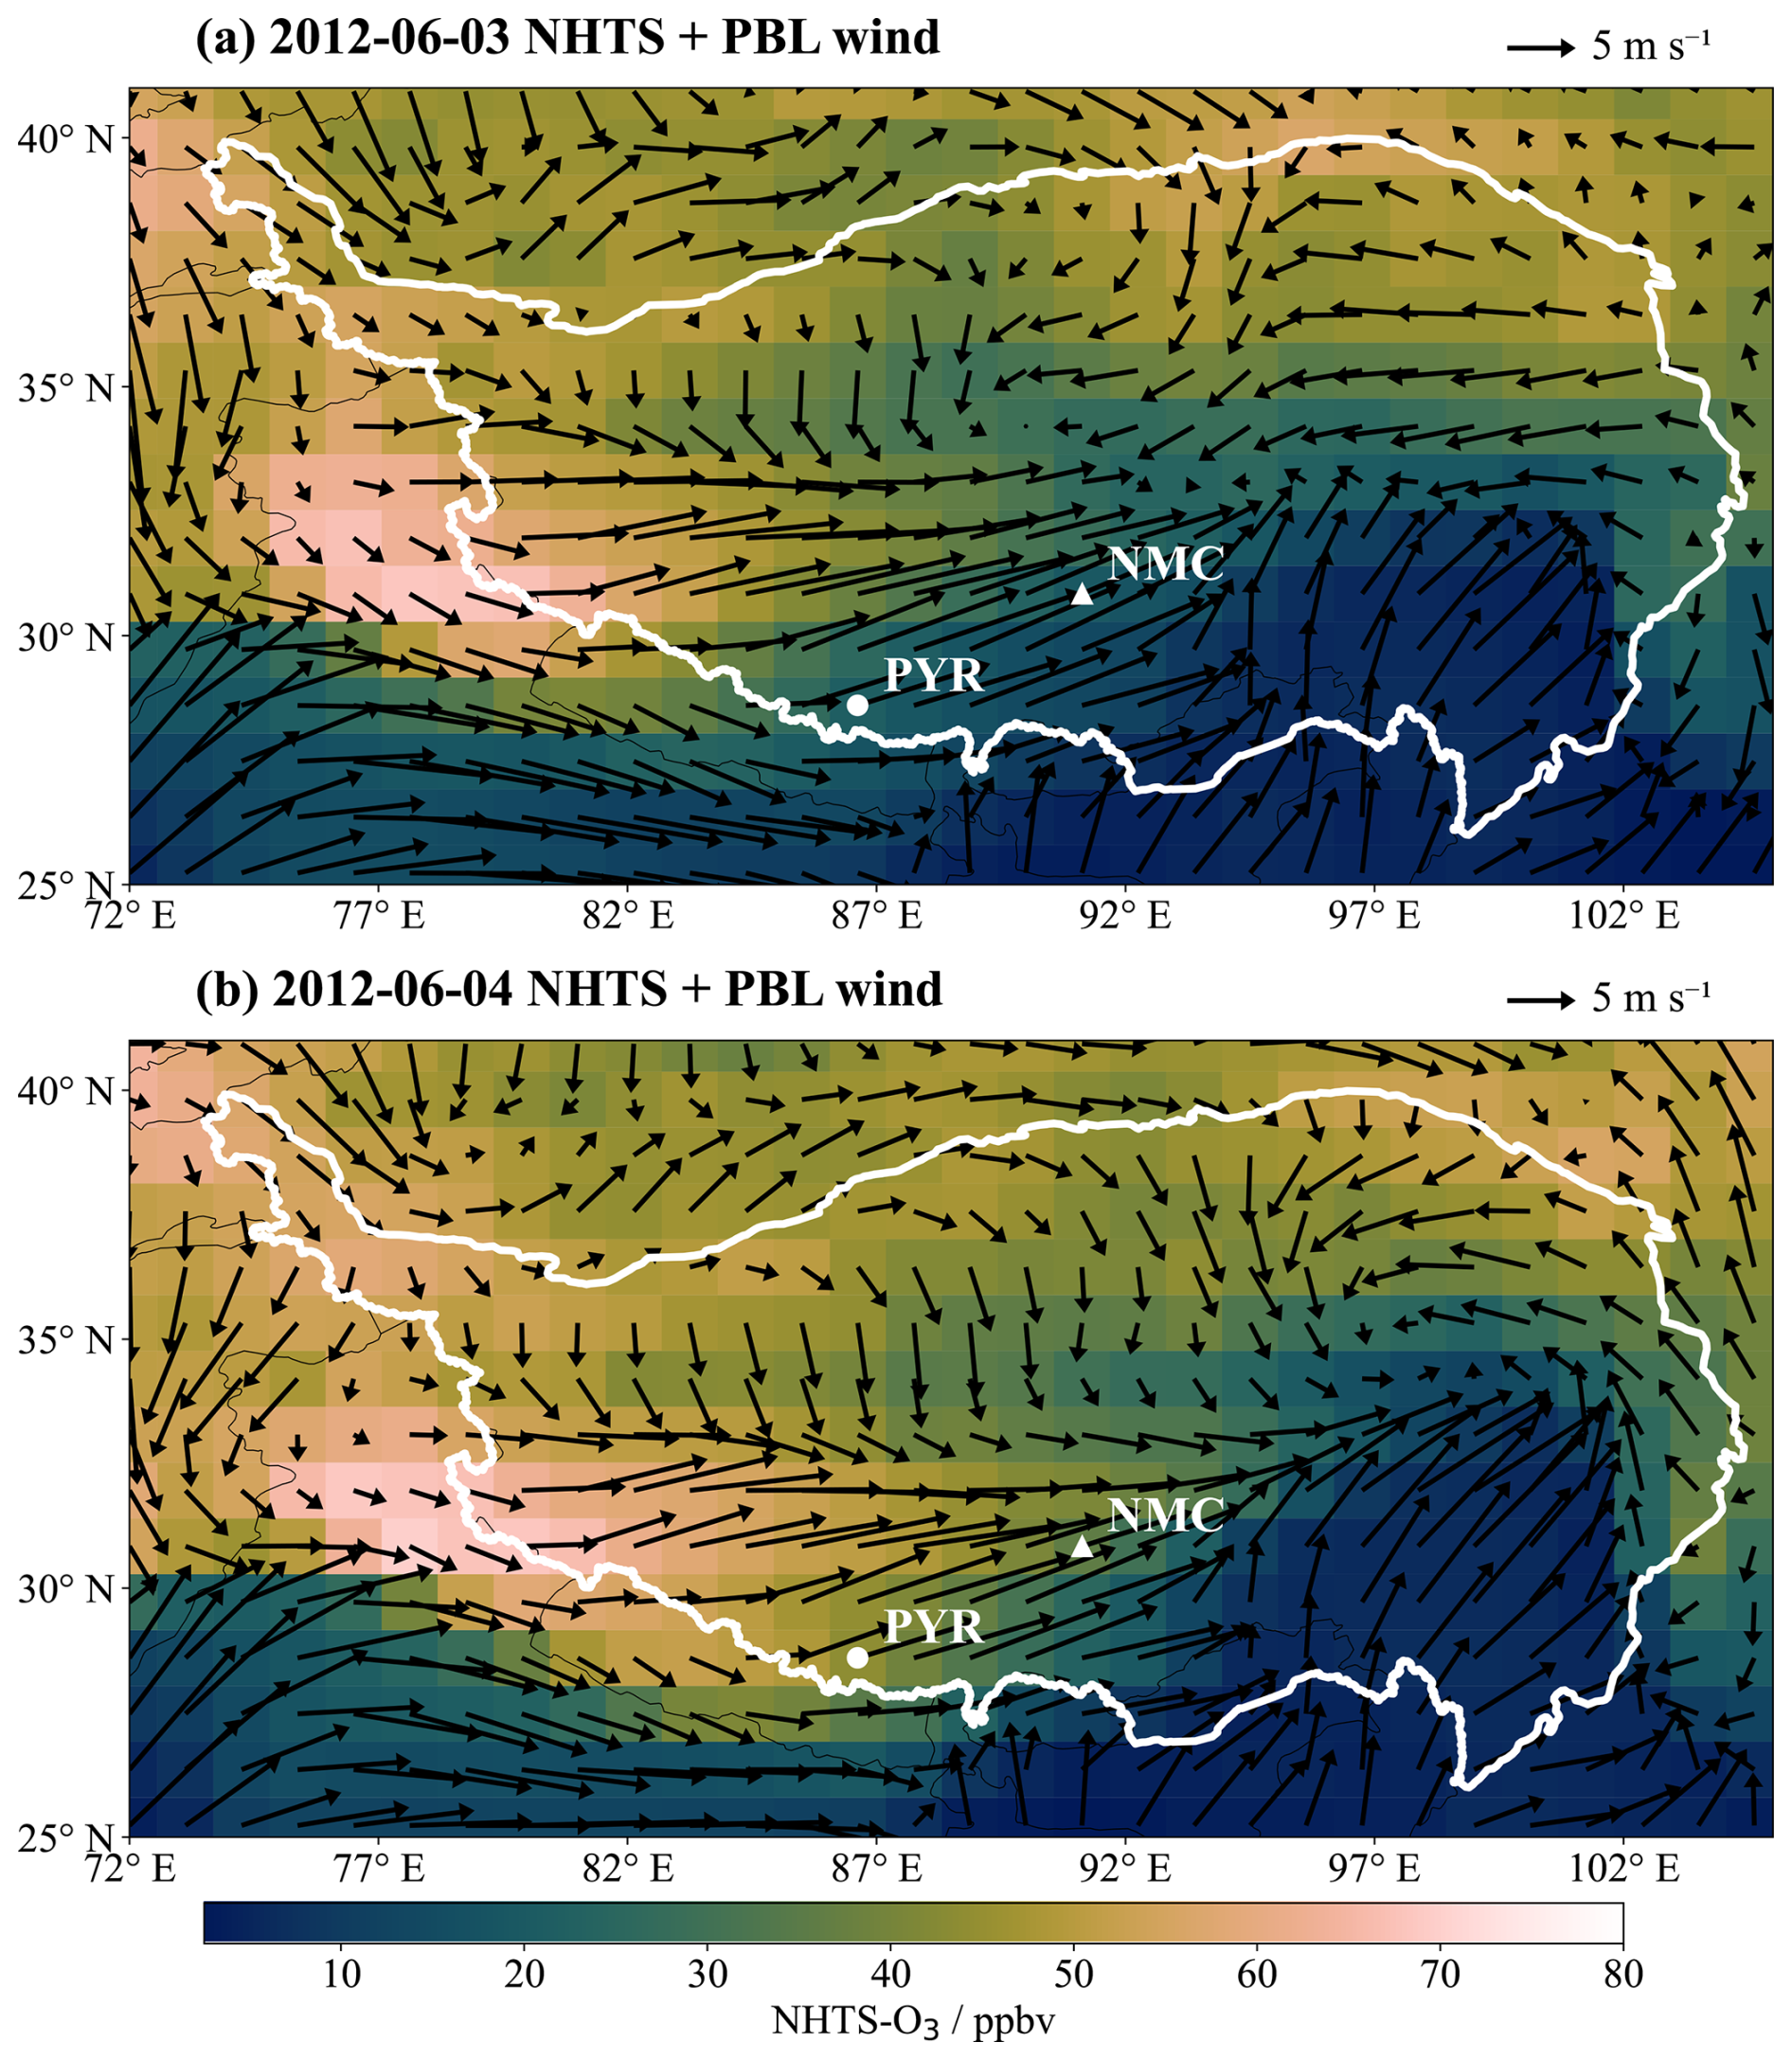
Figure 10EMAC simulated changes in the regional distribution of surface NHTS-O3 (color shading, units: ppbv) and the boundary layer average wind field (arrows, units: m s−1) during a typical NHTS-O3 transport event over the Tibetan Plateau: (a) corresponds to 3 June 2012, and (b) corresponds to 4 June 2012. White lines highlight the Tibetan Plateau area, and white dots mark the locations of the PYR (circle) and NMC (triangle) stations.
5.2.3 Analysis of tropospheric ozone transport events
Based on the interdaily variability of surface NHTS-O3 at the two stations presented in Sect. 4.2, we selected a typical event of strong NHTS-O3 transport to the central and southern Tibetan Plateau, which occurred from 3 to 4 June 2012, for in-depth analysis. Figure 10 presents the regional distributions of surface NHTS-O3 and boundary layer mean wind field over the Tibetan Plateau on 3 and 4 June 2012. The spatial patterns of the relative contribution of NHTS-O3 to total modelled O3 during this episode are provided in Fig. S10. This episode corresponds to a predominant-contribution period (above the 95th percentile) for NHTS-O3 on the southern plateau. Figure 10a shows that a high-mixing ratio center of NHTS-O3 (exceeding 50 ppbv) existed over the western area adjacent to the Tibetan Plateau (75–85° E, 30–34° N) on 3 June. The surface NHTS-O3 mixing ratio was 19 ppbv at NMC and was 21 ppbv at PYR. The boundary layer mean wind field indicates strong westerly winds over the western Tibetan Plateau, with southwest winds prevailing at both PYR and NMC. Driven by the strong westerly winds transporting high-concentration NHTS-O3 from the western plateau to its central part, the high-value center of NHTS-O3 (>50 ppbv) over the Tibetan Plateau shifted eastward to 89° E on 4 June (Fig. 10b). Surface NHTS-O3 mixing ratios over the plateau increased significantly compared to the previous day, to build up by 36 ppbv at NMC and 43 ppbv at PYR. This event demonstrates that intense transport processes can deliver high-concentration NHTS-O3 from outside the plateau into its central and southern regions, causing a rapid increase in surface NHTS-O3 mixing ratios in these areas. A similar event occurring from 4 to 5 June 2011 is shown in Fig. S12.
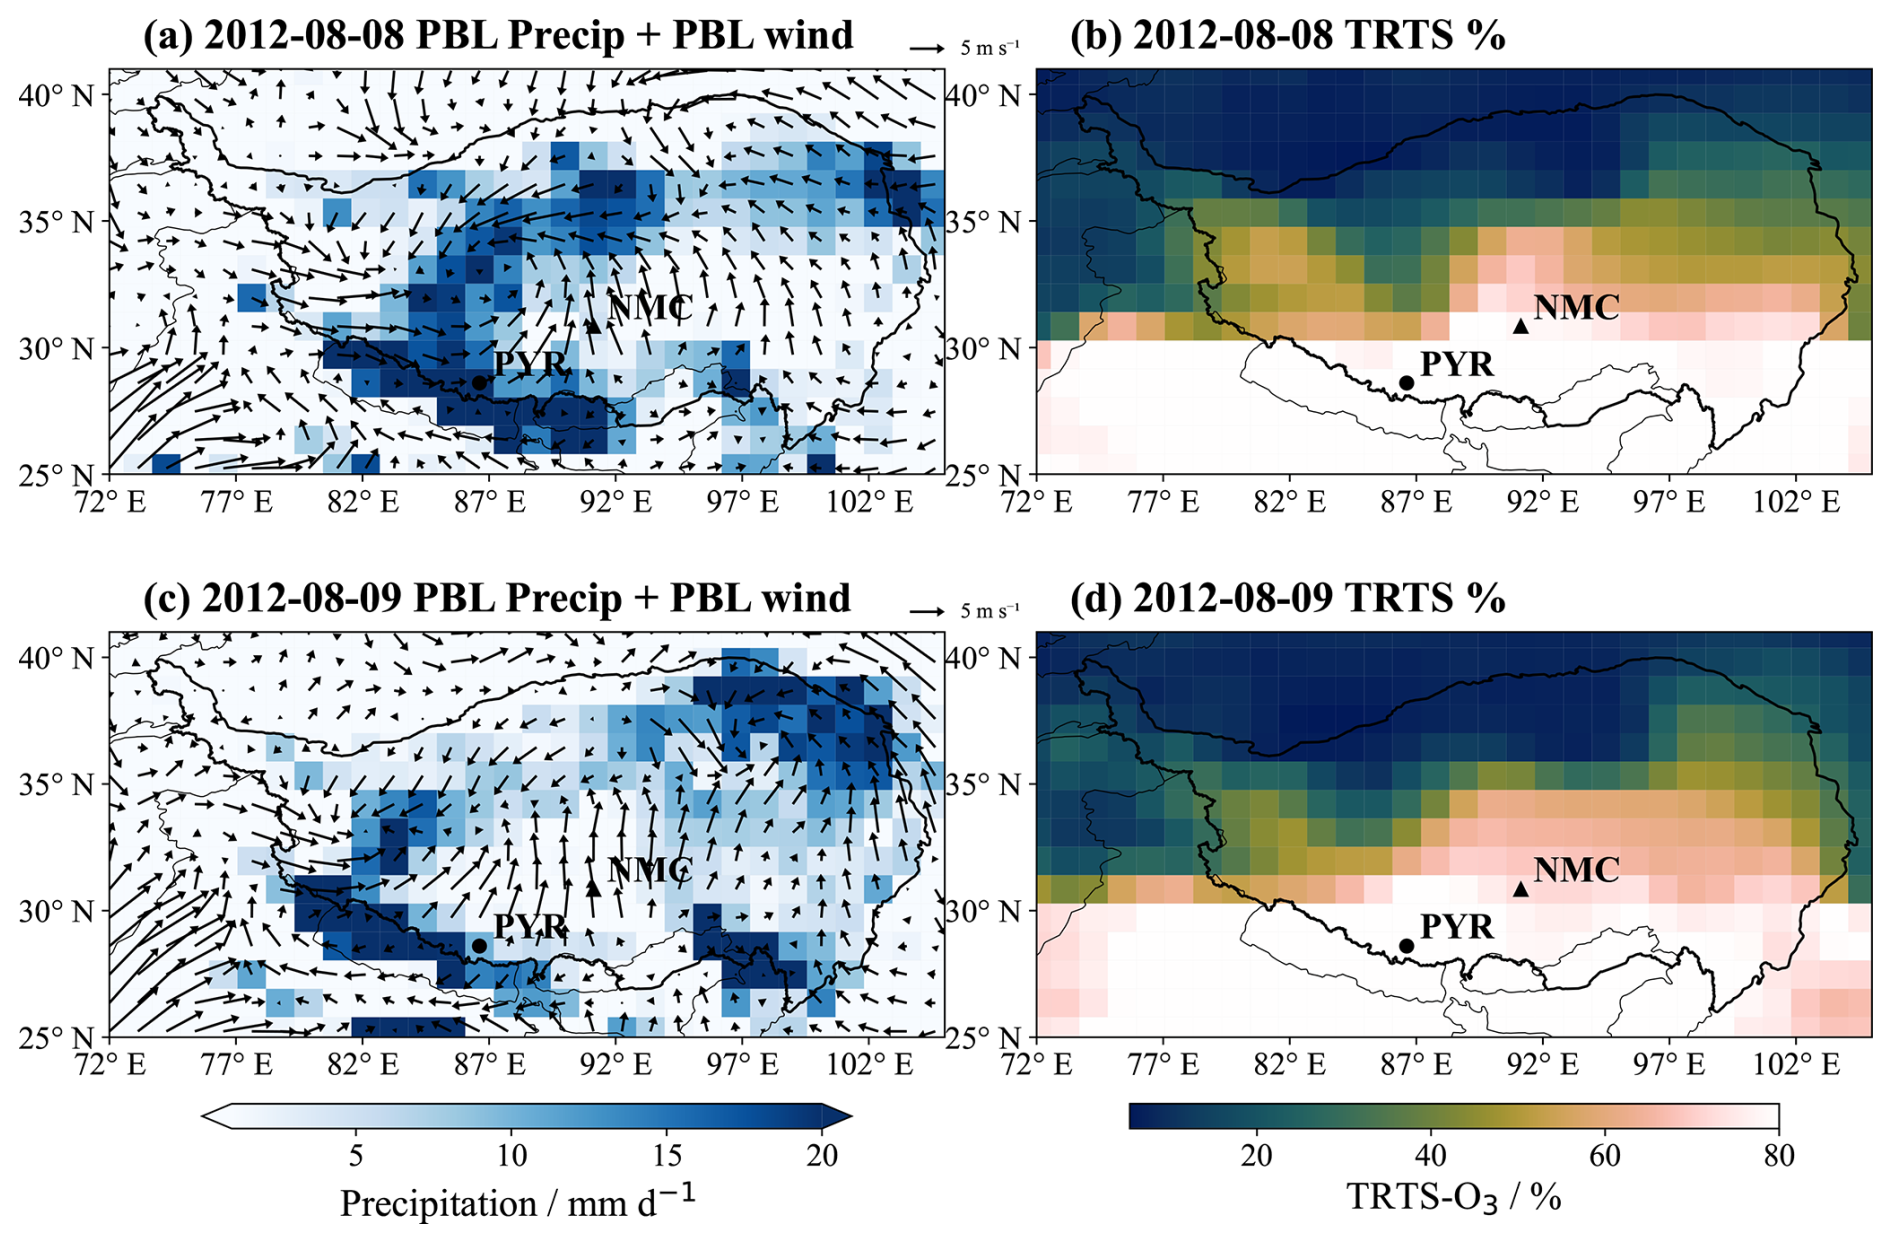
Figure 11EMAC simulated changes in the regional distribution of surface TRTS-O3 for a typical TRTS-O3 transport event during the 2012 Asian summer monsoon: Row 1 (a, b) corresponds to 8 August 2012, and Row 2 (c, d) corresponds to 9 August 2012. Column 1 (a, c) shows the regional distributions of daily accumulated precipitation (color shading, units: mm d−1) overlaid with the boundary layer average wind field (arrows, units: m s−1). Column 2 (b, d) presents the regional distributions of surface TRTS-O3 (units: ppbv). Black lines highlight the Tibetan Plateau area, and black dots mark the locations of the PYR (circle) and NMC (triangle) stations.
To examine the interdaily variation characteristics of surface TRTS-O3 at the two stations during the monsoon period, we selected a typical event of strong TRTS-O3 transport to the central and southern Tibetan Plateau, occurring from 8 to 9 August 2012, for in-depth analysis (Fig. 11). The relative contribution of TRTS-O3 during this transport event is presented in Fig. S11 to contextualize its impact. This episode corresponds to a predominant-contribution period (above the 95th percentile) for TRTS-O3 at the southern plateau. On 8 August (Fig. 11a), a strong precipitation belt existed in the central (82–93° E, 33–37° N) and southwestern (78–93° E, 26–32° N) Tibetan Plateau, with the daily accumulated precipitation reaching 5 mm d−1 at NMC and 17 mm d−1 at PYR. The boundary layer average wind field shows a low-level vortex structure in the central and southern Tibetan Plateau (west of NMC, north of PYR), while the wind direction was weak westerly at PYR and strong southerly at NMC. On 8 August (Fig. 11b), surface TRTS-O3 mixing ratios in the southern Tibetan Plateau (25–30° N) ranged from 20 to 40 ppbv, with 22 ppbv at NMC and 36 ppbv at PYR. For the boundary layer wind field on 9 August (Fig. 11c), the low-level vortex observed on the previous day moved westward to the northwestern Tibetan Plateau, and strong southerly winds prevailed at both NMC and PYR. Precipitation at NMC disappeared, while the daily accumulated precipitation at PYR decreased to 8 mm d−1. Due to the strong and dry low-level southerly winds and weakened wet deposition caused by reduced precipitation, surface TRTS-O3 in the central and southern Tibetan Plateau increased significantly on 9 August compared to the previous day, rising to 39 ppbv at PYR and 31 ppbv at NMC (Fig. 11d). This event indicates that during the monsoon period, surface TRTS-O3 on the central and southern Tibetan Plateau can change rapidly from day to day with variations in atmospheric circulation and precipitation. A similar event occurring from 6 to 7 June 2012 is shown in Fig. S13.
Based on a comprehensive analysis of in situ observational data and EMAC model simulations of ozone tagged for different stratospheric and tropospheric regions, this study systematically reveals the sources and spatiotemporal distribution characteristics of surface O3 at the NMC and PYR stations and in the surrounding areas of the Tibetan Plateau. The main conclusions are as follows:
The EMAC model can reproduce the seasonal and synoptic-scale variation and tendencies of surface O3 at the two stations in the central and southern Tibetan Plateau, but exhibits significant differences in simulation accuracy between the two stations. For the NMC station in the central plateau, the model shows high simulation accuracy with an MB of 3.2 ppbv and an RMSE of 10.9 ppbv for daily surface O3 mixing ratios. However, the model exhibits a systematic overestimation at the PYR station over the southern plateau, with an MB of 12.6 ppbv and an RMSE of 16.1 ppbv. This discrepancy mainly reflects the difficulty of representing the steep and highly heterogeneous terrain, the complex underlying surface conditions, and the associated local transport processes over the southern Tibetan Plateau at the current model resolution. The positive bias is most pronounced during late spring and early summer, when stratospheric influence and photochemical O3 formation are both strong, but this does not necessarily imply a unique overestimation of any single tagged source. Instead, we interpret the PYR bias as a model limitation that affects the absolute magnitudes of surface O3, while the simulated seasonal cycles and relative source contributions remain physically meaningful and robust within the current model configuration. Therefore, we interpret the source-attribution results at PYR as physically meaningful representations of regional-scale transport within the current model configuration, while noting that their absolute values are subject to local topographical uncertainties.
This study has analyzed the spatiotemporal variability of O3 over the Tibetan Plateau transported from the three source regions, namely the Northern Hemisphere and Tropical Stratospheric Source (NTST), the Northern Hemisphere Mid-High Latitude Tropospheric Source (NHTS), and the Tropical Tropospheric Source (TRTS), which are treated by EMAC using the ozone source tagging technique. Surface NTST-O3 is highest in spring annually at both stations (with a maximum daily average mixing ratio of 28 ppbv at NMC and 22 ppbv at PYR). It exhibits a strong interdaily variability during springtime stratospheric intrusion events, with a maximum interdaily difference of 15 ppbv at NMC and 11 ppbv at PYR. Surface NHTS-O3 is highest in summer, with a maximum daily average mixing ratio of 40 ppbv at NMC and 45 ppbv at PYR, and it also exhibits an intense interdaily variability, with a maximum of 22 ppbv at both stations. Surface TRTS-O3 is highest during spring, especially during the pre-monsoon period, and it exhibits a spatial pattern of being higher in the south and lower in the north over the Tibetan Plateau, with a maximum daily average mixing ratio of 77 ppbv at PYR and 64 ppbv at NMC.
The seasonal and daily variations of NTST-O3 over the Tibetan Plateau are primarily regulated by the changes in the position and intensity of the subtropical westerly jet. In spring, the jet axis is located in the hinterland of the plateau, and its interaction with planetary waves induces frequent tropopause folding events, which promote the downward transport of stratospheric O3 to the troposphere, leading to the spring peak and strong interdaily variability of NTST-O3 at the surface. The relative contribution of NTST-O3 to surface O3 can reach a daily maximum of 30 % at both NMC and PYR. Surface NHTS-O3 on the Tibetan Plateau is mutually regulated by variations in NHTS-O3 concentrations in the source regions and the westerly circulation indicated by the 500 hPa wind field. Since surface NHTS-O3 in Central Asia, West Asia and Europe are highest in summer, efficient transport of NHTS-O3 by zonal circulation from these source regions results in a summertime maximum of surface O3 over the northern plateau. The relative contribution of NHTS-O3 to surface O3 can reach a daily maximum of 62 % at NMC and 58 % at PYR in summer, although the absolute contributions are relatively small due to limited southward transport of NHTS-O3 over the plateau.
Surface TRTS-O3 over the Tibetan Plateau is controlled by the TRTS-O3 concentrations in the South and Southeast Asian source areas and monsoon circulation. In addition to biomass burning activities, the Asian summer monsoon regulates surface TRTS-O3 by modifying the environmental conditions, such as total water content and precipitation in the tropical source regions. During the pre-monsoon period, enhanced TRTS-O3 in South and Southeast Asia can be transported to the plateau, resulting in annual surface O3 peaks over the southern and central Tibetan Plateau. The relative contribution of TRTS-O3 to surface O3 can reach a daily maximum of 93 % at NMC and 98 % at PYR in this period. During the monsoon period, O3 production is suppressed in the source regions, and transport of TRTS-O3 to the plateau is limited, leading to annual minimums of surface TRTS-O3 over the southern and central Tibetan Plateau, as observed at NMC and PYR. During monsoon breaks, when precipitation weakens, and TRTS-O3 concentrations increase in the source regions, short-term TRTS-O3 enhancement events can occur over the central and southern plateau under favorable transport conditions.
By analyzing ozone variations across multiple spatial and temporal scales, this study elucidates the key roles of monsoon and zonal circulation as well as subtropical westerly jet in the dynamics and transport of O3 from the TRTS, NHTS and NTST source regions to the Tibetan Plateau. Although several areas, including South, Southeast, Central and West Asia, and further Europe, have been identified as major sources of surface O3 over the Tibetan Plateau, additional studies, including model simulation are needed to quantify the contributions of these important sources to the seasonal and daily variations of O3 over the Tibetan Plateau. Additional measurements, especially in the western, southwestern and northwestern parts of the plateau, are suggested to evaluate and improve the model simulations and reveal the sources and transport pathways of O3 to the plateau. It should be noted that the present analysis is limited to the observationally available period of 2010–2012. According to historical sea surface temperature data, this period was characterized by persistent La Niña conditions (Feng et al., 2015). Previous studies have shown that the El Niño–Southern Oscillation (ENSO) and the stratospheric quasi-biennial oscillation (QBO) can strongly influence cross-tropopause transport and tropospheric ozone anomalies (Han et al., 2001; Li et al., 2023, 2024), while the 11-year solar cycle contributes to longer-term ozone variations (Xu et al., 2016, 2018a). Future studies employing long-term transient simulations are essential to quantify the impacts of these climate modes on the interannual variability of ozone sources over the TP. Spatiotemporal variations of O3 over the Tibetan Plateau, as well as associated influencing factors, are complex, and with ongoing changes in the emissions of ozone precursors in the major source areas and enhanced climate variabilities, the influences on surface O3 over the Tibetan Plateau through transport and photochemistry need continued investigation.
Ozone measurements from NMC can be made available on request. The ozone dataset of PYR used in this study were accessed from EBAS (https://ebas.nilu.no, last access: 12 November 2024; https://doi.org/10.48597/ASM8-VJYZ, Cristofanelli and Bonasoni, 2026) hosted by NILU and affiliated with the GAW-WDCRG framework. The data comprise hourly ozone mixing ratios for 2010–2012. The usage of MESSy (Modular Earth Submodel System) and access to the source code is licensed to all affiliates of institutions which are members of the MESSy Consortium. Institutions can become members of the MESSy Consortium by signing the “MESSy Memorandum of Understanding”. More information can be found on the MESSy Consortium website: http://www.messy-interface.org (last access: 3 November 2025). The code used in this study has been based on MESSy version 2.52. The data produced in the study are available from the authors upon request.
The supplement related to this article is available online at https://doi.org/10.5194/acp-26-10355-2026-supplement.
YZ nalysed the data under discussion with JM. JM performed the model simulation. NL, AP, and JL contributed to the model simulation and evaluation. WL and XX made measurements at NMC. YL, SC, and XZ contributed to data processing and the analysis, YZ and JM prepared the manuscript with contributions from all co-authors.
At least one of the (co-)authors is a member of the editorial board of Atmospheric Chemistry and Physics. The peer-review process was guided by an independent editor, and the authors also have no other competing interests to declare.
Publisher's note: Copernicus Publications remains neutral with regard to jurisdictional claims made in the text, published maps, institutional affiliations, or any other geographical representation in this paper. The authors bear the ultimate responsibility for providing appropriate place names. Views expressed in the text are those of the authors and do not necessarily reflect the views of the publisher.
This article is part of the special issue “The Modular Earth Submodel System (MESSy) (ACP/GMD inter-journal SI)”. It is not associated with a conference.
Jianzhong Ma would like to thank Patrick Jöckel, Rolf Sander, and other MESSy colleagues for their help in using EMAC and the submodels. Hualong Zhang, Shihui Jia and Ying Wang participated in the observations at NMC.
This research has been supported by the National Natural Science Foundation of China (grant nos. 42330603 and 42475123) and the CAMS Science and Technology Development Fund (grant no. 2023KJ013).
This paper was edited by Andreas Hofzumahaus and reviewed by two anonymous referees.
Archibald, A. T., Neu, J. L., Elshorbany, Y. F., Cooper, O. R., Young, P. J., Akiyoshi, H., Cox, R. A., Coyle, M., Derwent, R. G., Deushi, M., Finco, A., Frost, G. J., Galbally, I. E., Gerosa, G., Granier, C., Griffiths, P. T., Hossaini, R., Hu, L., Joeckel, P., Josse, B., Lin, M. Y., Mertens, M., Morgenstern, O., Naja, M., Naik, V., Oltmans, S., Plummer, D. A., Revell, L. E., Saiz-Lopez, A., Saxena, P., Shin, Y. M., Shahid, I., Shallcross, D., Tilmes, S., Trickl, T., Wallington, T. J., Wang, T., Worden, H. M., and Zeng, G.: Tropospheric Ozone Assessment Report: A critical review of changes in the tropospheric ozone burden and budget from 1850 to 2100, Elem. Sci. Anth., 8, 034, https://doi.org/10.1525/elementa.2020.034, 2020.
Bonasoni, P., Laj, P., Angelini, F., Arduini, J., Bonafè, U., Calzolari, F., Cristofanelli, P., Decesari, S., Facchini, M. C., Fuzzi, S., Gobbi, G. P., Maione, M., Marinoni, A., Petzold, A., Roccato, F., Roger, J. C., Sellegri, K., Sprenger, M., Venzac, H., Verza, G. P., Villani, P., and Vuillermoz, E.: The ABC-Pyramid Atmospheric Research Observatory in Himalaya for aerosol, ozone and halocarbon measurements, Sci. Total Environ., 391, 252–261, https://doi.org/10.1016/j.scitotenv.2007.10.024, 2008.
Bonasoni, P., Laj, P., Marinoni, A., Sprenger, M., Angelini, F., Arduini, J., Bonafè, U., Calzolari, F., Colombo, T., Decesari, S., Di Biagio, C., di Sarra, A. G., Evangelisti, F., Duchi, R., Facchini, M. C., Fuzzi, S., Gobbi, G. P., Maione, M., Panday, A., Roccato, F., Sellegri, K., Venzac, H., Verza, G. P., Villani, P., Vuillermoz, E., and Cristofanelli, P.: Atmospheric Brown Clouds in the Himalayas: first two years of continuous observations at the Nepal Climate Observatory-Pyramid (5079 m), Atmos. Chem. Phys., 10, 7515–7531, https://doi.org/10.5194/acp-10-7515-2010, 2010.
Chen, X. L., Ma, Y. M., Kelder, H., Su, Z., and Yang, K.: On the behaviour of the tropopause folding events over the Tibetan Plateau, Atmos. Chem. Phys., 11, 5113–5122, https://doi.org/10.5194/acp-11-5113-2011, 2011.
Cristofanelli, P. and Bonasoni, P.: GAW-WDCRG, 2006–2013, Ozone at Nepal Climate Observatory – Pyramid, data hosted by EBAS at NILU [data set], https://doi.org/10.48597/ASM8-VJYZ, 2026.
Cristofanelli, P., Bonasoni, P., Collins, W., Feichter, J., Forster, C., James, P., Kentarchos, A., Kubik, P. W., Land, C., Meloen, J., Roelofs, G. J., Siegmund, P., Sprenger, M., Schnabel, C., Stohl, A., Tobler, L., Tositti, L., Trickl, T., and Zanis, P.: Stratosphere-to-troposphere transport: A model and method evaluation, J. Geophys. Res.-Atmos., 108, 8525, https://doi.org/10.1029/2002JD002600, 2003.
Cristofanelli, P., Bracci, A., Sprenger, M., Marinoni, A., Bonafè, U., Calzolari, F., Duchi, R., Laj, P., Pichon, J. M., Roccato, F., Venzac, H., Vuillermoz, E., and Bonasoni, P.: Tropospheric ozone variations at the Nepal Climate Observatory-Pyramid (Himalayas, 5079 m a.s.l.) and influence of deep stratospheric intrusion events, Atmos. Chem. Phys., 10, 6537–6549, https://doi.org/10.5194/acp-10-6537-2010, 2010.
Desqueyroux, H., Pujet, J.-C., Prosper, M., Squinazi, F., and Momas, I.: Short-Term Effects of Low-Level Air Pollution on Respiratory Health of Adults Suffering from Moderate to Severe Asthma, Environ. Res., 89, 29–37, https://doi.org/10.1006/enrs.2002.4357, 2002.
Ding, A. and Wang, T.: Influence of stratosphere-to-troposphere exchange on the seasonal cycle of surface ozone at Mount Waliguan in western China, Geophys. Res. Lett., 33, L03803, https://doi.org/10.1029/2005GL024760, 2006.
Eckstein, J., Ruhnke, R., Zahn, A., Neumaier, M., Kirner, O., and Braesicke, P.: An assessment of the climatological representativeness of IAGOS-CARIBIC trace gas measurements using EMAC model simulations, Atmos. Chem. Phys., 17, 2775–2794, https://doi.org/10.5194/acp-17-2775-2017, 2017.
Feng, L., Zhang, R.-H., Wang, Z., and Chen, X.: Processes leading to second-year cooling of the 2010–12 La Niña event, diagnosed using GODAS, Adv. Atmos. Sci., 32, 424–438, https://doi.org/10.1007/s00376-014-4012-8, 2015.
Gao, M., Gao, J., Zhu, B., Kumar, R., Lu, X., Song, S., Zhang, Y., Jia, B., Wang, P., Beig, G., Hu, J., Ying, Q., Zhang, H., Sherman, P., and McElroy, M. B.: Ozone pollution over China and India: seasonality and sources, Atmos. Chem. Phys., 20, 4399–4414, https://doi.org/10.5194/acp-20-4399-2020, 2020.
Granier, C., Bessagnet, B., Bond, T. C., D'Angiola, A., Denier van der Gon, H. A. C., Frost, G. J., Heil, A., Kaiser, J. W., Kinne, S., Klimont, Z., Kloster, S., Lamarque, J. F., Liousse, C., Masui, T., Meleux, F., Mieville, A., Ohara, T., Raut, J.-C., Riahi, K., Schultz, M. G., Smith, S. J., Thompson, A., v. Aardenne, J. A., Werf, G. R., and v. Vuuren, D.: Evolution of anthropogenic and biomass burning emissions of air pollutants at global and regional scales during the 1980–2010 period, Climatic Change, 109, 163–190, https://doi.org/10.1007/s10584-011-0154-1, 2011.
Grewe, V.: The origin of ozone, Atmos. Chem. Phys., 6, 1495–1511, https://doi.org/10.5194/acp-6-1495-2006, 2006.
Guerova, G., Bey, I., Attié, J. L., Martin, R. V., Cui, J., and Sprenger, M.: Impact of transatlantic transport episodes on summertime ozone in Europe, Atmos. Chem. Phys., 6, 2057–2072, https://doi.org/10.5194/acp-6-2057-2006, 2006.
Han, Z., Chongping, J., Libo, Z., Wei, W., and Yongxiao, J.: ENSO signal in total ozone over Tibet, Adv. Atmos. Sci., 18, 231–238, https://doi.org/10.1007/s00376-001-0016-2, 2001.
Hayashida, S., Kajino, M., Deushi, M., Sekiyama, T. T., and Liu, X.: Seasonality of the lower tropospheric ozone over China observed by the Ozone Monitoring Instrument, Atmos. Environ., 184, 244–253, https://doi.org/10.1016/j.atmosenv.2018.04.014, 2018.
Holton, J. R., Haynes, P. H., McIntyre, M. E., Douglass, A. R., Rood, R. B., and Pfister, L.: Stratosphere-troposphere exchange, Rev. Geophys., 33, 403–439, https://doi.org/10.1029/95RG02097, 1995.
Hough, A. M. and Derwent, R. G.: Changes in the global concentration of tropospheric ozone due to human activities, Nature, 344, 645-648, https://doi.org/10.1038/344645a0, 1990.
Jacob, D. J., Logan, J. A., and Murti, P. P.: Effect of rising Asian emissions on surface ozone in the United States, Geophys. Res. Lett., 26, 2175–2178, https://doi.org/10.1029/1999GL900450, 1999.
James, P., Stohl, A., Forster, C., Eckhardt, S., Seibert, P., and Frank, A.: A 15-year climatology of stratosphere-troposphere exchange with a Lagrangian particle dispersion model: 1. Methodology and validation, J. Geophys. Res.-Atmos., 108, 8519, https://doi.org/10.1029/2002JD002637, 2003.
Jöckel, P., Sander, R., Kerkweg, A., Tost, H., and J., L.: Technical Note: The Modular Earth Submodel System (MESSy) – a new approach towards Earth System Modeling, Atmos. Chem. Phys., 5, 433–444, https://doi.org/10.5194/acp-5-433-2005, 2005.
Jöckel, P., Tost, H., Pozzer, A., Brühl, C., Buchholz, J., Ganzeveld, L., Hoor, P., Kerkweg, A., Lawrence, M. G., Sander, R., Steil, B., Stiller, G., Tanarhte, M., Taraborrelli, D., van Aardenne, J., and Lelieveld, J.: The atmospheric chemistry general circulation model ECHAM5/MESSy1: consistent simulation of ozone from the surface to the mesosphere, Atmos. Chem. Phys., 6, 5067–5104, https://doi.org/10.5194/acp-6-5067-2006, 2006.
Jöckel, P., Kerkweg, A., Pozzer, A., Sander, R., Tost, H., Riede, H., Baumgaertner, A., Gromov, S., and Kern, B.: Development cycle 2 of the Modular Earth Submodel System (MESSy2), Geosci. Model Dev., 3, 717–752, https://doi.org/10.5194/gmd-3-717-2010, 2010.
Jöckel, P., Tost, H., Pozzer, A., Kunze, M., Kirner, O., Brenninkmeijer, C. A. M., Brinkop, S., Cai, D. S., Dyroff, C., Eckstein, J., Frank, F., Garny, H., Gottschaldt, K.-D., Graf, P., Grewe, V., Kerkweg, A., Kern, B., Matthes, S., Mertens, M., Meul, S., Neumaier, M., Nützel, M., Oberländer-Hayn, S., Ruhnke, R., Runde, T., Sander, R., Scharffe, D., and Zahn, A.: Earth System Chemistry integrated Modelling (ESCiMo) with the Modular Earth Submodel System (MESSy) version 2.51, Geosci. Model Dev., 9, 1153–1200, https://doi.org/10.5194/gmd-9-1153-2016, 2016.
Kim, J. H. and Lee, H.: What causes the springtime tropospheric ozone maximum over Northeast Asia?, Adv. Atmos. Sci., 27, 543–551, https://doi.org/10.1007/s00376-009-9098-z, 2010.
Kluge, F., Hüneke, T., Lerot, C., Rosanka, S., Rotermund, M. K., Taraborrelli, D., Weyland, B., and Pfeilsticker, K.: Airborne glyoxal measurements in the marine and continental atmosphere: comparison with TROPOMI observations and EMAC simulations, Atmos. Chem. Phys., 23, 1369–1401, https://doi.org/10.5194/acp-23-1369-2023, 2023.
Lalitaporn, P.: Long-Term Assessment of Carbon Monoxide Using MOPITT Satellite and Surface Data over Thailan., Eng. Appl. Sci. Res., 45, 132–139, https://doi.org/10.14456/EASR.2018.17, 2018.
Lalitaporn, P. and Boonmee, T.: Analysis of Tropospheric Nitrogen Dioxide Using Satellite and Ground Based Data over Northern Thailand, Eng. J., 23, 19–35, https://doi.org/10.4186/ej.2019.23.6.19, 2019.
Lee, H. N., Tositti, L., Zheng, X., and Bonasoni, P.: Analyses and comparisons of variations of 7Be, 210Pb, and 7Be/210Pb with ozone observations at two Global Atmosphere Watch stations from high mountains, J. Geophys. Res.-Atmos., 112, 1–11, https://doi.org/10.1029/2006JD007421, 2007.
Lefohn, A. S., Malley, C. S., Smith, L., Wells, B., Hazucha, M., Simon, H., Naik, V., Mills, G., Schultz, M. G., Paoletti, E., De Marco, A., Xu, X., Zhang, L., Wang, T., Neufeld, H. S., Musselman, R. C., Tarasick, D., Brauer, M., Feng, Z., Tang, H., Kobayashi, K., Sicard, P., Solberg, S., and Gerosa, G.: Tropospheric ozone assessment report: Global ozone metrics for climate change, human health, and crop/ecosystem research, Elem. Sci. Anth., 6, 28, https://doi.org/10.1525/elementa.279, 2018.
Lelieveld, J. and Dentener, F. J.: What controls tropospheric ozone?, J. Geophys. Res.-Atmos., 105, 3531–3551, https://doi.org/10.1029/1999JD901011, 2000.
Lelieveld, J., Gromov, S., Pozzer, A., and Taraborrelli, D.: Global tropospheric hydroxyl distribution, budget and reactivity, Atmos. Chem. Phys., 16, 12477–12493, https://doi.org/10.5194/acp-16-12477-2016, 2016.
Levy, H.: Normal Atmosphere – Large Radical and Formaldehyde Concentrations Predicted, Science, 173, 141–143, https://doi.org/10.1126/science.173.3992.141, 1971.
Li, J., Wang, Z., Akimoto, H., Tang, J., and Uno, I.: Modeling of the impacts of China's anthropogenic pollutants on the surface ozone summer maximum on the northern Tibetan Plateau, Geophys. Res. Lett., 36, https://doi.org/10.1029/2009GL041123, 2009.
Li, K., Tan, R., Qiao, W., Lee, T., Wang, Y., Zhang, D., Tang, M., Zhao, W., Gu, Y., Fan, S., Zhang, J., Lyu, X., Xue, L., Xu, J., Ma, Z., Latif, M. T., Amnuaylojaroen, T., Gil, J., Lee, M. H., Bak, J., Kim, J., Liao, H., Kanaya, Y., Lu, X., Nagashima, T., and Koo, J. H.: Surface and tropospheric ozone over East Asia and Southeast Asia from observations: distributions, trends, and variability, Atmos. Chem. Phys., 25, 11575–11596, https://doi.org/10.5194/acp-25-11575-2025, 2025.
Li, M., Yang, Y., Wang, H., Li, H., Wang, P., and Liao, H.: Summertime ozone pollution in China affected by stratospheric quasi-biennial oscillation, Atmos. Chem. Phys., 23, 1533–1544, https://doi.org/10.5194/acp-23-1533-2023, 2023.
Li, X., Liu, J., Mauzerall, D. L., Emmons, L. K., Walters, S., Horowitz, L. W., and Tao, S.: Effects of trans-Eurasian transport of air pollutants on surface ozone concentrations over Western China, J. Geophys. Res.-Atmos., 119, 12338–12354, https://doi.org/10.1002/2014JD021936, 2014.
Li, Y., Feng, W., Zhou, X., Li, Y., and Chipperfield, M. P.: The impact of El Niño–Southern Oscillation on the total column ozone over the Tibetan Plateau, Atmos. Chem. Phys., 24, 8277–8293, https://doi.org/10.5194/acp-24-8277-2024, 2024.
Liang, M.-C., Tang, J., Chan, C.-Y., Zheng, X. D., and Yung, Y. L.: Signature of stratospheric air at the Tibetan Plateau, Geophys. Res. Lett., 35, L20816, https://doi.org/10.1029/2008GL035246, 2008.
Lin, M., Zhang, Z., Su, L., Hill-Falkenthal, J., Priyadarshi, A., Zhang, Q., Zhang, G., Kang, S., Chan, C.-Y., and Thiemens, M. H.: Resolving the impact of stratosphere-to-troposphere transport on the sulfur cycle and surface ozone over the Tibetan Plateau using a cosmogenic 35S tracer, J. Geophys. Res.-Atmos., 121, 439–456, https://doi.org/10.1002/2015JD023801, 2016.
Lin, W., Xu, X., Zheng, X., Dawa, J., Baima, C., and Ma, J.: Two-year measurements of surface ozone at Dangxiong, a remote highland site in the Tibetan Plateau, J. Environ. Sci., 31, 133–145, https://doi.org/10.1016/j.jes.2014.10.022, 2015.
Liu, N., Ma, J., Xu, W., Wang, Y., Pozzer, A., and Lelieveld, J.: A modeling study of the regional representativeness of surface ozone variation at the WMO/GAW background stations in China, Atmos. Environ., 242, 117672, https://doi.org/10.1016/j.atmosenv.2020.117672, 2020.
Lu, X., Zhang, L., Liu, X., Gao, M., Zhao, Y., and Shao, J.: Lower tropospheric ozone over India and its linkage to the South Asian monsoon, Atmos. Chem. Phys., 18, 3101–3118, https://doi.org/10.5194/acp-18-3101-2018, 2018.
Luo, J., Liang, W., Xu, P., Xue, H., Zhang, M., Shang, L., and Tian, H.: Seasonal Features and a Case Study of Tropopause Folds over the Tibetan Plateau, Adv. Meteorol., 2019, 4375123, https://doi.org/10.1155/2019/4375123, 2019.
Ma, J., Liu, H., and Hauglustaine, D.: Summertime tropospheric ozone over China simulated with a regional chemical transport model 1. Model description and evaluation, J. Geophys. Res.-Atmos., 107, ACH 27-1–ACH 27-13, https://doi.org/10.1029/2001JD001354, 2002a.
Ma, J., Tang, J., Zhou, X., and Zhang, X.: Estimates of the Chemical Budget for Ozone at Waliguan Observatory, J. Atmos. Chem., 41, 21–48, https://doi.org/10.1023/A:1013892308983, 2002b.
Ma, J., Zhou, X., and Hauglustaine, D.: Summertime tropospheric ozone over China simulated with a regional chemical transport model 2. Source contributions and budget, J. Geophys. Res.-Atmos., 107, ACH 2-1–ACH 2-11, https://doi.org/10.1029/2001JD001354, 2002c.
Ma, J., Zheng, X., and Xu, X.: Comment on “Why does surface ozone peak in summertime at Waliguan?” by Bin Zhu et al, Geophys. Res. Lett., 32, L01805, https://doi.org/10.1029/2004GL021683, 2005.
Ma, J., Lin, W. L., Zheng, X. D., Xu, X. B., Li, Z., and Yang, L. L.: Influence of air mass downward transport on the variability of surface ozone at Xianggelila Regional Atmosphere Background Station, southwest China, Atmos. Chem. Phys., 14, 5311–5325, https://doi.org/10.5194/acp-14-5311-2014, 2014.
Ma, J., Brühl, C., He, Q., Steil, B., Karydis, V. A., Klingmüller, K., Tost, H., Chen, B., Jin, Y., Liu, N., Xu, X., Yan, P., Zhou, X., Abdelrahman, K., Pozzer, A., and Lelieveld, J.: Modeling the aerosol chemical composition of the tropopause over the Tibetan Plateau during the Asian summer monsoon, Atmos. Chem. Phys., 19, 11587–11612, https://doi.org/10.5194/acp-19-11587-2019, 2019.
Ma, J., Zhou, X., Xu, X., Xu, X., Gromov, S., and Lelieveld, J.: Chapter 15 – Ozone and aerosols over the Tibetan Plateau, in: Asian Atmospheric Pollution, edited by: Singh, R. P., Elsevier, 287–302, https://doi.org/10.1016/B978-0-12-816693-2.00008-1, 2022.
Marinoni, A., Cristofanelli, P., Laj, P., Duchi, R., Putero, D., Calzolari, F., Landi, T. C., Vuillermoz, E., Maione, M., and Bonasoni, P.: High black carbon and ozone concentrations during pollution transport in the Himalayas: Five years of continuous observations at NCO-P global GAW station, J. Environ. Sci., 25, 1618–1625, https://doi.org/10.1016/S1001-0742(12)60242-3, 2013.
Monks, P. S., Archibald, A. T., Colette, A., Cooper, O., Coyle, M., Derwent, R., Fowler, D., Granier, C., Law, K. S., Mills, G. E., Stevenson, D. S., Tarasova, O., Thouret, V., Schneidemesser, E. v., Sommariva, R., Wild, O., and Williams, M. L.: Tropospheric ozone and its precursors from the urban to the global scale from air quality to short-lived climate forcer, Atmos. Chem. Phys., 15, 8889–8973, https://doi.org/10.5194/acp-15-8889-2015, 2015.
Myhre, G., Shindell, D., Bréon, F.-M., Collins, W., Fuglestvedt, J., Huang, J., Koch, D., Lamarque, J.-F., Lee, D., Mendoza, B., Nakajima, T., Robock, A., Stephens, G., Takemura, T., and Zhang, H.: Anthropogenic and Natural Radiative Forcing, in: Climate Change 2013: The Physical Science Basis, Contribution of Working Group I to the Fifth Assessment Report of the Intergovernmental Panel on Climate Change, Cambridge University Press, Cambridge, UK and New York, NY, USA, 659–740, https://doi.org/10.1017/CBO9781107415324.018, 2013.
Ni, Z.-Z., Luo, K., Gao, X., Gao, Y., Fan, J.-R., Fu, J. S., and Chen, C.-H.: Exploring the stratospheric source of ozone pollution over China during the 2016 Group of Twenty summit, Atmos. Pollut. Res., 10, 1267–1275, https://doi.org/10.1016/j.apr.2019.02.010, 2019.
Oltmans, S. J., Hofmann, D. J., Lathrop, J. A., Harris, J. M., Komhyr, W. D., and Kuniyuki, D.: Tropospheric ozone during Mauna Loa Observatory Photochemistry Experiment 2 compared to long-term measurements from surface and ozonesonde observations, J. Geophys. Res.-Atmos., 101, 14569–14580, https://doi.org/10.1029/95JD03004, 1996.
Pozzer, A., Jöckel, P., and Van Aardenne, J.: The influence of the vertical distribution of emissions on tropospheric chemistry, Atmos. Chem. Phys., 9, 9417–9432, https://doi.org/10.5194/acp-9-9417-2009, 2009.
Pozzer, A., de Meij, A., Yoon, J., Tost, H., Georgoulias, A. K., and Astitha, M.: AOD trends during 2001–2010 from observations and model simulations, Atmos. Chem. Phys., 15, 5521–5535, https://doi.org/10.5194/acp-15-5521-2015, 2015.
Putero, D., Landi, T. C., Cristofanelli, P., Marinoni, A., Laj, P., Duchi, R., Calzolari, F., Verza, G. P., and Bonasoni, P.: Influence of open vegetation fires on black carbon and ozone variability in the southern Himalayas (NCO-P, 5079 m a.s.l.), Environ. Pollut., 184, 597–604, https://doi.org/10.1016/j.envpol.2013.09.035, 2014.
Ramanathan, V., Callis, L., Cess, R., Hansen, J., Isaksen, I., Kuhn, W., Lacis, A., Luther, F., Mahlman, J., Reck, R., and Schlesinger, M.: Climate-chemical interactions and effects of changing atmospheric trace gases, Rev. Geophys., 25, 1441–1482, https://doi.org/10.1029/RG025i007p01441, 1987.
Ran, L., Lin, W. L., Deji, Y. Z., La, B., Tsering, P. M., Xu, X. B., and Wang, W.: Surface gas pollutants in Lhasa, a highland city of Tibet – current levels and pollution implications, Atmos. Chem. Phys., 14, 10721–10730, https://doi.org/10.5194/acp-14-10721-2014, 2014.
Roelofs, G.-J. and Lelieveld, J.: Model study of the influence of cross-tropopause O3 transports on tropospheric O3 levels, Tellus B, 49, 38–55, https://doi.org/10.3402/tellusb.v49i1.15949, 1997.
Schiemann, R., Lüthi, D., and Schär, C.: Seasonality and Interannual Variability of the Westerly Jet in the Tibetan Plateau Region, J. Climate, 22, 2940-2957, https://doi.org/10.1175/2008JCLI2625.1, 2009.
Shindell, D., Kuylenstierna, J. C. I., Vignati, E., van Dingenen, R., Amann, M., Klimont, Z., Anenberg, S. C., Muller, N., Janssens-Maenhout, G., Raes, F., Schwartz, J., Faluvegi, G., Pozzoli, L., Kupiainen, K., Höglund-Isaksson, L., Emberson, L., Streets, D., Ramanathan, V., Hicks, K., Oanh, N. T. K., Milly, G., Williams, M., Demkine, V., and Fowler, D.: Simultaneously Mitigating Near-Term Climate Change and Improving Human Health and Food Security, Science, 335, 183–189, https://doi.org/10.1126/science.1210026, 2012.
Škerlak, B., Sprenger, M., and Wernli, H.: A global climatology of stratosphere–troposphere exchange using the ERA-Interim data set from 1979 to 2011, Atmos. Chem. Phys., 14, 913–937, https://doi.org/10.5194/acp-14-913-2014, 2014.
Škerlak, B., Sprenger, M., Pfahl, S., Tyrlis, E., and Wernli, H.: Tropopause folds in ERA-Interim: Global climatology and relation to extreme weather events, J. Geophys. Res.-Atmos., 120, 4860–4877, https://doi.org/10.1002/2014JD022787, 2015.
Stohl, A., Bonasoni, P., Cristofanelli, P., Collins, W., Feichter, J., Frank, A., Forster, C., Gerasopoulos, E., Gäggeler, H., James, P., Kentarchos, T., Kromp-Kolb, H., Krüger, B., Land, C., Meloen, J., Papayannis, A., Priller, A., Seibert, P., Sprenger, M., Roelofs, G. J., Scheel, H. E., Schnabel, C., Siegmund, P., Tobler, L., Trickl, T., Wernli, H., Wirth, V., Zanis, P., and Zerefos, C.: Stratosphere-troposphere exchange: A review, and what we have learned from STACCATO, J. Geophys. Res.-Atmos., 108, https://doi.org/10.1029/2002JD002490, 2003.
Sukkhum, S., Lim, A., Ingviya, T., and Saelim, R.: Seasonal Patterns and Trends of Air Pollution in the Upper Northern Thailand from 2004 to 2018, Aerosol Air Qual. Res., 22, 210318, https://doi.org/10.4209/aaqr.210318, 2022.
Tang, Q., Prather, M. J., and Hsu, J.: Stratosphere-troposphere exchange ozone flux related to deep convection, Geophys. Res. Lett., 38, L03806, https://doi.org/10.1029/2010GL046039, 2011.
Tarasick, D., Galbally, I. E., Cooper, O. R., Schultz, M. G., Ancellet, G., Leblanc, T., Wallington, T. J., Ziemke, J., Liu, X., Steinbacher, M., Staehelin, J., Vigouroux, C., Hannigan, J. W., García, O., Foret, G., Zanis, P., Weatherhead, E., Petropavlovskikh, I., Worden, H., Osman, M., Liu, J., Chang, K.-L., Gaudel, A., Lin, M., Granados-Muñoz, M., Thompson, A. M., Oltmans, S. J., Cuesta, J., Dufour, G., Thouret, V., Hassler, B., Trickl, T., and Neu, J. L.: Tropospheric Ozone Assessment Report: Tropospheric ozone from 1877 to 2016, observed levels, trends and uncertainties, Elem. Sci. Anth., 7, 39, https://doi.org/10.1525/elementa.376, 2019.
Vingarzan, R.: A review of surface ozone background levels and trends, Atmos. Environ., 38, 3431–3442, https://doi.org/10.1016/j.atmosenv.2004.03.030, 2004.
Wang, X., Fu, T.-M., Zhang, L., Lu, X., Liu, X., Amnuaylojaroen, T., Latif, M. T., Ma, Y., Zhang, L., Feng, X., Zhu, L., Shen, H., and Yang, X.: Rapidly Changing Emissions Drove Substantial Surface and Tropospheric Ozone Increases Over Southeast Asia, Geophys. Res. Lett., 49, e2022GL100223, https://doi.org/10.1029/2022GL100223, 2022.
Weinstock, B. and Niki, H.: Carbon-Monoxide Balance in Nature, Science, 176, 290–292, https://doi.org/10.1126/science.176.4032.290, 1972.
Xu, W., Lin, W., Xu, X., Tang, J., Huang, J., Wu, H., and Zhang, X.: Long-term trends of surface ozone and its influencing factors at the Mt Waliguan GAW station, China – Part 1: Overall trends and characteristics, Atmos. Chem. Phys., 16, 6191–6205, https://doi.org/10.5194/acp-16-6191-2016, 2016.
Xu, W., Xu, X., Lin, M., Lin, W., Tarasick, D., Tang, J., Ma, J., and Zheng, X.: Long-term trends of surface ozone and its influencing factors at the Mt Waliguan GAW station, China – Part 2: The roles of anthropogenic emissions and climate variability, Atmos. Chem. Phys., 18, 773–798, https://doi.org/10.5194/acp-18-773-2018, 2018a.
Xu, W., Bian, Y., Lin, W., Zhang, Y., Wang, Y., Ma, Z., Zhang, X., Zhang, G., Ye, C., and Xu, X.: O3 and PAN in southern Tibetan Plateau determined by distinct physical and chemical processes, Atmos. Chem. Phys., 23, 7635–7652, https://doi.org/10.5194/acp-23-7635-2023, 2023.
Xu, X., Zhang, H., Lin, W., Wang, Y., Xu, W., and Jia, S.: First simultaneous measurements of peroxyacetyl nitrate (PAN) and ozone at Nam Co in the central Tibetan Plateau: impacts from the PBL evolution and transport processes, Atmos. Chem. Phys., 18, 5199–5217, https://doi.org/10.5194/acp-18-5199-2018, 2018b.
Xue, L., Ding, A., Cooper, O., Huang, X., Wang, W., Zhou, D., Wu, Z., McClure-Begley, A., Petropavlovskikh, I., Andreae, M. O., and Fu, C.: ENSO and Southeast Asian biomass burning modulate subtropical trans-Pacific ozone transport, Natl. Sci. Rev, 8, https://doi.org/10.1093/nsr/nwaa132, 2020.
Xue, L. K., Wang, T., Zhang, J. M., Zhang, X. C., Deliger, Poon, C. N., Ding, A. J., Zhou, X. H., Wu, W. S., Tang, J., Zhang, Q. Z., and Wang, W. X.: Source of surface ozone and reactive nitrogen speciation at Mount Waliguan in western China: New insights from the 2006 summer study, J. Geophys. Res.-Atmos., 116, https://doi.org/10.1029/2010JD014735, 2011.
Yang, J., Kang, S., Hu, Y., Chen, X., and Rai, M.: Influence of South Asian Biomass Burning on Ozone and Aerosol Concentrations Over the Tibetan Plateau, Adv. Atmos. Sci., 39, 1184–1197, https://doi.org/10.1007/s00376-022-1197-0, 2022.
Ye, X., Zhang, L., Wang, X., Lu, X., Jiang, Z., Lu, N., Li, D., and Xu, J.: Spatial and temporal variations of surface background ozone in China analyzed with the grid-stretching capability of GEOS-Chem High Performance, Sci. Total Environ., 914, 169909, https://doi.org/10.1016/j.scitotenv.2024.169909, 2024.
Yin, X., Kang, S., de Foy, B., Cong, Z., Luo, J., Zhang, L., Ma, Y., Zhang, G., Rupakheti, D., and Zhang, Q.: Surface ozone at Nam Co in the inland Tibetan Plateau: variation, synthesis comparison and regional representativeness, Atmos. Chem. Phys., 17, 11293–11311, https://doi.org/10.5194/acp-17-11293-2017, 2017.
Yin, X., Rupakheti, D., Zhang, G., Luo, J., Kang, S., de Foy, B., Yang, J., Ji, Z., Cong, Z., Rupakheti, M., Li, P., Hu, Y., and Zhang, Q.: Surface ozone over the Tibetan Plateau controlled by stratospheric intrusion, Atmos. Chem. Phys., 23, 10137–10143, https://doi.org/10.5194/acp-23-10137-2023, 2023.
Yoshitomi, M., Wild, O., and Akimoto, H.: Contributions of regional and intercontinental transport to surface ozone in the Tokyo area, Atmos. Chem. Phys., 11, 7583–7599, https://doi.org/10.5194/acp-11-7583-2011, 2011.
Young, P. J., Naik, V., Fiore, A. M., Gaudel, A., Guo, J., Lin, M. Y., Neu, J. L., Parrish, D. D., Rieder, H. E., Schnell, J. L., Tilmes, S., Wild, O., Zhang, L., Ziemke, J. R., Brandt, J., Delcloo, A., Doherty, R. M., Geels, C., Hegglin, M. I., Hu, L., Im, U., Kumar, R., Luhar, A., Murray, L., Plummer, D., Rodriguez, J., Saiz-Lopez, A., Schultz, M. G., Woodhouse, M. T., and Zeng, G.: Tropospheric Ozone Assessment Report: Assessment of global-scale model performance for global and regional ozone distributions, variability, and trends, Elem. Sci. Anth., 6, 10, https://doi.org/10.1525/elementa.265, 2018.
Zhao, K., Hu, C., Yuan, Z., Xu, D., Zhang, S., Luo, H., Wang, J., and Jiang, R.: A modeling study of the impact of stratospheric intrusion on ozone enhancement in the lower troposphere over the Hong Kong regions, China, Atmos. Res., 247, 105158, https://doi.org/10.1016/j.atmosres.2020.105158, 2021a.
Zhao, K., Huang, J., Wu, Y., Yuan, Z., Wang, Y., Li, Y., Ma, X., Liu, X., Ma, W., Wang, Y., and Zhang, X.: Impact of Stratospheric Intrusions on Ozone Enhancement in the Lower Troposphere and Implication to Air Quality in Hong Kong and Other South China Regions, J. Geophys. Res.-Atmos., 126, e2020JD033955, https://doi.org/10.1029/2020JD033955, 2021b.
Zheng, X., Shen, C., Wan, G., Liu, K., Tang, J., and Xu, X.: 10Be/7Be implies the contribution of stratosphere-troposphere transport to the winter-spring surface O3 variation observed on the Tibetan Plateau, Chin. Sci. Bull., 56, 84–88, https://doi.org/10.1007/s11434-010-4211-3, 2011.
Zhu, B., Akimoto, H., Wang, Z., Sudo, K., Tang, J., and Uno, I.: Why does surface ozone peak in summertime at Waliguan?, Geophys. Res. Lett., 31, https://doi.org/10.1029/2004GL020609, 2004.
- Abstract
- Introduction
- Observational stations and model description
- Comparison between the model simulations and site observations
- Source attribution of surface ozone at NMC and PYR
- Surface ozone sources and variability at a larger spatial scale
- Conclusions
- Data availability
- Author contributions
- Competing interests
- Disclaimer
- Special issue statement
- Acknowledgements
- Financial support
- Review statement
- References
- Supplement
- Abstract
- Introduction
- Observational stations and model description
- Comparison between the model simulations and site observations
- Source attribution of surface ozone at NMC and PYR
- Surface ozone sources and variability at a larger spatial scale
- Conclusions
- Data availability
- Author contributions
- Competing interests
- Disclaimer
- Special issue statement
- Acknowledgements
- Financial support
- Review statement
- References
- Supplement