
the Creative Commons Attribution 4.0 License.
the Creative Commons Attribution 4.0 License.
O3–NOx–VOCs sensitivity in major Chinese regions: detailed insights from GEMS satellite hourly observations
Cheng Huang
Junjie Wang
Yinbao Jin
Qi Fan
Jhoon Kim
Ozone (O3) pollution remains a critical issue facing China. Between 2020 and 2024, the proportion of cities exceeding national standards stood at 22.5 % and 24 % respectively, representing an annual increase of 4.8 %. O3–NOx–VOCs sensitivity analysis is central to ozone pollution control. Satellite observations from the OMI and TROPOMI provide daily HCHO and NO2 data but cannot capture hourly ozone variability. In this study, we use hourly observations from the Geostationary Environment Monitoring Spectrometer (GEMS), in combination with locally estimated scatterplot smoothing (LOESS), to investigate the diurnal evolution of ozone formation sensitivity over China during the warm season (April–September) from 2021 to 2023. The results show a strong correlation between the HCHO NO2 ratio and ozone concentrations (R2 > 0.78), highlighting the complex nonlinear interactions within the O3–NOx–VOCs chemical system. At the urban agglomeration scale, ozone formation shifts to NOx-limited or transitional regimes in the Beijing–Tianjin–Hebei (BTH), Yangtze River Delta (YRD), and Sichuan–Chongqing (SC) regions in the afternoon, while it shifts to NOx-limited in Pearl River Delta (PRD). Further inter-city comparisons reveal distinct controlling mechanisms. Beijing remains VOC-limited in the morning due to high NOx emissions combined with strong solar radiation. Nanjing exhibits a persistently complex transitional regime. Chengdu maintains a predominantly VOC-limited regime throughout the day. In contrast, Guangzhou, characterized by active VOC emissions, shows a greater tendency to shift toward a NOx-limited regime. This study provides the first regional-scale characterization of diurnal ozone formation sensitivity, supporting time-resolved and region-specific emission control strategies.
- Article
(12951 KB) - Full-text XML
-
Supplement
(997 KB) - BibTeX
- EndNote
Ozone (O3), as an important secondary pollutant in the troposphere, influences the climate system through radiative forcing (Akimoto, 2003) and exerts profound impacts on regional air quality, public health, and ecosystems by regulating atmospheric oxidation capacity (Feng et al., 2022). Therefore, a comprehensive understanding of ozone formation mechanisms is essential for interpreting regional air quality evolution. In recent years, ozone pollution in China has shown a persistent increasing trend (Chen et al., 2025; Li and Li, 2024), continuously promoting advances in the understanding of ozone formation mechanisms. Recent studies further suggest that oxygenated volatile organic compounds (OVOCs), such as formaldehyde (HCHO) and glyoxal, are not only important products of VOC photochemical oxidation, but also play critical roles in sustaining hydroperoxy (HO2) and organic peroxy (RO2) radical cycling and continuously enhancing ozone production. For example, HCHO photolysis may contribute approximately 70.1 % of the HO2 source (Yao et al., 2025), while daytime peak concentrations of HO2 and RO2 typically reach 108–109 molec cm−3 and are strongly correlated with odd oxygen (Ox) production rates (Bottorff et al., 2023). In addition, carbonyl compounds can contribute up to 48.3 % of the ozone formation potential (OFP), substantially exceeding the contributions from aromatics (20.2 %) and alkenes (17.0 %) (Yao et al., 2025). In addition, aerosol–photochemistry interactions are increasingly recognized as an important “third dimension” influencing ozone formation mechanisms. As PM2.5 concentrations continue to decline, the enhanced solar radiation resulting from weakened aerosol extinction, together with changes in HO2 heterogeneous uptake and nitrous acid (HONO) formation processes, may further enhance regional atmospheric oxidation capacity and reshape ozone formation sensitivity regimes (Dyson et al., 2023; Zhang et al., 2025; Li et al., 2026). Against this background, some regions in eastern China may be gradually transitioning from traditional “emission-driven” ozone pollution toward a new stage dominated by a “persistent oxidation atmosphere”, characterized by sustained radical recycling, an extended ozone production window, and enhanced nighttime oxidation capacity. Meanwhile, recent studies have further proposed an “urban–forest–urban (UFU plume)” cascading ozone enhancement mechanism, suggesting that anthropogenic pollutants transported from urban areas into forested regions can further enhance downwind ozone production (35 %–105 %), while ozone production may further increase by approximately 10 % for every 1 °C increase in temperature (Li et al., 2025). This mechanism further extends earlier findings from Europe and North America that coupling between biogenic volatile organic compounds (BVOCs) and anthropogenic pollutants can enhance regional ozone formation (Trainer et al., 1987). In contrast, the fundamental photochemical processes governing the diurnal variations of ozone precursors remain relatively well established, with HCHO concentrations generally increasing with enhanced temperature and solar radiation due to VOC photochemical oxidation (Wu et al., 2023), whereas nitrogen dioxide (NO2) concentrations decrease as a result of photochemical loss and boundary layer dilution (Xie et al., 2016).
From the perspective of mechanistic classification, ozone formation is generally categorized into NOx-limited, VOC-limited, and transitional regimes (Sillman and He, 2002). To quantitatively characterize the response of ozone formation to its precursors, the HCHO-to-NO2 column ratio (HCHO NO2, FNR) has been widely used to diagnose ozone formation sensitivity and has played an important role in revealing regional differences and guiding pollution control strategies (Sillman, 1999; Martin et al., 2004; Duncan et al., 2010). At present, FNR values are mainly derived from three types of data sources: instantaneous overpass observations from polar-orbiting satellites, chemical transport model simulations, or ground-based monitoring measurements. Numerous studies have employed FNR values calculated from these datasets to investigate their correspondence with ozone formation sensitivity, where higher FNR values generally indicate a NOx-limited regime, whereas lower FNR values suggest a VOC-limited regime (Souri et al., 2020; Acdan et al., 2023). For example, in East Asia, Itahashi et al. (2022) reported an overall increasing trend in FNR values over Japan and South Korea based on Ozone Monitoring Instrument (OMI) satellite observations. In South Asia, Mahajan et al. (2015) compared observations from four different satellite instruments and found relatively high FNR values over India, implying that ozone formation is more likely to be NOx-limited, while urban and industrialized regions exhibit distinct sensitivity characteristics. Jin et al. (2017) combined satellite observations with chemical transport modeling to reveal pronounced regional-scale differences in ozone formation sensitivity across major urban agglomerations in North America. For typical urban agglomerations in China, Xu et al. (2025), based on OMI satellite observations, found that ozone formation in the Sichuan–Chongqing (SC) region during summer was predominantly characterized by a transitional regime, accounting for approximately 42.42 % of the total area. Pan (2023) further demonstrated that the northern Yangtze River Delta (YRD) has long been dominated by the transitional regime, with an areal fraction remaining stable at around 50.0 %, substantially higher than those of the VOC-limited and NOx-limited regimes. Similarly, Liang et al. (2024), combined with grey relational analysis, reported that in 2020 the Pearl River Delta (PRD) exhibited areal fractions of 1.6 %, 42.4 %, and 56.0 % for the VOC-limited, transitional, and NOx-limited regimes, respectively. Overall, these studies indicate that urban areas are more commonly characterized by VOC-limited or transitional regimes, whereas rural and background regions tend to be NOx-limited, and that major urban agglomerations worldwide exhibit broadly similar spatial differentiation patterns in ozone formation sensitivity.
In addition to spatial heterogeneity, ozone formation sensitivity also exhibits pronounced temporal variability. Changes in meteorological conditions, surface characteristics, and anthropogenic emissions jointly drive transitions in ozone sensitivity across different time scales (Camalier et al., 2007; Fiore et al., 2002). On the interannual scale, the implementation of emission control policies has led to transitions in ozone sensitivity from VOC-limited regimes toward transitional or NOx-limited regimes in many regions of China (Jacob, 2000; Monks et al., 2015). Meanwhile, NO2 emissions in North America, Europe, and megacities in the Global South (e.g., Jakarta and São Paulo) have also shown significant declining trends, which may further expand the spatial extent of NOx-limited regimes (Jairo et al., 2024). At seasonal and monthly scales, ozone sensitivity also shows systematic variations; for example, under high-temperature and strong-radiation conditions in summer, NOx-limited or transitional regimes are more prevalent, whereas VOC-limited regimes tend to dominate in spring, autumn, and winter (Tang et al., 2012; Martin et al., 2004). Furthermore, studies based on observations and chemical transport modeling indicate that ozone sensitivity exhibits more complex behavior at the monthly scale, characterized by pronounced interconversions among different regimes. For example, a study focusing on ozone in Mexico reported that NOx-limited regimes still dominated in March, whereas northwestern Mexico transitioned into a transitional regime in April and evolved into a fully NOx-limited regime across the entire region by July (Ju et al., 2025). Similarly, Wu et al. (2018), through analyses of ozone formation mechanisms in the Beijing–Tianjin–Hebei (BTH) region, found that areas dominated by NOx-limited regimes from June to August gradually shifted toward transitional regimes in September, with some transitional regions further evolving into VOC-limited regimes. Likewise, Li (2021), based on numerical simulations and FNR threshold analyses, reported that most areas of the PRD were characterized by NOx-limited regimes in July, whereas by October, western Shenzhen, Nansha District of Guangzhou, and southeastern Foshan had transitioned into VOC-limited regimes, with some areas further evolving into transitional regimes. These studies provide important support for a deeper understanding of ozone formation mechanisms. However, a key question that remains insufficiently addressed is whether ozone formation sensitivity also undergoes systematic and regular transitions on the diurnal timescale, given the pronounced diurnal variability of ozone.
A key challenge is that the three prevailing approaches mentioned above for calculating FNR all have inherent limitations in investigating diurnal variability. (1) Polar-orbiting satellite products (such as OMI and Tropospheric Monitoring Instrument (TROPOMI)) provide only a single overpass “instantaneous snapshot” per day, which is insufficient to capture the continuous diurnal evolution of ozone formation sensitivity (Lyu et al., 2024; Peng et al., 2024). In addition, these observations are highly susceptible to cloud contamination, leading to data gaps and spatial discontinuities that can introduce biases in satellite-derived products (Li and Chen, 2021). (2) Numerical models can deliver hourly data products, but their results depend strongly on the accuracy of meteorological inputs, emission inventories, and chemical mechanisms. Even the most recent chemical mechanisms (such as Mechanism for Atmospheric Chemistry eXtended 1 (MAX1)) are still being continuously refined to improve simulation performance (Menut et al., 2021; Trainer et al., 1987). Moreover, uncertainties associated with meteorological forcing, emission magnitudes and temporal allocation, chemical reactions among pollutants and deposition processes can further propagate substantial uncertainties in model results (Georgiana et al., 2016; Yu et al., 2020). (3) Ground-based observations offer high temporal resolution but suffer from sparse and uneven station coverage, resulting in limited spatial representativeness and an inability to depict complete regional-scale diurnal patterns (Xu et al., 2024; Klára et al., 2019). For individual sites, ozone research relies primarily on longitudinal time-series analyses, in which comparisons with satellite observations are used to validate data accuracy or to identify temporal patterns for assessing long-term trends in local ozone levels. Indeed, Wang et al. (2019), when analyzing the spatiotemporal variability of surface ozone column concentrations in China using data from six stations, also highlighted these limitations and emphasized the need for broader spatial coverage to robustly evaluate ozone. Consequently, none of these three mainstream approaches can simultaneously provide high temporal resolution and extensive spatial coverage to directly and reliably characterize the true diurnal evolution and spatial patterns of O3 formation sensitivity.
This study leverages observations from the Geostationary Environment Monitoring Spectrometer (GEMS) to fill the knowledge gap regarding the diurnal dynamics of ozone formation sensitivity. Unlike the “instantaneous snapshots” provided by polar-orbiting satellites, GEMS enables continuous “staring” observations over Asia, thereby allowing, for the first time, the investigation of the FNR at an hourly resolution on a regional scale. Given that the hourly GEMS products have been in stable operational use and fully validated since 2021, this study focuses on the period 2021–2023 to ensure data quality and multi-year comparability (Lange et al., 2024; Bae et al., 2025). Following common practice in domestic ozone research, the warm season is defined as April–September, during which high temperatures and strong solar radiation drive active photochemistry and represent the period of most severe ozone pollution in China (Guicai et al., 2022). Based on this, we systematically investigate the hourly spatiotemporal evolution of FNR over China during the warm seasons of 2021–2023 (09:00–16:00 local standard time (LST)), thereby elucidating the intraday transitions in ozone formation regimes and their key driving factors. It should be noted that the primary objective of this study is not merely to validate existing understanding, but rather to extend it by leveraging the hourly temporal resolution and broad spatial coverage of GEMS observations to reveal the diurnal dynamics of ozone formation sensitivity – an aspect that previous satellite-based studies, largely constrained by once-daily overpasses, have been unable to resolve. Meanwhile, the formation of high ozone concentrations in the afternoon is typically the result of the cumulative effects of multiple processes, including emissions, photochemical reactions, and boundary layer development. This study does not explicitly separate or quantitatively decompose these cumulative processes; instead, it provides observational constraints from the perspective of instantaneous formation sensitivity.
Specifically, this study addresses two key questions: (1) What spatiotemporal patterns characterize the diurnal evolution of ozone formation sensitivity (FNR) across different regions of China during daytime (09:00–16:00 LST)? (2) Do these diurnal transition patterns differ among major urban agglomerations in China, and what are the dominant factors driving these differences? The findings of this work enable the identification of ozone-sensitive periods and key regions with unprecedented spatiotemporal detail, providing direct scientific support for the implementation of dynamic, time-resolved, region-specific, and category-based emission reduction strategies. More importantly, they contribute to a fundamental understanding of the diurnal dynamics of nonlinear photochemical processes governing ozone formation, facilitating a paradigm shift in regional air quality management from “static control” toward “dynamic regulation”. This study provides crucial insights into the temporal dynamics of O3 pollution, offering a scientific basis for its coordinated management in China.
2.1 Dataset
To enhance air quality monitoring and climate change forecasting in East and Southeast Asia, the National Institute of Environmental Research (NIER) of South Korea developed the new-generation and first GEMS aboard the Geostationary (GEO) Korea Multi-Purpose Satellite 2B (GEO-KOMPSAT-2B). This satellite was successfully launched in February 2020. GEMS operates at a spectral resolution of 0.6 nm, covering a wavelength interval of 0.2 nm across the 300–500 nm range (Kim et al., 2020). It provides hourly observations across Asia, from 5° S to 45° N and 75 to 145° E, with a spatial resolution of 7×8 km. Compared with other satellites, GEMS offers significant advantages, with its superior temporal resolution allowing for eight daily observations from 00:45 to 07:45 UTC (Kim et al., 2020). The instrument primarily tracks key atmospheric constituents, including NO2, O3, HCHO, and aerosols. The GEMS L2 HCHO and NO2 products are retrieved using the Differential Optical Absorption Spectroscopy (DOAS) method. First, the slant column densities (SCDs) of the target gases are obtained through DOAS fitting of the ultraviolet–visible spectra. The SCDs are then converted to tropospheric vertical column densities (VCDs) by applying air mass factors (AMFs) derived from a radiative transfer model. The main sources of uncertainty include spectral fitting errors, AMF calculation errors, and assumptions in the a priori profiles. Detailed retrieval principles and product validation can be found in Kim et al. (2020) and Lange et al. (2024). As shown in Fig. 1, GEMS covers most of China from 08:45 to 15:45 LST, with a 1 h interval, enabling hourly analyses. Fig. 1a and 1b correspond to the first and last daily overpasses, respectively, illustrating the observational time boundaries and spatial coverage underlying the diurnal analysis in this study. LST was used for all study times in this paper if not otherwise stated. The study area for GEMS eight observation periods is defined as 17–43° N, 97–127° E, with a spatial resolution of 0.07°×0.08°. Additionally, the observation window has been adjusted to 09:00 to 16:00, crucial for monitoring photochemical activities and urban emissions in major Chinese cities (BTH, YRD, PRD, SC, in Fig. 1c. GEMS level-2 tropospheric NO2 and HCHO data from 2021 to 2023 are free to download at https://nesc.nier.go.kr/en/html/cntnts/91/static/page.do (last access: 6 July 2026).
In addition, this study utilizes tropospheric HCHO and NO2 column data from the Sentinel-5Precursor TROPOMI for 2021–2023. The products, provided by the European Space Agency (ESA), were obtained in Level-3 format via the Google Earth Engine platform and subjected to quality control filtering (qa _value > 0.75) to remove cloud contamination and low-quality observations. Both TROPOMI and GEMS retrieve gas column densities using the DOAS method; however, they differ substantially in orbital configuration and temporal resolution. TROPOMI is a polar-orbiting satellite with approximately one overpass per day, whereas GEMS is a geostationary satellite capable of providing hourly observations. TROPOMI data have been shown to exhibit a high correlation (R= 0.9) with GEMS NO2 measurements, confirming their reliability and accuracy in capturing atmospheric composition (Oak et al., 2024). In this study, TROPOMI data are primarily used to assist in validation and spatial distribution comparisons, while analyses of ozone formation sensitivity and its diurnal variations are conducted mainly using GEMS data.
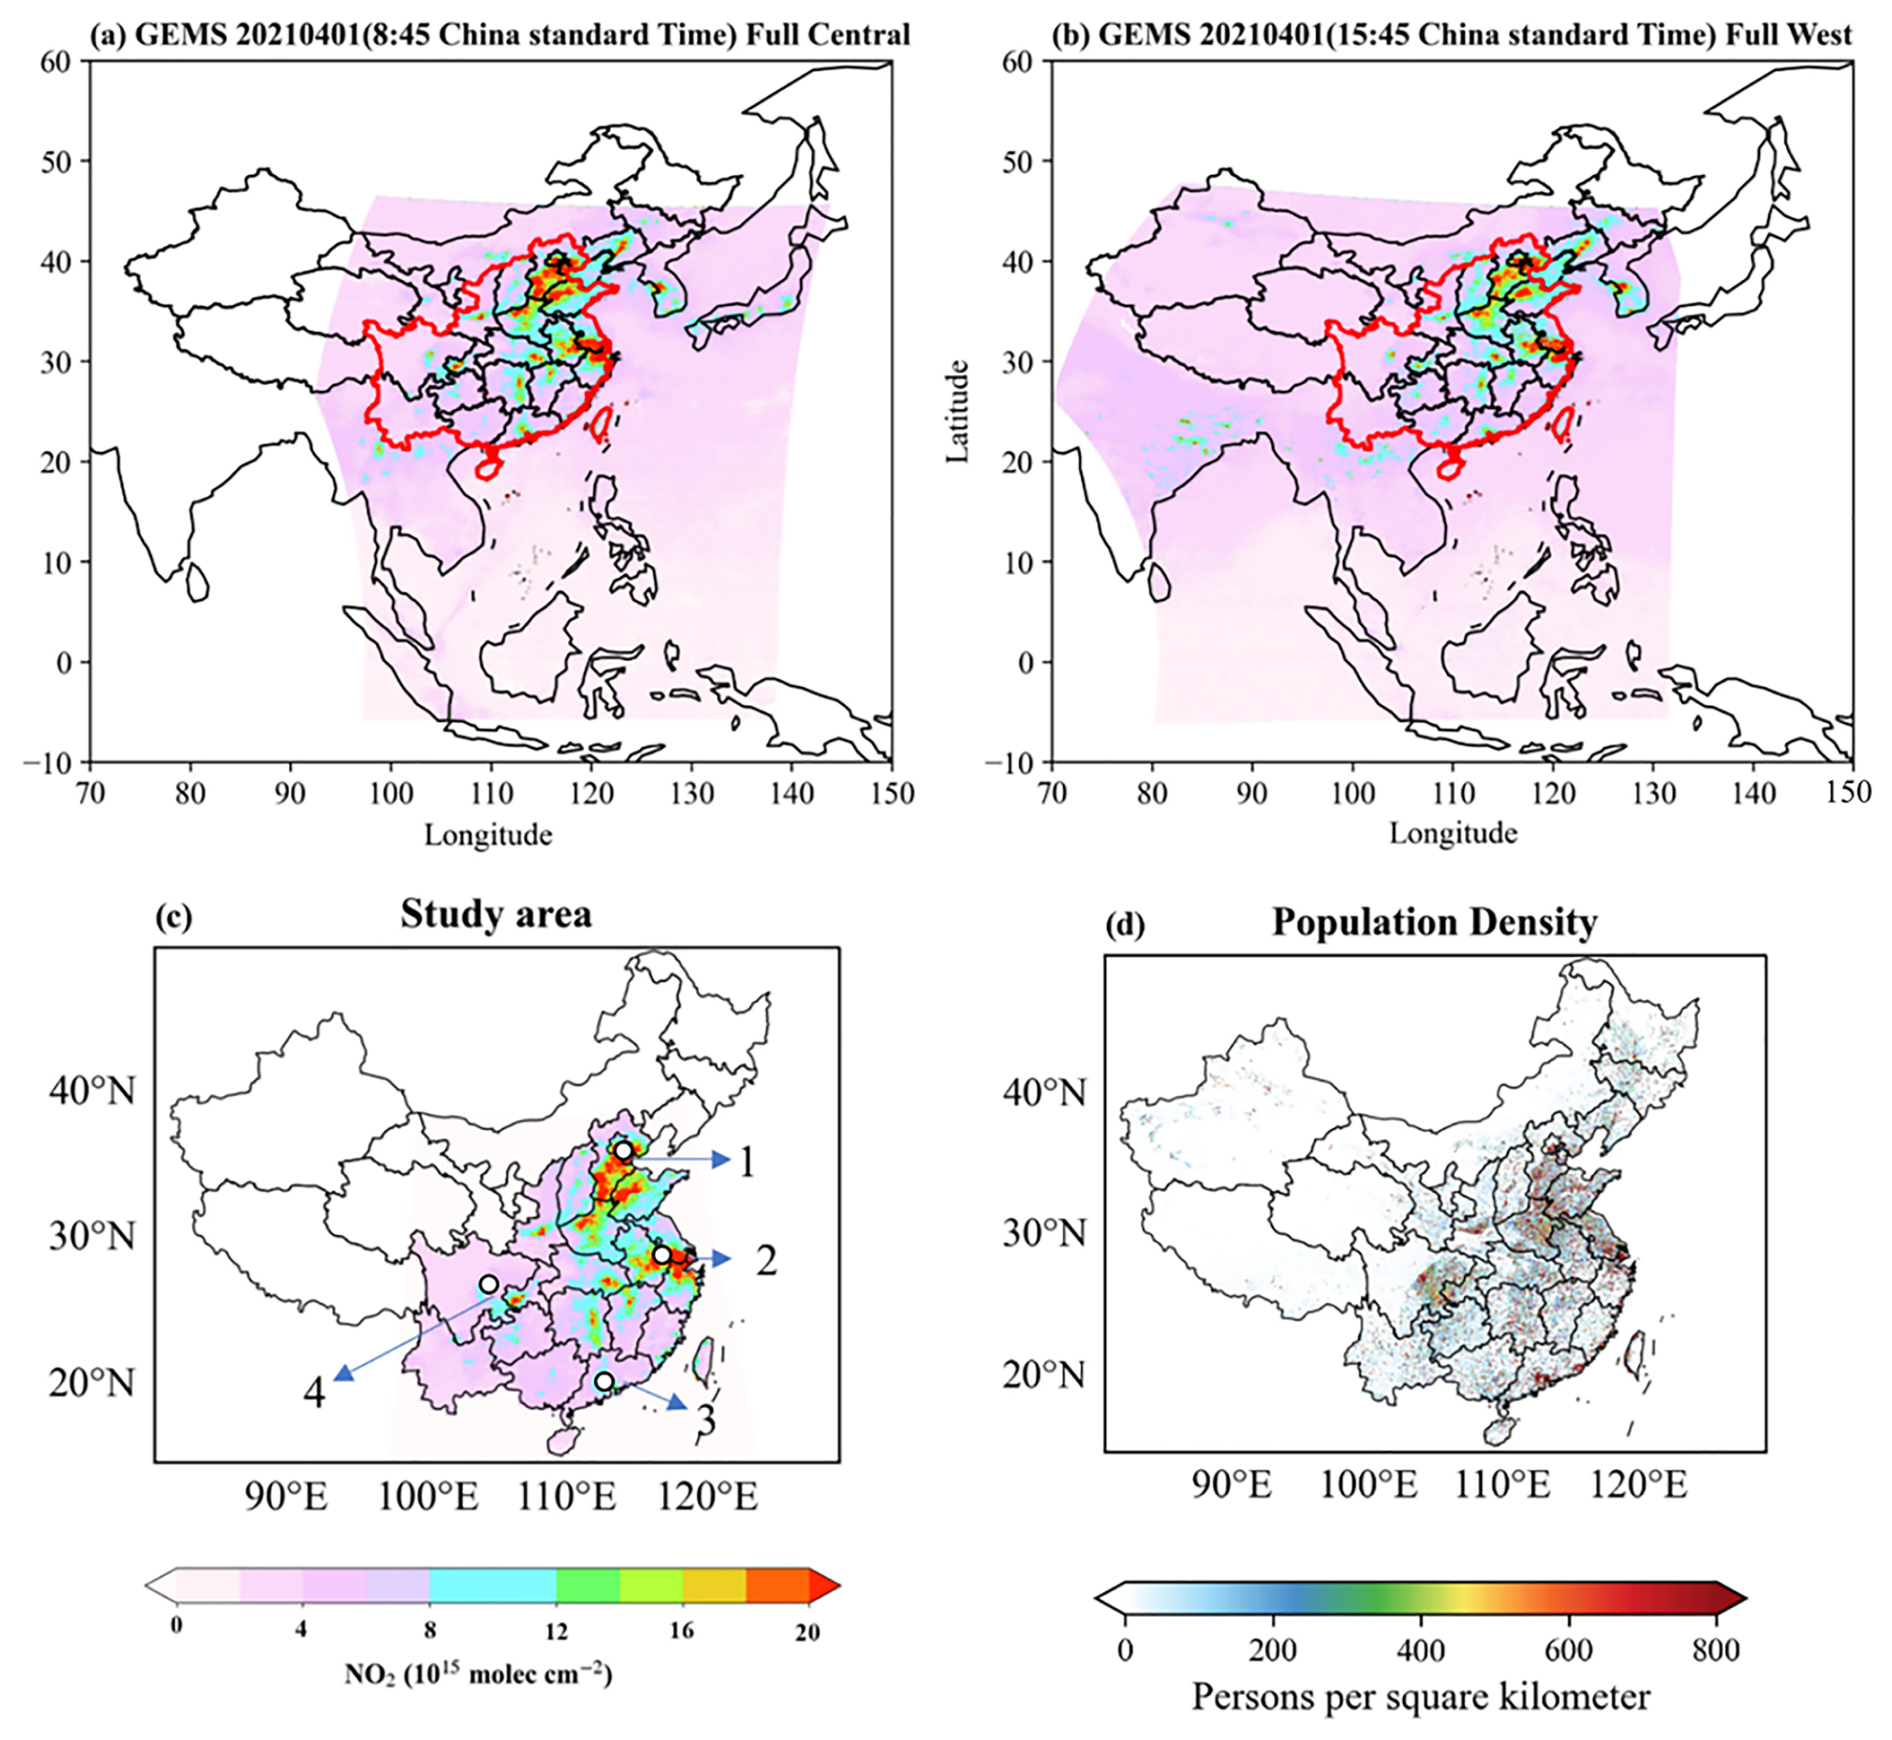
Figure 1(a) NO2 in the Full Central (FC) region as inverted by GEMS satellite at 08:45 LST on 1 April 2021. (b) NO2 in the Full West (FW) region as inverted by GEMS satellite at 15:45 LST on 1 April 2021, and (c) the study area of this study (the red combined region in panel a), where regions 1–4 denote the BTH, YRD, PRD, and SC regions, respectively. The white circular symbols from north to south indicate Beijing, Nanjing, Chengdu, and Guangzhou. (d) Spatial distribution of population density in China, 2017, the population data for the study area (a red ensemble area) represents approximately 87 % of the country's total population.
The China National Air Quality Monitoring Network provides hourly surface O3 measurements through an extensive network of over 1400 ground-based stations in more than 330 cities across China. This invaluable data can be accessible through the official website at https://air.cnemc.cn:18007/ (last access: 6 July 2026). Our analysis includes data from 642 stations located in 210 cities, with all O3 concentrations recorded in micrograms per cubic meter (µg m−3). Many studies have used satellite-derived tropospheric NO2 and HCHO concentrations in combination with near-surface ozone measurements to investigate O3–NOx–VOCs sensitivity. Accordingly, this study employs the aforementioned GEMS data and applies a k-dimensional tree (KDTree) nearest-neighbor approach to match ground stations to their nearest grid points, thereby extracting the corresponding hourly satellite observations. Additionally, this study incorporates hourly ERA5 reanalysis data, provided by the European Centre for Medium-Range Weather Forecasts (ECMWF). The ERA5 dataset includes critical meteorological variables such as 2 m temperature (T2 m), relative humidity (RH), surface solar radiation (SSR), and boundary layer height (BLH). These variables provide comprehensive insights into the meteorological conditions affecting ozone formation and its diurnal variations across the study area, enhancing the understanding of O3–NOx-VOCs interactions.
2.2 Methodology
This study employs locally estimated scatterplot smoothing (LOESS) to characterize the nonlinear relationship between O3 and FNR. LOESS is a nonparametric regression method that fits low-order polynomials to localized subsets of data, requiring no predetermined global functional form. Specifically, the LOESS fitting at each hour from 09:00 to 16:00 LST was performed independently. Only the O3 concentrations and corresponding FNR samples at the same hour were used for each fitting, without incorporating information from preceding or subsequent hours, thereby obtaining the functional relationship O3=f(FNR).
To identify high-response regions for ozone formation, the peak of the LOESS curve (denoted as f_max) was first determined. The FNR interval satisfying f_max was then defined as the transitional (high-response) regime. Based on the endpoints of this interval (FNR_start and FNR_end), ozone formation sensitivity was classified into three regimes: VOC-limited: FNR < FNR_start, Transitional: FNR_start ≤ FNR ≤ FNR_end, NOx-limited: FNR > FNR_end.
To evaluate the robustness of the fitting results, a bootstrap resampling method (1000 iterations) was applied to the LOESS curves to quantify uncertainties and estimate the corresponding 95 % confidence intervals. Compared with high-order polynomial fitting, however, LOESS provides a more robust representation by reducing the influence of local fluctuations and satellite observational noise on the overall fitting results, making it more suitable for identifying the overall variation trends and high-response regions of ozone formation sensitivity at the regional scale. In addition, the ozone sensitivity classification in this study was based on high-response intervals rather than a single peak point; therefore, small variations in local peak positions are unlikely to substantially affect the classification results.
3.1 Spatial distribution of HCHO, NO2, and O3
Figure 2, based on GEMS satellite data and ground monitoring observations, shows the daily variations in atmospheric pollutants across China during the warm seasons (April–September) from 2021 to 2023, including the tropospheric column concentrations of HCHO and NO2, as well as ground-level O3 concentrations. At 09:00, higher initial concentrations of HCHO relative to NO2 are apparent, likely from reduced nighttime dispersion and increased morning emissions (Wang et al., 2017). The majority of HCHO is produced through photo-oxidation of VOCs, while relatively little is emitted directly (Sun et al., 2021). As the day progresses, increases in temperature and radiation intensity promote the conversion of VOCs to HCHO (Eq. 1), significantly increasing HCHO levels, especially in densely populated urban areas (Fig. 1) with larger concentrations of VOCs such as BTH, YRD, PRD, and SC. Supplement Figs. S1–S4 indicate that the BTH, YRD, PRD and SC regions generally exhibit higher T2 m, SSR and BLH, except where regional climate and topography exert influence, providing favorable conditions for photochemical reactions. Statistical analysis (Table S1 in the Supplement) shows that HCHO is significantly positively correlated with T2 m (ρ= 0.531, p<0.01) and SSR (ρ= 0.415, p<0.01), indicating that HCHO concentrations are influenced by photochemical processes. Previous studies have also shown that HCHO concentrations increase with enhanced photochemical activity, peaking in the afternoon when solar radiation is strongest (Wu et al., 2023). Although the reaction of HCHO with OH radicals serves as a consumption mechanism (Eq. 2), in regions with high VOC emissions, the continuous conversion of both biogenic and anthropogenic VOCs, driven by increasing temperature and radiation, may result in a net production rate of HCHO that surpasses its consumption rate, thereby leading to a sustained increase in HCHO concentrations during the afternoon period (Javed et al., 2019). Overall, HCHO concentrations increase steadily throughout the day, reaching a maximum at 16:00, approximately 1.3 times the 09:00 level. Meanwhile, NO2 concentrations display pronounced diurnal fluctuations. Due to traffic and industrial emissions, concentrations are higher in the morning, while photochemical loss is minimal under low solar radiation (Fig. 3) (Xie et al., 2016). As solar radiation and temperature increase, enhanced photochemical activity promotes NO2 depletion (Eqs. 3–4), leading to a gradual decrease in concentrations over the course of the day. The most rapid NO2 reduction occurs between 13:00 and 14:00, primarily due to fast photochemical conversion coupled with strong mixing associated with the maximum boundary layer height (Fig. 3). Statistical analysis (Table S1) further indicates that NO2 is significantly negatively correlated with T2 m (0.556, p<0.01) and BLH (, p<0.01), reflecting the combined effects of enhanced photochemical loss and dilution by boundary layer mixing. However, after 16:00, as photochemical activity diminishes and traffic increases in some cities due to school dismissals and varying work shifts, NO2 levels rise again (Zhang and Batterman, 2009). This trend is consistent with observations by Kim et al. (2020) and Elise and Tracey (2020). NO2 peaks in the morning and then gradually decline, reaching around 70 % of their initial level by 15:00, followed by a slight rebound in the late afternoon. Although NO2 is also regenerated during this process (Eqs. 5–7), increased photolytic activity and the conversion of NO2 to nitric acid (Eq. 8) typically decrease NO2 concentrations throughout the daytime (Tan et al., 2019). The peak of O3 occurs between 15:00 and 16:00, with concentrations gradually increasing throughout the day, starting from a morning average of 56.29 µg m−3 and reaching a peak of 122.32 µg m−3 around 15:00. Liu and Wang (2020) and Xia et al. (2021) also reported that high O3 concentrations during the warm season peak around 15:00 in major city clusters in China. In addition, tropospheric ozone columns retrieved from the geostationary satellite GEMS exhibit a consistent diurnal pattern, with ozone gradually increasing throughout the morning and peaking in the afternoon (around 15:00) (Kim, 2023), showing good agreement in diurnal phase with surface observations.
Overall, the spatial distribution of HCHO, NO2, and O3 concentrations reveals significant regional differences across China. In the morning, high concentrations of HCHO and NO2 are primarily concentrated in urban clusters, reflecting the impact of industrial activities and traffic emissions on the precursors of O3. Meanwhile, O3 concentrations are predominantly concentrated in the northern regions. In the afternoon, both HCHO and ozone concentrations increase significantly, with their distribution range notably expanding compared to the morning, particularly in high-population-density urban areas. However, high concentrations of NO2 remain primarily concentrated in northern China, but due to the influence of local meteorological conditions, industrial emissions, and the involvement in O3 formation, NO2 concentrations gradually decrease.
Here, VOCs react with hydroxyl radicals (OH), producing RO2 and by-products like HCHO. RO2 and HCHO can further react with nitrogen monoxide (NO), forming NO2. NO2 undergoes photolysis (hν), breaking down into NO and atomic oxygen (O), which combines with molecular oxygen (O2) to form O3. O3 can react with NO to regenerate NO2, maintaining the NOx cycle. Meanwhile, HCHO can photolyze into carbon monoxide (CO) and more hydroperoxyl radicals, accelerating O3 formation. NO2 can also react with OH and a third body (M) to form nitric acid (HNO3), reducing NOx levels and limiting further O3 production.
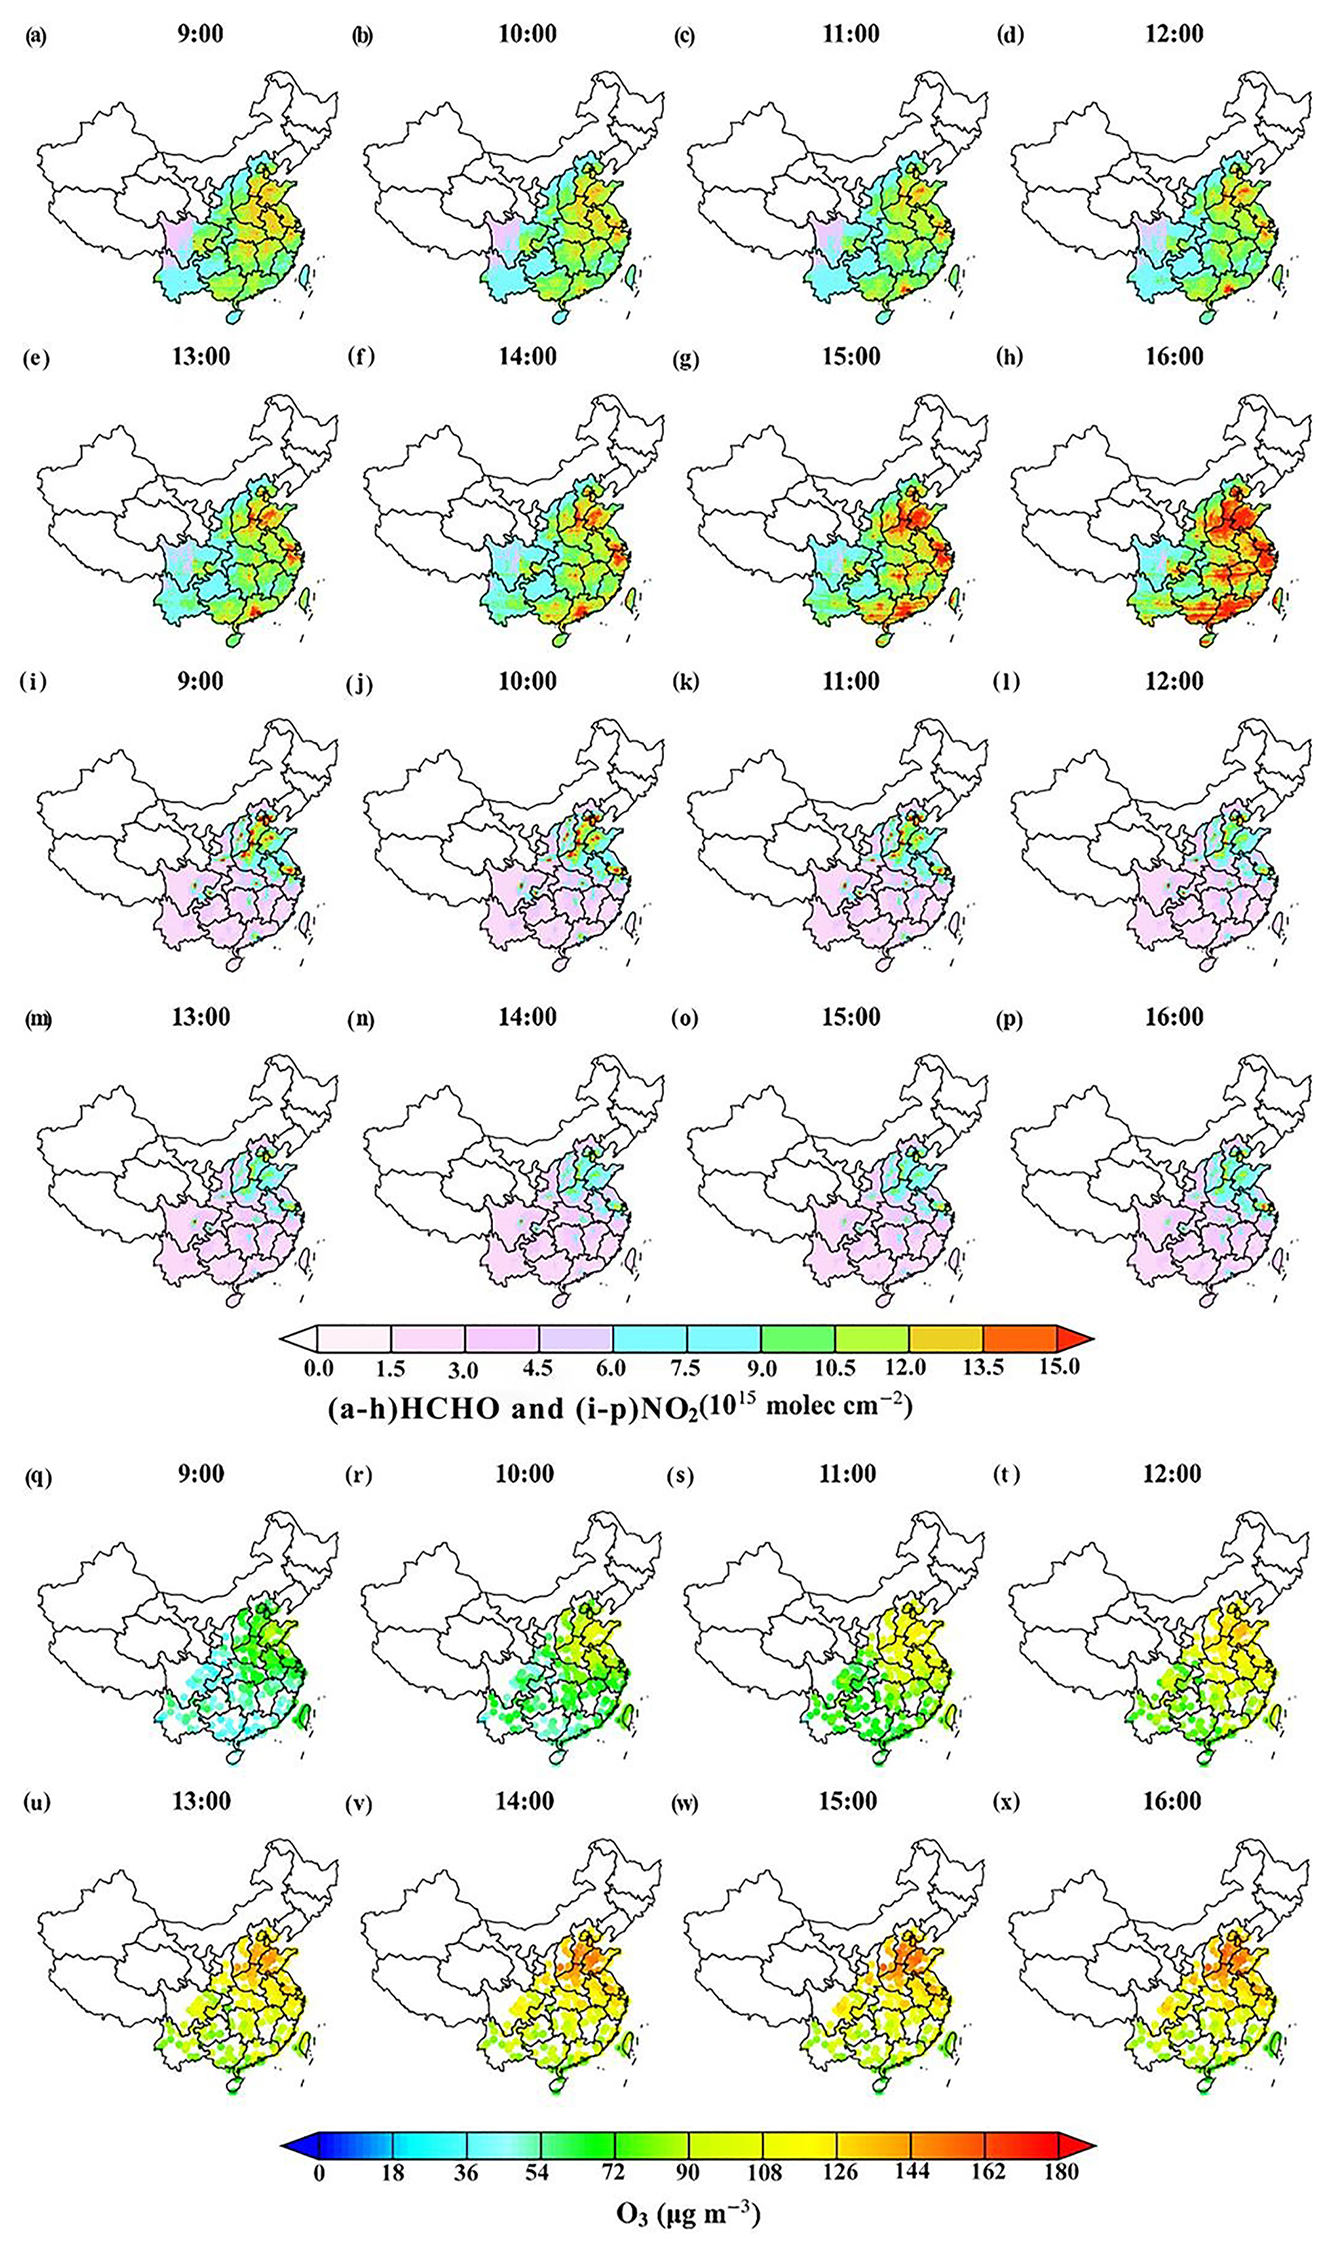
Figure 2Hourly atmospheric monitoring in China during the warm season (April to September 2021–2023). (a–h) and (i–p) Spatial distribution of hourly mean HCHO and NO2 levels retrieved from GEMS satellite data. (q–x) Temporal variations in ground-level mean O3 concentrations, observed at various monitoring stations.
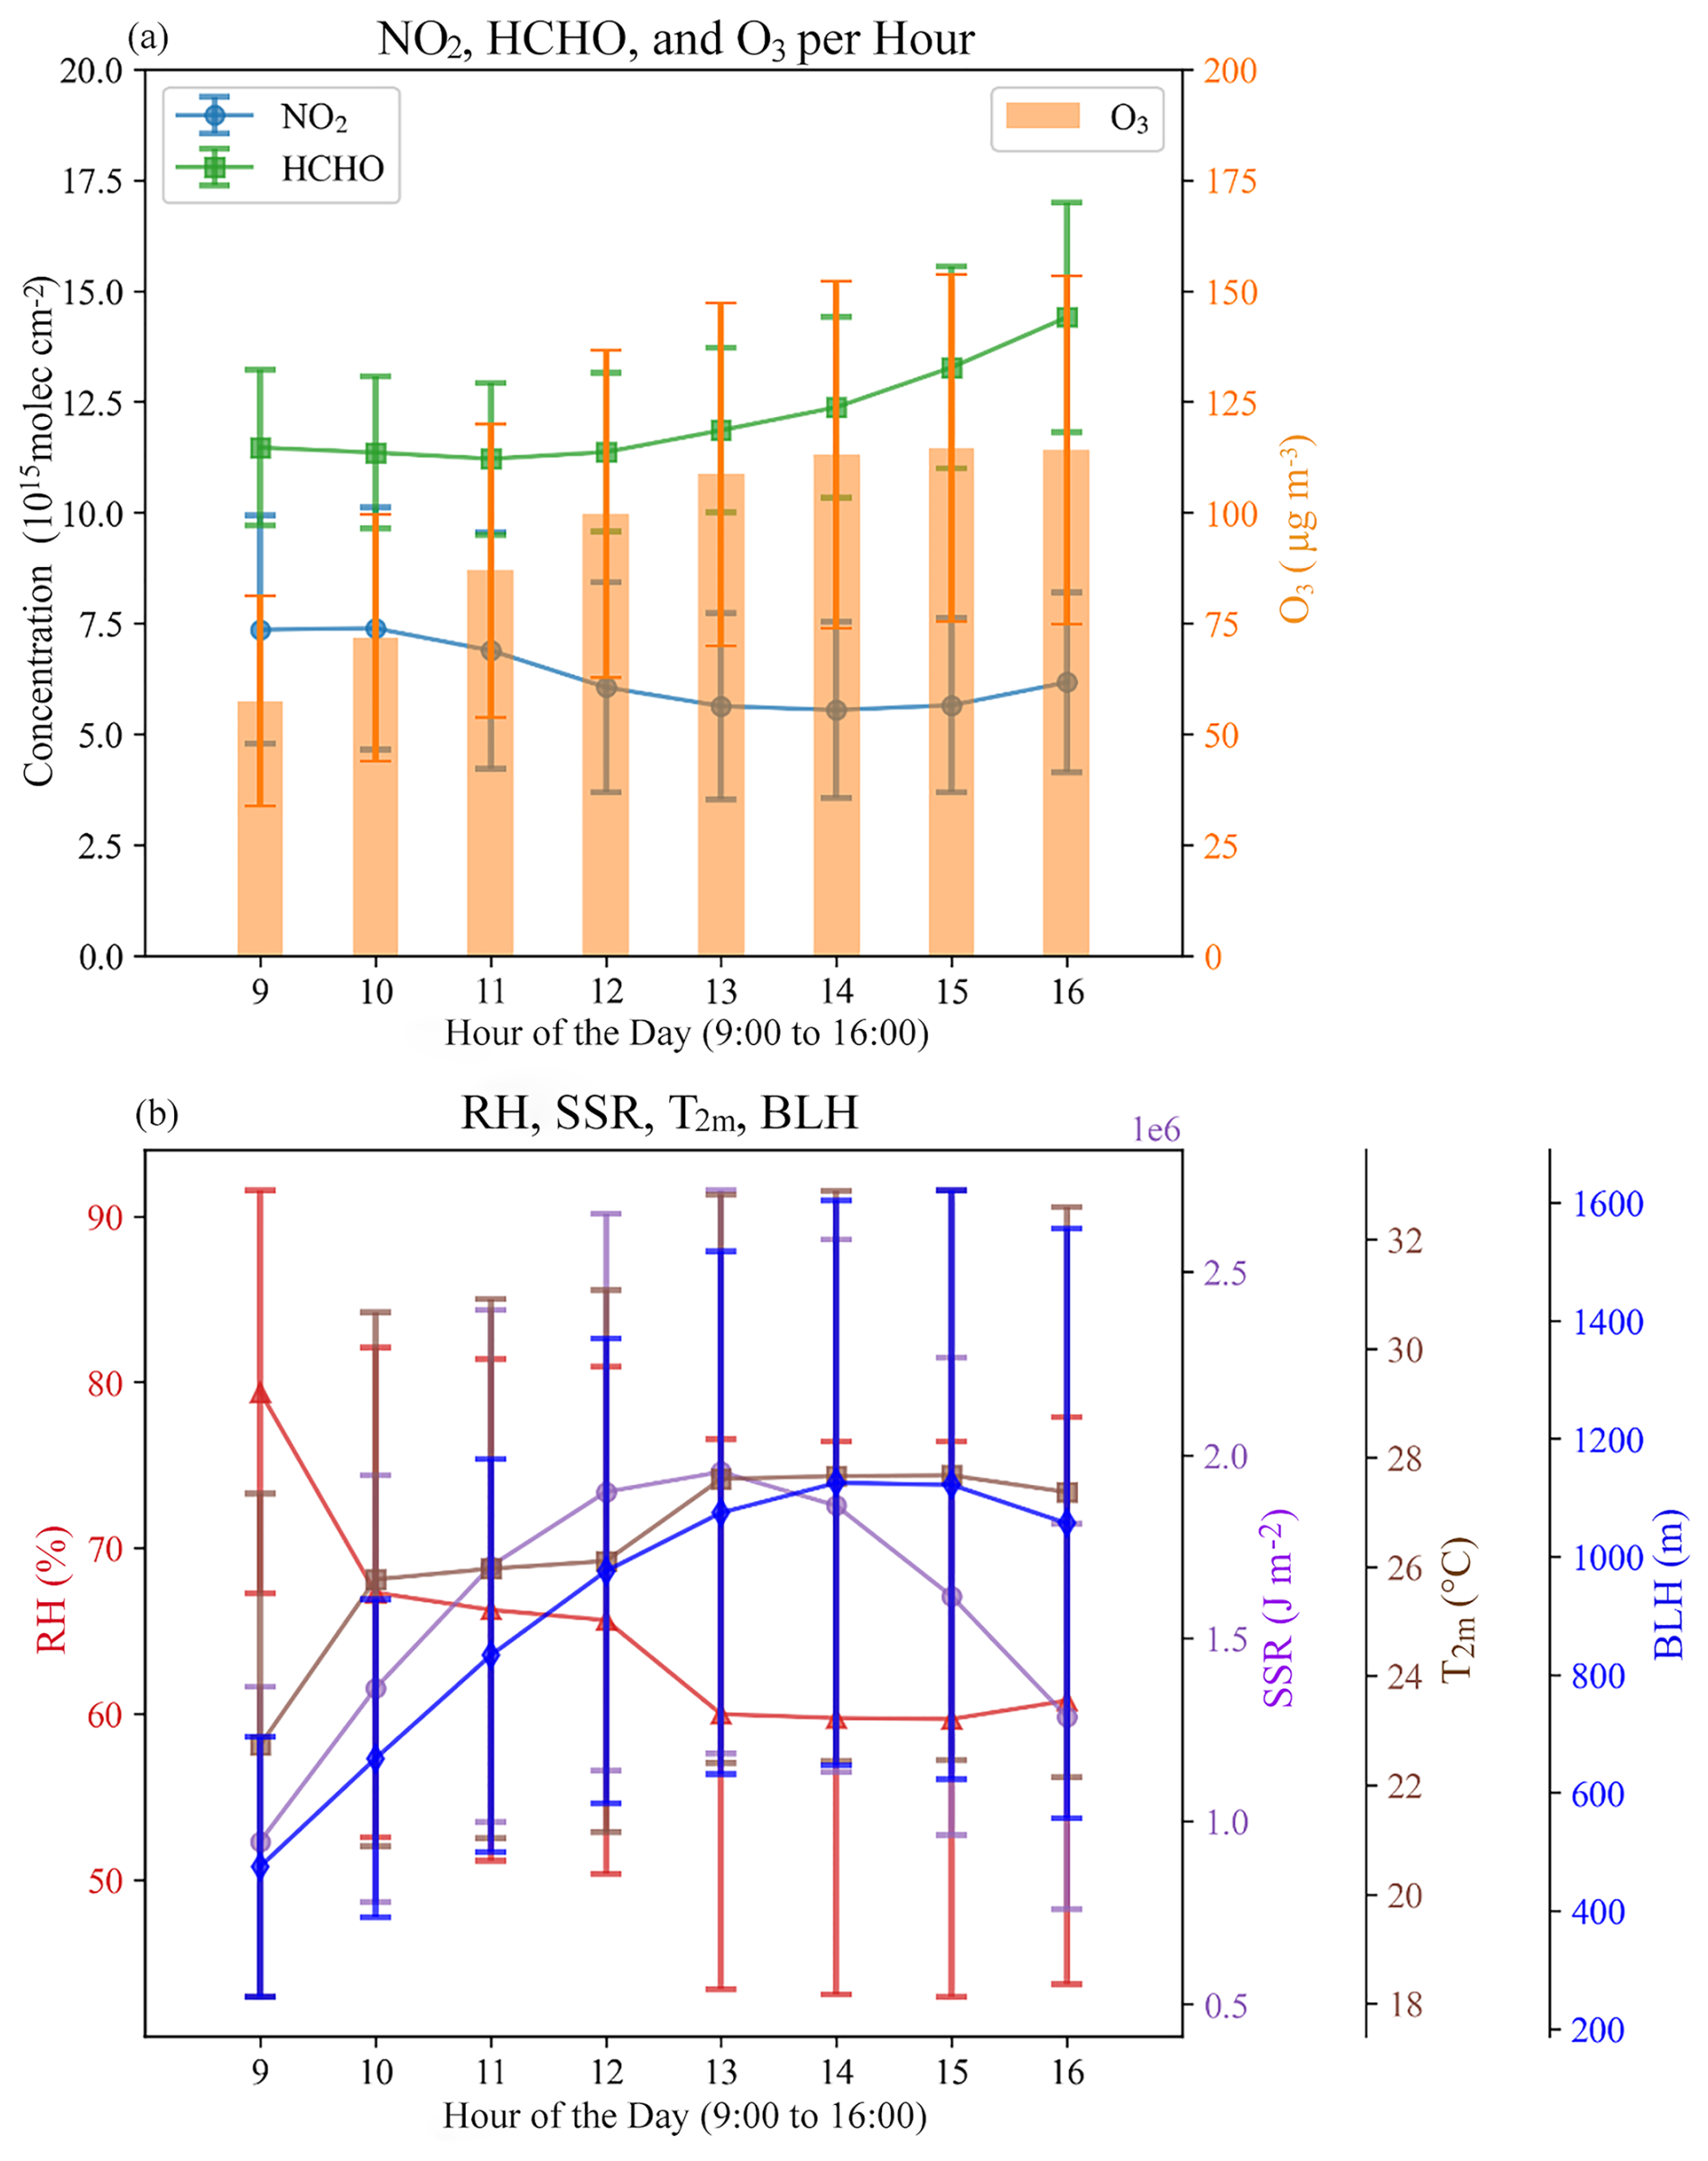
Figure 3(a) Warm-season hourly ozone averages and deviations for all stations in the study area, with corresponding HCHO and NO2 from GEMS. (b) and ERA5 corresponding to T2 m, RH, SSR, and BLH at the closest point site.
3.2 O3–NOx–VOCs chemistry captured by GEMS satellite-based HCHO/NO2
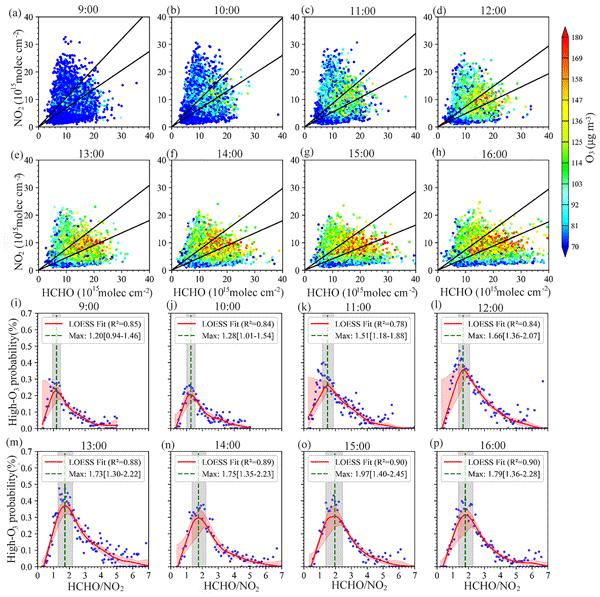
Figure 4 displays the daily relationship between HCHO and NO2 concentrations and ground-level O3 utilizing LOESS fitting method to highlight trends and high O3 concentration events. The distributions of HCHO and NO2 at 09:00 are dispersed. The concentration of O3 is relatively low in Fig. 4a, so the photochemical reaction required for O3 formation has not yet started completely because of the low temperature and radiation (Fig. 3). At this time, data points (NO2 > 20 × 1015 molec cm−2) are concentrated in the upper left corner, suggesting a NOx-saturated state with VOCs (represented by HCHO) as the limiting factor. In addition, a small amount of O3 reacts with NO to form new NO2 at this time (Eq. 5), but its contribution is smaller than the impact of direct emissions and the effect of nighttime accumulation (Romer et al., 2018). From 10:00 to 12:00, as sunlight and temperature rise, data points move towards the lower right, significantly increasing O3 concentration. During this period, three typical states of O3–NOx-VOCs chemical processes can be identified: the VOC-limited regime, the transition zone, and the NOx-limited regime. By the afternoon (Fig. 4e–h), the data points consistently cluster in regimes characterized by elevated HCHO and depleted NO2, indicating a progressive shift in the photochemical environment. Under these conditions, O3 concentrations concurrently reach their diurnal maximum. The photochemical reaction of VOCs is accelerated with increasing solar radiation (peak at 13:00) and temperature, generating more free radicals and intermediates (e.g., HCHO). The increase of these free radicals will further promote the photolysis of NO2 and accelerate the generation of O3. At the same time, the photolysis of NO2 not only produces O3 directly but also reduces the concentration of NO2, reducing the O3 consumption reaction (Yang et al., 2021). In addition, the lower relative humidity reduces the involvement of water vapor, which usually consumes O3, and this reduction favors the accumulation of O3 (Zhang et al., 2022). Since the reaction of VOCs and NO2 photolysis are mutually reinforcing, O3 production in this environment shows a nonlinear enhancement, which is particularly evident under conditions of abundant VOCs but low NO2.
Although there are some differences in the concentration and spatial distribution of HCHO and NO2 between the GEMS and TROPOMI satellite data (Fig. 5), they all exhibit similar distribution characteristics of high values in the four major urban agglomerations (BTH, YRD, SC, and PRD). Specifically, the areas of high concentrations of HCHO and NO2 are the same in both data, while the HCHO NO2 ratio also exhibits a similar spatial pattern. This similarity is further supported by the difference values (Fig. 5i), which show relatively small discrepancies in FNR over major urban agglomerations. In addition, the quantitative comparison in Fig. S5 indicates positive correlations between GEMS and TROPOMI observations for both HCHO and NO2, with correlation coefficients of 0.506 and 0.838, respectively. The mean biases (MB) are 0.185×10¹⁵ molec cm−2 for HCHO and −2.509 × 10¹⁵ molec cm−2 for NO2. Overall, NO2 exhibits higher consistency between the two datasets, whereas HCHO shows relatively weaker agreement. This discrepancy likely reflects known uncertainties in HCHO retrievals, such as a lower signal-to-noise ratio and a stronger dependence on a priori profiles, and is also influenced by differences in satellite overpass times (GEMS: hourly daytime observations; TROPOMI: ∼ 13:30 LST). As a ratio, FNR partially cancels systematic biases, yielding a correlation coefficient of 0.783 with an MB of 1.172, and thus exhibits strong agreement and similar overall trends between the two datasets. Previous studies have likewise reported good agreement between GEMS and TROPOMI for HCHO and NO2, with correlation coefficients reaching 0.80 and 0.62, respectively, and overall correlations ranging from 0.59 to 0.85, with most regional differences within 20 % (Fu et al., 2024; He, 2025).
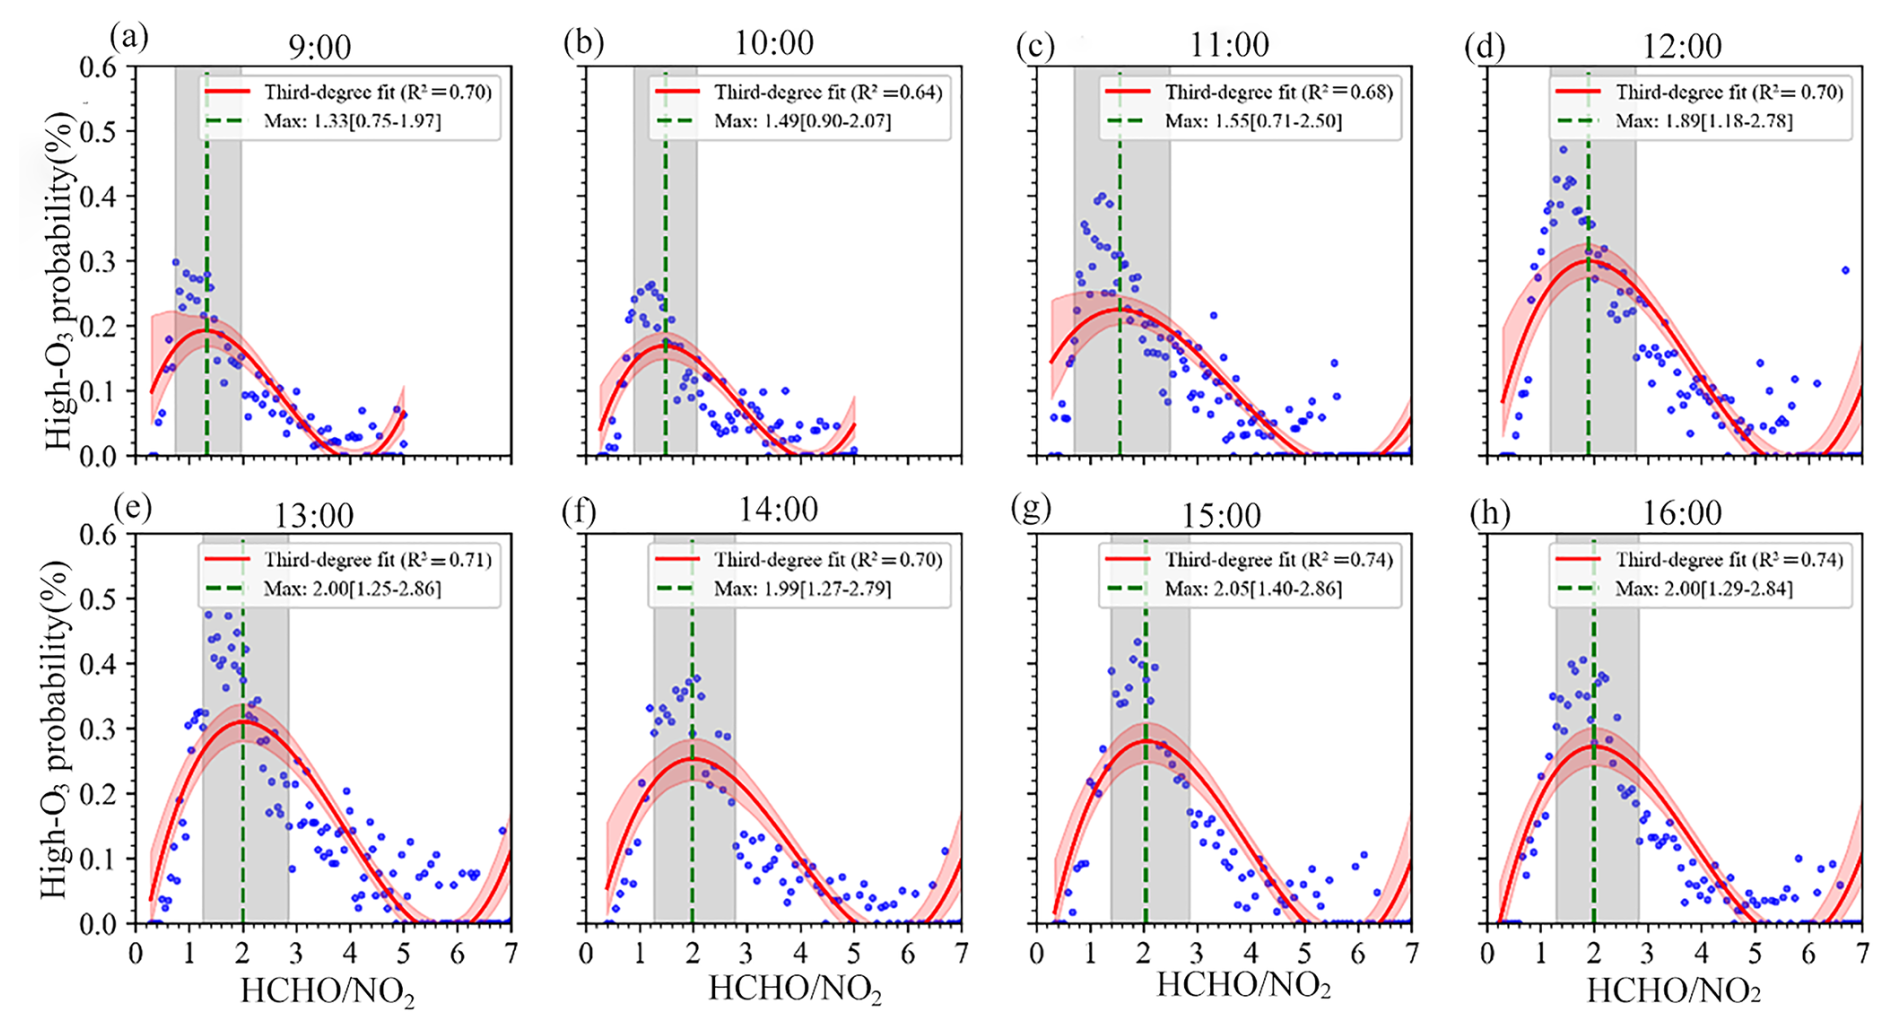
Therefore, FNR derived from both datasets can effectively capture the nonlinear relationships between ozone precursors relevant to ozone formation processes. Based on this, we further investigated the diurnal characteristics of the quantitative relationship between the probability of high-ozone events and the FNR derived from GEMS satellite observations, as shown in Fig. 4i–p. Compared to cubic polynomial fitting (Fig. 6), we found that LOESS fitting performed better in identifying peak probabilities of high O3 events with minimal uncertainty. During the morning hours (from 09:00 to 12:00), O3 concentrations gradually increase within the transition ranges of [0.94, 1.46] to [1.36, 2.07], with fitting curves that are steep and closely aligned to the y-axis, indicating a rapid shift from a VOC-limited to a regime significantly influenced by HCHO and NO2. As solar radiation intensifies and emissions from traffic and industrial sources continue, O3 gradually accumulates near the ground. Note that the maximum FNR position gradually shifts rightward, indicating the growing importance of NO2 in O3 formation. In the afternoon (after 12:00), the fitted regimes, with broader transition zones spanning [1.30, 2.22] to [1.36, 2.28], more accurately captured the nonlinear relationship of O3–NOx-VOCs (R2>0.88) than those in the morning. The afternoon typically meets peak radiation and temperatures (Fig. 3), accelerating chemical reactions, especially photochemical reactions, thus enhancing O3 production (Coates et al., 2016). Besides, the stable emissions and atmospheric chemical processes lead to consistent O3 sensitivity curves from 13:00 to 16:00. Throughout the day, the maximum high-probability O3 values from GEMS LOESS fitting increase, peaking at 1.97 at 15:00, before declining at 16:00. The O3 sensitivity thresholds at 13:00 in this study align with previous findings, such as [1.0, 2.0] by Jin and Holloway (2015), and [1.5, 2.3] by Chang et al. (2016). Furthermore, GEMS data further revealed that the hourly variability in O3–NOx-VOCs sensitivity throughout the day was more complex and dynamic compared to previous studies, which primarily reported diurnal changes limited to a single time period, as observed by polar-orbiting satellites.
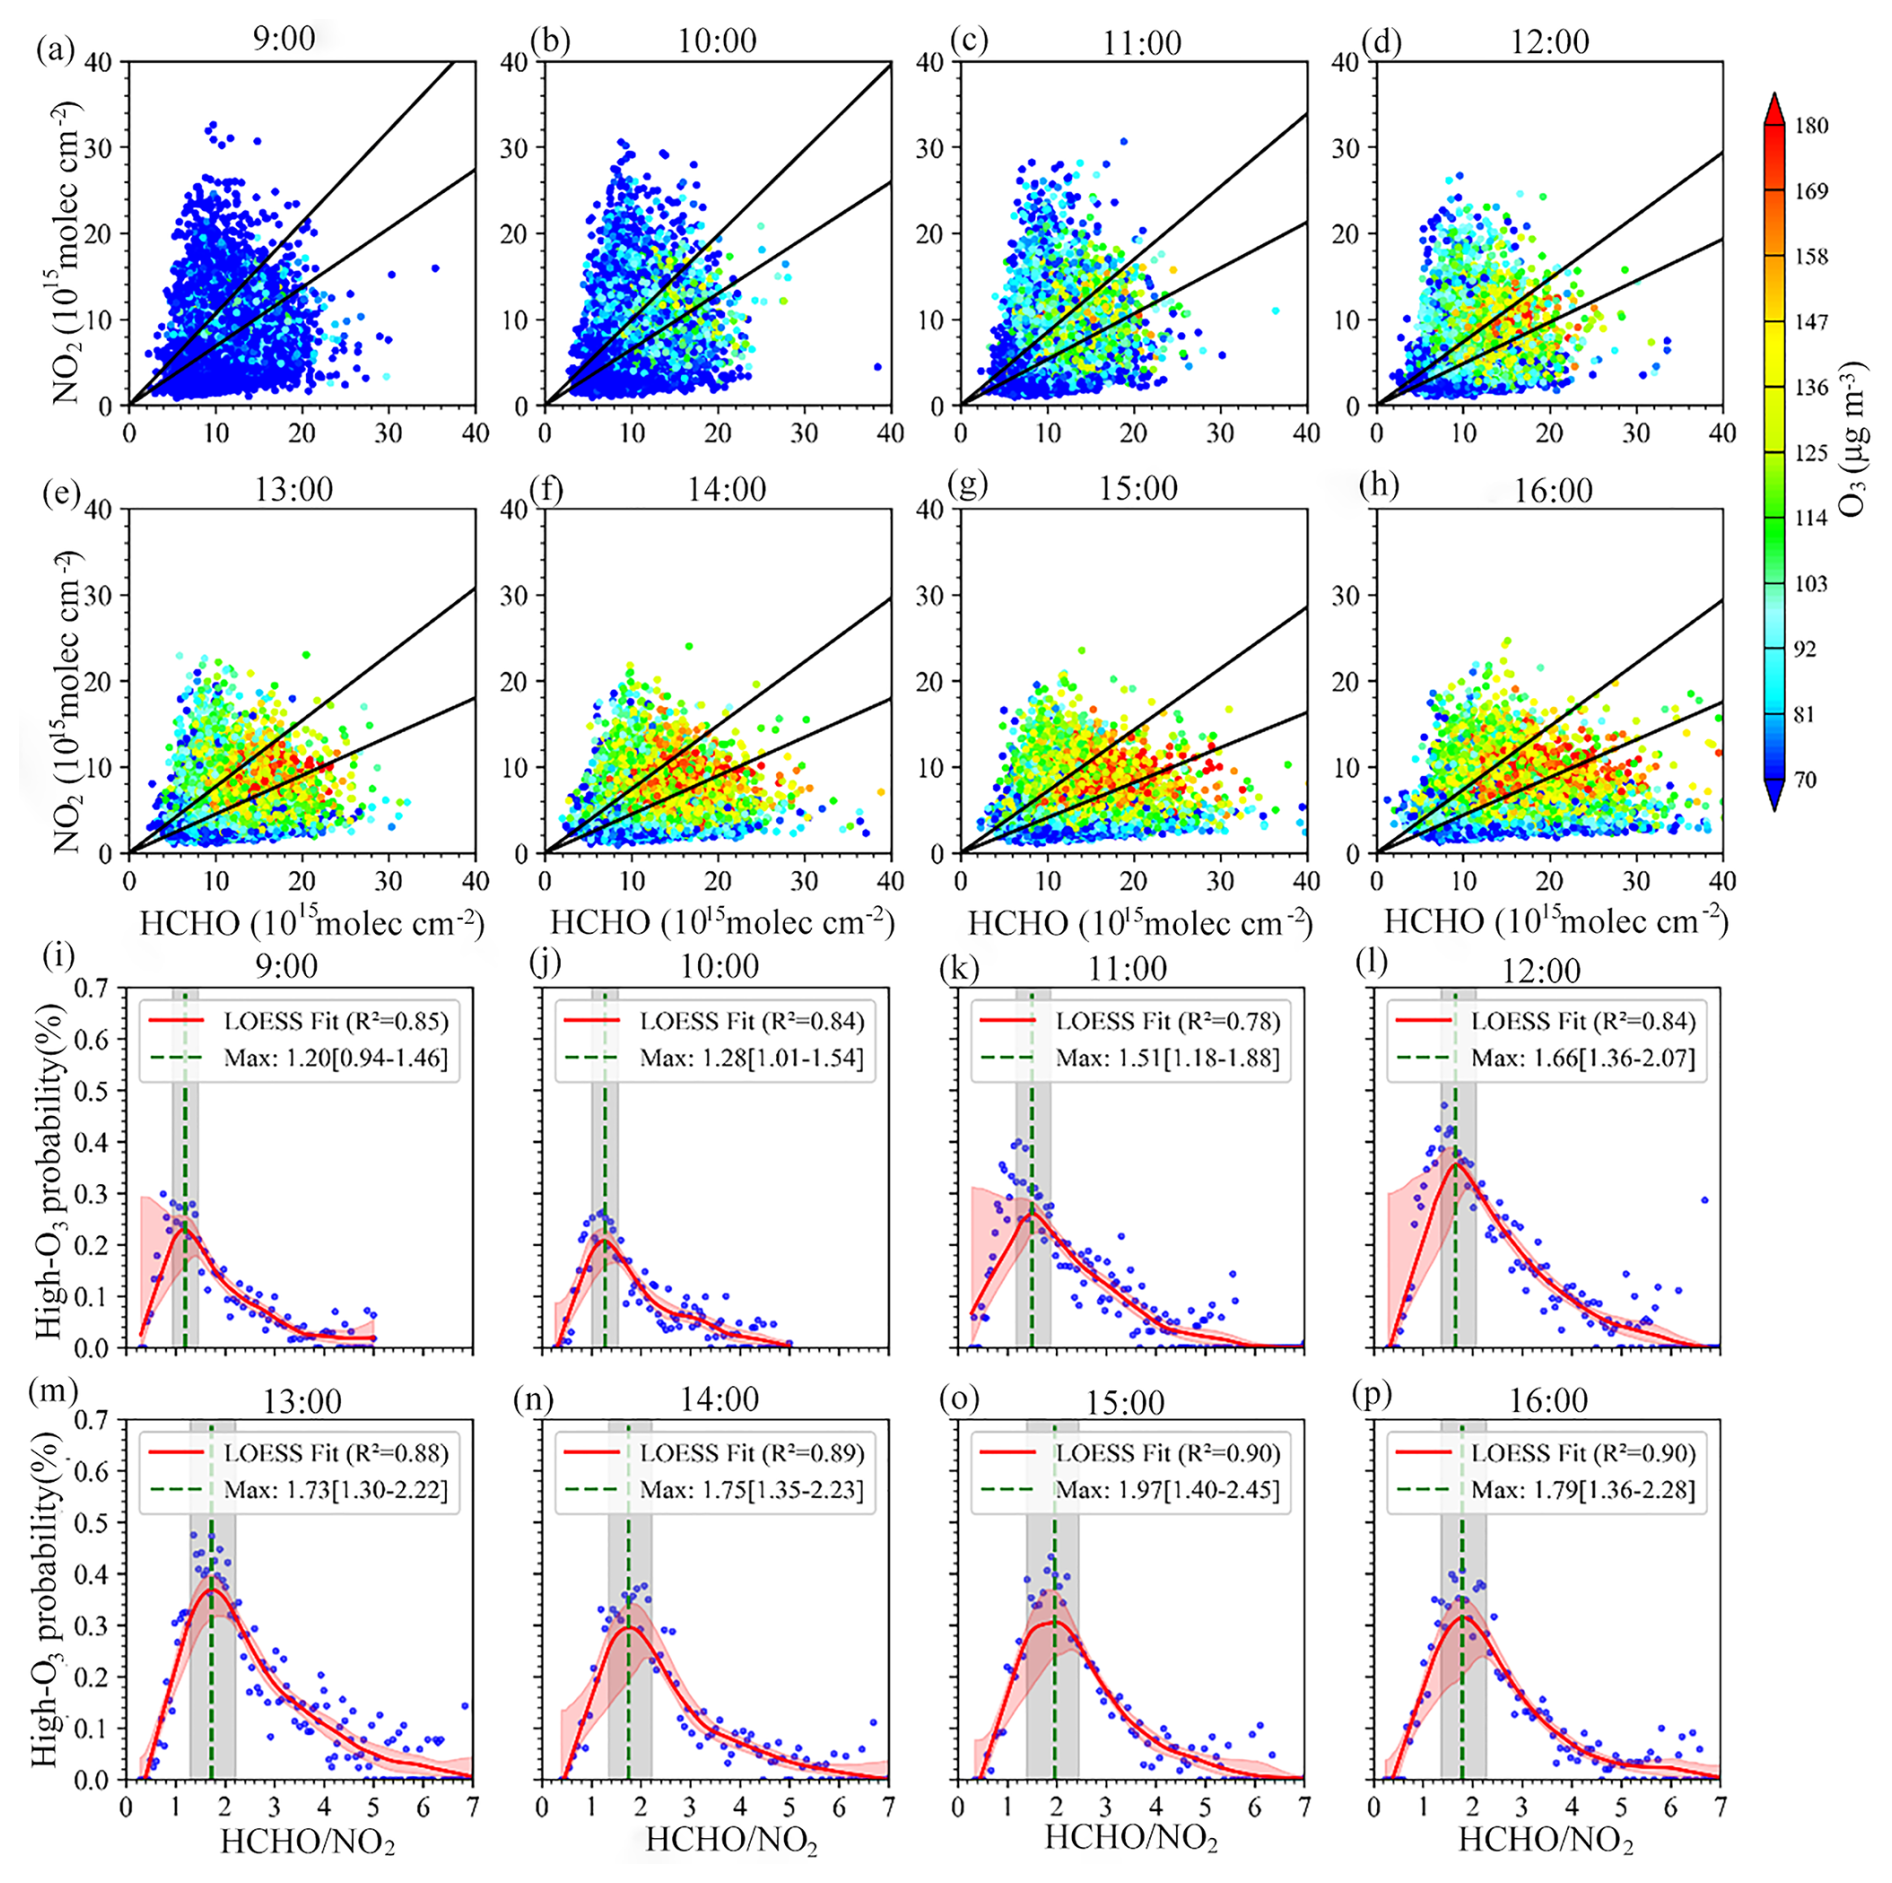
Figure 4Relationship between hourly surface O3 and GEMS HCHO NO2 during the warm seasons (April–September) of 2021–2023, analyzed using LOESS. (a–h) Scatterplots of hourly surface O3 concentrations versus GEMS HCHO and NO2, based on ground-level hourly O3 observations (09:00–16:00 LST) matched with the corresponding GEMS HCHO and NO2 data. The two vertical black lines indicate the boundaries of the transitional regime. (i–p) Relationship between the HCHO NO2 ratio (x-axis) and the probability of high O3 events (y-axis), based on 200 bins. Each bin represents half-monthly averaged values matched with the corresponding hourly O3 concentrations. High O3 thresholds are defined as follows: 09:00 > 80 µg m−3, 10:00 > 100 µg m−3, 11:00 > 110 µg m−3, 12:00 > 120 µg m−3, 13:00 > 130 µg m−3, 14:00 and later > 140 µg m−3. The red curve represents the LOESS fit, and the shaded area indicates the 95 % confidence interval derived from bootstrap resampling (1000 iterations).
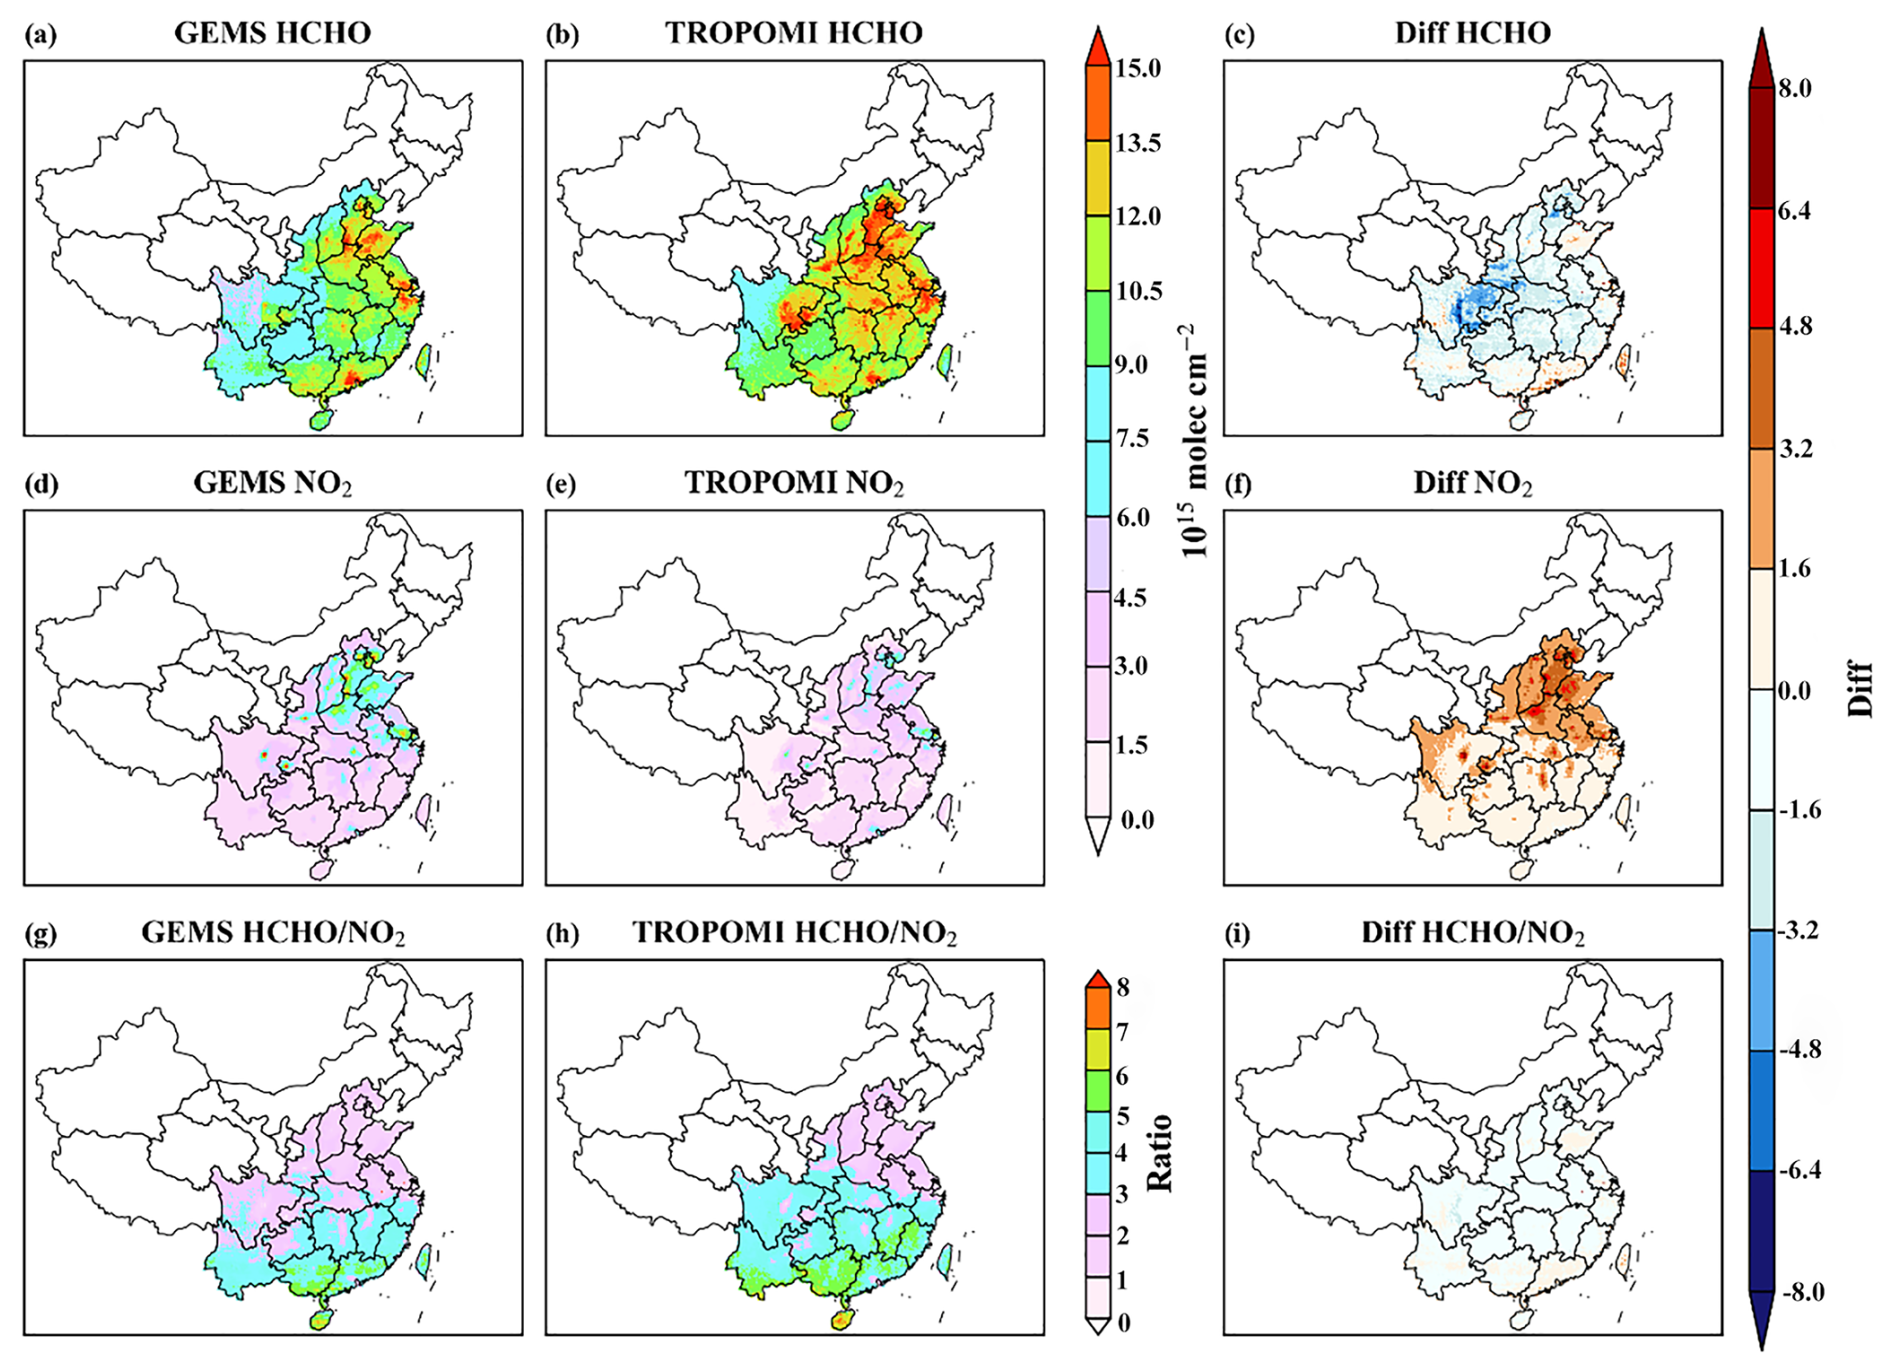
Figure 5Mean values of HCHO, NO2, and HCHO NO2 at 13:00 p.m. LST from 2021 to 2023 retrieved from GEMS and TROPOMI satellite data and their respective differences.
3.3 Spatiotemporal distribution of O3 production regimes
Figure 7 illustrates the diurnal characteristics of ozone formation regimes over the study region from April to September 2023. Spatially, the region is predominantly NOx-limited, followed by transitional regimes, with VOC-limited and transitional areas mainly concentrated in the northern part. Further analysis indicates that VOC-limited regimes are particularly pronounced in urban centers, whereas surrounding suburban and rural areas are more often classified as transitional or NOx-limited (see Figs. S6–S7). This spatial differentiation is consistent with the findings of Ren et al. (2022) and Li et al. (2024).
In terms of diurnal variation, ozone formation regimes exhibit significant dynamic transitions. As the day progresses into the afternoon (after approximately 13:00), many urban areas that are VOC-limited in the morning gradually shift toward transitional regimes. For example, in the BTH, YRD and SC regions, urban areas predominantly maintain a VOC-limited state in the morning but clearly transition toward transitional regimes in the afternoon. In contrast, the PRD shows a different pattern, being mainly transitional in the morning and further shifting to NOx-limited in the afternoon. This behavior may be associated with higher temperatures and humidity in the region, which facilitate the photochemical reactions between VOCs and NOx, thereby altering ozone formation sensitivity. This hypothesis is consistent with Wang et al. (2024), who reported enhanced photochemical reaction rates in the PRD. Moreover, recent air quality policies in the PRD have significantly reduced VOC and NOx concentrations, which may also contribute to the observed shift from VOC-limited to NOx-limited regimes (Li et al., 2024). Figure 8 (analogous to Fig. 7 but for 2021 and 2022) further indicate a trend in recent years in the PRD toward transitional and NOx-limited regimes in the morning. In contrast, the SC region maintains a primarily VOC-limited regime during the day, likely due to unique geographic features that restrict regional circulation and form temperature inversions, partially suppressing pollutant dispersion (Yang et al., 2020). Notably, the intensity of the VOC-limited regime in the SC region weakens in the afternoon and is not particularly pronounced in the morning, which may be influenced by solar radiation intensity and atmospheric dynamics. The above results indicate that ozone formation regimes exhibit pronounced spatial heterogeneity and diurnal variation at the regional scale. However, such large-scale patterns may obscure differences in precursor evolution and meteorological drivers among individual cities. Therefore, further analysis at the city scale is necessary to elucidate the physicochemical processes governing ozone formation.
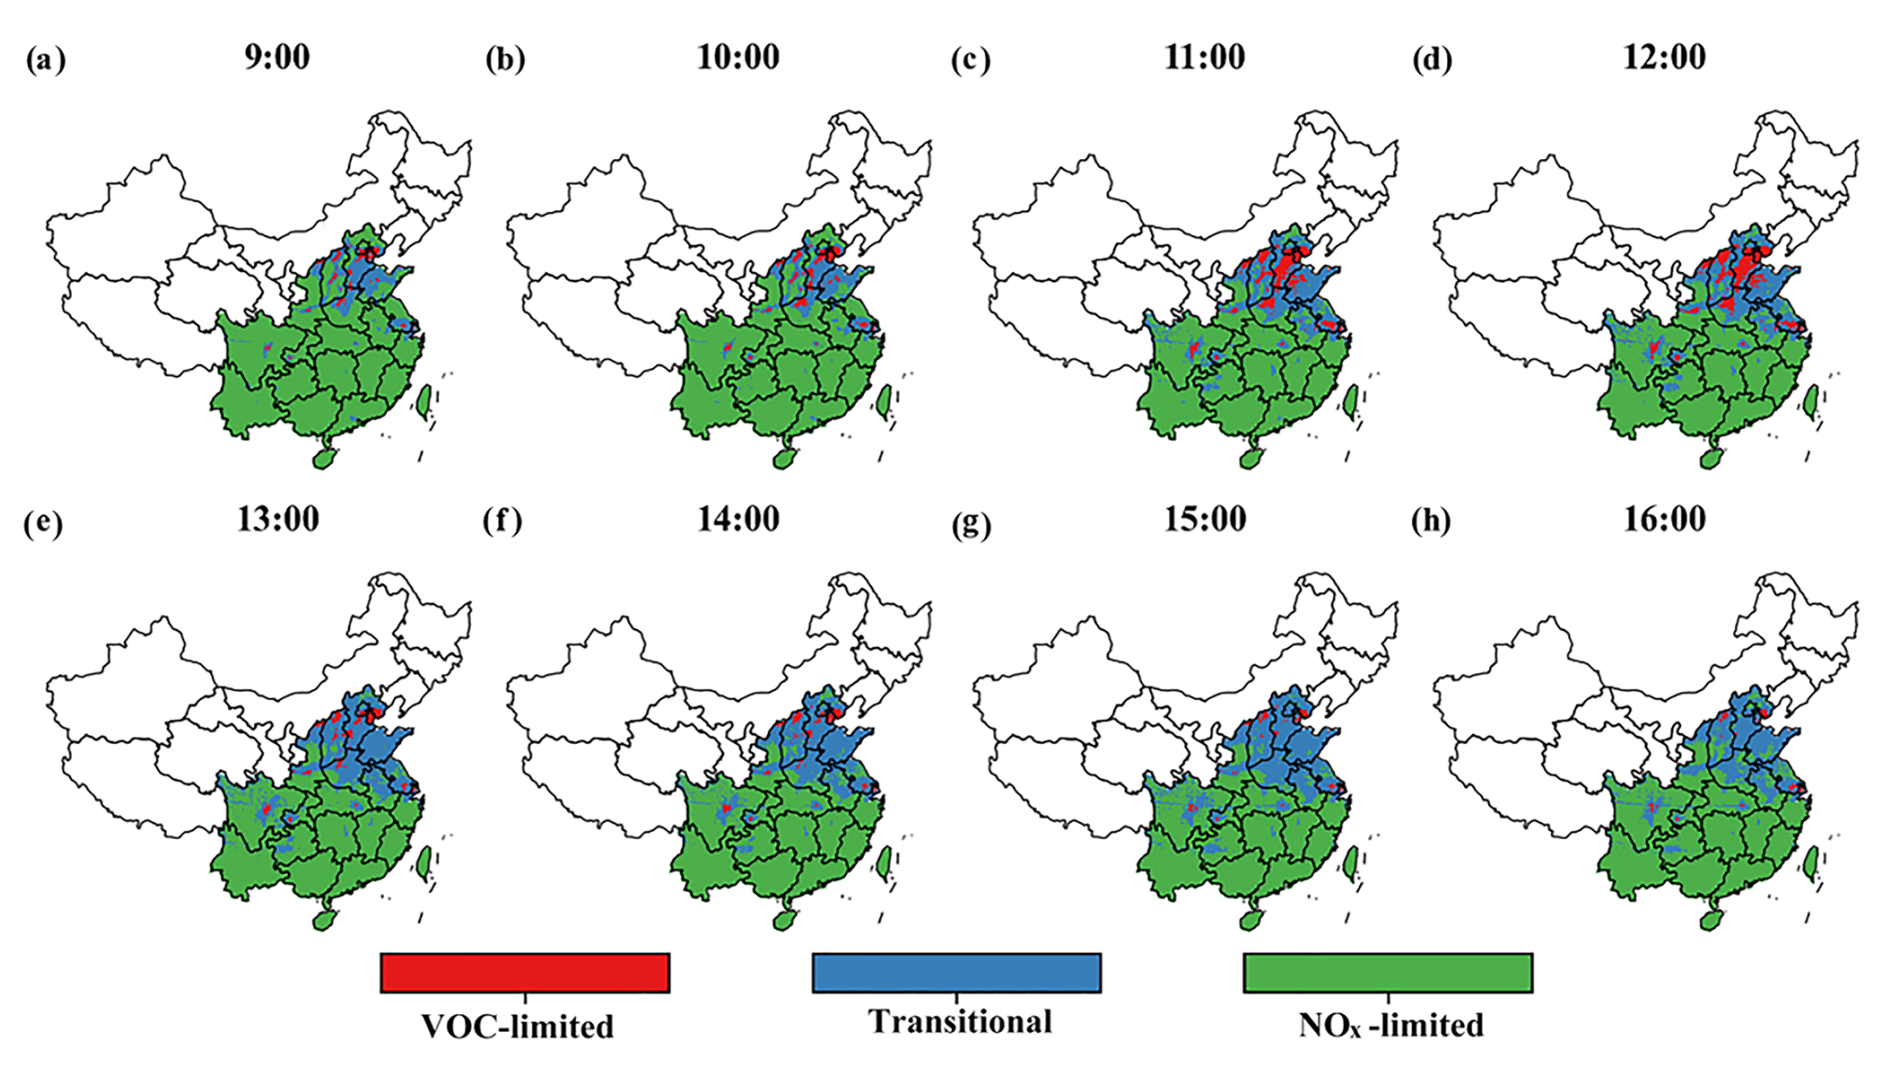
Figure 7Diurnal photochemical-regime classification over study areas in O3 pollution period from April to September 2023. (a–h) the analysis utilizes eight-hourly HCHO NO2 ratio data from the GEMS satellite to classify the regional O3 formation dynamics in polluted areas (regions with GEMS NO2 columns exceeding 1.0×10¹⁵ molec cm−2), The classification thresholds for VOC-limited, transitional, and NOx-limited conditions are based on the relationship between hourly surface high O3 occurrence probabilities and GEMS HCHO NO2, as shown in Fig. 4.
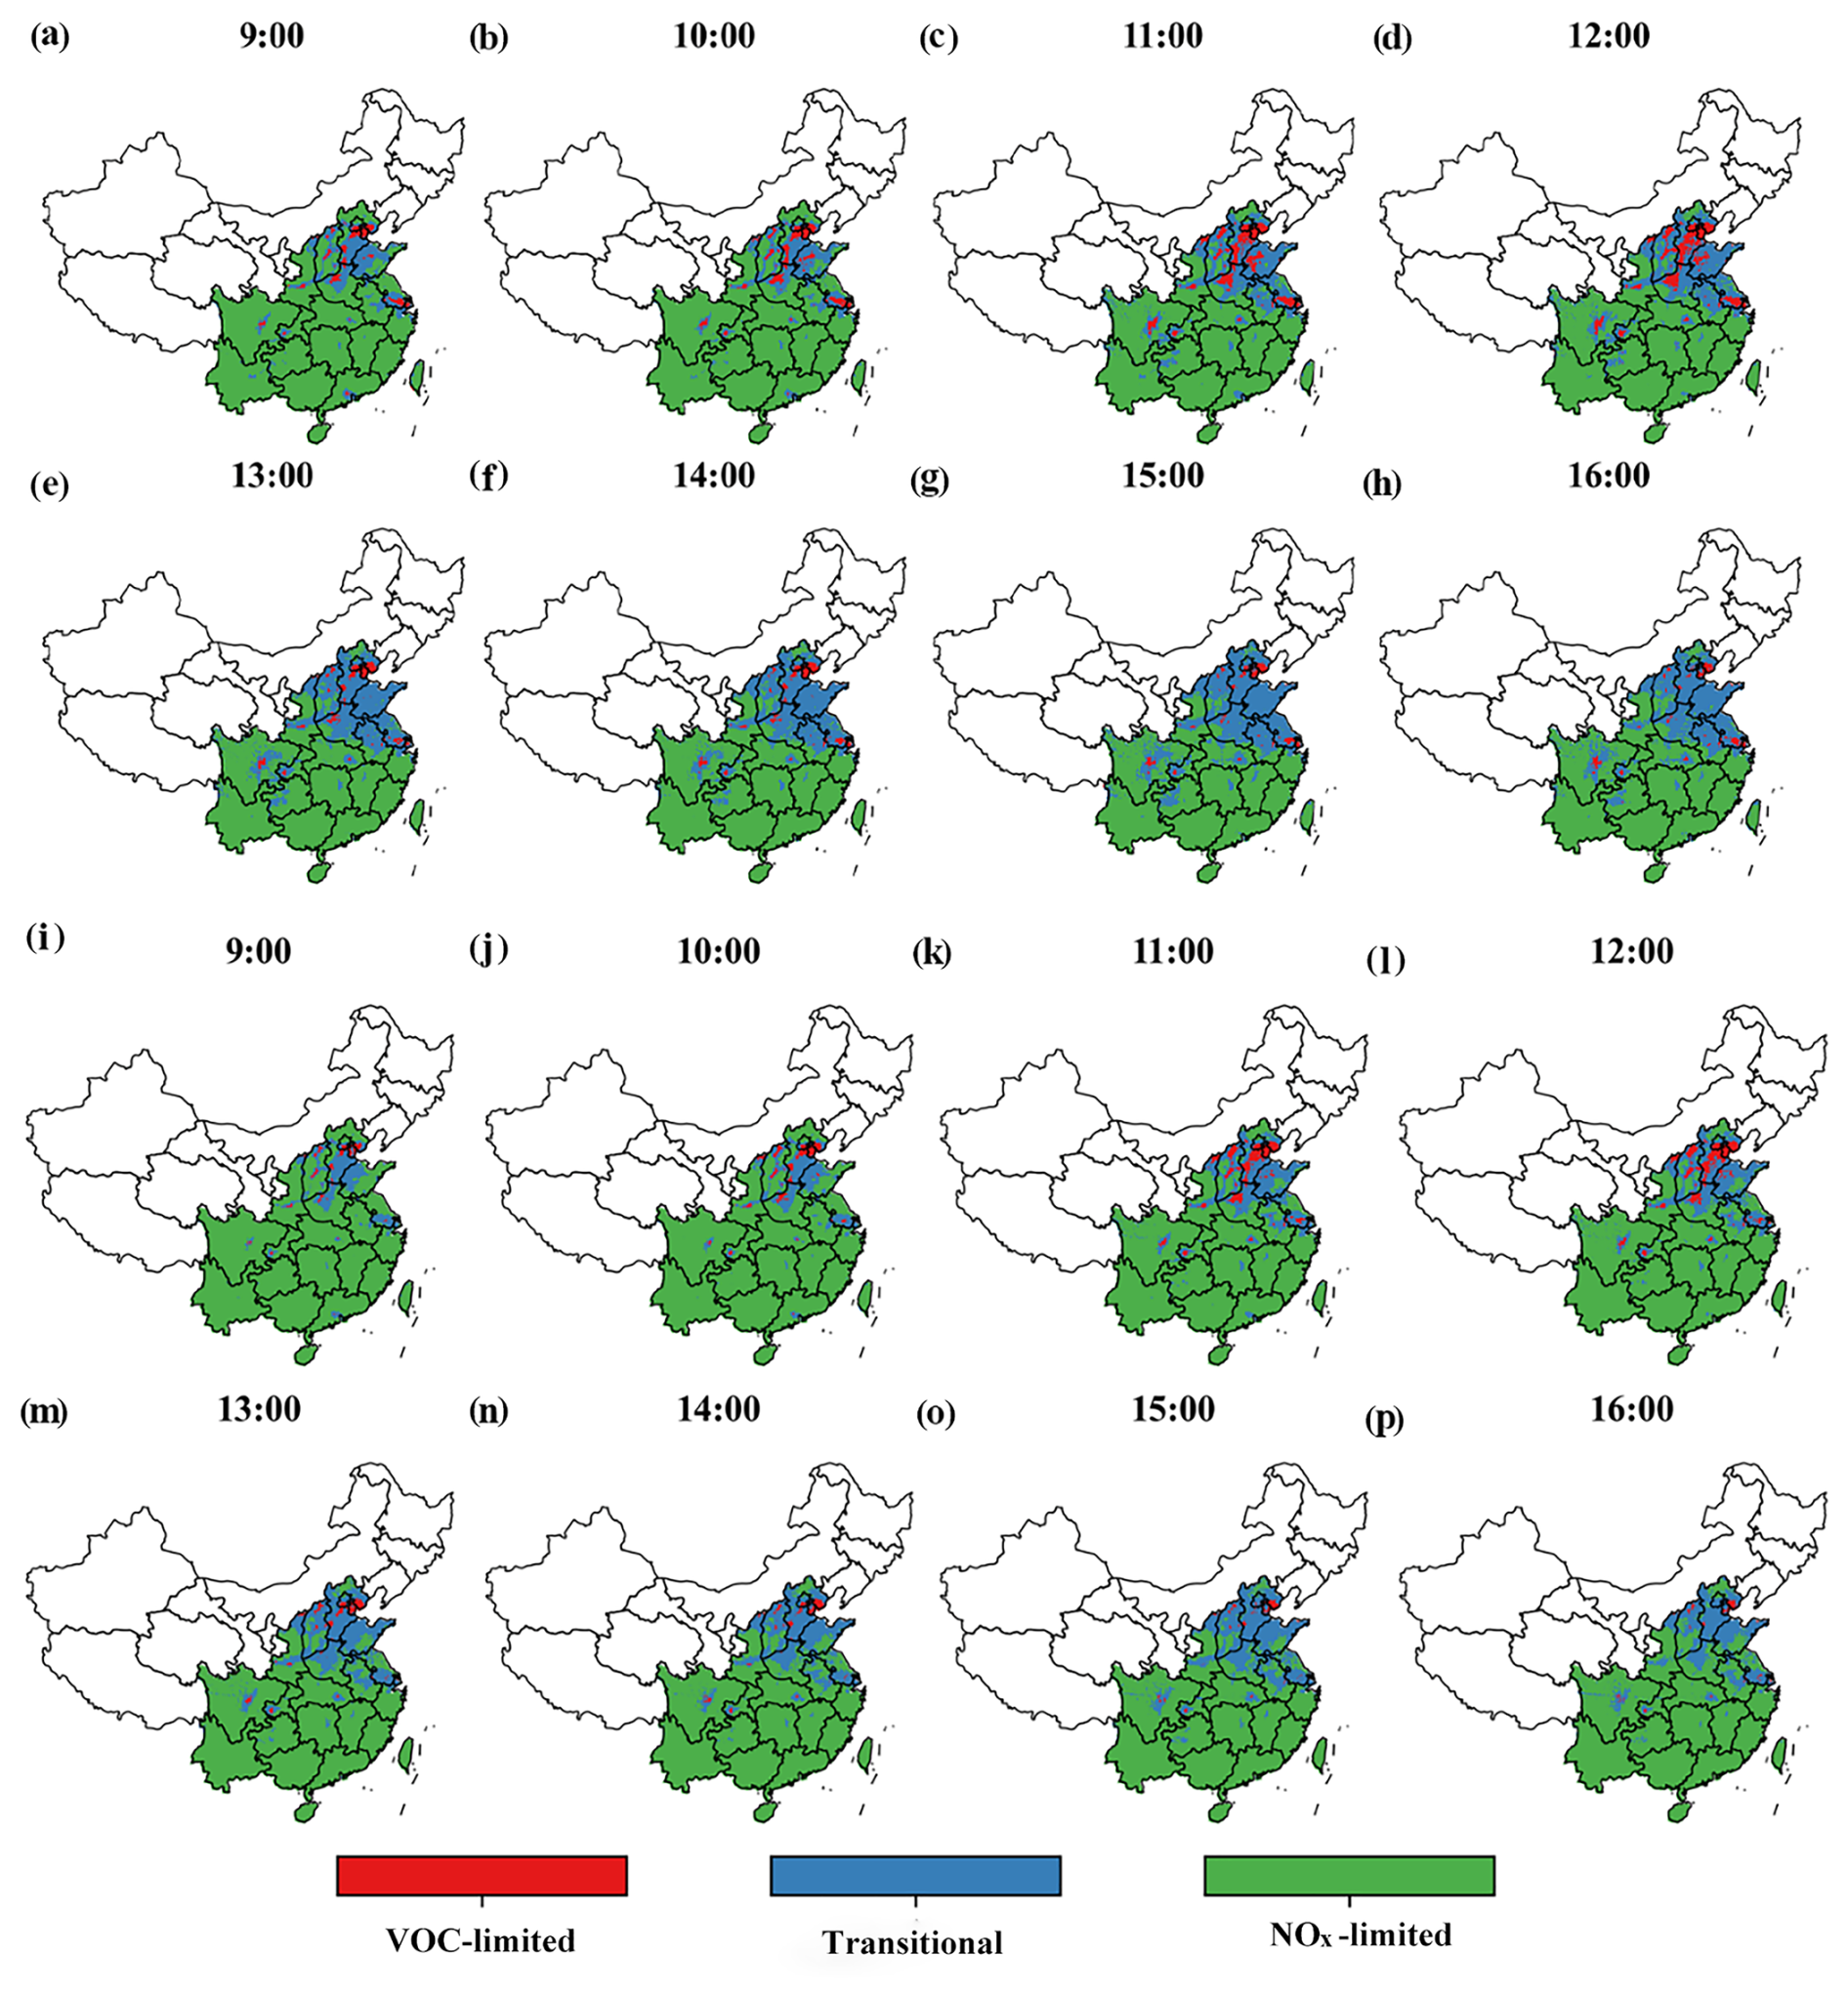
Figure 8Similar to Fig. 7, but for 2021 (a–h) and 2022 (i–p).
3.4 Analysis of O3 Formation Mechanisms in Representative Cities
Four representative cities – Beijing, Nanjing, Chengdu, and Guangzhou – were selected to represent the BTH, YRD, SC and PRD regions, respectively. A spatial masking was performed between the administrative boundaries of each city and the aforementioned ozone formation sensitivity regimes, thereby quantifying the fractional characteristics of the ozone formation regimes within each city. As shown in Fig. 9a–d, except for Guangzhou, the other three cities exhibit a high proportion of VOC-limited regimes during the daytime. Notably, the VOC-limited fraction in Beijing and Chengdu peaks around noon (12:00). The changes in ΔHCHO and ΔNO2, along with their rate-of-change ratio (|ΔHCHO ΔNO2|), serve as a robust indicator for tracking the dynamic response of relative precursor conversion intensities. With this analytical framework, we further combine the hourly meteorological conditions (Fig. 9e–h), the rates of change in ΔHCHO and ΔNO2 (Fig. 9i–l), and the correlations between pollutants and meteorological factors in each city (Tables S2–S5) to conduct a comparative analysis of ozone formation mechanisms and their diurnal evolution.
Beijing is characterized by the coexistence of VOC-limited and transitional regimes between 09:00 and 16:00, reflecting a NO2-abundant environment. More specifically, Beijing remains predominantly VOC-limited from 09:00 to 13:00, after which the fractions of the NOx-limited and transitional regimes gradually increase. Notably, taking 12:00 as a turning point, the VOC-limited fraction increases hourly before noon while the other regimes decrease, whereas after 12:00 the VOC-limited fraction declines sharply and reaches a minimum at 16:00, accompanied by a concurrent increase in the other two regimes, which peak at the same time. Strong SSR, particularly between 12:00 and 13:00, together with a rapidly increasing BLH, substantially enhances NO2 photolysis and weakens the titration of O3 by NO. As shown in Table S2, the negative correlation coefficients of NO2 with SSR and BLH are −0.384 and −0.219, respectively. Even so, under high-NOx emission conditions, ozone formation is still unlikely to enter a NOx-limited regime and is instead more strongly constrained by VOCs availability. Previous studies have shown that under NOx-rich conditions, ozone production is more sensitive to VOCs, and that boundary layer development and enhanced radiation further amplify this sensitivity (Ren et al., 2022). Consistently, Fig. 9i shows a relatively large net loss rate of NO2, whereas the increase in HCHO is comparatively limited, leading to low values of ΔHCHO ΔNO2 in the morning and further indicating VOC-limited ozone formation under a NOx-abundant background. In the afternoon, ΔHCHO ΔNO2 begins to increase, suggesting a transition toward a transitional regime with emerging NOx-limited characteristics.
O3 formation in Nanjing exhibits a more complex diurnal evolution, characterized by a predominantly transitional regime jointly controlled by VOCs and NOx, alongside a non-negligible contribution from the VOC-limited regime. During 09:00–11:00, the fractions of the NOx-limited and transitional regimes decrease, whereas the VOC-limited fraction increases. Taking 13:00 as a turning point, the former two regimes show an increase followed by a decrease, while the VOC-limited regime displays the opposite pattern. Compared with Beijing, the growth rate of the BLH in Nanjing is substantially weaker, whereas T2 m and RH are considerably higher. Such meteorological conditions may affect the efficiency of HO2 RO2 chain reactions, rendering ozone production more nonlinearly responsive to precursor changes and thereby leading to more complex dynamic behavior (Lu et al., 2019b). The statistical results (Table S3) further show that O3 is significantly positively correlated with both SSR and BLH (ρ= 0.507 and 0.387, respectively), whereas the correlation between NO2 and BLH is relatively weak (ρ= −0.017), indicating that ozone formation in Nanjing is jointly regulated by photochemical activity and complex boundary layer evolution. Consistent with this interpretation, the rates of change in ΔHCHO and ΔNO2 (Fig. 9j) increase synchronously after 12:00, resulting in a transient rise in ΔHCHO ΔNO2; however, this elevated ratio is not sustained. This indicates that Nanjing does not stably enter a single-precursor-limited regime but instead remains largely within a transitional state characterized by joint VOC-NOx control, reflecting strong photochemical activity under a NO2 -rich background.
In contrast, Chengdu is dominated by a VOC-limited regime, followed by the transitional regime, while the NOx-limited regime accounts for the smallest fraction. Before 12:00, the fractions of the NOx-limited and transitional regimes decrease hourly, accompanied by a continuous increase in the VOC-limited fraction. After 12:00, although the VOC-limited fraction decreases slightly, it remains substantially higher than the other two regimes. Ozone formation in Chengdu is strongly influenced by basin-induced meteorological conditions: the enclosed topography restricts atmospheric dispersion and suppresses photochemical intensity, while sustained traffic and industrial emissions maintain relatively high NOx levels, making ozone production more strongly constrained by VOC availability (Lu et al., 2019a). As shown in Table S4, the negative correlation between HCHO and RH (0.185) is substantially stronger than that between NO2 and RH (0.014), indicating that under basin conditions, high humidity exerts a more pronounced suppressive effect on HCHO accumulation, thereby further enhancing the sensitivity of ozone formation to VOCs. The rate-of-change characteristics of ΔHCHO and ΔNO2 further support this interpretation. Compared with the other three cities, Chengdu exhibits the smallest variability in both ΔHCHO and ΔNO2. During the morning (09:00–11:00), NO2 continues to increase, whereas HCHO does not show a corresponding enhancement, limiting the amplification of radical chain reactions and thereby suppressing rapid ozone formation. Even in the afternoon, when NO2 experiences sustained net loss and HCHO increases concurrently, ΔHCHO ΔNO2 remains persistently low, indicating that ozone formation in Chengdu is consistently dominated by a VOC-limited regime.
In Guangzhou, ozone formation is dominated by the transitional regime before 12:00, followed by the NOx-limited and VOC-limited regimes. After 12:00, the VOC-limited regime disappears, and ozone formation gradually shifts toward a pattern dominated by the NOx-limited regime, with the transitional regime as secondary. Among the four cities, Guangzhou exhibits the highest T2 m and RH, which may enhance photochemical reaction rates and contribute to the observed shift toward NOx-limited regimes in the afternoon. The statistical results further show (Table S5) that O3 is significantly positively correlated with T2 m (0.475) and SSR (0.578), whereas NO2 exhibits a negative correlation with SSR (−0.180), indicating that strong photochemical conditions promote NO2 photolysis and ozone formation. In addition, the continuously increasing anthropogenic and biogenic VOC emissions and oxidation processes in southern coastal regions maintain relatively high HCHO concentrations, which further contributes to the persistently low fraction of VOC-limited regimes (Wei et al., 2023). After 12:00, the net loss rate of NO2 weakens rapidly, whereas HCHO maintains stable positive production, leading to a pronounced short-term enhancement in the marginal sensitivity of ozone formation to NOx and a progressive transition toward a NOx-limited regime. Overall, Guangzhou is characterized by an HCHO-abundant regime driven by strong biogenic and anthropogenic VOC emissions. These features are consistent with previous understandings of ozone formation mechanisms in eastern and southern Chinese cities (Wang et al., 2021).
Therefore, effective ozone pollution control should avoid single-precursor strategies and instead implement coordinated and time-dependent reductions of VOCs and NOx tailored to different regions and meteorological conditions to achieve stable and effective ozone mitigation.
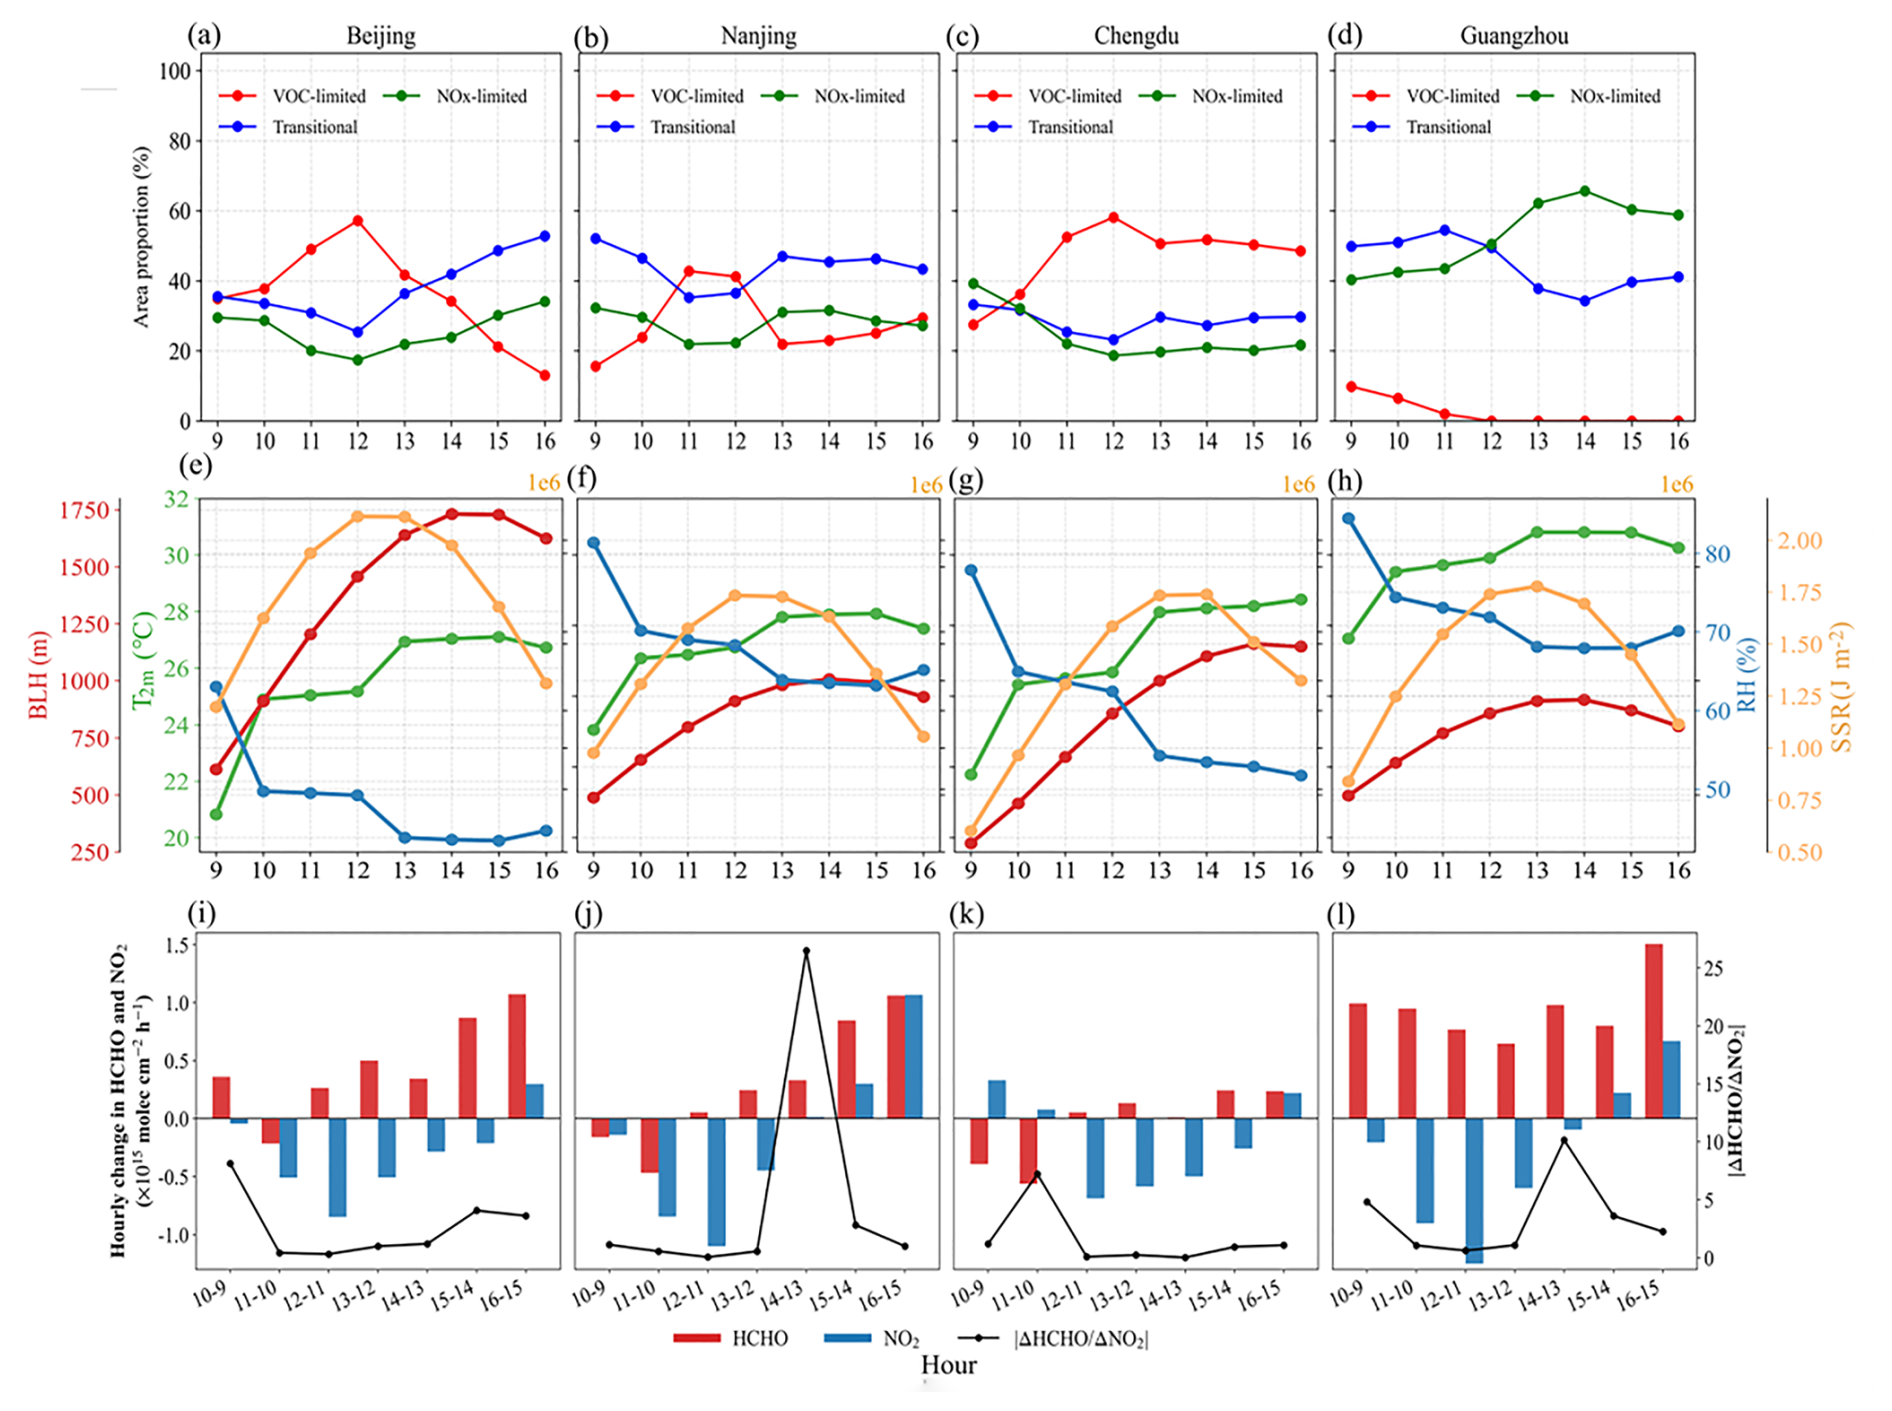
Figure 9Hourly-averaged diurnal variations of ozone formation regimes, meteorological conditions, and precursor concentrations for representative cities during the warm season from 2021 to 2023: Beijing (a, e, i), Nanjing (b, f, j), Chengdu (c, g, k), and Guangzhou (d, h, l). (a–d) Fractional contributions of O3 formation regimes. (e–h) hourly time series of meteorological variables (BLH, T2 m, RH, SSR). (i–l) hourly rates of change in ΔHCHO and ΔNO2.
HCHO is an important intermediate in the photochemical oxidation of VOCs, while NOx, as a key reactant in ozone formation, together with VOCs determines the sensitivity structure of ozone production. Here, utilizing GEMS satellite technology and ground-based monitoring stations, we analyzed the relationship between meteorological factors and the spatiotemporal distribution of O3–NOx-VOCs from 09:00 to 16:00 in major Chinese regions, based on hourly O3-NO2-HCHO data and meteorological parameters from the warm seasons of 2021–2023. In addition, the sensitivity characteristics of the HCHO-to-NO2 relationship were examined to analyze the spatiotemporal characteristics of O3 formation and the differences in formation mechanisms across major regions of China and representative cities (Beijing, Nanjing, Chengdu, and Guangzhou). The main conclusions are summarized as follows:
O3 and HCHO concentrations generally exhibited an upward trend from 09:00 to 16:00, peaking at 15:00 and 16:00, respectively. In contrast, NO2 concentrations generally declined, with a notable rebound only at 10:00. Spatially, elevated levels of O3, NO2 and HCHO were concentrated in the BTH, YRD, SC and PRD regions. Meteorologically, both T2 m and SSR exerted positive effects on ozone and HCHO concentrations. Meanwhile, enhanced photochemical activity and increased boundary layer height occasionally led to a reduction in nitrogen dioxide levels.
The scatter plot indicates that NOx reaches saturation at 09:00. During the afternoon period (after 12:00), the ozone formation environment exhibits a distinct non-linear trend characterized by high VOC concentrations and low NO2 concentrations. Moreover, compared to cubic polynomial fitting, LOESS fitting better highlights the diurnal variation characteristics of the quantitative relationship between FNR. Particularly after 12:00, the nonlinear relationship between O3–NOx-VOCs exhibits R2≥0.88, the O3 sensitivity curve remains consistent, peaking at 15:00 with a value of 1.97, and ranging from 1.40 to 2.45.
From the spatio-temporal distribution of ozone formation mechanisms, China's primary regions remain predominantly NOx-limited, with VOC-limited and transitional zones concentrated in the northern study area and parts of SC. Temporally, VOC-limited zones peak between 11:00 and 12:00, while transitional zones expand after 13:00. Additionally, the PRD region gradually transitioned from a VOC-limited pattern towards NOx-limited and transitional modes between 2021 and 2023.
With respect to the dominant drivers of the diurnal variation in ozone formation sensitivity across major urban regions, Beijing, Nanjing, Chengdu, and Guangzhou are selected as representative cities for the BTH, YRD, SC and PRD regions, respectively. The results show that Beijing, under a NOx-rich emission background, exhibits a VOC-limited regime driven by strong solar radiation and rapid boundary layer development, and transitions toward a transitional regime in the afternoon. Nanjing is dominated by a transitional regime jointly controlled by VOCs and NOx under hot and humid meteorological conditions, with complex diurnal variability arising from the nonlinear photochemical response of ozone formation to its precursors. Chengdu is dominated by a VOC-limited regime, primarily driven by basin-induced constraints on atmospheric dispersion that lead to persistent NOx accumulation and relatively weak photochemical activity, resulting in a comparatively stable diurnal pattern. Guangzhou, under hot and humid climatic conditions, experiences persistently high HCHO levels driven by active biogenic and anthropogenic VOC emissions, which promote a transition of ozone formation toward a NOx-limited regime.
In summary, our GEMS-based results largely confirm the existing mechanistic understanding: HCHO increases with enhanced photochemical activity, NO2 decreases due to photochemical loss, and the FNR-based spatial patterns are consistent with previous studies. An important extension was further achieved in this study by, for the first time, jointly analyzing hourly GEMS HCHO and NO2 observations together with ground-level O3 measurements to reveal the continuous spatiotemporal dynamic characteristics of ozone formation sensitivity on the diurnal scale, specifically characterized by a gradual transition in many urban regions from VOC-limited conditions in the morning to transitional or NOx-limited regimes in the afternoon. Therefore, our findings do not contradict existing theory; rather, they introduce a critical temporal dimension that cannot be resolved by previous satellite studies limited to daily-scale observations. Nevertheless, we acknowledge that several advanced mechanistic aspects are not directly addressed in this study. These include the specific roles of different VOC species (e.g., carbonyls versus aromatics) in radical production, the coupled effects of heterogeneous HO2 uptake and aerosol radiative processes on radical cycling and O3–NOx–VOCs sensitivity (Dyson et al., 2023; Wang et al., 2022; Li et al., 2018), as well as the differential contributions of anthropogenic and biogenic VOCs to ozone formation. Future research will further advance within a multi-process coupled framework by integrating regional air quality models, high-resolution anthropogenic VOC emission inventories, and aerosol–radiation interactions, while explicitly incorporating key mechanisms such as heterogeneous HO2 loss, to systematically elucidate the nonlinear response characteristics of O3–VOCs–NOx, thereby providing more robust scientific support for precise emission reduction and coordinated control strategies across different periods and regions.
GEMS satellite data (level-2 tropospheric NO2 and HCHO data) are accessible via the National Institute of Environmental Research (NIER) website (https://nesc.nier.go.kr/en/html/cntnts/91/static/page.do, last access: 6 July 2026). Ground-based ozone station data originate from the China National Atmospheric Environment Monitoring Network (https://air.cnemc.cn:18007/, last access: 6 July 2026). Land use type remote sensing data (30 m resolution) can be found at https://www.resdc.cn/DOI/doi.aspx?DOIid=54. 2 m temperature (T2 m), relative humidity (RH), surface solar radiation (SSR), and boundary layer height (BLH) can be downloaded from the ERA5 database (https://psl.noaa.gov/data/gridded/data.ncep.reanalysis.html, last access: 6 July 2026).
The supplement related to this article is available online at https://doi.org/10.5194/acp-26-10221-2026-supplement.
FQ and MM. Methodology: FQ. Investigation: CH, JW and YJ. Visualization: YJ and MM. Supervision: QF and JK. Writing – original draft: YJ, CH and MM. Writing – review & editing: MM. and JK.
The contact author has declared that none of the authors has any competing interests.
Publisher's note: Copernicus Publications remains neutral with regard to jurisdictional claims made in the text, published maps, institutional affiliations, or any other geographical representation in this paper. The authors bear the ultimate responsibility for providing appropriate place names. Views expressed in the text are those of the authors and do not necessarily reflect the views of the publisher.
The GEMS team is gratefully acknowledged for their valuable data and technical support in this study.
This work was supported by the Science and Technology Program of Guangdong Province (Science and Technology Innovation Platform Category) (grant no. 2019B121201002), the Guangdong Major Project of Basic and Applied Basic Research (grant no. 2020B0301030004) and the National Natural Science Foundation of China (grant nos. 42375182, 42175086 and 42075181).
This paper was edited by Jayanarayanan Kuttippurath and reviewed by two anonymous referees.
Acdan, J. J. M., Pierce, R. B., Dickens, A. F., Adelman, Z., and Nergui, T.: Examining TROPOMI formaldehyde to nitrogen dioxide ratios in the Lake Michigan region: implications for ozone exceedances, Atmos. Chem. Phys., 23, 7867–7885, https://doi.org/10.5194/acp-23-7867-2023, 2023.
Akimoto, H.: Global Air Quality and Pollution, Science, 302, 1716–1719, https://doi.org/10.1126/science.1092666, 2003.
Bae, K., Song, C.-K., Van Roozendael, M., Richter, A., Wagner, T., Merlaud, A., Pinardi, G., Friedrich, M. M., Fayt, C., Dimitropoulou, E., Lange, K., Bösch, T., Zilker, B., Latsch, M., Behrens, L. K., Ziegler, S., Ripperger-Lukosiūnaitė, S., Kuhn, L., Lauster, B., Reischmann, L., Uhlmannsiek, K., Cede, A., Tiefengraber, M., Gebetsberger, M., Park, R. J., Lee, H., Hong, H., Chang, L. S., and Jeon, K.: Validation of GEMS operational v2.0 total column NO2 and HCHO during the GMAP/SIJAQ campaign, Sci. Total Environ., 974, 179190, https://doi.org/10.1016/j.scitotenv.2025.179190, 2025.
Bottorff, B., Lew, M. M., Woo, Y., Rickly, P., Rollings, M. D., Deming, B., Anderson, D. C., Wood, E., Alwe, H. D., Millet, D. B., Weinheimer, A., Tyndall, G., Ortega, J., Dusanter, S., Leonardis, T., Flynn, J., Erickson, M., Alvarez, S., Rivera-Rios, J. C., Shutter, J. D., Keutsch, F., Helmig, D., Wang, W., Allen, H. M., Slade, J. H., Shepson, P. B., Bertman, S., and Stevens, P. S.: OH, HO2, and RO2 radical chemistry in a rural forest environment: measurements, model comparisons, and evidence of a missing radical sink, Atmos. Chem. Phys., 23, 10287–10311, https://doi.org/10.5194/acp-23-10287-2023, 2023.
Camalier, L., Cox, W., and Dolwick, P.: The effects of meteorology on ozone in urban areas and their use in assessing ozone trends, Atmos. Environ., 41, 7127–7137, https://doi.org/10.1016/j.atmosenv.2007.04.061, 2007.
Chang, C. Y., Faust, E., Hou, X. T., Lee, P. K., Hyun, C. K., Brent, C. H., and Liao, K. J.: Investigating ambient ozone formation regimes in neighboring cities of shale plays in the Northeast United States using photochemical modeling and satellite retrievals, Atmos. Environ., 142, 152–170, https://doi.org/10.1016/j.atmosenv.2016.06.058, 2016.
Chen, T. Z., Chu, B. W., Ma, J. Z., Ma, Q. X., Liu, Q., Wang, S. X., He, K. B., Zhao, J. C., and He, H.: Ozone Pollution in China: Current Status and Control Strategies, Engineering, 60, 15–19, https://doi.org/10.1016/j.eng.2025.06.044, 2025.
Coates, J., Mar, K. A., Ojha, N., and Butler, T. M.: The influence of temperature on ozone production under varying NOx conditions – a modelling study, Atmos. Chem. Phys., 16, 11601–11615, https://doi.org/10.5194/acp-16-11601-2016, 2016.
Duncan, B. N., Yoshida, Y., Olson, J. R., Sillman, S., Martin, R. V., Lamsal, L., Hu, Y., Pickering, K. E., Retscher, C., Allen, D. J., and Crawford, J. H.: Application of OMI observations to a space-based indicator of NOx and VOC controls on surface ozone formation, Atmos. Environ., 44, 2213–2223, https://doi.org/10.1016/j.atmosenv.2010.03.010, 2010.
Dyson, J. E., Whalley, L. K., Slater, E. J., Woodward-Massey, R., Ye, C., Lee, J. D., Squires, F., Hopkins, J. R., Dunmore, R. E., Shaw, M., Hamilton, J. F., Lewis, A. C., Worrall, S. D., Bacak, A., Mehra, A., Bannan, T. J., Coe, H., Percival, C. J., Ouyang, B., Hewitt, C. N., Jones, R. L., Crilley, L. R., Kramer, L. J., Acton, W. J. F., Bloss, W. J., Saksakulkrai, S., Xu, J., Shi, Z., Harrison, R. M., Kotthaus, S., Grimmond, S., Sun, Y., Xu, W., Yue, S., Wei, L., Fu, P., Wang, X., Arnold, S. R., and Heard, D. E.: Impact of HO2 aerosol uptake on radical levels and O3 production during summertime in Beijing, Atmos. Chem. Phys., 23, 5679–5697, https://doi.org/10.5194/acp-23-5679-2023, 2023.
Elise, P. and Tracey, H.: Evaluating current satellite capability to observe diurnal change in nitrogen oxides in preparation for geostationary satellite missions, Environ. Res. Lett., 15, 034038, https://doi.org/10.1088/1748-9326/ab6b36, 2020.
Feng, Z. Z., Xu, Y. S., Kobayashi, K., Dai, L. L., Zhang, T. Y., Agathokleous, E., Calatayud, V., Paoletti, E., Mukherjee, A., Agrawal, M., Park, R. J., Oak, Y. J., and Yue, X.: Ozone pollution threatens the production of major staple crops in East Asia, Nature Food, 3, 47–56, https://doi.org/10.1038/S43016-021-00422-6, 2022.
Fiore, A. M., Jacob, D. J., Bey, I., Yantosca, R. M., Field, B. D., and Fusco, A. C.: Background ozone over the United States in summer: origin, trend, and contribution to pollution episodes, J. Geophys. Res., 107, ACH 11-1–ACH 11-25, https://doi.org/10.1029/2001JD000982, 2002
Fu, W., Zhu, L., Kwon, H. A., Park, R. J., Lee, G. T., De Smedt, I., Liu, S., Li, X., Chen, Y., Pu, D., Li, J., Zuo, X., Zhang, P., Li, Y., Yan, Z., Zhang, X., Zhang, J., Wu, X., Shen, H., Ye, J., Wang, C., Fu, T.-M., and Yang, X.: Evaluating GEMS HCHO retrievals with TROPOMI product, Pandora observations, and GEOS-Chem simulations, Earth Space Sci., 12, e2024EA003894, https://doi.org/10.1029/2024EA003894, 2024.
Georgiana, G., Sabina, Ş., Constantin, R., and Cristinel, G.: Assessing of surface-ozone concentration in Bucharest, Romania, using OML and satellite data, Atmos. Pollut. Res., 7, 567–576, https://doi.org/10.1016/j.apr.2016.02.001, 2016.
Guicai, N., Wardle, D. A., and Yim, S. H. L.: Suppression of ozone formation at high temperature in China: from historical observations to future projections, Geophys. Res. Lett., 49, https://doi.org/10.1029/2021GL097090, 2022.
He, Q.: NOx emission inversion and near-surface NO2 estimation based on TROPOMI and GEMS, Ph.D. thesis, School of Environment and Surveying, China University of Mining and Technology, China, 136 pp., https://doi.org/10.27623/d.cnki.gzkyu.2025.000172, 2025.
Itahashi, S., Irie, H., Shimadera, H., and Chatani, S.: Fifteen-Year Trends (2005–2019) in the Satellite-Derived Ozone-Sensitive Regime in East Asia: A Gradual Shift from VOC-Sensitive to NOx-Sensitive, Remote Sensing, 14, 4512, https://doi.org/10.3390/rs14184512, 2022.
Jacob, D. J.: Heterogeneous chemistry and tropospheric ozone, Atmos. Environ., 34, 2131–2159, https://doi.org/10.1016/S1352-2310(99)00462-8, 2000.
Jairo, V. S., Hata, H., Martinez-Noriega, E. J., and Inoue, K.: Ozone trends and their sensitivity in global megacities under the warming climate, Nat. Commun., 15, 10236, https://doi.org/10.1038/s41467-024-54490-w, 2024.
Javed, Z., Liu, C., Khokhar, M. F., Tan, W., Liu, H., Xing, C., Ji, X., Tanvir, A., Hong, Q., and Sandhu, O.: Ground-Based MAX-DOAS Observations of CHOCHO and HCHO in Beijing and Baoding, China, Remote Sens., 11, 1524, https://doi.org/10.3390/rs11131524, 2019.
Jin, X. and Holloway, T.: Spatial and temporal variability of ozone sensitivity over China observed from the Ozone Monitoring Instrument, J. Geophys. Res.-Atmos., 120, 7229–7246, https://doi.org/10.1002/2015JD023250, 2015.
Jin, X. M., Arlene, M. F., Lee, T. M., Lukas, C. V., Lok, N. L., Bryan, D. K., Folkert, B., Isabelle, D. S., Gonzalo, G. A., Kelly, C., and Gail, S. T.: Evaluating a space-based indicator of surface ozone-NOx-VOC sensitivity over midlatitude source regions and application to decadal trends, J. Geophys. Res.-Atmos., 122, 10439–10461, https://doi.org/10.1002/2017JD026720, 2017.
Ju, T., Wang, L., Li, B., Lv, Z., and Gu, Z.: Study on correlation between atmospheric pollutants and meteorological factors during extreme weather in Mexico based on GTWR model, Air Qual. Atmos. Hlth., 18, 1–17, https://doi.org/10.1007/s11869-025-01724-5, 2025.
Kim, J., Jeong, U., Ahn, M. H., Kim, J. H., Park, R. J., Lee, H. L., Song, C. H., Choi, Y. S., Lee, K. H., Yoo, J. M., Jeong, M. J., Park, S. K., Lee, K. M., Song, C. K., Kim, S. W., Kim, Y. J., Kim, S. W., Kim, M. J., Go, S. J., Liu, X., Chance, K., Miller, C. C., Jay, A. S., Ben, V., Bhartia, P. K., Torres, O., Abad, G. G., Haffner, D. P., Ho, K. D., Lee, S. H., Woo, J. H., Chong, H. S., Park, S. S., Nicks, D., and Cho, W. J.: New era of air quality monitoring from space: Geostationary Environment Monitoring Spectrometer (GEMS), B. Am. Meteorol. Soc., 101, E1–E22, https://doi.org/10.1175/BAMS-D-18-0013.1, 2020.
Kim, J.: Diurnal variation of atmospheric composition in Asia seen from space: GEMS, ACAM 2023 Workshop, Boulder, CO, 30 May–2 June, https://www.acom.ucar.edu/webt/ACAM/2023/presentations/O2.03_Kim.pdf (last access: 6 July 2026), 2023.
Klára, Č., Kamil, L., Ladislav, M., and Martin, S.: Intercomparison of Ground- and Satellite-Based Total Ozone Data Products at Marambio Base, Antarctic Peninsula Region, Atmosphere, 10, 721, https://doi.org/10.3390/atmos10110721, 2019.
Lange, K., Richter, A., Bösch, T., Zilker, B., Latsch, M., Behrens, L. K., Okafor, C. M., Bösch, H., Burrows, J. P., Merlaud, A., Pinardi, G., Fayt, C., Friedrich, M. M., Dimitropoulou, E., Van Roozendael, M., Ziegler, S., Ripperger-Lukosiunaite, S., Kuhn, L., Lauster, B., Wagner, T., Hong, H., Kim, D., Chang, L.-S., Bae, K., Song, C.-K., Park, J.-U., and Lee, H.: Validation of GEMS tropospheric NO2 columns and their diurnal variation with ground-based DOAS measurements, Atmos. Meas. Tech., 17, 6315–6344, https://doi.org/10.5194/amt-17-6315-2024, 2024.
Li, J. J. and Li, Y.: Impact of Large-Scale Circulations on Ground-Level Ozone Variability over Eastern China, Atmosphere, 15, 1400, https://doi.org/10.3390/atmos15121400, 2024.
Li, J., Chen, X. S., Wang, Z. F., Du, H. Y., Yang, W. Y., Sun, Y. L., Hu, B., Li, J. J., Wang, W., Wang, T., Fu, P. Q., and Huang, H. L.: Radiative and heterogeneous chemical effects of aerosols on ozone and inorganic aerosols over East Asia, Sci. Total Environ., 622–623, 1327–1342, https://doi.org/10.1016/j.scitotenv.2017.12.041, 2018.
Li, J., Wang, H., Gong, D., Li, Q., Wang, Y., Zhao, W., Zhang, C., Zhou, Z., Zhao, Y., Xu, Q., Zhou, Y., He, C., Ristovski, Z., Morawska, L., Liu, S. C., and Wang, B.: Landscape fragmentation triggers cascading enhancement of surface ozone production, Commun. Earth Environ., 6, 931, https://doi.org/10.1038/s43247-025-02866-1, 2025.
Li, T. W. and Chen, X.: Estimating daily full-coverage surface ozone concentration using satellite observations and a spatiotemporally embedded deep learning approach, Int. J. Appl. Earth Obs., 101, 102356, https://doi.org/10.1016/J.JAG.2021.102356, 2021.
Li, Y.: Study on Ozone Formation Sensitivity in the Pearl River Delta Based on Satellite Remote Sensing and Air Quality Models, PhD thesis, South China University of Technology, China, https://doi.org/10.27151/d.cnki.ghnlu.2021.005599, 2021.
Li, Y., Yu, C., Tao, J., Lu, X., and Chen, L.: Analysis of Ozone Formation Sensitivity in Chinese Representative Regions Using Satellite and Ground-Based Data, Remote Sens., 16, 316, https://doi.org/10.3390/rs16020316, 2024.
Li, Y., Li, C., Li, Y., Wang, T., Li, M., Qu, Y., Wu, H., Xie, M., and Wang, Y.: Decadal evolution of aerosol-mediated ozone responses in Eastern China under clean air actions and carbon neutrality policies, Atmos. Chem. Phys., 26, 1301–1319, https://doi.org/10.5194/acp-26-1301-2026, 2026.
Liang, Y. N., Wang, X. H., Qi, S. M., Xu, J. M., and Liu, R.: Analysis of Ozone Formation Sensitivity in Guangdong Province Based on OMI Satellite and Ground Observation Data, Environmental Science, 45, 6248–6254, https://doi.org/10.13227/j.hjkx.202311261, 2024.
Lyu, C. G., Zhang, W. M., Zhang, C., Shi, Y. F., Zhang, Y., and Wang, Y. P.: Evaluating the spatial representativeness of ground-based observations for satellite total ozone products, Int. J. Appl. Earth Obs., 129, 103778, https://doi.org/10.1016/J.JAG.2024.103778, 2024.
Liu, Y. and Wang, T.: Worsening urban ozone pollution in China from 2013 to 2017 – Part 1: The complex and varying roles of meteorology, Atmos. Chem. Phys., 20, 6305–6321, https://doi.org/10.5194/acp-20-6305-2020, 2020.
Lu, X., Zhang, L., Chen, Y., Zhou, M., Zheng, B., Li, K., Liu, Y., Lin, J., Fu, T.-M., and Zhang, Q.: Exploring 2016–2017 surface ozone pollution over China: source contributions and meteorological influences, Atmos. Chem. Phys., 19, 8339–8361, https://doi.org/10.5194/acp-19-8339-2019, 2019a.
Lu, X., Zhang, L., and Shen, L.: Meteorology and Climate Influences on Tropospheric Ozone: a Review of Natural Sources, Chemistry, and Transport Patterns, Current Pollution Reports, 5, 238–260, https://doi.org/10.1007/s40726-019-00118-3, 2019b.
Mahajan, A. S., Isabelle, D. S., Mriganka, S. B., Sachin, G., Suvarna, F., Chaitri, R., and Michel, V. R.: Inter-annual variations in satellite observations of nitrogen dioxide and formaldehyde over India, Atmos. Environ., 116, 194–201, https://doi.org/10.1016/j.atmosenv.2015.06.004, 2015.
Martin, R. V., Fiore, A. M., and Van Donkelaar, A.: Spacebased diagnosis of surface ozone sensitivity to anthropogenic emissions, Geophys. Res. Lett., 31, https://doi.org/10.1029/2004GL019416, 2004.
Menut, L., Bessagnet, B., Briant, R., Cholakian, A., Couvidat, F., Mailler, S., Pennel, R., Siour, G., Tuccella, P., Turquety, S., and Valari, M.: The CHIMERE v2020r1 online chemistry-transport model, Geosci. Model Dev., 14, 6781–6811, https://doi.org/10.5194/gmd-14-6781-2021, 2021.
Monks, P. S., Archibald, A. T., Colette, A., Cooper, O., Coyle, M., Derwent, R., Fowler, D., Granier, C., Law, K. S., Mills, G. E., Stevenson, D. S., Tarasova, O., Thouret, V., von Schneidemesser, E., Sommariva, R., Wild, O., and Williams, M. L.: Tropospheric ozone and its precursors from the urban to the global scale from air quality to short-lived climate forcer, Atmos. Chem. Phys., 15, 8889–8973, https://doi.org/10.5194/acp-15-8889-2015, 2015.
Oak, Y. J., Jacob, D. J., Balasus, N., Yang, L. H., Chong, H., Park, J., Lee, H., Lee, G. T., Ha, E. S., Park, R. J., Kwon, H.-A., and Kim, J.: A bias-corrected GEMS geostationary satellite product for nitrogen dioxide using machine learning to enforce consistency with the TROPOMI satellite instrument, Atmos. Meas. Tech., 17, 5147–5159, https://doi.org/10.5194/amt-17-5147-2024, 2024.
Pan, Q. Q.: Spatiotemporal Distribution Characteristics of Ozone and Its Precursors in the Yangtze River Delta Region and Analysis of Ozone Formation Processes under Different NOx Emission Scenarios, PhD thesis, Donghua University, China, https://doi.org/10.27012/d.cnki.gdhuu.2023.001648, 2023.
Peng, H. C., Xing, C. Z., Li, Y. K., Zhang, C. X., Lin, J. N., Xue, J. K., Wang, X. H., Song, Y. H., Niu, X. H., and Liu, C.: Studies on regional ozone formation sensitivities and transport with higher spatiotemporal resolutions in a stereoscopic dimension: GEMS and vertical observations, Atmos. Res., 302, 107314, https://doi.org/10.1016/j.atmosres.2024.107314, 2024.
Ren, J., Guo, F., and Xie, S.: Diagnosing ozone–NOx–VOC sensitivity and revealing causes of ozone increases in China based on 2013–2021 satellite retrievals, Atmos. Chem. Phys., 22, 15035–15047, https://doi.org/10.5194/acp-22-15035-2022, 2022.
Romer, P. S., Duffey, K. C., Wooldridge, P. J., Edgerton, E., Baumann, K., Feiner, P. A., Miller, D. O., Brune, W. H., Koss, A. R., de Gouw, J. A., Misztal, P. K., Goldstein, A. H., and Cohen, R. C.: Effects of temperature-dependent NOx emissions on continental ozone production, Atmos. Chem. Phys., 18, 2601–2614, https://doi.org/10.5194/acp-18-2601-2018, 2018.
Sillman, S.: The relation between ozone, NOx and hydrocarbons in urban and polluted rural environments, Atmos. Environ., 33, 1821–1845, https://doi.org/10.1016/S1352-2310(98)00345-8, 1999.
Sillman, S. and He, D.: Some theoretical results concerning O3-NO-VOC chemistry and NO-VOC indicators, J. Geophys. Res.-Atmos., 107, ACH 26-1–ACH 26-15, https://doi.org/10.1029/2001JD001123, 2002.
Souri, A., Nowlan, C., Wolfe, G., Lamsal, L., Miller, C., Abad, G. G., Janz, S., Fried, A., Blake, D., Weinheimer, A., Diskin, G., Liu, X., and Chance, K.: Revisiting the effectiveness of HCHO NO2 ratios for inferring ozone sensitivity to its precursors using high resolution airborne remote sensing observations in a high ozone episode during the KORUS-AQ campaign, Atmos. Environ., 224, 117341, https://doi.org/10.1016/j.atmosenv.2020.117341, 2020.
Sun, Y., Yin, H., Liu, C., Zhang, L., Cheng, Y., Palm, M., Notholt, J., Lu, X., Vigouroux, C., Zheng, B., Wang, W., Jones, N., Shan, C., Qin, M., Tian, Y., Hu, Q., Meng, F., and Liu, J.: Mapping the drivers of formaldehyde (HCHO) variability from 2015 to 2019 over eastern China: insights from Fourier transform infrared observation and GEOS-Chem model simulation, Atmos. Chem. Phys., 21, 6365–6387, https://doi.org/10.5194/acp-21-6365-2021, 2021.
Tan, Z., Lu, K., Jiang, M., Su, R., Wang, H., Lou, S., Fu, Q., Zhai, C., Tan, Q., Yue, D., Chen, D., Wang, Z., Xie, S., Zeng, L., and Zhang, Y.: Daytime atmospheric oxidation capacity in four Chinese megacities during the photochemically polluted season: a case study based on box model simulation, Atmos. Chem. Phys., 19, 3493–3513, https://doi.org/10.5194/acp-19-3493-2019, 2019.
Tang, G., Wang, Y., Li, X., Ji, D., Hsu, S., and Gao, X.: Spatial-temporal variations in surface ozone in Northern China as observed during 2009–2010 and possible implications for future air quality control strategies, Atmos. Chem. Phys., 12, 2757–2776, https://doi.org/10.5194/acp-12-2757-2012, 2012.
Trainer, M., Williams, E. J., Parrish, D. D., Buhr, M. P., Allwine, E. J., Westberg, H. H., Fehsenfeld, F. C., and Liu, S. C.: Models and observations of the impact of natural hydrocarbons on rural ozone, Nature, 329, 705–707, https://doi.org/10.1038/329705a0, 1987.
Wu, Y., Huo, J., Yang, G., Wang, Y., Wang, L., Wu, S., Yao, L., Fu, Q., and Wang, L.: Measurement report: Production and loss of atmospheric formaldehyde at a suburban site of Shanghai in summertime, Atmos. Chem. Phys., 23, 2997–3014, https://doi.org/10.5194/acp-23-2997-2023, 2023.
Wu, W. L., Xue, W. B., Lei, Y., and Wang, J. N.: Sensitivity of Ozone Formation in the Beijing-Tianjin-Hebei Region and Surrounding Areas Based on OMI Data, China Environmental Science, 38, 1201–1208, https://doi.org/10.19674/j.cnki.issn1000-6923.2018.0143, 2018.
Wang, R., Bei, N., Tie, X., Wu, J., Liu, S., Li, X., Yu, J., Jiang, Q., and Li, G.: Effects of hydroperoxy radical heterogeneous loss on the summertime ozone formation in the North China Plain, Sci. Total Environ., 825, 153993, https://doi.org/10.1016/j.scitotenv.2022.153993, 2022.
Wang, R. F., Ma, X. D., Zhao, T. L., Wang, H. L., Ding, H., and Zheng, X. B.: Evaluation of the Applicability of MACC Reanalysis Ozone Data over China Using Ground-Based Observations and AIRS Satellite Data, Environmental Science, 40, 4412–4422, https://doi.org/10.13227/j.hjkx.201904029, 2019.
Wang, W., van der A, R., Ding, J., van Weele, M., and Cheng, T.: Spatial and temporal changes of the ozone sensitivity in China based on satellite and ground-based observations, Atmos. Chem. Phys., 21, 7253–7269, https://doi.org/10.5194/acp-21-7253-2021, 2021.
Wang, W., Li, X., Cheng, Y., Parrish, D. D., Ni, R., Tan, Z., Liu, Y., Lu, S., Wu, Y., and Chen, S.: Ozone pollution mitigation strategy informed by long-term trends of atmospheric oxidation capacity, Nat. Geosci., 17, 20–25, https://doi.org/10.1038/s41561-023-01334-9, 2024.
Wang, Y., Lampel, J., Xie, P., Beirle, S., Li, A., Wu, D., and Wagner, T.: Ground-based MAX-DOAS observations of tropospheric aerosols, NO2, SO2 and HCHO in Wuxi, China, from 2011 to 2014, Atmos. Chem. Phys., 17, 2189–2215, https://doi.org/10.5194/acp-17-2189-2017, 2017.
Wei, C. B., Yu, G. H., Cao, L. M., Han, H. X., Xia, S. Y., and Huang, X. F.: Tempo-spacial variation and source apportionment of atmospheric formaldehyde in the Pearl River Delta, China, Atmos. Environ., 312, 120016, https://doi.org/10.1016/j.atmosenv.2023.120016, 2023.
Xie, M., Zhu, K., Wang, T., Chen, P., Han, Y., Li, S., Zhuang, B., and Shu, L.: Temporal characterization and regional contribution to O3 and NOx at an urban and a suburban site in Nanjing, China, Sci. Total Environ., 551–552, 533–545, https://doi.org/10.1016/j.scitotenv.2016.02.047, 2016.
Xu, J., Zhang, Z., Rao, L. L., Wang, Y. P., Yan, H. H., Hu, S. T., Shi, C., Liu, S., Gegen, T., Wang, W. Y., Shi, E., Yao, S., Zhu, J., Wang, Y. M., Dong, X. L., and Shi, J. C.: Tropospheric ozone retrieval from satellite remote sensing – a review, Advances in Earth Science, 39, 56–70, 2024.
Xu, W., Yang, H., He, M., Yang, Z., Zhang, Y., Liu, Z. H., and He, Y. M.: Spatiotemporal Distribution and Influencing Factors of Ozone Formation Sensitivity in the Chengdu-Chongqing Region, Environmental Science, 46, 736–745, https://doi.org/10.13227/j.hjkx.202312065, 2025.
Xia, N., Du, E. Z., Guo, Z. D., and Wim, D. V.: The diurnal cycle of summer tropospheric ozone concentrations across Chinese cities: Spatial patterns and main drivers, Environ. Pollut., 286, 117547, https://doi.org/10.1016/ 10.1016/j.envpol.2021.117547, 2021.
Yao, C., Yang, X., Huang, D. D., Donger, L., Yi, C., Guo, J., Xin, F., Hui, L. R., Wang, Q., Huang, C., Wang, H. L., and Wang, Z.: Photochemical impacts of atmospheric carbonyl compounds on ozone formation and radical chemistry in urban Shanghai, Environ. Pollut., 380, 126557, https://doi.org/10.1016/ 10.1016/j.envpol.2025.126557, 2025.
Yu, L., Cheng, M. M., Guo, Z., Zhang, X. Y., Cui, X. M., and Chen, S. G.: Increase in Surface Ozone over Beijing-Tianjin-Hebei and the Surrounding Areas of China Inferred from Satellite Retrievals, 2005–2018, Aerosol Air Qual. Res., 20, 2170–2184, https://doi.org/10.4209/aaqr.2019.11.0603, 2020.
Yang, X., Wu, K., Wang, H., Liu, Y., and Wang, Z.: Summertime ozone pollution in Sichuan Basin, China: Meteorological conditions, sources and process analysis, Atmos. Environ., 226, 117392, https://doi.org/10.1016/j.atmosenv.2020.117392, 2020.
Yang, Y. M, Li, X., Zu, K. X., Lian, C. F., Chen, S. Y., Dong, H. B., Feng, M., Liu, H. F., Liu, J. W., Lu, K. D., Lu, S. H., Ma, X. F., Song, D. L., Wang, W. G., Yang, S. D., Yang, X. P., Yu, X. N., Zhu, Y., Zeng, L. M., Tan, Q. W., and Zhang, Y. H.: Elucidating the effect of HONO on O3 pollution by a case study in southwest China, Sci. Total Environ., 756, 144127, https://doi.org/10.1016/j.scitotenv.2020.144127, 2021.
Zhang, H., Shi, C., Ying, C., Weng, S., Ni, E., Zhao, L., Yang, P., Tang, K., Zhou, X., Ren, C., Chi, X., Zhou, D., Li, M., Li, N., Liu, T., and Huang, X.: HONO formation mechanisms and impacts on ambient oxidants in coastal regions of Fujian, China, Atmos. Chem. Phys., 25, 16797–16816, https://doi.org/10.5194/acp-25-16797-2025, 2025.
Zhang, J. X., Gao, Y., Leung, L. R., Luo, K., Wang, M. H., Zhang, Y., Bell, M. L., and Fan, J. R.: Disentangling the mechanism of temperature and water vapor modulation on ozone under a warming climate, Environ. Res. Lett., 17, 124032, https://doi.org/10.1088/1748-9326/ACA3BC, 2022.
Zhang, K. and Batterman, S. A.: Time allocation shifts and pollutant exposure due to traffic congestion: an analysis using the national human activity pattern survey, Sci. Total Environ., 407, 5493–5500, https://doi.org/10.1016/j.scitotenv.2009.07.008, 2009.