
the Creative Commons Attribution 4.0 License.
the Creative Commons Attribution 4.0 License.
 | 17 Jul 2026
Aerosol-deep convection interaction based on joint cell-thermal tracking in Large Eddy Simulations during the TRACER campaign
Daniel Hernandez-Deckers
Toshihisa Matsui
Takamichi Iguchi
Kelcy Brunner
Eric Bruning
Marcus van Lier-Walqui
Edward R. Mansell
Tamanna Subba
Chongai Kuang
Michael P. Jensen
Scott Braun
In cumulus clouds, aerosol concentrations control cloud droplet concentrations, modifying cloud radiative properties, precipitation processes, and cloud electrification. However, mechanisms of aerosol-deep convection interactions are not well understood due to complex cloud dynamics and microphysics. We investigate the interaction of aerosols with isolated deep convection using Large Eddy Simulations of two cases during the TRacking Aerosol Convection interactions ExpeRiment (TRACER) near Houston, Texas, using a joint cell-thermal tracking algorithm. Cumulus thermals are droplet generators, since supersaturation and droplet nucleation coincide with thermal centers, where the strongest updrafts occur. Primary ice crystal formation does not take place inside thermals, but at layers where previous thermals detrained moisture. As subsequent thermals containing supercooled droplets penetrate these layers, hail and graupel form at or near these thermals. Higher aerosol concentrations result in higher droplet concentrations that suppress drizzle, delay warm rain processes, and transport more moisture aloft. This increases snow and ice amount, as well as graupel and hail, leading to more lightning. Polluted thermals initiate at slightly higher altitudes, and are slightly larger and faster, suggesting a weak invigoration. We also find more thermals per cell, but fewer isolated cells, since convection is more aggregated and intense, especially near the end of the 24 h simulation. Non-linear mesoscale feedback likely triggered by temperature and moisture responses to aerosol-thermal interactions causes the aggregation. Time-lagged aerosol-reinitialization experiments show that the mesoscale response is the predominant forcing for the invigoration. These changes happen within one day, on a smaller scale than previously suggested.
- Article
(21849 KB) - Full-text XML
-
Supplement
(4172 KB) - BibTeX
- EndNote


Research over the past few decades has shown that aerosols can impact the microphysics, dynamics, and electrification of clouds (Tao et al., 2012). Higher aerosol concentrations result in smaller but more numerous cloud droplets, increasing cloud albedo (Twomey, 1974), cloud cover and lifetime (Albrecht, 1989; Ackerman et al., 2000), and delaying warm precipitation processes (e.g., Andreae et al., 2004; Givati and Rosenfeld, 2004). However, when mixed-phase clouds come into play, some results suggest “invigoration” of convection due to an enhancement of vertical velocity and ice-microphysical processes (Andreae et al., 2004; Koren et al., 2005; Lin et al., 2006; Li et al., 2011; Hu et al., 2019; Abbott and Cronin, 2021; Yin et al., 2024). The former process (i.e., impact of droplet nucleation and condensation) is called warm-phase invigoration, whereas the latter process (i.e., droplet freezing in the mixed-phase layer) is called cold-phase invigoration, Rosenfeld et al., 2008).
The mechanisms behind these impacts are not yet fully understood. Khain et al. (2008) classified invigoration/suppression of deep convection as a function of ambient humidity associated with condensation increases/decreases due to enhanced aerosol concentrations, which highlights how different ambient conditions can lead to different responses to aerosol concentrations. Such responses are also not linear and can depend on other factors such as aerosol size. For example, using observations over the Houston area, Hu et al. (2019) found that for environments with similar Convective Available Potential Energy (CAPE), convective clouds have a higher radar echo-top height and increased lightning activity for aerosol concentrations up to 1000 cm−3. They also report that increasing aerosol concentrations above about 1200 cm−3 in fact decreases lightning activity, and that differences between urban and rural areas are only present at low aerosol concentrations (less than 500 cm−3). More recently, Yin et al. (2024) show that fine aerosols invigorate deep convective systems by making them deeper and longer lived, whereas coarse sea salt aerosols inhibit convective vertical growth, but enhance warm rain production. On the other hand, convective invigoration is still debated in terms of warm- and cold-phase microphysics processes (Varble et al., 2023; Öktem et al., 2023; Fan et al., 2025). This is primarily due to the lack of fundamental understanding of the cloud microphysics associated with cloud turbulence/dynamics within the convective core, and also their dynamical feedback at different spatio-temporal scales (Hirt et al., 2020; Stephens et al., 2024).
It is widely accepted that cumulus clouds consist of updrafts that are transient in nature and actually resemble rising bubbles (e.g. Scorer and Ludlam, 1953; Saunders, 1961; Blyth et al., 2005; Sherwood et al., 2013; Yano, 2014; Romps et al., 2021). These bubbles, or “thermals”, are coherent volumes of rising air, typically with an internal toroidal circulation, as shown by observations (e.g. Damiani et al., 2006) and high-resolution simulations (e.g. Hernandez-Deckers and Sherwood, 2016; Peters et al., 2020). Although conceptual models of such clouds for numerical simulations where they are not explicitly resolved have mainly been developed assuming a “steady, entraining plume” (e.g. Arakawa and Schubert, 1974), there has been a growing interest in introducing the thermal concept, or fundamental aspects of it, to better describe cumulus convection and possibly improve cumulus parameterizations (e.g., Hu, 1997; Peters et al., 2020; Gu et al., 2020; Vraciu et al., 2023, 2025).
Sherwood et al. (2013) proposed that the internal circulation within thermals could explain how high entrainment rates do not necessarily imply substantial drag, a conclusion that is not necessarily consistent with the classical steady entraining-plume concept. Romps and Charn (2015) showed that, nevertheless, thermals do sustain significant drag that balances buoyancy, so that they rise at nearly constant speed. Hernandez-Deckers and Sherwood (2016) performed a more detailed momentum budget analysis, which highlighted the transient nature of thermals, and Hernandez-Deckers and Sherwood (2018) tested multiple entrainment relations for thermals. They found that thermal size is the most relevant determining factor for entrainment rate, but it explains only 20 % of total variance. Other studies have further investigated thermals and their properties within clouds, with a particular interest in the development of new cumulus parameterizations (e.g. Morrison and Peters, 2018; Morrison et al., 2020a; Peters et al., 2020; Romps et al., 2021; Gu et al., 2020; Morrison et al., 2023; Stanford et al., 2025).
Recent research increasingly utilizes thermals as a fundamental reference frame for investigating convective microphysical processes within numerical simulations. For instance, Hernandez-Deckers et al. (2022), hereafter HD22, emphasized the critical role of thermals as “cloud droplet/raindrop producers”, demonstrating that the formation of cloud droplets and their subsequent growth into raindrops are strongly governed by internal thermal circulations, supersaturation levels, and cloud nucleation processes. Sampling convective regions through the reference of thermals has proven to be a more effective approach for examining microphysical processes and their sensitivity to background aerosol number concentrations compared to methods relying solely on grid point selection based on specific thresholds.
Furthermore, Matsui et al. (2024), hereafter MA24, utilizing thermal tracking to analyze simulated dry- and wet-season deep convection over the Amazon, demonstrated a distinct role for thermals in cold-phase microphysics. Their findings indicated that ice and snow crystals predominantly form outside of thermals, specifically in regions where prior thermals have detrained cloud droplets. Subsequently, when droplet-laden thermals ascend into this ice-rich layer, riming processes are enhanced, leading to the production of graupel and hail embryos within the thermal cores. These two studies collectively highlight the importance of thermals and their ensembles as a crucial framework for understanding the development of convective microphysics within moist deep convection, influenced by both background aerosols and thermodynamic environments.
This study investigates the impact of aerosols on the microphysics and dynamics of isolated deep convective cells using large-eddy simulations (LES) coupled with Lagrangian tracking of convective cells and thermals. The manuscript is structured as follows: Sect. 2.1 details the selection of sea-breeze-driven isolated deep convection events observed around the Houston Metropolitan area and the characterization of background aerosol concentrations based on seasonal in situ measurements. Section 2.2 describes the LES model configuration, which incorporates a sophisticated double-moment microphysics scheme with an explicit representation of electric charging and discharging processes. A novel joint cell-thermal-tracking algorithm, developed for this study and applied to the high spatio-temporal resolution LES output, is presented in Sect. 2.3. Section 3 will present the results of these analyses, aiming to disentangle the complex interactions between microphysics, dynamics, and electrification within simulated isolated deep convection as a function of background aerosol concentrations. Furthermore, the intricate feedback mechanisms associated with cumulus thermals will be examined and discussed. Finally, Sect. 4 provides a summary of the findings, a discussion of potential uncertainties, and an outline of future research directions.
2.1 TRACER campaign
The US Department of Energy (DOE) Atmospheric Radiation Measurement (ARM) program's TRacking Aerosol Convection interactions ExpeRiment (TRACER) took place between October 2021 and September 2022 in the region in and around Houston, TX, with the goal of observing thunderstorms in the region together with their aerosol and thermodynamic environments (Jensen et al., 2025). The first ARM Mobile Facility (AMF1) captured a full suite of surface meteorological conditions, released frequent sounding balloons, and included detailed radiometric measurements. High-resolution scanning polarimetric radars characterized storm life cycle, while surface-based, boat, and drone-borne instrumentation sampled aerosol and thermodynamic conditions in the boundary layer. Additional detection antennas were used to augment the Houston Lightning Mapping Array (HLMA), improving coverage and accuracy of lightning flash detection (Bruning et al., 2024). Observations were emphasized during an Intensive Observing Period (IOP) from 1 June to 30 September 2022 when thunderstorm cells were automatically tracked, additional sondes were released, and guest instrumentation was brought to bear on environmental and aerosol sampling.
Aerosol size distributions were derived from Scanning Mobility Particle Sizer (SMPS) observations (Singh and Kuang, 2024) at the AMF1 site, during the TRACER field campaign (Jensen et al., 2022, 2025). The SMPS is a part of the operating Aerosol Observing Systems (AOS), which serves as the primary ground-based platform for in situ aerosol measurements (Uin et al., 2019). The SMPS measures aerosol size distribution (d) for particle diameters (Dp) ranging from 10 to 500 nm. The d values were integrated across different size bins to calculate the total aerosol number concentration.
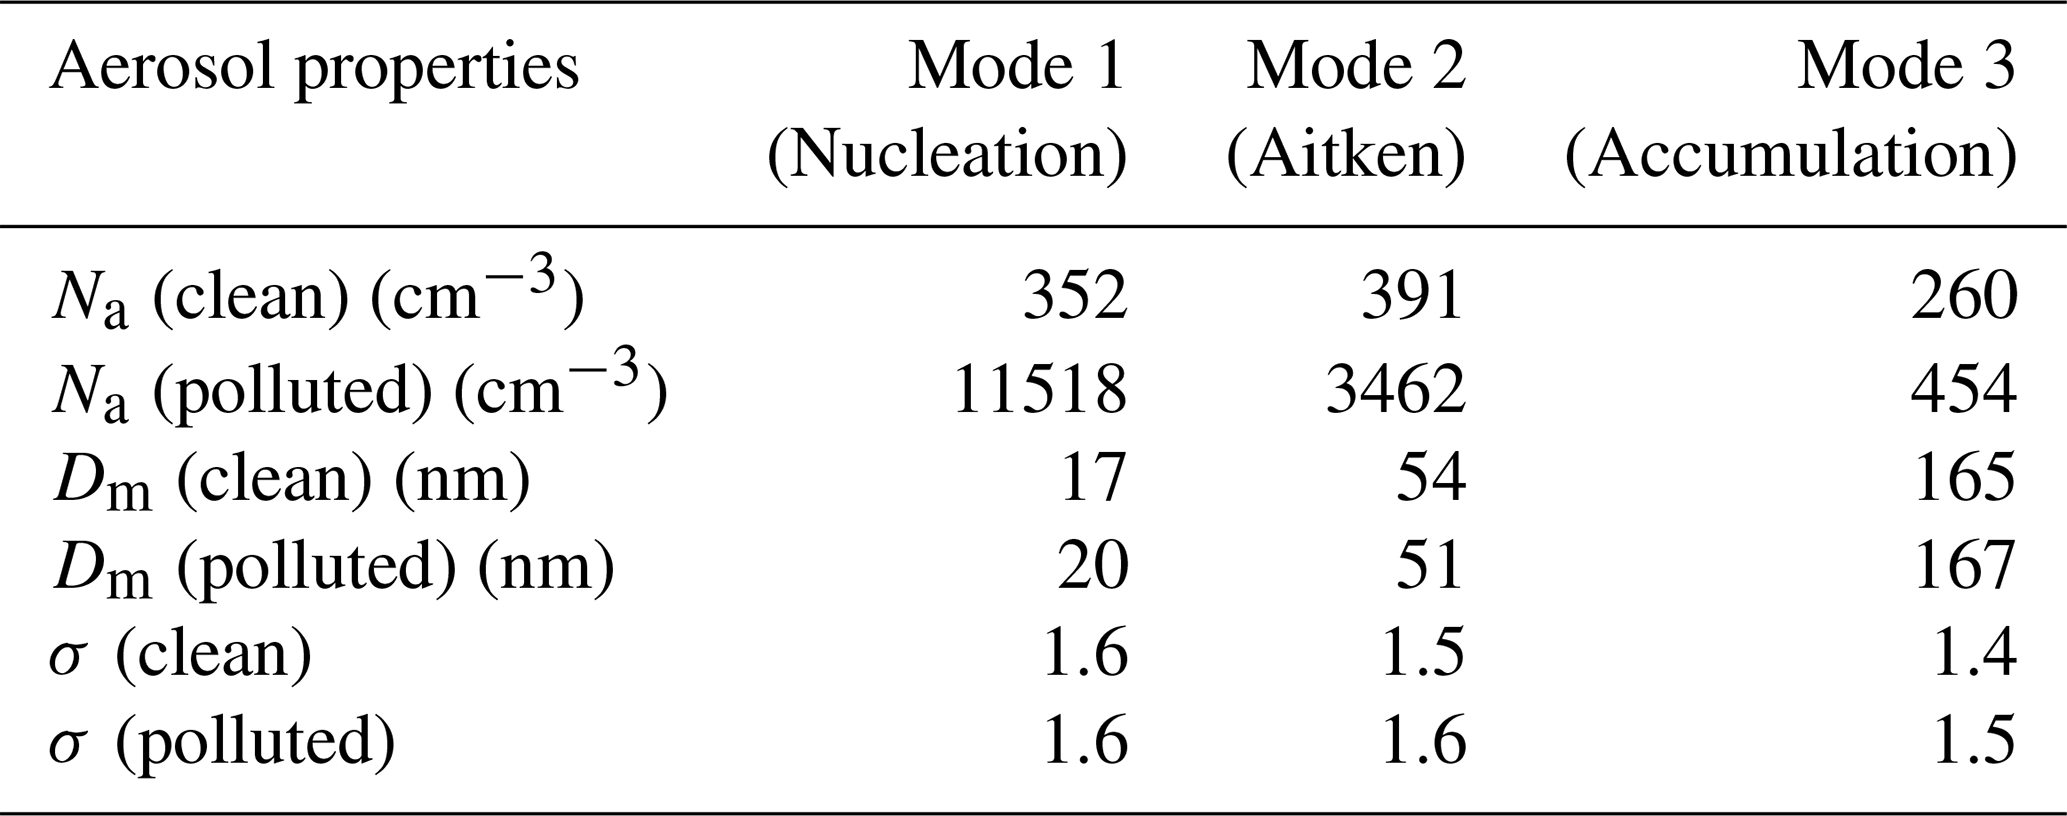
Two aerosol regimes are defined using percentiles calculated over the entire period from 17 June to 7 August 2022. Periods with aerosol concentrations below the 10th percentile (1181 cm−3) are classified as clean, while periods with concentrations above the 90th percentile (9769 cm−3) are classified as polluted. The aerosol modal representation presented here is based on a combination of qualitative assessment and closure of total number concentration between the observations and the best fit modes. Following Seinfeld and Pandis (2006), the aerosol size distributions were approximated using a sum of up to three lognormal functions, individually representing nucleation, Aitken, and accumulation modes. The parameters, including number concentration (Na), median diameter (Dm), and the standard deviation (σ) for the modal distributions, are shown in Table 1 for clean and polluted regimes. These values are homogeneously initialized within the regional LES. Figure S1 in the Supplement shows how the lognormal fits capture the overall observed size distributions. The total number concentration derived from the modal fits is 1003 cm−3 for the clean regime and 15 434 cm−3 for the polluted regime, with differences on the order of 5 %–6 %.
Table 1Lognormal aerosol modal parameters derived from SMPS observations for clean and polluted cases: Number concentration (Na), median diameter (Dm) and standard deviation (σ).
Note that there are several approaches to distinguishing clean and polluted conditions, such as separating continental and maritime regimes (Matsui et al., 2020a; Iguchi et al., 2020) or employing more gradual classifications rather than focusing solely on extreme values (Hernandez-Deckers et al., 2022). In this study, however, we adopt a more fundamental separation to examine the model’s behavior in simulating aerosol impacts on sea-breeze-driven isolated deep convection.
2.2 NU-WRF simulations
The NASA-Unified Weather Research and Forecasting (NU-WRF; e.g. Peters-Lidard et al., 2015) model was utilized as a limited-area weather model to simulate convection, the behavior of which is analyzed by the thermal and cell tracking algorithm. NU-WRF is a superset of the National Center for Atmospheric Research (NCAR) WRF Advanced Research core (ARW; Skamarock et al., 2008) with additional components developed at NASA Goddard Space Flight Center. The version of NU-WRF used here, tailored for simulating the cases of the TRACER field campaign, is denoted as NU-WRF with Electrification, a Polarimetric radar Instrumental simulator, and Cloud condensation nuclei (NU-WRF EPIC). NU-WRF EPIC is based on NU-WRF version 9 patch 3 and WRF-ARW version 3.9.1.1.
Three nested simulation domains, with horizontal grid spacings of 3, 1, and 0.2 km, were set up to cover an approximately 200 km × 170 km area around the Houston metropolitan area. The initial conditions for all domains, as well as the lateral boundary conditions for the outermost domain, were prepared using the ECMWF Reanalysis 5th Generation (ERA5) dataset (Hersbach et al., 2020). First, the two larger domains with grid spacings of 3 and 1 km were simulated simultaneously to produce the lateral boundary conditions for the 0.2 km domain. Then, the innermost domain was simulated at near LES scales, and the results were used for analysis. Model atmospheric columns extended from the surface up to 100 hPa and were divided into 91 layers across all domains.
The 2017 versions of the Goddard shortwave and longwave radiation schemes (Chou and Suarez, 1999; Chou et al., 2001; Matsui et al., 2020b), which do not incorporate the radiative effects of aerosols, were used to calculate the atmospheric radiation flux and heating. The level-2.5 Mellor-Yamada-Nakanishi-Niino turbulence scheme (Nakanishi and Niino, 2006, 2009) was used as the planetary boundary layer (PBL) parameterization scheme for simulations with grid spacings of 3 and 1 km. Following the guidance in Dudhia (2021), simulations with grid spacings of 200 m did not use a PBL scheme and a three-dimensional turbulent kinetic energy (TKE) subgrid mixing scheme was activated to resolve the remaining subgrid mixing. The physics and structure of the surface layer were parameterized based on the traditional Monin-Obukhov similarity theory (Monin and Obukhov, 1954). The community Noah land surface model with multi-parameterization (Niu et al., 2011; Yang et al., 2011) was used to calculate land surface processes and surface heat fluxes. The Moderate Resolution Imaging Spectroradiometer (MODIS) global dataset with 21 land use categories and 30 min horizontal resolution (e.g. Friedl et al., 2002) was used for categorizing land use and land cover. A single-layer urban canopy model (Kusaka et al., 2001; Kusaka and Kimura, 2004; Chen et al., 2011) was used to incorporate urban effects for metropolitan areas. No subgrid convection parameterization was used in any domain.
The National Severe Storms Laboratory (NSSL) two-moment bulk microphysics scheme was used to calculate grid-scale cloud microphysics. This microphysics scheme predicts the mass and number concentrations of the six hydrometeor categories (cloud water, rain, ice crystals, snow, graupel, and hail). Bulk densities are also predicted for the graupel and hail categories, allowing “graupel” to represent the range from rimed snow to frozen drops. The cloud microphysics parameterization is coupled with parameterizations for cloud electrification (Mansell et al., 2005, 2010) and bulk discharge processes (Fierro et al., 2013). Both non-inductive and inductive charging were considered, as both processes have proven important in simulating various thunderstorm modes, including thundersnow (Harkema et al., 2024).
The nucleation process of cloud water droplets from aerosol particles in NU-WRF EPIC is calculated based on the parameterization developed in Abdul-Razzak and Ghan (2000) from tri-modal size distributions, with Na specified from the SMPS observations (Sect. 2.1). Heterogeneous ice nucleation is based on the parameterization from DeMott et al. (2010). The Na values are initialized as horizontally homogeneous without the addition of aerosols during the simulations. The initial vertical distribution of Na is homogeneous from the ground to 1500 m a.m.s.l. Above that level, Na decreases with increasing height, with an 800 m scale height. The kappa value for the aerosol particles was set at 0.12. This value was calculated from the cloud condensation nuclei (CCN) observations at the TRACER-AMF1 site (Koontz et al., 2021) and represents the average value over the deployment.
A semi-diagnostic method (Fridlind et al., 2017) was employed to track aerosol number concentrations. This approach predicts CCN concentrations at each time step for a specified supersaturation. Cloud droplet number concentration increases only when the predicted number of activated CCN exceeds the existing cloud droplet number concentration. Notably, this nucleation scheme does not explicitly account for aerosol loss; aerosol removal is only considered during the conversion of cloud droplets to raindrops.
Note that considerable uncertainties remain for the parameterization of many microphysical processes, including initial formation of rain through collision-coalescence, vapor growth of ice, and secondary ice production, among other processes (Morrison et al., 2020b). The consequences of these individual uncertainties in the aggregated and emergent behavior of a deep convective thunderstorm are complex and may be substantial, but are outside the scope of this study.
2.3 Lagrangian Cell and Thermal Tracking
The convective cells within the simulations were tracked using the open-source Tracking and Object-Based Analysis of Clouds (TOBAC) software (Heikenfeld et al., 2019; Sokolowsky et al., 2024). Storm cells were identified at each model output time step (1 min in this study) as contiguous regions within the simulated 2D composite reflectivity field exceeding a minimum threshold of 15 dBZ (defined as a TOBAC “feature”). The spatial extent of each feature was determined through watershed segmentation and subsequently linked across time steps into cells. A final processing step allowed for cell splitting and merging (Sokolowsky et al., 2024, Sect. 3.2) by aggregating the paths of cells that came within 25 km and 5 min into storm tracks. To isolate deep convective cells, criteria based on minimum/maximum area (25–400 km2), minimum duration (> 30 min), and maximum reflectivity (> 35 dBZ) throughout cell life cycles were applied to exclude too small/large anomalous cells. Additionally, a maximum number of one neighboring feature within a 5 km radius was defined to exclude aggregated cells from the analysis. If multiple cells exceeding the 35 dBZ threshold are located within 5 km of one another, they are treated as a single isolated cell.
Each of these cells generally comprises numerous updrafts, which often manifest as small, short-lived cumulus thermals (Blyth et al., 2005; Damiani et al., 2006; Sherwood et al., 2013; Yano, 2014). Within each identified isolated convective cell defined by TOBAC, these thermals were tracked following the methodology outlined by Hernandez-Deckers and Sherwood (2016). Specifically, subdomains of tracked isolated cells were defined at each model-output time step (1 min); then, the thermal-tracking algorithm is applied to this subdomain that encompasses each tracked cell. While previous studies (e.g., HD22 and MA24) focused on a fixed sub-domain for the entire time period, this new technique allowed us to track thermals of multiple moving targets individually.
The thermal tracking method identifies and follows coherent, rising quasi-spherical volumes of air using the velocity, pressure, temperature, and water content fields. Initially, local maxima of vertical velocity are identified and tracked over time, and these points are considered the centers of potential rising thermals. Based on the trajectories of these centers, each thermal's center ascent rate is estimated at each output time step. A spherical radius is then determined such that the average vertical velocity within this volume matches the estimated ascent rate, providing an estimate of the thermal's size. Subsequently, the vertical momentum budget of each thermal is computed using the temperature, pressure, and water content fields, serving as a criterion to validate the correct identification of tracked thermals. Further details regarding this identification and tracking method are provided in Hernandez-Deckers and Sherwood (2016). While acknowledging that thermals are not strictly spherical, this tracking method assumes a spherical shape, which has been demonstrated to be a reasonable first-order approximation (Hernandez-Deckers and Sherwood, 2016).
Following the identification and tracking of thermals, composites are computed by averaging thermals normalized by their radius and weighted by their mass flux. This compositing can be performed for selected subsets of thermals, such as those categorized by altitude or stage of development, yielding valuable statistical insights into the microphysical and dynamical characteristics of thermals, and consequently, convection, given that thermals are the building blocks of convective cells. A similar methodology has been applied in prior research; for instance, Hernandez-Deckers and Sherwood (2018) utilized it to examine the impact of entrainment on cumulus convection, HD22 employed it to investigate warm microphysical processes within thermals, and MA24 used it to explore the dry-wet season contrast in convective mixed-phase microphysics over the Amazon. In this study, we employ this approach to investigate the response of cold- and warm-phase microphysics and electrification processes within thermals to varying aerosol loading conditions during isolated deep convective events.
2.4 Case selections
Prior to this study, NU-WRF EPIC simulations with horizontal grid spacings of 3 and 1 km were conducted to support the daily operations of the TRACER field campaign. The forecast performance was concurrently evaluated against the NEXRAD radar composite using a polarimetric radar simulator and composites (Matsui et al., 2023). Polarimetric radar-based skill scores were calculated for the daily forecasting results. TOBAC analysis was also employed to quantify the number of isolated cells during the IOP from both NEXRAD observations and NU-WRF EPIC-simulated NEXRAD signals. These comparisons (not shown here) indicated that higher model forecasting skill scores were strongly correlated with a larger number of isolated cells, suggesting that NU-WRF EPIC tends to exhibit better forecasting skill for isolated convective cases. Performance-check LES were conducted for several promising candidate cases, and a visual comparison with NEXRAD observations (not shown) led to the selection of two representative cases. These were used to investigate the aerosol impact on the cumulus thermals of isolated convective cells: 4 and 7 August 2022. The simulations started at 00:00 UTC each day.
Figure 1 illustrates the geopotential heights at 700 hPa and the horizontal winds at 850 hPa at 21:00 UTC for the two cases. According to Wang et al. (2022), who conducted an analysis and classification of the summer synoptic regimes over this region at a climatological scale, the synoptic pattern on 4 August is categorized roughly as a post-trough regime. In this regime, the Houston area was located to the west of a trough, and it was dominated by a weak northerly wind developed between the eastern trough and the western ridge. In contrast, the synoptic pattern on 7 August is categorized as an anticyclonic regime, characterized by a high pressure system over the Gulf and coastal area. These are conditions conducive to the sea-breeze development and isolated convection in the afternoon, under stable and weak synoptic forcing.
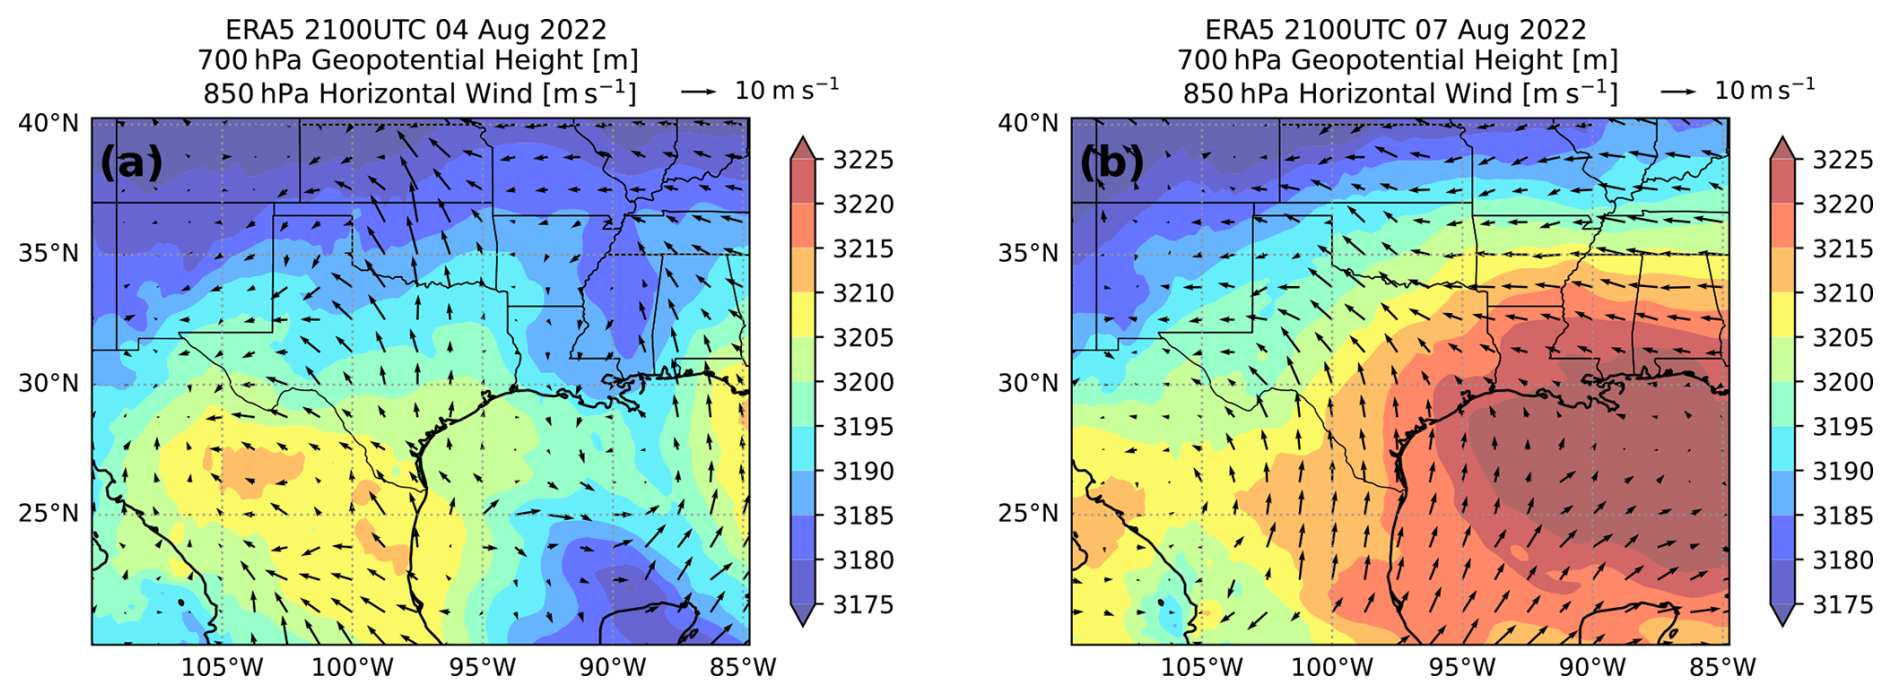
Figure 1Geopotential height at the 700 hPa level and the horizontal wind at the 850 hPa level at 21:00 UTC on (a) 4 August and (b) 7 August 2022, from the ERA5 reanalysis.
Figure 2 shows the composite radar reflectivity from the LES domain at the time when convective development is near the peak in each case. At these times, convection was simulated on the northwestern side of the Houston metropolitan area. The magnitude and structure of the composite radar reflectivity are quite different for the clean/polluted aerosol cases. The subsequent section presents a detailed analysis of the characteristics of convection and cloud microphysics through Lagrangian tracking of convective cells and thermals.
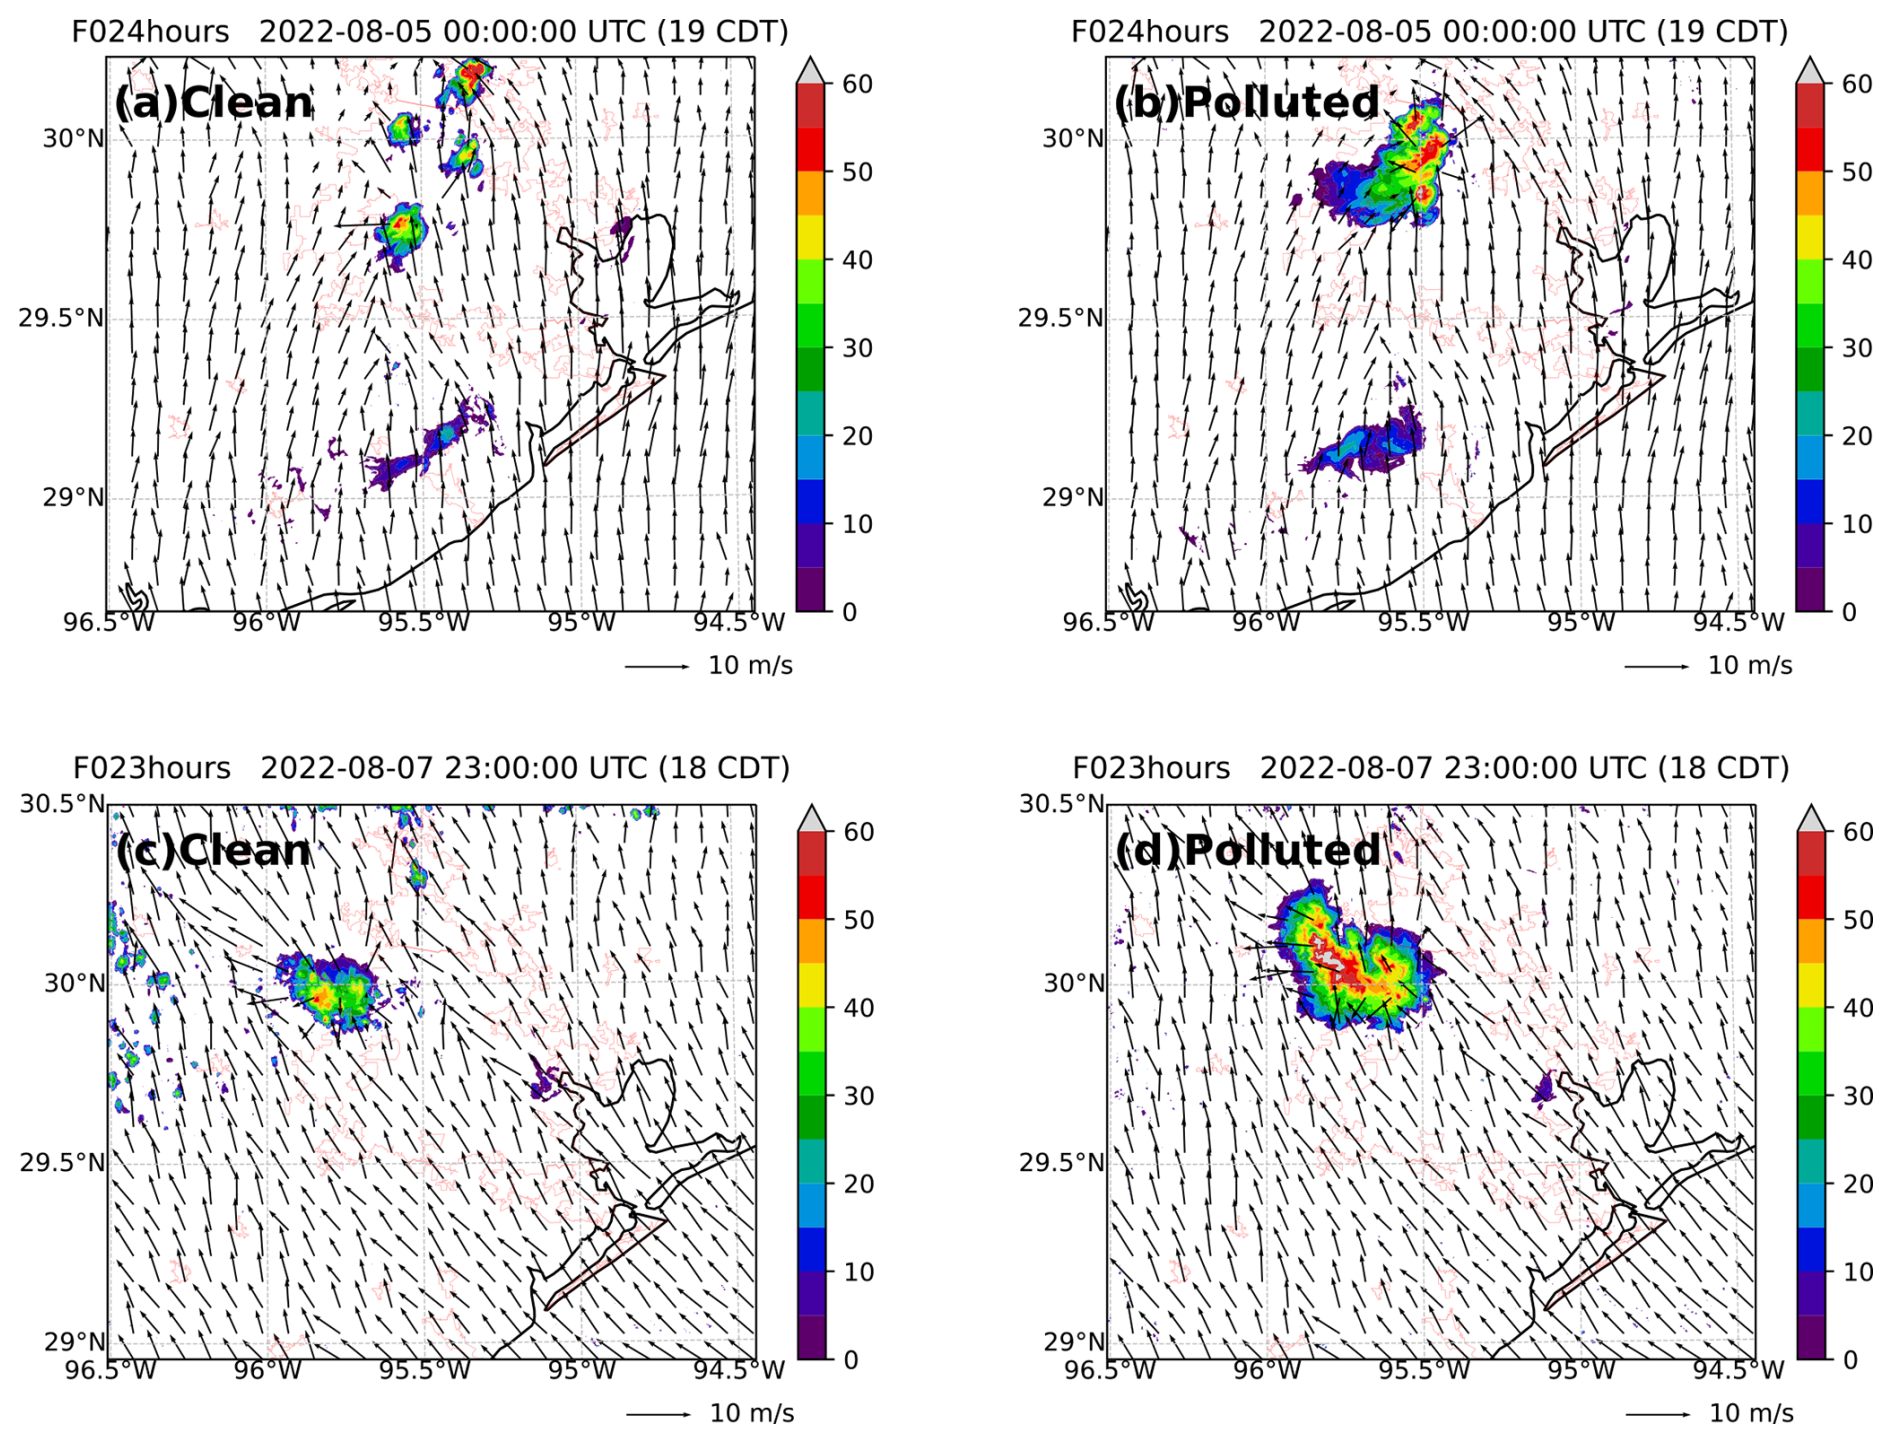
Figure 2Composite radar reflectivity (color field) with horizontal wind at 10 m a.g.l. (black arrows) in the model simulations, overlaid with the coastline (black line) and urban-rural classification (red lines) defined by the U.S. Census Bureau for the year 2020, with (a, c) Clean and (b, d) polluted aerosol conditions.
Figure 3 shows how the horizontally averaged aerosol concentrations change over time at a height of 1500 m a.s.l. from the start to the end of the simulation. The concentrations are normalized by the values listed in Table 1. This height corresponds to the cloud base, as shown in subsequent sections. These plots demonstrate that the normalized concentrations remain consistent regardless of clean or polluted conditions, as well as the aerosol mode. This suggests that the normalized concentration value represents the scale of the difference in aerosol concentrations between clean and polluted conditions at 1500 m compared to the difference in concentrations listed in Table 1. The normalized concentrations approximately range from 0.75 to 0.95 over the last six hours on 4 August and from 0.75 to 0.85 over the last six hours on 7 August. During these periods, thermals developed from this height are expected to be affected by the aerosol perturbation scaled by these range numbers rather than by the raw values shown in Table 1 of the surface observations.
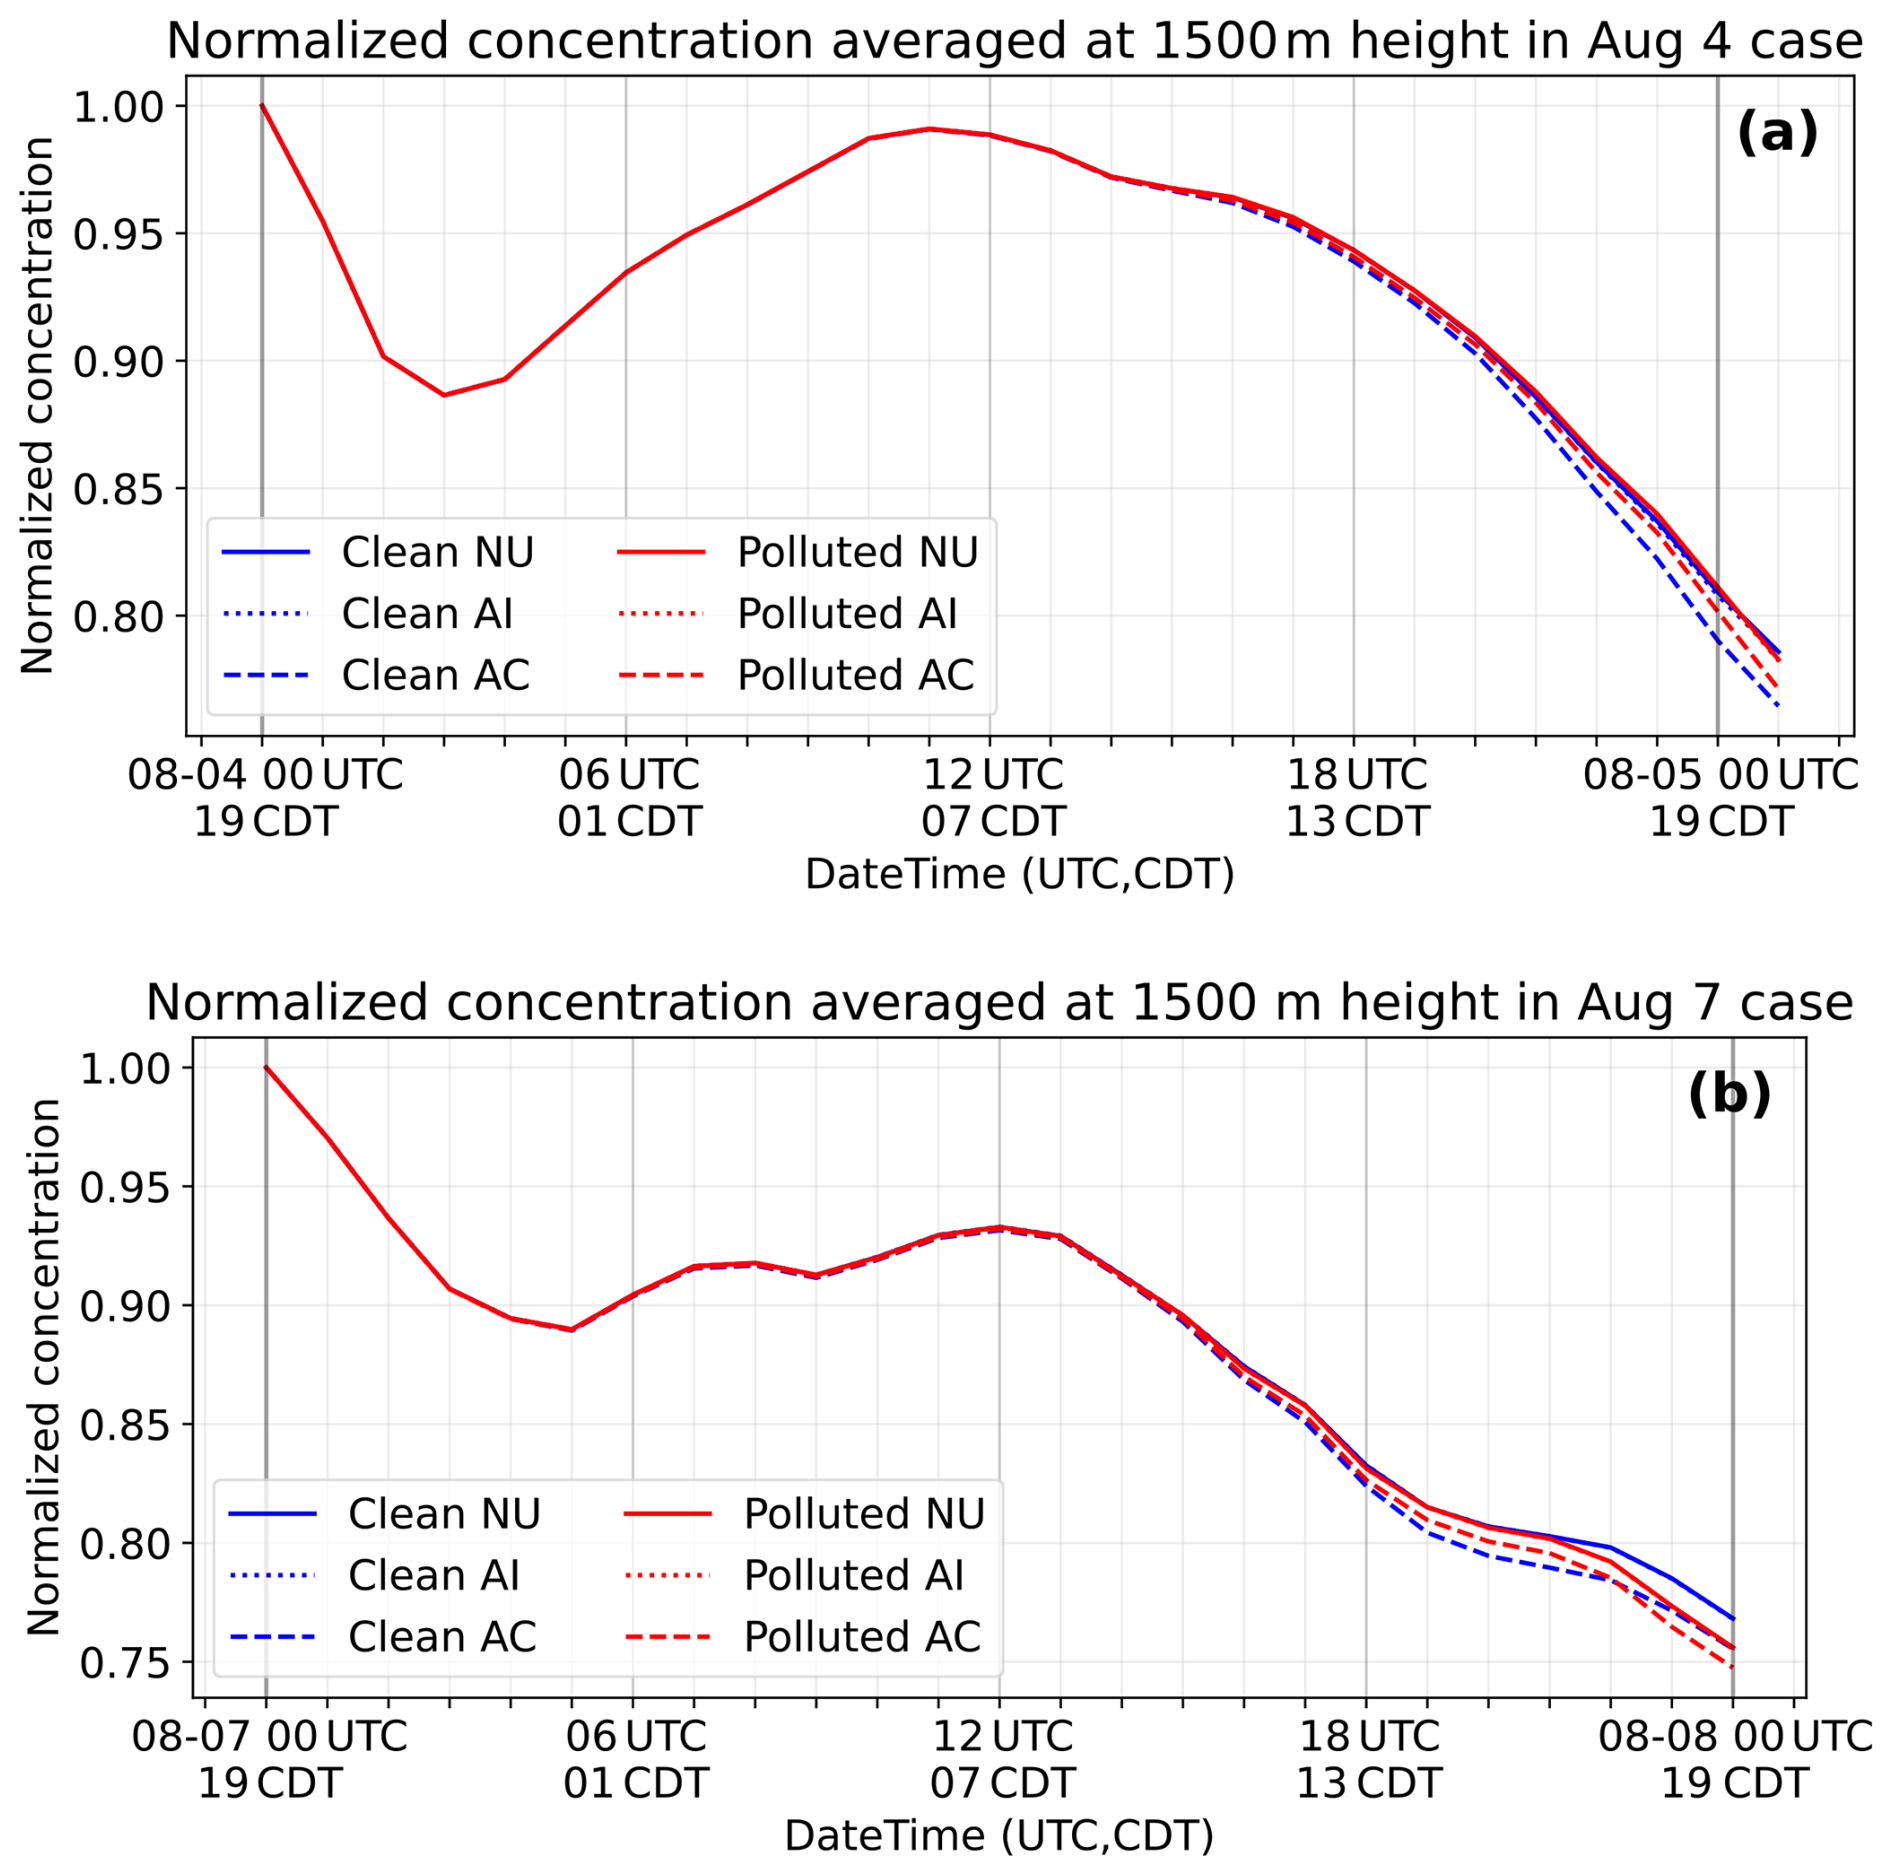
Figure 3Temporal evolution of the horizontally averaged normalized aerosol concentration at a height of 1500 m a.s.l. from the start to the end of the simulation in each case. In the legend, NU, AI, and AC denote the aerosol nucleation, Aitken, and accumulation modes, respectively (Table 1). UTC and CDT represent coordinated universal time and central daylight time, respectively.
3.1 Cumulus thermals
The TOBAC cell tracking algorithm identified and tracked 17 isolated convective cells in the 4 August clean case, 18 in the 7 August clean case, 6 in the 4 August polluted case, and 7 in the 7 August polluted case. Figure 4 illustrates the evolution of one of the tracked cells for the 7 August polluted case, along with time-altitude plots of mass flux for the individual thermals within this cell. Consistent with prior findings (e.g., Sherwood et al., 2013; Hernandez-Deckers and Sherwood, 2016), we see that the overall convective activity of each case is due to the contribution of a large number of thermals, as opposed to the classical plume model view, in which very few updrafts are responsible of most of the total mass flux. We find that thermals have short lifetimes: 5 min on average, with 90 % of thermals living less than 9 min, while convective cells last 24.4 min on average, with 90 % surviving more than 9 min. They also travel short distances: 85 %–90 % travel less than 2 km, while the overall depth of the cells reaches above 10 km. However, a subset of thermals, initiated during the mature stage of the convective cell, displays comparatively longer lifespans (1 % of thermals live 12 min or longer), greater travel distances (1 % of thermals travel at least 4 km), higher final altitudes (1 % of thermals reach above 10 km), and larger contributions to the mass flux (1 % of thermals have at least 4 × 10⁵ kg m s−1 mass flux), likely playing a key role in mixed-phase precipitation processes (MA24). It is also important to note that clear “lucky” thermals are not captured during the deepest time of convection (13:00–13:40). That is, thermals that would initiate at the cloud base and ascend continuously to the cloud top, which contrasts with the common conceptualization of deep precipitating convection (e.g., Emanuel, 1994). These robust, strong thermals typically occur from the middle height of the convective cells. It is also possible that smaller shallow thermals may merge to form larger thermals, which can penetrate to the cloud top and behave as “lucky thermals”. However, the potential impacts of such merging processes have not yet been investigated in this study.
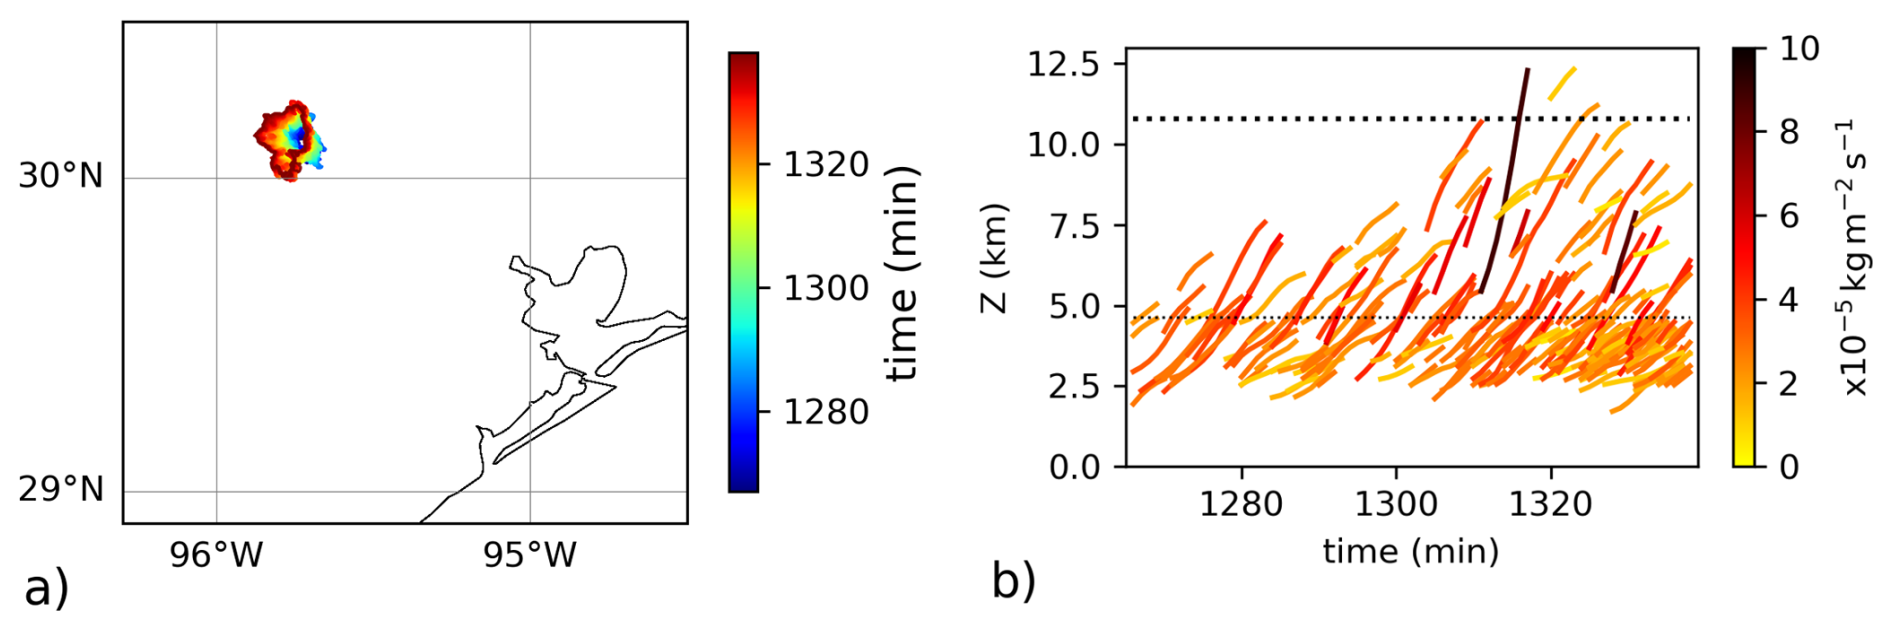
Figure 4(a) Evolution of the area covered by one of the isolated convective cells for the 7 August polluted case. Colored contours depict its spatial extent throughout time. (b) Time-height trajectories of tracked thermals and their mass flux (color shade) from the cell shown in (a); dashed line corresponds to the −40 °C level, and the dotted line to the 0 °C level.
The thermal tracking algorithm identified a total of 1263 thermals within the isolated cells of the clean cases (434 in the 4 August case and 829 in the 7 August case), and 561 thermals in the polluted cases (87 in the 4 August case and 474 in the 7 August case). Notice that although fewer thermals were identified in the polluted cases compared to the clean cases, there are actually more identified thermals per cell in the polluted cases (43 thermals/cell for polluted against 36 thermals/cell for clean). Also, notice that more thermals are tracked in the 7 August case than in the 4 August case, especially in the polluted cases. To ensure that our results are not affected by this differential sampling, we tested all analyses that will be shown here using a random sample of thermals from the 7 August cases, with the same number of thermals as the 4 August cases, and repeated this several times (not shown here). Only minor differences were found which will be pointed out below. Furthermore, the lower number of tracked cells in the polluted cases does not necessarily indicate less overall convective activity. In fact, convection in the polluted cases tends to exhibit greater aggregation compared to the clean cases (e.g., Fig. 2), resulting in fewer identified “isolated” cells, but not necessarily less convection overall (discussed in Sect. 3.2). Additionally, it is worth considering that radar-based cell identification can be biased towards precipitation particles because radar reflectivity is related to the sixth moment of hydrometeor sizes. Consequently, some polluted cells may suppress precipitation, becoming less detectable by the radar reflectivity threshold used by TOBAC (Sect. 2.3). Hereafter, statistical composites of thermal properties integrate all tracked thermal properties from detected isolated cells of the 4 and 7 August simulations for “clean” and “polluted” cases, and their difference (“polluted-clean”).
Figure 5 shows cross-sections of vertically and time averaged thermal composites. Similar to HD22 and MA24, after identifying individual thermals, the analysis centers on each thermal's peak vertical velocity (thermal maxima) as a reference point. For all cross-sections shown here, thermal properties are averaged using mass flux-based weights to emphasize stronger thermals. Note that this may result in slight differences when averaging for the entire column (Fig. 5) and when averaging at different altitudes (Figs. 8–9), since thermals reach their maxima at different heights. However, this does not affect our interpretation of results.
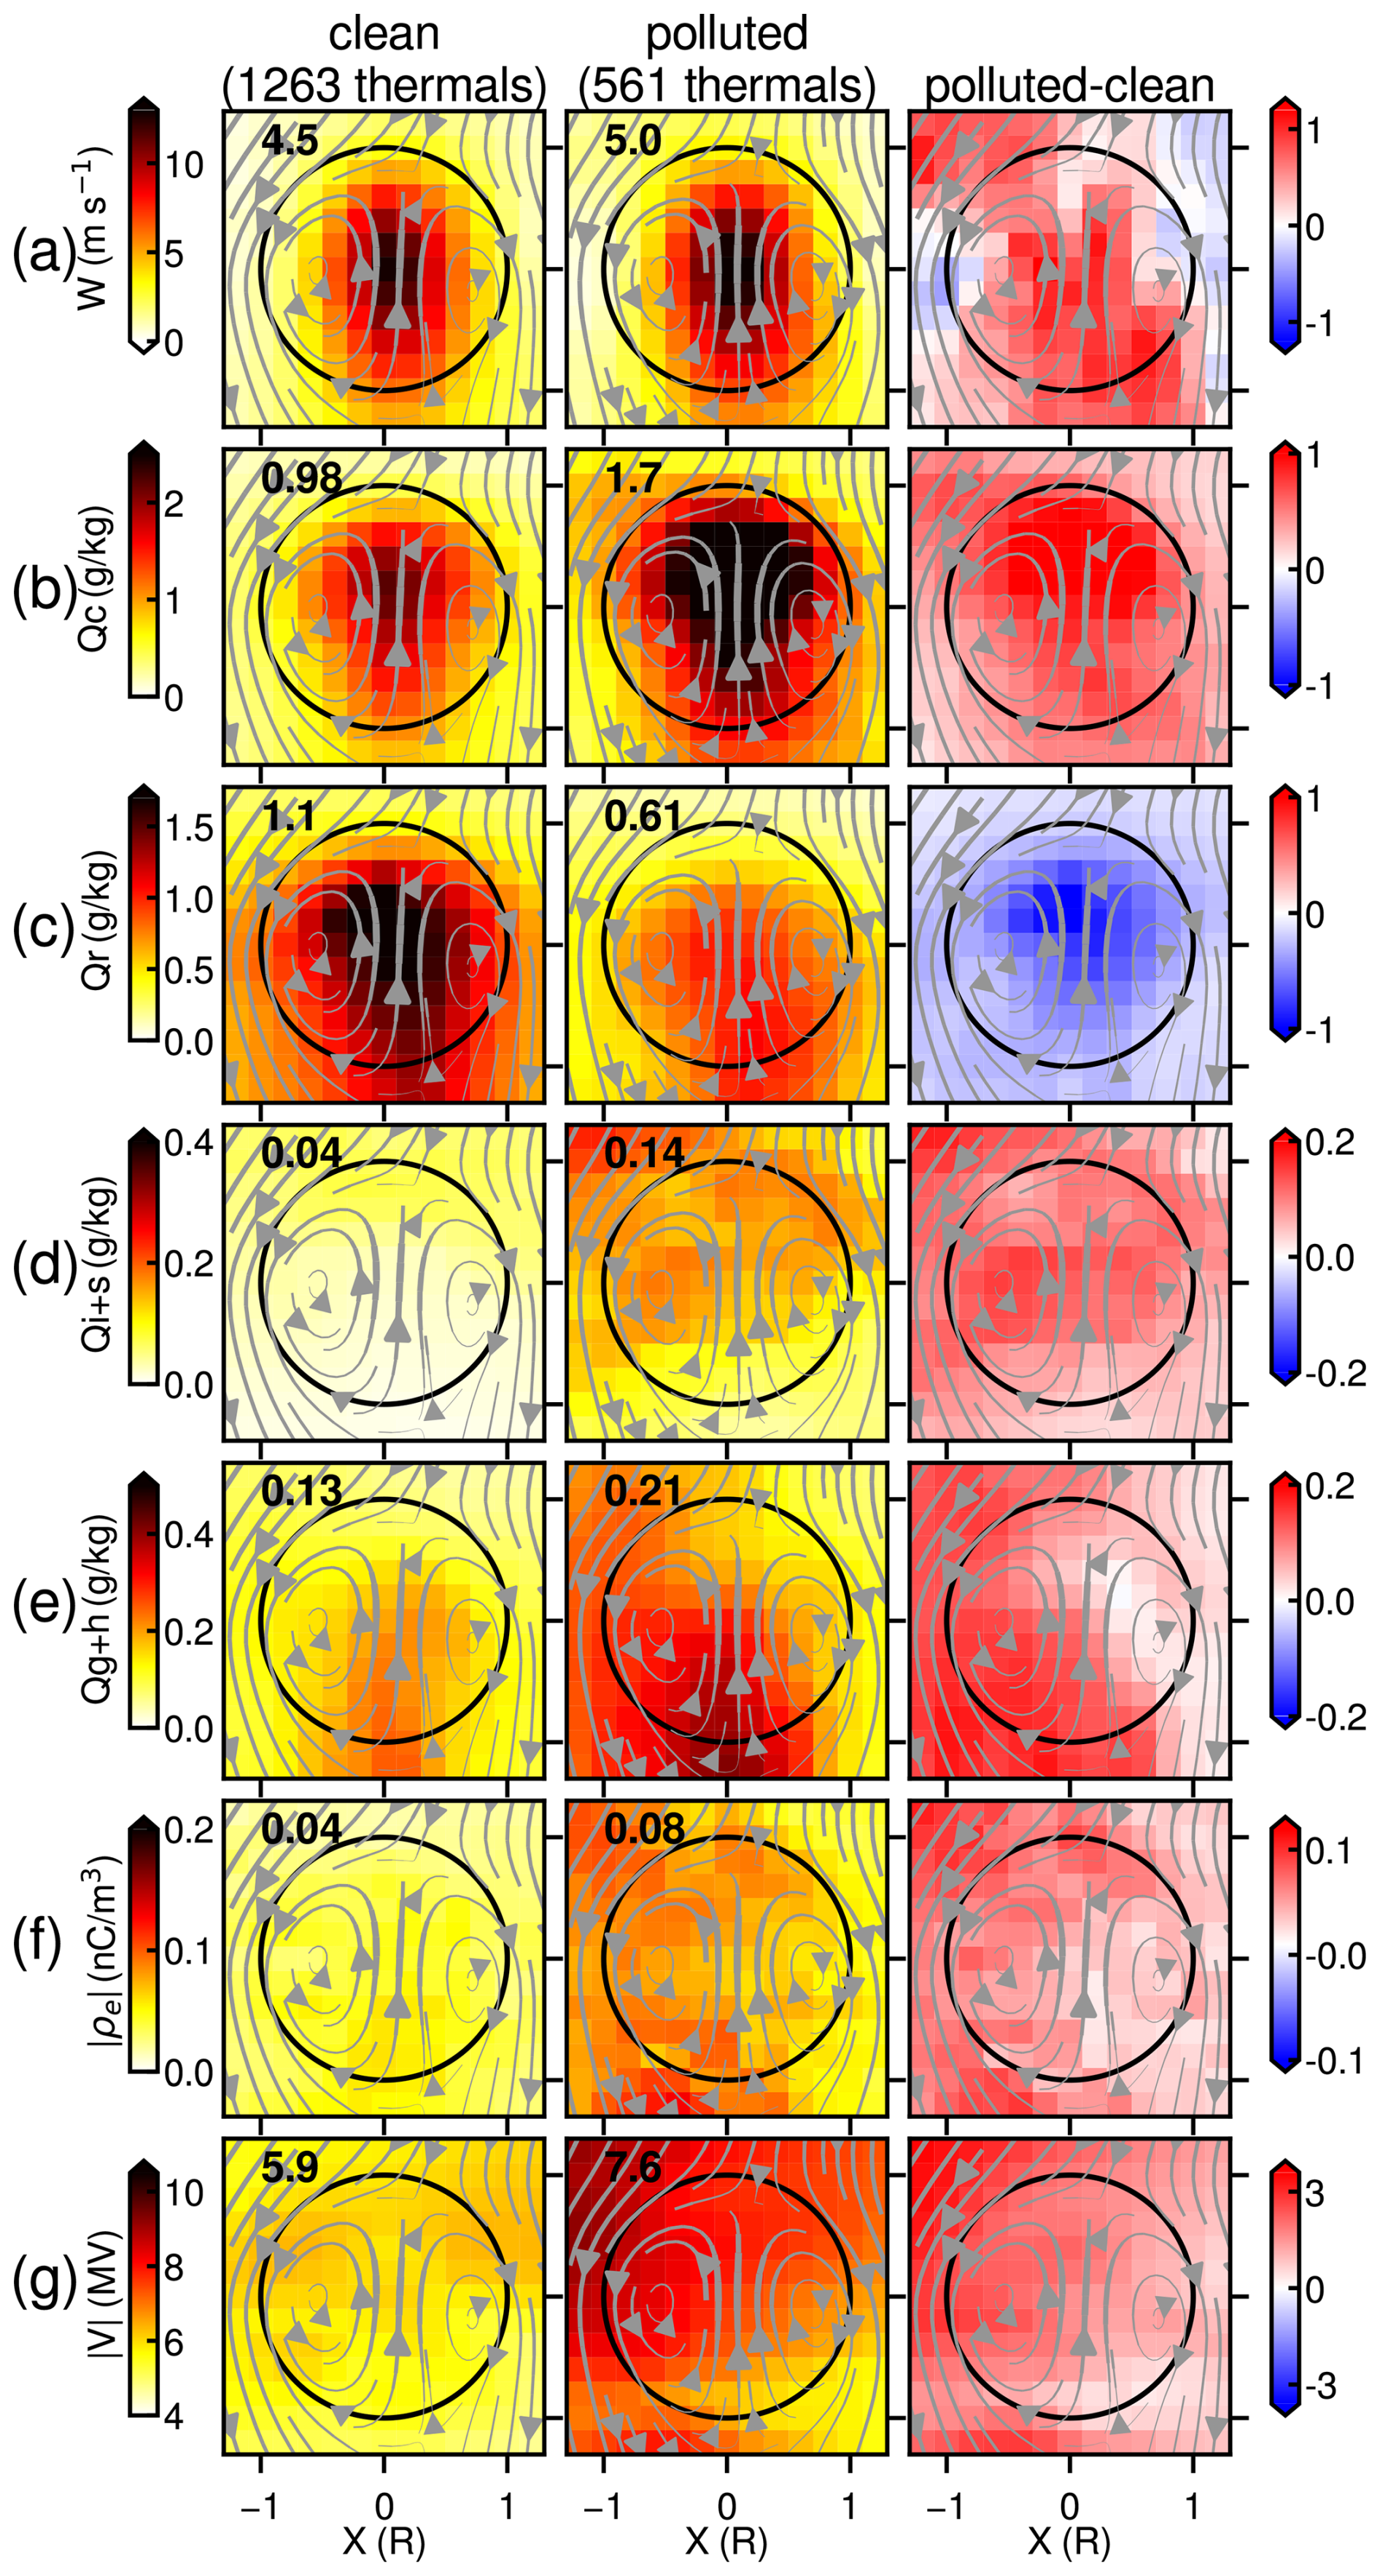
Figure 5Composites of (a) vertical velocity, (b) cloud water mixing ratio, (c) rain water mixing ratio, (d) ice + snow mixing ratio, (e) graupel + hail mixing ratio, (f) absolute value of volume charge density and (g) absolute value of electric potential, averaged over altitude and the entire thermal lifetime for the clean cases (left column), polluted cases (middle column) and their difference (right column). The bolded values indicate the in-thermal averages of each quantity. The background wind fields shown in the third column are taken from the clean cases.
Variations in background aerosol conditions exert influence on thermal properties. Specifically, the polluted case exhibits higher cloud water mixing ratios compared to clean cases (Fig. 5b), aligning with enhanced droplet nucleation and condensation. This increased droplet concentration subsequently suppresses warm-rain processes in the polluted case (Fig. 5c), a finding consistent with HD22's results using a different double-moment microphysics scheme. The NU-WRF EPIC simulations show that enhanced condensation is associated with increased vertical velocities (Fig. 5a) in contrast to HD22, who did not find enhanced vertical velocities associated with enhanced condensation.
The increased cloud droplet concentrations in polluted cases result in higher concentrations of ice, snow, and graupel/hail (Fig. 5d), similar to the dry/wet-season contrasts in simulated tropical continental deep convection in MD24. The enhanced condensation likely leads to detrainment after thermals reach neutral buoyancy, followed by the freezing of these cloud droplets via heterogeneous ice nucleation, gradually forming ice layers around the top of the convective clouds. Subsequent thermals entrain this ice and snow into droplet-rich thermal cores when penetrating the ice layers. This thermal-driven process promotes the generation of rimed particles (graupel/hail). Consequently, ice and snow particles exhibit a more homogeneous distribution along the thermal boundaries compared to other hydrometeors, which tend to be concentrated within the thermal cores. The subsequent figures provide a more thorough explanation of these processes.
The electrical properties (Fig. 5f, g) in the thermals show patterns consistent with the graupel-ice crystal collisional charging mechanism, as reviewed by Bruning et al. (2024). Charge density is larger in the same region where graupel and hail (Fig. 5e) are precipitating from the thermals. In the polluted cases, regions of greater ice and snow concentration above (but not at the center of) the thermal also show enhanced charge density. Electric potential shows the integrated effect of charge, with a subtle maxima in the clean case above and between the thermal's internal circulation, and a much greater enhancement in the polluted case extending to ice crystals laterally outside and above the thermal. The presence of thermal-internal potential gradients (i.e., electric fields) also suggests that flashes are more likely to initiate in the vicinity of thermals, as also inferred by Salinas et al. (2022); however, it was difficult to capture from this simulation due to the limited number of flash samples.
Figure 6 presents normalized histograms of thermal properties for both clean and polluted cases. The median of the thermal radii is approximately 0.7 km in both scenarios; however, the polluted case exhibits a tail extending to larger radii, reaching up to 2.3 km (Fig. 6a). Vertical velocity (W, Fig. 6b) and vertical travel distance (ΔZ, Fig. 6c) are also marginally greater in the polluted case, while thermal entrainment rates are lower (Fig. 6f). This is consistent with findings by Hernandez-Deckers and Sherwood (2018), since entrainment is mainly determined by thermal size. Thermal lifetimes appear comparable between the two cases (Fig. 6e). The most distinct and interesting difference is the thermal initiation height (Z0), with the polluted case showing a median value approximately 0.5 km higher (Fig. 6d), and is discussed further in the following figure and analyses. This increased starting point, together with slightly faster thermals with similar lifetimes results in higher final altitudes (Fig. 6h). Also, the slightly faster and larger thermals result in slightly higher average mass flux (Fig. 6g). It should be noted that these differences are mostly small and that the total number of thermals tracked is less than half in the polluted cases compared to the clean cases.
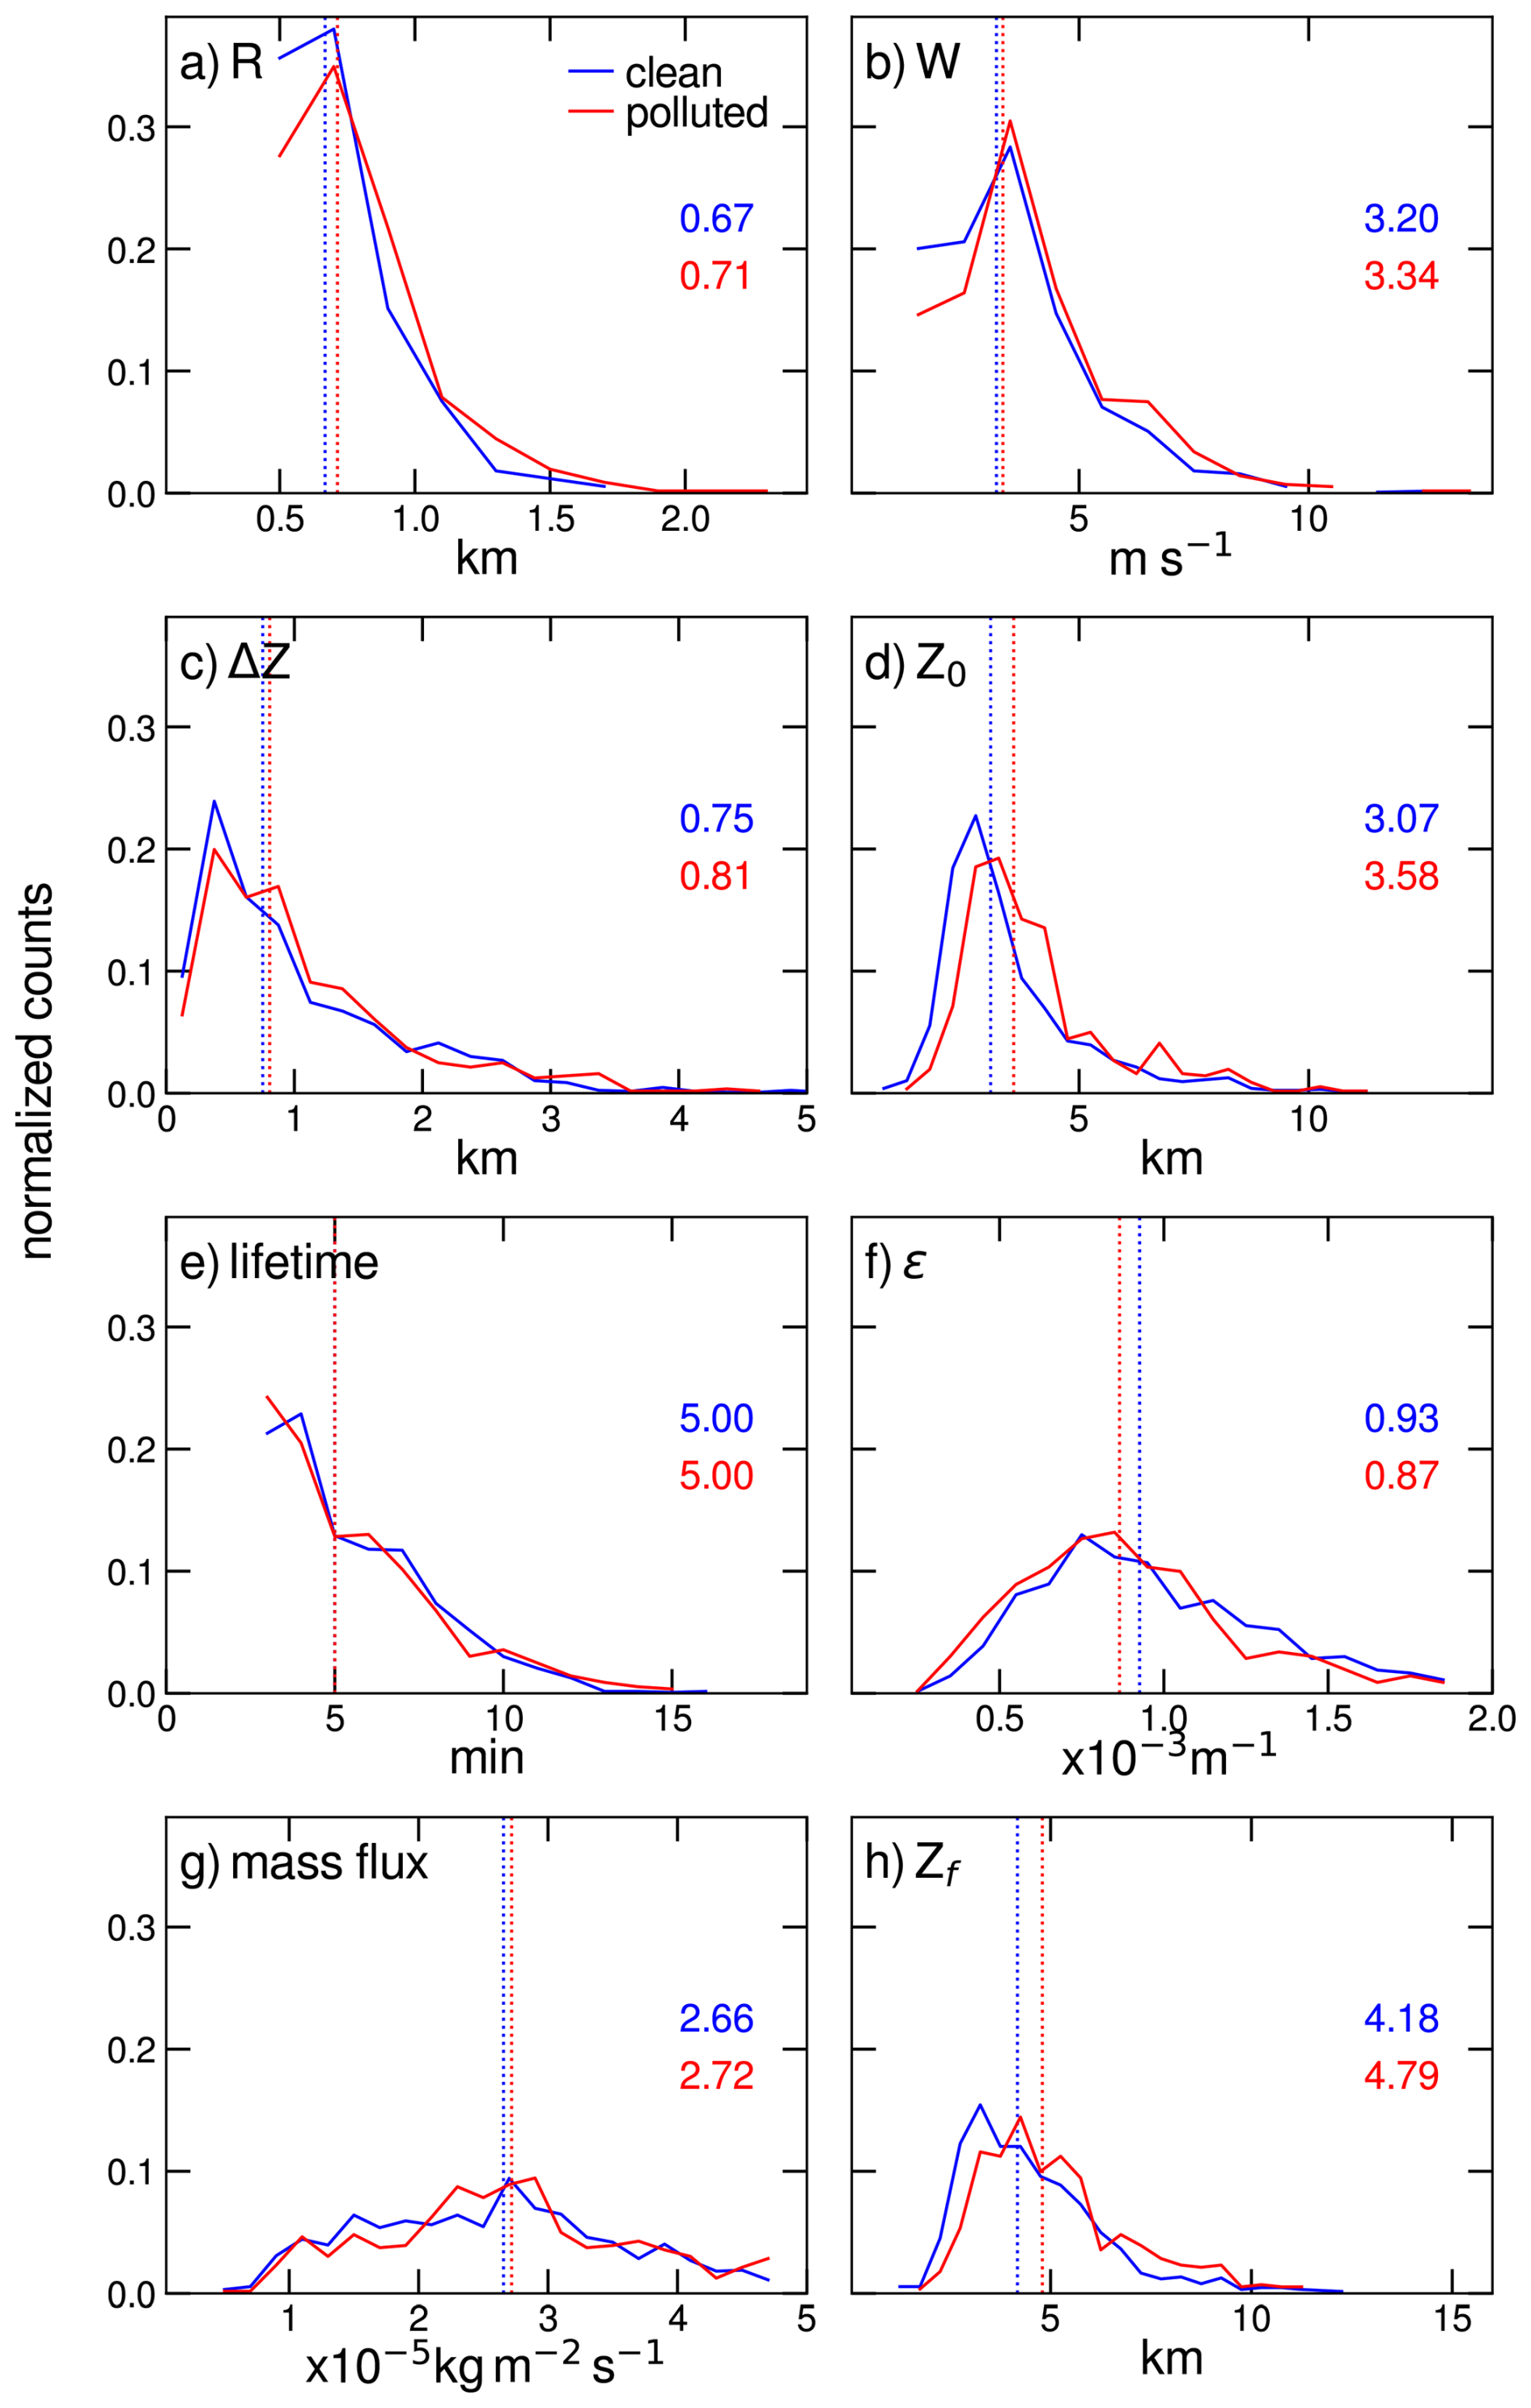
Figure 6Histograms of (a) thermal radius R, (b) ascent rate W, (c) distance traveled ΔZ, (d) initiation height Z0, (e) lifetime, (f) entrainment rate ε, (g) mass flux, and (h) final altitude Zf for the clean cases (blue) and the polluted cases (red). Vertical dotted lines indicate the median values, which are annotated to the right of each figure.
Figure 7 illustrates the vertical profiles of thermal states under both polluted and clean atmospheric conditions. Analysis of the thermal number density (N, number of thermals per vertical bin and number of cells) in Fig. 7a reveals a notable upward shift and increase in the vertical distribution of thermals above 3–4 km altitude in polluted conditions compared to clean conditions. Furthermore, vertical profiles of thermal radius and vertical velocity (Fig. 7b, c) indicate that the slightly larger thermals observed under polluted conditions are present at most altitudes. Concurrently, faster thermals are particularly prominent between 5–9 km in polluted environments.
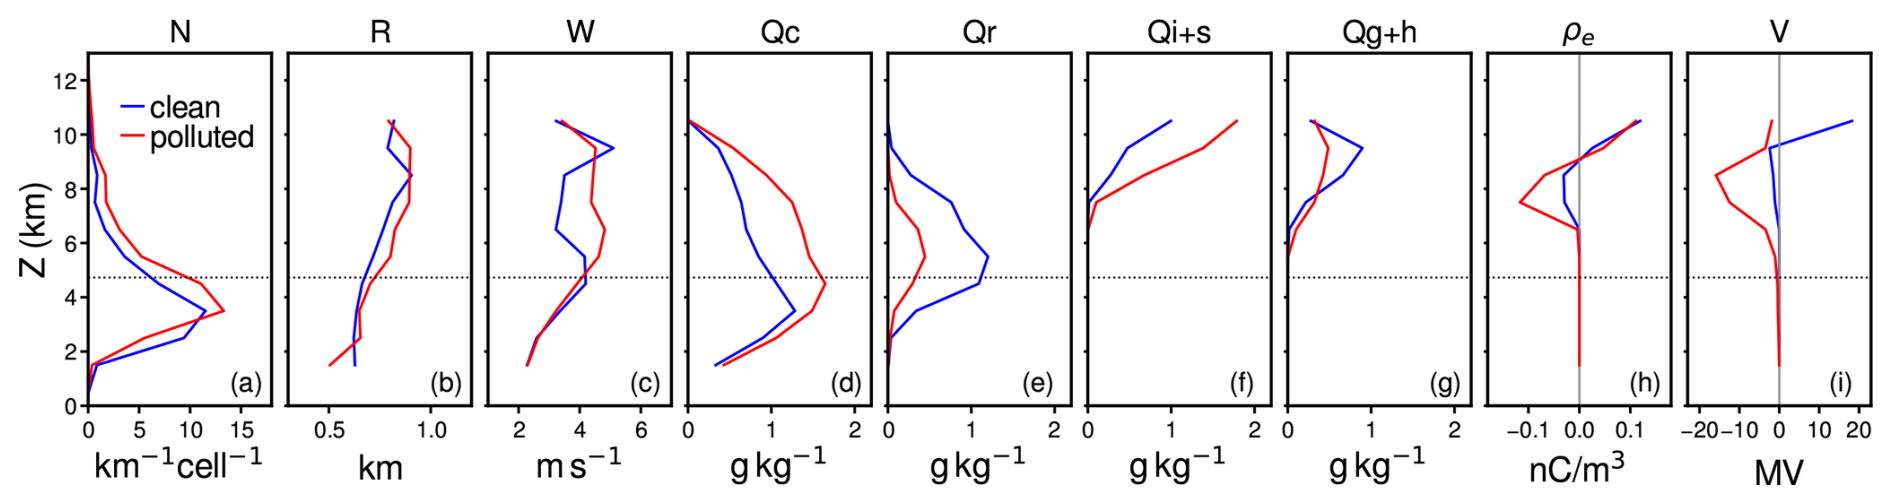
Figure 7Vertical profiles of mean thermal properties: (a) thermal number density, (b) median thermal radius, (c) ascent rate, (d) cloud water mixing ratio, (e) rain water mixing ratio, (f) ice + snow mixing ratio, (g) graupel + hail mixing ratio, (h) volume charge density, and (i) electric potential. Dotted line indicates the 0 °C level. Median values in (b)–(i) are only shown where the number of thermals is at least 0.5 % of the total sample size (6996 time steps for clean cases and 3126 for polluted cases).
Furthermore, the polluted scenario exhibits a substantial increase in cloud droplet (Qc) mixing ratio alongside a decrease in raindrop (Qr) mixing ratio (Fig. 7d, e). This microphysical shift leads to a greater abundance of ice and snow mixing ratios (Qi+s), attributed to the enhanced lofting of water above the melting layer. On the other hand, graupel and hail mixing ratios (Qg+h) increase slightly with polluted conditions between 6–8 km, but decrease between 8–10 km altitude. However, since there are more thermals between 6–8 km than between 8–10 km, the overall difference is an increase in graupel and hail (Fig. 5e).
While the population of thermals that reaches the charge-bearing layers is small, net-charge structure (Fig. 7h) produced by all thermals shows a positive-above-negative charge dipole in the upper mixed phase region, as observed. In observations, about 10 % of flashes also discharge a lower-altitude negative-above-positive charge dipole just above the melting level, and as shown in Figs. 15 and 16, that lower charge dipole was present here and was therefore generated outside the thermal reference frame.
The lower (upper) charge in a dipole is typically carried on graupel (ice crystals), implying that only negative charging to graupel took place within the thermals. Enhancement of charge and potential in the polluted case (Figs. 5f, g and 7h, i) is primarily realized as a net enhancement of the negative charge center at 8 km altitude, consistent with less graupel aloft and more graupel at lower altitudes (Fig. 7g). The polluted case apparently has no effect on the net charge carried on ice crystals near 10 km, consistent with the generation of these species outside the thermal, as noted above. The net effect of enhancing the net charge and electrical potential on graupel enhances the electric potential overall, and therefore, from conservation of energy, should result in more flashes per thermal in the polluted cases, and as shown below, is what was modeled.
Figure 8 presents cross-sectional composites of thermal properties at different altitude levels for the clean case. This averaging process, similar to that applied in Fig. 5, weights the composite by the magnitude of the thermal mass flux at each reference level. Vertical velocity (W) tends to increase with elevation, reaching its peak at 8.5 km in this sample. Supersaturation (S) becomes discernible at 5.5 km and maximizes at 8.5 km, while significant cloud droplet (Qc) concentrations are primarily captured at lower elevations (2.5–4.5 km). Raindrop (Qr) concentrations peak at slightly higher elevations (2.5–6.5 km), which is associated with droplet loss due to the coalescence process.
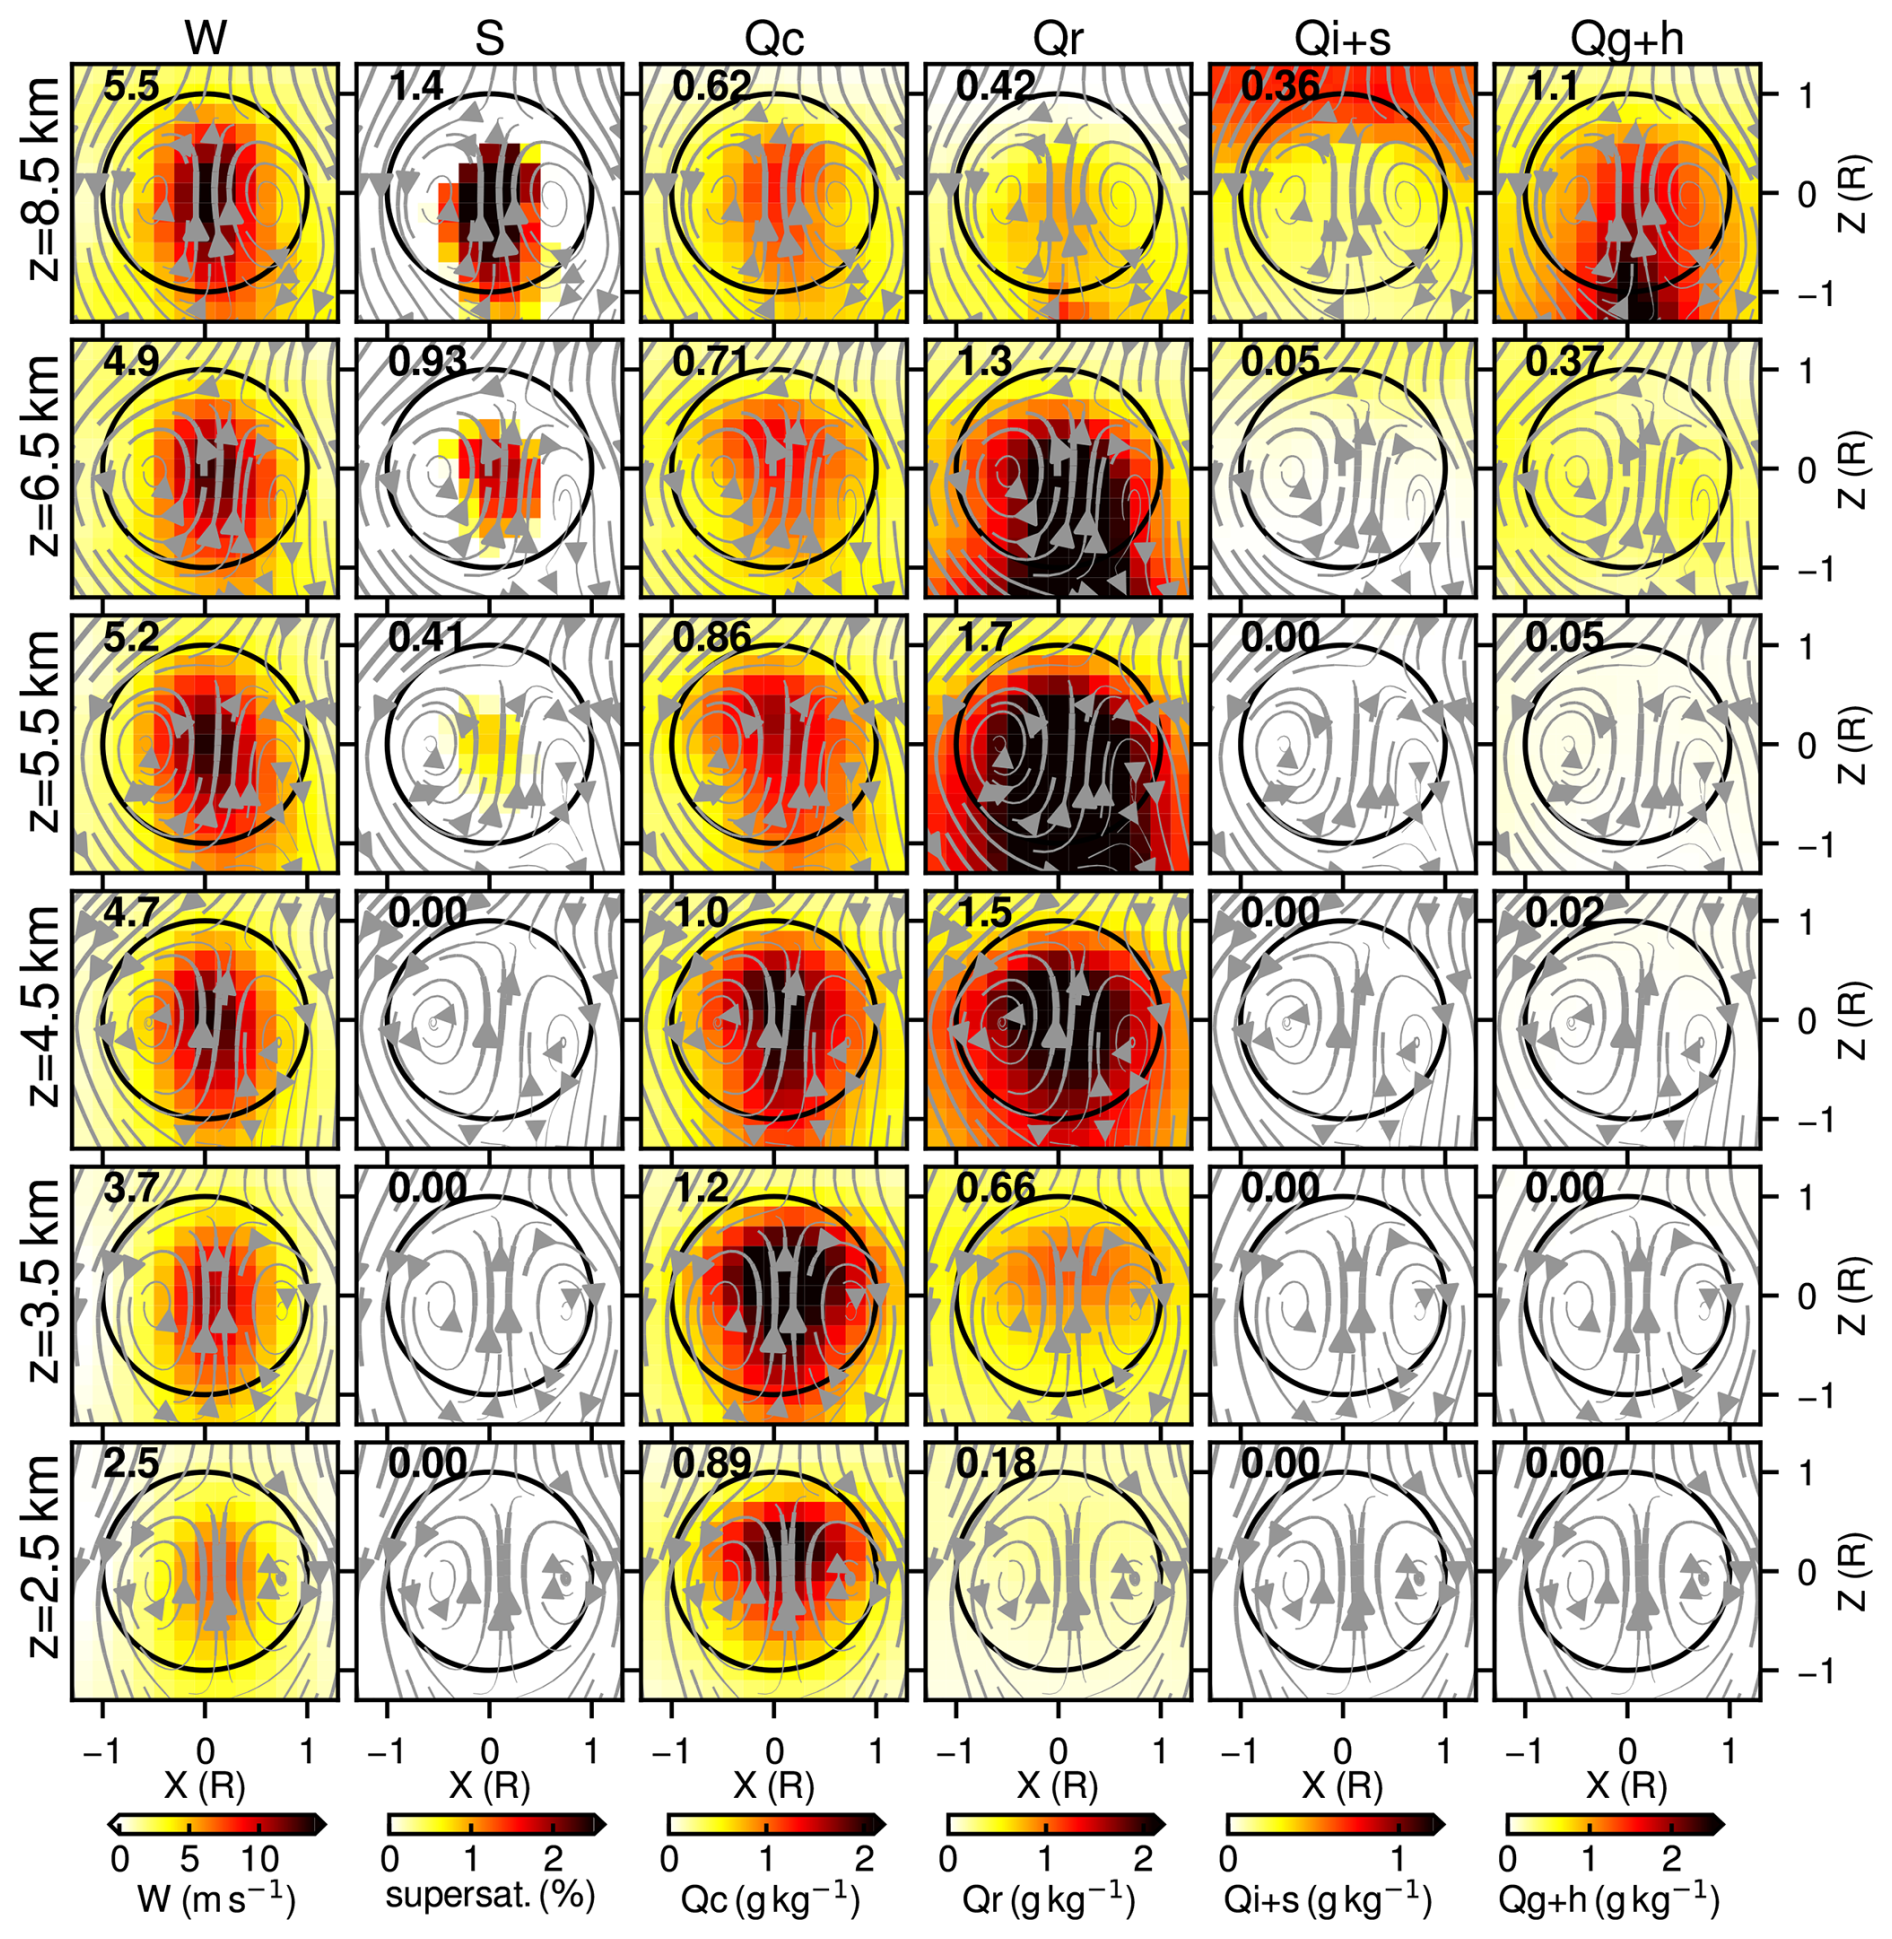
Figure 8Cross sections of composites by altitude (rows) for (columns, left to right): vertical velocity, supersaturation with respect to water, cloud water mixing ratio, rain mixing ratio, ice + snow mixing ratio and graupel + hail mixing ratio, corresponding to the clean cases.
These composites also reveal the evolution of variables within rising thermals. Notably, cloud water (Qc) is strongly coupled to the thermal's internal circulation, with its highest concentrations observed at the thermal's center where updraft velocities are strongest (DH22). Rainwater (Qr) development starts around 3 km altitude, coinciding with the region of most intense updrafts (W), and starts falling out from the thermal references. Conversely, the composites of ice and snow mixing ratios suggest that these particles are likely not generated within thermals in the mixed-phase zone, a finding consistent with MA24 regardless of the different sophistication of microphysics schemes (i.e., single- and double-moment microphysics with/without detailed nucleation schemes). Instead, ice crystals appear to form outside of thermals, likely originating from cloud water detrained from preceding thermals. Homogeneous distributions in the previous cross-section plot (Fig. 5d) also indicate this. As “younger” thermals subsequently penetrate this layer, where ice and snow are already present, the formation of graupel and hail is initiated.
Furthermore, ice and aggregation layers (Qi+s) are present and are entrained in thermals at the 6.5 and 8.5 km levels. Notably, graupel and hail particles (Qg+h) exhibit strong concentrations at the center of updraft core and also directly below the thermal cores at 8.5 km. This spatial distribution suggests that most of the riming process occurs at thermal cores due to the presence of thermal-generated droplets and entrained ice and snow aggregate particles in the mixed-phase level. This is in agreement with the thermal-driven graupel generation mechanism investigated in MA24 (including time-lapse analysis), despite differences in model dynamics, microphysics, and convective cases used in this study. The only differences from MA24 are the presence of cloud droplets well above the 0 °C isothermal level (8.5 km), which is attributed to the treatment of super-cooled droplets in a more sophisticated double-moment microphysics scheme used in this study, i.e., through single versus double moment microphysics with and without detailed cloud and ice nucleations.
It is also possible that riming between newly formed ice crystals at thermal core and existing droplets within the thermal contributes to in-thermal graupel generation. However, heterogeneous ice nucleation generation is generally weak at relatively warm temperatures (DeMott et al., 2010) compared with those characteristic of homogeneous nucleation levels. In this context, the MA24 sequential thermal-driven graupel generation theory appears to provide a more plausible explanation; A more detailed thermal-by-thermal analysis will be required in future studies to better understand this process, since the present analysis combines both younger and older thermals.
Figure 9 illustrates the differences in cross-sectional composites of thermal properties between polluted and clean atmospheric conditions at various altitude levels. The observed variations in these composites closely align with those presented in Fig. 7. Specifically, the vertical velocity in the polluted case appears stronger around 5.5–6.5 km altitude compared to the clean case. Regarding microphysical constituents, cloud droplet (Qc) concentrations are predominantly larger in the polluted case, whereas raindrop (Qr) concentrations are greater in the clean cases. Due to limited condensation, supersaturation (S) is observed to be larger in the clean cases. Polluted case enhanced ice and snow aggregate (Qi+s) concentrations at 8.5 km due to enhanced cloud droplet (Qc) concentrations, but graupel and hail (Qg+h) concentration are mixed results at this level, as it is shown in Fig. 7g. Taken together with Fig. 7, these thermal composites clearly demonstrate the impact of background aerosol number concentrations on the simulated thermal dynamics and, consequently, on updraft core microphysical processes.
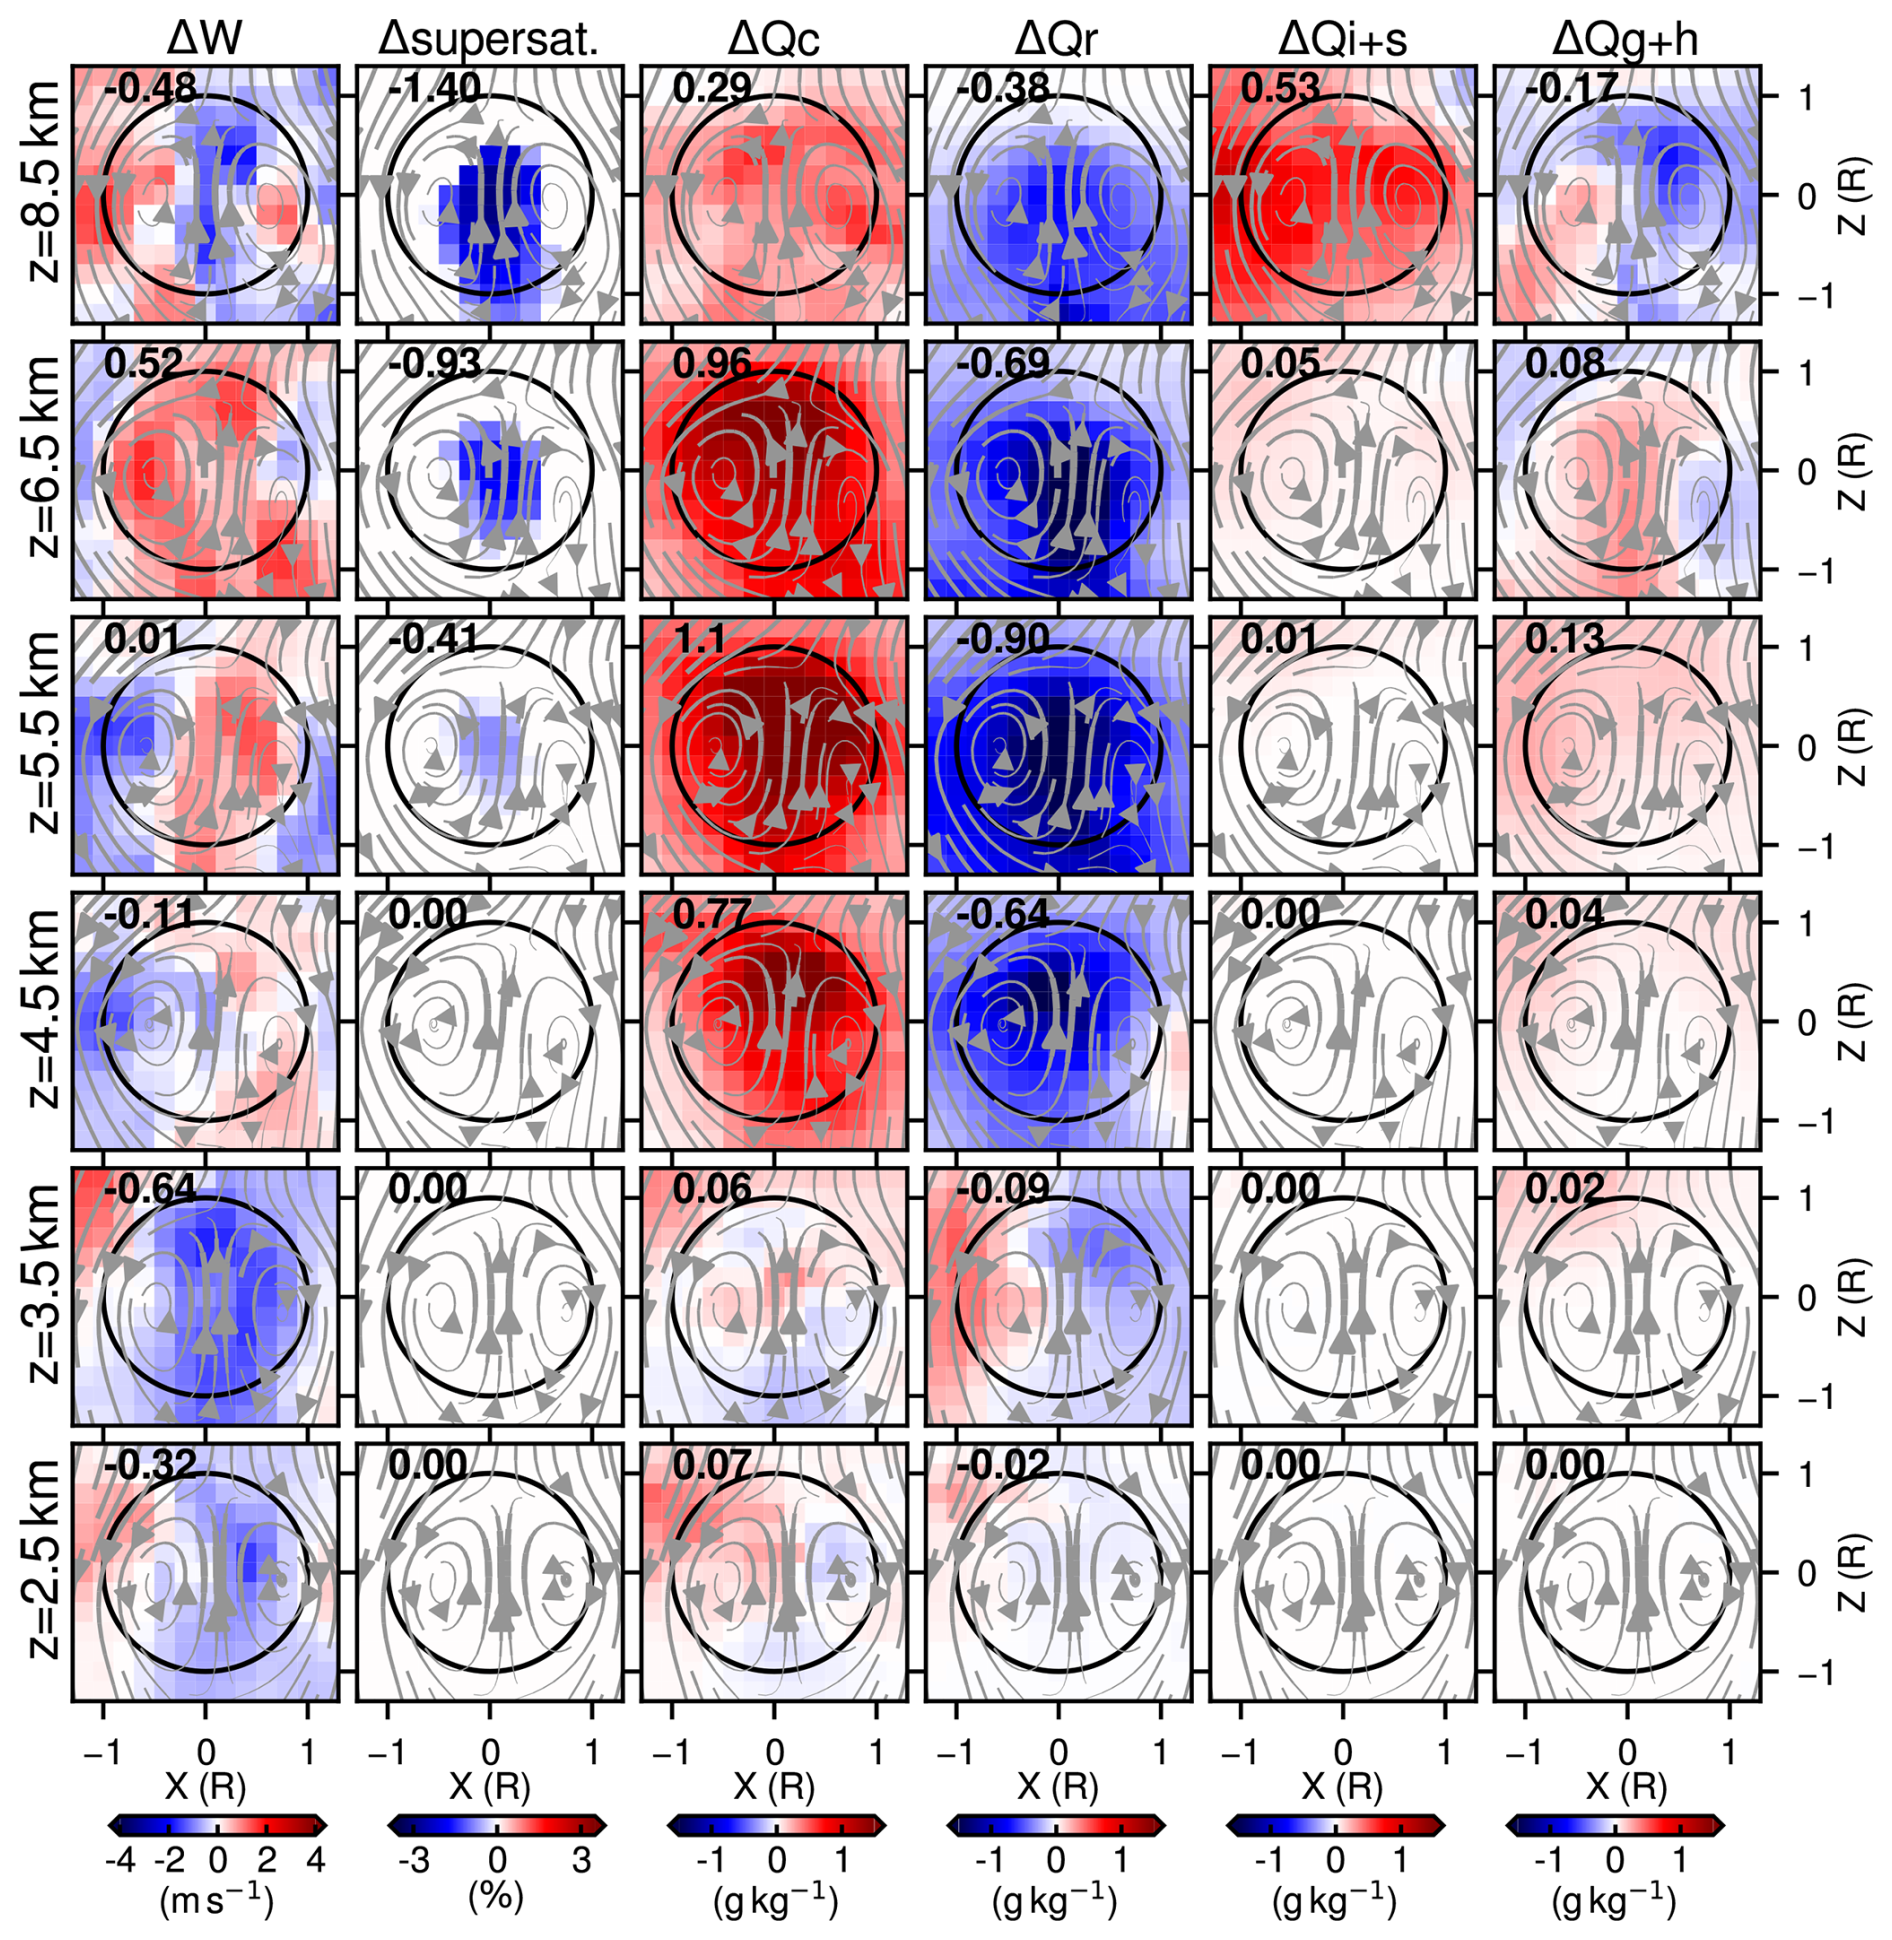
Figure 9Difference between polluted and clean cases (polluted-clean) for cross sections of composites by altitude (rows) for (columns, left to right): vertical velocity, supersaturation, cloud water mixing ratio, rain mixing ratio, ice + snow mixing ratio and graupel + hail mixing ratio. The background wind fields are taken from the clean cases.
As mentioned at the beginning of this section, we tested our thermal analysis using a random sample of thermals from 7 August cases so that we would use the same number of thermals from each case. We found that the responses regarding ice, snow, graupel and hail become slightly weaker. That is, the increase in these species with polluted conditions is slightly less pronounced, but still clear. Different versions of Fig. 5 with this random sampling are shown in Fig. S2.
3.2 Changes in mesoscale environment
The aerosol sensitivities of cumulus thermal properties raise a critical question: What mechanisms drive these responses? Specifically, is this sensitivity primarily due to isolated microphysical feedback from warm- and/or cold-phase processes, or is it a consequence of time-sequential mesoscale environmental changes? Recent extensive reviews of aerosol-deep convection interactions have reached contrasting conclusions. Varble et al. (2023) summarized that warm-phase (condensation impact) is theoretically feasible, but observationally weak at most, while cold-phase (freezing impact) is theoretically unrealistic, emphasizing methodological flaws and limited robustness in prior studies. In contrast, Fan et al. (2025) contend that aerosol invigoration remains plausible under specific meteorological and aerosol conditions, particularly in relatively clean environments. Together, these perspectives underscore that the complexity of mesoscale environments and thermodynamic feedback presents substantial challenges to quantifying the impacts of aerosols on deep convection.
To address this question, first, the time series of all-sky full-domain-mean differences in hydrometeor and thermodynamic profiles are depicted (Fig. 10). The left and right columns of the profiles represent the 4 and 7 August cases, respectively. Each profile illustrates the differences between the polluted and clean cases for various quantities. Red shading indicates larger values in the polluted case, while blue shading signifies larger values in the clean case.
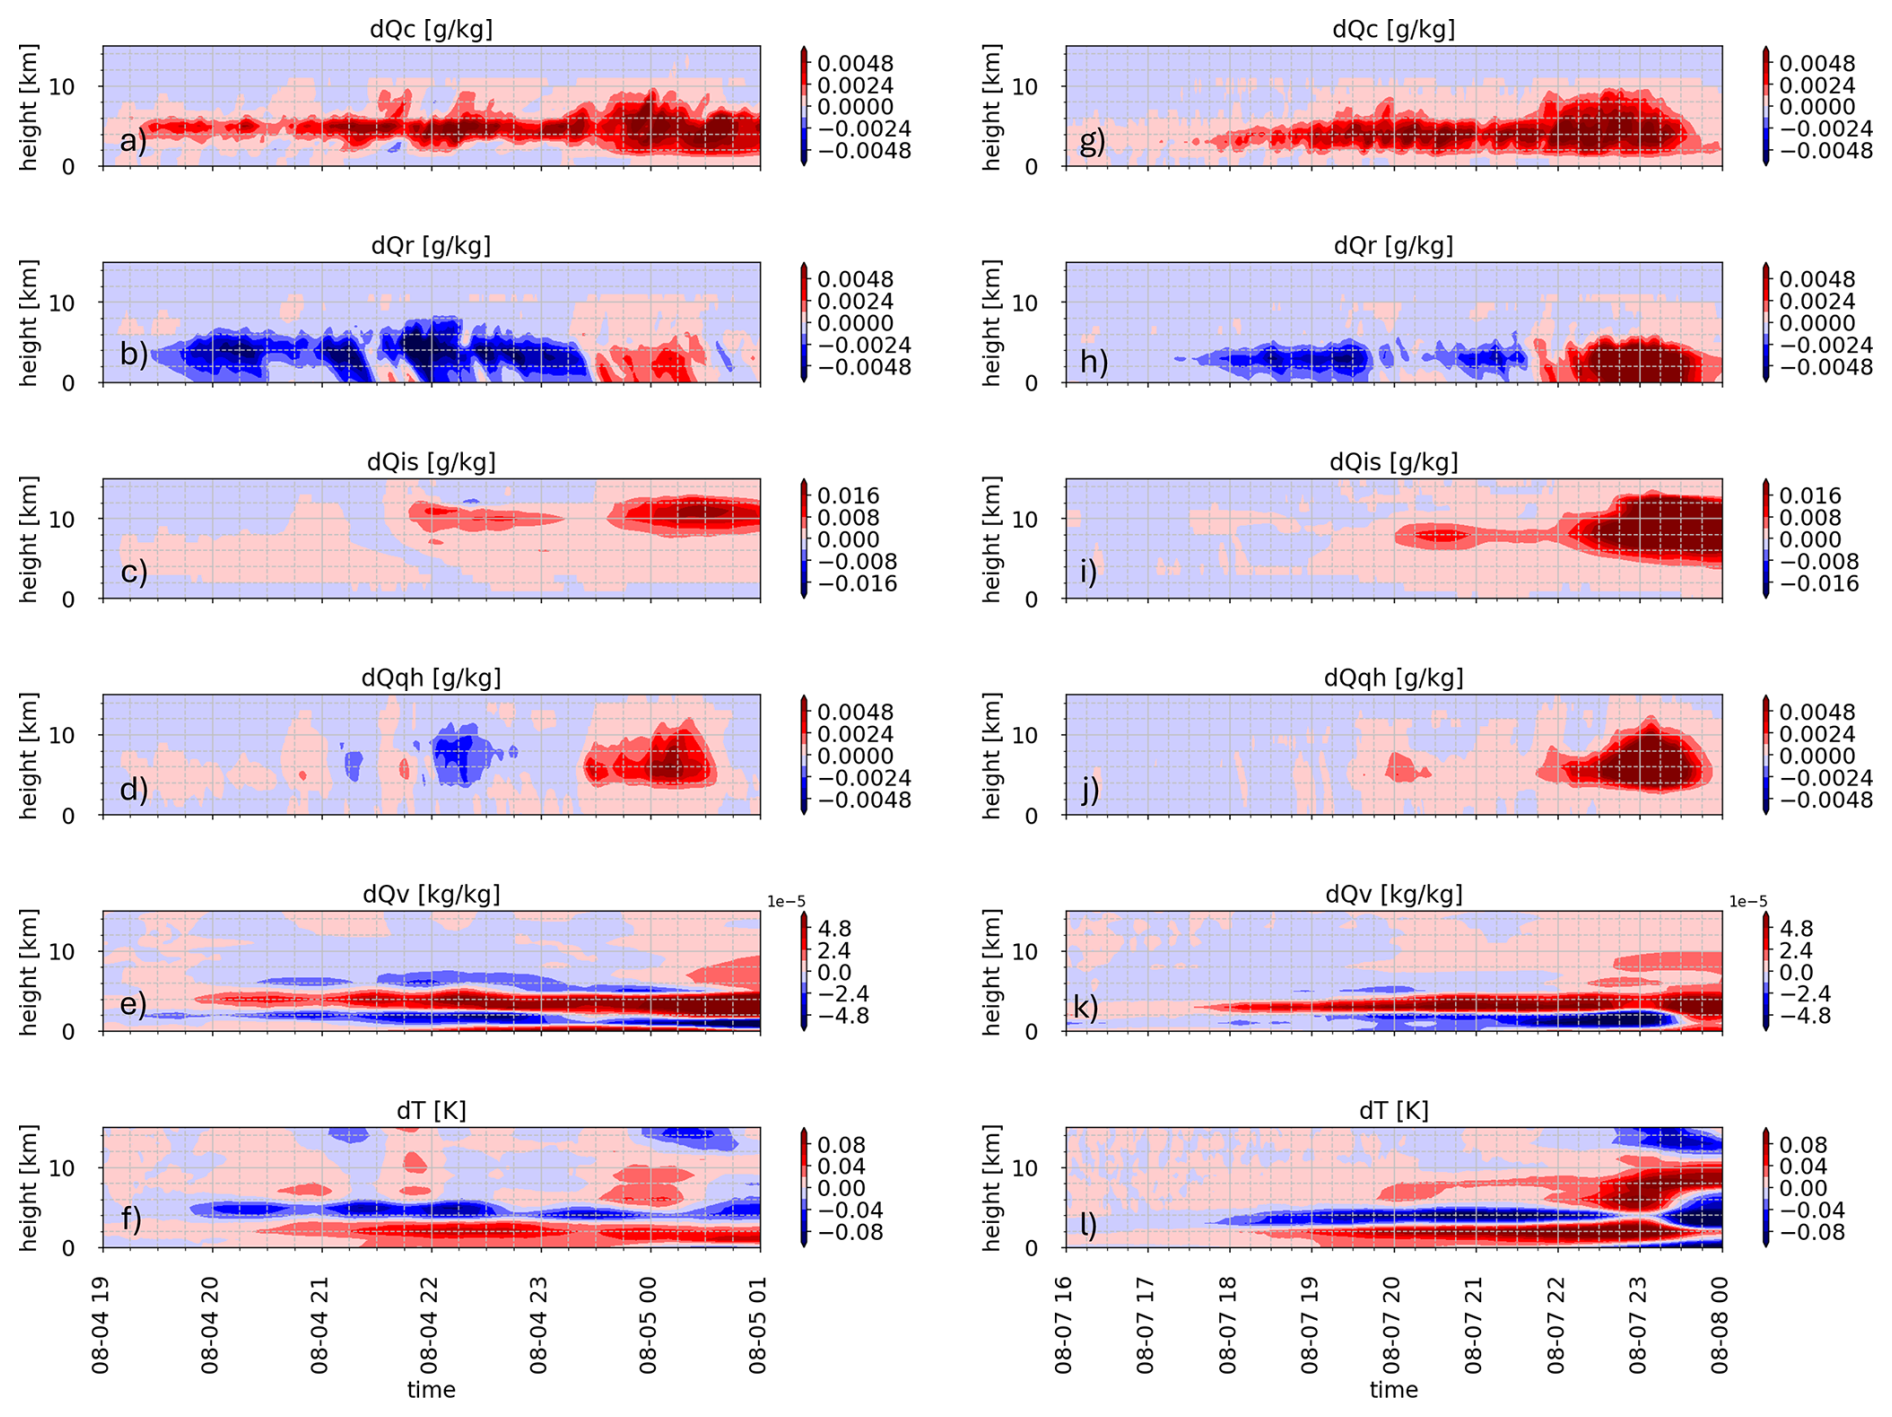
Figure 10All-sky full-domain mean profile of polluted-clean differences in (a) and (g) cloud droplet mass mixing ratio (dQc), (b, h) rain mixing ratio (dQr), (c, i) ice and snow mixing ratio (dQis), (d, j) graupel and hail mixing ratio (dQgh), (e, k) water vapor mixing ratio (dQv), (f, l) air temperature (dT). The left (right) column shows 4 August (7 August) cases.
Cloud droplet mixing ratios differences (dQc) are consistently positive (red shaded) throughout the sampling periods in both cases (Fig. 10a, g). This indicates that the polluted cases exhibit higher cloud droplet concentrations during these periods. Conversely, rain mixing ratio (dQr) differences are initially negative (blue shaded), suggesting a decrease in rain in the polluted cases, but switch to positive differences (red shaded) in the last few hours, especially for the 7 August case (Fig. 10b, h). This period also exhibits clear increases in graupel and hail (dQgh) as well as ice and snow (dQis), suggesting enhanced cold-precipitation processes and detrained anvils in the polluted case (Fig. 10d, j). Typically, a greater amount of Qc, associated with an increasing number of cloud droplets, tends to suppress warm-rain production (Fig. 7 and as discussed in DH22). However, a clear sign reversal of dQr is associated with stronger feedback in the system, as discussed and analyzed later in this section.
The difference in water vapor (dQv) and air temperature (dT) appears to be relevant to those of cloud (dQc) and raindrops (dQr). Specifically, dQv remains consistently positive around 4–5 km height and near the surface (Fig. 10e, k), where dQc is also consistently positive, suggesting that the positive dQv is likely due to greater evaporation of cloud droplets in the polluted cases. Xue and Feingold (2006) conducted LES simulations of trade cumuli, demonstrating a coherent vertical structure between droplet evaporation rate and cloud liquid water content. Conversely, dQv is strongly negative around 2–3 km height, which we attribute to the greater evaporation of raindrops in the clean cases. Consequently, air temperature exhibits opposite signs of change at different heights compared to these hydrometeor profiles (Fig. 10f, l); i.e., more water vapor due to raindrop evaporation cools the air temperature. Typically, full-domain averaging incorporates a mixture of air masses and therefore exhibits some inconsistencies (e.g., enhanced near-surface evaporation in the polluted case). Nevertheless, the overall temperature and water vapor responses remain consistent throughout the analysis period. Furthermore, these results are consistent with previous findings by Marinescu et al. (2021), who identified this same feature in a model intercomparison project for the same Houston area.
Other consistent signals due to enhanced aerosol concentrations is the simulated column lightning density, exhibiting substantial differences between polluted and clean atmospheric conditions (Fig. 11). Despite only a slight increase in graupel and hail, the polluted case showed enhanced lightning densities, whereas the clean case frequently produced no lightning at all (e.g., 19:00–21:00 UTC on 4 August). The greater production of lightning flashes in the polluted case was also associated with the dominance of cloud ice and snow, largely due to enhanced cloud droplet freezing (Fig. 10). Increased lightning activity in the polluted case was both immediate and consistent throughout intense convective periods, agreeing with the thermal tracking analyses that clearly indicate the immediate impact of aerosols on convective microphysics.
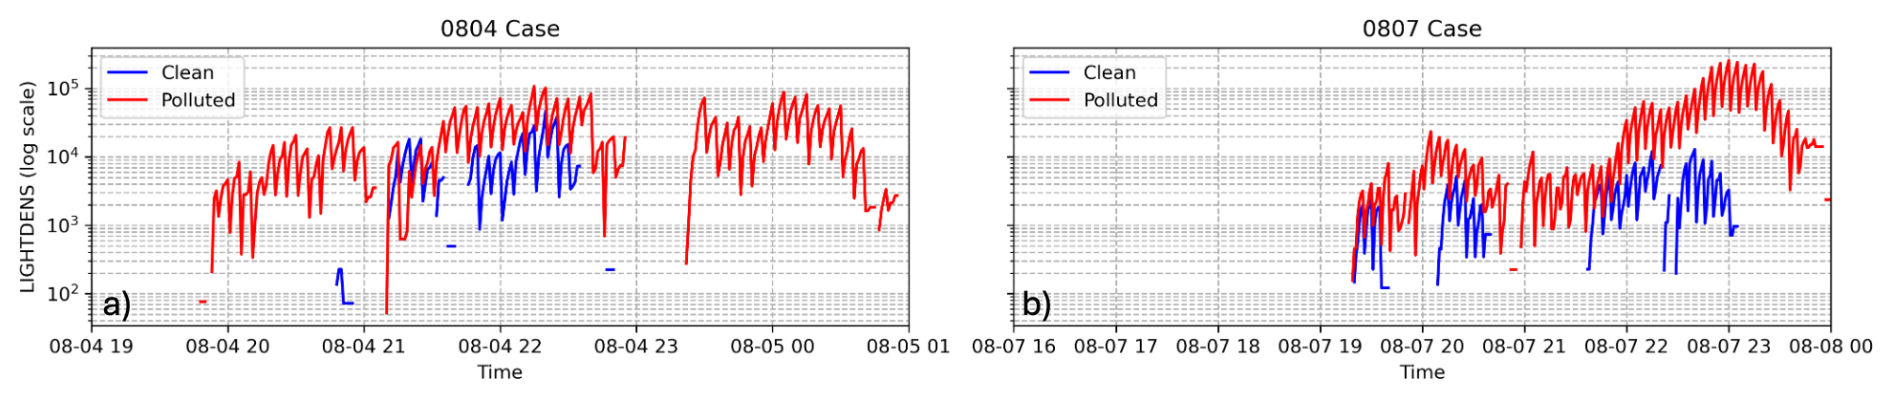
Figure 11Time series of column lightning flash density (LIGHTDENS) from the clean and polluted cases.
To understand the time-space evolution of mesoscale environment and precipitation, mesoscale low-level wind convergence (meso-LLC) fields are derived and analyzed. First, the simulated wind convergence was computed for each grid cell and then averaged between surface and 5 km altitude to generate LLC fields. Second, they are spatially averaged over 10 km × 10 km horizontal window to define meso-LLC. The meso-LLC field is a critical parameter that determines the exact location and timing of deep convection and microphysics development (e.g., Birch et al., 2013).
Visual and statistical analyses show that LLC integrated to 5 km is much more strongly correlated with column hydrometeor path than LLC integrated to shallower level (e.g., 2.5 km). The 5 km integration depth captures convergence associated with deep, long-lived convective thermals that dominate hydrometeor production, whereas the LLC integrated for shallower depth primarily reflects shallow convergence and is more strongly influenced by near-surface processes such as evaporation-driven downbursts and divergence. As a result, deeper (5 km) and spatially averaged (10 km) LLC provides a clearer and more physically meaningful indicator of the timing and location of deep convection (Figs. 12 and 13).
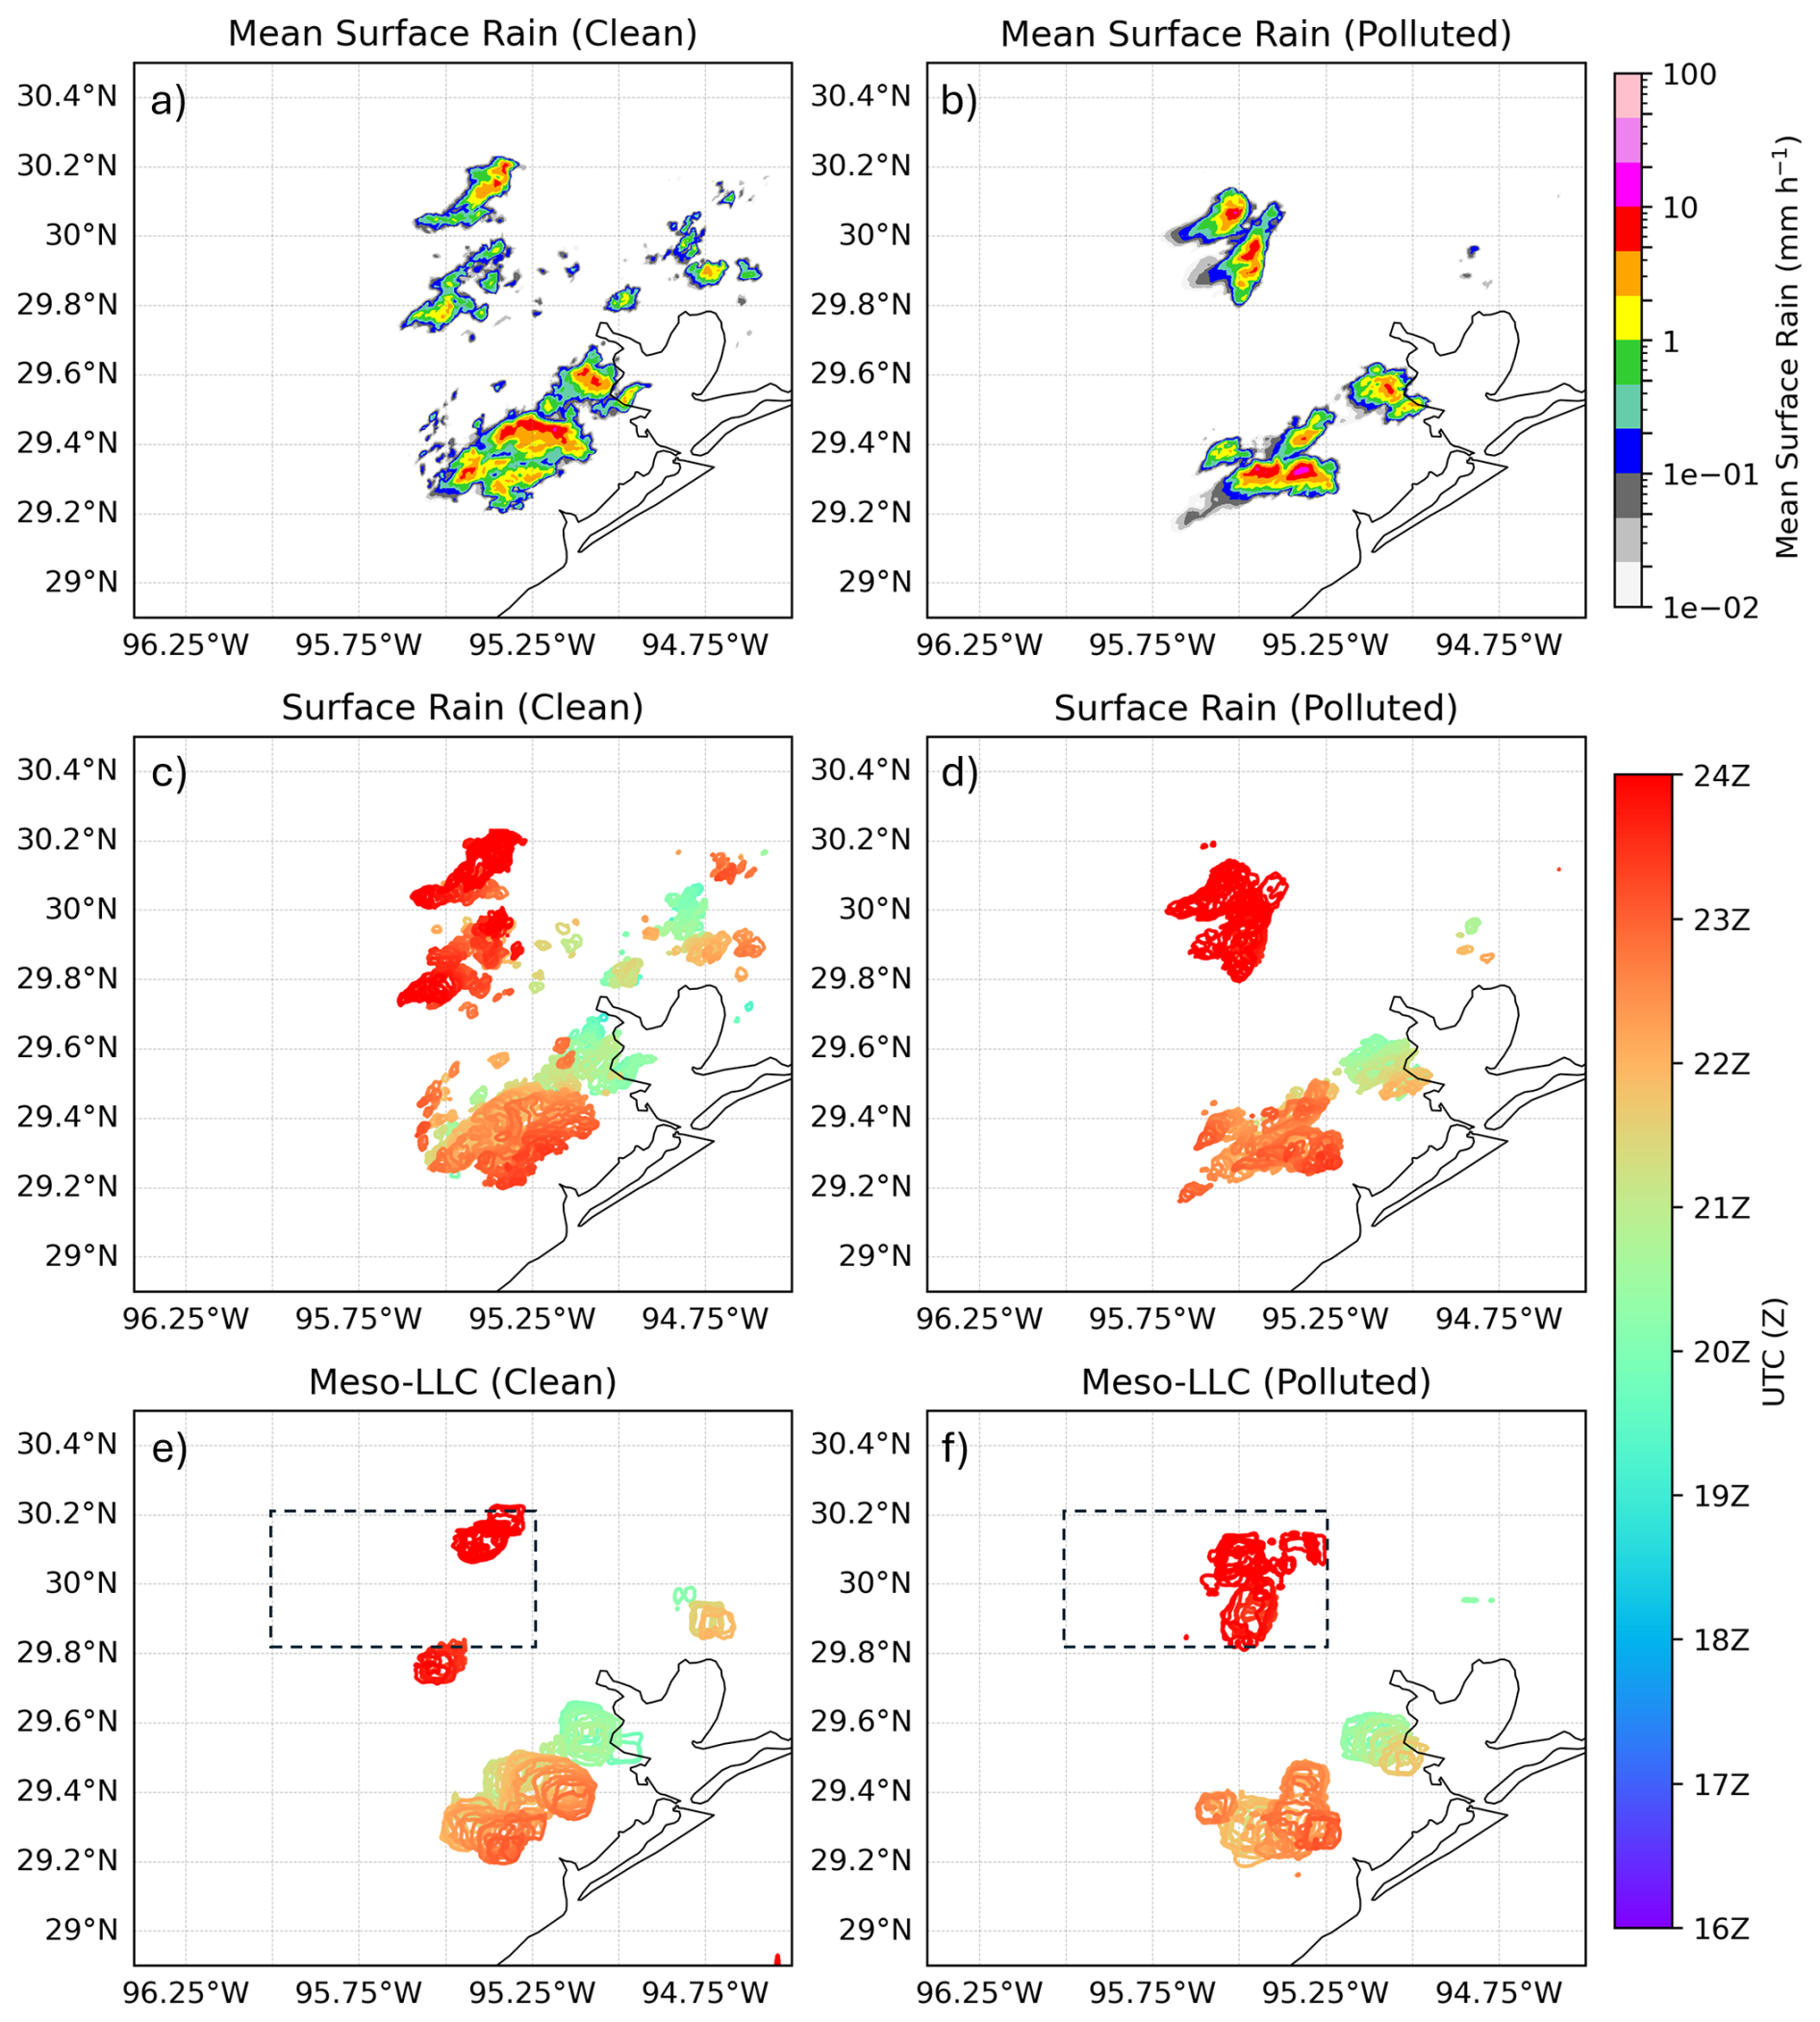
Figure 12(a–b) Mean surface precipitation, (c–d) time evolution of rainfall contours (>1 mm h−1), (e–f) and time evolution of meso-LLC contours ( s−1) from 16:00:00Z to 24:00:00Z for the 4 August simulations. The left and right column shows clean and polluted cases, respectively. The boundaries of rainfall and meso-LLC are shaded according to their corresponding UTC time. Dashed boxes in panels (e) and (f) indicate the subdomain used for Figs. 17, 18 and 19.
Meso-LLC in the Houston–Gulf region is primarily driven by the inland penetration and stalling of the sea breeze under weak synoptic flow, augmented by land–sea thermal contrasts and urban heat-island effects, which enhance convergence and convective initiation (e.g., Wang et al., 2022, 2024; Choi and Lee, 2021; Mages et al., 2025. Cold-pool outflow boundaries from prior convection can merge with the sea breeze and further strengthen convergence (Thompson et al., 2026).
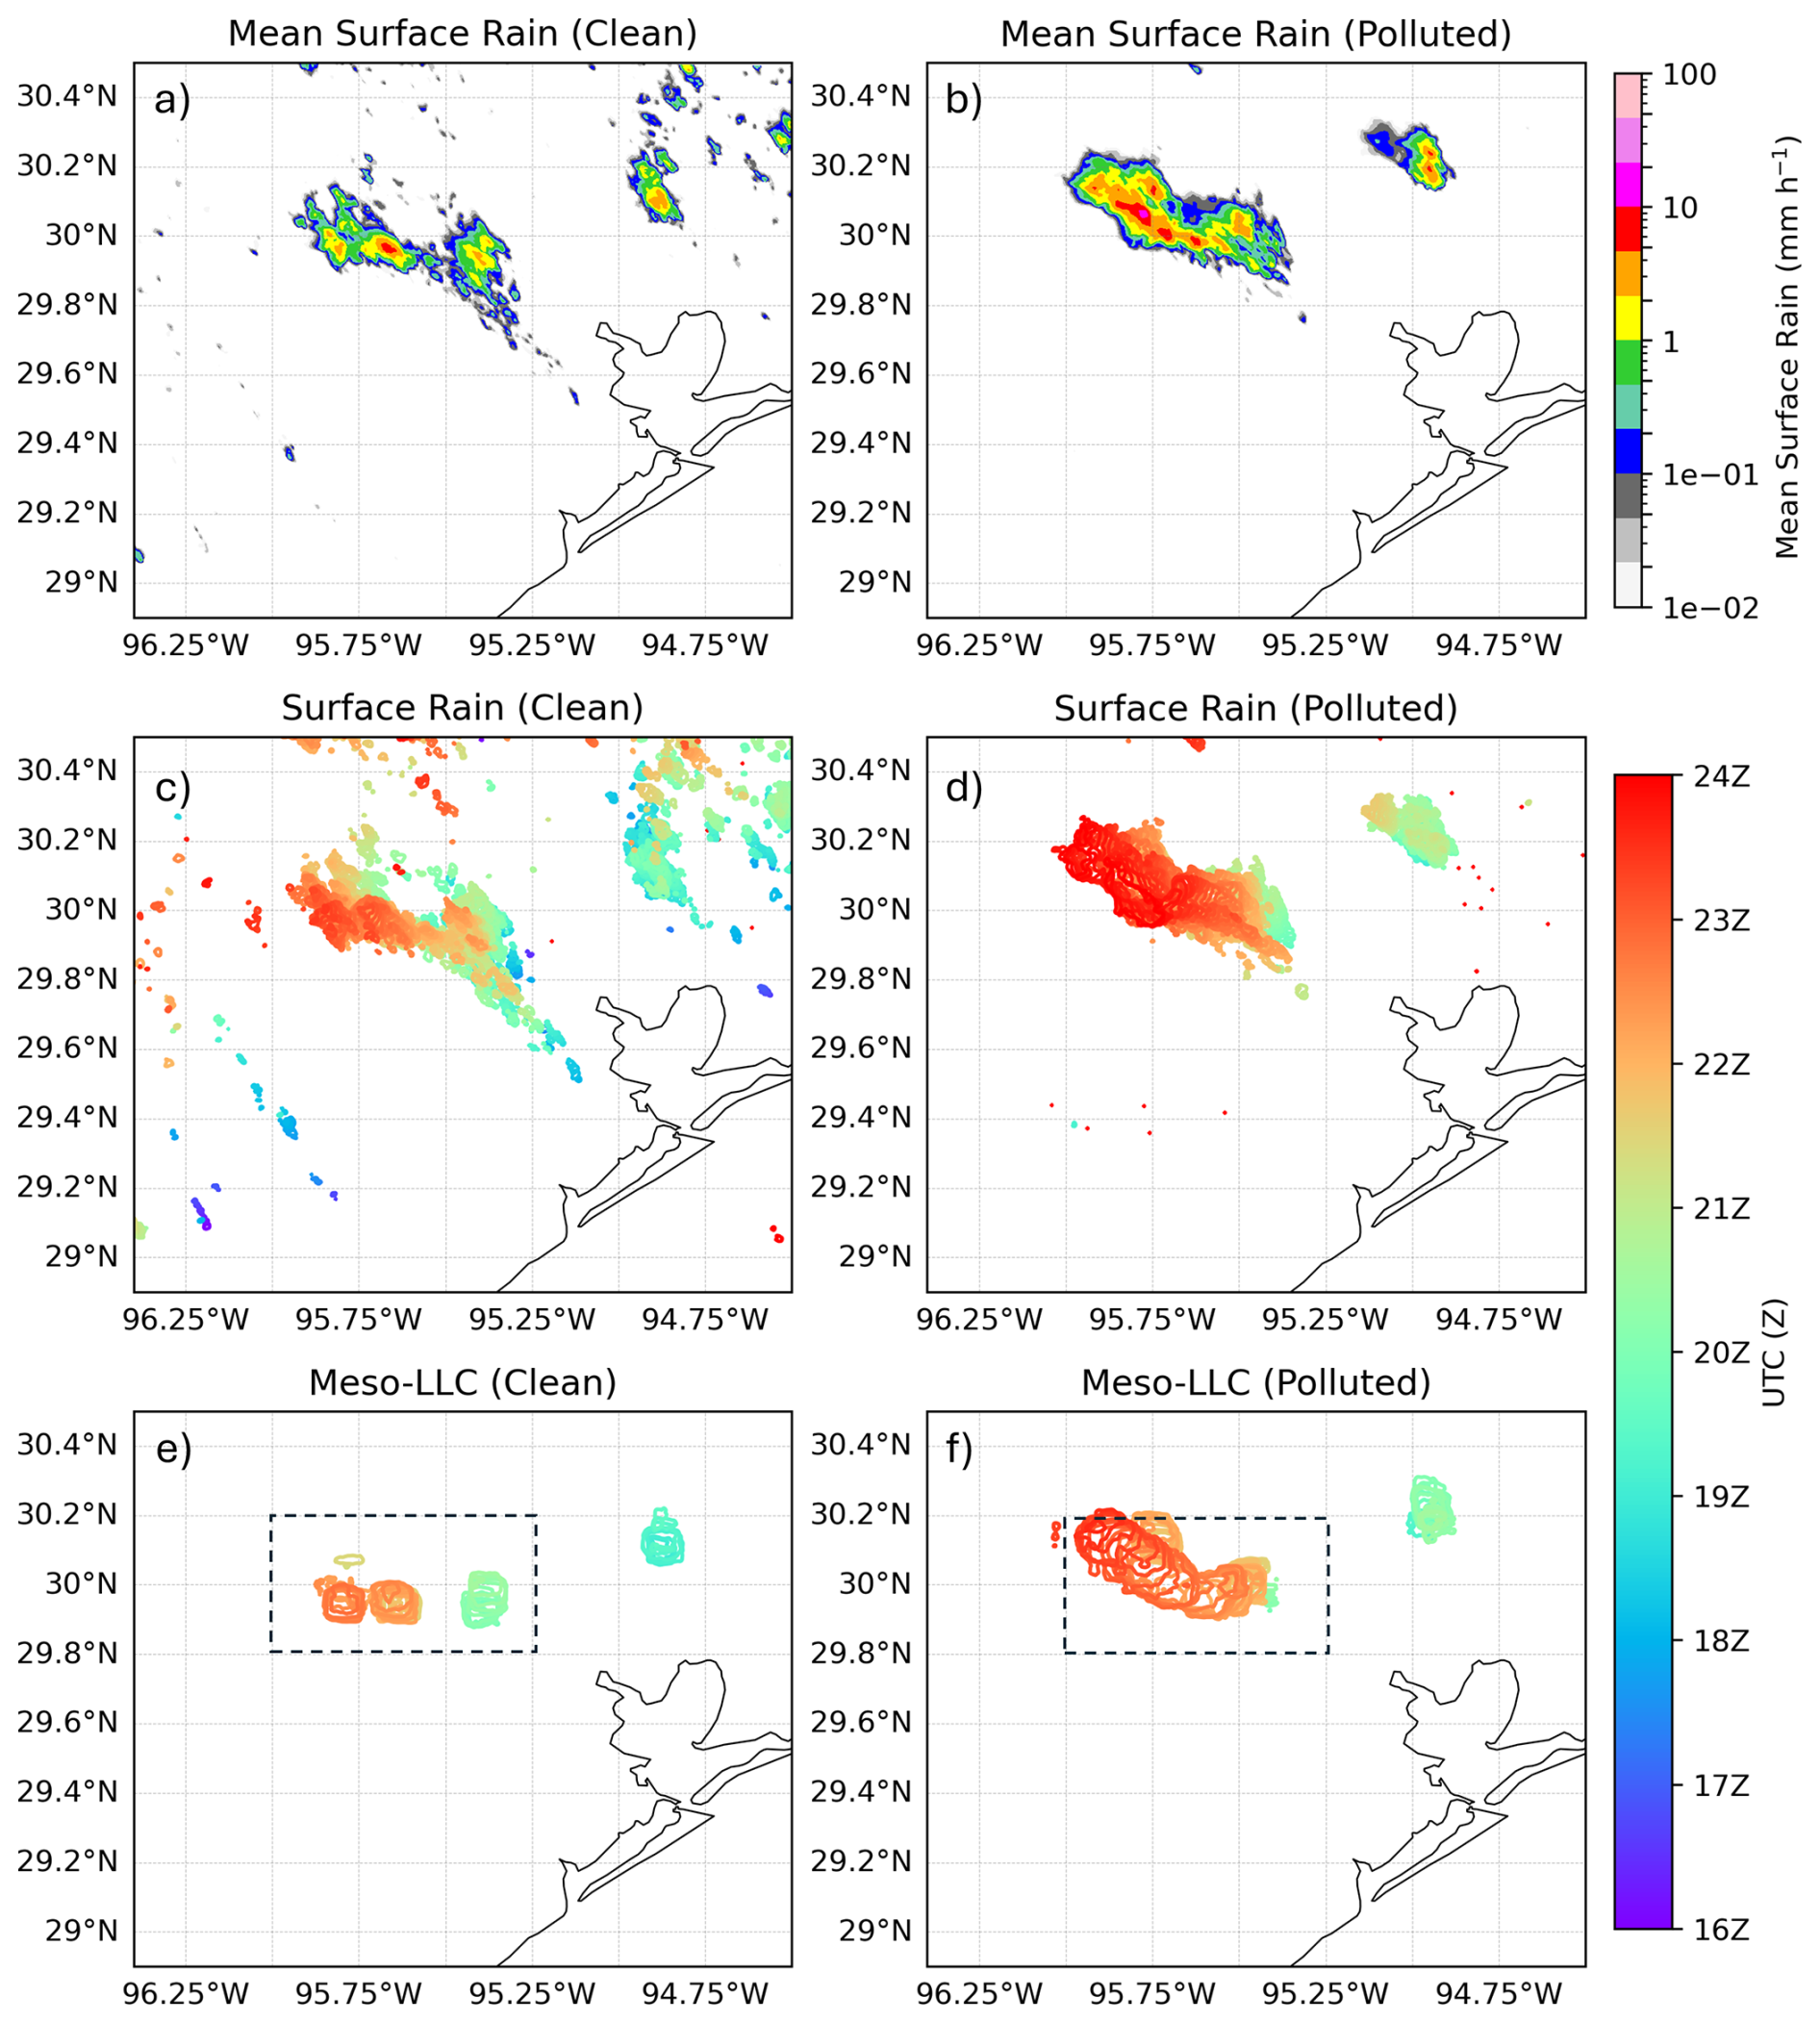
The temporal evolution of meso-LLC boundaries corresponds closely to the peak locations of the time-averaged surface rainfall fields (Figs. 12 and 13). The timing of rainfall nearly coincides with the meso-LLC. More specifically, positive meso-LLC (deep convergence) develops first in association with strong convection (ensemble of thermals), while surface rainfall is slightly delayed. Several clusters of meso-LLC developed during the analysis period, generally appearing at different locations, because of the sea-breeze-driven isolated convective cases. In the final hours, however, meso-LLCs (red contours) became more tightly clustered in the polluted cases compared to the clean cases on both 4 and 7 August. In particular, the polluted case on 7 August exhibited markedly stronger and more consolidated clusters than the corresponding clean case. Consequently, rainfall in the polluted runs tended to be organized into fewer, larger groups, whereas rainfall in the clean runs was more dispersed into multiple smaller groups. Similar behavior has been reported in previous aerosol-deep convection simulation studies, although the storm types differ (e.g., Iguchi et al., 2020). Aerosols can impact the clustering or aggregation of convection. For example, increasing aerosol loading can modify raindrop evaporation and downdraft latent cooling, thereby changing cold-pool strength and gust-front lifting so that secondary convection becomes either more or less organized depending on the altitude of the environmental dry layer (Tao et al., 2007; Grant and van den Heever, 2015).
To better quantify the degree of aggregation, we conduct the bandpath analyses of LLC for different energetic scales. Figure 14 summarizes the band-path (spectral) analysis (e.g., Lilly, 1983; Raymond and Herman, 2011) of the LLC field by counting how many Fourier modes are energetically dominant in three spatial-scale bands – mesoscale (> 20 km), convective (2–20 km), and thermal (< 2 km). For each time step, the 2-D LLC field is Fourier-transformed, the power spectrum is normalized by total power. Using the clean case only, we look at all spectral power values and define the top 10 % as energetic. This gives a fixed, objective cutoff that represents unusually strong convergence structures under clean conditions. For each scale band (thermal, convective, mesoscale), we count how many spectral modes exceed that fixed cutoff. The time series shows how many strongly energetic convergence structures are present at each scale, and how this number evolves in time for clean versus polluted cases. Thus, Fig. 14 represents the population of extreme, dynamically energetic structures at each scale, highlighting when and at what scales strong convergence events are preferentially activated and how their occurrence differs between clean and polluted environments.
At the thermal and convective scale (Fig. 14b, c, e, f), the polluted case generally exhibits a larger population of energetic LLC modes, especially toward the end of simulations, indicating aerosol-induced enhancement of small-scale updrafts and associated LLC, consistent with the stronger thermal and convection activity seen in Figs. 5 and 9. At the mesoscale (Fig. 14a, d), the polluted case on 7 August exhibits an increase in energetic convergence modes by nearly an order of magnitude toward the end of the simulation, indicative of enhanced convective organization and clustering. In contrast, the 4 August case shows only a limited late-evening increase in mesoscale energetic counts after approximately 23:30 UTC, consistent with modest convective invigoration under polluted conditions rather than sustained mesoscale organization. Nevertheless, we cannot generalize these findings regarding mesoscale feedback and clustering outside of our two case simulations. A larger sample of simulations and models would be required for this.
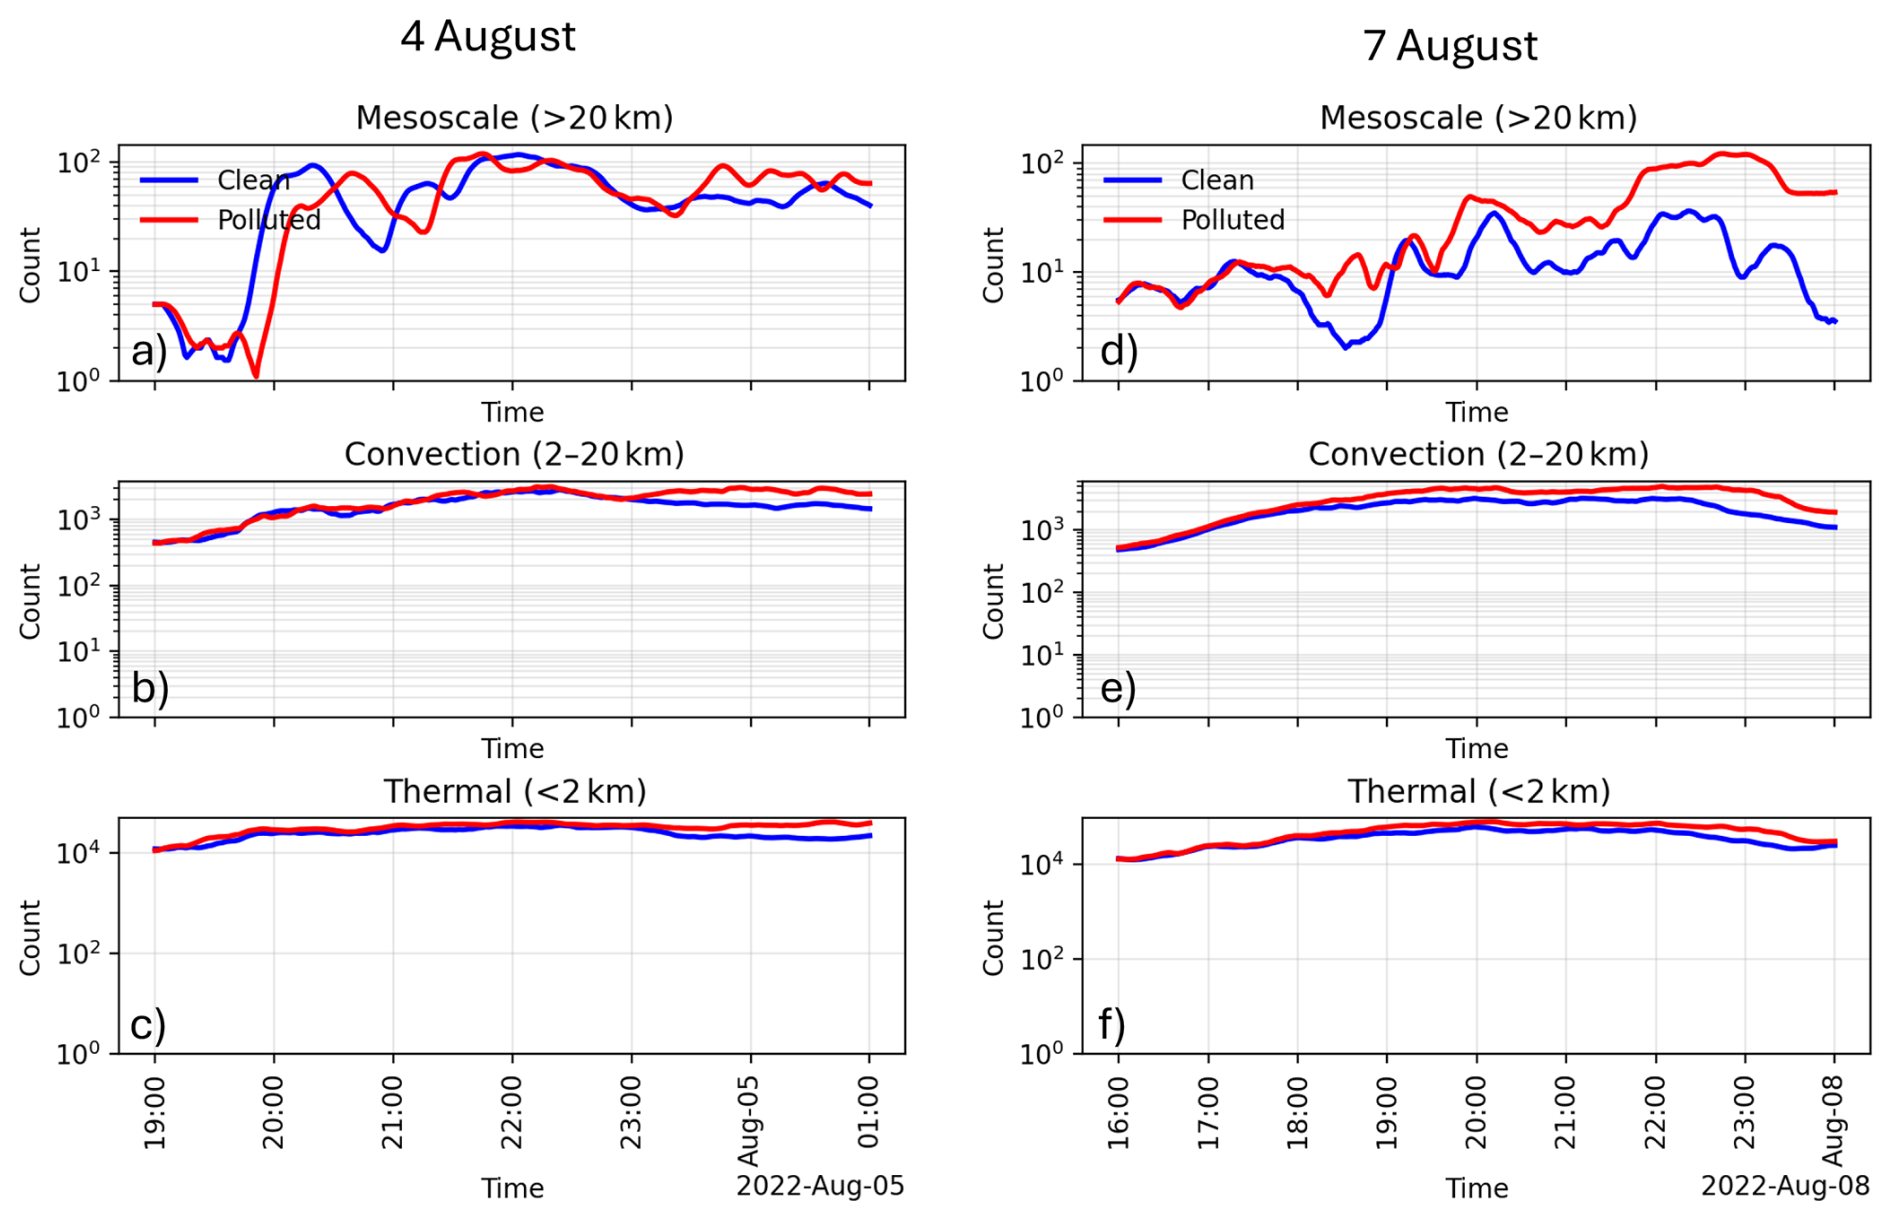
Figure 14Time evolution of log-scaled counts of energetically dominant (> 95 %) LLC modes within mesoscale, convective, and thermal bands, comparing clean and polluted simulations.
It is important to note that these changes in meso-LLC fields are purely driven by aerosol influences on cloud microphysics, as aerosol direct (e.g., radiation) effects were not considered in these sensitivity experiments. Both experiments also utilized identical initial and lateral boundary conditions, but different initial aerosol number concentrations in the polluted and clean cases (Sect. 2.2). In earlier times (until 20:00:00Z), the polluted case does not enhance cold-phase precipitation (Fig. 10b–h), while the polluted case consistently increases condensation and droplet number, suppresses warm-rain formation, and increases cloud ice and lightning discharge (Fig. 11). Appreciable strengthening only occurred in the late convective stage – suggesting a time-sequential impact on the mesoscale environment.
These results suggest that later-stage deep convective invigoration is led by mesoscale dynamical feedback, rather than by local aerosol–cloud interactions. To verify this hypothesis, additional numerical sensitivity experiments were conducted to isolate the in-storm microphysics impact of aerosols on convective clouds from the impact of mesoscale environmental change, particularly for the 7 August case. Although the original simulations were initiated with “clean” and “polluted” conditions (Sect. 2.2), prolonged integration allows for the evolution of unique cloud, mesoscale environments, and CCN loss after nearly a day of simulation time. Thus, CCN concentrations can be largely different from the initialized values. To reduce these uncertainties, aerosols were re-initialized at 22:00 UTC on 7 August, and at 23:30 UTC on 4 August for both the clean and polluted cases. These are the times when the polluted runs enhance cold-precipitation processes (Fig. 10) associated with consolidated meso-LLC fields (Figs. 12 and 13). Additional sensitivity experiments examining time-lagged reinitialization with more stratified aerosol concentrations are beyond the scope of this study, but may be conducted in the future across a broader set of cases to further strengthen the discussion and scientific insights of this manuscript.
Table 2 lists the names of the experiments. Note that the CleanRun(ReClean) and PollRun(RePolluted) experiments are specifically designed to make sure re-initializing clean/polluted aerosol conditions as described in Table 1, regardless of the altered aerosol concentrations from the initial conditions after 22 h of integration.
Table 2Experiment names and descriptions of the additional sensitivity simulations. Clean and polluted aerosol concentrations are defined in Table 1.
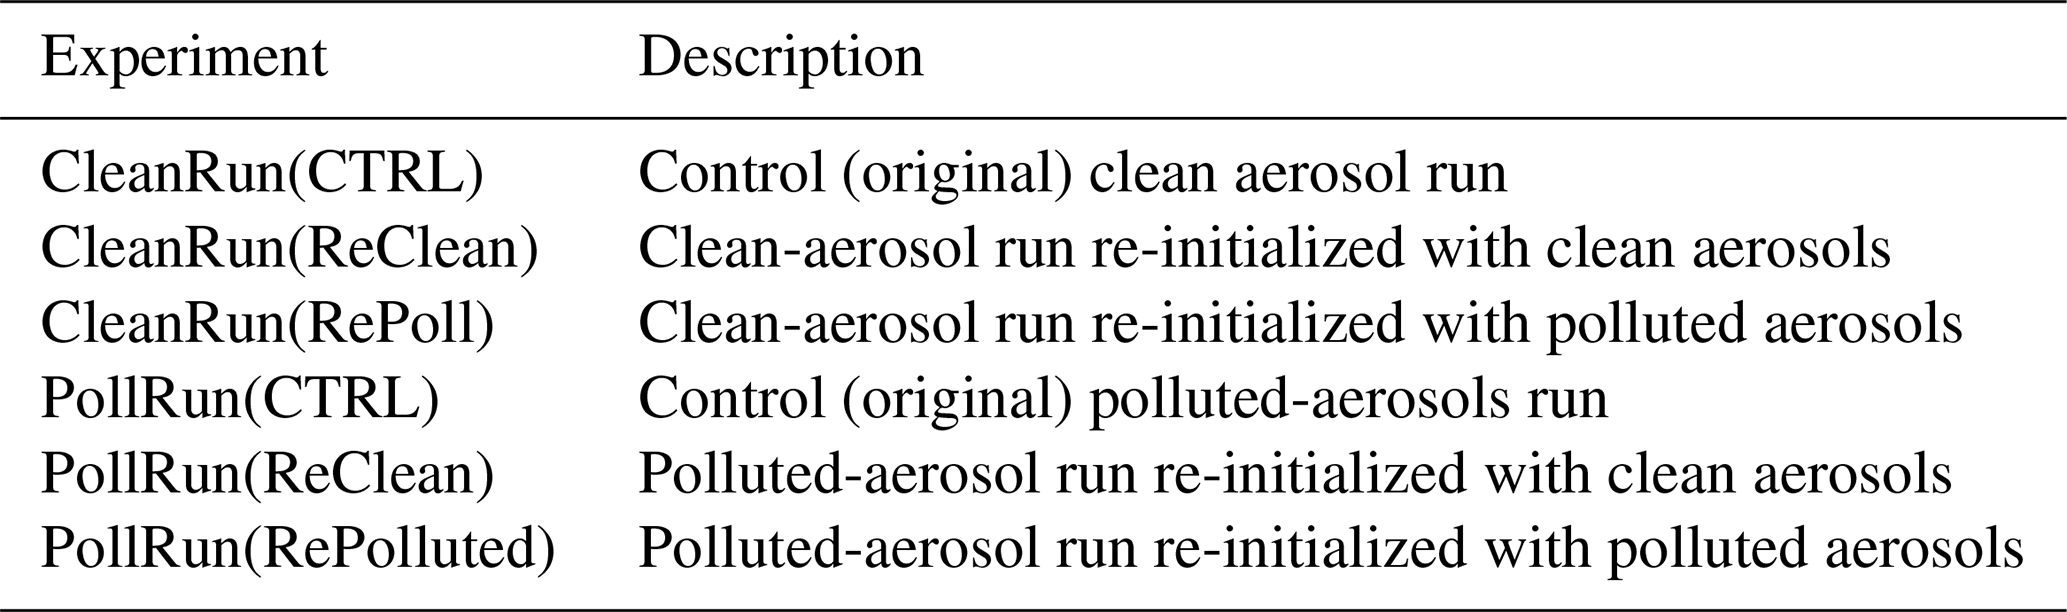
Figure 15 shows vertical profiles of vertical velocity, droplet number concentrations, rain, ice, and graupel mixing ratios, and total space charge averaged over the entire domain for all-sky conditions, from 23:30:00Z (8/4) to 00:30:00Z (8/5) on 4 August, and from 22:00:00Z to 24:00:00Z on 7 August. These time periods were chosen to match the times in which precipitation differences occur (see Fig. 10). The thick solid blue and red lines represent the original sensitivity experiments under clean (CleanRun(CTRL)) and polluted (PollRun(CTRL)) aerosol conditions, respectively, that evolved unique meso-LLC fields (Figs. 12 and 13). PollRun(CTRL) shows larger amounts of rain, ice, and graupel than CleanRun(CTRL) experiment during this time period, consistent with those of Fig. 10. The magnitude of total space change of PollRun(CTRL) shows more intensified multi-mode electric charging than CleanRun(CTRL), consistent with those of Fig. 11.
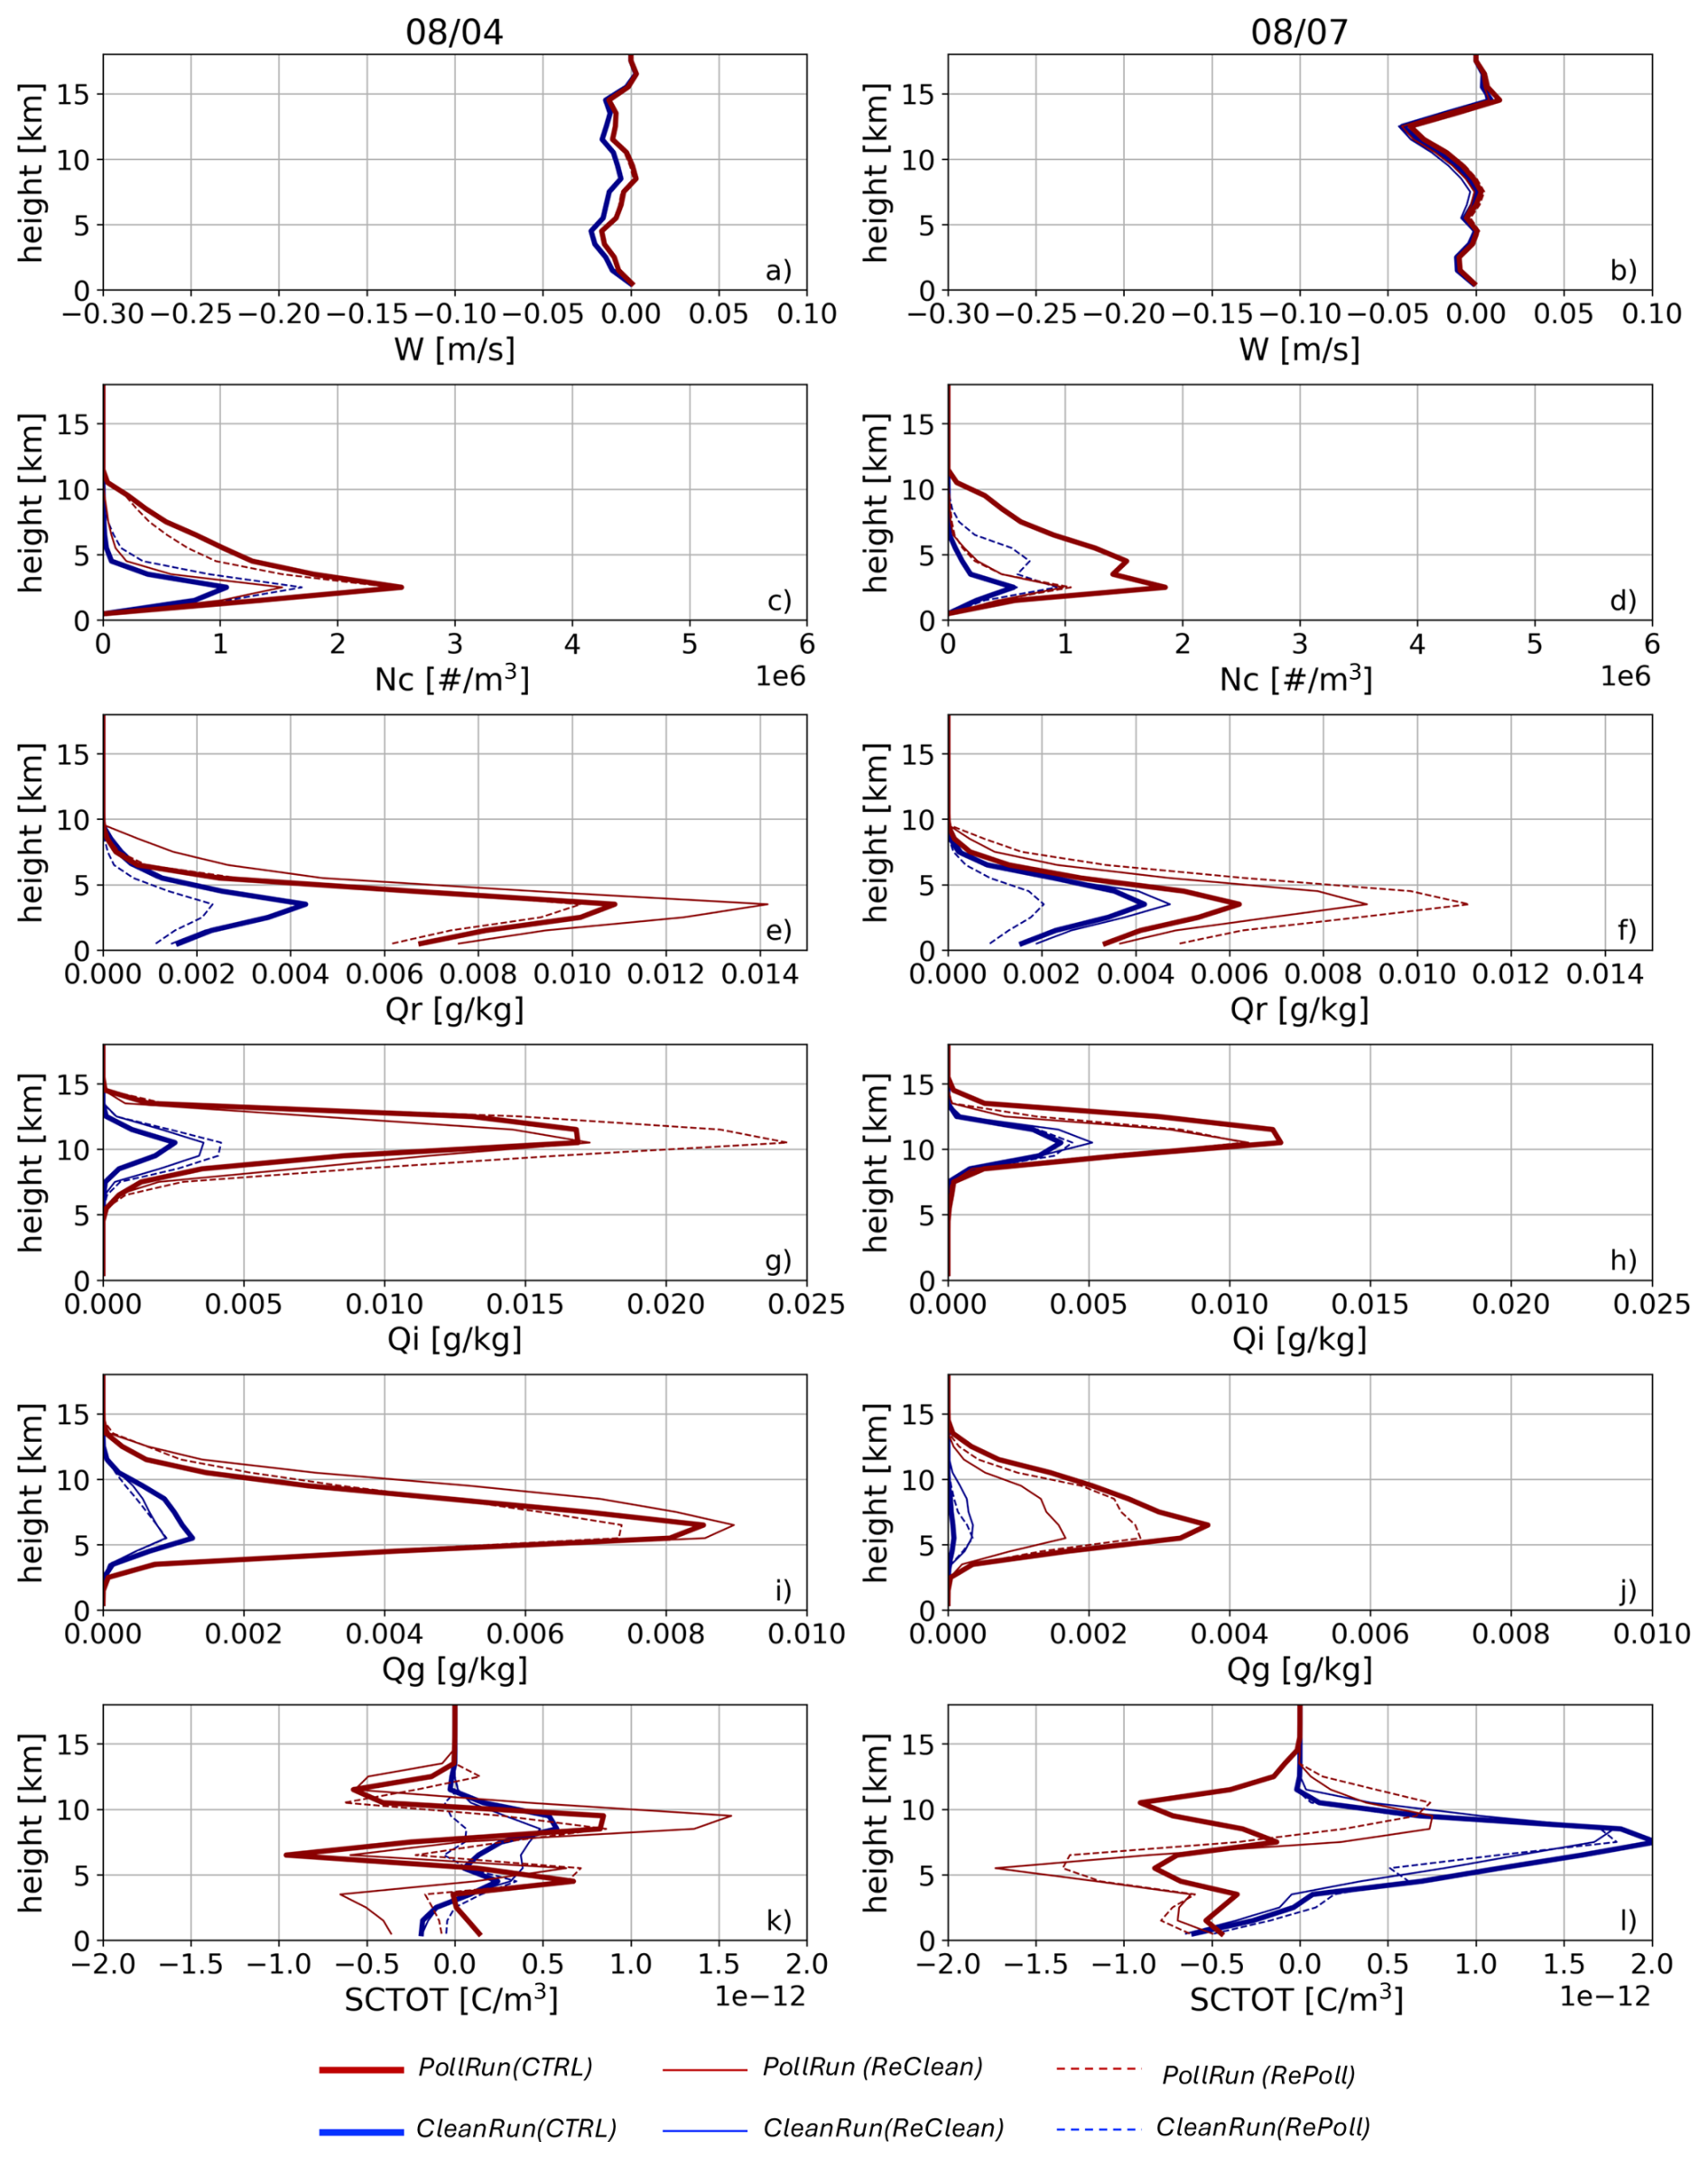
Figure 15Time and all-sky domain mean profiles of vertical velocity, cloud droplet concentrations (Nc), rain mixing ratio (Qr), ice mixing ratio (Qi), and graupel mixing ratio (Qg), total space charge (SCTOT) from the 4 August (left) and 7 August (right) case. Note that the temporal integration is from 23:30:00Z (8/4) to 00:30:00Z (8/5) on 4 August and from 22:00:00Z to 24:00:00Z on 7 August.
The PollRun(RePoll) and CleanRun(ReClean) experiments show slight differences from the CleanRun(CTRL) and PollRun(CTRL) experiments, respectively, suggesting that the spatial distributions of aerosol concentrations are altered through advection and aerosol microphysics loss throughout the model integration (Fig. 15). All members of the polluted experiments (PollRun(CTRL), PollRun(ReClean), PollRun(RePoll)) show higher values of rain, ice, and graupel mixing ratios, and larger dipoles in total space charge than those of the clean experiments (CleanRun(CTRL), CleanRun(ReClean), CleanRun(RePoll)), suggesting that the mesoscale environment created by the PollRun(CTRL) experiment plays a dominant role in shaping the hydrometeor and electrification profiles.
Full-domain statistics capture the spatial extent and aggregation of convection across the system, while convective-core sampling isolates local updrafts and directly reflects aerosol–cloud interactions. Abrupt changes in aerosol concentration do not significantly affect domain-wide convection in polluted–dynamic runs, but they do intensify convection at the local core scale. Overall, mesoscale dynamical feedbacks dominate domain-wide convective activity, with aerosol–cloud interactions playing a secondary, local role.
These results suggest that even over relatively short integration periods, the influence of aerosols on isolated deep convective cloud development strongly depends on the prevailing mesoscale environment, even within the single modeling framework employed in this study.
Figure 16 shows similar profiles from the convective-core sampling, based on the minimum thresholds of column condensate (0.1 g m−3) and maximum vertical velocity (greater than 4.0 m s−1). While domain all-sky sampling can quantify the total magnitude of hydrometeor profiles, the convective-core sampling shows that cloud droplet number concentrations (Nc) follow nearly identical values among the polluted-aerosol experiments group (PollRun(CTRL), PollRun(RePoll), and CleanRun(RePoll)), as well as among the clean-aerosol experiments group (CleanRun(CTRL), CleanRun(ReClean), and PollRun(ReClean)), regardless of the different mesoscale environment (Fig. 16d).
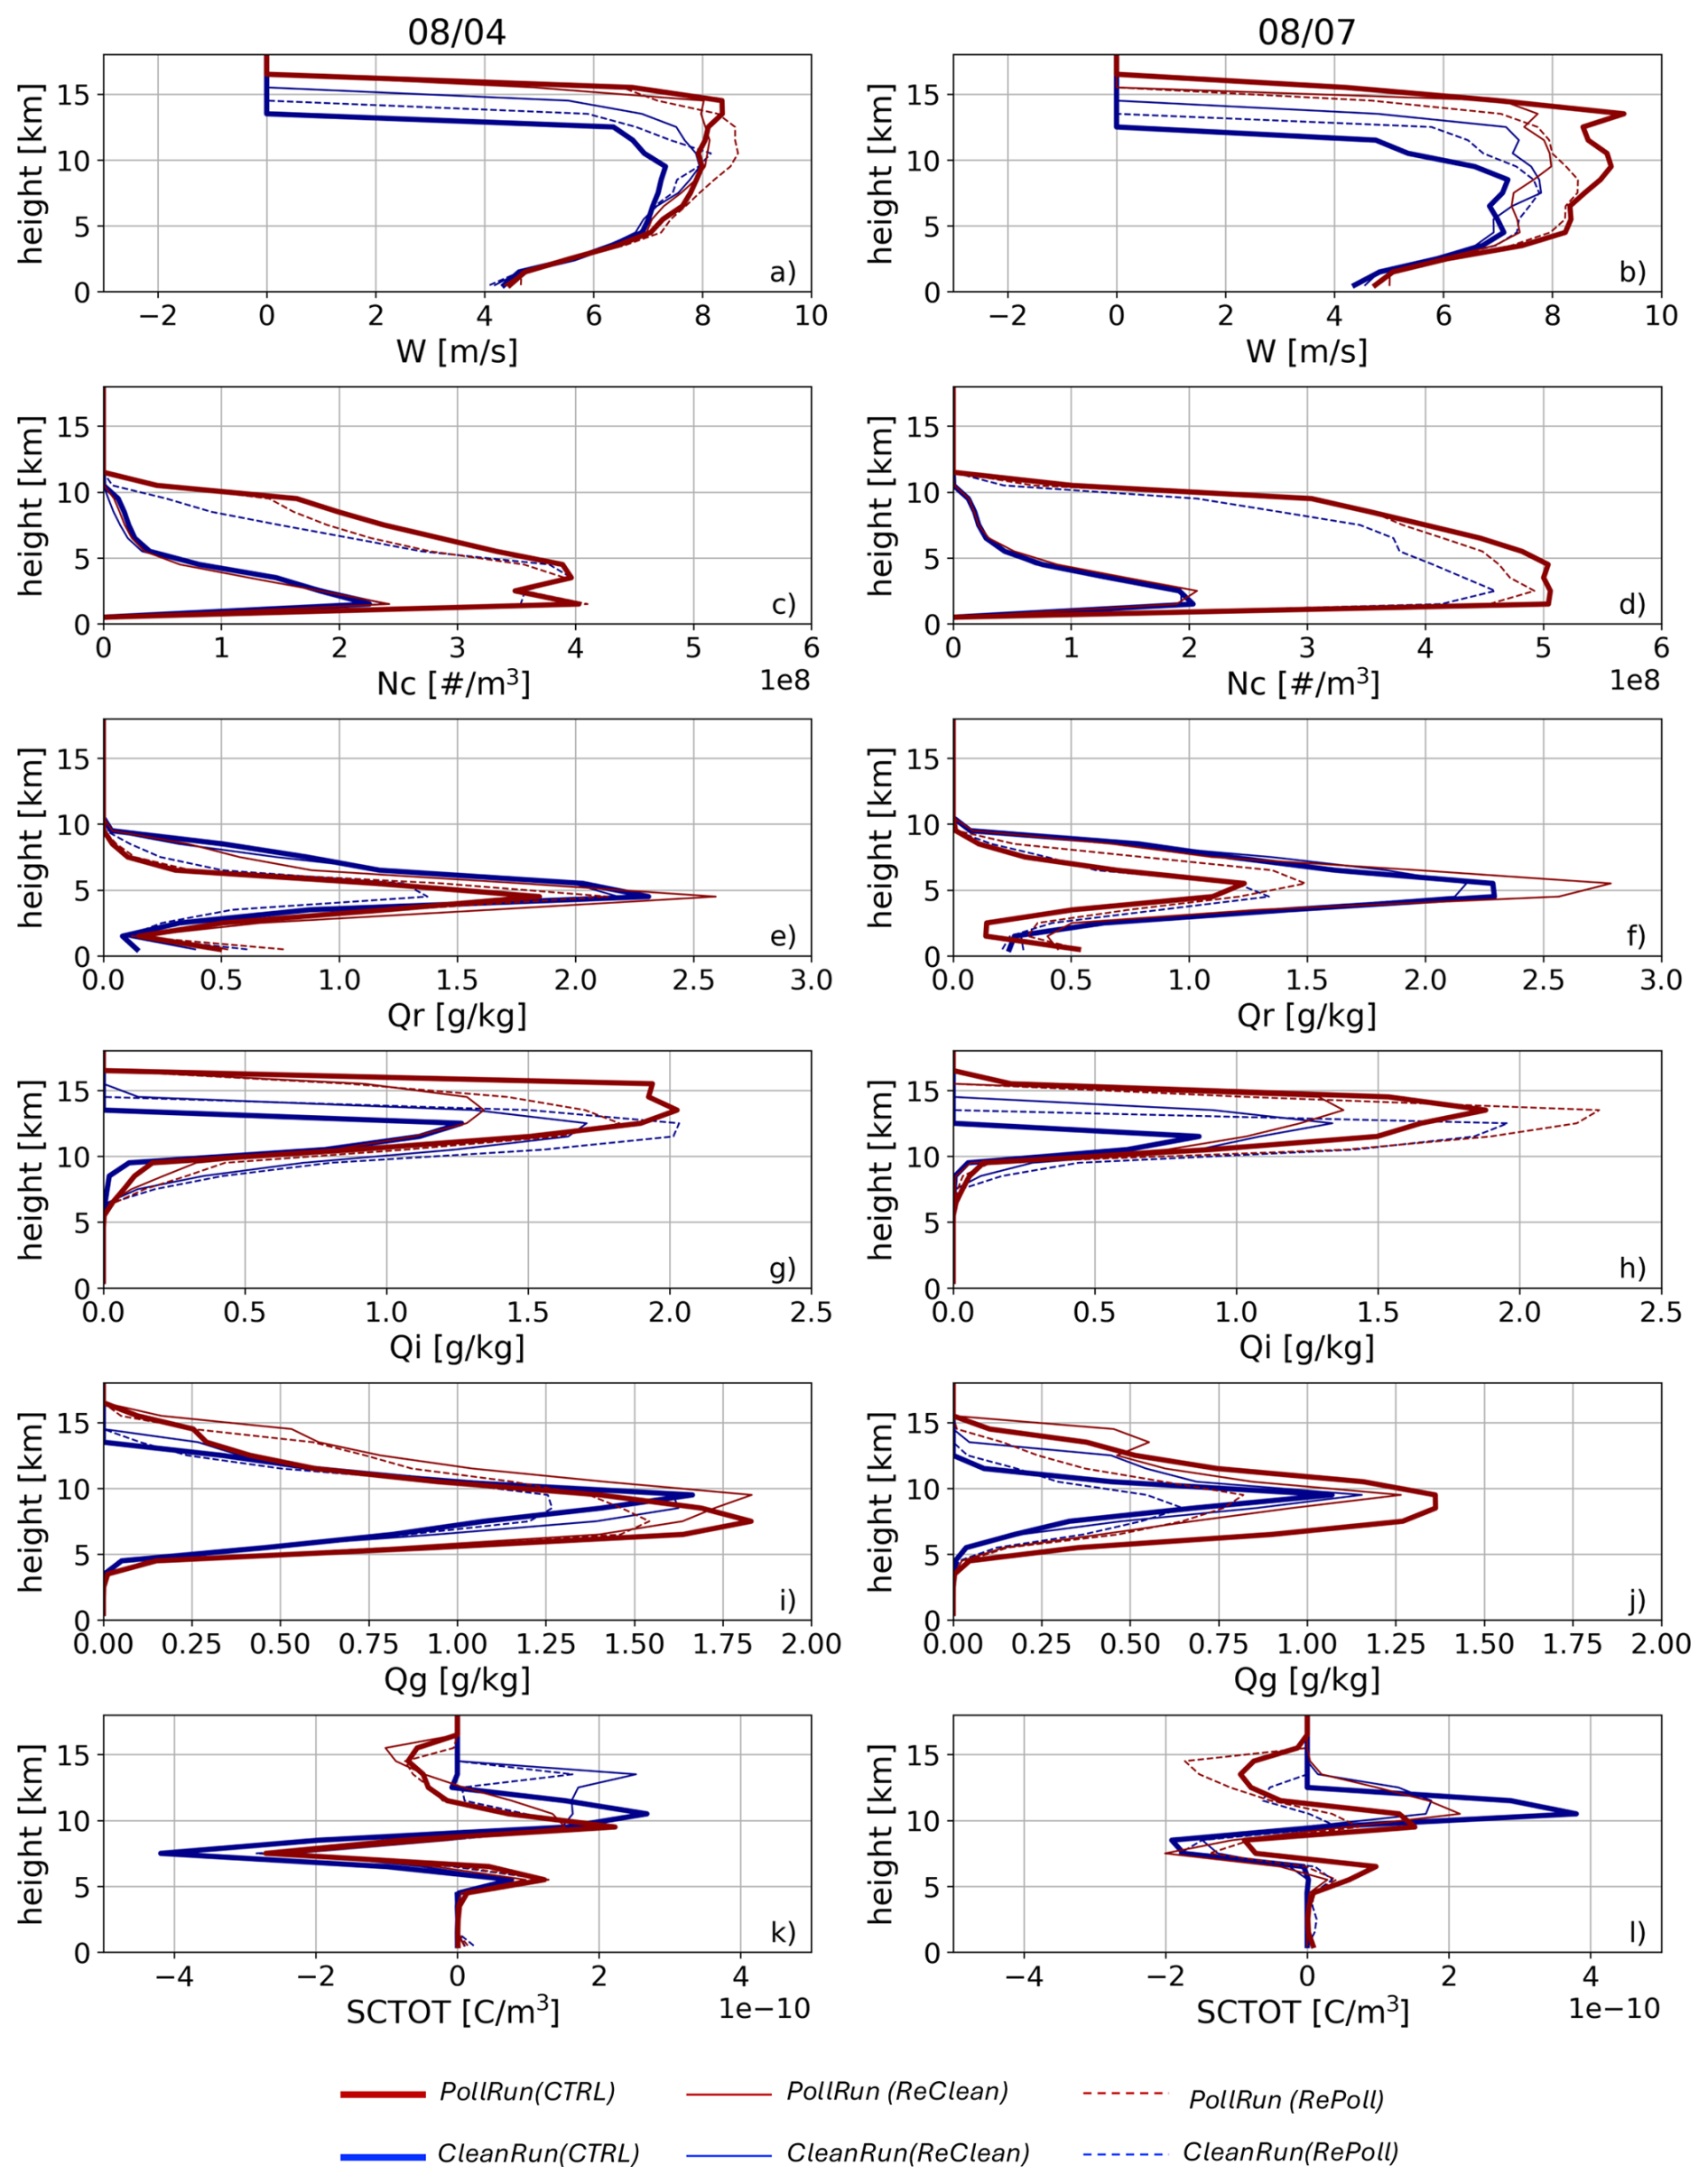
The large Nc also certainly reduces rain mixing ratio (Qr, Fig. 16e, f),and enhances ice mixing ratio (Qi, Fig. 16g, h) within the convective cores. As discussed earlier, charging outside thermals produces a weak positive charge center (Fig. 16k, l, between 5–6 km). The polluted experiment group (PollRun(CTRL), PollRun(RePoll), and CleanRun(RePoll)) also exhibit an upper-level negative charge center between 12–16 km, probably either due to relatively deep positive charging of graupel resulting in negative ice crystals aloft or due to screening layer formation from ion drift on longer-lived storm tops. Such enhancements to positive charging to graupel are expected, given the larger cloud droplet number concentrations modeled herein.
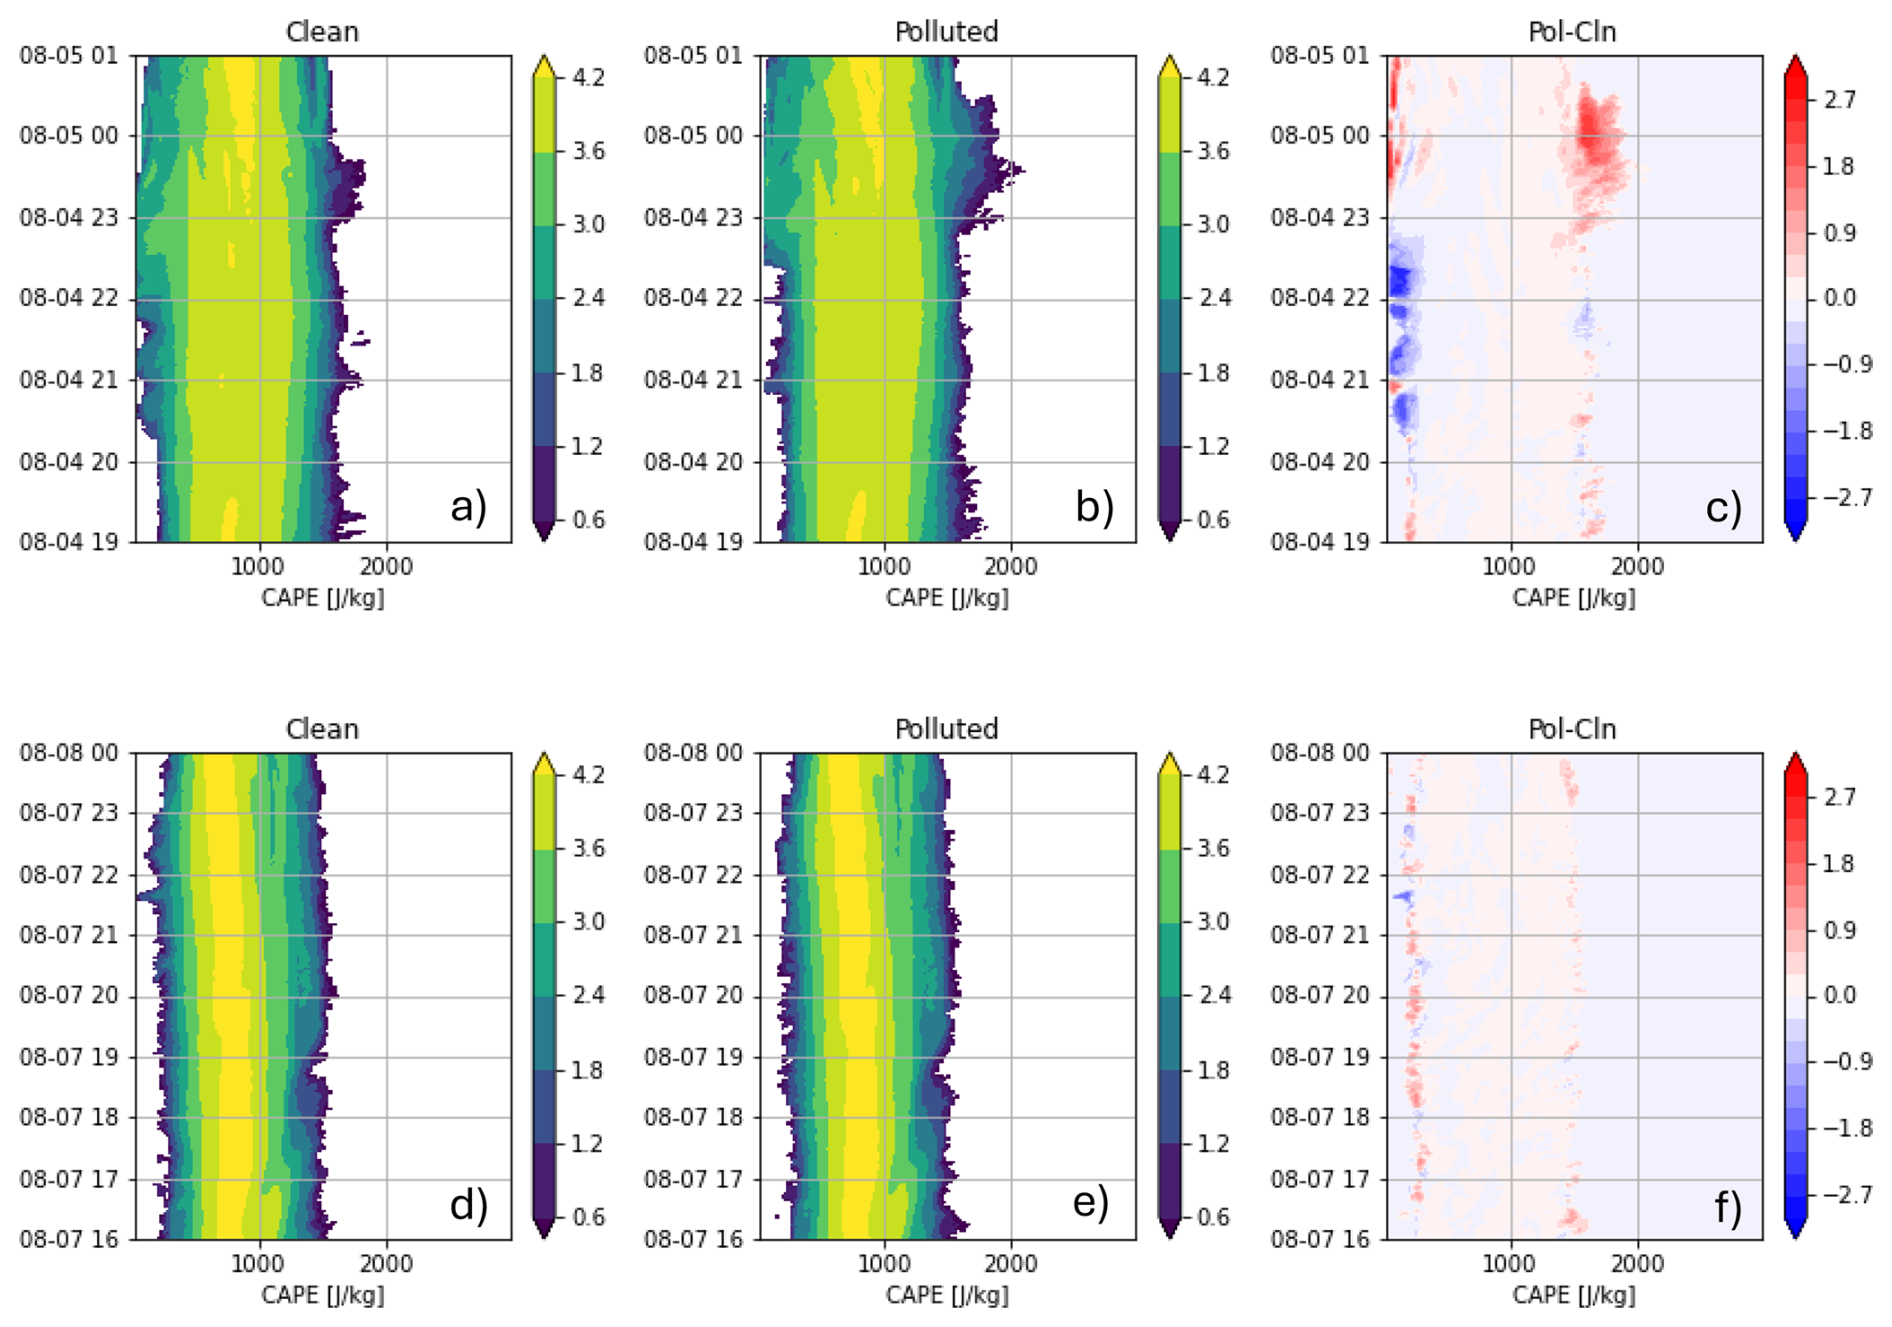
In order to delve deeper into the mesoscale feedback we find in our simulations, we now focus on a subdomain spanning 29.8–30.0° N and 95.25–96.0° W (1600 km2), where pronounced convective clustering develops (Figs. 12 and 13). This area lies within a typical downwind convergence zone, where urban influences are known to enhance afternoon convection (Shepherd and Burian, 2003). Within this subdomain, we construct a time series of convective available potential energy (CAPE) at each model grid point using 1-min simulation output. Figure 17 shows the resulting CAPE evolution and the polluted–clean differences for the 4 and 7 August cases. On 4 August, the polluted simulation exhibited systematically higher CAPE between 22:30 and 00:30 UTC (the following day) relative to the clean case. The largest CAPE reached up to 2000 J kg−1 in the polluted run. In contrast, the 7 August case shows no comparable CAPE enhancement in the polluted run, despite a clear increase in mesoscale LLC organization and convective clustering.
During periods when the polluted simulation exhibits stronger deep convection than the clean run, we additionally examine subdomain-averaged large-scale atmospheric profiles (Fig. 18). Overall, both the 4 and 7 August cases show nearly identical temperature and relative humidity profiles (Fig. 18a, b, e, f), despite higher grid-scale CAPE in the polluted run for the 4 August case. In contrast, the mean vertical velocity and convergence profiles reveal distinct differences between the polluted and clean simulations.
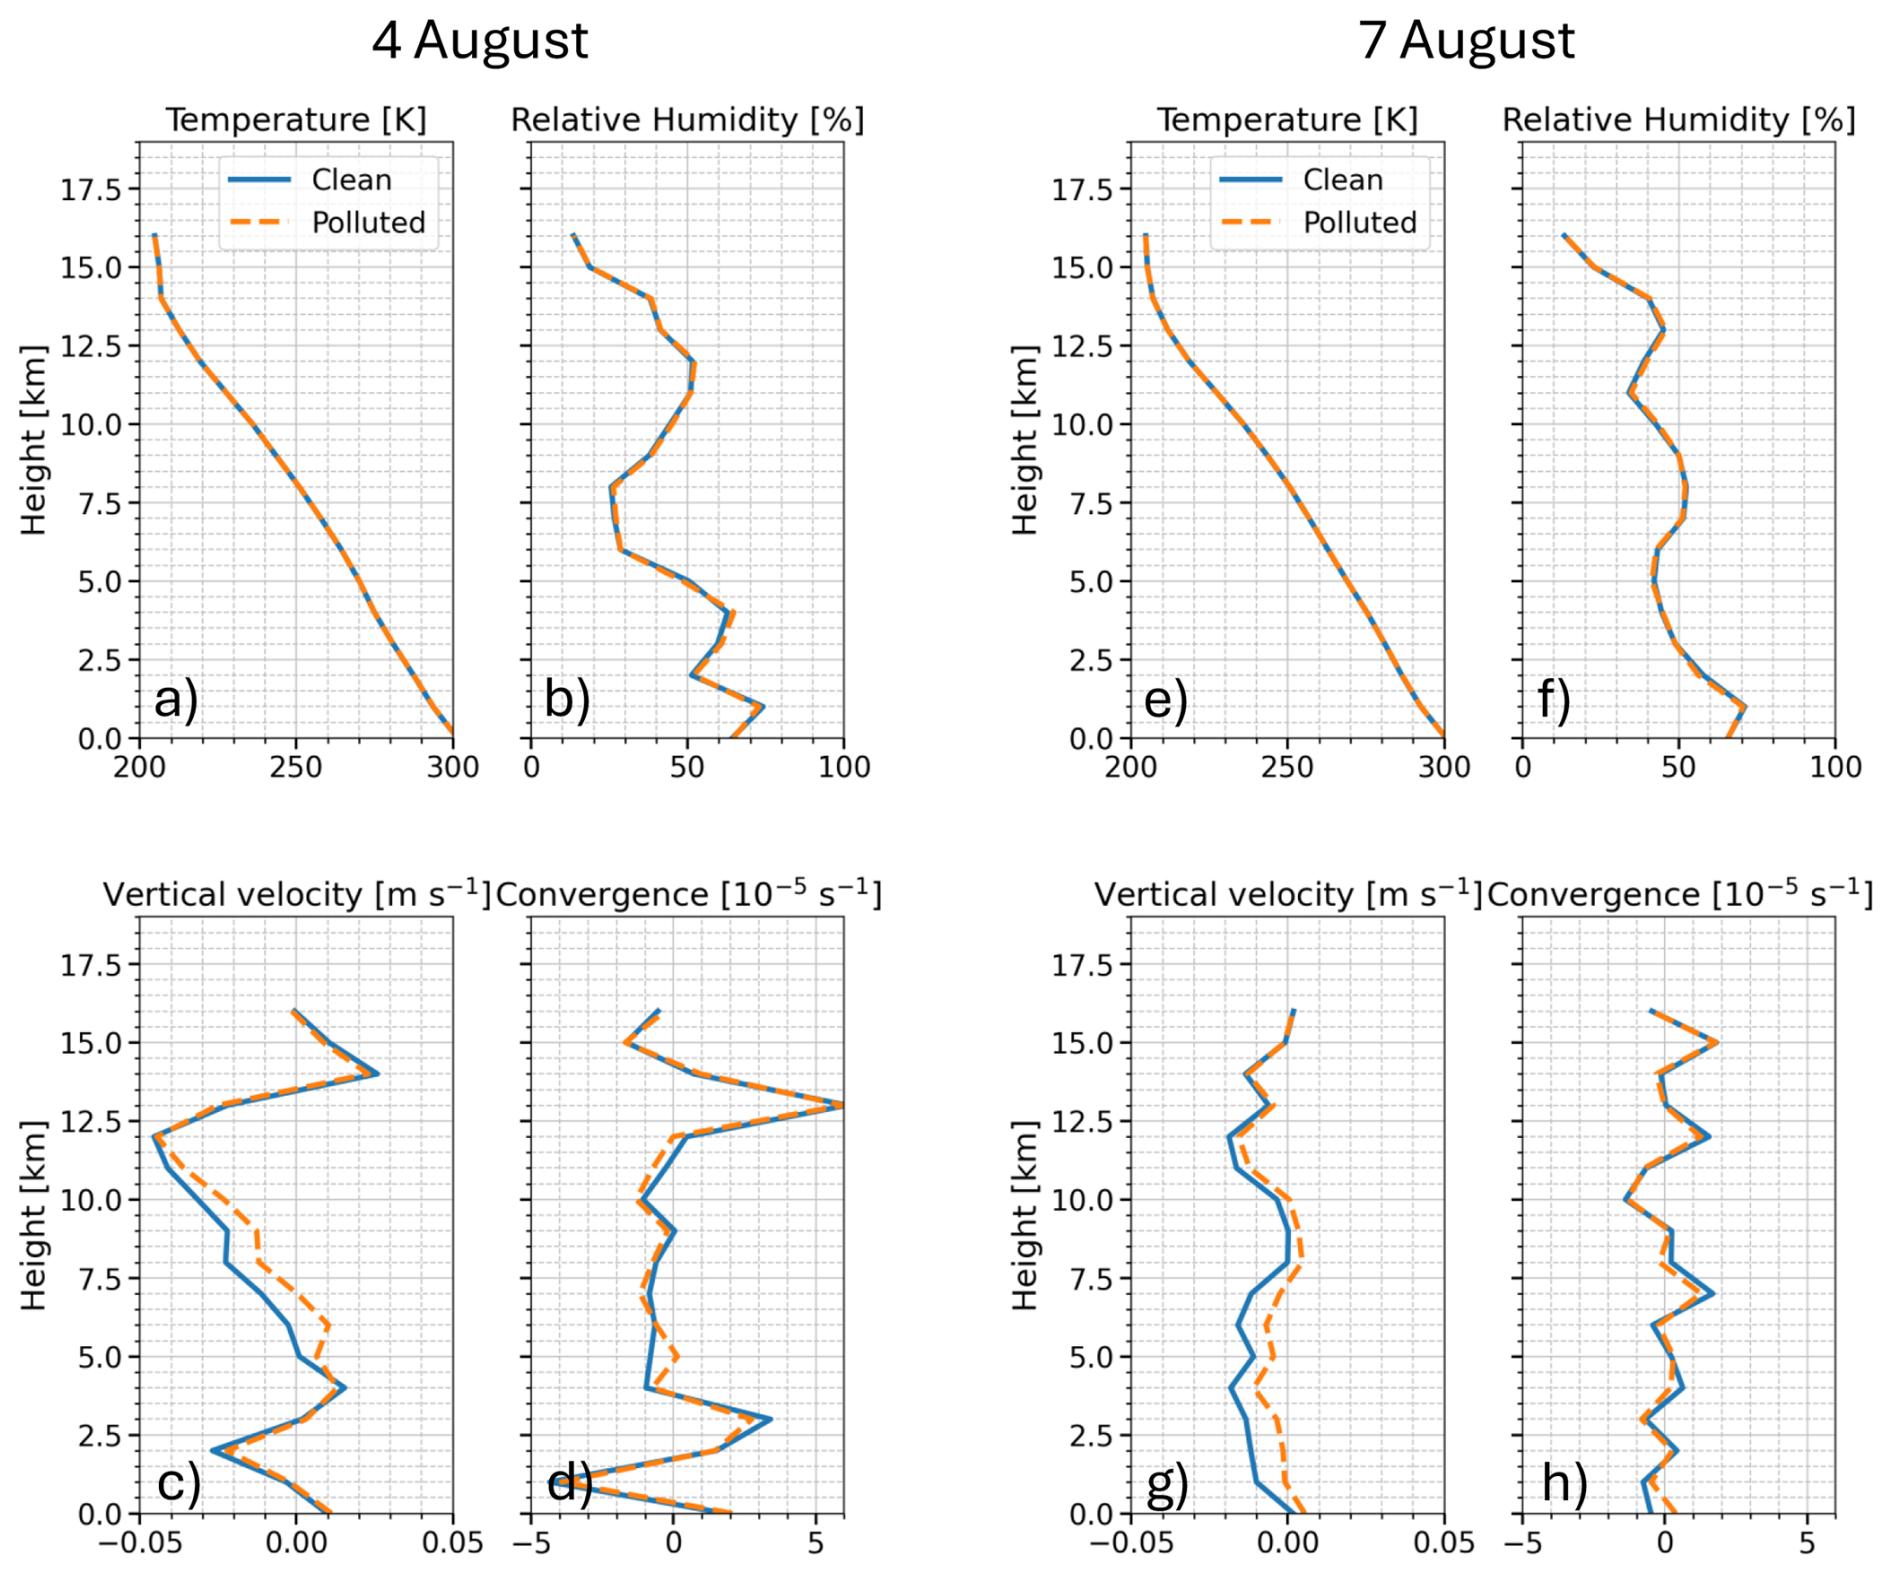
Figure 18Subdomain (as in Fig. 17) time-averaged mean profiles of air temperature, relative humidity, vertical velocity and convergence from the 4 August (a, b, c, d) and 7 August (e, f, g, h) cases. Note that the temporal integration is from 23:30:00Z (8/4) to 00:30:00Z (8/5) on 4 August and from 22:00:00Z to 24:00:00Z on 7 August.
For the 4 August case, the convergence profiles are similar between the two runs, excepting that 5 km level has larger convergence in the polluted case. Then, from the level above up to 12.5 km the polluted case shows enhanced mean vertical velocity. For the 7 August case, the polluted run exhibits substantially stronger low-level convergence below 1 km, indicating enhanced near-surface inflow within the subdomain. Consistent with this increased convergence and associated convective clustering, the mean vertical velocity in the polluted case is systematically larger from the surface up to 12.5 km. Although the causal pathway cannot be conclusively identified, these results suggest that enhanced low-level convergence may promote larger-scale ascent, thereby facilitating more vigorous convective activity within the subdomain.
In comparing the 4 and 7 August cases, the subdomain experiences markedly different magnitudes of convergence, which appear to modulate the large-scale ascent/descent rate. In particular, the enhanced low-level convergence and weaker descent rate in the 7 August polluted case likely promotes stronger near-surface updrafts and increased thermal generation. These processes can enhance condensation and, through subsequent thermal interactions, intensify cold-phase precipitation processes (Matsui et al., 2024).
In addition, we found that quite strong cold-pool interactions occurred in the 7 August polluted case. First, cold pools are defined using near-surface air properties as regions where the lowest-level air becomes appreciably cooler than its surrounding environment. At each time, a smoothly varying local background temperature is first estimated over a broad area to represent the undisturbed environment, and colder pockets are then identified by how much their temperature falls below this background. The cold-pool intensity is taken as this temperature deficit, and the cold-pool area is defined as the total area within the analysis domain where the deficit exceeds a fixed threshold (0.6 K), summed over all grid cells and converted to square kilometers. Intense precipitation is defined independently using the rainwater path, with intense RWP areas identified where the rainwater path exceeds 10 kg m−2 (Fig. 19a, b). For both quantities, the areas are calculated at every output time within the same focused geographic region. This procedure produces time series of cold-pool area and intense-rain area for the clean and polluted simulations, allowing their temporal evolution and covariability to be directly compared (Fig. 19c, d).
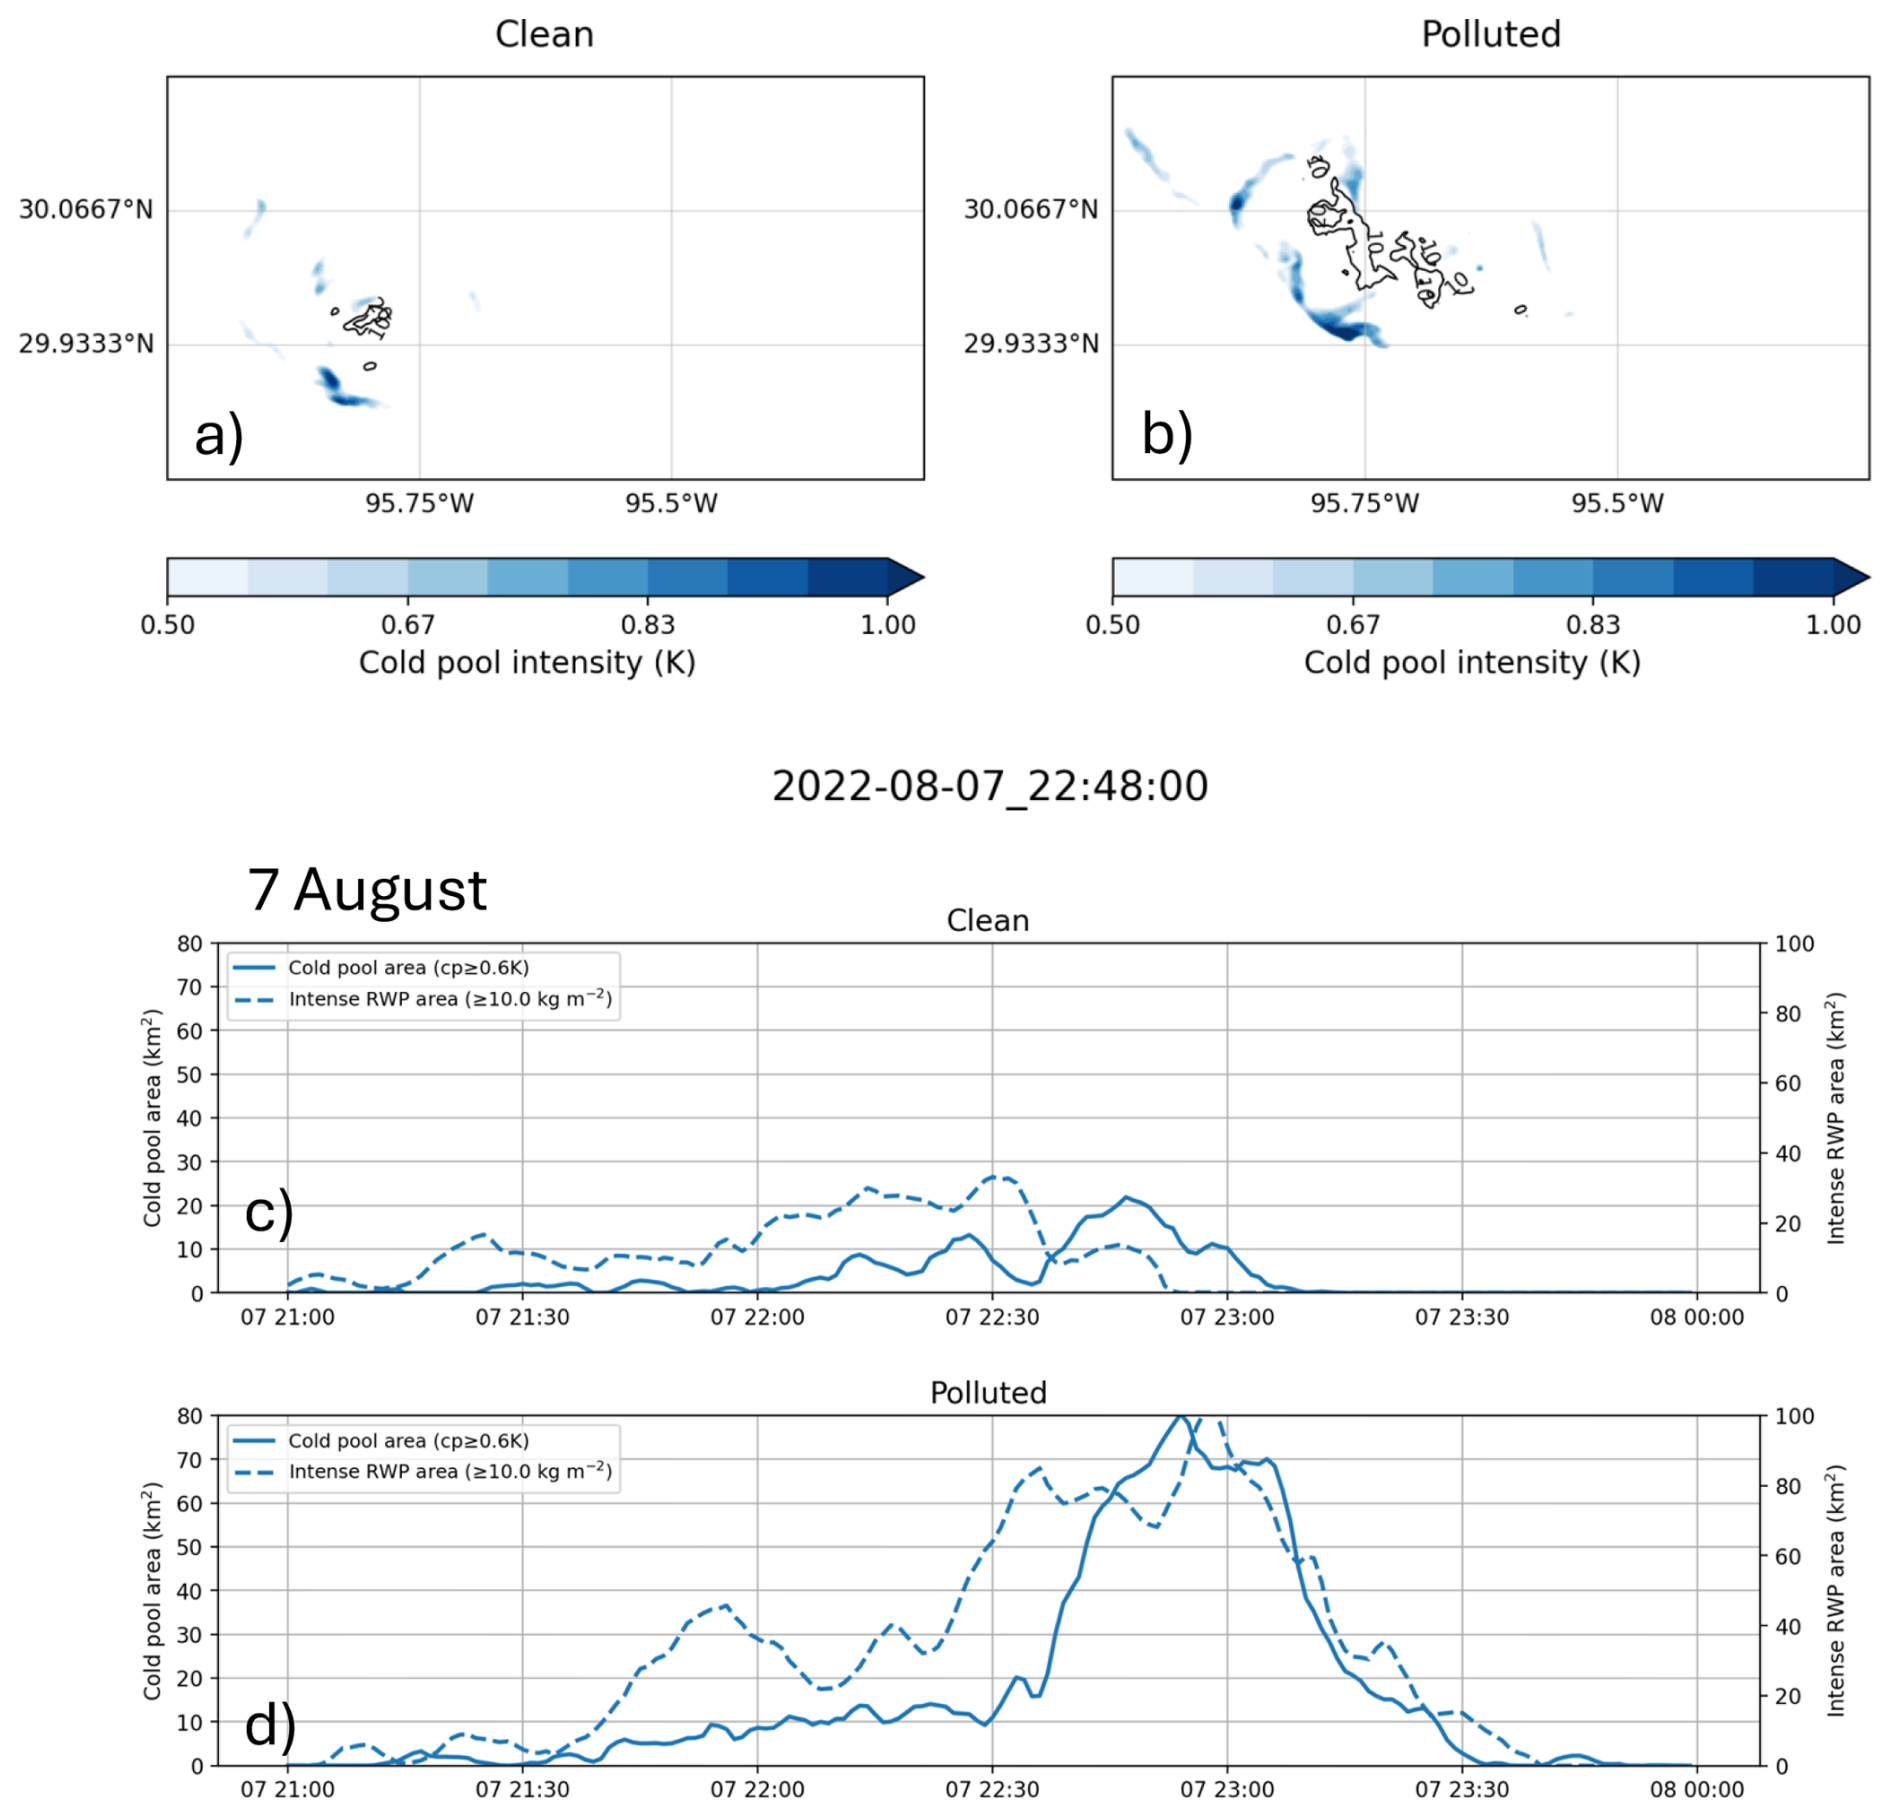
Figure 19Instantaneous spatial distribution of cold pool intensity (blue shade) and intense rain-water path (RWP > 10 kg m−2) in the subdomain of Fig. 17 from (a) the clean case and (b) the polluted case at 22:48:00Z on 7 August case. Time series of cold pool area and intense RWP area from (c) the clean case and (d) the polluted case in the same subdomain.
The polluted case clearly exhibits larger areas of both intense RWP and cold pools than the clean case, and the two quantities evolve coherently in time. This close correspondence suggests that stronger and more extensive cold pools help initiate additional convective cells, promoting the growth and clustering of convective systems as seen in the meso-LLC clustering. In contrast, although not shown here, such pronounced intense-RWP and cold-pool activity is largely absent within the focused, pollution-invigorated period and region of the 4 August case.
This study conducted NU-WRF EPIC LESs for two golden cases (4 and 7 August 2022) over the Houston area during the TRACER field campaign to investigate how aerosols impact sea-breeze-driven isolated deep convection. Each case was simulated with both low initial aerosol concentrations (“clean”) and with high initial aerosol concentrations (“polluted”) defined from the climatology of the field measurements. TOBAC was used to first identify isolated convective cells, within which then individual thermals were identified and tracked.
The polluted conditions exhibited more consolidated and less scattered convection, as well as lower numbers of isolated convective cells and thermals, albeit more thermals per cell. Based on composites of the tracked thermals by cases (“polluted” or “clean”) and by elevation, several features were identified: regarding warm rain microphysical processes, it is found that higher aerosol concentrations increase droplet number concentrations, leading to the suppression of warm rain, and more water droplets being transported aloft, consistent with previous studies (e.g., Givati and Rosenfeld, 2004, HD22). In the same way as HD22, it is found that thermals act as water droplet generators and thus play a crucial role in this mechanism. As more cloud droplets reach higher levels, more ice and snow is produced.
With more sophisticated microphysics parameterization, our results, consistent with MA24, indicated that the ice and snow crystals are most likely formed outside of thermals in the mixed-phase zone, but ice formation require water droplets that have been detrained by dissipated thermals. Thus, thermals play an indirect role in ice formation, also suggesting the cold-phase invigoration (Rosenfeld et al., 2008) is not supported from our thermal analysis. However, thermals become once more directly responsible for the formation of graupel and hail, as subsequent thermals inject supercooled water droplets to these layers where ice and snow are already present. Thus, more supercooled droplets in the polluted case add more riming and graupel production in the thermals. Therefore, more graupel and hail could be produced in the polluted cases at lower levels of the mixed-phase zone, as more ice and snow crystals are available, which depicts more detailed paths of aerosol-cloud interactions within the convective cores than previous studies (Rosenfeld et al., 2008).
The electrification properties of clouds were also investigated using the model's parameterization of cloud electrification and bulk discharge processes. Consistent with enhanced graupel and hail, which imply increased ice–crystal collisional charging, greater charge density, steeper electric potential gradients near thermals, and ultimately more flashes were produced in the polluted simulations, consistent with the findings of Hu et al. (2019).
However, apart from the responses of microphysical properties, responses in terms of other properties of thermals are rather subtle, except that they tend to initiate at higher elevations in the polluted simulations, therefore suggesting a general upward shift in the location of thermals, and thus convection. Thermal entrainment rates are also slightly smaller in the polluted simulation than in the clean ones, consistent with slightly larger thermals. Otherwise, a weak increase in size and vertical velocity is also found for the polluted cases. This slightly higher vertical velocity could imply a limited invigorating effect due to aerosol warm-phase, but does not support cold-phase invigoration theories due to the limited ice formation within thermals. These results agree with detailed process modeling (Grabowski and Morrison, 2020) as well as with idealized 1D parcel model (Igel and van den Heever, 2021).
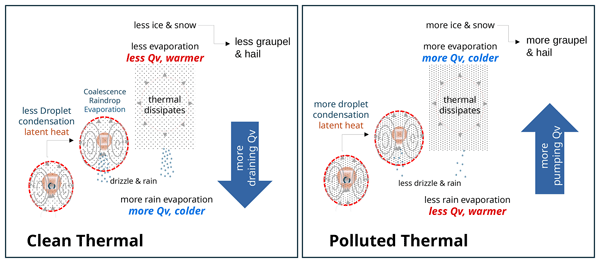
Our domain-wide analyses and additional sensitivity experiments indicate that the background aerosol concentrations gradually perturb vertical profiles of water vapor and temperature through the thermals' contributions. Figure 20 illustrates how the aerosol concentrations can affect water vapor profiles through thermal morphologies identified through the analyses. The polluted case tends to have slightly stronger convergence and updraft in the warm-phase clouds (not shown here) so that it could evaporate cloud droplets at elevated levels once they are lifted by thermals, resulting in pumping more boundary-layer water vapor to higher levels. Conversely, clean-case cumulus thermals generate more warm rain through the coalescence of cloud droplets, with sedimented raindrops evaporating at lower levels. This process brings down water vapor to lower elevation levels, thus “draining” water vapor. At this stage of warm-phase clouds, the polluted aerosol concentrations do not induce warm-phase invigoration, but provide consistent changes in water vapor vertical profiles.
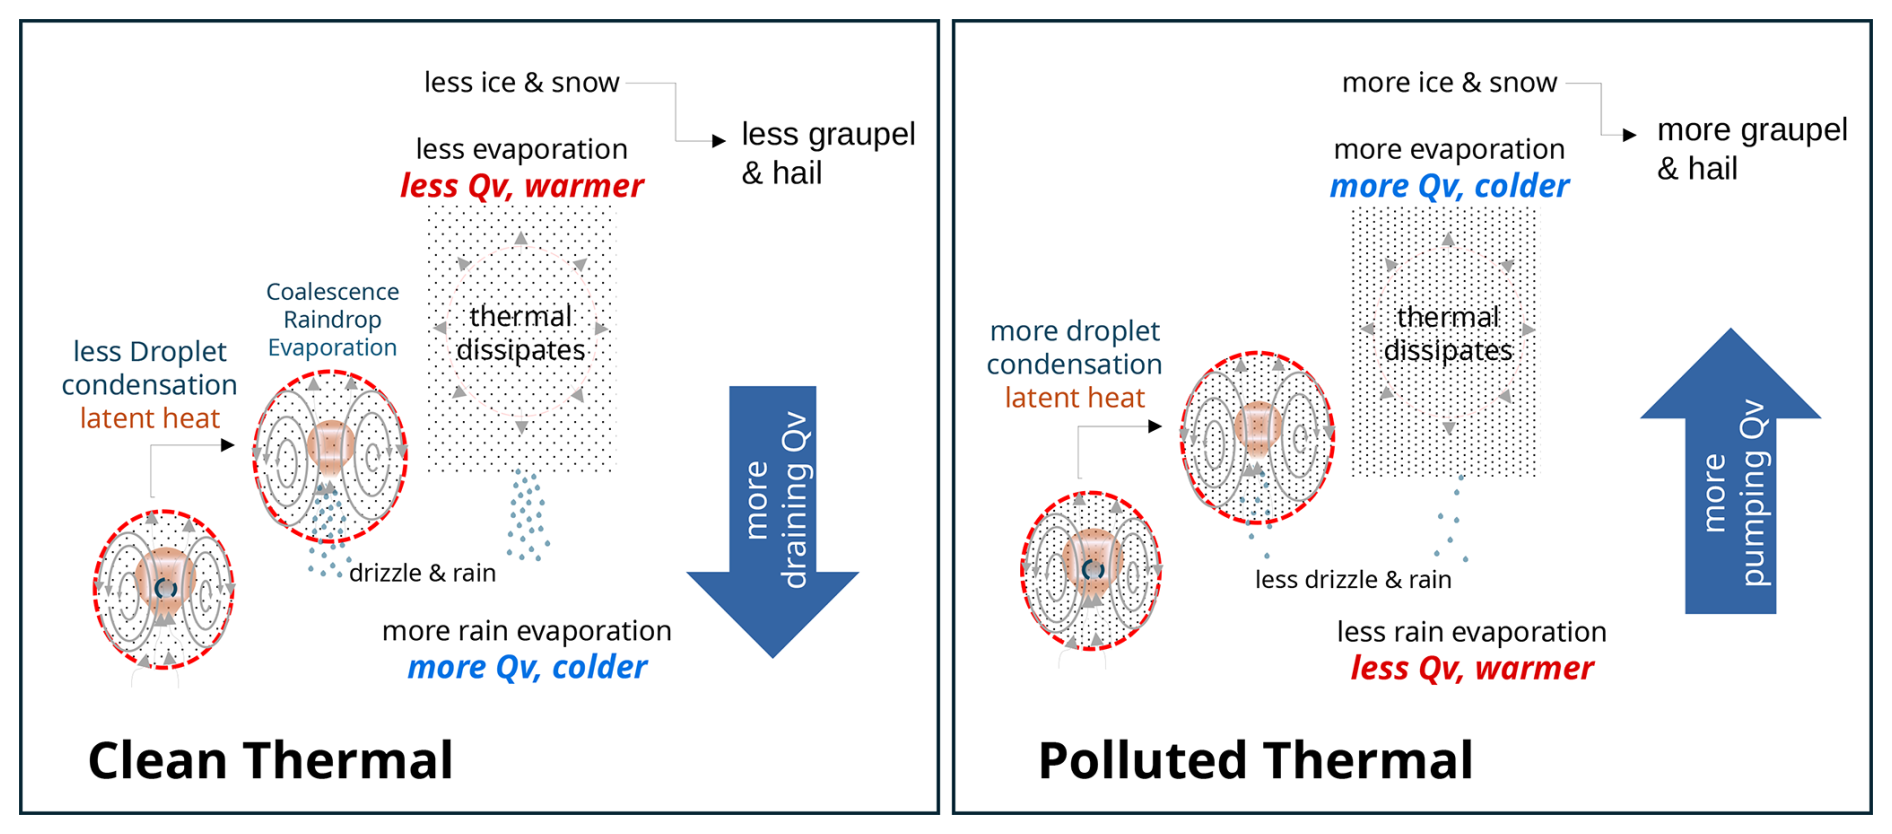
Note that our investigation does not include direct measurements of evaporation and condensation rate; however, LES studies from Xue and Feingold (2006) demonstrated that higher aerosol concentrations enhance overall cloud evaporation, and net evaporation (condensation minus evaporation) becomes larger near the cloud top, where net condensation becomes peaked near cloud base, therefore supporting our idea. This unique evaporation process also induces a temperature feedback, with more evaporation of cloud droplets aloft in the polluted cases, which induces a cooling, whereas less evaporation of raindrops at lower levels implies a warming relative to the clean cases.
Furthermore, model intercomparison projects reported by Marinescu et al. (2021) and Saleeby et al. (2025) for simulations in the same region (Houston area), found the same response regarding water vapor mixing ratio and temperature profiles. In particular, Marinescu et al. (2021) proposed that the response to higher aerosol concentrations is related to an increase in atmospheric instability that results from a warmer and drier boundary layer and a cooler and moister cloud level. This was further reinforced by results from Saleeby et al. (2025). Our results support this hypothesis, and emphasize on the fact that this has a clear impact on the mesoscale environment. The changes in temperature and water vapor profiles, together with cloud radiative forcing, likely change the mesoscale environment to enhance cold-precipitation processes toward the end of the simulation period in the polluted cases. In particular, the mesoscale convergence field in the 7 August polluted simulation became sufficiently consolidated and robust to initiate a sequence of deep convective events between 22:00:00Z and 24:00:00Z. Additional sensitivity experiments showed that re-initialized aerosol concentrations slightly modified the vertical distributions of hydrometeors and electrification within convective cores; however, the overall intensity and spatial extent of convection were governed primarily by the mesoscale environment.
This result seems to be consistent with the mechanism proposed by Abbott and Cronin (2021), whereby higher aerosol concentrations lead to clouds lofting more condensate. The additional condensate moistens the surrounding environment, reducing buoyancy dilution and ultimately enhancing larger-scale ascent and convection. In our case, however, the relevant timescale is only one day, substantially shorter than the 60 d integration reported by Abbott and Cronin (2021). Fan et al. (2025) summarize the recent studies related to aerosol impact through feedback between circulation and meteorology. They argue that a large-domain (> 500 km) simulation setup is required to capture such feedback mechanism. However, our results capture the dramatic change in mesoscale environment using relatively small regional LES domain within 24 h integration.
This complexity of aerosol-deep convective interaction likely contributes to the diversity reported by aerosol-cloud interaction model intercomparison projects (MIPs) in sea-breeze environment (Marinescu et al., 2021; Saleeby et al., 2025). While increased background aerosol concentrations can similarly enhance cloud droplet numbers and suppress warm-rain processes across different cloud-resolving models, evolution of mesoscale environments strongly varies across different models. This variability is likely attributed to differences in dynamic cores and microphysics packages, which induce unique mesoscale cloud feedback and rest of cloudiness and precipitation fields. It is important to note that we cannot fully generalize our results regarding mesoscale feedback, since these are limited to only two cases with one model setup. However, the overall agreement with other studies (e.g., Abbott and Cronin, 2021; Marinescu et al., 2021; Saleeby et al., 2025) suggest that our findings are not model artifacts.
Most recently, Wang et al. (2025) provide one of the first observational, conditional analyses of aerosol impacts on isolated deep convection using ground-based measurements from the TRACER campaign. This analysis enhances the understanding of how aerosol loading influences convective properties while acknowledging context dependence and uncertainties. It is possible to generate observation-equivalent fields from the NU-WRF EPIC framework and conduct similar sampling and systematic analysis from the simulated instrument-observables parameters to verify this process in the future.
Other noteworthy future effort includes more gradual perturbations of aerosol concentrations (e.g., DH22), rather than the extreme clean and polluted conditions examined in this study. Perturbing different aerosol size modes (coarse, accumulation, and Aitken) would also help clarify the role of fine-mode aerosols (Yin et al., 2024). To better capture gradual perturbations in the mesoscale environment, additional sensitivity experiments will be needed, including (1) modifying the latent heat of raindrop evaporation to assess temperature and pressure impact on sea-breeze circulation, and (2) adjusting cloud radiative forcing to evaluate the influence of cloud–radiation feedbacks on land–sea-breeze circulations. These topics are beyond the scope of the present study but are expected for the next pathway.
The NASA Data Portal hosts (1) codes and plots for mesoscale environment analyses (https://portal.nccs.nasa.gov/datashare/cloudlibrary/TRACER/TRACER_ACP2025.tar.gz, last access: 14 July 2026) and (2) thermal tracking and analysis codes (https://portal.nccs.nasa.gov/datashare/cloudlibrary/THERMAL/, last access: 14 July 2026). The data from the Scanning Mobility Particle Sizer (SMPS) at the Atmospheric Radiation Measurement (ARM) user facility site are available at https://doi.org/10.5439/1476898 (Singh et al., 2022).
The supplement related to this article is available online at https://doi.org/10.5194/acp-26-10071-2026-supplement.
TM and DHD prepared the manuscript with contributions from all authors. TI designed and performed the NU-WRF simulations. TS and CK prepared the aerosol concentrations and the related section. KB and EB developed and ran the TOBAC cell tracking algorithm. DH developed the thermal tracking algorithm, adapted it for tracking within the TOBAC tracked cells and prepared the thermal-analysis figures. TM performed the mesoscale response analysis and prepared the related figures. MJ conducted TRACER field campaign.
The contact author has declared that none of the authors has any competing interests.
Publisher's note: Copernicus Publications remains neutral with regard to jurisdictional claims made in the text, published maps, institutional affiliations, or any other geographical representation in this paper. The authors bear the ultimate responsibility for providing appropriate place names. Views expressed in the text are those of the authors and do not necessarily reflect the views of the publisher.
We thank the NASA Center for Climate Simulation (NCCS) (Program Manager: Dr. Tsengdar Lee) for providing the computational resources to conduct and analyze the NU-WRF EPIC simulations. In the open discussion, we referred to the aerosol vertical profiles derived from the lidar measurements managed and processed by the Texas A&M University group (Chen et al., 2025), and we thank Steve Saleeby at Colorado State University for helping to process the data. We also thank two anonymous reviewers for their helpful comments and suggestions.
This work is funded by the US Department of Energy (DOE) Atmospheric System Research (ASR) program (Program Managers: Drs. Shaima Nasiri and Jeff Stehr, grant nos. DE-SC0021247 [UMD], DE-SC0012704 [BNL]), NASA CLOUDSAT AND CALIPSO SCIENCE TEAM (CCST) program (Program Manager: Dr. David B. Considine, grant no. 80NSSC23K0124), Toshi Matsui and Scott Braun are also funded by the NASA Atmosphere Observing System mission (Program Scientist: Dr. William McCarty).
This paper was edited by Thijs Heus and reviewed by three anonymous referees.
Abbott, T. H. and Cronin, T. W.: Aerosol invigoration of atmospheric convection through increases in humidity, Science, 371, 83–85, https://doi.org/10.1126/science.abc5181, 2021. a, b, c, d
Abdul-Razzak, H. and Ghan, S. J.: A parameterization of aerosol activation: 2. Multiple aerosol types, J. Geophys. Res., 105, 6837–6844, https://doi.org/10.1029/1999JD901161, 2000. a
Ackerman, A. S., Toon, O. B., Stevens, D. E., Heymsfield, A. J., Ramanathan, V., and Welton, E. J.: Reduction of Tropical Cloudiness by Soot, Science, 288, 1042–1047, https://doi.org/10.1126/science.288.5468.1042, 2000. a
Albrecht, B. A.: Aerosols, Cloud Microphysics, and Fractional Cloudiness, Science, 245, 1227–1230, https://doi.org/10.1126/science.245.4923.1227, 1989. a
Andreae, M. O., Rosenfeld, D., Artaxo, P., Costa, A. A., Frank, G. P., Longo, K. M., and Silva-Dias, M. A. F.: Smoking Rain Clouds over the Amazon, Science, 303, 1337–1342, https://doi.org/10.1126/science.1092779, 2004. a, b
Arakawa, A. and Schubert, W. H.: Interaction of a Cumulus Cloud Ensemble with the Large-Scale Environment, Part I, J. Atmos. Sci., 31, 674–701, https://doi.org/10.1175/1520-0469(1974)031<0674:IOACCE>2.0.CO;2, 1974. a
Birch, C. E., Parker, D. J., O'Leary, A., Marsham, J. H., Taylor, C. M., Harris, P. P., and Lister, G. M. S.: Impact of soil moisture and convectively generated waves on the initiation of a West African mesoscale convective system, Q. J. Roy. Meteor. Soc., 139, 1712–1730, https://doi.org/10.1002/qj.2062, 2013. a
Blyth, A. M., Lasher-Trapp, S. G., and Cooper, W. A.: A study of thermals in cumulus clouds, Q. J. Roy. Meteor. Soc., 131, 1171–1190, https://doi.org/10.1256/qj.03.180, 2005. a, b
Bruning, E. C., Brunner, K. N., van Lier-Walqui, M., Logan, T., and Matsui, T.: Lightning and Radar Measures of Mixed-Phase Updraft Variability in Tracked Storms during the TRACER Field Campaign in Houston, Texas, Mon. Weather Rev., 152, 2753–2769, https://doi.org/10.1175/MWR-D-24-0060.1, 2024. a, b
Chen, B., Thompson, S. A., Matthews, B. H., Sharma, M., Li, R., Nowotarski, C. J., Rapp, A. D., and Brooks, S. D.: A new technique to retrieve aerosol vertical profiles using micropulse lidar and ground-based aerosol measurements, Atmos. Meas. Tech., 18, 5841–5859, https://doi.org/10.5194/amt-18-5841-2025, 2025. a
Chen, F., Kusaka, H., Bornstein, R., Ching, J., Grimmond, C. S. B., Grossman-Clarke, S., Loridan, T., Manning, K. W., Martilli, A., Miao, S., Sailor, D., Salamanca, F. P., Taha, H., Tewari, M., Wang, X., Wyszogrodzki, A. A., and Zhang, C.: The integrated WRF/urban modelling system: development, evaluation, and applications to urban environmental problems, Int. J. Climatol., 31, 273–288, https://doi.org/10.1002/joc.2158, 2011. a
Choi, Y. and Lee, Y.-H.: Urban Effect on Sea-Breeze-Initiated Rainfall: A Case Study for Seoul Metropolitan Area, Atmosphere, 12, https://doi.org/10.3390/atmos12111483, 2021. a
Chou, M.-D. and Suarez, M. J.: A Solar Radiation Parameterization for Atmospheric Studies, Tech. Rep. NASA/TM-1999-104606, Vol. 15, NASA Goddard Space Flight Center, Greenbelt, Maryland, https://ntrs.nasa.gov/api/citations/19990060930/downloads/19990060930.pdf (last access: 14 July 2026), 1999. a
Chou, M.-D., Suarez, M. J., Liang, X.-Z., and Yah, M. M.-H.: A Thermal Infrared Radiation Parameterization for Atmospheric Studies, Tech. Rep. NASA/TM-2001-104606, Vol. 19, NASA Goddard Space Flight Center, Greenbelt, Maryland, https://gmao.gsfc.nasa.gov/media/publications/zbly36ziNFDFbmYmvhQeVqPhUo/104606vol19.pdf (last access: 14 July 2026), 2001. a
Damiani, R., Vali, G., and Haimov, S.: The Structure of Thermals in Cumulus from Airborne Dual-Doppler Radar Observations, J. Atmos. Sci., 63, 1432–1450, https://doi.org/10.1175/JAS3701.1, 2006. a, b
DeMott, P. J., Prenni, A. J., Liu, X., Kreidenweis, S. M., Petters, M. D., Twohy, C. H., Richardson, M. S., Eidhammer, T., and Rogers, D. C.: Predicting global atmospheric ice nuclei distributions and their impacts on climate, P. Natl. Acad. Sci. USA, 107, 11217–11222, https://doi.org/10.1073/pnas.0910818107, 2010. a, b
Dudhia, J.: Overview of WRF Physics: Boundary Layer and Turbulence [PDF], NCAR/MMM2, National Center for Atmospheric Research, https://www2.mmm.ucar.edu/wrf/users/tutorial/presentation_pdfs/202101/dudhia_physics_pbl_turbulence.pdf (last access: 9 April 2026), 2021. a
Emanuel, K.: Atmospheric Convection, Oxford University Press, New York, ISBN 978-0-19-506630-2, 1994. a
Fan, J., Zhang, Y., Li, Z., Yan, H., Prabhakaran, T., Rosenfeld, D., and Khain, A.: Unveiling Aerosol Impacts on Deep Convective Clouds: Scientific Concept, Modeling, Observational Analysis, and Future Direction, J. Geophys. Res., 130, e2024JD041931, https://doi.org/10.1029/2024JD041931, 2025. a, b, c
Fierro, A. O., Mansell, E. R., MacGorman, D. R., and Ziegler, C. L.: The Implementation of an Explicit Charging and Discharge Lightning Scheme within the WRF-ARW Model: Benchmark Simulations of a Continental Squall Line, a Tropical Cyclone, and a Winter Storm, Mon. Weather Rev., 141, 2390–2415, https://doi.org/10.1175/MWR-D-12-00278.1, 2013. a
Fridlind, A. M., Li, X., Wu, D., van Lier-Walqui, M., Ackerman, A. S., Tao, W.-K., McFarquhar, G. M., Wu, W., Dong, X., Wang, J., Ryzhkov, A., Zhang, P., Poellot, M. R., Neumann, A., and Tomlinson, J. M.: Derivation of aerosol profiles for MC3E convection studies and use in simulations of the 20 May squall line case, Atmos. Chem. Phys., 17, 5947–5972, https://doi.org/10.5194/acp-17-5947-2017, 2017. a
Friedl, M., McIver, D., Hodges, J., Zhang, X., Muchoney, D., Strahler, A., Woodcock, C., Gopal, S., Schneider, A., Cooper, A., Baccini, A., Gao, F., and Schaaf, C.: Global land cover mapping from MODIS: algorithms and early results, Remote Sens. Environ., 83, 287–302, https://doi.org/10.1016/S0034-4257(02)00078-0, 2002. a
Givati, A. and Rosenfeld, D.: Quantifying Precipitation Suppression Due to Air Pollution, J. Appl. Meteorol., 43, 1038–1056, https://doi.org/10.1175/1520-0450(2004)043<1038:QPSDTA>2.0.CO;2, 2004. a, b
Grabowski, W. W. and Morrison, H.: Do Ultrafine Cloud Condensation Nuclei Invigorate Deep Convection?, J. Atmos. Sci., 77, 2567–2583, https://doi.org/10.1175/JAS-D-20-0012.1, 2020. a
Grant, L. D. and van den Heever, S. C.: Cold Pool and Precipitation Responses to Aerosol Loading: Modulation by Dry Layers, J. Atmos. Sci., 72, 1398–1408, https://doi.org/10.1175/JAS-D-14-0260.1, 2015. a
Gu, J.-F., Stephen Plant, R., Holloway, C. E., and Muetzelfeldt, M. R.: Pressure Drag for Shallow Cumulus Clouds: From Thermals to the Cloud Ensemble, Geophys. Res. Lett., 47, e2020GL090460, https://doi.org/10.1029/2020GL090460, 2020. a, b
Harkema, S. S., Mansell, E. R., Fierro, A. O., Carey, L. D., Schultz, C. J., Matsui, T., and Berndt, E. B.: Explicitly Resolving Lightning and Electrification Processes From the 10–12 April 2019 Thundersnow Outbreak, J. Geophys. Res., 129, e2023JD039987, https://doi.org/10.1029/2023JD039987, 2024. a
Heikenfeld, M., Marinescu, P. J., Christensen, M., Watson-Parris, D., Senf, F., van den Heever, S. C., and Stier, P.: tobac 1.2: towards a flexible framework for tracking and analysis of clouds in diverse datasets, Geosci. Model Dev., 12, 4551–4570, https://doi.org/10.5194/gmd-12-4551-2019, 2019. a
Hernandez-Deckers, D. and Sherwood, S. C.: A numerical study of cumulus thermals, J. Atmos. Sci., 73, 4117–4136, https://doi.org/10.1175/JAS-D-15-0385.1, 2016. a, b, c, d, e, f
Hernandez-Deckers, D. and Sherwood, S. C.: On the Role of Entrainment in the Fate of Cumulus Thermals, J. Atmos. Sci., 75, 3911–3924, https://doi.org/10.1175/JAS-D-18-0077.1, 2018. a, b, c
Hernandez-Deckers, D., Matsui, T., and Fridlind, A. M.: Updraft dynamics and microphysics: on the added value of the cumulus thermal reference frame in simulations of aerosol–deep convection interactions, Atmos. Chem. Phys., 22, 711–724, https://doi.org/10.5194/acp-22-711-2022, 2022. a, b
Hersbach, H., Bell, B., Berrisford, P., Hirahara, S., Horányi, A., Muñoz-Sabater, J., Nicolas, J., Peubey, C., Radu, R., Schepers, D., Simmons, A., Soci, C., Abdalla, S., Abellan, X., Balsamo, G., Bechtold, P., Biavati, G., Bidlot, J., Bonavita, M., De Chiara, G., Dahlgren, P., Dee, D., Diamantakis, M., Dragani, R., Flemming, J., Forbes, R., Fuentes, M., Geer, A., Haimberger, L., Healy, S., Hogan, R. J., Hólm, E., Janisková, M., Keeley, S., Laloyaux, P., Lopez, P., Lupu, C., Radnoti, G., de Rosnay, P., Rozum, I., Vamborg, F., Villaume, S., and Thépaut, J.-N.: The ERA5 global reanalysis, Q. J. Roy. Meteor. Soc., 146, 1999–2049, https://doi.org/10.1002/qj.3803, 2020. a
Hirt, M., Craig, G. C., Schäfer, S. A. K., Savre, J., and Heinze, R.: Cold-pool-driven convective initiation: using causal graph analysis to determine what convection-permitting models are missing, Q. J. Roy. Meteor. Soc., 146, 2205–2227, https://doi.org/10.1002/qj.3788, 2020. a
Hu, J., Rosenfeld, D., Ryzhkov, A., Zrnic, D., Williams, E., Zhang, P., Snyder, J. C., Zhang, R., and Weitz, R.: Polarimetric Radar Convective Cell Tracking Reveals Large Sensitivity of Cloud Precipitation and Electrification Properties to CCN, J. Geophys. Res., 124, 12194–12205, https://doi.org/10.1029/2019JD030857, 2019. a, b, c
Hu, Q.: A Cumulus Parameterization Based on a Cloud Model of Intermittently Rising Thermals, J. Atmos. Sci., 54, 2292–2307, https://doi.org/10.1175/1520-0469(1997)054<2292:ACPBOA>2.0.CO;2, 1997. a
Igel, A. L. and van den Heever, S. C.: Invigoration or Enervation of Convective Clouds by Aerosols?, Geophys. Res. Lett., 48, e2021GL093804, https://doi.org/10.1029/2021GL093804, 2021. a
Iguchi, T., Rutledge, S. A., Tao, W.-K., Matsui, T., Dolan, B., Lang, S. E., and Barnum, J.: Impacts of Aerosol and Environmental Conditions on Maritime and Continental Deep Convective Systems Using a Bin Microphysical Model, J. Geophys. Res., 125, e2019JD030952, https://doi.org/10.1029/2019JD030952, 2020. a, b
Jensen, M. P., Flynn, J. H., Judd, L. M., Kollias, P., Kuang, C., Mcfarquhar, G., Nadkarni, R., Powers, H., and Sullivan, J.: A Succession of Cloud, Precipitation, Aerosol, and Air Quality Field Experiments in the Coastal Urban Environment, B. Am. Meteorol. Soc., 103, 103–105, https://doi.org/10.1175/BAMS-D-21-0104.1, 2022. a
Jensen, M. P., Flynn, J. H., Gonzalez-Cruz, J. E., Judd, L. M., Kollias, P., Kuang, C., McFarquhar, G. M., Powers, H., Ramamurthy, P., Sullivan, J., Aiken, A. C., Alvarez, S. L., Argay, P., Argrow, B., Bell, T. M., Boyer, D., Brooks, S. D., Bruning, E. C., Brunner, K., Butterworth, B., Calmer, R., Cappa, C. D., Chakrabarty, R. K., Chandrasekar, V., Chao, C.-Y., Chen, B., China, S., Collins, D. R., Collis, S. M., Crowell, S., Porto, R. D., de Boer, G., Deng, M., Dexheimer, D., Drager, A. J., Du, X., Dubey, M. K., Dzambo, A. M., Etten-Bohm, M., Fan, J., Farley, R., Feng, Y.-C., Feng, Y., Fenn, M., Ferrare, R. E., Flusche, S., Fridlind, A. M., Galewsky, J., Gamarro, H., Gardner, S., Ghate, V. P., Giangrande, S. E., Griffin, R. J., Griggs, T., Gronoff, G. P., Grover, M., Gaugenti, M., Guo, F., Gupta, S., Hu, J., Huang, Y., Jackson, R. C., Hair, J. W., Johnson, K. L., Kasparoglu, S., Klein, P., Kotsakis, A. E., Kumar, J., Kumjian, M. R., Lamer, K., Lappin, F. M., Lei, Z., Li, J., Li, R., Li, Y., Logan, T., Lombardo, K., Luke, E. P., Mages, Z., Matthews, A. A., Matthews, B. H., Mayol-Bracero, O., Matsui, T., McKeown, K. E., Mehra, M., Mei, F., Meskidzhe, N., Nguyen, C., Nielsen, E. R., Nowotarski, C. J., Oaks, D., Oktem, R., Oue, M., Park, J. M., Partida, N., Patil, S., Pena, J. C., Petters, M. D., Phoenix, D. B., Puthserry, J. V., Rapp, A. D., Romps, D. M., Roots, M., Rosenfeld, D., Saleeby, S. M., Savala, P., Sedlacek, A. J., Sharma, M., Sheesley, R., Shingler, T. J., Shrestha, S., Singh, A., Smith, E. N., Smith, J. N., Smith, S., Snyder, J., Spicer, E., Spinei, E., Spychala, M., Steir, P., Storm, M. R., Subba, T., Treserras, B. P., Trojanowski, R., Theisen, A., Thompson, S. A., Twigg, L., Uin, J., Ulinski, A. R., van den Heever, S., van Lier-Walqui, M., Varble, A. C., Wagner, T. J., Wakeen, J., Wales, N. A., Walter, P. J., Wang, D., Wang, J., Wood, L., Wang, Y., Wolde, M., Yoon, S., Young, M. H., Zawadowicz, M. A., Zhang, Q., Zhou, A., Zhu, Z., and Zhu, Z.: Studying Aerosol, Clouds, and Air Quality in the Coastal Urban Environment of Southeastern Texas, B. Am. Meteorol. Soc., https://doi.org/10.1175/BAMS-D-23-0331.1, 2025. a, b
Khain, A. P., BenMoshe, N., and Pokrovsky, A.: Factors Determining the Impact of Aerosols on Surface Precipitation from Clouds: An Attempt at Classification, J. Atmos. Sci., 65, 1721–1748, https://doi.org/10.1175/2007JAS2515.1, 2008. a
Koontz, A., Uin, J., Andrews, E., Enekwizu, O., Hayes, C., and Salwen, C.: Cloud Condensation Nuclei Particle Counter (AOSCCN2COLASPECTRA), 2021-10-01 to 2022-09-02, ARM Mobile Facility (HOU), Houston, TX, AMF1 (main site for TRACER) (M1), https://doi.org/10.5439/1323896, 2021. a
Koren, I., Kaufman, Y. J., Rosenfeld, D., Remer, L. A., and Rudich, Y.: Aerosol invigoration and restructuring of Atlantic convective clouds, Geophys. Res. Lett., 32, https://doi.org/10.1029/2005GL023187, 2005. a
Kusaka, H. and Kimura, F.: Coupling a Single-Layer Urban Canopy Model with a Simple Atmospheric Model: Impact on Urban Heat Island Simulation for an Idealized Case, J. Meteorol. Soc. Jpn., 82, 67–80, https://doi.org/10.2151/jmsj.82.67, 2004. a
Kusaka, H., Kondo, H., Kikegawa, Y., and Kimura, F.: A Simple Single-Layer Urban Canopy Model For Atmospheric Models: Comparison With Multi-Layer And Slab Models, Bound.-Lay. Meteorol., 101, 329–358, https://doi.org/10.1023/A:1019207923078, 2001. a
Li, Z., Niu, F., Fan, J., Liu, Y., Rosenfeld, D., and Ding, Y.: Long-term impacts of aerosols on the vertical development of clouds and precipitation, Nat. Geosci., 4, 888–894, https://doi.org/10.1038/ngeo1313, 2011. a
Lilly, D. K.: Stratified Turbulence and the Mesoscale Variability of the Atmosphere, J. Atmos. Sci., 40, 749–761, https://doi.org/10.1175/1520-0469(1983)040<0749:STATMV>2.0.CO;2, 1983. a
Lin, J. C., Matsui, T., Pielke Sr., R. A., and Kummerow, C.: Effects of biomass-burning-derived aerosols on precipitation and clouds in the Amazon Basin: a satellite-based empirical study, J. Geophys. Res., 111, https://doi.org/10.1029/2005JD006884, 2006. a
Mages, Z., Kollias, P., Treserras, B. P., Borque, P., and Oue, M.: Shallow cloud variability in Houston, Texas, during the ESCAPE and TRACER field experiments, Atmos. Chem. Phys., 25, 6025–6045, https://doi.org/10.5194/acp-25-6025-2025, 2025. a
Mansell, E. R., MacGorman, D. R., Ziegler, C. L., and Straka, J. M.: Charge structure and lightning sensitivity in a simulated multicell thunderstorm, J. Geophys. Res., 110, https://doi.org/10.1029/2004JD005287, 2005. a
Mansell, E. R., Ziegler, C. L., and Bruning, E. C.: Simulated Electrification of a Small Thunderstorm with Two-Moment Bulk Microphysics, J. Atmos. Sci., 67, 171–194, https://doi.org/10.1175/2009JAS2965.1, 2010. a
Marinescu, P. J., van den Heever, S. C., Heikenfeld, M., Barrett, A. I., Barthlott, C., Hoose, C., Fan, J., Fridlind, A. M., Matsui, T., Miltenberger, A. K., Stier, P., Vie, B., White, B. A., and Zhang, Y.: Impacts of Varying Concentrations of Cloud Condensation Nuclei on Deep Convective Cloud Updrafts—A Multimodel Assessment, J. Atmos. Sci., 78, 1147–1172, https://doi.org/10.1175/JAS-D-20-0200.1, 2021. a, b, c, d, e
Matsui, T., Dolan, B., Iguchi, T., Rutledge, S. A., Tao, W.-K., and Lang, S.: Polarimetric Radar Characteristics of Simulated and Observed Intense Convective Cores for a Midlatitude Continental and Tropical Maritime Environment, J. Hydrometeorol., 21, 501–517, https://doi.org/10.1175/JHM-D-19-0185.1, 2020a. a
Matsui, T., Zhang, S. Q., Lang, S. E., Tao, W.-K., Ichoku, C., and Peters-Lidard, C. D.: Impact of radiation frequency, precipitation radiative forcing, and radiation column aggregation on convection-permitting West African monsoon simulations, Clim. Dynam., 55, 193–213, https://doi.org/10.1007/s00382-018-4187-2, 2020b. a
Matsui, T., Wolff, D. B., Lang, S., Mohr, K., Zhang, M., Xie, S., Tang, S., Saleeby, S. M., Posselt, D. J., Braun, S. A., Chern, J.-D., Dolan, B., Pippitt, J. L., and Loftus, A. M.: Systematic Validation of Ensemble Cloud-Process Simulations Using Polarimetric Radar Observations and Simulator Over the NASA Wallops Flight Facility, J. Geophys. Res., 128, e2022JD038134, https://doi.org/10.1029/2022JD038134, 2023. a
Matsui, T., Hernandez-Deckers, D., Giangrande, S. E., Biscaro, T. S., Fridlind, A., and Braun, S.: A thermal-driven graupel generation process to explain dry-season convective vigor over the Amazon, Atmos. Chem. Phys., 24, 10793–10814, https://doi.org/10.5194/acp-24-10793-2024, 2024. a, b
Monin, A. and Obukhov, A.: Basic laws of turbulent mixing in the ground surface layer, Tr. Geophiz. Inst. Akad. Nauk. SSSR, 151, 163–187, 1954. a
Morrison, H. and Peters, J. M.: Theoretical Expressions for the Ascent Rate of Moist Deep Convective Thermals, J. Atmos. Sci., 75, 1699–1719, https://doi.org/10.1175/jas-d-17-0295.1, 2018. a
Morrison, H., Peters, J. M., Varble, A. C., Hannah, W. M., and Giangrande, S. E.: Thermal Chains and Entrainment in Cumulus Updrafts. Part I: Theoretical Description, J. Atmos. Sci., 77, 3637–3660, https://doi.org/10.1175/JAS-D-19-0243.1, 2020a. a
Morrison, H., van Lier-Walqui, M., Fridlind, A. M., Grabowski, W. W., Harrington, J. Y., Hoose, C., Korolev, A., Kumjian, M. R., Milbrandt, J. A., Pawlowska, H., Posselt, D. J., Prat, O. P., Reimel, K. J., Shima, S.-I., van Diedenhoven, B., and Xue, L.: Confronting the Challenge of Modeling Cloud and Precipitation Microphysics, J. Adv. Model. Earth Sy., 12, e2019MS001689, https://doi.org/10.1029/2019MS001689, 2020b. a
Morrison, H., Jeevanjee, N., Lecoanet, D., and Peters, J. M.: What Controls the Entrainment Rate of Dry Buoyant Thermals with Varying Initial Aspect Ratio?, J. Atmos. Sci., 80, 2711–2728, https://doi.org/10.1175/JAS-D-23-0063.1, 2023. a
Nakanishi, M. and Niino, H.: An Improved Mellor–Yamada Level-3 Model: Its Numerical Stability and Application to a Regional Prediction of Advection Fog, Bound.-Lay. Meteorol., 119, 397–407, https://doi.org/10.1007/s10546-005-9030-8, 2006. a
Nakanishi, M. and Niino, H.: Development of an Improved Turbulence Closure Model for the Atmospheric Boundary Layer, J. Meteorol. Soc. Jpn., 87, 895–912, https://doi.org/10.2151/jmsj.87.895, 2009. a
Niu, G.-Y., Yang, Z.-L., Mitchell, K. E., Chen, F., Ek, M. B., Barlage, M., Kumar, A., Manning, K., Niyogi, D., Rosero, E., Tewari, M., and Xia, Y.: The community Noah land surface model with multiparameterization options (Noah-MP): 1. Model description and evaluation with local-scale measurements, J. Geophys. Res., 116, https://doi.org/10.1029/2010JD015139, 2011. a
Öktem, R., Romps, D. M., and Varble, A. C.: No Warm-Phase Invigoration of Convection Detected during GoAmazon, J. Atmos. Sci., 80, 2345–2364, https://doi.org/10.1175/JAS-D-22-0241.1, 2023. a
Peters, J. M., Morrison, H., Varble, A. C., Hannah, W. M., and Giangrande, S. E.: Thermal Chains and Entrainment in Cumulus Updrafts. Part II: Analysis of Idealized Simulations, J. Atmos. Sci., 77, 3661–3681, https://doi.org/10.1175/JAS-D-19-0244.1, 2020. a, b, c
Peters-Lidard, C. D., Kemp, E. M., Matsui, T., Santanello, J. A., Kumar, S. V., Jacob, J. P., Clune, T., Tao, W.-K., Chin, M., Hou, A., Case, J. L., Kim, D., Kim, K.-M., Lau, W., Liu, Y., Shi, J., Starr, D., Tan, Q., Tao, Z., Zaitchik, B. F., Zavodsky, B., Zhang, S. Q., and Zupanski, M.: Integrated modeling of aerosol, cloud, precipitation and land processes at satellite-resolved scales, Environ. Modell. Softw., 67, 149–159, https://doi.org/10.1016/j.envsoft.2015.01.007, 2015. a
Raymond, D. J. and Herman, M. J.: Convective quasi-equilibrium reconsidered, J. Adv. Model. Earth Sy., 3, https://doi.org/10.1029/2011MS000079, 2011. a
Romps, D. M. and Charn, A. B.: Sticky Thermals: Evidence for a Dominant Balance between Buoyancy and Drag in Cloud Updrafts, J. Atmos. Sci., 72, 2890–2901, https://doi.org/10.1175/JAS-D-15-0042.1, 2015. a
Romps, D. M., Öktem, R., Endo, S., and Vogelmann, A. M.: On the Life Cycle of a Shallow Cumulus Cloud: Is It a Bubble or Plume, Active or Forced?, J. Atmos. Sci., 78, 2823–2833, https://doi.org/10.1175/JAS-D-20-0361.1, 2021. a, b
Rosenfeld, D., Lohmann, U., Raga, G. B., O'Dowd, C. D., Kulmala, M., Fuzzi, S., Reissell, A., and Andreae, M. O.: Flood or Drought: How Do Aerosols Affect Precipitation?, Science, 321, 1309–1313, https://doi.org/10.1126/science.1160606, 2008. a, b, c
Saleeby, S. M., van den Heever, S. C., Marinescu, P. J., Oue, M., Barrett, A. I., Barthlott, C., Cherian, R., Fan, J., Fridlind, A. M., Heikenfeld, M., Hoose, C., Matsui, T., Miltenberger, A. K., Quaas, J., Shpund, J., Stier, P., Vie, B., White, B. A., and Zhang, Y.: Model Intercomparison of the Impacts of Varying Cloud Droplet–Nucleating Aerosols on the Life Cycle and Microphysics of Isolated Deep Convection, J. Atmos. Sci., 82, 2197–2217, https://doi.org/10.1175/JAS-D-24-0181.1, 2025. a, b, c, d
Salinas, V., Bruning, E. C., and Mansell, E. R.: Examining the Kinematic Structures within which Lightning Flashes Are Initiated Using a Cloud-Resolving Model, J. Atmos. Sci., 79, 513–530, https://doi.org/10.1175/JAS-D-21-0132.1, 2022. a
Saunders, P. M.: An observational study of Cumulus, J. Atmos. Sci., 18, 451–467, https://doi.org/10.1175/1520-0469(1961)018<0451:AOSOC>2.0.CO;2, 1961. a
Scorer, R. S. and Ludlam, F. H.: Bubble theory of penetrative convection, Q. J. Roy. Meteor. Soc., 79, 94–103, https://doi.org/10.1002/qj.49707933908, 1953. a
Seinfeld, J. and Pandis, S.: Atmospheric Chemistry and Physics: From Air Pollution to Climate Change, John Wiley & Sons, New York, ISBN 978-0-471-72017-1, 2006. a
Shepherd, J. M. and Burian, S. J.: Detection of Urban-Induced Rainfall Anomalies in a Major Coastal City, Earth Interact., 7, 1–17, https://doi.org/10.1175/1087-3562(2003)007<0001:DOUIRA>2.0.CO;2, 2003. a
Sherwood, S. C., Hernández-Deckers, D., Colin, M., and Robinson, F.: Slippery Thermals and the Cumulus Entrainment Paradox, J. Atmos. Sci., 70, 2426–2442, https://doi.org/10.1175/JAS-D-12-0220.1, 2013. a, b, c, d
Singh, A. and Kuang, C.: Scanning Mobility Particle Sizer (SMPS) Instrument Handbook, Tech. Rep. DOE/SC-ARM-TR-147, U.S. Department of Energy, Atmospheric Radiation Measurement user facility, Richland, Washington, https://doi.org/10.2172/1245993, 2024. a
Singh, A., Kuang, C., Howie, J., Salwen, C., and Hayes, C.: Scanning mobility particle sizer (AOSSMPS), 2021-10-01 to 2022-10-01, ARM Mobile Facility (HOU), Houston, TX; AMF1 (main site for TRACER) (M1), Atmospheric Radiation Measurement (ARM) user facility [data set], https://doi.org/10.5439/1476898, 2022. a
Skamarock, W. C., Klemp, J. B., Dudhia, J., Gill, D. O., Barker, D. M., Duda, M. G., Huang, X.-Y., Wang, W., and Powers, J. G.: A Description of the Advanced Research WRF Version 3, NCAR Technical Note NCAR/TN-475+STR, June 2008, Mesoscale and Microscale Meteorology Division. National Center for Atmospheric Research, Boulder, https://doi.org/10.5065/D68S4MVH, 2008. a
Sokolowsky, G. A., Freeman, S. W., Jones, W. K., Kukulies, J., Senf, F., Marinescu, P. J., Heikenfeld, M., Brunner, K. N., Bruning, E. C., Collis, S. M., Jackson, R. C., Leung, G. R., Pfeifer, N., Raut, B. A., Saleeby, S. M., Stier, P., and van den Heever, S. C.: tobac v1.5: introducing fast 3D tracking, splits and mergers, and other enhancements for identifying and analysing meteorological phenomena, Geosci. Model Dev., 17, 5309–5330, https://doi.org/10.5194/gmd-17-5309-2024, 2024. a, b
Stanford, M. W., Fridlind, A. M., Ackerman, A. S., van Diedenhoven, B., Xiao, Q., Wang, J., Matsui, T., Hernandez-Deckers, D., and Lawson, P.: Warm-phase microphysical evolution in large-eddy simulations of tropical cumulus congestus: evaluating drop size distribution evolution using polarimetry retrievals, in situ measurements, and a thermal-based framework, Atmos. Chem. Phys., 25, 11199–11231, https://doi.org/10.5194/acp-25-11199-2025, 2025. a
Stephens, G. L., Shiro, K. A., Hakuba, M. Z., Takahashi, H., Pilewskie, J. A., Andrews, T., Stubenrauch, C. J., and Wu, L.: Tropical Deep Convection, Cloud Feedbacks and Climate Sensitivity, Surv. Geophys., 45, 1903–1931, https://doi.org/10.1007/s10712-024-09831-1, 2024. a
Tao, W.-K., Li, X., Khain, A., Matsui, T., Lang, S., and Simpson, J.: Role of atmospheric aerosol concentration on deep convective precipitation: Cloud-resolving model simulations, J. Geophys. Res., 112, https://doi.org/10.1029/2007JD008728, 2007. a
Tao, W.-K., Chen, J.-P., Li, Z., Wang, C., and Zhang, C.: Impact of aerosols on convective clouds and precipitation, Rev. Geophys., 50, https://doi.org/10.1029/2011RG000369, 2012. a
Thompson, S. A., Peña, T. A., Lei, Z., Chen, B., Sharma, M., Matthews, B. H., Li, R., Nowotarski, C. J., Rapp, A. D., and Brooks, S. D.: Understanding aerosol properties in convective outflows during TRACER, Aerosol Sci. Tech., 60, 858–879, https://doi.org/10.1080/02786826.2025.2608352, 2026. a
Twomey, S.: Pollution and the planetary albedo, Atmos. Environ., 8, 1251–1256, https://doi.org/10.1016/0004-6981(74)90004-3, 1974. a
Uin, J., Aiken, A. C., Dubey, M. K., Kuang, C., Pekour, M., Salwen, C., Sedlacek, A. J., Senum, G., Smith, S., Wang, J., Watson, T. B., and Springston, S. R.: Atmospheric Radiation Measurement (ARM) Aerosol Observing Systems (AOS) for Surface-Based In Situ Atmospheric Aerosol and Trace Gas Measurements, J. Atmos. Ocean. Tech., 36, 2429–2447, https://doi.org/10.1175/JTECH-D-19-0077.1, 2019. a
Varble, A. C., Igel, A. L., Morrison, H., Grabowski, W. W., and Lebo, Z. J.: Opinion: A critical evaluation of the evidence for aerosol invigoration of deep convection, Atmos. Chem. Phys., 23, 13791–13808, https://doi.org/10.5194/acp-23-13791-2023, 2023. a, b
Vraciu, C. V., Kruse, I. L., and Haerter, J. O.: The Role of Passive Cloud Volumes in the Transition From Shallow to Deep Atmospheric Convection, Geophys. Res. Lett., 50, e2023GL105996, https://doi.org/10.1029/2023GL105996, 2023. a
Vraciu, C. V., Savre, J., and Colin, M.: The Rapid Transition From Shallow to Precipitating Convection as a Predator–Prey Process, J. Adv. Model. Earth Sy., 17, e2024MS004630, https://doi.org/10.1029/2024MS004630, 2025. a
Wang, D., Jensen, M. P., Taylor, D., Kowalski, G., Hogan, M., Wittemann, B. M., Rakotoarivony, A., Giangrande, S. E., and Park, J. M.: Linking Synoptic Patterns to Cloud Properties and Local Circulations Over Southeastern Texas, J. Geophys. Res., 127, e2021JD035920, https://doi.org/10.1029/2021JD035920, 2022. a, b
Wang, D., Melvin, E. C., Smith, N., Jensen, M. P., Gupta, S., Abdullah-Smoot, A., Pszeniczny, N., and Hahn, T.: TRACER Perspectives on Gulf-Breeze and Bay-Breeze Circulations and Coastal Convection, Mon. Weather Rev., 152, 2207–2228, https://doi.org/10.1175/MWR-D-23-0292.1, 2024. a
Wang, D., Kobrosly, R., Zhang, T., Subba, T., van den Heever, S., Gupta, S., and Jensen, M.: Aerosol impacts on isolated deep convection: findings from TRACER, Atmos. Chem. Phys., 25, 9295–9314, https://doi.org/10.5194/acp-25-9295-2025, 2025. a
Xue, H. and Feingold, G.: Large-Eddy Simulations of Trade Wind Cumuli: Investigation of Aerosol Indirect Effects, J. Atmos. Sci., 63, 1605–1622, https://doi.org/10.1175/JAS3706.1, 2006. a, b
Yang, Z.-L., Niu, G.-Y., Mitchell, K. E., Chen, F., Ek, M. B., Barlage, M., Longuevergne, L., Manning, K., Niyogi, D., Tewari, M., and Xia, Y.: The community Noah land surface model with multiparameterization options (Noah-MP): 2. Evaluation over global river basins, J. Geophys. Res., 116, https://doi.org/10.1029/2010JD015140, 2011. a
Yano, J.-I.: Basic convective element: bubble or plume? A historical review, Atmos. Chem. Phys., 14, 7019–7030, https://doi.org/10.5194/acp-14-7019-2014, 2014. a, b
Yin, J., Pan, Z., Mao, F., Rosenfeld, D., Zang, L., Chen, J., and Gong, J.: Large effects of fine and coarse aerosols on tropical deep convective systems throughout their lifecycle, NPJ Clim. Atmos. Sci., 7, https://doi.org/10.1038/s41612-024-00739-6, 2024. a, b, c