
the Creative Commons Attribution 4.0 License.
the Creative Commons Attribution 4.0 License.
 | 16 Jul 2026
Evaluation of coal mine methane inventory methods using aircraft-based approaches in the Bowen Basin, Australia
Stephen J. Harris
Sven Krautwurst
Jorg Hacker
Mark Lunt
Jakob Borchardt
Hartmut Boesch
Tarra Brain
John Philip Burrows
Shakti Chakravarty
Robert A. Field
Rebecca E. Fisher
James L. France
Konstantin Gerilowski
Wolfgang Junkermann
Bryce F. J. Kelly
Martin Kumm
Mathias Lanoisellé
Wolfgang Lieff
Andrew McGrath
Adrian Murphy
Thomas Röckmann
Zoe Salmon
Josua Schindewolf
Jakob Thoböll
Carina van der Veen
Heinrich Bovensmann
Australia uses a blend of IPCC Tier 2 and 3 bottom-up approaches to estimate and report fugitive coal mine methane (CH4) emissions. To date, Tier 3 reporting for underground coal mines, which predominantly relies on direct measurements of ventilated air, has not been systematically assessed against top-down atmospheric measurements. Tier 2 coal core-based emission factors and Tier 3 model guidelines for estimating surface (open-cut) mine emissions similarly lack verification.
Here, an in-situ and a remote sensing aircraft-based approach were used to quantify CH4 emission rates from 17 coal mines in the Bowen Basin, Australia. When compared to bottom-up mean annual reported estimates, airborne estimates from underground mines showed a non-significant mean positive bias of 0.28 t h−1 ( estimates) and good agreement (normalised root mean squared error (NRMSE) = 0.20). When aggregated, top-down measured emissions from all underground mines were within 8 % of bottom-up reported totals. In contrast, aircraft-based estimates from surface mines showed a significant mean positive bias of 3.7 t h−1 CH4 ( estimates) and poor agreement (NRMSE = 0.86). In aggregate, top-down emissions from all surface mines were 3.6 times the bottom-up totals.
Alignment between airborne top-down and measured vented underground coal mine emissions increases confidence in Australia's Tier 3 direct monitoring methods, while the difference between top-down and bottom-up surface mine emission estimates suggests core-based methods require review. Given that surface mines in the Basin alone account for ∼38 % of national production, the contribution of coal mining to Australia's CH4 emissions may exceed the reported ∼19 %.
- Article
(5650 KB) - Full-text XML
-
Supplement
(6765 KB) - BibTeX
- EndNote


Methane (CH4) is an abundant greenhouse gas with over 80 times the global warming potential of carbon dioxide (CO2) over a 20-year horizon (Arias et al., 2021). Its relatively short atmospheric lifetime means that reducing CH4 emissions rapidly lowers total radiative forcing, supporting Paris Agreement mitigation targets (UNFCCC, 2015). The coal sector is estimated to account for 38–43 Tg a−1, representing roughly one-third of global CH4 emissions from fossil fuels (Saunois et al., 2025), highlighting it as a key sector for mitigation. Although coal production is expected to decline, global CH4 emissions from coal mining are projected to rise over the 21st century (Kholod et al., 2020), underscoring the importance of both accurate measurement and targeted mitigation to track and reduce coal mine CH4 emissions.
As a signatory of the Global Methane Pledge (European Commission and United States Government, 2023), Australia has committed to reduce its CH4 emissions by at least 30 % below 2020 levels by 2030. This commitment is significant given that in 2024, Australia was the world's fifth-largest coal producer, second-largest exporter, and holds the third-largest reserves globally (Energy Institute, 2025; Geoscience Australia, 2024). The Bowen Basin in Queensland accounts for roughly 45 % of saleable coal production, making it Australia's largest producing region, particularly for metallurgical coal exports. Much of the remaining production comes from the Hunter Coalfields in New South Wales, the country's main source of thermal coal exports. Reported fugitive CH4 emissions from coal mining accounted for 24.8 Mt CO2 equivalent (CO2-e), representing approximately one-fifth of Australia's total reported CH4 emissions of 132.8 Mt CO2-e within Australia's UNFCCC/Paris Agreement inventory for 2023 (Department of Climate Change, Energy, the Environment and Water (DCCEEW), 2026).
The substantial contribution of coal sector emissions to Australia's national total has prompted growing interest in verifying the bottom-up facility-scale methods used to estimate fugitive CH4 in the national inventory. Australian coal mine operators report greenhouse gas emissions under the National Greenhouse and Energy Reporting (NGER) scheme, using different methods for estimating fugitive CH4 depending on whether mines are underground or surface (open-cut) operations (Australian Government, 2008). Data reported through the NGER Scheme contribute to Australia's national inventory, which is compiled in line with Intergovernmental Panel on Climate Change (IPCC) Guidelines to meet Australia's international reporting obligations (IPCC, 2006). Facilities with total Scope 1 emissions exceeding 100 000 t CO2-e a−1 (aggregated across CO2, CH4, and nitrous oxide (N2O)) are covered by the Safeguard Mechanism, a regulatory framework which requires emissions to remain below a declining baseline (Clean Energy Regulator (CER), 2026).
For underground coal mines, NGER methods distinguish between emissions from coal extraction and those from waste gas flaring (Clean Energy Regulator (CER), 2023). Emissions from coal extraction are estimated using Method 4, a Tier 3 IPCC approach that requires direct measurement of the gas stream either in return ventilation or surface gas drainage. These measurements can be conducted continuously (CEM) or periodically (PEM). Emissions from flared waste gas are estimated using Method 1 or 2, both constituting Tier 2 IPCC approaches. Method 1 calculates post-combustion emissions in CO2-e using an assumed gas composition and country-specific emission factor, while Method 2 calculates discrete CH4 emissions from the measured waste gas volume and an applied country-specific emission factor.
Open-cut coal mine operators report fugitive CH4 emissions using Method 1, 2, or 3. In Method 1, a state-wide emission factor is multiplied by the tonnes of run-of-mine (ROM) coal extracted to estimate annual fugitive CH4 emissions (a Tier 2 IPCC approach). Method 1's emission factor of 1.65 m3 CH4 t−1 of raw coal mined was updated in 2022 using coal core gas content records from the Queensland Petroleum Exploration Database (Australian Government, 2022). Methods 2 and 3 (both Tier 3 IPCC approaches) require a mine-specific coal core gas distribution model to estimate CH4 and CO2 released during coal extraction (Burra and Esterle, 2011; CER, 2025a), with Method 3 additionally requiring adherence to an approved gas sampling standard (CER, 2025a). During financial year 2024 (FY24; spanning from 1 July 2023 to 30 June 2024), operators of 21 out of 51 (41 %) open-cut coal mines reporting under the Safeguard Mechanism used Method 1 to estimate fugitive CH4 emissions, while the remaining operators used Method 2 (CER, 2025b). As of July 2025, all open-cut mines reporting under the Safeguard Mechanism extracting more than 10 Mt ROM coal are required to use Method 2 or 3. From July 2026, this requirement will apply to all open-cut coal mines covered by the Safeguard Mechanism, regardless of production volume.
While Australia's NGER scheme applies methodologies that are consistent with the requirements for IPCC Tier 3 reporting of coal mine CH4 emissions, this alone does not ensure regulatory adequacy, as the methods have not been systematically compared with top-down atmospheric measurements, and discrepancies with bottom-up approaches have been observed. Top-down measurements are a key component of effective measurement, reporting, and verification (MRV) frameworks, supporting bias detection and emission factor refinement (IPCC, 2006, 2022). Early evidence of discrepancies between top-down and bottom-up estimates in Australia was reported by Sadavarte et al. (2021) and Palmer et al. (2021) using coarse-resolution satellite observations and modelled emissions from Bowen Basin coal mines. Higher-resolution aircraft measurements later enabled facility-level assessments, revealing differences between annualised top-down estimates and Method 1 reporting at an open-cut coal mine in the basin (Borchardt et al., 2025). Moreover, although Method 2 is used to estimate annual emissions from surface mines and included in Australia's inventory reporting, coal core gas content-based approaches lack peer-reviewed validation beyond descriptive work (Burra and Esterle, 2011; Saghafi, 2012, 2014). The sampling and geostatistical modelling guidelines underpinning Method 2 for open-cut mines, as well as the scope of emission sources it is designed to capture, have also been questioned in the literature (Borchardt et al., 2025; Vigil et al., 2025) and in public submissions (e.g., Brain et al., 2025) to the Australian Government's ongoing review of these methods (Australian Government, 2024; Climate Change Authority (CCA), 2023). Moreover, apart from limited satellite-based evaluations of mine ventilation fans (e.g., Duren et al., 2025; Varon et al., 2018), NGER reporting from underground mines has not been systematically compared to high-resolution top-down data, and their consistency with such approaches remains uncertain.
Assessing the consistency of Australia's NGER bottom-up methods for coal mining with top-down measurements requires measurement techniques of established reliability at the facility scale. Aircraft equipped with in-situ or infrared spectroscopic sensors provide the tens-of-meters spatial coverage required for facility-scale CH4 surveys, allowing direct assessment of NGER reporting methods. These aircraft have been deployed at the facility-scale across the fossil fuel (e.g., Borchardt et al., 2025; Gordon et al., 2015; Lunt et al., 2025; Pühl et al., 2024; Sherwin et al., 2024), waste (e.g., Cusworth et al., 2020; Krautwurst et al., 2017), and agricultural sectors (e.g., Amini et al., 2022; Yu et al., 2021). The measurements made by these aircraft can quantify both point (e.g., Förster et al., 2025; Krautwurst et al., 2021; Krings et al., 2013) and diffuse CH4 sources (e.g., Gasbarra et al., 2019; Krautwurst et al., 2017), enabling verification of coal mine CH4 emissions.
In Australia, underground mines primarily emit fugitive CH4 through point sources such as ventilation fans and flares, whereas open-cut mines release methane more diffusely from exposed coal seams, the pit floor, waste piles, and water management ponds, which often lack the distinct plumes associated with localised sources. A key benefit of in-situ and certain remote sensing aircraft is their ability to quantify emissions downwind and outside surface coal mining pits (e.g., Borchardt et al., 2025). By measuring downwind, these aircraft are expected to more reliably quantify emissions that have undergone sufficient atmospheric transport beyond the mine pit. This reduces reliance on within-pit wind fields, which potentially differ from regional conditions (Kia et al., 2021) and make remote sensing approaches that depend on regional modelled winds subject to greater uncertainty. Measuring downwind also enables whole-of-facility emission estimates. In addition, aircraft offer the potential to sample downwind plumes for CH4 isotopic composition, allowing emissions to be apportioned among multiple sources located near coal mines (Kelly et al., 2022).
The detection limits and accuracy of aircraft-based systems have been evaluated in various controlled release studies (Chulakadabba et al., 2023; El Abbadi et al., 2024; Förster et al., 2025; Sherwin et al., 2021). Single-blind testing showed consistent quantification of releases above 10 kg h−1 CH4 by a combination of both in-situ and remote sensing-based aircraft (El Abbadi, 2024). Based on reported annual emissions under the Safeguard Mechanism, roughly 90 % of coal mines emit at rates exceeding this threshold (CER, 2025b), indicating that similar aircraft-based approaches should be capable of quantifying emissions from most reporting coal mines. In fully blinded trials, downward-facing aircraft-based imaging spectrometers produced parity slopes of 0.76–1.13, indicating close agreement with released quantities (El Abbadi, 2024). In the same study, a continuous in-situ aircraft yielded a lower parity slope of 0.5, which improved to 0.82 after excluding one outlier. More recently, Förster et al. (2025) validated a helicopter-borne measurement system using mass balance modelling with controlled CH4 releases of ∼21 kg h−1 and demonstrated that it could reliably quantify emissions within the method's uncertainty.
Evaluating Australia's NGER methods across coal-producing regions using aircraft-based approaches requires sampling a sufficiently large number of facilities to identify potential trends or systematic biases in reporting. At a basin-scale, population-level comparisons are more reliable than analyses of individual sites since aggregating results reduces random errors arising from quantification uncertainty and stochastic temporal variability. This approach provides a clearer picture of reporting performance and mitigates concerns that aircraft surveys capture only a limited snapshot of emissions. To date, top-down studies of Australia's coal sector have largely focused on single mines (Borchardt et al., 2025) or lacked the resolution to attribute emissions to individual facilities except for those sufficiently isolated from adjacent mines (Palmer et al., 2021; Sadavarte et al., 2021). While the Borchardt et al. (2025) results may represent an anomalous case due to the high gas content of the coal seams at that mine, they underscore the need to assess a larger number of coal mines to enable a systematic evaluation of Australia's NGER reporting methods for fugitive CH4 emissions from coal mining.
The aim of this study was to use an in-situ and a remote sensing aircraft-based approach to quantify CH4 emissions from multiple underground and surface coal mines in the Bowen Basin during September and October 2023, and to evaluate the consistency between airborne quantifications and operator estimates derived from NGER methods. Section 2 describes the study area, the location of known CH4 sources, and the instrumentation, measurements, and quantification approaches used by the aircraft. Section 3 compares the airborne quantifications against FY24 operator reporting and across the two aircraft, and evaluates the potential contribution of non-coal sources to the airborne quantifications using inventory and airborne CH4 isotope data. Section 4 discusses the results and their implications for the regulatory adequacy of NGER reporting. It also examines the factors affecting the quantification and interpretation of coal mine CH4 emissions using airborne measurements.
2.1 Study area and known CH4 sources
The Bowen Basin covers an area of over 60 000 km2 in Central Queensland (Fig. 1a). During FY24, there were 47 operational coal mine facilities in the Bowen Basin: 36 open-cut, 8 underground, and 3 integrated open-cut and underground operations (referred to herein as mine complexes). The location of all operational mines is shown in Fig. 1a, and production details for each mine during FY24 provided in the Supplement (S1). In this study, a unique identifier was assigned to each coal mine: open-cut coal mines were numbered OC-1 to OC-36, underground coal mines UG-1 to UG-8, and mine complexes MC-1 to MC-3. Run-of-mine (ROM) coal extraction totalled 256 Mt, with 215 Mt (84 %) extracted from surface mining and 41 Mt (16 %) from underground operations. 198 Mt (77 %) was extracted from open-cut, 27 Mt (10 %) from underground, and 31 Mt (12 %) was extracted from mine complexes (Queensland Government, 2025a; S1).
Aside from coal mines, other potential sources of CH4 in the Bowen Basin include oil and gas infrastructure (such as coal seam gas (CSG) and conventional gas onshore production wells, transmission and gathering pipelines, produced water treatment plants, gas processing and compressor stations, and abandoned oil and gas wells), abandoned coal exploration and groundwater boreholes, feedlot cattle, grazing cattle, farm dams, coal mine waste gas (CMWG) power stations, landfills, wastewater treatment plants (WWTP), termites, macropods, residential- and transportation-related emissions, and two ammonium nitrate plants (which represent downstream industrial CSG consumers). The methods used to derive the location of these sources are outlined further in S2. Figure 2a plots the locations of all known CH4 sources in the Bowen Basin.
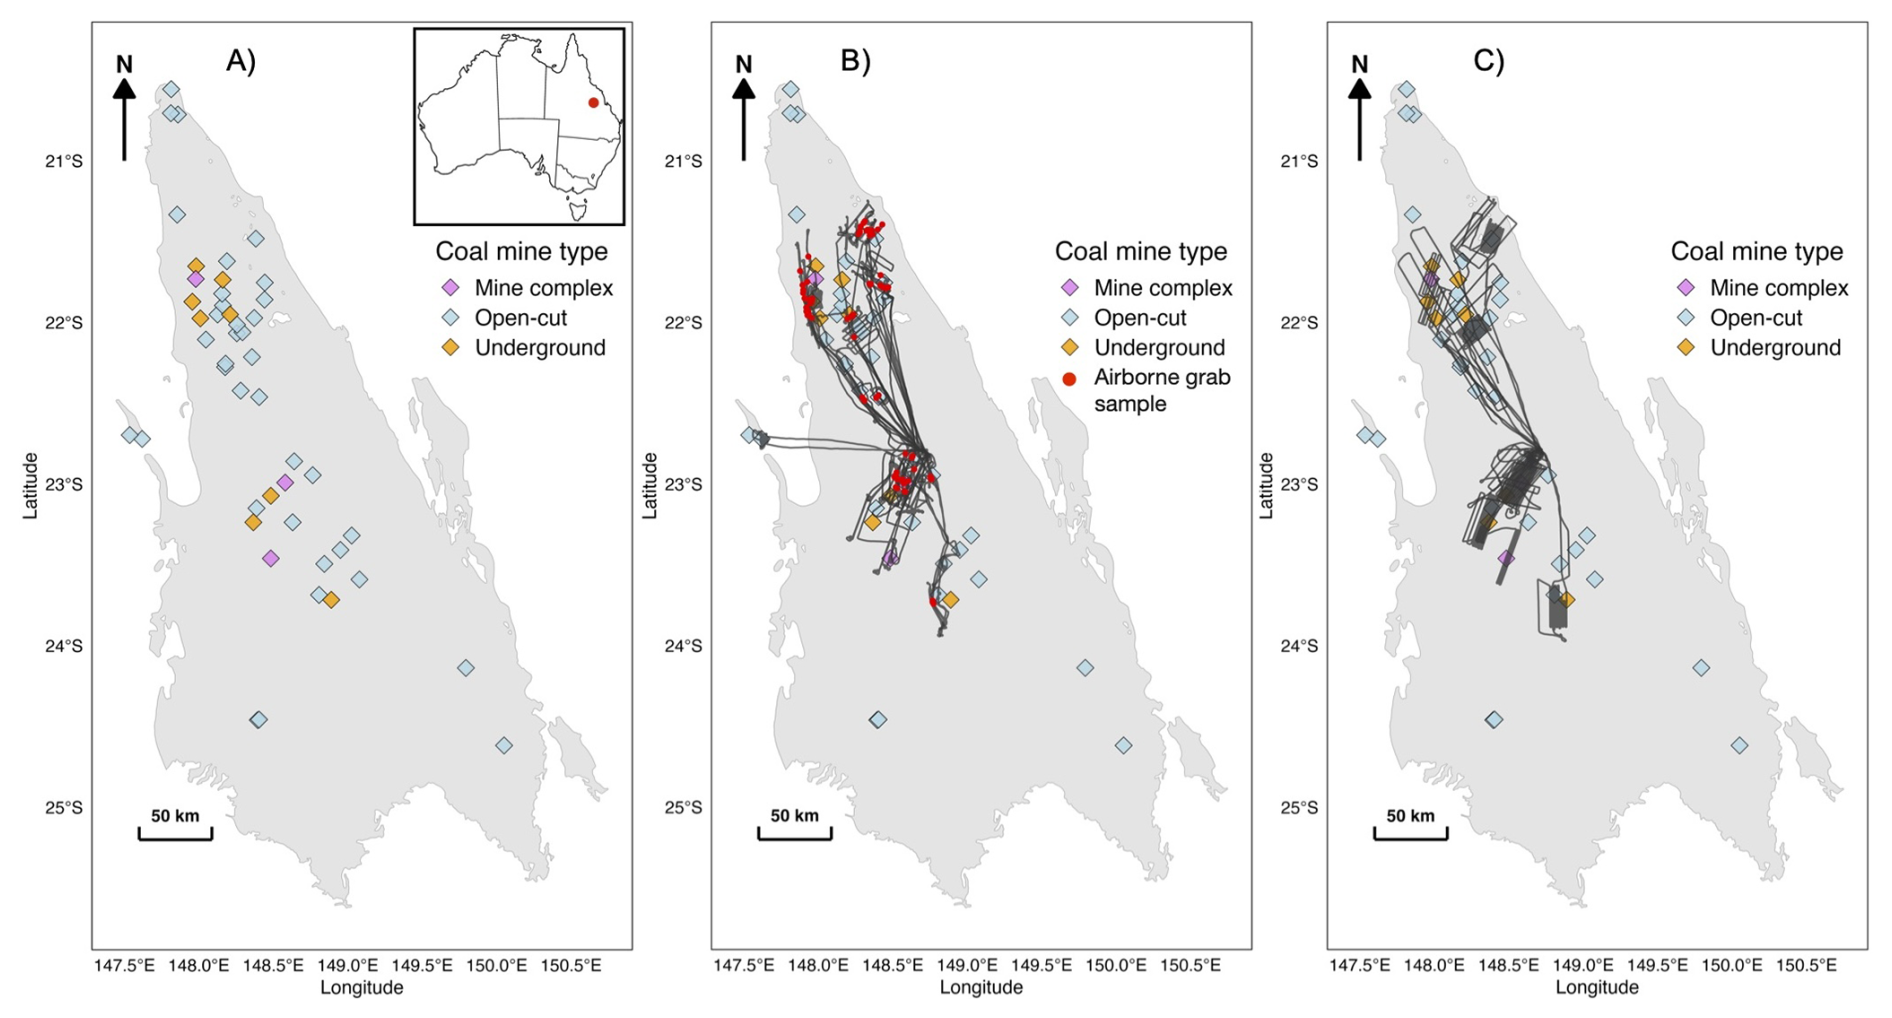
Figure 1(A) Open-cut, underground and coal mining complexes operational in the Bowen Basin, Australia, during FY24. (B) Flight paths (black lines) and the location of airborne grab samples (red dots) for all in-situ aircraft flights. (C) Flight paths for all remote sensing aircraft flights. Bowen Basin boundary data © Queensland Government (2025b).
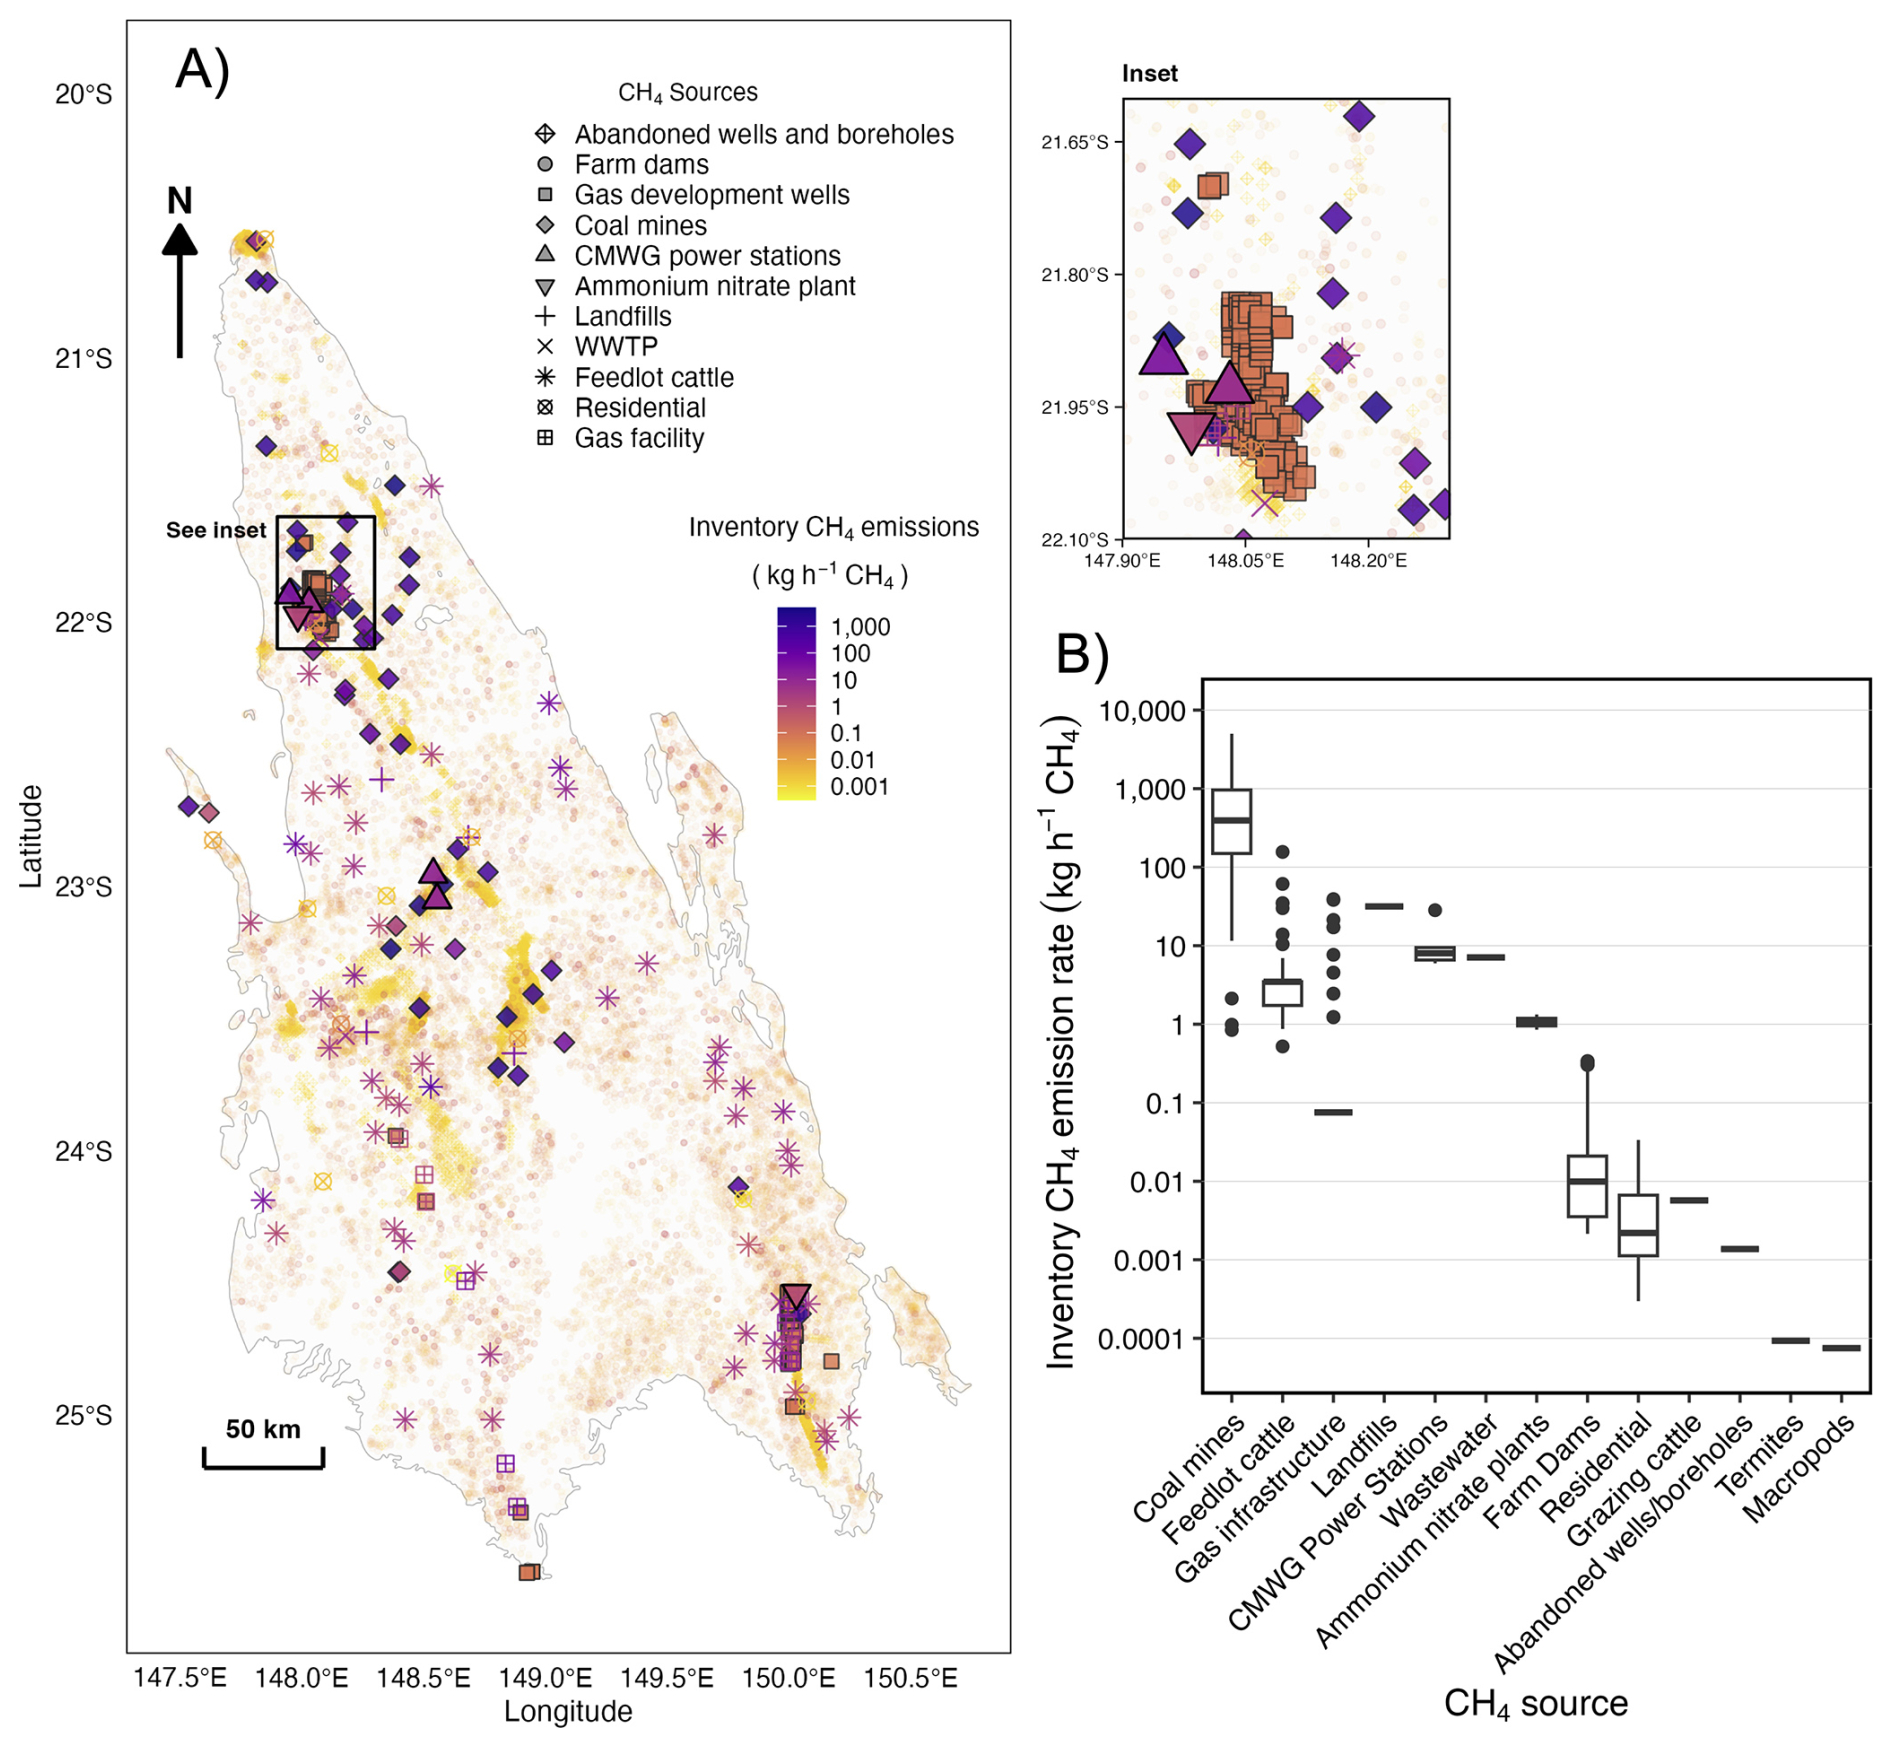
Figure 2(A) Location and CH4 emission strength of sources within the UNSW inventory across the Bowen Basin, Queensland, Australia. Sources with non-fixed or spatially diffuse locations (e.g. grazing cattle, termites, macropods, and transportation-related emissions) are included in the UNSW inventory but are not spatially represented. The inset (black box) shows a magnified view of an area of dense source overlap. (B) Distribution of CH4 emission rates (kg h−1) for discrete source categories within the UNSW inventory. Gas infrastructure includes coal seam gas and conventional gas facilities and associated infrastructure. Emission rates for grazing cattle are expressed on a per-head basis, whereas feedlot emissions are reported at the facility scale and therefore vary according to feedlot capacity. Further details on source classification and inventory construction are provided in S2.
2.2 Spatially resolved bottom-up inventory for FY24
To assist in the interpretation of data collected by the airborne surveys conducted in this study, a bottom-up inventory of CH4 emissions for the Bowen Basin during FY24 was developed. Herein this bottom-up inventory is referred to as the UNSW inventory. In Sects. 2.3.3 and 3.3, the UNSW inventory is used exclusively to assess, both qualitatively and quantitatively, the potential contribution of coal and non-coal CH4 sources to aircraft-based quantifications. Where possible, bottom-up emissions from coal mines are the reported emissions submitted under the Safeguard Mechanism reporting requirements for FY24 (CER, 2025b), and estimates from non-coal sources are derived using emission factors and methods as documented within Australia's National Inventory Report for 2023 (Australian Government, 2025a, b). Further details on the methods used to derive the location and annualised emissions from coal and non-coal CH4 sources for the UNSW inventory are outlined in S2.
Figure 2a plots annualised emission rates from stationary CH4 sources in the bottom-up UNSW inventory for FY24, expressed in kg h−1. The UNSW inventory totals 463 kt a−1 CH4 (equivalent to ∼13 Mt CO2-e a−1 using a GWP of 28), comprising approximately 385 kt a−1 (83 %) from coal mines (S2). Other sources, totalling 17 % of the inventory, comprise 59 kt a−1 from grazing cattle (13 %), 5 kt a−1 from termites (1.1 %), 4 kt a−1 from feedlot cattle (0.9 %), and gas infrastructure (0.7 %). All other CH4 sources, while visually abundant in Fig. 2a, each contribute <1 % of total CH4 emissions.
Figure 2b plots the distribution of emission rates according to each discrete CH4 source within the bottom-up UNSW inventory in kg h−1 CH4. Based on bottom-up reporting, coal mines are the largest sources of CH4 emissions in the region (median = 393 kg h−1 CH4), with emission rates that can be several orders of magnitude higher than other source types. Coal mines also show the largest variability in emission rate in absolute terms, ranging up to ∼5000 kg h−1 CH4. Solid waste, wastewater, CMWG power stations, and feedlot cattle exhibit moderate median emission rates, ranging from 8 to 32 kg h−1 CH4. While some larger cattle feedlots are estimated to emit up to ∼150 kg h−1, the median emission rate for feedlots is 3.5 kg h−1 CH4. Farm dams, while abundant, have a median emission rate of 0.01 kg h−1 CH4. Although per-head emissions from grazing cattle are small (0.006 kg h−1 CH4), their large region-wide population means they contribute significantly to the bottom-up inventory only when considered on a regional scale.
2.3 Airborne surveys
2.3.1 Aircraft and instrumentation
Two aircraft were deployed in this study: one equipped with an in-situ instrument and the other with a remote sensing instrument. Both aircraft were Diamond Aircraft HK36TTC-ECO Dimonas, owned and operated by the Independent Non-Profit Research Institute Airborne Research Australia (ARA), and piloted by ARA scientists. These aircraft are purpose-built sensor aircraft, derived from a motorized glider design capable of carrying a large instrument payload and providing flight characteristics well-suited to sensitive atmospheric measurements.
The in-situ aircraft measured meteorological parameters alongside atmospheric dry mole fractions of CH4 using an ABB Los Gatos Research Ultraportable Greenhouse Gas Analyzer (UGGA) along its flight path. This aircraft was previously used in Australian studies quantifying CH4 emissions from coal seam gas production (Neininger et al., 2021), an open-cut coal mine (Borchardt et al., 2025) and onshore LNG liquefaction facilities (Lunt et al., 2025). The second aircraft was fitted with the passive airborne remote sensing imaging instrument MAMAP2DL, which maps atmospheric CO2 and CH4 column anomalies beneath the aircraft. This approach was previously used by Borchardt et al. (2025) to estimate emissions from an open-cut coal mine in Australia.
Details on the instrumentation onboard both aircraft are provided in S3. Readers are also referred to Lunt et al. (2025) or Borchardt et al. (2025) for more detailed descriptions of the instrumentation onboard the in-situ aircraft, and Borchardt et al. (2025) for details on the remote sensing aircraft. In this study, unlike in previous campaigns where such measurements were not reported, a purpose-built device for acquiring airborne grab samples for subsequent laboratory CH4 isotope analysis was installed on the in-situ aircraft. A description of this grab sampling device is also provided in S3.
2.3.2 Sampling and quantification approaches
Details of each in-situ and remote sensing aircraft flight, including flight time, wind conditions, upwind coal mines, and isotope data collection, are provided in S4.
In-situ aircraft
Nineteen flights were undertaken by the in-situ aircraft between 5 September and 5 October 2023 (Fig. 1b; S4). A downwind single-screen sampling approach was used to determine CH4 emission rates via mass balance (Borchardt et al., 2025; Cambaliza et al., 2014; Fiehn et al., 2020; France et al., 2021; Hacker et al., 2016; Krings et al., 2018; Lunt et al., 2025). In this approach, the aircraft flew a series of vertically spaced transects ranging from ∼0.1 to 20 km downwind of coal mine facilities, forming a “curtain”. Transects were conducted at discrete altitudes along the same flightline, oriented roughly perpendicular to the mean wind direction, typically ranging from 120–250 m up to ∼2500 m above ground level (m a.g.l.) to sample plumes within the convective mixed layer. Reconnaissance legs were selectively flown to identify upwind CH4 sources but were not conducted in all cases due to flight time constraints and the absence of detectable emissions on the remote sensing aircraft from previous flights. Accordingly, the influence of upwind CH4 on the curtains was assessed independently using the methods in Sect. 2.3.3. Mass balance modelling applied to the data captured onboard the in-situ aircraft followed the approaches of Borchardt et al. (2025) and Lunt et al. (2025), as outlined in S5.
In total, 39 curtains were acquired by the in-situ aircraft. A schematic example of a curtain flown during this campaign is shown in Fig. 3. Atmospheric CH4 concentrations collected throughout each flight, along with the locations of individual curtains, are provided in S6. The number of curtains per flight ranged from 1 to 9 (mean 2, median 2). Individual curtains took between 15 min and 3 h 25 min to complete, with a mean duration of 1 h 20 min. The number of transects per curtain ranged from 2 to 12 (mean 5.4, median 4). Of the 39 curtains, 10 were excluded from subsequent analysis, leaving 29 that met suitable measurement conditions and were considered sufficiently reliable for comparison with operator-reported estimates. Reasons for exclusion included low wind speeds, variable wind directions, insufficient transect density, and incomplete background sampling, all of which increased uncertainty and potential bias in the derived emission rates (each exclusion criteria is further detailed in S5). Emission rate estimates and associated uncertainties for the 29 retained curtains are hereafter referred to as “quantifications” to distinguish them from the initial 39 curtains.
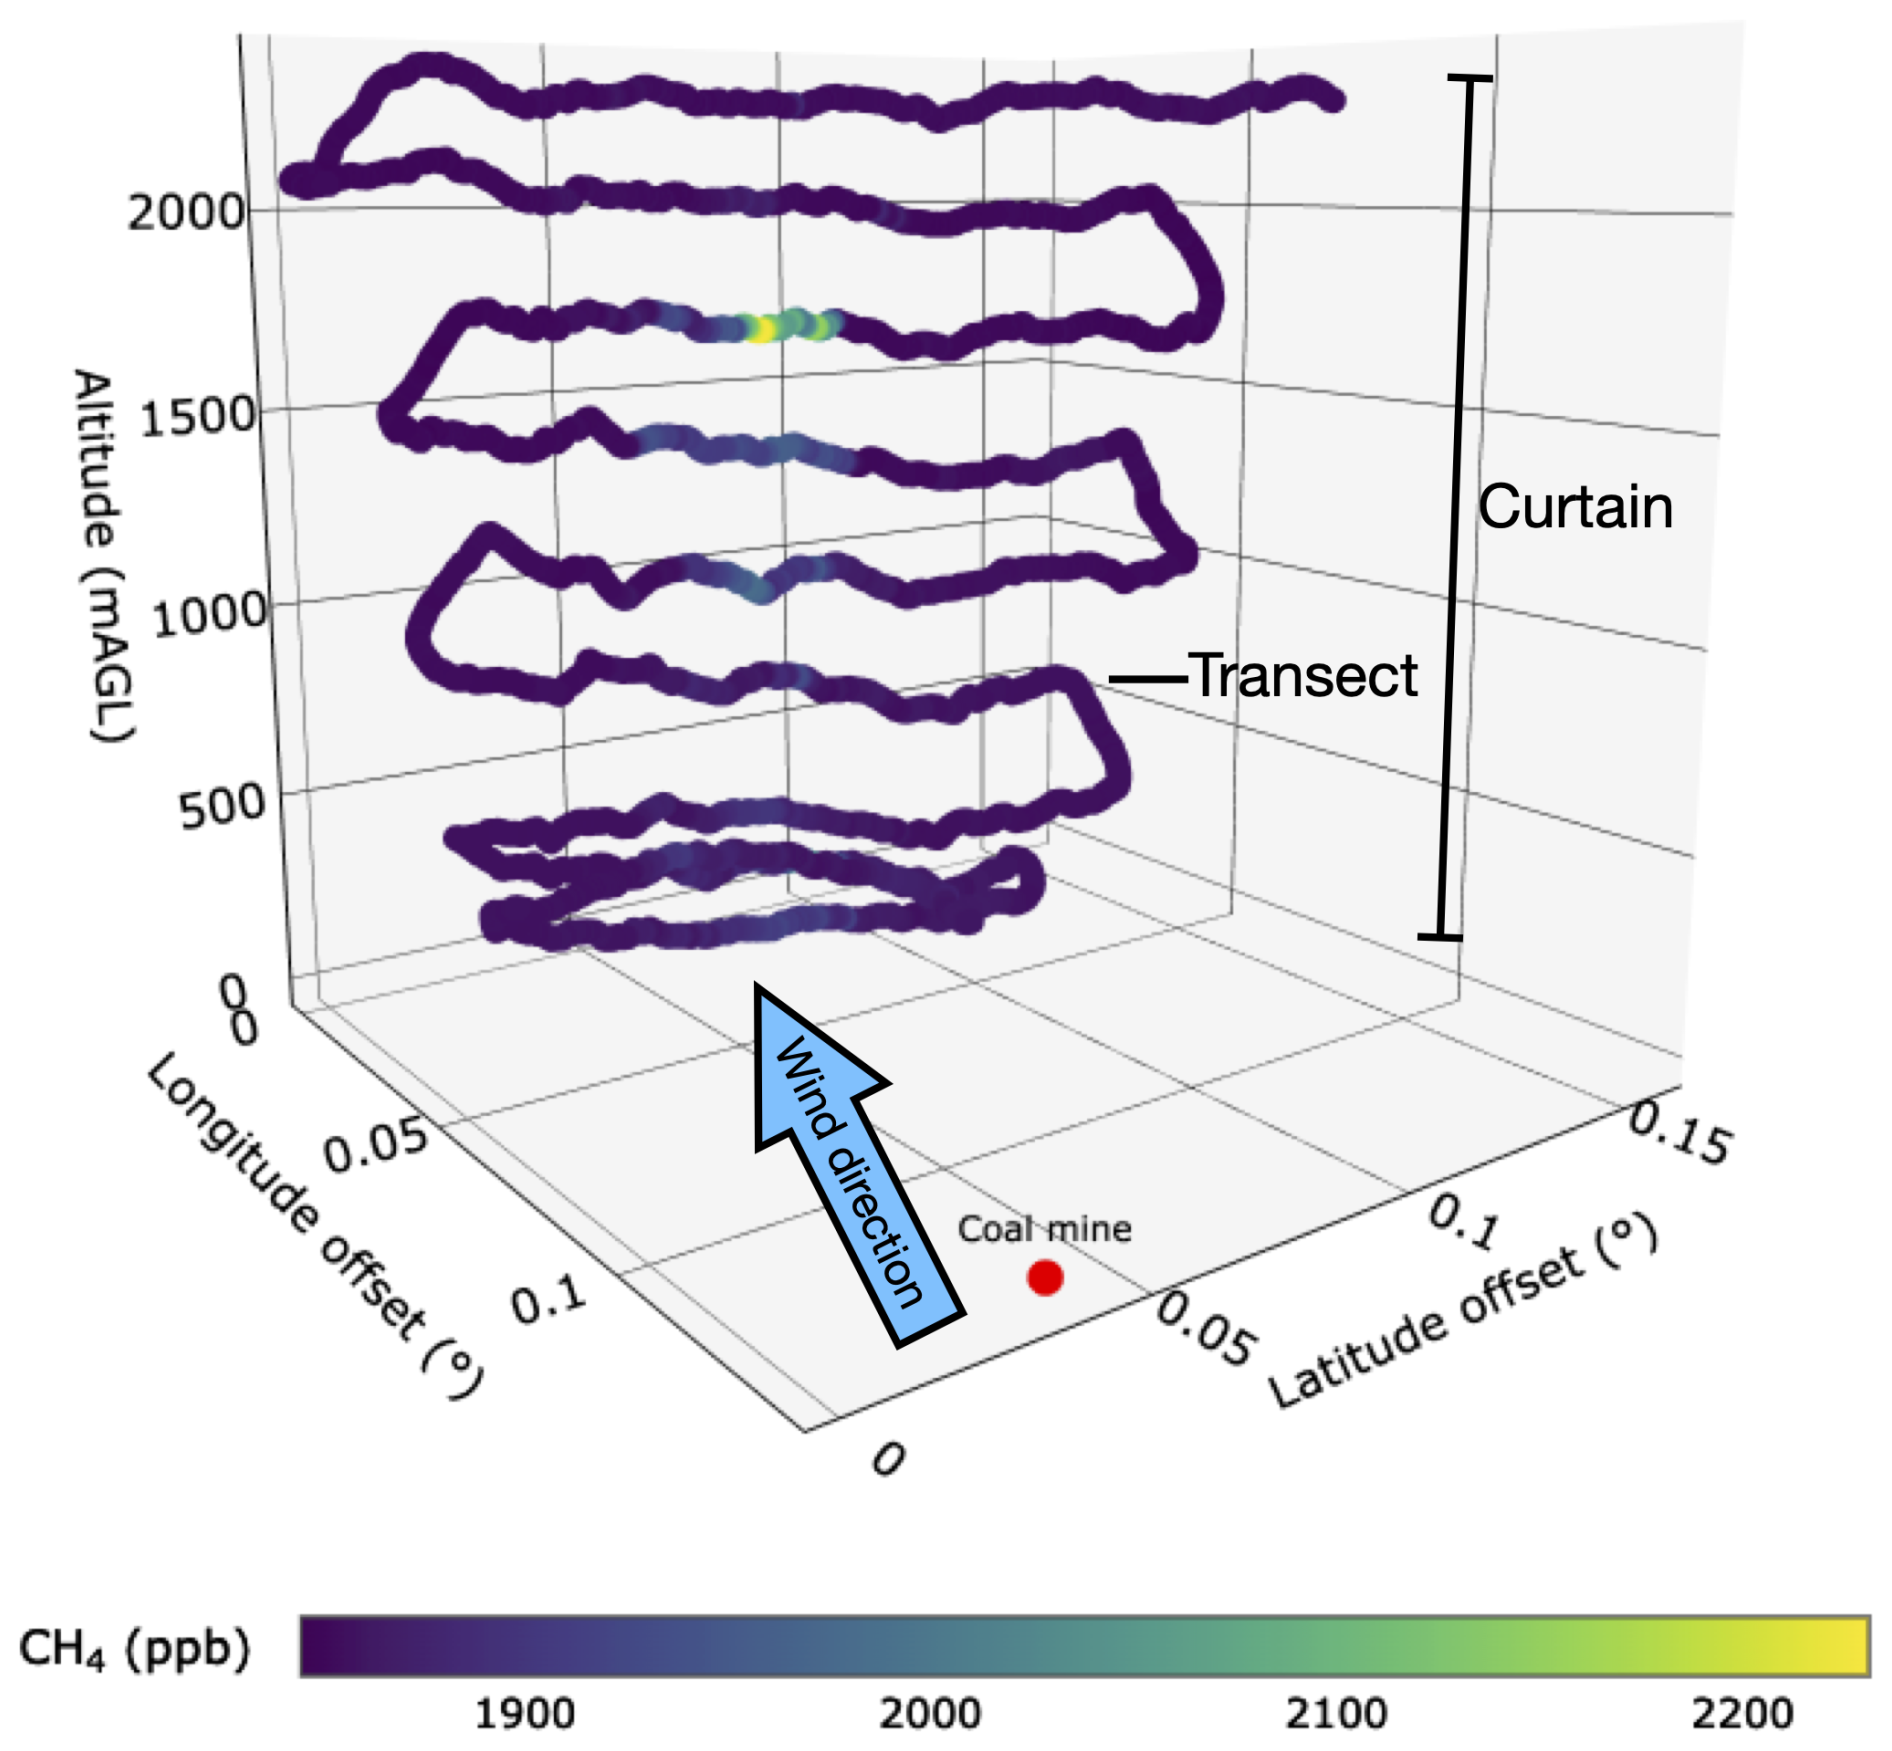
Figure 3Three-dimensional visualisation of measured downwind CH4 enhancements from a flight performed by the in-situ aircraft on 28 September 2023. The red dot marks a quantified coal mine, and the colour bar indicates measured CH4 mole fractions downwind of the coal mine.
Remote sensing aircraft
Fourteen flights were undertaken by the remote sensing aircraft between 5 September and 1 October 2023 (Fig. 1c; S4). Flights were designed following the approaches of Krautwurst et al. (2025) and Borchardt et al. (2025). The aircraft collected measurements at an altitude of approximately 3300 m a.g.l., covering a swath width of about 1.3 km. Across the swath, the 28 ground scenes had a ground scene size of roughly 45 m × 45 m. Flight legs were positioned above potential sources at varying upwind and downwind distances, and oriented perpendicular to prevailing winds, based on expected emission strengths and forecasted wind speeds. Upwind legs monitored the inflow of clean background air masses, which could include CH4 enhancements or clean air, while downwind legs were used to quantify emission rates. Legs flown directly above emitting sources within facilities ensured that observed CH4 enhancements could be attributed unambiguously to their respective source locations.
CH4 emission rates were estimated from the retrieved CH4 column anomaly maps using a cross-sectional mass balance approach, a method widely applied in remote sensing studies (Frankenberg et al., 2016; Fuentes Andrade et al., 2024; Krings et al., 2018; Reuter et al., 2019; Varon et al., 2018; Wolff et al., 2021). The specific approach applied in this study has been described in detail by Krautwurst et al. (2025) for estimating CH4 emissions from landfills in Madrid, Spain, and was also applied by Borchardt et al. (2025) to quantify emissions from an open-cut coal mine in Australia. In short, downwind of a source, multiple cross-sections were explicitly defined (i.e. geometrically constructed) through the observed plume, spaced at 10 m intervals. Within each cross-section, CH4 was sampled at 10 m resolution. The transported mass of CH4 per unit time (t h−1) was then calculated for each cross-section using the component of wind speed perpendicular to the transect. This process also included a dedicated normalisation step for each cross-section, in which the plume was separated from the surrounding background on either side. This allowed the local CH4 background to be estimated and subtracted prior to flux calculation. Further details on the computation of emission rates, associated errors, and their propagation into final estimates are provided in S5.
In total, 204 flight legs were collected during the 14 remote sensing aircraft flights (S7; see S5 for the definition of the term flight leg). Of these, 86 contained one or more plume signals (CH4 column enhancements), yielding 122 plumes identified through visual inspection of the retrieved data. An example of persistent CH4 emissions observed in multiple legs and days is shown in Fig. 4. Of the 122 plumes, 66 were excluded from subsequent analysis after data quality assessment, leaving 56 that met suitable measurement conditions and were considered sufficiently reliable for flux analysis. Exclusions fell into six categories: an absence of distinct plumes under calm winds, the mixing of plumes with other sources, suboptimal observing geometry causing truncation or tilt, cloud-induced data gaps or artifacts, insufficient enhancements for plume-background separation, and/or challenges over open-cut mines where wind-field modelling was infeasible (each exclusion criteria is further detailed in S5). For underground and mine complex facilities with more than one ventilation fan, flux estimates from individual plumes were summed to produce a single facility-level estimate (see Sect. 2.4). Seven plumes represented emissions from only part of a facility and were not considered representative of total facility emissions (see Sect. 2.4), and three plumes lacked a clearly identifiable source linked to coal mining infrastructure and possibly corresponded to emissions from abandoned coal exploration boreholes or groundwater boreholes (Hoerning and Hayes, 2025; see S9). After accounting for these cases, the 56 individual plumes became 46 plumes that combined produced 24 emission rate estimates, hereafter referred to as “quantifications”, that could be directly compared with operator-reported values. MAMAP2DL imagery of the 46 plumes used to derive the 24 quantifications are shown in S8.
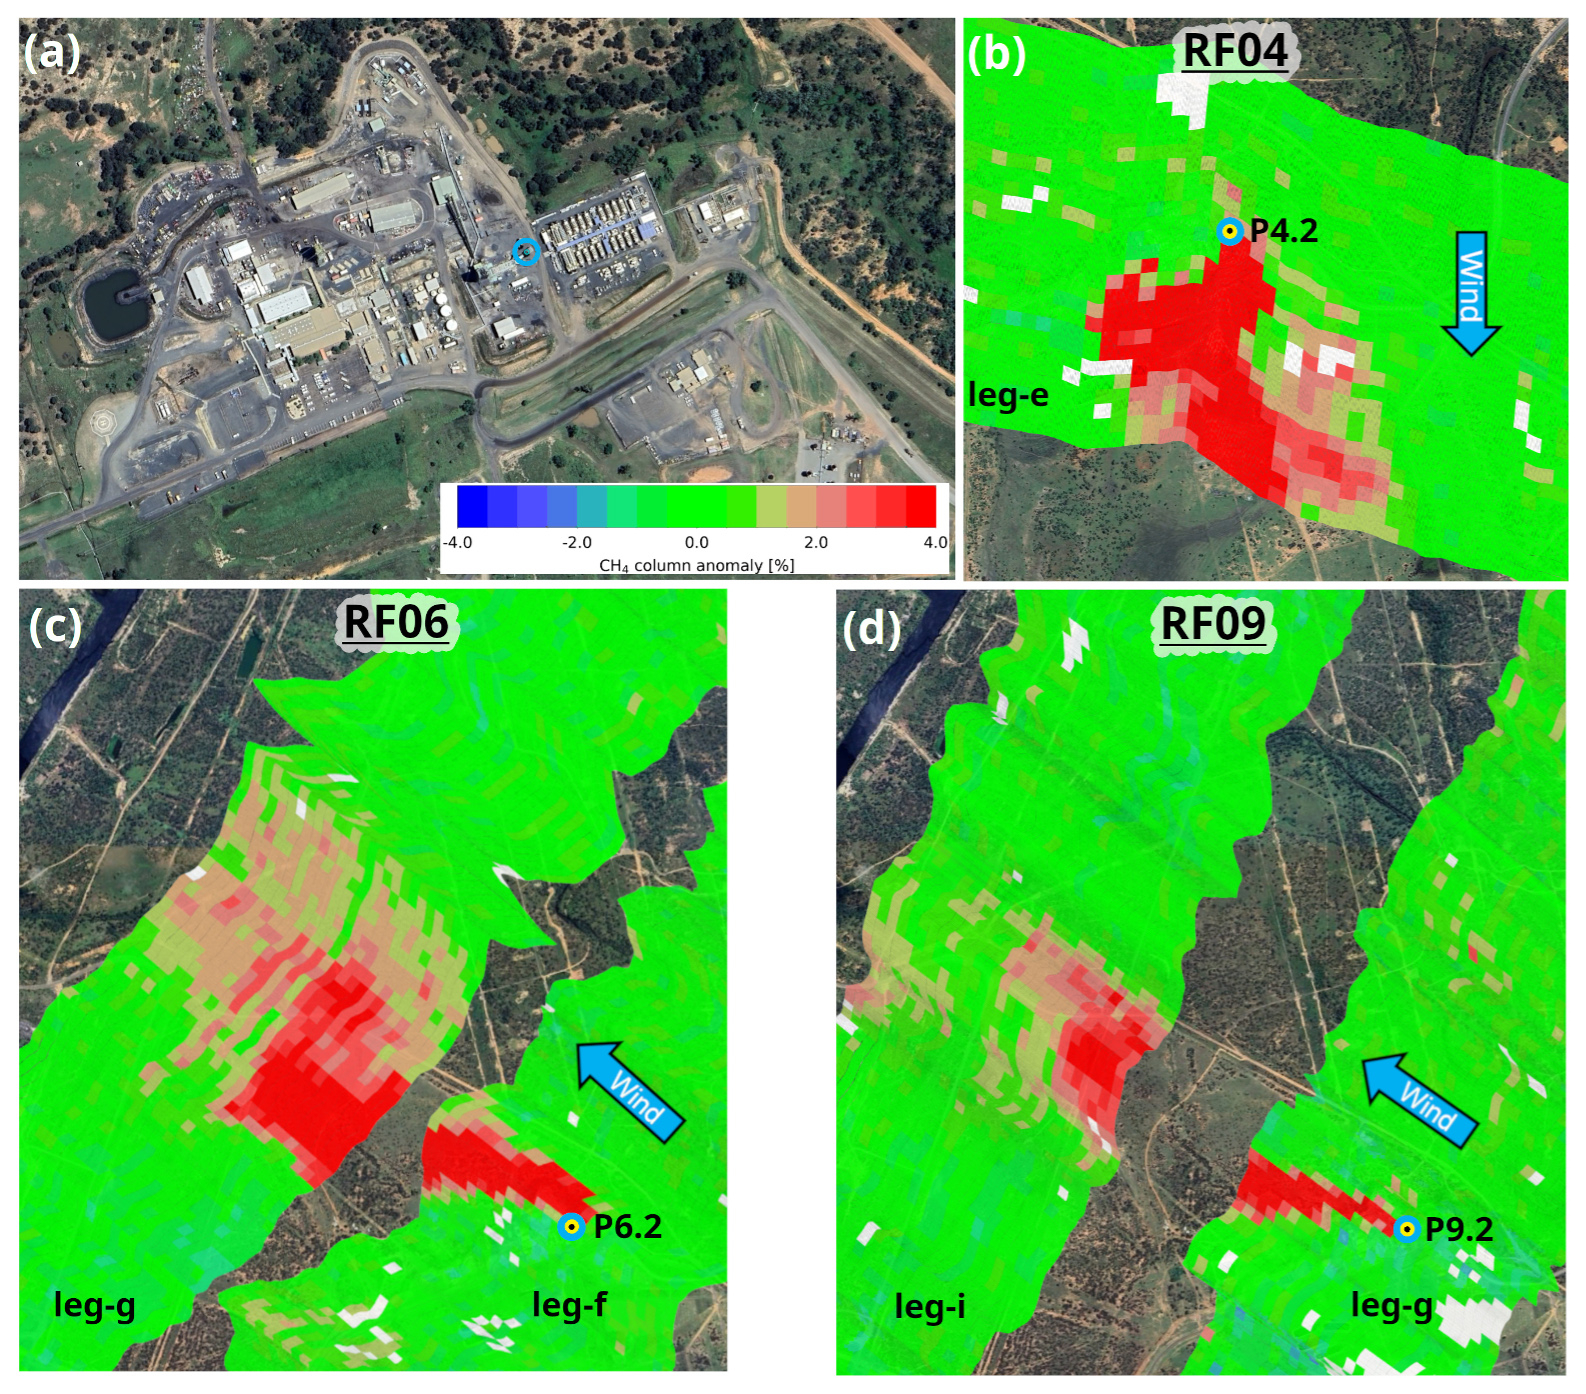
Figure 4MAMAP2DL CH4 column observations over a ventilation shaft (cyan circle). (a) Google Earth imagery showing the shaft location. (b–d) Five of eleven flight legs acquired during research flights on 5, 9, and 16 September 2023, showing downwind CH4 plume enhancements. Winds were from the north on 5 September and from the south-east on 9 and 16 September. Base map data © Google, Imagery © 2026 CNES/Airbus.
2.3.3 CH4 emission source attribution and evaluation of upwind sources
In-situ aircraft
For each curtain sampled by the in-situ aircraft, the upwind domain containing all potential CH4 sources (both coal and non-coal sources) was defined using Hybrid Single Particle Lagrangian Integrated Transport (HYSPLIT) backward trajectories (Rolph et al., 2017; Stein et al., 2015) using GFS (0.25°) meteorology at the time the curtain was flown by the aircraft. Two backward trajectories at altitudes corresponding to the midpoint of the mixing layer height were modelled from the lateral extremities of each curtain. These trajectories were used as bounds to determine which coal mines were potentially contributing to the CH4 signals in each curtain. Where there was clear separation between plumes within a curtain originating from different coal mines (i.e., background CH4 concentrations are reached for a substantial portion of the transect prior to sampling another distinct plume) a wind direction filter was applied to isolate emissions and derive a facility-scale for each mine.
Although emissions from dispersed, low-strength sources such as grazing cattle, termites and macropods would be rapidly diluted in the atmosphere and accounted for through the background subtraction method (outlined in S5), emission rate estimates for each upwind source located within 0.25° upwind of the curtains were calculated using the bottom-up methods used in the UNSW inventory outlined in S2. These upwind emission rate estimates were then summed, and the totals compared with each curtain's quantified emission rate to determine the magnitude of the upwind inventory compared to emissions derived for the curtain. In the case of grazing cattle, since the area of suitable grazing land upwind of the curtain varies on a curtain-by-curtain basis, the area (ha) of suitable grazing land within the upwind domain was estimated by generating land use reports from the AGTrends Spatial database (Queensland Government, 2025c), customised to include only the upwind domain using the “polygon” feature in the AGTrends Spatial interactive mapping tool. This upwind area was then multiplied by the approximated average cattle density in the study area (0.20 head ha−1; see S2) to approximate the number of upwind grazing cattle and their emission source strengths upwind of each curtain. This area was also used to estimate emissions from termites and macropods. While the number of dispersed CH4 sources included in these calculations carries substantial uncertainty, this approach serves as a reasonable reference against which the magnitude of emissions from the curtains can be compared.
Remote sensing aircraft
Unlike the in-situ aircraft, which sampled plumes at various distances downwind of the source(s), the remote sensing aircraft provided 2D images of detected CH4 plumes (see Fig. 4). Flight legs directly over a source, referred to as overhead legs, were used to unambiguously identify and locate the position of the source. These flight legs captured measurements of the plume upwind, directly over, and downwind of the source. In the resulting concentration maps, the start of a plume appears as a CH4 column enhancement in red, with CH4 transported and dispersed downwind from that point on. On the opposite side (upwind of the source), no CH4 enhancements are visible, and column concentration anomalies typically fluctuate around 0 % due to measurement noise, indicating clean air masses and the absence of enhanced CH4 inflow. Thus, the plume origin clearly identifies the source and the facility or facilities responsible. For each identified plume signal in a leg, the plume and corresponding background areas on either side are determined by visual inspection. To isolate the plume from background CH4, a straight line is fitted to measurements of the two background areas across a cross-section; this line represents background CH4 levels and is removed from the measurement, leaving only the plume signal. This processed signal is then used to estimate the emission rate of the source.
2.3.4 Airborne grab sample laboratory CH4 isotope analysis
Airborne grab samples for CH4 isotope analysis were acquired during 13 of the 19 flights undertaken by the in-situ aircraft (S4) and were used to assist in attributing sources between fossil and non-fossil CH4. Samples were taken over the course of sampling one or multiple curtains at different altitudes in the convective mixed layer. Analysis was undertaken at Royal Holloway University of London (RHUL) using a Picarro G2210-i cavity ringdown spectrometer (CRDS) (Picarro, Inc., USA) for CH4 mole fraction and a modified gas chromatography isotope ratio mass spectrometry (GC-IRMS) system (Trace Gas and Isoprime mass spectrometer, Elementar UK Ltd., UK) (Fisher et al., 2006) for the measurement of δ13C-CH4. Each bag was analysed for at least 5 min using the Picarro G2210-i (flow rate 40 mL min−1) and the mean CH4 mole fraction of the last three minutes of measurement calculated. CH4 mole fractions were calibrated to the WMO X2004A CH4 scale using air cylinders provided by Max Planck Institute-Jena. The accuracy of the reported measurements is <1 ppb. Each GC-IRMS δ13C-CH4 measurement used 75 mL air, and each bag was analysed at least three times. δ13C-CH4 measurements have a repeatability of 0.05 ‰ and are reported on the V-PDB scale. Further information about calibration and intercomparison of isotopic measurements with other laboratories is reported in Umezawa et al. (2018).
Analysis for δ2H-CH4 was undertaken at Utrecht University on a GC-IRMS system described in (Menoud et al., 2022; Röckmann et al., 2016), consisting of a custom-built CH4 extraction system and a Thermo Fisher Delta plus XP IRMS. The isotope scale at Utrecht University was established as described in Brass and Röckmann (2010) and is linked to the international reference materials via intercalibration with the Max-Planck-Institute for Biogeochemistry, Jena, Germany (Sperlich et al., 2016). The Utrecht CH4 isotope system has participated in various international intercomparison programs (Dasgupta et al., 2025; Umezawa et al., 2018).
2.4 Comparison of top-down and bottom-up estimates from coal mines
The in-situ and remote sensing aircraft quantifications were compared with mean annual emission rates (t h−1 CH4) derived from operator-reported annual emission totals (reported in t a−1 CO2-e, using a GWP100 value of 28) submitted under Australia's Safeguard Mechanism for FY24 (CER, 2025b). To enable a direct comparison, it was necessary to define what the airborne estimates quantify. Accordingly, the following terms were defined to describe the scope of each airborne quantification:
-
Facility quantification: quantified all CH4 emissions from a single coal mine facility with no emission contribution from any other mine. For the remote sensing aircraft, a facility quantification on occasions comprised multiple sub-facility quantifications (defined below), such as from ventilation shafts and flaring infrastructure within an underground or mine complex, that were summed to represent total emissions from an individual facility. Facility quantifications were directly compared with operator-reported estimates reported under the Safeguard Mechanism.
-
Multi-facility quantification: quantified combined CH4 emissions from two or more coal mines where plumes from multiple mines had mixed or could not be reasonably separated based on wind direction. In this case, the quantification was compared against the sum of operator-reported figures for the relevant facilities reported under the Safeguard Mechanism.
-
Sub-facility quantification: quantified emissions from an individual piece of mine infrastructure that did not, by itself, represent total facility emissions. Where possible, sub-facility quantifications were summed to produce a facility estimate if they accounted for all emission sources from the mine. If a sub-facility quantification could not be combined to represent total facility emissions, it was not compared with operator-reported estimates.
When comparing top-down and bottom-up estimates, the analysis also evaluated the different NGER methods used in operator reporting. Of the 28 open-cut coal mines located in the Bowen Basin, 16 operators reported CH4 emissions using Method 1, with the remaining 12 using Method 2 (S1; CER, 2025b). Operators from two of the mine complexes disclosed the use of Method 1 to estimate emissions from their open-cut operations (MC-1 and MC-2). In this case, it was possible to separate the estimated CH4 emissions from the open-cut (assigned as MC-1-OC and MC-2-OC) and underground (assigned as MC-1-UG and MC-2-UG) operations, since the relative amount of coal extracted from the surface and underground operations was disclosed. This was not possible for the third mine complex (MC-3), which disclosed the use of a Method 2 for their open-cut operations, meaning the emissions from the open-cut (assigned as MC-3-OC) and underground (assigned as MC-3-UG) operations could not be disaggregated.
All underground coal mine operators applied Method 4 to estimate ventilated fugitive emissions from coal extraction, and either Method 1 or Method 2 to estimate emissions from flared coal mine waste gas (S1; CER, 2025b). However, the use of CEM or PEM to derive Method 4 estimates is not publicly disclosed under the Safeguard Mechanism. In addition, CH4 emissions are aggregated at the facility level, with no publicly available breakdown by method, meaning comparisons were made against total reported facility emissions (i.e., the combined contribution of Method 1/2 and Method 4). As a result, individual NGER methods (and their methods of operation) for underground coal mining could not be separately assessed in this study and were instead evaluated on an aggregated basis.
3.1 Comparison of airborne estimates with bottom-up NGER estimates
Fifty-three individual quantifications of 17 coal mines were acquired across both aircraft. These quantifications were grouped by mine or mine grouping and averaged to produce 24 independent mean emission rate estimates across 10 open-cut, 8 underground, 2 mine complex, and 4 multi-facility groupings covering multiple mine types. Some mines contribute more than one estimate where both aircraft were deployed. Table 1 presents these 24 estimates for each quantified mine or mine grouping, alongside the corresponding mean annual operator-reported CH4 emission rate in t h−1 CH4 and the applied NGER method(s). All individual quantifications are listed in S10.
Table 1Mean CH4 emission rates from facility- and multi-facility airborne estimates, compared with mean annual operator-reported emission rates derived using NGER methods. Estimates from Borchardt et al. (2025) are also included. Values are reported to two significant figures; rounding may introduce minor discrepancies.
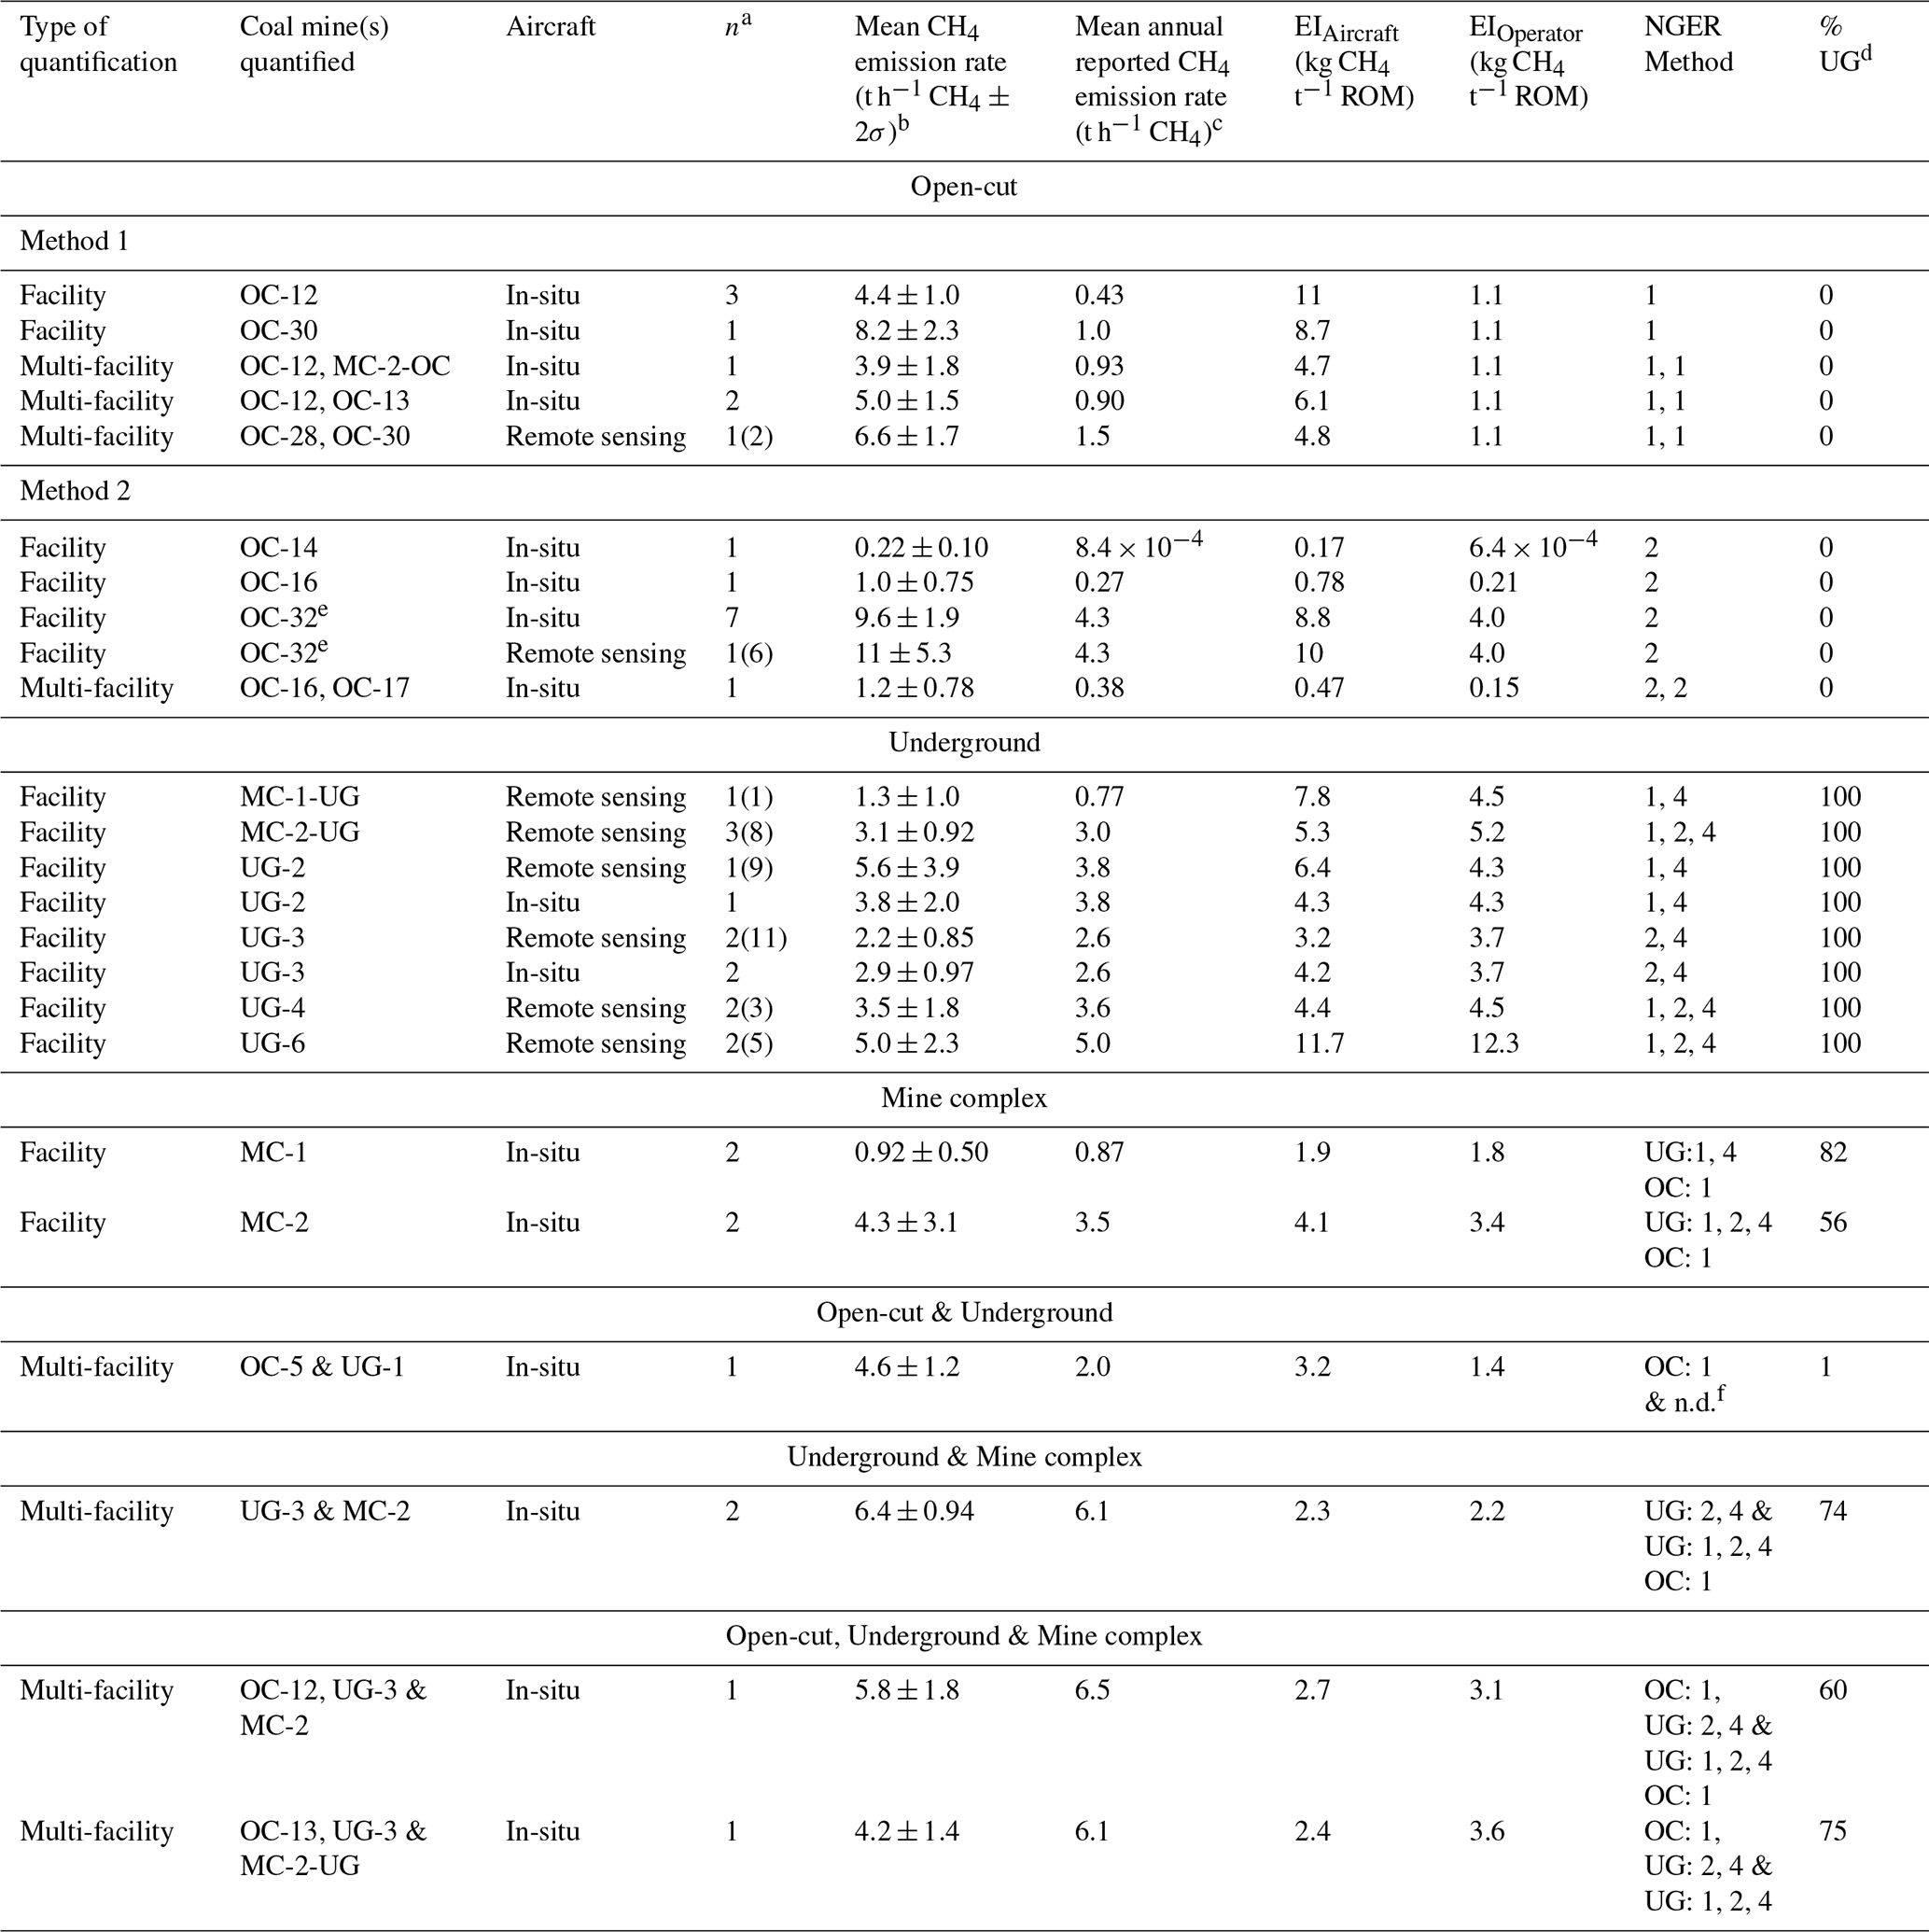
a For the in-situ aircraft, n represents the number of quantifications used to derive each mean emission rate estimate. For the remote sensing aircraft, n represents the number of days the mine(s) were sampled, with the number in brackets representing the number of flight legs used in the estimate. b Uncertainties represent 2σ errors (see S5 for further details).
c Mean annual operator-reported CH4 emission rate derived from FY24 Safeguard Mechanism reporting. d Percentage of ROM coal produced from underground operations.
e Estimates previously reported in Borchardt et al. (2025). f n.d. = not determined.
The median estimated 1σ uncertainty for individual quantifications was 21 % for the in-situ aircraft (mean 25 %, n=29; S5) and 25 % for the remote sensing aircraft (mean 28 %, n=24; S5). For facilities with multiple quantifications (n≥2), reflecting a more representative sampling than single quantifications, the median standard error was 15 % for the in-situ aircraft (mean 18 %, n=7), equivalent to 30 % at the 95 % confidence level. Similarly, the median standard error for the remote sensing aircraft was 19 % (mean 19 %, n=4), equivalent to 37 % at the 95 % confidence level.
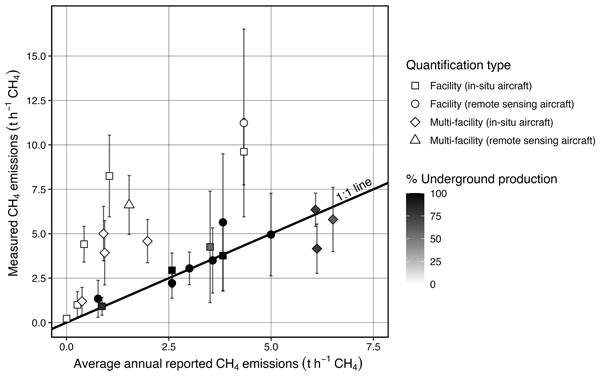
Figure 5 compares the 24 mean airborne emission rates against mean annual reported CH4 emission rates for each quantified mine or mine grouping, distinguished by mine type and NGER method. Figure 5 shows that airborne estimates derived solely from underground mines or solely from mine complexes were typically within ±2σ of reported values. All airborne estimates derived solely from open-cut coal mines, regardless of whether Method 1 or 2 was applied, exceeded reported values by more than 1σ of the estimated uncertainty.
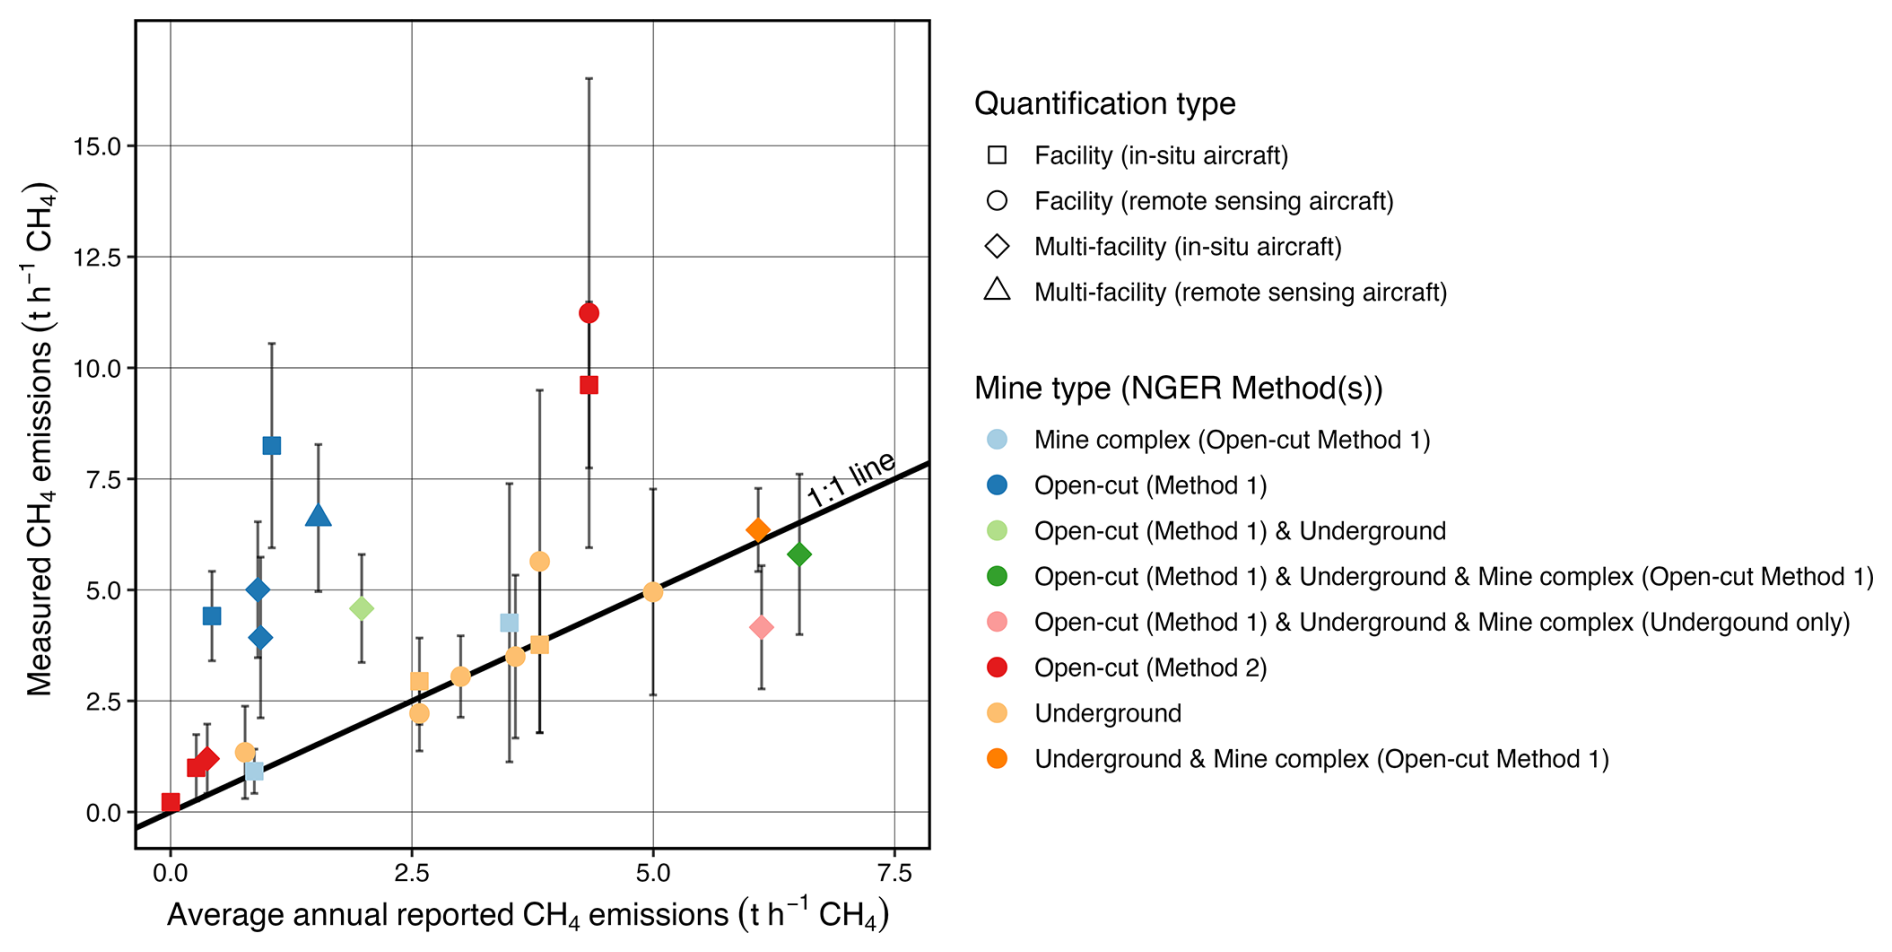
Figure 5Comparison between mean airborne emission rates and reported mean annual CH4 emission rates, distinguished by mine type and NGER method. Each data point represents a mean emission rate (±2σ) estimate derived from one or more quantifications of a single mine or mine grouping (see Table 1 for full details).
Trends within the multi-facility estimates spanning different mine types were less apparent, likely due to the unequal contribution of surface and underground ROM production and the resulting range of NGER methods applied by operators to estimate emissions. Two of the four estimates, which combined emissions from underground mines, mine complexes, and open-cut mines, were within ±2σ of reported values. The third was lower than reported values, and the fourth, which combined one underground and one open-cut mine, exceeded reported values by more than the estimated 2σ uncertainty. Therefore, to further assess underlying trends for estimates from facilities applying multiple NGER methods, the percentage of ROM produced via underground extraction methods was calculated for each mine quantified based on reported production data for FY24 (Queensland Government, 2025a; S1). When presented in this way (Fig. 6), mean airborne emission rates from facilities that predominantly produced coal via underground operations (≥50 % underground production) were typically within ±2σ uncertainty of reported values, while 100 % of estimates from those facilities predominantly producing coal via surface extraction methods (<50 % underground production) exceeded reported values by more than 2σ of the estimated uncertainty.
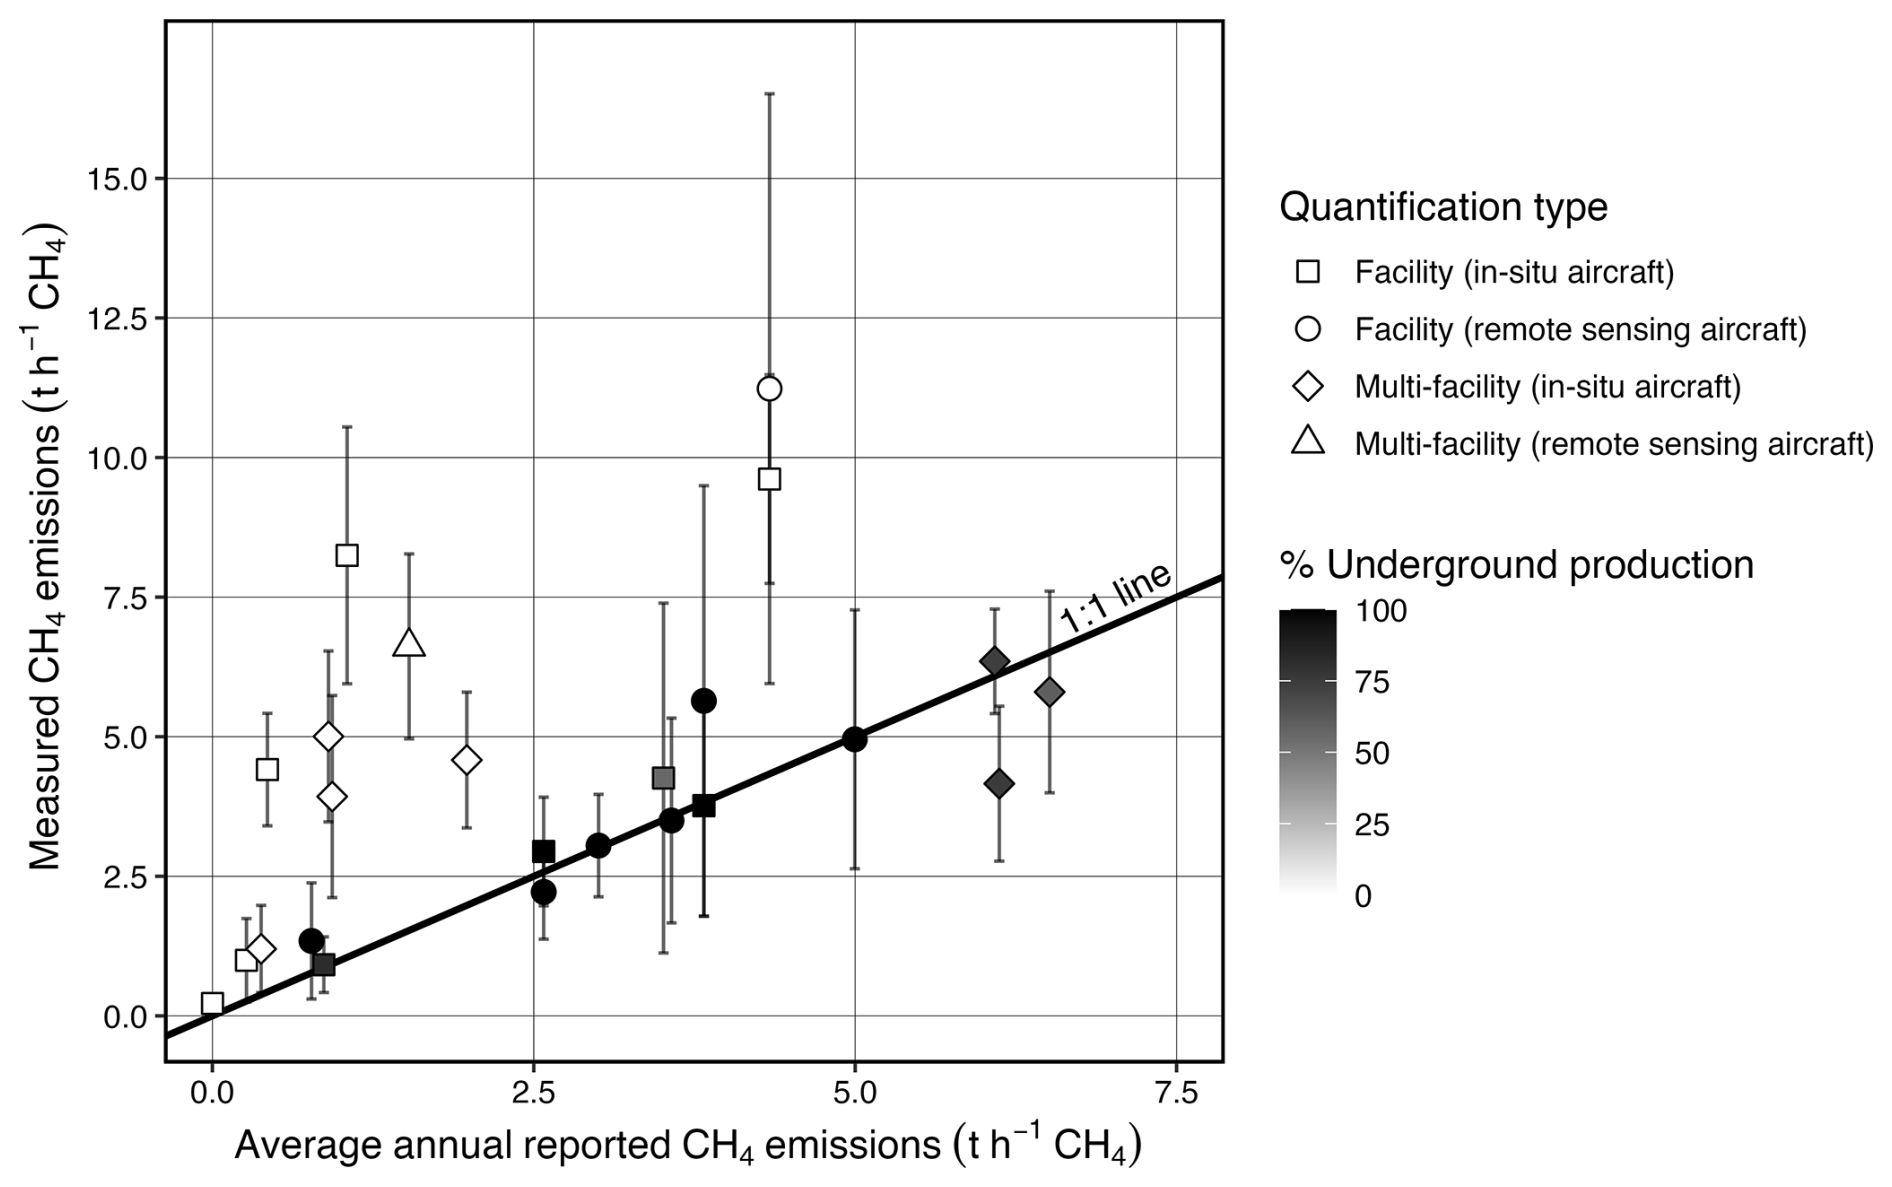
Figure 6Comparison between mean airborne emission rates and reported mean annual CH4 emission rates (±2σ), coloured according to percentage of underground ROM coal production for FY24 (Queensland Government, 2025a; S1).
Based on the trends shown in Figs. 5 and 6, biases between mean airborne estimates and mean annual operator-reported estimates were assessed by grouping the estimates by mine type as follows:
-
Group 1: Estimates exclusively from underground coal mines
-
Group 2: Estimates exclusively from open-cut coal mines (not distinguished by NGER method)
-
Group 3: Estimates exclusively from open-cut coal mines where operators applied Method 1
-
Group 4: Estimates exclusively from open-cut coal mines where operators applied Method 2
-
Group 5: Estimates from coal mines with ≥50 % of ROM production from underground extraction
-
Group 6: Estimates from coal mines with <50 % of ROM production from underground extraction.
Groups 5 and 6 allow multi-facility estimates spanning various mine types and NGER methods to be included, increasing the statistical power of the bias analyses. They also allow the few mine complexes that report emissions from both underground and open-cut operations to be included in the bias assessment.
To assess systematic differences between facility level operator-reported and aircraft-measured emission rates within each group (Table 2), mean bias was calculated according to:
where n is the number of estimates within in each group, TDi is the mean airborne emission rate for the ith estimate, and BUi is the mean annual operator-reported emission rate for the ith estimate. In Eq. (1), positive values signify that airborne estimates exceeded mean annual operator-reported estimates on average. Statistical significance of the mean bias was evaluated using one-sample t-tests with 95 % confidence intervals derived from the t-distribution. Normalised root mean square error (NRMSE; normalised to the mean) was used as a scale-independent measure of agreement. Fixed-origin linear regression (intercept constrained to zero; Fig. 7) was used to evaluate proportionality, with a slope of unity expected under no bias. Statistical significance of slope deviations from unity was assessed using t-tests, and 95 % confidence intervals were derived from the t-distribution. Analyses were performed in R 4.2.2 (R Core Team, 2022).
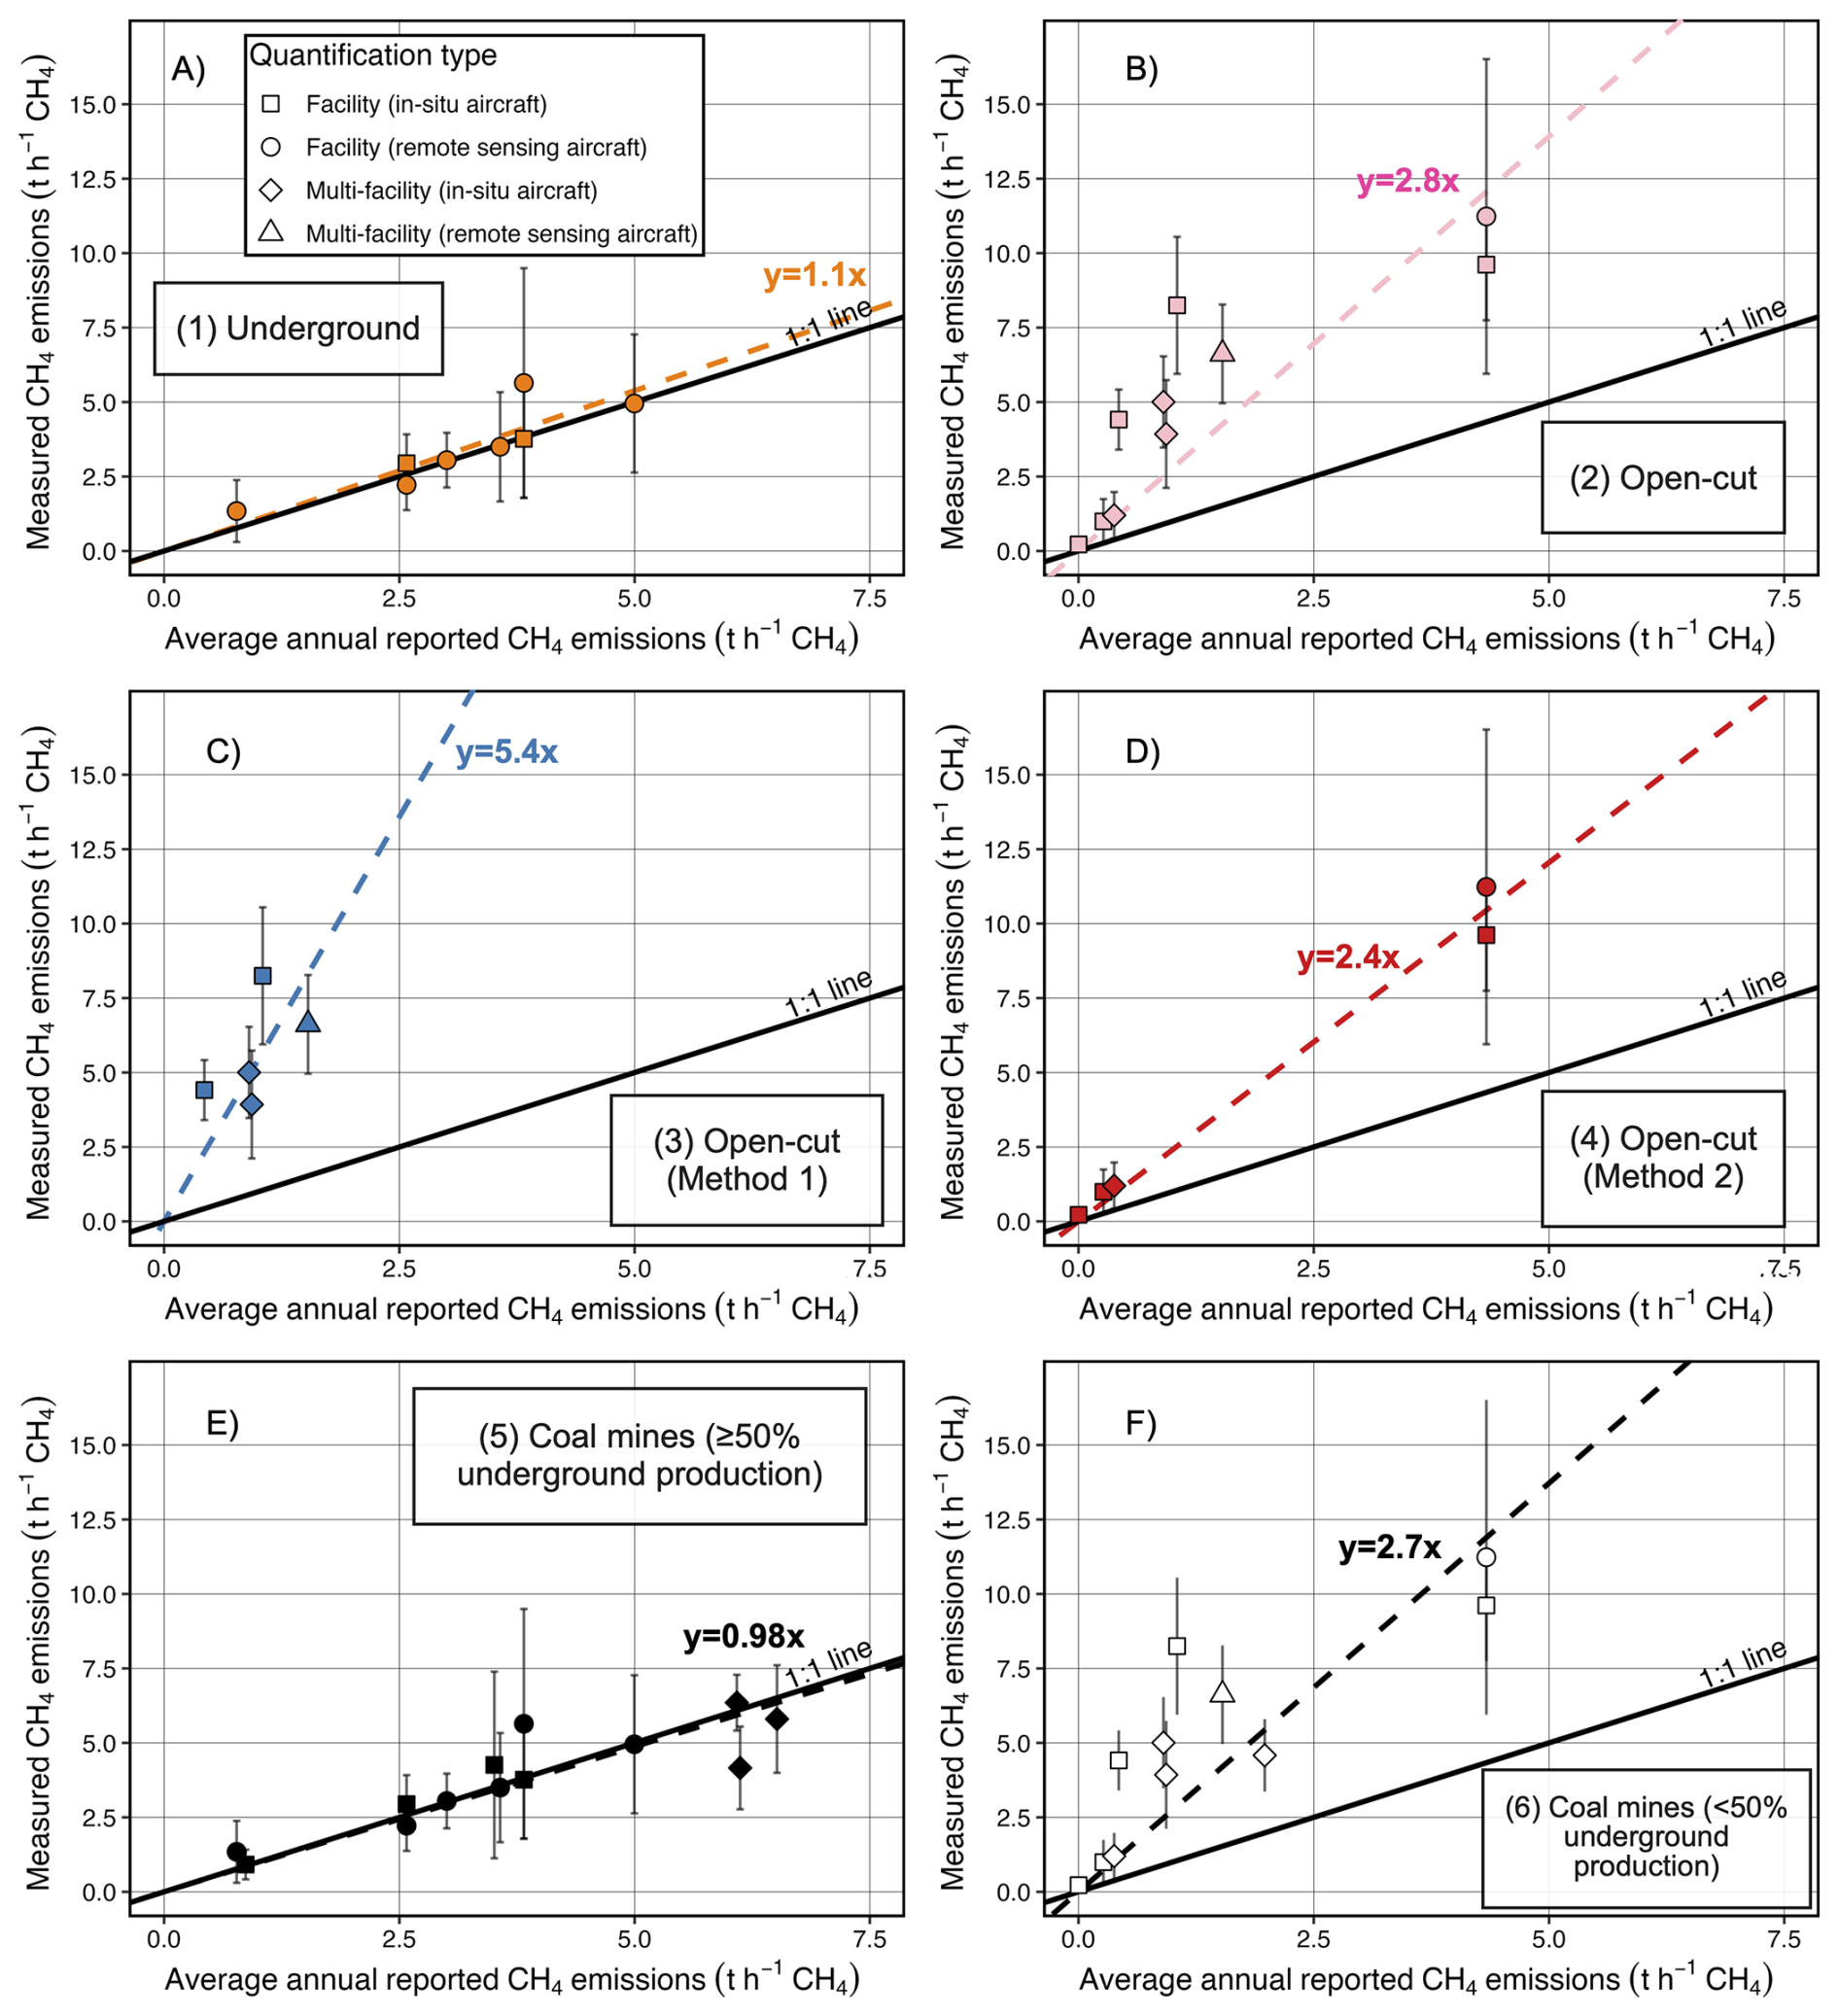
Figure 7Comparison between mean airborne emission rates (±2σ) and reported mean annual CH4 emission rates for: (A) exclusively underground coal mines; (B) exclusively open-cut coal mines; (C) exclusively open-cut coal mines estimated using Method 1; (D) exclusively open-cut coal mines estimated using Method 2; (E) coal mines with ≥50 % underground production; and (F) coal mines with <50 % underground production. The fixed-origin linear regression analysis model is indicated by the dashed line and the slope is indicated in each panel. Symbol shapes are as in Figs. 5 and 6.
Table 2Summary of facility level bias within Groups 1–6. Values are reported to two significant figures; rounding may introduce minor discrepancies. CI = confidence interval.
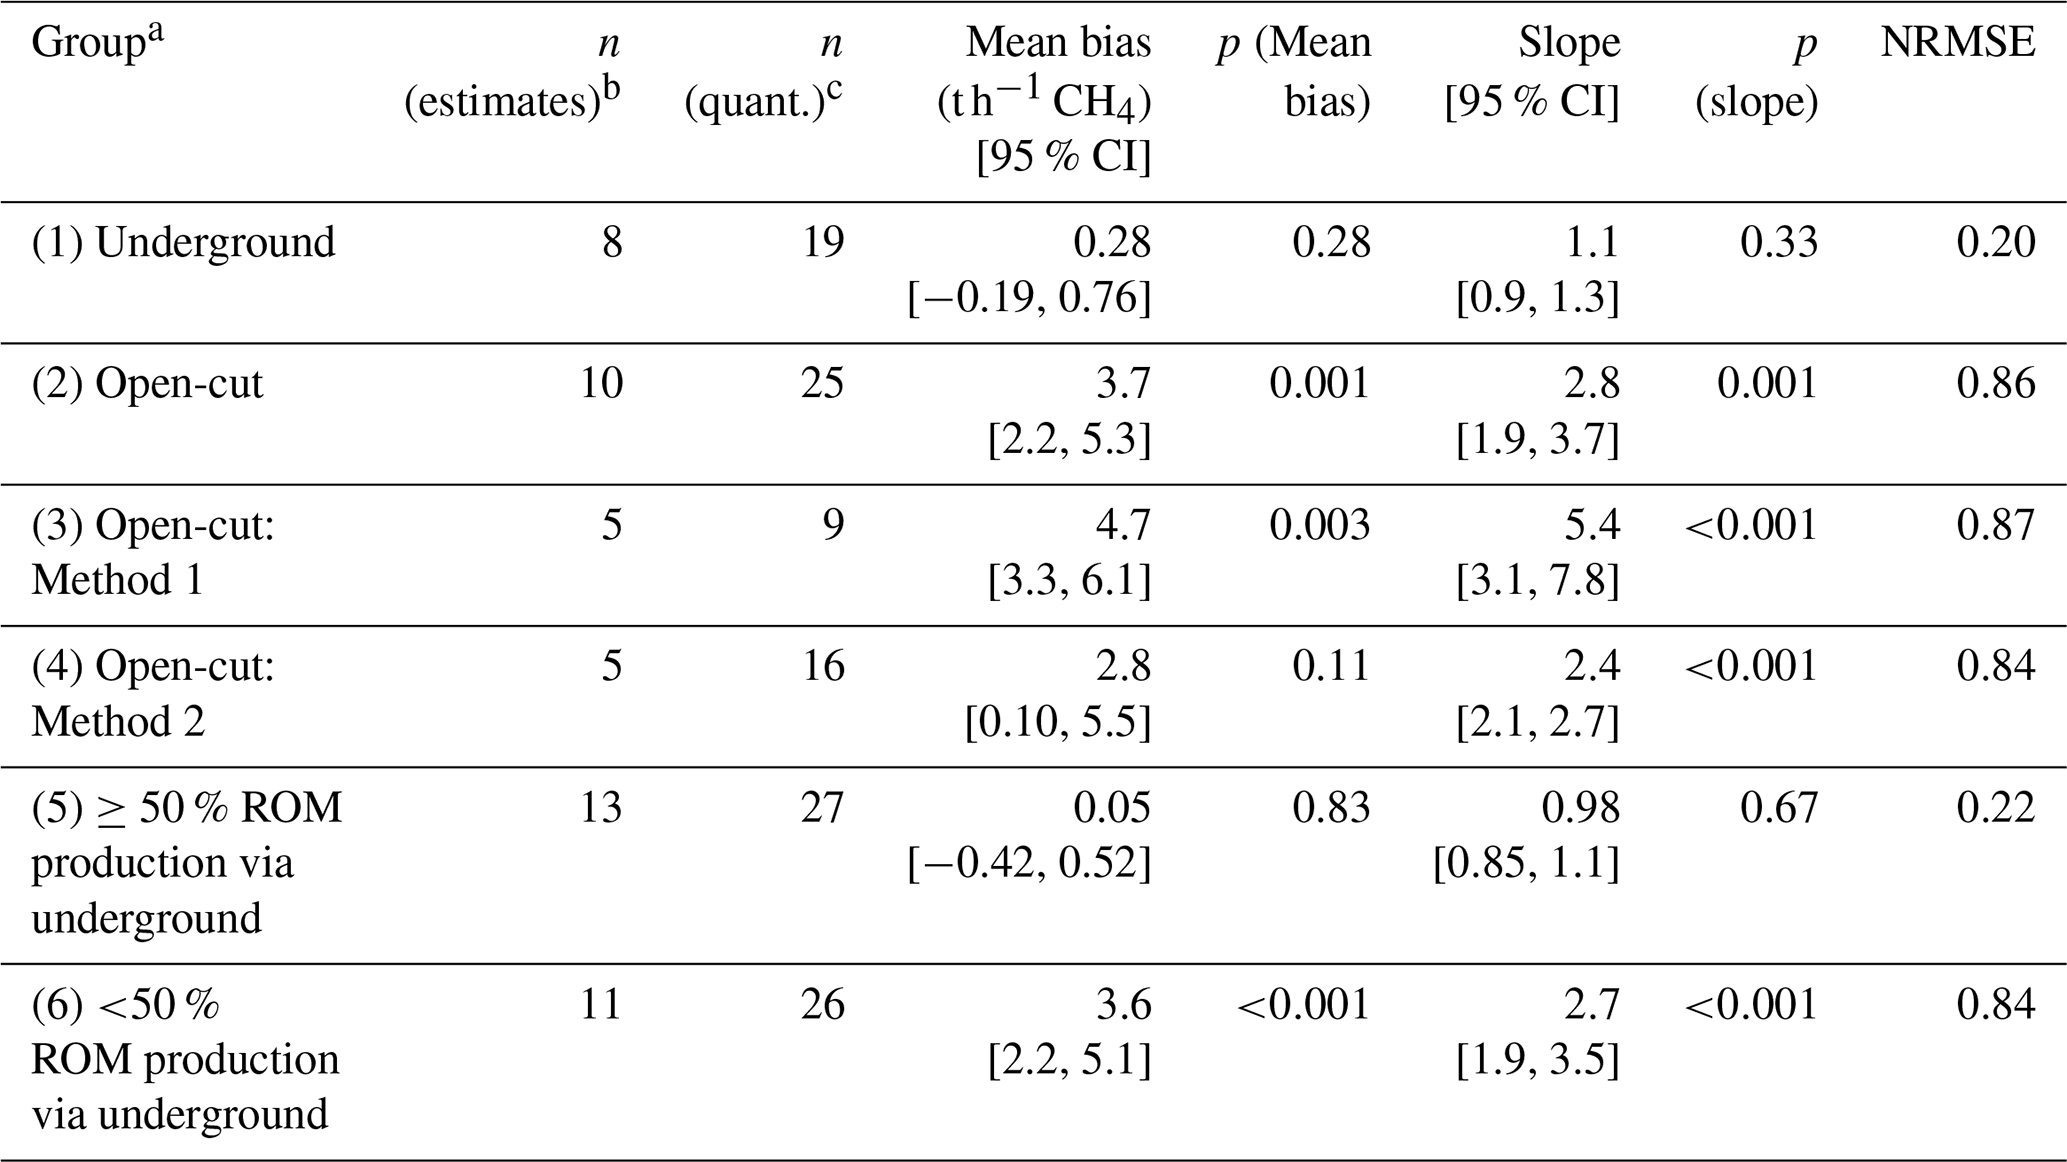
a Refer to the text for further details on the groups. b Represents the number of independent mean emission rate estimates derived across facility- and multi-facility quantifications. c Refers to the total number of individual airborne quantifications used to derive the n mean emission rate estimates.
Aggregate bias within each group was quantified using four metrics (Table 3): the ratio of total aircraft to total operator-reported emissions (), the absolute difference between these totals (|Aircrafttotal−Operatortotal|), the percentage deviation relative to the operator total , and the normalised deviation from the estimated 1σ uncertainty of the total top-down emission rate . Assuming individual facility quantifications were independent, aggregation reduces random errors arising from quantification uncertainty and stochastic temporal variability via the central limit theorem, thereby isolating and highlighting underlying systematic reporting biases between top-down airborne estimates and operator bottom-up estimates at the population level.
Table 3Summary of aggregate level bias within Groups 1–6. Where possible, values are reported to two significant figures; rounding may introduce minor discrepancies.
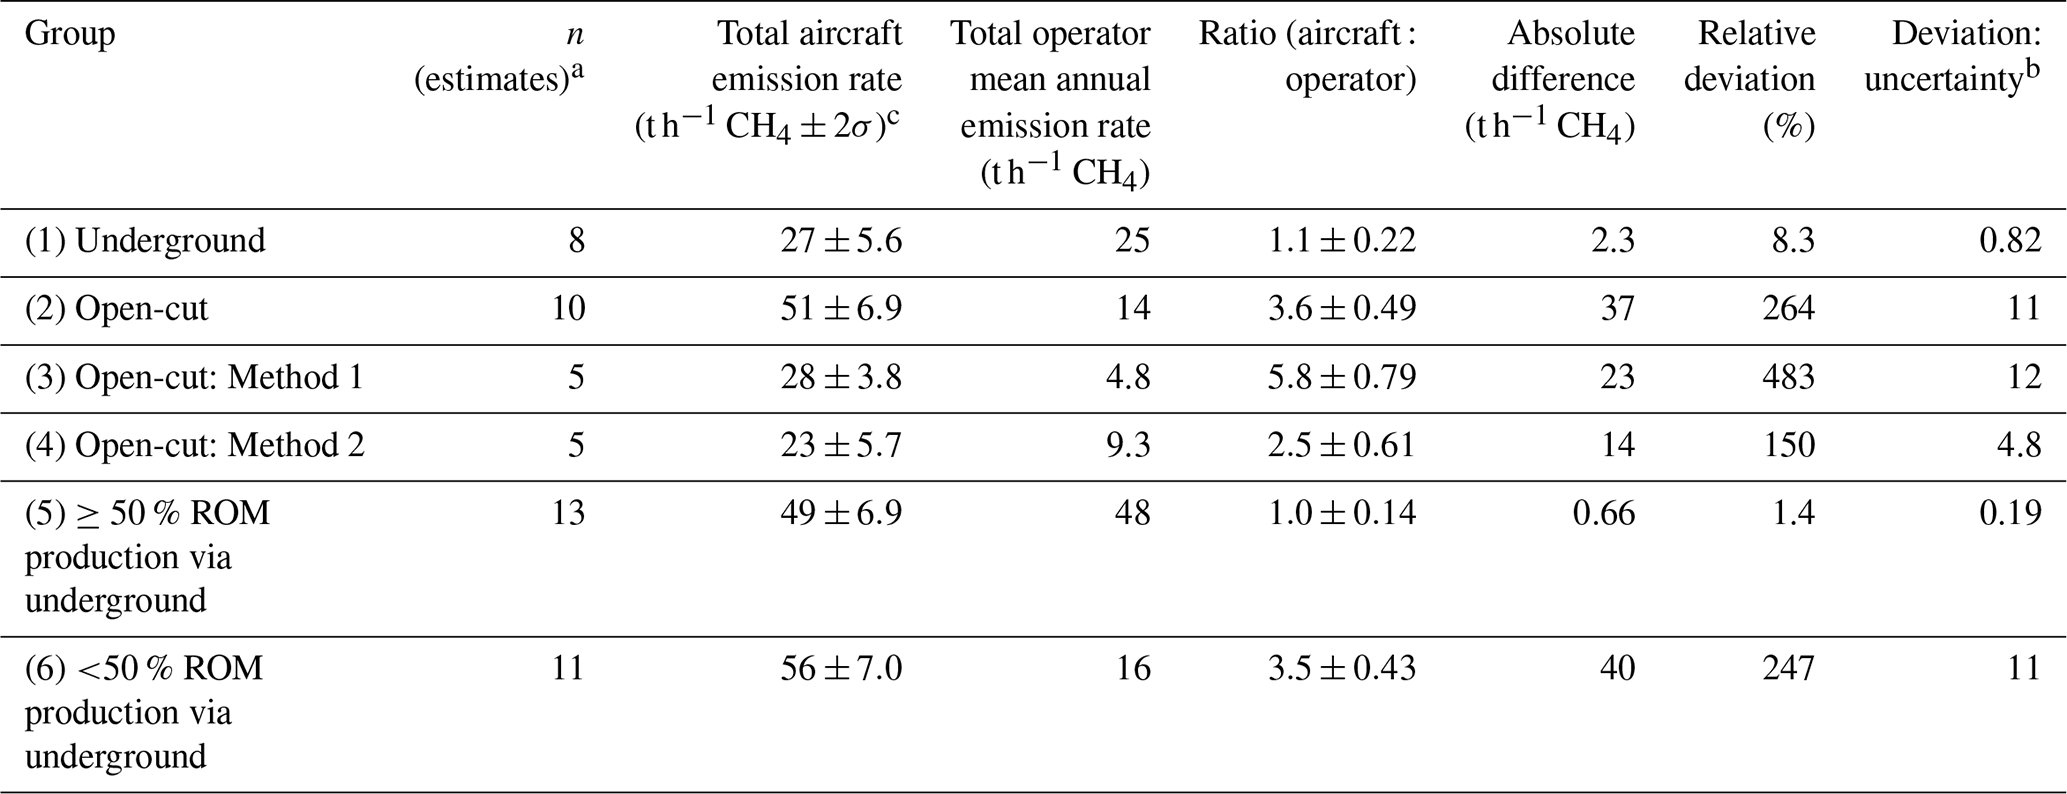
a Represents the number of independent mean emission rate estimates derived across facility- and multi-facility quantifications. b The ratio of the relative deviation to the estimated percentage 1σ uncertainty of the total measured emission rate. c Uncertainty totals were derived by summing the estimated uncertainties in quadrature.
In Group 1, airborne estimates from solely underground mines showed minimal differences relative to operator estimates at the facility-level (Table 2). The mean bias was small (0.28 t h−1) and not statistically significant (p=0.28), with a slope that did not significantly differ from unity (; Fig. 7a). The NRMSE value of 0.20 indicated good agreement, consistent with the estimated airborne uncertainties (± 30 %–37 % at the 95 % confidence level for the two aircraft). Aggregate-level emissions also aligned closely, with the total airborne estimate within 8.3 % of the total operator estimate (Table 3). The absolute difference was less than the estimated 1σ quantification uncertainty (0.82σ), confirming good agreement between the two estimation approaches.
In contrast, airborne estimates from solely open-cut coal mines (Group 2) were systematically higher than operator-reported estimates (Table 2). The mean positive bias of 3.7 t h−1 CH4 was statistically significant (p=0.001), and the slope of 2.8 was significantly different from unity (p=0.001), indicating a systematic proportional bias whereby airborne estimates were on average 2.8 times the operator-reported values (Fig. 7b). The NRMSE value of 0.86 indicated poor agreement, with discrepancies exceeding estimated airborne quantification uncertainties. Even with the exclusion of data reported in Borchardt et al. (2025), the positive bias remained statistically significant (mean = 3.1 t h−1 CH4, p=0.01; data not shown in Table 2), the slope increased to 5.4 (p<0.001), and the NRMSE increased to 1.0, indicating that the observed bias persists despite the removal of these data. In aggregate, the total airborne estimate from surface mines was 3.6 times the operator-reported total, with the relative deviation exceeding the estimated 1σ uncertainty of the total airborne estimate by a factor of 11.
Airborne estimates from open-cut mines applying Method 1 (Group 3) showed the largest statistically significant positive bias (4.7 t h−1 CH4, p=0.003) and poor agreement (NRMSE = 0.87), together with strong proportional overestimation (slope = 5.4, p<0.001; Fig. 7c; Table 2). When aggregated, total airborne estimates were 5.8 times the operator-reported emissions (Table 3). The absolute difference in total aggregated emissions corresponded to an approximately 12σ deviation based on the estimated uncertainty of the airborne quantifications.
Airborne estimates from open-cut mines applying Method 2 (Group 4) showed a positive mean bias of 2.8 t h−1 CH4 that was not statistically significant (p=0.11), despite a statistically significant slope different from unity (2.4,p<0.001; Fig. 7d) and a large NRMSE (0.84) indicating poor agreement. This contrast likely reflects the large variance in this group, compounded by the small sample size (n=5; Table 2). Nonetheless, in aggregate, total airborne estimates were 2.5 times the operator-reported emissions, with the absolute difference in total aggregated emissions corresponding to a 5σ deviation compared to estimated airborne quantification uncertainty (Table 3).
Bias metrics from Groups 5 and 6, which had greater statistical power because of the inclusion of multi-facility and mine complex quantifications (n= 13 and 11 mines, respectively), further confirmed the contrasting bias behaviour between underground and open-cut coal mines relative to airborne estimates. Group 5 showed a small and non-significant bias (0.05 t h−1 CH4; p=0.83, NRMSE = 0.22), with a slope not significantly different from unity (; Fig. 7e). Aggregate-level emissions agreed within 1.4 %, with absolute differences five times smaller than the estimated 1σ uncertainty. In contrast, Group 6 exhibited a large mean bias (3.6 t h−1 CH4; p<0.001, NRMSE = 0.84) and a slope significantly different from unity (2.7,p<0.001; Fig. 7f). Aggregate-level emissions were 3.5 times the operator-reported estimates (Table 3), with the absolute difference corresponding to an approximately 11σ deviation.
Although not included as separate groups in the bias assessment due to small sample size (n=2 of 3 mine complexes in the Bowen Basin), emission totals from mine complexes showed agreement between operator reporting (4.4 t h−1 CH4) and airborne estimates (5.2±1.6 t h−1 CH4; Table 1). A similar limitation applied to multi-facility quantifications of several open-cut, underground, and mine complexes (n=2), where operator estimates (13 t h−1 CH4) exceeded airborne estimates (10±1.1 t h−1 CH4; Table 1). Across both cases, underground mining accounted for 58 % to 82 % of ROM production (Queensland Government, 2025a; S1), and the trends are consistent with results from Group 5, where airborne estimates from mines with mainly underground production showed no significant bias compared to operator reporting.
To further assess whether discrepancies in emission rates persist after normalisation by coal production volume, Table 4 presents mean CH4 emission intensities (EI) for each group derived from top-down aircraft quantifications (EIAircraft) and bottom-up operator estimates (EIOperator). As in Tables 2 and 3, aircraft-based and operator EIs agreed for underground mines (Groups 1 and 5) but disagreed for open-cut mines (Groups 2, 3, 4, and 6), with aircraft-based EIs substantially higher. Notably, mean aircraft EIs were similar for underground and open-cut mines (5.4±2.7 (±1σ) vs. 5.6±4.2 (±1σ) kg CH4 t−1 ROM, respectively), suggesting that the intensity of CH4 emitted per tonne of coal was independent of mine type.
Table 4Mean CH4 emission intensities for each group derived from aircraft estimates (EIAircraft) and operator estimates (EIOperator).
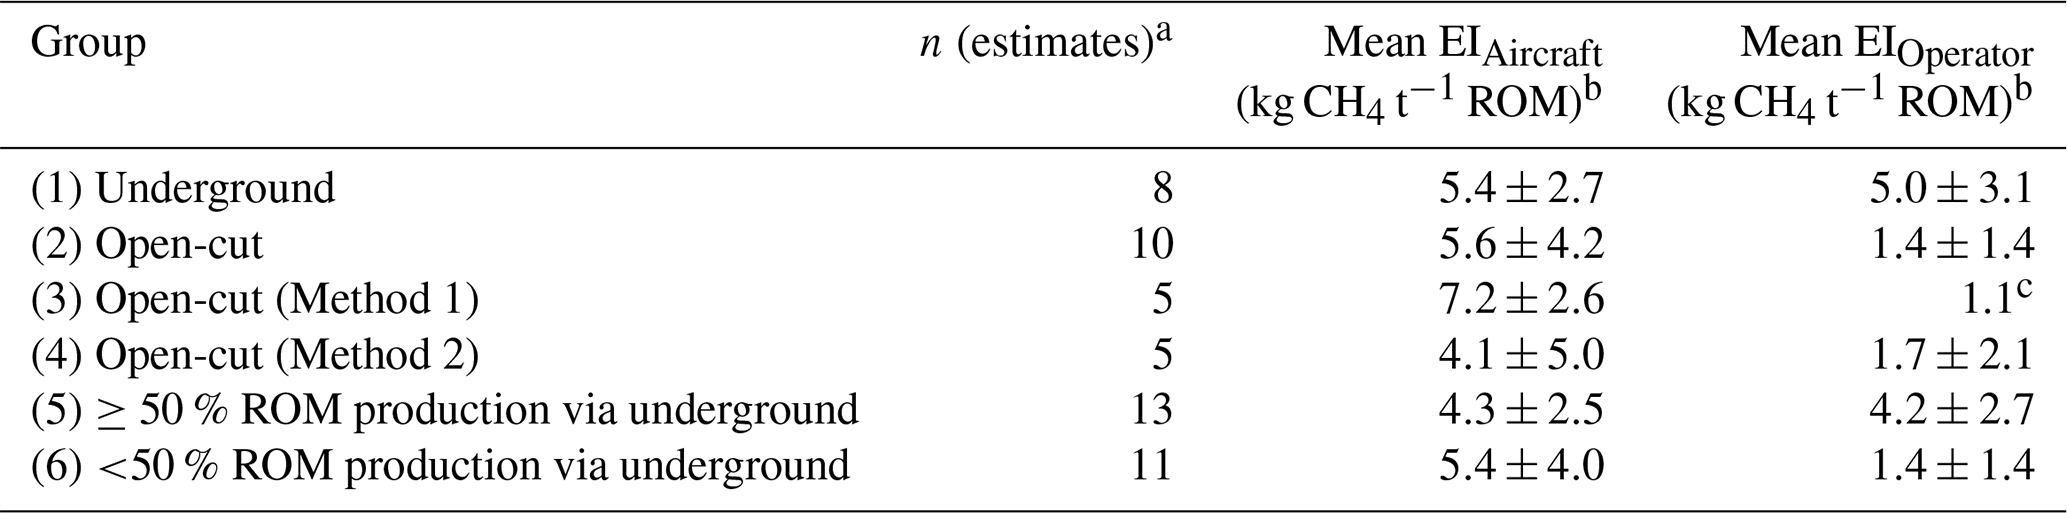
a Represents the number of independent mean emission rate estimates derived across facility- and multi-facility quantifications. b Reported errors represents one standard deviation of the mean. c No standard deviation is reported since, by default, all reporting using NGER Method 1 from open-cut mines in the Bowen Basin assumes an emissions intensity of 1.1 kg CH4 t−1 ROM coal.
3.2 Comparison of in-situ and remote sensing aircraft quantifications
Direct comparisons between in-situ and remote sensing aircraft estimates were possible for three facilities (Fig. 8a; Table 1). A forced-origin regression of the quantifications yielded a slope of 1.2, which was not significantly different from 1 (95 % CI = 0.69–1.67; p=0.27), indicating no systematic bias between the two approaches. Despite the limited sample size (n=3), the relationship was strong (R2=0.98), demonstrating close proportional agreement. The unconstrained regression showed a non-significant intercept (−46 t h−1; p=0.94), supporting the use of a zero-intercept model to assess proportional agreement between the in-situ and remote sensing quantifications. Wind speeds used in the individual airborne quantifications were compared across multiple flights by the two aircraft on the same day (n=11; Fig. 8b). A fixed-origin regression yielded a slope of 0.96, which was statistically indistinguishable from 1 (95 % CI = 0.87–1.05; p=0.30), and the relationship was very strong (R2=0.98). The unconstrained regression showed a non-significant intercept (0.97, p=0.12), indicating no evidence of systematic offset.
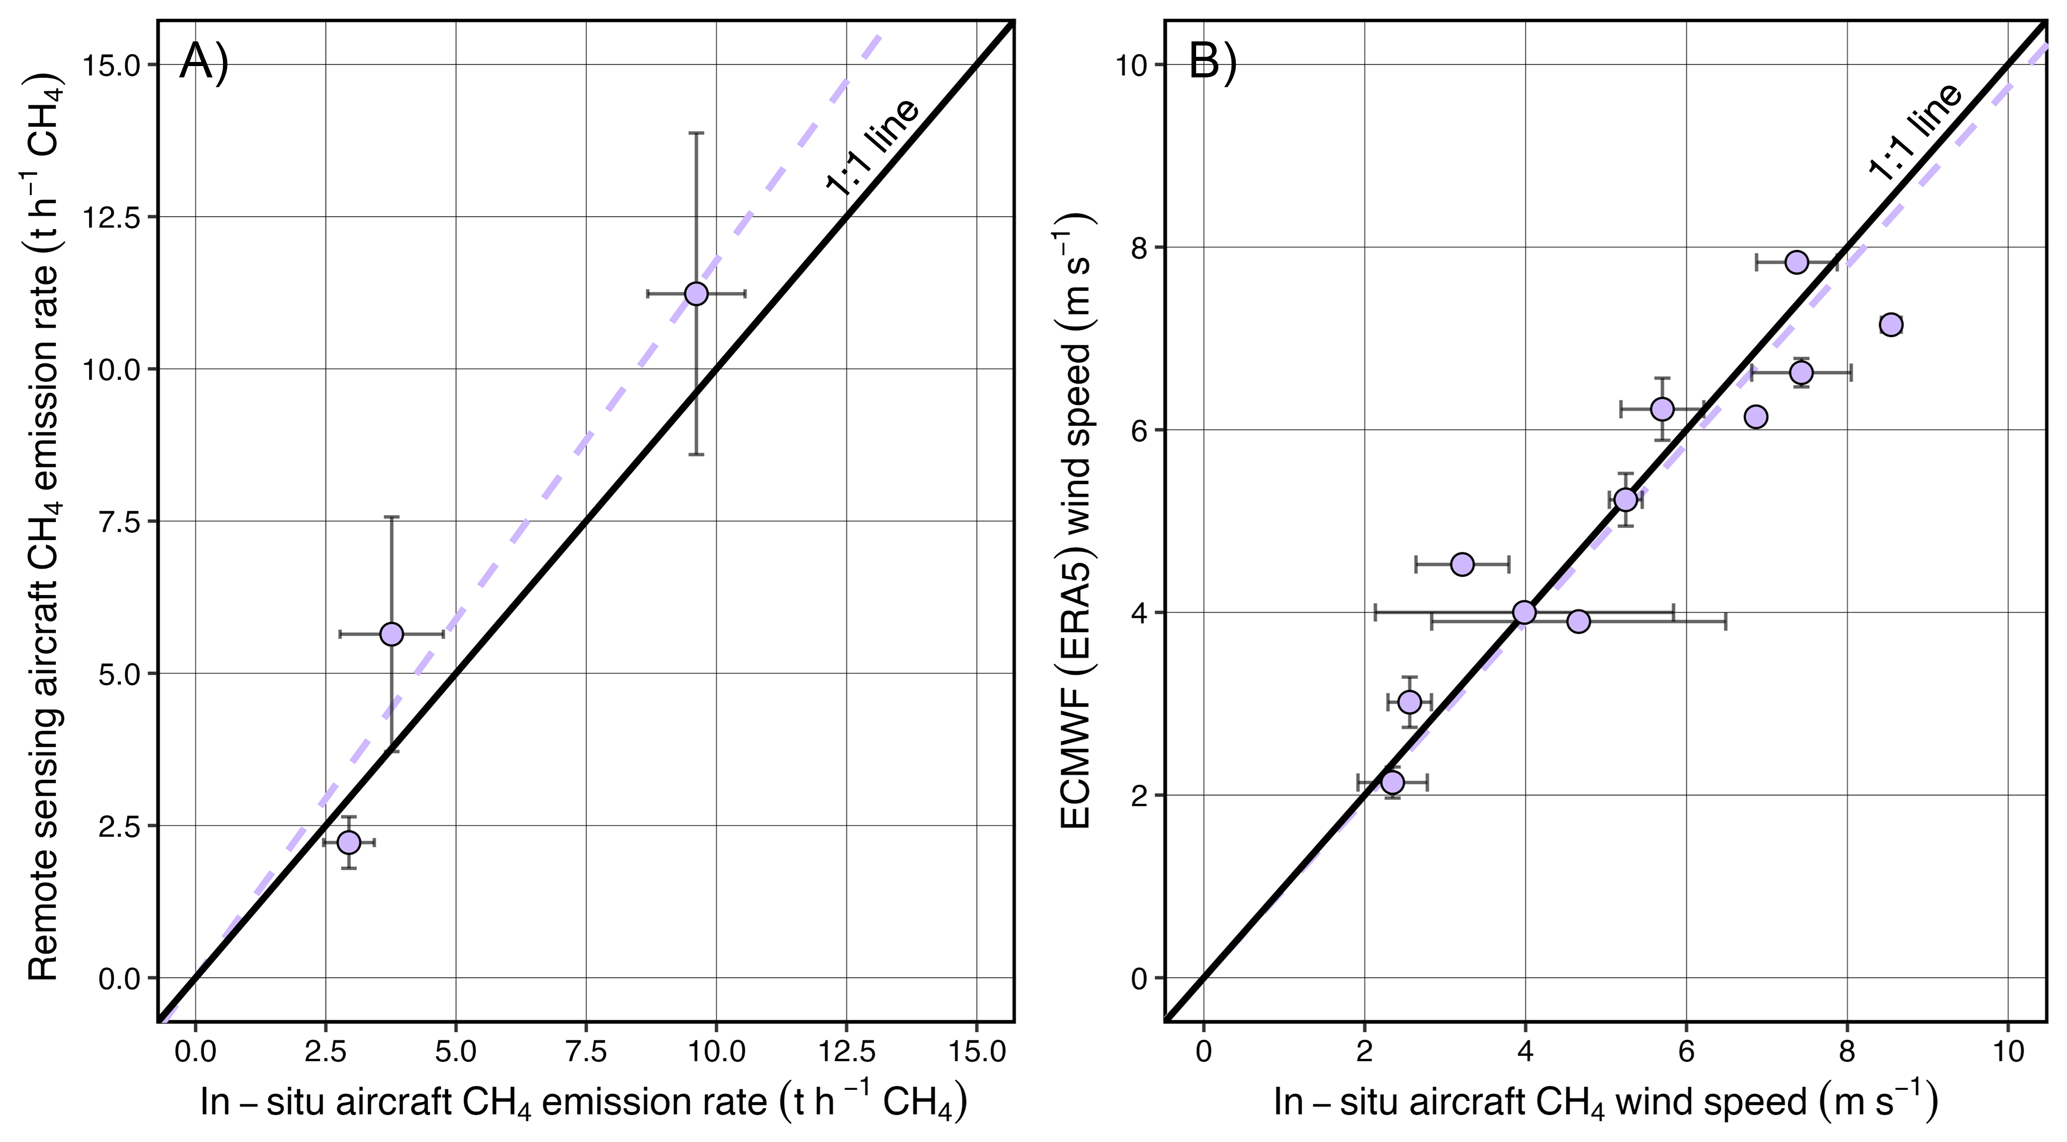
Figure 8(A) Comparison of remote sensing and in-situ aircraft emission rate estimates from the same coal mine facility. Error bars represent ±1σ uncertainty of each estimate. Data from Borchardt et al. (2025) are used as one of the data points. (B) Comparison of ECMWF (ERA5) modelled wind speeds used in the remote sensing aircraft flux analysis and those measured onboard the in-situ aircraft during the sampling of curtains during the 11 flights undertaken on the same day. Error bars represent 1 standard deviation of mean winds speeds used to model individual quantifications on each day.
3.3 Evaluation of upwind non-coal CH4 source emission rates
The estimated emission rates of non-coal CH4 sources within the UNSW inventory located upwind of each in-situ aircraft curtain, broken down by source, is provided in S11. Across all curtains, the median emission rate of upwind non-coal sources was 0.069 t h−1 CH4 (mean: 0.077 t h−1 CH4), ranging from 0.028–0.16 t h−1 CH4. Compared to individual in-situ quantifications, these sources had a median emission rate equal to 1.4 % of the quantified emission rate (mean: 2.6 %), ranging from 0.4 % to 12.6 %. This indicates that median estimated upwind emission rates were roughly 15 times smaller than the median estimated 1σ quantification uncertainty for individual curtains derived by the in-situ aircraft (±21 %). A sensitivity analysis of HYSPLIT footprints to release height, performed for cases spanning the minimum, mean, and maximum other-source contributions (relative to the total curtain emission rate) in our dataset, confirmed that our source-region identification and quantitative estimates are robust to release-height uncertainty (see S11). Grazing cattle were typically the largest estimated upwind source, emitting a median of 0.052 t h−1 CH4, or approximately 0.8 % of the estimated uncertainty of the in-situ quantification rates. Median emission rates from all other sources were ≤0.1 % of the measured in-situ emission rates. The upwind bottom-up inventories derived in Sect. 2.3.3 incorporate non-coal CH4 sources located within the upper and lower extremities of each curtain. Since the emission rate is derived only from enhancements within the plume extremities, which do not span the entire curtain, the upwind inventory for each curtain likely overestimates the potential contribution of upwind non-coal sources, making this a conservative approach.
All plumes quantified by the remote sensing aircraft and used in the bias assessment did not exhibit visually apparent upwind CH4 enhancements, indicating that the observed emissions arise from the identified sources rather than from inflowing polluted air masses. To support this observation, the upwind portion of a leg containing a quantifiable plume (P6.2_leg-f) was analysed using the standard emission rate quantification procedure, yielding an upwind flux of 0.009 t h−1 CH4 (Fig. S6f). This value lies well within the estimated flux error of the plume quantified within the downwind portion of the same leg (Fig. S6e; 3.7±0.93 [±1σ] t h−1). Similar low emission rate estimates (0.15 and 0.013 t h−1) were obtained for two additional upwind legs (P6.2_leg-d and leg-e, Fig. S6b and c) located up to 3 km upwind of the source and, therefore, did not show any detectable enhancements. On average, the mean upwind emission rate based on the three upwind legs was 0.06 t h−1, approximately 1.5 % of the measured downwind emission rate of P6.2 (based on legs f, g, and h: (3.8±0.82) t h−1) and well within the quantification error margins. This consistency indicates that the absence of significant upwind contributions is expected to hold for all other plumes measured by the remote sensing aircraft.
3.4 Airborne CH4 isotope signatures
A total of 114 bag samples were acquired on 13 of the 19 in-situ aircraft flights (S12). All samples were analysed for their δ13C-CH4 isotope signature, while only 34 were analysed for their δ2H-CH4 signature. One grab sample bag could not be analysed due to leakage during transit between the sampling location and the laboratory.
Each bag sample was assigned according to whether it was collected upwind of the same coal mine or group of mines. The isotopic laboratory results were then combined to form Keeling plots of δ13C-CH4 versus 1/CH4 and δ2H-CH4 versus 1/CH4, following Keeling (1961). These plots were used to derive the isotopic signature of the upwind CH4 source. A Keeling plot was only generated when four or more samples were collected upwind of the same coal mine(s), resulting in 12 sets being analysed for δ13C-CH4, and four sets for δ2H-CH4 (S11). For three δ13C-CH4 sets, the concentration range was too narrow to provide sufficient spread in the data, indicating that the plume(s) had not been thoroughly sampled. These source signature intercepts were omitted due to poor constraint of the regression best fit (S12). In addition, airborne grab samples collected under low wind speed conditions were omitted, as clean two-endmember mixing assumptions were likely compromised.
Table 5 summarises the δ13C-CH4 source signatures downwind of nine individual coal mines and groups of coal mines, ranging from −64.9 ‰ (95 % CI: ±5.6) to −42.9 ‰ (95 % CI: ±3.6). δ2H-CH4 source signatures were additionally derived downwind of four individual coal mines and groups of coal mines and range from −199.7 ‰ (95 % CI: ±21.4) to −153.4 ‰ (95 % CI: ±30.3). In Table 5, the strength of the mixing relationship used to derive the source signatures is indicated by Pearson's correlation coefficient (r), which ranged from 0.85–0.99 for δ13C-CH4 and 0.87–0.99 for δ2H-CH4. The high r values indicate strong linearity in the Keeling plots, consistent with a dominant single-source contribution and supporting the reliability of the derived source signatures.
Table 5CH4 source signatures and Pearson correlation coefficients (r) derived from the airborne grab samples. Further details are provided in S12.
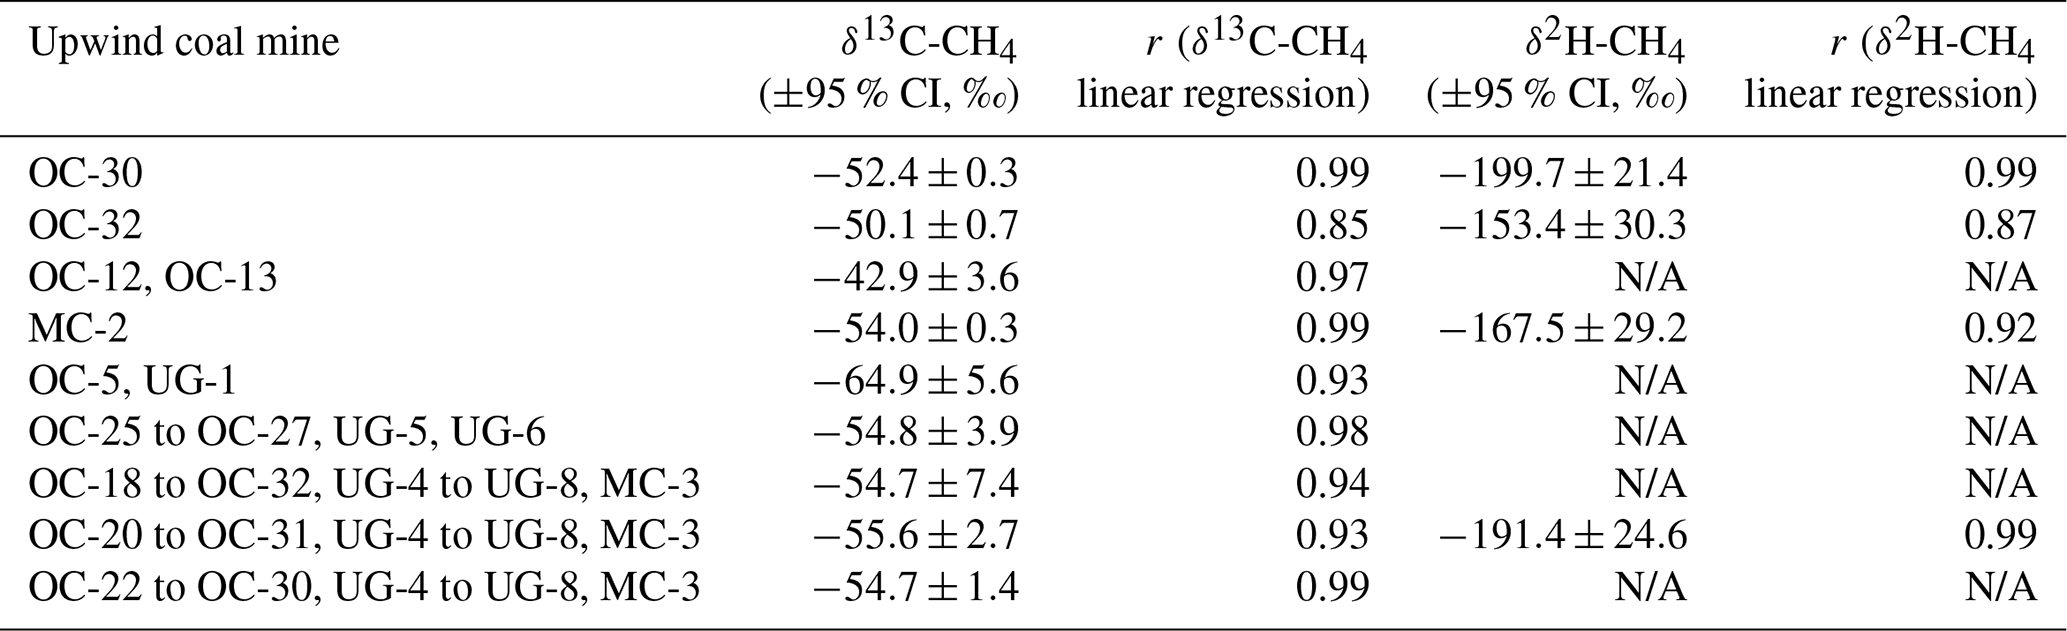
N/A = not analysed.
Four sets of dual isotopic signatures of CH4 (δ13C-CH4 and δ2H-CH4) were derived from airborne grab samples (Table 5). Figure 9 presents these data in a dual δ13C-CH4 vs δ2H-CH4 plot, incorporating known fields for various CH4 sources (Whiticar, 1996), as well as values for coal bed CH4 in the Bowen Basin (Draper and Boreham, 2006; Golding et al., 2013; Hamilton et al., 2020; Kinnon et al., 2010), CH4 from Queensland feedlot and grazing cattle (Lu et al., 2021), and CH4 from Queensland landfills (Obersky et al., 2018). All collected dual isotopic data closely match previously reported isotopic signatures for coal bed CH4 in the Bowen Basin, indicating that the CH4 concentrations measured during these curtains are consistent with a coal mine CH4 source. No isotopic signatures with δ2H-CH4 depleted enough to indicate contributions from biogenic sources (such as grazing or feedlot cattle, landfills, termites, macropods or farm dams) were observed. The remaining five airborne isotope source signatures, consisting of single δ13C-CH4 signatures measured downwind of coal mines, ranged from −64.9 ‰ to −42.9 ‰. While these values were also consistent with coal bed CH4 in the Bowen Basin, they could not be used alone to attribute emissions to upwind coal mines, as they overlap with other microbial sources. Although interpretation of these data is therefore limited, they remain consistent with the other lines of evidence presented above.
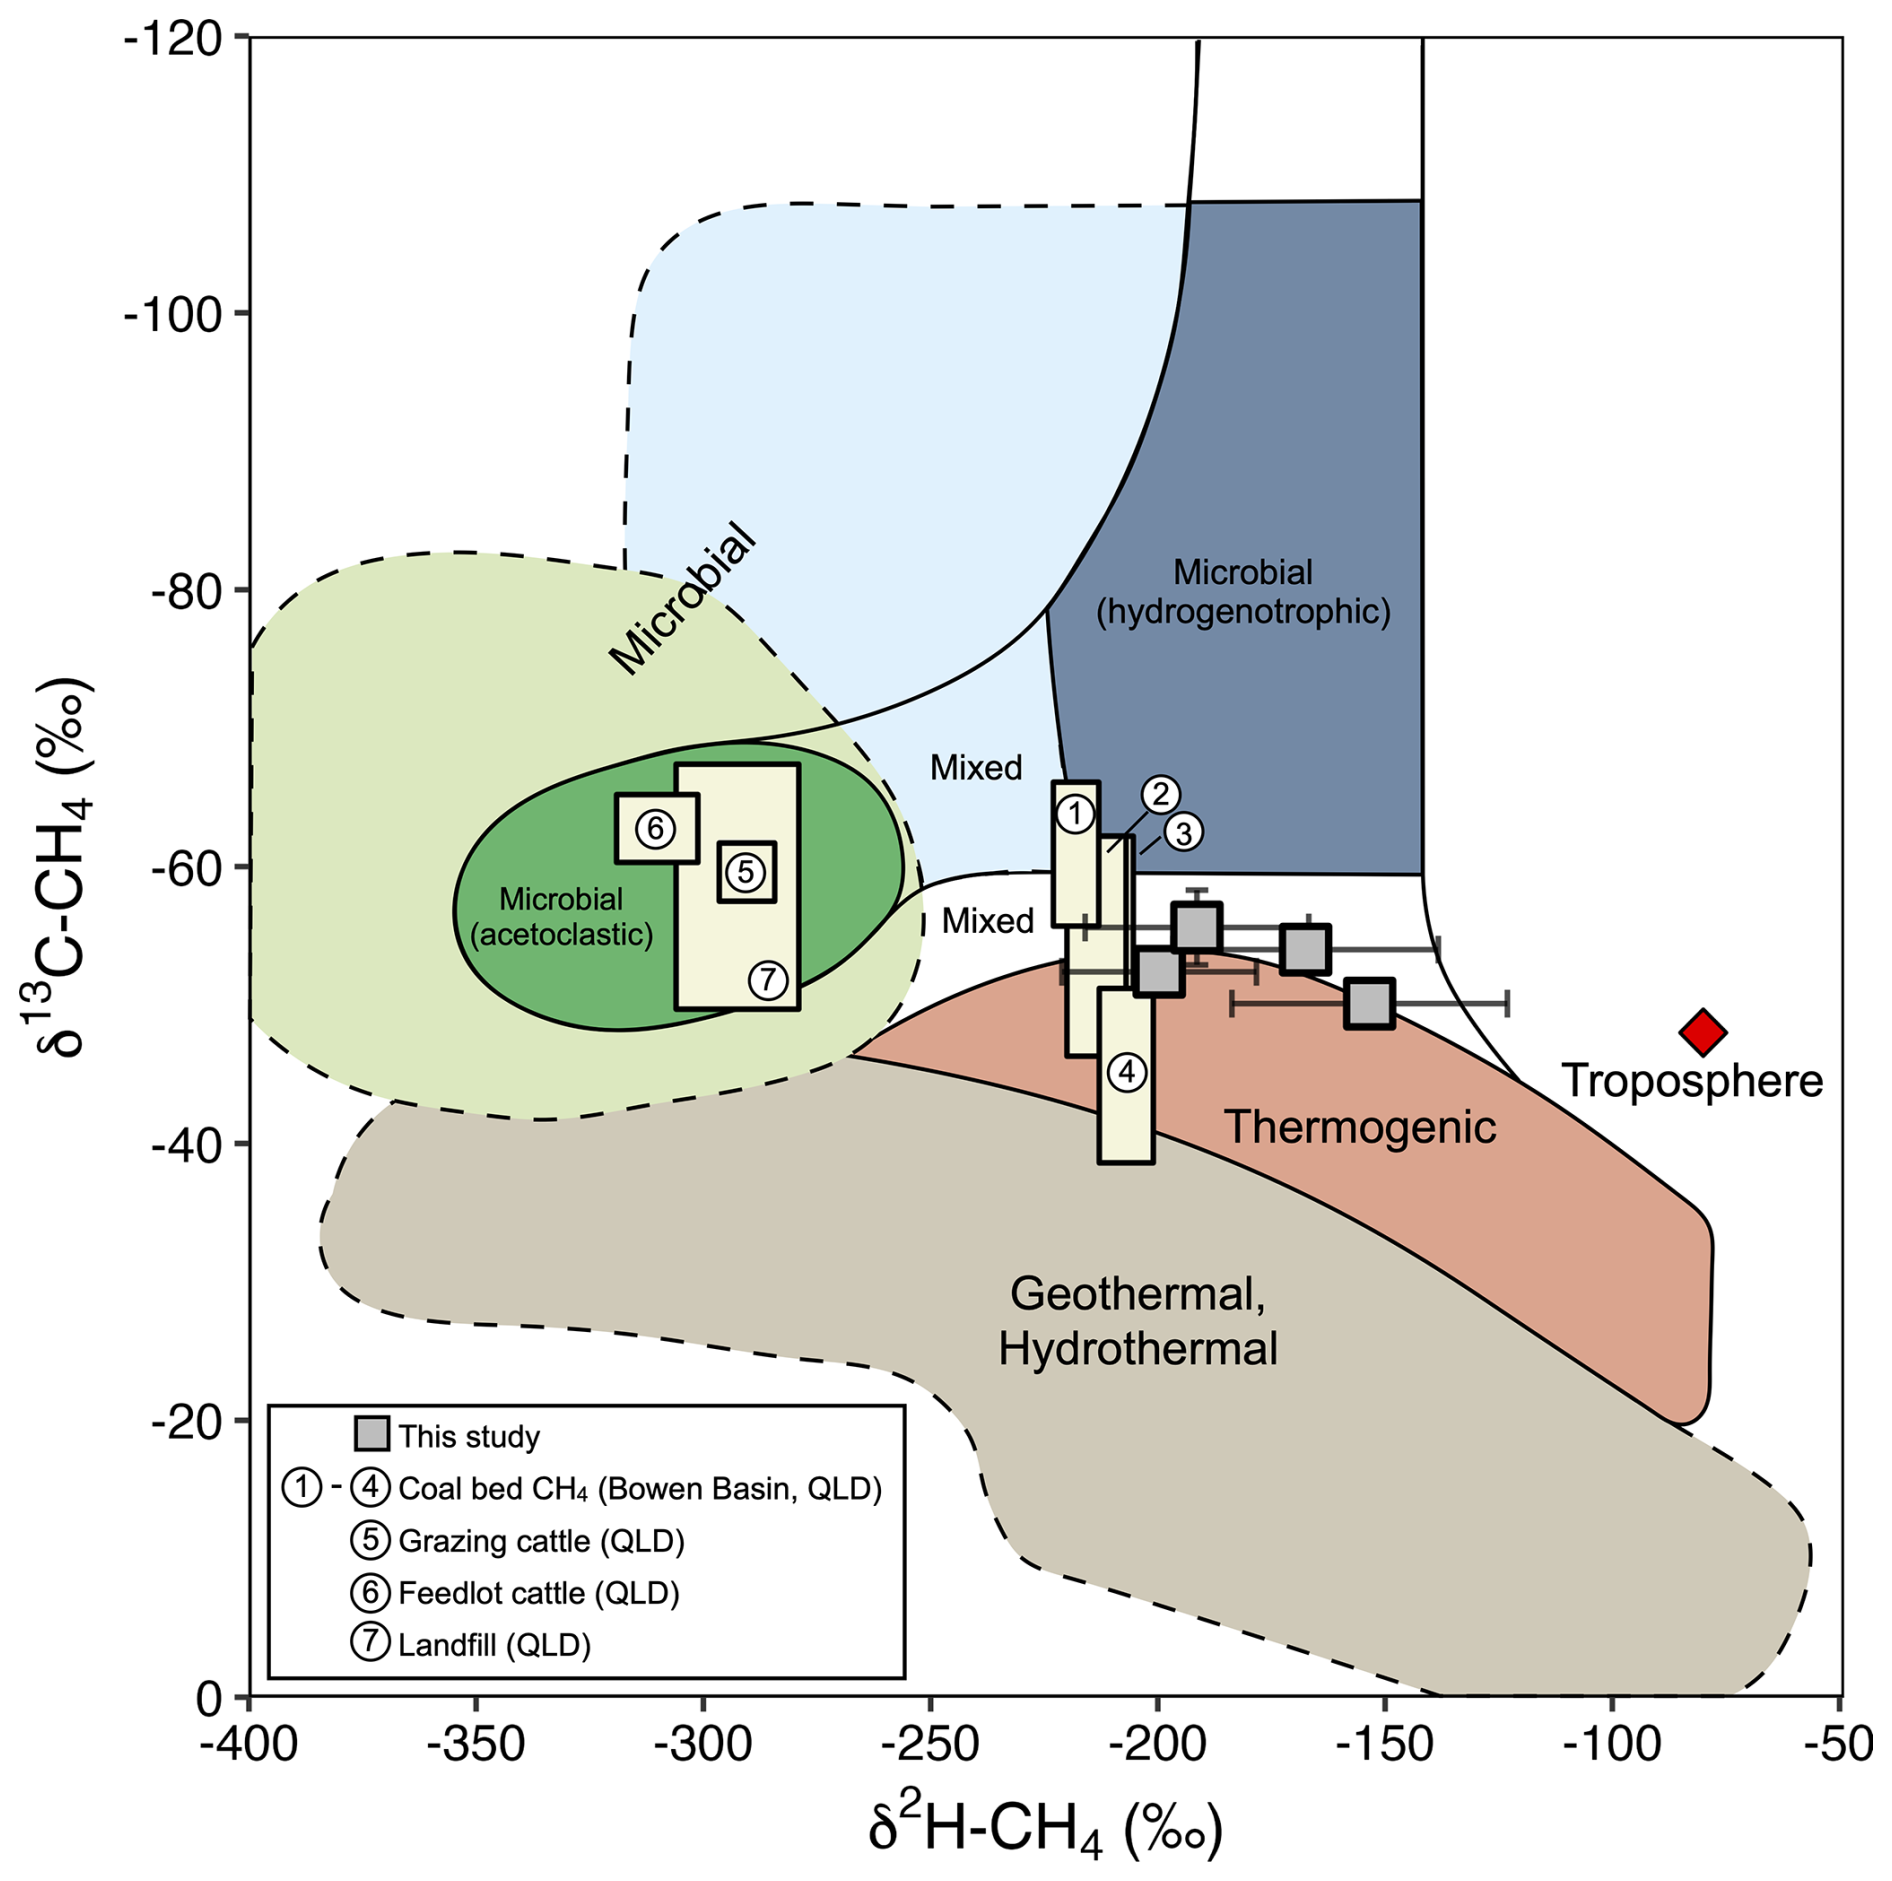
Figure 9δ13C-CH4 vs δ2H-CH4 plot after Whiticar (1990) and Haghnegahdar et al. (2023). Coal bed CH4 data from the Bowen Basin are from Golding et al. (2013; labelled 1), Hamilton et al. (2020; labelled 2), Kinnon et al. (2010; labelled 3) and Draper and Boreham (2006; labelled 4). CH4 isotopic signatures from grazing cattle (labelled 5), feedlot cattle (labelled 6) in Queensland are taken from Lu et al. (2021). CH4 isotopic signatures from landfill (labelled 7) are taken from Obersky et al. (2018). Error bars represent the 95 % CI bounds on the Keeling plot intercept.
4.1 Implications for bottom-up reporting of coal mine CH4 in the Bowen Basin, Australia and globally
The two aircraft used in this study quantified 17 coal mines, representing approximately 36 % of the 47 total Bowen Basin coal mines. Quantifications covered a range of underground, open-cut, and mine complex facilities, providing good operational coverage across the region. Given that the Bowen Basin accounts for roughly 45 % of Australia's coal production, this study encompassed a substantial portion of national coal mining activity. While the applicability of the open-cut coal mine results to other coal basins with different geological conditions requires further investigation, if representative, they have broader implications for reporting fugitive coal mine CH4 emissions in Australia's national inventory and for meeting obligations under the Global Methane Pledge and Paris Agreement (UNFCCC, 2015), particularly since open-cut mines account for 80 % of production across the country (Geoscience Australia, 2025).
The results reveal a clear distinction in biases between airborne and operator estimates of fugitive CH4 emissions for underground and open-cut coal mines in the Bowen Basin. For the case of underground coal mines (Group 1), the bias between individual airborne and operator estimates is small and non-significant (Table 2), and within the uncertainties of airborne quantifications. The lack of bias is confirmed at the aggregate level, with total emissions measured across all quantified underground coal mines agreeing within 8.3 % between operator-reported and airborne estimates (Table 3). Extending the dataset to include mine complexes and multi-facility estimates, where coal was predominantly produced via underground methods, further supports this finding, with aggregated estimates agreeing within 1.4 % (Group 5, Table 3). Collectively, these results provide statistically supported evidence of agreement between airborne estimates and operator-reported emissions derived using NGER Method 4, increasing confidence in both the airborne and inventory-based approaches.
In contrast, the large and statistically significant bias observed between airborne and operator estimates for open-cut coal mines (Group 2) is particularly relevant given that these mines account for approximately 85 % of production in the Bowen Basin (Queensland Government, 2025a; S1), which itself represents roughly 45 % of Australia's coal production, equivalent to roughly 38 % nationally. The facility-level proportional bias indicates the gap between measured and reported emission rates increases with emission magnitude (Table 2; Fig. 7), and aggregated measured emissions being multiples larger than reported estimates suggests fundamental methodological disagreement rather than random quantification variability (Table 3). This bias is confirmed regardless of the NGER reporting method applied (as evidenced through Group 3 and 4 results), as well as across the wider number of sampled mines where coal production predominantly occurs via open-cut methods (as evidenced through Group 6 results). Furthermore, the positive biases in Group 2 remained statistically significant after exclusion of the data presented in Borchardt et al. (2025), indicating that reporting biases for open-cut coal mines in the basin extend beyond the mine considered in that study. Considered collectively, this suggests that coal-core emission factor-based approaches (NGER Methods 1 and 2) do not yield good agreement between top-down and bottom-up estimates.
The reliability of the aircraft-based quantifications in this study is supported on two levels. First, direct comparison of quantifications from three facilities measured by both aircraft showed no systematic bias and strong linear correlation (Fig. 8), demonstrating consistency across two independent airborne methods. Second, the close agreement between operator estimates and airborne estimates for underground operations, where direct monitoring is employed under NGER Method 4, indicates the aircraft quantifications can produce good agreement with bottom-up reporting methods derived from direct atmospheric measurement.
While the data presented here provide strong evidence supporting the Australian Government's phase-out of Method 1 for reporting fugitive CH4 emissions from open-cut coal mines, bias was also observed in facilities using Method 2 (Tables 2 and 3). This suggests that higher-tier, mine-specific emission factor approaches (consistent with an IPCC Tier 3 approach) also exhibit systematic differences from airborne quantifications; though to a lesser extent than Method 1's regional emission factor approach (consistent with an IPCC Tier 2 approach). These findings reinforce the Australian Government's ongoing review of Method 2 reporting guidelines (Australian Government, 2024), indicating that improvements including, but not limited to, coal core gas sampling procedures, borehole spatial distribution requirements and gas content modelling approaches may be needed to reduce systematic biases in open-cut emission reporting.
Another notable finding was that mean atmospheric EIs based on aircraft quantifications in this study are similar between surface (5.6±4.2 kg CH4 t−1 ROM) and underground (5.4±2.7 kg CH4 t−1 ROM) coal mines (Table 4). Despite the high variability among open-cut EIs, the comparability between underground and open-cut mines suggests that mine type alone may not be a reliable proxy for CH4 EI. While underground mines are conventionally assumed to emit more CH4 due to greater depths and associated gas contents (IPCC, 2006), many modern open-cut operations extend to substantial depths where coal seams may retain significant gas content consistent with Langmuir-type gas adsorption behaviour (e.g., Kholod et al., 2020). The similarity in EI observed here therefore likely reflects overlapping depth and gas-content ranges between mine types, rather than a breakdown of the underlying gas adsorption model. Additional microbial CH4 contributions may also occur at some mines, consistent with the thermogenic to mixed-thermogenic isotopic signatures observed in available isotope samples (Table 5 and Fig. 9). The discrepancy between aircraft-derived and operator-reported emissions for open-cut mines in the Bowen Basin therefore further underscores the need for careful implementation of emission factor-based methods and independent verification to ensure national inventories accurately reflect actual CH4 emission rates.
Within a global context, the limitations observed herein for Australia's CH4 inventory methods for surface mining may also be relevant to emissions reporting in other major coal-producing countries, including the United States, China, India, and Russia, where similar IPCC Tier 2 approaches are currently used or Tier 3 methods are under consideration (UNECE, 2021). By contrast, Tier 3 direct measurement approaches for underground mines, as demonstrated here for Australia and supported by United States studies using Carbon Mapper aircraft-based remote sensing surveys (Penn, 2025) and Polish studies using HELiPOD (Förster et al., 2025), show consistent agreement between measurement-based estimates and inventory-based reporting frameworks across regions.
4.2 Factors influencing airborne measurement and interpretation of coal mine CH4
4.2.1 Attribution of quantified CH4 emissions to individual coal mine facilities
Attribution of the measured airborne emission rates to the 17 coal mines was supported by four key lines of evidence. First, the observed plumes were located downwind of the attributed coal mines. The in-situ aircraft provided continuous, high-resolution measurements of wind speed and direction, which were used to identify upwind CH4 sources on a curtain-by-curtain basis for both open-cut and underground coal mines. Attribution of emissions relied on relatively consistent wind directions throughout each quantification, and curtains that violated this requirement were excluded from the analysis (see S5). For the remote sensing aircraft, when plumes were located downwind of both open-cut and underground mines, wind direction was estimated using ECMWF ERA5 modelled winds. These generally aligned with both in-situ aircraft wind measurements (Fig. 8b) and visual observations from column anomaly maps. Plumes measured directly overhead of an open-cut or underground coal mine could be confidently attributed to specific mine infrastructure or locations within a mining pit void.
Second, the estimated median contribution of upwind non-coal sources was only 1.4 % of the quantified emission rates made by the in-situ aircraft, which was approximately 15 times smaller than the median individual quantification uncertainty (Sect. 3.3). This estimation is also conservative, given that non-coal CH4 emissions were estimated upwind of the entire extent of the in-situ curtains, not just the areas upwind of the detected plume(s). When performed, upwind flight legs showed no detectable CH4 enhancements, indicating that upwind emissions were below the aircraft's detection limits. Similarly, plumes quantified by the remote sensing aircraft visually showed no upwind sources, and exemplary upwind fluxes computed in Sect. 3.3 were roughly four times smaller than the aircraft's representative quantification uncertainty. Thus, even accounting for potential systematic errors in the non-coal inventory, the typical contribution of non-coal sources would likely be too small to meaningfully influence the airborne quantifications.
Third, both aircraft quantification methods used local background concentrations of CH4 measured directly on either side of the plume(s) to isolate CH4 enhancements. This background subtraction removed widespread regional elevations arising from upwind sources during the quantification procedures. Diffuse CH4 emissions from sources such as grazing cattle and farm dams rapidly dilute in the atmosphere (due to their low source strength) and are incorporated into the background signal, which serves as the baseline for deriving plume enhancements. These approaches ensure that only discrete CH4 sources with emission rates exceeding the instrument detection threshold are included in the emission rate estimate. While a diffuse, non-coal CH4 source located very close to a curtain and immediately downwind of a target coal mine could be partially incorporated into the plume signal, emission rates from such sources are typically orders of magnitude lower than those from coal mines (Fig. 2b) and are therefore unlikely to have any impact exceeding the estimated quantification uncertainty of the airborne quantifications.
Fourth, dual isotopic signatures from the in-situ measurements for which isotope samples were collected pointed to a thermogenic to mixed-thermogenic coal CH4 source, aligning with previously reported coal mine CH4 signatures for the Bowen Basin (Fig. 9). These isotopic signatures are incompatible with microbial sources of CH4 such as those from cattle and farm dams, providing further evidence that their impact on these quantifications is unlikely to be significant.
4.2.2 Temporal variability of coal mine CH4 emissions
Comparing instantaneous airborne quantifications with annual mean operator-reported emission rates introduces uncertainty due to temporal variability in coal mine emissions. Coal mine CH4 emissions are expected to fluctuate with changes in extraction rates, blasting activity, barometric pressure, rainfall and overburden removal. For verification of individual facility reporting, finer temporal comparisons down to the hour or day would enable more accurate comparisons across bottom-up and top-down data (e.g., Förster et al., 2025). In this study, such comparisons were not possible, so comparisons were made to mean annual emission rates to match the timeframe of the airborne quantifications.
Despite this limitation, airborne estimates from underground mines showed no statistically significant systematic bias relative to operator-reported annual averages, even though the number of individual quantifications per facility was limited (1–3 for the in-situ aircraft and 1–11 for the remote sensing aircraft; Table 2). This agreement is noteworthy given the documented temporal variability in underground coal mine CH4 emission rates (Förster et al., 2025; Karacan et al., 2011, 2024, 2025; Swolkień et al., 2022; Qin et al., 2024). Measured flux rates and in-mine flux data reported by Förster et al. (2025) indicate temporal coefficients of variation on the order of 10 % to 30 % for underground emissions, while shaft-scale CH4 fluxes in Swolkień et al. (2022) show coefficients of variation from about 11 % to 106 % (median ≈25 %, mean ≈31 %; n=15). In this context, the observed NRMSE of ∼20 % relative to operator data for underground mines (Table 2) falls within the range expected given the documented temporal variability of emissions from underground coal mines and the estimated uncertainties of the airborne methods applied in this study. This level of agreement across multiple facilities demonstrates that airborne quantification can reliably characterise underground mine emissions despite sparse temporal sampling.
Moreover, the approach of aggregating estimates across multiple facilities allowed random errors from quantification uncertainty and stochastic temporal variability to cancel, revealing systematic patterns in reporting performance across the population of sampled mines in the region. Aggregated estimates from underground mines in this study showed close quantitative agreement with operator estimates (Table 3). In contrast, aggregated comparisons for open-cut mines revealed a substantial absolute difference (37 t h−1 CH4), exceeding the estimated 1σ uncertainty of the total airborne estimate (±3.4 t h−1 CH4) by an order of magnitude. Although temporal variations in open-cut emissions remain poorly characterised, the magnitude of this aggregate difference far exceeds the measurement uncertainty. Even if open-cut mines exhibit substantially higher temporal variability than underground mines, the aggregation across 10 facilities should reduce the contribution of random temporal fluctuations to aggregate totals, as demonstrated for underground mines where no aggregate bias was detected. The scale of the observed discrepancy for open-cut mines therefore suggests systematic reporting bias as the most plausible explanation.
It is acknowledged that further research is needed to determine how many individual top-down quantifications are required to adequately capture annual emission variability for individual facility characterisation across both underground and open-cut mines. In regional assessments such as this study, where estimates are aggregated across multiple facilities, sparse temporal sampling per facility has less impact on aggregate accuracy due to error cancellation. Enhancing operator reporting transparency by reporting emissions on shorter timescales than the current annual reports would facilitate more direct comparisons with all top-down quantification approaches, not only airborne methods. Higher temporal resolution emission data (e.g., monthly, weekly, or daily) may be used by operators under Method 2 and Method 4 to derive annual estimates; however, under the NGER scheme, emissions are collected and reported on an annual basis. Incorporating additional long-term continuous measurements, such as regional ground-based tall monitoring networks and EM27/SUN networks (e.g., Luther et al., 2022), provided they can quantify emissions from individual or groups of coal mines, would enable more reliable characterisation of temporal emissions variability and further validation of finer resolution verification approaches for annual emissions reporting. Similarly, the implementation of within-pit measurement systems could offer essential reference data for evaluating and refining out-of-pit top-down quantification methods, particularly in relation to temporal variability in emissions and assessing in-pit wind conditions.
4.2.3 Impact of surface mine terrain on airborne approaches
Surface mines have non-uniform terrain, which can change rapidly throughout the year depending on the mining production rates, mine design changes and management of waste earth materials such as overburden. These waste materials are commonly placed in spoil piles adjacent to the pit or backfilled into mined-out areas, which can alter within-pit wind fields (Kia et al., 2021). Moreover, the pit itself, which can be more than 100–200 m deep, can form a topographic low susceptible to within-pit pooling of atmospheric gases. Therefore, the impact of the interplay of meteorology and topography on top-down quantifications from open-cut coal mines should be assessed.
In this study, quantifications were performed in the afternoon, when the convective mixing layer height was typically highest and most stable. Acquiring quantifications during this period helped minimise the potential influence of residual CH4 that may have accumulated overnight within the nocturnal boundary layer, as such air masses were likely to be diluted or transported downwind by this time of day. The mean wind speed across all in-situ curtains included in the analysis was 5.5±2.5 m s−1 (±1σ; median = 5.1, range = 2.3–8.9 m s−1), and 5.2±1.8 m s−1 (±1σ median = 5.2, range = 2.1–7.8 m s−1) for plumes quantified by the remote sensing aircraft. The mean convective mixed-layer height used in the analysis of each in-situ curtain was 2090±280 m a.g.l. (±1σ; median = 2138, range = 1625–2500 m a.g.l.). These conditions likely minimised the possibility of within-pit accumulation of CH4 and were broadly conducive to effective plume transport out of mine pits, thereby supporting the representativeness of the emission rate estimates used in the bias analysis.
Another key benefit of the two airborne approaches used in this study was that all open-cut mine quantifications were based on measurements taken outside the exposed pit. In-situ aircraft curtains were flown ∼0.1–20 km downwind of exposed pits (mean 6.4 km downwind), reducing the potential influence of disturbed wind fields within the mine void. Similarly, all remote sensing aircraft quantifications of open-cut mines used in the NGER method evaluation were based on flight legs roughly 0.1–15 km downwind. Although the remote sensing aircraft could, and in some cases did, detect and quantify column anomalies directly within the pit, these data were excluded because a coherent downwind flow could not be guaranteed (e.g., see Kia et al., 2021) and/or plume signals were diluted below the MAMAP2DL detection threshold. In total, 22 plumes detected within open-cut pits were not quantified for these reasons (S7). Measuring from the far-field ensured that plumes were more likely to be well mixed through the convective layer, reducing the influence of local topographic effects on plume structure.
While the mine topography could significantly affect the emissions profile at the ground surface, the median impact of changing the extrapolation of emissions to the ground by ±50 % for the in-situ aircraft quantifications was small (±3 %; S5). This suggests that ground-level extrapolation was not a major source of uncertainty in the in-situ aircraft quantifications. The effects of topography, which could distort the vertical profile of emitted CH4, were also considered in the uncertainty budget for the remote sensing quantifications but were less critical because the entire column was measured from top to bottom. A change in topography of 50 m, such as from a spoil pile, would result in an offset of approximately 0.065 % in the retrieved column anomaly, since this type of variation is not explicitly accounted for during the retrieval process (S5). Compared to the 0.4 % noise level of the retrieved column anomalies, this effect is negligible. Additionally, surface structures that could obscure the measurement, such as water bodies (causing abnormally low signal levels) or highly reflective surfaces (causing abnormally high signals), were filtered out during the column retrieval. Measurements were excluded when the retrieval fit did not meet quality standards, meaning the model could not adequately explain the data and residuals were too large. Overall, approximately 6 % of the collected ground scenes were excluded due to these criteria.
Two aircraft-based approaches were used to quantify the rate of CH4 emissions from 17 coal mines in the Bowen Basin. The consistency between top-down airborne estimates and bottom-up mean annual emission rates reported under Australia's NGER scheme were then evaluated. When compared with bottom-up estimates at both the facility- and aggregate-levels, airborne estimates from underground mines showed non-significant bias and good agreement with reported mean annual emission rates. This agreement increases confidence in the estimates produced by both methods and supports Australia's current Tier 3 direct monitoring approaches for underground mines. In contrast, results from surface (open-cut) mines showed statistically significant positive bias at the aggerate-level. When considering all open-cut mines combined, measured emissions were 3.6 times bottom-up totals, increasing to 5.8 times for Method 1 alone. For Method 2, aggregate measured emissions were approximately 2.5 times bottom-up totals. Facility-level results also indicated a consistent positive bias, although not all groups reached statistical significance, with Method 2 in particular not achieving statistical significance. This is likely a consequence of limited sample size, rather than providing evidence of no bias. Overall, results suggest current Tier 2 and 3 coal core-based methods approaches are unsuitable for estimating CH4 emissions from open-cut mines. The contrast between surface and underground reporting methods was consistent when estimates from mine complexes were included in the bias assessment, and when data were stratified according to the proportion of underground extraction. Noting that surface mines in the Bowen Basin alone account for ∼38 % of national coal production, the contribution of coal mining to Australia's fugitive CH4 emissions may exceed the reported ∼19 % (DCCEEW, 2026).
These findings support the Australian Government's current phase-out of NGER Method 1 (consistent with an IPCC Tier 2 approach) for open-cut mines and reinforce the need for continued improvements in reporting guidelines for higher-tier NGER Methods 2 and 3 in Australia (consistent with an IPCC Tier 3 approach). Furthermore, the similarity in emissions intensities between underground and surface mines in the Bowen Basin suggests that mine type alone may not be a reliable proxy for CH4 emissions intensity, underscoring the importance of accurate facility-level measurement to ensure national inventories reflect actual CH4 emission rates. Within a global context, findings from the Bowen Basin highlight that IPCC Tier 2 and 3 inventory methods for surface mining require careful implementation and independent verification, while the observed agreement for underground operations is consistent with existing evidence from measurement-based Tier 3 approaches applied in underground mines.
Atmospheric measurement data from the in-situ aircraft can be downloaded at: https://doi.org/10.5281/zenodo.16992959 (Hacker, 2026). The CH4 column anomalies for each flight leg retrieved from MAMAP2DL spectral data onboard the remote sensing aircraft can be downloaded at: https://doi.org/10.5281/zenodo.18300535 (Krautwurst and Borchardt, 2026).
The supplement related to this article is available online at https://doi.org/10.5194/acp-26-10043-2026-supplement.
H.B. and J.H. conceptualised the study. S.J.H., S.K. and J.H. wrote the manuscript. B.F.J.K provided background policy and geological context to support the interpretation and discussion. S.J.H. developed the UNSW inventory in consultation with B.F.J.K. S.K., J.B., K.G., O.H., M.K., J.S. and A.M. served as instrument operators and/or performed flight planning activities for the remote sensing aircraft. S.K., J.B. and O.H. performed the analysis of the MAMAP2D-Light dataset. J.H. and S.C. served as instrument operators and performed flight planning activities for the in-situ aircraft. M.B. assisted with ground activities related to bag sample collection. S.J.H., J.H., M. Lunt and M.B. performed the analysis of the in-situ aircraft dataset. W.J. developed the bag sampler fitted on the in-situ aircraft. R.E.F., J.L.F., M. Lanoisellé, T.R. and C.V. performed isotopic analysis of bag samples acquired by the in-situ aircraft. All authors reviewed the manuscript and assisted in shaping the analyses.
The contact author has declared that none of the authors has any competing interests.
Publisher's note: Copernicus Publications remains neutral with regard to jurisdictional claims made in the text, published maps, institutional affiliations, or any other geographical representation in this paper. The authors bear the ultimate responsibility for providing appropriate place names. Views expressed in the text are those of the authors and do not necessarily reflect the views of the publisher.
This research was funded in the framework of UNEP's International Methane Emissions Observatory (IMEO). S.J.H. acknowledges funding from UNSW Philanthropy which contributed to their time on this research. The Airborne Research Australia (ARA) Dimona research motor glider was donated by the late Joyce Schultz of Adelaide. ARA has been substantially supported by the Hackett Foundation, Adelaide. The MAMAP2D-Light instrument concept is based on developments supported by the Deutsche Forschungsgemeinschaft (DFG) and was built using funds from the University and State of Bremen, Germany, and the Bundesministerium für Forschung, Technologie und Raumfahrt (BMFTR)-funded project AIRSPACE. Data analyses of MAMAP2D-Light data were also supported in parts by the University and State of Bremen, the DFG within its Priority Programme SPP 1294, the BMFTR-funded project ITMS TEGAD and the European Space Agency.
This research has been supported by the Bundesministerium für Forschung, Technologie und Raumfahrt (BMFTR, grant nos. 01LK1701B, 01LK2311), the Deutsche Forschungsgemeinschaft (DFG, grant no. BO 1731/2-1, FUGG INST 144/437-1), and the European Space Agency (ESA/ESTEC, grant no. 4000141036/23/NL/FF).
The article processing charges for this open-access publication were covered by the University of Bremen.
This paper was edited by Eric Kort and reviewed by Grant Allen and Magdalena Pühl.
Amini, S., Kuwayama, T., Gong, L., Falk, M., Chen, Y., Mitloehner, Q., Weller, S., Mitloehner, F. M., Patteson, D., Conley, S. A., and Scheehle, E.: Evaluating California dairy methane emission factors using short-term ground-level and airborne measurements, Atmos. Environ.: X, 14, 100171, https://doi.org/10.1016/j.aeaoa.2022.100171, 2022.
Arias, P., Bellouin, N., Coppola, E., Jones, R., Krinner, G., Marotzke, J., Naik, V., Palmer, M., Plattner, G. K., Rogelj, J., and Rojas, M.: Climate Change 2021: the physical science basis, Contribution of Working Group I to the Sixth Assessment Report of the Intergovernmental Panel on Climate Change, technical summary, https://www.ipcc.ch/report/ar6/wg1/ (last access: 24 July 2025), 2021.
Australian Government: National Greenhouse and Energy Reporting (Measurement) Determination 2008, Compilation No. 18, Federal Register of Legislation, https://www.legislation.gov.au/F2008L02309/latest/text (last access: 24 August 2025), 2008.
Australian Government: National Greenhouse and Energy Reporting (Safeguard Mechanism) Rule 2015, Compilation No. 13, Federal Register of Legislation. https://www.legislation.gov.au/F2015L01637/latest/text (last access: 24 July 2025), 2015.
Australian Government: National Inventory Report 2020 – The Australian Government Submission to the United Nations Framework Convention on Climate Change, Department of Industry, Science, Energy and Resources, https://www.dcceew.gov.au/sites/default/files/documents/national-inventory-report-2020-volume-1.pdf (last access: 24 August 2025), 2022.
Australian Government: Australian Government response to the Climate Change Authority's 2023 Review of the National Greenhouse and Energy Reporting legislation, https://www.dcceew.gov.au/sites/default/files/documents/government-response-cca-nger-review.pdf (last access: 27 August 2024), 2024.
Australian Government: National Inventory Report 2023, Volume I, Department of Climate Change, Energy, the Environment and Water, https://www.dcceew.gov.au/sites/default/files/documents/national-inventory-report-2023-volume-1.pdf (last access: 13 August 2025), 2025a.
Australian Government: National Inventory Report 2023, Volume II, Department of Climate Change, Energy, the Environment and Water, https://www.dcceew.gov.au/sites/default/files/documents/national-inventory-report-2023-volume-2.pdf (last access: 23 January 2026), 2025b.
Borchardt, J., Harris, S. J., Hacker, J. M., Lunt, M., Krautwurst, S., Bai, M., Bösch, H., Bovensmann, H., Burrows, J. P., Chakravarty, S., Field, R. A., Gerilowski, K., Huhs, O., Junkermann, W., Kelly, B. F. J., Kumm, M., Lieff, W., McGrath, A., Murphy, A., Schindewolf, J., and Thoböll, J.: Insights into Elevated Methane Emissions from an Australian Open-Cut Coal Mine Using Two Independent Airborne Techniques, Environ. Sci. Technol. Lett., 12, 397–404, https://doi.org/10.1021/acs.estlett.4c01063, 2025.
Brain, T., Harris, S. J., and Kelly, B. F. J.: Submission to National Greenhouse and Energy Reporting (NGER) Scheme 2025 Public Consultation Re: Review of Method 2 for estimating fugitive emissions from open-cut coal mines, https://consult.dcceew.gov.au/national-greenhouse-and-energy-reporting-nger-scheme/new-survey/view/53 (last access: 12 February 2026), 2025.
Brass, M. and Röckmann, T.: Continuous-flow isotope ratio mass spectrometry method for carbon and hydrogen isotope measurements on atmospheric methane, Atmos. Meas. Tech., 3, 1707–1721, https://doi.org/10.5194/amt-3-1707-2010, 2010.
Burra, A. and Esterle, J.: Guidelines for the Implementation of NGER Method 2 or 3 for Open Cut Coal Mine Fugitive GHG Emissions Reporting (C20005) and Technical Discussion of the Implementation of NGER Method 2 or 3 for Open Cut Coal Mine Fugitive GHG Emissions Reporting (C20005A), Final Report ACARP C20005, Brisbane, Australia, ACARP (Australian Coal Industry Research Program), https://www.acarp.com.au/abstracts.aspx?repId=C20005 (last access: 14 August 2024), 2011.
Cambaliza, M. O. L., Shepson, P. B., Caulton, D. R., Stirm, B., Samarov, D., Gurney, K. R., Turnbull, J., Davis, K. J., Possolo, A., Karion, A., Sweeney, C., Moser, B., Hendricks, A., Lauvaux, T., Mays, K., Whetstone, J., Huang, J., Razlivanov, I., Miles, N. L., and Richardson, S. J.: Assessment of uncertainties of an aircraft-based mass balance approach for quantifying urban greenhouse gas emissions, Atmos. Chem. Phys., 14, 9029–9050, https://doi.org/10.5194/acp-14-9029-2014, 2014.
CCA: 2023 review of the National Greenhouse and Energy Reporting legislation, Climate Change Authority, https://www.climatechangeauthority.gov.au (last access: 14 August 2024), ISBN: 978-0-6486349-9-7, 2023.
CER: Estimating emissions and energy from coal mining guideline, Australian Government, 64 pp., https://cer.gov.au/document/estimating-emissions-and-energy-coal-mining-guideline (last access: 19 January 2026), 2025a.
CER: 2023–24 baselines and emissions data, Australian Government, https://cer.gov.au/markets/reports-and-data/safeguard-data/2023-24-baselines-and-emissions-data (last access: 19 January 2026), 2025b.
CER: Safeguard Mechanism, Australian Government, https://cer.gov.au/schemes/safeguard-mechanism, last access: 24 April 2026.
Chulakadabba, A., Sargent, M., Lauvaux, T., Benmergui, J. S., Franklin, J. E., Chan Miller, C., Wilzewski, J. S., Roche, S., Conway, E., Souri, A. H., Sun, K., Luo, B., Hawthrone, J., Samra, J., Daube, B. C., Liu, X., Chance, K., Li, Y., Gautam, R., Omara, M., Rutherford, J. S., Sherwin, E. D., Brandt, A., and Wofsy, S. C.: Methane point source quantification using MethaneAIR: a new airborne imaging spectrometer, Atmos. Meas. Tech., 16, 5771–5785, https://doi.org/10.5194/amt-16-5771-2023, 2023.
Cusworth, D. H., Duren, R. M., Thorpe, A. K., Tseng, E., Thompson, D., Guha, A., Newman, S., Foster, K. T., and Miller, C. E.: Using remote sensing to detect, validate, and quantify methane emissions from California solid waste operations, Environ. Res. Lett., 15, 054012, https://doi.org/10.1088/1748-9326/ab7b99, 2020.
Dasgupta, B., Menoud, M., van der Veen, C., Levin, I., Veidt, C., Moossen, H., Englund Michel, S., Sperlich, P., Morimoto, S., Fujita, R., Umezawa, T., Platt, S., Zwaaftink, C. G., Myhre, C. L., Fisher, R., Lowry, D., Nisbet, E. G., France, J., Woolley Maisch, C., Brailsford, G., Moss, R., Goto, D., Pandey, S., Houweling, S., Warwick, N., and Röckmann, T.: Harmonisation of methane isotope ratio measurements from different laboratories using atmospheric samples, Atmos. Meas. Tech., 18, 6591–6607, https://doi.org/10.5194/amt-18-6591-2025, 2025.
DCCEEW: Australia's National Greenhouse Accounts, Paris Agreement Inventory, https://www.greenhouseaccounts.climatechange.gov.au/, last access 16 January 2026.
Draper, J. J. and Boreham, C. J.: Geological controls on exploitable coal seam gas distribution in Queensland, The APPEA Journal, 46, 343–366, https://doi.org/10.1071/AJ05019, 2006.
Duren, R., Cusworth, D., Ayasse, A., Howell, K., Diamond, A., Scarpelli, T., Kim, J., O'neill, K., Lai-Norling, J., Thorpe, A., Zandbergen, S. R., Shaw, L., Keremedjiev, M., Guido, J., Giuliano, P., Goldstein, M., Nallapu, R., Barentsen, G., Thompson, D. R., Roth, K., Jensen, D., Eastwood, M., Reuland, F., Adams, T., Brandt, A., Kort, E. A., Mason, J., and Green, R. O.: The Carbon Mapper emissions monitoring system, Atmos. Meas. Tech., 18, 6933–6958, https://doi.org/10.5194/amt-18-6933-2025, 2025.
El Abbadi, S. H., Chen, Z., Burdeau, P. M., Rutherford, J. S., Chen, Y., Zhang, Z., Sherwin, E. D., and Brandt, A. R.: Technological maturity of aircraft-based methane sensing for greenhouse gas mitigation, Environ. Sci. Technol., 58, 9591–9600, https://doi.org/10.1021/acs.est.4c02439, 2024.
Energy Institute: Statistical Review of World Energy, 76 pp., https://www.energyinst.org/statistical-review, last access: 24 August 2025.
European Commission and United States Government: Global Methane Pledge, https://www.globalmethanepledge.org/sites/default/files/documents/2023-11/Global Methane Pledge.pdf (last access: 10 July 2023), 2023.
Fiehn, A., Kostinek, J., Eckl, M., Klausner, T., Gałkowski, M., Chen, J., Gerbig, C., Röckmann, T., Maazallahi, H., Schmidt, M., Korbeń, P., Neçki, J., Jagoda, P., Wildmann, N., Mallaun, C., Bun, R., Nickl, A.-L., Jöckel, P., Fix, A., and Roiger, A.: Estimating CH4, CO2 and CO emissions from coal mining and industrial activities in the Upper Silesian Coal Basin using an aircraft-based mass balance approach, Atmos. Chem. Phys., 20, 12675–12695, https://doi.org/10.5194/acp-20-12675-2020, 2020.
Fisher, R., Lowry, D., Wilkin, O., Sriskantharajah, S., and Nisbet, E. G.: High-precision, automated stable isotope analysis of atmospheric methane and carbon dioxide using continuous-flow isotope-ratio mass spectrometry, Rapid Commun. Mass Spectrom., 20, 200–208, https://doi.org/10.1002/rcm.2300, 2006.
Förster, E., Huntrieser, H., Lichtenstern, M., Pätzold, F., Bretschneider, L., Schlerf, A., Bollmann, S., Lampert, A., Nęcki, J., Jagoda, P., Swolkień, J., Pasternak, D., Field, R. A., and Roiger, A.: A helicopter-based mass balance approach for quantifying methane emissions from industrial activities, applied for coal mine ventilation shafts in Poland, Atmos. Meas. Tech., 18, 7153–7176, https://doi.org/10.5194/amt-18-7153-2025, 2025.
France, J. L., Bateson, P., Dominutti, P., Allen, G., Andrews, S., Bauguitte, S., Coleman, M., Lachlan-Cope, T., Fisher, R. E., Huang, L., Jones, A. E., Lee, J., Lowry, D., Pitt, J., Purvis, R., Pyle, J., Shaw, J., Warwick, N., Weiss, A., Wilde, S., Witherstone, J., and Young, S.: Facility level measurement of offshore oil and gas installations from a medium-sized airborne platform: method development for quantification and source identification of methane emissions, Atmos. Meas. Tech., 14, 71–88, https://doi.org/10.5194/amt-14-71-2021, 2021.
Frankenberg, C., Thorpe, A. K., Thompson, D. R., Hulley, G., Kort, E. A., Vance, N., Borchardt, J., Krings, T., Gerilowski, K., Sweeney, C., Conley, S., Bue, B. D., Aubrey, A. D., Hook, S., and Green, R. O.: Airborne methane remote measurements reveal heavy-tail flux distribution in Four Corners region, Proc. Natl. Acad. Sci. USA, 113, 9734–9739, https://doi.org/10.1073/pnas.1605617113, 2016.
Fuentes Andrade, B., Buchwitz, M., Reuter, M., Bovensmann, H., Richter, A., Boesch, H., and Burrows, J. P.: A method for estimating localized CO2 emissions from co-located satellite XCO2 and NO2 images, Atmos. Meas. Tech., 17, 1145–1173, https://doi.org/10.5194/amt-17-1145-2024, 2024.
Gasbarra, D., Toscano, P., Famulari, D., Finardi, S., Di Tommasi, P., Zaldei, A., Carlucci, P., Magliulo, E., and Gioli, B.: Locating and quantifying multiple landfills methane emissions using aircraft data, Environ. Pollut., 254, 112987, https://doi.org/10.1016/j.envpol.2019.112987, 2019.
Geoscience Australia: Australia's Energy Commodity Resources 2024, https://www.ga.gov.au/aecr2024/coal (last access: 24 August 2025), 2024.
Geoscience Australia: Coal, https://www.ga.gov.au/education/minerals-energy/australian-energy-facts/coal (last access: 24 August 2025), 2025.
Golding, S. D., Boreham, C. J., and Esterle, J. S.: Stable isotope geochemistry of coal bed and shale gas and related production waters: A review, Int. J. Coal Geol., 120, 24–40, https://doi.org/10.1016/j.coal.2013.09.001, 2013.
Gordon, M., Li, S.-M., Staebler, R., Darlington, A., Hayden, K., O'Brien, J., and Wolde, M.: Determining air pollutant emission rates based on mass balance using airborne measurement data over the Alberta oil sands operations, Atmos. Meas. Tech., 8, 3745–3765, https://doi.org/10.5194/amt-8-3745-2015, 2015.
Hacker, J. M., Chen, D., Bai, M., Ewenz, C., Junkermann, W., Lieff, W., McManus, B., Neininger, B., Sun, J., Coates, T., and Denmead, T.: Using airborne technology to quantify and apportion emissions of CH4 and NH3 from feedlots, Anim. Prod. Sci., 56, 190–203, https://doi.org/10.1071/AN15513, 2016.
Hacker, J.: Airborne In-Situ-measured GHG emission data from Coal Mines in the Bowen Basin, Queensland, Australia, Sep/Oct 2023, Zenodo [data set], https://doi.org/10.5281/zenodo.16992959, 2026.
Haghnegahdar, M. A., Sun, J., Hultquist, N., Hamovit, N. D., Kitchen, N., Eiler, J., Ono, S., Yarwood, S. A., Kaufman, A. J., Dickerson, R. R., and Bouyon, A.: Tracing sources of atmospheric methane using clumped isotopes, Proc. Natl. Acad. Sci. USA, 120, e2305574120, https://doi.org/10.1073/pnas.2305574120, 2023.
Hamilton, S. K., Golding, S. D., Esterle, J. S., Baublys, K. A., and Ruyobya, B. B.: Controls on gas domains and production behaviour in a high-rank CSG reservoir: insights from molecular and isotopic chemistry of co-produced waters and gases from the Bowen Basin, Australia, Geosci., 10, 74, https://doi.org/10.3390/geosciences10020074, 2020.
Hoerning, S. and Hayes, P.: Measurement of fugitive methane emissions from an abandoned coal exploration hole in Queensland, Australia using a Quantum Gas LiDAR, Sci. Total Environ., 992, 179925, https://doi.org/10.1016/j.scitotenv.2025.179925, 2025.
IPCC: 2006 IPCC Guidelines for National Greenhouse Gas Inventories, Volume 2: Energy, Chapter 4: Fugitive Emissions, https://www.ipcc-nggip.iges.or.jp/public/2006gl/pdf/2_Volume2/V2_4_Ch4_Fugitive_Emissions.pdf (last access: 24 August 2025), 2006.
IPCC: IPCC Expert Meeting on Use of Atmospheric Observation Data in Emission Inventories, edited by: Calvo Buendia, E., Tanabe, K., Enoki, T., Federici, S., Jamsranjav, B., and Shermanau, P., Report of the IPCC Expert Meeting on Use of Atmospheric Observation Data in Emission Inventories, Pub. IGES, Japan, 5–7 September, Geneva, Switzerland, https://www.ipcc-nggip.iges.or.jp/public/mtdocs/pdfiles/2209_AtmObs_Report.pdf (last access: 24 August 2025), 2022.
Karacan, C. Ö., Ruiz, F. A., Cotè, M., and Phipps, S.: Coal mine methane: a review of capture and utilization practices with benefits to mining safety and to greenhouse gas reduction, Int. J. Coal Geol., 86, 121–156, https://doi.org/10.1016/j.coal.2011.02.009, 2011.
Karacan, C. Ö., Field, R. A., Olczak, M., Kasprzak, M., Ruiz, F. A., and Schwietzke, S.: Mitigating climate change by abating coal mine methane: A critical review of status and opportunities, Int. J. Coal Geol., 295, 104623, https://doi.org/10.1016/j.coal.2024.104623, 2024.
Karacan, C. Ö., Irakulis-Loitxate, I., Field, R. A., and Warwick, P. D.: Temporal and spatial comparison of coal mine ventilation methane emissions and mitigation quantified using PRISMA satellite data and on-site measurements, Sci. Total Environ. 975, 179268, https://doi.org/10.1016/j.scitotenv.2025.179268, 2025.
Keeling, C. D.: The concentration and isotopic abundances of carbon dioxide in rural and marine air, Geochim. Cosmochim. Acta, 24, 277–298, https://doi.org/10.1016/0016-7037(61)90023-0, 1961.
Kelly, B. F. J., Lu, X., Harris, S. J., Neininger, B. G., Hacker, J. M., Schwietzke, S., Fisher, R. E., France, J. L., Nisbet, E. G., Lowry, D., van der Veen, C., Menoud, M., and Röckmann, T.: Atmospheric methane isotopes identify inventory knowledge gaps in the Surat Basin, Australia, coal seam gas and agricultural regions, Atmos. Chem. Phys., 22, 15527–15558, https://doi.org/10.5194/acp-22-15527-2022, 2022.
Kholod, N., Evans, M., Pilcher, R. C., Roshchanka, V., Ruiz, F., Coté, M., and Collings, R.: Global methane emissions from coal mining to continue growing even with declining coal production, J. Clean. Prod., 256, 120489, https://doi.org/10.1016/j.jclepro.2020.120489, 2020.
Kia, S., Flesch, T. K., Freeman, B. S., and Aliabadi, A. A.: Atmospheric transport over open-pit mines: The effects of thermal stability and mine depth, J. Wind. Eng. Ind. Aerodyn., 214, 104677, https://doi.org/10.1016/j.jweia.2021.104677, 2021.
Kinnon, E. C. P., Golding, S. D., Boreham, C. J., Baublys, K. A., and Esterle, J. S.: Stable isotope and water quality analysis of coal bed methane production waters and gases from the Bowen Basin, Australia, Int. J. Coal Geol., 82, 219–231, https://doi.org/10.1016/j.coal.2009.10.014, 2010.
Krautwurst, S. and Borchardt, J.: MAMAP2D-Light methane column anomaly maps (NetCDF4 and KMZ) (Version v1.0), Zenodo [data set], https://doi.org/10.5281/zenodo.18300535, 2026.
Krautwurst, S., Gerilowski, K., Jonsson, H. H., Thompson, D. R., Kolyer, R. W., Iraci, L. T., Thorpe, A. K., Horstjann, M., Eastwood, M., Leifer, I., Vigil, S. A., Krings, T., Borchardt, J., Buchwitz, M., Fladeland, M. M., Burrows, J. P., and Bovensmann, H.: Methane emissions from a Californian landfill, determined from airborne remote sensing and in situ measurements, Atmos. Meas. Tech., 10, 3429–3452, https://doi.org/10.5194/amt-10-3429-2017, 2017.
Krautwurst, S., Gerilowski, K., Borchardt, J., Wildmann, N., Gałkowski, M., Swolkień, J., Marshall, J., Fiehn, A., Roiger, A., Ruhtz, T., Gerbig, C., Necki, J., Burrows, J. P., Fix, A., and Bovensmann, H.: Quantification of CH4 coal mining emissions in Upper Silesia by passive airborne remote sensing observations with the Methane Airborne MAPper (MAMAP) instrument during the CO2 and Methane (CoMet) campaign, Atmos. Chem. Phys., 21, 17345–17371, https://doi.org/10.5194/acp-21-17345-2021, 2021.
Krautwurst, S., Fruck, C., Wolff, S., Borchardt, J., Huhs, O., Gerilowski, K., Gałkowski, M., Kiemle, C., Quatrevalet, M., Wirth, M., Mallaun, C., Burrows, J. P., Gerbig, C., Fix, A., Bösch, H., and Bovensmann, H.: Identification and quantification of CH4 emissions from Madrid landfills using airborne imaging spectrometry and greenhouse gas lidar, Atmos. Chem. Phys., 25, 14669–14702, https://doi.org/10.5194/acp-25-14669-2025, 2025.
Krings, T., Gerilowski, K., Buchwitz, M., Hartmann, J., Sachs, T., Erzinger, J., Burrows, J. P., and Bovensmann, H.: Quantification of methane emission rates from coal mine ventilation shafts using airborne remote sensing data, Atmos. Meas. Tech., 6, 151–166, https://doi.org/10.5194/amt-6-151-2013, 2013.
Krings, T., Neininger, B., Gerilowski, K., Krautwurst, S., Buchwitz, M., Burrows, J. P., Lindemann, C., Ruhtz, T., Schüttemeyer, D., and Bovensmann, H.: Airborne remote sensing and in situ measurements of atmospheric CO2 to quantify point source emissions, Atmos. Meas. Tech., 11, 721–739, https://doi.org/10.5194/amt-11-721-2018, 2018.
Lu, X., Harris, S. J., Fisher, R. E., France, J. L., Nisbet, E. G., Lowry, D., Röckmann, T., van der Veen, C., Menoud, M., Schwietzke, S., and Kelly, B. F. J.: Isotopic signatures of major methane sources in the coal seam gas fields and adjacent agricultural districts, Queensland, Australia, Atmos. Chem. Phys., 21, 10527–10555, https://doi.org/10.5194/acp-21-10527-2021, 2021.
Lunt, M. F., Harris, S. J., Hacker, J., Joynes, I., Robertson, T., Thompson, S., and France, J. L.: An evaluation of airborne mass balance and tracer correlation approaches to estimate site-level CH4 emissions from LNG facilities using CO2 as a tracer of opportunity, Atmos. Meas. Tech., 18, 4413–4431, https://doi.org/10.5194/amt-18-4413-2025, 2025.
Luther, A., Kostinek, J., Kleinschek, R., Defratyka, S., Stanisavljević, M., Forstmaier, A., Dandocsi, A., Scheidweiler, L., Dubravica, D., Wildmann, N., Hase, F., Frey, M. M., Chen, J., Dietrich, F., Nȩcki, J., Swolkień, J., Knote , C., Vardag, S. N., Roiger, A., and Butz, A.: Observational constraints on methane emissions from Polish coal mines using a ground-based remote sensing network, Atmos. Chem. Phys., 22, 5859–5876, https://doi.org/10.5194/acp-22-5859-2022, 2022.
Menoud, M., van der Veen, C., Maazallahi, H., Hensen, A., Velzeboer, I., van den Bulk, P., Delre, A., Korben, P., Schwietzke, S., Ardelean, M., Calcan, A., Etiope, G., Baciu, C., Scheutz, C., Schmidt, M., and Röckmann, T.: CH4 isotopic signatures of emissions from oil and gas extraction sites in Romania, Elementa, 10, 00092, https://doi.org/10.1525/elementa.2021.00092, 2022.
Neininger, B. G., Kelly, B. F., Hacker, J. M., Lu, X., and Schwietzke, S.: Coal seam gas industry methane emissions in the Surat Basin, Australia: comparing airborne measurements with inventories, Philos. Trans. A Math. Phys. Eng. Sci., 379, 20200458, https://doi.org/10.1098/rsta.2020.0458, 2021.
Obersky, L., Rafiee, R., Cabral, A. R., Golding, S. D., and Clarke, W. P.: Methodology to determine the extent of anaerobic digestion, composting and CH4 oxidation in a landfill environment, Waste Manag., 76, 364–373, https://doi.org/10.1016/j.wasman.2018.02.029, 2018.
Palmer, P. I., Feng, L., Lunt, M. F., Parker, R. J., Bösch, H., Lan, X., Lorente, A., and Borsdorff, T.: The added value of satellite observations of methane for understanding the contemporary methane budget, Philos. Trans. A Math. Phys. Eng. Sci., 379, 20210106, https://doi.org/10.1098/rsta.2021.0106, 2021.
Penn, E.: Quantifying Tropospheric OH Concentrations and Coal Methane Emissions Using Remote Sensing, Doctoral dissertation, Harvard University, https://dash.harvard.edu/entities/publication/70ffdba5-4e18-4d80-a0fa-cf576c12c257 (last access: 16 October 2025), 2025.
Pühl, M., Roiger, A., Fiehn, A., Gorchov Negron, A. M., Kort, E. A., Schwietzke, S., Pisso, I., Foulds, A., Lee, J., France, J. L., Jones, A. E., Lowry, D., Fisher, R. E., Huang, L., Shaw, J., Bateson, P., Andrews, S., Young, S., Dominutti, P., Lachlan-Cope, T., Weiss, A., and Allen, G.: Aircraft-based mass balance estimate of methane emissions from offshore gas facilities in the southern North Sea, Atmos. Chem. Phys., 24, 1005–1024, https://doi.org/10.5194/acp-24-1005-2024, 2024.
Qin, K., Hu, W., He, Q., Lu, F., and Cohen, J. B.: Individual coal mine methane emissions constrained by eddy covariance measurements: low bias and missing sources, Atmos. Chem. Phys., 24, 3009–3028, https://doi.org/10.5194/acp-24-3009-2024, 2024.
Queensland Government: Annual coal statistics, https://www.data.qld.gov.au/dataset/annual-coal-statistics (last access: 10 April 2025), 2025a.
Queensland Government: ArcGIS REST Services Directory, https://spatial-gis.information.qld.gov.au/arcgis/rest/services, (last access: 12 May 2025), 2025b.
Queensland Government: AG Trends Spatial data portal, https://qldspatial.information.qld.gov.au/AGTrendsSpatial (last access: 11 June 2026), 2025c.
R Core Team: R: A Language and Environment for Statistical Computing, Version 4.2.2, R Foundation for Statistical Computing, https://www.r-project.org/ (last access: 11 June 2026), 2022.
Reuter, M., Buchwitz, M., Schneising, O., Krautwurst, S., O'Dell, C. W., Richter, A., Bovensmann, H., and Burrows, J. P.: Towards monitoring localized CO2 emissions from space: co-located regional CO2 and NO2 enhancements observed by the OCO-2 and S5P satellites, Atmos. Chem. Phys., 19, 9371–9383, https://doi.org/10.5194/acp-19-9371-2019, 2019.
Röckmann, T., Eyer, S., van der Veen, C., Popa, M. E., Tuzson, B., Monteil, G., Houweling, S., Harris, E., Brunner, D., Fischer, H., Zazzeri, G., Lowry, D., Nisbet, E. G., Brand, W. A., Necki, J. M., Emmenegger, L., and Mohn, J.: In situ observations of the isotopic composition of methane at the Cabauw tall tower site, Atmos. Chem. Phys., 16, 10469–10487, https://doi.org/10.5194/acp-16-10469-2016, 2016.
Rolph, G., Stein, A., and Stunder, B.: Real-time environmental applications and display system: READY, Environ. Model. Softw., 95, 210–228, https://doi.org/10.1016/j.envsoft.2017.06.025, 2017.
Sadavarte, P., Pandey, S., Maasakkers, J. D., Lorente, A., Borsdorff, T., Denier van der Gon, H., Houweling, S., and Aben, I.: Methane emissions from superemitting coal mines in Australia quantified using TROPOMI satellite observations, Environ. Sci. Technol., 55, 16573–16580, https://doi.org/10.1021/acs.est.1c03976, 2021.
Saghafi, A.: A Tier 3 method to estimate fugitive gas emissions from surface coal mining, Int. J. Coal Geol., 100, 14–25, https://doi.org/10.1016/j.coal.2012.05.008, 2012.
Saghafi, A.: Estimating greenhouse gas emissions from open-cut coal mining: application to the Sydney Basin, Aust. J. Earth Sci., 61, 453–462, https://doi.org/10.1080/08120099.2013.834844, 2014.
Saunois, M., Martinez, A., Poulter, B., Zhang, Z., Raymond, P. A., Regnier, P., Canadell, J. G., Jackson, R. B., Patra, P. K., Bousquet, P., Ciais, P., Dlugokencky, E. J., Lan, X., Allen, G. H., Bastviken, D., Beerling, D. J., Belikov, D. A., Blake, D. R., Castaldi, S., Crippa, M., Deemer, B. R., Dennison, F., Etiope, G., Gedney, N., Höglund-Isaksson, L., Holgerson, M. A., Hopcroft, P. O., Hugelius, G., Ito, A., Jain, A. K., Janardanan, R., Johnson, M. S., Kleinen, T., Krummel, P. B., Lauerwald, R., Li, T., Liu, X., McDonald, K. C., Melton, J. R., Mühle, J., Müller, J., Murguia-Flores, F., Niwa, Y., Noce, S., Pan, S., Parker, R. J., Peng, C., Ramonet, M., Riley, W. J., Rocher-Ros, G., Rosentreter, J. A., Sasakawa, M., Segers, A., Smith, S. J., Stanley, E. H., Thanwerdas, J., Tian, H., Tsuruta, A., Tubiello, F. N., Weber, T. S., van der Werf, G. R., Worthy, D. E. J., Xi, Y., Yoshida, Y., Zhang, W., Zheng, B., Zhu, Q., Zhu, Q., and Zhuang, Q.: Global Methane Budget 2000–2020, Earth Syst. Sci. Data, 17, 1873–1958, https://doi.org/10.5194/essd-17-1873-2025, 2025.
Sherwin, E. D., Chen, Y., Ravikumar, A. P., and Brandt, A. R.: Single-Blind Test of Airplane-Based Hyperspectral Methane Detection via Controlled Releases, Elem. Sci. Anthr., 9, 00063, https://doi.org/10.1525/elementa.2021.00063, 2021.
Sherwin, E. D., Rutherford, J. S., Zhang, Z., Chen, Y., Wetherley, E. B., Yakovlev, P. V., Berman, E. S., Jones, B. B., Cusworth, D. H., Thorpe, A. K., and Ayasse, A. K.: US oil and gas system emissions from nearly one million aerial site measurements, Nature, 627, 328–334, https://doi.org/10.1038/s41586-024-07117-5, 2024.
Sperlich, P., Uitslag, N. A. M., Richter, J. M., Rothe, M., Geilmann, H., van der Veen, C., Röckmann, T., Blunier, T., and Brand, W. A.: Development and evaluation of a suite of isotope reference gases for methane in air, Atmos. Meas. Tech., 9, 3717–3737, https://doi.org/10.5194/amt-9-3717-2016, 2016.
Stein, A. F., Draxler, R. R., Rolph, G. D., Stunder, B. J., Cohen, M. D., and Ngan, F.: NOAA's HYSPLIT atmospheric transport and dispersion modeling system, Bull. Amer. Meteor. Soc., 96, 2059–2077, https://doi.org/10.1175/BAMS-D-14-00110.1, 2015.
Swolkień, J., Fix, A., and Gałkowski, M.: Factors influencing the temporal variability of atmospheric methane emissions from Upper Silesia coal mines: a case study from the CoMet mission, Atmos. Chem. Phys., 22, 16031–16052, https://doi.org/10.5194/acp-22-16031-2022, 2022.
Umezawa, T., Brenninkmeijer, C. A. M., Röckmann, T., van der Veen, C., Tyler, S. C., Fujita, R., Morimoto, S., Aoki, S., Sowers, T., Schmitt, J., Bock, M., Beck, J., Fischer, H., Michel, S. E., Vaughn, B. H., Miller, J. B., White, J. W. C., Brailsford, G., Schaefer, H., Sperlich, P., Brand, W. A., Rothe, M., Blunier, T., Lowry, D., Fisher, R. E., Nisbet, E. G., Rice, A. L., Bergamaschi, P., Veidt, C., and Levin, I.: Interlaboratory comparison of δ13C and δD measurements of atmospheric CH4 for combined use of data sets from different laboratories, Atmos. Meas. Tech., 11, 1207–1231, https://doi.org/10.5194/amt-11-1207-2018, 2018.
UNECE: Best practice guidance for effective management of coal mine methane at national level: monitoring, reporting, verification and mitigation, ECE Energy Series No. 71, New York, NY, https://unece.org/sites/default/files/2022-07/2119167_E_ECE_ENERGY_139_WEB.pdf (last access: 20 November 2025), ISBN: 978-92-1-117287-4, 2021.
UNFCCC: United Nations Framework Convention on Climate Change Paris Agreement, https://unfccc.int/process-and-meetings/the-paris-agreement/the-paris-agreement (last access: 24 August 2025), 2015.
Varon, D. J., Jacob, D. J., McKeever, J., Jervis, D., Durak, B. O. A., Xia, Y., and Huang, Y.: Quantifying methane point sources from fine-scale satellite observations of atmospheric methane plumes, Atmos. Meas. Tech., 11, 5673–5686, https://doi.org/10.5194/amt-11-5673-2018, 2018.
Vigil, D. A., Johnson Jr., R. L., and Tauchnitz, J.: Improved estimation methods for surface coal mine methane emissions for reporting, beneficial use, and emission reduction purposes and relative to Australia's safeguard mechanisms, J. Environ. Manage., 376, 124366, https://doi.org/10.1016/j.jenvman.2025.124366, 2025.
Whiticar, M. J.: A geochemial perspective of natural gas and atmospheric methane, Org. Geochem., 16, 531–547, https://doi.org/10.1016/0146-6380(90)90068-B, 1990.
Whiticar, M. J.: Stable isotope geochemistry of coals, humic kerogens and related natural gases, Int. J. Coal Geol., 32, 191–215, https://doi.org/10.1016/S0166-5162(96)00042-0, 1996.
Wolff, S., Ehret, G., Kiemle, C., Amediek, A., Quatrevalet, M., Wirth, M., and Fix, A.: Determination of the emission rates of CO2 point sources with airborne lidar, Atmos. Meas. Tech., 14, 2717–2736, https://doi.org/10.5194/amt-14-2717-2021, 2021.
Yu, X., Millet, D. B., Wells, K. C., Henze, D. K., Cao, H., Griffis, T. J., Kort, E. A., Plant, G., Deventer, M. J., Kolka, R. K., Roman, D. T., Davis, K. J., Desai, A. R., Baier, B. C., McKain, K., Czarnetzki, A. C., and Bloom, A. A.: Aircraft-based inversions quantify the importance of wetlands and livestock for Upper Midwest methane emissions, Atmos. Chem. Phys., 21, 951–971, https://doi.org/10.5194/acp-21-951-2021, 2021.