the Creative Commons Attribution 4.0 License.
the Creative Commons Attribution 4.0 License.
 | 21 Jan 2026
Evaluating simulations of organic aerosol volatility and degree of oxygenation in eastern China
Yu Li
Weiwei Hu
Havala O. T. Pye
Jingyi Li
Linghan Zeng
Jianlin Hu
Volatility and oxygen-to-carbon () molar ratios are critical properties of organic aerosols (OA), influencing their viscosity, hygroscopicity, and light absorption thereby resulting in impacts on air quality and climate. While atmospheric models often track these properties to simulate OA evolution, their performance remains insufficiently evaluated. This study assessed OA volatility and simulations by comparing CMAQ model outputs using official AERO7i and community-contributed two-dimensional volatility basis set (2D-VBS) schemes, against two field measurements in eastern China. Apart from baseline modelling, two additional simulations using AERO7i incrementally incorporated low-volatility/semi-volatile/intermediate-volatility organic compound (L/S/IVOC) emissions and enhanced anthropogenic secondary organic aerosol (SOA) yields. An optimized 2D-VBS simulation further constrained ratios of primary organic aerosol (POA) emissions using observations. The results showed that OA mass concentrations were underestimated by 24 % in 2D-VBS and 27 %–34 % with updated AERO7i, likely due to underrepresented vehicular POA emissions and nighttime SOA formation. All simulations captured the substantial contribution of low-volatility products ( µg m−3) but failed to reproduce the detailed volatility distributions within this range. Simulated ratios were biased low in aged air masses (notably with 2D-VBS) and slightly overestimated in areas with more local emissions using updated AERO7i. Misrepresentations of OA volatility significantly led to biases in viscosity predictions, while the hygroscopicity parameter played a more important role. These findings highlight the need to better constrain OA volatility and in models to improve projections of OA air quality and climate impacts.
- Article
(3782 KB) - Full-text XML
-
Supplement
(8128 KB) - BibTeX
- EndNote


Organic aerosols (OA) are a major component of fine particulate matter (PM2.5), accounting for 20 %–90 % of its mass (Jimenez et al., 2009; Zhang et al., 2007), and play a critical role in global air quality, climate, and public health (Nault et al., 2021; Shrivastava et al., 2017; Wu et al., 2018). OA can be classified as either primary organic aerosol (POA), emitted directly from sources such as combustion, or secondary organic aerosol (SOA), formed through the oxidation of volatile organic compounds (VOCs) and semi-volatile and intermediate volatility organic compounds (S/IVOCs) (Hallquist et al., 2009; Heald and Kroll, 2020). The chemical aging of OA involves functionalization (incorporation of oxygen-containing groups), fragmentation, and oligomerization. These processes alter OA's composition and physicochemical properties, including volatility, oxidation state, viscosity, hygroscopicity, and light absorption (Chacon-Madrid and Donahue, 2011; Tritscher et al., 2011; Massoli et al., 2010; Rothfuss and Petters, 2017; Hems et al., 2021). Understanding these evolving properties is crucial for accurately predicting the impacts of OA on climate, air quality, and public health in atmospheric and climate models (Tsigaridis and Kanakidou, 2018).
Among the various properties of OA, volatility and the oxygen-to-carbon molar ratio (, an indicator of the extent of oxygenation) are pivotal for constraining their atmospheric fate and impacts, and they are therefore important parameters in chemical transport models (CTMs) (Donahue et al., 2013; Rao and Vejerano, 2018). The two-dimensional volatility basis set (2D-VBS), a widely adopted framework in OA modeling, tracks volatility and to simulate chemical evolution (Donahue et al., 2011). Volatility primarily governs the partitioning of organic compounds between particulate and gas phases at equilibrium, thereby influencing their atmospheric behavior (e.g., chemical aging, transport, and deposition) and overall OA concentrations (Donahue et al., 2014; Shiraiwa and Seinfeld, 2012). Li et al. (2020) recently parameterized the glass transition temperature (Tg, at which a phase transition between amorphous solid and semi-solid states occurs, and viscosity changes dramatically) as a function of volatility and . This parametrization highlights the link between volatility and phase state (or viscosity), which influence the kinetics of gas-particle interactions, with implications for diffusion, partitioning, and heterogeneous reaction rates (Zaveri et al., 2014; Reid et al., 2018; Marshall et al., 2018; Li and Shiraiwa, 2019). Furthermore, OA volatility affects cloud condensation nuclei (CCN) activity due to its connection with particle hygroscopicity and growth dynamics (Liu and Matsui, 2022; Zhang et al., 2023).
The ratios of OA influence their viscosity and hygroscopicity, similar to the effects of volatility (Massoli et al., 2010; Koop et al., 2011). The ratios and volatility of OA components are largely coupled, with more volatile components typically exhibiting lower ratios. Lower ratios favor phase separation under specific relative humidity conditions (Pye et al., 2017). Conversely, elevated ratios indicate increased hygroscopicity resulting in enhanced water uptake, thereby increasing their potential to act as cloud condensation nuclei and ice nuclei (Mahrt et al., 2022; Malek et al., 2023; Song et al., 2012; Tian et al., 2022). Furthermore, ratios substantially impact the optical properties of OA (Xu et al., 2024). During aging, bulk OA generally darkens with increasing , while excessive oxidation at higher levels diminishes light absorption (Jiang et al., 2022; Duan et al., 2024). These findings suggest that could serve as a critical parameter in radiative forcing estimation in climate models.
A few prior studies have revealed significant uncertainties in OA volatility and simulations with CTMs. For instance, Saha et al. (2017) demonstrated that the VBS module in WRF-Chem significantly underestimated OA concentrations, and failed to reproduce low-volatility OA components with effective saturation concentration (C∗) between 10−4 and 10−1 µg m−3. This discrepancy could be partially explained by underestimated SOA formation due to wall losses of condensable vapors and missing low-volatility products, with the parameters empirically derived from aerosol growth experiments. In contrast, parameters derived from dual thermodenuder (TD) measurements predicted 2–4× higher SOA yields, and produced more low-volatility products under atmospherically relevant conditions (Saha and Grieshop, 2016). Additionally, the lack of S/IVOC emissions in the model likely contributed to biases in simulated OA volatility distributions (Xu et al., 2019). Regarding simulations, Tsimpidi et al. (2018) introduced the ORACLE 2-D module into a global chemistry-climate model, which tended to overpredict OA ratios in urban downwind areas. Overall, the model exhibited a 5 %–7 % overestimation of for OA and SOA, with the most pronounced positive biases in summer. The regional model Community Multiscale Air Quality (CMAQ) also overestimated ratio (closely related to ) of OA compared to observations in the southeastern US (Pye et al., 2017). However, accounting for interactions between OA and aerosol water, which enhance semi-volatile partitioning by increasing the available partitioning medium, could reduce model biases in . The air quality model Polyphemus underestimated in the northwestern Mediterranean region, even after implementing multi-generational oxidation processes, highlighting insufficient representation of aging processes in the model (Chrit et al., 2018). While model performance varies across different regions and models globally, simulations of OA volatility and ratios in the polluted atmospheres of China remain insufficiently explored.
In this study, we evaluated the performance of the CMAQ model in simulating OA mass concentration, volatility distribution and ratio, by comparing to the observations at two sites in eastern China. The evaluation focused on two OA schemes that differed in their level of complexity regarding the representation of volatility and . Additionally, two adjustments to the default CMAQ scheme were evaluated: (1) adding S/IVOC emissions with SOA formation from these precursors, and (2) updating the SOA yields of aromatic species (benzene, toluene, xylene) and polycyclic aromatic hydrocarbons (PAHs). The assessment also explored how uncertainties in OA volatility and propagated to Tg and viscosity predictions. These efforts aimed to provide valuable insights into improving OA simulations (in terms of both mass concentrations and properties), and their implications for viscosity and phase state modeling in CTMs.
2.1 Model configuration
In this study, two versions of the CMAQ model (https://epa.gov/cmaq, last access: 6 November 2023), the official v5.3.2 (Appel et al., 2021) (available from https://doi.org/10.5281/zenodo.4081737, US EPA Office of Research and Development, 2020) and v5.4 with a community contribution (available from https://doi.org/10.5281/zenodo.7218076, US EPA Office of Research and Development, 2022), were used to perform nested simulations with horizontal resolutions of 36 and 12 km. The outer domain encompassed most of China, while the inner domain focused on eastern China (Fig. S1 in the Supplement). The simulation period covered 17 March–21 April and 29 September–21 November 2018, aligning with the campaigns conducted in Dongying (DY) and Guangzhou (GZ), respectively. Meteorological fields were generated using the Weather Research and Forecasting (WRF) model version 4.2.1. Anthropogenic emissions for China were represented using the 2018 high-resolution (0.25° × 0.25°) Multi-resolution Emission Inventory for China (MEIC) v1.4 (http://www.meicmodel.org, last access: 9 September 2023), while the Regional Emission Inventory in Asia (REAS) v3.2.1 (https://www.nies.go.jp/REAS/, last access: 12 September 2023) was used for the rest of Asia. Emissions from open burning were obtained from the Fire Inventory from NCAR (FINN) v1.5 (https://www2.acom.ucar.edu/modeling/finn-fire-inventory-ncar, last access: 13 January 2021), and biogenic emissions were calculated using the Model of Emissions of Gases and Aerosols from Nature (MEGAN) v2.1 (Guenther et al., 2012). The simulations utilized the SAPRC07tic gas-phase mechanism within CMAQ (Xie et al., 2013). The capabilities of WRF and CMAQ in simulating meteorological factors and major pollutants (NO2, SO2, O3 and PM2.5) were evaluated (Tables S1–S2 in the Supplement).
2.2 OA representations
All the simulations modeled SOA formation from isoprene, glyoxal, and methylglyoxal, as well as NO3-initiated oxidation of monoterpenes, using consistent parameterizations from CMAQ's official AERO7i module (see Fig. S2). Specifically, isoprene SOA formed via the aqueous uptake of isoprene epoxydiols (IEPOX)/methacrylic acid epoxide (MAE), and monoterpene-derived organic nitrates (ONs) via NO3 oxidation were explicitly represented (Pye et al., 2013; Pye et al., 2015). Semi-volatile isoprene SOA, including contributions from non-aqueous pathways, was parameterized with the two-product model (Carlton et al., 2010), which utilized mass yields of two products (αi, i=1, 2) and their effective saturation concentrations (, ) to simulate aerosol growth observed in experiments (Pankow, 1994). All the simulations accounted for multiphase SOA formation from glyoxal and methylglyoxal both in cloud (Carlton et al., 2008) and on wet aerosol surfaces (Pye et al., 2015).
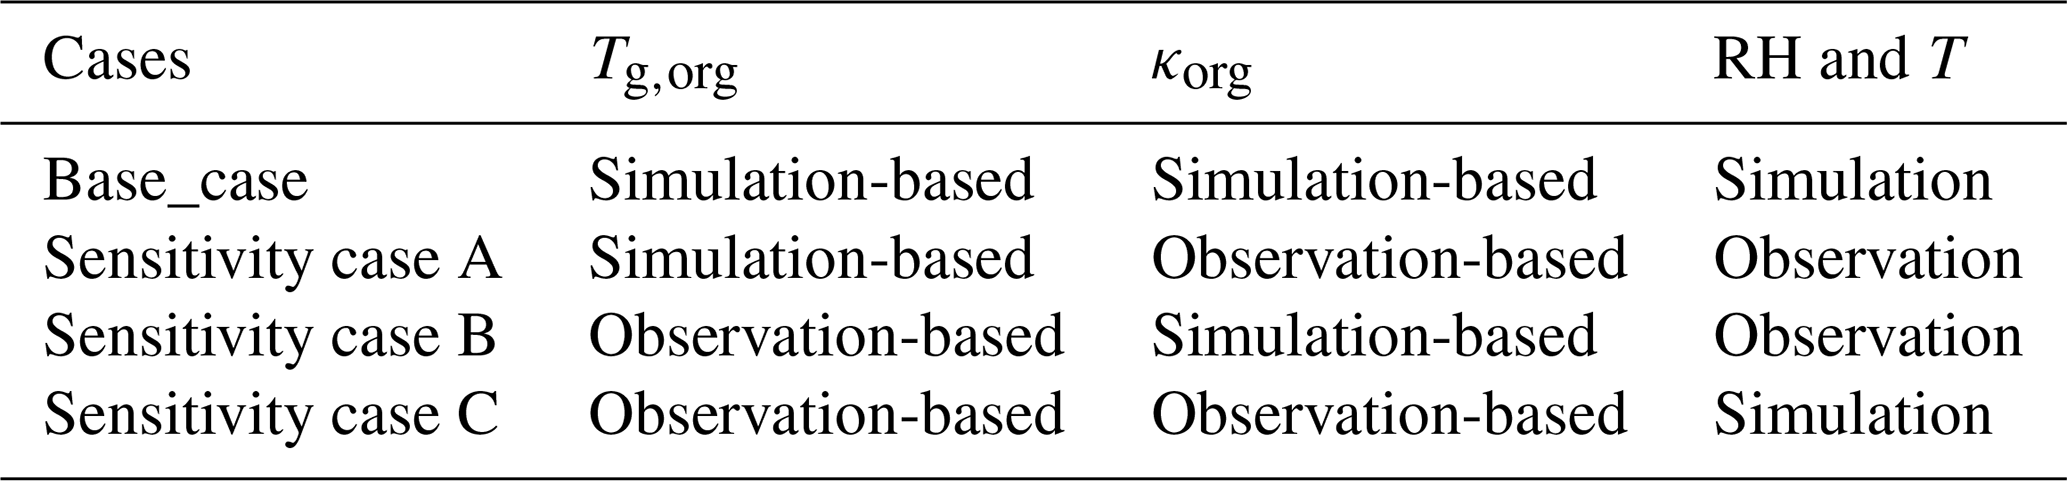
Five simulations were conducted to evaluate model performance in reproducing OA mass concentrations, volatility distributions, and ratios against observational data (Table 1). All simulations retained the same AERO7i heterogeneous chemistry and selected other systems (see above), and focused on different representations of key volatility-based systems. The simulation using the standard AERO7i treatment including SOA from anthropogenic precursors (e.g., aromatics, long-chain alkanes) (Qin et al., 2021), monoterpenes via oxidation (Xu et al., 2018), and sesquiterpenes (Carlton et al., 2010) was referred to as a 1-D VBS for simplicity. In another simulation, the 2D-VBS framework (Zhao et al., 2015; Zhao et al., 2016; Chang et al., 2022) was used for anthropogenic VOCs, monoterpenes (excluding NO3 oxidation pathways), and sesquiterpenes. Additionally, in 2D-VBS, the oxidation of POA (or L/S/IVOCs) was represented differently compared to the 1D-VBS simulations (Murphy et al., 2017).
Table 1Description of the five simulations conducted in this study.
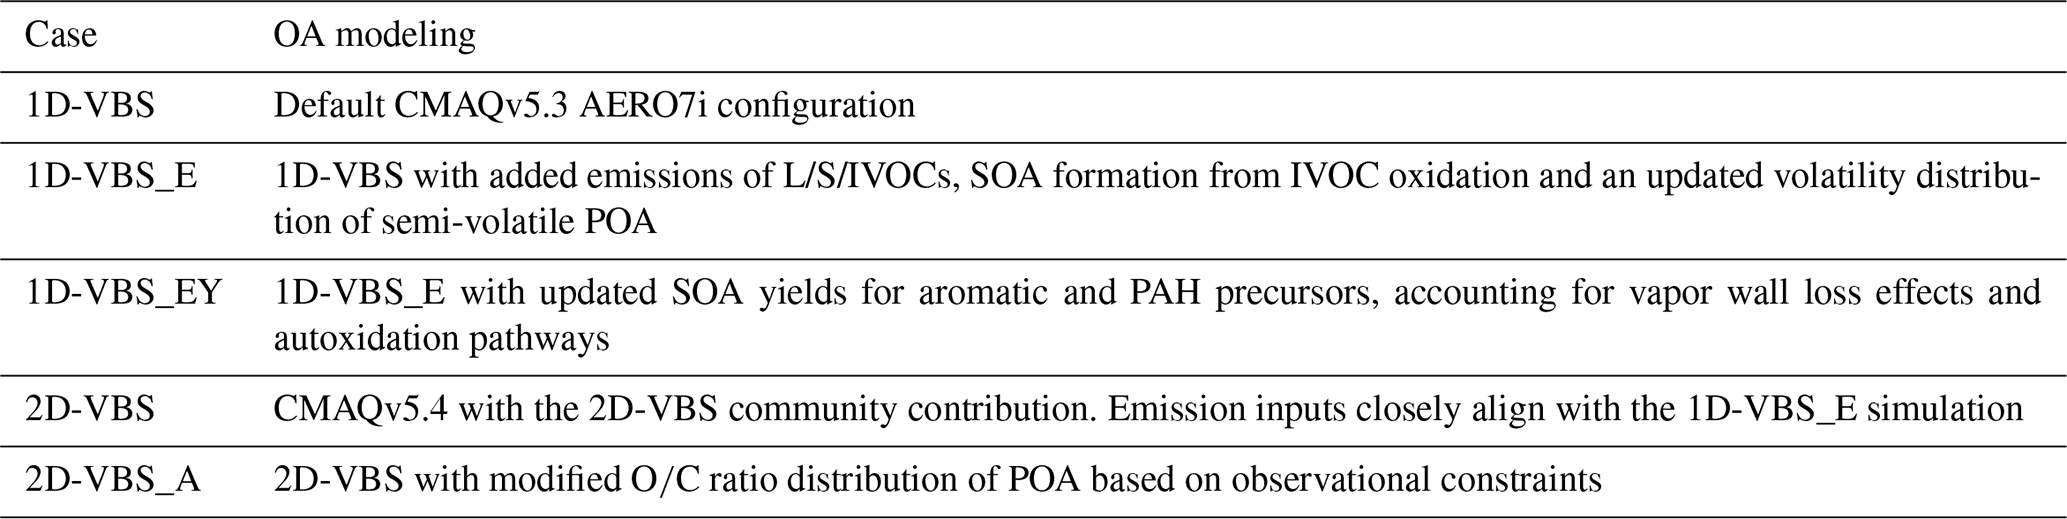
The 1D-VBS simulation reflected the default CMAQ configuration without modifications to emissions or chemistry. The 1D-VBS_E simulation incorporated additional IVOC emissions, and updated emissions of S/LVOCs (historically classified as POA), based on MEICv1.4 (Sect. S1 in the Supplement). L/SVOC and IVOC emissions in each volatility bin were scaled from POA and total VOC emissions, respectively, using source-specific scaling factors (Table S3). Since the lowest volatility bin for emissions in the standard 1D-VBS parameterization was set to µg m−3, the difference between original POA emissions and L/SVOC emissions within the model-resolved volatility range () was reclassified as non-volatile ( µg m−3, see Fig. S3) and treated with heterogeneous aging chemistry (Simon and Bhave, 2012). This adjustment conserved POA mass while addressing the model's limitations in volatility coverage. The estimated nation-wide L/SVOC and IVOC emissions, which were 3.18 and 6.68 Tg yr−1, respectively, were higher than those reported by Zheng et al. (2023), but agreed well with Chen et al. (2024) in magnitude (Table S4, Figs. S4–S5), as both this study and Chen et al. (2024) applied a ratio-based methodology combined with the MEIC emission inventory. In contrast, Zheng et al. (2023) employed a different approach, using emission factors and activity data obtained from ABaCAS (Air Benefit and Cost and Attainment Assessment System) and Chang et al. (2022), which led to larger discrepancies relative to our estimates. The source contributions and volatility distributions of L/S/IVOCs differed slightly between studies. For example, our estimates indicated a lower contribution of solvent use to IVOCs compared with Zheng et al. (2023) (40 % vs. 57 %), and a higher contribution from residential sources to S/LVOCs (49 % vs. 30 %). In addition, the differences in emission magnitudes were primarily in the IVOC volatility range, whereas discrepancies in L/SVOCs were smaller. In the 1D-VBS_E simulation, the aging of L/SVOCs followed the POA treatment established in prior studies (Donahue et al., 2012; Murphy et al., 2017), where a fraction of L/SVOCs was oxidized in the gas phase to form SOA and the volatility distribution continually updated. The IVOC-derived SOA formation adopted the parameterization of Lu et al. (2020). In the 1D-VBS_EY simulation, SOA yields for benzene, toluene, xylene, and naphthalene oxidation were updated (Table S5) to account for vapor wall losses and formation of highly oxygenated organic molecules (HOMs) via autoxidation (Bilsback et al., 2023).
The 2D-VBS scheme (Zhao et al., 2015; Zhao et al., 2016; Chang et al., 2022), was implemented into CMAQv5.4 and evaluated using emission inputs largely consistent with the 1D-VBS_E simulation. The major differences in emissions included (1) reallocating non-volatile POA to the LVOC species with C∗ of 10−2 µg m−3 (i.e., the least volatile primary emission category in 2D-VBS); and (2) mapping SVOC emissions with C∗ of 10−1 µg m−3 to the µg m−3 bin as well (due to the absence of a corresponding volatility bin in the 2D-VBS scheme). L/SVOC aging products were classified as SOA. Initial ratio distributions for L/S/IVOC emissions across volatility bins followed 2D-VBS default profiles. However, these default assumptions led to underestimated POA ratios (see Sect. 3.3). Therefore, we conducted the 2D-VBS_A simulation, wherein sector-specific ratios for POA emissions from gasoline/diesel vehicles, non-road mobile sources, power plants and industrial sources were constrained using observational averages in eastern China (Table S6).
2.3 Volatility distribution and ratio modelling
The volatility (expressed in terms of C∗) and ratios for OA surrogate species across all the simulations were summarized in Tables S7–S8. Volatilities for all species, except those in VBS-based parameterizations, were aligned with surrogate data in chamber experiments. Non-volatile POA and SOA formed via pathways such as aromatic oxidation under low-NOx conditions, aqueous-phase uptake of IEPOX/MAE/glyoxal/methylglyoxal, ON hydrolysis and particle-phase oligomerization were assigned a fixed C∗ of 10−10 µg m−3 for simplicity. The volatility of primary L/S/IVOCs in the condensed phase and aged OA, was described in detail by Murphy et al. (2017). In the 1D-VBS_EY simulation, a new SOA species with µg m−3 (unrepresented in the base 1D-VBS in CMAQ) was explicitly incorporated. The volatility distribution of total SOA (POA) was then derived using simulated concentrations of individual SOA (POA) species.
The overall ratios for SOA, POA, and OA were calculated using the mole-weighted averages of the values for individual species. The ratios of OA species were calculated based on mass-based ratios provided with the CMAQ code. The ratios for SOA were primarily derived from chamber experiments (Pye et al., 2017; Carlton et al., 2010; Xu et al., 2018). For example, SOA species with relatively well-known structures (e.g., IEPOX-/MAE-derived SOA, isoprene dinitrates and monoterpene nitrates), along with seven VBS bins representing monoterpene SOA formed via O3 and OH oxidation, adopted values and other molecular properties from surrogate compounds identified in chamber studies. For other SOA species, once their C∗ values were determined (as described above) and the number of carbons (nC) was assumed, the ratios were either inferred based on plausible structures (Pankow et al., 2015) or estimated using the relationship between volatility, nC and the number of oxygens (nO) used in 2D-VBS ((Pye et al., 2017). Additionally, ratios for primary L/S/IVOCs and their aging products were constrained by laboratory work and filed observations as documented in previous studies (Murphy et al., 2017; Lu et al., 2020). The non-volatile POA emissions were assumed to have an ratio of 1.6 (Turpin and Lim, 2001), which was equivalent to of 0.35.
In the base 2D-VBS, the distributions for L/S/IVOC emissions in each volatility bin followed the default settings in the community-contributed 2D-VBS. These ratios were primarily based on Chang et al. (2022), which used emission test data for specific sectors when available and otherwise adopted values from prior studies. However, in the 2D VBS, the ratios for emissions were capped at 0.4. For SOA products overlapping with AERO7i, such as isoprene SOA, the ratios were set to match those in AERO7i. For other SOA surrogate species, the ratios were determined either by adjusting the distribution of first-generation products to align with experimental data (OH/O3-intitiated monoterpene and sesquiterpene SOA), or based on explicit chemical mechanisms for initial oxidation (anthropogenic SOA), followed by aging through functionalization and fragmentation within 2D-VBS (Zhao et al., 2015). As a result, the ratios for OH/O3-intitiated monoterpene and sesquiterpene SOA in 2D-VBS generally ranged from 0 to 1.0 in 0.1 increments. In contrast, anthropogenic SOA (ASOA) exhibited a broader range, with a maximum ratio of 2.0, to account for the high degree of oxygenation observed in toluene SOA in chamber experiments.
2.4 Predictions of Tg and viscosity
Previous measurements have demonstrated a close relationship between volatility and viscosity. For instance, Champion et al. (2019) found that SOA with higher fractions of EL/LVOCs showed increased viscosity. Similarly, an inverse correlation between Tg and vapor pressure was observed for isoprene SOA components (Zhang et al., 2019). Although the dependence of Tg on atomic ratios is generally weaker than on vapor pressure (Koop et al., 2011), strong correlations between Tg and ratios have been observed for oxidation products formed from specific precursors, such as α-pinene (Dette et al., 2014), n-heptadecane, and naphthalene (Saukko et al., 2012). Therefore, the uncertainties in volatility and ratios may impact Tg and viscosity predictions when using the parameterizations that relate Tg and viscosity to volatility and ratios (Li et al., 2020; Zhang et al., 2019).
Here we calculated the Tg of individual OA surrogate species i (Tg,i) using Eqs. (1), (2) (Li et al., 2020) or (3) (Zhang et al., 2019):
Where Eq. (1) relies solely on volatility ( represents the saturation concentration at 298 K, and is equal to assuming ideal thermodynamic mixing), and was developed for coupling into the 1-D VBS framework. Equation (2) incorporates as an additional factor, which is used in 2D-VBS. Both equations yield similar predictions, particularly for compounds with low ratios (Li et al., 2020). Equation (3) is a semi-empirical formula derived from the measurements of isoprene SOA components, which relates Tg to volatility and includes molar mass Mi (Zhang et al., 2019). The overall Tg of OA mixtures under dry conditions (Tg,org) can be calculated using the Gordon-Taylor equation (see Sect. S2 in the Supplement).
OA viscosity depends on aerosol water content, since water significantly influences the phase state of aerosols (Koop et al., 2011). Under humid conditions, the Tg of organic-water mixtures (Tg,ωorg) is calculated based on the mass fraction of organics (ωorg) in the mixtures, along with the Tg values of pure water (136 K) and dry OA (using Eqs. 1, 2 or 3). Notably, ωorg varies with ambient relative humidity (RH) and the effective hygroscopicity parameter of OA (κorg). Further details can be found in previous studies (DeRieux et al., 2018; Shiraiwa et al., 2017) and Sect. S2 in the Supplement. The temperature-dependent viscosity (η) can be estimated using the modified Vogel-Tammann-Fulcher (VTF) equation, as given in Eq. (4) (Angell, 1991), when the ambient temperature T is at or above Tg,ωorg; otherwise η is fixed at 1012 Pa s.
where η∞ and D denote the viscosity at infinite temperature and the fragility parameter, with the values of 10−5 Pa s and 10, respectively (DeRieux et al., 2018). T0 represents the Vogel temperature, and can be estimated using Eq. (5) (Angell, 1991; DeRieux et al., 2018):
2.5 Measurement Data
Two sets of observational data from field campaigns were used to evaluate the simulations. One campaign was conducted in the spring (17 March–21 April) of 2018 in DY, at a site located in the Yellow River Delta National Nature Reserve and strongly influenced by urban outflows from the North China Plain (NCP) (Feng et al., 2023). The observational data include the mass concentration and elemental ratios (e.g., , ) of OA, measured using a high-resolution time-of-flight aerosol mass spectrometer (HR-AMS). The volatility distribution of OA (expressed as VBS) was estimated using an empirical method based on data from a thermodenuder (TD) combined with AMS. The sources of OA components were characterized using the positive matrix factorization (PMF) method, which resolved OA factors, including hydrocarbon-like OA (HOA), biomass-burning OA (BBOA), transported OOA and background OOA. The other campaign, led by the same team, was conducted in the autumn (29 September–21 November) of 2018 in urban GZ surrounded by transportation and residential districts, with significant impacts from local emissions (Chen et al., 2021). The resolved OA factors in GZ identified three POA groups (cooking OA (COA), HOA, and nitrogen-containing OA (NOA)) along with two types of SOA (low-volatility oxygenated OA, LV-OOA, and semi-volatile oxygenated OA, SV-OOA).
3.1 Evaluation of mass concentration
Figure 1 compared the observed and simulated diurnal variations of OA and its components, POA and SOA, in DY and GZ, respectively. The simulation with updated ratios of POA emissions in the 2D-VBS framework (i.e., 2D-VBS_A) did not alter the emission magnitudes or volatility, and therefore had a minimal impact on the predicted POA mass concentration or volatility distribution. As a result, this case is not discussed in Sect. 3.1 and 3.2. The observations indicated that SOA dominated OA at both sites, contributing 72 % and 64 % at DY and GZ, respectively. The model generally underestimated the SOA contribution in DY (except for the 2D-VBS case), while slightly overestimating it in GZ (Table S9). In general, the 2D-VBS case predicted higher contributions of SOA to total OA (> 80 %) than in the 1D-VBS simulations.
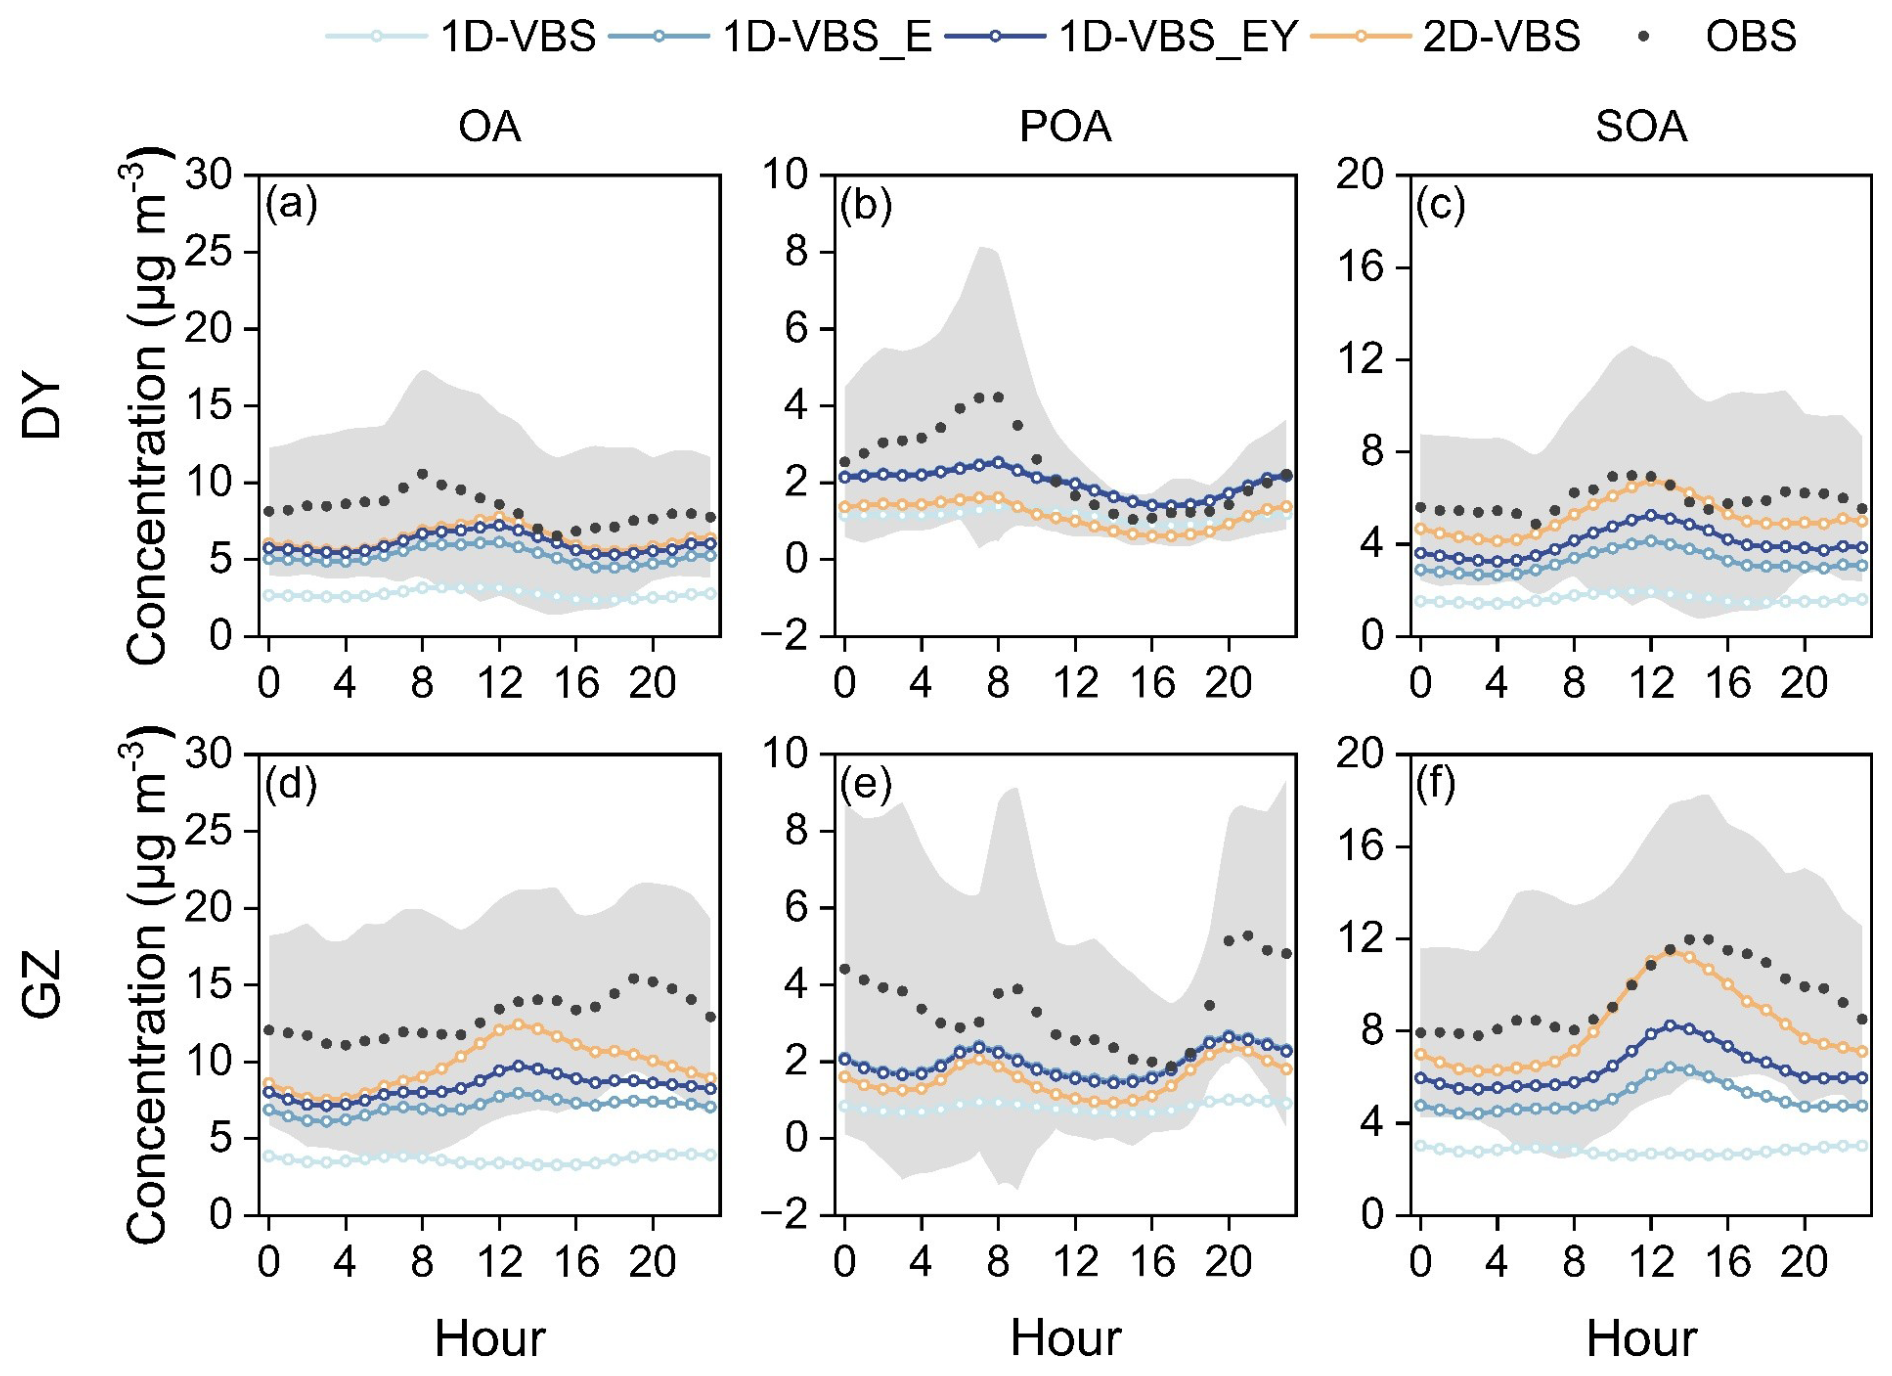
Figure 1Simulated diurnal variations of OA, POA, and SOA with different SOA schemes compared to the observations in DY (a–c) and GZ (d–f). The light grey shading indicates the standard deviations (±1σ) from the mean concentration in the observations.
The base 1D-VBS significantly underestimated SOA production, with NMBs of −72 % in DY and −71 % in GZ (Table S10). Adding L/S/IVOC emissions and their contributions to SOA in the 1D-VBS_E case resulted in approximately a two-fold enhancement in SOA mass concentration. This finding was consistent with earlier studies showing that 64 % to 100 % of observed SOA in GZ can be explained when both conventional precursors and S/IVOCs are considered (Hu et al., 2022), and that simulated S/IVOC contributions to SOA exceeded 50 % across most of China (Li et al., 2021a; Miao et al., 2021). The 1D-VBS_EY case substantially increased SOA production from aromatics and PAHs with updated yields (Fig. S6), and the diurnal variation was similar to that in the 2D-VBS simulation in DY. In GZ, the notable daytime differences in SOA between the 2D-VBS and 1D-VBS_EY cases were driven by variations in ASOA representations (Fig. S7). Mass increases in ASOA as a result of gas-phase aging were likely overestimated with the 4 km grid spacing in the 1D-VBS_EY simulation (Bilsback et al., 2023). While both simulations significantly improved SOA predictions, they still underestimated SOA concentrations compared to observations by 11 %–14 % (2D-VBS) and 30 %–33 % (1D-VBS_EY), respectively. Diagnosing the causes of these underestimations remains challenging due to the lack of chemically resolved SOA measurements. Although POA was underestimated (as discussed below), the sensitivity simulations indicated that its impact on SOA was limited (Fig. S8). At the GZ site, for example, increasing POA emissions by 70 % in the 1D-VBS_EY simulation to match the observed POA concentrations led to only 4 % increase in SOA, suggesting that missing or incomplete SOA formation pathways are likely the primary drivers of the SOA low biases. We infer that the nighttime low biases in both cases were likely attributed to insufficient formation of organic nitrates in the presence of NO3 radicals. This might result from missing anthropogenic terpene and phenolic emissions from sources such as biomass burning and volatile chemical products (Wang et al., 2022; Coggon et al., 2021; Xie et al., 2025; Liu et al., 2024). The underestimated nocturnal SOA formation could also be attributed to the underprediction of aqueous-phase formation pathways, which are enhanced under high RH conditions at night (Wang et al., 2019; Gu et al., 2023).
Simulated POA also exhibited underestimation at both locations. In the comparison, BBOA and COA were excluded from the observations, due to the complexity and considerable uncertainties associated with cooking and biomass burning (particularly open burning) emission estimation (Li et al., 2023; Zhou et al., 2017). Therefore, the POA underestimation was most likely attributable to uncertainties in mobile emissions. Observed POA concentrations at both sites showed peaks during traffic rush hours, which were not well captured by the simulations. At the DY site, the resolved HOA in observations was partially aged, as noted in Feng et al. (2023) and included some SOA transported over long distances, which may also explain the POA underestimation. At the GZ site, which is more influenced by local emissions, the simulated peak concentration exhibited an earlier shift compared to the observed peak, suggesting that the diurnal patterns of POA emissions may differ from those specified in the model. Additionally, the POA volatility distributions (see Methods) and aging schemes in the 1D-VBS and 2D-VBS simulations were different: (1) The 1D-VBS involved heterogeneous aging of non-volatile POA. (2) In 2D-VBS, POA aging led to its complete transformation into SOA, whereas in the 1D-VBS, some oxidation products remained as POA. These differences led to distinct POA levels between the two cases.
Overall, total mass concentrations of OA were underestimated. The 1D-VBS_EY case, which had the smallest negative biases among the 1D-VBS simulations, underestimated OA by approximately 27 % in DY and 34 % in GZ. These discrepancies were dominated by SOA underestimation at both sites (Fig. S9). The 2D-VBS simulation demonstrated better performance in OA predictions than 1D-VBS_EY, with NMBs of −24 % in both DY and GZ, primarily due to higher predicted SOA mass concentrations.
3.2 Volatility simulations
The mass distributions of OA, POA, and SOA across different volatility bins (i.e., volatility distribution) were examined. This study primarily focused on compounds with C∗ equal or below 10−1 µg m−3 (log, referred to as low-volatility OA hereafter), and on SVOCs (i.e., ), which exist in both gas and condensed phases. Despite variations in OA mass concentrations across different cases, CMAQ generally reproduced the observed volatility distributions of OA, SOA, and POA in all the simulations (Fig. 2). Specifically, the observations indicated that more than 70 % of OA was low-volatility OA, consistent across the simulations. The base 1D-VBS significantly underestimated low-volatility OA concentrations, leading to underestimation in total OA mass (Fig. S10). The 1D-VBS_E simulation, which included L/S/IVOC emissions, increased low-volatility SOA formation by 1.1 µg m−3 in DY and 1.5 µg m−3 in GZ, although the contributions of low-volatility SOA to total SOA decreased. It also replaced the default volatility distribution of POA in CMAQv5.3 with source-specific gas/particle partitioning, resulting in a significant amount of non-volatile POA (Fig. S11). Collectively, these adjustments led to slightly higher fractions of low-volatility OA with the inclusion of L/S/IVOC emissions, as proposed by Xu et al. (2019), albeit for a different reason (mainly due to changes in POA rather than SOA volatility distributions). The updated SOA yields for aromatics and PAHs had minor effects on POA but increased SOA mass concentrations across three of the four volatility bins in Fig. S10, slightly changing the SOA volatility distributions.
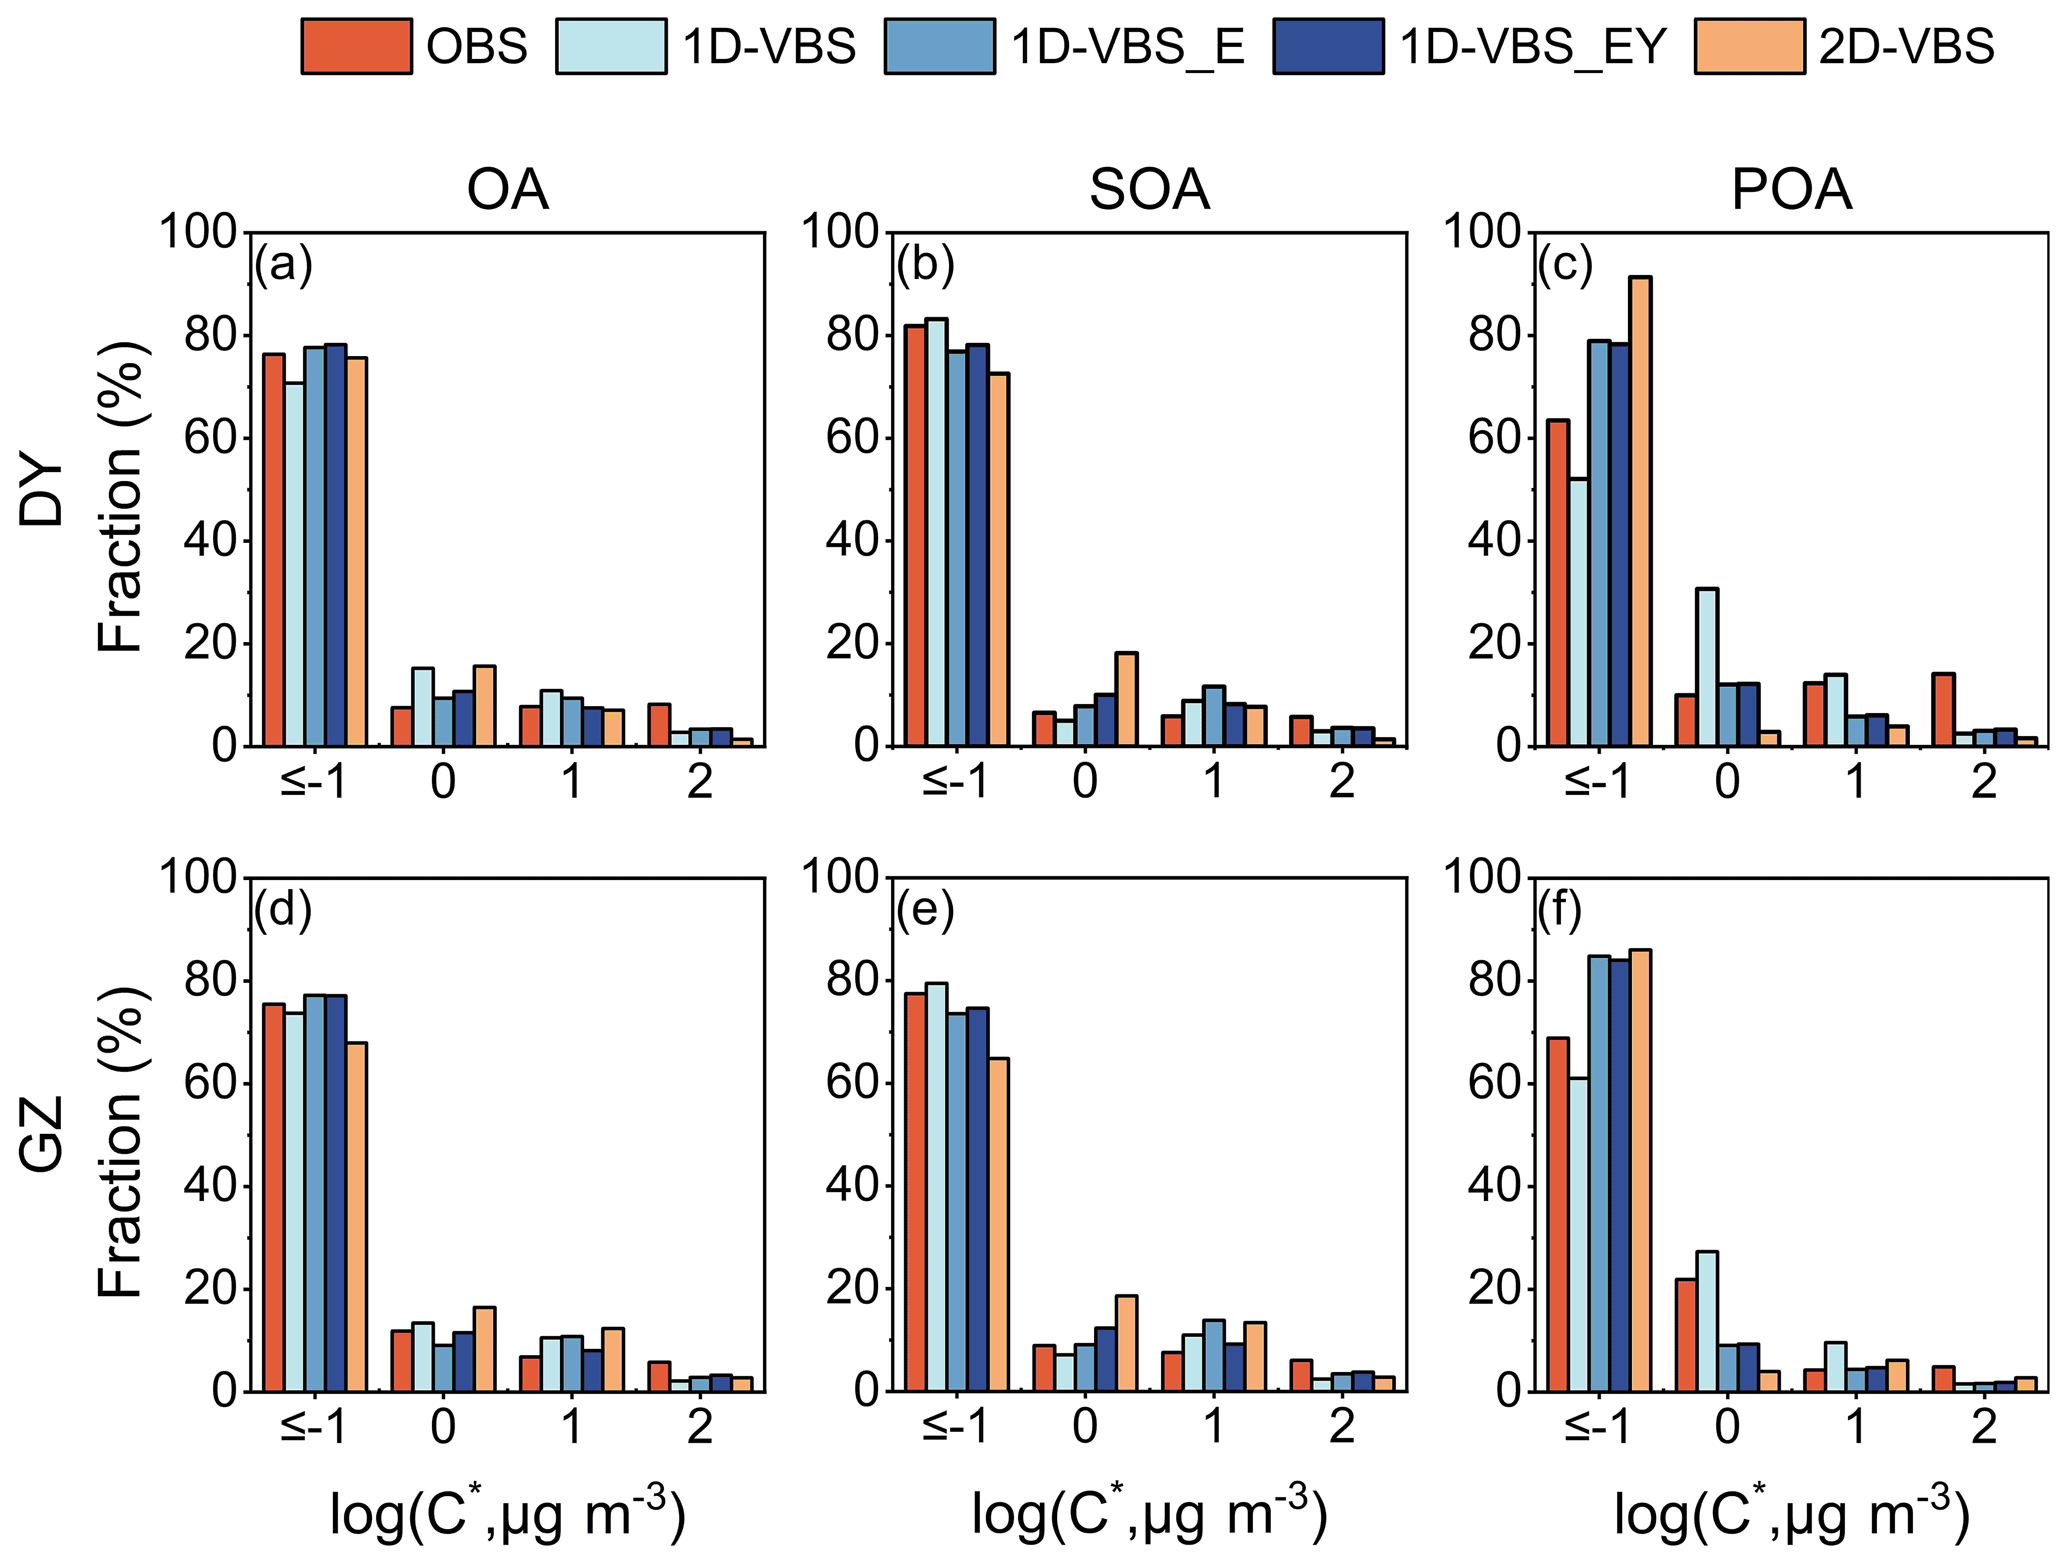
Figure 2Simulated volatility distributions of OA, POA, and SOA across volatility bins with C∗ up to 102 µg m−3, compared to the observations in DY (a–c) and GZ (d–f). The compounds with C∗ equal or below 10−1 µg m−3 were grouped into a single volatility bin, and referred to as low-volatility OA in this study.
The simulated OA volatility distributions, particularly for POA, differed between the 2D-VBS and 1D-VBS_EY simulations. The observations presented a higher fraction of low-volatility POA in GZ than in DY. The spatial variation in POA volatility was captured by the 1D-VBS_EY case. However, both 1D-VBS_EY and 2D-VBS overestimated the contributions of low-volatility POA. In 1D-VBS_EY, non-volatile POA was substantial in mass, and increased with aging (Fig. 3); semi-volatile POA underwent aging, with a portion remaining as POA (rather than fully converting into SOA as in 2D-VBS) but becoming more volatile. This ultimately led to a higher low-volatility POA mass and a lower contribution compared to 2D-VBS. The SOA volatility distributions in the 1D-VBS_EY and 2D-VBS cases both agreed well with the observations, which were similar at the two locations. However, the 2D-VBS simulation predicted a lower fraction of low-volatility BSOA in GZ compared to the 1D-VBS simulations (over 73 % vs. less than 86 %), primarily due to differences in the treatment of monoterpene-derived SOA through oxidation pathways. Additionally, the contribution of low-volatility ASOA was also lower in the 2D-VBS simulation (over 62 % vs. over 69 %; see Fig. S12).
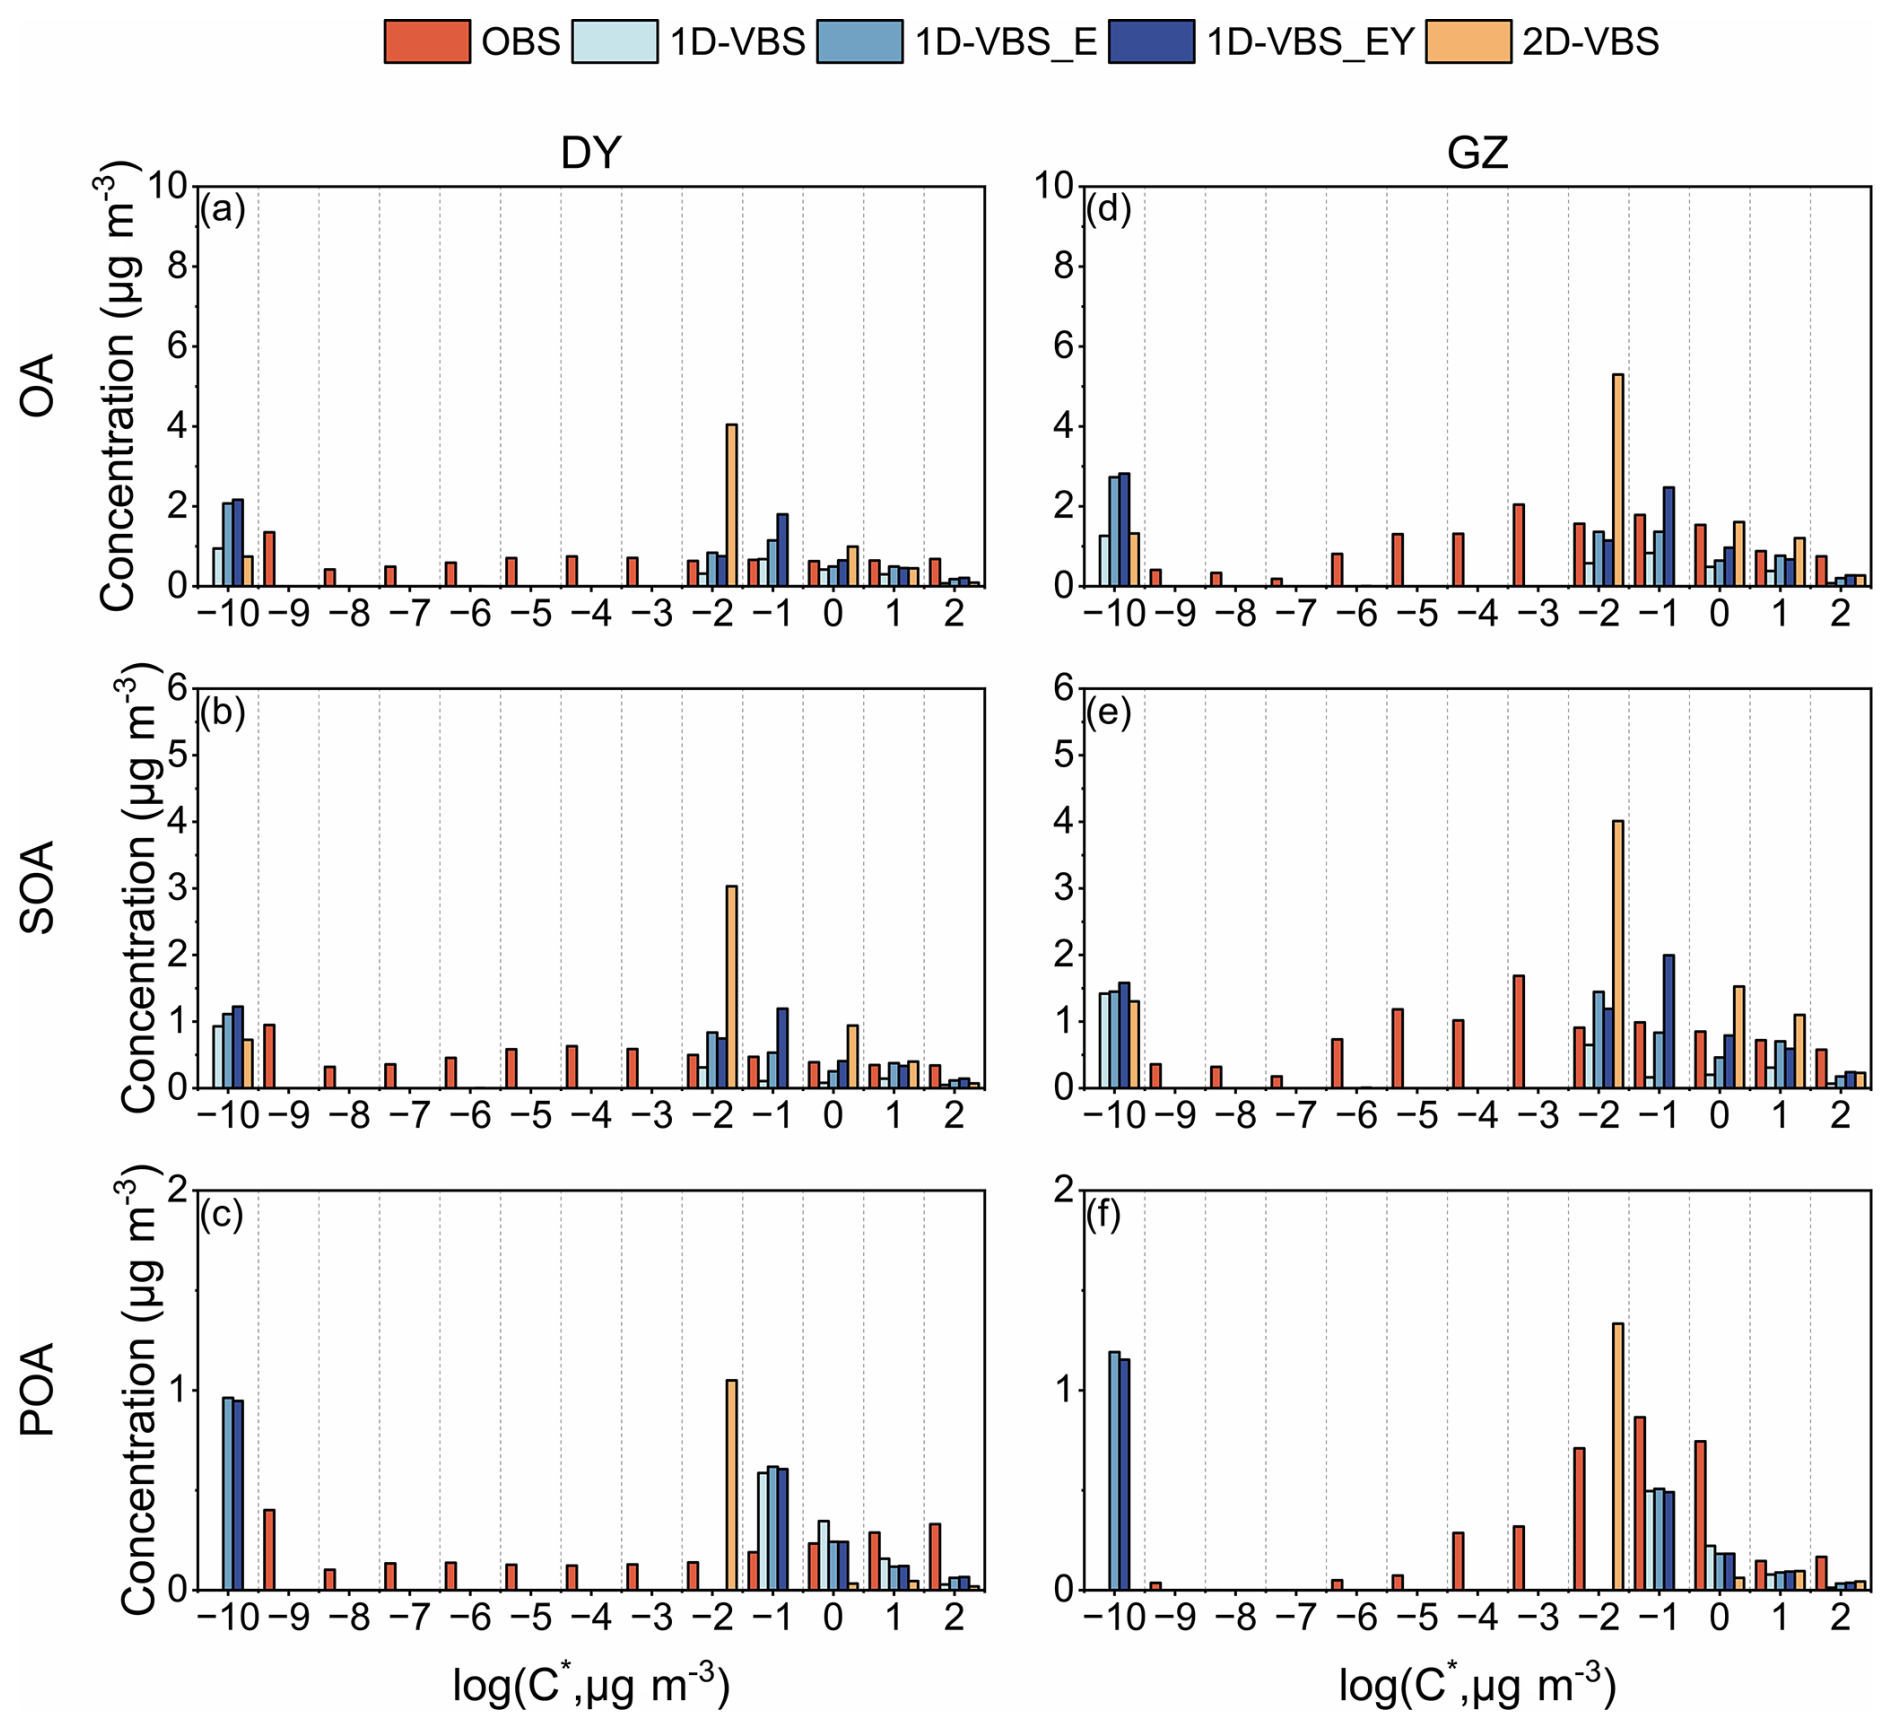
Figure 3Simulated mass concentrations of OA, POA, and SOA across volatility bins with C* ranging from 10−10 to 102 µg m−3, compared to observations in DY (a–c) and GZ (d–f).
It is important to note that LVOCs ( (µg m−3) ) and ELVOCs (extremely low-volatility VOCs with logC∗ (µg m−3) ) were not explicitly resolved in this study (Fig. 3). In all simulations, SOA formation was dominated by species within C∗ bins ranging from 10−2 to 104 µg m−3. In addition, certain assumed “non-volatile” products (IEPOX/MAE-derived SOA, oligomers, etc.) were arbitrarily assigned to the volatility bin of µg m−3 (see Methods). The abundance of mass in the µg m−3 bin was particularly high for the 2D-VBS and largely due to aging. The absence of predicted SOA between the C∗ bins at 10−10 µg m−3 and µg m−3 was in contrary to the observed more uniform distribution across C∗ bins spanning from 10−9 to 10−1 µg m−3. The 1D-VBS_EY case included formation of mass for the volatility bin at µg m−3 for HOMs formed from aromatics and PAHs under low-NOx conditions, but the predicted mass concentration was negligible and biased low relative to the observations. Major ELVOC formation pathways, including autoxidation and bimolecular peroxy radical reactions for monoterpenes, have been incorporated into the Community Regional Atmospheric Chemistry Multiphase Mechanism (CRACMM) (Pye et al., 2023). However, the volatility distribution of the resulting products remained insufficiently resolved. Furthermore, anthropogenic ELVOC formation is not yet well understood (Shrivastava et al., 2024; Yin et al., 2024). As ambient observations consistently reported significant amounts of LVOCs and ELVOCs (Chen et al., 2024; Huang et al., 2024), future work should refine and expand the representation of autoxidation and other chemical processes contributing to LVOC and ELVOC formation from both anthropogenic and biogenic precursors. These improvements will enhance model accuracy in predicting SOA volatility and new particle formation.
3.3 Oxygen-to-carbon ratio simulations
Both observed and simulated OA showed higher ratios during the day and lower ratios at night (Fig. S13), aligning with the temporal patterns of SOA mass concentrations. The higher ratios in the afternoon were linked to elevated oxidant levels, which facilitated SOA formation (typically characterized by higher ratios compared to POA, see Table 2) and the photochemical aging of OA. In contrast, during the night and early morning, the increased contributions of fresh POA led to lower ratios.
Table 2Simulated and observed ratios of OA, POA and SOA in DY and GZ.
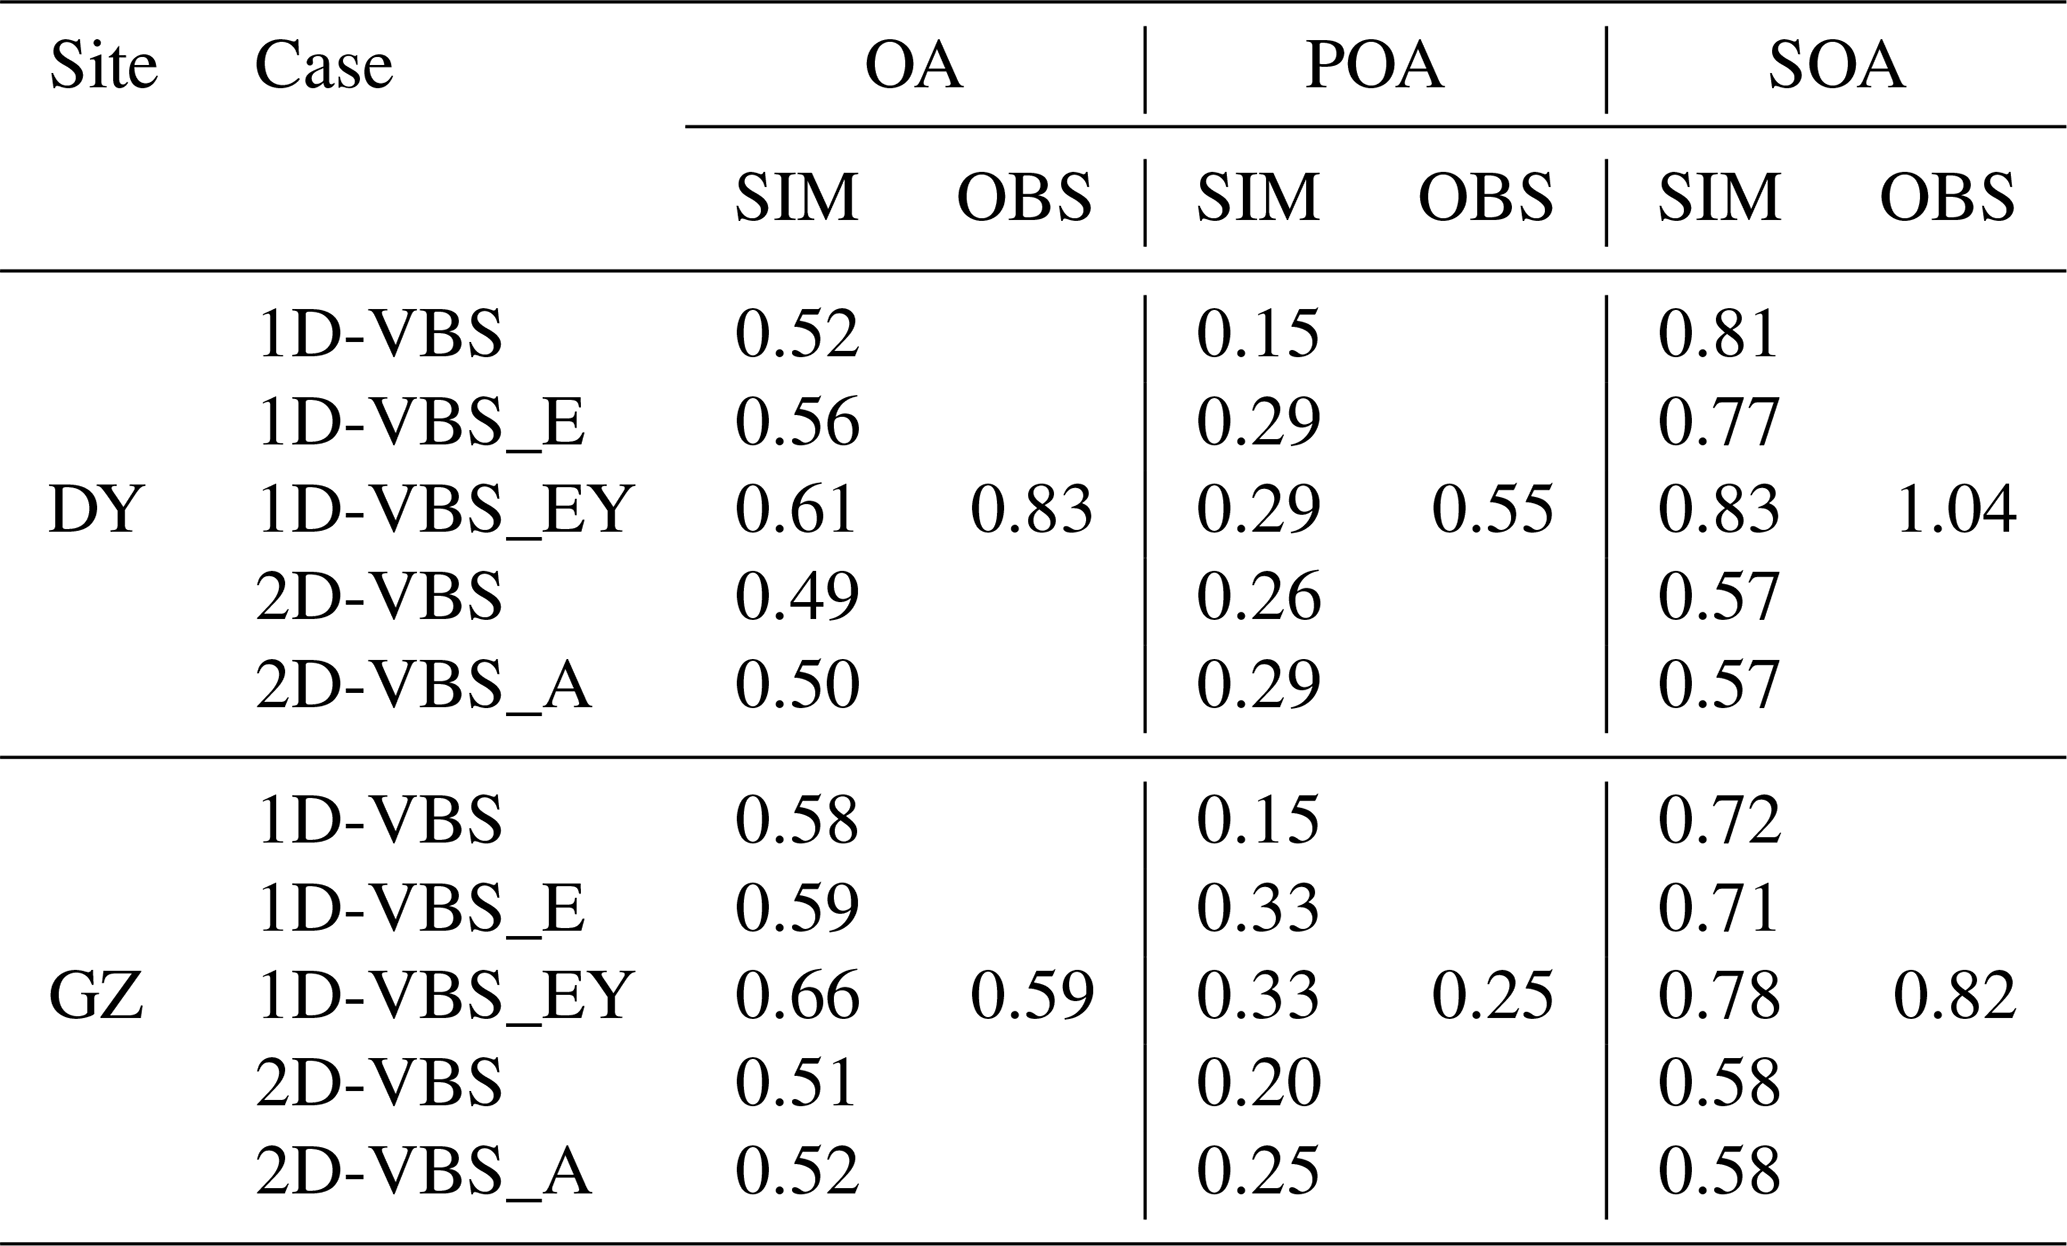
Most simulations underestimated the ratios of OA, with a more pronounced underestimation at the DY site, where both POA and SOA ratios were lower than observed (Table 2). In DY, OA underwent prolonged aging during transport, resulting in a higher ratio (0.84) than the national average (0.3–0.65) (Feng et al., 2023). Although the 1D-VBS_EY case predicted the highest ratio of OA (due to potentially overestimated multi-generational oxidation as discussed in Sect. 3.1), it was still lower than the observed value (0.61 vs. 0.83). This discrepancy suggests that accurately simulating the evolution of OA ratios with aging remains a significant challenge for current CTMs (despite satisfactory mass simulations). The observed POA contained aged HOA, which, although essentially SOA, could not be separated from HOA in DY (Feng et al., 2023), partly explaining the underestimation of POA ratios. In the 1D-VBS_E case, the inclusion of L/S/IVOC emissions increased the ratio of POA but decreased that of SOA, consistent with the impacts on volatility, i.e., increased (decreased) the contribution of low-volatility POA (SOA) (see Figs. 2 and S11). The 1D-VBS_EY case promoted SOA formation at µg m−3 through the newly added volatility bin for ASOA, which was highly oxygenated ( = 2.53, see Table S7), thereby increasing the ratios of SOA. However, the impacts of HOMs were negligible due to their minimal contribution to mass.
At the GZ site, the overestimation of POA ratios in certain cases (i.e., 1D-VBS_E and 1D-VBS_EY) partially offset the underestimation of SOA ratios. As a result, the ratio of total OA in 1D-VBS_E was closest to the observed value (both were 0.59), while the 1D-VBS_EY case overpredicted the ratio (0.66 vs. 0.59). The more oxygenated POA in both simulations than observed could be attributed to overestimations in non-volatile POA mass concentrations. Additionally, COA, with an observed ratio of 0.19 in GZ, were likely underestimated in the simulations given uncertainties in cooking emissions. If COA were well represented, it could slightly lower the simulated POA ratios and reduce the positive biases in the 1D-VBS_E and 1D-VBS_EY simulations in GZ. It was also found that wind speeds were overestimated at GZ (Fig. S14), which could lead to excessive dilution and consequently reduce the simulated concentrations of locally emitted POA and freshly formed SOA (both of which typically exhibit lower ratios than aged POA or SOA). This effect would be expected to increase the simulated . However, the low biases in at GZ indicate that meteorological biases are unlikely to be the dominant factor, and that limitations in the SOA representations may play a more important role.
The ratios predicted by the 2D-VBS case were lower than those in other simulations, primarily due to the underestimation in SOA ratios. In particular, the distribution of ASOA ratios differed significantly from those in the 1D-VBS simulations (see Fig. S15), highlighting the constraint of ASOA ratios in future work. Simulated POA ratios were mainly influenced by how emissions were specified in the model. As the default settings in 2D-VBS underestimated POA ratios, an additional simulation, 2D-VBS_A, was conducted with updated ratios for emissions, constrained by those of POA factors in observations from prior studies (Table S6 and Fig. S16). For instance, in the default configuration, mobile sources were assumed to emit primarily hydrocarbons and low-oxygenated compounds, with over 90 % of emissions distributed in the bins of 0 and 0.1. The optimized parameters in the 2D-VBS_A case reflected a higher degree of oxygenation, with more than 60 % of emissions allocated to the bins of 0.2 and 0.4. As a result, the POA increased from 0.26 (DY) and 0.20 (GZ) in 2D-VBS to 0.29 and 0.25 in 2D-VBS_A, respectively, and showed good agreement with the observation in GZ. However, the persistent low bias in POA ratios in DY was likely attributable to uncertainties in emissions from sources with higher , such as biomass burning (with an observed ratio of 0.37 for BBOA) in the simulations, as well as potential overestimation of observed POA ratios due to the influence of aged HOA.
Apart from underestimations in OA ratios in most cases, the simulations struggled to capture the spatiotemporal variability on an hourly basis (Fig. 4). The observations revealed significant differences in the ratios between DY and GZ, reflecting distinct aging processes associated with site characteristics (i.e., regional transport at DY versus dominant local emissions at GZ), rather than differences in oxidant levels, as comparable O3 concentrations were observed at both sites. As discussed above, current SOA parameterizations inadequately represent chemical aging processes and thereby fail to reproduce the observed spatial contrasts in oxidation state. The observations also exhibited considerable temporal variability, particularly at the GZ site with abundant fresh emissions. Specifically, the interquartile range (IQR) of hourly ratios was 0.77–0.89 in DY and 0.52–0.68 in GZ in the observations. However, the simulated ratios of OA showed less variability than observed in GZ, with narrower IQRs and Standard Deviation Ratios (SDR) lower than 1.0.
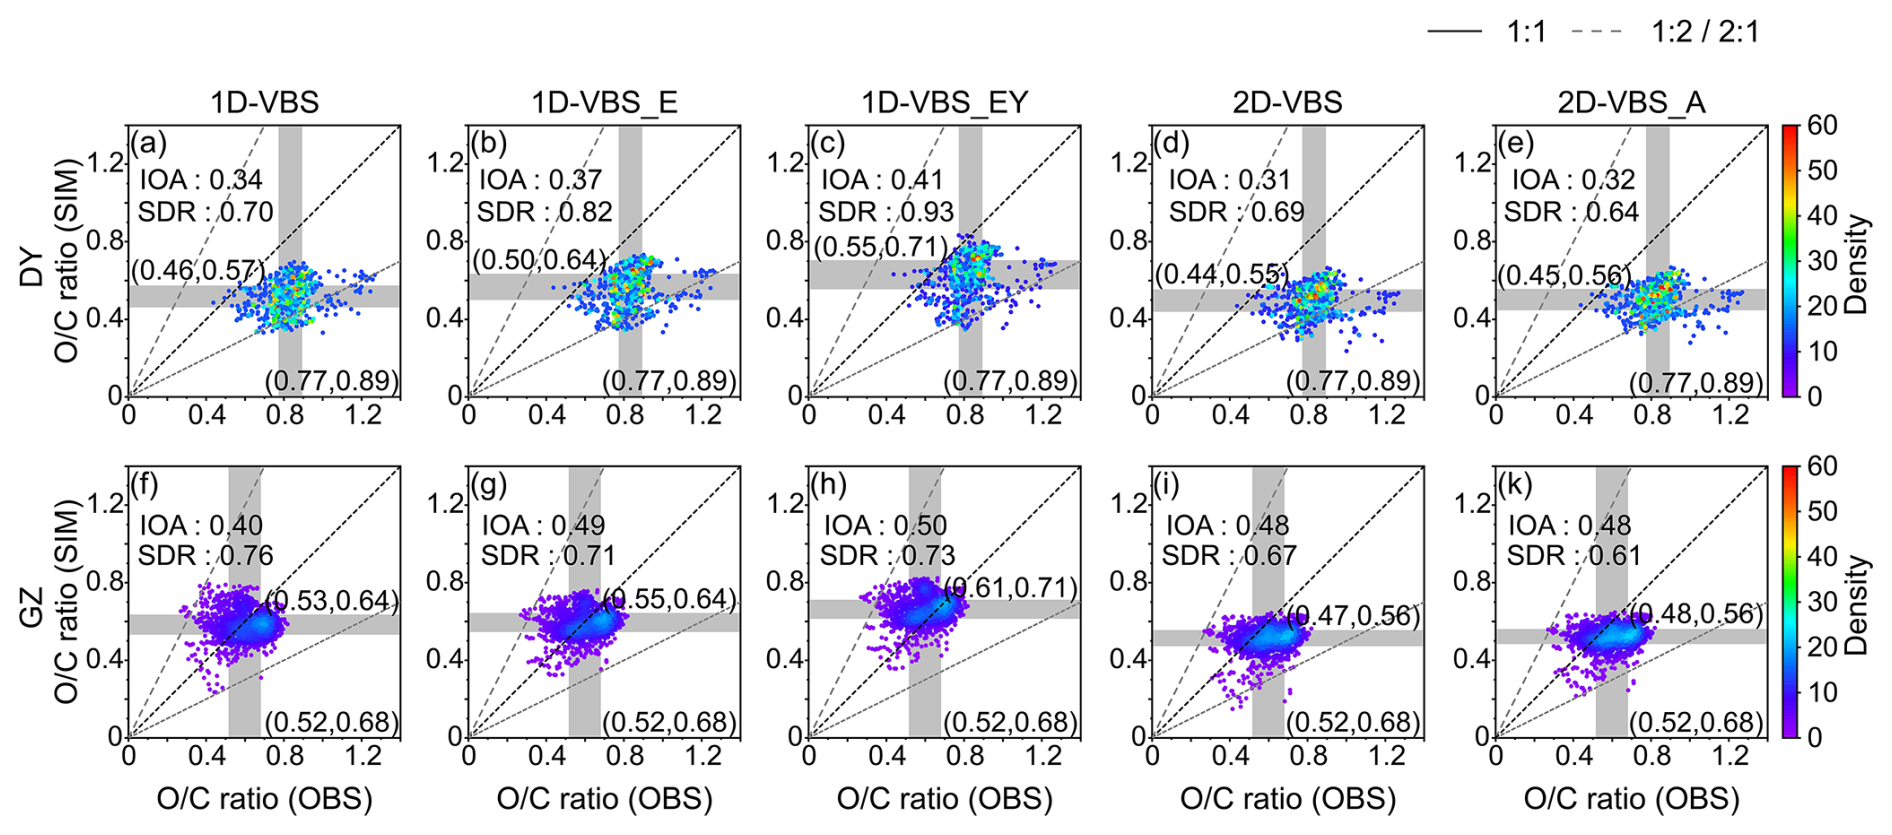
Figure 4Density distribution of simulated versus observed hourly ratios of OA in DY (a–e) and GZ (f–k). The edges of the grey shading represent the 25th and 75th percentiles in both the observations and simulations, with the shading indicating the interquartile range (IQR). The Index of Agreement (IOA, reflecting both bias and variability) and Standard Deviation Ratio (, comparing the magnitude of variability in simulations and observations) are calculated.
The responses of daily OA ratios to ambient O3 concentrations were also examined (Fig. 5). All the simulations demonstrated an increased in ratios as O3 levels rose (indicating a higher atmospheric oxidative capacity), with the rates in the range of 0.0023–0.0045 per ppb O3. The 2D-VBS simulations exhibited a steeper slope, suggesting stronger sensitivity to O3 levels. This implied that oxidant abundance in the gas phase was an important driver of the increase in ratios in the simulations. However, the observations did not show a clear correlation between ratios and O3. In DY, this could be due to the decoupling of ratios from local O3 in aged air masses. Other factors, such as fresh emissions in GZ (see Fig. S17) or aqueous formation pathways, may also contribute to the observed variations in ratios.
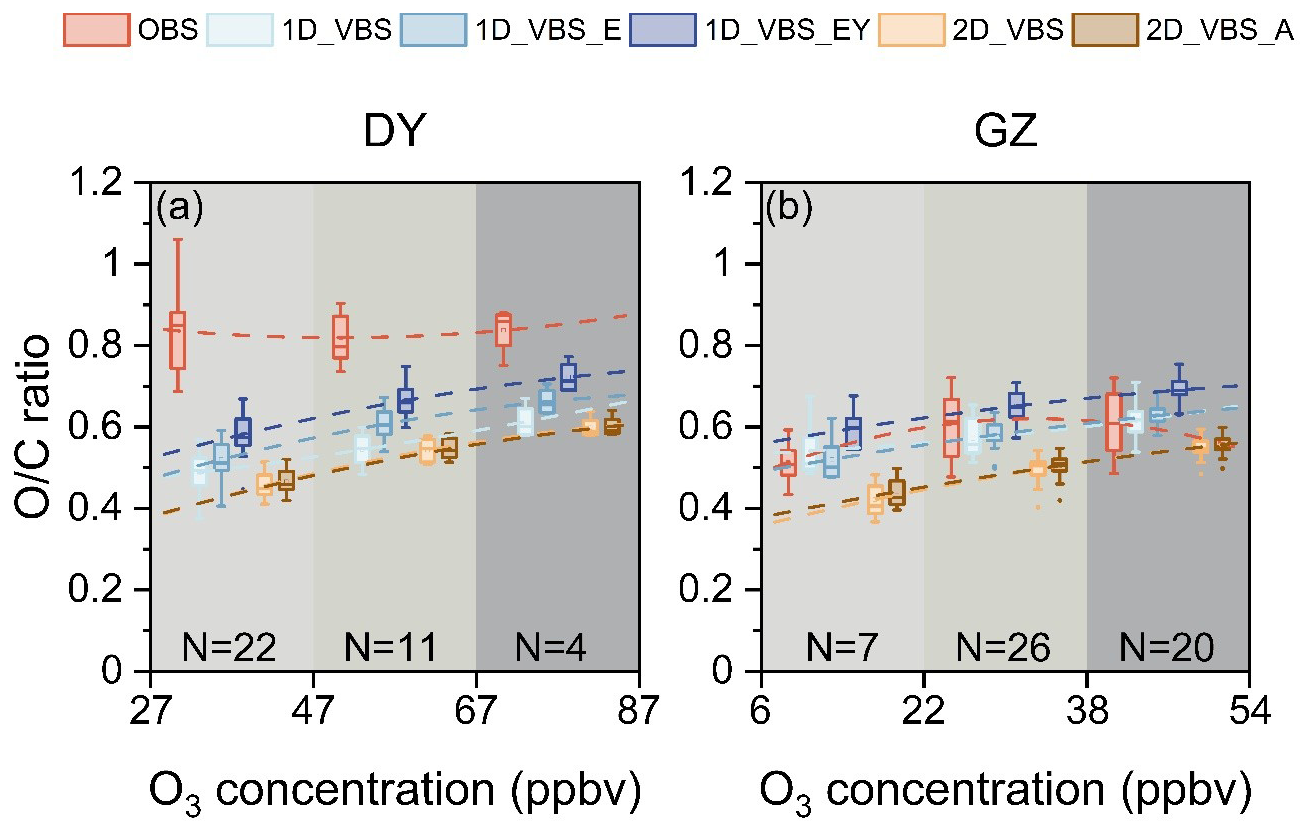
Figure 5Simulated changes in OA ratios with daily mean ozone (O3) concentrations, compared to observations in DY (a) and GZ (b). The paired data of ratios and O3 were grouped into three bins with equal intervals of O3 levels. Dashed lines represent fitted trends, and the values of N denote the sample size within each bin.
3.4 Implications for Tg and viscosity predictions
Several widely used CTMs, including WRF-Chem and GEOS-Chem, have been utilized to predict OA viscosity and phase state based on volatility and (Zhang et al., 2024; Luu et al., 2025). In this study, three parameterizations of Tg were employed to investigate how model capability in representing volatility and influences the predictions of Tg (and the resulting viscosity using the VTF equation, see Methods): (1) one incorporating both and volatility (Eq. 2), (2) one accounting for both volatility and molecular mass (Eq. 3), and (3) one based solely on volatility (Eq. 1). Given that Eq. (3) was developed from laboratory experiments focused on isoprene SOA, its applicability to POA and ASOA warrants further evaluation (which is beyond the scope of this study). Nevertheless, it was included here as a comparative parameterization to evaluate impacts of volatility representations. The simulation at the DY site was selected for detailed analysis as a representative case.
In DY, the mean Tg,org values for POA and SOA showed differences across parameterizations, ranging from 15.5 to 24.4 K for POA and 19.3 to 23.0 K for SOA (Fig. 6). The parameterization based on Eq. (1) generally predicted the highest Tg,org values, closely aligning with those from Eq. (2) as has been reported in Li et al. (2020). This suggests that simulated volatility distributions exerted a stronger influence on Tg,org predictions than ratios, as further evidenced by the Tg,org values of individual SOA surrogates (Fig. S18). Equation (3) predicted the lowest Tg,org values, including for nearly all SOA components except a few isoprene SOA surrogates. For isoprene SOA components, Tg estimates remained constant using either Eqs. (1) or (3), due to the use of a fixed C* of 10−10 µg m−3 in CMAQ (see Methods), which resulted in unrealistically high Tg values, e.g., ∼ 400 K with Eq. (1). However, 2-methyltetrol (AIETET), despite its unexpectedly high ambient concentrations, might be semi-volatile, with predicted C* of 102 µg m−3, while 2-methyltetrol sulfate (AIEOS) has a relatively low volatility, with C* of 10−1 µg m−3 (Budisulistiorini et al., 2017). These values resulted in much lowerTg estimates of approximately 230 and 276 K, respectively (Zhang et al., 2019). Therefore, the C* values for these compounds should be revisited when applied in Tg predictions.
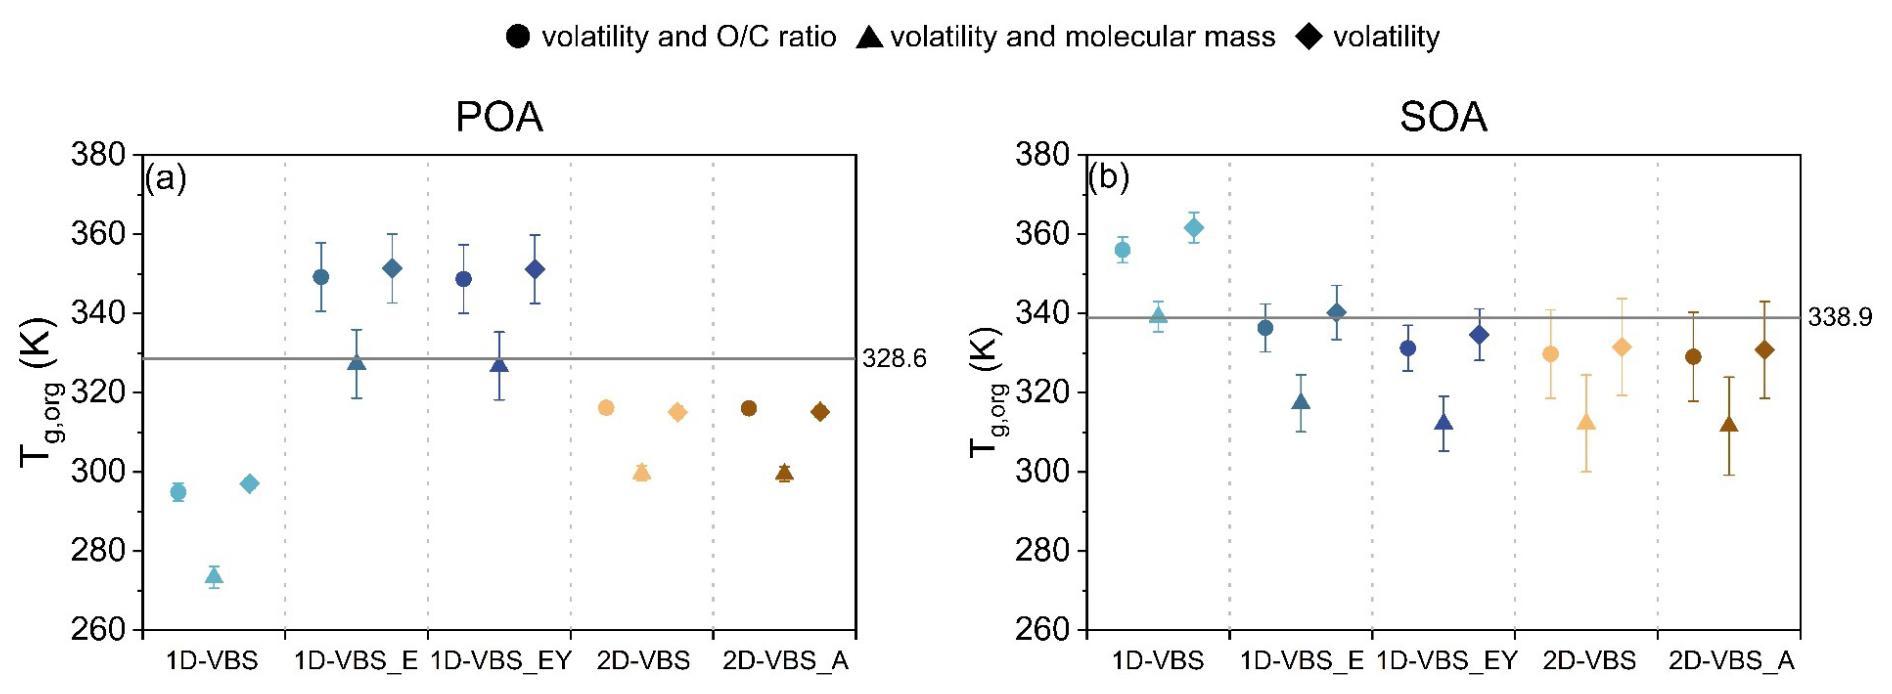
Figure 6Predicted Tg,org of (a) POA and (b) SOA using three parameterizations across different simulation cases. The solid line represents Tg,org derived from observed volatility and ratios. Symbols denote Tg,org estimated from: volatility and ratio using Eq. (2) (circles), volatility and molecular weight using Eq. (3) (triangles), and volatility only using Eq. (1) (diamonds). Error bars indicate one standard deviation.
The discrepancies in POA Tg,org derived from observed versus simulated volatility and ratios using Eq. (2) ranged from 12.4 to 33.7 K across the five simulations. Compared to observation-based Tg,org, the 2D-VBS, 2D-VBS_A, and 1D-VBS simulations underestimated POA Tg,org, whereas the 1D-VBS_E and 1D-VBS_EY simulations overpredicted it, primarily due to a substantial contribution from non-volatile POA (Fig. S11). Although the 2D-VBS simulation exhibited the highest fraction of low-volatility POA (Fig. 2), these species were mainly allocated to the volatility bin of µg m−3, which led to lower Tg,org values than those inferred from observations. The biases in SOA Tg,org were smaller, ranging from 2.5 to 17.2 K. Most simulations exhibited a slight underestimations of SOA Tg,org relative to observation-derived values. Conversely, the 1D-VBS case overestimated SOA Tg,org, with an excessive proportion of SOA at µg m−3 (Fig. S11). Since Eqs. (1) and (2) were developed for use within the 1D-VBS and 2D-VBS frameworks, respectively, the evaluation presented here suggests that the differences in Tg,org estimates were driven by the volatility representations in the 1D-VBS versus 2D-VBS, rather than by the specific Tg parameterizations. Notably, the 2D-VBS implementation in CMAQv5.4 generally produced lower SOA Tg,org values.
The values of OA viscosity η, which determine their phase state, were calculated using the VTF equation, with Tg parameterized as a function of volatility and ratios (Eq. 2), and incorporating additional variables including κorg, RH, and T (see Methods). Figure 7a and e compared viscosity estimated from simulations and observations, with all input variables (i.e., Tg,org, κorg, RH and T) obtained consistently from either model output or observations. In the simulations, κorg for each OA species was parameterized as a function of (Eq. S7), assuming a constant density of 1.4 g cm−3. Bulk κorg for SOA and POA was calculated as a mass-weighted average across species. For observations, κorg was inferred from f44 (i.e., the fraction of 44 signal in total organic signals) following Feng et al. (2023). The simulations generally reproduced the diurnal variability in OA viscosity, predicting higher η values during the daytime than at night, in line with the observed diurnal patterns. Field measurements indicated that POA was predominantly semi-solid ( Pa s) with a transition to the solid phase (η>1012 Pa s) between 12:00 and 17:00 LT. However, the model overestimated viscosity. Consequently, the 2D-VBS and 2D-VBS_A simulations predicted prolonged solid phase for POA, while 1D-VBS_E and 1D-VBS_EY predicted POA to remain solid throughout the day. For SOA, observations showed that it was semi-solid, while the simulations reproduced this phase state during nighttime hours only.
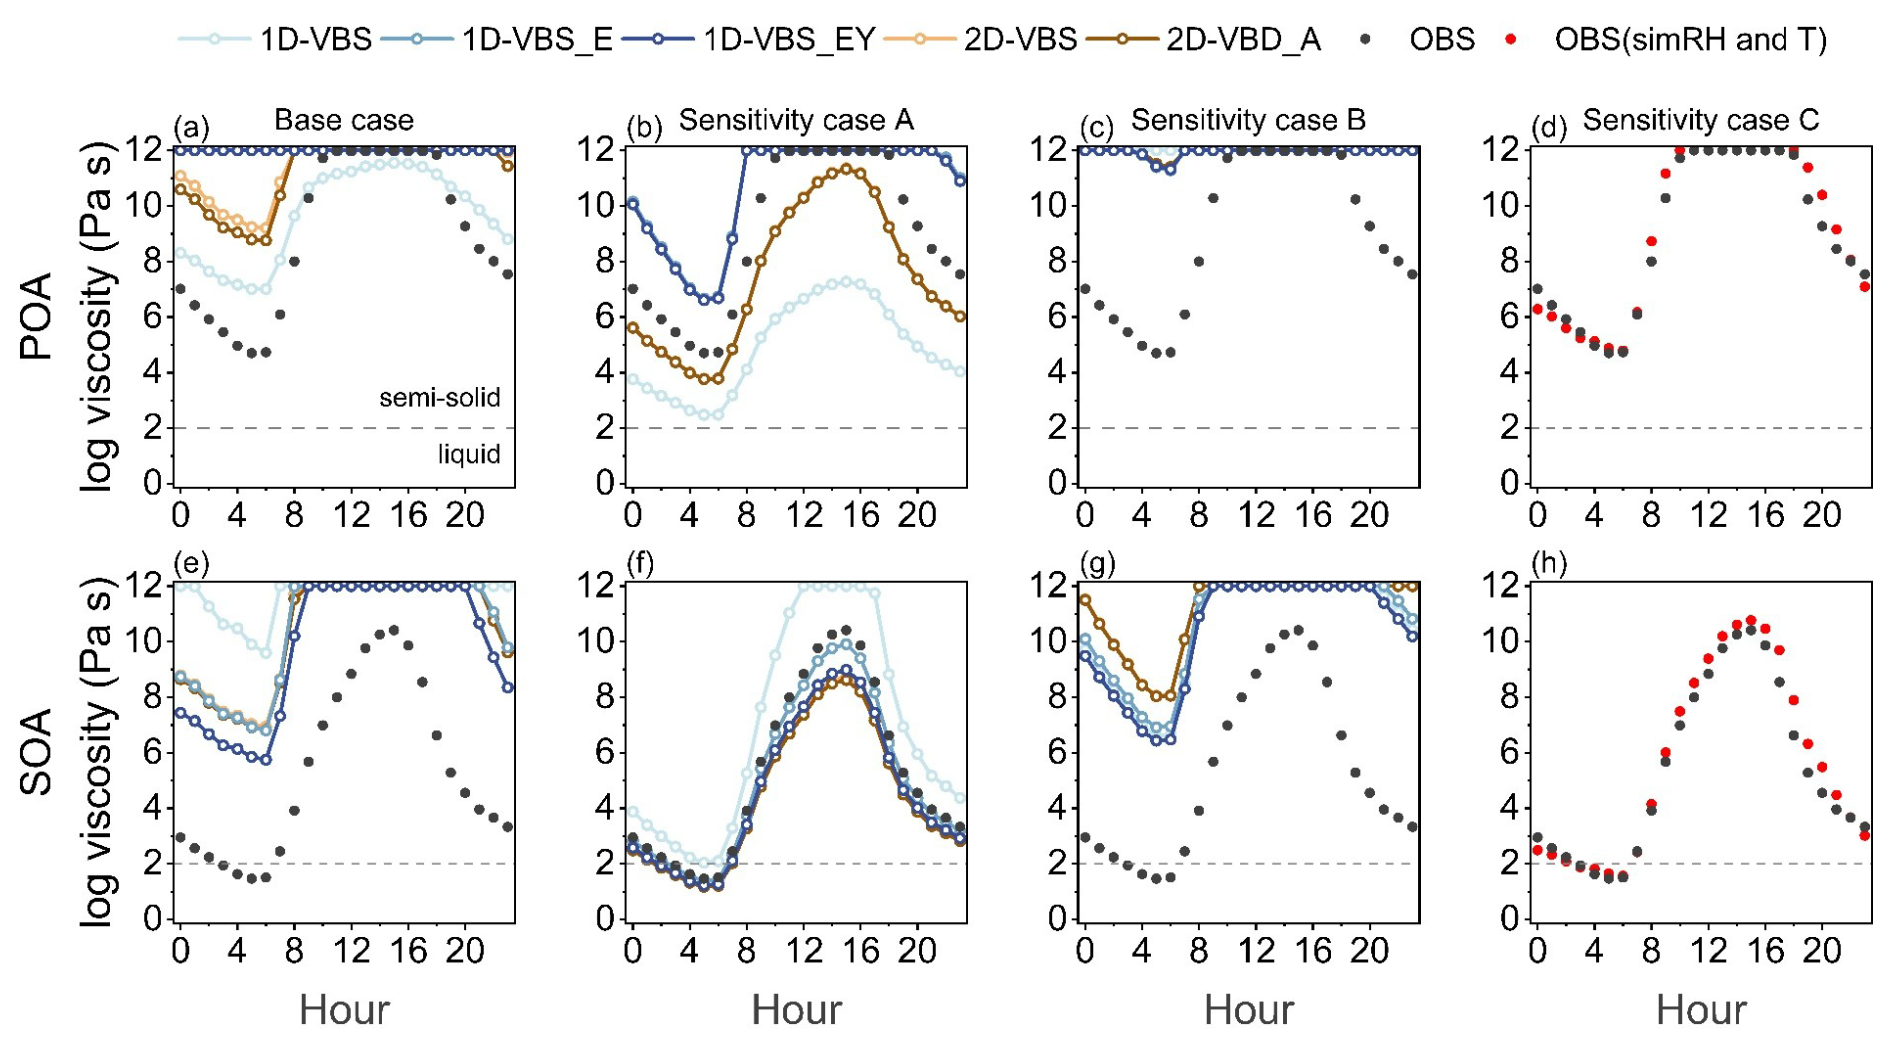
Figure 7Diurnal variations in predicted OA viscosity using Eq. (2), based on observations and simulations. Black points indicate observation-based values, while colored lines represent predictions using combinations of Tg,org, κorg, RH, and T from observations or simulations as defined in Table 3. Red points indicate viscosity estimated using observation-based Tg,org and κorg values, along with simulated RH and T. The OA phase state is determined based on viscosity: liquid (η<102 Pa s), semi-solid ( Pa s), and solid (η>1012 Pa s) (Reid et al., 2018). Viscosity values in the figure are capped at 1012 Pa s, beyond which values are not physically meaningful for solid-phase OA.
To identify the dominant source of overestimation in predicted viscosity, three sensitivity experiments were conducted (Table 3), each isolating the influence of a specific input variable. The results from sensitivity experiment A (Fig. 7b and f) revealed that the evident model-observation discrepancies in POA and SOA viscosity were positively correlated with the biases in Tg,org. For instance, in the 1D-VBS case, POA viscosity was significantly underestimated (by up to five orders of magnitude) due to a ∼ 40 K negative bias in Tg,org (Fig. S19a), while an overestimation of Tg,org for SOA (∼ 20 K, Fig. S19d) led to viscosity exceeding observation-based values by up to two orders of magnitude. In contrast, simulations such as 1D-VBS_E and 1D-VBS_EY, which better captured SOA Tg,org, yielded viscosity values in good agreement with observations. Thus, by comparing Fig. 7e and f, we conclude that the considerable overestimation of SOA viscosity in Fig. 7e, except in 1D-VBS, cannot be attributed to Tg,org bias. O'Brien et al. (2021) also reported a moderate sensitivity of predicted OA viscosity to Tg,org, e.g., under conditions of RH = 60 %, a reduction in Tg,org by ∼ 200 K resulted in a decrease in predicted viscosity from 1012 to 10 Pa s (with κorg of 0.14).
Table 3Combinations of Tg,org, κorg, RH and T used in sensitivity cases for OA viscosity estimation.
On the other hand, the OA hygroscopicity parameter (κorg) was an important parameter in viscosity estimation. Sensitivity experiment B predicted viscosity comparable to those in Fig. 7a and e, indicating that the discrepancies between simulation- and observation-based viscosity values was due to the variation in κorg. Specifically, the κorg values used in the simulations underestimated the hygroscopicity of both POA and SOA relative to the values derived from 44 (Fig. S20), e.g. 0.16 versus 0.048–0.069 (1D-VBS)0.064–0.068 (2D-VBS) for POA, and 0.35 verus 0.013–0.014(1D-VBS)0.12 (2D-VBS) for SOA. Earlier sensitivity simulations showed that a perturbation of ±0.05 in κorg resulted in changes of Tg,ωorg by ∼ 5 %–15 % over high RH areas, supporting a critical role of κorg in viscosity estimation (Shiraiwa et al., 2017). Consistently, the underestimation in κorg led to an overestimation in simulated viscosity in this study (given the inverse relationship between viscosity and hygroscopicity), and even offset the underestimations of viscosity that were caused by low biases in Tg,org (see Sensitivity experiment A). In CMAQ, κorg was parameterized as a function of . In light of the notable underestimation of ratios at the DY site (Table 2), this could be a key driver of the bias in viscosity predictions. While the impact of relative humidity on viscosity has also been emphasized in other studies (Maclean et al., 2021; Rasool et al., 2021; Li et al., 2021b), its effect is minimal in this study due to the strong agreement between simulated and observed meteorological variables (Fig. S21). This was further supported by the similarity in viscosity estimates derived using identical κorg and Tg,org but different RH and T inputs (Fig. 7d and h).
This study evaluated the CMAQ model's performance in predicting OA mass concentrations, volatility distributions, and ratios, and examined their implications for Tg and viscosity estimates, using observations at two representative sites in Eastern China, i.e., DY, influenced by aged air masses, and GZ, more impacted by local emissions. The major findings include:
-
The base 1D-VBS simulation with AERO7i underestimated OA by ∼ 70 %. However, the optimized 1D-VBS simulation, which incorporated additional L/S/IVOC emissions and enhanced SOA production from aromatics and PAHs (accounting for vapor wall losses and autooxidation), significantly improved OA predictions with NMBs of −27 % (DY) and −34 % (GZ). The 2D-VBS simulation exhibited similar performance with NMBs of −24 %. The OA biases were mainly driven by SOA underestimation, with the optimized 1D-VBS underestimating SOA by ∼ 32 % and 2D-VBS underestimating it by ∼ 13 %.
-
All the simulations accurately captured the observed fraction of low-volatility products in OA (> 70 %), although the detailed distributions within these volatility bins (10−9 µg m µg m−3) were not well represented. Simulated SOA was abundant in volatility bins of µg m−3 or 10−10 µg m−3. The volatility distributions of POA showed notable variations across the simulations, influenced by the gas/particle partitioning of L/SVOC emissions specified in the model.
-
OA ratios were generally underestimated across all the simulations, particularly in DY, where aged air masses prevailed. In the 1D-VBS simulations, the inclusion of L/S/IVOC emissions increased ratios with more non-volatile POA, while updated SOA yields added SOA at µg m−3 , contributing to higher SOA ratios. The 2D-VBS simulations presented lower ratios than 1D-VBS overall, whereas constraining POA with observations improved its representation.
The simulated volatility distribution strongly influenced Tg estimates. In particular, the fraction of POA and SOA in the lowest volatility bin ( µg m−3) played an important role. The assumption of µg m−3 resulted in unrealistically high Tg values for some OA components (e.g., isoprene SOA). Although the high (low) biases in Tg led to overestimation (underestimation) of viscosity in the case of DY, uncertainties in OA hygroscopicity parameter, parameterized as a function of ratios in CMAQ, were the dominant source of model-observation gaps in viscosity.
These findings highlight the limitations of the CMAQ model in predicting the volatility distribution of OA and the associated ratios. While the allocation of OA in low-volatility bins may have a limited impact on simulated mass concentrations under atmospherically relevant conditions, it is closely linked to key physicochemical properties, such as Tg, viscosity, and phase state. These properties, which have received insufficient attention in previous studies, play a crucial role in the kinetics of multiphase SOA formation. Additionally, estimates of OA hygroscopicity and light absorptivity – both of which influence climate effects – may be subject to uncertainties when parameterized based on ratios. In some cases, inaccurate treatment of these properties could also influence OA mass concentrations. For example, OA hygroscopicity affects water uptake, which can, in turn, enhance SOA mass through interactions between water and organics. Therefore, we summarize several recommendations based on this study for future improvements in OA modeling:
Given the substantial contribution of L/S/IVOCs to SOA, emission inventories should be further refined not only in terms of total magnitudes but also volatility-resolved distributions, and constrained using ambient measurements. In addition, primary emissions from sources such as cooking, open biomass burning, and mobile sources require improved representation. Better treatment of nighttime SOA formation pathways, particularly NO3 oxidation and aqueous-phase chemistry, is also needed to reduce SOA mass underestimation.
While updated SOA yields can partially improve model performance, explicitly accounting for autoxidation processes and the formation of HOMs (including both biogenic and anthropogenic origins) would provide a more physically based description of evolution. Moreover, SOA aging schemes should be better constrained by chamber experiments, particularly with respect to the relationship between the degree of oxygenation and multigenerational aging. Constraining POA ratios using source-specific measurements also represents a promising approach for improving the modeled elemental composition of OA.
The linkage between OA volatility and Tg,org (and viscosity) requires revisiting the volatility assignments of existing SOA surrogates (e.g., isoprene-derived SOA in CMAQ) and developing more accurate, dynamic parameterizations of κorg.
The measurement data are publicly available in previous publications listed in the references. Two versions of CMAQ used in this paper, CMAQv5.3.2 and CMAQv5.4 are archived at https://doi.org/10.5281/zenodo.4081737 (US EPA Office of Research and Development, 2020) and https://doi.org/10.5281/zenodo.7218076 (US EPA Office of Research and Development, 2022). CMAQ model output data and Python scripts used to generate the figures are available upon request from the corresponding author.
The supplement related to this article is available online at https://doi.org/10.5194/acp-26-1001-2026-supplement.
MQ and Yu L designed and coordinated the research. MQ, WH, YiL, MH and JH were responsible for funding acquisition. YuL conducted the CMAQ simulations and processed the simulation data. WH provided the OA measurements. YuL, MQ, WH, BZ, YiL and HOTP interpreted the comparison between simulations and measurements. YuL and MQ wrote the original draft. All co-authors reviewed and edited the manuscript.
The contact author has declared that none of the authors has any competing interests.
Publisher's note: Copernicus Publications remains neutral with regard to jurisdictional claims made in the text, published maps, institutional affiliations, or any other geographical representation in this paper. The authors bear the ultimate responsibility for providing appropriate place names. Views expressed in the text are those of the authors and do not necessarily reflect the views of the publisher.
The authors would like to acknowledge the Chinese Ministry of Science and Technology for their support through the Key Research and Development Program (Grant No. 2022YFC3701000). This research was also supported by the National Natural Science Foundation of China (Grant No. 42107117, 42475124 and 42575192), the International Partnership Program of the Chinese Academy of Sciences (Grant No. 164GJHZ2023068FN), and the Qing Lan Project of Colleges and Universities in Jiangsu Province.
This research has been supported by the Ministry of Science and Technology of the People's Republic of China, National Key Research and Development Program of China (grant no. 2022YFC3701000) and the National Natural Science Foundation of China (grant nos. 42107117, 42575192 and 42475124), the International Partnership Program of the Chinese Academy of Sciences (grant no. 164GJHZ2023068FN), and the Qing Lan Project of Colleges and Universities in Jiangsu Province.
This paper was edited by Benjamin A Nault and reviewed by three anonymous referees.
Angell, C. A.: Relaxation in liquids, polymers and plastic crystals – strong/fragile patterns and problems, J. Non-Cryst. Solids., 131–133, 13-31, https://doi.org/10.1016/0022-3093(91)90266-9, 1991.
Appel, K. W., Bash, J. O., Fahey, K. M., Foley, K. M., Gilliam, R. C., Hogrefe, C., Hutzell, W. T., Kang, D., Mathur, R., Murphy, B. N., Napelenok, S. L., Nolte, C. G., Pleim, J. E., Pouliot, G. A., Pye, H. O. T., Ran, L., Roselle, S. J., Sarwar, G., Schwede, D. B., Sidi, F. I., Spero, T. L., and Wong, D. C.: The Community Multiscale Air Quality (CMAQ) model versions 5.3 and 5.3.1: system updates and evaluation, Geosci. Model Dev., 14, 2867–2897, https://doi.org/10.5194/gmd-14-2867-2021, 2021.
Bilsback, K. R., He, Y., Cappa, C. D., Chang, R. Y.-W., Croft, B., Martin, R. V., Ng, N. L., Seinfeld, J. H., Pierce, J. R., and Jathar, S. H.: Vapors Are Lost to Walls, Not to Particles on the Wall: Artifact-Corrected Parameters from Chamber Experiments and Implications for Global Secondary Organic Aerosol, Environ. Sci. Technol., 57, 53–63, https://doi.org/10.1021/acs.est.2c03967, 2023.
Budisulistiorini, S. H., Nenes, A., Carlton, A. G., Surratt, J. D., McNeill, V. F., and Pye, H. O. T.: Simulating Aqueous-Phase Isoprene-Epoxydiol (IEPOX) Secondary Organic Aerosol Production During the 2013 Southern Oxidant and Aerosol Study (SOAS), Environ. Sci. Technol., 51, 5026–5034, https://doi.org/10.1021/acs.est.6b05750, 2017.
Carlton, A. G., Turpin, B. J., Altieri, K. E., Seitzinger, S. P., Mathur, R., Roselle, S. J., and Weber, R. J.: CMAQ Model Performance Enhanced When In-Cloud Secondary Organic Aerosol is Included: Comparisons of Organic Carbon Predictions with Measurements, Environ. Sci. Technol., 42, 8798–8802, https://doi.org/10.1021/es801192n, 2008.
Carlton, A. G., Bhave, P. V., Napelenok, S. L., Edney, E. O., Sarwar, G., Pinder, R. W., Pouliot, G. A., and Houyoux, M.: Model representation of secondary organic aerosol in CMAQv4.7, Environ. Sci. Technol., 44, 8553–8560, https://doi.org/10.1021/es100636q, 2010.
Chacon-Madrid, H. J. and Donahue, N. M.: Fragmentation vs. functionalization: chemical aging and organic aerosol formation, Atmos. Chem. Phys., 11, 10553–10563, https://doi.org/10.5194/acp-11-10553-2011, 2011.
Champion, W. M., Rothfuss, N. E., Petters, M. D., and Grieshop, A. P.: Volatility and Viscosity Are Correlated in Terpene Secondary Organic Aerosol Formed in a Flow Reactor, Environ. Sci. Technol. Lett., 6, 513–519, https://doi.org/10.1021/acs.estlett.9b00412, 2019.
Chang, X., Zhao, B., Zheng, H., Wang, S., Cai, S., Guo, F., Gui, P., Huang, G., Wu, D., Han, L., Xing, J., Man, H., Hu, R., Liang, C., Xu, Q., Qiu, X., Ding, D., Liu, K., Han, R., Robinson, A. L., and Donahue, N. M.: Full-volatility emission framework corrects missing and underestimated secondary organic aerosol sources, One Earth, 5, 403–412, https://doi.org/10.1016/j.oneear.2022.03.015, 2022.
Chen, Q., Miao, R., Geng, G., Shrivastava, M., Dao, X., Xu, B., Sun, J., Zhang, X., Liu, M., Tang, G., Tang, Q., Hu, H., Huang, R.-J., Wang, H., Zheng, Y., Qin, Y., Guo, S., Hu, M., and Zhu, T.: Widespread 2013-2020 decreases and reduction challenges of organic aerosol in China, Nat. Commun., 15, 4465, https://doi.org/10.1038/s41467-024-48902-0, 2024.
Chen, W., Ye, Y., Hu, W., Zhou, H., Pan, T., Wang, Y., Song, W., Song, Q., Ye, C., Wang, C., Wang, B., Huang, S., Yuan, B., Zhu, M., Lian, X., Zhang, G., Bi, X., Jiang, F., Liu, J., Canonaco, F., Prevot, A. S. H., Shao, M., and Wang, X.: Real-Time Characterization of Aerosol Compositions, Sources, and Aging Processes in Guangzhou During PRIDE-GBA 2018 Campaign, J. Geophys. Res., 126, e2021JD035114, https://doi.org/10.1029/2021JD035114, 2021.
Chrit, M., Sartelet, K., Sciare, J., Majdi, M., Nicolas, J., Petit, J.-E., and Dulac, F.: Modeling organic aerosol concentrations and properties during winter 2014 in the northwestern Mediterranean region, Atmos. Chem. Phys., 18, 18079–18100, https://doi.org/10.5194/acp-18-18079-2018, 2018.
Coggon, M. M., Gkatzelis, G. I., McDonald, B. C., Gilman, J. B., Schwantes, R. H., Abuhassan, N., Aikin, K. C., Arend, M. F., Berkoff, T. A., Brown, S. S., Campos, T. L., Dickerson, R. R., Gronoff, G., Hurley, J. F., Isaacman-VanWertz, G., Koss, A. R., Li, M., McKeen, S. A., Moshary, F., Peischl, J., Pospisilova, V., Ren, X., Wilson, A., Wu, Y., Trainer, M., and Warneke, C.: Volatile chemical product emissions enhance ozone and modulate urban chemistry, Proceedings of the National Academy of Sciences, 118, e2026653118, https://doi.org/10.1073/pnas.2026653118, 2021.
DeRieux, W.-S. W., Li, Y., Lin, P., Laskin, J., Laskin, A., Bertram, A. K., Nizkorodov, S. A., and Shiraiwa, M.: Predicting the glass transition temperature and viscosity of secondary organic material using molecular composition, Atmos. Chem. Phys., 18, 6331–6351, https://doi.org/10.5194/acp-18-6331-2018, 2018.
Dette, H. P., Qi, M., Schröder, D. C., Godt, A., and Koop, T.: Glass-Forming Properties of 3-Methylbutane-1,2,3-tricarboxylic Acid and Its Mixtures with Water and Pinonic Acid, J. Phys. Chem. A, 118, 7024–7033, https://doi.org/10.1021/jp505910w, 2014.
Donahue, N. M., Epstein, S. A., Pandis, S. N., and Robinson, A. L.: A two-dimensional volatility basis set: 1. organic-aerosol mixing thermodynamics, Atmos. Chem. Phys., 11, 3303–3318, https://doi.org/10.5194/acp-11-3303-2011, 2011.
Donahue, N. M., Kroll, J. H., Pandis, S. N., and Robinson, A. L.: A two-dimensional volatility basis set – Part 2: Diagnostics of organic-aerosol evolution, Atmos. Chem. Phys., 12, 615–634, https://doi.org/10.5194/acp-12-615-2012, 2012.
Donahue, N. M., Chuang, W., Epstein, S. A., Kroll, J. H., Worsnop, D. R., Robinson, A. L., Adams, P. J., and Pandis, S. N.: Why do organic aerosols exist? Understanding aerosol lifetimes using the two-dimensional volatility basis set, Environ. Chem., 10, 151–157, https://doi.org/10.1071/EN13022, 2013.
Donahue, N. M., Robinson, A. L., Trump, E. R., Riipinen, I., and Kroll, J. H.: Volatility and aging of atmospheric organic aerosol, Topics in current chemistry, 339, 97-143, https://doi.org/10.1007/128_2012_355, 2014.
Duan, J., Huang, R.-J., Lin, C., Shen, J., Yang, L., Yuan, W., Wang, Y., Liu, Y., and Xu, W.: Aromatic Nitration Enhances Absorption of Biomass Burning Brown Carbon in an Oxidizing Urban Environment, Environ. Sci. Technol., 58, 17344–17354, https://doi.org/10.1021/acs.est.4c05558, 2024.
Feng, T., Wang, Y., Hu, W., Zhu, M., Song, W., Chen, W., Sang, Y., Fang, Z., Deng, W., Fang, H., Yu, X., Wu, C., Yuan, B., Huang, S., Shao, M., Huang, X., He, L., Lee, Y. R., Huey, L. G., Canonaco, F., Prevot, A. S. H., and Wang, X.: Impact of aging on the sources, volatility, and viscosity of organic aerosols in Chinese outflows, Atmos. Chem. Phys., 23, 611–636, https://doi.org/10.5194/acp-23-611-2023, 2023.
Gu, Y., Huang, R.-J., Duan, J., Xu, W., Lin, C., Zhong, H., Wang, Y., Ni, H., Liu, Q., Xu, R., Wang, L., and Li, Y. J.: Multiple pathways for the formation of secondary organic aerosol in the North China Plain in summer, Atmos. Chem. Phys., 23, 5419–5433, https://doi.org/10.5194/acp-23-5419-2023, 2023.
Guenther, A. B., Jiang, X., Heald, C. L., Sakulyanontvittaya, T., Duhl, T., Emmons, L. K., and Wang, X.: The Model of Emissions of Gases and Aerosols from Nature version 2.1 (MEGAN2.1): an extended and updated framework for modeling biogenic emissions, Geosci. Model Dev., 5, 1471–1492, https://doi.org/10.5194/gmd-5-1471-2012, 2012.
Hallquist, M., Wenger, J. C., Baltensperger, U., Rudich, Y., Simpson, D., Claeys, M., Dommen, J., Donahue, N. M., George, C., Goldstein, A. H., Hamilton, J. F., Herrmann, H., Hoffmann, T., Iinuma, Y., Jang, M., Jenkin, M. E., Jimenez, J. L., Kiendler-Scharr, A., Maenhaut, W., McFiggans, G., Mentel, Th. F., Monod, A., Prévôt, A. S. H., Seinfeld, J. H., Surratt, J. D., Szmigielski, R., and Wildt, J.: The formation, properties and impact of secondary organic aerosol: current and emerging issues, Atmos. Chem. Phys., 9, 5155–5236, https://doi.org/10.5194/acp-9-5155-2009, 2009.
Heald, C. L. and Kroll, J. H.: The fuel of atmospheric chemistry: Toward a complete description of reactive organic carbon, Science Advances, 6, eaay8967, https://doi.org/10.1126/sciadv.aay8967, 2020.
Hems, R. F., Schnitzler, E. G., Liu-Kang, C., Cappa, C. D., and Abbatt, J. P. D.: Aging of Atmospheric Brown Carbon Aerosol, ACS Earth Space Chem., 5, 722–748, https://doi.org/10.1021/acsearthspacechem.0c00346, 2021.
Hu, W., Zhou, H., Chen, W., Ye, Y., Pan, T., Wang, Y., Song, W., Zhang, H., Deng, W., Zhu, M., Wang, C., Wu, C., Ye, C., Wang, Z., Yuan, B., Huang, S., Shao, M., Peng, Z., Day, D. A., Campuzano-Jost, P., Lambe, A. T., Worsnop, D. R., Jimenez, J. L., and Wang, X.: Oxidation Flow Reactor Results in a Chinese Megacity Emphasize the Important Contribution of S/IVOCs to Ambient SOA Formation, Environmental Science & Technology, 56, 6880–6893, https://doi.org/10.1021/acs.est.1c03155, 2022.
Huang, W., Wu, C., Gao, L., Gramlich, Y., Haslett, S. L., Thornton, J., Lopez-Hilfiker, F. D., Lee, B. H., Song, J., Saathoff, H., Shen, X., Ramisetty, R., Tripathi, S. N., Ganguly, D., Jiang, F., Vallon, M., Schobesberger, S., Yli-Juuti, T., and Mohr, C.: Variation in chemical composition and volatility of oxygenated organic aerosol in different rural, urban, and mountain environments, Atmos. Chem. Phys., 24, 2607–2624, https://doi.org/10.5194/acp-24-2607-2024, 2024.
Jiang, X. T., Liu, D. T., Li, Q., Tian, P., Wu, Y. Z., Li, S. Y., Hu, K., Ding, S., Bi, K., Li, R. J., Huang, M. Y., Ding, D. P., Chen, Q. C., Kong, S. F., Li, W. J., Pang, Y., and He, D.: Connecting the Light Absorption of Atmospheric Organic Aerosols with Oxidation State and Polarity, Environ. Sci. Technol., https://doi.org/10.1021/acs.est.2c02202, 2022.
Jimenez, J. L., Canagaratna, M. R., Donahue, N. M., Prevot, A. S. H., Zhang, Q., Kroll, J. H., DeCarlo, P. F., Allan, J. D., Coe, H., Ng, N. L., Aiken, A. C., Docherty, K. S., Ulbrich, I. M., Grieshop, A. P., Robinson, A. L., Duplissy, J., Smith, J. D., Wilson, K. R., Lanz, V. A., Hueglin, C., Sun, Y. L., Tian, J., Laaksonen, A., Raatikainen, T., Rautiainen, J., Vaattovaara, P., Ehn, M., Kulmala, M., Tomlinson, J. M., Collins, D. R., Cubison, M. J., E, Dunlea, J., Huffman, J. A., Onasch, T. B., Alfarra, M. R., Williams, P. I., Bower, K., Kondo, Y., Schneider, J., Drewnick, F., Borrmann, S., Weimer, S., Demerjian, K., Salcedo, D., Cottrell, L., Griffin, R., Takami, A., Miyoshi, T., Hatakeyama, S., Shimono, A., Sun, J. Y., Zhang, Y. M., Dzepina, K., Kimmel, J. R., Sueper, D., Jayne, J. T., Herndon, S. C., Trimborn, A. M., Williams, L. R., Wood, E. C., Middlebrook, A. M., Kolb, C. E., Baltensperger, U., and Worsnop, D. R.: Evolution of Organic Aerosols in the Atmosphere, Science, 326, 1525–1529, https://doi.org/10.1126/science.1180353, 2009.
Koop, T., Bookhold, J., Shiraiwa, M., and Pöschl, U.: Glass transition and phase state of organic compounds: Dependency on molecular properties and implications for secondary organic aerosols in the atmosphere, Phys. Chem. Chem. Phys., 13, 19238–19255, https://doi.org/10.1039/C1CP22617G, 2011.
Li, J., Han, Z., Sun, Y., Li, J., and Liang, L.: Chemical formation pathways of secondary organic aerosols in the Beijing-Tianjin-Hebei region in wintertime, Atmos. Environ., 244, 117996, https://doi.org/10.1016/j.atmosenv.2020.117996, 2021a.
Li, Y. and Shiraiwa, M.: Timescales of secondary organic aerosols to reach equilibrium at various temperatures and relative humidities, Atmos. Chem. Phys., 19, 5959–5971, https://doi.org/10.5194/acp-19-5959-2019, 2019.
Li, Y., Day, D. A., Stark, H., Jimenez, J. L., and Shiraiwa, M.: Predictions of the glass transition temperature and viscosity of organic aerosols from volatility distributions, Atmos. Chem. Phys., 20, 8103–8122, https://doi.org/10.5194/acp-20-8103-2020, 2020.
Li, Y., Carlton, A. G., and Shiraiwa, M.: Diurnal and Seasonal Variations in the Phase State of Secondary Organic Aerosol Material over the Contiguous US Simulated in CMAQ, ACS Earth and Space Chemistry, 5, 1971–1982, https://doi.org/10.1021/acsearthspacechem.1c00094, 2021b.
Li, Z., Wang, S., Li, S., Wang, X., Huang, G., Chang, X., Huang, L., Liang, C., Zhu, Y., Zheng, H., Song, Q., Wu, Q., Zhang, F., and Zhao, B.: High-resolution emission inventory of full-volatility organic compounds from cooking in China during 2015–2021, Earth Syst. Sci. Data, 15, 5017–5037, https://doi.org/10.5194/essd-15-5017-2023, 2023.
Liu, L., Hohaus, T., Franke, P., Lange, A. C., Tillmann, R., Fuchs, H., Tan, Z., Rohrer, F., Karydis, V., He, Q., Vardhan, V., Andres, S., Bohn, B., Holland, F., Winter, B., Wedel, S., Novelli, A., Hofzumahaus, A., Wahner, A., and Kiendler-Scharr, A.: Observational evidence reveals the significance of nocturnal chemistry in seasonal secondary organic aerosol formation, npj Climate and Atmospheric Science, 7, 207, https://doi.org/10.1038/s41612-024-00747-6, 2024.
Liu, M. and Matsui, H.: Secondary Organic Aerosol Formation Regulates Cloud Condensation Nuclei in the Global Remote Troposphere, Geophys. Res. Lett., 49, e2022GL100543, https://doi.org/10.1029/2022GL100543, 2022.
Lu, Q., Murphy, B. N., Qin, M., Adams, P. J., Zhao, Y., Pye, H. O. T., Efstathiou, C., Allen, C., and Robinson, A. L.: Simulation of organic aerosol formation during the CalNex study: updated mobile emissions and secondary organic aerosol parameterization for intermediate-volatility organic compounds, Atmos. Chem. Phys., 20, 4313–4332, https://doi.org/10.5194/acp-20-4313-2020, 2020.
Luu, R., Schervish, M., June, N. A., O'Donnell, S. E., Jathar, S. H., Pierce, J. R., and Shiraiwa, M.: Global Simulations of Phase State and Equilibration Time Scales of Secondary Organic Aerosols with GEOS-Chem, ACS Earth and Space Chemistry, 9, 288-302, https://doi.org/10.1021/acsearthspacechem.4c00281, 2025.
Maclean, A. M., Li, Y., Crescenzo, G. V., Smith, N. R., Karydis, V. A., Tsimpidi, A. P., Butenhoff, C. L., Faiola, C. L., Lelieveld, J., Nizkorodov, S. A., Shiraiwa, M., and Bertram, A. K.: Global Distribution of the Phase State and Mixing Times within Secondary Organic Aerosol Particles in the Troposphere Based on Room-Temperature Viscosity Measurements, ACS Earth Space Chem., 5, 3458-3473, https://doi.org/10.1021/acsearthspacechem.1c00296., 2021.
Mahrt, F., Huang, Y. Z., Zaks, J., Devi, A., Peng, L., Ohno, P. E., Qin, Y. M., Martin, S. T., Ammann, M., and Bertram, A. K.: Phase Behavior of Internal Mixtures of Hydrocarbon-like Primary Organic Aerosol and Secondary Aerosol Based on Their Differences in Oxygen-to-Carbon Ratios, Environ. Sci. Technol., 56, 3960–3973, https://doi.org/10.1021/acs.est.1c07691, 2022.
Malek, K., Gohil, K., Olonimoyo, E. A., Ferdousi-Rokib, N., Huang, Q., Pitta, K. R., Nandy, L., Voss, K. A., Raymond, T. M., Dutcher, D. D., Freedman, M. A., and Asa-Awuku, A.: Liquid–Liquid Phase Separation Can Drive Aerosol Droplet Growth in Supersaturated Regimes, ACS Environ. Au., 3, 348–360, https://doi.org/10.1021/acsenvironau.3c00015, 2023.
Marshall, F. H., Berkemeier, T., Shiraiwa, M., Nandy, L., Ohm, P. B., Dutcher, C. S., and Reid, J. P.: Influence of particle viscosity on mass transfer and heterogeneous ozonolysis kinetics in aqueous–sucrose–maleic acid aerosol, Phys. Chem. Chem. Phys., 20, 15560–15573, https://doi.org/10.1039/C8CP01666F, 2018.
Massoli, P., Lambe, A. T., Ahern, A. T., Williams, L. R., Ehn, M., Mikkilä, J., Canagaratna, M. R., Brune, W. H., Onasch, T. B., Jayne, J. T., Petäjä, T., Kulmala, M., Laaksonen, A., Kolb, C. E., Davidovits, P., and Worsnop, D. R.: Relationship between aerosol oxidation level and hygroscopic properties of laboratory generated secondary organic aerosol (SOA) particles, Geophys. Res. Lett., 37, https://doi.org/10.1029/2010GL045258, 2010.
Miao, R., Chen, Q., Shrivastava, M., Chen, Y., Zhang, L., Hu, J., Zheng, Y., and Liao, K.: Process-based and observation-constrained SOA simulations in China: the role of semivolatile and intermediate-volatility organic compounds and OH levels, Atmos. Chem. Phys., 21, 16183–16201, https://doi.org/10.5194/acp-21-16183-2021, 2021.
Murphy, B. N., Woody, M. C., Jimenez, J. L., Carlton, A. M. G., Hayes, P. L., Liu, S., Ng, N. L., Russell, L. M., Setyan, A., Xu, L., Young, J., Zaveri, R. A., Zhang, Q., and Pye, H. O. T.: Semivolatile POA and parameterized total combustion SOA in CMAQv5.2: impacts on source strength and partitioning, Atmos. Chem. Phys., 17, 11107–11133, https://doi.org/10.5194/acp-17-11107-2017, 2017.
Nault, B. A., Jo, D. S., McDonald, B. C., Campuzano-Jost, P., Day, D. A., Hu, W., Schroder, J. C., Allan, J., Blake, D. R., Canagaratna, M. R., Coe, H., Coggon, M. M., DeCarlo, P. F., Diskin, G. S., Dunmore, R., Flocke, F., Fried, A., Gilman, J. B., Gkatzelis, G., Hamilton, J. F., Hanisco, T. F., Hayes, P. L., Henze, D. K., Hodzic, A., Hopkins, J., Hu, M., Huey, L. G., Jobson, B. T., Kuster, W. C., Lewis, A., Li, M., Liao, J., Nawaz, M. O., Pollack, I. B., Peischl, J., Rappenglück, B., Reeves, C. E., Richter, D., Roberts, J. M., Ryerson, T. B., Shao, M., Sommers, J. M., Walega, J., Warneke, C., Weibring, P., Wolfe, G. M., Young, D. E., Yuan, B., Zhang, Q., de Gouw, J. A., and Jimenez, J. L.: Secondary organic aerosols from anthropogenic volatile organic compounds contribute substantially to air pollution mortality, Atmos. Chem. Phys., 21, 11201–11224, https://doi.org/10.5194/acp-21-11201-2021, 2021.
O'Brien, R. E., Li, Y., Kiland, K. J., Katz, E. F., Or, V. W., Legaard, E., Walhout, E. Q., Thrasher, C., Grassian, V. H., and DeCarlo, P. F.: Emerging investigator series: chemical and physical properties of organic mixtures on indoor surfaces during HOMEChem, Environmental Science: Processes & Impacts, 23, 559–568, 2021.
Pankow, J. F.: An absorption model of gas/particle partitioning of organic compounds in the atmosphere, Atmos. Environ., 28, 185–188, https://doi.org/10.1016/1352-2310(94)90093-0, 1994.
Pankow, J. F., Marks, M. C., Barsanti, K. C., Mahmud, A., Asher, W. E., Li, J., Ying, Q., Jathar, S. H., and Kleeman, M. J.: Molecular view modeling of atmospheric organic particulate matter: Incorporating molecular structure and co-condensation of water, Atmos. Environ., 122, 400–408, https://doi.org/10.1016/j.atmosenv.2015.10.001, 2015.
Pye, H. O. T., Pinder, R. W., Piletic, I. R., Xie, Y., Capps, S. L., Lin, Y.-H., Surratt, J. D., Zhang, Z., Gold, A., Luecken, D. J., Hutzell, W. T., Jaoui, M., Offenberg, J. H., Kleindienst, T. E., Lewandowski, M., and Edney, E. O.: Epoxide Pathways Improve Model Predictions of Isoprene Markers and Reveal Key Role of Acidity in Aerosol Formation, Environ. Sci. Technol., 47, 11056–11064, https://doi.org/10.1021/es402106h, 2013.
Pye, H. O. T., Luecken, D. J., Xu, L., Boyd, C. M., Ng, N. L., Baker, K. R., Ayres, B. R., Bash, J. O., Baumann, K., Carter, W. P. L., Edgerton, E., Fry, J. L., Hutzell, W. T., Schwede, D. B., and Shepson, P. B.: Modeling the Current and Future Roles of Particulate Organic Nitrates in the Southeastern United States, Environ. Sci. Technol., 49, 14195–14203, https://doi.org/10.1021/acs.est.5b03738, 2015.
Pye, H. O. T., Murphy, B. N., Xu, L., Ng, N. L., Carlton, A. G., Guo, H., Weber, R., Vasilakos, P., Appel, K. W., Budisulistiorini, S. H., Surratt, J. D., Nenes, A., Hu, W., Jimenez, J. L., Isaacman-VanWertz, G., Misztal, P. K., and Goldstein, A. H.: On the implications of aerosol liquid water and phase separation for organic aerosol mass, Atmos. Chem. Phys., 17, 343–369, https://doi.org/10.5194/acp-17-343-2017, 2017.
Pye, H. O. T., Place, B. K., Murphy, B. N., Seltzer, K. M., D'Ambro, E. L., Allen, C., Piletic, I. R., Farrell, S., Schwantes, R. H., Coggon, M. M., Saunders, E., Xu, L., Sarwar, G., Hutzell, W. T., Foley, K. M., Pouliot, G., Bash, J., and Stockwell, W. R.: Linking gas, particulate, and toxic endpoints to air emissions in the Community Regional Atmospheric Chemistry Multiphase Mechanism (CRACMM), Atmos. Chem. Phys., 23, 5043–5099, https://doi.org/10.5194/acp-23-5043-2023, 2023.
Qin, M., Murphy, B. N., Isaacs, K. K., McDonald, B. C., Lu, Q., McKeen, S. A., Koval, L., Robinson, A. L., Efstathiou, C., Allen, C., and Pye, H. O. T.: Criteria pollutant impacts of volatile chemical products informed by near-field modelling, Nature Sustainability, 4, 129–137, 2021.
Rao, G. and Vejerano, E. P.: Partitioning of volatile organic compounds to aerosols: A review, Chemosphere, 212, 282–296, https://doi.org/10.1016/j.chemosphere.2018.08.073, 2018.
Rasool, Q. Z., Shrivastava, M., Octaviani, M., Zhao, B., Gaudet, B., and Liu, Y.: Modeling Volatility-Based Aerosol Phase State Predictions in the Amazon Rainforest, ACS Earth Space Chem., 5, 2910–2924, https://pubs.acs.org/doi/10.1021/acsearthspacechem.1c00255., 2021.
Reid, J. P., Bertram, A. K., Topping, D. O., Laskin, A., Martin, S. T., Petters, M. D., Pope, F. D., and Rovelli, G.: The viscosity of atmospherically relevant organic particles, Nat. Commun., 9, 956, https://doi.org/10.1038/s41467-018-03027-z, 2018.
Rothfuss, N. E. and Petters, M. D.: Influence of Functional Groups on the Viscosity of Organic Aerosol, Environ. Sci. Technol., 51, 271–279, https://doi.org/10.1021/acs.est.6b04478, 2017.
Saha, P. K. and Grieshop, A. P.: Exploring Divergent Volatility Properties from Yield and Thermodenuder Measurements of Secondary Organic Aerosol from α-Pinene Ozonolysis, Environ Sci Technol, 50, 5740–5749, https://doi.org/10.1021/acs.est.6b00303, 2016.
Saha, P. K., Khlystov, A., Yahya, K., Zhang, Y., Xu, L., Ng, N. L., and Grieshop, A. P.: Quantifying the volatility of organic aerosol in the southeastern US, Atmos. Chem. Phys., 17, 501–520, https://doi.org/10.5194/acp-17-501-2017, 2017.
Saukko, E., Lambe, A. T., Massoli, P., Koop, T., Wright, J. P., Croasdale, D. R., Pedernera, D. A., Onasch, T. B., Laaksonen, A., Davidovits, P., Worsnop, D. R., and Virtanen, A.: Humidity-dependent phase state of SOA particles from biogenic and anthropogenic precursors, Atmos. Chem. Phys., 12, 7517–7529, https://doi.org/10.5194/acp-12-7517-2012, 2012.
Shiraiwa, M. and Seinfeld, J. H.: Equilibration timescale of atmospheric secondary organic aerosol partitioning, Geophys. Res. Lett., 39, https://doi.org/10.1029/2012GL054008, 2012.
Shiraiwa, M., Li, Y., Tsimpidi, A. P., Karydis, V. A., Berkemeier, T., Pandis, S. N., Lelieveld, J., Koop, T., and Pöschl, U.: Global distribution of particle phase state in atmospheric secondary organic aerosols, Nature communications, 8, 15002, https://doi.org/10.1038/ncomms15002, 2017.
Shrivastava, M., Cappa, C. D., Fan, J. W., Goldstein, A. H., Guenther, A. B., Jimenez, J. L., Kuang, C., Laskin, A., Martin, S. T., Ng, N. L., Petaja, T., Pierce, J. R., Rasch, P. J., Roldin, P., Seinfeld, J. H., Shilling, J., Smith, J. N., Thornton, J. A., Volkamer, R., Wang, J., Worsnop, D. R., Zaveri, R. A., Zelenyuk, A., and Zhang, Q.: Recent advances in understanding secondary organic aerosol: Implications for global climate forcing, Rev. Geophys., 55, 509-559, https://doi.org/10.1002/2016RG000540, 2017.
Shrivastava, M., Zhang, J., Zaveri, R. A., Zhao, B., Pierce, J. R., O'Donnell, S. E., Fast, J. D., Gaudet, B., Shilling, J. E., Zelenyuk, A., Murphy, B. N., Pye, H. O. T., Zhang, Q., Trousdell, J., and Chen, Q.: Anthropogenic Extremely Low Volatility Organics (ELVOCs) Govern the Growth of Molecular Clusters Over the Southern Great Plains During the Springtime, Journal of Geophysical Research: Atmospheres, 129, e2024JD041212, https://doi.org/10.1029/2024JD041212, 2024.
Simon, H. and Bhave, P. V.: Simulating the Degree of Oxidation in Atmospheric Organic Particles, Environmental Science & Technology, 46, 331–339, https://doi.org/10.1021/es202361w, 2012.
Song, M., Marcolli, C., Krieger, U. K., Zuend, A., and Peter, T.: Liquid-liquid phase separation in aerosol particles: Dependence on O:C, organic functionalities, and compositional complexity, Geophys. Res. Lett., 39, https://doi.org/10.1029/2012GL052807, 2012.
Tian, P., Liu, D. T., Bi, K., Huang, M. Y., Wu, Y. Z., Hu, K., Li, R. J., He, H., Ding, D. P., Hu, Y. Q., Liu, Q., Zhao, D. L., Qiu, Y., Kong, S. F., and Xue, H. W.: Evidence for Anthropogenic Organic Aerosols Contributing to Ice Nucleation, Geophys. Res. Lett., 49, https://doi.org/10.1029/2022gl099990, 2022.
Tritscher, T., Dommen, J., DeCarlo, P. F., Gysel, M., Barmet, P. B., Praplan, A. P., Weingartner, E., Prévôt, A. S. H., Riipinen, I., Donahue, N. M., and Baltensperger, U.: Volatility and hygroscopicity of aging secondary organic aerosol in a smog chamber, Atmos. Chem. Phys., 11, 11477–11496, https://doi.org/10.5194/acp-11-11477-2011, 2011.
Tsigaridis, K. and Kanakidou, M.: The Present and Future of Secondary Organic Aerosol Direct Forcing on Climate, Curr. Clim. Change Rep., 4, 84–98, https://doi.org/10.1007/s40641-018-0092-3, 2018.
Tsimpidi, A. P., Karydis, V. A., Pozzer, A., Pandis, S. N., and Lelieveld, J.: ORACLE 2-D (v2.0): an efficient module to compute the volatility and oxygen content of organic aerosol with a global chemistry–climate model, Geosci. Model Dev., 11, 3369–3389, https://doi.org/10.5194/gmd-11-3369-2018, 2018.
Turpin, B. J. and Lim, H.-J.: Species Contributions to PM2.5 Mass Concentrations: Revisiting Common Assumptions for Estimating Organic Mass, Aerosol Science and Technology, 35, 602–610, https://doi.org/10.1080/02786820119445, 2001.
US EPA Office of Research and Development: CMAQ (5.3.2), Zenodo [code], https://doi.org/10.5281/zenodo.4081737, 2020.
US EPA Office of Research and Development: CMAQ (5.4), Zenodo [code], https://doi.org/10.5281/zenodo.7218076, 2022.
Wang, H., Ma, X., Tan, Z., Wang, H., Chen, X., Chen, S., Gao, Y., Liu, Y., Liu, Y., Yang, X., Yuan, B., Zeng, L., Huang, C., Lu, K., and Zhang, Y.: Anthropogenic monoterpenes aggravating ozone pollution, Nat. Sci. Rev., 9, nwac103, https://doi.org/10.1093/nsr/nwac103, 2022.
Wang, J., Liu, D., Ge, X., Wu, Y., Shen, F., Chen, M., Zhao, J., Xie, C., Wang, Q., Xu, W., Zhang, J., Hu, J., Allan, J., Joshi, R., Fu, P., Coe, H., and Sun, Y.: Characterization of black carbon-containing fine particles in Beijing during wintertime, Atmos. Chem. Phys., 19, 447–458, https://doi.org/10.5194/acp-19-447-2019, 2019.
Wu, X., Vu, T. V., Shi, Z. B., Harrison, R. M., Liu, D., and Cen, K.: Characterization and source apportionment of carbonaceous PM2.5 particles in China – A review, Atmos. Environ., 189, 187–212, https://doi.org/10.1016/j.atmosenv.2018.06.025, 2018.
Xie, Q., Chen, W., Yuan, B., Huangfu, Y., He, X., Wu, L., Liu, M., You, Y., Shao, M., and Wang, X.: Significant but Overlooked: The Role of Anthropogenic Monoterpenes in Ozone Formation in a Chinese Megacity, Environmental Science & Technology, 59, 8085–8098, https://doi.org/10.1021/acs.est.5c00001, 2025.
Xie, Y., Paulot, F., Carter, W. P. L., Nolte, C. G., Luecken, D. J., Hutzell, W. T., Wennberg, P. O., Cohen, R. C., and Pinder, R. W.: Understanding the impact of recent advances in isoprene photooxidation on simulations of regional air quality, Atmos. Chem. Phys., 13, 8439–8455, https://doi.org/10.5194/acp-13-8439-2013, 2013.
Xu, L., Pye, H. O. T., He, J., Chen, Y., Murphy, B. N., and Ng, N. L.: Experimental and model estimates of the contributions from biogenic monoterpenes and sesquiterpenes to secondary organic aerosol in the southeastern United States, Atmos. Chem. Phys., 18, 12613–12637, https://doi.org/10.5194/acp-18-12613-2018, 2018.
Xu, N., Hu, M., Li, X., Zeng, L., Wang, Y., Qiu, Y., Song, K., Li, S., Shuai, S., Chen, Y., Hu, J., and Guo, S.: Unraveling the Light-Absorbing Properties of Brown Carbon at a Molecular Level, Geophys. Res. Lett., 51, e2024GL108834, https://doi.org/10.1029/2024GL108834, 2024.
Xu, W., Xie, C., Karnezi, E., Zhang, Q., Wang, J., Pandis, S. N., Ge, X., Zhang, J., An, J., Wang, Q., Zhao, J., Du, W., Qiu, Y., Zhou, W., He, Y., Li, Y., Li, J., Fu, P., Wang, Z., Worsnop, D. R., and Sun, Y.: Summertime aerosol volatility measurements in Beijing, China, Atmos. Chem. Phys., 19, 10205–10216, https://doi.org/10.5194/acp-19-10205-2019, 2019.
Yin, D., Zhao, B., Wang, S., Donahue, N. M., Feng, B., Chang, X., Chen, Q., Cheng, X., Liu, T., Chan, C. K., Schervish, M., Li, Z., He, Y., and Hao, J.: Fostering a Holistic Understanding of the Full Volatility Spectrum of Organic Compounds from Benzene Series Precursors through Mechanistic Modeling, Environ. Sci. Technol., 58, 8380–8392, https://doi.org/10.1021/acs.est.3c07128, 2024.
Zaveri, R. A., Easter, R. C., Shilling, J. E., and Seinfeld, J. H.: Modeling kinetic partitioning of secondary organic aerosol and size distribution dynamics: representing effects of volatility, phase state, and particle-phase reaction, Atmos. Chem. Phys., 14, 5153–5181, https://doi.org/10.5194/acp-14-5153-2014, 2014.
Zhang, C., Hai, S., Gao, Y., Wang, Y., Zhang, S., Sheng, L., Zhao, B., Wang, S., Jiang, J., Huang, X., Shen, X., Sun, J., Lupascu, A., Shrivastava, M., Fast, J. D., Cheng, W., Guo, X., Chu, M., Ma, N., Hong, J., Wang, Q., Yao, X., and Gao, H.: Substantially positive contributions of new particle formation to cloud condensation nuclei under low supersaturation in China based on numerical model improvements, Atmos. Chem. Phys., 23, 10713–10730, https://doi.org/10.5194/acp-23-10713-2023, 2023.
Zhang, Q., Jimenez, J. L., Canagaratna, M. R., Allan, J. D., Coe, H., Ulbrich, I., Alfarra, M. R., Takami, A., Middlebrook, A. M., Sun, Y. L., Dzepina, K., Dunlea, E., Docherty, K., DeCarlo, P. F., Salcedo, D., Onasch, T., Jayne, J. T., Miyoshi, T., Shimono, A., Hatakeyama, S., Takegawa, N., Kondo, Y., Schneider, J., Drewnick, F., Borrmann, S., Weimer, S., Demerjian, K., Williams, P., Bower, K., Bahreini, R., Cottrell, L., Griffin, R. J., Rautiainen, J., Sun, J. Y., Zhang, Y. M., and Worsnop, D. R.: Ubiquity and dominance of oxygenated species in organic aerosols in anthropogenically-influenced Northern Hemisphere midlatitudes, Geophysical Research Letters, 34, https://doi.org/10.1029/2007gl029979, 2007.
Zhang, Y., Nichman, L., Spencer, P., Jung, J. I., Lee, A., Heffernan, B. K., Gold, A., Zhang, Z., Chen, Y., Canagaratna, M. R., Jayne, J. T., Worsnop, D. R., Onasch, T. B., Surratt, J. D., Chandler, D., Davidovits, P., and Kolb, C. E.: The Cooling Rate- and Volatility-Dependent Glass-Forming Properties of Organic Aerosols Measured by Broadband Dielectric Spectroscopy, Environ. Sci. Technol., 53, 12366-12378, https://doi.org/10.1021/acs.est.9b03317, 2019.
Zhang, Z., Li, Y., Ran, H., An, J., Qu, Y., Zhou, W., Xu, W., Hu, W., Xie, H., Wang, Z., Sun, Y., and Shiraiwa, M.: Simulated phase state and viscosity of secondary organic aerosols over China, Atmos. Chem. Phys., 24, 4809–4826, https://doi.org/10.5194/acp-24-4809-2024, 2024.
Zhao, B., Wang, S. X., Donahue, N. M., Chuang, W. N., Hildebrandt Ruiz, L., Ng, N. L., Wang, Y. J., and Hao, J. M.: Evaluation of One-Dimensional and Two-Dimensional Volatility Basis Sets in Simulating the Aging of Secondary Organic Aerosol with Smog-Chamber Experiments, Environ. Sci. Technol., 49, 2245-2254, https://doi.org/10.1021/es5048914, 2015.
Zhao, B., Wang, S. X., Donahue, N. M., Jathar, S. H., Huang, X. F., Wu, W. J., Hao, J. M., and Robinson, A. L.: Quantifying the effect of organic aerosol aging and intermediate-volatility emissions on regional-scale aerosol pollution in China, Scientific Reports, 6, https://doi.org/10.1038/srep28815, 2016.
Zheng, H., Chang, X., Wang, S., Li, S., Yin, D., Zhao, B., Huang, G., Huang, L., Jiang, Y., Dong, Z., He, Y., Huang, C., and Xing, J.: Trends of Full-Volatility Organic Emissions in China from 2005 to 2019 and Their Organic Aerosol Formation Potentials, Environ. Sci. Technol. Lett., 10, 137–144, https://doi.org/10.1021/acs.estlett.2c00944, 2023.
Zhou, Y., Xing, X., Lang, J., Chen, D., Cheng, S., Wei, L., Wei, X., and Liu, C.: A comprehensive biomass burning emission inventory with high spatial and temporal resolution in China, Atmos. Chem. Phys., 17, 2839–2864, https://doi.org/10.5194/acp-17-2839-2017, 2017.