the Creative Commons Attribution 4.0 License.
the Creative Commons Attribution 4.0 License.
 | 01 Sep 2025
Influencing factors of the gas–particle distribution of oxygenated organic molecules in the urban atmosphere and deviation from equilibrium partitioning: a random forest model study
Xinyu Wang
Nan Chen
Bo Zhu
Gas–particle partitioning governs the fate of oxygenated organic molecules (OOMs) and the formation of organic aerosols. We employed a Chemical Ionization Mass Spectrometer equipped with a Filter Inlet for Gases and AEROsol (FIGAERO-CIMS) to measure the gas–particle distribution of OOMs in a winter campaign in the urban atmosphere. The observed gas–particle () ratios show a narrower range than the equilibrium ratios predicted from saturation mass concentration C* and organic aerosol content. The difference between observed and equilibrium ratios could be up to 10 orders of magnitude, depending on the C* parameterization selection. Our random forest models identified relative humidity (RH), aerosol liquid water content (LWC), temperature, and ozone as four influential factors driving the deviations of partitioning from the equilibrium state. Random forest models with satisfactory performance were developed to predict the observed ratios. Intrinsic molecule features far outweigh meteorological and chemical composition features in the model's predictions. For a given OOM species, particle chemical composition features, including pH, RH, LWC, organic carbon, potassium, and sulfate, dominate over meteorological and gaseous chemical composition features in predicting the ratios. We identified the positive or negative effects as well as the sensitive ranges of these influential features using SHapley Additive exPlanations (SHAP) analysis and curve fitting with a generalized additive model (GAM). Our models found that temperature does not emerge as a significant factor influencing the observed ratios, suggesting that other factors, most likely associated with particle composition, inhibit the gas–particle partitioning of OOMs in response to temperature change.
- Article
(5397 KB) - Full-text XML
-
Supplement
(1463 KB) - BibTeX
- EndNote


Oxygenated organic molecules (OOMs) are ubiquitous in the atmosphere. They are key constituents of organic aerosols (OA) and play a critical role in particle formation and growth (Yuan et al., 2024). The distribution of an OOM between the gas and particle phases not only reflects its volatility or water solubility but also governs its formation pathways, atmospheric transport, and deposition. Therefore, understanding the phase distribution of OOMs is essential for gaining insights into their volatility, transformation processes, and environmental impacts in the atmosphere.
Gas–particle () ratios of OOMs measured by laboratory (e.g., ozonolysis products from Δ3-carene, Li et al., 2024a) or field studies (e.g., in the Hyytiälä forest, Finland, Lutz et al., 2019) were sometimes used to derive saturation mass concentrations (C*) or partitioning coefficients (Ki), assuming that the observed ratios represent an equilibrium partitioning state (Priestley et al., 2024; Li et al., 2024a; Lutz et al., 2019; Stark et al., 2017). However, the ratio of an OOM under atmospheric conditions is influenced by not only intrinsic OOM physicochemical properties but also external factors such as meteorological shifts (Hildebrandt et al., 2009), precursor oxidation (Pankow, 1994; Seinfeld and Pankow, 2003), particle chemical composition, morphology, and particle-phase reactions (Jang et al., 2002; George et al., 2007). As a result, OOMs rarely achieve equilibrium partitioning between the gas and particle phases (Roldin et al., 2014; Li et al., 2024b).
Gas–particle partitioning kinetics have been incorporated into many atmospheric aerosol models, such as aerosol dynamics models (Liu et al., 2019; Zaveri et al., 2014) and kinetic multilayer models (Fowler et al., 2018; Roldin et al., 2014), which accounted for molecular transfer rates, interphase interactions, and environmental variability (Shiraiwa and Pöschl, 2021) in the gas–particle transfer process. The development of these models has advanced our understanding of the distribution and transport of organic compounds. However, existing theories and models often rely on parameter simplifications or assumptions, and there is a lack of systematic studies examining the factors influencing the phase distribution of OOMs under real atmospheric conditions. In recent years, machine learning methods have been applied successfully for a variety of purposes, including compound identification (Franklin et al., 2022; Boiko et al., 2022), aerosol classification (Christopoulos et al., 2018; Bland et al., 2022), precursor apportionment (Pande et al., 2022; Wang et al., 2021), and property prediction (Gong et al., 2022; Ruiz-Jimenez et al., 2021). Machine learning has proven to be a powerful, data-driven approach capable of uncovering complex and nonlinear relationships between variables (Lin et al., 2022; Zhu et al., 2019). Unlike physical or chemical models, machine learning does not rely on predefined assumptions or simplifications, which enables it to unveil previously unrecognized interactions.
In this work, we employed a Chemical Ionization Mass Spectrometer equipped with a Filter Inlet for Gases and AEROsol (FIGAERO-CIMS) in an urban location to measure the concentrations of OOMs in both the gas and particle phases. By building data-driven machine learning models with the ratio as the target variable, we explored the influencing factors of the gas–particle distribution of OOMs and examined the factors that contribute to the deviations from equilibrium gas–particle partitioning. This study offered new insights and provided the foundation for future studies on the atmospheric behavior of OOMs.
2.1 OOM measurement
Hourly measurements of OOMs in both the gas and particle phases were conducted during a winter campaign from 5 December 2022 to 8 January 2023, using an iodide-based FIGAERO-CIMS (Aerodyne Research Inc., USA) at a suburban site in Wuhan, a megacity in central China (30.4577° N, 114.6157° E). The site is located on the campus of China University of Geosciences, which is surrounded by a residential and agricultural mixed area. The nearest urban center and industrial area are about 25 km west of the measurement site. The nearest highways and major roads lie about 2 km north and south of the site. The site is the only provincial supersite operated by a local environmental authority to monitor air quality in Wuhan and can thus be regarded as a receptor site influenced by wide ranges of emission sources from neighboring regions. We obtained valid data of 594 h, during which meteorological parameters (e.g., relative humidity RH and temperature T), particulate chemical components (e.g., organic carbon OC and sulfate ions SO), and gaseous components (e.g., sulfur dioxide SO2 and ozone O3) were routinely monitored. Detailed information about these routine measurements is shown in the Supplement (Text S1).
The design of FIGAERO-CIMS for hourly OOM measurement has been described by previous studies (Zhao et al., 2024; Lopez-Hilfiker et al., 2014; Lee et al., 2014). Briefly, FIGAERO operated in a measurement cycle of 1 h, alternating between gas-phase and particle-phase modes. In the gas-phase mode, ambient air was drawn at a flow rate of 2 L min−1 directly into the ion–molecule reactor (IMR), where gaseous molecules were ionized and subsequently detected as adduct ions with the reagent ion I−. Simultaneously, another flow of ambient air was pulled through a PM2.5 cyclone (URG-2000-30EN, URG Corp.) and then a PTFE filter (2 µm Zefluor, 25 mm, Pall Corp.), where particles smaller than 2.5 µm were collected. During the subsequent particle-phase mode, the molecules on the PTFE filter underwent thermal desorption in a heated ultrahigh-purity (UHP) nitrogen flow, which was kept at room temperature for 2 min, heated to 200° for 15 min, kept at 200° for an additional 15 min to ensure the desorption of the majority of OOMs (Lopez-Hilfiker et al., 2014), and then cooled to room temperature within 4 min. The desorbed molecules were directed into a turbulent-flow IMR. A field blank sample was collected every 24 h. According to our earlier investigation (Wang et al., 2024), the OOM measured with FIGAERO-CIMS stands for only those polar and moderate-volatility organic species being desorbed below 200 °C and accounted for only 26 ± 8 % of the total OA (OC × 1.4) measured with the thermal–optical method using the IMPROVE protocol.
2.2 OOM identification and selection
OOMs were identified using a non-target strategy. Mass calibration was performed using ions such as NO, C2F3O, IC2H2O, IC2F3HO, IC3F5HO, and I, covering a mass range from 62 to 381 . The spectra peaks were iteratively fitted with multiple peaks using a custom peak shape until the residual was reduced to less than 5 % (Lee et al., 2014; Stark et al., 2015). Subsequently, the exact masses of these multiple peaks were matched with the most probable elemental formulas within the ranges of C1−30H1−60O0−20N0−2S0−2X0−2I, where “X” stands for halogen atoms, with mass errors smaller than 10 ppm (mass resolution of ∼ 6000). Isotope distribution was inspected to match the theoretical isotope pattern. The elemental ratio and double-bond-equivalent (DBE) limits of the formulas were 0.3 ≤ ≤ 3, ≤ 0.5, ≤ 3, ≤ 1, and 0 ≤ DBE ≤ 20 (Kind and Fiehn, 2007; Lee et al., 2018; Kind and Fiehn, 2006).
In order to obtain reliable concentrations and thus ratios, only those OOMs with a unit mass peak area ratio of > 20 % and a sample-to-blank ratio of > 2 were included for further analysis. This filtered out the OOMs with low concentrations in the atmosphere as well as those extremely high- or low-volatility OOMs that are predominantly in only one phase. Thermal desorption may cause OOM decomposition in the particle phase. According to our earlier study on the same dataset using a K-means clustering method (Wang et al., 2024), on average, 25.1 % of the particle-bound OOM species number and 26.8 % of the OOM mass detected by FIGAERO-CIMS could be attributed to thermal decomposition fragments (Text S2). These fragments were excluded from the gas–particle partitioning analysis. The overlap of non-fragment particle-bound OOM species with those gas-phase OOM species resulted in 123 species, which were chosen as the target species for subsequent partitioning analysis. Based on our previous work (Fig. S1) (Wang et al., 2024), these 123 OOM species were classified as 41 aromatic species (33.7 %), 35 monoterpene-derived species (28.3 %), 14 isoprene-derived species (11.4 %), 11 aliphatic species (8.7 %), 10 biomass burning tracers (8.1 %), 3 sulfur-containing species (2.4 %), and 9 other unknown species (7.3 %). Notably, we cannot rule out the possibility that some of these 123 OOMs underwent partial thermal decomposition in the particle phase to an unknown extent. This could lead to an underestimation of their particle-phase concentrations and, in turn, bias the results towards higher ratios.
2.3 Observed ratios of OOMs
The concentrations of an OOM species in the gas phase and particle phase are calculated as
where Cg (ng m−3) and Cp (ng m−3) are the average concentrations of a species in the gas phase and particle phase, respectively, in a measurement interval (e.g., 1 h in our campaign). signalg is the integrated signal (unit: counts) of this species during the 21 min gas-phase measurement time (tg) in a measurement interval. tp is the particle sampling time (24 min) in a measurement interval. signalp is the integrated signal of the particle-phase species during the thermal desorption (30 min) period. Qg and Qp are the sampling flow rates for the gas phase and particle phase, respectively (L min−1). S is the sensitivity of the species (counts per nanogram). The observed ratio can be calculated as
2.4 Comparison with the equilibrium ratios
According to the modified Raoult law, the saturation ratio of an organic species in the gas phase (i.e., ) equals the mass fraction of the species in organic aerosol with mass concentration ), under the assumptions of equilibrium absorptive partitioning of the species over an ideal organic solution and that the species has a molecular weight similar to that of the organic solution (Donahue et al., 2009; Epstein et al., 2010). The equilibrium ratio can thus be estimated from the saturated mass concentration C* and the mass concentration of organic aerosol COA(COA=COC × 1.4) using Eq. (4):
C* at 300 K of OOMs was calculated using four different parameterizations reported by Mohr et al. (2019), Peräkylä et al. (2020), Ren et al. (2022), and Priestley et al. (2024). Based on the saturation concentrations of highly oxygenated molecules (HOMs) modeled by Tröstl et al. (2016), Mohr et al. (2019) applied an updated version of the SIMPOL-type parameterization described by Donahue et al. (2011) to estimate C* from the numbers of carbon, oxygen, and nitrogen atoms of an organic species (nC, nO, and nN) but emphasizing the increased importance of OOH groups. This parameterization likely produces C* of pure compounds without considering the effect of the particle matrix. Ren et al. (2022) obtained the C* of OOMs via calibrated C*–Tmax (the thermal desorption temperature at which the maximum signal intensity occurs) correlations in the thermal desorption process. A similar parameterization formula between C* and nC, nO, and nN was then derived using multivariate regression. Peräkylä et al. (2020) parameterized the dependence of C* on nC, nO, nN, and the number of hydrogen atoms (nH) by comparing steady-state gas-phase concentrations of α-pinene ozonolysis products with and without seed addition in a chamber. This parameterization predicts much lower sensitivities of HOM volatility to oxygen-containing functional groups than SIMPOL. The parameterization of Priestley et al. (2024) was based on measured gas- and particle-phase concentrations, at an assumed equilibrium state, in residential wood burning emissions. The C* values of the products were obtained via Eq. (4), and a parameterization was obtained between C* and nC, nO, nN, and nH. The four C* parameterizations are listed in Text S3. A temperature correction was made based on Eqs. (5) and (6) to convert C*(300 K) into C*(T) at observed temperatures (Epstein et al., 2010; Li et al., 2024a):
where ΔHvap is the enthalpy of vaporization. R is the gas constant. T is the observed temperature for every hour. C*(T) was then used in Eq. (4) to estimate the equilibrium ratios.
2.5 Random forest models
2.5.1 Build random forest models
Complex interactions and potential nonlinear dependencies exist among OOM gas–particle partitioning, atmospheric chemistry, and environmental variables. We employed random forest models to investigate the influencing factors of gas–particle partitioning.
Our selection of influencing factors (i.e., features) is based on a comprehensive literature review. We categorized 30 features into four groups: (1) 9 molecular features of the OOMs – nC, nO, nN, nH, molecular weight (Mw), DBE, hydrogen-to-carbon atom ratios (), oxygen-to-carbon atom ratios (), and the oxidation state of carbon (OSc); (2) seven meteorological features – RH, T, wind speed (WS), wind direction (represented by sine and cosine functions to preserve the periodicity, denoted as WD_sin and WD_cos), ultraviolet A (UV-A), ultraviolet B (UV-B), and JHONO; (3) 4 gaseous composition features – SO2 concentration, O3 concentration, nitrogen dioxide (NO2) concentration, and ammonia (NH3) concentration; and (4) 10 particle composition features – OC concentration, elemental carbon (EC) concentration, SO concentration, nitrate ion (NO3) concentration, chloride ion (Cl) concentration, ammonium ion (NH) concentration, PM2.5 concentration, potassium ion (K+) concentration, and aerosol-phase pH and liquid water content (LWC). Calculation details of pH and LWC using the ISORROPIA-II model (Fountoukis and Nenes, 2007) are provided in Text S4. This feature selection scheme guarantees a balanced representation of pertinent factors while preserving the simplicity and predictive efficacy of the models. Unlike neural networks and other machine learning algorithms, the random forest model used in this study is an ensemble model made up of multiple decision trees. During training, each tree splits using a randomly chosen subset of features. Because each tree uses different feature subsets, this randomness in feature selection reduces the model's reliance on any single feature, making it less likely to be severely impacted by multicollinearity. To further ensure model stability, we also conducted a 5-fold cross-validation to confirm the robustness of the model.
First, we developed a multispecies model involving 123 OOM species to predict the of OOMs from molecule features, meteorological features, and gas and particle composition features. A total of 73 062 values for 123 species with hourly resolution were collected in the winter campaign. Outliers can indeed exacerbate modeling errors and potentially affect the model's outcomes. Therefore, they should be removed (Leong et al., 2020). Outlier removal is described in Text S5. The data used for modeling were randomly divided into training data (85 % of the total) for model training and test data (15 % of the total) to evaluate the model generalization.
Second, we selected six typical OOMs, including more volatile (C5H8O4, C6H10O4, C6H5NO3, and C7H7NO3; C* range: 103.90–106.53 µg m−3) and less volatile (C10H16O4 and C12H21NO9; C* range: 10−4.73–101.18 µg m−3) species according to the C* parameterization of Mohr et al. (2019). C5H8O4 (glutaric acid, Lee et al., 2014; Reyes-Villegas et al., 2018) and C6H10O4 (adipic acid, Ye et al., 2021; Lee et al., 2014) are small dicarboxylic acids (C ≤ 6) typically formed through photochemical degradation of reactions of alkenes, aldehydes, longer-chain acids (Kawamura and Sakaguchi, 1999), or other low-oxygen organic compounds (Grosjean and Friedlander, 1980) in the urban atmosphere (Kawamura and Ikushima, 1993). C6H5NO3 (Huang et al., 2019; Cai et al., 2022) and C7H7NO3 (Huang et al., 2019; Cai et al., 2022) are nitrophenols directly emitted either from vehicle exhaust (Tremp et al., 1993), coal and wood combustion (Huang et al., 2019), or industrial processes (Harrison et al., 2005) or formed through the nitration of phenol in the gas or liquid phase (Lüttke and Levsen, 1997). C10H16O4 is primarily derived from the oxidation of monoterpenes (Ye et al., 2019; Barreira et al., 2021). C12H21NO9 is an organic nitrate from long-chain alkane oxidation under high-NOx conditions (Wang and Ruiz, 2018).
Third, single-species models were tailored to predict the gas–particle partitioning behaviors of these six individual OOMs under varying meteorological and gas–particle composition conditions. We also built random forest models to investigate how the values of the six OOMs deviate from under varying meteorological conditions and gas–particle compositions. In this study, we did not build a random forest model to predict absolute gas- or particle-phase concentrations of OOMs, due to their strong dependencies on diverse emission sources from neighboring regions. We lack reliable features for quantifying the variable strengths of unknown sources and atmospheric aging processes during transport, which are key factors influencing the OOM concentrations.
2.5.2 Model optimization, evaluation, and feature importance analysis
To optimize and evaluate the model's performance, we applied a combination of grid search and cross-validation methods. First, we employed a grid search to tune the hyperparameters of the random forest model. The search space included the following hyperparameters: n_estimators (the number of decision trees), max_depth (the maximum depth of each tree), max_features (the number of features considered for splitting at each node), and min_samples_split (the minimum number of samples required to split an internal node). For each combination of hyperparameters, we used 5-fold cross-validation in the training set with a coefficient of determination (R2) as the primary metric to assess model performance and identify the best configuration. The specific hyperparameter settings used in the grid search are provided in the Supplement in Table S1.
After selecting the optimal hyperparameters, we further evaluated the final model using 5-fold cross-validation to assess the model's generalization ability and ensure that it was not overfitted. In this evaluation, both R2 and the root mean square error (RMSE) were used as metrics: R2 indicates the proportion of variance in the ratio explained by the model. The RMSE, on the other hand, quantifies the average prediction error and is calculated as the square root of the average squared differences between the predicted and actual values. The final model performance was determined by averaging the R2 and RMSE values across the five validation sets. All model tunings and evaluations were conducted using Python (v.3.8).
To quantify the influence of each feature on the ratio, we computed a SHAP (SHapley Additive exPlanations) value for each feature and sample (i.e., at each hour) using the SHAP package (v.0.40.0) in Python (v.3.8). A positive SHAP value indicates that the feature contributes positively to the ratio, while a negative SHAP value means that it makes a negative contribution. The SHAP values versus feature values were then fitted with a generalized additive model (GAM) using the pygam package (v.0.8.0) to further identify the sensitivity ranges where the changes in feature values significantly affect the SHAP values. For more details, please refer to Text S6. We utilized two-way partial dependence plots (PDPs) (Chen et al., 2024a; Shi et al., 2023; Zhang et al., 2022) to analyze the joint effects of T and RH on the predicted ratio. This analysis yielded a comprehensive understanding of how simultaneous changes in T and RH affect the observed ratio, thereby unveiling the complex dynamics among these variables. For more details, please refer to Text S7.
Despite the overall improvement in air quality in recent years, PM2.5 episodes still occur frequently in December and January in most Chinese cities, contributing to the majority of the PM2.5 exceedance days of a year. During the winter observation period of this study, PM2.5 concentrations ranged from 20 to 150 µg m−3, spanning both clean and severe pollution conditions. Organic aerosol (COA= COC × 1.4) comprised 10 %–76 % of PM2.5, emerging as a critical bottleneck when eliminating PM2.5 episodes. Time series of the other criterion pollutants and key meteorological parameters are presented in Fig. S2. The data collected during the observation period herein are considered representative of winter PM2.5 pollution characteristics in Wuhan.
3.1 Observed ratios of OOMs and comparison with equilibrium partitioning
As shown in Fig. 1a, although ratios generally decrease with increasing molecular weight, the observed ratios show a narrower range (10−1–101.5) than the equilibrium ratios predicted from Eq. (4). The differences could be up to 10 orders of magnitude, depending on the C* parameterization. Of all the methods, Mohr et al. (2019) predicted the steepest dependence of on Mw. Their values are higher than for the OOMs with nC= 2–5 and lower than for the OOMs with nC > 8 (Fig. 1b). It has been recognized by Kurtén et al. (2016) and subsequent publications that SIMPOL-derived parameterizations predict an overly steep dependence of C* on Mw and oxygen content. Moreover, the parameterization of Mohr et al. (2019) likely produces C* of pure compounds. Without considering the effect of the particle matrix, it may be unrealistic to predict ratios using their C* parameterization. On the basis of the thermal desorption temperature, Ren et al. (2022) predicted lower equilibrium ratios than all other parameterizations and our observation. The weakness of Ren et al. (2022) is that thermal desorption may result in the formation of decomposed fragments, which could be misidentified as OOM species. As a result, the Tmax of OOM formulas tends to be overestimated and the C* tends to be underestimated in their parameterization. Although Peräkylä et al. (2020) also predicted lower ratios, their ratios are much closer to our observation than Ren et al. (2022). Of all the predictions, the one by Priestley et al. (2024) is closest to our observation. This is because their C* parameterization is based on the measured gas- and particle-phase concentrations of OOMs in fresh or aged residential wood burning emissions. Their predicted ratio is thus inherently consistent with the observed ratios in our study. This also highlights the risks of estimating volatility (C*) using the partitioning method, which is based on measuring equilibrium gas- and particle-phase concentrations of OOMs. Two key issues arise: (1) OOMs may not achieve the assumed equilibrium state under real atmospheric or chamber conditions, introducing substantial uncertainty into calculations of ; and (2) the method fails for compounds with extremely high or low volatility, as their gas- or particle-phase concentrations often fall below the detection limits of mass spectrometers. These limitations explain why the partitioning method typically reports a narrow volatility range (Voliotis et al., 2021; Chen et al., 2024b).
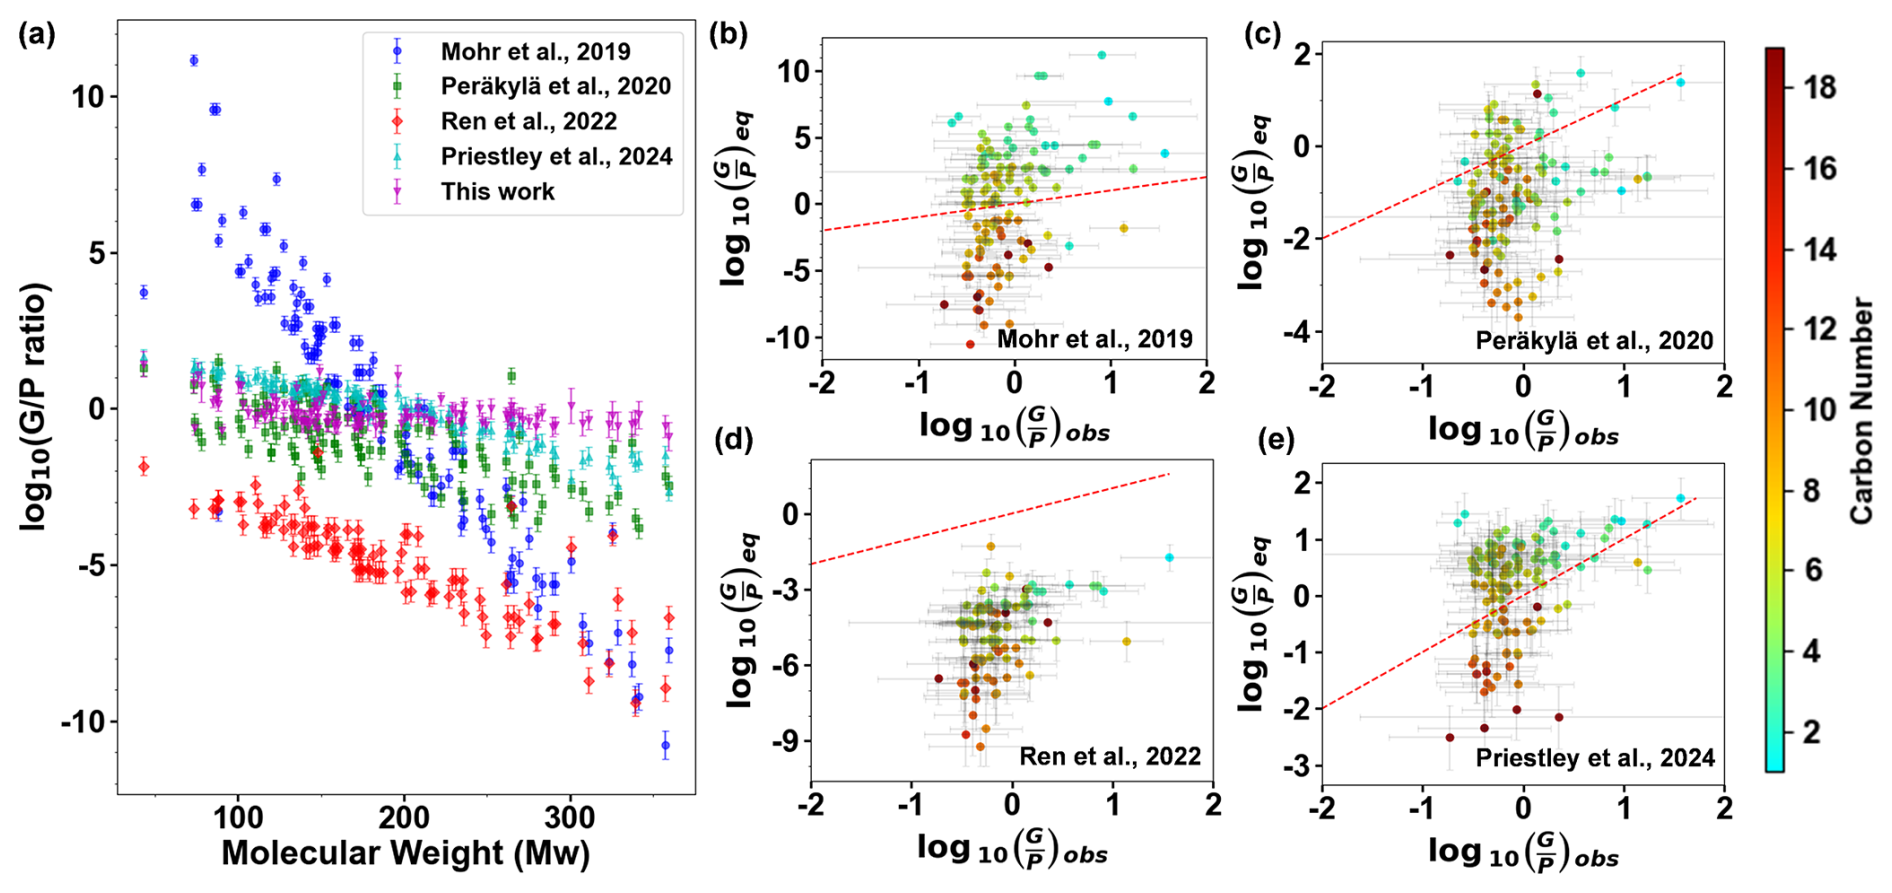
Figure 1Comparison of the of 123 OOMs with the corresponding predicted by Eq. (4). C* was estimated from the parameterizations of Mohr et al. (2019), Peräkylä et al. (2020), Ren et al. (2022), and Priestley et al. (2024), respectively. The error bars of denote the range of ratios observed under varying conditions for 594 samples (i.e., 594 h). The error bars of denote the variations with temperature and COA. The color scales in panels (b)–(e) denote the carbon numbers of the OOM species. The dashed red lines in panels (b)–(e) denote a 1:1 correspondence.
In theory, no matter which C* parameterization is used in Eq. (4), the temporal variation of for an OOM species depends solely on COA and temperature. Therefore, we are able to obtain a normalized , which is independent of C* parameterization, by dividing the of an OOM by its maximum value. Diurnal variations of the normalized of C5H8O4 and C7H7NO3 are shown in Fig. 2a, b, and those of the other four selected OOMs are shown in Fig. S3. We found similar diurnal variations for all six OOMs: a peak ratio appeared in the afternoon, which is attributed to a higher temperature. In contrast, we observed different patterns of diurnal variations for the six OOM species during the campaign, as shown in Fig. 2c–h. This indicates that the extent of the deviation of actual gas–particle partitioning from the equilibrium state fluctuates randomly over time, driven by other unknown factors. In this study, we will first examine the influencing factors of the gas–particle distribution of OOMs in the urban atmosphere during the winter campaign (Sect. 3.2), followed by an investigation into the factors contributing to the discrepancies between the observed and equilibrium ratios (Sect. 3.3).
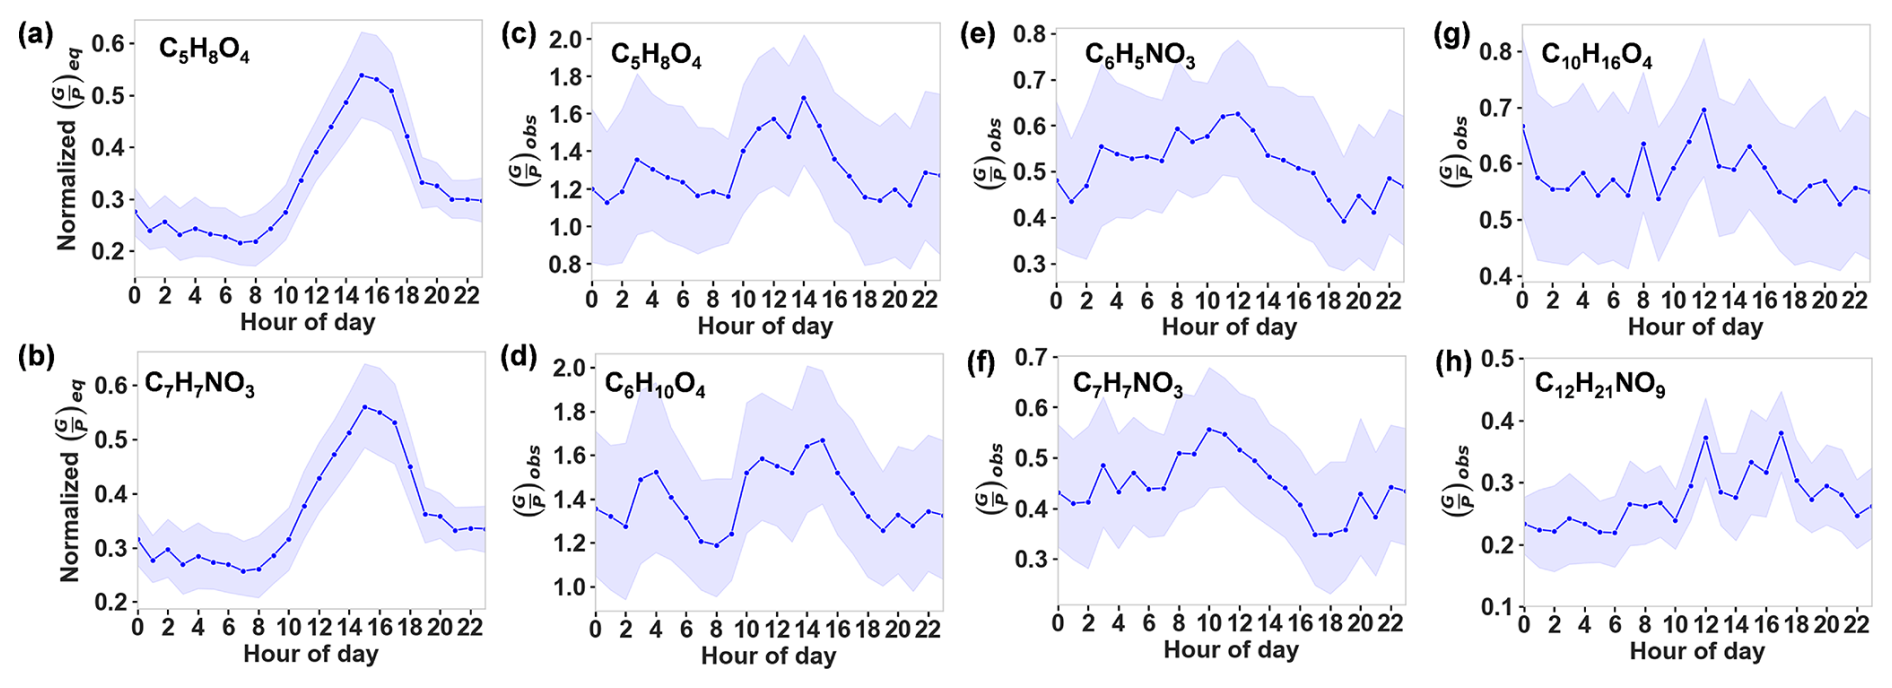
Figure 2Diurnal variations of (a–b) the normalized equilibrium ratios for the selected species (C5H8O4 and C7H7NO3) and (c–h) the observed ratios during the campaign. The solid line denotes the average value, and the filled area denotes the 95 % confidence intervals of the mean.
3.2 Influencing factors of the observed ratios of OOMs
3.2.1 Multispecies model performance and key features
The 5-fold cross-validation demonstrates that a predictive multispecies model with a satisfactory generalization performance was developed, achieving R2=0.88 ± 0.02 and RMSE = 1.76 ± 0.13 in the test set (Fig. S4). Mean absolute SHAP values indicate the average importance of each feature in predicting the observed ratios (Fig. 3a). The model highlights that intrinsic molecule features, such as nC, Mw, nH, and DBE, far outweigh meteorological and chemical composition features in the model's predictions. Of the nine molecular features, eight are ranked as highly important, with nN being comparatively less influential.
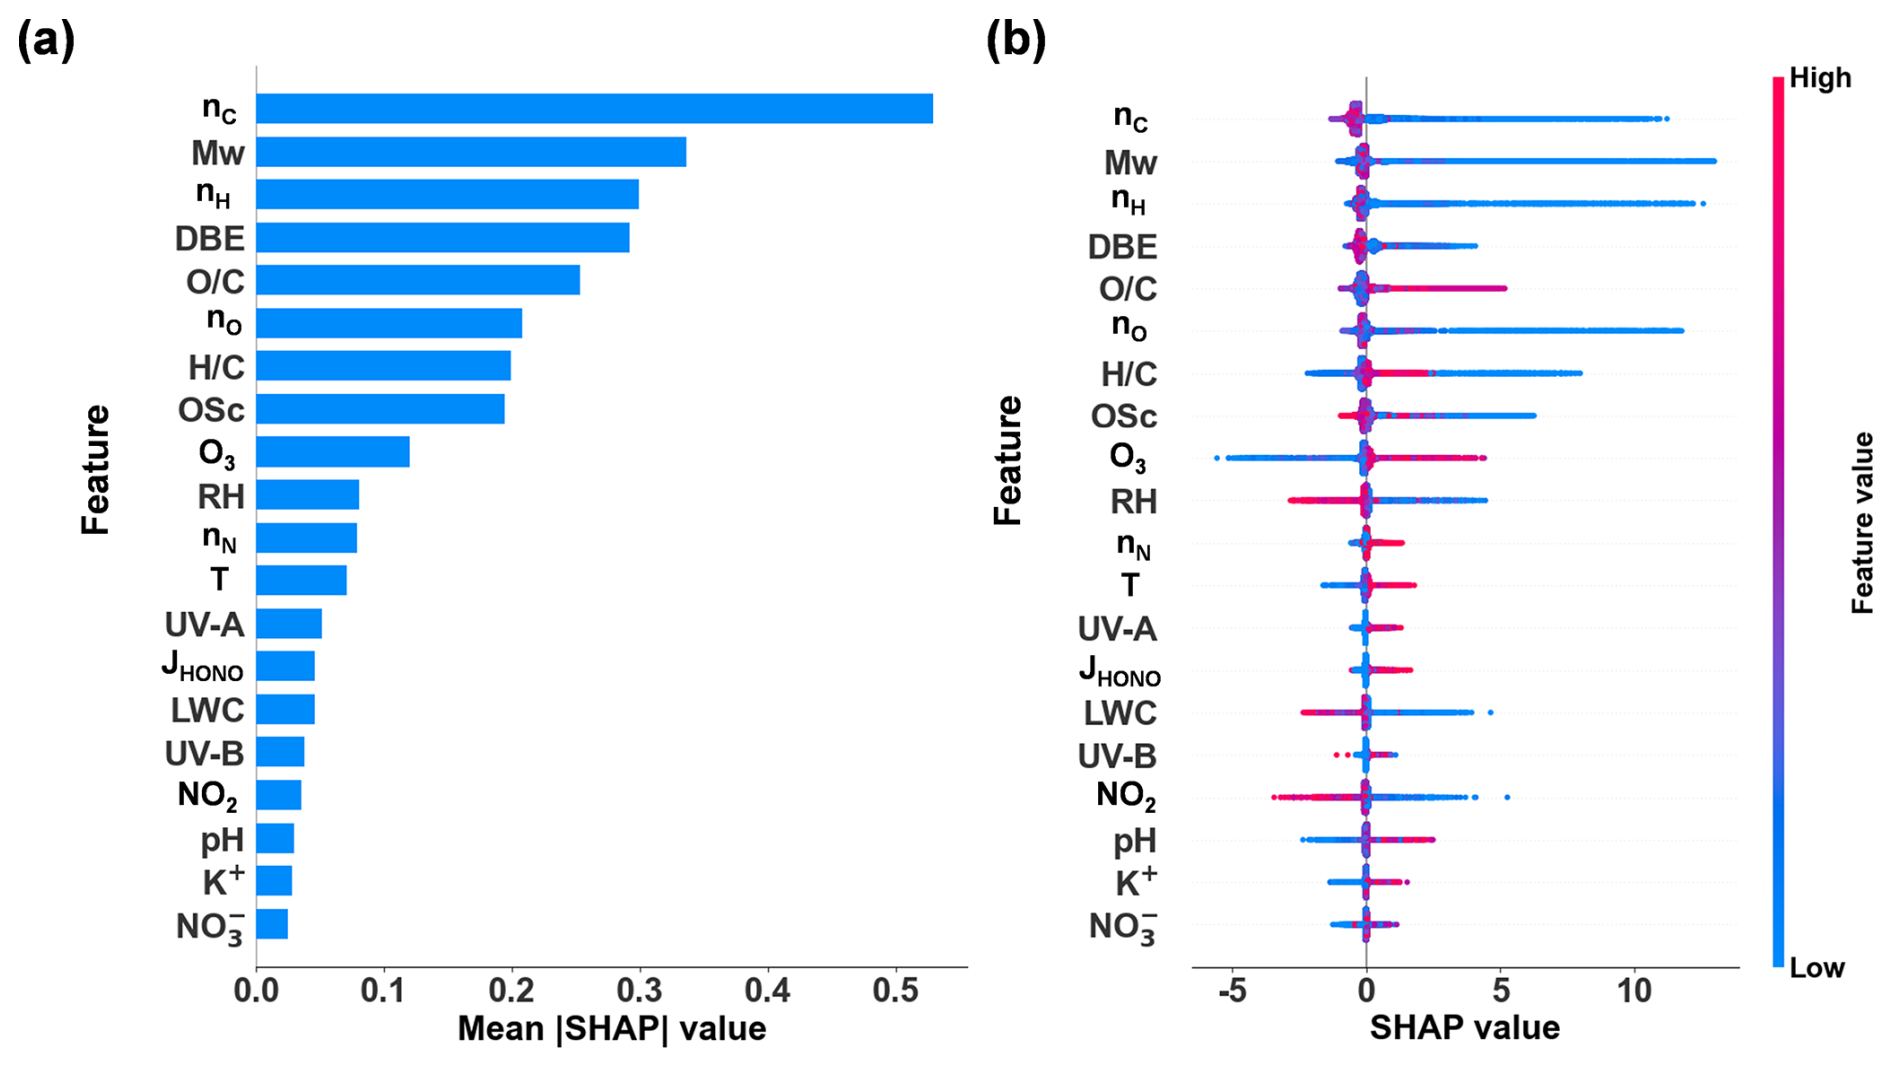
Figure 3Multispecies model: (a) feature importance based on the mean of the absolute SHAP values calculated for 594 samples (i.e., 594 h) for predicting the ratio. (b) Distribution of SHAP values in 594 samples for the top 20 features.
Figure 3b shows the SHAP value distribution for each feature. For molecular features, such as nC, Mw,nH, and nO, high feature values are associated with negative SHAP values, while low feature values are associated with positive SHAP values. This suggests that large molecules with high nC, Mw, nH, and nO and consequently lower volatility are more likely to partition into the particle phase, thereby reducing the ratio.
However, the molecular features related to oxidation state and unsaturation degree did not show consistent effects on the observed ratios. For example, OSc has a negative effect on the ratios, whereas has a positive effect. DBE has a negative effect on the ratios, whereas shows a mixed positive and negative effect. This is due to the fact that these features are dependent variables as a function of nC, nH, nN, and nO. To isolate the effects of oxidation- and unsaturation-related features, we utilized the trained random forest model to predict ratios of modified C10 monocarboxylic acid with varying numbers of the hydroxyl group and DBE (Fig. 4b and c). Other features in the model were fixed at average daytime or nighttime values observed during the campaign (see Tables S2 and S3). For comparison, the isolated effect of the carbon atom number is also plotted (Fig. 4a).
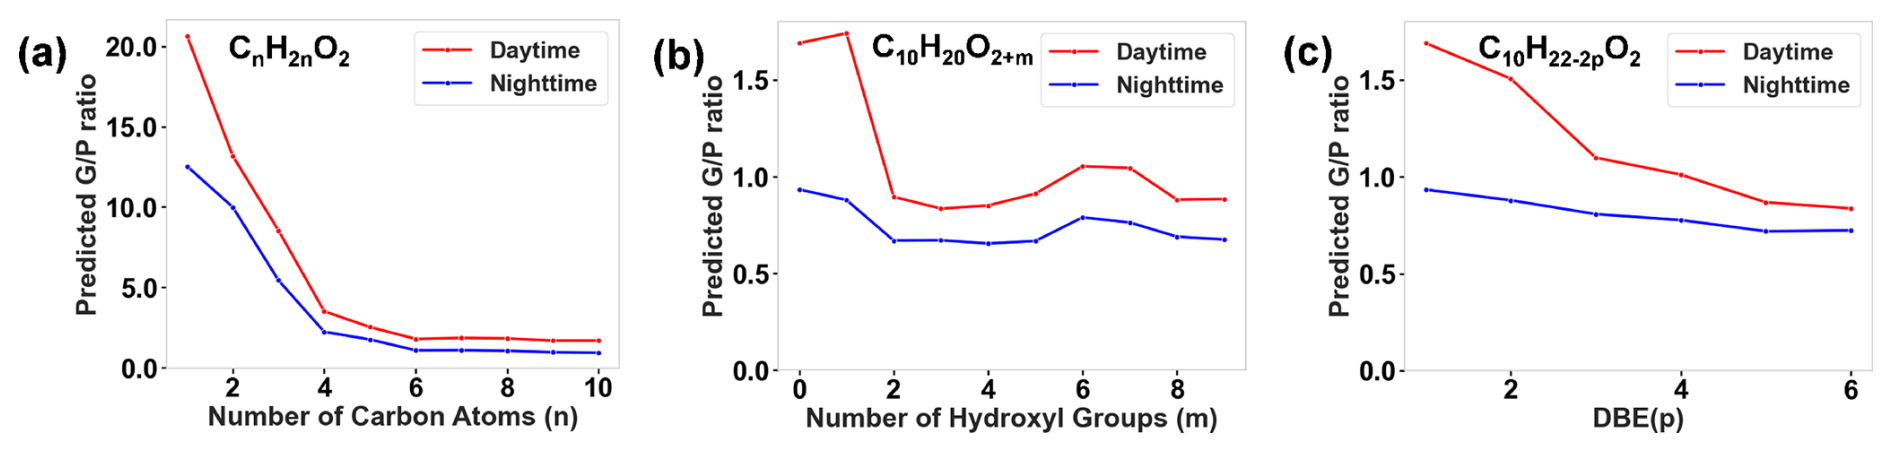
Figure 4Predicted ratios using the developed multispecies model for (a) monocarboxylic acids as a function of the number of carbon atoms, (b) modified 10-carbon monocarboxylic acids as a function of the number of additional hydroxyl groups, and (c) modified 10-carbon monocarboxylic acids as a function of DBE values, under average daytime and nighttime environmental and gas–particle composition conditions.
Figure 4 demonstrates that the number of carbon atoms exerts the most significant influence on the predicted ratio, which decreases sharply as the carbon atom number increases from 1 to 4. Beyond this point, the ratio levels off. For modified 10-carbon monocarboxylic acids, ratios are high when there is one or no hydroxyl group (Fig. 4b). The ratio levels off when the number of hydroxyl groups exceeds two. The ratio decreases with an increasing DBE value (Fig. 4c). When the DBE value exceeds five, the ratio change becomes minimal. In all of the subplots, the ratio during nighttime is consistently lower than that during daytime, which could be attributed to enhanced partitioning from gases to particles at a lower nighttime temperature.
3.2.2 Identification of the key features and sensitivity analyses in single-species models
By excluding molecule features, single-species models focus on the prediction of observed gas–particle partitioning behaviors of individual OOMs from meteorological and gas–particle composition features. The evaluation results and optimal parameters of the six single-species models in the test set are presented in Table S4. All of the models show an acceptable generalization ability (R2= 0.51–0.88). For all six OOMs, particle composition features dominate over meteorological and gaseous composition features in predicting the ratios (Fig. 5). Particle composition features LWC, OC, K+, SO, and pH as well as RH consistently play important roles in influencing the ratios of these species. This is roughly in line with the correlation analysis between the features and the observed ratios of the six selected OOMs (Fig. S5), which show that pH, RH, LWC, and SO exhibited strong positive or negative correlations with the ratios. Below, we (1) examined the positive or negative effects of these features one by one (Fig. 6a) and (2) identified the sensitive ranges of these features by fitting SHAP values against feature values using a GAM (Fig. 7).
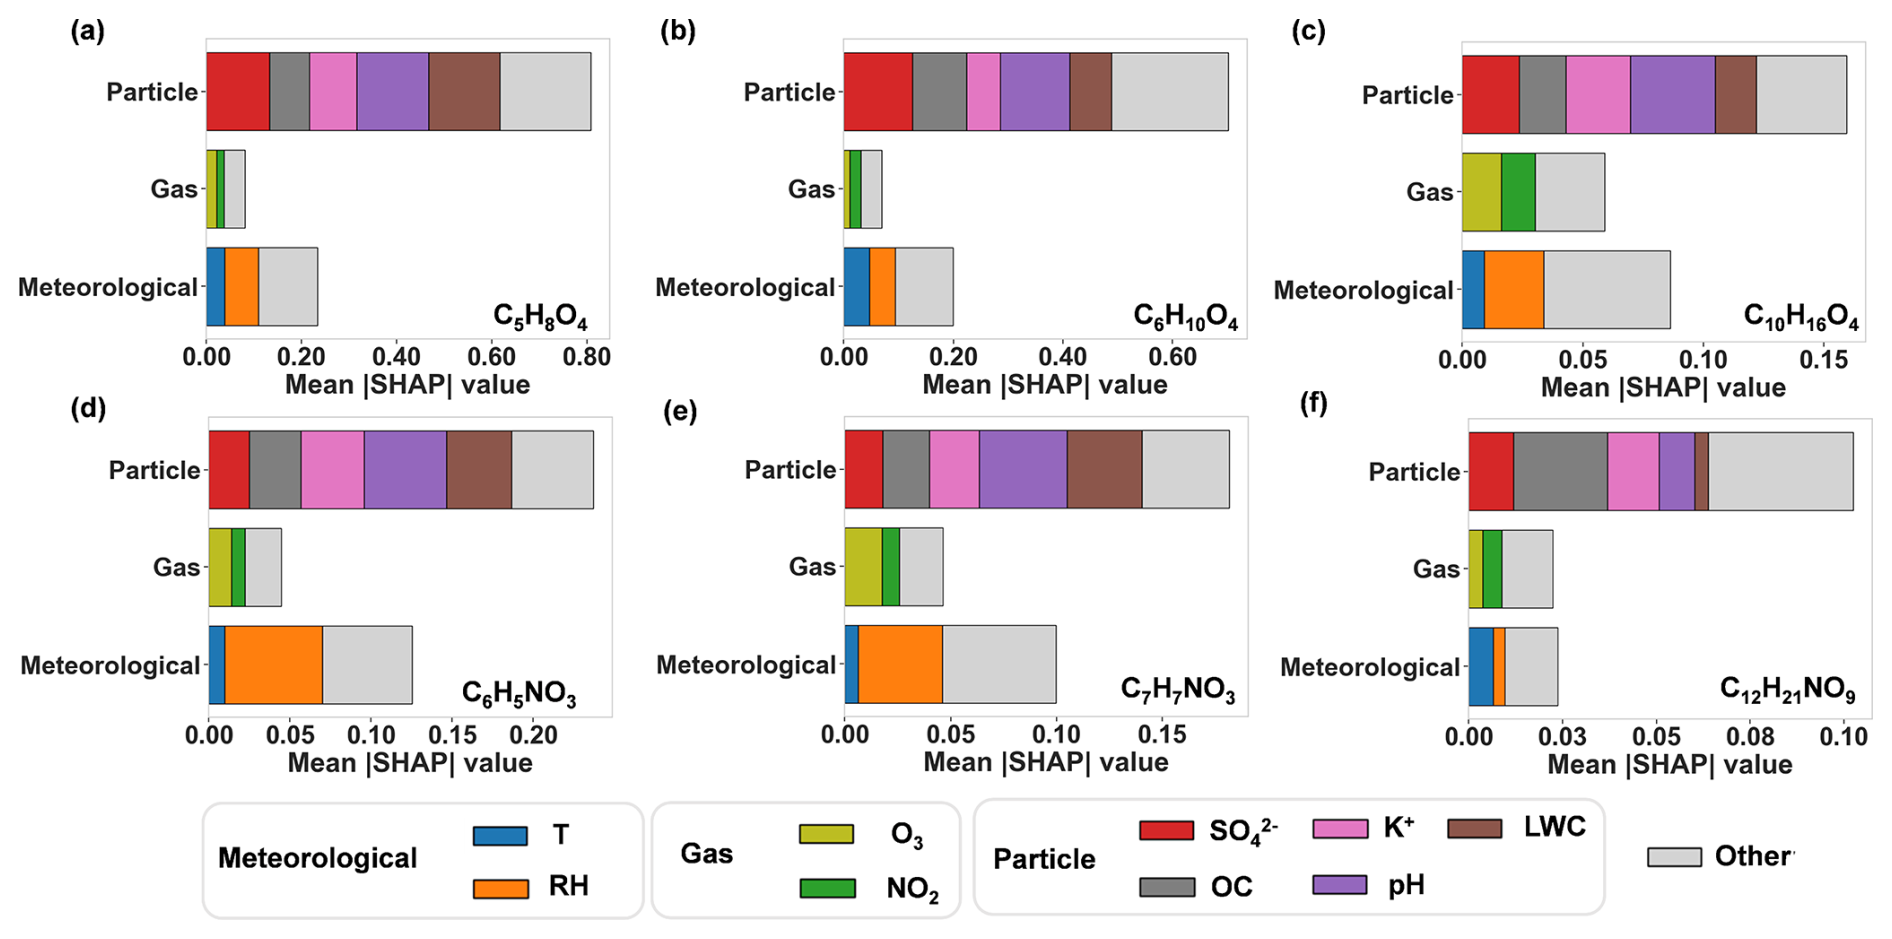
Figure 5SHAP value analysis of three categories of features. The mean |SHAP| denotes the mean absolute SHAP values calculated for 594 samples (i.e., 594 h): (a) glutaric acid (C5H8O4), (b) adipic acid (C6H10O4), (c) monoterpene oxidation products (C10H16O4), (d, e) nitrophenol (C6H5NO3 and C7H7NO3), and (f) nitrated aliphatic acid (C12H21NO9).
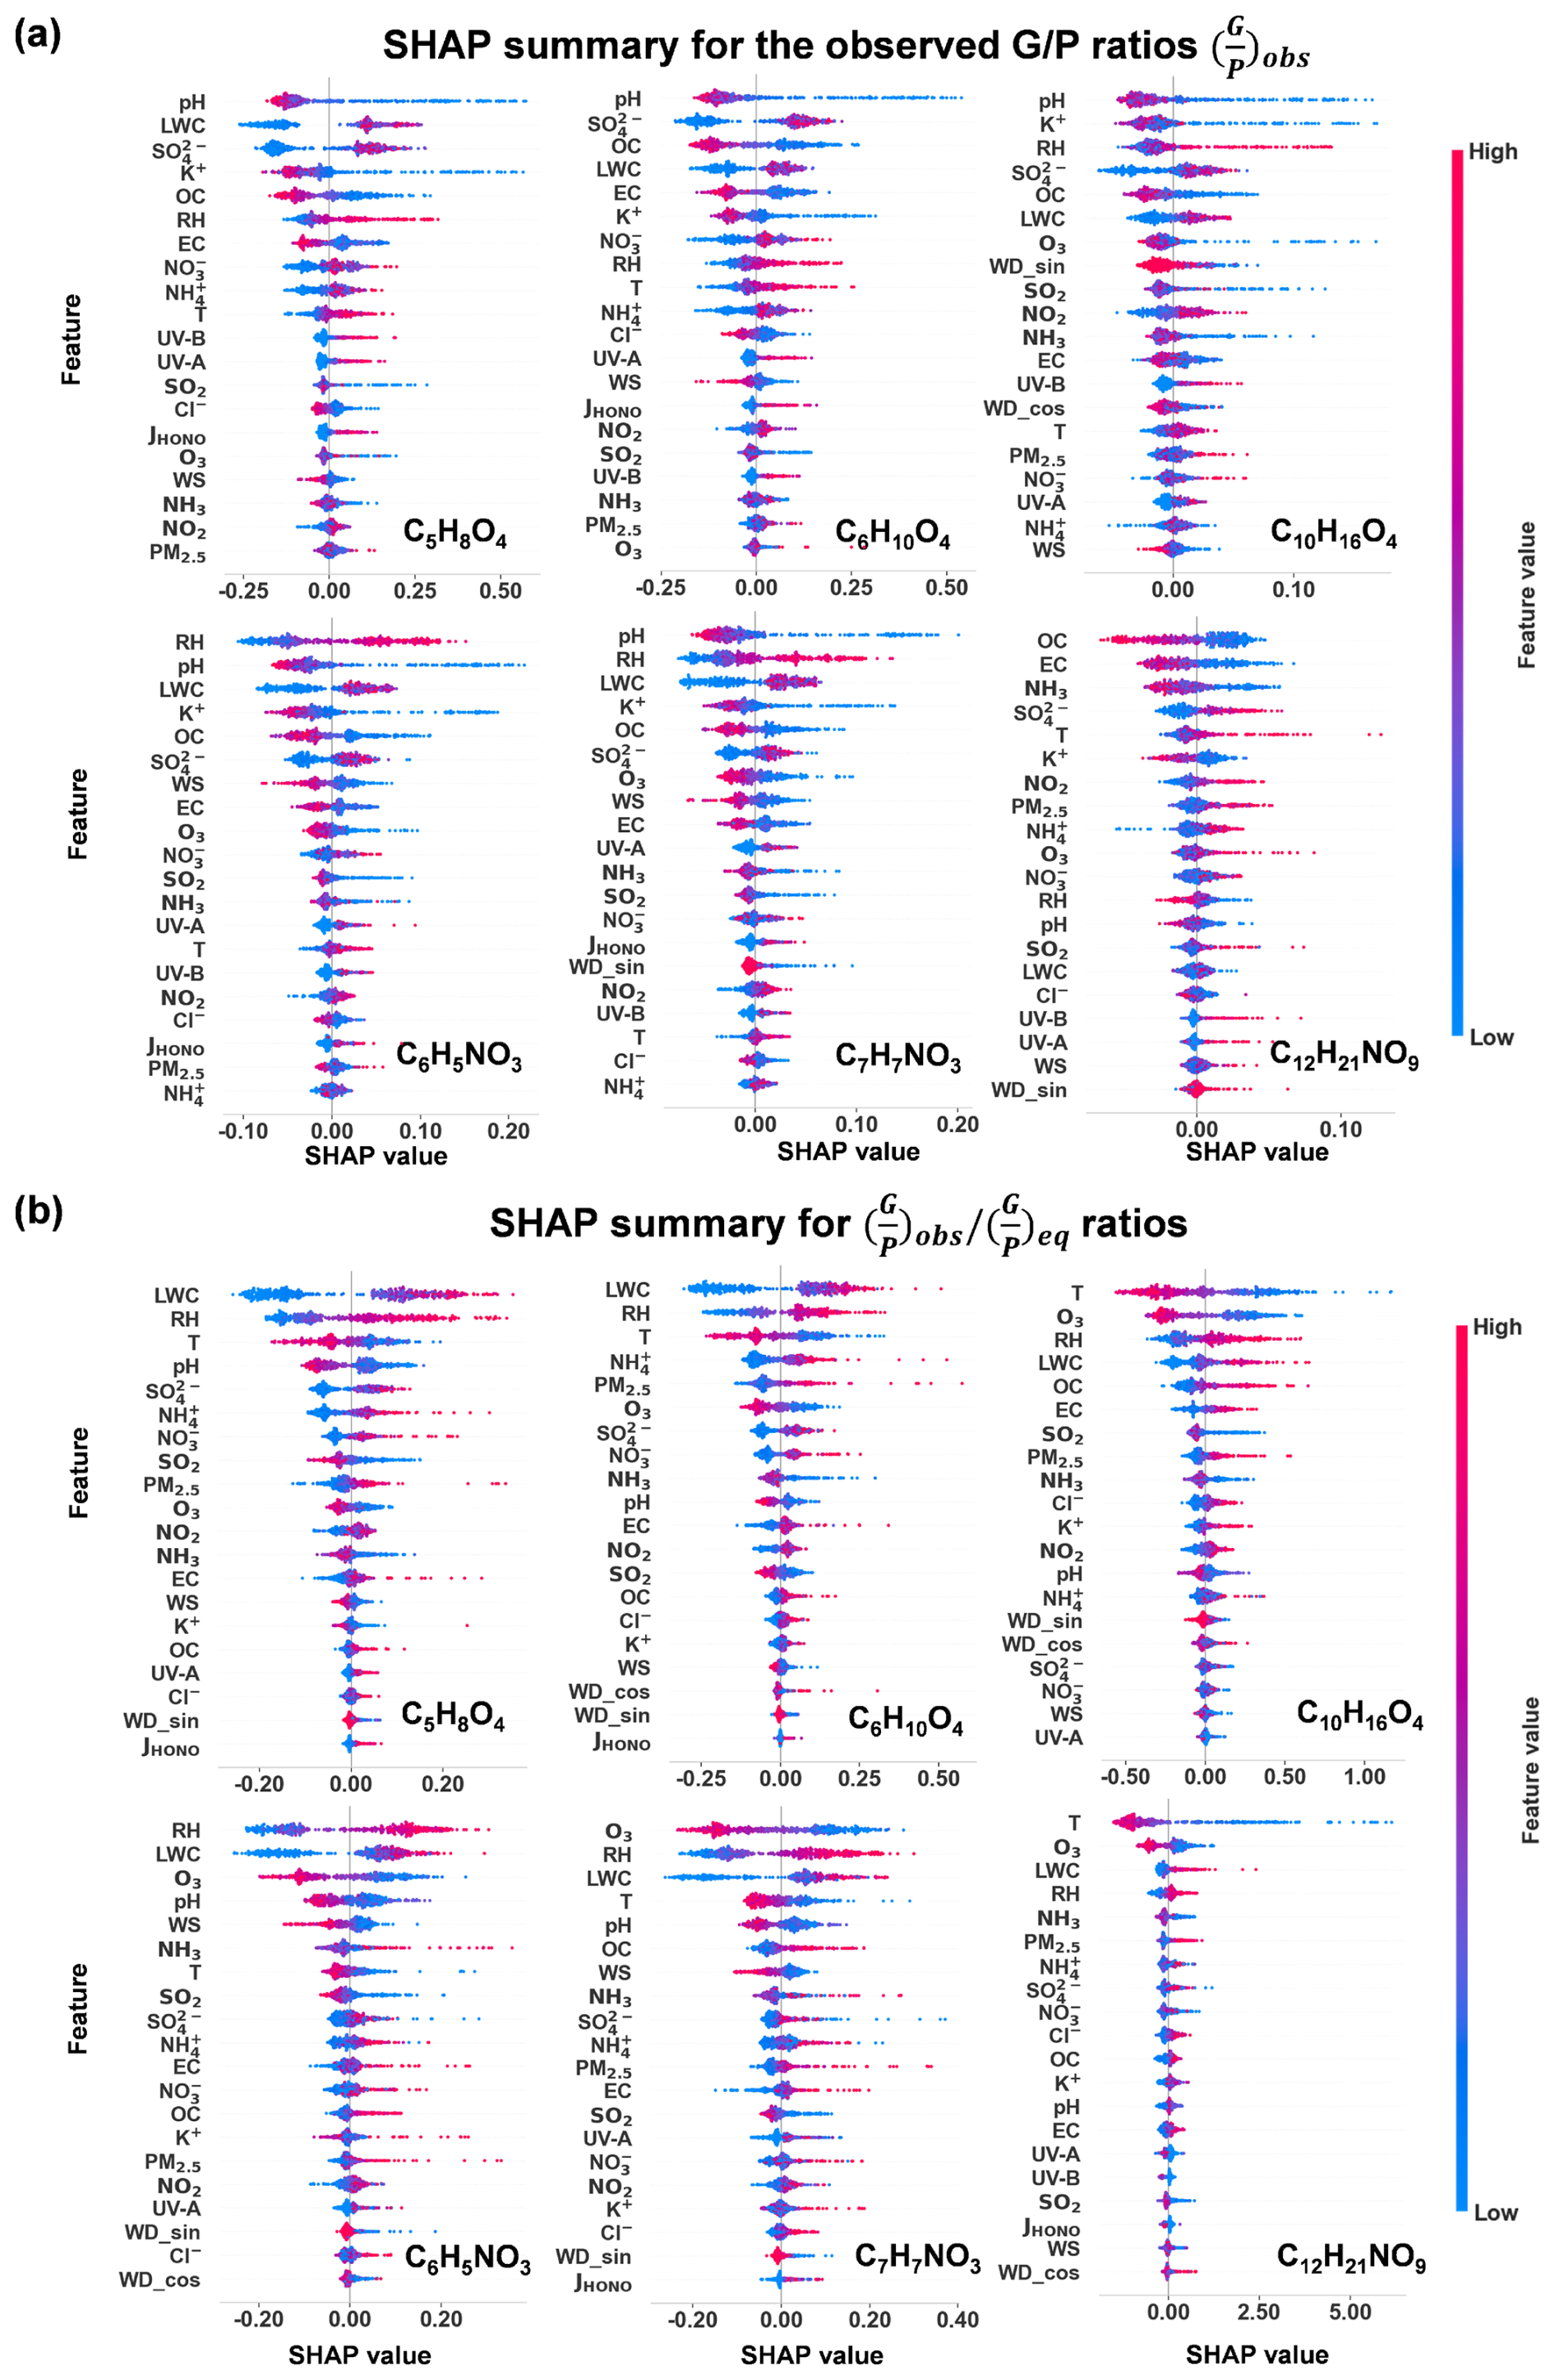
Figure 6SHAP summary plots for feature importance based on the random forest model for glutaric acid (C5H8O4), adipic acid (C6H10O4), the monoterpene oxidation product (C10H16O4), nitrophenol (C6H5NO3 and C7H7NO3), and nitrated aliphatic acid (C12H21NO9). Features are prioritized in descending order based on their importance. (a) SHAP summary for the observed ratios . (b) SHAP summary for the ratios.
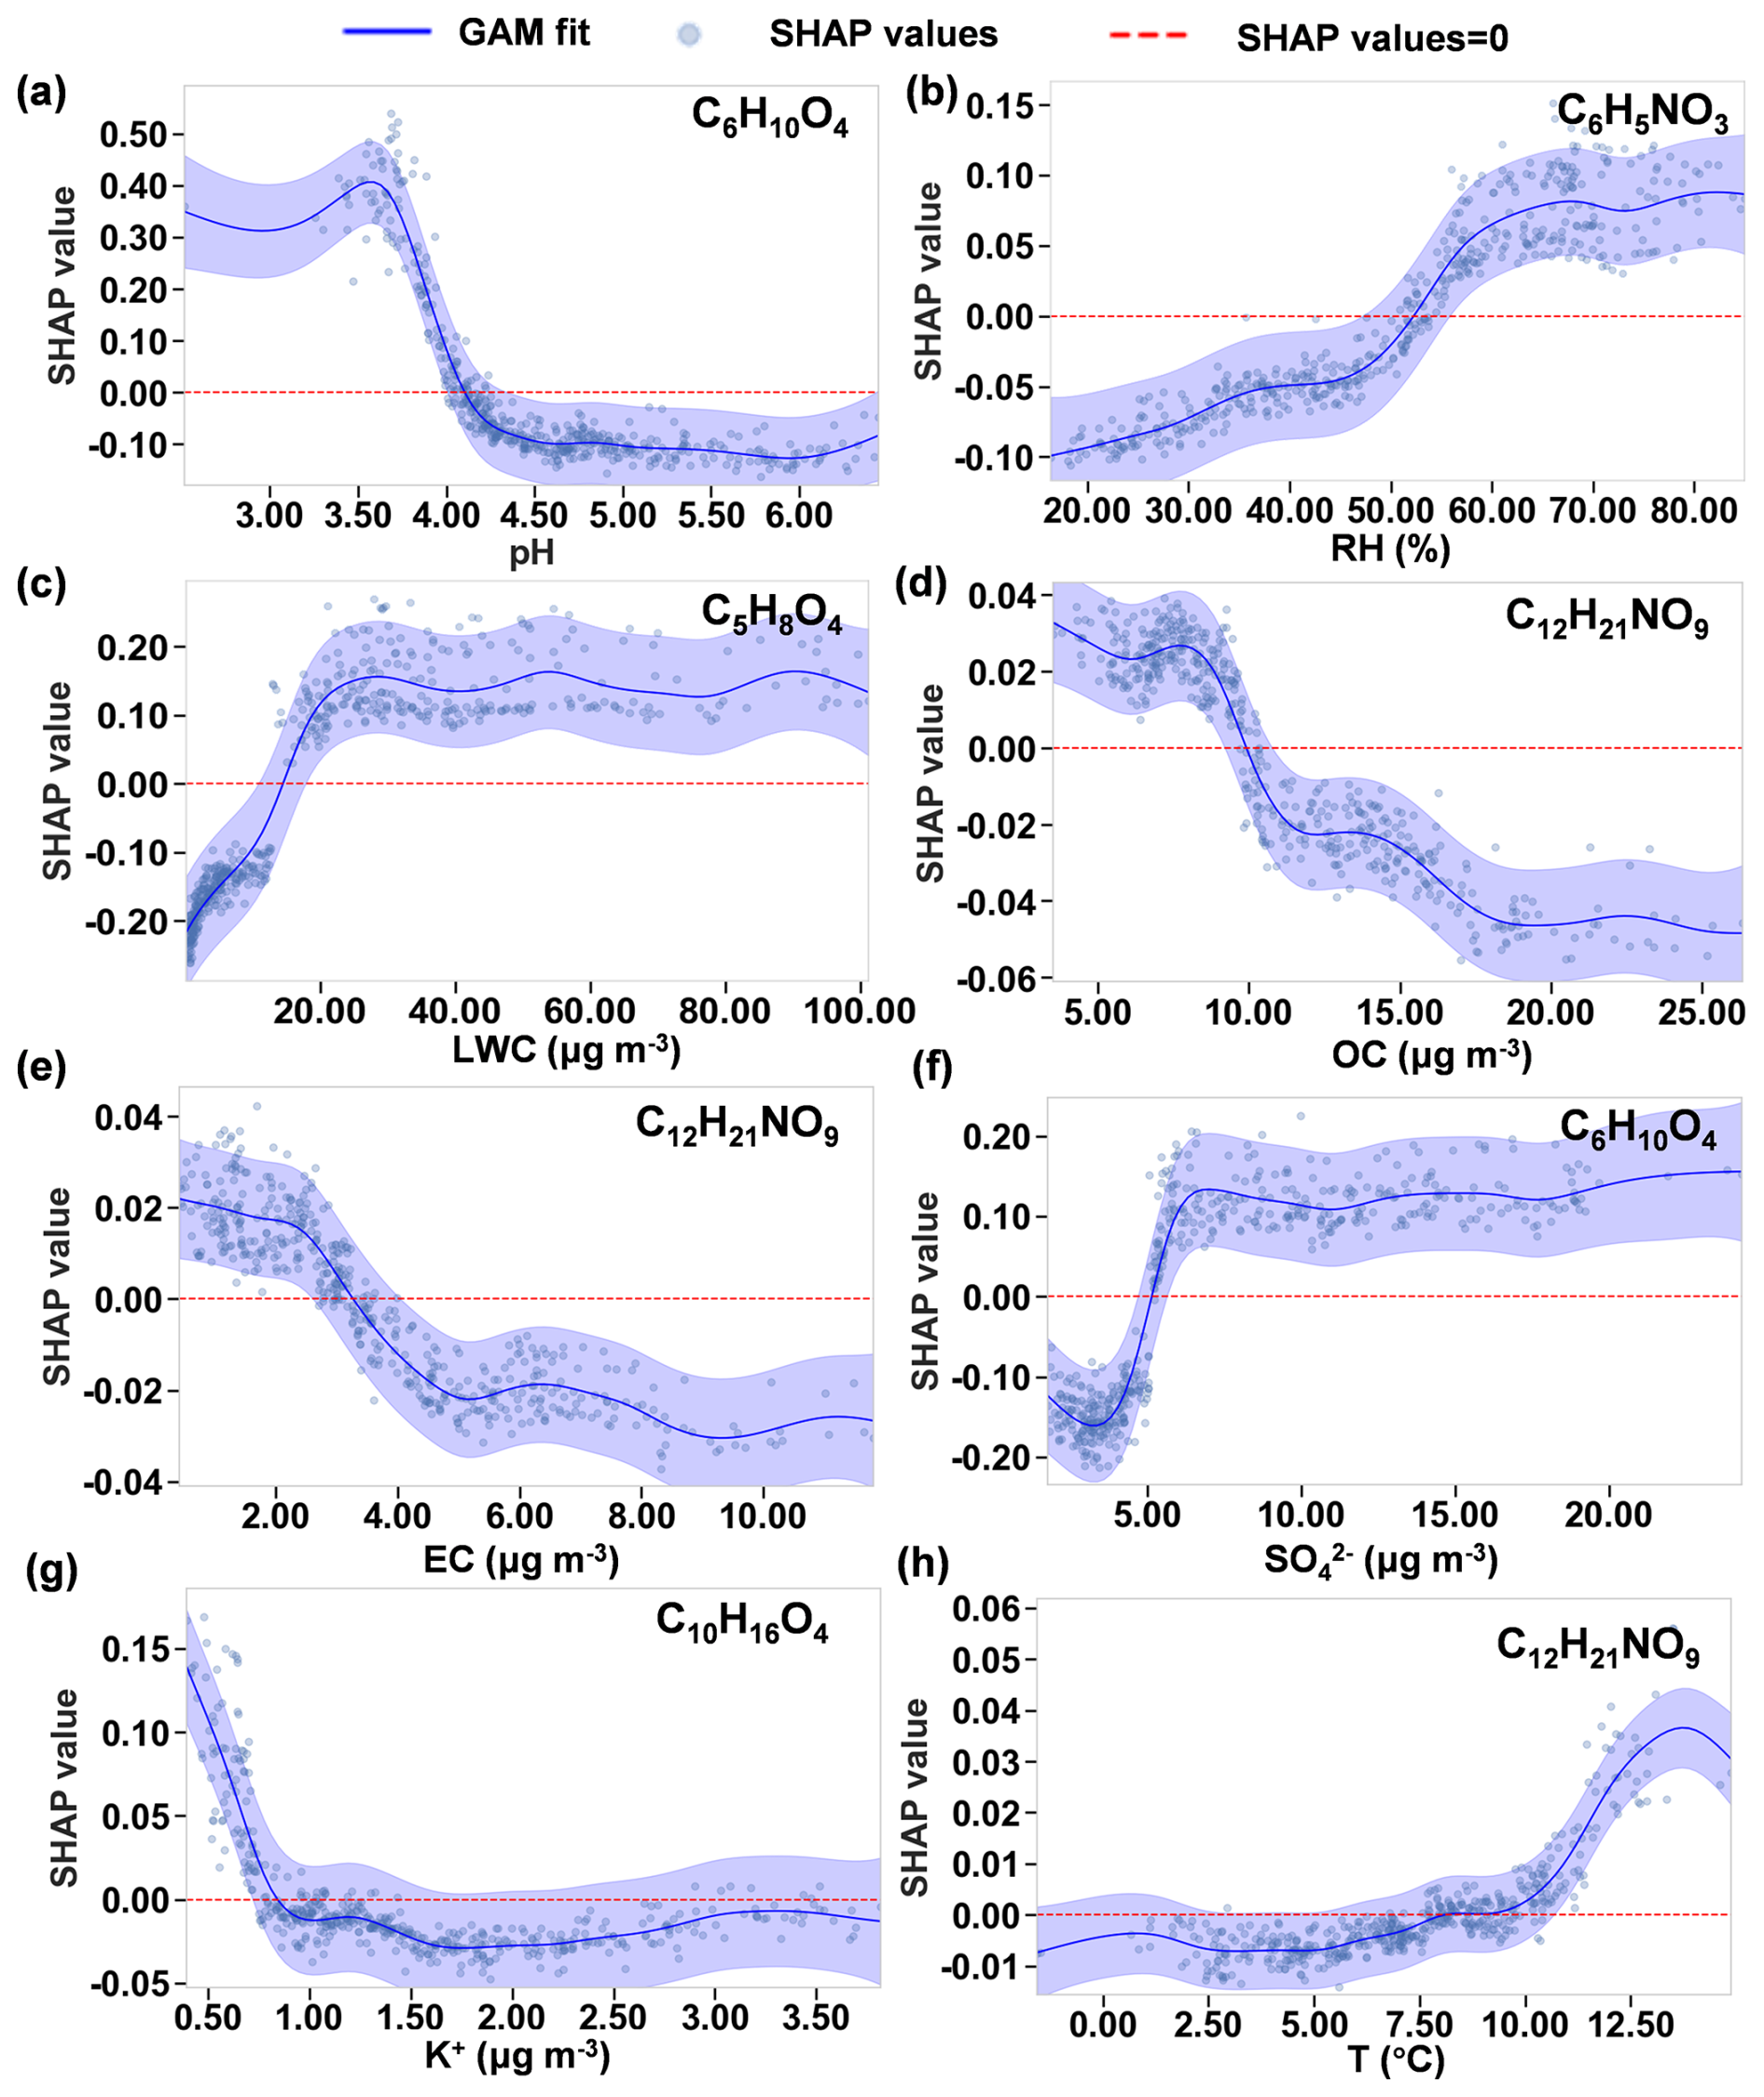
Figure 7Curve fitting of SHAP values versus features using a GAM, illustrating the sensitivity ranges where the changes in feature values significantly affect the SHAP values. Only those OOM species most affected by the eight features are shown. (a) pH for C6H10O4. (b) RH for C6H5NO3. (c) LWC for C5H8O4. (d) OC for C12H21NO9. (e) EC for C12H21NO9. (f) SO for C6H10O4. (g) K+ for C10H16O4. (h) Temperature for C12H21NO9. The blue line denotes the GAM fit. The shaded area indicates the 95 % confidence interval. The dots are the SHAP values for 594 samples (i.e., 594 h). The red dashed line denotes a SHAP value of 0.
pH is one of the two most influential factors in the gas–particle partitioning of five species (C5H8O4, C6H10O4, C6H5NO3, C7H7NO3, and C10H16O4), with a sensitivity range of 3.5–4.5 (as illustrated for C6H10O4 in Fig. 7a). Within this range, the contribution to the ratio decreases by 0.5 from pH 3.5 to 4.5. Beyond pH 4.5, the ratio stabilizes at −0.1. An increase in pH results in a pronounced decrease in the ratio. This phenomenon can be attributed to the enhanced partitioning of OOMs with acidic functional groups from gases to particles with elevated pH (Su et al., 2020).
RH has a positive effect, ranking among the top five significant features, on the ratios of the three OOMs C6H5NO3, C7H7NO3, and C10H16O4 (Fig. 6a). The SHAP value is sensitive to RH across the full RH range (20 %–80 %, illustrated by the example C6H5NO3 in Fig. 7b). LWC also has a significant positive effect for C5H8O4, C6H10O4, C6H5NO3, and C7H7NO3. For example, in the case of C5H8O4, a sharp increase of 0.35 in the ratio is observed within the LWC range below 20 µg m−3. Above 20 µg m−3, the contribution to the ratio stabilizes at 0.15 (Fig. 7c). The underlying mechanism of this behavior is unclear. One explanation is that the low RH and LWC in particles may facilitate the reversible formation of oligomers (Shen et al., 2018) and suppress their hydrolysis (Liu et al., 2012), thereby increasing the concentration of these OOMs in the particle phase. It is also possible that the thermal desorption and subsequent detection of particle-bound OOMs were inhibited in aerosol particles with more moisture.
OC has a significant negative impact (i.e., ranking among the top five) on the ratios of all six species, consistent with Eq. (4), where the equilibrium ratios are inversely proportional to COA. Taking C12H21NO9 as an example (Fig. 7d), the SHAP values decrease monotonically with COA by 0.08 in the entire COA range (5–25 µg m−3). For this compound, EC ranks as the second-most influential factor, exerting a notable negative impact below 4 µg m−3. A significant decrease of 0.05 was observed in this range (Fig. 7e).
SO has a positive effect (i.e., ranking among the top five) on the ratios of C5H8O4, C6H10O4, C10H16O4, and C12H21NO9. For example, in the case of C6H10O4, the ratio rises rapidly by 0.30, with increasing SO concentrations below 6 µg m−3 (Fig. 7f). Above 6 µg m−3, the contribution to the ratio stabilizes at 0.1. This may partly be related to the fact that SO is a highly hydrophilic component (Thaunay et al., 2015), which makes its effect similar to that of LWC. In addition, an increase in sulfate in aerosols is often associated with enhanced acidity and a decrease in pH (Zhang et al., 2007), which drives OOM from the particle to gas phases, as we have explained above.
K+ has a negative effect on the ratios of C5H8O4, C10H16O4, C6H5NO3, and C7H7NO3. Taking C10H16O4 as an example, the ratio decreases rapidly by 0.15, with K+ in the concentration range below 1 µg m−3. Above 1 µg m−3, its contribution to the ratio stabilizes at −0.03 (Fig. 7g). K+ is considered a tracer of biomass burning. The increase in K+ is generally associated with higher pollution levels and higher OC concentrations in the study region (Zhao et al., 2024). The effect of K+ on the ratio is thus similar to that of OC.
In general, temperature is supposed to be an important influential factor in the ratio, because the saturation vapor pressure of OOMs increases with temperature. Temperature ranged from −1.6 to 14.9 °C during the winter campaign. Although temperature increase tends to elevate the ratios, as expected (Fig. 6a), the models show that temperature did not rank as an important feature for five of the six OOM species. We evaluated the effect of temperature on ratios using two-way partial dependence plots (Fig. S6). The ratio is sensitive to temperature change only for two dicarboxylic acids (C5H8O4 and C6H10O4, Fig. S6a–b) and for C12H21NO9 in a narrow temperature range of 10–13 °C (Figs. S6f and 7h). The ratios of C6H5NO3, C7H7NO3, and C10H16O4 are not sensitive to temperature across most of the RH range. This behavior may be attributed to the aerosol coating of inorganic salts and other aerosol components that hinder the rapid equilibrium partitioning of OOMs when temperature changes. In addition, the influence of temperature may be obscured due to the dominant effect of particle composition features (e.g., LWC, pH, OC, SO, and K+), as discussed above.
As shown in Fig. 6a, wind speed and direction rank relatively low in terms of feature importance for the six OOMs. This suggests that, while wind direction and speed might influence the source areas of OOMs, they have a minimal impact on the ratios of OOMs.
3.3 Identifying key factors driving the deviations of gas–particle partitioning from the equilibrium state
To investigate the deviations of the observed gas–particle partitioning from the equilibrium state, we first calculate the ratios of to the normalized for every hour for the six selected OOM species. The normalized was used here in order to offset the effect of the C* parameterization selection. We then developed new random forest models to investigate the effects of meteorological and gas–particle composition features on the ratios. All of the models show an acceptable generalization performance (R2= 0.52–0.83) (Table S5) in the test set.
Figure 6b presents the SHAP analysis results for the ratios of the six OOMs. The models identify RH, LWC, O3, and temperature as four influential factors driving the deviations from equilibrium partitioning. Positive correlations are observed between the SHAP values of and the RH and LWC for all six compounds. This indicates that RH and LWC have a stronger positive effect on than their effect on , which should be negligible according to Eq. (4). Temperature is shown to be a negative factor driving the deviation from equilibrium partitioning, suggesting that temperature has a stronger influence on than . This is consistent with our earlier result that is not sensitive to temperature. Surprisingly, O3 is identified as an important influential factor with a negative effect, particularly for the three nitrophenols and the monoterpene oxidation product C10H16O4. Since O3 is not expected to change , the negative impact of O3 on the ratio could be explained by the speculation (Kaur Kohli et al., 2023) that high O3 concentrations are likely to deplete gas-phase OOMs at a faster rate than particle-phase OOMs, thereby reducing .
We measured the ratios of OOM species using FIGAERO-CIMS in the urban atmosphere during a winter campaign. The observed ratios show a narrower range than the equilibrium ratios predicted from C* and COA. The difference between the observed and equilibrium ratios could be up to 10 orders of magnitude, depending on the C* parameterization. Our observed ratio is inherently closer to the equilibrium ratios predicted from the C* parameterization by Priestley et al. (2024), which was derived from measured ratios in wood burning emissions. Our random forest models identified RH, LWC, O3, and temperature as four influential factors driving the deviations of gas–particle partitioning from the equilibrium state.
Random forest models with satisfactory performance were developed to predict observed ratios. Intrinsic molecule features, such as nC, Mw, nH, and DBE, far outweigh meteorological and chemical composition features in the model's predictions. Large molecules with high nC, Mw, nH, nO, and consequently lower volatility are more likely to partition into the particle phase, thereby reducing the ratio. As dependent variables, oxidation state and unsaturation do not show consistently positive or negative effects on the observed ratios. If other variables are fixed, the model predicts that ratios generally decrease with the addition of oxygen atoms and the DBE.
Particle composition features dominate over meteorological and gaseous composition features in predicting the ratio of a given OOM species. Among these particle features, pH, RH, LWC, OC, K+, and SO consistently play important roles in influencing the ratios of the six selected OOM species, showing either positive or negative effects. We also identified the sensitivity ranges where the changes in these features significantly affect the SHAP values and provided valuable insights for future research in atmospheric chemistry. It is surprising that temperature does not emerge as an important factor influencing the ratios for five of the six selected OOM species. Our model suggests that other factors, most likely associated with the particle composition, inhibit the gas–particle partitioning of OOMs in response to temperature change.
Finally, the random forest models developed in this study have certain limitations. (1) Aerosol particle coating may serve as an inhibitory factor in gas–particle partitioning. However, the mixing state and morphology of aerosol particles were not considered in the model due to the challenges in quantifying these features with high resolution. (2) The OOMs with extremely high or low volatility might be underrepresented in this study, because their gas- or particle-phase concentrations often fall below the limit of quantification of FIGAERO-CIMS. (3) Isomers were not differentiated in the measurement of FIGAERO-CIMS in this study. The observed ratio was contributed by isomers sharing the same chemical formula. The machine learning model built in this study did not account for the effect of isomerization on the gas–particle distribution of OOMs. (4) The model was based solely on the data collected during the winter season and for specific groups of OOM species present in the urban atmosphere. To enhance the robustness of the gas–particle partitioning model, future data collection under a broader range of atmospheric conditions is recommended.
The data used in this article are available from the public data repository Zenodo at https://doi.org/10.5281/zenodo.15428774 (Yu and Wang, 2025).
The supplement related to this article is available online at https://doi.org/10.5194/acp-25-9601-2025-supplement.
HY designed the experiment. XW, BZ, and NC contributed to the data collection. XW and HY analyzed the data and wrote the manuscript.
The contact author has declared that none of the authors has any competing interests.
Publisher’s note: Copernicus Publications remains neutral with regard to jurisdictional claims made in the text, published maps, institutional affiliations, or any other geographical representation in this paper. While Copernicus Publications makes every effort to include appropriate place names, the final responsibility lies with the authors.
This research was supported by the National Key Research and Development Program of China (grant no. 2023YFC3709801), the National Natural Science Foundation of China (grant no. 42175131), and the Fundamental Research Funds (grant no. G1323523063) for the Central Universities, China University of Geosciences (Wuhan).
This paper was edited by John Liggio and reviewed by four anonymous referees.
Barreira, L. M. F., Ylisirniö, A., Pullinen, I., Buchholz, A., Li, Z., Lipp, H., Junninen, H., Hõrrak, U., Noe, S. M., Krasnova, A., Krasnov, D., Kask, K., Talts, E., Niinemets, Ü., Ruiz-Jimenez, J., and Schobesberger, S.: The importance of sesquiterpene oxidation products for secondary organic aerosol formation in a springtime hemiboreal forest, Atmos. Chem. Phys., 21, 11781–11800, https://doi.org/10.5194/acp-21-11781-2021, 2021.
Bland, G. D., Battifarano, M., Pradas del Real, A. E., Sarret, G., and Lowry, G. V.: Distinguishing Engineered TiO2 Nanomaterials from Natural Ti Nanomaterials in Soil Using spICP-TOFMS and Machine Learning, Environ. Sci. Technol., 56, 2990–3001, https://doi.org/10.1021/acs.est.1c02950, 2022.
Boiko, D. A., Kozlov, K. S., Burykina, J. V., Ilyushenkova, V. V., and Ananikov, V. P.: Fully Automated Unconstrained Analysis of High-Resolution Mass Spectrometry Data with Machine Learning, J. Am. Chem. Soc., 144, 14590–14606, https://doi.org/10.1021/jacs.2c03631, 2022.
Cai, J., Wu, C., Wang, J., Du, W., Zheng, F., Hakala, S., Fan, X., Chu, B., Yao, L., Feng, Z., Liu, Y., Sun, Y., Zheng, J., Yan, C., Bianchi, F., Kulmala, M., Mohr, C., and Daellenbach, K. R.: Influence of organic aerosol molecular composition on particle absorptive properties in autumn Beijing, Atmos. Chem. Phys., 22, 1251–1269, https://doi.org/10.5194/acp-22-1251-2022, 2022.
Chen, Q., Shao, K., and Zhang, S.: Enhanced PM2.5 estimation across China: An AOD-independent two-stage approach incorporating improved spatiotemporal heterogeneity representations, J. Environ. Manage., 368, 122107, https://doi.org/10.1016/j.jenvman.2024.122107, 2024a.
Chen, W., Hu, W., Tao, Z., Cai, Y., Cai, M., Zhu, M., Ye, Y., Zhou, H., Jiang, H., Li, J., Song, W., Zhou, J., Huang, S., Yuan, B., Shao, M., Feng, Q., Li, Y., Isaacman-VanWertz, G., Stark, H., Day, D. A., Campuzano-Jost, P., Jimenez, J. L., and Wang, X.: Quantitative Characterization of the Volatility Distribution of Organic Aerosols in a Polluted Urban Area: Intercomparison Between Thermodenuder and Molecular Measurements, J. Geophys. Res.-Atmos., 129, e2023JD040284, https://doi.org/10.1029/2023JD040284, 2024b.
Christopoulos, C. D., Garimella, S., Zawadowicz, M. A., Möhler, O., and Cziczo, D. J.: A machine learning approach to aerosol classification for single-particle mass spectrometry, Atmos. Meas. Tech., 11, 5687–5699, https://doi.org/10.5194/amt-11-5687-2018, 2018.
Donahue, N. M., Robinson, A. L., and Pandis, S. N.: Atmospheric organic particulate matter: From smoke to secondary organic aerosol, Atmos. Environ., 43, 94–106, https://doi.org/10.1016/j.atmosenv.2008.09.055, 2009.
Donahue, N. M., Epstein, S. A., Pandis, S. N., and Robinson, A. L.: A two-dimensional volatility basis set: 1. organic-aerosol mixing thermodynamics, Atmos. Chem. Phys., 11, 3303–3318, https://doi.org/10.5194/acp-11-3303-2011, 2011.
Epstein, S. A., Riipinen, I., and Donahue, N. M.: A Semiempirical Correlation between Enthalpy of Vaporization and Saturation Concentration for Organic Aerosol, Environ. Sci. Technol., 44, 743–748, https://doi.org/10.1021/es902497z, 2010.
Fountoukis, C. and Nenes, A.: ISORROPIA II: a computationally efficient thermodynamic equilibrium model for K+–Ca2+–Mg2+–NH–Na+–SO–NO–Cl−–H2O aerosols, Atmos. Chem. Phys., 7, 4639–4659, https://doi.org/10.5194/acp-7-4639-2007, 2007.
Fowler, K., Connolly, P. J., Topping, D. O., and O'Meara, S.: Maxwell–Stefan diffusion: a framework for predicting condensed phase diffusion and phase separation in atmospheric aerosol, Atmos. Chem. Phys., 18, 1629–1642, https://doi.org/10.5194/acp-18-1629-2018, 2018.
Franklin, E. B., Yee, L. D., Aumont, B., Weber, R. J., Grigas, P., and Goldstein, A. H.: Ch3MS-RF: a random forest model for chemical characterization and improved quantification of unidentified atmospheric organics detected by chromatography–mass spectrometry techniques, Atmos. Meas. Tech., 15, 3779–3803, https://doi.org/10.5194/amt-15-3779-2022, 2022.
George, I. J., Vlasenko, A., Slowik, J. G., Broekhuizen, K., and Abbatt, J. P. D.: Heterogeneous oxidation of saturated organic aerosols by hydroxyl radicals: uptake kinetics, condensed-phase products, and particle size change, Atmos. Chem. Phys., 7, 4187–4201, https://doi.org/10.5194/acp-7-4187-2007, 2007.
Gong, X., Wex, H., Müller, T., Henning, S., Voigtländer, J., Wiedensohler, A., and Stratmann, F.: Understanding aerosol microphysical properties from 10 years of data collected at Cabo Verde based on an unsupervised machine learning classification, Atmos. Chem. Phys., 22, 5175–5194, https://doi.org/10.5194/acp-22-5175-2022, 2022.
Grosjean, D. and Friedlander, S.: Formation of organic aerosols from cyclic olefins and diolefins, Adv. Environ. Sci. Technol., 9, 435–473, 1980.
Harrison, M. A. J., Barra, S., Borghesi, D., Vione, D., Arsene, C., and Iulian Olariu, R.: Nitrated phenols in the atmosphere: a review, Atmos. Environ., 39, 231–248, https://doi.org/10.1016/j.atmosenv.2004.09.044, 2005.
Hildebrandt, L., Donahue, N. M., and Pandis, S. N.: High formation of secondary organic aerosol from the photo-oxidation of toluene, Atmos. Chem. Phys., 9, 2973–2986, https://doi.org/10.5194/acp-9-2973-2009, 2009.
Huang, W., Saathoff, H., Shen, X., Ramisetty, R., Leisner, T., and Mohr, C.: Seasonal characteristics of organic aerosol chemical composition and volatility in Stuttgart, Germany, Atmos. Chem. Phys., 19, 11687–11700, https://doi.org/10.5194/acp-19-11687-2019, 2019.
Jang, M., Czoschke, N. M., Lee, S., and Kamens, R. M.: Heterogeneous Atmospheric Aerosol Production by Acid-Catalyzed Particle-Phase Reactions, Science, 298, 814–817, https://doi.org/10.1126/science.1075798, 2002.
Kaur Kohli, R., Reynolds, R. S., Wilson, K. R., and Davies, J. F.: Exploring the influence of particle phase in the ozonolysis of oleic and elaidic acid, Aerosol Sci. Tech., 58, 356–373, https://doi.org/10.1080/02786826.2023.2226183, 2023.
Kawamura, K. and Ikushima, K.: Seasonal changes in the distribution of dicarboxylic acids in the urban atmosphere, Environ. Sci. Technol., 27, 2227–2235, 1993.
Kawamura, K. and Sakaguchi, F.: Molecular distributions of water soluble dicarboxylic acids in marine aerosols over the Pacific Ocean including tropics, J. Geophys. Res.-Atmos., 104, 3501–3509, https://doi.org/10.1029/1998JD100041, 1999.
Kind, T. and Fiehn, O.: Metabolomic database annotations via query of elemental compositions: Mass accuracy is insufficient even at less than 1 ppm, BMC Bioinformatics, 7, 234, https://doi.org/10.1186/1471-2105-7-234, 2006.
Kind, T. and Fiehn, O.: Seven Golden Rules for heuristic filtering of molecular formulas obtained by accurate mass spectrometry, BMC Bioinformatics, 8, 105, https://doi.org/10.1186/1471-2105-8-105, 2007.
Kurtén, T., Tiusanen, K., Roldin, P., Rissanen, M., Luy, J.-N., Boy, M., Ehn, M., and Donahue, N.: α-Pinene Autoxidation Products May Not Have Extremely Low Saturation Vapor Pressures Despite High O:C Ratios, J. Phys. Chem. A, 120, 2569–2582, https://doi.org/10.1021/acs.jpca.6b02196, 2016.
Lee, B. H., Lopez-Hilfiker, F. D., Mohr, C., Kurten, T., Worsnop, D. R., and Thornton, J. A.: An Iodide-Adduct High-Resolution Time-of-Flight Chemical-Ionization Mass Spectrometer: Application to Atmospheric Inorganic and Organic Compounds, Environ. Sci. Technol., 48, 6309–6317, https://doi.org/10.1021/es500362a, 2014.
Lee, B. H., Lopez-Hilfiker, F. D., D'Ambro, E. L., Zhou, P., Boy, M., Petäjä, T., Hao, L., Virtanen, A., and Thornton, J. A.: Semi-volatile and highly oxygenated gaseous and particulate organic compounds observed above a boreal forest canopy, Atmos. Chem. Phys., 18, 11547–11562, https://doi.org/10.5194/acp-18-11547-2018, 2018.
Leong, W. C., Kelani, R. O., and Ahmad, Z.: Prediction of air pollution index (API) using support vector machine (SVM), J. Environ. Chem. Eng., 8, 103208, https://doi.org/10.1016/j.jece.2019.103208, 2020.
Li, L., Thomsen, D., Wu, C., Priestley, M., Iversen, E. M., Tygesen Skonager, J., Luo, Y., Ehn, M., Roldin, P., Pedersen, H. B., Bilde, M., Glasius, M., and Hallquist, M.: Gas-to-Particle Partitioning of Products from Ozonolysis of Δ3-Carene and the Effect of Temperature and Relative Humidity, J. Phys. Chem. A, 128, 918–928, https://doi.org/10.1021/acs.jpca.3c07316, 2024a.
Li, Y., Cai, R., Yin, R., Li, X., Yuan, Y., An, Z., Guo, J., Stolzenburg, D., Kulmala, M., and Jiang, J.: A kinetic partitioning method for simulating the condensation mass flux of organic vapors in a wide volatility range, J. Aerosol Sci., 180, 106400, https://doi.org/10.1016/j.jaerosci.2024.106400, 2024b.
Lin, G.-Y., Chen, H.-W., Chen, B.-J., and Chen, S.-C.: A machine learning model for predicting PM2.5 and nitrate concentrations based on long-term water-soluble inorganic salts datasets at a road site station, Chemosphere, 289, 133123, https://doi.org/10.1016/j.chemosphere.2021.133123, 2022.
Liu, S., E., S. J., Chen, S., Naruki, H., A., Z. R., and and Russell, L. M.: Hydrolysis of Organonitrate Functional Groups in Aerosol Particles, Aerosol Sci. Tech., 46, 1359–1369, https://doi.org/10.1080/02786826.2012.716175, 2012.
Liu, X., Day, D. A., Krechmer, J. E., Brown, W., Peng, Z., Ziemann, P. J., and Jimenez, J. L.: Direct measurements of semi-volatile organic compound dynamics show near-unity mass accommodation coefficients for diverse aerosols, Commun. Chem., 2, 98, https://doi.org/10.1038/s42004-019-0200-x, 2019.
Lopez-Hilfiker, F. D., Mohr, C., Ehn, M., Rubach, F., Kleist, E., Wildt, J., Mentel, Th. F., Lutz, A., Hallquist, M., Worsnop, D., and Thornton, J. A.: A novel method for online analysis of gas and particle composition: description and evaluation of a Filter Inlet for Gases and AEROsols (FIGAERO), Atmos. Meas. Tech., 7, 983–1001, https://doi.org/10.5194/amt-7-983-2014, 2014.
Lüttke, J. and Levsen, K.: Phase partitioning of phenol and nitrophenols in clouds, Atmos. Environ., 31, 2649–2655, https://doi.org/10.1016/S1352-2310(96)00228-2, 1997.
Lutz, A., Mohr, C., Le Breton, M., Lopez-Hilfiker, F. D., Priestley, M., Thornton, J. A., and Hallquist, M.: Gas to Particle Partitioning of Organic Acids in the Boreal Atmosphere, ACS Earth Space Chem., 3, 1279–1287, https://doi.org/10.1021/acsearthspacechem.9b00041, 2019.
Mohr, C., Thornton, J. A., Heitto, A., Lopez-Hilfiker, F. D., Lutz, A., Riipinen, I., Hong, J., Donahue, N. M., Hallquist, M., Petäjä, T., Kulmala, M., and Yli-Juuti, T.: Molecular identification of organic vapors driving atmospheric nanoparticle growth, Nat. Commun., 10, 4442, https://doi.org/10.1038/s41467-019-12473-2, 2019.
Pande, P., Shrivastava, M., Shilling, J. E., Zelenyuk, A., Zhang, Q., Chen, Q., Ng, N. L., Zhang, Y., Takeuchi, M., Nah, T., Rasool, Q. Z., Zhang, Y., Zhao, B., and Liu, Y.: Novel Application of Machine Learning Techniques for Rapid Source Apportionment of Aerosol Mass Spectrometer Datasets, ACS Earth Space Chem., 6, 932–942, https://doi.org/10.1021/acsearthspacechem.1c00344, 2022.
Pankow, J. F.: An absorption model of gas/particle partitioning of organic compounds in the atmosphere, Atmos. Environ., 28, 185–188, https://doi.org/10.1016/1352-2310(94)90093-0, 1994.
Peräkylä, O., Riva, M., Heikkinen, L., Quéléver, L., Roldin, P., and Ehn, M.: Experimental investigation into the volatilities of highly oxygenated organic molecules (HOMs), Atmos. Chem. Phys., 20, 649–669, https://doi.org/10.5194/acp-20-649-2020, 2020.
Priestley, M., Kong, X., Pei, X., Pathak, R. K., Davidsson, K., Pettersson, J. B. C., and Hallquist, M.: Volatility Measurements of Oxygenated Volatile Organics from Fresh and Aged Residential Wood Burning Emissions, ACS Earth Space Chem., 8, 159–173, https://doi.org/10.1021/acsearthspacechem.3c00066, 2024.
Ren, S., Yao, L., Wang, Y., Yang, G., Liu, Y., Li, Y., Lu, Y., Wang, L., and Wang, L.: Volatility parameterization of ambient organic aerosols at a rural site of the North China Plain, Atmos. Chem. Phys., 22, 9283–9297, https://doi.org/10.5194/acp-22-9283-2022, 2022.
Reyes-Villegas, E., Bannan, T., Le Breton, M., Mehra, A., Priestley, M., Percival, C., Coe, H., and Allan, J. D.: Online Chemical Characterization of Food-Cooking Organic Aerosols: Implications for Source Apportionment, Environ. Sci. Technol., 52, 5308–5318, https://doi.org/10.1021/acs.est.7b06278, 2018.
Roldin, P., Eriksson, A. C., Nordin, E. Z., Hermansson, E., Mogensen, D., Rusanen, A., Boy, M., Swietlicki, E., Svenningsson, B., Zelenyuk, A., and Pagels, J.: Modelling non-equilibrium secondary organic aerosol formation and evaporation with the aerosol dynamics, gas- and particle-phase chemistry kinetic multilayer model ADCHAM, Atmos. Chem. Phys., 14, 7953–7993, https://doi.org/10.5194/acp-14-7953-2014, 2014.
Ruiz-Jimenez, J., Okuljar, M., Sietiö, O.-M., Demaria, G., Liangsupree, T., Zagatti, E., Aalto, J., Hartonen, K., Heinonsalo, J., Bäck, J., Petäjä, T., and Riekkola, M.-L.: Determination of free amino acids, saccharides, and selected microbes in biogenic atmospheric aerosols – seasonal variations, particle size distribution, chemical and microbial relations, Atmos. Chem. Phys., 21, 8775–8790, https://doi.org/10.5194/acp-21-8775-2021, 2021.
Seinfeld, J. H. and Pankow, J. F.: Organic atmospheric particulate material, Annu. Rev. Phys. Chem., 54, 121–140, https://doi.org/10.1146/annurev.physchem.54.011002.103756, 2003.
Shen, H., Chen, Z., Li, H., Qian, X., Qin, X., and Shi, W.: Gas-Particle Partitioning of Carbonyl Compounds in the Ambient Atmosphere, Environ. Sci. Technol., 52, 10997–11006, https://doi.org/10.1021/acs.est.8b01882, 2018.
Shi, H., Yang, N., Yang, X., and Tang, H.: Clarifying Relationship between PM2.5 Concentrations and Spatiotemporal Predictors Using Multi-Way Partial Dependence Plots, Remote Sens., 15, 358, https://doi.org/10.3390/rs15020358, 2023.
Shiraiwa, M. and Pöschl, U.: Mass accommodation and gas–particle partitioning in secondary organic aerosols: dependence on diffusivity, volatility, particle-phase reactions, and penetration depth, Atmos. Chem. Phys., 21, 1565–1580, https://doi.org/10.5194/acp-21-1565-2021, 2021.
Stark, H., Yatavelli, R. L. N., Thompson, S. L., Kimmel, J. R., Cubison, M. J., Chhabra, P. S., Canagaratna, M. R., Jayne, J. T., Worsnop, D. R., and Jimenez, J. L.: Methods to extract molecular and bulk chemical information from series of complex mass spectra with limited mass resolution, Int. J. Mass Spectrom., 389, 26–38, https://doi.org/10.1016/j.ijms.2015.08.011, 2015.
Stark, H., Yatavelli, R. L. N., Thompson, S. L., Kang, H., Krechmer, J. E., Kimmel, J. R., Palm, B. B., Hu, W. W., Hayes, P. L., Day, D. A., Campuzano-Jost, P., Canagaratna, M. R., Jayne, J. T., Worsnop, D. R., and Jimenez, J. L.: Impact of Thermal Decomposition on Thermal Desorption Instruments: Advantage of Thermogram Analysis for Quantifying Volatility Distributions of Organic Species, Environ. Sci. Technol., 51, 8491–8500, https://doi.org/10.1021/acs.est.7b00160, 2017.
Su, H., Cheng, Y., and Pöschl, U.: New Multiphase Chemical Processes Influencing Atmospheric Aerosols, Air Quality, and Climate in the Anthropocene, Acc. Chem. Res., 53, 2034–2043, https://doi.org/10.1021/acs.accounts.0c00246, 2020.
Thaunay, F., Clavaguéra, C., and Ohanessian, G.: Hydration of the sulfate dianion in cold nanodroplets: SO(H2O)12 and SO(H2O)13, Phys. Chem. Chem. Phys., 17, 25935–25945, https://doi.org/10.1039/C5CP02557E, 2015.
Tremp, J., Mattrel, P., Fingler, S., and Giger, W.: Phenols and nitrophenols as tropospheric pollutants: Emissions from automobile exhausts and phase transfer in the atmosphere, Water Air Soil Poll., 68, 113–123, https://doi.org/10.1007/BF00479396, 1993.
Tröstl, J., Chuang, W. K., Gordon, H., Heinritzi, M., Yan, C., Molteni, U., Ahlm, L., Frege, C., Bianchi, F., Wagner, R., Simon, M., Lehtipalo, K., Williamson, C., Craven, J. S., Duplissy, J., Adamov, A., Almeida, J., Bernhammer, A.-K., Breitenlechner, M., Brilke, S., Dias, A., Ehrhart, S., Flagan, R. C., Franchin, A., Fuchs, C., Guida, R., Gysel, M., Hansel, A., Hoyle, C. R., Jokinen, T., Junninen, H., Kangasluoma, J., Keskinen, H., Kim, J., Krapf, M., Kürten, A., Laaksonen, A., Lawler, M., Leiminger, M., Mathot, S., Möhler, O., Nieminen, T., Onnela, A., Petäjä, T., Piel, F. M., Miettinen, P., Rissanen, M. P., Rondo, L., Sarnela, N., Schobesberger, S., Sengupta, K., Sipilä, M., Smith, J. N., Steiner, G., Tomè, A., Virtanen, A., Wagner, A. C., Weingartner, E., Wimmer, D., Winkler, P. M., Ye, P., Carslaw, K. S., Curtius, J., Dommen, J., Kirkby, J., Kulmala, M., Riipinen, I., Worsnop, D. R., Donahue, N. M., and Baltensperger, U.: The role of low-volatility organic compounds in initial particle growth in the atmosphere, Nature, 533, 527–531, https://doi.org/10.1038/nature18271, 2016.
Voliotis, A., Wang, Y., Shao, Y., Du, M., Bannan, T. J., Percival, C. J., Pandis, S. N., Alfarra, M. R., and McFiggans, G.: Exploring the composition and volatility of secondary organic aerosols in mixed anthropogenic and biogenic precursor systems, Atmos. Chem. Phys., 21, 14251–14273, https://doi.org/10.5194/acp-21-14251-2021, 2021.
Wang, D. S. and Hildebrandt Ruiz, L.: Chlorine-initiated oxidation of n-alkanes under high-NOx conditions: insights into secondary organic aerosol composition and volatility using a FIGAERO–CIMS, Atmos. Chem. Phys., 18, 15535–15553, https://doi.org/10.5194/acp-18-15535-2018, 2018.
Wang, F., Yu, H., Wang, Z., Liang, W., Shi, G., Gao, J., Li, M., and Feng, Y.: Review of online source apportionment research based on observation for ambient particulate matter, Sci. Total Environ., 762, 144095, https://doi.org/10.1016/j.scitotenv.2020.144095, 2021.
Wang, X., Zhao, Y., Hu, K., Wang, J., Wang, Q., Chen, N., Zhu, B., Zhang, H.-H., and Yu, H.: Linking Precursors and Volatility of Ambient Oxygenated Organic Aerosols Using Thermal Desorption Measurement and Machine Learning, ACS ES&T Air, 1, 1239–1251, https://doi.org/10.1021/acsestair.4c00076, 2024.
Ye, C., Yuan, B., Lin, Y., Wang, Z., Hu, W., Li, T., Chen, W., Wu, C., Wang, C., Huang, S., Qi, J., Wang, B., Wang, C., Song, W., Wang, X., Zheng, E., Krechmer, J. E., Ye, P., Zhang, Z., Wang, X., Worsnop, D. R., and Shao, M.: Chemical characterization of oxygenated organic compounds in the gas phase and particle phase using iodide CIMS with FIGAERO in urban air, Atmos. Chem. Phys., 21, 8455–8478, https://doi.org/10.5194/acp-21-8455-2021, 2021.
Ye, Q., Wang, M. Y., Hofbauer, V., Stolzenburg, D., Chen, D. X., Schervish, M., Vogel, A., Mauldin, R. L., Baalbaki, R., Brilke, S., Dada, L., Dias, A., Duplissy, J., El Haddad, I., Finkenzeller, H., Fischer, L., He, X. C., Kim, C., Kurten, A., Lamkaddam, H., Lee, C. P., Lehtipalo, K., Leiminger, M., Manninen, H. E., Marten, R., Mentler, B., Partoll, E., Petaja, T., Rissanen, M., Schobesberger, S., Schuchmann, S., Simon, M., Tham, Y. J., Vazquez-Pufleau, M., Wagner, A. C., Wang, Y. H., Wu, Y. S., Xiao, M., Baltensperger, U., Curtius, J., Flagan, R., Kirkby, J., Kulmala, M., Volkamer, R., Winkler, P. M., Worsnop, D., and Donahue, N. M.: Molecular Composition and Volatility of Nucleated Particles from alpha-Pinene Oxidation between −50 °C and +25 °C, Environ. Sci. Technol., 53, 12357–12365, https://doi.org/10.1021/acs.est.9b03265, 2019.
Yu, H. and Wang, X.: Influencing Factors of Gas-Particle Distribution of Oxygenated Organics in Urban Atmosphere and Deviation from Equilibrium Partitioning: A Random Forest Model Study, Zenodo [data set], https://doi.org/10.5281/zenodo.15428774, 2025.
Yuan, Y., Chen, X., Cai, R., Li, X., Li, Y., Yin, R., Li, D., Yan, C., Liu, Y., He, K., Kulmala, M., and Jiang, J.: Resolving Atmospheric Oxygenated Organic Molecules in Urban Beijing Using Online Ultrahigh-Resolution Chemical Ionization Mass Spectrometry, Environ. Sci. Technol., 58, 17777–17785, https://doi.org/10.1021/acs.est.4c04214, 2024.
Zaveri, R. A., Easter, R. C., Shilling, J. E., and Seinfeld, J. H.: Modeling kinetic partitioning of secondary organic aerosol and size distribution dynamics: representing effects of volatility, phase state, and particle-phase reaction, Atmos. Chem. Phys., 14, 5153–5181, https://doi.org/10.5194/acp-14-5153-2014, 2014.
Zhang, Q., Jimenez, J. L., Worsnop, D. R., and Canagaratna, M.: A Case Study of Urban Particle Acidity and Its Influence on Secondary Organic Aerosol, Environ. Sci. Technol., 41, 3213–3219, https://doi.org/10.1021/es061812j, 2007.
Zhang, Z., Xu, B., Xu, W., Wang, F., Gao, J., Li, Y., Li, M., Feng, Y., and Shi, G.: Machine learning combined with the PMF model reveal the synergistic effects of sources and meteorological factors on PM2.5 pollution, Environ. Res., 212, 113322, https://doi.org/10.1016/j.envres.2022.113322, 2022.
Zhao, Y., Hu, K., Wang, J., Wang, Q., Wang, P., Chen, N., Zhu, B., Zhang, H.-H., and Yu, H.: Quantifying New Sources of Ambient Organic Aerosol and Their Roles in Particle Growth Using Oxygenated Organic Molecule (OOM) Tracers, Environ. Sci. Tech. Let., 11, 988–995, https://doi.org/10.1021/acs.estlett.4c00536, 2024.
Zhu, X., Wang, X., and Ok, Y. S.: The application of machine learning methods for prediction of metal sorption onto biochars, J. Hazard. Mater., 378, 120727, https://doi.org/10.1016/j.jhazmat.2019.06.004, 2019.