the Creative Commons Attribution 4.0 License.
the Creative Commons Attribution 4.0 License.
 | 13 Aug 2025
Response of the link between the El Niño–Southern Oscillation (ENSO) and the East Asian winter monsoon to Asian anthropogenic sulfate aerosols
Massimo A. Bollasina
Wenjun Zhang
Ying Xiang
We use coupled and atmosphere-only simulations from the Precipitation Driver and Response Model Intercomparison Project (PDRMIP) to investigate the impacts of Asian anthropogenic sulfate aerosols on the link between the El Niño–Southern Oscillation (ENSO) and the East Asian winter monsoon (EAWM). In fully coupled simulations, aerosol-induced cooling extends southeastward to the Maritime Continent and the northwestern Pacific. Remotely, this broad cooling weakens the easterly trade winds over the central Pacific, which reduces the east–west equatorial Pacific sea surface temperature gradient. These changes contribute to increasing ENSO's amplitude by 17 %, mainly through strengthening the zonal wind forcing. Concurrently, the El Niño-related warm sea surface temperature (SST) anomalies and the ensuing Pacific–East Asia teleconnection pattern (i.e. the ENSO–EAWM link) intensify, leading to an increased EAWM amplitude by 18 % in the coupled simulations. Therefore, in response to the increasing frequency of El Niño and La Niña years under Asian sulfate aerosol forcing, the interannual variability of the EAWM increases, with more extreme EAWM years. The opposite variations in the interannual variability of the EAWM to Asian aerosols in atmosphere-only simulations (−19 %) further reflect the importance of ENSO-related atmosphere–ocean coupled processes. A better understanding of the changes in the year-to-year variability of the EAWM in response to aerosol forcing is critical to reducing uncertainties in future projections of variability of regional extremes, such as cold surges and flooding, which can cause large social and economic impacts on densely populated East Asia.
- Article
(5725 KB) - Full-text XML
-
Supplement
(7074 KB) - BibTeX
- EndNote


The East Asian winter monsoon (EAWM) is one of the most prominent features of the Northern Hemisphere atmospheric circulation during the boreal winter and has a pronounced influence on the weather and climate of the Asian Pacific region from the northern latitudes to the Equator (e.g. Chang et al., 2006; Zhou and Wu, 2010; Wang et al., 2022b). As such, the year-to-year variations of the EAWM have the potential to cause extreme cold disasters and severe flooding in Southeast Asian countries (e.g. Huang et al., 2012; Yang et al., 2020; Zuo et al., 2022), with consequent marked social and economic impacts (e.g. Chen et al., 2005; Zhou et al., 2011). Thus, it is very important to understand the mechanisms underpinning its variability and associated drivers and to ultimately develop more robust projections of its future evolution.
The EAWM is fundamentally driven by the thermal contrast between the cold Asian continent and the adjacent warm oceans (e.g. Yang et al., 2002; Huang et al., 2012; Chen et al., 2019). Its climatological pattern is mainly characterised by dry cold low-level northwesterlies along the eastern flank of the Siberian High and low-level northeasterlies along the coast of East Asia, triggering cold air outbreaks in northern China and generating cold surges over southern China as well as the South China Sea (Li and Wang, 2012; He et al., 2013). The EAWM exhibits distinct interannual variability (e.g. Gong et al., 2014; Chen et al., 2015) that mainly originates from intrinsic atmospheric processes (e.g. Wu et al., 2014; Wang and Wu, 2021, 2022b) and the El Niño–Southern Oscillation (ENSO) forcing through the Pacific–East Asia teleconnection (Zhang et al., 1996). Associated with an El Niño event, the anomalous anticyclone over the western tropical Pacific – which is the most remarkable low-level circulation feature of the Pacific–East Asia (PEA) teleconnection – induces southwesterlies on its western flank, which weaken the EAWM flow and lead to warmer and wetter conditions over southeastern China and the South China Sea (Wang et al., 2000, 2013). In turn, the EAWM tends to be strong during La Niña winters, with widespread cooling and reduced precipitation.
Previous studies indicated that the magnitude and location of ENSO-induced teleconnection patterns are influenced by ENSO characteristics, such as amplitude and location of its sea surface temperature (SST) anomalies (Cai et al., 2021; Jiang et al., 2022). However, future projections of ENSO characteristics are highly uncertain, even in the latest CMIP6 models (Huang and Xie, 2015; Yan et al., 2020; Beobide-Arsuaga et al., 2021). Therefore, there is no consensus on future changes in the ENSO-induced teleconnections, including projections of the PEA pattern (e.g. Wang et al., 2013; Jia et al., 2020). The characteristics of ENSO and its induced atmospheric teleconnections are closely related to the tropical Pacific mean state via ocean–atmosphere feedbacks (Jin, 1997; Wang and An, 2002; Cai et al., 2014). Based on ocean–atmosphere reanalyses, observed mean state changes since the 1980s feature a La Niña-like warming (i.e. the tropical Pacific warming centre is mainly located in the western basin; Rayner et al., 2003; Kobayashi et al., 2015; Huang et al., 2017). However, both a La Niña-like and an El Niño-like warming (i.e. tropical Pacific warming centred in the eastern basin) are projected in the future, with a large spread across different climate models (e.g. Power et al., 2013; Lian et al., 2018). These two different warming patterns will cause a corresponding strengthening and weakening of the easterly trade winds over the tropical Pacific Ocean, respectively, resulting in opposite changes in the characteristics of ENSO (Vecchi et al., 2006; Collins et al., 2010). While the majority of the studies have focused on the influence of increasing greenhouse gas concentrations on the tropical Pacific mean state (e.g. Wang et al., 2017; Yan et al., 2020), the impact of anthropogenic aerosols has been largely overlooked.
Due to the intensification of human industrial activities, the global mean atmospheric burden of anthropogenic aerosols has continued to increase over the past century, exerting a significant imprint on the worldwide climate (Liao et al., 2015; Forster et al., 2021; Persad, 2023). Anthropogenic aerosols can affect climate by modulating shortwave radiation and, to some extent, longwave radiation directly and through their interactions with clouds and precipitation indirectly (Boucher et al., 2013; Myhre et al., 2013; Zhao and Suzuki, 2019). Unlike greenhouse gases, which are distributed evenly across the globe, anthropogenic aerosols reside in the atmosphere for a short time (days to weeks) due to numerous chemical and physical removal processes, which cause their distribution and associated radiative forcing to be spatially heterogeneous (Allen et al., 2015; Wilcox et al., 2019). As such, aerosols can induce substantial changes in local atmospheric circulation and extend their influence over long distances, even over the surrounding ocean, triggering ocean–atmosphere interactions (Rotstayn and Lohmann, 2002; Ramanathan et al., 2005; Westervelt et al., 2020). Some studies indicated that the influence of anthropogenic aerosols from remote sources can even outweigh that of locally emitted ones (Shindell et al., 2012; Lewinschal et al., 2013). Since the start of the industrial age, vast emissions of aerosols and their precursors over the Northern Hemisphere have had a profound cooling effect, and this preferential cooling has been linked to a southward shift of the Intertropical Convergence Zone (e.g. Hwang et al., 2013; Navarro et al., 2017).
The emissions of anthropogenic aerosols and their precursors in Asia have increased rapidly since 1980, and many studies have focused on Asian as well as Northern Hemispheric climate (e.g. Bollasina et al., 2014; Bartlett et al., 2018; Wilcox et al., 2019; Li et al., 2022). While Asian anthropogenic aerosols can significantly affect the Asian monsoon, the large majority of the current literature has focused on the effects of aerosols on the summer or annual mean climatology (e.g. Westervelt et al., 2018; Song et al., 2014; Persad et al., 2022). Only a limited number of studies have focused on the influence of aerosols on the EAWM (Jiang et al., 2017; Liu et al., 2019; Wilcox et al., 2019), while their effect on the interannual variability of the EAWM and the link to ENSO remains unexplored. In boreal winter, intensive combustion of coal and fossil fuels across Asia leads to sulfate aerosols dominance (Gao et al., 2018; Cheng et al., 2019), setting the stage for a potential important influence on the continental climate and the mean EAWM circulation. Moreover, ENSO and the associated PEA teleconnection pattern peak in the winter, representing a major driver of interannual fluctuations of the EAWM. The extent to which aerosols may affect ENSO and the related ocean–atmosphere feedbacks has not been thoroughly investigated and is unclear (Westervelt et al., 2018; Wilcox et al., 2019). Given the rapid variations in aerosol emissions over Asia, addressing this knowledge gap is both compelling and timely for enhancing our understanding and projections of the ENSO–EAWM link in the near future and potential causes of changes in the interannual variability of the EAWM.
In this study, we use multi-model mean data from regional aerosol perturbation experiments conducted with coupled and atmosphere-only models (Sect. 2) to investigate the impacts of Asian sulfate aerosols on the ENSO–EAWM link and the interannual variability of the EAWM (Sect. 3). We then link changes in the PEA pattern to the remote impacts of Asian aerosols on ENSO (Sect. 4). Mechanisms driving changes in the tropical Pacific mean state and ENSO characteristics are further investigated in Sect. 5. Finally, Sect. 6 summarises the main results and provides key conclusions.
Model data from the Precipitation Driver and Response Model Intercomparison Project (PDRMIP; Myhre et al., 2017) are used to investigate the impact of Asian anthropogenic aerosols on the ENSO–EAWM link. PDRMIP offers a unique opportunity for elucidating the complexities of the ENSO–EAWM aerosol nexus and its mechanisms, particularly with regard to the role of air–sea interactions in modulating the aerosol-driven response. Indeed, one approach that has provided valuable insights is the decomposition of the response into two complementary components: a fast response involving atmospheric and land surface adjustments but fixed sea surface temperature (SST) acting on short timescales (a few years) and a slow response, which includes the full extent of the oceanic circulation response, thus being effective on decadal or longer timescales (e.g. Samset et al., 2016; Liu et al., 2018, 2024; Dow et al., 2021; Fahrenbach et al., 2024). The baseline simulation was forced by present-day (year 2000) levels of aerosols and greenhouse gas emissions/concentrations. The regional aerosol experiment analysed in this study has sulfate concentrations/emissions over Asia (10–50° N, 60–140° E) increased by a factor of 10 compared to the baseline values (hereafter SUL×10Asia). Note that sulfate is the predominant aerosol component in boreal winter over Asia (e.g. Liu et al., 2009; Zhang et al., 2018). The response to Asian aerosols is identified as the difference between the SUL×10Asia and the baseline experiments. Of the 10 models that contributed to PDRMIP, 7 performed the SUL×10Asia experiment: GISS-E2, HadGEM3-GA4, IPSL-CM5 A, MIROC-SPRINTARS, ESM1-CAM4, CESM1-CAM5, and NorESM1 (details on the resolution and aerosol setup for each model can be found in Table 1 of Liu et al., 2018). For each model and experiment, a pair of simulations was performed: one in a fully coupled atmosphere–ocean setting (called “coupled”) and one with fixed climatological sea surface temperatures (called fSST). The coupled simulations were run for 100 years and the fSST simulations for 15 years. The concentrations of all non-aerosol anthropogenic forcers and natural forcing were kept at present-day levels (typically year 2000) in all the experiments, as were the SSTs for the fSST simulations. In this study, we use output from the last 50 winters (DJF, i.e. December of the current year and January and February of the following year) of coupled simulations and the last 12 winters of the fSST simulations to discard the model spin-up time and consistently with existing literature (Liu et al., 2018; Dow et al., 2021; Fahrenbach et al., 2024). The effective radiative forcing (ERF) is calculated as the difference in the top-of-the-atmosphere net radiative flux between the SUL×10Asia and baseline fSST simulations (Samset et al., 2016).
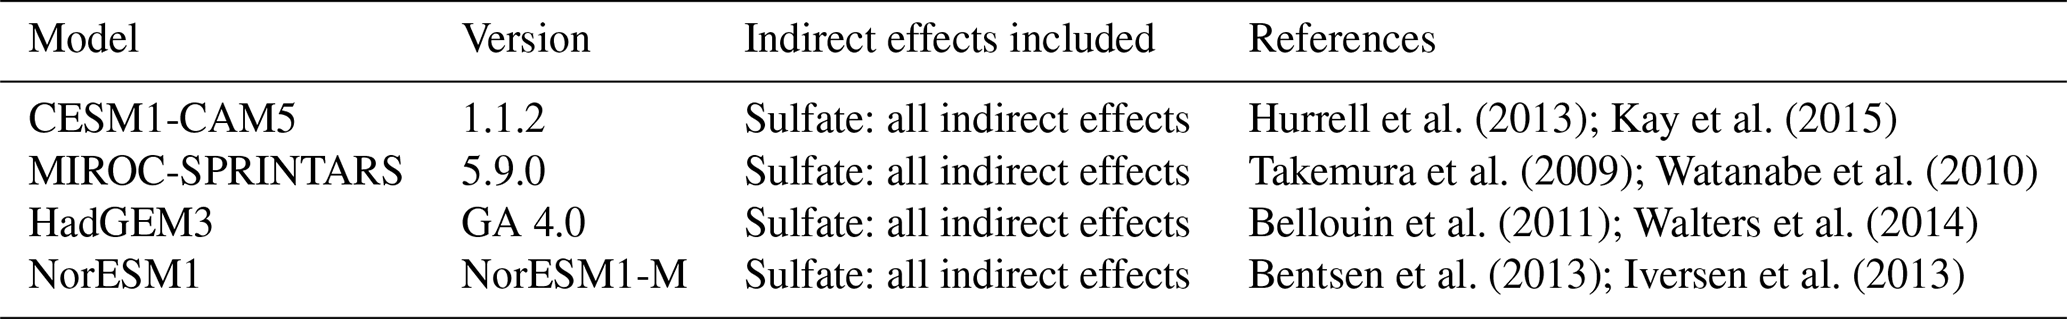
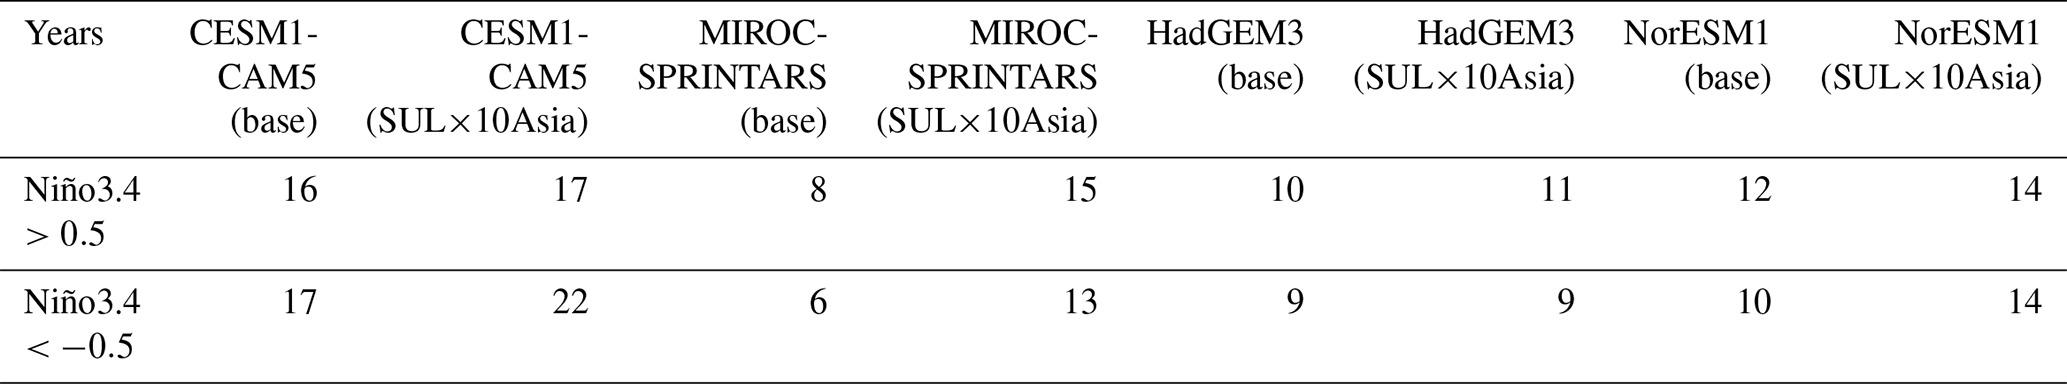
Table 2Number of El Niño and La Niña years for each model from coupled baseline and SUL×10Asia simulations in PDRMIP.
Reanalysis and observational data for DJF 1965–2014 (50 years) are used to evaluate the PDRMIP-simulated EAWM and ENSO-related patterns in the baseline experiment. Monthly meteorological reanalysis data are from the fifth-generation atmospheric reanalysis, ERA5, provided by the European Centre for Medium-Range Weather Forecasts at a spatial resolution of 0.25° (Hersbach et al., 2023). Monthly gridded observations are from the Hadley Centre Sea Ice and Sea Surface Temperature (HadISST) dataset for sea surface temperature at a spatial resolution of 1° (Rayner et al., 2003), and from the Climatic Research Unit (CRU) v4.07 data set for land surface temperature with a spatial resolution of 0.5° (Harris et al., 2020). To quantify the EAWM interannual variability, we use the Ji et al. (1997) index (the negative 1000 hPa meridional wind anomaly averaged over 10–30° N, 115–130° E) as it represents the spatio-temporal characteristics of the ENSO–EAWM relationship well (Gong et al., 2015; Jia et al., 2020). Positive values indicate a stronger-than-normal EAWM. ENSO is described by the Niño3.4 index (area-averaged SST anomaly over 5° S–5° N, 120–170° W). The ENSO-related PEA pattern is deduced by regression analysis, and the statistical significance is evaluated using the two-tailed Student t test. Among the seven PDRMIP models with the SUL×10Asia experiment, coupled baseline simulations in CESM1-CAM5, MIROC-SPRINTARS, HadGEM3-GA4, and NorESM1 can well capture the observed pattern and magnitude of the ENSO-related circulation anomalies across East Asia and the Pacific (Fig. S1 in the Supplement) and are used in this study. These four models include parameterisations of both aerosol–radiation and aerosol–cloud interactions, while the others do not include indirect effects or include only the first indirect effect (Liu et al., 2018; Dow et al., 2021). (Table 1). All the data are interpolated to a 3.75°×2° (longitude × latitude) resolution before the analysis for consistency between all models.
The ENSO-related circulation and precipitation anomalies across East Asia and the Pacific (i.e. the PEA pattern) (Fig. 1a–c) are well reproduced by the multi-model mean of the PDRMIP coupled baseline simulations (Fig. 1d–f). The pattern is characterised by the El Niño-related warm SST anomalies over the equatorial Pacific and cold SSTs over the northwestern Pacific (Fig. 1a), the anomalous anticyclone over the western tropical Pacific, and the anomalous low over the northern extratropical Pacific (Fig. 1b). On the western flank of the anticyclone, near-surface and lower tropospheric southerly winds along the East Asian coast (Figs. 1a and b) lead to warm surface air temperature and precipitation over southeastern China and even over central China (Fig. 1a and c), while the lower tropospheric northerly winds on the western flank of the cyclone bring cold air to northeastern China (Fig. 1b). The spatial patterns of simulated anomalies are broadly similar to those found in observations, including the position and magnitude of El Niño-related warm SST anomalies, anticyclone and cyclone anomalies, and precipitation anomalies (Fig. 1d–f). The multi-model mean from PDRMIP shares common biases with other CMIP5 and CMIP6 models, such as a slightly westward shift of the equatorial Niño warming with associated circulation and precipitation anomalies (Gong et al., 2015; Wang et al., 2022a). Overall, the multi-model mean coupled PDRMIP baseline simulations successfully reproduce the PEA pattern.
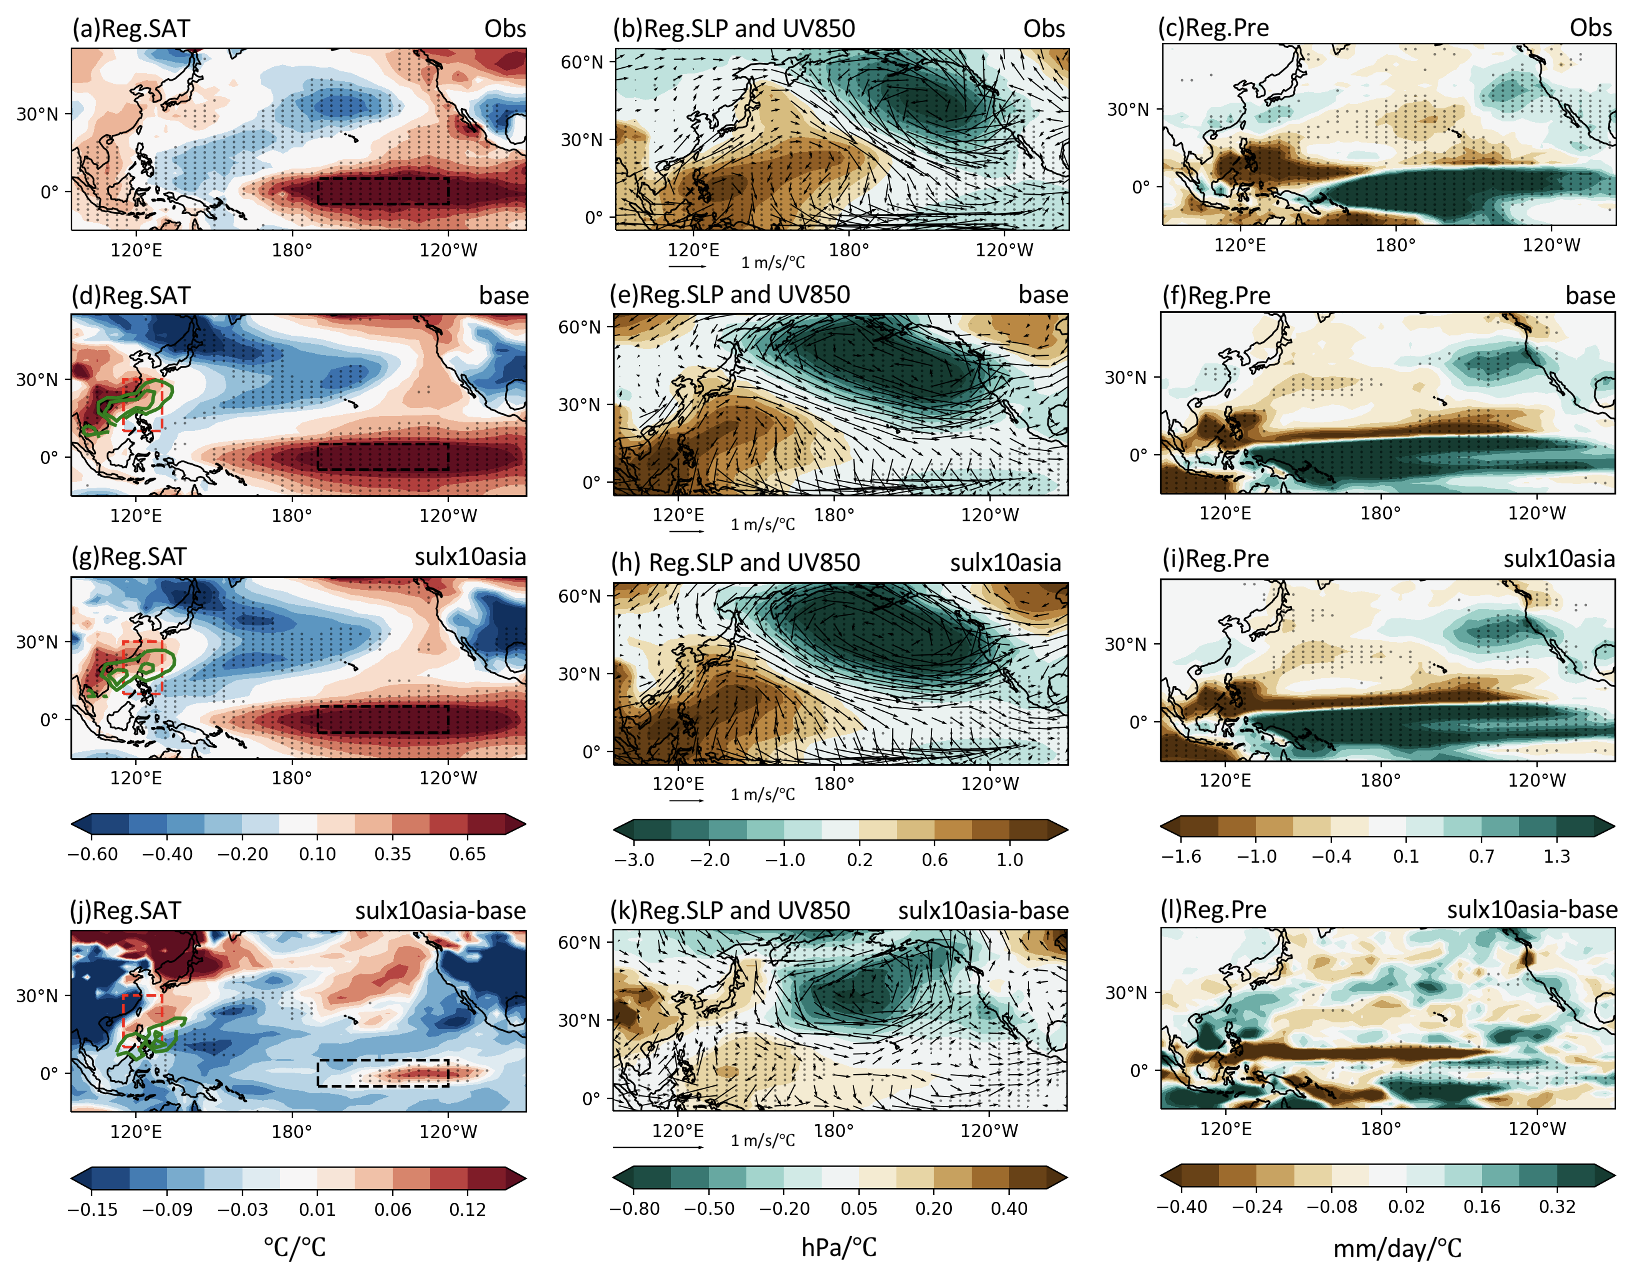
Figure 1DJF regressions of (a, d, g) surface air temperature (SAT, SST over the ocean, °C, shading) and 1000 hPa meridional wind (V1000) over the broad East Asia (green contours; values plotted only when larger than 0.1 ); (b, e, h) sea level pressure (SLP; hPa, shading) and 850 hPa wind (UV850; m s−1, vector); and (c, f, i) precipitation (Pre, mm d−1) onto the Niño3.4 index from (a–c) observations during 1965–2014, multi-model mean coupled (d–f) baseline, and (g–i) SUL×10Asia simulations in PDRMIP. Dotted regions indicate significant correlations at the 95 % level from the two-tailed Student t test. Differences in regressions of (j) SAT and V1000 (green contours; values plotted only when larger than 0.05 ), (k) SLP and UV850, and (l) Pre between coupled SUL×10Asia and baseline simulations. Dotted regions represent differences that remain significant after the false discovery rate (FDR) correction of p values from the two-tailed Student t test (Wilks et al., 2016). The definition regions of the EAWM index and the Niño3.4 index are marked by red and black rectangles, respectively.
In response to Asian aerosols, the El Niño-related warm SST anomalies intensify over the eastern equatorial Pacific, which is associated with an intensification of the anomalous SST cooling over the western tropical Pacific (Fig. 1g and j). Concurrently, the anticyclonic anomalies over the western tropical Pacific strengthen and stretch northwestward, while the cyclone over the northern Pacific strengthens and covers a broader region (Fig. 1h and k). This enhanced anticyclone results in an intensification of southerly anomalies along the Asian coast from the South China Sea (Fig. 1j and k), advecting warm and humid air (Fig. 1i and l). Over land, warm anomalies over southeastern and central China weaken as well as cold anomalies over northeastern China (Fig. 1d, g, and j), which is primarily associated with the Asian aerosol-induced cooling (Fig. S2k) and the enhanced, northwestward-expanding PEA teleconnection pattern (Figs. 1e, h, k and S3), respectively. Overall, these changes suggest that the ENSO signal and its induced PEA pattern enhance with northwestward expansion under increased Asian aerosols. Given that the interannual variability of the EAWM is strongly influenced by the PEA pattern, the intensification of southerly anomalies along the Asian coast associated with the enhanced PEA may lead to an increase in the interannual variability of the EAWM.
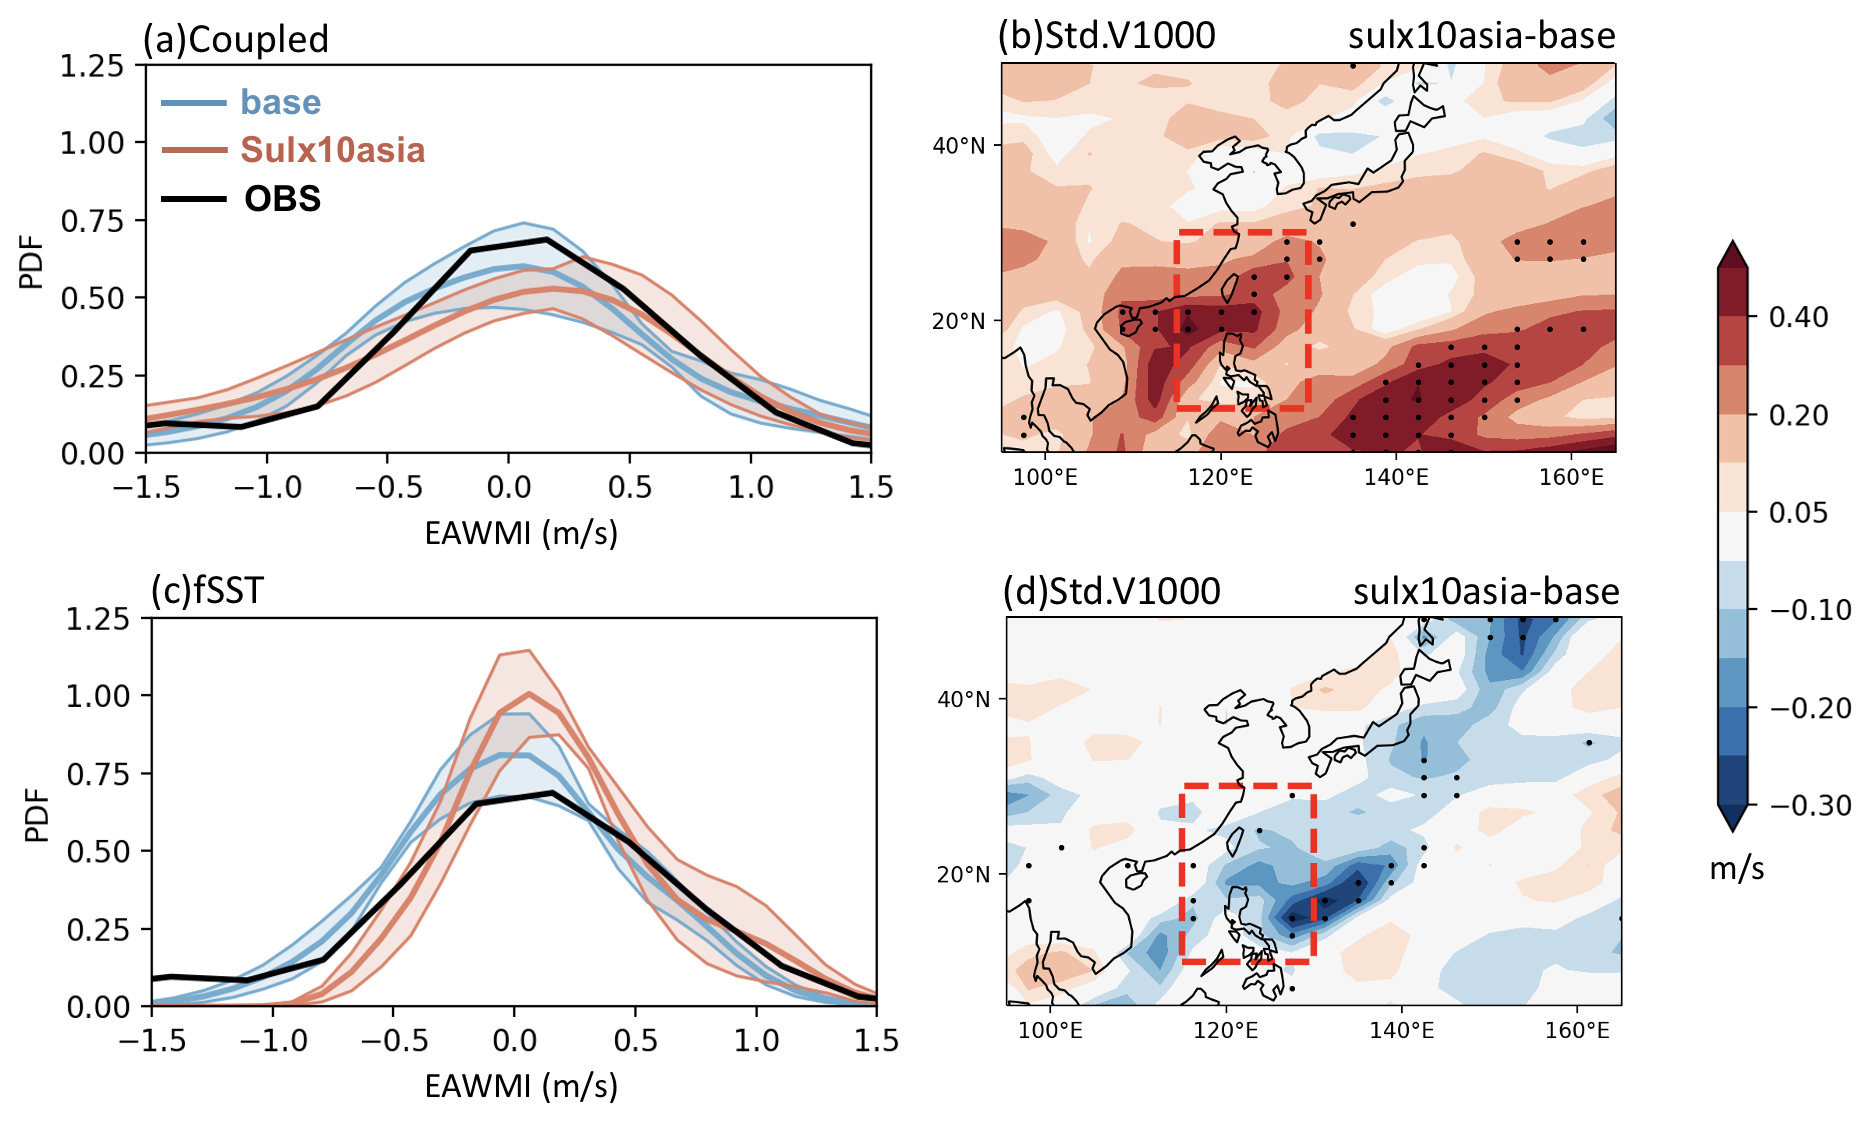
Figure 2Frequency distributions of the EAWM index from observations during DJF 1994–2005 (black curve) and (a) coupled simulations during DJF for years 50–61 and (c) fSST simulations during DJF for years 3–14 in PDRMIP with multi-model means (thick coloured curves) and the associated 95 % confidence intervals (coloured shades). The confidence intervals are estimated from different models using bootstrap resampling (e.g. Wang, 2001). Differences in multi-model mean standard deviations of V1000 (m s−1) between SUL×10Asia and baseline experiments from (b) coupled simulations during DJF for years 50–61 and (d) fSST simulations during DJF for years 3–14 in PDRMIP. Dotted regions indicate significant differences at the 95 % level from the two-tailed F test. The definition region of the EAWM index is marked by a red rectangle.
Changes in the interannual variability of the EAWM in response to Asian aerosol increase are shown by the probability distributions of the EAWM index (Figs. 2a and S4a). The simulated amplitude of the EAWM (defined as the standard deviation of the EAWM index) is slightly smaller than the observed amplitude in baseline simulations, which is a general known bias in models (Wang et al., 2010; Gong et al., 2014). In coupled simulations, the multi-model mean EAWM amplitudes increase by 18 % due to the Asian aerosols at both the 12-year (Fig. 2a) and 50-year (Fig. S4a) timescales, together with more extreme EAWM years in the SUL×10Asia experiment. Note, however, the differences in the shifts of the tails of the distributions of 12-year and 50-year periods due to sampling. Differences in standard deviations of V1000 between SUL×10Asia and baseline experiments (Figs. 2b and S4c) further confirm that the prevailing northerly wind region of the EAWM, with large V1000 standard deviations (mainly along the East Asian coast) in the baseline experiment (Fig. S4b), exhibits an increase in SUL×10Asia simulations. These changes are consistent with the aerosol-enhanced PEA pattern identified above. However, in fSST simulations, the multi-model mean EAWM amplitude decreases by 19 % at the 12-year timescale accompanied by more strong-EAWM years and less weak-EAWM years in SUL×10Asia experiments (Fig. 2c and d). These changes can be explained by aerosol-induced cooling over the emission region and the formation of an anomalous anticyclonic circulation (e.g. Hu et al., 2015; Liu et al., 2019; Dow et al., 2021) and indicate an enhanced climatological pattern of the EAWM under increased aerosols (Fig. S2a–f). In addition to this atmospheric-only response, the influence of Asian aerosols can extend over the Maritime Continent and the northwestern Pacific (Wilcox et al., 2019; Dow et al., 2021; Fig. S2g–l). In coupled simulations, the climatological pattern of the EAWM extends southeastward, which is mainly represented by an anomalous anticyclone centred over the southwest of the Philippines (Fig. S2g and j). This anomalous anticyclone, attributed to the southward shift of the Hadley circulation to compensate for the interhemispheric asymmetry in aerosol radiative cooling (Liu et al., 2019), enhances the northerlies over the Maritime Continent but slightly weakens the northerlies along the East Asian coast (Fig. S3g, h, j, and k). This pattern cannot explain the increased interannual variability of the EAWM in coupled simulations as it is not associated with an evident modulation of the climatological monsoon flow. The EAWM-related circulation and precipitation anomalies brought about by increased aerosols in the coupled experiments (Fig. S5) feature an enhanced PEA pattern. This further suggests the contribution of the enhanced ENSO-induced PEA pattern to increased interannual variability of the EAWM. The opposite variations in the interannual variability of the EAWM to Asian aerosols in fully coupled experiments and atmosphere-only (+18 % and −19 %, respectively) also reflect the importance of ENSO-related atmosphere–ocean coupled processes.
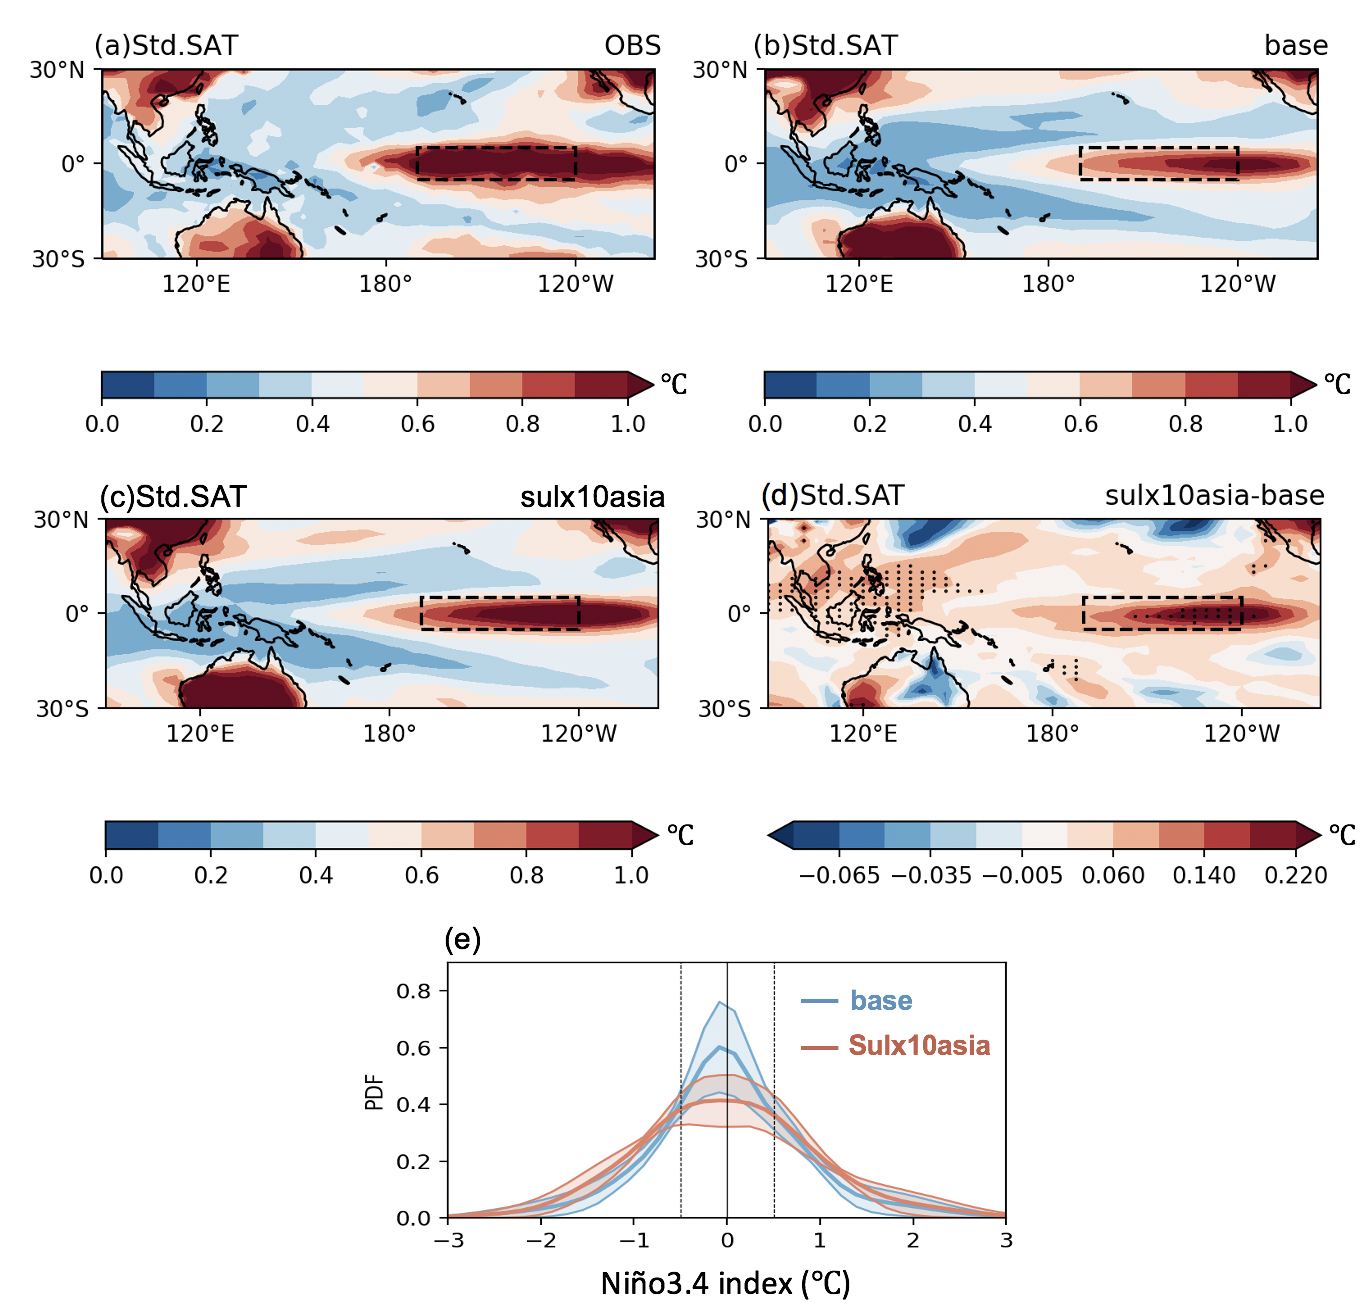
Figure 3DJF multi-model mean standard deviations of SAT (SST over the ocean, °C) from (a) observations during 1965–2014, (b) coupled baseline simulations, and (c) coupled SUL×10Asia simulations. (d) Differences in standard deviations of SAT (SST over the ocean, °C) between coupled SUL×10Asia and baseline simulations. Dotted regions indicate significant differences at the 95 % level from the two-tailed F test. (e) Frequency distributions of the Niño3.4 index from coupled simulations in PDRMIP with multi-model means (thick coloured curves) and the associated 95 % confidence intervals (coloured shading). The confidence intervals are estimated from different models using bootstrap resampling.
Following previous studies (e.g. Wang et al., 2013, 2022a), the increased ENSO signal and its induced teleconnection pattern can be further linked to changes in the ENSO amplitude (defined as the standard deviation of the Niño3.4 index). Figure 3a shows the observed standard deviation of SST across the tropical Pacific, with the highest values over the central–eastern equatorial Pacific. This spatial pattern is well captured by the multi-model mean in the coupled baseline simulation (Fig. 3b) albeit the core values are slightly underestimated in magnitude and spatial extent, especially in the meridional direction. Increased aerosols lead to significant increases in the SST standard deviation over the Maritime Continent and the central–eastern equatorial Pacific (Fig. 3c and d). This is consistent with the increased ENSO signal and the related changes in SST anomalies over these two regions (Fig. 1j). Figure 3e shows the probability distributions of the Niño3.4 index from the coupled baseline (blue curve and shading) and SUL×10Asia (red curve and shading) simulations. The multi-model mean ENSO amplitude increases by 17 % under aerosol forcing (from 0.7–0.82 °C).
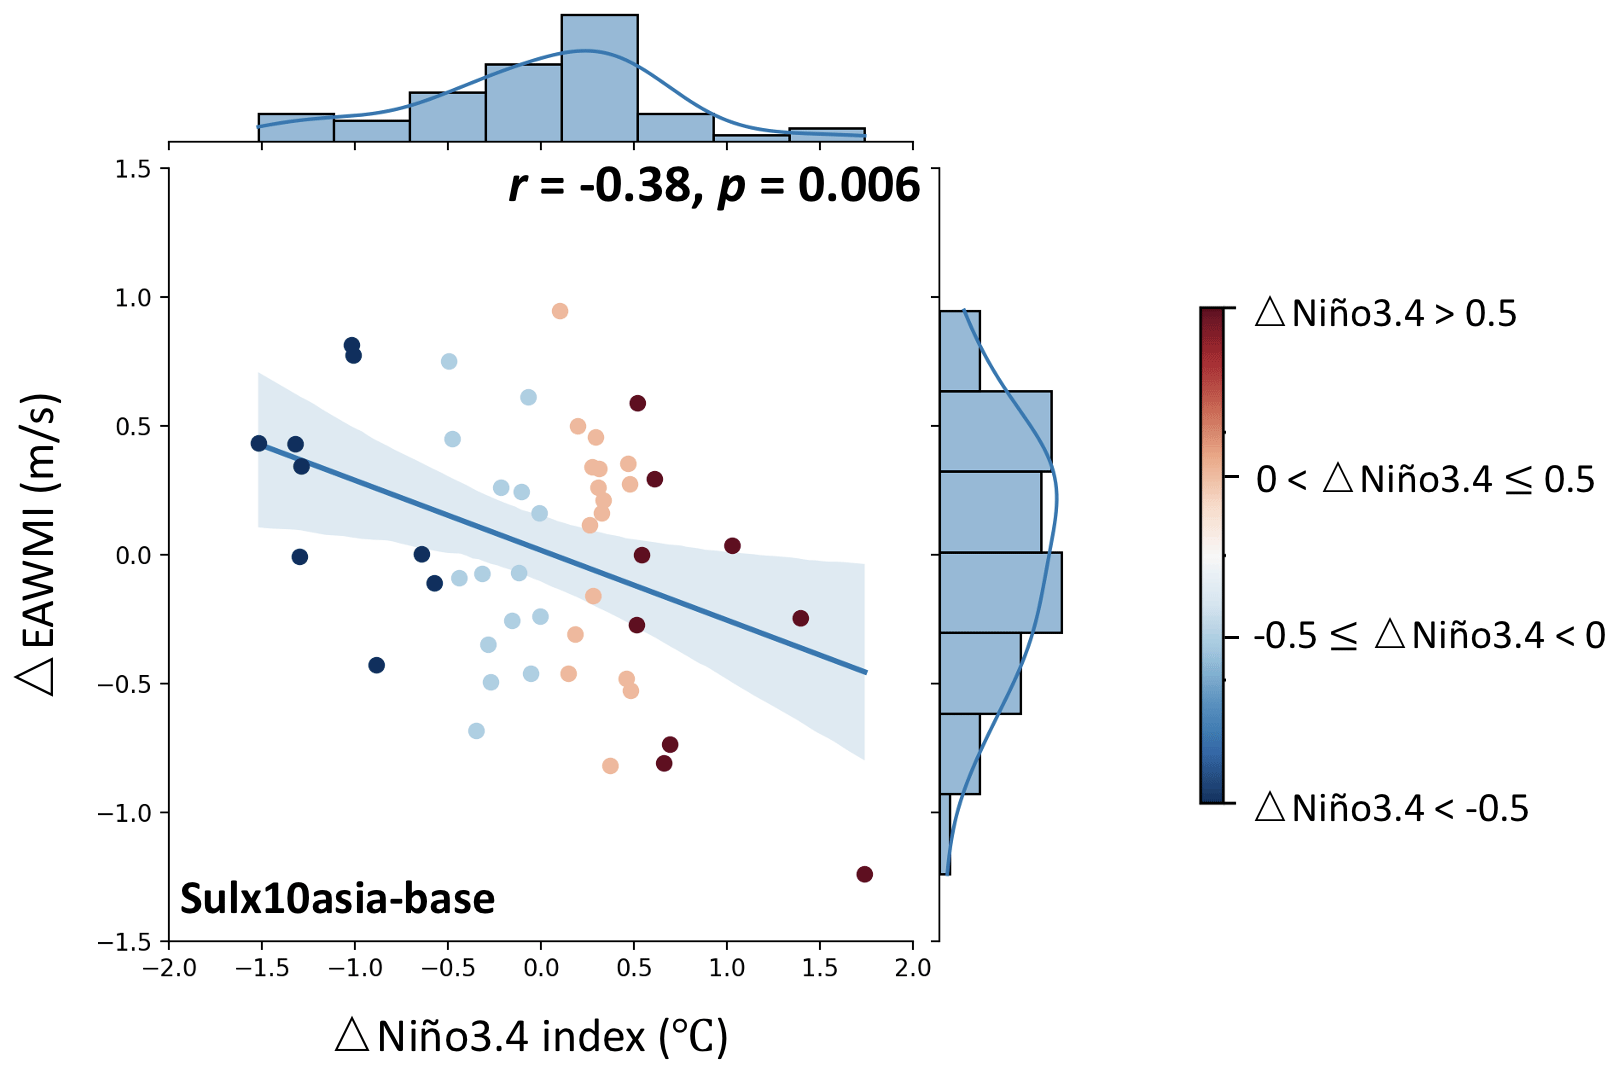
Figure 4Joint distributions of multi-model mean differences in the EAWM index against corresponding differences in the Niño3.4 index between coupled SUL×10Asia and baseline simulations, including the linear fits with 95 % confidence intervals.
Consistent with the increased ENSO amplitude, Table 1 shows that there are more El Niño (Niño3.4 index >0.5°) and La Niña (the Niño3.4 index ) years in the coupled SUL×10Asia simulation compared to the baseline for each model, with an increase of up to 100 % (from 14 to 28 events in the 50-year record). Figure 4 shows the joint distributions of multi-model mean aerosol-driven changes in the Niño3.4 index compared with the EAWM index in coupled simulations. Both the Niño3.4 index and the EAWM index have a wide range of variations (i.e. from −1.5 to 1.5°and −1 to , respectively), suggesting that both the ENSO amplitude and the interannual variability of the EAWM increase under Asian aerosol forcing as indicated above. Remarkably, changes in the Niño3.4 index are significantly anti-correlated (p<0.01) with those in the EAWM index (). In particular, when the Niño3.4 index decreases by less than 0.5° due to Asian aerosol forcing, the EAWM is 2.5 times more likely to strengthen than weaken and vice versa. This is consistent with the negative relationship between ENSO and the EAWM induced by the ensuing PEA teleconnection pattern (Wang et al., 2000). These results show that Asian aerosols lead to an increase in the ENSO amplitude, resulting in increased interannual variability of the EAWM through the associated PEA pattern.
It is well known that ENSO is fundamentally governed by ocean–atmosphere coupled processes in the tropical Pacific (Timmermann et al., 2018; Rashid, 2022). It is therefore interesting to examine how the tropical Pacific mean state and atmosphere–ocean coupling are affected by Asian aerosol forcing. Figure 5 shows the climatological annual variation in key surface variables across the equatorial Pacific Ocean in the coupled baseline simulation and their changes under increased Asian aerosols. In the baseline simulation, the equatorial Pacific mean state is characterised by easterly trade winds with maximum magnitude over the central–eastern Pacific, east–west SST gradient, and strong SST amplitudes (i.e. standard deviations of SST) over the eastern Pacific (Fig. 5a–c). These features are altered in the SUL×10Asia experiment relative to the baseline experiment, with significant seasonal differences. In particular, anomalous westerlies develop from spring over the eastern Pacific and then gradually strengthen until the peak in September while moving towards the central Pacific (the Niño4 region, purple bar) (Fig. 5d). Westerly wind anomalies are considered to play an important role during the development stage (i.e. boreal autumn) of ENSO events by generating warm SST anomalies in the eastern equatorial Pacific via the thermocline and the advective feedbacks (McPhaden, 1999; Lian and Chen, 2021; Xuan et al., 2024). This anomalous westerly flow weakens the climatological easterly trade winds in the coupled SUL×10Asia simulation compared to the baseline (Fig. 5a and d). Furthermore, anomalous SST warming appears over the eastern Pacific (the Niño3 region, green bar) from autumn to winter (peak around October) (Fig. 5h), which decreases the east–west equatorial Pacific SST gradient (Fig. 5b and e). Note that Fig. 5b, e, and h show SST minus zonal mean and SST difference minus zonal mean, respectively, to clarify the east–west SST change gradient. Given the broad aerosol-induced cooling over the Pacific (Fig. S2k), warming SST anomalies in Fig. 5h represent less cooling. Although the east–west equatorial Pacific SST gradient weakens (Fig. 5h), westerly wind anomalies over the central Pacific are larger (Fig. 5g), sustaining the eastward advection of warm water and reinforcing the positive SST anomalies over the eastern Pacific. Correspondingly, the SST amplitude increases with maximum values in the winter mainly over the central–eastern Pacific (the Niño3.4 region) (Fig. 5i), which is consistent with the increased ENSO amplitude under Asian aerosol forcing indicated above. Besides, anomalous SST warming over the eastern Pacific can further strengthen westerly wind anomalies over the central Pacific (Zebiak and Cane, 1987). Previous studies have found a link between the warmer SST in the eastern than in the western equatorial Pacific with an increase in ENSO amplitude (Zheng et al., 2016; Ying et al., 2019; Hayashi et al., 2020).
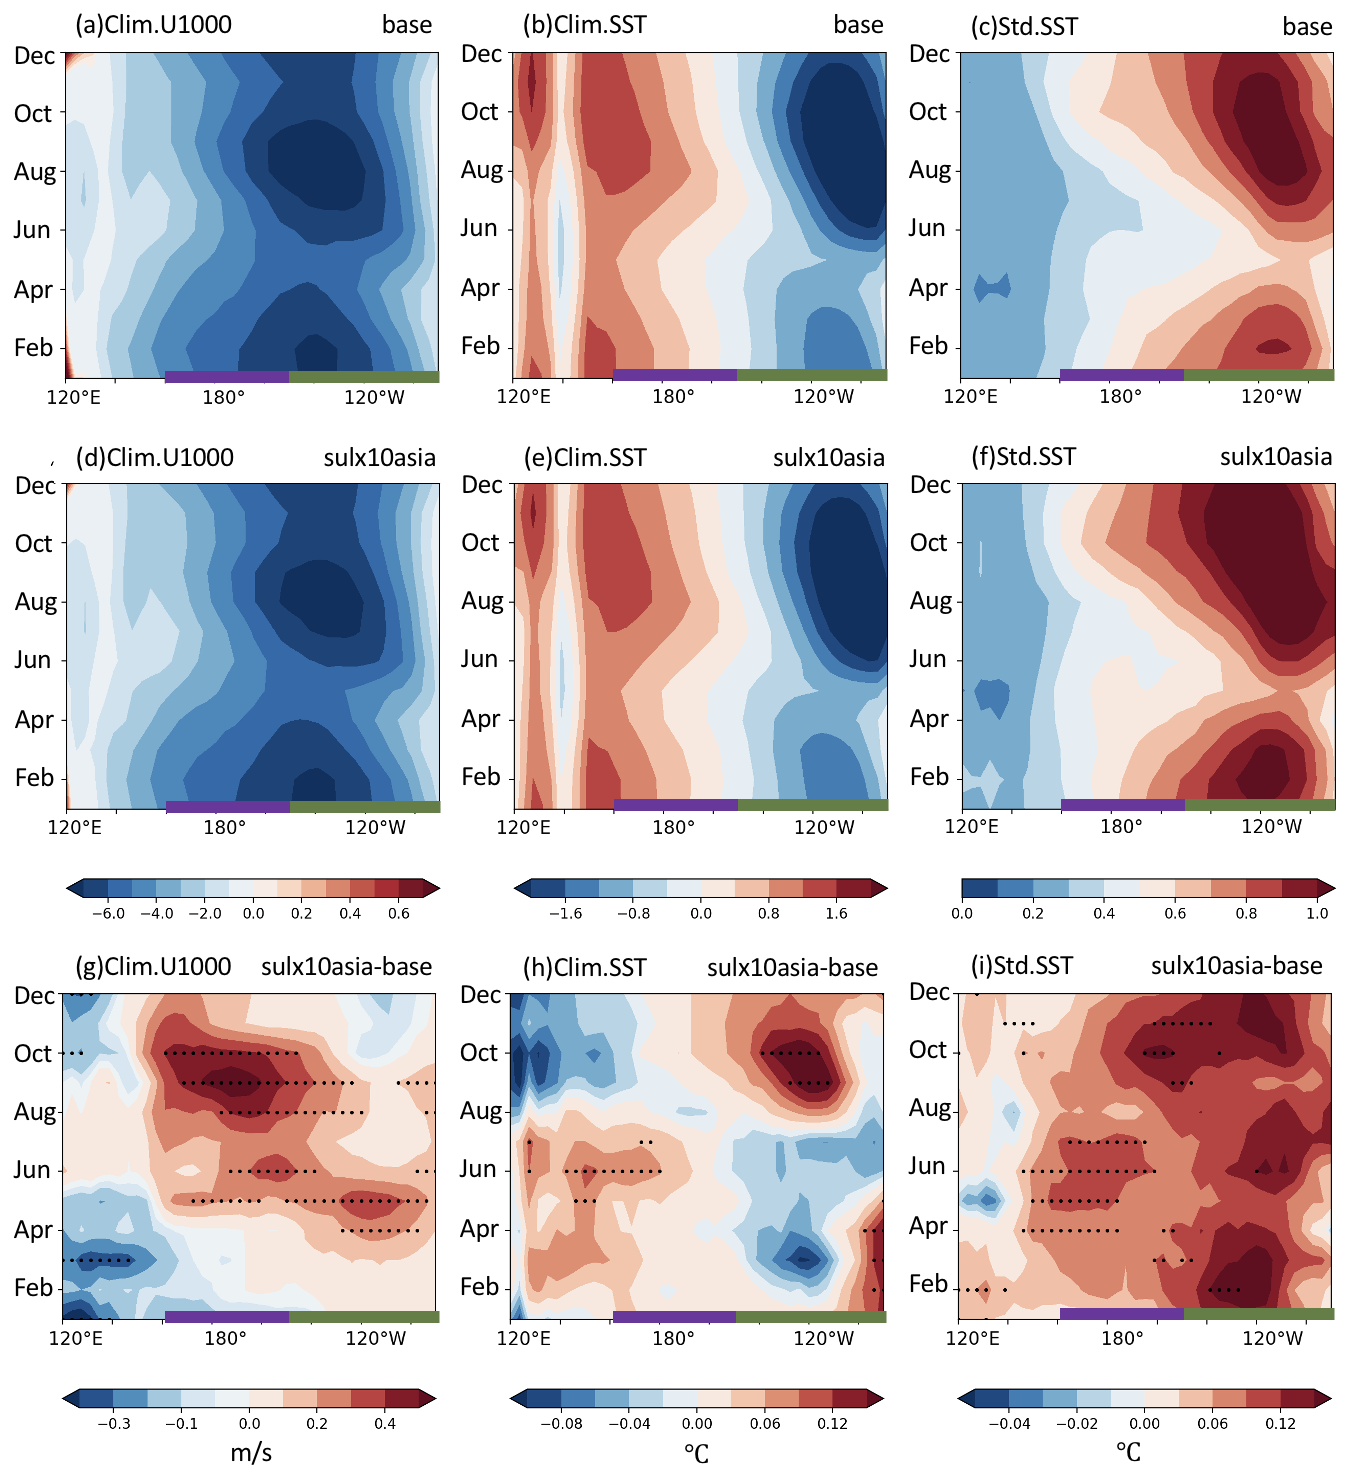
Figure 5Multi-model mean longitudinal transect of the monthly climatological (a, d) 1000 hPa zonal wind (U1000, ms−1); (b, e) SST minus zonal mean (°C); (c, f) SST standard deviation (°C) for the equatorial Pacific (5° S–5° N) from coupled (a–c) baseline and (d–f) SUL×10Asia simulations; and their changes in (g) U1000, (h) SST, and (i) SST standard deviation between coupled SUL×10Asia and baseline simulations. Dotted regions in (g, h) indicate significant changes at the 95 % level from the two-tailed Student t test and in (i) indicate significant changes at the 95 % level from the two-tailed F test. The definition longitudes of the Niño3 and Niño4 indices are marked by green and purple thick bars, respectively, along the x axis.
Given the above marked changes over the equatorial Pacific mean state in autumn and winter, we further explore the response of the tropical Pacific mean state to Asian aerosols in these two seasons. In autumn (SON, September–October–November), there are a zonally wider anticyclone, cooling, and negative precipitation anomalies stretching from Asia to the whole North Pacific (Fig. 6a–c) compared to those in winter (Fig. 6d–f). As in Fig. 5h, Fig. 6b and e show surface air temperature (SST over the ocean) difference minus domain mean in which warming SST anomalies represent less cooling. These differences between SON and DJF are related to the climatological pattern in SON when the Siberian High is close to the broad North Pacific subtropical high and the Aleutian Low is weak (Fig. S6). The associated midlatitude westerlies (Fig. S6a) transport aerosols downstream, extending the region of aerosol-induced negative effective radiative forcing (ERF) anomalies to the northwestern Pacific (Fig. S7a–c), leading to the zonally wider cooling. The cooling and associated anticyclonic anomalies trigger cross-equatorial wind anomalies from the Northern Hemisphere to the Southern Hemisphere, which shift the Intertropical Convergence Zone (ITCZ) southward (Fig. 6a–c), as indicated by previous studies on the interhemispheric difference in aerosol emissions (Navarro et al., 2017; Voigt et al., 2017; Wilcox et al., 2019). Deflected by the Coriolis force, the cross-equatorial wind anomalies present a westerly anomaly near the Equator mainly over the central Pacific (purple box in Fig. 6a), which can weaken the easterly trade winds, generating warm SST anomalies over the eastern Pacific (green box in Fig. 6b) and excess rainfall (Fig. 6c). From SON to DJF, the climatological Siberian High strengthens, and the Aleutian Low deepens with a southward shift in the coupled baseline simulation (Fig. S6). The associated northwesterlies along the eastern flank of the Siberian High and northeasterlies along the coast of East Asia confine the negative ERF anomalies primarily south of 30° N (Fig. S7d–f). Therefore, the Asian aerosol-induced cooling and associated anticyclone are more concentrated over the Maritime Continent and the northwestern Pacific (Fig. 6d), altering the SST gradient anomaly from north–south (Fig. 6b) to northwest–southeast (Fig. 6e). This SST anomaly pattern leads to the southward shift of anomalous westerly winds over the central–eastern Pacific as well as warm SST and positive precipitation anomalies over eastern Pacific (Fig. 6d–f). These anomalies are conducive to increasing the ENSO amplitude as explained below.
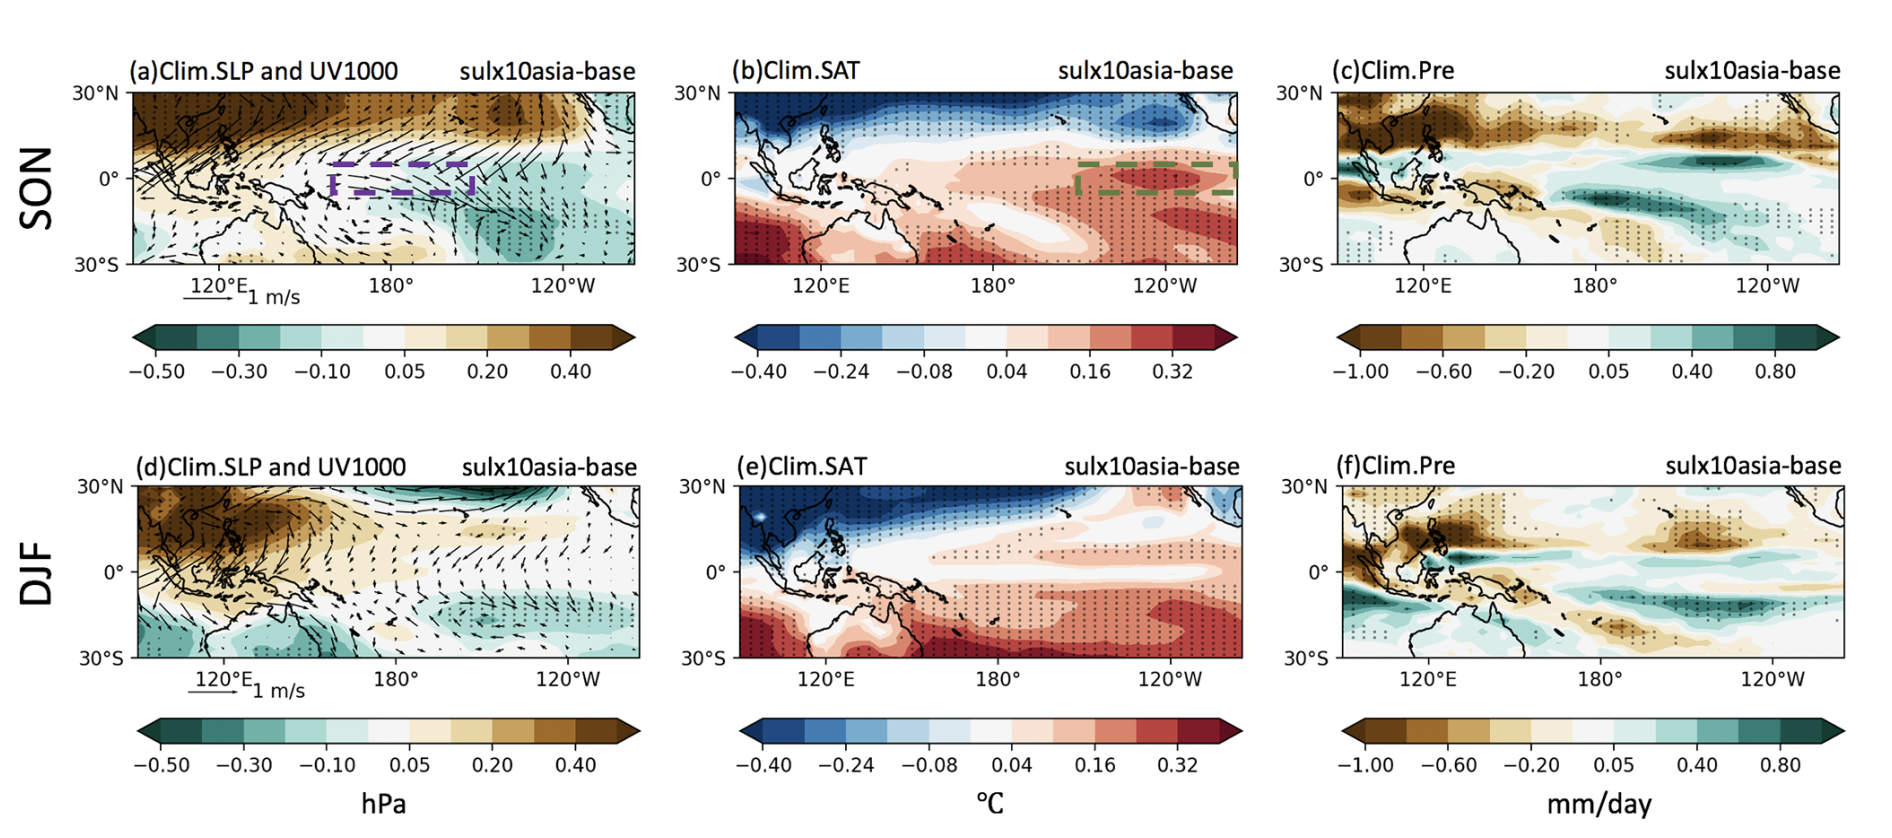
Figure 6(a–c) SON and (d–f) DJF multi-model mean changes in (a, d) sea level pressure (SLP; hPa, shading) and 1000 hPa wind (UV1000, vector), (b, e) surface air temperature (SAT, SST over the ocean) minus domain mean (°C), and (c, f) precipitation (Pre, mm d−1) between coupled SUL×10Asia and baseline simulations. Dotted regions indicate significant changes at the 95 % level from the two-tailed Student t test. The definition regions of the Niño3 and Niño4 indices are marked by green and purple rectangles in panels a and b, respectively.
The processes that most significantly contribute to the ENSO amplitude are surface wind responses to the equatorial eastern Pacific SST variations (the atmospheric Bjerknes or zonal wind feedback), the zonal advection of mean SSTs by the anomalous current (the zonal advective feedback), and the vertical advection of anomalous subsurface temperatures by the mean upwelling (the thermocline feedback) (e.g. Timmermann et al., 2018; Ying et al., 2019; Peng et al., 2024). The two latter feedbacks are related to the ocean dynamic responses to zonal wind forcing that cause in-phase variations of eastern Pacific SST anomalies (Jin and An, 1999; Kim et al., 2014). A diagnostic quantity that includes both of these two feedback processes is the zonal wind forcing of SST anomalies, which was found to be useful for studying ENSO amplitude changes under global warming (Rashid et al., 2016). To further quantify the changes in the strength of the ocean–atmosphere coupling that modulate the ENSO amplitude, we focus on two main processes, the atmospheric Bjerknes feedback and the zonal wind forcing, which are related to the formation of the westerly anomalies over the central Pacific and warm SST anomalies over the eastern Pacific indicated above. Figure 7 shows the lag-regression coefficients between the SST anomalies averaged over the Niño3 region (green box in Fig. 6b) (the Niño3 SST index) and near-surface zonal winds (U1000) anomalies averaged over the Niño4 region (purple box in Fig. 6a) (the Niño4 U1000 index) to represent the atmospheric Bjerknes feedback and the zonal wind forcing. In each panel, regression coefficients between two variables at different lags are plotted for observations (black curve) and the coupled baseline (blue curve and shading) and SUL×10Asia (red curve and shading) simulations. The left panel shows the Niño4 U1000 anomalies response to the Niño3 SST index (i.e. the atmospheric Bjerknes feedback). As in most CMIP models (e.g. Bellenger et al., 2014, and Rashid et al., 2016), the simulated atmospheric Bjerknes feedback is weaker than in observations (Fig. 7a). The strength of the feedback for lags between −5 and 5 months almost does not change in the coupled SUL×10Asia simulation relative to the baseline (Fig. 7a). The right panel shows the Niño3 SST anomalies response to the Niño4 U1000 index (i.e. the zonal wind forcing). In this case, the simulated SST responses are somewhat stronger than the observed responses, and the maximum responses are found at small positive lags (e.g. when U1000 leads SST by 1–2 months) (Rashid et al., 2022). The zonal wind forcing, defined as the maximum of the regression coefficients (lag=1), strengthens from the baseline (0.51 °C m−1 s) to the SUL×10Asia experiment (0.55 °C m−1 s) by 8 %. Therefore, the zonal wind forcing plays a more important role than the atmospheric Bjerknes feedback in increasing the ENSO amplitude under Asian aerosol forcing. In summary, the Asian aerosol-induced cooling weakens the easterly trade winds over the central Pacific, which reduces the east–west equatorial Pacific SST gradient through the zonal wind forcing, leading to increased ENSO amplitude.
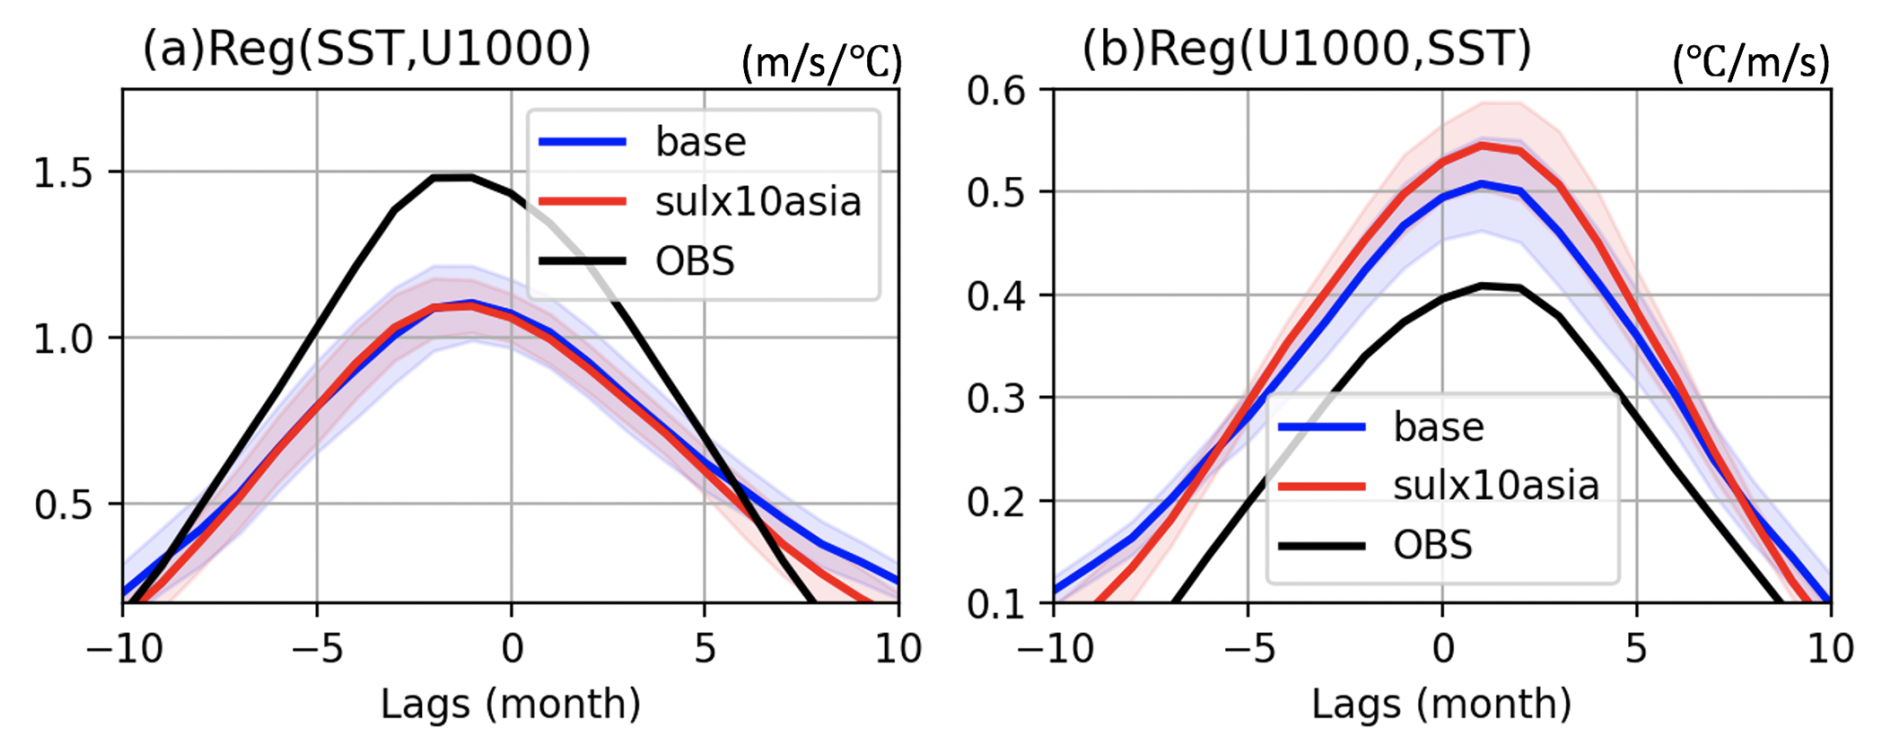
Figure 7Multi-model mean lag-regression coefficients of (a) the Niño4 U1000 index onto the Niño3 SST index (indicative of the atmospheric Bjerknes feedback) () and (b) the Niño3 SST index onto the Niño4 U1000 index (indicative of the zonal wind forcing of SST) (°C m−1 s) from observations (black curve) and coupled simulations in PDRMIP with multi-model means (thick coloured curves) and the associated 95 % confidence intervals (coloured shades). The confidence intervals are estimated from different models using bootstrap resampling.
This study investigates the response of the ENSO–EAWM link and related interannual variability of the EAWM to Asian sulfate aerosols, including the induced changes in the ENSO-related ocean–atmosphere feedbacks, using a set of experiments carried out as part of the PDRMIP initiative. Accounting for two-way atmosphere–ocean coupling, the El Niño-related warm SST anomalies intensify over the eastern equatorial Pacific, associated with an enhancement of the anomalous anticyclone anomaly over the western tropical Pacific and corresponding stronger southerlies along the Asian coast from the South China Sea. This enhanced ENSO signal and its induced PEA pattern contribute to explaining the increased interannual variability of the EAWM (+18 %). When the ocean is not allowed to respond, the interannual variability of the EAWM varies in the opposite direction (-19 %), which further reflects the importance of ENSO-related atmosphere–ocean coupled processes for explaining the increased variability. The PEA-like EAWM-related circulation and precipitation anomalies also hint at a link between increased interannual variability of the EAWM and changes in ENSO in response to Asian aerosols. The increased ENSO signal can be further linked to changes in the ENSO amplitude. The multi-model mean ENSO amplitude increases by 17 % with increased sulfate aerosols, with more El Niño and La Niña years in all the PDRMIP models used in this study. Changes in the Niño3.4 index are significantly correlated with changes in the EAWM index.
In coupled simulations, the aerosol-induced broad cooling alters the mean state over the tropical and equatorial Pacific, generating westerly anomalies over the central Pacific (peak in autumn) and warm SST anomalies over the eastern Pacific from autumn to winter, which are key factors in the increasing ENSO amplitude. Using a diagnostic analysis, the contribution of two main processes, the atmospheric Bjerknes feedback and zonal wind forcing, is estimated. The zonal wind forcing is identified to strengthen from the baseline experiment to the SUL×10Asia experiment by 8 %, while the strength of the atmospheric Bjerknes feedback almost does not change. Therefore, the aerosol-induced cooling weakens the easterly trade winds over the central Pacific, which reduce the east–west equatorial Pacific SST gradient through the zonal wind forcing, causing the increased amplitude of ENSO and the EAWM. In summary, the findings of this study provide a better understanding of the change in the year-to-year variability of the EAWM in response to aerosol forcing. This is critical to reducing uncertainties in future projections of variability of regional extremes, such as cold surges and flooding, which can cause large social and economic impacts on the densely populated East Asia.
We acknowledge some limitations and potential extensions of this study. Only a limited number of models is available as part of PDRMIP as some others do not parameterise aerosol–cloud interactions, which are critical to realise the total aerosol response across Asia (e.g. Dong et al., 2016; Liu et al., 2024). Also, some models prescribed concentrations rather than emissions and perturbations, the implications of which are difficult to ascertain given the limited model sample. Including more models and making use of coordinated perturbed aerosol experiments to Asian aerosols, such as those planned as part of RAMIP (Wilcox et al., 2023) would further increase the robustness of our study. This would allow us to better characterise the individual model responses as a function of the underlying bias (e.g. Liu et al., 2024). It would be interesting to extend this analysis to future projections for the 21st century, for example, using CMIP6 models or large ensembles, and examine the externally forced changes accounting also for the role of internal climate variability. It would also be interesting to examine the extent to which the ENSO–EAWM link varies across the various future aerosol pathways, which are uncertain and display very different, but equally plausible, patterns over Asia (Persad et al., 2022; Wang et al., 2023). Finally, we only considered the role of Asian aerosol changes. A more comprehensive analysis, should similar experiments be available, could also consider aerosols from South and East Asia separately as well as from other geographical regions, such as Europe and North America, which can also affect the Pacific and, via atmospheric teleconnections, East Asia (e.g. Dong et al., 2016; Liu et al., 2019).
The Python code generated in this study is available upon request (contact author).
The CRU land temperature dataset is obtained from https://crudata.uea.ac.uk/cru/data/hrg/cru_ts_4.07 (CRU, 2025), while the HadISST sea surface temperature dataset can be found at https://www.metoffice.gov.uk/hadobs/hadisst/ (HadISST, 2025). The ERA5 reanalysis is provided by the European Centre for Medium-Range Weather Forecasts at https://www.ecmwf.int/en/forecasts/dataset/ecmwf-reanalysis-v5 (ERA5, 2025). The PDRMIP data can be accessed through the World Data Center for Climate (WDCC) data server at https://doi.org/10.26050/WDCC/PDRMIP_2012-2021 (Andrews et al., 2021).
The supplement related to this article is available online at https://doi.org/10.5194/acp-25-8805-2025-supplement.
ZJ and MAB designed the study and discussed the results. ZJ carried out the analysis and drafted the manuscript. All authors edited the paper.
The contact author has declared that none of the authors has any competing interests.
Publisher's note: Copernicus Publications remains neutral with regard to jurisdictional claims made in the text, published maps, institutional affiliations, or any other geographical representation in this paper. While Copernicus Publications makes every effort to include appropriate place names, the final responsibility lies with the authors.
Zixuan Jia thanks the Startup Foundation for Introducing Talent of Nanjing University of Information Science and Technology (NUIST) and the Natural Science Fund for Colleges and Universities in Jiangsu Province. Massimo A. Bollasina acknowledges support from the Natural Environment Research Council (grant no. NE/N006038/1) and the Research Council of Norway (grant no. 324182; CATHY).
This research has been supported by the Startup Foundation for Introducing Talent of Nanjing University of Information Science and Technology (NUIST) (grant no. 2024r034) and the Natural Science Fund for Colleges and Universities in Jiangsu Province (grant no. 24KJB170015).
This paper was edited by Marco Gaetani and reviewed by two anonymous referees.
Allen, R. J., Evan, A. T., Booth, B. B. B., Allen, R. J., Evan, A. T., and Booth, B. B. B.: Interhemispheric Aerosol Radiative Forcing and Tropical Precipitation Shifts during the Late Twentieth Century, J. Climate, 28, 8219–8246, https://doi.org/10.1175/JCLI-D-15-0148.1, 2015.
Andrews, T., Boucher, O., Fläschner, D., Kasoar, M., Kharin, V. V., Kirkevåg, A., Lamarque, J.-F., Myhre, G., Mülmenstädt, J., Oliviè, D. J. L., Samset, B. H., Sandstad, M., Shawki, D., Shindell, D., Stier, P., Takemura, T., Voulgarakis, A., and Watson-Parris, D.: Precipitation Driver Response Model Intercomparison Project data sets 2013–2021, World Data Center for Climate (WDCC) at DKRZ [data set], https://doi.org/10.26050/WDCC/PDRMIP_2012-2021, 2021
Bellenger, H., Guilyardi, E., Leloup, J., Lengaigne, M., and Vialard, J.: ENSO representation in climate models: from CMIP3 to CMIP5, Clim. Dynam., 42, 1999–2018, https://doi.org/10.1007/s00382-013-1783-z, 2014.
Bartlett, R. E., Bollasina, M. A., Booth, B. B., Dunstone, N. J., Marenco, F., Messori, G., and Bernie, D.J: Do differences in future sulfate emission pathways matter for near-term climate? A case study for the Asian monsoon, Clim. Dynam., 50, 1863–1880, https://doi.org/10.1007/s00382-017-3726-6, 2018.
Bellouin, N., Rae, J., Jones, A., Johnson, C., Haywood, J., and Boucher, O.: Aerosol forcing in the Climate Model Intercomparison Project (CMIP5) simulations by HadGEM2‐ES and the role of ammonium nitrate, J. Geophys. Res.-Atmos., 116, D20206, https://doi.org/10.1029/2011JD016074, 2011.
Bentsen, M., Bethke, I., Debernard, J. B., Iversen, T., Kirkevåg, A., Seland, Ø., Drange, H., Roelandt, C., Seierstad, I. A., Hoose, C., and Kristjánsson, J. E.: The Norwegian Earth System Model, NorESM1-M – Part 1: Description and basic evaluation of the physical climate, Geosci. Model Dev., 6, 687–720, https://doi.org/10.5194/gmd-6-687-2013, 2013.
Bollasina, M. A., Ming, Y., Ramaswamy, V., Schwarzkopf, M. D., and Naik, V.: Contribution of local and remote anthropogenic aerosols to the twentieth century weakening of the South Asian monsoon, Geophys. Res. Lett., 41, 680–687, https://doi.org/10.1002/2013GL058183, 2014.
Beobide-Arsuaga, G., Bayr, T., Reintges, A., and Latif, M.: Uncertainty of ENSO-amplitude projections in CMIP5 and CMIP6 models, Clim. Dynam., 56, 3875–3888, https://doi.org/10.1007/s00382-021-05673-4, 2021.
Boucher, O., Randall, D., Artaxo, P., Bretherton, C., Feingold, G., Forster, P., Kerminen, V.-M., Kondo, Y., Liao, H., Lohmann, U., Rasch, P., Satheesh, S., Sherwood, S., Stevens, B., and Zhang, X.: Clouds and Aerosols, in: Climate Change 2013: The Physical Science Basis. Contribution of Working Group I to the Fifth Assessment Report of the Intergovernmental Panel on Climate Change, Cambridge University Press, Cambridge, United Kingdom and New York, NY, USA, 571–658, https://doi.org/10.1017/CBO9781107415324.016, 2013.
Cai, W., Borlace, S., Lengaigne, M., Van Rensch, P., Collins, M., Vecchi, G., Timmermann, A., Santoso, A., McPhaden, M. J., Wu, L., and England, M. H.: Increasing frequency of extreme El Niño events due to greenhouse warming, Nat. Clim. Change, 4, 111–116, https://doi.org/10.1038/nclimate2100, 2014.
Cai, W., Santoso, A., Collins, M., Dewitte, B., Karamperidou, C., Kug, J. S., Lengaigne, M., McPhaden, M. J., Stuecker, M. F., Taschetto, A. S., and Timmermann, A.: Changing El Niño–Southern oscillation in a warming climate, Nature Reviews Earth and Environment, 2, 628–644, https://doi.org/10.1038/s43017-021-00199-z, 2021.
Chang, C. P., Wang, Z., and Hendon, H.: The Asian winter monsoon The Asian Monsoon, Springer Praxis Books, Berlin, 89–127, https://doi.org/10.1007/3-540-37722-0_3, 2006.
Chen, W., Yang, S., and Huang, R. H.: Relationship between stationary planetary wave activity and the East Asian winter monsoon, J. Geophys. Res.-Atmos., 110, D14110, https://doi.org/10.1029/2004JD005669, 2005.
Chen, W., Wang, L., Feng, J., Wen, Z., Ma, T., Yang, X., and Wang, C.: Recent progress in studies of the variabilities and mechanisms of the East Asian monsoon in a changing climate, Adv. Atmos. Sci., 36, 887–901, https://doi.org/10.1007/s00376-019-8230-y, 2019.
Chen, Z., Wu, R., and Chen, W.: Effects of northern and southern components of the East Asian winter monsoon on SST changes in the western North Pacific, J. Geophys. Res., 120, 3888–3905, 2015.
Cheng, J., Su, J., Cui, T., Li, X., Dong, X., Sun, F., Yang, Y., Tong, D., Zheng, Y., Li, Y., Li, J., Zhang, Q., and He, K.: Dominant role of emission reduction in PM2.5 air quality improvement in Beijing during 2013–2017: a model-based decomposition analysis, Atmos. Chem. Phys., 19, 6125–6146, https://doi.org/10.5194/acp-19-6125-2019, 2019.
Collins, M., An, S. I., Cai, W., Ganachaud, A., Guilyardi, E., Jin, F. F., Jochum, M., Lengaigne, M., Power, S., Timmermann, A., and Vecchi, G.: The impact of global warming on the tropical Pacific Ocean and El Niño, Nat. Geosci., 3, 391–397, https://doi.org/10.1038/ngeo868, 2010.
CRU: Climatic Research Unit (CRU) Time-Series dataset of high-resolution gridded climate data, version 4.07, Climatic Research Unit (University of East Anglia) and Met Office [data set], https://crudata.uea.ac.uk/cru/data/hrg/cru_ts_4.07 (last access: 4 August 2025), 2025.
Dong, B., Sutton, R. T., Highwood, E. J., and Wilcox, L. J.: Preferred response of the East Asian summer monsoon to local and non-local anthropogenic sulphur dioxide emissions, Clim. Dynam., 46, 1733–1751, https://doi.org/10.1007/s00382-015-2671-5, 2016.
Dow, W. J., Maycock, A. C., Lofverstrom, M., and Smith, C. J.: The effect of anthropogenic aerosols on the Aleutian low, J. Climate, 34, 1725–1741, https://doi.org/10.1175/JCLI-D-20-0423.1, 2021.
ERA5: ECMWF Reanalysis v5 dataset, European Centre for Medium-Range Weather Forecasts [data set], https://www.ecmwf.int/en/forecasts/dataset/ecmwf-reanalysis-v5 (last access: 4 August 2025), 2025.
Fahrenbach, N. L., Bollasina, M. A., Samset, B. H., Cowan, T., and Ekman, A. M.: Asian Anthropogenic Aerosol Forcing Played a Key Role in the Multidecadal Increase in Australian Summer Monsoon Rainfall, J. Climate, 37, 895–911, https://doi.org/10.1175/JCLI-D-23-0313.1, 2024.
Forster, P., Storelvmo, T., Armour, K., Collins, W., Dufresne, J. L., Frame, D., Lunt, D. J., Mauritsen, T., Palmer, M. D., Watanabe, M., Wild, M., and Zhang, H.: The Earth's Energy Budget, Climate Feedbacks, and Climate Sensitivity, in: Climate Change 2021: The Physical Science Basis. Contribution of Working Group I to the Sixth Assessment Report of the Intergovernmental Panel on Climate Change, Cambridge University Press, Cambridge, United Kingdom and New York, NY, USA, 923–1054, https://doi.org/10.1017/9781009157896.009, 2021.
Gao, J., Wang, K., Wang, Y., Liu, S., Zhu, C., Hao, J., Liu, H., Hua, S., and Tian, H.: Temporal-spatial characteristics and source apportionment of PM2.5 as well as its associated chemical species in the Beijing-Tianjin-Hebei region of China, Environ. Pollut., 233, 714–724, https://doi.org/10.1016/j.envpol.2017.10.123, 2018.
Gong, H.,Wang, L., Chen, W., Wu, R., Wei, K., and Cui, X.: The Climatology and Interannual Variability of the East Asian Winter Monsoon in CMIP5 Models, J. Climate, 27, 1659–1678, https://doi.org/10.1175/JCLI-D-13-00039.1, 2014.
Gong, H., Wang, L., Chen, W., Nath, D., Huang, G., and Tao, W.: Diverse influences of ENSO on the East Asian–Western Pacific winter climate tied to different ENSO properties in CMIP5 models, J. Climate, 28 2187–2202, https://doi.org/10.1175/JCLI-D-14-00405.1, 2015.
HadISST: Met Office Hadley Centre observations datasets, Hadley Centre Sea Ice and Sea Surface Temperature dataset [data set], https://www.metoffice.gov.uk/hadobs/hadisst/ (last access: 4 August 2025), 2025.
Harris, I., Osborn, T. J., Jones, P., and Lister, D.: Version 4 of the CRU TS monthly high-resolution gridded multivariate climate dataset. Sci. Data, 7, 109, https://doi.org/10.1038/s41597-020-0453-3, 2020.
Hayashi, M., Jin, F. F., and Stuecker, M. F. Dynamics for El Niño–La Niña asymmetry constrain equatorial-Pacific warming pattern, Nat. Commun., 11, 4230, https://doi.org/10.1038/s41467-020-17983-y, 2020.
He, S., Wang, H., and Liu, J.: Changes in the Relationship between ENSO and Asia–Pacific Midlatitude Winter Atmospheric Circulation, J. Climate, 26, 3377–3393, https://doi.org/10.1175/JCLI-D-12-00355.1, 2013.
Hersbach, H., Bell, B., Berrisford, P., Biavati, G., Horányi, A., Muñoz Sabater, J., Nicolas, J., Peubey, C., Radu, R., Rozum, I., Schepers, D., Simmons, A., Soci, C., Dee, D., Thépaut, J.-N.: ERA5 monthly averaged data on pressure levels from 1940 to present, Copernicus Climate Change Service (C3S) Climate Data Store (CDS), https://doi.org/10.24381/cds.6860a573, 2023.
Hu, C., Yang, S., and Wu, Q.: An optimal index for measuring the effect of East Asian winter monsoon on China winter temperature, Clim. Dynam., 45, 2571–2589, https://doi.org/10.1007/s00382-015-2493-5, 2015.
Huang, R., Chen, J., Wang, L., and Lin, Z.: Characteristics, processes, and causes of the spatio-temporal variabilities of the East Asian monsoon system, Adv. Atmos. Sci., 29, 910–942, https://doi.org/10.1007/s00376-012-2015-x, 2012.
Huang, P. and Xie, S. P.: Mechanisms of change in ENSO-induced tropical Pacific rainfall variability in a warming climate, Nat. Geosci., 8, 922–926, https://doi.org/10.1038/ngeo2571, 2015.
Huang, B., Thorne, P. W., Banzon, V. F., Boyer, T., Chepurin, G., Lawrimore, J. H., Menne, M. J., Smith, T. M., Vose, R. S., and Zhang, H. M.: Extended reconstructed sea surface temperature, version 5 (ERSSTv5): upgrades, validations, and intercomparisons, J. Climate, 30, 8179–8205, https://doi.org/10.1175/JCLI-D-16-0836.1, 2017.
Hurrell, J. W., Holland, M. M., Gent, P. R., Ghan, S., Kay, J. E., Kushner, P. J., Lamarque, J. F., Large, W. G., Lawrence, D., Lindsay, K., and Lipscomb, W. H.: The community earth system model: a framework for collaborative research, B. Am. Meteorol. Soc., 94, 1339–1360, https://doi.org/10.1175/BAMS-D-12-00121.1, 2013.
Hwang, Y.-T., Frierson, D. M. W., and Kang, S. M.: Anthropogenic sulfate aerosol and the southward shift of tropical precipitation in the late 20th century, Geophys. Res. Lett., 40, 2845–2850, https://doi.org/10.1002/grl.50502, 2013.
Iversen, T., Bentsen, M., Bethke, I., Debernard, J. B., Kirkevåg, A., Seland, Ø., Drange, H., Kristjansson, J. E., Medhaug, I., Sand, M., and Seierstad, I. A.: The Norwegian Earth System Model, NorESM1-M – Part 2: Climate response and scenario projections, Geosci. Model Dev., 6, 389–415, https://doi.org/10.5194/gmd-6-389-2013, 2013.
Ji, L., Sun, S., Arpe, K., and Bengtsson, L.: Model study on the interannual variability of Asian winter monsoon and its influence, Adv. Atmos. Sci., 14, 1–22, https://doi.org/10.1007/s00376-997-0039-4, 1997.
Jia, Z., Bollasina, M. A., Li, C., Doherty, R., and Wild, O.: Changes in the relationship between ENSO and the East Asian winter monsoon under global warming, Environ. Res. Lett., 15, 124056, https://doi.org/10.1088/1748-9326/abca63, 2020.
Jin, F. and An, S.: Thermocline and zonal advective feedbacks within the equatorial ocean recharge oscillator model for ENSO, Geophys. Res. Lett., 26, 2989–2992, https://doi.org/10.1029/1999GL002297, 1999.
Jin, F. F.: An equatorial ocean recharge paradigm for ENSO, Part II: A stripped-down coupled model, J. Atmos. Sci., 54, 830–847, https://doi.org/10.1175/1520-0469(1997)054<0830:AEORPF>2.0.CO;2, 1997.
Jiang, W., Gong, H., Huang, P., Wang, L., Huang, G., and Hu, L.: Biases and improvements of the ENSO-East Asian winter monsoon teleconnection in CMIP5 and CMIP6 models, Clim. Dynam., 59, 2467–2480, https://doi.org/10.1007/s00382-022-06220-5, 2022.
Jiang, Y., Yang, X. Q., Liu, X., Yang, D., Sun, X., Wang, M., Ding, A., Wang, T., and Fu, C.: Anthropogenic aerosol effects on East Asian winter monsoon: The role of black carbon-induced Tibetan Plateau warming, J. Geophys. Res.-Atmos., 122, 5883–5902, https://doi.org/10.1002/2016JD026237, 2017.
Kay, J. E., Deser, C., Phillips, A., Mai, A., Hannay, C., Strand, G., Arblaster, J. M., Bates, S. C., Danabasoglu, G., Edwards, J., and Holland, M.: The Community Earth System Model (CESM) large ensemble project: A community resource for studying climate change in the presence of internal climate variability, B. Am. Meteorol. Soc., 96, 1333–1349, https://doi.org/10.1175/BAMS-D-13-00255.1, 2015.
Kim, S. T., Cai, W., Jin, F. F., and Yu, J. Y.: ENSO stability in coupled climate models and its association with mean state, Clim. Dynam., 42, 3313–3321, https://doi.org/10.1007/s00382-013-1833-6, 2014.
Kobayashi, S., Ota, Y., Harada, Y., Ebita, A., Moriya, M., Onoda, H., Onogi, K., Kamahori, H., Kobayashi, C., Endo, H., and Miyaoka, K.: The JRA-55 reanalysis: General specifications and basic characteristics, J. Meteorol. Soc. Jpn., 93, 5–48, https://doi.org/10.2151/jmsj.2015-001, 2015.
Lewinschal, A., Ekman, A. M. L., and Körnich, H.: The role of precipitation in aerosol-induced changes in northern hemisphere wintertime stationary waves, Clim. Dynam., 41, 647–661, https://doi.org/10.1007/s00382-012-1622-7, 2013.
Li, F. and Wang, H.: Autumn sea ice cover, winter Northern Hemisphere annular mode, and winter precipitation in Eurasia, J. Climate, 26, 3968–3981, https://doi.org/10.1175/JCLI-D-12-00380.1, 2012.
Li, J., Carlson, B. E., Yung, Y. L., Lv, D., Hansen, J., Penner, J. E., Liao, H., Ramaswamy, V., Kahn, R. A., Zhang, P., and Dubovik, O.: Scattering and absorbing aerosols in the climate system, Nature Reviews Earth and Environment, 3, 363–379, https://doi.org/10.1038/s43017-022-00296-7, 2022.
Liao, H., Chang, W. Y., Yang, Y.: Climatic effects of air pollutants over China: A review, Adv. Atmos. Sci., 32, 115–139, https://doi.org/10.1007/s00376-014-0013-x, 2015.
Lian, T. and Chen, D.: The essential role of early-spring westerly wind burst in generating the centennial extreme 1997/98 El Niño, J. Climate, 1, 1–38, https://doi.org/10.1175/JCLI-D-21-0010.1, 2021.
Lian, T., Chen, D., Ying, J., Huang, P., and Tang, Y.: Tropical Pacific trends under global warming: El Niño-like or La Niña-like?, Natl. Sci. Rev., 5, 810–812, https://doi.org/10.1093/nsr/nwy134, 2018.
Liu, L., Shawki, D., Voulgarakis, A., Kasoar, M., Samset, B. H., Myhre, G., Forster, P. M., Hodnebrog, Ø., Sillmann, J., Aalbergsjø, S. G., and Boucher, O.: A PDRMIP multimodel study on the impacts of regional aerosol forcings on global and regional precipitation, J. Climate, 31, 4429–4447, https://doi.org/10.1175/JCLI-D-17-0439.1, 2018.
Liu, Y., Sun, J. R., and Yang, B.: The effects of black carbon and sulphate aerosols in China regions on East Asia monsoons, Tellus B, 61, 642–656, https://doi.org/10.1111/j.1600-0889.2009.00427.x, 2009.
Liu, Z., Ming, Y., Wang, L., Bollasina, M., Luo, M., Lau, N. C., and Yim, S. H. L.: A model investigation of aerosol-induced changes in the east Asian winter monsoon, Geophys. Res. Lett., 46, 10186–10195, https://doi.org/10.1029/2019GL084228, 2019.
Liu, Z., Bollasina, M. A., and Wilcox, L. J.: Impact of Asian aerosols on the summer monsoon strongly modulated by regional precipitation biases, Atmos. Chem. Phys., 24, 7227–7252, https://doi.org/10.5194/acp-24-7227-2024, 2024.
McPhaden, M. J.: Genesis and evolution of the 1997–98 El Nino, Science, 283, 950–954, https://doi.org/10.1126/science.283.5404.950, 1999.
Myhre, G., Shindell, D., Breón, F.-M., Collins, W., Fuglestvedt, J., Huang, J., Koch, D., Lamarque, J.-F., Lee, D., Mendoza, B., Nakajima, T., Robock, A., Stephens, G., Takemura, T., and Zhang, H.: Anthropogenic and Natural Radiative Forcing, in: Climate Change 2013, The Physical Science Basis, Contribution of Working Group I to the Fifth Assessment Report of the Intergovernmental Panel on Climate Change, edited by: Stocker, T. F., Qin, D., Plattner, G.-K., Tignor, M., Allen, S. K., Boschung, J., Nauels, A., Xia, Y., Bex, V., and Midgley, P. M., Cambridge University Press, Cambridge, New York, 659–740, https://doi.org/10.1017/CBO9781107415324.018, 2013.
Myhre, G., Forster, P. M., Samset, B. H., Hodnebrog, Ø., Sillmann, J., Aalbergsjø, S. G., Andrews, T., Boucher, O., Faluvegi, G., Fläschner, D., and Iversen, T.: PDRMIP: A precipitation driver and response model intercomparison project—Protocol and preliminary results, B. Am. Meteorol. Soc., 98, 1185–1198, https://doi.org/10.1175/BAMS-D-16-0019.1, 2017.
Navarro, J. C. A., Ekman, A. M. L., Pausata, F. S. R., Lewinschal, A., Varma, V., Seland, Ø., Gauss, M., Iversen, T., Kirkevåg, A., Riipinen, I., and Hansson, H. C.: Future Response of Temperature and Precipitation to Reduced Aerosol Emissions as Compared with Increased Greenhouse Gas Concentrations, J. Climate, 30, 939–954, https://doi.org/10.1175/JCLI-D-16-0466.1, 2017.
Peng, Q., Xie, S. P., and Deser, C.: Collapsed upwelling projected to weaken ENSO under sustained warming beyond the twenty-first century, Nat. Clim. Chang., 14, 815–822, https://doi.org/10.1038/s41558-024-02061-8, 2024.
Persad, G. G.: The dependence of aerosols' global and local precipitation impacts on the emitting region, Atmos. Chem. Phys., 23, 3435–3452, https://doi.org/10.5194/acp-23-3435-2023, 2023.
Persad, G. G., Samset, B. H., and Wilcox, L. J.: Aerosols must be included in climate risk assessments, Nature, 611, 662–664, https://doi.org/10.1038/d41586-022-03763-9, 2022.
Power, S., Delage, F., Chung, C., Kociuba, G., and Keay, K.: Robust twenty-first-century projections of El Niño and related precipitation variability, Nature, 502, 541–545, https://doi.org/10.1038/nature12580, 2013.
Rayner, N. A., Parker, D. E., Horton, E. B., Folland, C. K., Alexander, L. V., and Rowell, D. P.: Global analyses of sea surface temperature, sea ice, and night marine air temperature since the late nineteenth century, J. Geophys. Res., 108, 4407, https://doi.org/10.1029/2002JD002670, 2003.
Ramanathan, V., Chung, C., Kim, D., Bettge, T., Buja, L., Kiehl, J. T., Washington, W. M., Fu, Q., Sikka, D. R., and Wild, M.: Atmospheric brown clouds: impacts on South Asian climate and hydrological cycle, P. Natl. Acad. Sci. USA, 102, 5326–5333, https://doi.org/10.1073/pnas.0500656102, 2005.
Rashid, H. A.: Forced changes in El Niño–Southern Oscillation due to global warming and the associated uncertainties in ACCESS-ESM1.5 large ensembles, Front. Clim., 4, 954449, https://doi.org/10.3389/fclim.2022.954449, 2022.
Rashid, H. A., Hirst, A. C., and Marsland, S. J.: An atmospheric mechanism for ENSO amplitude changes under an abrupt quadrupling of CO2 concentration in CMIP5 models, Geophys. Res. Lett., 43, 1687–1694, https://doi.org/10.1002/2015GL066768, 2016.
Rotstayn, L. D. and Lohmann, U.: Tropical Rainfall Trends and the Indirect Aerosol Effect, J. Climate, 15, 2103–2116, https://doi.org/10.1175/1520-0442(2002)015<2103:TRTATI>2.0.CO;2, 2002.
Shindell, D. T., Voulgarakis, A., Faluvegi, G., and Milly, G.: Precipitation response to regional radiative forcing, Atmos. Chem. Phys., 12, 6969–6982, https://doi.org/10.5194/acp-12-6969-2012, 2012.
Samset, B. H., Myhre, G., Forster, P. M., Hodnebrog, Ø., Andrews, T., Faluvegi, G., Flaeschner, D., Kasoar, M., Kharin, V., Kirkevåg, A., and Lamarque, J. F.: Fast and slow precipitation responses to individual climate forcers: A PDRMIP multimodel study, Geophys. Res. Lett., 43, 2782–2791, https://doi.org/10.1002/2016GL068064, 2016.
Song, F. F., Zhou, T. T., and Qian, Y.: Responses of East Asian summer monsoon to natural and anthropogenic forcings in the 17 latest CMIP5 models, Geophys. Res. Lett., 41, 596–603, https://doi.org/10.1002/2013GL058705, 2014.
Takemura, T., Egashira, M., Matsuzawa, K., Ichijo, H., O'ishi, R., and Abe-Ouchi, A.: A simulation of the global distribution and radiative forcing of soil dust aerosols at the Last Glacial Maximum, Atmos. Chem. Phys., 9, 3061–3073, https://doi.org/10.5194/acp-9-3061-2009, 2009.
Timmermann, A., An, S. I., Kug, J. S., Jin, F. F., Cai, W., Capotondi, A., Cobb, K. M., Lengaigne, M., McPhaden, M. J., Stuecker, M. F., and Stein, K.: El Niño–southern oscillation complexity, Nature, 559, 535–545, https://doi.org/10.1038/s41586-018-0252-6, 2018.
Vecchi, G. A., Soden, B. J., Wittenberg, A. T., Held, I. M., Leetmaa, A., and Harrison, M. J.: Weakening of tropical Pacific atmospheric circulation due to anthropogenic forcing, Nature, 441, 73–76, https://doi.org/10.1038/nature04744, 2006.
Voigt, A., Pincus, R., Stevens, B., Bony, S., Boucher, O., Bellouin, N., Lewinschal, A., Medeiros, B., Wang, Z., and Zhang, H.: Fast and slow shifts of the zonal-mean intertropical convergence zone in response to an idealized anthropogenic aerosol, J. Adv. Model. Earth Sy., 9, 870–892, https://doi.org/10.1002/2016MS000902, 2017.
Walters, D. N., Williams, K. D., Boutle, I. A., Bushell, A. C., Edwards, J. M., Field, P. R., Lock, A. P., Morcrette, C. J., Stratton, R. A., Wilkinson, J. M., Willett, M. R., Bellouin, N., Bodas-Salcedo, A., Brooks, M. E., Copsey, D., Earnshaw, P. D., Hardiman, S. C., Harris, C. M., Levine, R. C., MacLachlan, C., Manners, J. C., Martin, G. M., Milton, S. F., Palmer, M. D., Roberts, M. J., Rodríguez, J. M., Tennant, W. J., and Vidale, P. L.: The Met Office Unified Model Global Atmosphere 4.0 and JULES Global Land 4.0 configurations, Geosci. Model Dev., 7, 361–386, https://doi.org/10.5194/gmd-7-361-2014, 2014.
Wang, B. and An, S. A.: Mechanism for decadal changes of ENSO behavior: Roles of background wind changes, Clim. Dynam., 18, 475–486, https://doi.org/10.1007/s00382-001-0189-5, 2002.
Wang, B., Wu, R., and Fu, X.: Pacific–East Asian teleconnection: how does ENSO affect East Asian climate?, J. Climate, 13, 1517–1536, https://doi.org/10.1175/1520-0442(2000)013<1517:PEATHD>2.0.CO;2, 2000.
Wang, F. K.: Confidence interval for the mean of non-normal data, Qual. Reliab. Eng. Int., 17, 257–267, https://doi.org/10.1002/qre.400, 2001.
Wang, G., Cai, W., Gan, B., Wu, L., Santoso, A., Lin, X., Chen, Z., and McPhaden, M. J.: Continued increase of extreme El Niño frequency long after 1.5 °C warming stabilization, Nature Clim. Change, 7, 568–572, https://doi.org/10.1038/nclimate3351, 2017.
Wang, H., He, S., and Liu, J.: Present and future relationship between the East Asian winter monsoon and ENSO: Results of CMIP5, J. Geophys. Res.-Oceans, 118, 5222–5237, https://doi.org/10.1002/jgrc.20332, 2013.
Wang, P., Yang, Y., Xue, D., Ren, L., Tang, J., Leung, L. R., and Liao, H.: Aerosols overtake greenhouse gases causing a warmer climate and more weather extremes toward carbon neutrality, Nat. Commun., 14, 7257, https://doi.org/10.1038/s41467-023-42891-2, 2023.
Wang, Z., Wu, C.-P., Chang, J., Liu, J., Li, J., and Zhou, T.: Another look at interannual-to-interdecadal variations of the East Asian winter monsoon: The northern and southern temperature modes, J. Climate, 23, 1495–1512, https://doi.org/10.1175/2009JCLI3243.1, 2010.
Wang, Z., Wu, R., Gong, H., Jia, X., and Dai, P.: What determine the performance of the ENSO-East Asian winter monsoon relationship in CMIP6 models?, J. Geophys. Res.-Atmos., 127, e2021JD036227, https://doi.org/10.1029/2021JD036227, 2022a.
Wang, Z.-Z. and Wu, R.: Individual and combined impacts of ENSO and East Asian winter monsoon on the South China Sea cold tongue intensity, Clim. Dynam., 56, 3995–4012, 2021.
Wang, Z.-Z., Wu, R., and Wang, Y.-Q.: Impacts of the East Asian winter monsoon on winter precipitation variability over East Asia-western North Pacific, Clim. Dynam., 58, 3041–3055, 2022b.
Watanabe, M., Suzuki, T., O’ishi, R., Komuro, Y., Watanabe, S., Emori, S., Takemura, T., Chikira, M., Ogura, T., Sekiguchi, M. and Takata, K.: Improved climate simulation by MIROC5: mean states, variability, and climate sensitivity, J. Climate, 23, 6312–6335, https://doi.org/10.1175/2010JCLI3679.1, 2010.
Westervelt, D. M., Conley, A. J., Fiore, A. M., Lamarque, J.-F., Shindell, D. T., Previdi, M., Mascioli, N. R., Faluvegi, G., Correa, G., and Horowitz, L. W.: Connecting regional aerosol emissions reductions to local and remote precipitation responses, Atmos. Chem. Phys., 18, 12461–12475, https://doi.org/10.5194/acp-18-12461-2018, 2018.
Westervelt, D. M., Mascioli, N. R., Fiore, A. M., Conley, A. J., Lamarque, J.-F., Shindell, D. T., Faluvegi, G., Previdi, M., Correa, G., and Horowitz, L. W.: Local and remote mean and extreme temperature response to regional aerosol emissions reductions, Atmos. Chem. Phys., 20, 3009–3027, https://doi.org/10.5194/acp-20-3009-2020, 2020.
Wilcox, L. J., Dunstone, N., Lewinschal, A., Bollasina, M., Ekman, A. M. L., and Highwood, E. J.: Mechanisms for a remote response to Asian anthropogenic aerosol in boreal winter, Atmos. Chem. Phys., 19, 9081–9095, https://doi.org/10.5194/acp-19-9081-2019, 2019.
Wilcox, L. J., Allen, R. J., Samset, B. H., Bollasina, M. A., Griffiths, P. T., Keeble, J., Lund, M. T., Makkonen, R., Merikanto, J., O'Donnell, D., Paynter, D. J., Persad, G. G., Rumbold, S. T., Takemura, T., Tsigaridis, K., Undorf, S., and Westervelt, D. M.: The Regional Aerosol Model Intercomparison Project (RAMIP), Geosci. Model Dev., 16, 4451–4479, https://doi.org/10.5194/gmd-16-4451-2023, 2023.
Wilks, D.: “The stippling shows statistically significant grid points”: How research results are routinely overstated and overinterpreted, and what to do about it, B. Am. Meteorol. Soc., 97, 2263–2273, https://doi.org/10.1175/BAMS-D-15-00267.1, 2016.
Wu, R., Chen, W., Wang, G., and Hu, K.-M.: Relative contribution of ENSO and East Asian winter monsoon to the South China Sea SST anomalies during ENSO decaying years, J. Geophys. Res., 119, 5046–5064, 2014.
Xuan, Z., Zhang, W., Jiang, F., Stuecker, M. F., and Jin, F. F.: Seasonal-varying characteristics of tropical Pacific westerly wind bursts during El Niño due to annual cycle modulation, Clim. Dynam., 62, 299–314, https://doi.org/10.1007/s00382-023-06907-3, 2024.
Yan, Z., Wu, B., Li, T., Collins, M., Clark, R., Zhou, T., Murphy, J., and Tan, G.: Eastward shift and extension of ENSO-induced tropical precipitation anomalies under global warming, Science Advances, 6, eaax4177, https://doi.org/10.1126/sciadv.aax4177, 2020.
Yang, S., Lau, K.-M., and Kim, K.-M.: Variations of the East Asian jet stream and Asian–Pacific–American winter climate anomalies, J. Climate, 15, 306–325, https://doi.org/10.1175/1520-0442(2002)015<0306:VOTEAJ>2.0.CO;2, 2002.
Yang, Y., Gao, M., Xie, N., and Gao, Z.: Relating anomalous large-scale atmospheric circulation patterns to temperature and precipitation anomalies in the East Asian monsoon region, Atmos. Res., 232, 104679, https://doi.org/10.1016/j.atmosres.2019.104679, 2020.
Ying, J., Huang, P., Lian, T., and Chen, D.: Intermodel uncertainty in the change of ENSO's amplitude under global warming: role of the response of atmospheric circulation to SST anomalies, J. Climate, 32, 369–383, https://doi.org/10.1175/JCLI-D-18-0456.1, 2019.
Zebiak, S. E. and Cane, M. A.: A model El Niño–southern oscillation, Mon. Weather Rev., 115, 2262–2278, https://doi.org/10.1175/1520-0493(1987)115<2262:AMENO>2.0.CO;2, 1987.
Zhang, R., Sumi, A., and Kimoto, M.: Impact of El Niño on the East Asian monsoon a diagnostic study of the '86/87 and '91/92 events, J. Meteorol. Soc. Jpn., 74, 49–62, https://doi.org/10.2151/jmsj1965.74.1_49, 1996.
Zhang, H., Chen, S., Zhong, J., Zhang, S., Zhang, Y., Zhang, X., Li, Z., and Zeng, X. C.: Formation of aqueous-phase sulfate during the haze period in China: Kinetics and atmospheric implications, Atmos. Environ., 177, 93–99, https://doi.org/10.1016/j.atmosenv.2018.01.017, 2018.
Zhao, S. and Suzuki, K.: Differing impacts of black carbon and sulfate aerosols on global precipitation and the ITCZ location via atmosphere and ocean energy perturbations, J. Climate, 32, 5567–5582, https://doi.org/10.1175/JCLI-D-18-0616.1, 2019.
Zheng, X.-T., Xie, S.-P., Lv, L. H., and Zhou, Z. Q.: Intermodel uncertainty in ENSO amplitude change tied to Pacific Ocean warming pattern, J. Climate, 29, 7265–7279, https://doi.org/10.1175/JCLI-D-16-0039.1, 2016.
Zhou, L.-T. and Wu, R.: Respective impacts of the East Asian winter monsoon and ENSO on winter rainfall in China, J. Geophys. Res., 115, D02107, https://doi.org/10.1029/2009JD012502, 2010.
Zhou, B., Gu, L., Ding, Y., Shao, L., Wu, Z., Yang, X., Li, C., Li, Z., Wang, X., Cao, Y., and Zeng, B.: The great 2008 Chinese ice storm: its socioeconomic–ecological impact and sustainability lessons learned, B. Am. Meteorol. Soc., 92, 47–60, https://doi.org/10.1175/2010BAMS2857.1, 2011.
Zuo, Z., Li, M., An, N., Xiao, D.: Variations of widespread extreme cold and warm days in winter over China and their possible causes, Science China Earth Sciences, 65, 337–350, https://doi.org/10.1007/s11430-021-9836-0, 2022.
- Abstract
- Introduction
- Data and methodology
- Impacts of Asian aerosols on the PEA pattern and the EAWM interannual variability
- The response of ENSO amplitude to increased Asian aerosols
- Changes in the tropical Pacific mean state and ocean–atmosphere feedbacks
- Summary and conclusions
- Code availability
- Data availability
- Author contributions
- Competing interests
- Disclaimer
- Acknowledgements
- Financial support
- Review statement
- References
- Supplement