the Creative Commons Attribution 4.0 License.
the Creative Commons Attribution 4.0 License.
 | 25 Jun 2025
Combined CO2 measurement record indicates Amazon forest carbon uptake is offset by savanna carbon release
Saqr Munassar
Thomas Koch
Danilo Custodio
Luana S. Basso
Shujiro Komiya
Jost V. Lavric
David Walter
Manuel Gloor
Giordane Martins
Stijn Naus
Gerbrand Koren
Ingrid T. Luijkx
Stijn Hantson
John B. Miller
Wouter Peters
Christian Rödenbeck
Christoph Gerbig
In tropical South America there has been substantial progress in atmospheric monitoring capacity, but the region still has a limited number of continental atmospheric stations relative to its large area, hindering net carbon flux estimates using atmospheric inversions. In this study, we use dry-air CO2 mole fractions measured at the Amazon Tall Tower Observatory (ATTO) and airborne vertical CO2 profiles in an atmospheric inversion system to estimate net carbon exchange in tropical South America from 2010 to 2018. Given previous knowledge of a bias due to undried samples in the airborne vertical profiles, we calculate the effect of this systematic uncertainty in our inverse estimates and propose a water-vapor correction to the airborne CO2 profiles. We focus our analysis on the biogeographic Amazon and its neighboring “Cerrado and Caatinga” biomes. Including the water-vapor correction changes the posterior ensemble median from −0.33 to −0.04 PgC yr−1 with a posterior uncertainty of 0.33 PgC yr−1 for the Amazon and for the Cerrado and Caatinga from 0.31 to 0.50 PgC yr−1, with an uncertainty of 0.24 PgC yr−1. Our estimates of carbon exchange include the contributions from both net vegetation exchange and release from fires. Assuming that the correction brings the observational data closer to the truth implies that the Amazon is a weaker sink of carbon and that the Cerrado and Caatinga is a larger source. We do not find a strong spatial shift of fluxes within the biogeographic Amazon due to the correction, nor do we find a strong impact on the interannual variations. Finally, to further reduce the uncertainty in regional carbon balance estimates in tropical South America, we call for an expansion of the atmospheric monitoring network on the continent, mainly in the Amazon–Andes foothills.
- Article
(6820 KB) - Full-text XML
- BibTeX
- EndNote


Land ecosystems constitute approximately half of the atmospheric CO2 sink (Friedlingstein et al., 2022). However, they remain the most uncertain (Ballantyne et al., 2012) and variable (Le Quéré et al., 2018) component of the global carbon cycle. Numerous independent studies confirm that tropical land ecosystems drive most of the interannual variability (IAV) in the net land carbon flux (Keeling and Revelle, 1985; Keeling et al., 1995; Bousquet et al., 2000; Jung et al., 2011; Peylin et al., 2013; Jung et al., 2017; Rödenbeck et al., 2018a; Bastos et al., 2020), which is linked to the atmospheric CO2 growth rate (Cox et al., 2013; Wang et al., 2013; Piao et al., 2020). Furthermore, tropical ecosystems store substantial carbon reserves in aboveground ground living biomass (Brando et al., 2019) that can be released rapidly, further amplifying the CO2 growth rate. In other words, the accumulation of CO2 in the atmosphere depends to a large extent on the dynamics of carbon uptake and release in tropical ecosystems. In particular, South America plays a pivotal role in both aspects, uptake and release, as it hosts the Amazon rainforest, which contains 49 % of tropical biomass carbon (Saatchi et al., 2011) and encompasses a third of the continent landmass (Goulding et al., 2003).
The balance between total uptake and release of carbon results in the FNetLand, which consists of the net biome exchange (NBE) and the release of carbon from fossil fuel combustion. The NBE is composed of vegetation-related fluxes, gross primary productivity (GPP) and terrestrial ecosystem respiration (TER), disturbance-related emission from biomass burning and degradation (Ffire), and river CO2 outgassing (Friver). Estimates of FNetLand for tropical regions (Gurney et al., 2002; Rödenbeck et al., 2003; Peylin et al., 2013; Liu et al., 2017; Gloor et al., 2018; Palmer et al., 2019; Crowell et al., 2019; Peiro et al., 2022) and specifically for the Amazon region (Molina et al., 2015; Alden et al., 2016; Gloor et al., 2018; Wang et al., 2023) have been conducted previously using top-down atmospheric global inversions, typically operating under the assumption that sources from fires and fossil fuels are separately constrained or well known. Top-down studies have shed light on how fire influences the net carbon balance in specific years (2010–2011) (Gatti et al., 2014; van der Laan-Luijkx et al., 2015), the spatial differences of NBE in areas within the Amazon for 2010 to 2012 (Alden et al., 2016), the response of the Amazon carbon cycle relative to other tropical regions in the 2015/2016 El Niño event (Liu et al., 2017; Gloor et al., 2018; Crowell et al., 2019), and the main drivers of the NBE anomaly in 2015/2016 in the Amazon using satellite-constrained inverse estimates (Wang et al., 2023). At the time of these studies, the available data allowed only analyses of the response to a drought year and normal/wet years. The longer measurement records of in situ CO2 measurements at the Amazon Tall Tower Observatory (ATTO) (Botía et al., 2022) and the vertical CO2 profiles in the Amazon region (Gatti et al., 2021a) now enable the community to further examine interannual and seasonal variations using atmospheric inversions (Koren, 2020; Basso et al., 2023) or column budget techniques (Gatti et al., 2021a, 2023).
Previous results using a column budget technique suggested that the FNetLand of the eastern Amazon was on average a carbon source from 2010 to 2018, mainly explained by fire emissions, but also by a vegetation-related source in the southeastern part of the Amazon forest (Gatti et al., 2021a). The authors attribute the carbon source to the combined impact of temperature and precipitation anomalies on vegetation, affecting its carbon uptake capacity. Basso et al. (2023) reported a smaller carbon source compared to Gatti et al. (2021a) for the same period (2010–2018), using similar CO2 observational constraints but using an atmospheric transport inversion and integrating additional CO observational constraints on fire emissions. Both studies agree on the calculation of a net carbon source (positive FNetLand) and a small vegetation-related carbon sink after subtracting fires and fossil fuels (or assuming them negligible). In recent years, a potential bias in CO2 observations collected from the aircraft network using nondried air samples has been recognized (Baier et al., 2020; Gatti et al., 2023; Basso et al., 2023). The presence of water vapor in the collected samples would lead to a loss of CO2 in condensed water in the pressurized flasks. This can lead to an underestimation of fluxes when using this dataset as a constraint on the amount of CO2 that the Amazon exchanges, with a possibility for seasonal biases due to the higher water vapor present during the wet season. However, the effect of water vapor in the aircraft samples and how that propagates to optimized fluxes has not been quantified, adding additional uncertainty to the Amazon-wide carbon budget.
Studies based on plots in old-growth forests found that the Amazon represents a small carbon sink with a decreasing trend over the last 30 years (Brienen et al., 2015; Hubau et al., 2020). Although these studies are broadly consistent with the existence of an Amazon-wide vegetation carbon sink and net biomass growth in old-growth plots, substantial uncertainties persist regarding their magnitudes. This agrees with a recent synthesis by Rosan et al. (2024), who reported an Amazon-wide carbon sink of 342 ± 192 TgC yr−1 from vegetation uptake over the period 2010–2018, albeit with considerable interannual variability. Furthermore, interannual variability of deforestation fires (van der Werf et al., 2010) and degradation (Assis et al., 2020) carbon sources are particularly important for the Amazon region (Aragão et al., 2018; Matricardi et al., 2020; Qin et al., 2021; Kruid et al., 2021; Lapola et al., 2023). In the years after 2017 to 2022, clear-cut deforestation increased significantly in Brazil (Alencar et al., 2019; Silva Junior et al., 2021), not only releasing massive amounts of carbon (Assis et al., 2020) but also exposing larger areas of forest fragments to degradation (Matricardi et al., 2020) and inducing indirect carbon losses by edge effects (Silva Junior et al., 2020). In 2023, while deforestation decreased by 22 % relative to 2022, there was a disproportionate rise of wildfires in old-growth forests (Mataveli et al., 2024). Such threats to standing forests pose a risk of gradually releasing the carbon stock of the Amazon, which amounts to 150–200 PgC (Saatchi et al., 2007; Malhi et al., 2009; Marques et al., 2017; Baccini et al., 2017). Despite the attention to deforestation and degradation in the Amazon, vegetation loss has largely been overlooked in the Cerrado biome (da Conceição Bispo et al., 2024), where agricultural expansion is more widespread (Rodrigues et al., 2022). By 2019, 46 % of the original land cover in the Cerrado was converted to pastures and crops (MapBiomas, 2020). Fires in the Cerrado occur naturally and are crucial for ecosystem functioning, but agricultural expansion has brought more frequent and intense fires, threatening the aboveground biomass and creating the need for near-real-time monitoring (Pletsch et al., 2022). Although most of the studies have investigated the carbon exchange of the Amazon, they each had different definitions in area, be it the biogeographic or a selection of sub-regions defined by Eva et al. (2005). Moreover, a perspective including the neighboring biomes (i.e., “Cerrado and Caatinga”) is lacking.
In this study, we use the CarboScope Global and Regional inversion system to assimilate the 2010–2018 airborne CO2 profile record and the continuous and long-term CO2 record at the Amazon Tall Tower Observatory (ATTO). We build on previous studies using the CarboScope Regional system in Europe (Kountouris et al., 2018b, a; Munassar et al., 2021) to explore its ability to constrain the FNetLand at the continental scale over a larger domain but with a sparser observational network. The study is structured as follows. First, we aim to quantify where the atmospheric inversion using this set of atmospheric data can provide a constraint based on uncertainty reduction. Second, a sub-continental analysis of the carbon budget with and without including systematic uncertainties in measured mole fractions is presented, with a strong focus on the biogeographic Amazon but not limited to it. With this study, we provide a broad perspective on carbon exchange in tropical South America, going beyond the Amazon biome and highlighting where we need to expand our observational efforts to reduce the uncertainty in carbon exchange estimates in the region.
2.1 CarboScope Regional inversion system
2.1.1 Two-step scheme description
The version of the CarboScope Global inversion system used here is described in detail by Rödenbeck et al. (2018b). To refine the resolution of fluxes and atmospheric transport within our study area, we use the two-step scheme described in several publications previously (Rödenbeck et al., 2009; Trusilova et al., 2010; Kountouris et al., 2018b; Munassar et al., 2021). Our inversion setup largely follows that of Kountouris et al. (2018a), but we use an isotropic exponential decay for the spatial error structure, mainly because in our domain, unlike in mid-latitudes, the climatic gradients are similar in both latitude and longitude.
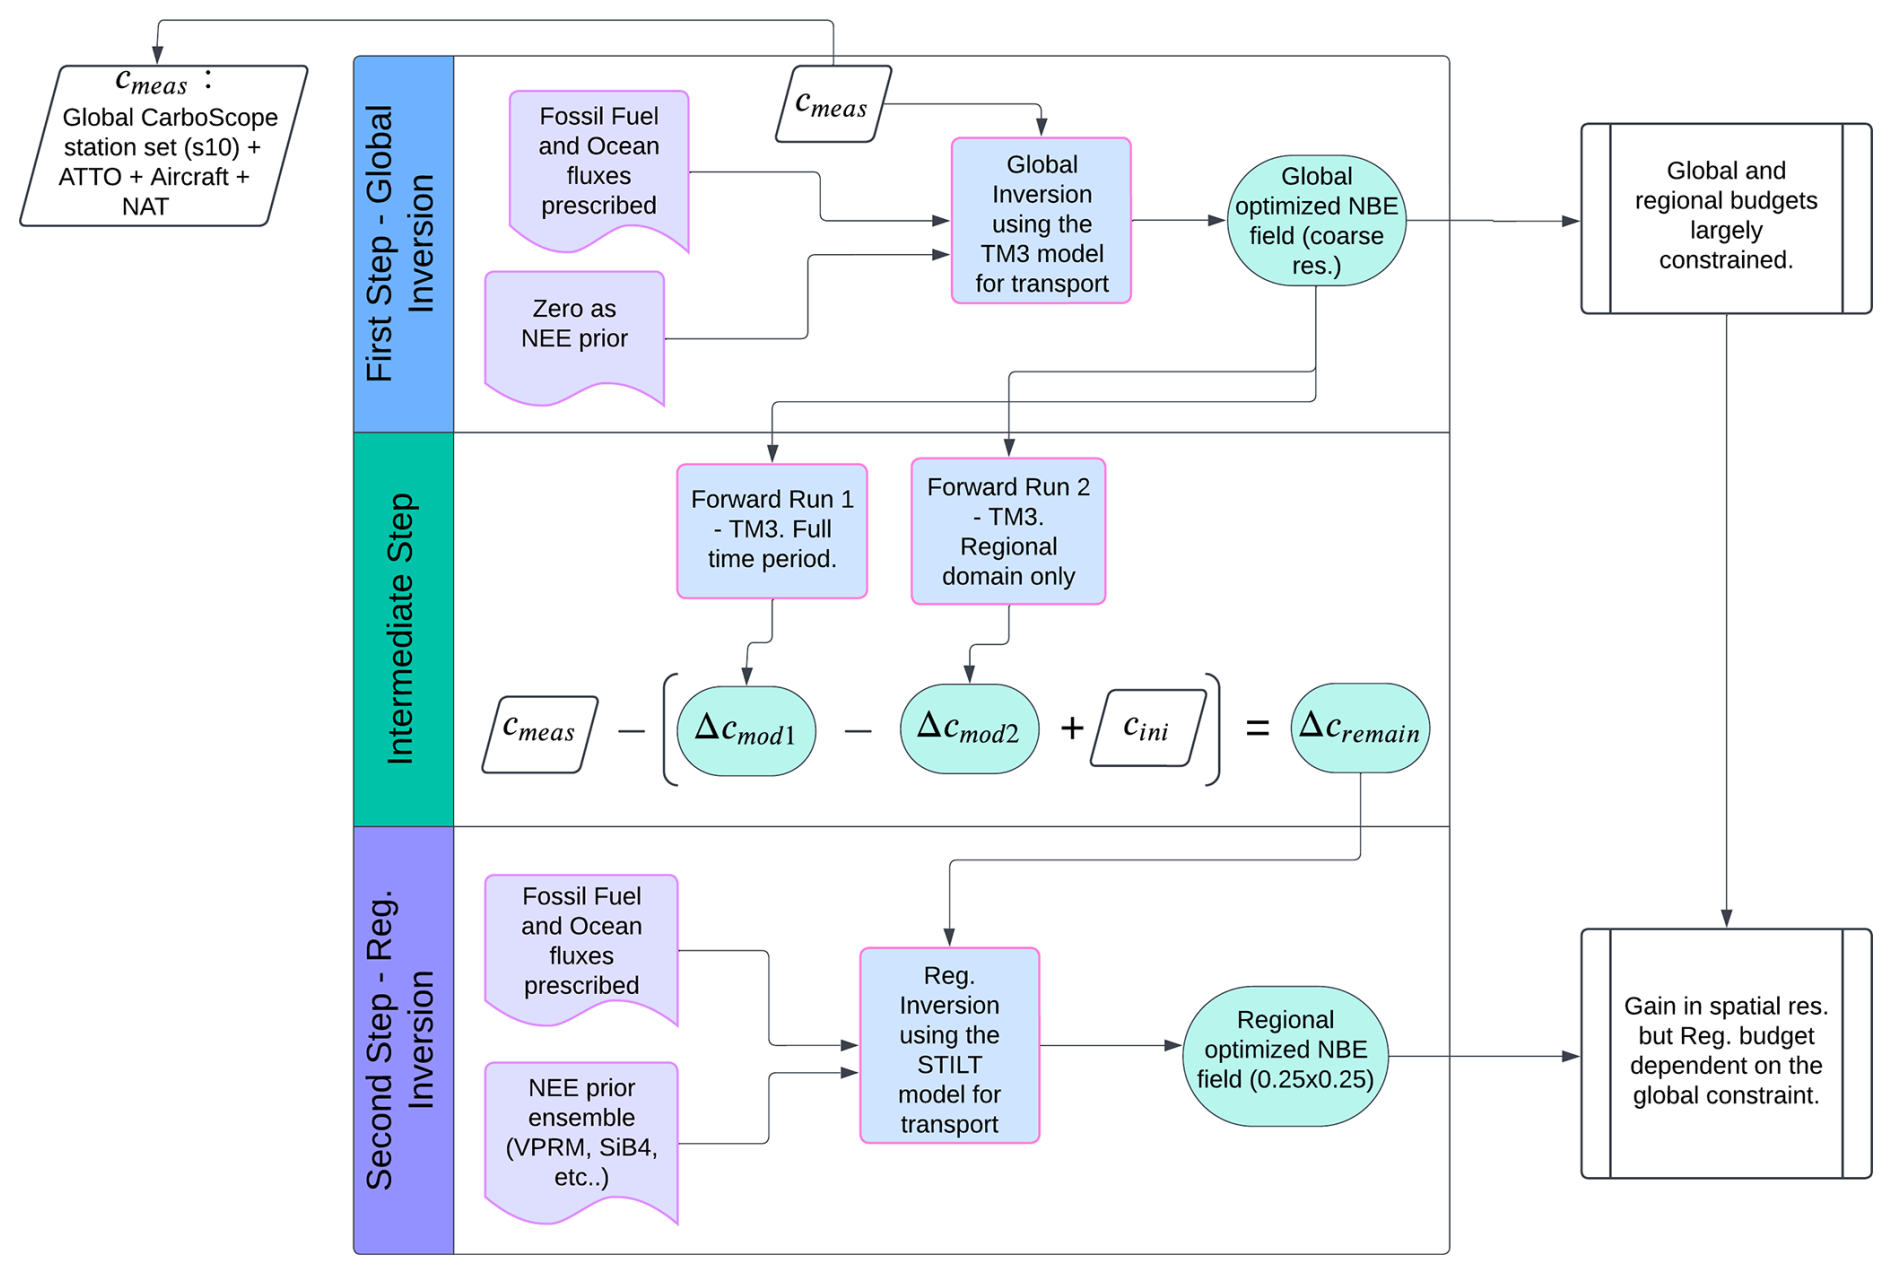
Figure 1CarboScope Regional Inversion two-step scheme (Rödenbeck et al., 2009; Trusilova et al., 2010) flow diagram showing the inputs (purple polygons) to the processes (blue squares) and their specific output (green circles).
In the two-step scheme (see Fig. 1), two atmospheric transport models with different spatial resolutions are used. In step 1, a global inversion is performed using the CarboScope Global inversion system (Rödenbeck et al., 2018b) to obtain an optimized NBE flux field having ocean and fossil fuel fluxes prescribed. This global inversion is performed on a coarse global scale using the TM3 atmospheric transport model (Heimann and Körner, 2003) at 4×5° resolution driven by the NCEP reanalysis meteorological fields (Kalnay et al., 1996). Using that optimized NBE flux field and the same atmospheric transport setup, simulated mole fractions increments for all sites are obtained (i.e., the s10v2022 station set as well as the South American stations; see Sect. 2.1.4), except for the sites left for independent evaluation. These “forward” runs represent an intermediate step and are done twice; see Eq. (1) and Fig. 1 (adapted from Rödenbeck et al. (2009)). The first one is performed using TM3 at the coarse global resolution and for the entire time period of the global inversion. The second forward run is performed using NBE fluxes at coarse spatial resolution, only for the regional domain (i.e., with zeros outside the regional domain) tropical South America and the desired period of interest (i.e., 2010–2018). Both forward runs result in simulated mole fraction increments (Δcmod1 and Δcmod2), and their difference corresponds to the far-field contribution from fluxes outside of the regional domain. An initial condition (cini) that corresponds to a well-mixed atmosphere with a given initial tracer mole fraction is then added to the far-field contribution. All this together is subtracted from the measured mole fractions at the sites within the domain of interest. This difference represents a “remaining mole fraction” (Δcremain), corresponding to signals from fluxes within the regional domain, as defined by Rödenbeck et al. (2009).
In step 2, the Δcremain is assimilated in a regional inversion at high resolution (0.25 × 0.25°) using the model STILT (Lin et al., 2003). STILT is driven by the ECMWF Integrated Forecasting System (IFS) (following the contemporary IFS cycle development; for more information, see https://www.ecmwf.int/en/publications/ifs-documentation, last access: 10 January 2025). At each measurement location and time () in the regional domain, we released an ensemble of 100 particles back in time (10 d) to calculate the surface influence on the observations. The surface influence, with units of ppm (µmol m−2 s−1)−1, provides the link between measured mole fractions and the prior surface fluxes. A set of different prior fluxes (representing a prior ensemble) is used (see Sect. 2.1.6), and the regional inversion is performed for each prior ensemble member individually. The domain in this study extends from 28.875° S to 13.875° N and from 83.875 to 34.125° W; see Fig. 2.
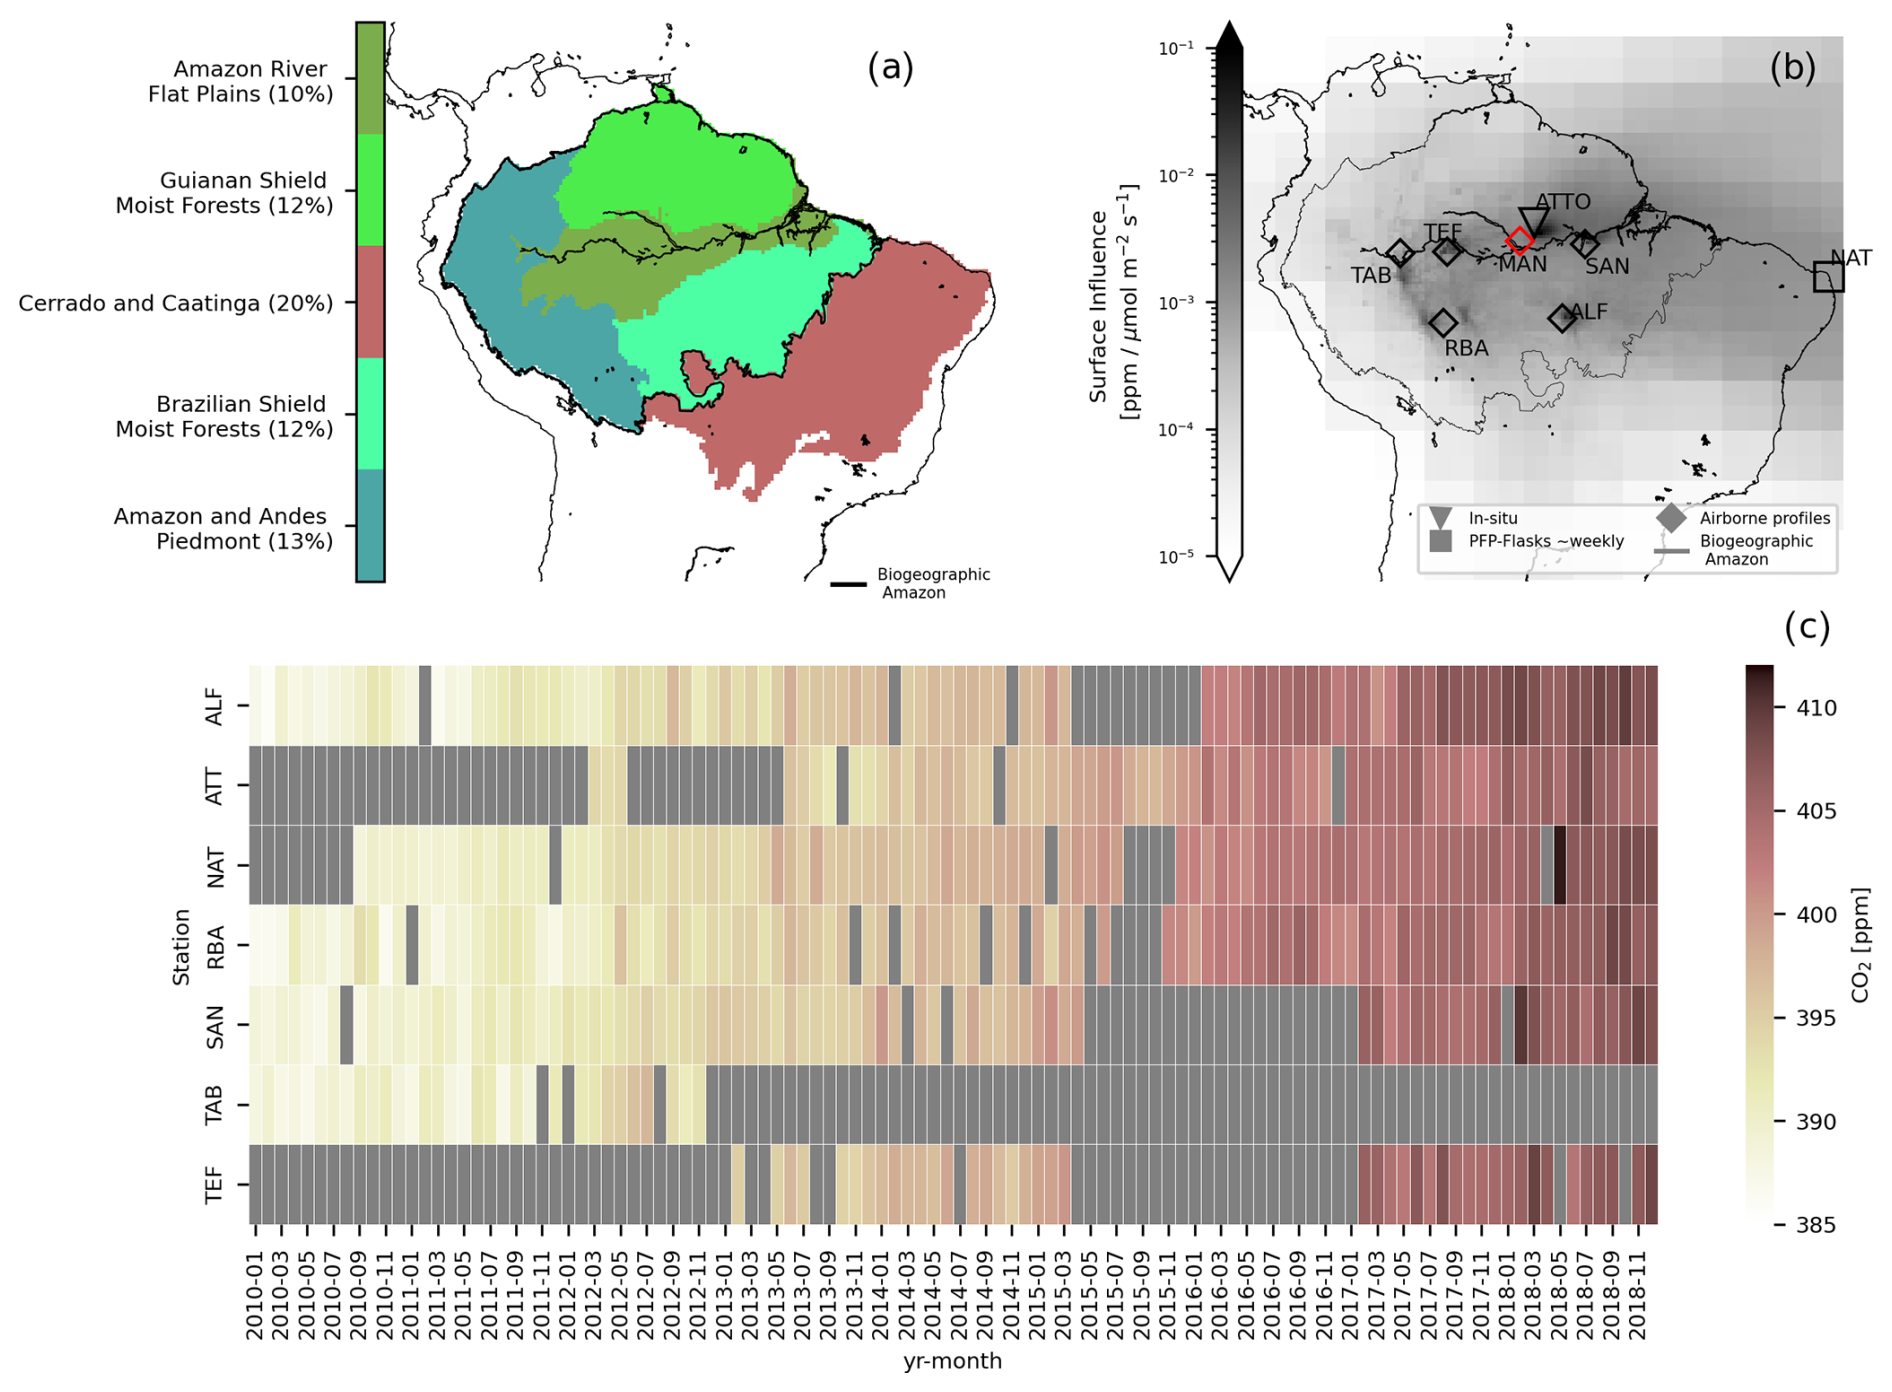
Figure 2South American domain (from 13.875° N to 28.875° S and 83.875 to 34.125° W) with a subregional division adapted from EPA (2011) (a). The percentages in the legend (adding to 67 %) denote the area of the region relative to the total land area in the domain; the remaining 33 % corresponds to the white areas. The annual mean footprint, associated with the period where data are available, is shown in (b). Note that MAN is not assimilated and is used as a validation site. The time series showing the monthly mean CO2 mole fraction at each station or aircraft profile site is shown in (c). The gaps are shown in grey and are due to logistical problems and/or instrument malfunction. The Amazon contour corresponds to the biogeographic limit of the Amazon.
2.1.2 Definition of CO2 flux components
The total CO2 exchange with the atmosphere is denoted as net land flux (FNetLand), which consists of net biome exchange (NBE) and fossil fuel CO2 emissions (Fff):
NBE, in turn, is composed of net ecosystem exchange (NEE), the carbon exchange between atmosphere and rivers (Friver), and emissions from fires (Ffire):
For all fluxes we adopt the atmospheric sign convention in which positive (+) denotes a source to the atmosphere and negative (−) denotes a sink.
The atmospheric signals reflect the total CO2 flux, FNetLand. However, as Fff is prescribed as a prior the inversion optimizes NBE. In the figures in which the posterior FNetLand is reported, we have added the Fff in post-processing. When subtracting Ffire from the NBE we obtain a flux component composed of NEE and Friver, reported in Sect. 3.2.
2.1.3 Analysis regions in postprocessing
To analyze the spatial distribution of the estimated posterior fluxes and the coverage of the atmospheric network, we have used the definition of sub-regions shown in Fig. 2a. These masks can be downloaded here: https://doi.org/10.17617/3.VFC252 (Botía, 2025). One of the criteria for the choice of these regional areas is that they should be independent of our observational network and associated with a biogeographic gradient. Thus, the selection of these areas follows, to some extent, a biome-like distribution, but it does not represent individual biomes strictly. The division within the biogeographic Amazon serves to provide individual sub-regions dividing east–west but also north–south. In addition, we have also kept a separate sub-region for the main branch of the Amazon River as we are interested in the atmospheric constraint over these areas. The biogeographic limit of the Amazon we use here is the same as defined by Albert et al. (2021) as the Amazon biome. When reference to the Amazon sensu stricto+ is given, the area corresponds to four subregions defined in Eva et al. (2005): Amazon sensu stricto, Andes, Guiana, and Gurupi. The Amazon sensu stricto+ area is only used for comparative reasons in the Discussion. As we are using a regional inversion with 0.25 × 0.25° of spatial resolution with a correlation length of about 200 km, the posterior budgets as well as posterior uncertainties for these subregions within the Amazon can be individually quantified.
2.1.4 Observational network
The location of the measurement sites is shown in Fig. 2b, together with their aggregated annual mean surface influence (sensitivities of atmospheric concentrations to surface fluxes, in the following called “footprint”) from 2010 to 2018. The coverage of the observational network in our regional domain concentrates on the areas within the Amazon but also in the northeast of Brazil. For the seasonal footprints for each site, see Fig. A1.
In the global inversion (step 1) we have used the set of stations in the 2022 (s10v2022) release version of the CarboScope Global system with nearly continuous coverage from 2010 onward (i.e., s10oc_v2022; see http://www.bgc-jena.mpg.de/CarboScope/?ID=s10oc_v2022 (last access: 18 December 2024), for details of stations and data providers). A default global inversion using the s10v2022 is used as a reference and is identified as s10. In addition, to the s10v2022 station set, we added the ATTO CO2 record (available at https://attodata.org/, last access: 16 August 2024); five sites within the Amazon region where airborne profiles (available at https://doi.org/10.1594/PANGAEA.926834, Gatti et al., 2021b) are collected (Gatti et al., 2021a); and the weekly flask sampling record in Natal (NAT), a station in the northeast of Brazil (Dlugokencky et al., 2021) to have a global inversion run with the South American data (s10sam). For the regional inversion (step 2), only the sites within our domain are used (ATTO + NAT + Aircraft). The monthly time series at each site is shown in Fig. 2c, indicating the data gaps and the evolution of CO2 over the last decade. Note that ATTO has provided continuous data since 2013 from an 80 m tower, ≈ 50 m above the canopy, and there were major gaps in the aircraft network during 2015 and 2016. For the continuous data (ATTO), we use only daytime measurements (i.e., from 13:00 to 17:00 local time) to ensure we have measurements representative of the well-mixed boundary layer when the transport model errors are smallest (see Fig. S4, supplementary material in Botía et al., 2022). The average number of aircraft profiles per month is two; see Fig. A2. For each measurement in an aircraft profile (full profile goes up to ≈ 4500 m a.s.l), for the weekly flask measurements at NAT, and for every single data point at ATTO, we have simulated the surface influence using the STILT model. Therefore, each measurement has an individual footprint linking the observations with surface fluxes in the regional inversion. The STILT setup follows that of Botía et al. (2022), but the spatial resolution used here is 0.25×0.25°. For evaluating the estimated posterior fluxes we use airborne data from the Manaus site (MAN) (Fig. 2); the data were not assimilated, and this is left as an independent site. The information gained from using the South American stations is tested using CarboScope Global with (s10sam) and without (s10) these stations.
The model–data mismatch uncertainty (including the representation error of the measurements within the transport model) for the three types of sites (in situ tower, aircraft, and weekly flasks) is chosen to be 1.5 ppm for weekly timescales, following common practice in CarboScope Global (Rödenbeck, 2005; Rödenbeck et al., 2018a), which assimilates a large set of weekly flask samples. To assimilate multiple data streams, we apply a data density weighting (Rödenbeck, 2005): for the hourly ATTO data, the error will be inflated by (for details see Kountouris et al., 2018a), while for aircraft profiles (composed of several flasks) the error is scaled with . The data-density weighting practically ensures that 1 week of hourly ATTO observations, one aircraft profile, and one weekly flask sample have the same weight in the inversion, reflecting the assumption that they provide the same amount of information due to roughly weekly error correlations.
2.1.5 Addressing systematic uncertainties in vertical profiles
Gatti et al. (2023) (“Methods and data” section) reported a source of uncertainty in the aircraft profiles given by moisture in undried flask samples at time of collection. Such moisture can lead to biases in the measured CO2 mole fractions. The bias manifests itself as an underestimate of the true mole fraction of atmospheric CO2 in the measurements, due to the removal of gaseous CO2 into water between the time of sampling at the aircraft inlet and analysis in the lab. Both liquid water and condensation of water vapor after pressurizing the flasks form the source for this CO2 absorption, and thus a relation with water-vapor mole fraction exists (hereafter xH2O), as described specifically for this sampling method by Baier et al. (2020) and Paul et al. (2020). Moreover, systematic errors in assimilated data can bias inverse results in various ways (Masarie et al., 2011). To quantify the effect of such systematic uncertainty on the estimated fluxes, we apply a water-vapor-dependent bias correction to the data, before they are assimilated. In other words, we run a set of inversions (using the Global and the Regional versions of CarboScope) assimilating the bias-corrected data (e.g., s10samwvc for CarboScope Global) and another set using the data without the bias correction (e.g., s10sam for CarboScope Global).
To derive the water-vapor bias correction, we used CO2 vertical profiles collected approximately 80 km northeast of the city of Manaus in the central Amazon basin (site code MAN; Miller et al. (2023)) aboard a Cessna Grand Caravan. Collocated portable flask packages (PFPs; which have a water-related CO2 bias) and in situ, onboard measurements (Picarro Inc. CRDS analyzer model G-2401m) were performed (see Fig. A4). The in situ analyzer also provided measurements of CH4, CO, and H2O roughly every 3 s. The MAN time series of vertical profiles, extending from approximately 150 m above ground level (a.g.l.) to approximately 5 km above sea level (a.s.l.), began in April 2017 and continues to this day at a frequency of approximately twice per month. The in situ gas stream was undried (but CO2 mole fractions have been converted from wet to dry using the simultaneously measured water vapor), and calibrations occurred on the ground. Previous results have shown this kind of implementation has minimal (≈ < 0.1 ppm) impact on CO2 values (Rella et al., 2013). Critically, the fact that the air stream was undried allows us to use the analyzer's water-vapor measurement. The PFPs used were version 2 models, and CO2 measurements on PFP air samples were performed at INPE LaGEE; the sampling and analysis methodologies have been described previously (Gatti et al., 2014).
Between April 2017 and June 2019, when air sample collection via PFP stopped at MAN, there were 12 vertical profiles available that had collocated PFP discrete samples and in situ measurements that could be compared. These 12 profiles span a range of water-vapor mole fraction from 0.2 % to 3.5 % that decrease with altitude (see Fig. A5) and allow us to define a relationship between CO2 bias (ΔCO2 = CO – CO) vs. ambient water vapor. The matching between the independent PFP and onboard analyzer systems could be performed accurately by matching each system's GPS time and position signals. Because the PFP sample is collected over ≈ 15–40 s (depending on altitude), we tested a wide range of time averaging windows for the in situ analyzer, ranging from 10 to 40 s to best match the single value of CO2 measured in the laboratory from the PFP air sample. Fortunately, this averaging window range had a negligible impact on the final relationship between ΔCO2 and water vapor (see Fig. A3); the results presented here use a window of 30 s. We also filtered Picarro data for high variability by excluding any 30 s period where the CO2 standard deviation was greater than 0.5 ppm. Finally, we binned all ΔCO2 and xH2O values in 10 000 ppm (or 1 %) increments to define a bias relationship. This relationship (Fig. A3) shows little bias between 0 % and 1 % (above 3 km a.g.l.) but an increasing, approximately linear bias with increasing xH2O (below 2 km a.g.l.).
We used the STILT model to extract the water-vapor mole fraction from the ECMWF-IFS short-term forecasts (as also used to drive STILT) at the same measurement and sampling locations in the Manaus flights in which PFPs and the CRDS analyzer were collocated. These flights span altitudes from 280 to 5200 m a.g.l., and vertical profiles are taken at ≈ 17:00 UTC. The correlation between the measured water vapor (CRDS analyzer) and that extracted from ECMWF-IFS was 0.94 (p≪0.01, N=158) (see Fig. A5), with a mean bias of −0.2 % (ECWMF-IFS biased low relative to the continuous measurements). The observational record at MAN includes both dry and wet seasons and, in combination with a large altitude range, covers the range of water-vapor variability at the other vertical profile sites (see Fig. A6). The latter gives us confidence in ECMWF-IFS as a proxy for the water-vapor mole fraction at the time and location () of each flask sample at ALF, RBA, TEF, TAB, and SAN. Therefore, the difference between the dry air CO2 mole fraction from the continuous measurements (using the wet-dry correction as proposed by Rella et al. (2013)) and the PFP on the Manaus flights was fitted to the water-vapor mole fraction from ECMWF-IFS. The linear fit is , where y is the resulting CO2 increase [ppm] to be applied to the PFP data at a given water-vapor mole fraction x [%], and the slope (0.594) was significantly (p≪0.01, N=158) different from zero (see Fig. A7). The standard error of the slope and the intercept is ±0.11 and ±0.20, respectively. Note that the negative values in Fig. A7 are due to the variable nature of the atmosphere causing uncertainty in both measurement strategies. We discard the possibility of being a mismatch in different air parcels sampled because of the collocated sampling lines and the tests we have done with different averaging times with the Picarro data (Fig. A3). Note that these negative values are more frequent at low water-vapor concentrations, which occur more often in the free troposphere (Figs. A4 and A5). We have further quantified the expected error in the PFP mole fractions by calculating . Introducing the correction we obtain 0.93 ppm and without the correction 1.30 ppm. The sum of squared residuals (SSR) with the correction is obtained using the linear fit reported previously, and N is the number of measurement points (N=158). In the case without the correction the SSR is calculated by obtaining the residuals with respect to a line with no slope and intercept at zero in Fig. A7. As introducing the correction leads to a lower than without it, it indicates that by applying the water-vapor correction we are decreasing the measurement error.
Using this function and the ECMWF-IFS water vapor at ALF, RBA, TEF, TAB, and SAN we applied the water-vapor correction to each individual PFP sample (see Fig. A8). Note that the uncertainty added by the accuracy of the water-vapor mole fraction given by the ECMWF-IFS forecast is dealt with using the fit of the ΔCO2 to the ECMWF-IFS water vapor. At RBA there were six flights (dates: 16 February, 9 March, 6 April, 8 May, 15 July, 19 September 2018) that had a drier installed, so for these flights we did not apply the correction. Here, we establish the offsets on this specific set of flask samples collected over the Amazon. The offsets used in this study are provided as a public dataset (https://doi.org/10.17617/3.M60T6G, Botía et al., 2025), such that the community can use them in their inversion systems and compare their magnitude to other correction methods.
2.1.6 A priori fluxes
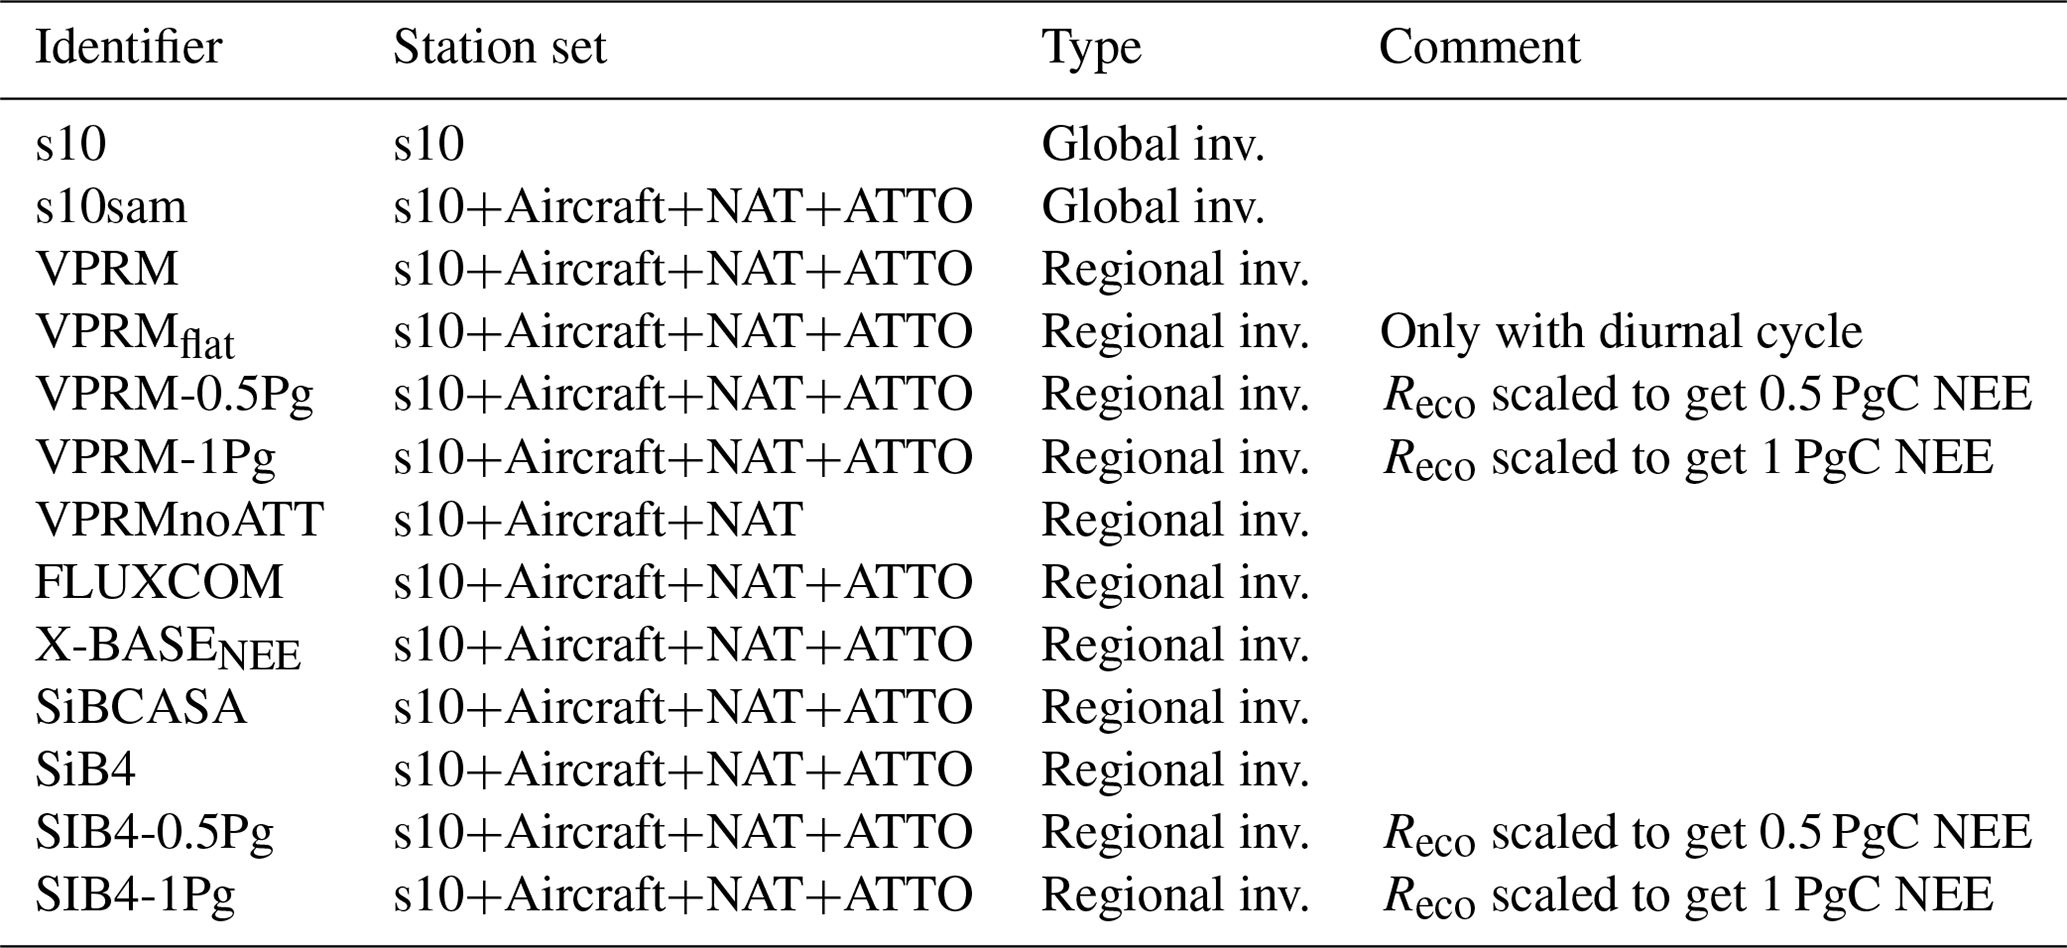
We present an ensemble of inversions based on a set of prior fluxes that differ in several aspects (see Table 1). The first aspect is their conceptual nature, having (a) the Vegetation Photosynthesis and Respiration Model (VPRM) (Mahadevan et al., 2008), a simple diagnostic model using MODIS imagery and fitted to eddy covariance data (Saleska et al. (2013); see Table A2 for the site descriptions) within the domain which provides NEE; (b) the FLUXCOM product (Bodesheim et al., 2018) and its latest version X-BASENEE (Nelson et al., 2024), which up-scales site-level eddy covariance data to the globe using a random forest regression; and (c) two process-based models, the SiB4 (Haynes et al., 2019) and SiBCASA (Schaefer et al., 2008) models, both having served as biospheric flux priors in earlier published studies focusing on the Amazon (van der Laan-Luijkx et al., 2015; van Schaik et al., 2018). By having this set of priors we have a wide representation of the potential spatio-temporal dynamics of NEE over our domain. The other variable aspect of this prior selection is their flux magnitudes and seasonal patterns (see Figs. A9 and A11). Originally the eddy-covariance-based products, like the two FLUXCOM versions and VPRM, have a large sink magnitude for the Amazon. Note that the total land flux in the Amazon is highly uncertain, spanning −0.34 to 0.29 PgC yr−1 (Gatti et al., 2021a; Rosan et al., 2024), but this range gets larger than 1 PgC considering the uncertainties associated with each estimate; thus we decided to keep the eddy-flux based prior NEE products (VPRM and FLUXCOM), as they can be considered a plausible first guess in an inversion. Furthermore and regardless of how they compare to current independent estimates we proceeded to make an experiment scaling two of our priors (i.e., VPRM and SiB4) such that NEE =0.5 and 1 PgC, and thus we can test an opposing (in sign) prior scenario. To achieve this, we scaled ecosystem respiration in VPRM and SiB4 such that the total NEE integral for the biogeographic Amazon equals 0.5 and 1 PgC yr−1 (namely VPRM-0.5Pg, VPRM-1Pg, SIB4-0.5Pg, and SIB4-1Pg). An example for VPRM-0.5Pg is shown in Fig. A9. Two additional sensitivity tests were performed using the original VPRM. In one, we removed the long-term mean, seasonality, and interannual variability (IAV) from VPRM (called VPRMflat) and run the regional inversion only with a diurnal cycle in the prior. In the second one, we used VPRM as prior but left the ATTO data out from the assimilated station set (called VPRMnoATT).
Table 1Inversion runs indicating the type of inversion (Global or regional), the selection of prior NEE fluxes used in the regional inversion and the label identifying each individual run. All these individual runs except VPRMnoATT represent the prior ensemble. IAV stands for interannual variability and Reco for ecosystem respiration. The s10 station set has nearly continuous coverage from 2010 onward.
Note that the CarboScope Global v2022 has no diurnal cycle in the prior fluxes. The effect of this and how it propagates to the regional inversion is discussed in Munassar et al. (2024). Here, we apply a region-specific correction based on this work. The correction is based on the response of CarboScope Global to having a diurnal cycle in the prior fluxes, which was derived by inverting the diurnal anomalies (hourly − daily mean) of two forward runs (one with and the other without diurnal cycle) using CarboScope Global. The prior flux diurnal cycle was based on FLUXCOM. The posterior fluxes of such inversion correspond to the per-grid-cell correction that should be added to the posterior fluxes of the normal inversion, assuming that the FLUXCOM diurnal cycles are correct. Then, we propagate such a correction using the two-step scheme described above via the lateral boundary conditions.
The fire emissions used in this study (GFAS-opt CO2) are based on the original GFAS product (Kaiser et al., 2012), with an adjustment over the northern part of South America based on CO inversions by Naus et al. (2022). These inversions were performed using the TM5-4DVAR system (Krol et al., 2005; Meirink et al., 2008) using CO data from MOPITT (Deeter et al., 2019) inside the study area (northern part of South America) and NOAA station data outside of this region. We calculated the increment ratios from prior (GFAS) to posterior CO fluxes for each grid cell and applied this factor to the GFAS CO2 fire emissions as previously done in Koren (2020). For regions outside the domain of Naus et al. (2022) we did not scale the GFAS emissions. Thus, our approach assumes that the adjustment of the MOPITT-Inversion in CO is also applicable to CO2. We acknowledge that this is an approximation, as the emission ratio between CO and CO2 could also be off in GFAS. However, here we assume they are constant and interpret the underestimation in CO as an underestimation in fire emissions. This is in line with recent studies of undetected African fire emissions (Ramo et al., 2021).
Furthermore, a non-optimized set of fluxes is used to account for important CO2 sources that contribute to the integrated signal of CO2 in the atmosphere within our domain. Ocean fluxes are based on surface–ocean pCO2 data (Rödenbeck et al., 2013) but specifically processed at higher (1×1°) resolution (Run ID: oc_1x1_v2022). Following Steinbach et al. (2011), the EDGAR 4.3 inventory, sector and fuel-type specific and scaled at the national level for each year based on the British Petroleum statistical review (BP Annual report, 2020), is used to account for emissions related to the burning of fossil fuels.
The assumed regional prior uncertainty for the domain-wide and annually integrated flux is chosen to be 0.9 PgC yr−1, which is based on the contribution of the regional domain to the assumed prior uncertainty (2.8 PgC) in the CarboScope Global inversion system. Therefore, when spatially aggregating the spatially and temporally correlated prior error, regardless of the correlation length scale, it scales to the assumed prior uncertainty for the domain.
2.2 Statistical metrics
The uncertainty associated with the posterior covariance matrix in the inversion system, what is often referred to as “Bayesian” uncertainty, is used in the context of reporting the ensemble median for particular regions. The posterior flux uncertainty can be calculated from the prior uncertainties given by the prior flux and the measurement covariance matrices as described by Rödenbeck (2005). The posterior uncertainty is calculated for each year of interest (2010–2018) and the regions in Fig. 2a as the square root of the covariance matrix multiplied by a regional operator. This uncertainty primarily depends on the observation availability and the assumed uncertainties for model–data mismatch and prior fluxes, which is independent of the biosphere or diagnostic model used as a prior. The uncertainty reduction (UR; Δσ) is then calculated with Eq. (4):
3.1 Understanding atmospheric and prior constraints
We found that the eastern part of the South American domain has a better observational constraint compared to the west. We obtained a mean (averaged over 2010–2018) uncertainty reduction (UR) of 44 % for the Amazon region and for all the regions within it a reduction equal to or above 18 % (Fig. 3). Despite the uncertainty reduction of 44 %, the absolute uncertainty of the posterior is 0.33 PgC yr−1. For the “Amazon River Flat Plains” and the “Brazilian Shield Moist Forests” the mean reduction is 53 % and 54 %, followed by the “Guianan Shield Moist Forests” with 25 % and the “Amazon and Andes Piedmont” with the lowest mean reduction of 18 % within the Amazon region. Note that the Cerrado and Caatinga has a mean UR of 30 %, higher than the Amazon and Andes Piedmont, indicating that on average there is better observational coverage over this eastern part of the domain.
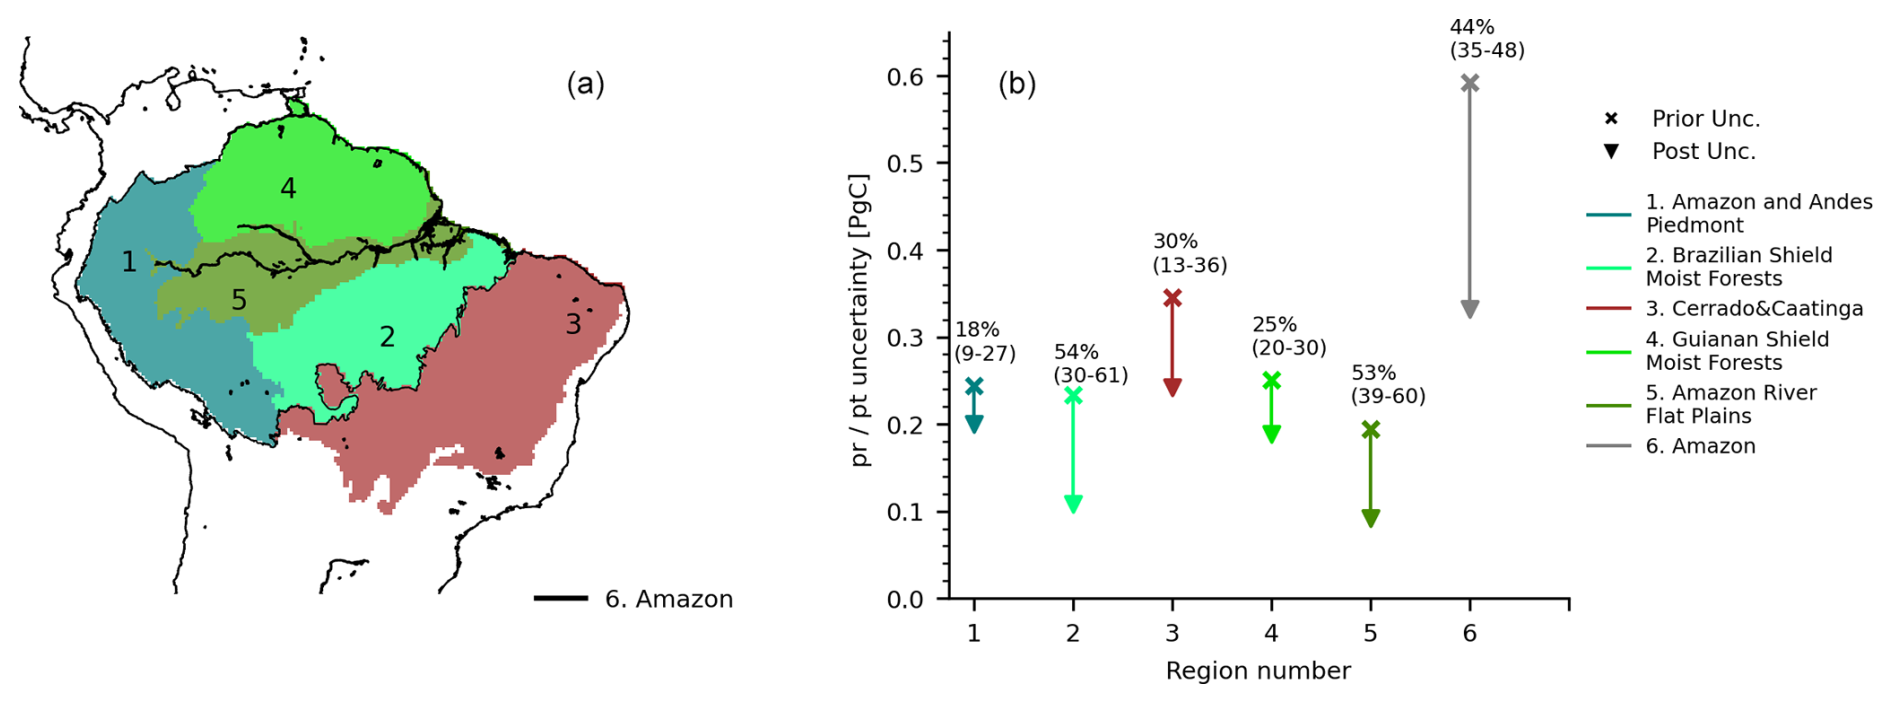
Figure 3Areas for spatial integration of fluxes (a) and prior/posterior uncertainty for each of these areas (b). The percentages represent the mean uncertainty reduction over the period between 2010 and 2018, and the values in brackets indicate the min–max range. For a complete time series for each region, see Fig. A12. Region 6 (biogeographic Amazon) is the sum of 1, 2, 4, and 5.
The UR not only varies spatially but also from year to year, depending on the continuity of the measurement records. As expected, years with data gaps have a low uncertainty reduction (see Fig. A12). For example, due to the gaps in 2015 at the sites of TEF, SAN, and partly ALF, the uncertainty reduction was affected largely in the Brazilian Shield Moist Forests (decreasing by 21 % from 2014 to 2015), the Amazon River Flat Plains (17 %), and the Cerrado and Caatinga (18 %). This impact on UR was also observed in the biogeographic Amazon with an effect of 10 % (Fig. A12). Furthermore, in the Amazon and Andes Piedmont we observe a slight decrease in the UR throughout the years. The highest UR is observed from 2010 to 2012, when the TAB site was active; after that, the UR never gets back to the 2010–2012 values. The latter highlights the effect of the location and the continuity of the measurement record on the UR for a particular region and specifically the low information content in the west of the domain.
The largest UR caused by adding the ATTO data is for the flux estimate from Guianan Shield Moist Forests. Sensitivity tests (not shown) excluding ATTO from the assimilated data show that on average the UR is 7 % lower in this region, but some years reach 12 % (i.e., 2016). The constraint added by ATTO is smaller but also relevant in the Amazon River Flat Plains, increasing the UR by 6 % also in 2016. At the biogeographic Amazon scale, the mean impact on the UR is small (2 %), but in individual years it can amount to more than 5 %. These changes in UR are somewhat conservative as in this study we have treated the aircraft data and the continuous data from ATTO in a similar way, inflating the uncertainty depending on the number of observations per week or per vertical profile, as described in Sect. 2.1.4. It is important to mention that the mean bias error of simulated mole fractions at each site assimilated shows better agreement between ensemble members (individual priors) relative to the simulations using prior fluxes, and the magnitude is reduced considerably from prior to posterior (see Fig. A13). For the MAN site, used for evaluation (i.e., not assimilated), we observed a reduction in the mean bias from −0.4 to 0.1 ppm.
For the biogeographic Amazon and the Cerrado and Caatinga we find a strong linear dependence of the posterior estimates on the prior (Fig. 4a, b). Even though the spread in the marginal distribution is reduced largely from prior to posterior, the models with a large uptake in the prior (e.g., VPRM, FLUXCOM, X-BASENEE) do not converge with the main cluster of posterior estimates. We further evaluated such dependence with the VPRMflat experiment, confirming that after removing the long-term mean, the VPRMflat posterior FNetLand falls closer to the main group of estimates in both regions. Interestingly, the regions in the eastern part of the Amazon (Amazon River Flat Plains, Brazilian Shield Moist Forests, and the Guianan Shield Moist Forests) exhibit superior constraint by atmospheric data, as illustrated in Fig. 4c–f. The spread in the posterior marginal distribution and the slopes of the linear regression in these four regions are inversely proportional to their respective reduction in uncertainty (Fig. 3). This inverse relationship indicates that the posterior estimates are more effectively adjusted in regions with a higher reduction in uncertainty, irrespective of the prior magnitude. Therefore, the Amazon and Andes Piedmont in the west stands out as an area where a bias in the prior fluxes would exert a more substantial impact on posterior estimates.
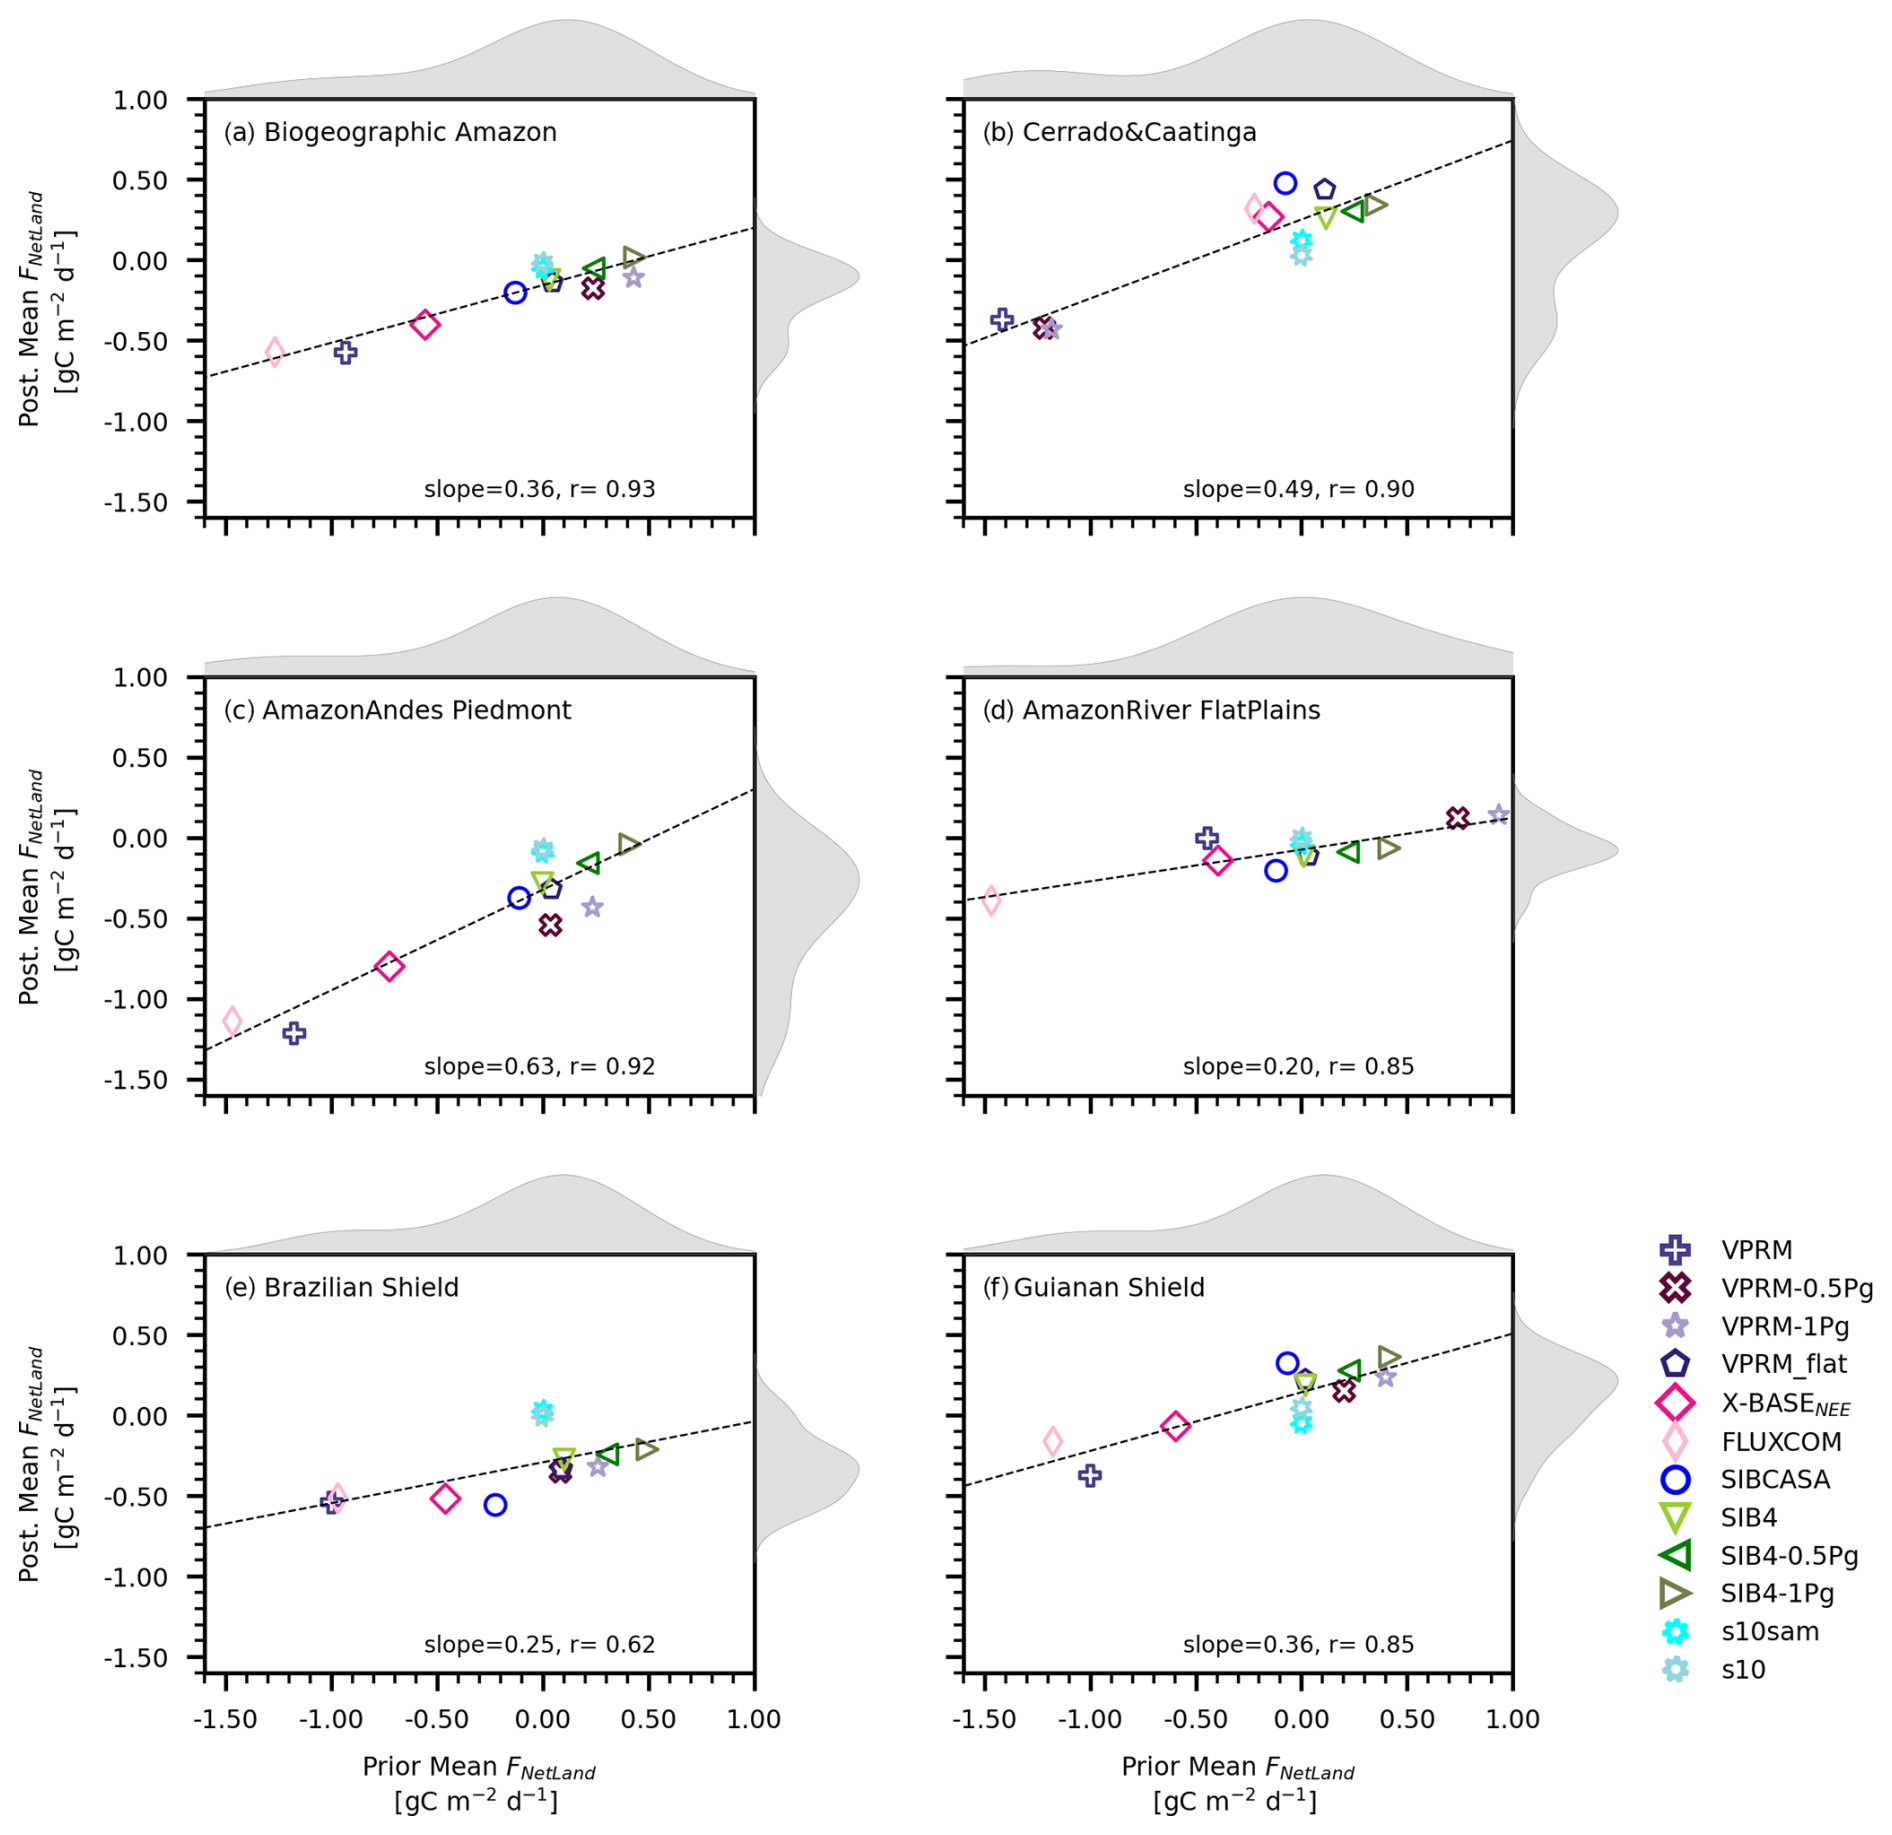
Figure 4Relationship between prior and posterior mean net land flux (FNetLand). On the y and x axes of each panel the density distribution is shown.
3.2 Constraint on the carbon budget for tropical South America
The flask-specific CO2 bias correction (see Sect. 2.1.5) results in a consistent shift towards a source in the posterior FNetLand for both regions (Fig. 5). For the biogeographic Amazon, using the global inversion we find a mean effect of 0.21 PgC yr−1, while in the regional inversion the effect is 0.31 PgC yr−1 (see Table A1). For the Cerrado and Caatinga the mean effect is 0.10 PgC yr−1 (CarboScope Global) and 0.14 PgC yr−1 (CarboScope Regional), and for the regions within the Amazon equal to or less than 0.10 PgC yr−1 for both Global and Regional inversions (see Table A1). Therefore, the ensemble median FNetLand changes from −0.33 to −0.04 PgC yr−1 for the Amazon and for the Cerrado and Caatinga from 0.31 to 0.50 PgC yr−1. Applying the correction results in a mean posterior FNetLand with a weaker sink or a larger source of carbon, consistent with the need to simulate higher CO2 levels to match the data.
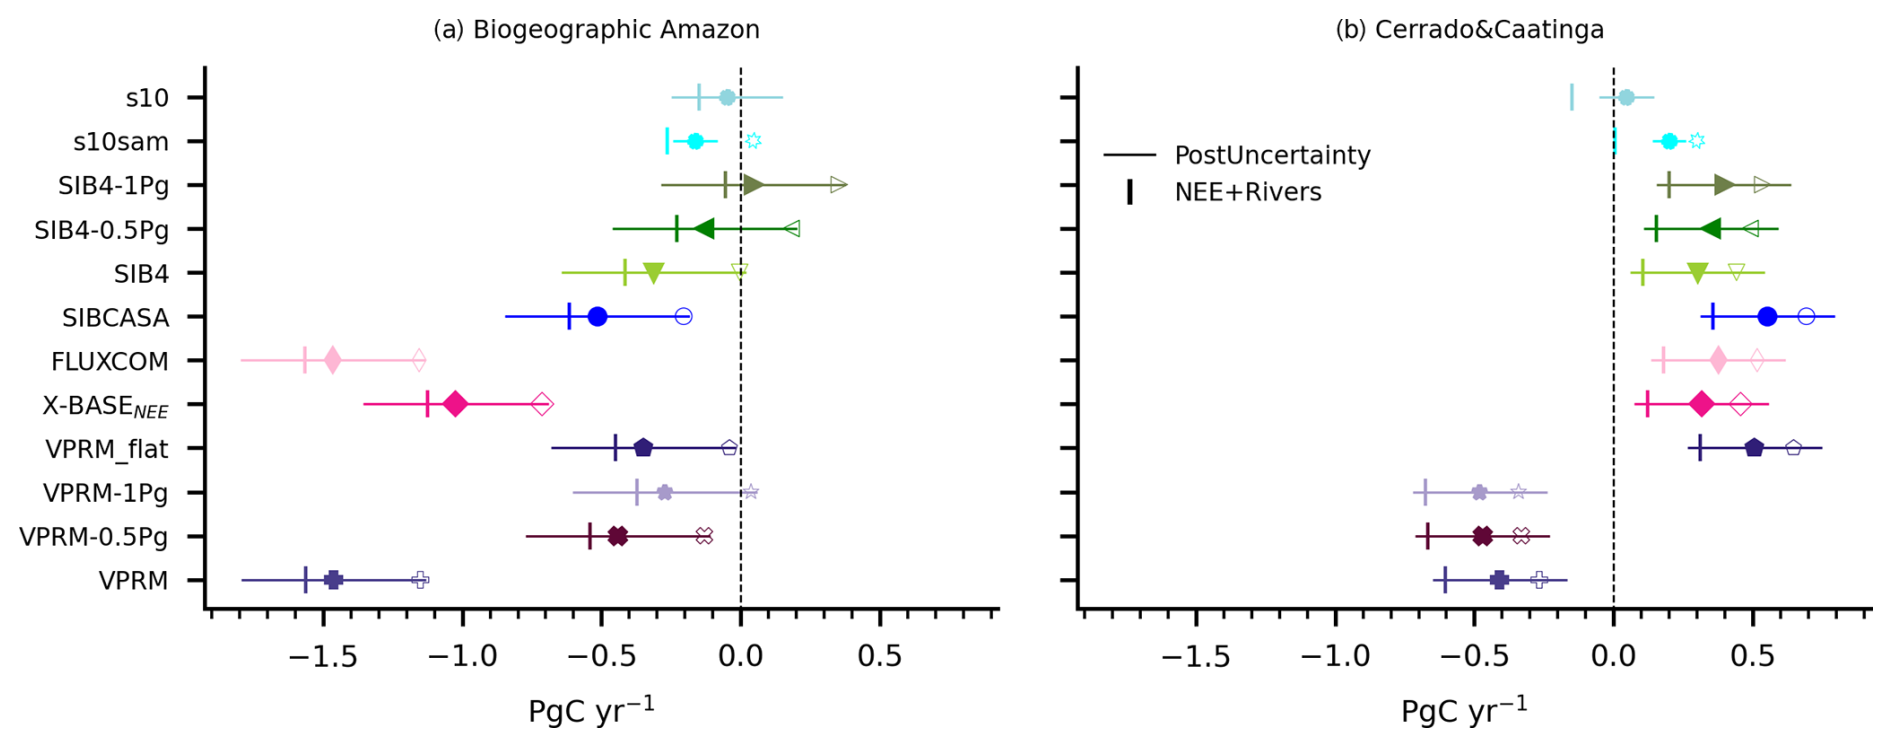
Figure 5Carbon budget for the biogeographic Amazon (a) and the Cerrado and Caatinga (b) regions. The posterior flux components shown with a vertical bar (NEE + Friver), result from subtracting the Ffire and Fff from the posterior FNetLand (shown with the markers). The empty markers show the effect of the water-vapor correction for each individual inversion.
The atmospheric inversion allocates a net carbon source (FNetLand) in the Cerrado and Caatinga and a sink in the biogeographic Amazon, except for VPRM, VPRM-0.5Pg, and VPRM-1Pg (Fig. 5, and see Figs. A9 and A10 for spatial patterns). Adding South American stations amplifies this pattern and reduces the posterior uncertainty (compare s10 with s10sam). Despite variations in magnitude, the inversion consistently shifts priors toward a smaller Amazonian source (e.g., SIB4-1Pg) or even a sink (e.g., VPRM-1Pg, VPRM-0.5Pg, and SIB4-0.5Pg). The prior vs. posterior flux contrast (Figs. 5, A15) confirms a robust sink–source gradient, embedded in the atmospheric measurements, despite limitations in adjusting individual priors. Notably, VPRM-based estimates in Cerrado and Caatinga undergo substantial corrections, sometimes exceeding +1 PgC yr−1. This pattern also appears in the Amazon for VPRM, FLUXCOM, and X-BASENEE. However, removing the long-term prior mean (VPRMflat) results in a FNetLand that aligns more closely with posterior estimates at PgC yr−1 (Amazon) and ≈ 0.3 PgC yr−1 (Cerrado and Caatinga). In other words, a prior flux having zero mean but a diurnal cycle would be closer to the main cluster of posterior estimates.
We do not find a spatial shift of the fluxes (see Fig. A16) due to the water-vapor correction, nor do we find a strong impact on the interannual variations (Fig. 6). The response to drought in 2010, 2015, and 2016 is affected by the magnitude of the absolute flux, but the variability between years remains the same (Fig. 6). Note that the correction is allocated to the regions with uncertainty reduction greater than 18 %, consistent with the observational coverage (compare Fig. 6b with Fig. 2b). In other words, the correction only affects the areas covered by the aircraft network. Therefore, the findings of our sensitivity tests support the hypothesis in Gatti et al. (2023) that the water vapor bias mainly affects the absolute annual flux magnitudes. In both cases, with and without correction, our estimates of the total carbon loss to the atmosphere in the Amazon during 2015 and 2016 are lower (from 0.15 to 0.30 PgC) than other studies (Liu et al., 2017; Gloor et al., 2018). However, it should be noted that the response to the 2015–2016 drought in our system must be interpreted with caution, as there are large gaps in the observational record during 2015 and 2016. Having this in mind, our total net flux is closer to the 0.5 ± 0.3 PgC of Gloor et al. (2018), but note that they used a time period from September 2015 to June 2016, and the area they refer to as Amazonia is not clearly defined. Compared to 1.6 ± 0.29 PgC in Liu et al. (2017), our estimates are much lower, but the difference in area is large, as they refer to tropical South America, including parts of the Cerrado and Caatinga biomes and Central America. Ultimately, assuming that the correction brings the observational data closer to the truth implies that the Amazon is a weaker sink of carbon and that the Cerrado and Caatinga is a larger source.
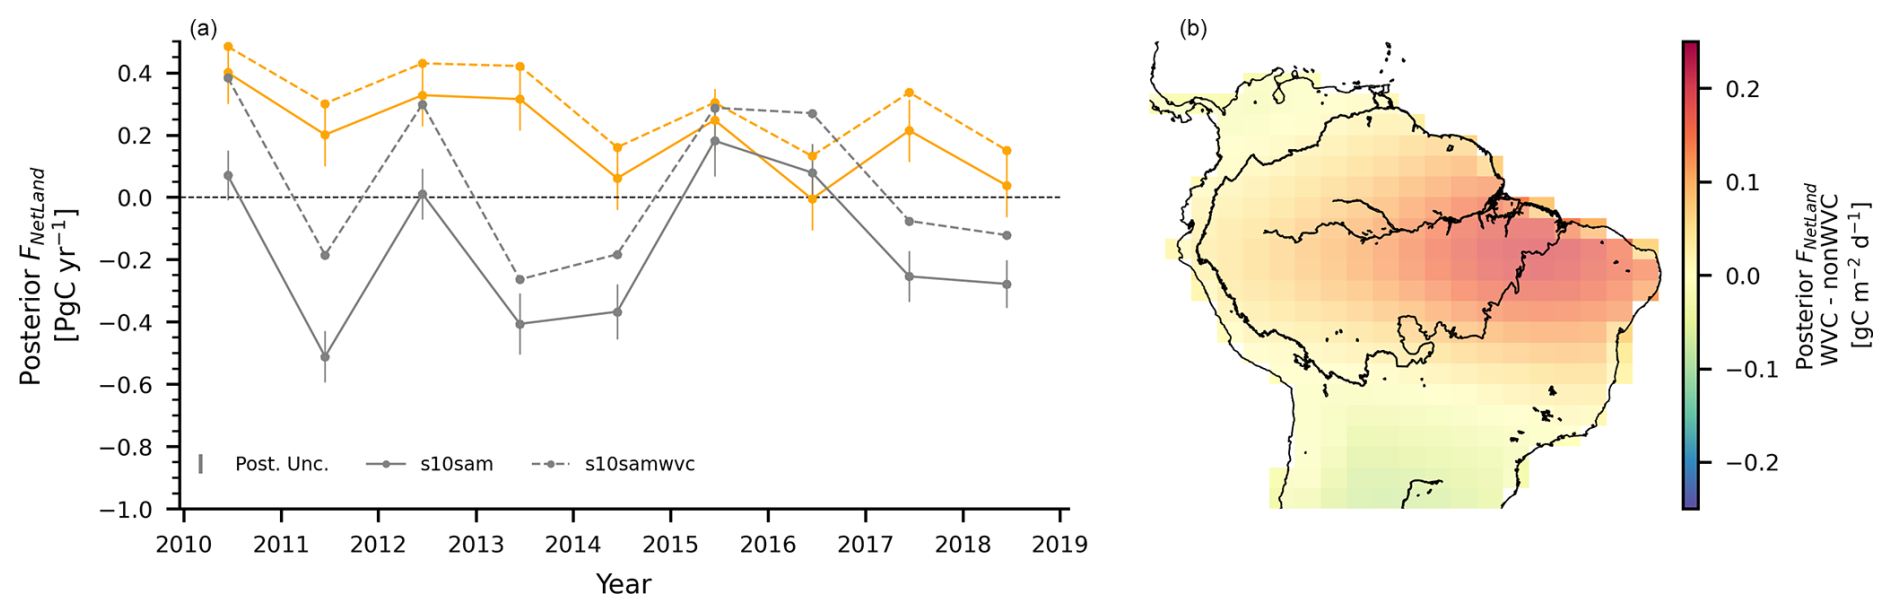
Figure 6Posterior flux estimates using the global inversion assimilating vertical profile data without a bias correction (s10sam) and with the correction (s10samwvc) (a). The integrated flux corresponds to the biogeographic Amazon (grey) and the Cerrado and Caatinga (orange). The error bars correspond to the posterior uncertainty. In (b), the difference per grid cell is shown for the two resulting posterior estimates (with water-vapor correction (WVC) and without (nonWVC)) averaged over 2010–2018.
To provide further insights on the main drivers of FNetLand and the spatial gradient reported here, we explore the individual components of the FNetLand. The mean fire emission estimates for the biogeographic Amazon and the Cerrado and Caatinga are 0.10 and 0.19 PgC yr−1, respectively (difference between solid marker and vertical bar in Fig. 5 and shown in Fig. 7). Our findings indicate that, for most estimates, the carbon source in the Cerrado and Caatinga does not solely originate from fires (Fig. 5b). Within the cluster that exhibits positive posterior estimates (excluding s10), the remaining flux components (NEE + Friver) are positive, even after subtracting fires and fossil fuels from the mean FNetLand. This pattern is even stronger when considering the inversion ensemble that assimilates the bias-corrected data. In the conservative case (without bias correction), the values range from neutral for s10sam with 0.00 to 0.35 PgC yr−1 for SIBCASA. Despite fires contributing 0.19 PgC yr−1 in this region, the persistence of positive NEE + Friver in most inversions suggests a non-fire-related carbon source. In contrast, for the biogeographic Amazon we observe a consistently negative NEE + Friver across all posterior estimates, with a smaller fire component (0.10 PgC yr−1) compared to the adjacent Cerrado and Caatinga. Therefore, given these results, a large portion of fire-related carbon sources lie outside the biogeographic Amazon, emphasizing the critical role of fire locations in determining remaining flux components in the NBE.
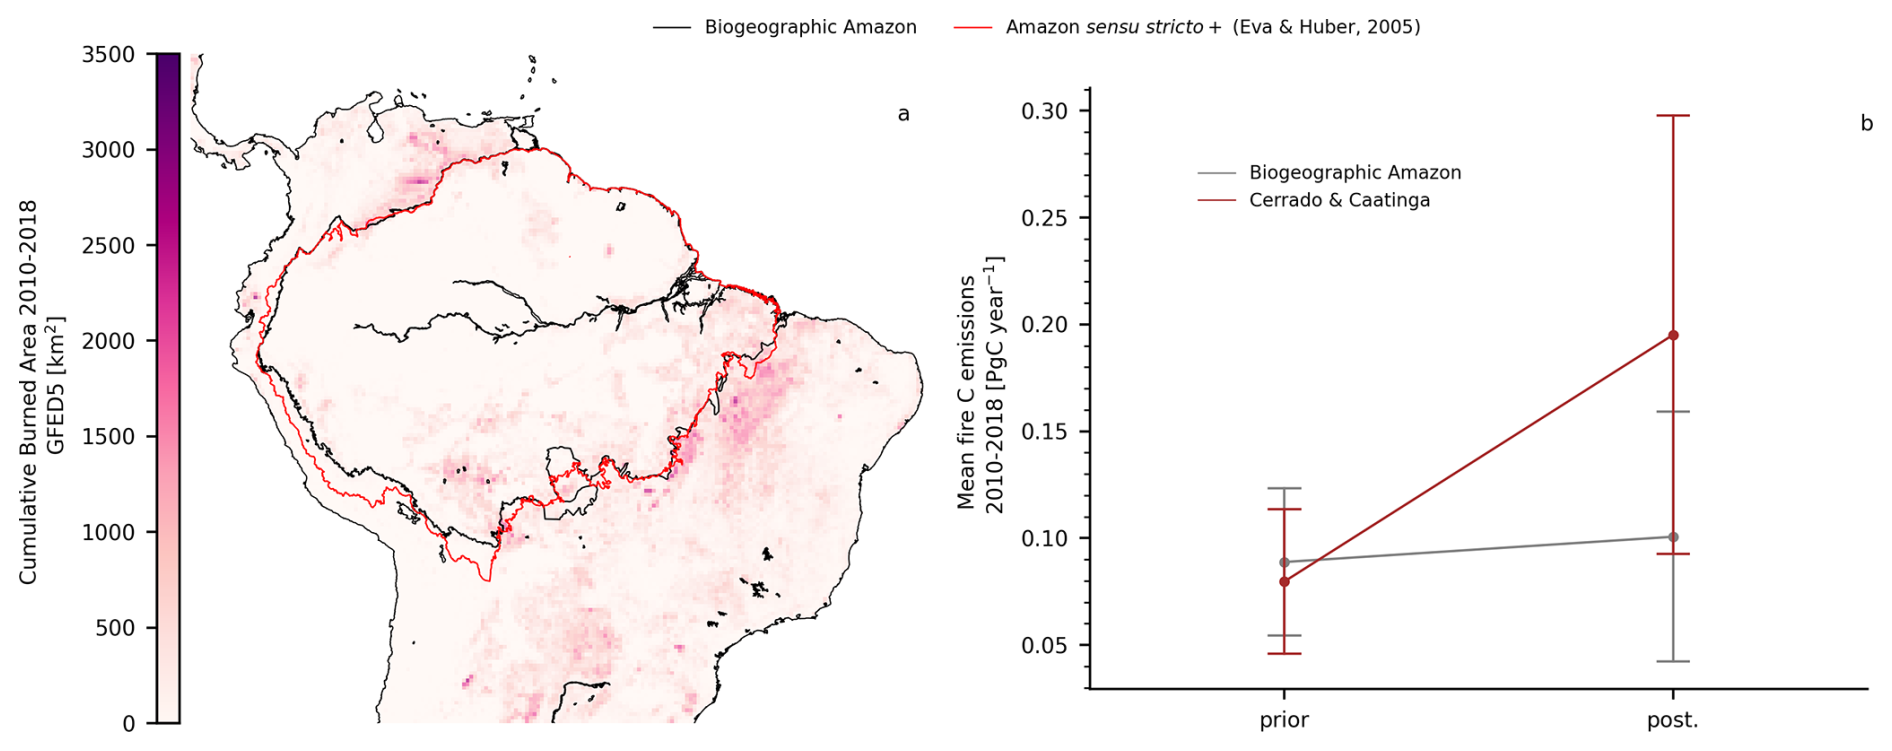
Figure 7Cumulative burned area for the domain of the regional inversion using GFED5 (a) (Chen et al., 2023a) and the prior and posterior fire emission estimates from GFAS and optimized with using satellite retrievals from MOPITT (Deeter et al., 2019) (b) for the biogeographic Amazon and the Cerrado and Caatinga regions; the error bars denote the IAV.
The largest contribution (63 %) to the mean fire emission in the biogeographic Amazon (0.10 PgC yr−1) is from the Brazilian Shield Moist Forests (see Fig. A14). Our fire emission estimate is lower than reported in other studies (Gatti et al., 2021a; Basso et al., 2023), but our analysis shows that fire emissions are concentrated on the border of the Amazon and the Cerrado and Caatinga region. Note that when adding the fire emissions from the Brazilian Shield Moist Forests and the Cerrado and Caatinga, we obtain 0.25 PgC yr−1, which is close to the fire estimate of Basso et al. (2023). Furthermore, the cumulative burned area in GFED5 (Chen et al., 2023a), a fire emission proxy independent of the optimized fires used here, has most of the burning in the Cerrado and Caatinga (Fig. 7a), which is also the case when using an alternative Amazon boundary, such as that defined by Eva et al. (2005). Burned area is indicative of fire activity, but it does not scale 1:1 with fire carbon emissions, as they depend on factors like fuel load and combustion efficiency (van der Werf et al., 2010; van Wees et al., 2022). However, fire emissions in the Cerrado and Caatinga region increase from prior (0.08 PgC yr−1) to posterior estimates (0.19 PgC yr−1) (Fig. 7b), consistent with an increase in burned area from GFED4 (Giglio et al., 2013) to GFED5 (Chen et al., 2023a). It is worth noting that the fire emissions used here result from a top-down optimized version (Naus et al., 2022) based on CO using MOPITT satellite retrievals (Deeter et al., 2019). Therefore, the difference in fire emissions relative to other studies is likely associated with the distinct methodologies used to attribute the fluxes as well as the spatial resolution used in the inversion, both of which can lead to accounting for fire emissions outside of the regional boundaries in the Amazon region.
4.1 The Amazon carbon exchange in context
Significant progress advancing the monitoring capacity over the continent, particularly in Brazil, has allowed for an increasing number of studies (Gatti et al., 2014; van der Laan-Luijkx et al., 2015; Alden et al., 2016; Koren, 2020; Gatti et al., 2021a; Botía et al., 2022; Basso et al., 2023; Gatti et al., 2023) using atmospheric mole fraction measurements to understand ecosystem carbon exchange. However, using atmospheric inversions that assimilate in situ or flask data to estimate net carbon exchange remains a challenging task given the remaining limitations in data constraint, as shown in Fig. 3. We have shown that posterior estimates have a linear dependence on the prior magnitude that varies according to the uncertainty reduction and absolute posterior uncertainty. On the biogeographic Amazon scale, such linear dependence together with the large posterior uncertainty (±0.33 PgC yr−1) makes it difficult to attribute a mean carbon exchange based solely on one prior, as the magnitude and sign could be greatly influenced by that of the prior. To address this issue, our study offers a meticulous evaluation of uncertainty for specific regions, recommending areas where the inversion benefits from superior atmospheric data constraint. In light of this assessment, we identify potential sites for new measurement stations to reduced the uncertainty in Amazon-wide top-down estimates, like the Amazon and Andes Piedmont.
We acknowledge that a shortcoming of our regional inversion, common to other regional systems (Munassar et al., 2023), is the use of a single global inversion for the far-field contribution (e.g., the CO2 mole fraction advected into the regional domain). For example, if the global inversion has a regional bias in the CO2 mole fractions, it can propagate to the regional inversion via the far-field contribution. Yet, this influence should be smaller in well-constrained areas (those having high uncertainty reduction, Fig. 3). In this regional domain, the predominant atmospheric flow changes seasonally from easterly to northeasterly, both directions constrained by two background stations: Ragged Point Barbados (RPB; 13.1650° N, 59.432° W) and Ascension Island (ASC; 7.9667° S, 14.4° W). CarboScope Global assimilates data from these stations, and the mean bias error between posterior CO2 mole fractions and local measurements at these sites is lower than 0.1 ppm (Botía et al., 2022, supplementary figures). In addition, Schuh et al. (2019) showed that atmospheric transport models (e.g., TM5) that have a slow vertical and meridional transport in the northern mid-latitudes can have a weaker sink from 45 to 90° N but at the same time a stronger sink from 0 to 45° N, resulting in a stronger global integrated carbon sink compared to the fast vertical mixing models (e.g., GEOS-Chem). We speculate that as a precursor of TM5, the model we used in the global inversion (i.e., TM3) could have a stronger global carbon sink due to a slower vertical and meridional transport, so the contribution of our South American domain to that carbon sink will propagate to the regional inversion via Step 1 of the two-step scheme. The quantification of this potential effect is a source of uncertainty in our regional inversions that should be further quantified. Finally, we have assumed weekly error correlations for the model–data mismatch uncertainty to be able to assimilate multiple data streams and for consistency with the CarboScope Global inversion system. Such assumption should be revisited and evaluated with further sensitivity tests in future studies in the tropics, but maintaining consistency between the Global (which provides the boundary conditions) and Regional inversion systems.
Our estimates for the biogeographic Amazon are consistent with bottom-up approaches in the negative sign of net land flux (FNetLand) (Table 2), yet a large uncertainty remains in both approaches. For the same area, Basso et al. (2023) report a small net source of carbon, but considering the uncertainty range, all approaches overlap. Integrating our posterior fluxes for the same Amazon boundaries as in Gatti et al. (2021a) and Basso et al. (2023) results in contrasting signs but again with an overlapping uncertainty range. Therefore, to answer the sink–source question for the Amazon region – regardless of its boundaries – reducing uncertainty in both bottom-up and top-down approaches should be the priority in upcoming studies. From the top-down perspective (assimilating in situ and/or flask data), such uncertainty reduction can be achieved by expanding the observational network to the west of the Amazon, towards the Andes foothills in Peru, Colombia, and Ecuador, as this region had the smallest uncertainty reduction in our study. Thus, mean estimates over these regions should be interpreted with caution, as the selection of prior fluxes can largely influence the sign and the magnitude of such a mean, as shown in this study.
To further reduce the uncertainty in this domain, top-down estimates could combine in situ data with satellite retrievals. The inversions assimilating data from the Orbiting Carbon Observatory 2 (OCO2) (Liu et al., 2017; Crowell et al., 2019; Peiro et al., 2022; Wang et al., 2023) have shown that remotely sensed CO2 columns can provide a valuable constraint of net carbon exchange in tropical regions. However, the OCO2-inversions are still limited by cloud coverage during the wet season (Massie et al., 2017; Peiro et al., 2022), and the adjustment of the prior can be biased to dry season retrievals (Crowell et al., 2019). The seasonal effect due to clouds could also vary spatially, as cloud cover tends to be more prominent in the northwest of the Amazon, where the dry season is shorter. In our system, we do not constrain this area (Amazon and Andes Piedmont) as well as others; therefore we do not discard a dipole effect as a result of network coverage. Nevertheless, as we assimilate data sources that are not subject to very strong seasonal cloud biases and actually have calibrated data over the continent, we believe that in the regions with a large uncertainty reduction our results should be closer to the true flux. Comparing the response to the 2015/2016 El Niño, our results coincide with the OCO2 inversions (Liu et al., 2017; Crowell et al., 2019; Peiro et al., 2022) in a carbon source in 2015 and 2016. Yet, a direct comparison of the magnitude in those studies to our results is challenging for the following reasons. First, the response in our system could be biased to ATTO as there was a large gap in the aircraft data in 2015 and 2016. Second, the area for South America in Liu et al. (2017) includes parts of the Cerrado and Caatinga regions, and in Crowell et al. (2019) and Peiro et al. (2022), they divide South America into three parts: (1) northern South America, including only the north (north of the Equator) of the Amazon basin, the Orinoco basin, a part of central America, and the Caribbean islands; (2) southern tropical South America, which includes a large part of the Cerrado and the southern part of the Amazon; and (3) South America temperate, which includes the Cerrado and Caatinga, extending until the southernmost point on the continent. None of these regions coincide with our regional distribution; therefore, using our domain definition on the OCO2-MIP fluxes should be part of a next study, when we can afford to have more years in the comparison and not only 4 (2015–2018) that overlap for the analysis.
The effect of fires is fundamental to understanding the NBE and quantifying this signal remains challenging. Studies like van der Laan-Luijkx et al. (2015), Koren (2020), Naus (2021), and Basso et al. (2023) show that further optimization of fires in a Bayesian setup can have an important impact on the magnitude of the derived fire-CO signal, which can be translated to a fire-CO2 signal and thus impact the net carbon flux on the regional scale. This is why we selected an optimized fire emission for our domain, as did Basso et al. (2023), which results in fire emissions that are generally larger than the prior used, in both cases GFAS. The higher estimates than the original GFAS product are in line with recent findings that the global burned area has been strongly underestimated, resulting in underestimated fire emissions (e.g., Ramo et al., 2021). Further advances in global burned area mapping (Chen et al., 2023a) and fire emission estimates (van Wees et al., 2022; Wiedinmyer et al., 2023) will help to reduce the estimated fire flux and help to further constrain NBE in the future. The fire flux for the Amazon area used in Gatti et al. (2021a) is 0.41 ± 0.05, which is relatively high compared to the 0.09 PgC yr−1 (Rosan et al., 2024), the 0.26 PgC yr−1 (Basso et al., 2023), and the 0.10 PgC yr−1 from this study. The Gatti et al. (2021a) approach with the column budget technique solves for the total flux concerning a background signal linked to each of the aircraft profiles. Using an observation-based CO:CO2 relationship, they obtained the contribution of fires and subtract that from the FNetLand, but the area for attributing fluxes corresponds to the regional influence of each aircraft site limited to the Amazon boundaries. As the CO:CO2 is also influenced by areas outside of the Amazon (see Figs. 5 and 6 in Cassol et al. (2020) and Fig. 1 in Gatti et al. (2014)), such an approach could assign fire sources from the Cerrado to the Amazon.
In addition to the challenges posed by a limited observational constraint in this region, other sources of uncertainty could be associated with water vapor in the samples of the aircraft vertical profiles, as was mentioned in Gatti et al. (2023). Previous studies (Baier et al., 2020) focusing on the effect of water vapor in flasks have shown that the linear dependency of the ΔCO2 on humidity in the flasks is more evident above ≈ 1.5 % xH2O. We have fitted the ΔCO2 to the entire humidity range in the measurements and thus the range simulated by the STILT-ECMWF-IFS model (see Fig. A7), so we recognize that the bias estimates at low water-vapor levels could be slightly overestimated. Nevertheless, we hypothesized that the effect of that overestimation on the posterior fluxes should be minor, as water-vapor mole fractions are predominantly above 1 % at all sites. Thus, our approach provides a reference for future studies focusing on characterizing the water dependence in undried PFP samples and the effect of such a bias in an atmospheric inversion. We have quantified the effect of this systematic uncertainty on the posterior estimates, resulting in a weaker sink or a larger carbon source of 0.31 (based on the regional inversion) to 0.21 PgC yr−1 (based on the global inversion). As we have shown, assimilating a bias-corrected dataset does not affect the IAV, nor the spatial patterns of the retrieved fluxes and rather results in an upward shift (towards a source of carbon) of the posterior flux.
The water-vapor correction, when applied to each ensemble member individually (see Table 2), results in a shift of the posterior ensemble median from −0.33 to −0.04 PgC yr−1 with a posterior uncertainty of 0.33 PgC yr−1. After subtracting fires and fossil fuels, the resulting flux will still represent an ecosystem carbon sink (a negative NEE + Frivers). Considering the water-vapor effect together with the posterior uncertainty of ±0.33 PgC yr−1 amounts to a positive shift of about +0.6 PgC yr−1. Such a magnitude shift represents a large change in the carbon budget at the biogeographic Amazon scale, but note that this change is within the large spread in FNetLand estimates by different approaches (Table 2). Now, placing this in the context of the global carbon budget, an increase of +0.6 PgC yr−1 is within the uncertainty of the global net land carbon fluxes (1.1 PgC yr−1) for 2013–2022 reported in Friedlingstein et al. (2023) and would represent a third of the constraint given by atmospheric inversions with a range of 0.5–2.3 PgC yr−1 (Friedlingstein et al., 2023). Therefore, given the large uncertainties reported for the global carbon budget, it is possible to accommodate such a magnitude shift in the net land carbon flux of the biogeographic Amazon.
4.1.1 Rivers
For the carbon balance of the main branch of the Amazon River, we estimated a FNetLand close to neutral (Fig. 4). The median FNetLand for the Amazon River Flat Plains region was −0.04 ± 0.09 PgC yr−1 without water-vapor correction and 0.03 ± 0.09 PgC yr−1, considering the mean of the Global and Regional corrections. Note that this region is relatively well constrained by the atmospheric monitoring network with a mean UR of 53 %; thus the posterior estimates have the smallest spread of all regions (see Fig. 4d). After removing fires and fossil fuel emissions (0.01 and 0.007 PgC yr−1) the resulting flux, NEE + Friver, is slightly negative or close to neutral. In this work, we have considered river CO2 evasion (Friver) an explicit component of the NBE because we believe is a land flux that should be characterized independently of the NEE, in particular for the Amazon lowland area considering that at least 31 % (Fleischmann et al., 2022) can be seasonally flooded.
Using output from a process-based model (ORCHILEAK, (Hastie et al., 2019)), Botía et al. (2022) suggested that river outgassing could play an important role in representing the seasonal pattern of CO2 mole fractions at ATTO, yet there are important processes in that model that are not accounted for (i.e., aquatic plants), which is why in this study we did not use ORCHILEAK as a prior. However, if we consider Friver to be the CO2 evasion based on the ORCHILEAK model (Hastie et al., 2019) for the Amazon River Flat Plains (0.09 PgC yr−1), the resulting NEE for this area would be even more negative, suggesting that plant productivity in this region is larger than the respired CO2 from the decomposition of organic matter. Nevertheless, the growth of aquatic plants in rivers could play an important role in the net balance of riverine CO2 fluxes (Science Panel for the Amazon, 2021). This uptake of carbon, which is not taken into account in ORCHILEAK, could potentially balance out the CO2 outgassing due to decomposition of submerged organic carbon and respiration of roots, which are the main sources in ORCHILEAK for the CO2 evasion. Our results for the Amazon River Flat Plains suggest the region is close to neutral, but to partition the components NEE + Friver using an atmospheric inversion, bottom-up estimates for rivers should consider aquatic plant productivity, which is a crucial process to determine net river evasion or uptake.
4.2 Sink-to-source gradient between the biogeographic Amazon and the Cerrado and Caatinga
Our results suggest that the Amazon is a net carbon sink and that the Cerrado and Caatinga biomes are possibly net sources of carbon, even after removing fires in some individual inversions we obtain a positive NBE. This is in contrast to Gatti et al. (2021a) and Basso et al. (2023). Gatti et al. (2021a) suggested that vegetation of the southeast of the Amazon was losing the capacity to capture carbon, reporting on average a positive NBE for the years 2010 to 2018, thus locating a net source of carbon within the Amazon in the southeast regions. Basso et al. (2023) report a posterior carbon source in the eastern part of their domain (see Fig. A11 in Basso et al., 2023). In both studies, the analyses were limited to the Amazon sensu stricto + (as defined in Table 2) but used the same aircraft data as we used in this study. Therefore, we believe that the main reasons explaining the differences reported here are as follows: (1) limiting their region of interest to the Amazon boundaries, while using atmospheric data that are influenced by a footprint that goes beyond the Amazon, and (2) having a coarse global inversion in which the boundaries between the Amazon biome and the Cerrado are not well defined, leading to attributing sources from the Cerrado to the Amazon.
Rosan et al. (2024)Rosan et al. (2024)Rosan et al. (2024)Basso et al. (2023)Rosan et al. (2024)Basso et al. (2023)Gatti et al. (2021a)Table 2Comparison of FNetLand for the Amazon region based on top-down and bottom-up approaches averaged over 2010–2018. We present estimates for two different definitions of Amazon boundaries, the biogeographic Amazon and the Amazon sensu stricto+. The latter corresponds to four subregions defined in Eva et al. (2005): Amazon sensu stricto, Andes, Guiana, and Gurupi. We present our estimates for the Amazon sensu stricto+, so the area is comparable to previous top-down studies. The acronym WVC stands for water-vapor correction. Units in PgC yr−1.

The spatial attribution of fluxes in Gatti et al. (2021a) is performed using a column budget technique. In this method, the residence time of air parcels over each region of influence for each aircraft site is used to account for the time and the area that contribute to an enhancement or depletion of CO2 mole fractions at the site relative to the background. In our study, a similar source is needed to match the atmospheric profile data, but it is further east outside the Amazon bounds. This solution is possible in our system with individual (though correlated) grid points that can be assigned extra flux, but it is not possible in the setup of Gatti et al. (2021a), where a mean flux rate is assigned to the areas of influence of the airborne measurements, which is limited to the Amazon boundary. Thus, the degrees of freedom to place sources/sinks in specific biomes further upwind are not present. Sensitivity tests in Botía (2022) indicate that our result is robust against changing the spatial error structure in the inversion settings. While recognizing such spatial differences between the studies, we nevertheless conclude that the east-to-west gradient within Amazonia that Gatti et al. (2021a) report is not seen in our posterior ensemble median estimates. Interestingly, without the water-vapor correction an individual ensemble member (i.e., s10sam) does result in a source (0.03 gC m−2 d−1) in the Brazilian Shield Moist Forests but still having a larger one (0.12 gC m−2 d−1) in the Cerrado and Caatinga. Therefore, it is likely that the atmospheric signal of a carbon source is unmistakably in the data but is attributed to different spatial regions by the different methodologies. Understanding this discrepancy and determining the location of the eastern Brazilian CO2 source should have the highest priority in further work. Next, despite these discrepancies, we speculate on what could be driving a source of carbon in the Cerrado and Caatinga region.
The Cerrado and Caatinga biomes cover approximately 35 % of the Brazilian land mass (Beuchle et al., 2015) and are characterized by a savanna-type ecosystem (Cerrado) (Sano et al., 2007) and seasonally dry tropical forest (Caatinga) (Prado, 2003). Both biomes have a marked seasonality in precipitation, with mean annual precipitation of less than 750 mm yr−1 in the Caatinga (Prado, 2003; Leal et al., 2005) and from 800 to 2000 mm yr−1 in the Cerrado (Ratter et al., 1997; Rodrigues et al., 2022). Studies focusing on ecosystem functioning conducted in both biomes using eddy covariance measurements have shown that these ecosystems have similar seasonal patterns in net ecosystem exchange. In general, with the onset of the rainy season, a higher carbon uptake is observed over converted pastures and over natural vegetation (Miranda et al., 1997; Varella et al., 2004; Santos et al., 2004; Silva et al., 2017; Mendes et al., 2020; Alves et al., 2021). Studies focusing on soil CO2 emissions comparing converted pasture and both natural ecosystems, Caatinga (Ribeiro et al., 2016) and Cerrado (Varella et al., 2004), found no significant differences in magnitude between the pasture and the natural ecosystem. Both coincided with higher CO2 emissions at the beginning of the rainy season (Varella et al., 2004; Ribeiro et al., 2016). The findings of Ribeiro et al. (2016) are in line with Mendes et al. (2020), where they observed an increase in ecosystem respiration with the onset of the rainy season but offset by GPP. Integrated over time, these ecosystems in their natural form or converted to pasture seemed to be carbon sinks when no disturbance is taken into account (Santos et al., 2004; Bustamante et al., 2012; Silva et al., 2017; Mendes et al., 2020; Alves et al., 2021).
However, these biomes have suffered considerable loss of natural vegetation due to the expansion of the agricultural frontier (Beuchle et al., 2015; Alencar et al., 2019). Beuchle et al. (2015) found that over the period between 1990 and 2010, both biomes had a continued net loss of natural vegetation. More recently, most of the agricultural expansion in the Cerrado has been concentrated in a region called MATOPIBA, which refers to portions of the Maranhão, Tocantins, Piauí, and Baia states (Spera et al., 2016; da Conceição Bispo et al., 2024). Drought periods in the Caatinga can extend over years (Leal et al., 2005), making agricultural activities more difficult to sustain, yet considerable pasture conversion for extensive livestock has changed the Caatinga landscape (Leal et al., 2005). Fire is used for the conversion of forest and shrublands to pasture or croplands; thus that conversion leads to fire CO2 emissions (van der Werf et al., 2010; Pivello, 2011; van der Werf et al., 2017). The Cerrado biome was found to have higher fire CO2 emissions than the Caatinga, with an increasing trend in recent years (da Silva Junior et al., 2020). Moreover, the annual fire regime fluctuates between naturally occurring low-intensity fires at the end of the wet season ignited by lightning and anthropogenic high-intensity fires at the end of the dry season (Ramos-Neto and Pivello, 2000; Pletsch et al., 2022). Frequent fires can lead to aboveground biomass reduction, changing the ecosystem from a sink to a source of carbon (de Azevedo et al., 2020). Moreover, Bustamante et al. (2012) found that a large portion of the CO2 emissions from pasture management (i.e., burning practices) in Brazil originated in the Cerrado. Throughout 2003 to 2013, changes in vegetation stocks due to cropland conversion in the Cerrado, and specifically in the MATOPIBA region, contributed to 33 % of the forest carbon emissions (Noojipady et al., 2017).
Given these studies and our findings, carbon emissions in these two biomes but primarily in the Cerrado can be grouped into two categories. The first one is associated directly with fires (either from deforestation or pasture management), and the second arises from degradation after the conversion of natural vegetation to pastures or croplands. For the first category, we showed that fire emissions increased from prior to posterior in the Cerrado and Caatinga region by a factor of 2.3, which is broadly consistent with an increase in burned area from GFED4 to GFED5, by a factor of 1.7. Emissions in the second category are associated with changes in carbon stocks, decomposition, and sink-to-source shifts due to climate change (Bustamante et al., 2012; Marengo et al., 2022). Having this in mind, we hypothesize that the carbon source in the semi-arid ecosystems of the Cerrado and Caatinga given by the atmospheric inversion is likely due to agricultural expansion in the Cerrado, mainly from the second category mentioned above. On top, their capacity for secondary forest regrowth is compromised. This contrasts with the Amazon biome, which is highly resilient (Sakschewski et al., 2016; Poorter et al., 2021) and has shown a relatively rapid recovery of aboveground biomass by secondary forest growth (Poorter et al., 2016) with considerable potential to capture carbon (Heinrich et al., 2021, 2023). It is important to note here that Amazon forest resilience is heavily affected by anthropogenic disturbances (Fawcett et al., 2023; Wang et al., 2024), and it seems to have been decreasing since 2000 (Boulton et al., 2022), although this finding has been questioned (Tao et al., 2023). This would make the carbon source we find in this study not only large but likely also influence the regional carbon balance for decades to come. Therefore, the hypothesis of the Cerrado and Caatinga source, driven by changes in carbon stocks and fires, should be part of a future study in which additional ways of testing the robustness of the inversion results are explored. For example, comparing several inversion systems using the same data constraint could shed light on the spatial gradients reported here. Finally, an assessment of having different or even multiple global inversions to constrain the far-field contribution in the regional inversion should also be investigated.
In this study, we have integrated in situ CO2 measurements from the Amazon Tall Tower Observatory together with a network of airborne vertical profiles in the CarboScope Regional inversion system to estimate carbon fluxes in tropical South America. Our analysis is limited to regions with uncertainty reduction above 18 %, which amounts to 67 % of the land mass in our domain. Among these regions, the Amazon River Flat Plains, the Brazilian Shield Moist Forests, and to a lesser extent the Guianan Shield Moist Forests are better constrained than others. We have quantified and reported important uncertainties associated with the data and methodology used in this work. Part of this was the assessment of how systematic uncertainties due to water vapor in the aircraft vertical profiles affect the estimated fluxes in our inversion system. In principle, we recommend drying the air during sampling time to avoid systematic uncertainties and their propagation to flux estimates in an inversion system. Our analysis suggests that including the water-vapor correction changes the posterior ensemble median from −0.33 to −0.04 PgC yr−1 with a posterior uncertainty of 0.33 PgC yr−1 for the Amazon and for the Cerrado and Caatinga from 0.31 to 0.50 PgC yr−1, with an uncertainty of 0.24 PgC yr−1. Note that other than the shift in magnitude, the interannual variability or the spatial gradients of the posterior fluxes do not change.
Therefore, our results suggest a sink–source gradient between the Amazon (sink) and the Cerrado and Caatinga (source). This finding, which is in contrast to other studies (Gatti et al., 2021a; Basso et al., 2023), is explained by two reasons. The first one is that we do not limit our analysis to the Amazon boundaries; instead, we take into account the extended surface influence of the vertical profiles, which goes beyond the Amazon. The second reason is associated with a higher spatial resolution in our regional inversion system (0.25×0.25°) than in Basso et al. (2023). The latter allows us to integrate fluxes over the analysis regions with improved precision. This is particularly relevant considering that fires occur on – but are not limited to – the border of the Amazon and the Cerrado, so when having coarser grids, one can attribute Cerrado fires to the Amazon.
Table A1Mean effect on the posterior estimates of assimilating bias-corrected vertical profiles using CarboScope Global and Regional. The difference was calculated postFluxWVC − postFluxNonWVC; therefore positive numbers indicate that the WVC posterior flux is larger. Units in PgC yr−1.
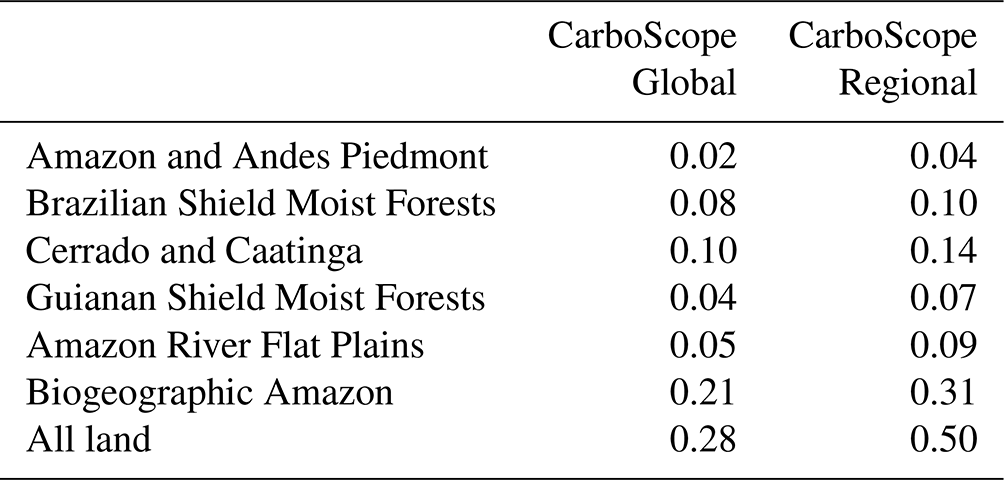
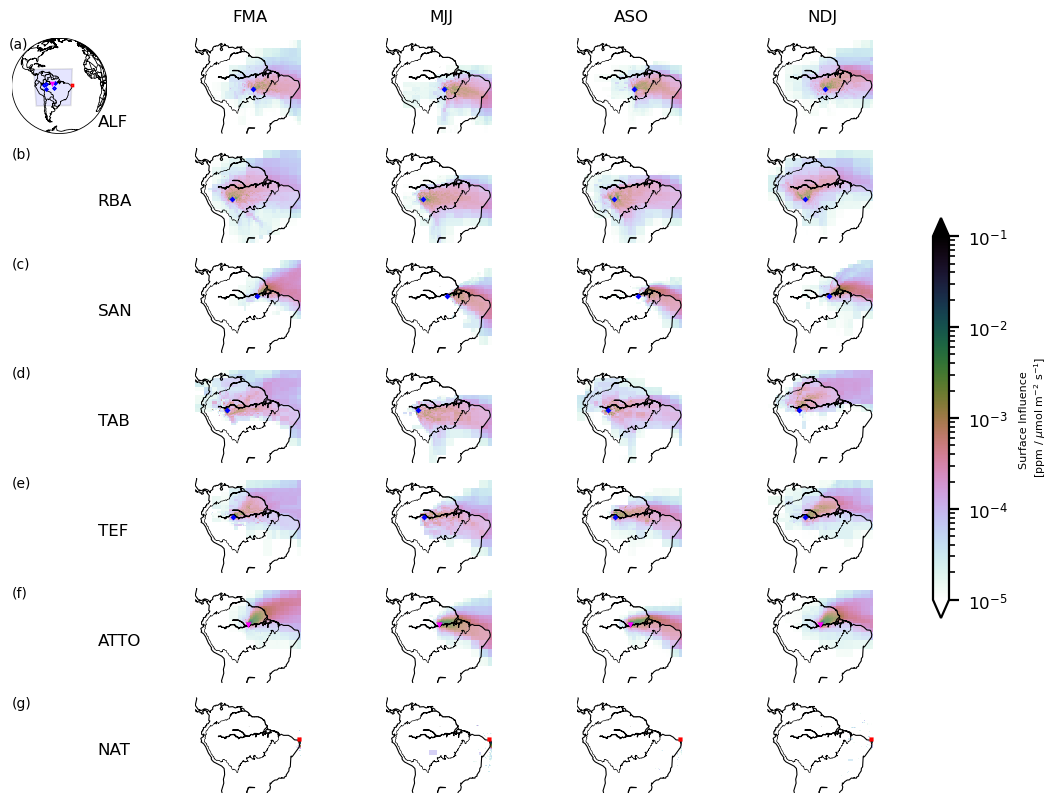
Figure A1Seasonal surface influence for each station used in the regional inversion. The averaging period for each station corresponds to the period of data availability, which is site-specific; see Fig. 2.
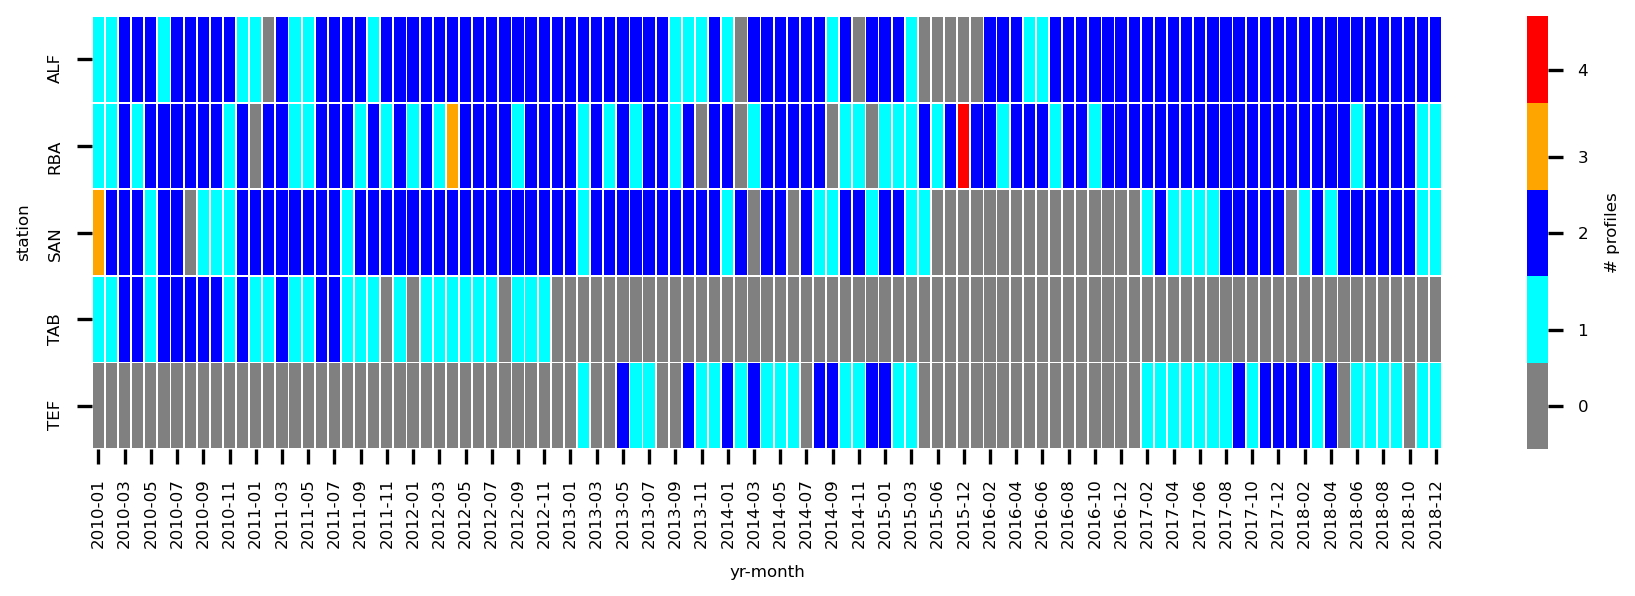
Figure A2Number of aircraft profiles per month over the period of interest in the inversion. An aircraft profile goes up until 4500 m a.s.l. and on average collects samples at 14 heights.
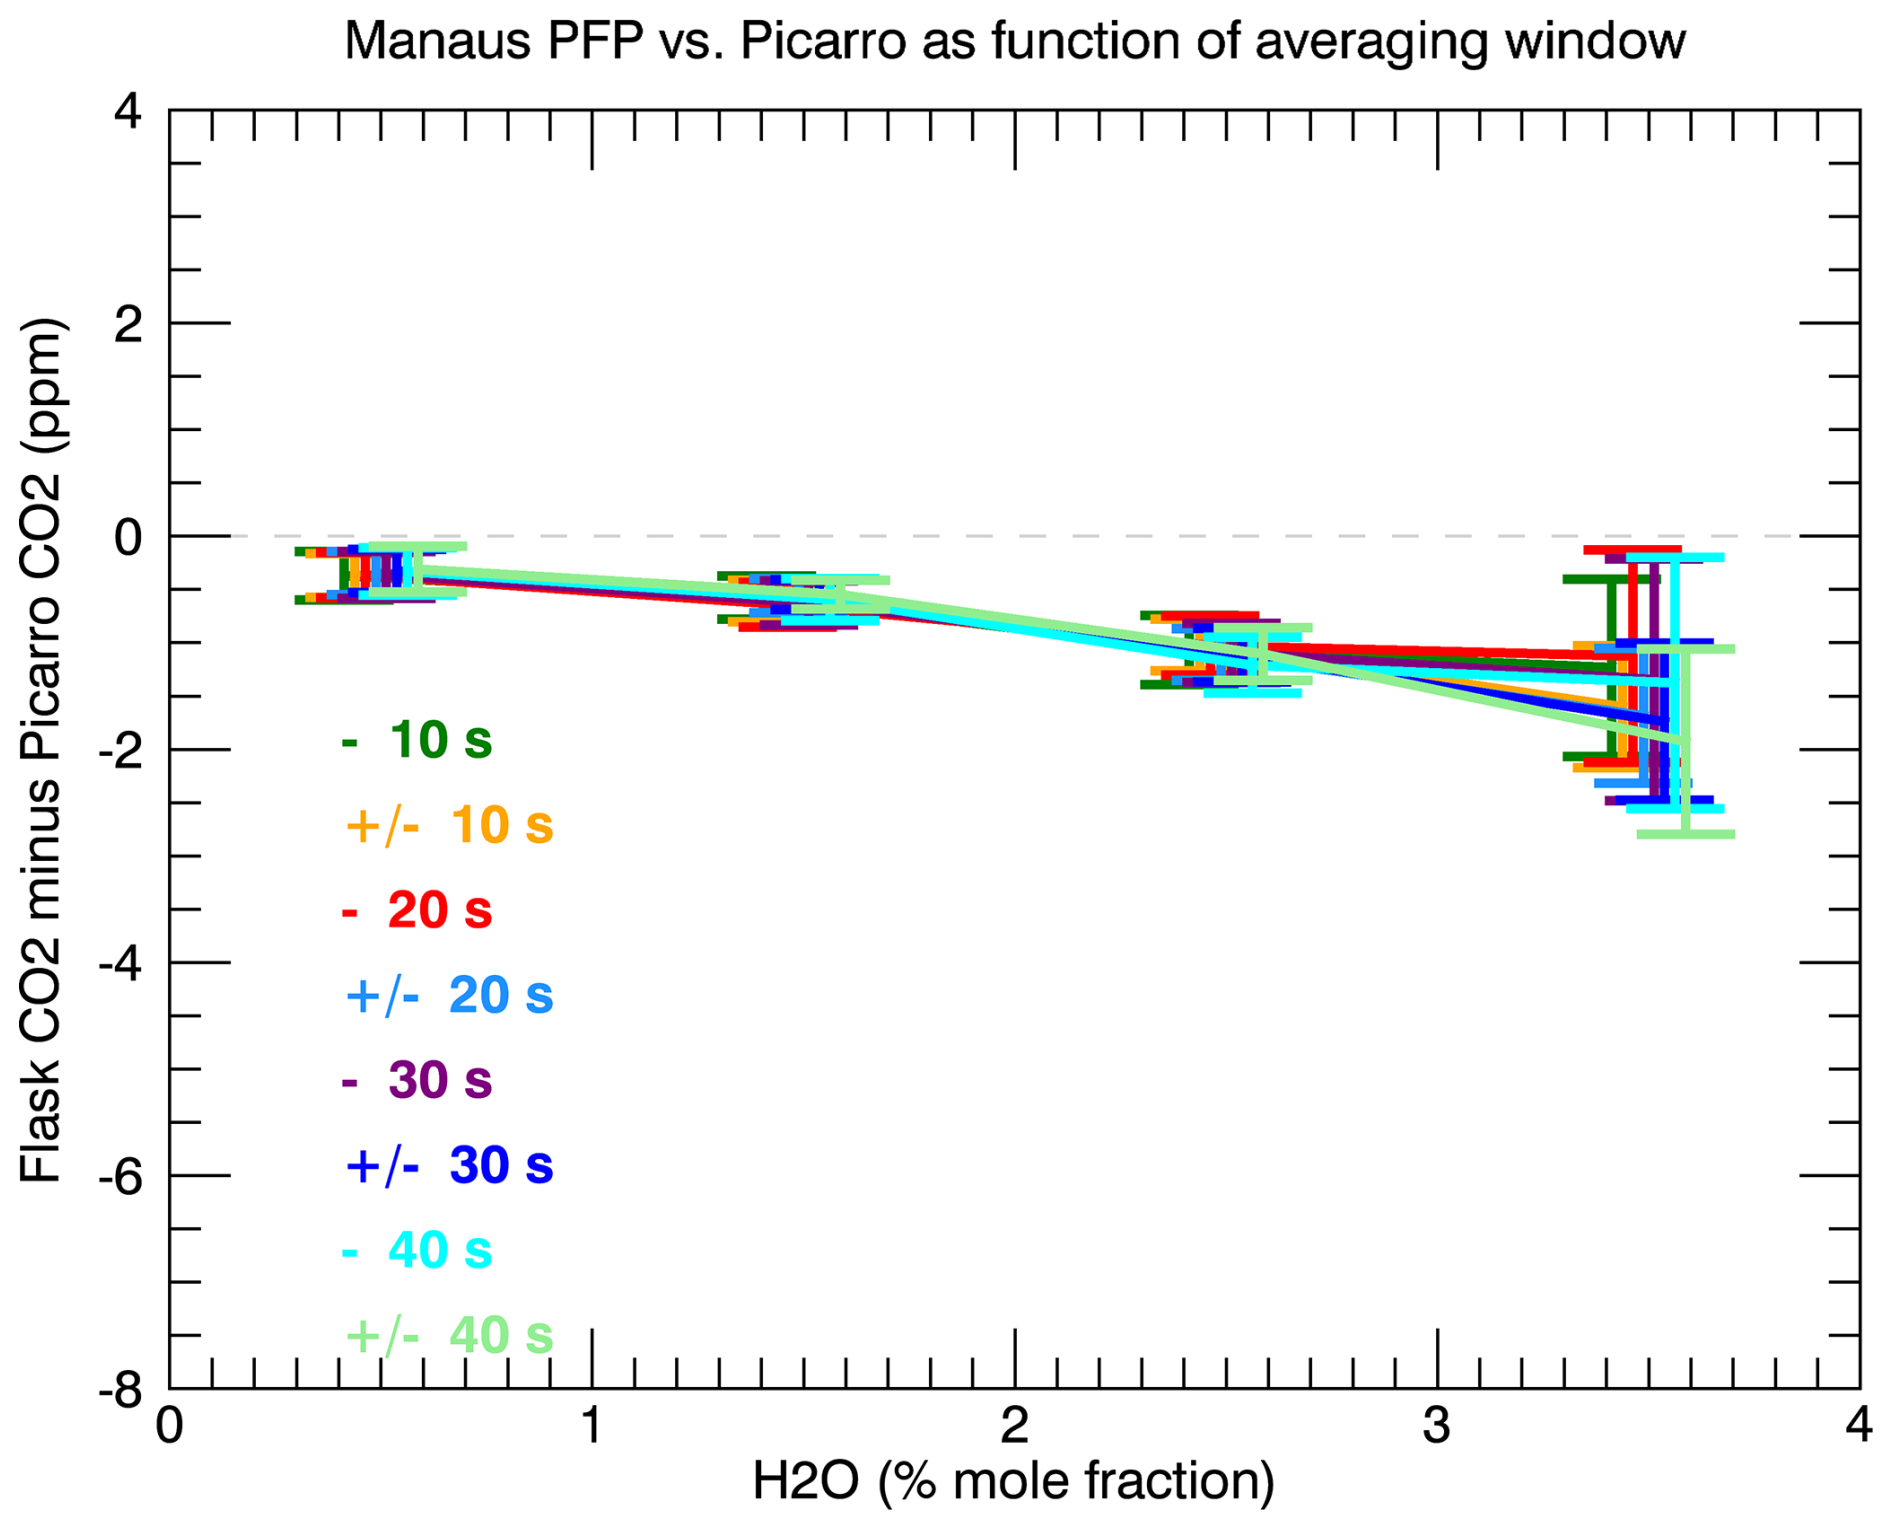
Figure A3Bias between PFP and CRDS analyzer (Picarro Inc. model G2401-m) CO2 mole fractions at MAN as a function of water-vapor mole fraction measured by the CRDS analyzer.
Table A2Eddy flux sites used to calibrate the VPRM parameters.
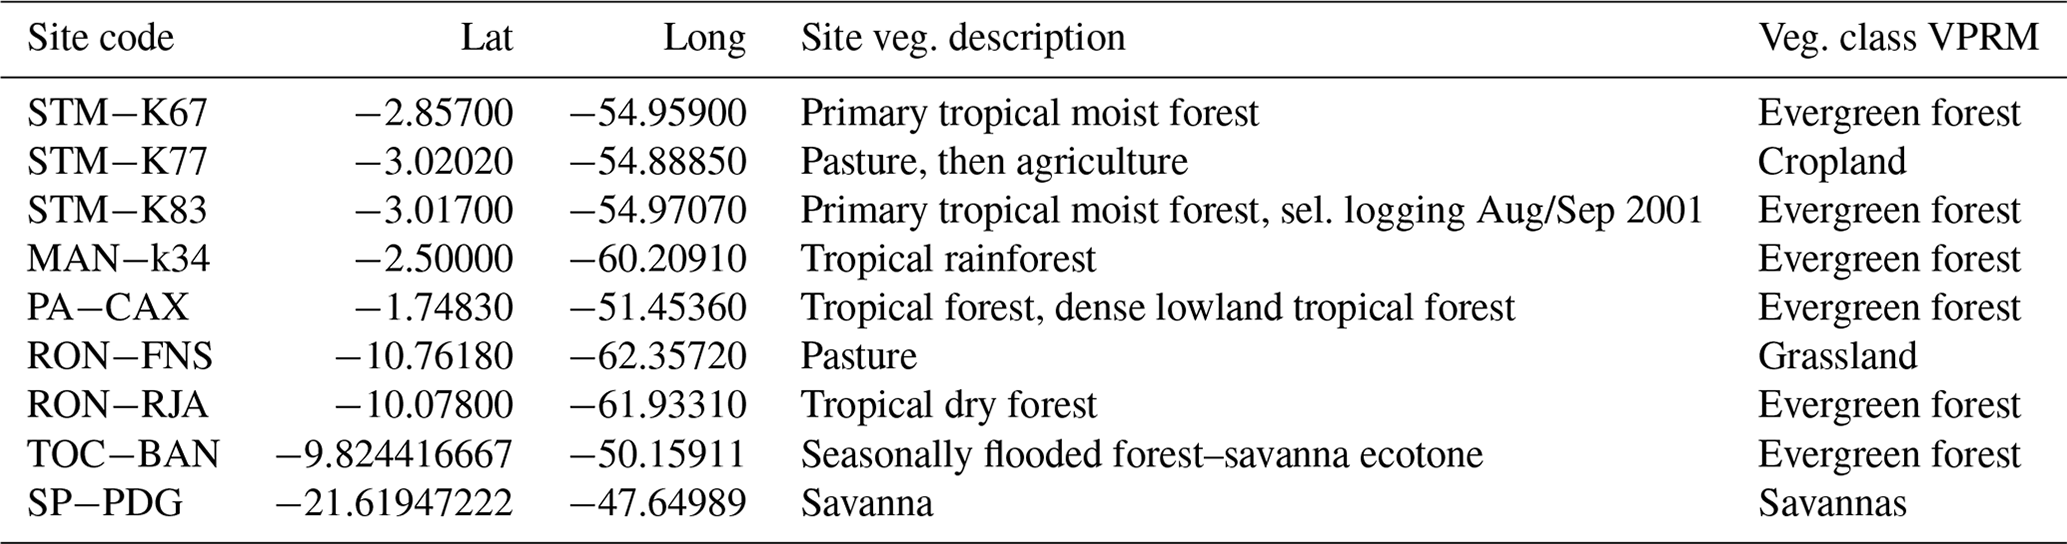
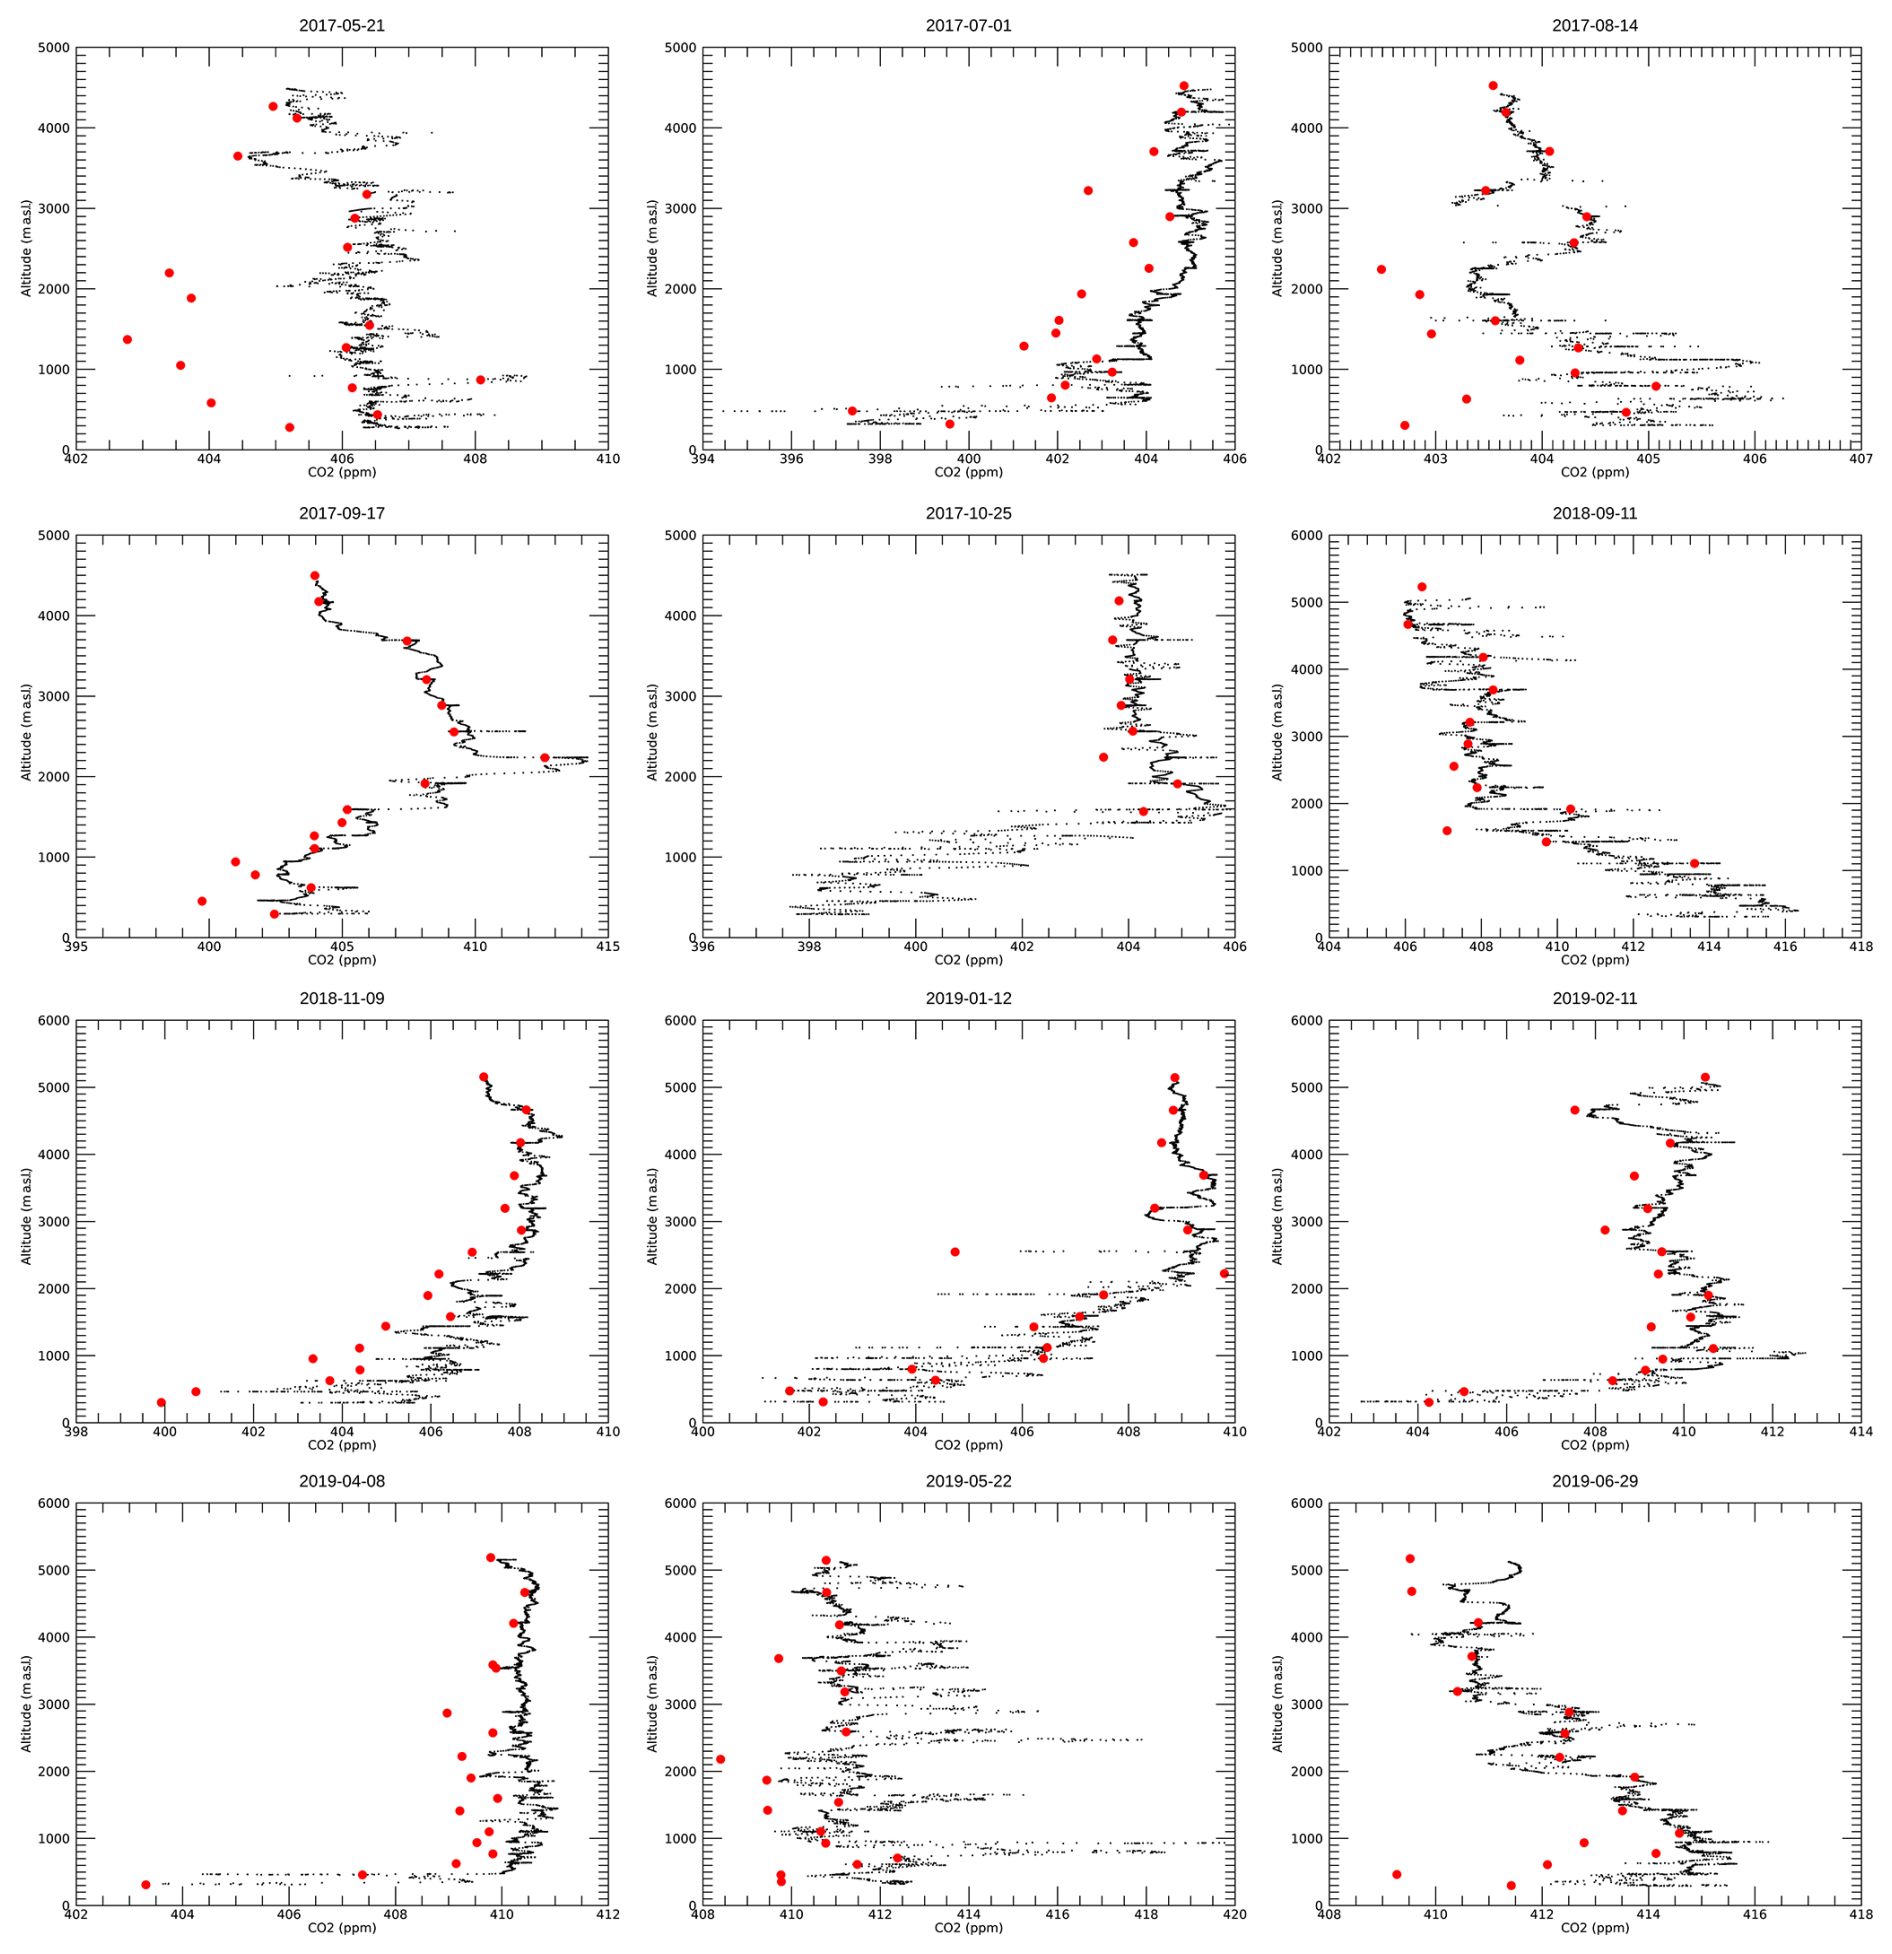
Figure A4Individual vertical profiles with the in situ (black dots) and the discrete PFP samples in Manaus (MAN). Each in situ point is a 1 Hz interpolated value from the calibrated native CRDS signal at 0.3–0.4 Hz.
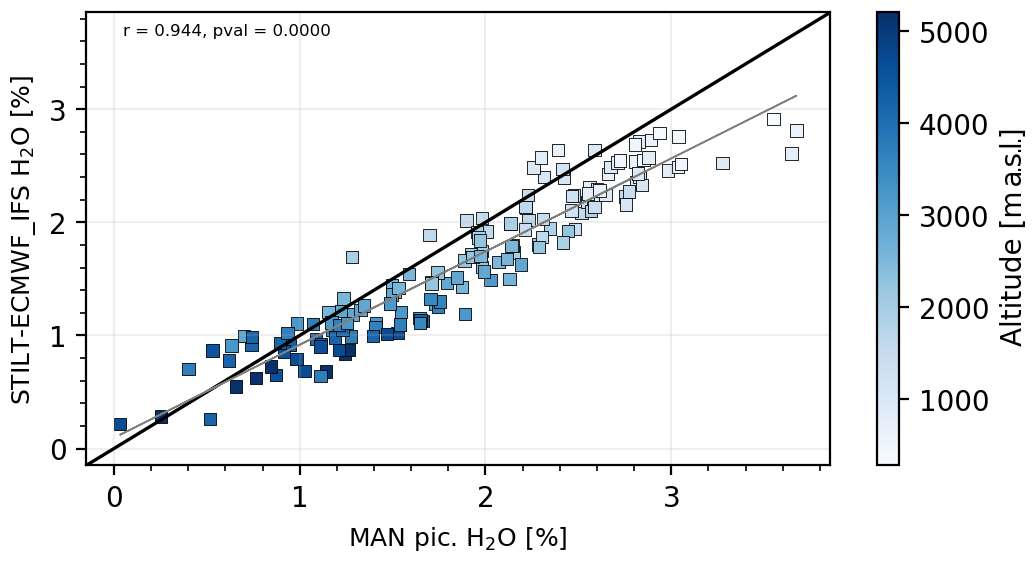
Figure A5Correlation between STILT ECMWF-IFS water vapor and the measured water mole fraction at the Manaus flights with a Picarro (model G2401-m). The grey line corresponds to the predicted y using a linear regression.
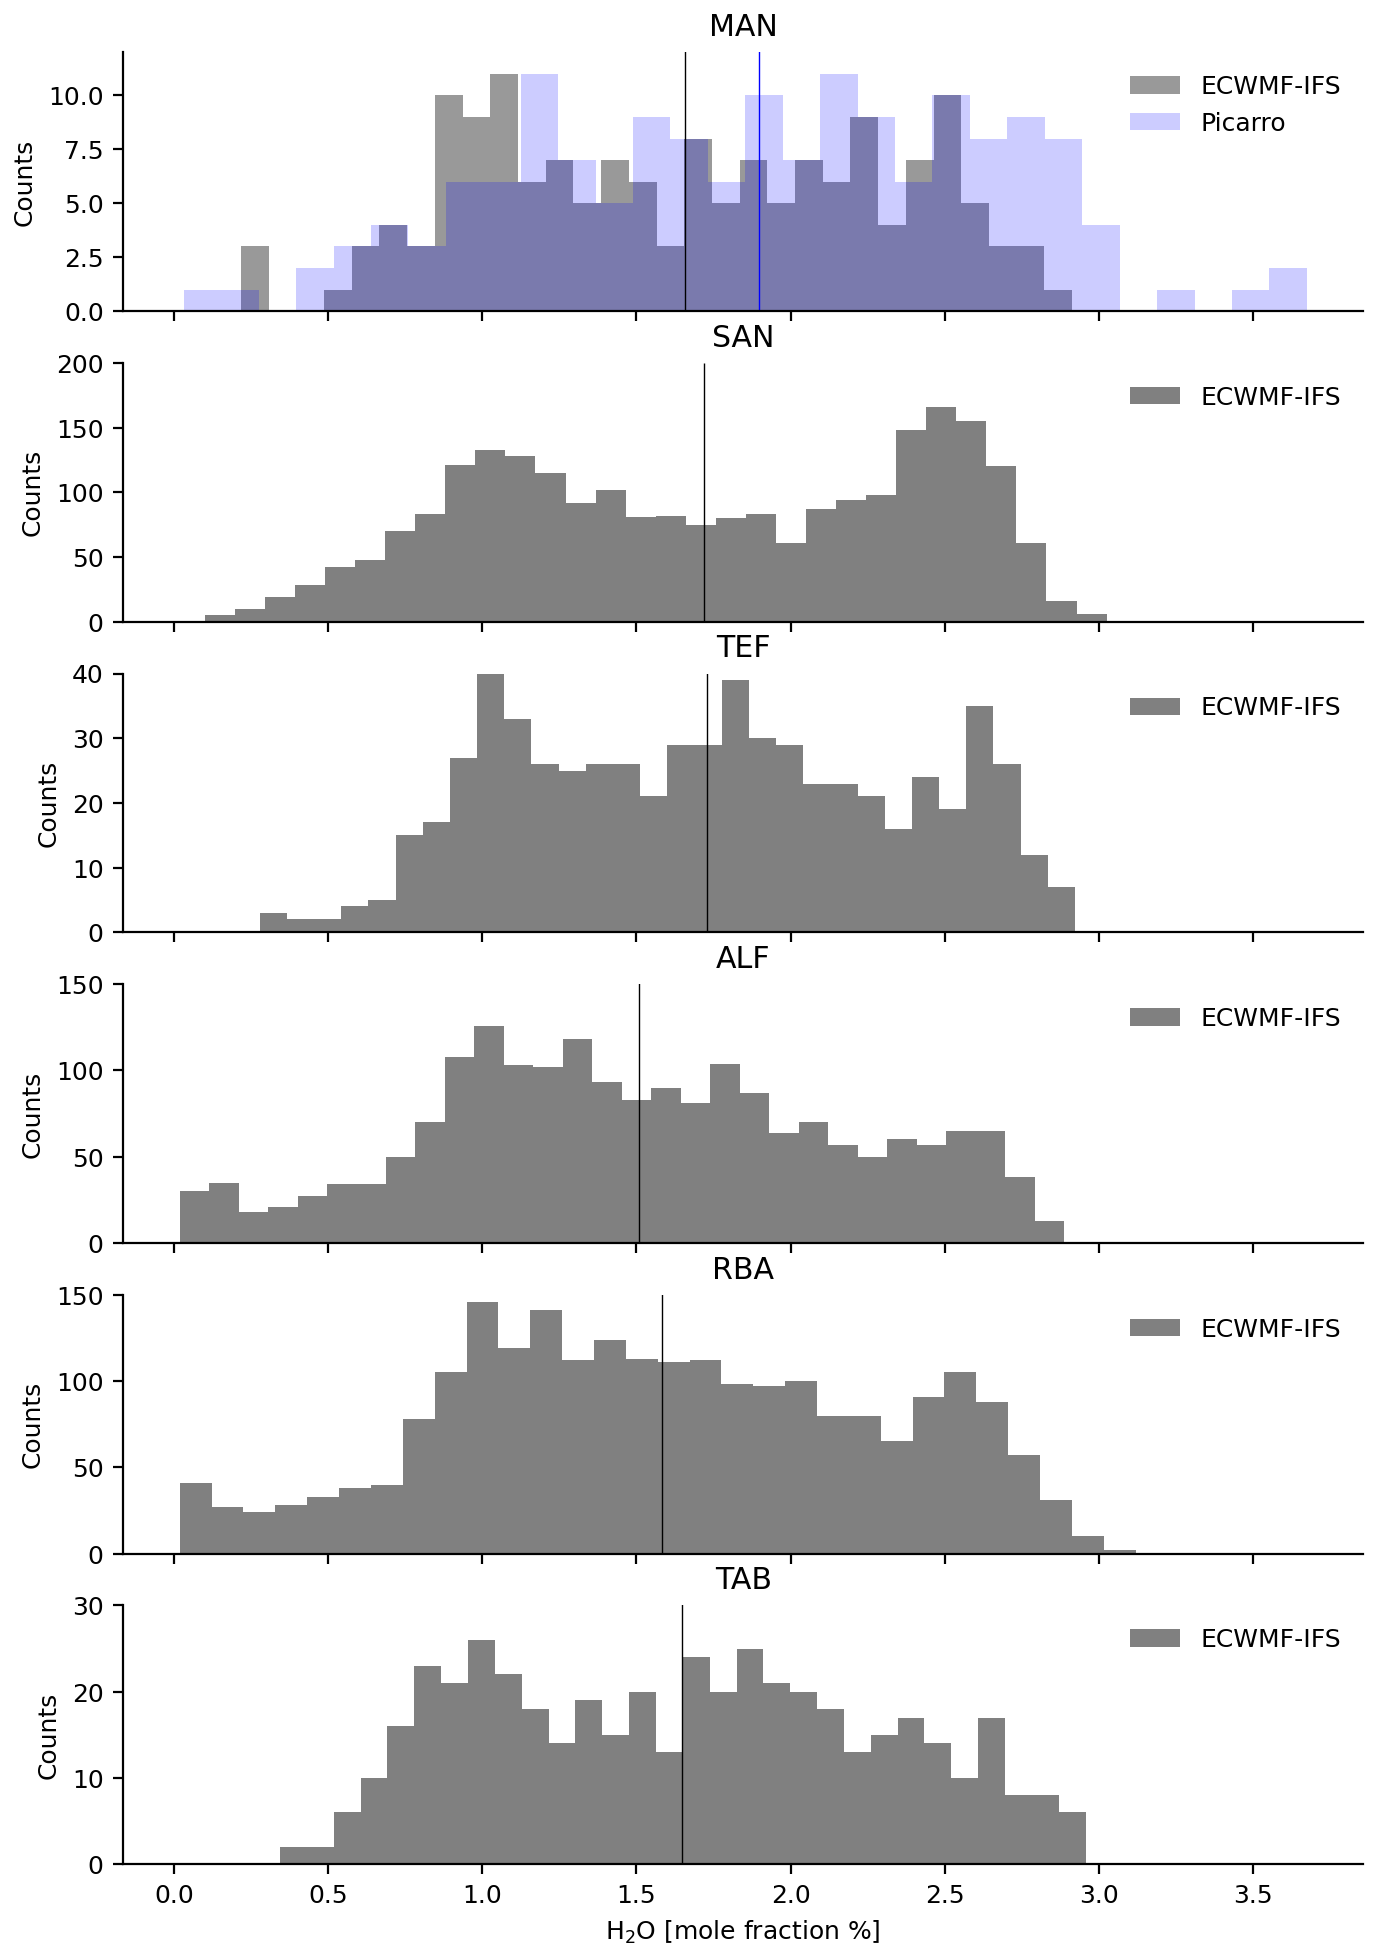
Figure A6Distribution of water-vapor mole fractions at all sites extracted from ECMWF-IFS and the measurements at Manaus.
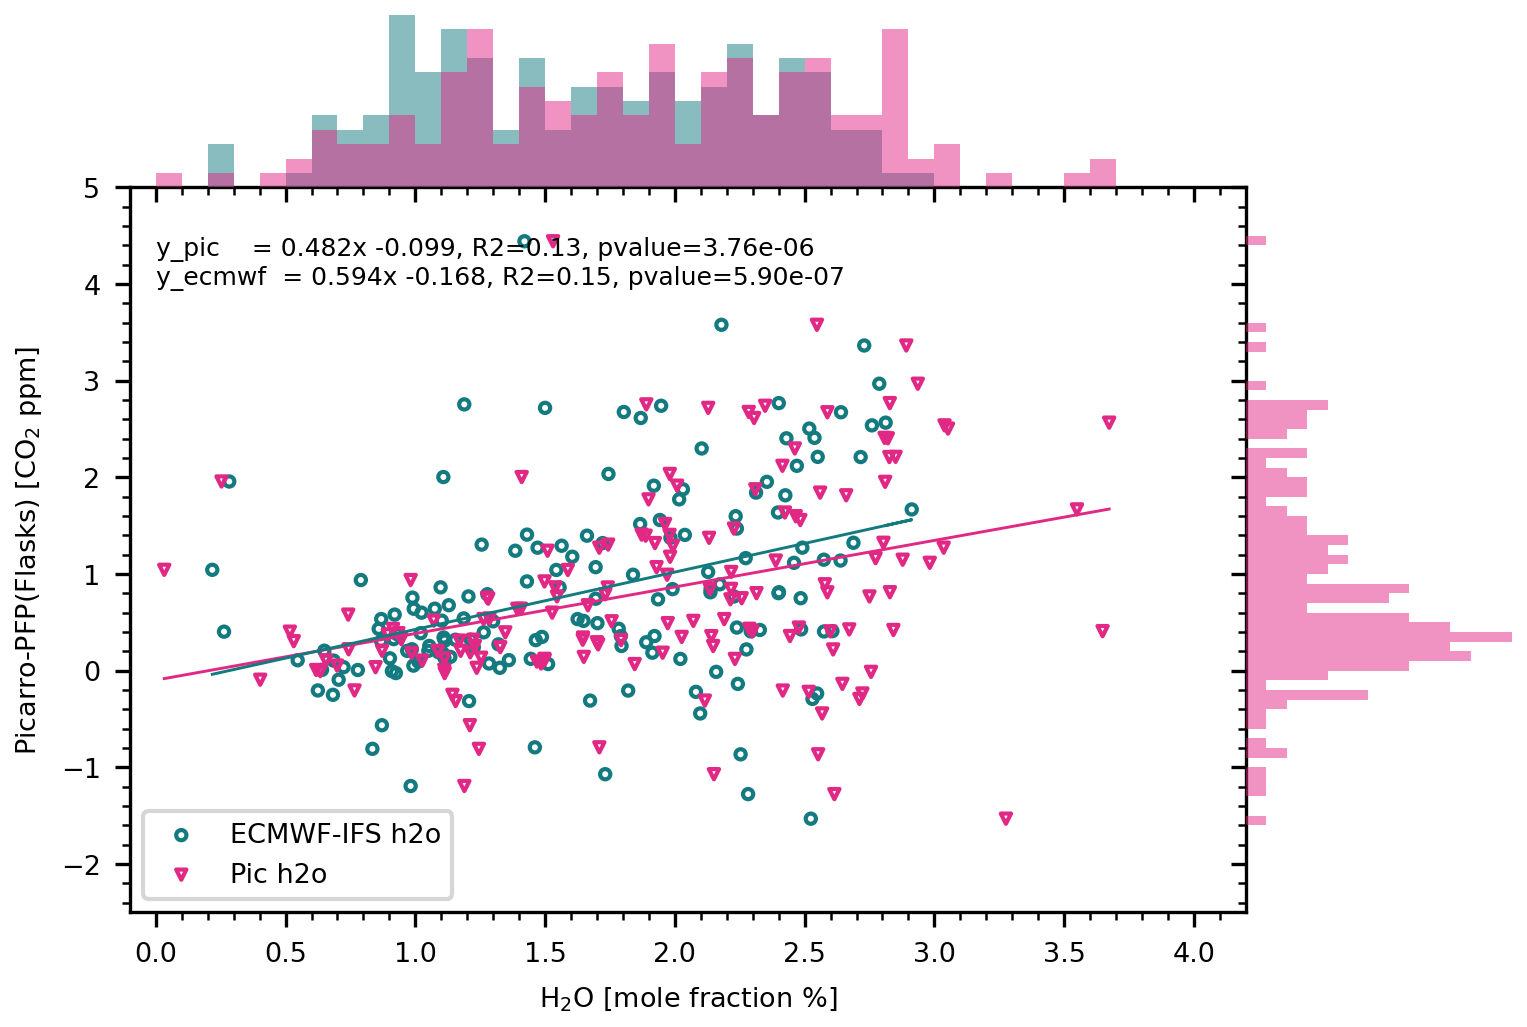
Figure A7Bias between Picarro (model G2401-m) and PFP CO2 mole fractions at Manaus as a function of water-vapor mole fraction measured by the Picarro (model G2401-m) and also extracted from ECMWF-IFS.
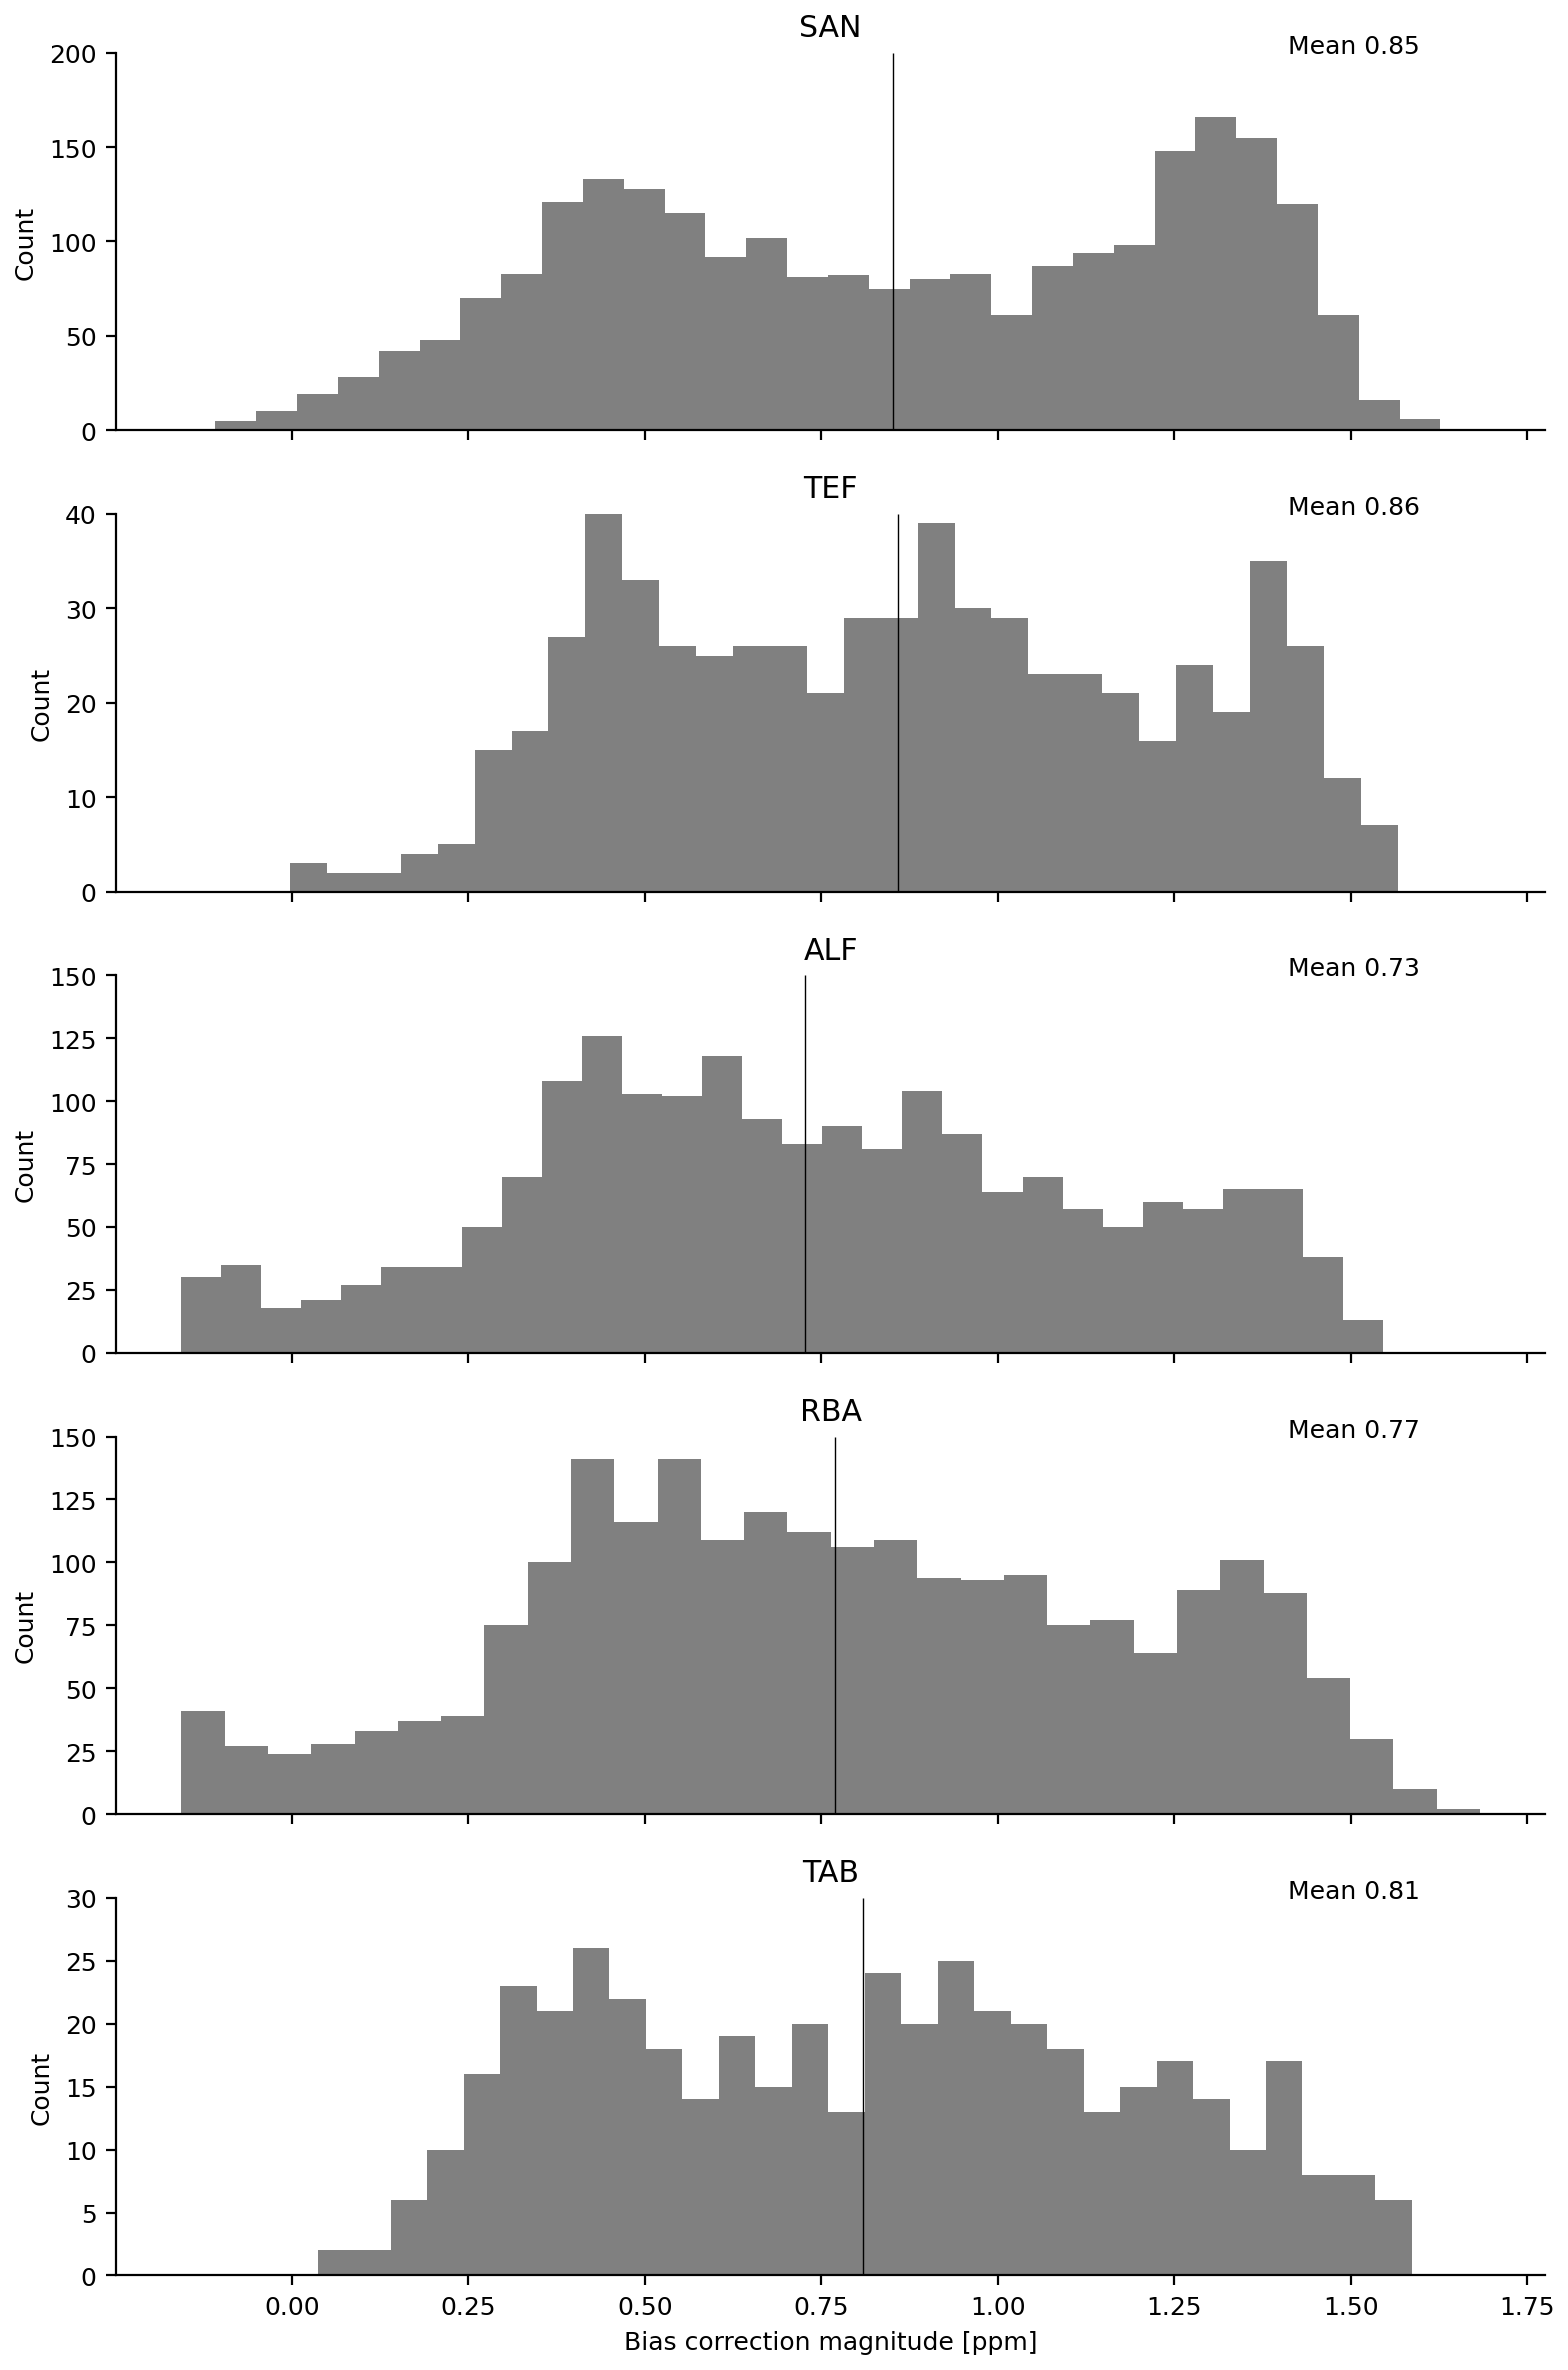
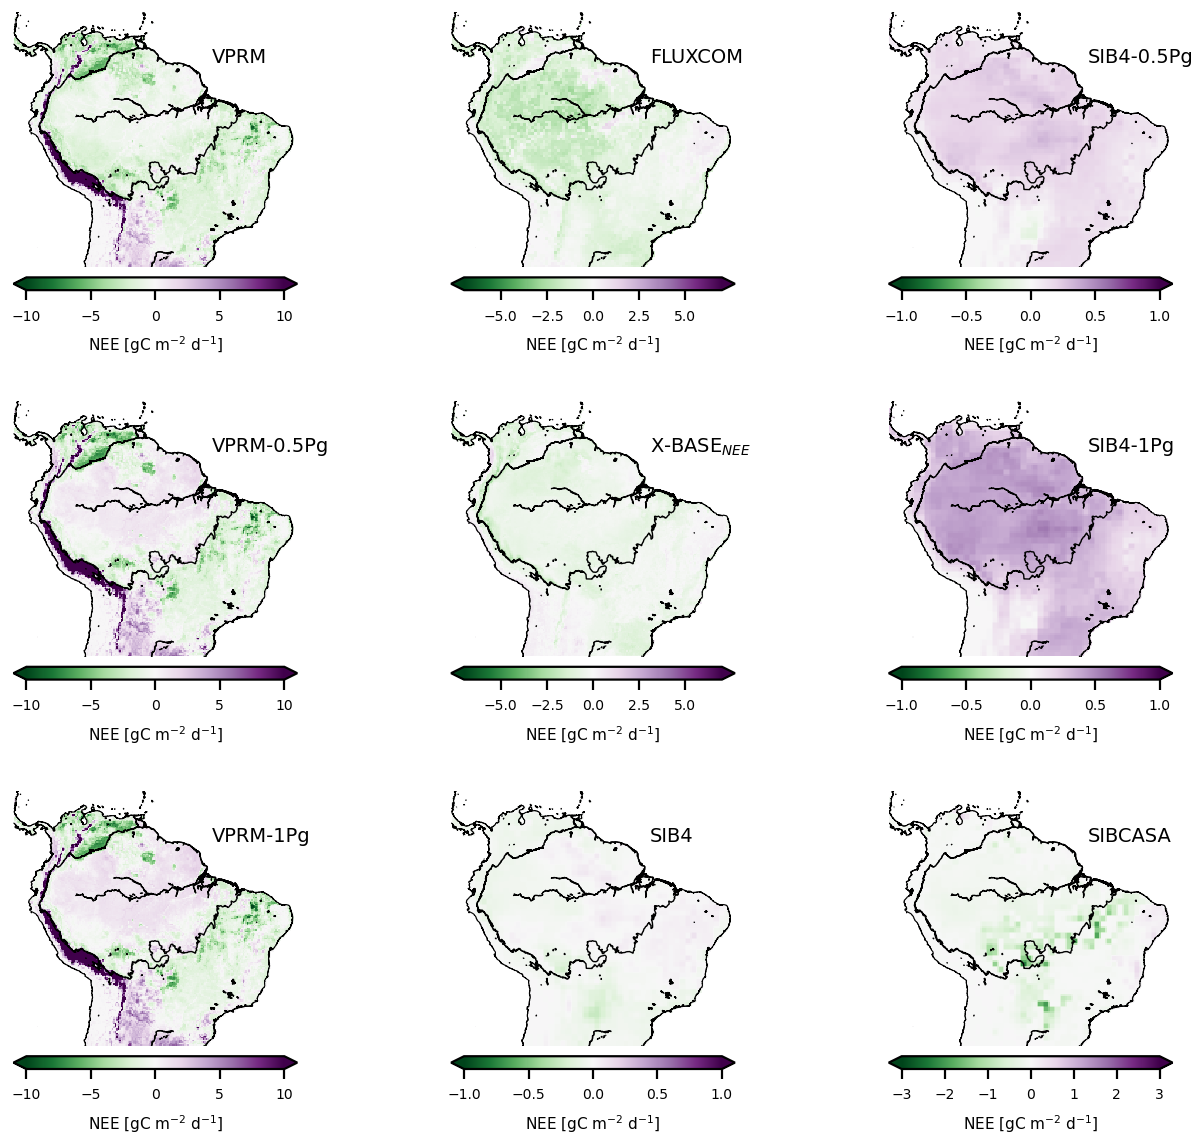
Figure A9Prior mean NEE over 2010–2018 for several of the models used. Note the different range in the color bar.
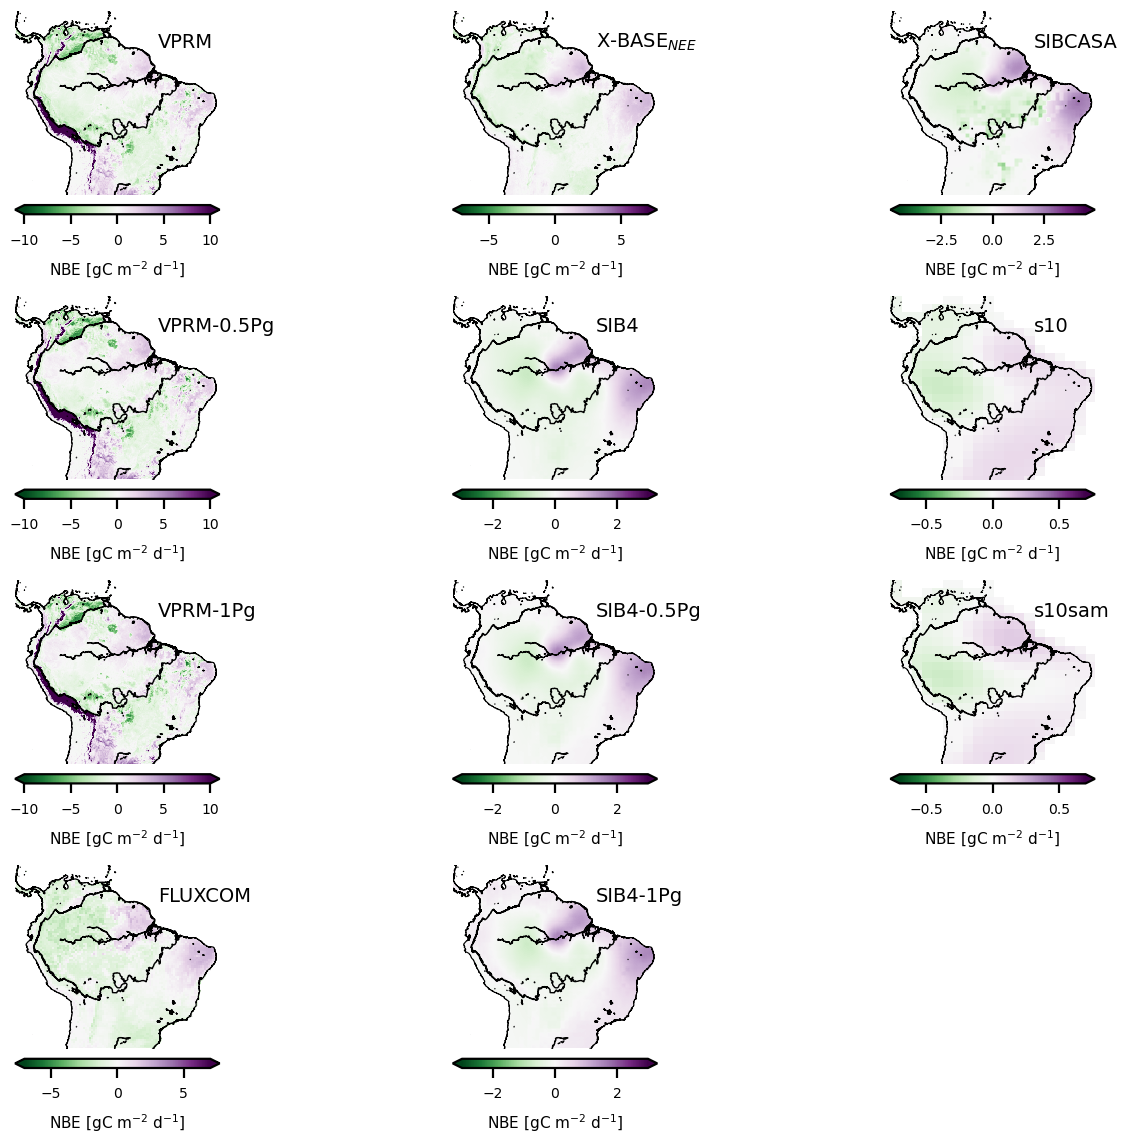
Figure A10Posterior mean NBE over 2010–2018 for several of the models used. Note the different range in the color bar.
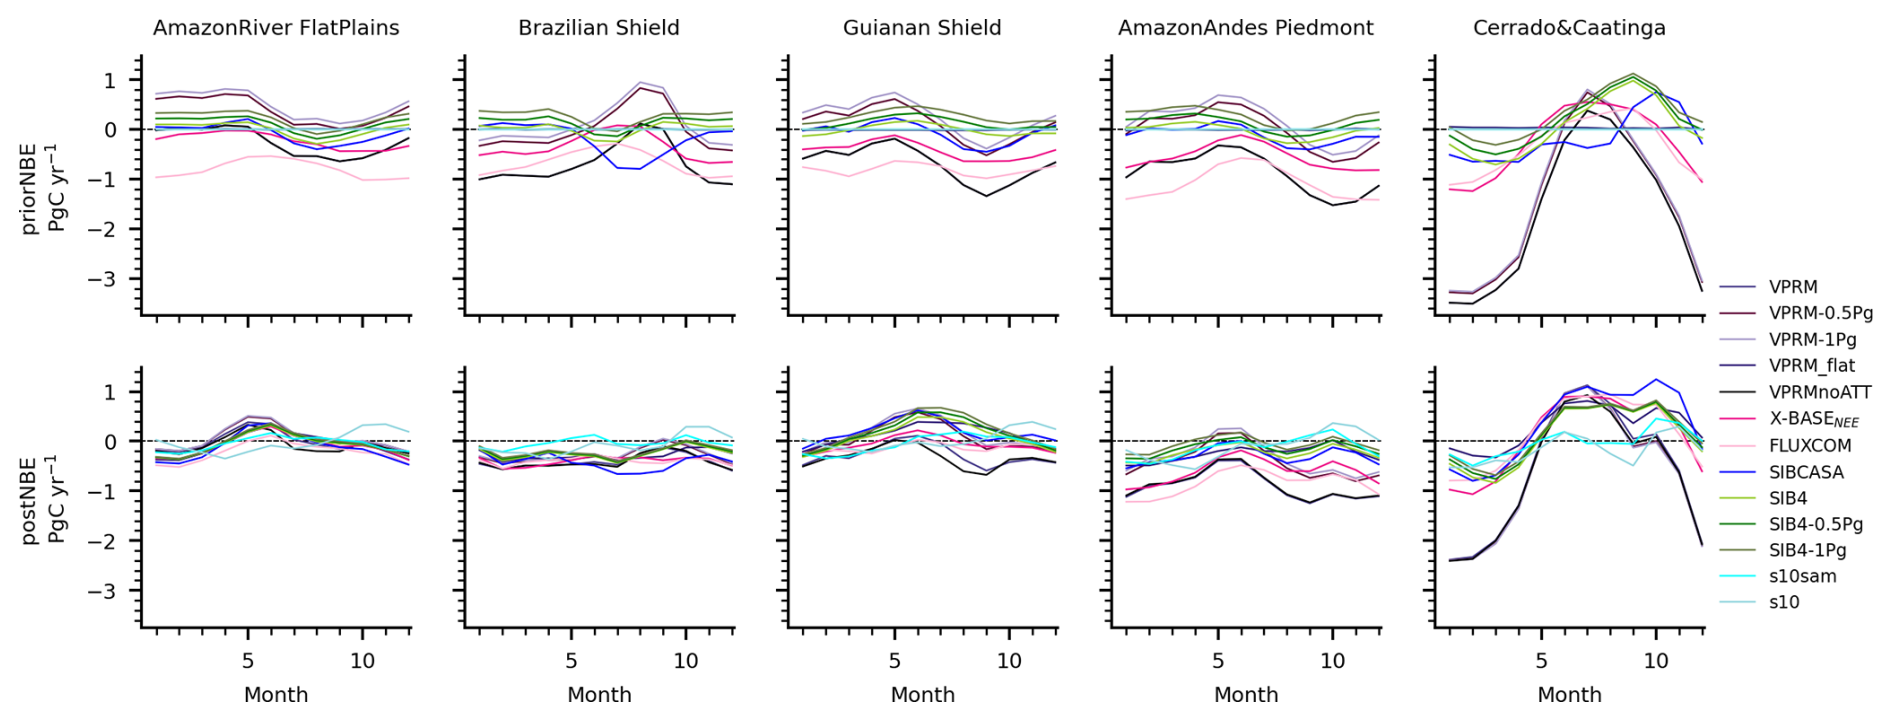
Figure A11Prior (upper panel) and posterior (lower panel) seasonal cycle of NBE for each ensemble member aggregated for each region of interest.
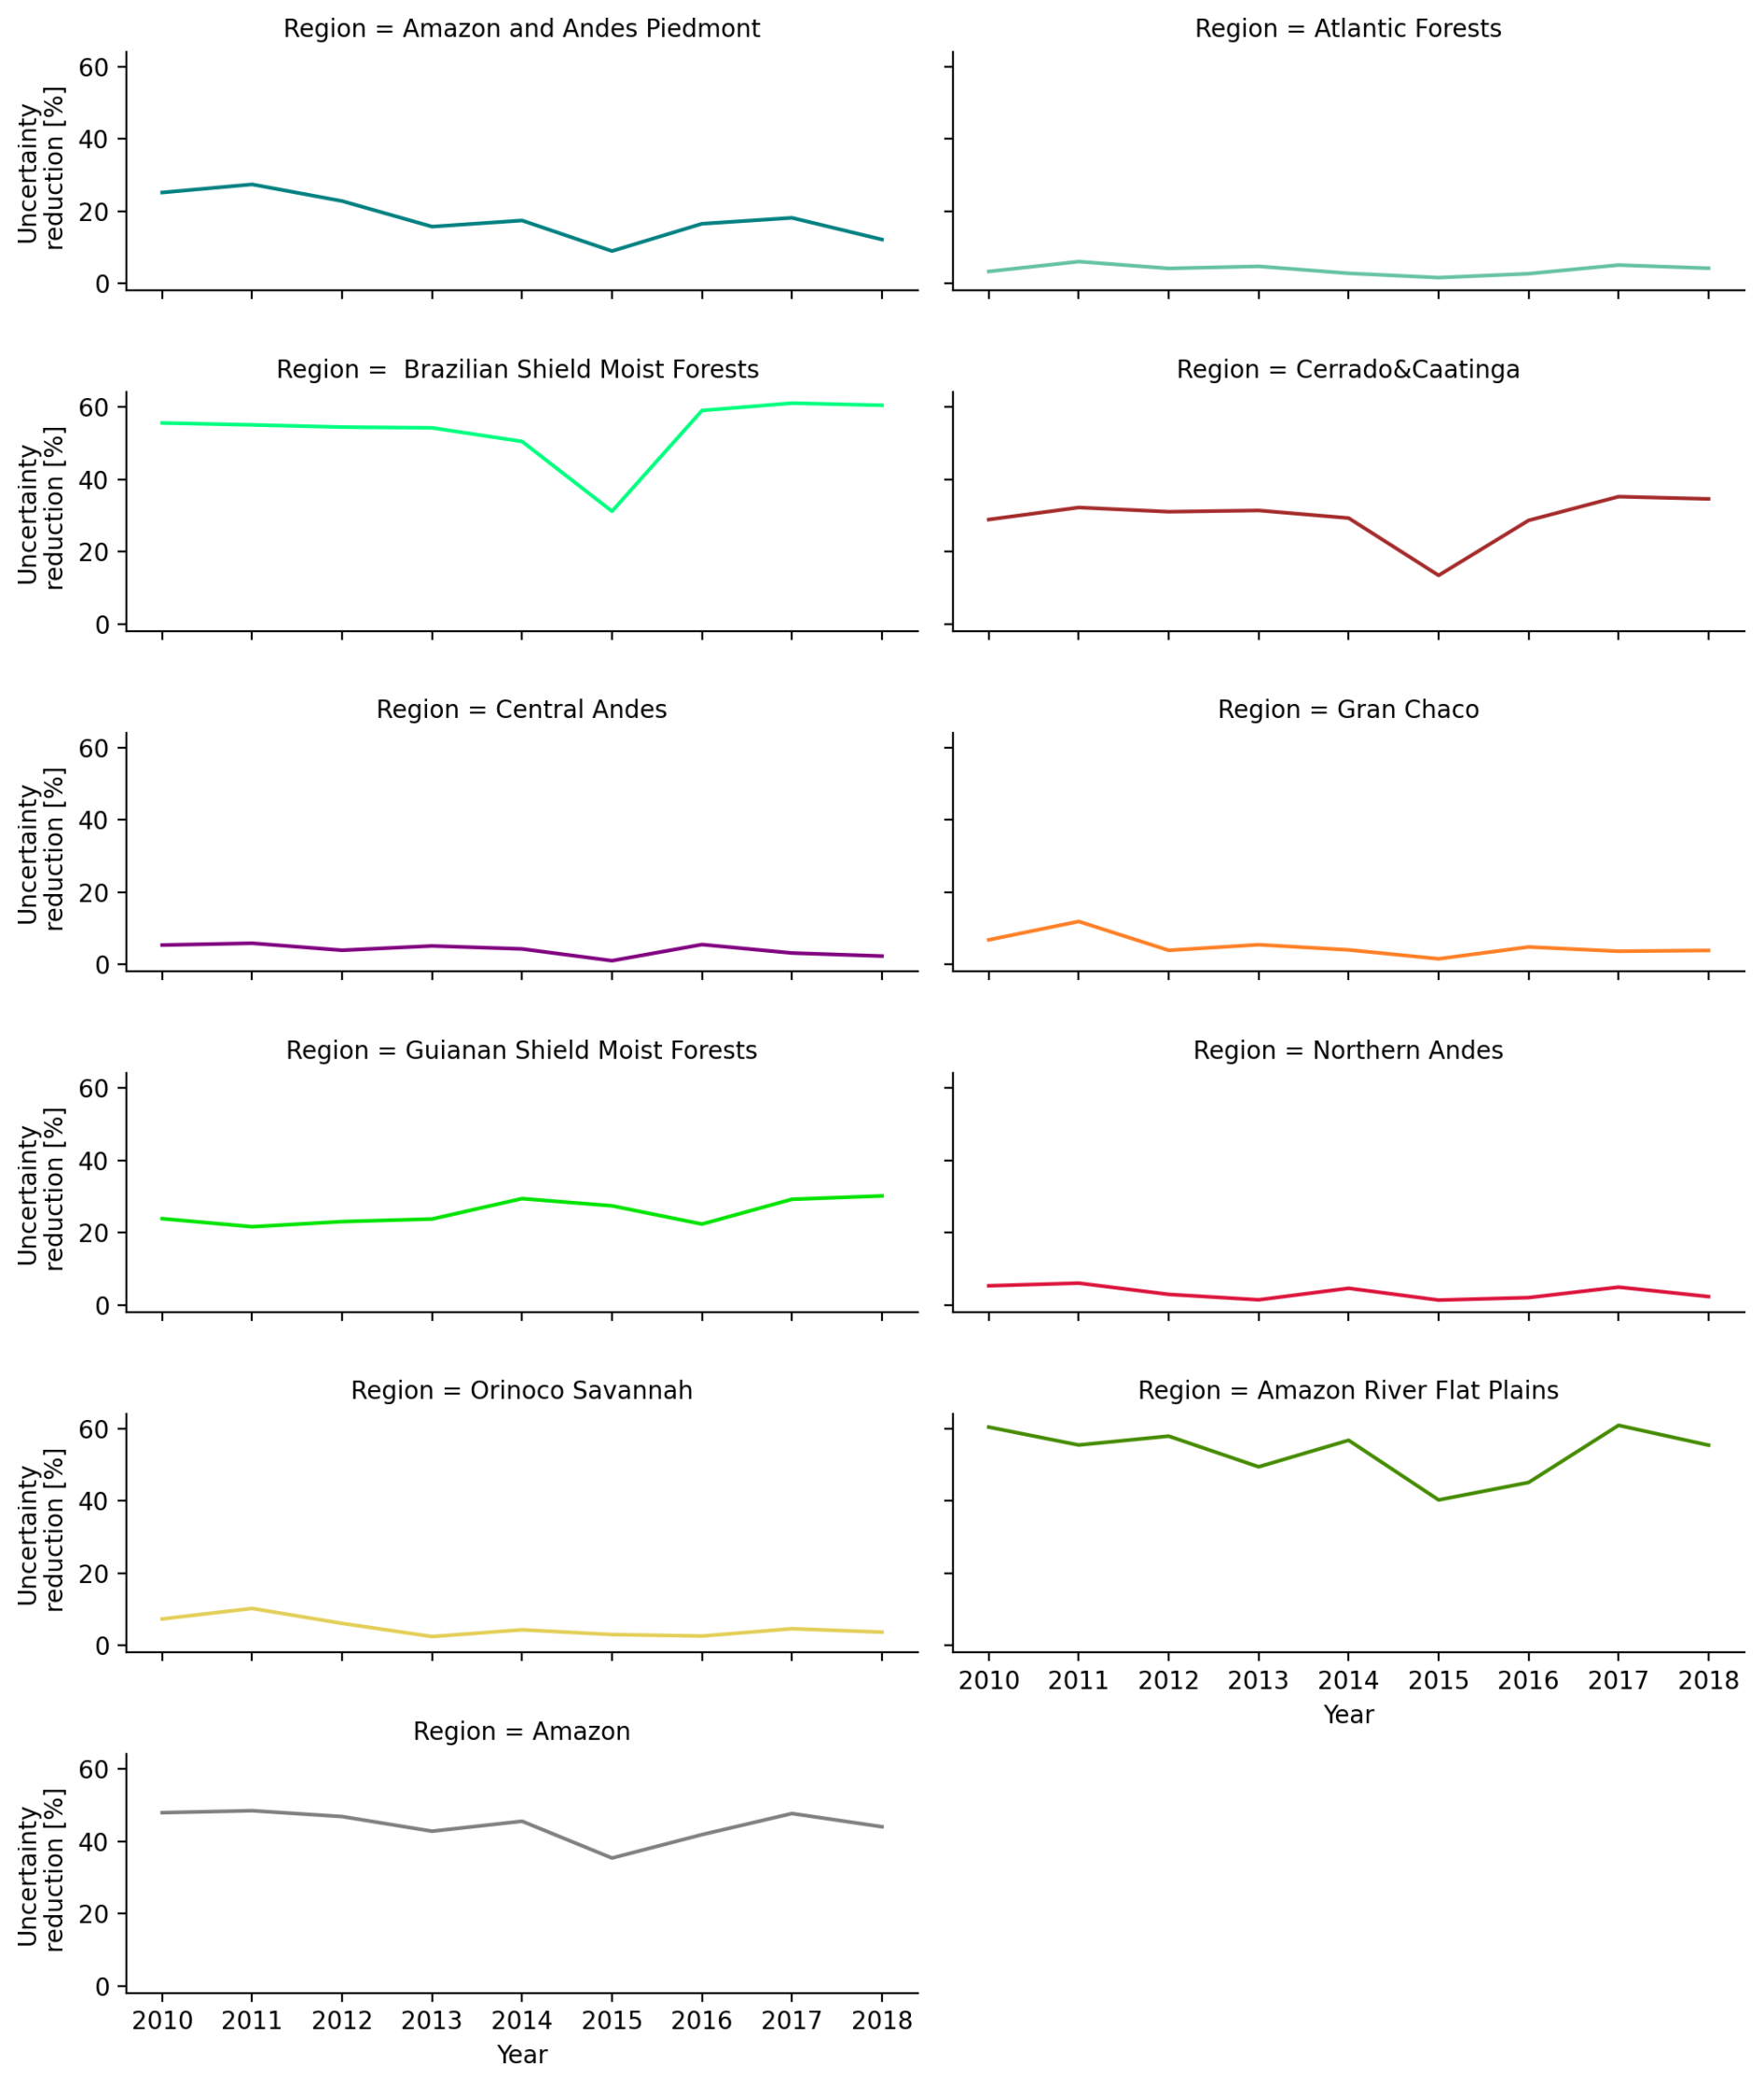
Figure A12Prior to posterior uncertainty reduction throughout the complete inversion period (2010–2018).
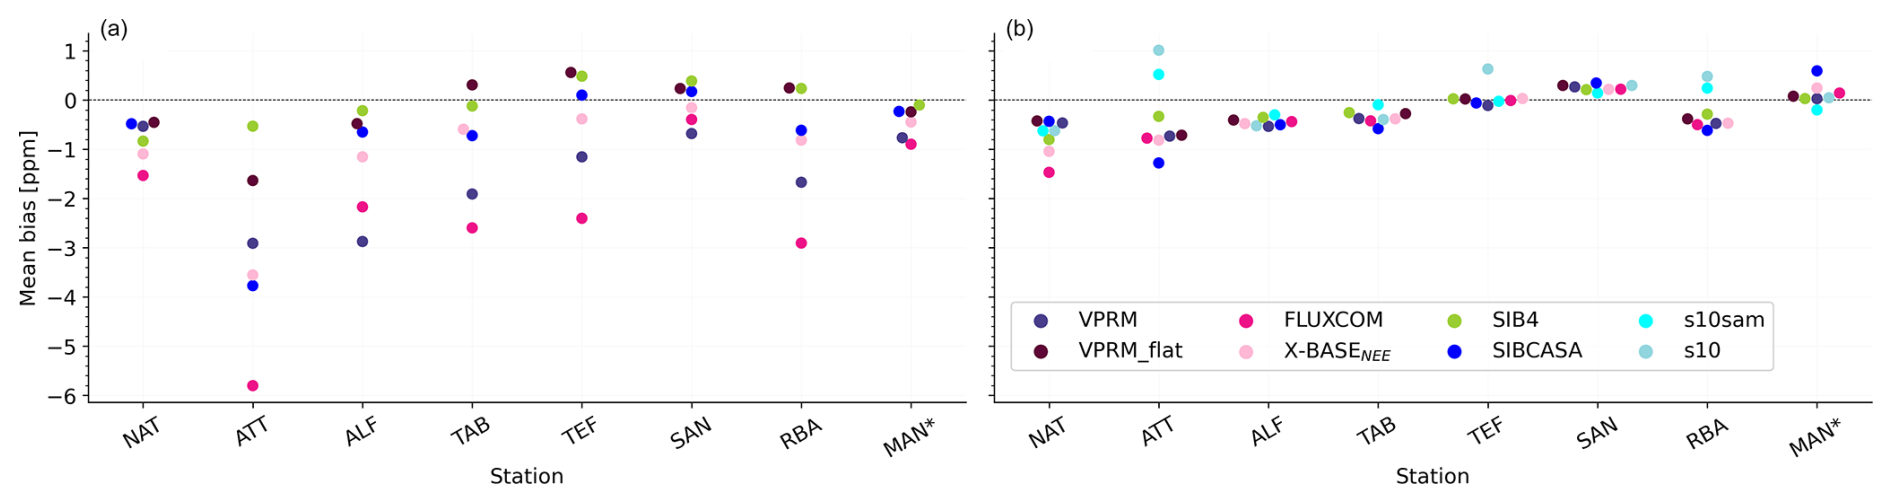
Figure A13Atmospheric forward runs using the prior (a) and posterior fluxes (b). Model–data comparison is done at the sites assimilated in the inversion (NAT, ATT, ALF, TAB, TEF, SAN, RBA) and at one site that was not assimilated (MAN*, v2 (Miller et al., 2023)) as a validation site. Note that the global inversions s10 and s10sam have a zero prior, so no forward run is available for those. In addition, note that the s10 global inversion did not assimilate any of the sites shown here. At the MAN site we use aircraft profiles using a Picarro (model G2401-m) over 2017 to 2018. For the MAN measurements, the surface influence (or footprints) was calculated for a 10 s CO2 mole fraction average. We used the same settings described for STILT-IFS in the “Methods and data” section.
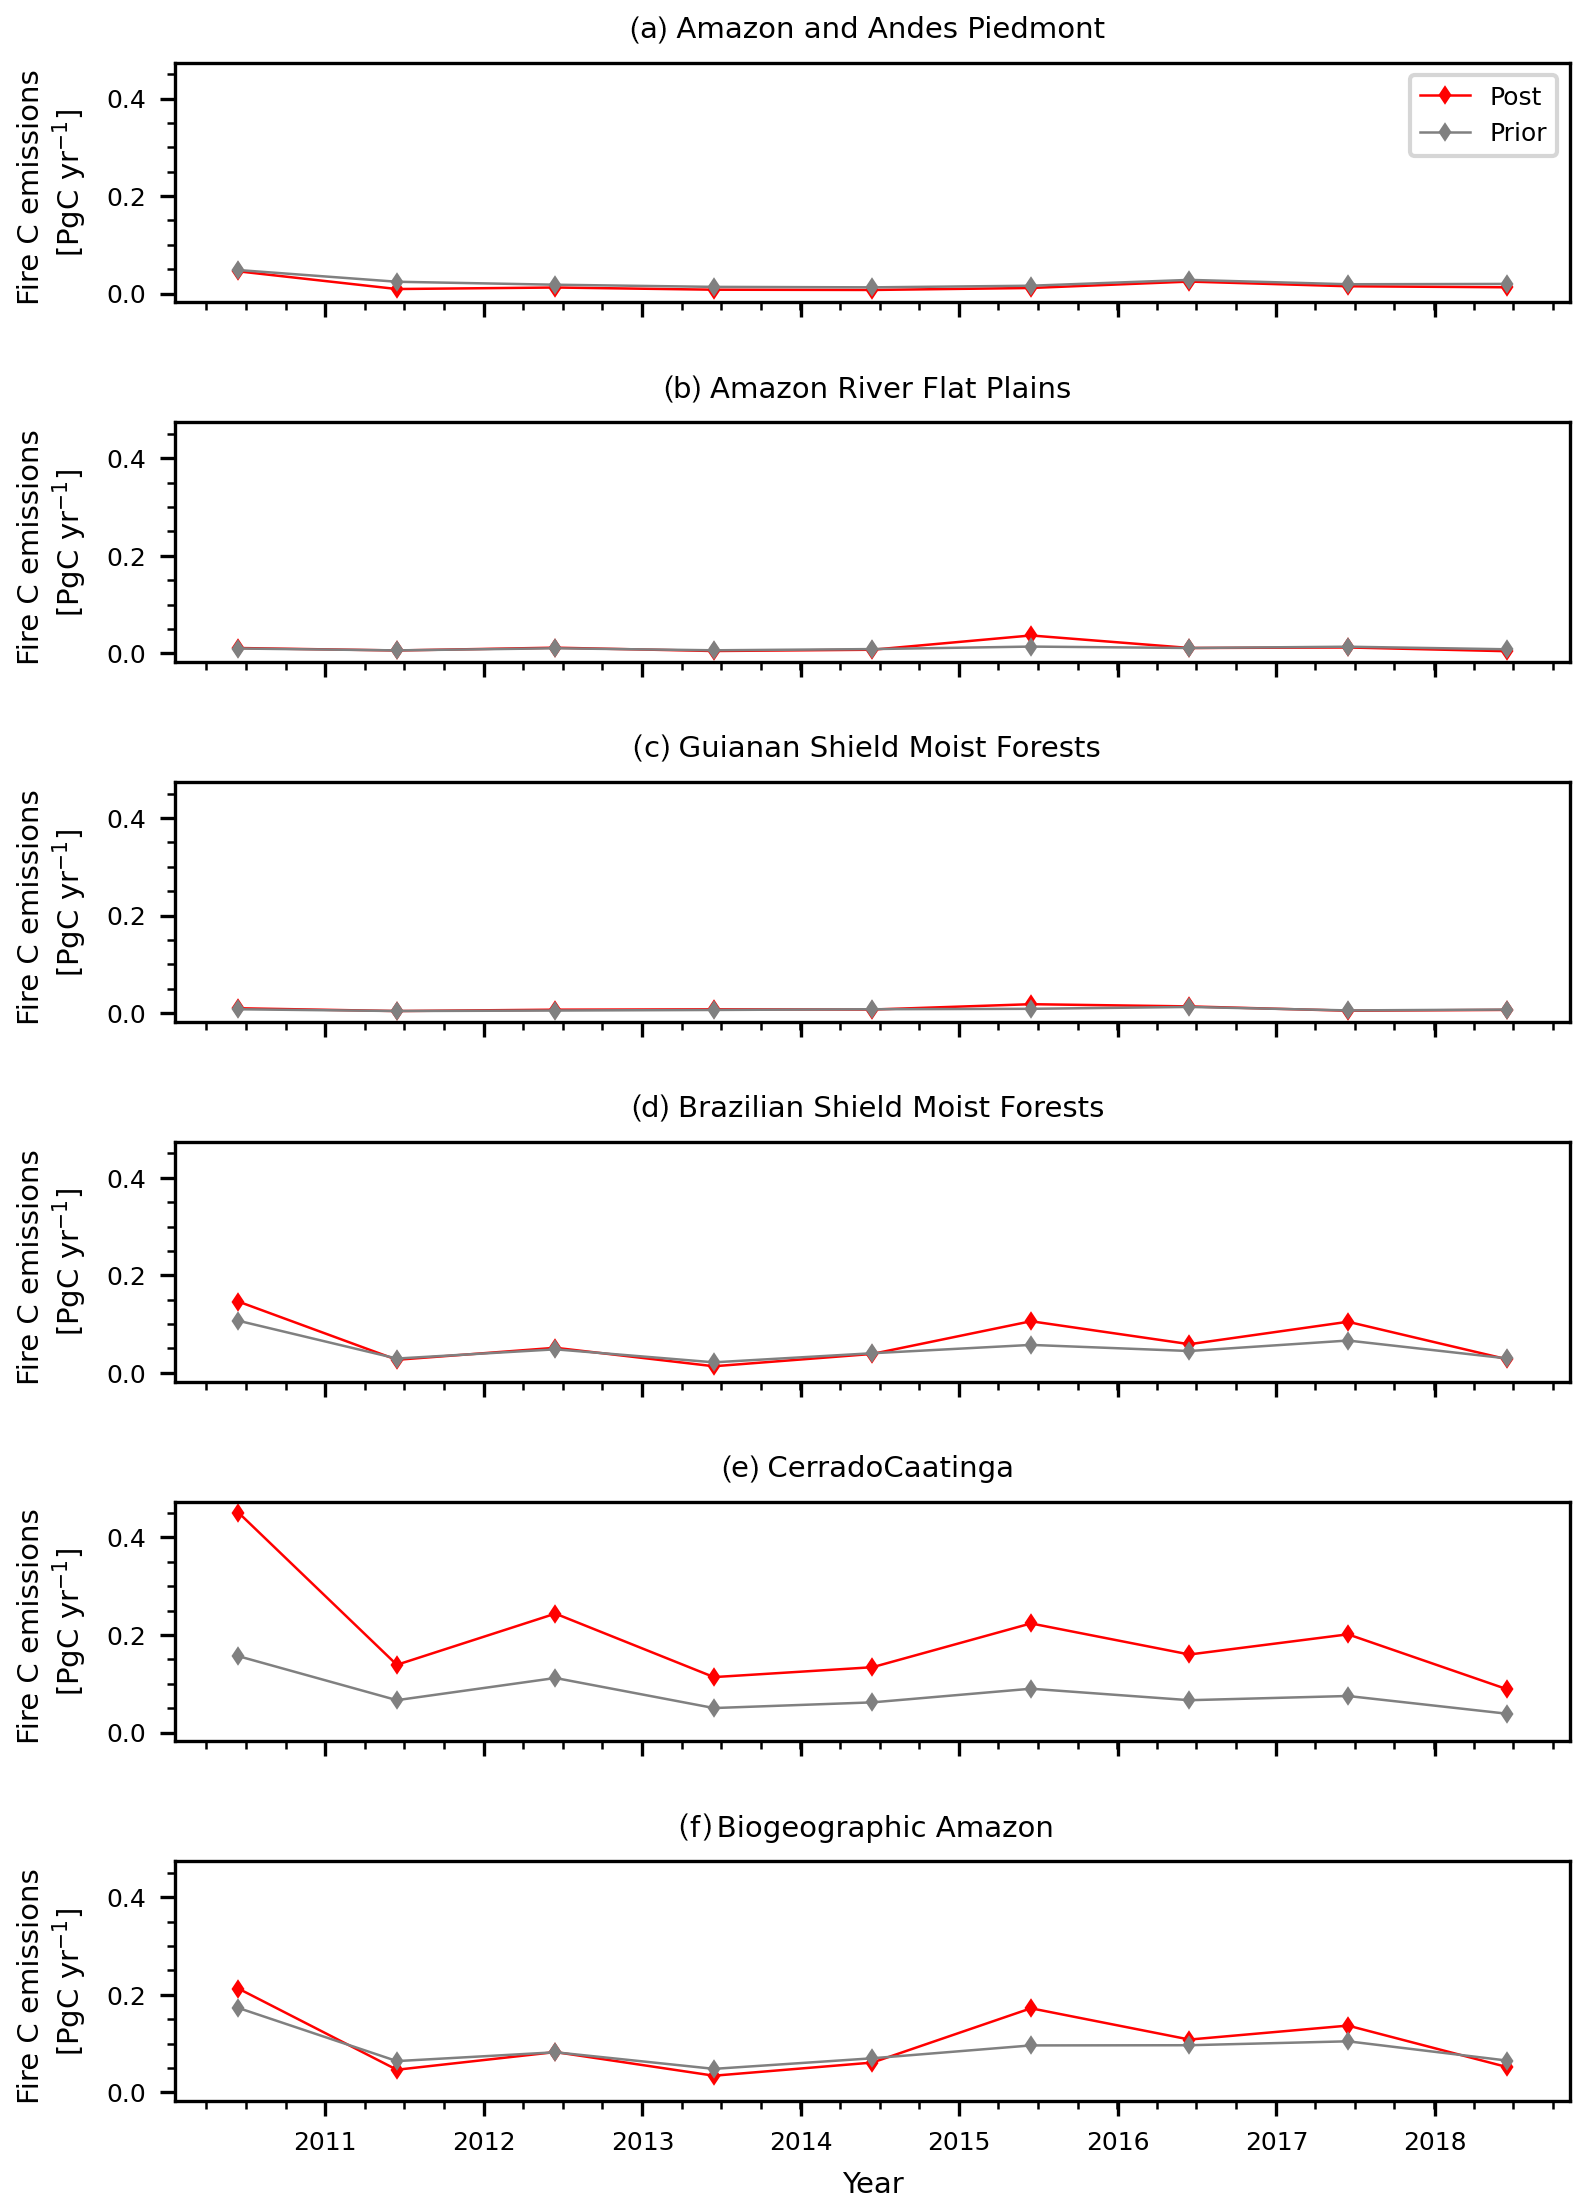
Figure A14Prior and posterior GFAS fire emissions for the regions within the biogeographic Amazon (a–d), the Cerrado and Caatinga (e), and the biogeographic Amazon (f).
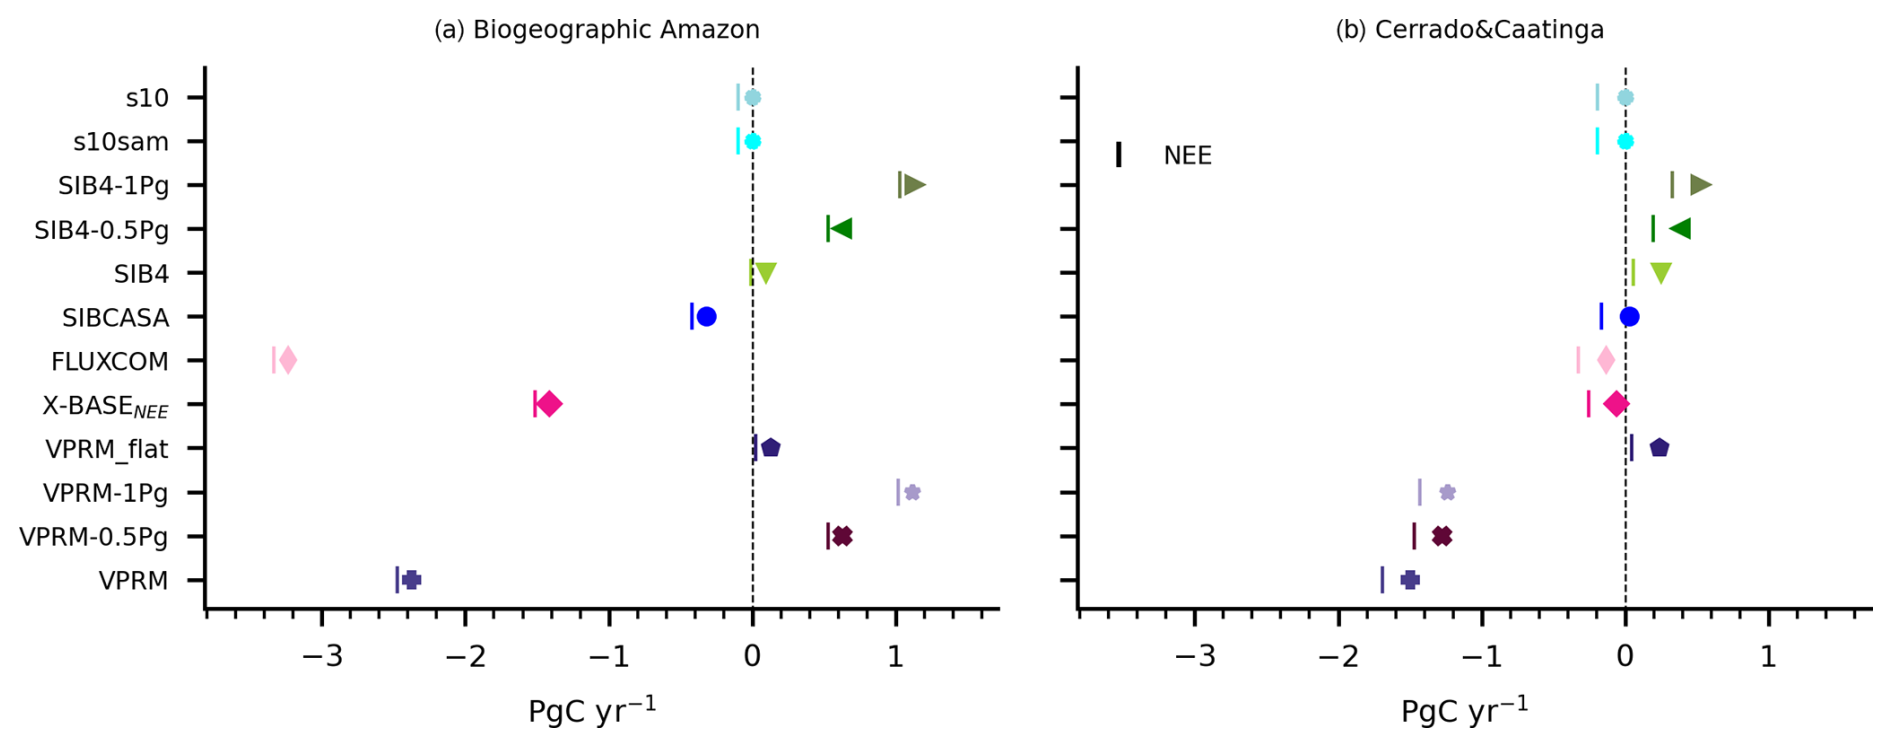
Figure A15Prior carbon budget for the biogeographic Amazon (a) and the Cerrado and Caatinga (b) regions. The prior flux component shown with a vertical bar (NEE) results from subtracting the Ffire and Fff from the prior FNetLand (shown with the markers).
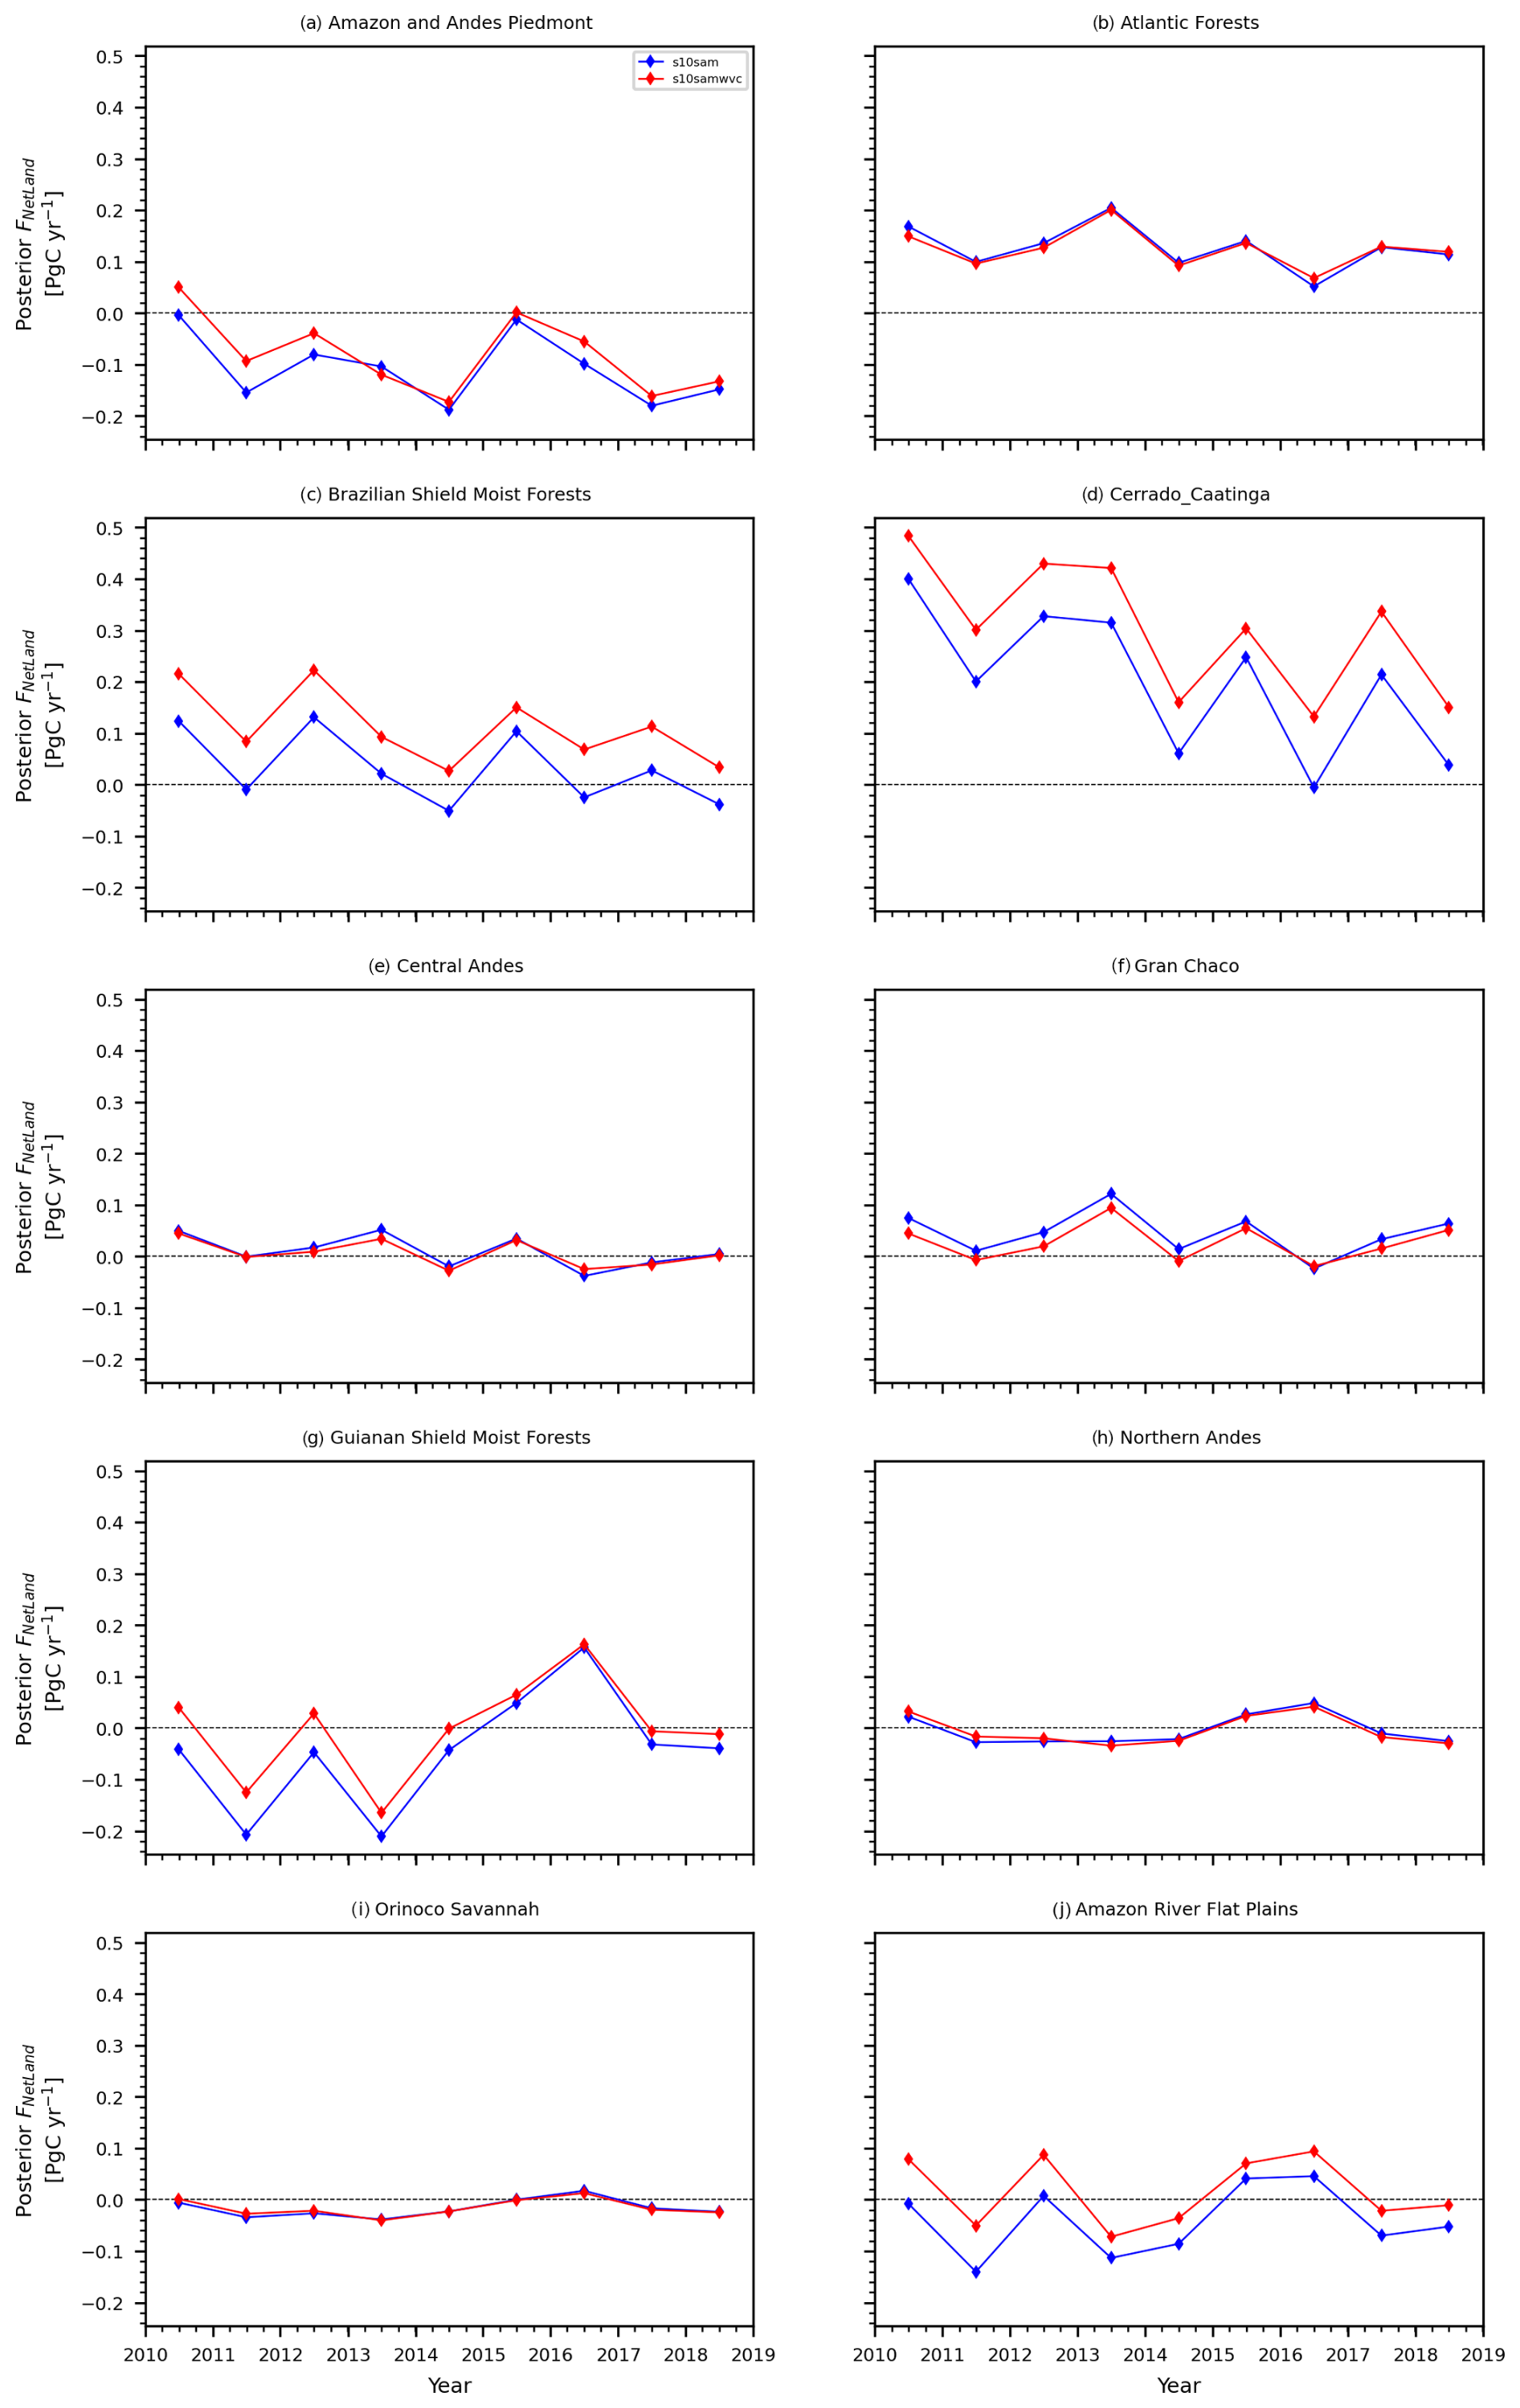
Figure A16Time series of posterior fluxes for each region using the global inversion assimilating data with the water-vapor correction and without it.
The aircraft vertical profiles are openly available in PANGAEA at https://doi.org/10.1594/PANGAEA.926834 (Gatti et al., 2021b). The data generated in this paper, the simulated water vapor at each aircraft site with its corresponding bias correction (in ppm), can be accessed at https://doi.org/10.17617/3.M60T6G (Botía et al., 2025). The analysis regions in postprocessing can be found at https://doi.org/10.17617/3.VFC252 (Botía, 2025). The posterior fluxes for each individual inversion run and the fire-CO2 emissions based on the MOPITT-CO inversions can be made available upon request to Santiago Botía (sbotia@bgc-jena.mpg.de). The GFED5 burned area was retrieved from the open repository Zenodo (https://doi.org/10.5281/zenodo.7668424, Chen et al., 2023b). The data that support the findings of this study are the ATTO CO2 measurements available for each individual year from: https://www.attodata.org/ddm/data/Showdata/39 (Lavric, 2012), https://www.attodata.org/ddm/data/Showdata/64 (Lavric, 2013), https://www.attodata.org/ddm/data/Showdata/65 (Lavric, 2014), https://www.attodata.org/ddm/data/Showdata/66 (Lavric, 2015), https://www.attodata.org/ddm/data/Showdata/67 (Lavric, 2016), https://www.attodata.org/ddm/data/Showdata/68 (Lavric, 2017), and https://www.attodata.org/ddm/data/Showdata/69 (Lavric, 2018).
SB wrote the initial manuscript and ran the atmospheric inversions. SB together with CG, WP, and CR designed the methodology. CR developed the global and the regional inversion systems, and he assisted in running the global inversions. SM and TK assisted with the regional inversion runs, DC ran the forward-run simulations for the validation site MAN. LSB helped with the data curation of the aircraft sites and further interpretation of the results. SK, JVL, and DW provided the ATTO data and ran the ATTO measurement system until 2021. GM is co-PI of the aircraft data and assisted with the interpretation of the results. SN, GK, IL, and WP provided the fire-CO2 emission based on the MOPITT-CO inversions. SH contributed with the analysis of burned area. JBM and GM ran the Manaus aircraft measurements and provided the data for the water-vapor correction. All authors contributed to the analysis and text editing.
At least one of the (co-)authors is a member of the editorial board of Atmospheric Chemistry and Physics. The peer-review process was guided by an independent editor, and the authors also have no other competing interests to declare.
Publisher’s note: Copernicus Publications remains neutral with regard to jurisdictional claims made in the text, published maps, institutional affiliations, or any other geographical representation in this paper. While Copernicus Publications makes every effort to include appropriate place names, the final responsibility lies with the authors.
The authors thanks the German Federal Ministry of Education and Research (BMBF) and the International Max Planck Research School for Global Biogeochemical Cycles (IMPRS-gBGC) for funding support. The ATTO project is furthermore funded by the Brazilian Ministério da Ciência, Tecnología e Inovação (MCTI/FINEP contract 01.11.01248.00), and the Max Planck Society. We acknowledge the Instituto Nacional de Pesquisas da Amazonia as well as the Amazon State University (UEA), FAPEAM, LBA/INPA, and SDS/CEUC/RDS-Uatumã for continuous support and logistical management. Many thanks are given to the people coordinating the scientific support at ATTO, in particular Susan Trumbore, Carlos Alberto Quesada, Bruno Takeshi, and Reiner Ditz. We express our gratitude to the data providers, Luciana Gatti (Aircraft vertical profiles) and Jacob Nelson, Sophia Walter, and Martin Jung (for the FLUXCOM and X-BASE NEE fluxes). Wouter Peters and Gebrand Koren were funded by an ERC-Consolidator grant (649087) as part of the ASICA (Airborne Stable Isotopes of Carbon from the Amazon) project. We appreciate the comments received from the three reviewers during the revision phase; they helped to improve the test and the main message of the manuscript. Finally we would like to thank David Baker and Andrew Schuh for their valuable comments about the OCO2-MIP v10 experiments that were useful during the review process.
This research has been supported by the Bundesministerium für Bildung und Forschung (grant nos. 01LB1001A and 01LK1602A).
The article processing charges for this open-access publication were covered by the Max Planck Society.
This paper was edited by Abhishek Chatterjee and reviewed by Ian Baker and two anonymous referees.
Albert, J., Hoorn, C., Malhi, Y., Phillips, O., Encalada, A. C., Hecht, S., Varese, M., Peña-Claros, M., and Roca, F. A.: The multiple viewpoints for the Amazon: geographic limits and meanings, Tech. rep., https://www.theamazonwewant.org/wp-content/uploads/2021/09/220105_The-multiple-viewpoints-for-the-Amazon-formatted-and-reviewed-050122.pdf (last access: 16 May 2024), 2021. a
Alden, C. B., Miller, J. B., Gatti, L. V., Gloor, M. M., Guan, K., Michalak, A. M., van der Laan-Luijkx, I. T., Touma, D., Andrews, A., Basso, L. S., Correia, C. S. C., Domingues, L. G., Joiner, J., Krol, M. C., Lyapustin, A. I., Peters, W., Shiga, Y. P., Thoning, K., van der Velde, I. R., van Leeuwen, T. T., Yadav, V., and Diffenbaugh, N. S.: Regional atmospheric CO 2 inversion reveals seasonal and geographic differences in Amazon net biome exchange, Glob. Change Biol., 22, 3427–3443, https://doi.org/10.1111/gcb.13305, 2016. a, b, c
Alencar, A., Moutinho, P., Arruda, V., Balzani, C., and Ribeiro, J.: Amazon Burning: Locating the fires, Tech. rep., https://ipam.org.br/wp-content/uploads/2019/09/AmazonBurning_LocatingTheFires.pdf (last access: 2 December 2023), 2019. a, b
Alves, J. D. N., Ribeiro, A., Rody, Y. P., Loos, R. A., and Hall, K. B.: Carbon uptake and water vapor exchange in a pasture site in the Brazilian Cerrado, J. Hydrol., 594, 125943, https://doi.org/10.1016/j.jhydrol.2020.125943, 2021. a, b
Aragão, L. E. O. C., Anderson, L. O., Fonseca, M. G., Rosan, T. M., Vedovato, L. B., Wagner, F. H., Silva, C. V. J., Junior, C. H. L. S., Arai, E., Aguiar, A. P., Barlow, J., Berenguer, E., Deeter, M. N., Domingues, L. G., Gatti, L., Gloor, M., Malhi, Y., Marengo, J. A., Miller, J. B., Phillips, O. L., and Saatchi, S.: 21st Century drought-related fires counteract the decline of Amazon deforestation carbon emissions, Nat. Commun., 9, 1–12, https://doi.org/10.1038/s41467-017-02771-y, 2018. a
Assis, T. O., Aguiar, A. P. D. D., Randow, C. V., Gomes, D. M. D. P., Kury, J. N., Ometto, J. P. H. B., and Nobre, C. A.: CO2 emissions from forest degradation in Brazilian Amazon, Environ. Res. Lett., 15, 104035, https://doi.org/10.1088/1748-9326/ab9cfc, 2020. a, b
Baccini, A., Walker, W., Carvalho, L., Farina, M., Sulla-Menashe, D., and Houghton, R. A.: Tropical forests are a net carbon source based on aboveground measurements of gain and loss, Science, 358, 230–234, https://doi.org/10.1126/science.aam5962, 2017. a
Baier, B. C., Sweeney, C., Choi, Y., Davis, K. J., DiGangi, J. P., Feng, S., Fried, A., Halliday, H., Higgs, J., Lauvaux, T., Miller, B. R., Montzka, S. A., Newberger, T., Nowak, J. B., Patra, P., Richter, D., Walega, J., and Weibring, P.: Multispecies Assessment of Factors Influencing Regional CO2 and CH4 Enhancements During the Winter 2017 ACT-America Campaign, J. Geophys. Res.-Atmos., 125, e2019JD031339, https://doi.org/10.1029/2019JD031339, 2020. a, b, c
Ballantyne, A. P., Alden, C. B., Miller, J. B., Tans, P. P., and White, J. W. C.: Increase in observed net carbon dioxide uptake by land and oceans during the past 50 years, Nature, 488, 70–72, https://doi.org/10.1038/nature11299, 2012. a
Basso, L. S., Wilson, C., Chipperfield, M. P., Tejada, G., Cassol, H. L. G., Arai, E., Williams, M., Smallman, T. L., Peters, W., Naus, S., Miller, J. B., and Gloor, M.: Atmospheric CO2 inversion reveals the Amazon as a minor carbon source caused by fire emissions, with forest uptake offsetting about half of these emissions, Atmos. Chem. Phys., 23, 9685–9723, https://doi.org/10.5194/acp-23-9685-2023, 2023. a, b, c, d, e, f, g, h, i, j, k, l, m, n, o, p, q, r
Bastos, A., O'Sullivan, M., Ciais, P., Makowski, D., Sitch, S., Friedlingstein, P., Chevallier, F., Rödenbeck, C., Pongratz, J., Luijkx, I. T., Patra, P. K., Peylin, P., Canadell, J. G., Lauerwald, R., Li, W., Smith, N. E., Peters, W., Goll, D. S., Jain, A., Kato, E., Lienert, S., Lombardozzi, D. L., Haverd, V., Nabel, J. E. M. S., Poulter, B., Tian, H., Walker, A. P., and Zaehle, S.: Sources of Uncertainty in Regional and Global Terrestrial CO 2 Exchange Estimates, Global Biogeochem. Cy., 34, e2019GB006393, https://doi.org/10.1029/2019GB006393, 2020. a
Beuchle, R., Grecchi, R. C., Shimabukuro, Y. E., Seliger, R., Eva, H. D., Sano, E., and Achard, F.: Land cover changes in the Brazilian Cerrado and Caatinga biomes from 1990 to 2010 based on a systematic remote sensing sampling approach, Appl. Geogr., 58, 116–127, https://doi.org/10.1016/j.apgeog.2015.01.017, 2015. a, b, c
Bodesheim, P., Jung, M., Gans, F., Mahecha, M. D., and Reichstein, M.: Upscaled diurnal cycles of land–atmosphere fluxes: a new global half-hourly data product, Earth Syst. Sci. Data, 10, 1327–1365, https://doi.org/10.5194/essd-10-1327-2018, 2018. a
Botía, S.: Greenhouse gas exchange in the Amazon region: carbon dioxide and methane insights from the Amazon Tall Tower Observatory (ATTO), Ph.D. thesis, Wageningen University, https://doi.org/10.18174/573967, 2022. a
Botía, S.: Regional and global mask used for flux integrals in Botía et al., 2025, Edmond [data set], https://doi.org/10.17617/3.VFC252, 2025. a
Botía, S., Komiya, S., Marshall, J., Koch, T., Gałkowski, M., Lavric, J., Gomes-Alves, E., Walter, D., Fisch, G., Pinho, D. M., Nelson, B. W., Martins, G., Luijkx, I. T., Koren, G., Florentie, L., Carioca de Araújo, A., Sá, M., Andreae, M. O., Heimann, M., Peters, W., and Gerbig, C.: The CO2 record at the Amazon Tall Tower Observatory: A new opportunity to study processes on seasonal and inter-annual scales, Glob. Change Biol., 28, 588–611, https://doi.org/10.1111/gcb.15905, 2022. a, b, c, d, e, f
Botía, S., Gerbig, C., and Miller, J. B.: Water-vapor based bias correction for CO2 airborne vertical profiles, Edmond [data set], https://doi.org/10.17617/3.M60T6G, 2025. a
Boulton, C. A., Lenton, T. M., and Boers, N.: Pronounced loss of Amazon rainforest resilience since the early 2000s, Nat. Clim. Change, 12, 271–278, https://doi.org/10.1038/s41558-022-01287-8, 2022. a
Bousquet, P., Peylin, P., Ciais, P., Le Quéré, C., Friedlingstein, P., and Tans, P. P.: Regional Changes in Carbon Dioxide Fluxes of Land and Oceans Since 1980, Science, 290, 1342–1346, https://doi.org/10.1126/science.290.5495.1342, 2000. a
BP Annual report: Statistical Review of World Energy, Tech. rep., https://www.bp.com/content/dam/bp/business-sites/en/global/corporate/pdfs/energy-economics/statistical-review/bp-stats-review-2020-full-report.pdf, 2020.
Brando, P. M., Paolucci, L., Ummenhofer, C. C., Ordway, E. M., Hartmann, H., Cattau, M. E., Rattis, L., Medjibe, V., Coe, M. T., and Balch, J.: Droughts, Wildfires, and Forest Carbon Cycling: A Pantropical Synthesis, Annu. Rev. Earth Pl. Sc., 47, 555–581, https://doi.org/10.1146/annurev-earth-082517-010235, 2019. a
Brienen, R. J. W., Phillips, O. L., Feldpausch, T. R., Gloor, E., Baker, T. R., Lloyd, J., Lopez-Gonzalez, G., Monteagudo-Mendoza, A., Malhi, Y., Lewis, S. L., Vásquez Martinez, R., Alexiades, M., Álvarez Dávila, E., Alvarez-Loayza, P., Andrade, A., Aragão, L. E. O. C., Araujo-Murakami, A., Arets, E. J. M. M., Arroyo, L., Aymard C., G. A., Bánki, O. S., Baraloto, C., Barroso, J., Bonal, D., Boot, R. G. A., Camargo, J. L. C., Castilho, C. V., Chama, V., Chao, K. J., Chave, J., Comiskey, J. A., Cornejo Valverde, F., da Costa, L., de Oliveira, E. A., Di Fiore, A., Erwin, T. L., Fauset, S., Forsthofer, M., Galbraith, D. R., Grahame, E. S., Groot, N., Hérault, B., Higuchi, N., Honorio Coronado, E. N., Keeling, H., Killeen, T. J., Laurance, W. F., Laurance, S., Licona, J., Magnussen, W. E., Marimon, B. S., Marimon-Junior, B. H., Mendoza, C., Neill, D. A., Nogueira, E. M., Núñez, P., Pallqui Camacho, N. C., Parada, A., Pardo-Molina, G., Peacock, J., Peña-Claros, M., Pickavance, G. C., Pitman, N. C. A., Poorter, L., Prieto, A., Quesada, C. A., Ramírez, F., Ramírez-Angulo, H., Restrepo, Z., Roopsind, A., Rudas, A., Salomão, R. P., Schwarz, M., Silva, N., Silva-Espejo, J. E., Silveira, M., Stropp, J., Talbot, J., ter Steege, H., Teran-Aguilar, J., Terborgh, J., Thomas-Caesar, R., Toledo, M., Torello-Raventos, M., Umetsu, R. K., van der Heijden, G. M. F., van der Hout, P., Guimarães Vieira, I. C., Vieira, S. A., Vilanova, E., Vos, V. A., and Zagt, R. J.: Long-term decline of the Amazon carbon sink, Nature, 519, 344–348, https://doi.org/10.1038/nature14283, 2015. a
Bustamante, M. M. C., Nardoto, G. B., Pinto, A. S., Resende, J. C. F., Takahashi, F. S. C., and Vieira, L. C. G.: Potential impacts of climate change on biogeochemical functioning of Cerrado ecosystems, Braz. J. Biol., 72, 655–671, https://doi.org/10.1590/S1519-69842012000400005, 2012. a, b, c
Cassol, H. L. G., Domingues, L. G., Sanchez, A. H., Basso, L. S., Marani, L., Tejada, G., Arai, E., Correia, C., Alden, C. B., Miller, J. B., Gloor, M., Anderson, L. O., Aragão, L. E. O. C., and Gatti, L. V.: Determination of Region of Influence Obtained by Aircraft Vertical Profiles Using the Density of Trajectories from the HYSPLIT Model, Atmosphere, 11, 1073, https://doi.org/10.3390/atmos11101073, 2020. a
Chen, Y., Hall, J., van Wees, D., Andela, N., Hantson, S., Giglio, L., van der Werf, G. R., Morton, D. C., and Randerson, J. T.: Multi-decadal trends and variability in burned area from the fifth version of the Global Fire Emissions Database (GFED5), Earth Syst. Sci. Data, 15, 5227–5259, https://doi.org/10.5194/essd-15-5227-2023, 2023a. a, b, c, d
Chen, Y., Hall, J., van Wees, D., Andela, N., Hantson, S., Giglio, L., van der Werf, G. R., Morton, D. C., and Randerson, J. T.: Global Fire Emissions Database (GFED5) Burned Area (0.1), Zenodo [data set], https://doi.org/10.5281/zenodo.7668424, 2023b. a
Cox, P. M., Pearson, D., Booth, B. B., Friedlingstein, P., Huntingford, C., Jones, C. D., and Luke, C. M.: Sensitivity of tropical carbon to climate change constrained by carbon dioxide variability, Nature, 494, 341–344, https://doi.org/10.1038/nature11882, 2013. a
Crowell, S., Baker, D., Schuh, A., Basu, S., Jacobson, A. R., Chevallier, F., Liu, J., Deng, F., Feng, L., McKain, K., Chatterjee, A., Miller, J. B., Stephens, B. B., Eldering, A., Crisp, D., Schimel, D., Nassar, R., O'Dell, C. W., Oda, T., Sweeney, C., Palmer, P. I., and Jones, D. B. A.: The 2015–2016 carbon cycle as seen from OCO-2 and the global in situ network, Atmos. Chem. Phys., 19, 9797–9831, https://doi.org/10.5194/acp-19-9797-2019, 2019. a, b, c, d, e, f
da Conceição Bispo, P., Picoli, M. C. A., Marimon, B. S., Marimon Junior, B. H., Peres, C. A., Menor, I. O., Silva, D. E., de Figueiredo Machado, F., Alencar, A. A. C., de Almeida, C. A., Anderson, L. O., Aragão, L. E. O. C., Breunig, F. M., Bustamante, M., Dalagnol, R., Diniz-Filho, J. A. F., Ferreira, L. G., Ferreira, M. E., Fisch, G., Galvão, L. S., Giarolla, A., Gomes, A. R., de Marco Junior, P., Kuck, T. N., Lehmann, C. E. R., Lemes, M. R., Liesenberg, V., Loyola, R., Macedo, M. N., de Souza Mendes, F., do Couto de Miranda, S., Morton, D. C., Moura, Y. M., Oldekop, J. A., Ramos-Neto, M. B., Rosan, T. M., Saatchi, S., Sano, E. E., Segura-Garcia, C., Shimbo, J. Z., Silva, T. S. F., Trevisan, D. P., Zimbres, B., Wiederkehr, N. C., and Silva-Junior, C. H. L.: Overlooking vegetation loss outside forests imperils the Brazilian Cerrado and other non-forest biomes, Nat. Ecol. Evol., 8, 12–13, https://doi.org/10.1038/s41559-023-02256-w, 2024. a, b
da Silva Junior, C. A., Teodoro, P. E., Delgado, R. C., Teodoro, L. P. R., Lima, M., de Andréa Pantaleão, A., Baio, F. H. R., de Azevedo, G. B., de Oliveira Sousa Azevedo, G. T., Capristo-Silva, G. F., Arvor, D., and Facco, C. U.: Persistent fire foci in all biomes undermine the Paris Agreement in Brazil, Sci. Rep., 10, 16246, https://doi.org/10.1038/s41598-020-72571-w, 2020. a
de Azevedo, G. B., Rezende, A. V., de Oliveira Sousa Azevedo, G. T., Miguel, E. P., de Gois Aquino, F., Bruzinga, J. S. C., de Oliveira, L. S. C., Pereira, R. S., and Teodoro, P. E.: Woody biomass accumulation in a Cerrado of Central Brazil monitored for 27 years after the implementation of silvicultural systems, Forest Ecol. Manage., 455, 117718, https://doi.org/10.1016/j.foreco.2019.117718, 2020. a
Deeter, M. N., Edwards, D. P., Francis, G. L., Gille, J. C., Mao, D., Martínez-Alonso, S., Worden, H. M., Ziskin, D., and Andreae, M. O.: Radiance-based retrieval bias mitigation for the MOPITT instrument: the version 8 product, Atmos. Meas. Tech., 12, 4561–4580, https://doi.org/10.5194/amt-12-4561-2019, 2019. a, b, c
Dlugokencky, E., Mund, J., Crotwell, A., Crotwell, M., and Thoning, K.: Atmospheric Carbon Dioxide Dry Air Mole Fractions from the NOAA GML Carbon Cycle Cooperative Global Air Sampling Network (1968–2020), NOAA Global Monitoring Laboratory Data Repository [data set], https://doi.org/10.15138/wkgj-f215, 2021. a
EPA: Level III Ecoregions of Central and South America, US Environmental Protection Agency, ftp://ftp.epa.gov/wed/ecoregions/sa/sa_eco.zip (last access: 23 April 2022), 2011. a
Eva, H., Huber, O., Frédéric, A., Balslev, H., Beck, S., Behling, H., Belward, A., Beuchle, R., Cleef, A. M., Colchester, M., Duivenvoorden, J., Hoogmoed, M., Junk, W., Kabat, P., Kruijt, B., Malhi, Y., Müller, J., Pereira, J., Peres, C., and Salo, J.: A proposal for defining the geographical boundaries of Amazonia; synthesis of the results from an expert consultation workshop organized by the European Commission in collaboration with the Amazon Cooperation Treaty Organization – JRC Ispra, 7–8 June 2005, ISBN 92-79-00012-8, 2005. a, b, c, d
Fawcett, D., Sitch, S., Ciais, P., Wigneron, J. P., Silva-Junior, C. H. L., Heinrich, V., Vancutsem, C., Achard, F., Bastos, A., Yang, H., Li, X., Albergel, C., Friedlingstein, P., and Aragão, L. E. O. C.: Declining Amazon biomass due to deforestation and subsequent degradation losses exceeding gains, Glob. Change Biol., 29, 1106–1118, https://doi.org/10.1111/gcb.16513, 2023. a
Fleischmann, A. S., Papa, F., Fassoni-Andrade, A., Melack, J. M., Wongchuig, S., Paiva, R. C. D., Hamilton, S. K., Fluet-Chouinard, E., Barbedo, R., Aires, F., Al Bitar, A., Bonnet, M.-P., Coe, M., Ferreira-Ferreira, J., Hess, L., Jensen, K., McDonald, K., Ovando, A., Park, E., Parrens, M., Pinel, S., Prigent, C., Resende, A. F., Revel, M., Rosenqvist, A., Rosenqvist, J., Rudorff, C., Silva, T. S. F., Yamazaki, D., and Collischonn, W.: How much inundation occurs in the Amazon River basin?, Remote Sens. Environ., 278, 113099, https://doi.org/10.1016/j.rse.2022.113099, 2022. a
Friedlingstein, P., Jones, M. W., O'Sullivan, M., Andrew, R. M., Bakker, D. C. E., Hauck, J., Le Quéré, C., Peters, G. P., Peters, W., Pongratz, J., Sitch, S., Canadell, J. G., Ciais, P., Jackson, R. B., Alin, S. R., Anthoni, P., Bates, N. R., Becker, M., Bellouin, N., Bopp, L., Chau, T. T. T., Chevallier, F., Chini, L. P., Cronin, M., Currie, K. I., Decharme, B., Djeutchouang, L. M., Dou, X., Evans, W., Feely, R. A., Feng, L., Gasser, T., Gilfillan, D., Gkritzalis, T., Grassi, G., Gregor, L., Gruber, N., Gürses, Ö., Harris, I., Houghton, R. A., Hurtt, G. C., Iida, Y., Ilyina, T., Luijkx, I. T., Jain, A., Jones, S. D., Kato, E., Kennedy, D., Klein Goldewijk, K., Knauer, J., Korsbakken, J. I., Körtzinger, A., Landschützer, P., Lauvset, S. K., Lefèvre, N., Lienert, S., Liu, J., Marland, G., McGuire, P. C., Melton, J. R., Munro, D. R., Nabel, J. E. M. S., Nakaoka, S.-I., Niwa, Y., Ono, T., Pierrot, D., Poulter, B., Rehder, G., Resplandy, L., Robertson, E., Rödenbeck, C., Rosan, T. M., Schwinger, J., Schwingshackl, C., Séférian, R., Sutton, A. J., Sweeney, C., Tanhua, T., Tans, P. P., Tian, H., Tilbrook, B., Tubiello, F., van der Werf, G. R., Vuichard, N., Wada, C., Wanninkhof, R., Watson, A. J., Willis, D., Wiltshire, A. J., Yuan, W., Yue, C., Yue, X., Zaehle, S., and Zeng, J.: Global Carbon Budget 2021, Earth Syst. Sci. Data, 14, 1917–2005, https://doi.org/10.5194/essd-14-1917-2022, 2022. a
Friedlingstein, P., O'Sullivan, M., Jones, M. W., Andrew, R. M., Bakker, D. C. E., Hauck, J., Landschützer, P., Le Quéré, C., Luijkx, I. T., Peters, G. P., Peters, W., Pongratz, J., Schwingshackl, C., Sitch, S., Canadell, J. G., Ciais, P., Jackson, R. B., Alin, S. R., Anthoni, P., Barbero, L., Bates, N. R., Becker, M., Bellouin, N., Decharme, B., Bopp, L., Brasika, I. B. M., Cadule, P., Chamberlain, M. A., Chandra, N., Chau, T.-T.-T., Chevallier, F., Chini, L. P., Cronin, M., Dou, X., Enyo, K., Evans, W., Falk, S., Feely, R. A., Feng, L., Ford, D. J., Gasser, T., Ghattas, J., Gkritzalis, T., Grassi, G., Gregor, L., Gruber, N., Gürses, Ö., Harris, I., Hefner, M., Heinke, J., Houghton, R. A., Hurtt, G. C., Iida, Y., Ilyina, T., Jacobson, A. R., Jain, A., Jarníková, T., Jersild, A., Jiang, F., Jin, Z., Joos, F., Kato, E., Keeling, R. F., Kennedy, D., Klein Goldewijk, K., Knauer, J., Korsbakken, J. I., Körtzinger, A., Lan, X., Lefèvre, N., Li, H., Liu, J., Liu, Z., Ma, L., Marland, G., Mayot, N., McGuire, P. C., McKinley, G. A., Meyer, G., Morgan, E. J., Munro, D. R., Nakaoka, S.-I., Niwa, Y., O'Brien, K. M., Olsen, A., Omar, A. M., Ono, T., Paulsen, M., Pierrot, D., Pocock, K., Poulter, B., Powis, C. M., Rehder, G., Resplandy, L., Robertson, E., Rödenbeck, C., Rosan, T. M., Schwinger, J., Séférian, R., Smallman, T. L., Smith, S. M., Sospedra-Alfonso, R., Sun, Q., Sutton, A. J., Sweeney, C., Takao, S., Tans, P. P., Tian, H., Tilbrook, B., Tsujino, H., Tubiello, F., van der Werf, G. R., van Ooijen, E., Wanninkhof, R., Watanabe, M., Wimart-Rousseau, C., Yang, D., Yang, X., Yuan, W., Yue, X., Zaehle, S., Zeng, J., and Zheng, B.: Global Carbon Budget 2023, Earth Syst. Sci. Data, 15, 5301–5369, https://doi.org/10.5194/essd-15-5301-2023, 2023. a, b
Gatti, L. V., Gloor, M., Miller, J. B., Doughty, C. E., Malhi, Y., Domingues, L. G., Basso, L. S., Martinewski, A., Correia, C. S. C., Borges, V. F., Freitas, S., Braz, R., Anderson, L. O., Rocha, H., Grace, J., Phillips, O. L., and Lloyd, J.: Drought sensitivity of Amazonian carbon balance revealed by atmospheric measurements, Nature, 506, 76–80, https://doi.org/10.1038/nature12957, 2014. a, b, c, d
Gatti, L. V., Basso, L. S., Miller, J. B., Gloor, M., Gatti Domingues, L., Cassol, H. L. G., Tejada, G., Aragão, L. E. O. C., Nobre, C., Peters, W., Marani, L., Arai, E., Sanches, A. H., Corrêa, S. M., Anderson, L., Von Randow, C., Correia, C. S. C., Crispim, S. P., and Neves, R. A. L.: Amazonia as a carbon source linked to deforestation and climate change, Nature, 595, 388–393, https://doi.org/10.1038/s41586-021-03629-6, 2021a. a, b, c, d, e, f, g, h, i, j, k, l, m, n, o, p, q, r
Gatti, L. V., Correa, C. C. S., Domingues, L. G., Miller, J. B., Gloor, M., Martinewski, A., Basso, L. S., Santana, R., Crispim, S. P., Marani, L., and Neves, R. L.: CO2 Vertical Profiles on Four Sites over Amazon from 2010 to 2018, PANGAEA [dataset], https://doi.org/10.1594/PANGAEA.926834, 2021b. a, b
Gatti, L. V., Cunha, C. L., Marani, L., Cassol, H. L. G., Messias, C. G., Arai, E., Denning, A. S., Soler, L. S., Almeida, C., Setzer, A., Domingues, L. G., Basso, L. S., Miller, J. B., Gloor, M., Correia, C. S. C., Tejada, G., Neves, R. A. L., Rajao, R., Nunes, F., Filho, B. S. S., Schmitt, J., Nobre, C., Corrêa, S. M., Sanches, A. H., Aragão, L. E. O. C., Anderson, L., Von Randow, C., Crispim, S. P., Silva, F. M., and Machado, G. B. M.: Increased Amazon carbon emissions mainly from decline in law enforcement, Nature, 621, 318–323, https://doi.org/10.1038/s41586-023-06390-0, 2023. a, b, c, d, e, f
Giglio, L., Randerson, J. T., and van der Werf, G. R.: Analysis of daily, monthly, and annual burned area using the fourth-generation global fire emissions database (GFED4), J. Geophys. Res.-Biogeo., 118, 317–328, https://doi.org/10.1002/jgrg.20042, 2013. a
Gloor, E., Wilson, C., Chipperfield, M. P., Chevallier, F., Buermann, W., Boesch, H., Parker, R., Somkuti, P., Gatti, L. V., Correia, C., Domingues, L. G., Peters, W., Miller, J., Deeter, M. N., and Sullivan, M. J. P.: Tropical land carbon cycle responses to 2015/16 El Niño as recorded by atmospheric greenhouse gas and remote sensing data, Philos. T. Roy. Soc. B, 373, 20170302, https://doi.org/10.1098/rstb.2017.0302 2018. a, b, c, d, e
Goulding, M., Barthem, R., and Ferreira, E.: The Smithsonian atlas of the Amazon, ISBN 1-58834-135-6, 2003. a
Gurney, K. R., Law, R. M., Denning, A. S., Rayner, P. J., Baker, D., Bousquet, P., Bruhwiler, L., Chen, Y.-H., Ciais, P., Fan, S., Fung, I. Y., Gloor, M., Heimann, M., Higuchi, K., John, J., Maki, T., Maksyutov, S., Masarie, K., Peylin, P., Prather, M., Pak, B. C., Randerson, J., Sarmiento, J., Taguchi, S., Takahashi, T., and Yuen, C.-W.: Towards robust regional estimates of CO2 sources and sinks using atmospheric transport models, Nature, 415, 626–630, https://doi.org/10.1038/415626a, 2002. a
Hastie, A., Lauerwald, R., Ciais, P., and Regnier, P.: Aquatic carbon fluxes dampen the overall variation of net ecosystem productivity in the Amazon basin: An analysis of the interannual variability in the boundless carbon cycle, Glob. Change Biol., 25, 2094–2111, https://doi.org/10.1111/gcb.14620, 2019. a, b
Haynes, K. D., Baker, I. T., Denning, A. S., Stöckli, R., Schaefer, K., Lokupitiya, E. Y., and Haynes, J. M.: Representing Grasslands Using Dynamic Prognostic Phenology Based on Biological Growth Stages: 1. Implementation in the Simple Biosphere Model (SiB4), J. Adv. Model. Earth Sy., 11, 4423–4439, https://doi.org/10.1029/2018MS001540, 2019. a
Heimann, M. and Körner, S.: The global atmospheric tracer model TM3, Tech. Rep. Tech. Rep. 5., MPI-BGC, Jena (Germany), https://www.db-thueringen.de/servlets/MCRFileNodeServlet/dbt_derivate_00020679/tech_report5.pdf (last access: 22 April 2022), 2003. a
Heinrich, V. H. A., Dalagnol, R., Cassol, H. L. G., Rosan, T. M., de Almeida, C. T., Silva Junior, C. H. L., Campanharo, W. A., House, J. I., Sitch, S., Hales, T. C., Adami, M., Anderson, L. O., and Aragão, L. E. O. C.: Large carbon sink potential of secondary forests in the Brazilian Amazon to mitigate climate change, Nat. Commun., 12, 1785, https://doi.org/10.1038/s41467-021-22050-1, 2021. a
Heinrich, V. H. A., Vancutsem, C., Dalagnol, R., Rosan, T. M., Fawcett, D., Silva-Junior, C. H. L., Cassol, H. L. G., Achard, F., Jucker, T., Silva, C. A., House, J., Sitch, S., Hales, T. C., and Aragão, L. E. O. C.: The carbon sink of secondary and degraded humid tropical forests, Nature, 615, 436–442, https://doi.org/10.1038/s41586-022-05679-w, 2023. a
Hubau, W., Lewis, S. L., Phillips, O. L., Affum-Baffoe, K., Beeckman, H., Cuní-Sanchez, A., Daniels, A. K., Ewango, C. E. N., Fauset, S., Mukinzi, J. M., Sheil, D., Sonké, B., Sullivan, M. J. P., Sunderland, T. C. H., Taedoumg, H., Thomas, S. C., White, L. J. T., Abernethy, K. A., Adu-Bredu, S., Amani, C. A., Baker, T. R., Banin, L. F., Baya, F., Begne, S. K., Bennett, A. C., Benedet, F., Bitariho, R., Bocko, Y. E., Boeckx, P., Boundja, P., Brienen, R. J. W., Brncic, T., Chezeaux, E., Chuyong, G. B., Clark, C. J., Collins, M., Comiskey, J. A., Coomes, D. A., Dargie, G. C., de Haulleville, T., Kamdem, M. N. D., Doucet, J.-L., Esquivel-Muelbert, A., Feldpausch, T. R., Fofanah, A., Foli, E. G., Gilpin, M., Gloor, E., Gonmadje, C., Gourlet-Fleury, S., Hall, J. S., Hamilton, A. C., Harris, D. J., Hart, T. B., Hockemba, M. B. N., Hladik, A., Ifo, S. A., Jeffery, K. J., Jucker, T., Yakusu, E. K., Kearsley, E., Kenfack, D., Koch, A., Leal, M. E., Levesley, A., Lindsell, J. A., Lisingo, J., Lopez-Gonzalez, G., Lovett, J. C., Makana, J.-R., Malhi, Y., Marshall, A. R., Martin, J., Martin, E. H., Mbayu, F. M., Medjibe, V. P., Mihindou, V., Mitchard, E. T. A., Moore, S., Munishi, P. K. T., Bengone, N. N., Ojo, L., Ondo, F. E., Peh, K. S.-H., Pickavance, G. C., Poulsen, A. D., Poulsen, J. R., Qie, L., Reitsma, J., Rovero, F., Swaine, M. D., Talbot, J., Taplin, J., Taylor, D. M., Thomas, D. W., Toirambe, B., Mukendi, J. T., Tuagben, D., Umunay, P. M., van der Heijden, G. M. F., Verbeeck, H., Vleminckx, J., Willcock, S., Wöll, H., Woods, J. T., and Zemagho, L.: Asynchronous carbon sink saturation in African and Amazonian tropical forests, Nature, 579, 80–87, https://doi.org/10.1038/s41586-020-2035-0, 2020. a
Jung, M., Reichstein, M., Margolis, H. A., Cescatti, A., Richardson, A. D., Arain, M. A., Arneth, A., Bernhofer, C., Bonal, D., Chen, J., Gianelle, D., Gobron, N., Kiely, G., Kutsch, W., Lasslop, G., Law, B. E., Lindroth, A., Merbold, L., Montagnani, L., Moors, E. J., Papale, D., Sottocornola, M., Vaccari, F., and Williams, C.: Global patterns of land-atmosphere fluxes of carbon dioxide, latent heat, and sensible heat derived from eddy covariance, satellite, and meteorological observations, J. Geophys. Res.-Biogeo., 116, G00J07, https://doi.org/10.1029/2010JG001566, 2011. a
Jung, M., Reichstein, M., Schwalm, C. R., Huntingford, C., Sitch, S., Ahlström, A., Arneth, A., Camps-Valls, G., Ciais, P., Friedlingstein, P., Gans, F., Ichii, K., Jain, A. K., Kato, E., Papale, D., Poulter, B., Raduly, B., Rödenbeck, C., Tramontana, G., Viovy, N., Wang, Y.-P., Weber, U., Zaehle, S., and Zeng, N.: Compensatory water effects link yearly global land CO 2 sink changes to temperature, Nature, 541, 516–520, https://doi.org/10.1038/nature20780, 2017. a
Kaiser, J. W., Heil, A., Andreae, M. O., Benedetti, A., Chubarova, N., Jones, L., Morcrette, J.-J., Razinger, M., Schultz, M. G., Suttie, M., and van der Werf, G. R.: Biomass burning emissions estimated with a global fire assimilation system based on observed fire radiative power, Biogeosciences, 9, 527–554, https://doi.org/10.5194/bg-9-527-2012, 2012. a
Kalnay, E., Kanamitsu, M., Kistler, R., Collins, W., Deaven, D., Gandin, L., Iredell, M., Saha, S., White, G., Woollen, J., Zhu, Y., Leetmaa, A., Reynolds, B., Chelliah, M., Ebisuzaki, W., Higgins, W., Janowiak, J., Mo, K. C., Ropelewski, C., Wang, J., Jenne, R., and Joseph, D.: The NCEP/NCAR 40-Year Reanalysis Project, B. Am. Meteorol. Soc., 77, 437–472, 1996. a
Keeling, C. D. and Revelle, R.: Effects of EL Nino/Southern Oscillation on the Atmospheric Content of Carbon Dioxide, Meteoritics, 20, 437, https://ui.adsabs.harvard.edu/abs/1985Metic..20..437K/abstract (last access: 7 July 2024), 1985. a
Keeling, C. D., Whorf, T. P., Wahlen, M., and van der Plichtt, J.: Interannual extremes in the rate of rise of atmospheric carbon dioxide since 1980, Nature, 375, 666–670, https://doi.org/10.1038/375666a0, 1995. a
Koren, G.: Constraining the exchange of carbon dioxide over the Amazon: New insights from stable isotopes, remote sensing and inverse modeling, Ph.D. thesis, Wageningen University, https://doi.org/10.18174/524771, 2020. a, b, c, d
Kountouris, P., Gerbig, C., Rödenbeck, C., Karstens, U., Koch, T. F., and Heimann, M.: Atmospheric CO2 inversions on the mesoscale using data-driven prior uncertainties: quantification of the European terrestrial CO2 fluxes, Atmos. Chem. Phys., 18, 3047–3064, https://doi.org/10.5194/acp-18-3047-2018, 2018a. a, b, c
Kountouris, P., Gerbig, C., Rödenbeck, C., Karstens, U., Koch, T. F., and Heimann, M.: Technical Note: Atmospheric CO2 inversions on the mesoscale using data-driven prior uncertainties: methodology and system evaluation, Atmos. Chem. Phys., 18, 3027–3045, https://doi.org/10.5194/acp-18-3027-2018, 2018b. a, b
Krol, M., Houweling, S., Bregman, B., van den Broek, M., Segers, A., van Velthoven, P., Peters, W., Dentener, F., and Bergamaschi, P.: The two-way nested global chemistry-transport zoom model TM5: algorithm and applications, Atmos. Chem. Phys., 5, 417–432, https://doi.org/10.5194/acp-5-417-2005, 2005. a
Kruid, S., Macedo, M. N., Gorelik, S. R., Walker, W., Moutinho, P., Brando, P. M., Castanho, A., Alencar, A., Baccini, A., and Coe, M. T.: Beyond Deforestation: Carbon Emissions From Land Grabbing and Forest Degradation in the Brazilian Amazon, Front. Forests Global Change, 4, 645282, https://doi.org/10.3389/ffgc.2021.645282, 2021. a
Lapola, D. M., Pinho, P., Barlow, J., Aragão, L. E. O. C., Berenguer, E., Carmenta, R., Liddy, H. M., Seixas, H., Silva, C. V. J., Silva-Junior, C. H. L., Alencar, A. A. C., Anderson, L. O., Armenteras, D., Brovkin, V., Calders, K., Chambers, J., Chini, L., Costa, M. H., Faria, B. L., Fearnside, P. M., Ferreira, J., Gatti, L., Gutierrez-Velez, V. H., Han, Z., Hibbard, K., Koven, C., Lawrence, P., Pongratz, J., Portela, B. T. T., Rounsevell, M., Ruane, A. C., Schaldach, R., da Silva, S. S., von Randow, C., and Walker, W. S.: The drivers and impacts of Amazon forest degradation, Science, 379, eabp8622, https://doi.org/10.1126/science.abp8622, 2023. a
Lavric, J. V.: ATTO – Mole fractions of CO, CO2, CH4 measured at ATTO Instant Tower, ATTO data portal [data set], https://www.attodata.org/ddm/data/Showdata/39 (last access: 24 February 2023), 2012.
Lavric, J. V.: ATTO – Mole fractions of CO, CO2, CH4 measured at ATTO Instant Tower, ATTO data portal [data set], https://www.attodata.org/ddm/data/Showdata/64 (last access: 24 February 2023), 2013.
Lavric, J. V.: ATTO – Mole fractions of CO, CO2, CH4 measured at ATTO Instant Tower, ATTO data portal [data set], https://www.attodata.org/ddm/data/Showdata/65 (last access: 24 February 2023), 2014.
Lavric, J. V.: ATTO – Mole fractions of CO, CO2, CH4 measured at ATTO Instant Tower, ATTO data portal [data set], https://www.attodata.org/ddm/data/Showdata/66 (last access: 24 February 2023), 2015.
Lavric, J. V.: ATTO – Mole fractions of CO, CO2, CH4 measured at ATTO Instant Tower, ATTO data portal [data set], https://www.attodata.org/ddm/data/Showdata/67 (last access: 24 February 2023), 2016.
Lavric, J. V.: ATTO – Mole fractions of CO, CO2, CH4 measured at ATTO Instant Tower, ATTO data portal [data set], https://www.attodata.org/ddm/data/Showdata/68 (last access: 24 February 2023), 2017.
Lavric, J. V.: ATTO – Mole fractions of CO, CO2, CH4 measured at ATTO Instant Tower, ATTO data portal [data set], https://www.attodata.org/ddm/data/Showdata/69 (last access: 24 February 2023), 2018.
Lavric, J. V.: ATTO – Mole fractions of CO, CO2, CH4 measured at ATTO Instant Tower, https://www.attodata.org/home/Start (last access: 24 February 2023), 2022.
Le Quéré, C., Andrew, R. M., Friedlingstein, P., Sitch, S., Hauck, J., Pongratz, J., Pickers, P. A., Korsbakken, J. I., Peters, G. P., Canadell, J. G., Arneth, A., Arora, V. K., Barbero, L., Bastos, A., Bopp, L., Chevallier, F., Chini, L. P., Ciais, P., Doney, S. C., Gkritzalis, T., Goll, D. S., Harris, I., Haverd, V., Hoffman, F. M., Hoppema, M., Houghton, R. A., Hurtt, G., Ilyina, T., Jain, A. K., Johannessen, T., Jones, C. D., Kato, E., Keeling, R. F., Goldewijk, K. K., Landschützer, P., Lefèvre, N., Lienert, S., Liu, Z., Lombardozzi, D., Metzl, N., Munro, D. R., Nabel, J. E. M. S., Nakaoka, S., Neill, C., Olsen, A., Ono, T., Patra, P., Peregon, A., Peters, W., Peylin, P., Pfeil, B., Pierrot, D., Poulter, B., Rehder, G., Resplandy, L., Robertson, E., Rocher, M., Rödenbeck, C., Schuster, U., Schwinger, J., Séférian, R., Skjelvan, I., Steinhoff, T., Sutton, A., Tans, P. P., Tian, H., Tilbrook, B., Tubiello, F. N., van der Laan-Luijkx, I. T., van der Werf, G. R., Viovy, N., Walker, A. P., Wiltshire, A. J., Wright, R., Zaehle, S., and Zheng, B.: Global Carbon Budget 2018, Earth Syst. Sci. Data, 10, 2141–2194, https://doi.org/10.5194/essd-10-2141-2018, 2018. a
Leal, I. R., Da Silva, J. M. C., Tabarelli, M., and Lacher Jr., T. E.: Changing the Course of Biodiversity Conservation in the Caatinga of Northeastern Brazil, Conserv. Biol., 19, 701–706, https://doi.org/10.1111/j.1523-1739.2005.00703.x, 2005. a, b, c
Lin, J. C., Gerbig, C., Wofsy, S. C., Andrews, A. E., Daube, B., Davis, K., and Grainger, C. A.: A near-field tool for simulating the upstream influence of atmospheric observations: The Stochastic Time-Inverted Lagrangian Transport (STILT) model, J. Geophys. Res., 108, ACH 2–1–ACH 2–17, https://doi.org/10.1029/2002JD003161, 2003. a
Liu, J., Bowman, K. W., Schimel, D. S., Parazoo, N. C., Jiang, Z., Lee, M., Bloom, A. A., Wunch, D., Frankenberg, C., Sun, Y., O'Dell, C. W., Gurney, K. R., Menemenlis, D., Gierach, M., Crisp, D., and Eldering, A.: Contrasting carbon cycle responses of the tropical continents to the 2015–2016 El Niño, Science, 358, eaam5690, https://doi.org/10.1126/science.aam5690, 2017. a, b, c, d, e, f, g
Mahadevan, P., Wofsy, S. C., Matross, D. M., Xiao, X., Dunn, A. L., Lin, J. C., Gerbig, C., Munger, J. W., Chow, V. Y., and Gottlieb, E. W.: A satellite-based biosphere parameterization for net ecosystem CO2 exchange: Vegetation Photosynthesis and Respiration Model (VPRM), Global Biogeochem. Cy., 22, GB2005, https://doi.org/10.1029/2006GB002735, 2008. a
Malhi, Y., Saatchi, S., Girardin, C., and Aragão, L. E. O. C.: The Production, Storage, and Flow of Carbon in Amazonian Forests, in: Amazonia and Global Change, American Geophysical Union (AGU), 355–372, ISBN 978-1-118-67034-7, 2009. a
MapBiomas: Collection 5.0 of the annual series of land use and land cover maps of Brazil, https://brasil.mapbiomas.org/ (last access: 13 May 2024), 2020. a
Marengo, J. A., Jimenez, J. C., Espinoza, J.-C., Cunha, A. P., and Aragão, L. E. O.: Increased climate pressure on the agricultural frontier in the Eastern Amazonia-Cerrado transition zone, Sci. Rep., 12, 457, https://doi.org/10.1038/s41598-021-04241-4, 2022. a
Marques, J. D. d. O., Luizão, F. J., Teixeira, W. G., Nogueira, E. M., Fearnside, P. M., and Sarrazin, M.: Soil Carbon Stocks under Amazonian Forest: Distribution in the Soil Fractions and Vulnerability to Emission, Open J. Forest., 7, 121–142, https://doi.org/10.4236/ojf.2017.72008, 2017. a
Masarie, K. A., Pétron, G., Andrews, A., Bruhwiler, L., Conway, T. J., Jacobson, A. R., Miller, J. B., Tans, P. P., Worthy, D. E., and Peters, W.: Impact of CO2 measurement bias on CarbonTracker surface flux estimates, J. Geophys. Res.-Atmos., 116, D17305, https://doi.org/10.1029/2011JD016270, 2011. a
Massie, S. T., Sebastian Schmidt, K., Eldering, A., and Crisp, D.: Observational evidence of 3-D cloud effects in OCO-2 CO2 retrievals, J. Geophys. Res.-Atmos., 122, 7064–7085, https://doi.org/10.1002/2016JD026111, 2017. a
Mataveli, G., Jones, M. W., Carmenta, R., Sanchez, A., Dutra, D. J., Chaves, M., de Oliveira, G., Anderson, L. O., and Aragão, L. E. O. C.: Deforestation falls but rise of wildfires continues degrading Brazilian Amazon forests, Glob. Change Biol., 30, e17202, https://doi.org/10.1111/gcb.17202, 2024. a
Matricardi, E. A. T., Skole, D. L., Costa, O. B., Pedlowski, M. A., Samek, J. H., and Miguel, E. P.: Long-term forest degradation surpasses deforestation in the Brazilian Amazon, Science, 369, 1378–1382, https://doi.org/10.1126/science.abb3021, 2020. a, b
Meirink, J. F., Bergamaschi, P., and Krol, M. C.: Four-dimensional variational data assimilation for inverse modelling of atmospheric methane emissions: method and comparison with synthesis inversion, Atmos. Chem. Phys., 8, 6341–6353, https://doi.org/10.5194/acp-8-6341-2008, 2008. a
Mendes, K. R., Campos, S., da Silva, L. L., Mutti, P. R., Ferreira, R. R., Medeiros, S. S., Perez-Marin, A. M., Marques, T. V., Ramos, T. M., de Lima Vieira, M. M., Oliveira, C. P., Gonçalves, W. A., Costa, G. B., Antonino, A. C. D., Menezes, R. S. C., Bezerra, B. G., and Santos e Silva, C. M.: Seasonal variation in net ecosystem CO2 exchange of a Brazilian seasonally dry tropical forest, Sci. Rep., 10, 9454, https://doi.org/10.1038/s41598-020-66415-w, 2020. a, b, c
Miller, J. B., Martins, G. A., de Souza, R. A. F., and Schuldt, K. N.: Manaus aircraft profile data for the period 2017-2023; obspack_multi-species_1_manaus_profiles_v2.0_2023-09-26, NOAA Global Monitoring Laboratory [data set], https://doi.org/10.25925/20230922, 2023. a, b
Miranda, A. C., Miranda, H. S., Lloyd, J., Grace, J., Francey, R. J., Mcintyre, J. A., Meir, P., Riggan, P., Lockwood, R., and Brass, J.: Fluxes of carbon, water and energy over Brazilian cerrado: an analysis using eddy covariance and stable isotopes, Plant Cell Environ., 20, 315–328, https://doi.org/10.1046/j.1365-3040.1997.d01-80.x, 1997. a
Molina, L., Broquet, G., Imbach, P., Chevallier, F., Poulter, B., Bonal, D., Burban, B., Ramonet, M., Gatti, L. V., Wofsy, S. C., Munger, J. W., Dlugokencky, E., and Ciais, P.: On the ability of a global atmospheric inversion to constrain variations of CO2 fluxes over Amazonia, Atmos. Chem. Phys., 15, 8423–8438, https://doi.org/10.5194/acp-15-8423-2015, 2015. a
Munassar, S., Rödenbeck, C., Koch, F.-T., Totsche, K. U., Gałkowski, M., Walther, S., and Gerbig, C.: Net ecosystem exchange (NEE) estimates 2006–2019 over Europe from a pre-operational ensemble-inversion system, Atmos. Chem. Phys., 22, 7875–7892, https://doi.org/10.5194/acp-22-7875-2022, 2022. a, b
Munassar, S., Monteil, G., Scholze, M., Karstens, U., Rödenbeck, C., Koch, F.-T., Totsche, K. U., and Gerbig, C.: Why do inverse models disagree? A case study with two European CO2 inversions, Atmos. Chem. Phys., 23, 2813–2828, https://doi.org/10.5194/acp-23-2813-2023, 2023. a
Munassar, S., Roedenbeck, C., Gałkowski, M., Koch, F.-T., Totsche, K. U., Botía, S., and Gerbig, C.: To what extent does CO2 diurnal cycle impact carbon flux estimates in CarboScope?, EGUsphere [preprint], https://doi.org/10.5194/egusphere-2024-291, 2024. a
Naus, S.: Improving estimates of the atmospheric oxidative capacity and Amazon fire emissions, Ph.D. thesis, Wageningen Univeristy, https://doi.org/10.18174/536720, 2021. a
Naus, S., Domingues, L. G., Krol, M., Luijkx, I. T., Gatti, L. V., Miller, J. B., Gloor, E., Basu, S., Correia, C., Koren, G., Worden, H. M., Flemming, J., Pétron, G., and Peters, W.: Sixteen years of MOPITT satellite data strongly constrain Amazon CO fire emissions, Atmos. Chem. Phys., 22, 14735–14750, https://doi.org/10.5194/acp-22-14735-2022, 2022. a, b, c
Nelson, J. A., Walther, S., Gans, F., Kraft, B., Weber, U., Novick, K., Buchmann, N., Migliavacca, M., Wohlfahrt, G., Šigut, L., Ibrom, A., Papale, D., Göckede, M., Duveiller, G., Knohl, A., Hörtnagl, L., Scott, R. L., Zhang, W., Hamdi, Z. M., Reichstein, M., Aranda-Barranco, S., Ardö, J., Op de Beeck, M., Billdesbach, D., Bowling, D., Bracho, R., Brümmer, C., Camps-Valls, G., Chen, S., Cleverly, J. R., Desai, A., Dong, G., El-Madany, T. S., Euskirchen, E. S., Feigenwinter, I., Galvagno, M., Gerosa, G., Gielen, B., Goded, I., Goslee, S., Gough, C. M., Heinesch, B., Ichii, K., Jackowicz-Korczynski, M. A., Klosterhalfen, A., Knox, S., Kobayashi, H., Kohonen, K.-M., Korkiakoski, M., Mammarella, I., Mana, G., Marzuoli, R., Matamala, R., Metzger, S., Montagnani, L., Nicolini, G., O'Halloran, T., Ourcival, J.-M., Peichl, M., Pendall, E., Ruiz Reverter, B., Roland, M., Sabbatini, S., Sachs, T., Schmidt, M., Schwalm, C. R., Shekhar, A., Silberstein, R., Silveira, M. L., Spano, D., Tagesson, T., Tramontana, G., Trotta, C., Turco, F., Vesala, T., Vincke, C., Vitale, D., Vivoni, E. R., Wang, Y., Woodgate, W., Yepez, E. A., Zhang, J., Zona, D., and Jung, M.: X-BASE: the first terrestrial carbon and water flux products from an extended data-driven scaling framework, FLUXCOM-X, EGUsphere [preprint], https://doi.org/10.5194/egusphere-2024-165, 2024. a
Noojipady, P., Morton, C. D., Macedo, N. M., Victoria, C. D., Huang, C., Gibbs, K. H., and Bolfe, L. E.: Forest carbon emissions from cropland expansion in the Brazilian Cerrado biome, Environ. Res. Lett., 12, 025004, https://doi.org/10.1088/1748-9326/aa5986, 2017. a
Palmer, P. I., Feng, L., Baker, D., Chevallier, F., Bösch, H., and Somkuti, P.: Net carbon emissions from African biosphere dominate pan-tropical atmospheric CO2 signal, Nat. Commun., 10, 3344, https://doi.org/10.1038/s41467-019-11097-w, 2019. a
Paul, D., Scheeren, H. A., Jansen, H. G., Kers, B. A. M., Miller, J. B., Crotwell, A. M., Michel, S. E., Gatti, L. V., Domingues, L. G., Correia, C. S. C., Neves, R. A. L., Meijer, H. A. J., and Peters, W.: Evaluation of a field-deployable Nafion™-based air-drying system for collecting whole air samples and its application to stable isotope measurements of CO2, Atmos. Meas. Tech., 13, 4051–4064, https://doi.org/10.5194/amt-13-4051-2020, 2020. a
Peiro, H., Crowell, S., Schuh, A., Baker, D. F., O'Dell, C., Jacobson, A. R., Chevallier, F., Liu, J., Eldering, A., Crisp, D., Deng, F., Weir, B., Basu, S., Johnson, M. S., Philip, S., and Baker, I.: Four years of global carbon cycle observed from the Orbiting Carbon Observatory 2 (OCO-2) version 9 and in situ data and comparison to OCO-2 version 7, Atmos. Chem. Phys., 22, 1097–1130, https://doi.org/10.5194/acp-22-1097-2022, 2022. a, b, c, d, e
Peylin, P., Law, R. M., Gurney, K. R., Chevallier, F., Jacobson, A. R., Maki, T., Niwa, Y., Patra, P. K., Peters, W., Rayner, P. J., Rödenbeck, C., van der Laan-Luijkx, I. T., and Zhang, X.: Global atmospheric carbon budget: results from an ensemble of atmospheric CO2 inversions, Biogeosciences, 10, 6699–6720, https://doi.org/10.5194/bg-10-6699-2013, 2013. a, b
Piao, S., Wang, X., Wang, K., Li, X., Bastos, A., Canadell, J. G., Ciais, P., Friedlingstein, P., and Sitch, S.: Interannual variation of terrestrial carbon cycle: Issues and perspectives, Glob. Change Biol., 26, 300–318, https://doi.org/10.1111/gcb.14884, 2020. a
Pivello, V. R.: The Use of Fire in the Cerrado and Amazonian Rainforests of Brazil: Past and Present, Fire Ecol., 7, 24–39, https://doi.org/10.4996/fireecology.0701024, 2011. a
Pletsch, M. A. J. S., Körting, T. S., Morita, F. C., Silva-Junior, C. H. L., Anderson, L. O., and Aragão, L. E. O. C.: Near Real-Time Fire Detection and Monitoring in the MATOPIBA Region, Brazil, Remote Sens., 14, 3141, https://doi.org/10.3390/rs14133141, 2022. a, b
Poorter, L., Bongers, F., Aide, T. M., Almeyda Zambrano, A. M., Balvanera, P., Becknell, J. M., Boukili, V., Brancalion, P. H. S., Broadbent, E. N., Chazdon, R. L., Craven, D., de Almeida-Cortez, J. S., Cabral, G. A. L., de Jong, B. H. J., Denslow, J. S., Dent, D. H., DeWalt, S. J., Dupuy, J. M., Durán, S. M., Espírito-Santo, M. M., Fandino, M. C., César, R. G., Hall, J. S., Hernandez-Stefanoni, J. L., Jakovac, C. C., Junqueira, A. B., Kennard, D., Letcher, S. G., Licona, J.-C., Lohbeck, M., Marín-Spiotta, E., Martínez-Ramos, M., Massoca, P., Meave, J. A., Mesquita, R., Mora, F., Muñoz, R., Muscarella, R., Nunes, Y. R. F., Ochoa-Gaona, S., de Oliveira, A. A., Orihuela-Belmonte, E., Peña-Claros, M., Pérez-García, E. A., Piotto, D., Powers, J. S., Rodríguez-Velázquez, J., Romero-Pérez, I. E., Ruíz, J., Saldarriaga, J. G., Sanchez-Azofeifa, A., Schwartz, N. B., Steininger, M. K., Swenson, N. G., Toledo, M., Uriarte, M., van Breugel, M., van der Wal, H., Veloso, M. D. M., Vester, H. F. M., Vicentini, A., Vieira, I. C. G., Bentos, T. V., Williamson, G. B., and Rozendaal, D. M. A.: Biomass resilience of Neotropical secondary forests, Nature, 530, 211–214, https://doi.org/10.1038/nature16512, 2016. a
Poorter, L., Craven, D., Jakovac, C. C., van der Sande, M. T., Amissah, L., Bongers, F., Chazdon, R. L., Farrior, C. E., Kambach, S., Meave, J. A., Muñoz, R., Norden, N., Rüger, N., van Breugel, M., Almeyda Zambrano, A. M., Amani, B., Andrade, J. L., Brancalion, P. H. S., Broadbent, E. N., de Foresta, H., Dent, D. H., Derroire, G., DeWalt, S. J., Dupuy, J. M., Durán, S. M., Fantini, A. C., Finegan, B., Hernández-Jaramillo, A., Hernández-Stefanoni, J. L., Hietz, P., Junqueira, A. B., N'dja, J. K., Letcher, S. G., Lohbeck, M., López-Camacho, R., Martínez-Ramos, M., Melo, F. P. L., Mora, F., Müller, S. C., N'Guessan, A. E., Oberleitner, F., Ortiz-Malavassi, E., Pérez-García, E. A., Pinho, B. X., Piotto, D., Powers, J. S., Rodríguez-Buriticá, S., Rozendaal, D. M. A., Ruíz, J., Tabarelli, M., Teixeira, H. M., Valadares de Sá Barretto Sampaio, E., van der Wal, H., Villa, P. M., Fernandes, G. W., Santos, B. A., Aguilar-Cano, J., de Almeida-Cortez, J. S., Alvarez-Davila, E., Arreola-Villa, F., Balvanera, P., Becknell, J. M., Cabral, G. A. L., Castellanos-Castro, C., de Jong, B. H. J., Nieto, J. E., Espírito-Santo, M. M., Fandino, M. C., García, H., García-Villalobos, D., Hall, J. S., Idárraga, A., Jiménez-Montoya, J., Kennard, D., Marín-Spiotta, E., Mesquita, R., Nunes, Y. R. F., Ochoa-Gaona, S., Peña-Claros, M., Pérez-Cárdenas, N., Rodríguez-Velázquez, J., Villanueva, L. S., Schwartz, N. B., Steininger, M. K., Veloso, M. D. M., Vester, H. F. M., Vieira, I. C. G., Williamson, G. B., Zanini, K., and Hérault, B.: Multidimensional tropical forest recovery, Science, 374, 1370–1376, https://doi.org/10.1126/science.abh3629, 2021. a
Prado, D.: As caatingas da América do Sul, in: Ecologia e Biogeografía da Caatinga, Universidade Federal de Pernambuco, inara leal, marcelo tabarelli, j.m.c. silva edn., 3–73, https://www.gov.br/mma/pt-br/assuntos/biodiversidade-e-biomas/biomas-e-ecossistemas/biomas/arquivos-biomas/5_livro_ecologia_e_conservao_da_caatinga_203.pdf (last access: 7 July 2024), 2003. a, b
Qin, Y., Xiao, X., Wigneron, J.-P., Ciais, P., Brandt, M., Fan, L., Li, X., Crowell, S., Wu, X., Doughty, R., Zhang, Y., Liu, F., Sitch, S., and Moore, B.: Carbon loss from forest degradation exceeds that from deforestation in the Brazilian Amazon, Nat. Clim. Change, 11, 442–448, https://doi.org/10.1038/s41558-021-01026-5, 2021. a
Ramo, R., Roteta, E., Bistinas, I., van Wees, D., Bastarrika, A., Chuvieco, E., and van der Werf, G. R.: African burned area and fire carbon emissions are strongly impacted by small fires undetected by coarse resolution satellite data, P. Natl. Acad. Sci. USA, 118, e2011160118, https://doi.org/10.1073/pnas.2011160118, 2021. a, b
Ramos-Neto, M. B. and Pivello, V. R.: Lightning Fires in a Brazilian Savanna National Park: Rethinking Management Strategies, Environ. Manage., 26, 675–684, https://doi.org/10.1007/s002670010124, 2000. a
Ratter, J. A., Ribeiro, J. F., and Bridgewater, S.: The Brazilian cerrado vegetation and threats to its biodiversity, Ann. Botany, 80, 223–230, 1997. a
Rella, C. W., Chen, H., Andrews, A. E., Filges, A., Gerbig, C., Hatakka, J., Karion, A., Miles, N. L., Richardson, S. J., Steinbacher, M., Sweeney, C., Wastine, B., and Zellweger, C.: High accuracy measurements of dry mole fractions of carbon dioxide and methane in humid air, Atmos. Meas. Tech., 6, 837–860, https://doi.org/10.5194/amt-6-837-2013, 2013. a, b
Ribeiro, K., Sousa-Neto, E. R. d., Carvalho, J. A. d., Sousa Lima, J. R. d., Menezes, R. S. C., Duarte-Neto, P. J., da Silva Guerra, G., and Ometto, J. P. H. B.: Land cover changes and greenhouse gas emissions in two different soil covers in the Brazilian Caatinga, Sci. Total Environ., 571, 1048–1057, https://doi.org/10.1016/j.scitotenv.2016.07.095, 2016. a, b, c
Rödenbeck, C.: Estimating CO2 sources and sinks from atmospheric mixing ratio measurements using a global inversion of atmospheric transport, Tech. rep., Max Planck Institute for Biogeochemistry, https://www.bgc-jena.mpg.de/~christian.roedenbeck/download/2005-Roedenbeck-TechReport6.pdf (last access: 5 May 2022), 2005. a, b, c
Rödenbeck, C., Houweling, S., Gloor, M., and Heimann, M.: CO2 flux history 1982–2001 inferred from atmospheric data using a global inversion of atmospheric transport, Atmos. Chem. Phys., 3, 1919–1964, https://doi.org/10.5194/acp-3-1919-2003, 2003. a
Rödenbeck, C., Gerbig, C., Trusilova, K., and Heimann, M.: A two-step scheme for high-resolution regional atmospheric trace gas inversions based on independent models, Atmos. Chem. Phys., 9, 5331–5342, https://doi.org/10.5194/acp-9-5331-2009, 2009. a, b, c, d
Rödenbeck, C., Keeling, R. F., Bakker, D. C. E., Metzl, N., Olsen, A., Sabine, C., and Heimann, M.: Global surface-ocean pCO2 and sea–air CO2 flux variability from an observation-driven ocean mixed-layer scheme, Ocean Sci., 9, 193–216, https://doi.org/10.5194/os-9-193-2013, 2013. a
Rödenbeck, C., Zaehle, S., Keeling, R., and Heimann, M.: History of El Niño impacts on the global carbon cycle 1957–2017: a quantification from atmospheric CO2 data, Philos. T. Roy. Soc., 373, 20170303, https://doi.org/10.1098/rstb.2017.0303, 2018a. a, b
Rödenbeck, C., Zaehle, S., Keeling, R., and Heimann, M.: How does the terrestrial carbon exchange respond to inter-annual climatic variations? A quantification based on atmospheric CO2 data, Biogeosciences, 15, 2481–2498, https://doi.org/10.5194/bg-15-2481-2018, 2018b. a, b
Rodrigues, A. A., Macedo, M. N., Silvério, D. V., Maracahipes, L., Coe, M. T., Brando, P. M., Shimbo, J. Z., Rajão, R., Soares-Filho, B., and Bustamante, M. M. C.: Cerrado deforestation threatens regional climate and water availability for agriculture and ecosystems, Glob. Change Biol., 28, 6807–6822, https://doi.org/10.1111/gcb.16386, 2022. a, b
Rosan, T. M., Sitch, S., O'Sullivan, M., Basso, L. S., Wilson, C., Silva, C., Gloor, E., Fawcett, D., Heinrich, V., Souza, J. G., Bezerra, F. G. S., von Randow, C., Mercado, L. M., Gatti, L., Wiltshire, A., Friedlingstein, P., Pongratz, J., Schwingshackl, C., Williams, M., Smallman, L., Knauer, J., Arora, V., Kennedy, D., Tian, H., Yuan, W., Jain, A. K., Falk, S., Poulter, B., Arneth, A., Sun, Q., Zaehle, S., Walker, A. P., Kato, E., Yue, X., Bastos, A., Ciais, P., Wigneron, J.-P., Albergel, C., and Aragão, L. E. O. C.: Synthesis of the land carbon fluxes of the Amazon region between 2010 and 2020, Commun. Earth Environ., 5, 1–15, https://doi.org/10.1038/s43247-024-01205-0, 2024. a, b, c, d, e, f, g
Saatchi, S. S., Houghton, R. A., Alvalá, R. C. D. S., Soares, J. V., and Yu, Y.: Distribution of aboveground live biomass in the Amazon basin, Glob. Change Biol., 13, 816–837, https://doi.org/10.1111/j.1365-2486.2007.01323.x, 2007. a
Saatchi, S. S., Harris, N. L., Brown, S., Lefsky, M., Mitchard, E. T. A., Salas, W., Zutta, B. R., Buermann, W., Lewis, S. L., Hagen, S., Petrova, S., White, L., Silman, M., and Morel, A.: Benchmark map of forest carbon stocks in tropical regions across three continents, P. Natl. Acad. Sci. USA, 108, 9899–9904, https://doi.org/10.1073/pnas.1019576108, 2011. a
Sakschewski, B., von Bloh, W., Boit, A., Poorter, L., Peña-Claros, M., Heinke, J., Joshi, J., and Thonicke, K.: Resilience of Amazon forests emerges from plant trait diversity, Nat. Clim. Change, 6, 1032–1036, https://doi.org/10.1038/nclimate3109, 2016. a
Saleska, S. R., da Rocha, H., Huete, A., Nobre, A. D., Artaxo, P., and Shimabukuro, Y.: LBA-ECO CD-32 Flux Tower Network Data Compilation, Brazilian Amazon: 1999–2006, ORNL DAAC, Oak Ridge [data set], https://doi.org/10.3334/ORNLDAAC/1174, 2013. a
Sano, E. E., Rosa, R., Brito, J. L. S., and Ferreira, L. G.: Mapeamento de Cobertura Vegetal do Bioma Cerrado: estratégias e resultados, Tech. rep., EMBRAPA, https://www.infoteca.cnptia.embrapa.br/bitstream/doc/570887/1/doc190.pdf (last access: 6 October 2022), 2007. a
Santos, A. J., Quesada, C. A., Da Silva, G. T., Maia, J. F., Miranda, H. S., Carlos Miranda, A., and Lloyd, J.: High rates of net ecosystem carbon assimilation by Brachiara pasture in the Brazilian Cerrado, Glob. Change Biol., 10, 877–885, https://doi.org/10.1111/j.1529-8817.2003.00777.x, 2004. a, b
Schaefer, K., Collatz, G. J., Tans, P., Denning, A. S., Baker, I., Berry, J., Prihodko, L., Suits, N., and Philpott, A.: Combined Simple Biosphere/Carnegie-Ames-Stanford Approach terrestrial carbon cycle model, J. Geophys. Res., 113, G03034, https://doi.org/10.1029/2007JG000603, 2008. a
Schuh, A. E., Jacobson, A. R., Basu, S., Weir, B., Baker, D., Bowman, K., Chevallier, F., Crowell, S., Davis, K. J., Deng, F., Denning, S., Feng, L., Jones, D., Liu, J., and Palmer, P. I.: Quantifying the Impact of Atmospheric Transport Uncertainty on CO2 Surface Flux Estimates, Global Biogeochem. Cy., 33, 484–500, https://doi.org/10.1029/2018GB006086, 2019. a
Science Panel for the Amazon: Executive Summary of the Amazon Assessment Report 2021, UN Sustainable Development Solutions Network (SDSN), New York, USA, p. 48, https://www.theamazonwewant.org/wp-content/uploads/2022/06/220717-SPA-Executive-Summary-2021-EN.pdf (last access: 5 October 2022), 2021. a
Silva, P. F. D., Lima, J. R. D. S., Antonino, A. C. D., Souza, R., Souza, E. S. D., Silva, J. R. I., and Alves, E. M.: Seasonal patterns of carbon dioxide, water and energy fluxes over the Caatinga and grassland in the semi-arid region of Brazil, J. Arid Environ., 147, 71–82, https://doi.org/10.1016/j.jaridenv.2017.09.003, 2017. a, b
Silva Junior, C. H. L., Aragão, L. E. O. C., Anderson, L. O., Fonseca, M. G., Shimabukuro, Y. E., Vancutsem, C., Achard, F., Beuchle, R., Numata, I., Silva, C. A., Maeda, E. E., Longo, M., and Saatchi, S. S.: Persistent collapse of biomass in Amazonian forest edges following deforestation leads to unaccounted carbon losses, Sci. Adv., 6, eaaz8360, https://doi.org/10.1126/sciadv.aaz8360, 2020. a
Silva Junior, C. H. L., Pessôa, A. C. M., Carvalho, N. S., Reis, J. B. C., Anderson, L. O., and Aragão, L. E. O. C.: The Brazilian Amazon deforestation rate in 2020 is the greatest of the decade, Nat. Ecol. Evol., 5, 144–145, https://doi.org/10.1038/s41559-020-01368-x, 2021. a
Spera, S. A., Galford, G. L., Coe, M. T., Macedo, M. N., and Mustard, J. F.: Land-use change affects water recycling in Brazil's last agricultural frontier, Glob. Change Biol., 22, 3405–3413, https://doi.org/10.1111/gcb.13298, 2016. a
Steinbach, J., Gerbig, C., Rödenbeck, C., Karstens, U., Minejima, C., and Mukai, H.: The CO2 release and Oxygen uptake from Fossil Fuel Emission Estimate (COFFEE) dataset: effects from varying oxidative ratios, Atmos. Chem. Phys., 11, 6855–6870, https://doi.org/10.5194/acp-11-6855-2011, 2011. a
Tao, S., Wigneron, J.-P., Chave, J., Tang, Z., Wang, Z., Zhu, J., Guo, Q., Liu, Y. Y., and Ciais, P.: Little evidence that Amazonian rainforests are approaching a tipping point, Nat. Clim. Change, 13, 1317–1320, https://doi.org/10.1038/s41558-023-01853-8, 2023. a
Trusilova, K., Rödenbeck, C., Gerbig, C., and Heimann, M.: Technical Note: A new coupled system for global-to-regional downscaling of CO2 concentration estimation, Atmos. Chem. Phys., 10, 3205–3213, https://doi.org/10.5194/acp-10-3205-2010, 2010. a, b
van der Laan-Luijkx, I. T., van der Velde, I. R., Krol, M. C., Gatti, L. V., Domingues, L. G., Correia, C. S. C., Miller, J. B., Gloor, M., van Leeuwen, T. T., Kaiser, J. W., Wiedinmyer, C., Basu, S., Clerbaux, C., and Peters, W.: Response of the Amazon carbon balance to the 2010 drought derived with CarbonTracker South America, Global Biogeochem. Cy., 29, 1092–1108, https://doi.org/10.1002/2014GB005082, 2015. a, b, c, d
van der Werf, G. R., Randerson, J. T., Giglio, L., Collatz, G. J., Mu, M., Kasibhatla, P. S., Morton, D. C., DeFries, R. S., Jin, Y., and van Leeuwen, T. T.: Global fire emissions and the contribution of deforestation, savanna, forest, agricultural, and peat fires (1997–2009), Atmos. Chem. Phys., 10, 11707–11735, https://doi.org/10.5194/acp-10-11707-2010, 2010. a, b, c
van der Werf, G. R., Randerson, J. T., Giglio, L., van Leeuwen, T. T., Chen, Y., Rogers, B. M., Mu, M., van Marle, M. J. E., Morton, D. C., Collatz, G. J., Yokelson, R. J., and Kasibhatla, P. S.: Global fire emissions estimates during 1997–2016, Earth Syst. Sci. Data, 9, 697–720, https://doi.org/10.5194/essd-9-697-2017, 2017. a
van Schaik, E., Killaars, L., Smith, N. E., Koren, G., van Beek, L. P. H., Peters, W., and van der Laan-Luijkx, I. T.: Changes in surface hydrology, soil moisture and gross primary production in the Amazon during the 2015/2016 El Niño, Philos. T. Roy. Soc. B, 373, 20180084, https://doi.org/10.1098/rstb.2018.0084, 2018. a
van Wees, D., van der Werf, G. R., Randerson, J. T., Rogers, B. M., Chen, Y., Veraverbeke, S., Giglio, L., and Morton, D. C.: Global biomass burning fuel consumption and emissions at 500 m spatial resolution based on the Global Fire Emissions Database (GFED), Geosci. Model Dev., 15, 8411–8437, https://doi.org/10.5194/gmd-15-8411-2022, 2022. a, b
Varella, R. F., Bustamante, M. M. C., Pinto, A. S., Kisselle, K. W., Santos, R. V., Burke, R. A., Zepp, R. G., and Viana, L. T.: Soil Fluxes of CO2, CO, NO, and N2O from an Old Pasture and from Native Savanna in Brazil, Ecol. Appl., 14, 221–231, https://doi.org/10.1890/01-6014, 2004. a, b, c
Wang, H., Ciais, P., Sitch, S., Green, J. K., Tao, S., Fu, Z., Albergel, C., Bastos, A., Wang, M., Fawcett, D., Frappart, F., Li, X., Liu, X., Li, S., and Wigneron, J.-P.: Anthropogenic disturbance exacerbates resilience loss in the Amazon rainforests, Glob. Change Biol., 30, e17006, https://doi.org/10.1111/gcb.17006, 2024. a
Wang, J., Zeng, N., Wang, M., Jiang, F., Chevallier, F., Crowell, S., He, W., Johnson, M. S., Liu, J., Liu, Z., Miller, S. M., Philip, S., Wang, H., Wu, M., Ju, W., Feng, S., and Jia, M.: Anomalous Net Biome Exchange Over Amazonian Rainforests Induced by the 2015/16 El Niño: Soil Dryness-Shaped Spatial Pattern but Temperature-dominated Total Flux, Geophys. Res. Lett., 50, e2023GL103379, https://doi.org/10.1029/2023GL103379, 2023. a, b, c
Wang, W., Ciais, P., Nemani, R. R., Canadell, J. G., Piao, S., Sitch, S., White, M. A., Hashimoto, H., Milesi, C., and Myneni, R. B.: Variations in atmospheric CO2 growth rates coupled with tropical temperature, P. Natl. Acad. Sci. USA, 110, 13061–13066, https://doi.org/10.1073/pnas.1219683110, 2013. a
Wiedinmyer, C., Kimura, Y., McDonald-Buller, E. C., Emmons, L. K., Buchholz, R. R., Tang, W., Seto, K., Joseph, M. B., Barsanti, K. C., Carlton, A. G., and Yokelson, R.: The Fire Inventory from NCAR version 2.5: an updated global fire emissions model for climate and chemistry applications, Geosci. Model Dev., 16, 3873–3891, https://doi.org/10.5194/gmd-16-3873-2023, 2023. a