the Creative Commons Attribution 4.0 License.
the Creative Commons Attribution 4.0 License.
 | 14 May 2025
The modulation of synoptic weather patterns and human activities on the diurnal cycle of the summertime canopy urban heat island in the Yangtze River Delta Urban Agglomeration, China
Tao Shi
Yuanjian Yang
Lian Zong
Min Guo
Ping Qi
Simone Lolli
Synoptic weather patterns (SWPs) and human activities are significant driving factors of the canopy urban heat island effect (CUHI), and the CUHI phenomenon exhibits a pronounced diurnal cycle. However, to date, there has been a significant knowledge gap in understanding how the combination of SWPs and human activities modulates the diurnal cycle of CUHI. This study systematically analyzed the diurnal patterns of CUHI intensity (CUHII) in the Yangtze River Delta Urban Agglomeration (YRDUA) by integrating multiple source datasets and utilizing objective classification methods. Among all SWPs, type 2 (dominated by subtropical high pressure) exhibited the strongest CUHII, while type 4 (affected by southwestern moisture and southward cold air) had the lowest. In terms of human activities, landscape percentage (PLAND), largest patch index (LPI), and anthropogenic heat flux (AHF) showed an increasing trend, with higher values in the east and lower values in the west, coinciding with the spatiotemporal patterns of CUHII. These findings collectively confirm the pivotal roles of SWPs and human activities in CUHI phenomena. More importantly, this paper quantifies the contributions of SWPs and human activities to the diurnal cycle of CUHI using a random forest (RF) model. Shapley additive explanation (SHAP) revealed that SWPs had a more pronounced influence on daytime CUHII, whereas human activities dominated nighttime CUHII. During the daytime, the partial dependence plot (PDP) of relative humidity (RH) decreased more pronouncedly, explaining why type 4 contributed more significantly to CUHII during this period. When the wind speed (WS) exceeded a threshold, PDP rapidly increased, which might account for the higher contribution of type 5 to CUHII during this period. During the nighttime, there appeared to be a threshold for PLAND, beyond which its impact on improving CUHII became markedly more prominent. These results indicated that there was a clear diurnal asymmetry in the modulation of CUHI by SWPs and human activities. In conclusion, this study not only provided scientific insight into the complex driving mechanisms of the CUHI diurnal cycle in YRDUA, but also offered a theoretical foundation for evaluating urban overheating issues and developing effective mitigation strategies.
- Article
(9947 KB) - Full-text XML
-
Supplement
(1546 KB) - BibTeX
- EndNote


The expansion of urban areas and the unprecedented growth of the population have led to the well-known phenomenon of the urban heat island (UHI) (Roth, 2007; Rizwan et al., 2008; Oke et al., 2017). Among the various manifestations of UHI, the canopy urban heat island effect (CUHI) refers to the temperature differential observed between urban and rural areas, specifically spanning the range from the ground surface to the roof of urban structures (Liu et al., 2007; Yang et al., 2023). This phenomenon is closely linked to human welfare, as it exerts direct and indirect impacts on human comfort and health, energy consumption patterns, and even financial losses (Muthers et al., 2017; Salimi and Al-Ghamdi, 2020; Xia et al., 2018; Herbel et al., 2018; Marks and Connell, 2024; Singh et al., 2023; Yang et al., 2023).
In recent years, scholars have extensively studied CUHI driving mechanisms (Li et al., 2020; Jiang et al., 2019; Imran et al., 2019). Human activities, such as land use and cover changes and emissions, can modulate urban warming (Ren, 2015; Zheng et al., 2020). However, many studies focus solely on land use and cover data (Ren and Ren, 2011; Shi et al., 2015, 2021, 2024; Tysa et al., 2019; Xue et al., 2023), neglecting the pivotal role of landscape patterns (Ren, 2015; Estoque et al., 2017; Chen et al., 2022). Anthropogenic heat sources, like buildings and transportation, significantly impact the urban thermal environment (Guo et al., 2021). Studies show that aerosols can intensify CUHI (Menon, 2002; Poupkou et al., 2011; Zheng et al., 2018), but others find contrasting effects (Yang et al., 2020; Wu et al., 2021). In addition to human activities, certain synoptic weather patterns (SWPs) can cause noticeable changes in CUHI through their modulation of boundary layer meteorological factors (Hoffmann and Schlünzen, 2013; IPCC, 2021; Yang et al., 2022; Zhang et al., 2024). The western Pacific subtropical high (WPSH) is an important factor in the monsoon system, which leads to high temperatures in southeastern China (Wang et al., 2015). There is significant interannual variability in the extent, intensity, and location of the WPSH, and its positional configuration with the westerly jet and South Asian high affects the region where high temperatures occur. Under clear and cloudless conditions, the solar shortwave radiation received by the ground surface intensifies during the day (Hong et al., 2018), while light winds further mitigate the horizontal dispersion of near-surface heat (Tong and Leung, 2012), thus rendering local high-temperature events more stable and persistent. High-pressure systems in summer can suppress the development of the planetary boundary layer and induce calm and cloud-free conditions favorable for radiation enhancement, thus raising temperatures (Miao et al., 2017; Yang et al., 2018; Wang et al., 2017).
The CUHI phenomenon exhibits pronounced temporal variability throughout the diurnal cycle (Liu et al., 2022; Bansal and Quan, 2024; Lin et al., 2024). Specifically, it tends to intensify significantly after sunset, reaching its peak, while during the day its influence is notably weaker (Tong et al., 2018; Zhang et al., 2022). In fact, the intensities and causes of the day and night CUHI differ. The diurnal CUHI is usually caused by excess heat dissipated from urban surfaces through turbulent transfer, while the night CUHI is primarily caused by the heat stored in urban surfaces during the day (Giridharan et al., 2004, 2005). Daytime urban excess warm events have the potential to induce heatstroke and exacerbate ground-level ozone pollution (Filleul et al., 2006; Gosling et al., 2009; Pu et al., 2017). However, urban excess warm events at night can hinder the body's ability to recover during sleep, potentially leading to insomnia and abnormal temperature regulation (Le Tertre et al., 2006; Gosling et al., 2009; Fischer and Schär, 2010). Furthermore, research has also revealed that excess warm events at night in urban settings can negatively impact agricultural productivity, leading to reduced crop yields (Bahuguna et al., 2017). In the context of global warming and rapid urbanization, exploring the diurnal cycle of CUHI is of significant importance for understanding the impacts of excess urban warming on human health and social activities. However, to date, there remains a significant knowledge gap in understanding how the combination of SWPs and human activities modulates the diurnal cycle of CUHI. Specifically, how do we quantitatively assess the relative importance of SWPs and human activities on the diurnal cycle of CUHI? Do distinct driving effects on daytime CUHII and nighttime CUHII exist?
The Yangtze River Delta Urban Agglomeration (YRDUA) is one of the most developed, densely populated, and concentrated industrial areas in China. In YRDUA, cities and regions are closely linked with each other. The diversity and spatial heterogeneity of the land surface conditions, the dense population, and the close interconnection of the city regions make YRDUA an ideal area for the study of the CUHI city agglomeration (Dong et al., 2014; Du et al., 2016; Zhang et al., 2022; Yan and Zhou, 2023). This study used multisource meteorological and environmental data to objectively identify dominated SWPs over YRDUA. Subsequently, a machine learning method was employed to explore the modulation mechanisms of both SWPs and human activities in the diurnal cycle of CUHI. The overarching goal of this research was to provide valuable insights into the mitigation of urban overheating and the management of urban planning, thus fostering a deeper understanding of the intricate interaction between natural factors and human factors in the shaping of the urban thermal environment.
2.1 Study area
YRDUA is considered one of the influential world-class metropolitan regions, playing a pivotal role in China's economic and social development processes (Tian et al., 2011). YRDUA is situated in the middle to lower reaches of the Yangtze River, serving as the junction between the eastern coastal region and the Yangtze River basin in China. YRDUA denotes the administrative region comprising Shanghai, Jiangsu, Zhejiang, and Anhui (Fig. 1). It represents one of the most developed, densely populated, and highly concentrated industrial zones in China. With a total area of 358 000 km2, accounting for less than 4 % of the country's total, the region is home to approximately 236 million people, inhabited by around 17 % of the national population. In 2023, Shanghai's GDP reached USD 0.67 trillion, Jiangsu's GDP amounted to USD 1.82 trillion, Zhejiang's GDP totaled USD 1.17 trillion, and Anhui's GDP stood at USD 0.67 trillion; collectively, these statistical data surpassed USD 4.26 trillion, accounting for one-quarter of China's total economic output. However, this rapid urbanization has led to a series of intricate urban environmental issues, with the CUHI phenomenon being particularly prominent (Huang and Lu, 2015; Du et al., 2016; Zhang et al., 2022).
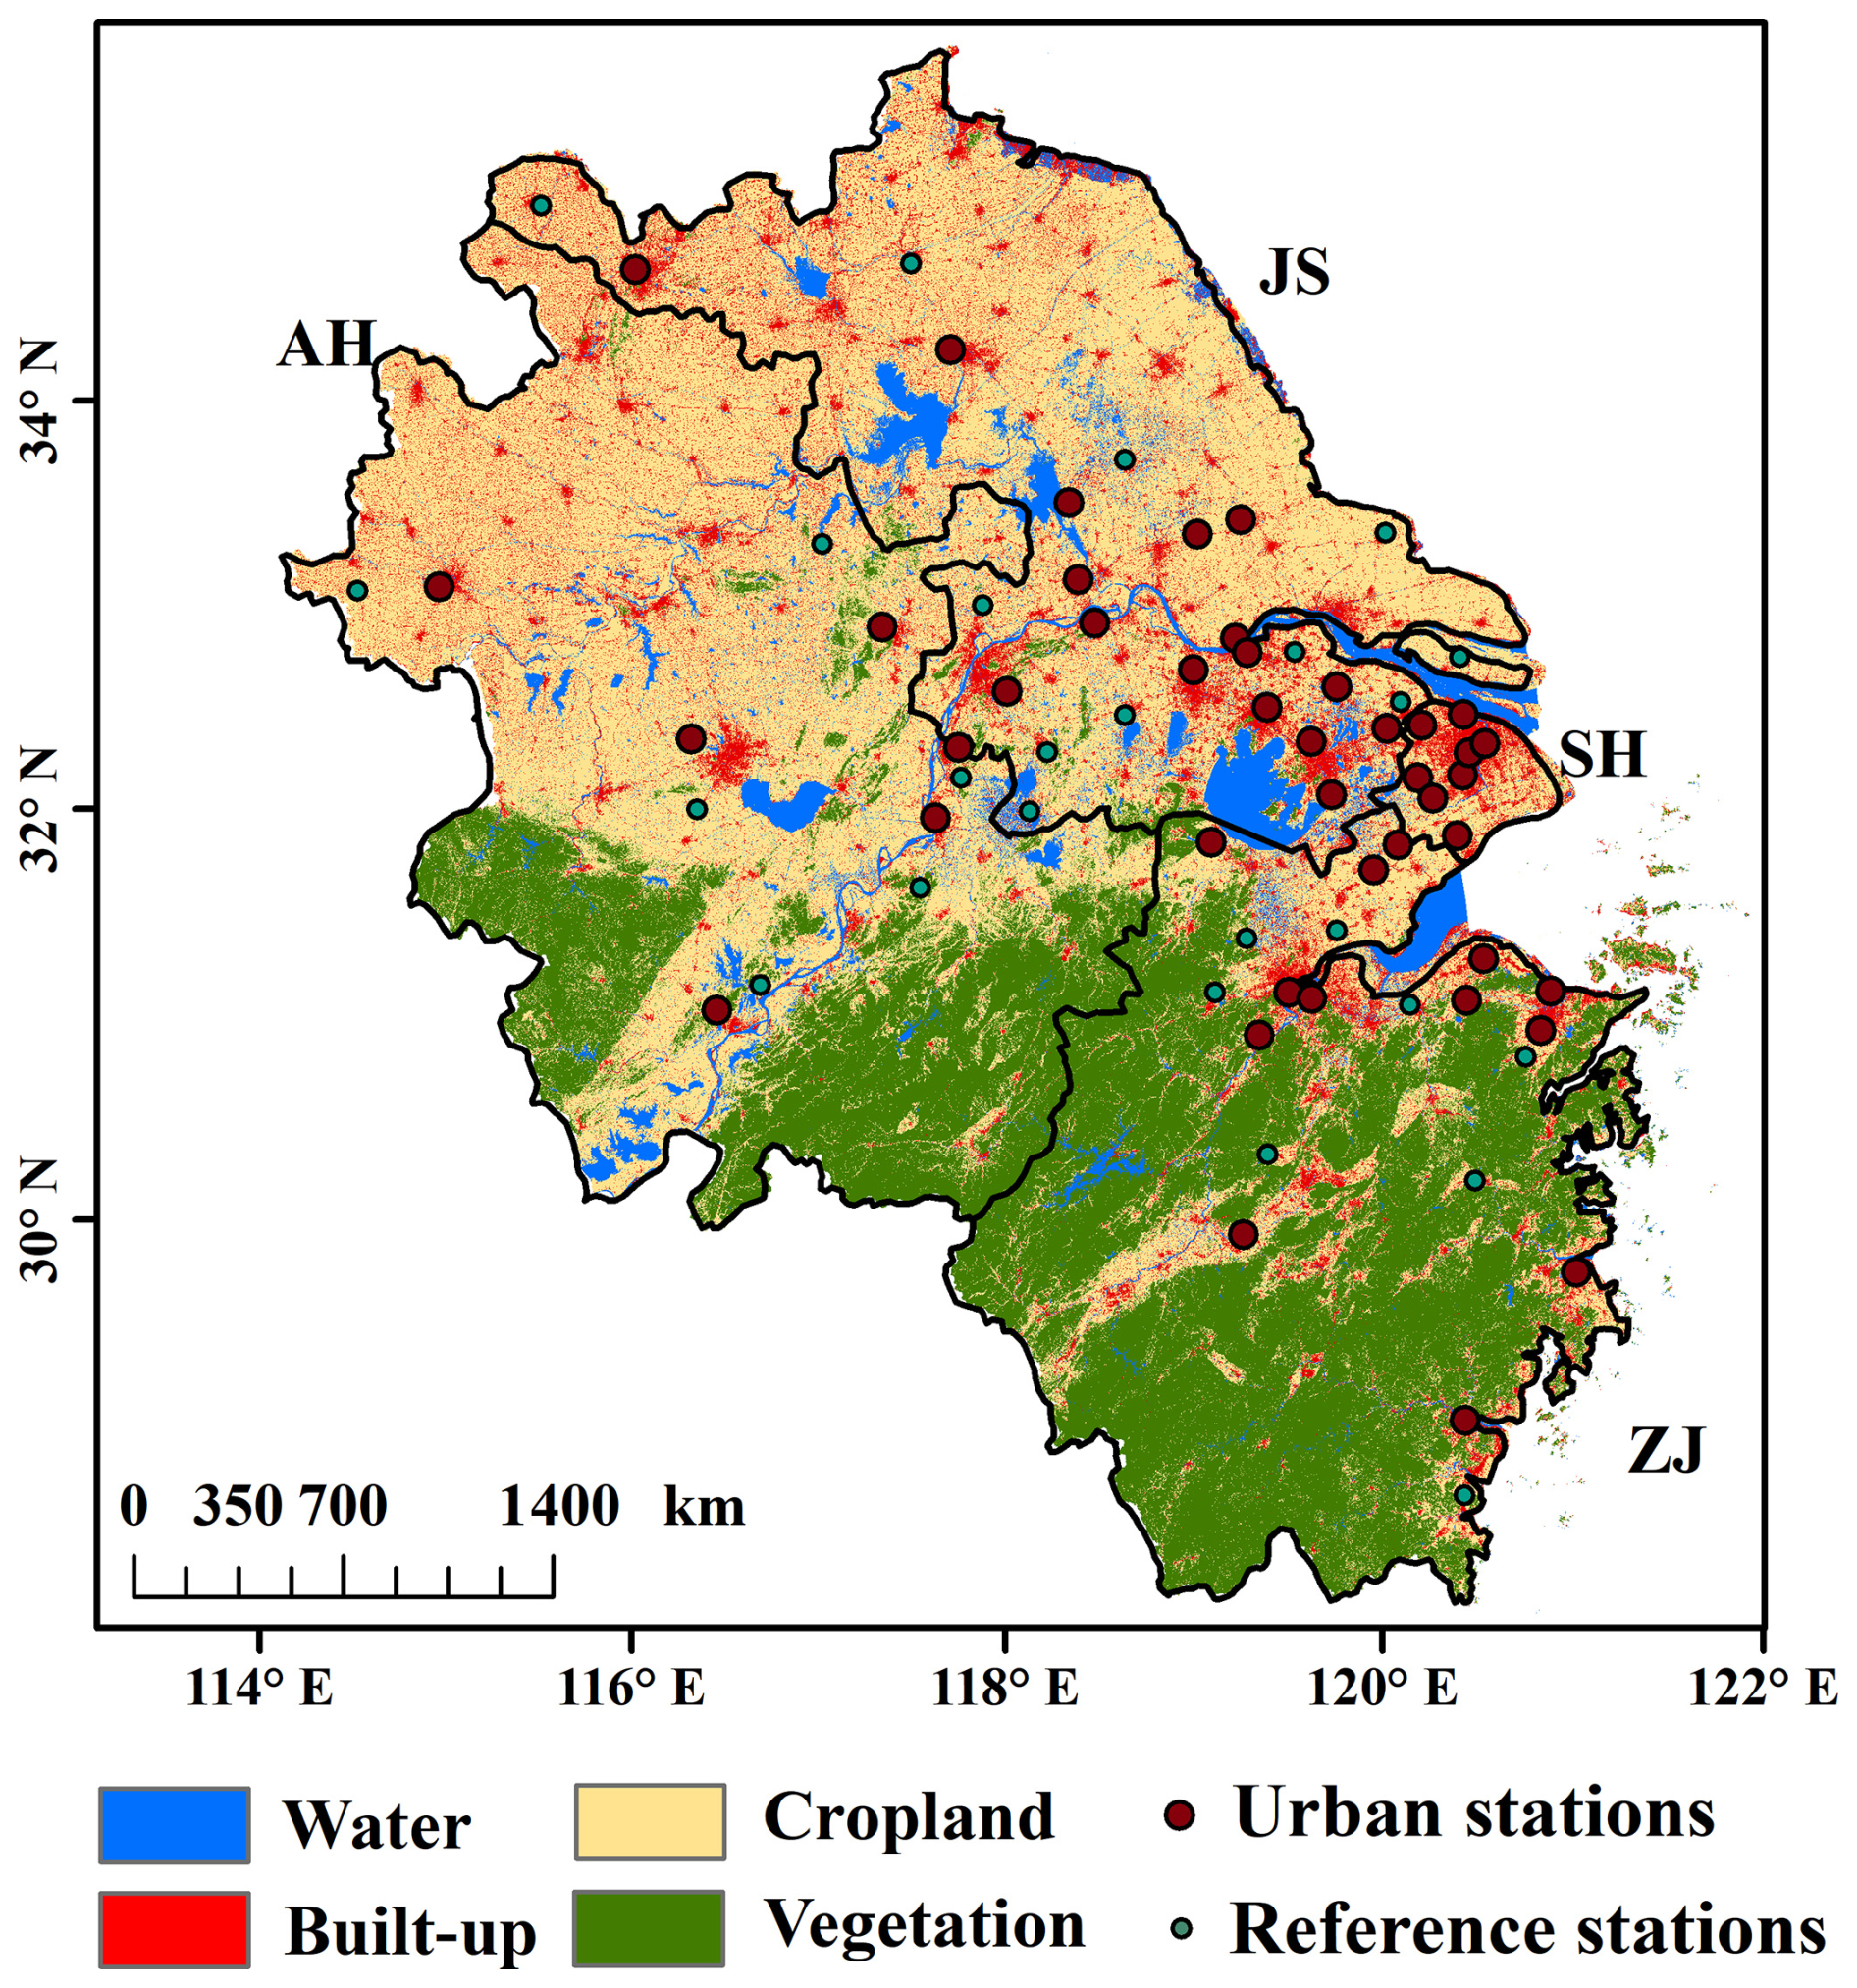
Figure 1Distribution of urban stations and reference stations in YRDUA.
2.2 Data
2.2.1 Reanalysis data
The reanalysis data used in this study, comprising 850 hPa geopotential height, wind speed (WS), total cloud cover (TCC), relative humidity (RH), boundary layer height (BLH), and vertical velocity, were derived from the fifth-generation European Centre for Medium-Range Weather Forecasts (ECMWF) reanalysis of global climate and weather (ERA5). The data period for the specific subset of the ERA5 dataset used in our study spans the months of June to August from 2011 to 2020. This dataset boasts an hourly temporal resolution and a spatial resolution of 0.25° × 0.25°. The dataset was created by the Copernicus Climate Change Service, operated by ECMWF, and ERA5 data can be derived from https://cds.climate.copernicus.eu (last access: 12 September 2024).
2.2.2 Observation data
In this paper, we use the hourly temperature, WS, and RH data covering YRDUA provided by the China Meteorological Data Service Centre (CMDC, http://Data.cma.cn/en, last access: 12 September 2024), spanning the months of June to August from 2011 to 2020. Daily, monthly, and annual data used in this study were derived from hourly measurements. To uphold the integrity and rigor of the dataset, we implemented a quality control procedure following the methodologies outlined by Xu et al. (2013) and Yang et al. (2011). Specifically, missing values within the observational sequences were substituted with the mean values of synchronous observations from the five nearest neighboring stations surrounding the target station. Stations with an excessive number of error records were excluded from the analysis. BLH data from the sounding stations were calculated on the basis of the methodologies described by Seidel et al. (2012) and Guo et al. (2019). The daily concentrations of PM2.5 and PM10 could be accessed from the following links: https://doi.org/10.5281/zenodo.5652265 (Bai and Li, 2021a) and https://doi.org/10.5281/zenodo.5652263 (Bai and Li, 2021b), respectively.
2.2.3 Remote sensing data
The anthropogenic heat flux (AHF) data were derived from the inversion of the National Oceanic and Atmospheric Administration (NOAA) night light satellite dataset (http://ngdc.NOAA.gov/eog/dmsp/downloadV4composites.html, last access: 12 September 2024), with a calculation error margin of less than 12 % (Chen et al., 2016).
The annual China land cover dataset (CLCD) is a dynamic dataset of land use released by Wuhan University. Yang and Huang (2021) developed the land cover datasets with a spatial resolution of 30 m based on 335 709 Landsat images on the Google Earth Engine platform. The latest dataset contains information on land cover for China from 1985 to 2021, and the overall precision of land classification is 80 %.
The normalized difference vegetation index (NDVI) dataset used in this study, produced and distributed by the National Ecological Science Data Center (http://www.nesdc.org.cn/, last access: 12 September 2024), has a spatial resolution of 30 m and a temporal resolution of 1 year. It involves the removal of clouds and shadows by obtaining all valid Landsat observations, followed by the calculation of the NDVI index for each Landsat observation. Subsequently, through a combination of interpolation and smoothing techniques, the maximum NDVI value is obtained for each pixel location throughout the year (Yang et al., 2019).
In this paper, a buffer zone with a radius of 5 km centered around each station is defined as the calculation area, from which various human activity factors could be obtained for each station, including the percentage of landscape (PLAND), the largest patch index (LPI), NDVI, and AHF.
2.3 Methods
2.3.1 Synoptic weather classification
The T-mode principal component analysis (T-PCA) method is an objective classification method. Initially, T-PCA standardized the weather data spatially and divided them into 10 subsets. Subsequently, the principal components (PCs) of the weather information were estimated through singular value decomposition, and the corresponding PC scores were calculated after oblique rotation. Finally, the resultant subset with the highest sum was selected by comparing the 10 subsets based on contingency tables, and the classification result for this subset could be output (Miao et al., 2017; Philipp et al., 2014). This paper objectively classifies synoptic circulations during the summer period of 2011 to 2020, focusing on the field of geopotential height of 850 hPa within the geographical range of 0–60° N and 60–150° E. Six summer weather patterns (SWPs) for YRDUA were identified (as shown in Fig. 2). The frequency of each SWP type in each month was defined as the number of days of occurrence divided by the total number of days.
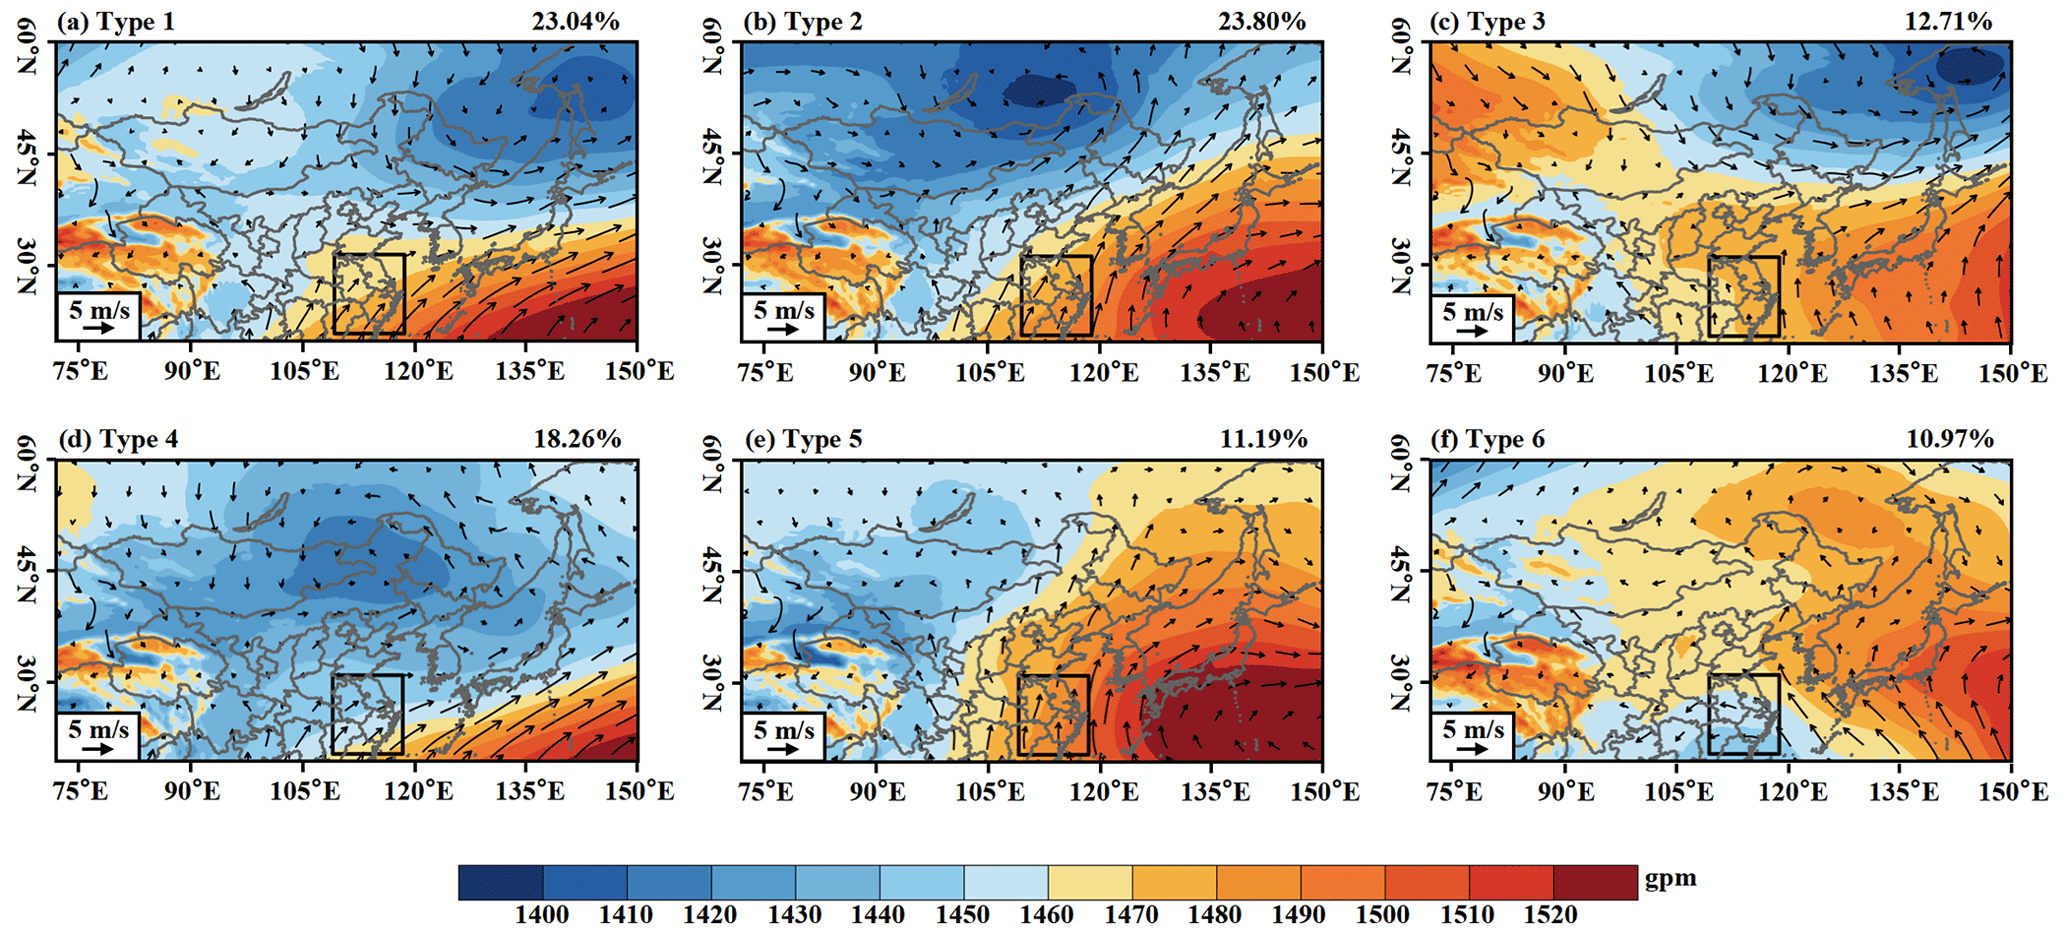
Figure 2The geopotential height of 850 hPa (shading) and wind (vectors) based on the objective classification in six SWPs in summer (a–f), respectively. The black box indicates the Yangtze River Delta Urban Agglomeration (YRDUA).
Under type 1 (23.04 % of occurrences), abundant moisture transport from the South China Sea and prevailing strong southwest winds create favorable conditions for water vapor conducive to precipitation formation. In type 2, the subtropical high jumps northward, placing YRDUA under its control, with decreased moisture transport from the southwestern sea. This type occurs most frequently among the six types, with a frequency of 23.80 %. Type 3 (12.71 %) features the subtropical high retreating eastward, with uniform pressure dominating over YRDUA, resulting in lower WS. Type 4 (18.26 %) involves the subtropical high retreating southward and eastward, influenced by both moisture transport from the southwestern sea and southward-moving cold air, favoring precipitation and temperature reduction. In type 5 (11.19 %), YRDUA is primarily controlled by the subtropical high, with warm air transported from the southeastern ocean promoting air subsidence, which is conducive to high-temperature weather. Lastly, type 6 (10.97 %) sees a small cyclone center emerging in central and southern China, positioning YRDUA in the vicinity of a weak low-pressure system, potentially influencing local weather patterns.
2.3.2 Stations selection and CUHII calculation
Since surface air temperature is measured at a height of 2 m, previous studies (Yang et al., 2013; Cai, 2008; Shi et al., 2015) have indicated that under conditions of advection and turbulent transport, the maximum impact of anthropogenic heat on meteorological observations within a station typically does not exceed 5 km. Consequently, a radius of 5 km was selected as a buffer zone to capture the effects of urbanization on air temperature. AHF serves as an indicator of the influence of human emissions and changes in land use on sensible and latent heat fluxes in the lower atmosphere (Jiang et al., 2019; Chen et al., 2020). Following the calculation of the average AHF within a 5 km radius around each station, the top a third of the stations, ranked by their AHF values, were designated as urban stations (USs) for this study.
The selection of reference stations (RSs) is the key step in calculating CUHII (Ren and Ren, 2011). The stations in the bottom one-third, ranked by their AHF values, were chosen as candidate RSs. Furthermore, RSs must meet the following criteria: they must have continuous records spanning over 50 years without missing data; the number of relocations must be less than three, and any relocations must involve a horizontal distance of less than 5 km (Zhang et al., 2010; Ren, 2015; Shi et al., 2015; Wen et al., 2019; Yang et al., 2022). As a result, 46 USs and 25 RSs were selected for this analysis. The method used to calculate CUHII was specifically based on comparing the air temperature differences between USs and RSs during the summertime (Ren et al., 2007; Yang et al., 2022).
In the above equation, CUHII is the canopy urban heat island intensity during the summertime, TUSs is the air temperature of the USs, and TRSs is the summer air temperature of the RSs.
2.3.3 Random forest model
The random forest (RF) model, an extension or evolution of decision trees, represents a popular and highly versatile machine learning approach (Tan et al., 2017; Yu et al., 2020). Unlike traditional linear regression models, RF operates as a nonparametric method, capable of modeling complex nonlinear relationships among predicted values and various predictor variables (Hastie et al., 2009), while also identifying the significance of individual variables (Wang et al., 2019). Based on previous research (Duan et al., 2021; Chen et al., 2022), we randomly divided the stations within YRDUA into train (70 %) and test (30 %) samples. With CUHII serving as the dependent variable, the RF model incorporated both synoptic factors and anthropogenic factors as independent variables, encompassing SWPs, RH, WS, BLH, AL, PLAND, LPI, AHF, PM2.5, and PM10. To train and test the RF model, we employed a 10-fold cross-validation approach (Zeng et al., 2020). The construction of the RF model and the calculation of importance scores for influencing factors were implemented using Python.
3.1 Diurnal cycle of CUHII in YRDUA
On the background of climate warming, human activities have produced considerable amounts of anthropogenic heat and pollutant emissions, which, to a certain extent, exacerbate urban excess warming.

Figure 3Temporal characteristics of CUHII during the daytime and nighttime. (a) The diurnal variation of CUHII, with short lines indicating standard deviation, blue areas representing day, and purple areas representing night. (b) The monthly variation of CUHII during the daytime and nighttime (“Sum” indicates summer).
Figure 3a illustrates the hourly variation of CUHII in the summer in YRDUA from 2011 to 2020. At 08:00 Beijing time (BJT, same below), as the solar altitude angle increases, the temperature in suburban areas rises faster than that in urban areas. Coupled with higher wind speed during the day compared to night, turbulence intensifies, leading to a rapid decline in the urban–suburban temperature difference. Consequently, CUHII reaches its minimum value of 0.27 °C at 17:00 BJT. After 18:00 BJT, as the solar altitude angle decreases, the shortwave radiation from the sun correspondingly diminishes. For suburban areas, the net radiation generally turns negative after sunset, leading to a stable atmospheric stratification where the entire underlying surface is in a state of heat loss, resulting in an increased cooling rate (Liu et al., 2013). However, in urban areas, due to the accumulation of more heat, longwave radiation from the ground continues to supply heat to the atmosphere. The urban underlying surface is characterized by dense construction, leading to a much lower sky view factor (SVF) in streets compared to suburban areas. Longwave radiation from the ground undergoes multiple reflections between walls and the ground, significantly reducing the amount of heat lost from the surface to the atmosphere (Drach et al., 2018; Tian and Miao, 2019). In addition, high-rise buildings in urban areas with lower SVF tend to experience lower wind speed (Hang et al., 2011). These factors collectively contribute to a rapid widening of the temperature difference between urban and suburban areas during the night. Compared to urban areas, suburbs can be regarded as cooling sources (Mirzaei and Haghighat, 2010; Yang et al., 2024). Before sunrise, between 00:00 and 07:00 BJT, the cooling rate in urban areas consistently remains lower than that in suburban areas, leading to a gradual increase in CUHII to its daily maximum value of 0.65 °C. Overall, CUHII exhibits a clear diurnal cycle characterized by a gradual decrease, stable low values, rapid increase, and stable high values, with pronounced day–night differences, consistent with previous studies (Wang et al., 2017; Zhang et al., 2022). Figure 3b depicts the intraseasonal variation of CUHII in YRDUA. It can be observed that the average CUHII in July and August (approximately 0.63 °C) is significantly higher than in June, and the day–night difference in CUHII in June and August (approximately 0.14 °C) is significantly greater than in July. Throughout the entire summer period, the average CUHII during the nighttime is 21.11 % higher than during the daytime.

Figure 4Spatial patterns of CUHII in YRDUA during the day (a) and the night (b). Different colored dots represent different ranks of CUHII. The bar chart below represents the average CUHII of Anhui (AH), Jiangsu (JS), Shanghai (SH), and Zhejiang (ZJ).
Figure 4 illustrates the spatial patterns of CUHII in YRDUA. Taking the day CUHII as an example (Fig. 4a), it is evident that CUHII in the eastern YRDUA is significantly higher than that in the western YRDUA. Specifically, SH exhibits the highest CUHII, reaching 0.59 °C, with the highest CUHII observed at the Xujiahui station, peaking at 0.95 °C. Following SH, ZJ and JS rank second and third, with CUHII values of 0.52 and 0.37 °C, respectively. In contrast, AH has the lowest CUHII, at merely 0.25 °C. When considering the night CUHII (Fig. 4b), SH maintains the highest CUHII, which rises to 0.62 °C, while CUHII at the Xujiahui station increases even further, reaching 1.04 °C. Similarly, ZJ, JS, and AH also experience varying degrees of intensification of CUHII. In conclusion, there is a pronounced difference in the spatial–temporal patterns of CUHII between day and night. The underlying mechanisms driving this phenomenon will be analyzed from the perspectives of SWPs and human activities in the subsequent sections of this paper.
3.2 Spatial–temporal patterns of SWPs and human activities in YRDUA
Based on the T-PCA results, the summer synoptic backgrounds in YRDUA from 2011 to 2020 can be classified into six distinct SWPs. We first conducted a statistical analysis of the occurrence frequencies of these different SWPs, as illustrated in Fig. 5. The daily, interannual, and monthly frequency of occurrence of six SWPs during the summer from 2011 to 2020 revealed pronounced variations in atmospheric circulation patterns. Specifically, type 1 predominantly occurred in late June and early July 2011, as well as in 2017–2020. Type 2 exhibited the highest frequency, mainly concentrated in mid-to-late July and early August of each year, with particularly high occurrences in 2013 and 2020. Type 3 appeared frequently in August annually. Type 4 was more prevalent in mid-to-late June of each year. Type 5 was mostly observed in mid-July. Lastly, type 6 predominantly emerged in early August 2011–2012 and 2018–2019.
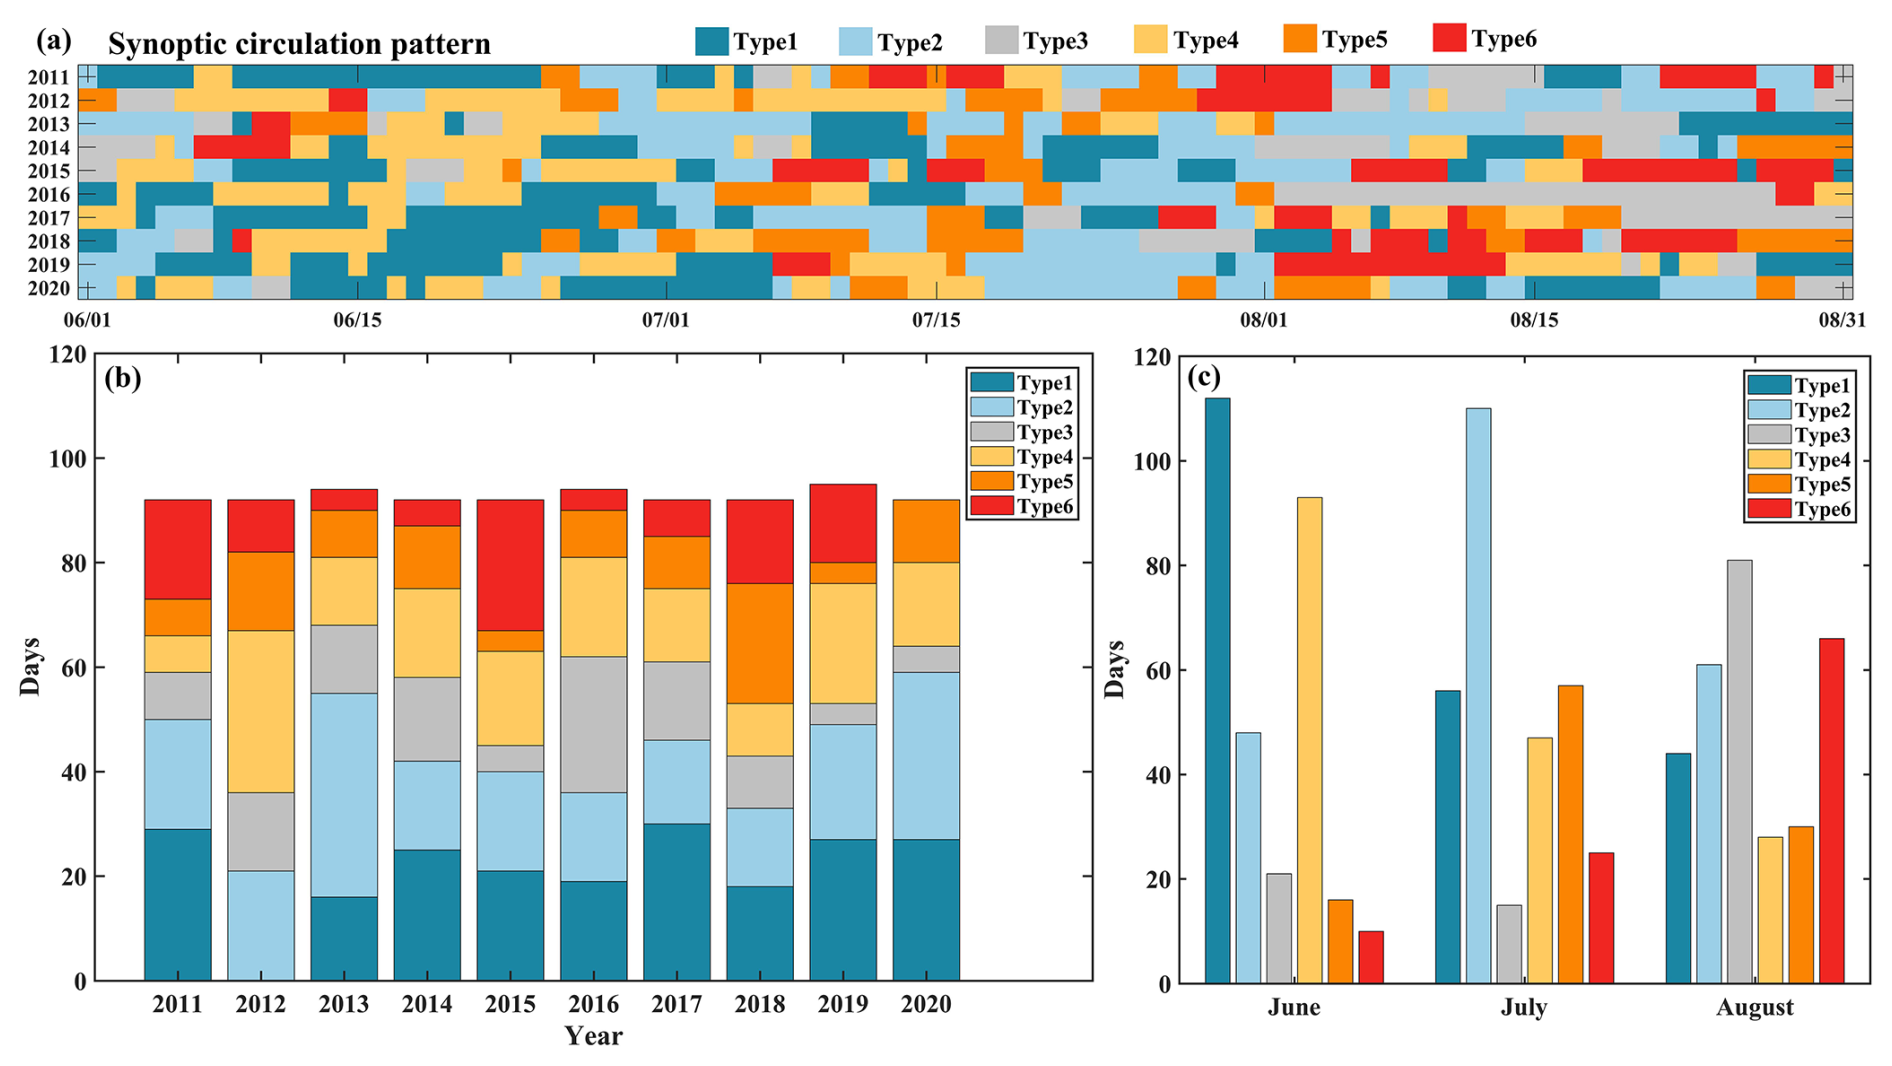
Figure 5(a) Daily, (b) interannual, and (c) monthly occurrence frequencies of the six SWPs in YRDUA from 2011 to 2020.
This paper delves into analyzing the diurnal variation of CUHII in YRDUA under different SWPs. In Fig. S1 in the Supplement, across all SWPs, the diurnal variation of CUHII consistently exhibits a periodic pattern of gradual decline, stable low values, rapid increase, and stable high values. Specifically, the daily maximum of CUHII occurs under type 2. Under type 2, with the northward movement of the subtropical high of the western Pacific, the Meiyu season ends, transitioning into a period dominated by hot and dry weather, characteristic of midsummer. The daily minimum of CUHII is observed under type 4. Under type 4, intensified low-pressure activities and moisture transport lead to cloudy skies, bringing about a precipitation-dominated climatic phase in YRDUA. Figure S2 illustrates the spatial patterns of CUHII under various synoptic backgrounds. In general, all high-CUHI centers align well with economically developed and densely populated urban areas of all types. In general, the average CUHII under type 2 is markedly higher than that of other types, and type 4 exhibits the lowest average CUHII. These findings underscore the crucial role of various SWPs in modulating CUHII in YRDUA.
Next, this study analyzed the spatiotemporal variations of meteorological conditions within the boundary layer. As the sun rises, ground warming causes atmospheric stratification to become unstable, enhancing turbulence and increasing WS, which opposes CUHII's diurnal pattern (Fig. S3). Figure S4 reveals that type 6 exhibits the highest WS, attributable to the highest boundary layer observed over YRDUA under type 6 conditions, where a weak low-pressure system contributes to the upward development of the boundary layer. Type 4 displays the lowest WS, which corresponds to the lowest boundary layer and increased cloud cover, thereby reducing solar radiation reaching the ground and inhibiting boundary layer growth. Figures S5 and S6 indicate that as air temperature rises after sunrise, the saturation vapor pressure increases, leading to a decrease in RH, which reaches its daily minimum at 15:00 BJT before gradually rising thereafter. The day humidity is conspicuously lower than the night humidity. Turning our attention to the BLH, during the nighttime, the atmospheric stratification is stable, accompanied by low WS, which consequently results in a low BLH. However, as the sun rises and wind speeds intensify, the BLH begins an upward trend (see Fig. S7). Therefore, the meteorological conditions of the boundary layer constitute important factors influencing the spatiotemporal variations of CUHII (Ren et al., 2007; Yang et al., 2019, 2023).

Figure 6Temporal patterns of PLAND (a), LPI (b), NDVI (c), AHF (d), PM2.5 (e), and PM10 (f) in YRDUA.
Figure 6a and b illustrate that PLAND gradually increased from 44.31 % in 2011 to 51.91 % in 2020, and LPI also rose from 37.01 % in 2011 to 44.65 % in 2020. The spatial patterns of PLAND and LPI (Fig. S8a and b) indicate that SH exhibits the highest level of urbanization, as evidenced by half of the stations appearing in a deep red grade on the map, followed by ZJ and JS, and AH showing the lowest level, which generally corresponds to the spatial patterns of CUHII. Figure 6c reveals a declining trend in NDVI over the years, and the spatial pattern of NDVI exhibits an opposite pattern to that of CUHII (Fig. S8c). Figure 6d suggests an increasing trend in AHF. Since AHF is closely related to changes in the built-up areas surrounding the meteorological stations (Guo et al., 2021), the temporal–spatial patterns of AHF are generally consistent with those of PLAND (Fig. S8d). Furthermore, PM2.5 and PM10 concentrations exhibit a trend of initial growth followed by a decrease (Fig. 6e and f), suggesting an improvement in air quality after an initial period of deterioration. Following the issuance of the Action Plan for Air Pollution Prevention and Control released by the State Council in 2013, various pollution prevention and control measures have been implemented across YRDUA, leading to a marked improvement in air quality. The gradual decrease in aerosol concentrations from the northwest to southeast within YRDUA (Fig. S8e and f) may be attributed to differences in industrial structures, infrastructure, and environmental protection policies between different regions (He et al., 2024). These findings confirm that human activities, such as land use, anthropogenic heat, and aerosols, are significant drivers of the CUHI phenomenon (Ren, 2015; Zheng et al., 2020; Yang et al., 2023).
3.3 The modulation of CUHII by SWPs and human activities
In this section, we selected synoptic backgrounds, meteorological conditions, and urban morphology as influencing factors and used the RF model to fit the day CUHII and night CUHII, aiming to explore the driving mechanisms of synoptic and human factors on CUHII. Figure 7 compares the performance of the RF models for day and night. During the day (Fig. 7a), the RF model achieves an R squared (R2) value of 0.95 and a root mean squared error (RMSE) of 0.13 °C in the train data, indicating an excellent fit between the model predictions and the observed data. When we turn our attention to the test data, the performance of the RF model decreases, which might be attributed to differences in the distribution between the test and train data. Similarly, for night (Fig. 7b), the RF model produces excellent results on the train data. These findings suggest that the RF model might be a powerful tool for simulating the local urban thermal environment (Yu et al., 2020; Chen et al., 2022).
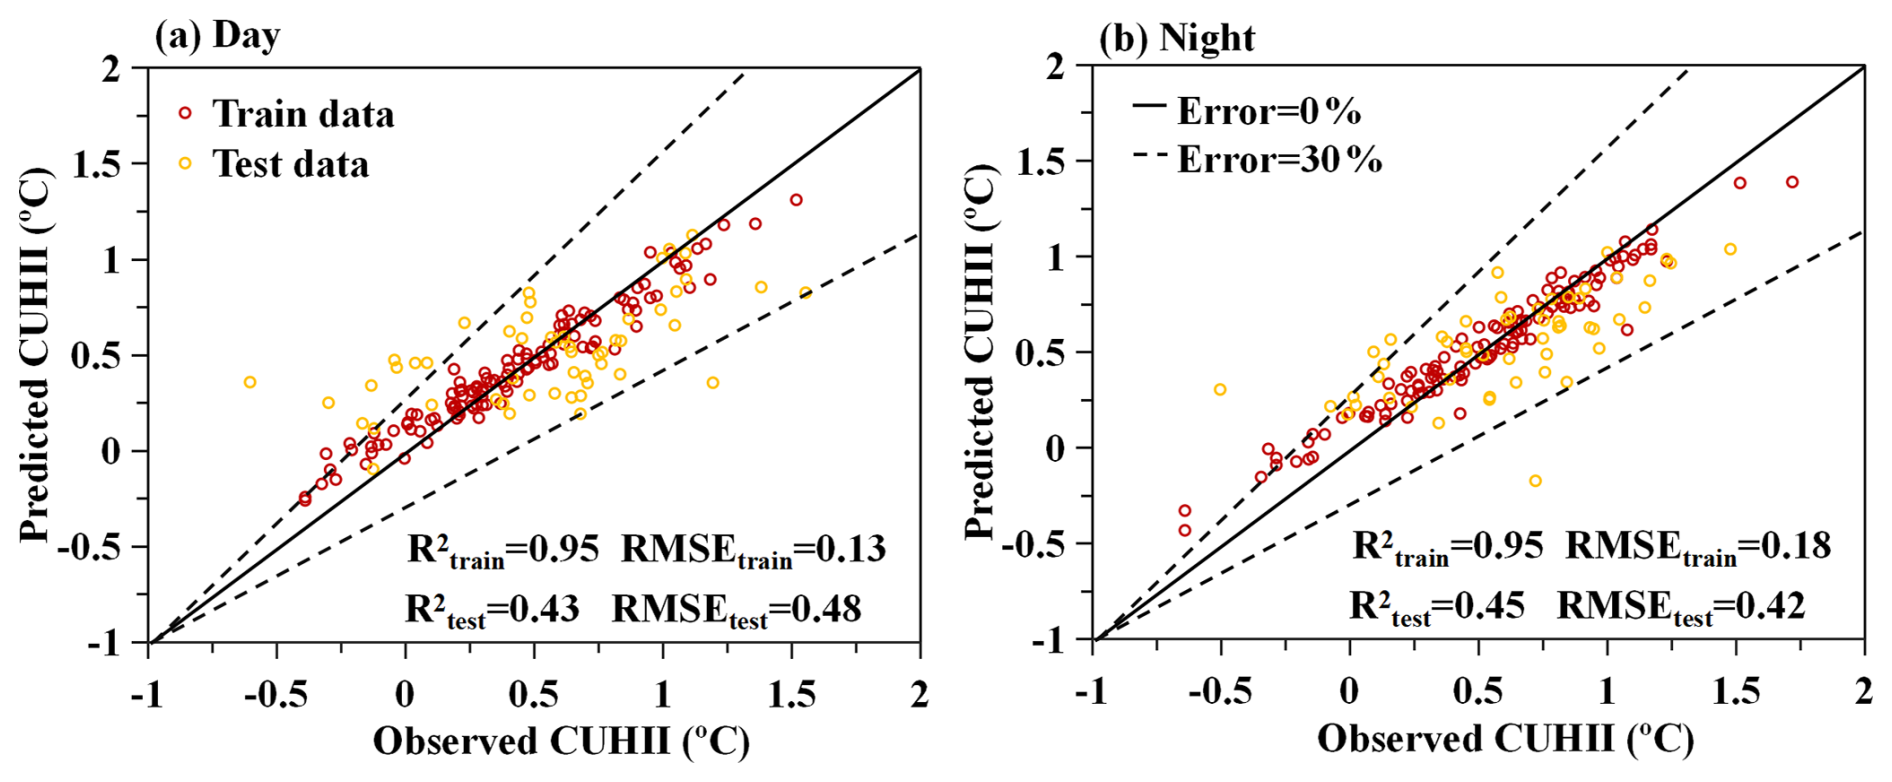
Figure 7Prediction results of day CUHII (a) and night CUHII (b). Red circles represent the train data, while yellow circles represent the test data. The dashed lines indicate 30 % fit error lines.
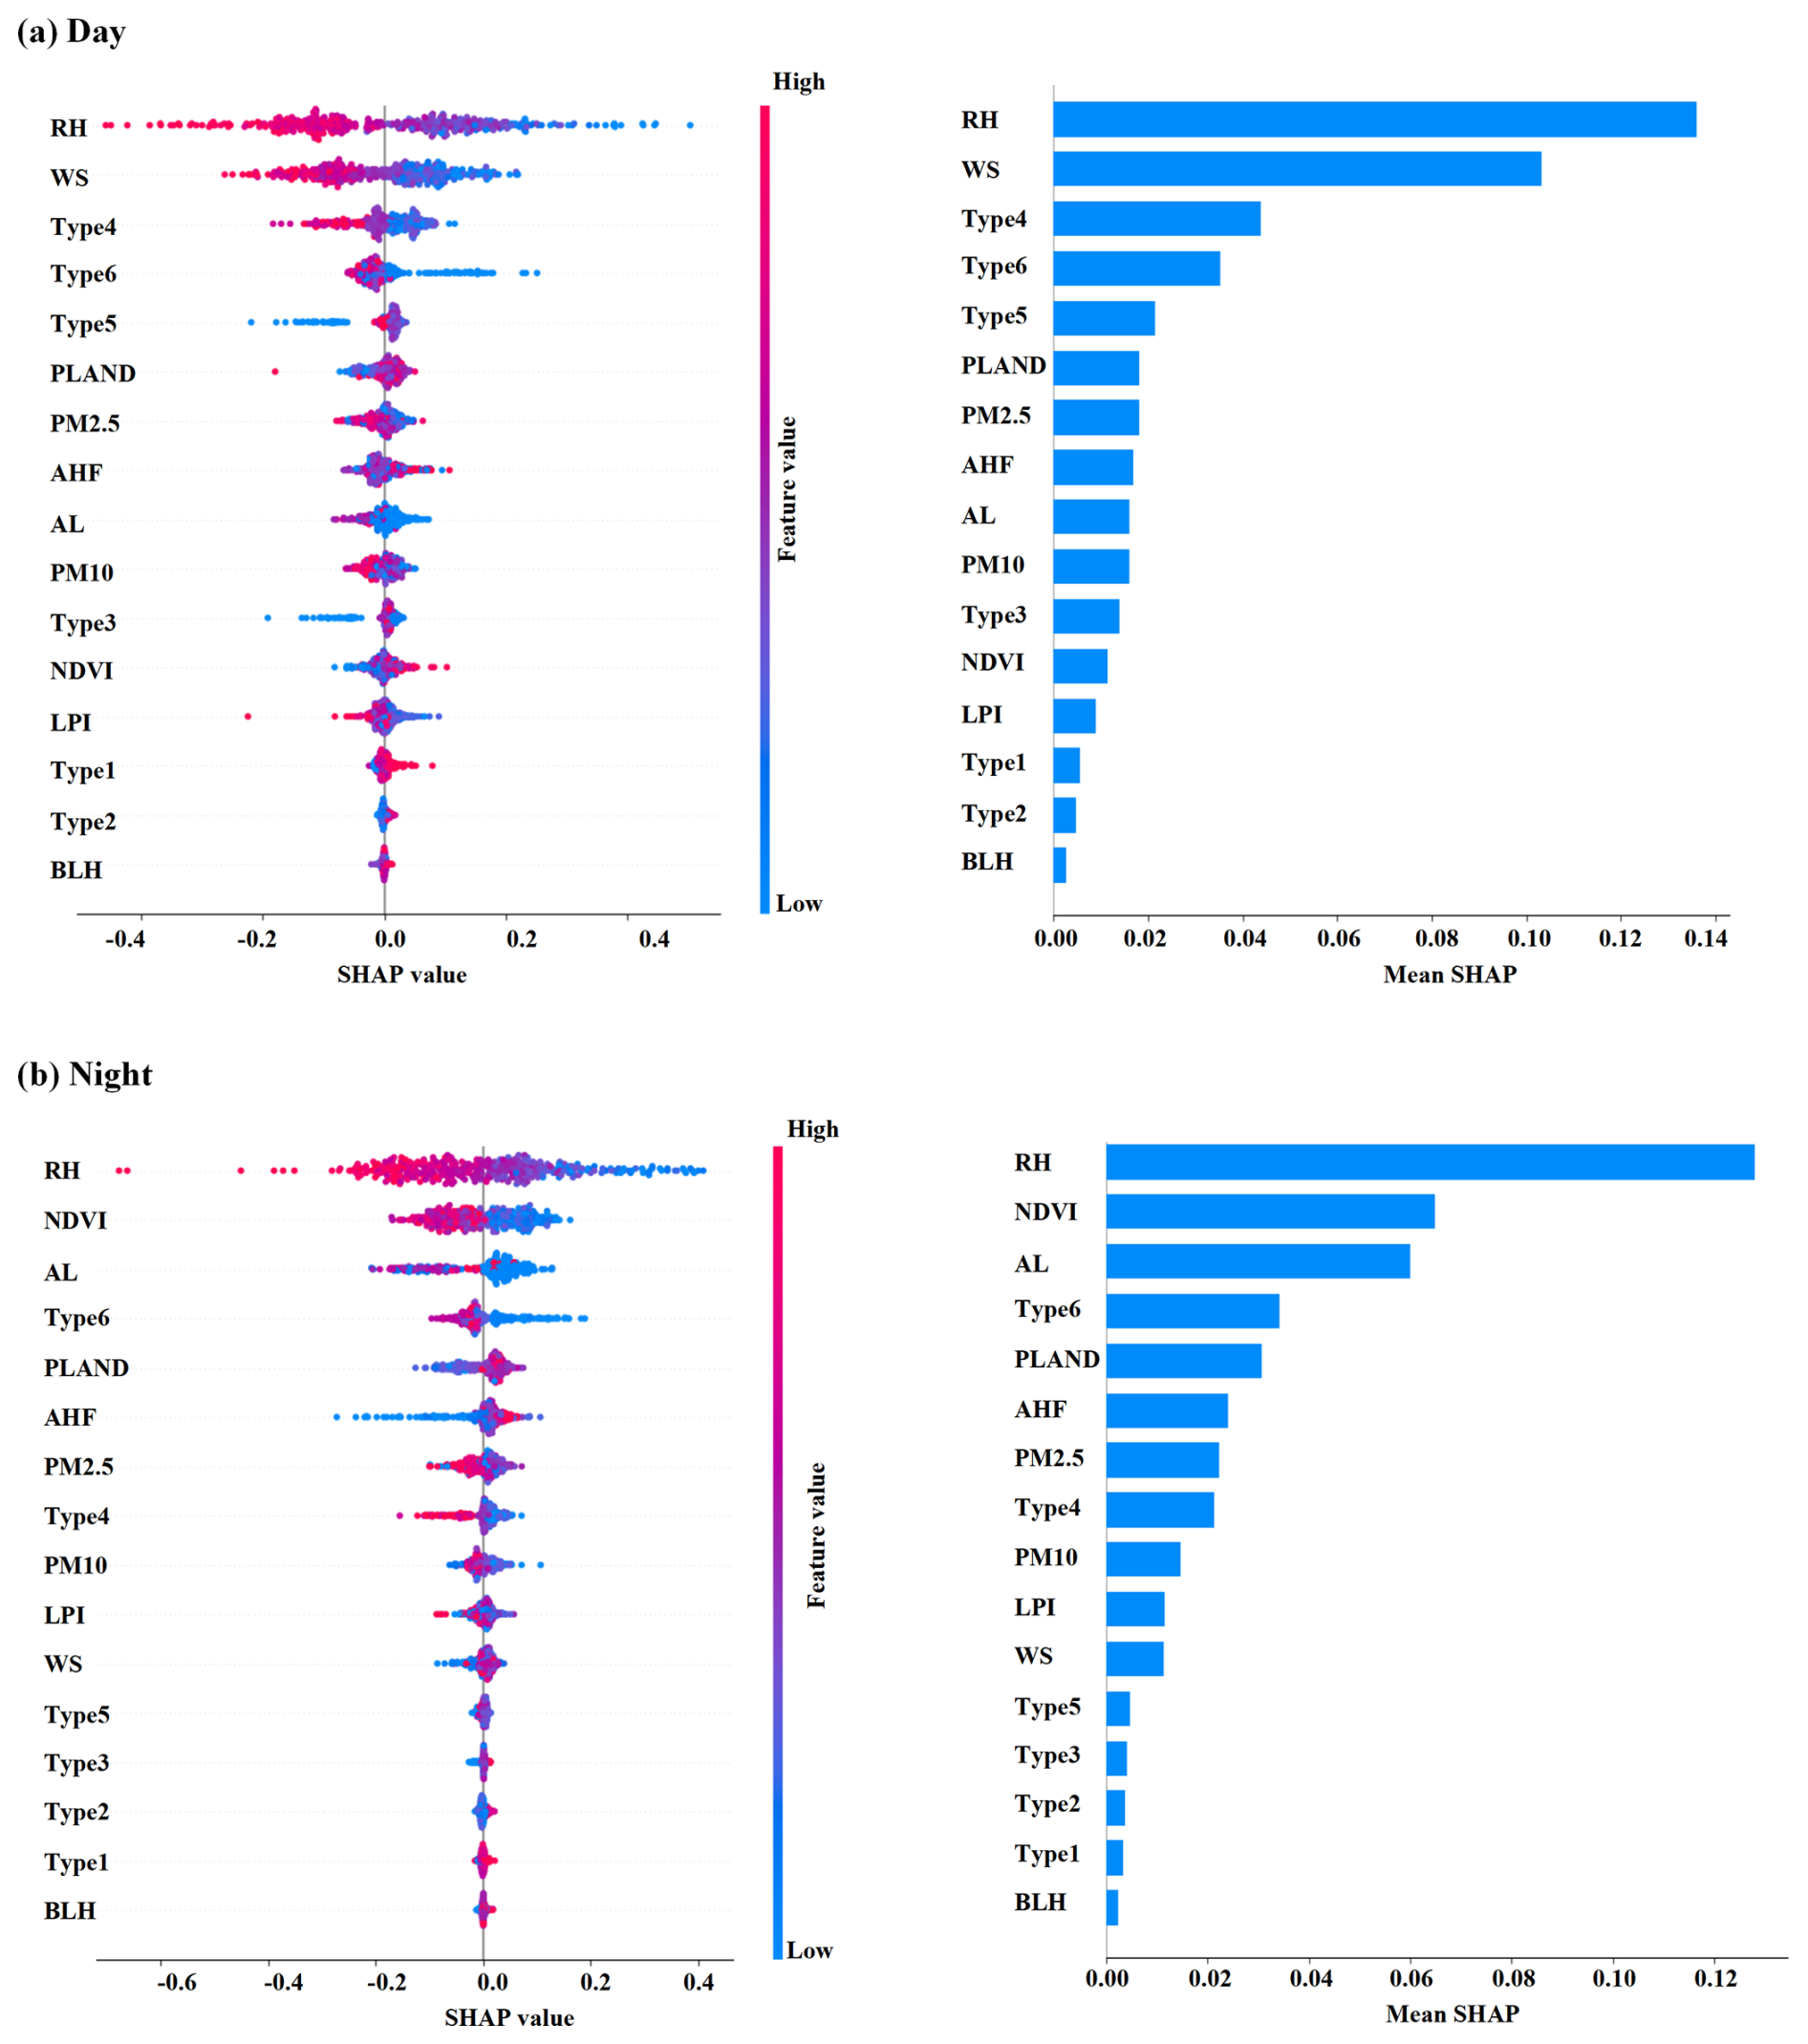
Figure 8SHAP plots illustrating the influence factors of day CUHII (a) and night CUHII (b) based on the RF model. The left subplot represents the SHAP values. The right subplot depicts the mean SHAP values, which are used to characterize the importance of various factors.
Next, we used the RF model to analyze the contributions of various factors to day CUHII and night CUHII. Shapley additive explanation (SHAP) is an interpretability framework used to explain model outputs (Park et al., 2023). It assesses the impact of individual characteristics on prediction results by quantifying their contributions to the result. As depicted in the left subplot (SHAP value) of Fig. 8, each row represents a feature, with the horizontal axis indicating the SHAP value. Each dot corresponds to a sample, where the reddish colors signify higher feature values and the bluer colors indicate lower values. It is evident that RH exerts the most significant influence on the model, regardless of the day or night. The red dots (high RH) are concentrated on the left side (SHAP < 0), whereas the blue dots (low RH) are clustered on the right side (SHAP > 0), with a notable separation between the two color groups. This clear distinction signifies a significant negative impact of RH on the model. Specifically, the red dots, representing higher levels of air humidity, tend to absorb heat through evaporation, thus mitigating the CUHI phenomenon to a certain degree (Huang et al., 2012; Jiang et al., 2019). Of course, several scholars contend that humidity can exacerbate heat stress (Mora et al., 2017; Zhang et al., 2023). CUHII is highly dependent on variations in WS (Oke et al., 2017; Yang et al., 2020). During the day, WS ranks second in terms of its contribution to CUHII, but its significance diminishes significantly during the night. Among SWPs, type 4 exhibits the greatest contribution to CUHII during the day, whereas type 6 dominates during the night. PLAND ranks sixth in contribution during the day but gains further importance during the night. Additionally, we observed that the SHAP values for SWPs are more dispersed during the day, indicating that CUHII was more sensitive to changes in synoptic conditions during this period. Conversely, the more dispersed SHAP values for human activities during the night suggest that CUHII was more responsive to variations in human activities during this period. We defined the importance of each feature as the mean absolute value of its impact on the target variable. As depicted in the right subplot (mean SHAP) of Fig. 8, statistical analysis reveals that during the daytime, the mean SHAP values for SWPs and human activities are 0.12 and 0.10, respectively. During the nighttime, these values change to 0.08 for SWP and 0.16 for human activities. Consequently, during the day, SWPs were more crucial than human activities to influence CUHII, whereas during the night, human activities surpass SWPs in their importance for CUHII.
In the SHAP plots presented above, the mixed pattern of red and blue dots signifies that the relationships between various factors and CUHII do not adhere to simple positive or negative trends, underscoring the need for an analysis of their nonlinear associations. Within the framework of machine learning, partial dependence plot (PDP) refers to the evaluation of the relationship between a single feature's value and the model's prediction outcomes, while holding all other features constant (Friedman, 2001). Taking type 4 as an illustrative example, this type predominantly occurs in late June, characterized by rainy and overcast days due to the influence of low pressure and moisture transport from the southwestern sea, resulting in high air humidity. As evident from Fig. 9a, during the nighttime, PDP gradually decreases with increasing RH, while during the day, the decrease in PDP is more pronounced, indicating that air humidity may exhibit a stronger mitigating effect on CUHII during the day compared to during the night. This explains why type 4's SHAP value ranks third during the day but drops to eighth during the night, as the influence of air humidity on CUHII diminishes. Next, we consider type 5, which typically appears in mid-July, influenced by warm air transported from the southeastern ocean by the subtropical high of the western Pacific, favoring air subsidence, which leads to higher WS. As illustrated in Fig. 9b, during the day, once WS exceeds 1.7 m s−1, PDP rapidly decreases, significantly improving the ability to mitigate CUHII. For the entire city, a more consistent wind field at ground level contributes to a stronger heat transport capacity (Xie et al., 2022; Yang et al., 2023). However, during the night, as the WS increases, the PDP remains largely unchanged. This is because urban surfaces undergo radiative cooling during the night, which slows down heat loss. Although WS can facilitate some heat diffusion, its mitigating effect is limited by factors such as dense urban buildings and poor air circulation. Consequently, type 5's SHAP value ranks 5th during the daytime but drops to 12th during the nighttime, as the impact of WS on CUHII rapidly diminishes.
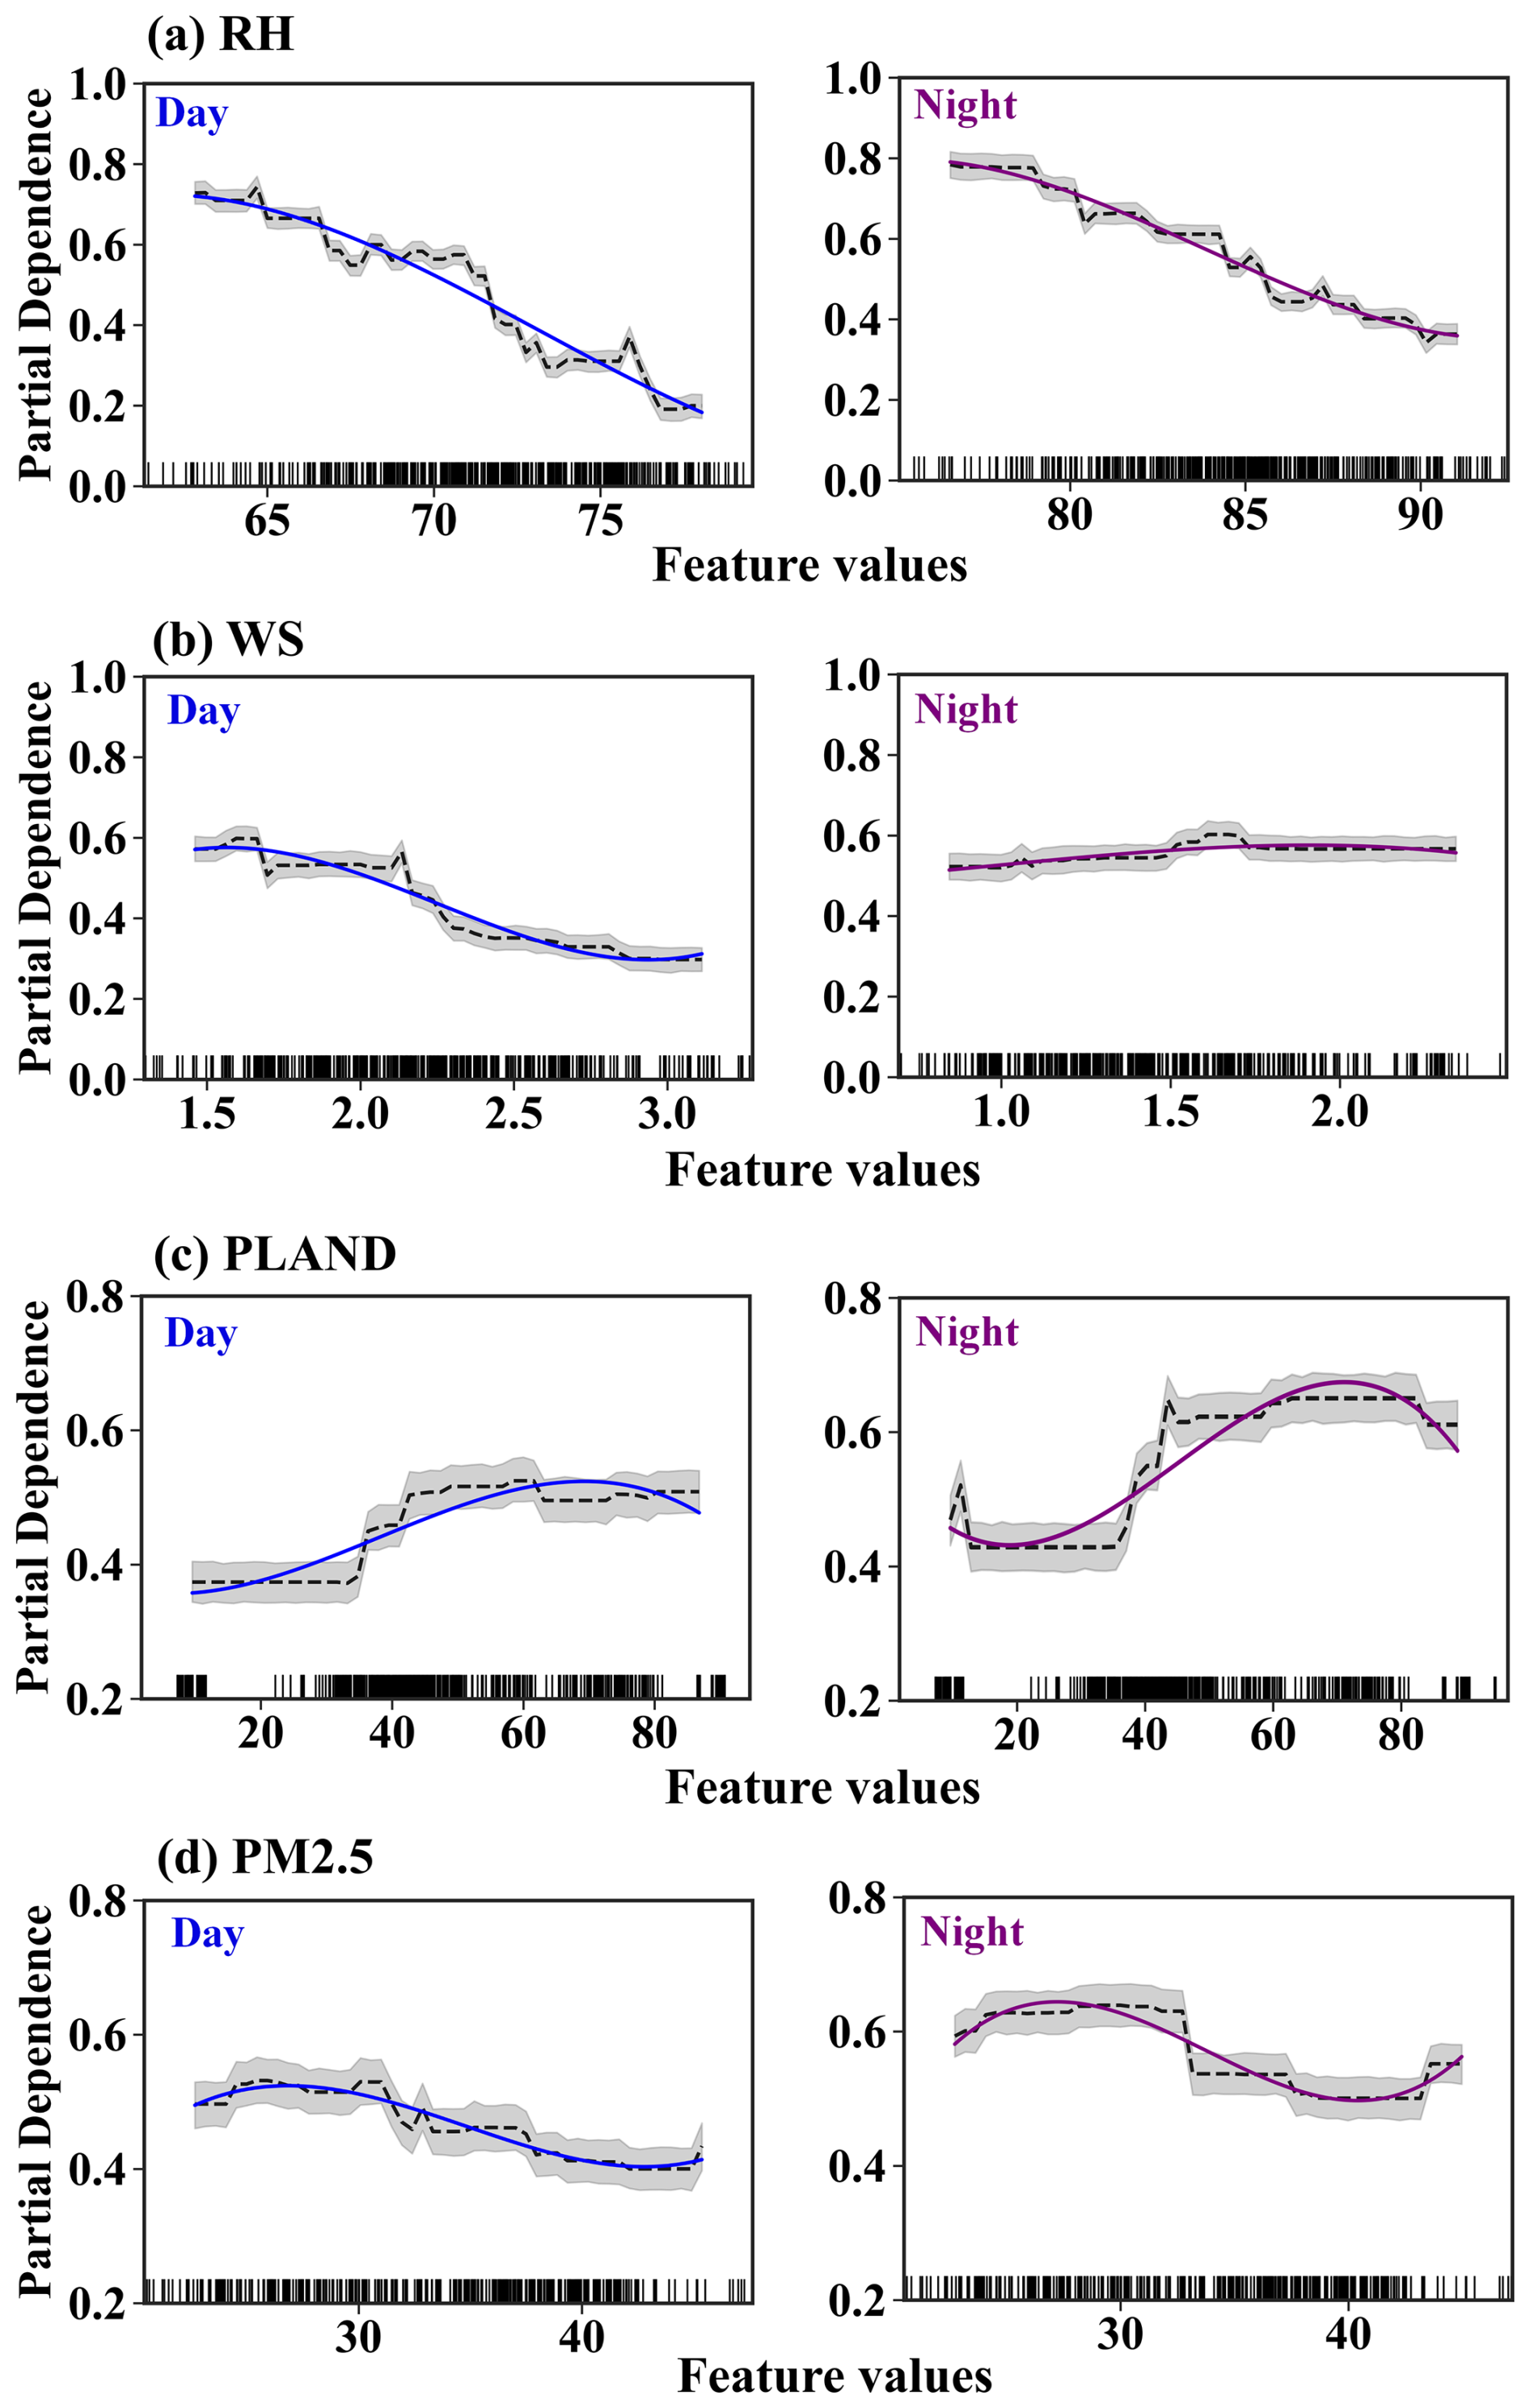
Figure 9Partial dependence plots of day CUHII and night CUHII with respect to RH (a), WS (b), PLAND (c), and PM2.5 (d). The blue and red lines represent the fitted curves for day and night, respectively. The gray areas indicate the 95 % confidence interval. Rug plots (small vertical lines) along the x axis represent the distribution of the feature values.
Next, this paper examines the partial dependence of CUHII on human activities. During the nighttime, when PLAND exceeds 38 %, the PDP rapidly increases (Fig. 9c). There may be a threshold for the built-up area, beyond which its contribution to improving CUHII becomes significantly more pronounced. This complex correlation pattern is intimately linked to urban climatic conditions, vegetation coverage within urbanized areas, the frequency of human activities, and seasonal and spatial variations in energy consumption (Guo et al., 2016; Yang et al., 2018; Zhou et al., 2014). In contrast, during the daytime, the upward trend of PDP is notably weaker than during the nighttime. While buildings can intensify CUHII by reducing outgoing longwave radiation and WS, they also block more shortwave solar radiation from reaching the ground, and this shading effect contributes to lowering near-surface air temperatures (Zhang et al., 2016; Krayenhoff and Voogt, 2016; Taleghani et al., 2016; Cai and Xu, 2017). Figure 9d shows that as PM2.5 concentrations increase, PDP gradually decreases. During the daytime, PM2.5 scatters and absorbs part of the solar radiation, reducing the amount of solar radiation reaching the surface and thereby inhibiting the CUHI phenomenon (Yang et al., 2021). During the nighttime, changes in CUHII are more dependent on the energy stored within the urban canopy. The PDP trend exhibits a threshold behavior. When PM2.5 concentrations exceed 40 µg m−3, PM2.5 slows the loss of surface heat and its insulating effect becomes apparent (Li et al., 2020). These results indicate that there is a clear diurnal asymmetry in the modulation of CUHI by SWPs and human activities. This finding provides valuable information on the physical mechanisms of CUHI and the optimization of predictive models.
In the context of global climate warming, the frequency and duration of heatwave (HW) events are also increasing worldwide, posing significant challenges to urban thermal environments and resulting in public health issues (IPCC, 2021; Patz et al., 2005; Xu et al., 2016). Next, we will analyze the HW activity patterns under different SWPs in YRDUA.
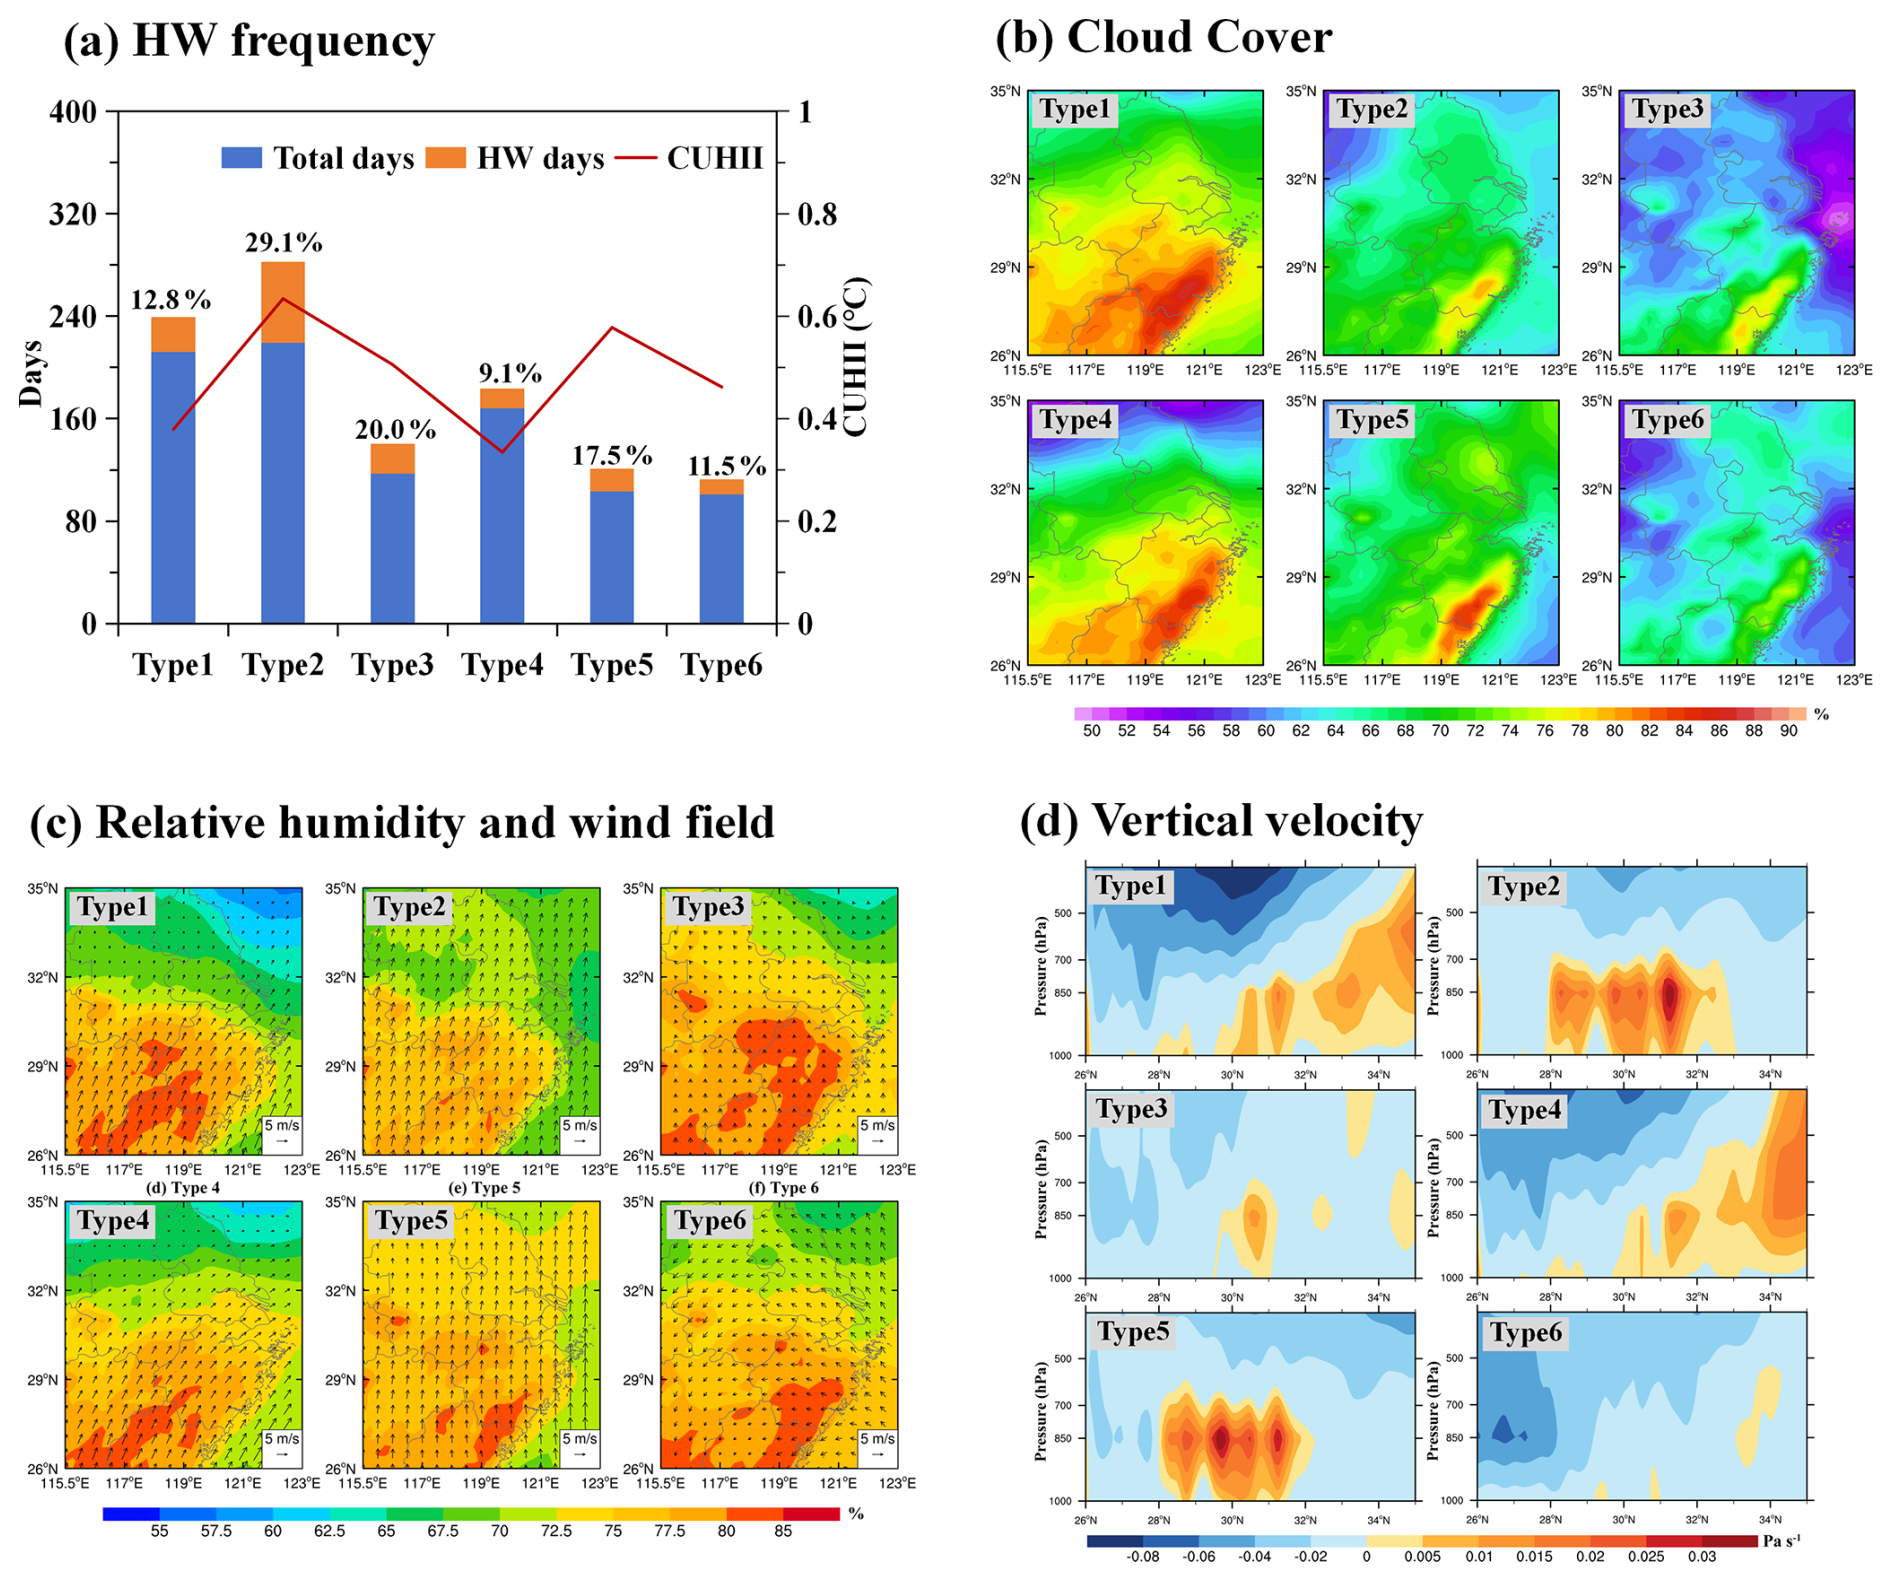
Figure 10HW frequency (a), cloud cover (b), relative humidity and wind field (c), and vertical velocity profiles (d) under different SWPs in YRDUA.
As shown in Fig. 10a, type 2 exhibits the highest frequency of HW events (29.1 %), corresponding to the highest CUHII (0.66 °C). Type 4, on the other hand, has the lowest HW frequency and the lowest CUHII. The ranking of the HW frequency and CUHII for other synoptic types generally aligns. In Fig. 10b, type 4 has the highest cloud cover, forming a high-value center band in the southeast, while type 2 has a relatively lower cloud cover. Reduced cloud cover improves the reach of solar radiation reaching the surface, contributing to the HW frequency. In Fig. 10c, the relative humidity across YRDUA is generally high, above 65 %. Type 4 displays a high humidity center in the southern part of YRDUA. On the contrary, type 2 exhibits a lower overall relative humidity, influenced by the subtropical high of the western Pacific, which is favorable for the formation of HW events. Figure 10d presents the zonal profiles of vertical velocity at 500, 700, 850, and 1000 hPa for the six SWPs, with positive values indicating sinking motion and negative values indicating ascending motion. Under type 4, the central and southern regions of YRDUA experience prevalent ascending motion above 850 hPa, where warm air encounters cold air, leading to increased cloud cover and subsequently lower HW frequency. On the contrary, type 2, controlled by the subtropical high of the western Pacific, exhibits a strong sinking motion in the central region, reducing cloud cover, improving solar radiation reaching the ground, and increasing the HW frequency.
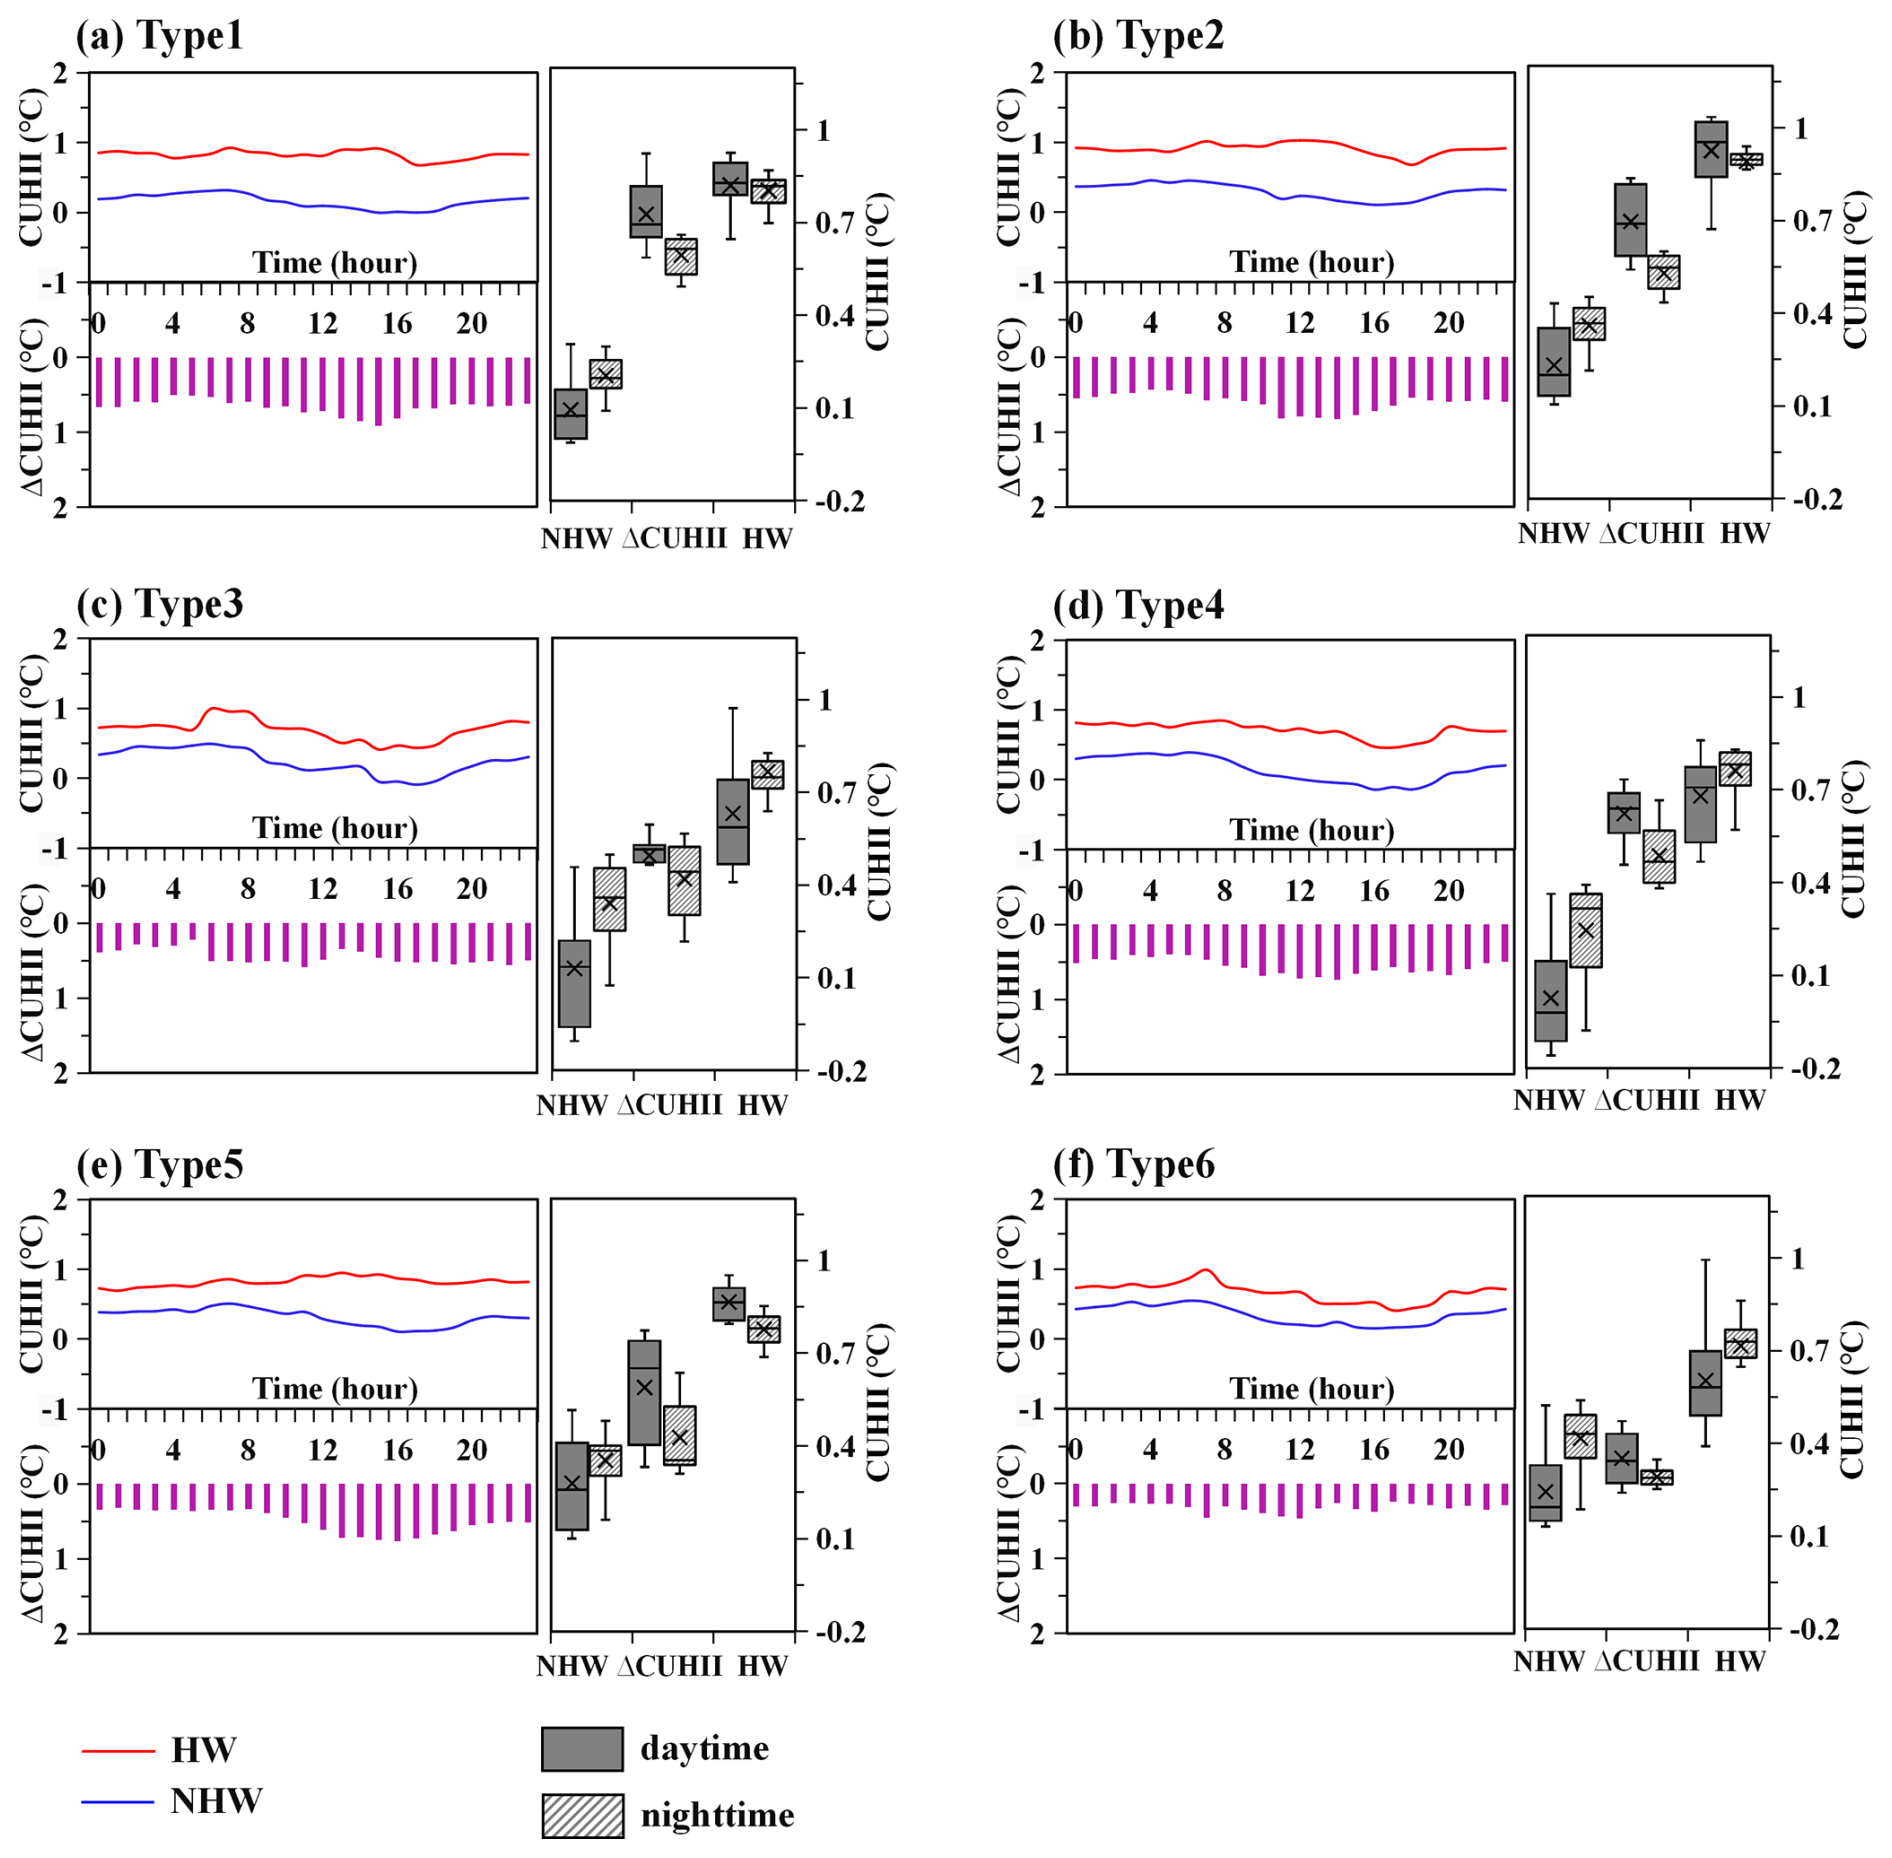
Figure 11Synergies between HW and CUHI during HW periods under different SWPs (a–f). In each panel, the upper line chart represents the diurnal variation of CUHII, the lower bar chart represents the diurnal variation of the ΔCUHII during HW periods, and the box plot on the right presents the statistical results for both day and night.

Figure 12Diurnal variations of (a) RH and (b) WS during the HW periods (red line) and the NHW periods (blue line).
Previous studies have noted a pronounced amplification of CUHII during HW periods (Li and Bou-Zeid, 2013; Founda et al., 2015; Khan et al., 2020; Ngarambe et al., 2020). Does a similar effect exist for CUHII in YRDUA during HW periods? If so, what role does this amplification play in the diurnal cycle of CUHII? We proceed with our analysis to explore these questions. Figure 11 illustrates that CUHII during HW periods (red line) is significantly higher than that during non-heatwave (NHW) periods (blue line) for all SWPs, indicating a notable amplification of CUHII in YRDUA during HW periods. Specifically, the differences in CUHII between HW and NHW range from 0.22 to 0.92 °C (purple bars), with the most pronounced amplification observed in type 1 and type 2. In particular, amplified CUHII (ΔCUHII) peaks around 15:00 BJT during the day, consistent with previous studies (Tan et al., 2010; Founda et al., 2015), highlighting the crucial role of day in amplifying CUHII. Statistical analysis of day and night data (box plots) reveals that during NHW periods, CUHII is significantly higher at night than during the day. However, during HW periods, the amplification effect is stronger during the day than at night, significantly narrowing the difference between CUHII at night and during the day. For example, under type 3, type 4, and type 6, the difference between night and day CUHII decreases by over 35 % during HW periods compared to NHW periods. Furthermore, in type 1, type 2, and type 5, during HW periods, day CUHII even surpasses night CUHII. To gain insight into the underlying physical mechanisms, Fig. 12 compares the diurnal variations of RH and WS between the HW and NHW periods. The results show that, overall, RH during HW periods is generally lower than RH during NHW periods, with the disparity widening significantly during the day. As exemplified by type 2, the maximum difference in RH coincides with the maximum difference in CUHII at 15:00 BJT, suggesting that during the daytime of HW periods, urban areas are drier than their suburban counterparts, inhibiting the cooling of the evaporation and therefore exacerbating CUHII. In addition, WS analysis indicates that while night WS remains similar between HW and NHW periods, WS decreases significantly during the daytime of HW periods (except for type 6), implying suppressed advective cooling and further contributing to the amplification of CUHII. In summary, HW events not only significantly amplify CUHII in YRDUA, but also attenuate the diurnal variation of CUHII by modulating local meteorological factors. Given the unique coastal location of YRDUA, the influence of sea–land breeze advection cooling on the diurnal cycle of CUHII cannot be overlooked. Future research will focus on typical cities within the region, delving deeper into the effects of sea breezes on the dynamic changes of the urban thermal environment.
This study systematically analyzed the complex modulation mechanisms of the diurnal cycles of CUHII using objective classification and a machine learning model, taking into account both SWP and human factors. The key findings were summarized as follows.
CUHII in the YRDUA region exhibited a spatial pattern with higher values in the east and lower values in the west. Night CUHII was 21.11 % stronger than that during the daytime, with June displaying the largest diurnal amplitude. The temporal–spatial dynamics of CUHII manifested a pronounced diurnal cycle. At the synoptic system level, this study clarified the differentiated impacts of six distinct SWPs on CUHII within the 850 hPa geopotential height field during summer. In particular, type 2 (dominated by subtropical high pressure) stood out due to its high frequency of occurrence and accompanying intense CUHII (0.65 °C during the day and 0.71 °C during the night). Type 4 (jointly influenced by southwestern moisture and cold air moving southward) was characterized by low frequency and relatively weaker CUHII (0.41 °C during the day and 0.47 °C during the night). These discoveries indicated that SWPs could play a pivotal role in regulating the diurnal cycle of CUHII. Furthermore, this research delved into the contributions of human activities to CUHII. Apart from particulate matter, PLAND, LPI, and AHF all exhibited increasing trends over the years, with their spatial distributions closely mirroring that of CUHII, again featuring higher values in the east and lower in the west. This underscored the non-negligible influence of human activities on CUHII. Most importantly, this paper quantifies the contributions of SWPs and human activities to the diurnal cycle of CUHI using a RF model. The SHAP value revealed that SWPs had a more pronounced influence on daytime CUHII (mean SHAP: 0.12 for human activities, 0.10 for SWPs), whereas human activities dominated nighttime CUHII (mean SHAP: 0.08 for human activities, 0.16 for SWPs). During the daytime, the PDP value for RH exhibited a more significant decrease, explaining why type 4 contributed more prominently to CUHI during this period. When the wind speed surpassed a threshold of 1.7 m s−1, the PDP rapidly increased, potentially accounting for the heightened contribution of type 5 to CUHI during this period. Conversely, during the nighttime, there seemed to be a threshold for PLAND at 38 %, beyond which its impact on enhancing CUHI became notably more significant. These findings indicated a clear diurnal asymmetry in the modulation of CUHI by SWPs and human activities. Lastly, this study endeavored to elucidate the potential physical mechanisms underlying the diurnal asymmetry in SWP modulation of CUHI, with a focus on HW events. This research not only improved our understanding of the diurnal drivers of CUHII in the YRDUA region, but also provided a solid scientific basis for formulating targeted urban environmental mitigation strategies.
Reanalysis data were derived from the fifth-generation European Centre for Medium-Range Weather Forecasts (https://doi.org/10.24381/cds.bd0915c6, Hersbach et al., 2023). Meteorological data could be collected from the China Meteorological Data Service Centre (http://data.cma.cn/en, China Meteorological Data Service Centre, 2024). Land cover data are available at https://doi.org/10.5281/zenodo.5816591 (Yang and Huang, 2022, 2021). The AHF data were derived from the inversion of the National Oceanic and Atmospheric Administration (http://ngdc.NOAA.gov/eog/dmsp/downloadV4composites.html, National Oceanic and Atmospheric Administration, 2024). PM2.5 and PM10 concentration data could be accessed from the following links: https://doi.org/10.5281/zenodo.5652265 (Bai and Li, 2021a) and https://doi.org/10.5281/zenodo.5652263 (Bai and Li, 2021b), respectively.
The supplement related to this article is available online at https://doi.org/10.5194/acp-25-4989-2025-supplement.
YY conceptualized the study. TS and MG wrote the original manuscript and plotted all the figures. YY, LZ, PQ, and SL assisted in the conceptualization and model development. All the authors contributed to the manuscript preparation, discussion, and writing.
The contact author has declared that none of the authors has any competing interests.
Publisher's note: Copernicus Publications remains neutral with regard to jurisdictional claims made in the text, published maps, institutional affiliations, or any other geographical representation in this paper. While Copernicus Publications makes every effort to include appropriate place names, the final responsibility lies with the authors.
The authors express their gratitude to the editor and reviewers for their constructive comments and suggestions for improvement of this paper.
This research has been supported by the National Natural Science Foundation of China (grant nos. 42222503, 42030606, and 42105147), the Joint Research Project for Meteorological Capacity Improvement (grant no. 22NLTSQ013), and the Nanjing Joint Institute for Atmospheric Sciences Open Research Fund (grant no. BJG202506).
This paper was edited by Zhanqing Li and reviewed by four anonymous referees.
Bahuguna, R. N., Solis, C. A., Shi, W., and Jagadish, K. S. V.: Post-flowering night respiration and altered sink activity account for high night temperature-induced grain yield and quality loss in rice (Oryza sativa L.), Physiol. Plantarum, 159, 59–73, https://doi.org/10.1111/ppl.12485, 2017.
Bai, K. and Li, K.: Daily 1-km gap-free PM2.5 grids in China, v1 (2000–2020), in: Earth System Science Data (Vol. 14, 907–927), Zenodo [data set], https://doi.org/10.5281/zenodo.5652265, 2021a.
Bai, K. and Li, K.: Daily 1-km gap-free PM10 grids in China, v1 (2000–2020), in: Earth System Science Data (Vol. 14, 907–927), Zenodo [data set], https://doi.org/10.5281/zenodo.5652263, 2021b.
Bansal, P. and Quan, S.: Examining temporally varying nonlinear effects of urban form on urban heat island using explainable machine learning: A case of Seoul, Build. Environ., 247, 110957, https://doi.org/10.1016/j.buildenv.2023.110957, 2024.
Cai, H. and Xu, X.: Impacts of built-up area expansion in 2D and 3D on regional surface temperature, Sustainability, 9, 1862, https://doi.org/10.3390/su9101862, 2017.
Cai, X.: Footprint Analysis in Micrometeorology and its Extended Applications, Chinese Journal of Atmospheric Sciences, 32, 123–132, https://doi.org/10.3724/SP.J.1148.2008.00288, 2008.
Chen, B., Dong, L., Liu, X., Shi, G., Chen, L., Nakajima, T., and Habib, A.: Exploring the Possible Effect of Anthropogenic Heat Release Due to Global Energy Consumption upon Global Climate: a Climate Model Study, Int. J. Climatol., 36, 15, 4790–4796, https://doi.org/10.1002/joc.4669, 2016.
Chen, G., Wang, D., Wang, Q., Li, Y., Wang, X., Hang, J., Gao, P., Ou, C., and Wang, K.: Scaled Outdoor Experimental Studies of Urban thermal Environment in Street canyon Models with Various Aspect Ratios and thermal Storage, Sci. Total Environ., 726, 138147, https://doi.org/10.1016/j.scitotenv.2020.138147, 2020.
Chen, S., Yang, Y., Deng, F., Zhang, Y., Liu, D., Liu, C., and Gao, Z.: A high-resolution monitoring approach of canopy urban heat island using a random forest model and multi-platform observations, Atmos. Meas. Tech., 15, 735–756, https://doi.org/10.5194/amt-15-735-2022, 2022.
China Meteorological Data Service Centre: Daily Timed Data From Automated Weather Stations In China, China Meteorological Data Service Centre, http://data.cma.cn/en, last access: 12 September 2024.
Dong, L., Jiang, Z., and Shen, S.: Urban heat island change and its relationship with urbanization of urban agglomerations in Yangtze River Delta in past decade, Trans. Atmos. Sci., 37, 146–154, https://doi.org/10.3969/j.issn.1674-7097.2014.02.003, 2014.
Drach, P., Krüger, E. L., and Emmanuel, R.: Effects of atmospheric stability and urban morphology on daytime intra-urban temperature variability for Glasgow, UK, Sci. Total Environ., 627, 782–791, https://doi.org/10.1016/j.scitotenv.2018.01.285, 2018.
Du, H., Wang, D., Wang, Y., Zhao, X., Qin, F., Jiang, H., and Cai, Y.: Influences of land cover types, meteorological conditions, anthropogenic heat and urban area on surface urban heat island in the Yangtze River Delta Urban Agglomeration, Sci. Total Environ., 571, 461–470, https://doi.org/10.1016/j.scitotenv.2016.07.012, 2016.
Duan, Z., Yang, Y., Zhou, S., and Yin, J.: Estimating Gross Primary Productivity (GPP) over Rice-Wheat-Rotation Croplands by Using the Random Forest Model and Eddy Covariance Measurements: Upscaling and Comparison with the MODIS Product, Remote Sens., 13, 21, https://doi.org/10.3390/rs13214229, 2021.
Estoque, R. C., Murayama, Y., and Myint, S. W.: Effects of landscape composition and pattern on land surface temperature: An urban heat island study in the megacities of Southeast Asia, Sci. Total Environ., 577, 349–359, https://doi.org/10.1016/j.scitotenv.2016.10.195, 2017.
Filleul, L., Cassadou, S., Médina, S., Fabres, P., Lefranc, A., Eilstein, D., Tertre, A. L., Pascal, L., Chardon, B., and Blanchard, M.: The relation between temperature, ozone, and mortality in nine french cities during the heat wave of 2003, Environ. Health Persp., 114, 1344–1347, https://doi.org/10.1289/ehp.8328, 2006.
Fischer, E. M. and Schär, C.: Consistent geographical patterns of changes in high-impact European heatwaves, Nat. Geosci., 3, 398–403, https://doi.org/10.1038/NGEO866, 2010.
Founda, D., Pierros, F., Petrakis, M., and Zerefos, C.: Interdecadal variations and trends of the urban heat island in Athens (Greece) and its response to heat waves, Atmos. Res., 161, 1–13, https://doi.org/10.1016/j.atmosres.2015.03.016, 2015.
Friedman, J.: Greedy function approximation: a gradient boosting machine, Ann. Stat., 29, 1189–1232, https://doi.org/10.1214/aos/1013203451, 2001.
Giridharan, R., Ganesan, S., and Lau, S. S. Y.: day urban heat island effect in high-rise and high-density residential developments in Hong Kong, Energ. Buildings, 36, 525–534, https://doi.org/10.1016/j.enbuild.2003.12.016, 2004.
Giridharan, R., Lau, S. S. Y., and Ganesan, S.: Nocturnal heat island effect in urban residential developments of Hong Kong, Energ. Buildings, 37, 964–971, https://doi.org/10.1016/j.enbuild.2004.12.005, 2005.
Gosling, S. N., Lowe, J. A., McGregor, G. R., Pelling, M., and Malamud, B. D.: Associations between elevated atmospheric temperature and human mortality: A critical review of the literature, Climatic Change, 92, 299–341, https://doi.org/10.1007/s10584-008-9441-x, 2009.
Guo, G., Zhou, X., Wu, Z., Xiao, R., and Chen, Y.: Characterizing the impact of urban morphology heterogeneity on land surface temperature in Guangzhou, China, Environ. Model. Softw., 84, 427–439, https://doi.org/10.1016/j.envsoft.2016.06.021, 2016.
Guo, J., Li, Y., Cohen, J. B., Li, J., Chen, D., Xu, H., Liu, L., Yin, J., Hu, K., and Zhai, P.: Shift in the Temporal Trend of Boundary Layer Height in China Using Long-Term (1979–2016) Radiosonde Data, Geophys. Res. Lett., 46, 6080–6089, https://doi.org/10.1029/2019GL082666, 2019.
Guo, M., Zhang, M., Wang, H., Wang, L., and Li, Y.: Dual Effects of Synoptic Weather Patterns and Urbanization on Summer Diurnal Temperature Range in an Urban Agglomeration of East China, Front. Environ. Sci., 9, 672295, https://doi.org/10.3389/fenvs.2021.672295, 2021.
Hang, J., Li, Y., and Sandberg, M.: Experimental and numerical studies of flows through and within high-rise building arrays and their link to ventilation strategy, J. Wind Eng. Ind. Aerodyn., 99, 1036–1055, https://doi.org/10.1016/j.envsoft.2016.06.021, 2011.
Hastie, T., Tibshirani, R., and Friedman, J.: The Elements of Statistical Learning: Data mining, Inference, and Prediction, Springer Series in Statistics, Springer, New York, https://doi.org/10.1207/S15328007SEM1101_10, 2009.
He, Y., Miao, L., Gu, W., and Ju, L.: Analysis of PM2.5 concentration dynamics and its influencing factors in the Yangtze River Delta based on different city sizes, Scientia Geographica Sinica, 44, 1426–1436, https://doi.org/10.13249/j.cnki.sgs.20220878, 2024.
Herbel, I., Croitoru, A. E., Rus, A.V. Roca, C. F., Harpa, G. V., Ciupertea, A. F., and Rus, I.: The impact of heat waves on surface urban heat island and local economy in Cluj-Napoca city, Romania, Theor. Appl. Climatol., 133, 681–695, https://doi.org/10.1007/s00704-017-2196-4, 2018.
Hersbach, H., Bell, B., Berrisford, P., Biavati, G., Horányi, A., Muñoz Sabater, J., Nicolas, J., Peubey, C., Radu, R., Rozum, I., Schepers, D., Simmons, A., Soci, C., Dee, D., and Thépaut, J.-N.: ERA5 hourly data on pressure levels from 1940 to present, Copernicus Climate Change Service (C3S) Climate Data Store (CDS) [data set], https://doi.org/10.24381/cds.bd0915c6, 2023.
Hoffmann, P. and Schlünzen, K. H.: Weather Pattern Classification to Represent the Urban Heat Island in Present and Future Climate, J. Appl. Meteorol. Clim., 52, 2699–2714, https://doi.org/10.1175/JAMC-D-12-065.1, 2013.
Hong, J. S., Yeh, S. W., and Seo, K. H.: Diagnosing physical mechanisms leading to pure heat waves versus pure tropical nights over the Korean peninsula, J. Geophys. Res.-Atmos., 123, 7149–7160, https://doi.org/10.1029/2018JD028360, 2018.
Huang, L., Miao, J., and Liu, Y.: Spatial and temporal variation characteristics of urban heat island in Tianjin, Transactions of Atmospheric Sciences, 35, 620–632, https://doi.org/10.1007/s11783-011-0280-z, 2012.
Huang, Q. and Lu, Y.: The Effect of Urban Heat Island on Climate Warming in the Yangtze River Delta Urban Agglomeration in China, Int. J. Env. Res. Pub. He., 12, 8773–8789, https://doi.org/10.3390/ijerph120808773, 2015.
Imran, H. M., Kala, J., Ng, A. W. M., and Muthukumaran, S.: Impacts of future urban expansion on urban heat island effects during heatwave events in the city of Melbourne in southeast Australia, Q. J. Roy. Meteor. Soc., 145, 2586–2602, https://doi.org/10.1002/qj.3580, 2019.
IPCC (Intergovernmental Panel on Climate Change): Climate Change 2021: The Physical Science Basis. Contribution of Working Group I to the Sixth Assessment Reportof the Intergovernmental Panel on Climate Change, Cambridge University Press, Cambridge and New York, ISBN 9781009157896, 2021.
Jiang, S., Lee, X., Wang, J., and Wang, K.: Amplified urban heat islands during heat wave periods, J. Geophys. Res.-Atmos., 124, 7797–7812, https://doi.org/10.1029/2018jd030230, 2019.
Khan, H. S., Paolini, R., Santamouris, M., and Caccetta, P.: Exploring the synergies between urban overheating and heatwaves (HWs) in Western Sydney, Energies, 13, 470, https://doi.org/10.3390/en13020470, 2020.
Krayenhoff, E. S. and Voogt, J. A.: Daytime Thermal Anisotropy of Urban Neighbourhoods: Morphological Causation, Remote Sens., 8, 108, https://doi.org/10.3390/rs8020108, 2016.
Le Tertre, A., Lefranc, A., Eilstein, D., Declercq, C., Medina, S., Blanchard, M., Chardon, B., Fabre, P., Filleul, L., Jusot, J.-F., Pascal, L., Prouvost, H., Cassadou, S., and Ledrans, M.: Impact of the 2003 heatwave on all-cause mortality in 9 French cities, Epidemiology, 17, 75–79, https://doi.org/10.1097/01.ede.0000187650.36636.1f, 2006.
Li, D. and Bou-Zeid, E.: Synergistic Interactions between Urban Heat Islands and Heat Waves: The Impact in Cities Is Larger than the Sum of Its Parts, J. Appl. Meteorol. Clim., 52, 2051–2064, https://doi.org/10.1175/JAMC-D-13-02.1, 2013.
Li, Y., Schubert, S., Kropp, J. P., and Rybski, D.: On the influence of density and morphology on the Urban Heat Island intensity, Nat. Commun., 11, 2647, https://doi.org/10.1038/s41467-020-16461-9, 2020.
Lin, Z., Xu, H., Han, L., Zhang, H., Peng, J., and Yao, X.: Day and night: Impact of 2D/3D urban features on land surface temperature and their spatiotemporal non-stationary relationships in urban building spaces, Sustain. Cities Soc., 108, 105507, https://doi.org/10.1016/j.scs.2024.105507, 2024.
Liu, W., Ji, C., Zhong, J., Jiang, X., and Zheng, Z.: Temporal characteristics of the Beijing urban heat island, Theor. Appl. Climatol., 87, 213–221, https://doi.org/10.1007/s00704-005-0192-6, 2007.
Liu, W., Yang, P., You, H., and Zhang, B.: Heat island effect and diurnal temperature range in Beijing area, Climatic and Environmental Research, 18, 171–177, https://doi.org/10.3878/j.issn.1006-9585.2012.11147, 2013.
Liu, Y., Xu, Y., Zhang, Y., Han, X., Weng, F., Xuan, C., and Shu, W.: Impacts of the Urban Spatial Landscape in Beijing on Surface and Canopy Urban Heat Islands, J. Meteorol. Res., 36, 882–7899, https://doi.org/10.1007/s13351-022-2045-y, 2022.
Marks, D. and Connell, J.: Unequal and unjust: The political ecology of Bangkok's increasing urban heat island, Urban Studies, 61, 2887–2907, https://doi.org/10.1177/00420980221140999, 2024.
Menon, S.: Climate effects of black carbon aerosols in China and India, Science, 297, 2250–2253, https://doi.org/10.1126/science.1075159, 2002.
Miao, Y., Guo, J., Liu, S., Liu, H., Li, Z., Zhang, W., and Zhai, P.: Classification of summertime synoptic patterns in Beijing and their associations with boundary layer structure affecting aerosol pollution, Atmos. Chem. Phys., 17, 3097–3110, https://doi.org/10.5194/acp-17-3097-2017, 2017.
Mirzaei, P. A. and Haghighat, F.: Approaches to study Urban Heat Island – Abilities and limitations, Build. Environ., 45, 2192–2201, https://doi.org/10.1016/j.buildenv.2010.04.001, 2010
Mora, C., Dousset, B., Caldwell, I., Powell, F., Geronimo, R., Bielecki, C., Counsell, C., Dietrich, B., Johnston, E., Louis, L., Lucas, M., McKenzie, M., Shea, A., Tseng, H., Giambelluca, T., Leon, L., Hawkins, E., and Trauernicht, C.: Global risk of deadly heat, Nature Climate Change, 7, 501–506, https://doi.org/10.1038/nclimate3322, 2017.
Muthers, S., Laschewski, G., and Matzarakis, A.: The Summers 2003 and 2015 in South-West Germany: Heat Waves and Heat-Related Mortality in the Context of Climate Change, Atmosphere 8, 224, https://doi.org/10.3390/atmos8110224, 2017.
Ngarambe, J., Nganyiyimana, J., Kim, I., Santamouris, M., and Yunid, G. Y.: Synergies between urban heat island and heat waves in Seoul: The role of wind speed and land use characteristics, PLoS ONE, 15, e0243571, https://doi.org/10.1371/journal.pone.0243571, 2020.
National Oceanic and Atmospheric Administration: Version 4 DMSP-OLS Nighttime Lights Time Series, National Oceanic and Atmospheric Administration [data set], http://ngdc.NOAA.gov/eog/dmsp/downloadV4composites.html, last access: 12 September 2024.
Oke, T. R., Mills, G., Christen, A., and Voogt, J. A.: Urban climates, Cambridge University Press, ISBN 9780521849500, 2017.
Park, S., Park, J., and Lee, S.: Unpacking the nonlinear relationships and interaction effects between urban environment factors and the urban night heat index, J. Clean. Prod., 428, 139407, https://doi.org/10.1016/j.jclepro.2023.139407, 2023.
Patz, J. A., Campbell-Lendrum, D., Holloway, T., and Foley, J. A.: Impact of regional climate change on human health, Nature, 438, 310–317, https://doi.org/10.1038/nature04188, 2005.
Philipp, A., Beck, C., Esteban, P., Krennert, T., Lochbihler, K., Spyros, P., Pianko-Kluczynska, K., Post, P., Alvarez, R., Spekat, A., and Streicher, F.: Cost733class-1.2 User guide, http://cost733.met.no/ (last access: 7 June 2021), 2014.
Poupkou, A., Nastos, P., Melas, D., and Zerefos, C.: Climatology of discomfort index and air quality index in a large urban mediterranean agglomeration, Water Air Soil Poll., 222, 163–183, https://doi.org/10.1007/s11270-011-0814-9, 2011.
Pu, X., Wang, T., Huang, X., Melas, D., Zanis, P., Papanastasiou, D. K., and Poupkou, A.: Enhanced surface ozone during the heat wave of 2013 in Yangtze River Delta region, China, Sci. Total Environ., 603, 807–816, https://doi.org/10.1016/j.scitotenv.2017.03.056, 2017.
Ren, G., Chu, Z., Chen, Z., and Ren, Y.: Implications of temporal change in urban heat island intensity observed at Beijing and Wuhan stations, Geophys. Res. Lett., 34, L05711, https://doi.org/10.1029/2006GL027927, 2007.
Ren, G. Y.: Urbanization as a major driver of urban climate change, Advances in Climate Change Research, 6, 1–6, https://doi.org/10.1016/j.accre.2015.08.003, 2015.
Ren, Y. and Ren, G.: A remote-sensing method of selecting RS for evaluating urbanization effect on surface air temperature trends, J. Climate, 24, 3179–3189, https://doi.org/10.1175/2010JCLI3658.1, 2011.
Rizwan, A. M., Dennis, L. Y., and Chunho, L.: A review on the generation, determination and mitigation of urban heat island, J. Environ. Sci., 20, 120–128, https://doi.org/10.1016/S1001-0742(08)60019-4, 2008.
Roth, M.: Review of urban climate research in (sub) tropical regions. Int. J. Climatol., 27, 1859–1873, https://doi.org/10.1002/joc.1591, 2007.
Salimi, M. and Al-Ghamdi, S. G. Climate change impacts on critical urban infrastructure and urban resiliency strategies for the Middle East, Sustain. Cities Soc., 54, 101948, https://doi.org/10.1016/j.scs.2019.101948, 2020.
Seidel, D. J., Zhang, Y., Beljaars, A., Golaz, J. C., Jacobson, A. R., and Medeiros, B.: Climatology of the planetary boundary layer over the continental United States and Europe, J. Geophys. Res.-Atmos., 117, 1–15, https://doi.org/10.1029/2012JD018143, 2012.
Shi, T., Huang, Y., Shi, C., and Yang, Y.: Influence of Urbanization on the Thermal Environment of Meteorological Stations: Satellite-observational Evidence, Advances in Climate Change Research, 1, 7–15, https://doi.org/10.1016/j.accre.2015.07.001, 2015.
Shi, T., Sun, D., Huang, Y., Lu, G., and Yang, Y.: A new method for correcting urbanization-induced bias in surface air temperature observations: Insights from comparative site-relocation data, Front. Environ. Sci., 9, 625418, https://doi.org/10.3389/fenvs.2021.625418, 2021.
Shi, T., Yang, Y., Qi, P., Ren, G., Wen, X., and Gul, C.: Adjustment of the urbanization bias in surface air temperature series based on urban spatial morphologies and using machine learning, Urban Climate, 55, 101991, https://doi.org/10.1016/j.uclim.2024.101991, 2024.
Singh, V. K., Mohan, M., and Bhati, S.: Industrial heat island mitigation in Angul-Talcher region of India: Evaluation using modified WRF-Single Urban Canopy Model, Sci. Total Environ., 858, 159949, https://doi.org/10.1016/j.scitotenv.2022.159949, 2023.
Taleghani, M., Sailor, D., and Ban-Weiss, G. A.: Micrometeorological simulations to predict the impacts of heat mitigation strategies on pedestrian thermal comfort in a Los Angeles neighborhood, Environ. Res. Lett., 11, 024003, https://doi.org/10.1088/1748-9326/11/2/024003, 2016.
Tan, J., Zheng, Y., Tang, X., Guo, C., Li, L., Song, G., Zhen, X., Yuan, D., Kalkstein, A. J., Li, F., and Chen, H.: The urban heat island and its impact on heat waves and human health in Shanghai, Int. J. Biometeorol., 54, 75–84, https://doi.org/10.1007/s00484-009-0256-x, 2010.
Tan, M., Liu, K., Liu, L.,Zhu, Y., and Wang, D.: Population Spatialization of 30 m Grid in Pearl River Delta Based on Stochastic Forest Model, Progress in Geography, 36, 10, 122–130, https://doi.org/10.18306/dlkxjz.2017.10.012, 2017.
Tian, G., Jiang, J., Yang, Z., and Zhang, Y.: The urban growth, size distribution and spatio-temporal dynamic pattern of the Yangtze River Delta megalopolitan region, China, Ecol. Model., 222, 865–878, https://doi.org/10.1016/j.ecolmodel.2010.09.036, 2011.
Tian, Y. and Miao, J.: Overview of Mountain-Valley Breeze Studies in China, Meteorological Science and Technology, 47, 41–51, https://doi.org/10.19517/j.1671-6345.20170777, 2019.
Tong, N. Y. O. and Leung, D. Y. C.: Effects of Building Aspect Ratio, Diurnal Heating Scenario, and Wind Speed on Reactive Pollutant Dispersion in Urban Street Canyons, J. Environ. Sci., 24, 2091–2103, https://doi.org/10.1016/S1001-0742(11)60971-6, 2012.
Tong, S., Wong, N., Jusuf, S. K., Tan, C., Wong, H., Ignatius, H., and Tan, E.: Study on correlation between air temperature and urban morphology parameters in built environment in northern China, Build. Environ., 127, 239–249, https://doi.org/10.1016/j.buildenv.2017.11.013, 2018.
Tysa, S. K., Ren, G., Qin, Y., Zhang, P., Ren, Y., Jia, W., and Wen, K.: Urbanization effect in regional temperature series based on a remote sensing classification scheme of stations, J. Geophys. Res.-Atmos., 124, 10646–10661, https://doi.org/10.1029/2019JD030948, 2019.
Verma, A., Pedrosa, L., Korupolu, M., Oppenheimer, D., Tune, E., and Wilkes, J.: Large-scale cluster management at Google with Borg, Proceedings of the Tenth European Conference on Computer Systems, Bordeaux, France, 21–24 April 2015, ACM, New York, USA, https://doi.org/10.1145/2741948.2741964, 2022.
Wang, H., Li, J., Gao, Z., Yim, S. H. L., Shen, H., Ho, H. C., Li, Z., Zeng, Z., Liu, C., Li, Y., Ning, G., and Yang, Y.: High-Spatial-Resolution Population Exposure to PM2.5 Pollution Based on Multi-Satellite Retrievals: A Case Study of Seasonal V ariation in the Yangtze River Delta, China in 2013, Remote Sens., 11, 2724, https://doi.org/10.3390/rs11232724, 2019.
Wang, K., Jiang, S., Wang, J., Zhou, C., Wang, X., and Lee, X.: Comparing the diurnal and seasonal variabilities of atmospheric and surface urban heat islands based on the Beijing urban meteorological network, J. Geophys. Res.-Atmos., 122, 2131–2154, https://doi.org/10.1002/2016jd025304, 2017.
Wang, W., Zhou, W., Li, X., Wang, X., and Wang, D.: Synoptic-scale characteristics and atmospheric controls of summer heat waves in China, Clim. Dynam., 46, 2923–2941, https://doi.org/10.1007/s00382-015-2741-8, 2015.
Wen, K., Ren, G., Li, J., Zhang, A., Ren, Y., Sun, X., and Zhou, Y.: Recent Surface Air Temperature Change Over Mainland China Based on an Urbanization-Bias Adjusted Dataset, J. Climate, 32, 2691–2705, https://doi.org/10.1175/JCLI-D-18-0395.1, 2019.
Wu, H., Wang, T., Wang, Q., Cao, Y., Qu, Y., and Nie, D.: Radiative effects and chemical compositions of fine particles modulating urban heat island in Nanjing, China, Atmos. Environ., 247, 118201, https://doi.org/10.1016/j.atmosenv.2021.118201, 2021.
Xia, Y., Li, Y., Guan, D., Tinoco, D.M., Xia, J., Yan, Z., Liu, Q., and Huo, H.: Assessment of the economic impacts of heat waves: a case study of Nanjing, China, J. Clean. Prod., 171, 811–819, https://doi.org/10.1016/j.jclepro.2017.10.069, 2018.
Xie, J., Sun, T., Liu, C., Li, L., Xu, X., Miao, S., Lin, L., Chen, Y., and Fan, S.: Quantitative evaluation of impacts of the steadiness and duration of urban surface wind patterns on air quality, Sci. Total Environ., 850, 157957, https://doi.org/10.1016/j.scitotenv.2022.157957, 2022.
Xu, W. H., Li, Q. X., Wang, X. L., Yang, S., Cao, L., and Feng, Y.: Homogenization of Chinese daily surface air temperatures and analysis of trends in the extreme temperature indices, J. Geophys. Res.-Atmos., 118, 9708–9720, https://doi.org/10.1002/jgrd.50791, 2013.
Xu, Z., Fitzgerald, G., Guo, Y., Jalaludin, B., and Tong, S.: Impact of heatwave on mortality under different heatwave definitions: A systematic review and meta-analysis, Environ. Int., 89–90, 193–203, https://doi.org/10.1016/j.envint.2016.02.007, 2016.
Xue, J., Zong, L., Yang ,Y., Bi, X., Zhang, Y., and Zhao, M.: Diurnal and interannual variations of canopy urban heat island (CUHI) effects over a mountain-valley city with a semi-arid climate, Urban Climate, 48, 101425, https://doi.org/10.1016/j.uclim.2023.101425, 2023.
Yan, Z. and Zhou, D.: Rural agriculture largely reduces the urban heating effects in China: A tale of the three most developed urban agglomerations. Agr. Forest Meteorol., 331, 109343, https://doi.org/10.1016/j.agrformet.2023.109343, 2023.
Yang, G., Ren, G., Zhang, P., Xue, X., Tysa, S. K., Jia, W., Qin, Y., Zheng, X., and Zhang, S.: PM2.5 influence on urban heat island (UHI) effect in Beijing and the possible mechanisms, J. Geophys. Res.-Atmos., 126, e2021JD035227, https://doi.org/10.1029/2021JD035227, 2021.
Yang, J. and Huang, X.: The 30 m annual land cover dataset and its dynamics in China from 1990 to 2019, Earth Syst. Sci. Data, 13, 3907–3925, https://doi.org/10.5194/essd-13-3907-2021, 2021.
Yang, J. and Huang, X.: The 30 m annual land cover datasets and its dynamics in China from 1990 to 2021, in: Earth System Science Data (1.0.1, Vol. 13, 3907–3925), Zenodo [data set], https://doi.org/10.5281/zenodo.5816591, 2022.
Yang, J., Liu, H. Z., Ou, C. Q., Lin, G. Z., Zhou, Q., Shen, G. C., Chen, P. Y., and Guo, Y.: Global Climate Change: Impact of Diurnal Temperature Range on Mortality in Guangzhou, China, Environ. Pollut., 175, 131–136, https://doi.org/10.1016/j.envpol.2012.12.021, 2013.
Yang, J., Dong, J., Xiao, X., Dai, J., Wu, C., Xia, J., Zhao, G., Zhao, M., Li, Z., Zhang, Y., and Ge, Q.: Divergent shifts in peak photosynthesis timing of temperate and alpine grasslands in China. Remote Sens. Environ., 233, 111395, https://doi.org/10.1016/j.rse.2019.111395, 2019.
Yang, P., Liu, W., Zhong, J., and Yang, J.: Evaluating the Quality of Temperature Measured at Automatic Weather Stations in Beijing, Journal of Applied Meteorological Science, 22, 706–715, https://doi.org/10.3969/j.issn.1001-7313.2011.06.008, 2011.
Yang, Y., Zheng, X., Gao, Z., Wang, H., Wang, T., Li, Y., Lau, G. N. C., and Yim, S. H. L.: Long-Term Trends of Persistent Synoptic Circulation Events in Planetary Boundary Layer and Their Relationships With Haze Pollution in Winter Half Year Over Eastern China, J. Geophys. Res.-Atmos., 123, 10991–11007, https://doi.org/10.1029/2018JD028982, 2018.
Yang, Y., Zheng, Z., Yim, S. Y. L., Roth, M., Ren, G., Gao, Z., Wang, T., Li, Q., Shi, C., and Ning, G.: PM2.5 Pollution Modulates Wintertime Urban Heat Island Intensity in the BeijingTianjin-Hebei Megalopolis, China, Geophys. Res. Lett., 47, 1–12, https://doi.org/10.1029/2019GL084288, 2020.
Yang, Y., Guo, M., Ren, G., Liu, S., Zong, L., Zhang, Y., Zheng, Z., Miao, Y., and Zhang, Y.: Modulation of wintertime canopy urban heat island (CUHI) intensity in Beijing by synoptic weather pattern in planetary boundary layer, J. Geophys. Res.-Atmos., 127, e2021JD035988, https://doi.org/10.1029/2021JD035988, 2022.
Yang, Y., Guo, M., Wang, L., Zong, L., Liu, D., Zhang, W., Wang, M., Wan, B., and Guo, Y.: Unevenly spatiotemporal distribution of urban excess warming in coastal Shanghai megacity, China: Roles of geophysical environment, ventilation and sea breeze, Build. Environ., 235, 110180, https://doi.org/10.1016/j.buildenv.2023.110180, 2023.
Yang, Y., Luo, F., Xue, J., Zong, L., Tian, W., and Shi, T.: Research progress and perspective on synergy between urban heat waves and canopy urban heat island, Advances in Earth Science, 39, 1–16, https://doi.org/10.11867/j.issn.1001-8166.2024.032, 2024.
Yu, Z., Chen, S., Wong, N., Ignatius, M., Deng, J., He, Y., and Hii, D. J. C.: Dependence between urban morphology and outdoor air temperature: A tropical campus study using random forests algorithm, Sustain. Cities Soc., 61, 1–12, https://doi.org/10.1016/j.scs.2020.102200, 2020.
Zeng, Z., Wang, Z., Gui, K., Yan, X., Gao, M., Luo, M., Geng, H., Liao, T., Li, X., and An, J.: Daily Global Solar Radiation in China Estimated from High-density Meteorological Observations: A Random Forest Model Framework, Earth and Space Science, 7, e2019EA001058, https://doi.org/10.1029/2019EA001058, 2020.
Zhang, A., Ren, G., Zhou, J., Chu, Z., Ren, Y., and Tang, G.: Urbanization effect on surface air temperature trends over China, Acta Meteorol. Sin., 68, 957–966, https://doi.org/10.11676/qxxb2010.090, 2010.
Zhang, H., Zhu, S., Gao, Y., and Zhang, G.: The Relationship Between Urban Spatial Morphology Parameters and Urban Heat Island Intensity Under Fine Weather Condition, Journal of Applied Meteorological Science, 27, 249–256, https://doi.org/10.11898/1001-7313.20160213, 2016.
Zhang, K., Cao, C., Chu, H., Zhao, L., Zhao, J., and Lee, X.: Increased heat risk in wet climate induced by urban humid heat, Nature, 617, 7962, https://doi.org/10.1038/s41586-023-05911-1, 2023.
Zhang, M., Yang, Y., Zhan, C., Zong, L., Gul, C., and Wang, M.: Tropical cyclone-related heatwave episodes in the Greater Bay Area, China: synoptic patterns and urban-rural disparities, Weather and Climate Extremes, 44, 100656, https://doi.org/10.1016/j.wace.2024.100656, 2024.
Zhang, X., Chen, L., Jiang, W., and Jin, X.: Urban heat island of Yangtze River Delta urban agglomeration in China: Multi-time scale characteristics and influencing factors, Urban Climate, 43, 101180, https://doi.org/10.1016/j.uclim.2022.101180, 2022.
Zheng, Z., Ren, G., Wang, H., Dou, J., Gao, Z., Duan, C., Li, Y., Ngarukiyimana, J. P., Zhao, C., Cao, C., Jiang, M., and Yang, Y.: Relationship between fine-particle pollution and the urban heat island in Beijing, China: Observational evidence, Bound.-Lay. Meteorol., 169, 93–113, https://doi.org/10.1007/s10546-018-0362-6, 2018.
Zheng, Z., Zhao, C., Lolli, S., Wang, X., Wang, Y., Ma, X., Li, Q., and Yang, Y.: Diurnal variation of summer precipitation modulated by air pollution: Observational evidences in the Beijing metropolitan area, Environ. Res. Lett., 15, 094053, https://doi.org/10.1088/1748-9326/ab99fc, 2020.
Zhou, D., Zhao, S., Liu, S., Zhang, L., and Zhu, C.: Surface urban heat island in China's 32 major cities: Spatial patterns and drivers, Remote Sens. Environ., 152, 51–61, https://doi.org/10.1016/j.rse.2014.05.017, 2014.