the Creative Commons Attribution 4.0 License.
the Creative Commons Attribution 4.0 License.
 | 12 May 2025
Validation and uncertainty quantification of three state-of-the-art ammonia surface exchange schemes using NH3 flux measurements in a dune ecosystem
Tycho Jongenelen
Margreet van Zanten
Enrico Dammers
Roy Wichink Kruit
Arjan Hensen
Leon Geers
Jan Willem Erisman
Deposition of reactive nitrogen causes detrimental environmental effects, including biodiversity loss, eutrophication, and soil acidification. Measuring and modelling the biosphere–atmosphere exchange of ammonia, the most abundant reduced nitrogen species, is complex due to its high reactivity and solubility, often leading to systematic discrepancies between model predictions and observations. This study aims to determine whether three state-of-the-art exchange schemes for NH3 can accurately model NH3 exchange in a dune ecosystem (Solleveld) and detect factors causing the uncertainties in these schemes. The selected schemes are DEPAC (DEPosition of Acidifying Compounds) by van Zanten et al. (2010) and the schemes by Massad et al. (2010) and Zhang et al. (2010). Validation against 1 year of gradient flux measurements revealed that the Zhang scheme represented the NH3 deposition at Solleveld best, whereas the DEPAC scheme overestimated the total deposition, while the Massad scheme underestimated the total deposition. Yet none of these schemes captured the emission events at Solleveld, pointing to considerable uncertainty in the compensation point parameterization and possibly in the modelling of NH3 desorption processes from wet surface layers. The sensitivity analysis further reinforced these results, showing how uncertainty in essential model parameters in the external resistance (Rw) and compensation point parameterization propagated into diverging model outcomes. These outcomes underscore the need to improve our mechanistic understanding of surface equilibria represented by compensation points, including the adsorption–desorption mechanism at the external water layer, and specific recommendations are provided for future modelling approaches and measurement setups to support this goal.
- Article
(2717 KB) - Full-text XML
- BibTeX
- EndNote


Nitrogen deposition is known to have detrimental effects on the environment, such as biodiversity loss, greenhouse gas emissions, soil acidification, eutrophication, and particulate matter formation (Galloway et al., 2003). Nitrogen deposition consists of both oxidized and reduced nitrogen components. Measuring dry NH3 deposition is challenging as NH3 is very reactive and has a high solubility (Erisman and Wyers, 1993). Moreover, NH3 is a weak absorber of light in both infrared and ultraviolet, which complicates remote-sensing measurements (Shephard and Cady-Pereira, 2015).
The development of NH3 exchange schemes is mainly based on flux measurements with the gradient technique (Flechard et al., 2013) and more recently using the eddy covariance technique at a single height (Famulari et al., 2005; Swart et al., 2023; Wang et al., 2021). This has allowed for the parameterization of the exchange processes for different ecosystem types and also enabled the parameterization of multi-layer models and bi-directional exchange schemes (Nemitz et al., 2001). The exchange of NH3 is a complex and dynamic process and is determined by a multitude of processes such as micrometeorology, soil properties, agricultural management practices, and vegetation growth, which are still only partly understood (Flechard et al., 2013).
Surface exchange schemes for NH3 have three different pathways: (i) stomatal uptake into the leaf apoplasts, (ii) external deposition through solution of NH3 in raindrops in water layers on vegetation surfaces, and (iii) surface deposition onto the soil surface. While the apoplasts, the external water layer, and the soil (hereafter called exchange pathways) can act as a sink for NH3, they can also be a source under certain conditions, making the surface exchange of NH3 bi-directional (Farquhar et al., 1980). Most surface exchange schemes utilize the resistance analogy to calculate and describe factors that influence the rate of atmospheric deposition toward the biosphere (Wesely and Hicks, 1977). To account for the bi-directional nature of NH3, compensation points are introduced that act as an effective NH3 concentration within the canopy. The NH3 exchange schemes are illustrated in Fig. 1 and further discussed in Sect. 2.2. An intercomparison of several NH3 exchange schemes by Flechard et al. (2011) has shown that under identical meteorological and vegetative circumstances, the dry deposition velocities of different models vary by a factor of 2–3, pointing to a large uncertainty.
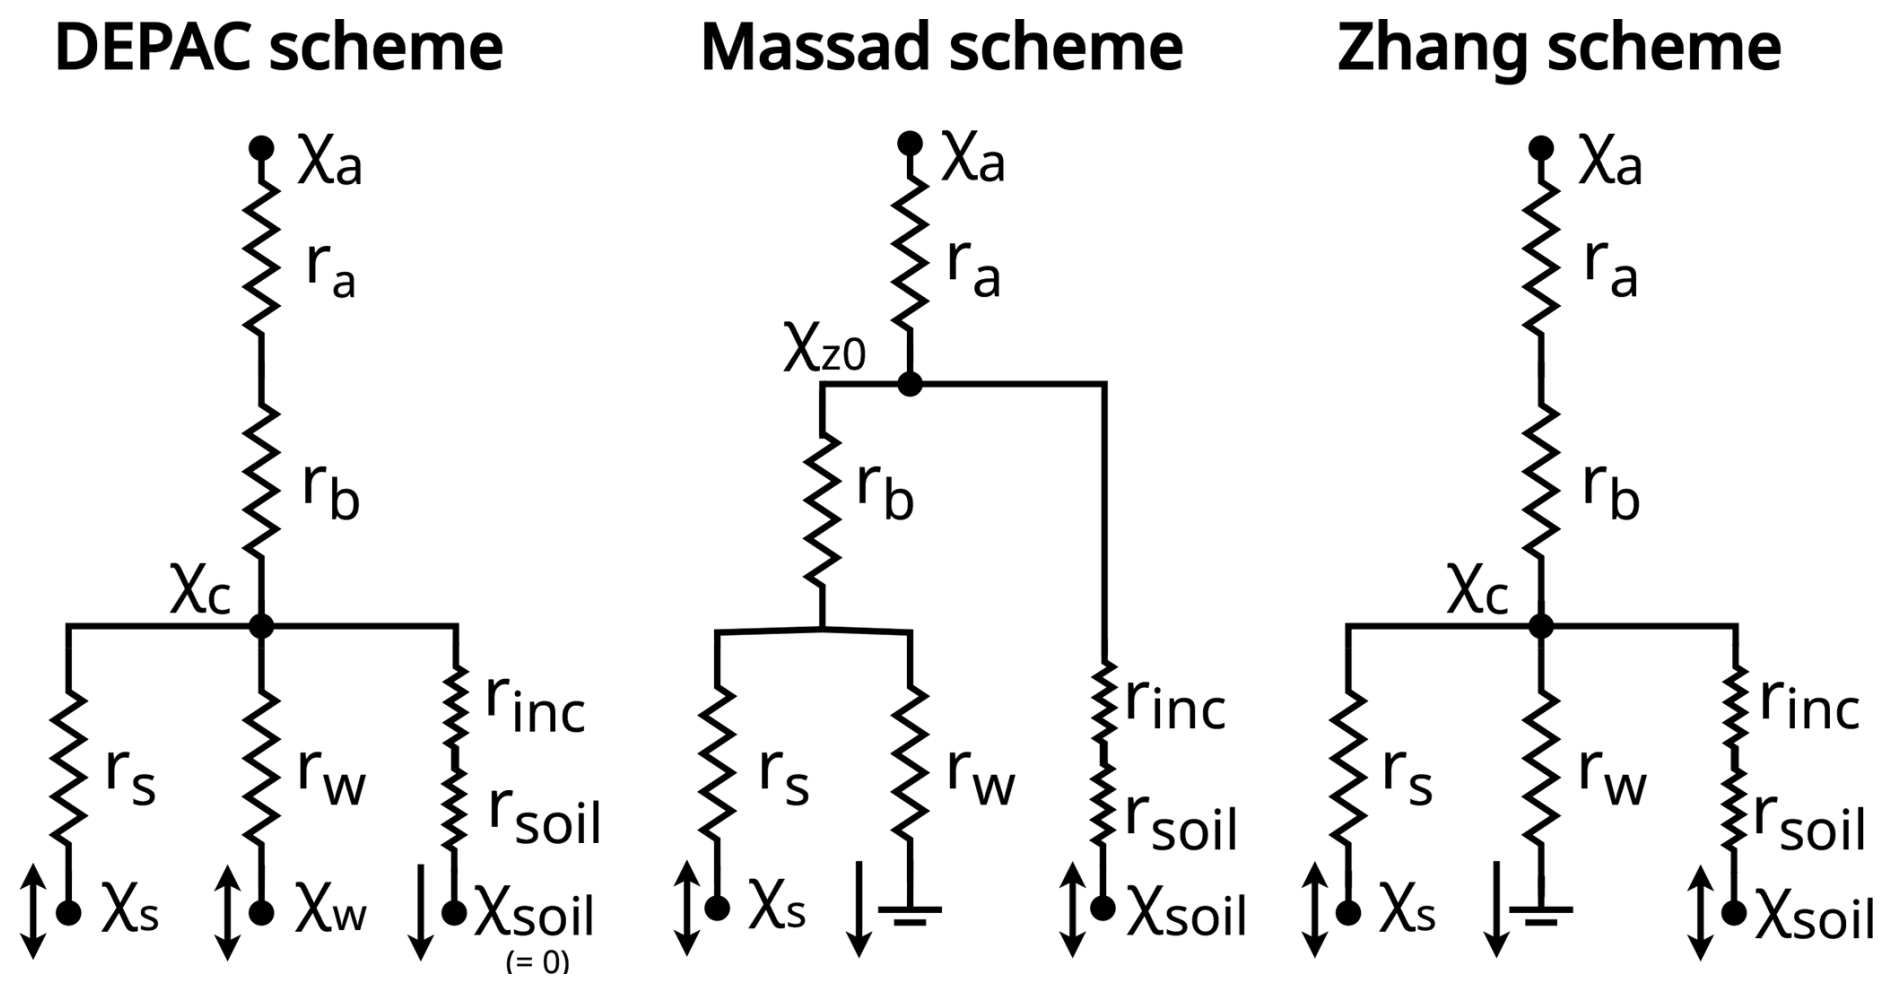
Figure 1Schematic of the DEPAC, Massad, and Zhang schemes. Note that at Solleveld, the DEPAC and Massad schemes do not model NH3 exchange with the soil pathway. χz0 is the NH3 concentration at height z0 and is only calculated in the Massad scheme.
There is a need to improve the NH3 surface exchange schemes to advance our understanding of the transport and deposition of reduced nitrogen. Therefore, this study aims to determine and quantify the uncertainties in three state-of-the-art NH3 exchange schemes, which to our knowledge, has only scarcely been done (e.g. Hoogerbrugge et al., 2024; Bytnerowicz et al., 2015). Besides, comparative studies between bi-directional exchange schemes can help to improve models but are rare (e.g. Flechard et al., 2011; Neirynck and Ceulemans, 2008; Schrader et al., 2016; Wen et al., 2014).
Three operational exchange schemes are selected: the DEPAC (DEPosition of Acidifying Compounds) scheme (van Zanten et al., 2010), the Massad scheme by Massad et al. (2010), and the Zhang scheme by Zhang et al. (2010). We use a 1-year hourly flux measurement dataset from the dune area Solleveld (Vendel et al., 2023) to test and analyse the differences between the three models. Importantly, we evaluate these schemes without altering or optimizing their parameters, ensuring that the comparison reflects the formulations as implemented in the operational models. After presenting the results, the potential shortcomings of current NH3 exchange schemes are discussed, and several recommendations for future NH3 exchange schemes and measurement campaigns are provided that can contribute to lowering the model uncertainty and improving the understanding of the biosphere–atmosphere exchange of NH3.
2.1 Experimental site and setup
The measurements took place in the dune ecosystem of Solleveld (52°2′′ N, 4°11′′ E), in the Netherlands (Vendel et al., 2023). The habitat type is grey dunes, and the measurement site consisted of sand sedge (Carex arenaria), moss, and lichens. To the east and south of the site are ponds surrounded by reed, contributing to terrain inhomogeneity. This inhomogeneity could be resolved by filtering out data from these wind directions; however, this would significantly reduce the dataset and would remove periods with higher NH3 concentrations, limiting the validation of the schemes under more polluted conditions. Therefore, we did not apply this filter. The measurements with the GRadient Ammonia High Accuracy Monitor (GRAHAM; Wichink Kruit et al., 2007) took place between September 2014 and September 2015. The measurements were performed at three heights: 0.8, 1.7, and 3.8 m. The GRAHAM instrument is a continuous wet denuder system with a low random bias of 1.9 %, a low detection limit of 0.1 µg m−3, and a temporal resolution of 10 min averaged to hourly measurements. Besides the NH3 flux measurements, the wind speed and direction were measured with the 3D sonic anemometer Gill WindMaster Pro with a temporal resolution of 20 Hz at 5.15 m, from which the friction velocity u∗ and Monin–Obukhov length were inferred. Based on the NH3 concentrations measured and (partly) on-site meteorological measurements, the NH3 exchange flux was inferred. To ensure the quality of the NH3 gradient measurements, we have applied the same filters to the dataset as Vendel et al. (2023).
Meteorological input variables such as temperature, relative humidity (RH), and radiation were measured at Valkenburg weather station by the KNMI (the Royal Netherlands Meteorological Institute), located approximately 20 km northeast of Solleveld, provided at an hourly resolution. The DEPAC and Massad schemes also required SO2 concentration data to account for co-deposition, which is the enhanced deposition of NH3 caused by SO2 deposition lowering the pH of the external leaf water (van Hove et al., 1989; Erisman and Wyers, 1993). SO2 concentrations were not measured at Solleveld; therefore, hourly SO2 measurements from monitoring station De Zilk were used, which were measured with the Thermo model 43w SO2 analyser. De Zilk is a coastal station 35 km northeast of Solleveld and shares similar environmental conditions with Solleveld, as it is situated near the sea. The NH3 and SO2 concentrations were for 95 % of the measurements between 0–8 µg m−3 and 0–7.5 µg m−3 respectively. In September 2014, the SO2 concentrations briefly spiked, caused by volcanic eruptions in Iceland (KNMI, 2024).
2.2 Dry deposition modelling of NH3
To calculate the dry deposition fluxes at Solleveld, the parameterizations of the DEPAC, Massad, and Zhang schemes have been coded in Python based on the parameterization presented in van Zanten et al. (2010), Massad et al. (2010), and Zhang et al. (2010). The modelled fluxes have an hourly temporal resolution. No parameterization for the land use class dunelands specifically was available in the three schemes. Therefore, “grass” was selected in the DEPAC scheme, “un-managed” and “semi-natural vegetation” in the Massad scheme, and “short grass and forbs” in the Zhang scheme. For a complete description of the schemes, we refer to van Zanten et al. (2010), Massad et al. (2010), and Zhang et al. (2010). The parameterizations are summarized in Table 1 and illustrated in Fig. 1.
Table 1Main parameterization of the DEPAC, Massad, and Zhang exchange schemes for the NH3 exchange utilized in this study.
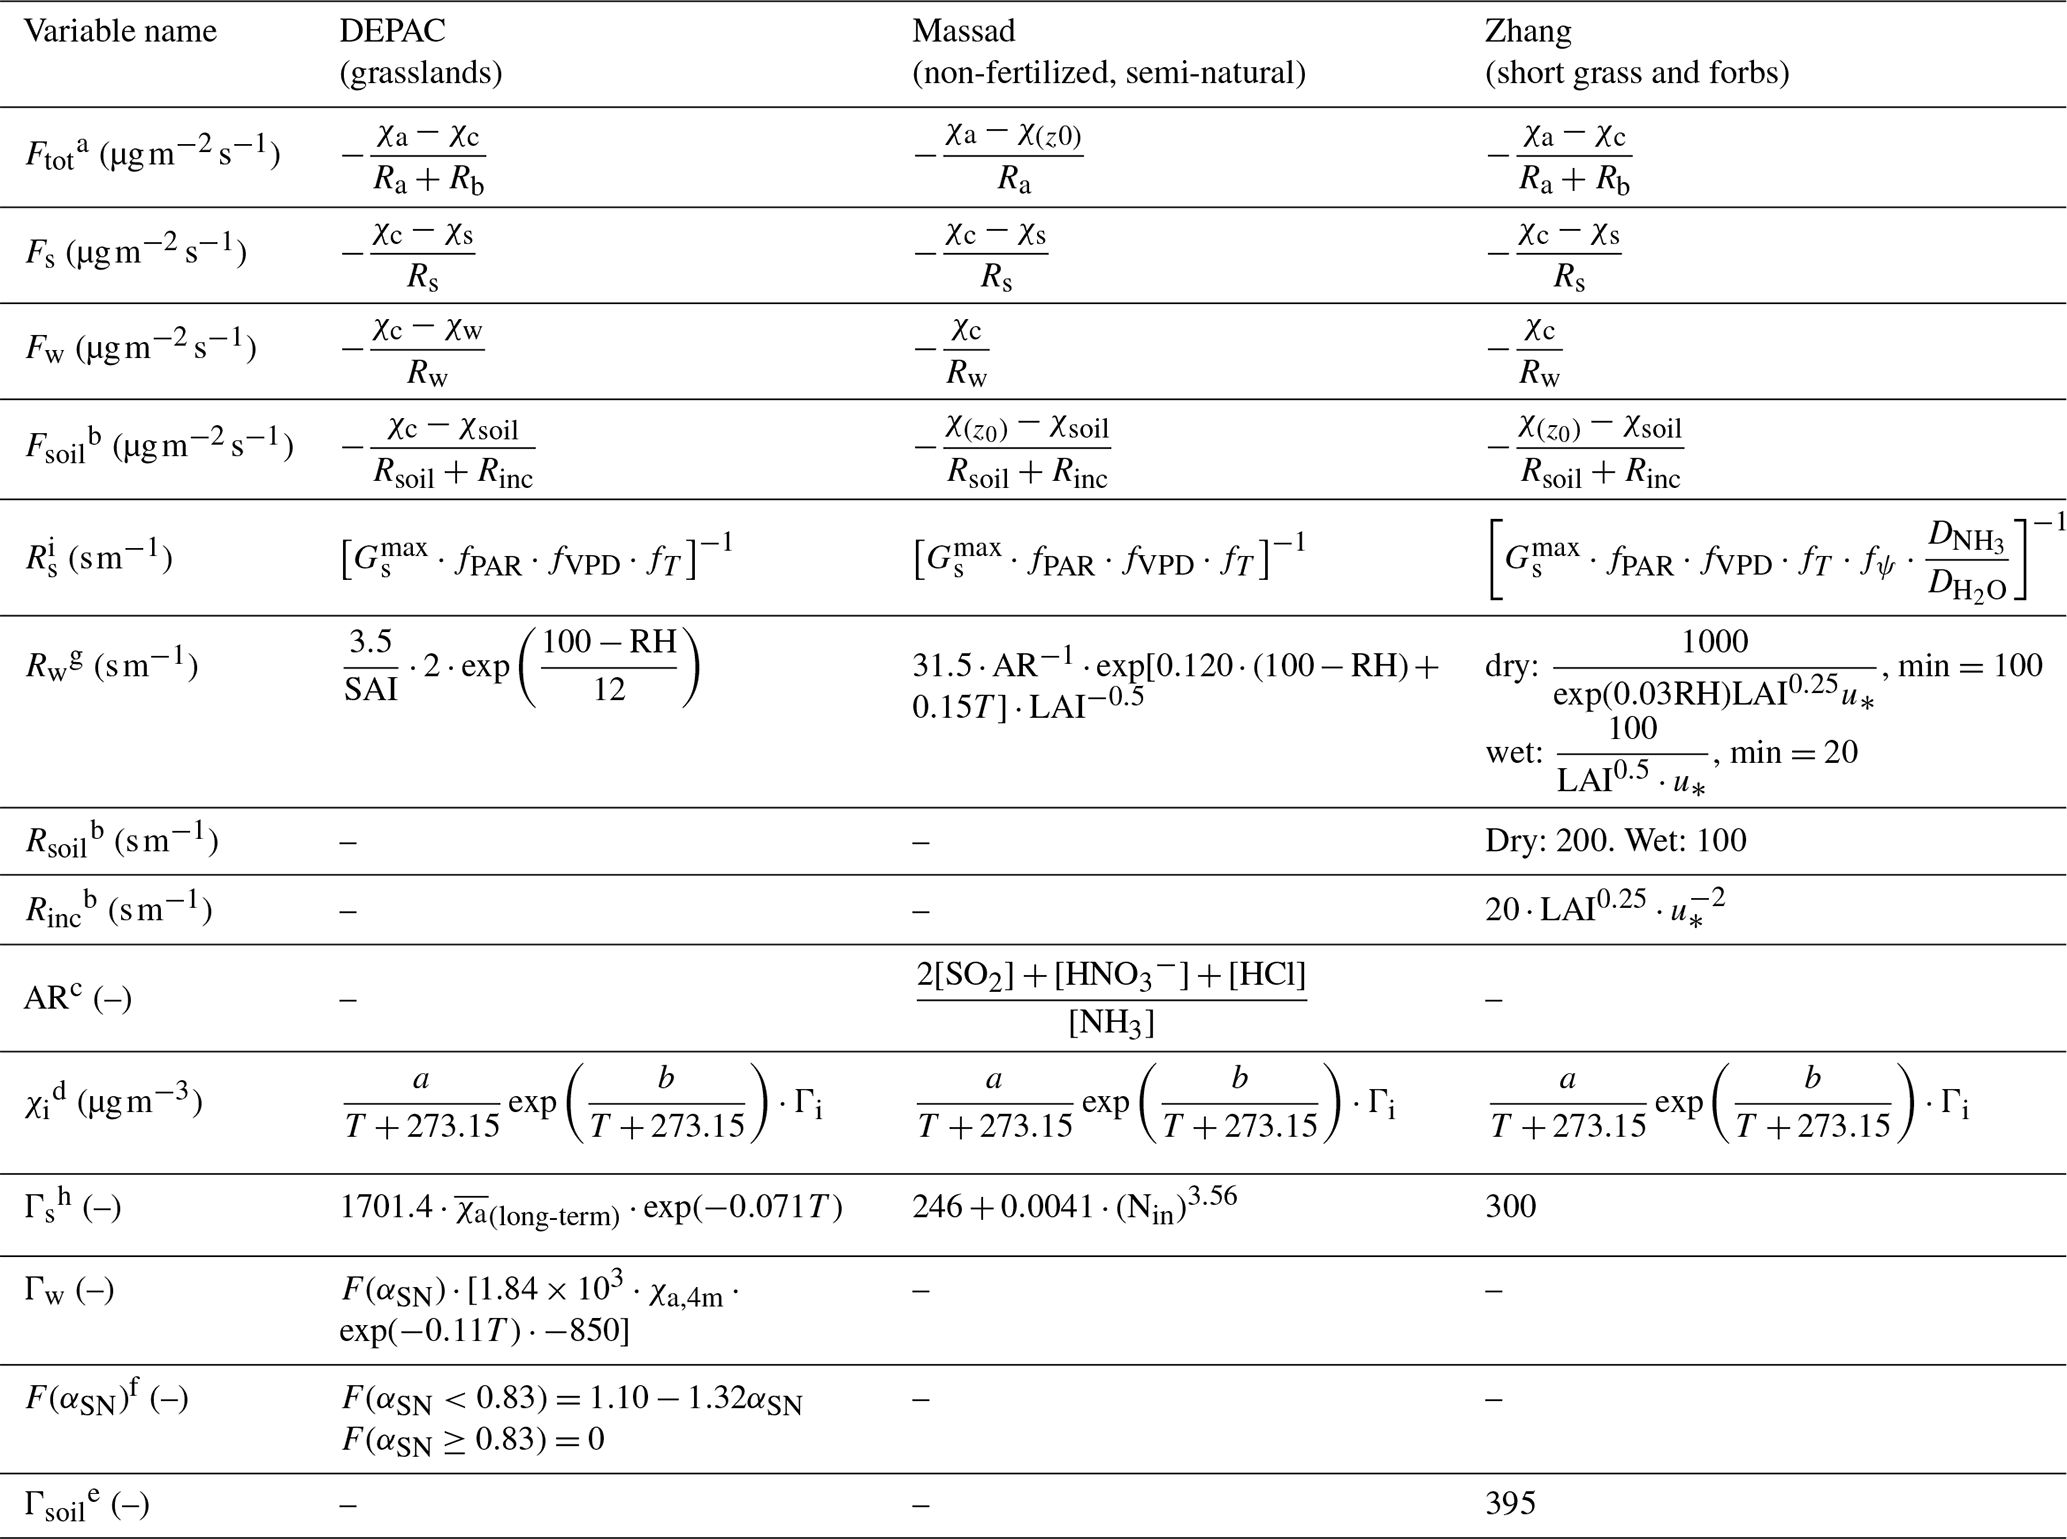
a The equations for χc and χ(z0) are extensive and can be found in van Zanten et al. (2010), Massad et al. (2010), and Zhang et al. (2010). b Note that the soil resistances and compensation points are not calculated in the DEPAC and Massad schemes. c Acidity ratio used in Massad scheme. No and HCl concentration data were available for Solleveld; therefore, the alternative function proposed by Schrader et al. (2016) of is used. d Formula for the calculation of the compensation point in the unit µg m−3 specifically where and . e Note that originally the Γsoil in the Zhang scheme is 2000, but a lower value of 395 has been implemented, which is an average of the Γsoil value reported by Massad et al. (2010) and Wentworth et al. (2014). f The co-deposition function is described in Wichink Kruit et al. (2017), where . g The Zhang scheme uses different parameterizations for dry and wet conditions. The threshold value for wet conditions is when RH≥95, based on the threshold value used in the GEM-MACH model (Chen and GEM-MACH Development Team, 2019). h The is the average long-term NH3 concentration. In this study, we calculate a monthly average NH3 concentration. The Nin at Solleveld was extracted from the annual deposition map published by RIVM (2024) and was 20.7 and 18.2 kg N ha−1 in 2014 and 2015 respectively. i PAR is the photosynthetically active radiation, and VPD is the vapour pressure deficit.
The aerodynamic (Ra) and quasi-laminar boundary layer resistances (Rb) are parameterized consistently across all schemes following Wesely and Hicks (1977) and Hicks et al. (1987) respectively. Here we used the stability correction functions from Holtslag and de Bruin (1988) for stable conditions () and the function from Paulson (1970) and Dyer (1974) for unstable conditions (). The stomatal resistance Rs describes the exchange of gases with the atmosphere through the stomata with apoplastic fluids and is modelled with Jarvis-like functions. The DEPAC scheme follows the Rs parameterization by Emberson et al. (2000). Similarly, the Massad scheme also adopts this parameterization as Massad et al. (2010) do not provide a specific Rs parameterization. The Zhang scheme uses a slightly different parameterization for Rs and includes a function for stomatal blocking caused by water droplets blocking the stomata. The external resistance Rw (in the literature also denoted by Rcut or Rext) describes the exchange of gases with the (wet) layer on the cuticula (Erisman and Wyers, 1993; Sutton et al., 1995b; van Hove et al., 1989). While implemented differently across the three schemes, they all incorporate dependencies on RH, the leaf area index (LAI), a minimal external resistance Rw,min (or α), and an RH-response strength parameter, known as the β value. Finally, the soil resistance Rsoil (also called Rg) models the exchange of NH3 with the soil, and the in-canopy resistance Rinc is the additional resistance exerted on a gas while being transported from the canopy towards the soil (David et al., 2009; Nemitz et al., 2000). Given the selected land use classes, only the Zhang scheme calculates the Rsoil and Rinc at Solleveld.
To model the bi-directional exchange of NH3 with the stomata, the wet dew layer, or the soil, compartment-specific compensation points χi are calculated. The equation for χi is the same across all schemes, incorporating principles from the Henry equilibrium, the NH3– dissociation equilibrium, and the ideal gas law (e.g. Sutton et al., 1994):
where Γi is the emission potential of the exchange pathway i, which is the [] : [H+] ratio in either the apoplasts, the external dew layer, or the soil. The canopy compensation point χc can be interpreted as the effective NH3 concentration in an ecosystem and is used to calculate the total flux. The formulae of χc in the three exchange schemes are lengthy but generally adhere to the following format (Sutton et al., 1995b):
Finally, the exchange flux F is calculated as follows:
By convention, deposition and emission fluxes have a negative and positive sign respectively. Studies have demonstrated that integrating compensation points into exchange schemes generally improves the agreement with measurements compared to unidirectional deposition models (Neirynck and Ceulemans, 2008; Wen et al., 2014; Wichink Kruit et al., 2012). Yet the empirical functions in surface exchange schemes are adapted to a scarce set of flux measurements.
The three exchange schemes selected in this study differ in which exchange pathway is bi-directional. The DEPAC scheme has a stomatal compensation point χs and an external compensation point χw: the stomatal emission potential Γs parameterization is derived from a meta-analysis of Γs values for multiple land use classes (see Wichink Kruit et al., 2010). It is a function of temperature and the long-term average NH3 concentration (e.g. 1 month or 1 year), which serves as a memory component assuming that the apoplastic Γs is a function of the historic NH3 accumulation. The DEPAC scheme is the only operational model with a χw parameterization, which is a function of temperature and the instantaneous NH3 concentration and is based on 3 years of measurements at Haarweg (Wichink Kruit et al., 2010). The scheme also implicitly has a soil compensation point χsoil, but this is currently set to zero. Besides, soil exchange is disabled for the grasslands land use class in the DEPAC scheme. The Massad scheme has a χs and χsoil, but the χsoil is set to 0 at Solleveld as the scheme assumes no soil exchange takes place when vegetation is present. The Γs equation in the Massad scheme is derived from a meta-analysis of reported Γs values and is a function of annual nitrogen input Nin (Massad et al., 2010). The Massad scheme also has a parameterization specifically for management events (e.g. fertilizer application or grazing) but is not utilized as Solleveld is an unmanaged site. The Zhang scheme has a χs and χsoil, and in contrast to the DEPAC and Massad schemes, it also assumes soil exchange when vegetation is present. The scheme has a lookup table with Γ values for an extensive set of land use classes based on a meta-analysis of reported Γs and Γsoil values (Zhang et al., 2010). For several land use classes, they provide Γ values for ecosystems with either a low or high nitrogen content. In this study, the low content value was used. The Γsoil value for the land use category of short grass and forbs in the Zhang scheme is set at 2000, leading to unrealistic model output, which results in extremely high emission fluxes (see Figs. 6 and A2). Wentworth et al. (2014) also observe this issue, explaining that the high Γsoil value was derived from measurements at fertilized sites, which are not representative of unfertilized soils. Therefore, the Γsoil value of 2000 is lowered to 395, which is an averaged value derived from the Γsoil value reported by Massad et al. (2010) and Wentworth et al. (2014). The effects of this modification are further discussed in Sect. 4.4.
Moreover, all schemes used the yearly LAI curves employed in the DEPAC scheme. Vendel et al. (2023) found stronger performance for the DEPAC scheme with a minimum and maximum LAI of 0.5 and 1.0 respectively. These values were also applied in this study. Vendel et al. (2023) have also experimented with enabling the soil pathway in the DEPAC scheme, but this was not implemented in this study.
2.3 Uncertainty analysis and sensitivity analysis
In addition to validating the NH3 exchange schemes, a comprehensive error analysis was conducted to estimate the uncertainties in input variables and model parameters. A Monte Carlo uncertainty analysis was used to propagate these uncertainties and quantify the total uncertainty in the model output. Additionally, a sensitivity analysis was performed by only perturbing one input variable or model parameter to identify the most sensitive inputs. The uncertainty of each input variable or model variable was estimated using literature-based estimations or expert judgement. A 95 % confidence interval was determined for each input. Table A1 provides a complete list of the variables selected for the uncertainty/sensitivity analysis, together with the derived standard deviations, the lower and upper bounds per variable used for the sensitivity analysis, and the type of probability distribution (e.g. normal, uniform, discrete). Additionally, the methods and assumptions for deriving these probability density functions are briefly explained.
Three uncertainty categories were propagated in the Monte Carlo analysis. The first is measurement biases, both random and systematic, which arise from the measurement device itself. From this, the extent to which these biases may propagate into modelling errors could be assessed, consequently determining whether more accurate measurement equipment is necessary. Second, two systematic environmental biases were analysed: these are differences between temperature and RH within and outside the canopy, where these variables are typically measured. This can aid in detecting potential systematic errors that need to be considered. Research by Personne et al. (2009) has shown that systematic temperature differences could lead to diverging modelling outcomes, because NH3 exchange schemes are sensitive to this temperature offset, as temperature is a key parameter for stomatal conductance and compensation point parameterization. Likewise, RH is a key variable for calculating the external resistance Rw but could strongly differ inside and outside of the canopy (von Arx et al., 2012; Westreenen et al., 2020). Third, model biases such as empirically derived model parameters like α and β in Rw were propagated to identify parameters that may require revision. It should be acknowledged that estimating the uncertainty for these parameters is challenging and involves some degree of subjectivity, and results can vary strongly depending on the chosen uncertainty range.
In total, 5000 trials were run per model; i.e. the three exchange schemes calculated the fluxes at Solleveld 5000 times with different settings. A 95 % confidence interval for modelled fluxes was derived, calculated from the 2.5th and 97.5th percentile. To ensure the number of trials was sufficient, it was verified that the mean flux of the 5000 trials converged to stable values. Vendel et al. (2023) have conducted an assessment of the uncertainty associated with the GRAHAM instrument and flux calculations. They report an error margin of ±24 % (2σ) for accumulated fluxes, which was used in this study.
3.1 Quantitative comparison of exchange schemes with measurements
The comparison of the measured and modelled fluxes is given in Table 2. The mean measured NH3 flux at Solleveld is −7.0 . The mean flux modelled by the Zhang scheme at −6.8 comes close to the mean measured flux. In contrast, the DEPAC scheme overestimates the mean flux at −14.6 , which is more than twice the measured mean flux, and the Massad scheme strongly underestimates the mean flux at −3.0 . When comparing the hourly measured and the modelled NH3 fluxes at Solleveld, the Zhang scheme has the highest Pearson correlation at 0.63, indicating a moderately strong linear relationship. This is followed by the DEPAC scheme at 0.56, whereas the Massad scheme has a low correlation of 0.18. Table 2 also displays the performance of the exchange scheme when strong deposition, moderate deposition, or emission is observed. Both during moderate and strong deposition events, the Zhang scheme has the lowest RMSE. However, the DEPAC scheme had the highest correlation of 0.50 during moderate deposition, slightly better than the Zhang scheme.
Table 2Descriptive statistics of the measured and the modelled fluxes per exchange scheme. Additionally, the statistics are shown when strong deposition (), moderate deposition (), and emission (Ftot≥0) are observed.
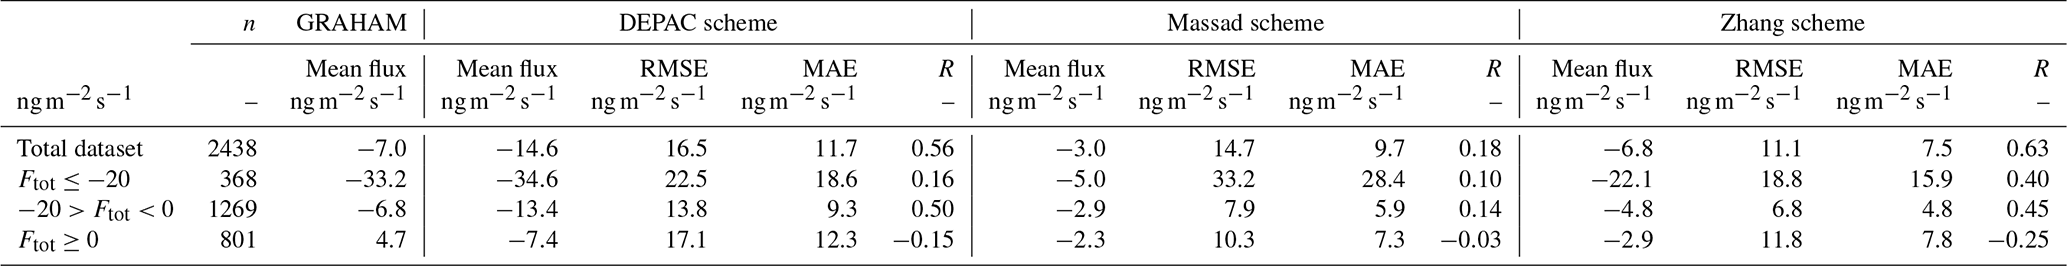
Table 2 shows that emission events are poorly captured by all three schemes. In total, 33 % of the fluxes were emission fluxes with the DEPAC scheme capturing emissions in only 14 % of the instances, compared to 20 % for the Massad scheme and 31 % for the Zhang scheme. NH3 emissions were observed at all hours of the day, with a peak between 10:00 and 18:00 LT, but emissions also took place during the night. Figure 2 shows hexbin plots comparing the hourly measured fluxes with the modelled fluxes. The weak performance of all three models during emission events is clearly visible, showing no correlation with the measurements and often predicting deposition instead of emission. This indicates that the current parameterization of compensation points in all three exchange schemes cannot model the emission events correctly at Solleveld.
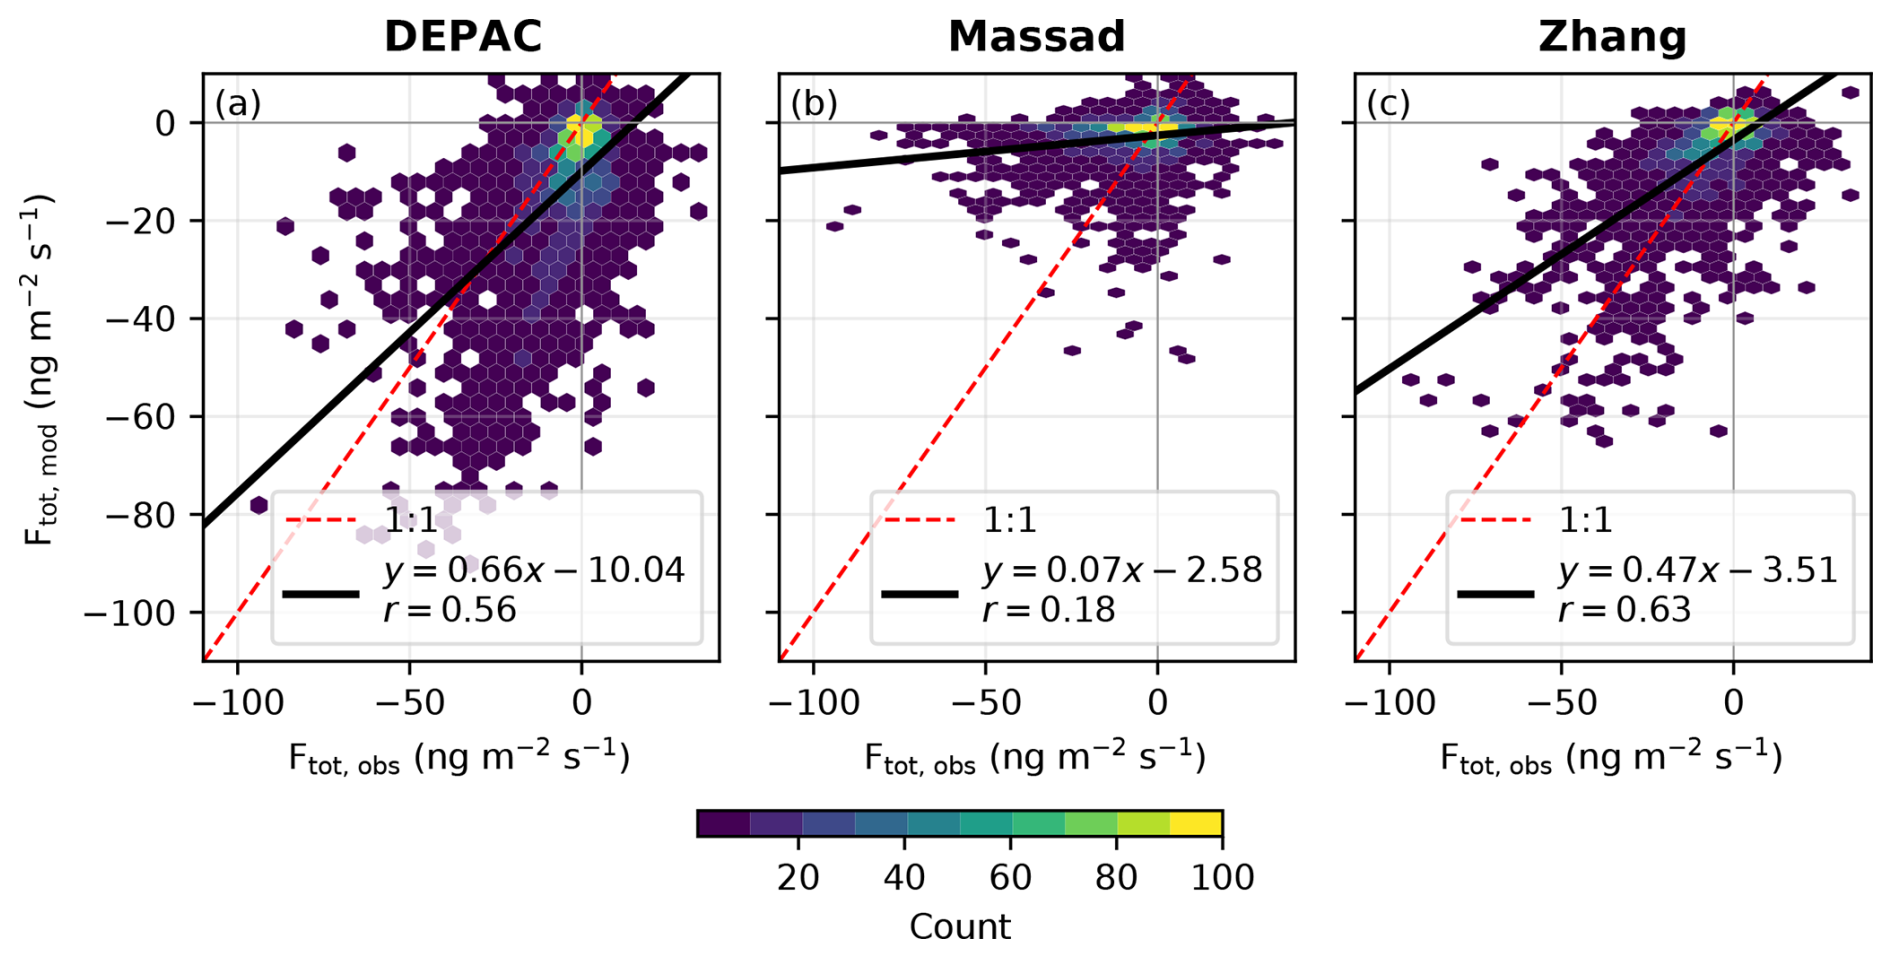
Figure 2Hexbin plot with the measured and modelled fluxes for the DEPAC, Massad, and Zhang schemes.
Figure 3 shows the average diurnal pattern of the measured and modelled NH3 flux per scheme at Solleveld. The measured NH3 flux exhibits a clear diurnal pattern where the deposition is enhanced during the evening and the night and lower during the day. In terms of timing, the DEPAC scheme closely matches the measured flux; however, it overestimates deposition due to a negative offset at all times. The observed deposition “dip” at noon (i.e. when the deposition is at its lowest) is shifted to 15:00 LT in the DEPAC scheme. On the contrary, the Massad scheme exhibits a rather flat diurnal pattern and consistently underestimates NH3 deposition at Solleveld throughout the day. The Zhang scheme approximates the order of magnitude of the measured fluxes well, although it does not accurately model the temporal variation of the fluxes.
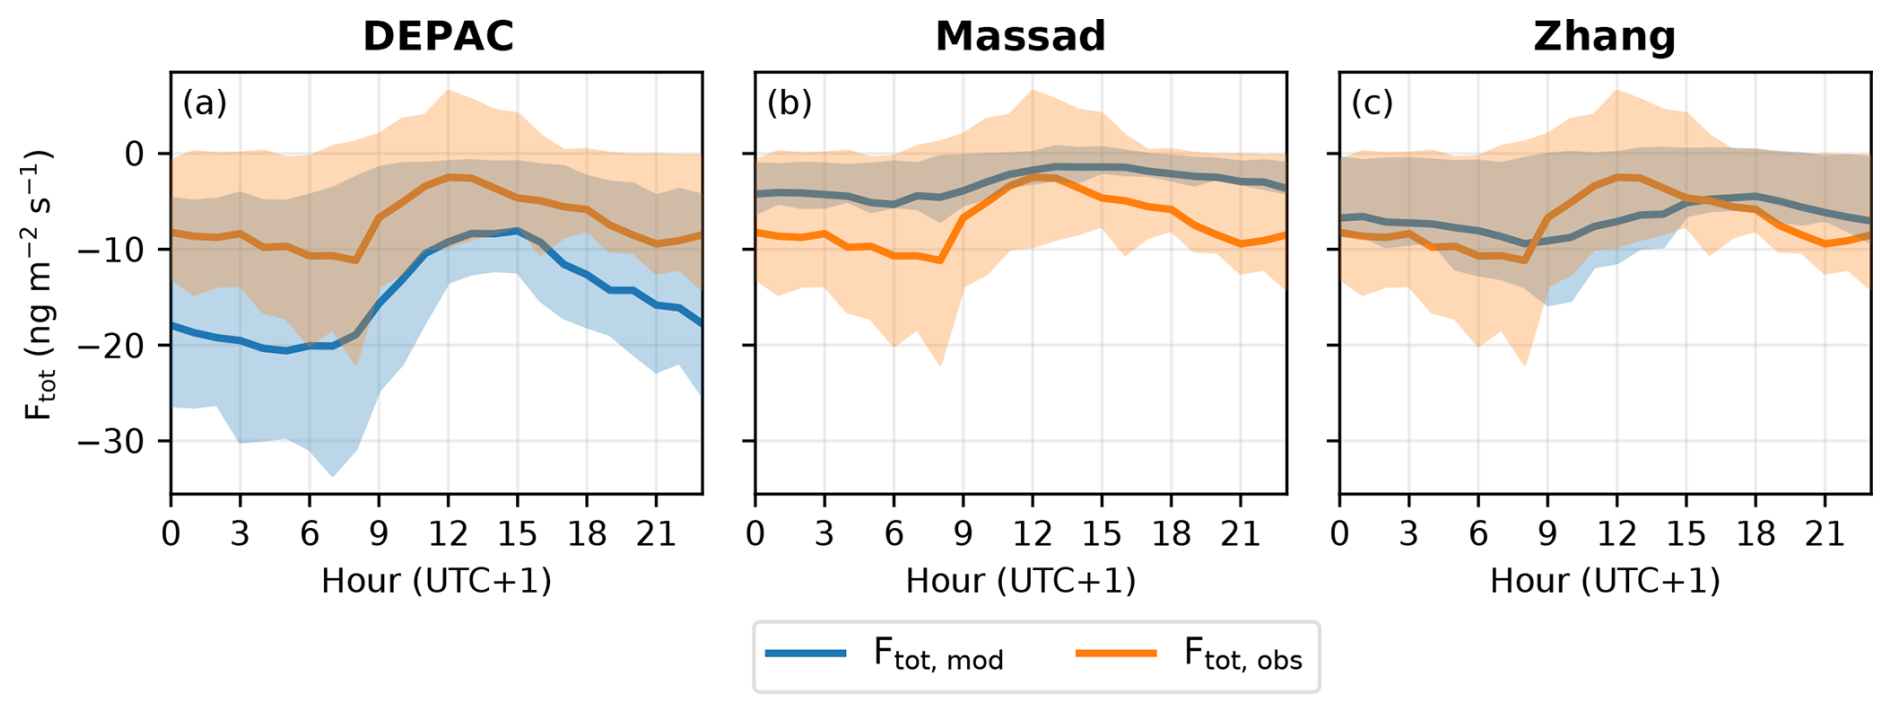
Figure 3Measured and modelled average diurnal pattern of the NH3 flux at Solleveld in , per model. The shading around the lines depicts the 25 %–75 % percentile range.
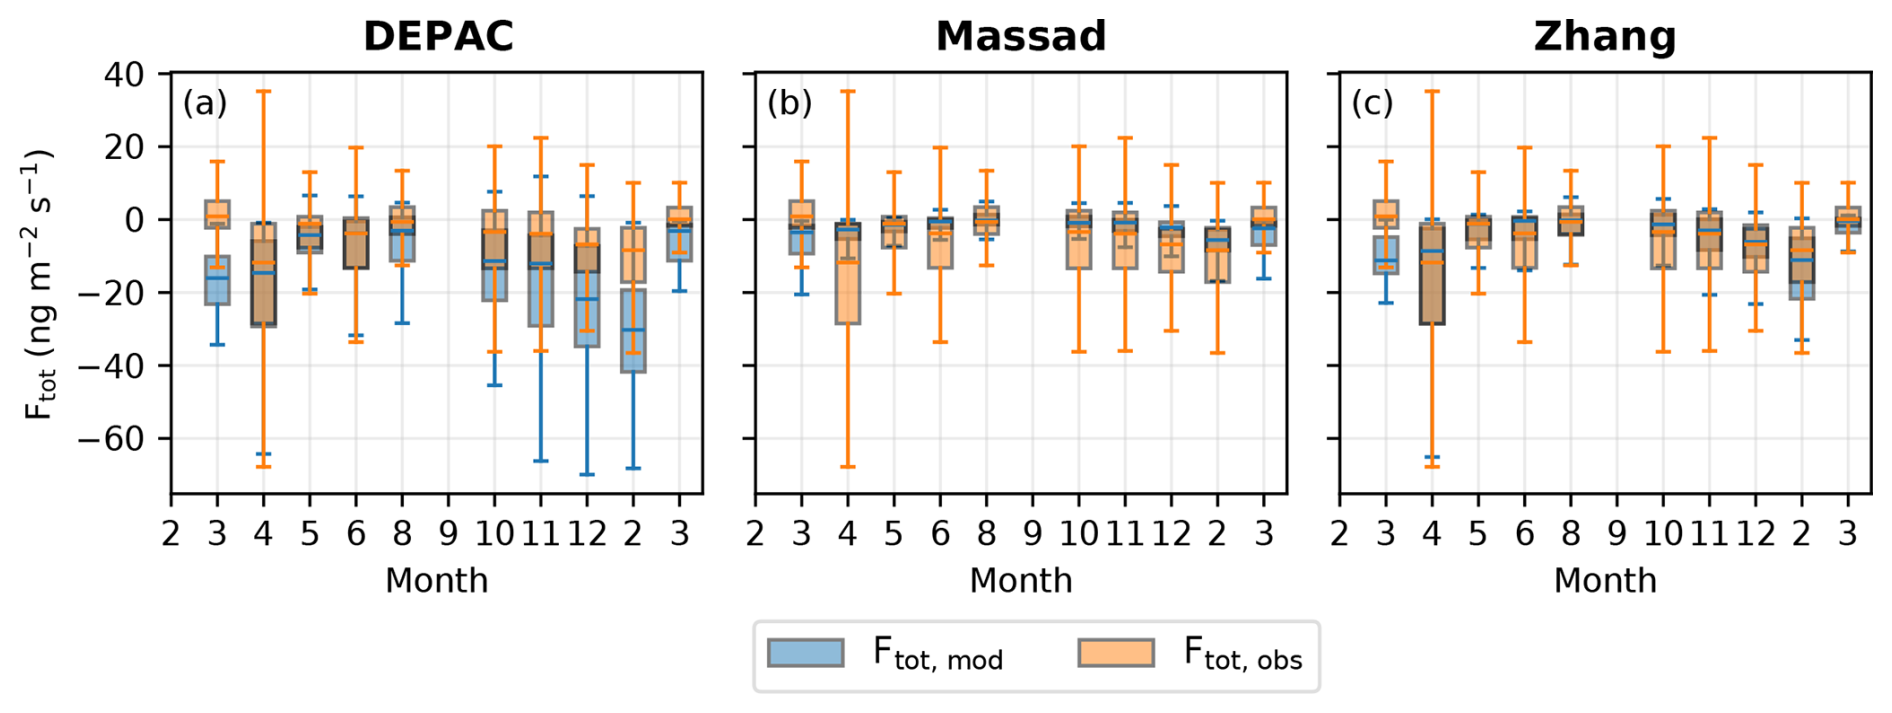
Figure 4Measured and modelled monthly averaged NH3 flux at Solleveld in , per model. The outer whiskers show the quartile + 1.5× the interquartile range. Note that outliers are not displayed.
Figure 4 displays the comparison between monthly averaged observed and modelled NH3 fluxes. The strongest deposition took place in March, attributed to the elevated NH3 concentrations stemming from agricultural fertilization practices in the region. Additionally, a minor deposition peak can be observed in November. The DEPAC scheme demonstrates a moderately good comparison with the measurements in spring, while the deposition flux is overestimated in the second half of the year, especially in November. In contrast, the Massad scheme underestimates deposition almost every month, showing very little correlation with the measured yearly trend. Finally, the Zhang scheme demonstrates the strongest performance every month, accurately modelling NH3 deposition during both strong and weak deposition months. The accumulated measured and modelled fluxes during the Solleveld campaign are illustrated in Fig. A1.
3.2 Model comparison
To understand the differences between the three exchange schemes, the separate pathways of the three schemes are illustrated in Fig. 5. A general observation from Fig. 5a–c is that all exchange schemes are predominantly governed by deposition towards the external leaf surface, highlighting the importance of Rw parameterization for NH3. The dominance of the external leaf pathway is also shown in Fig. A3, showing the total accumulated flux per exchange pathway for all three exchange schemes. Conversely, the stomatal exchange is minimal across all three schemes. In the Zhang scheme, a small but not insignificant fraction of the deposition is towards the soil. Figure 5g–i show the conductances, which are the reciprocals of the resistances and are more convenient to show, as resistances can vary strongly throughout the day.
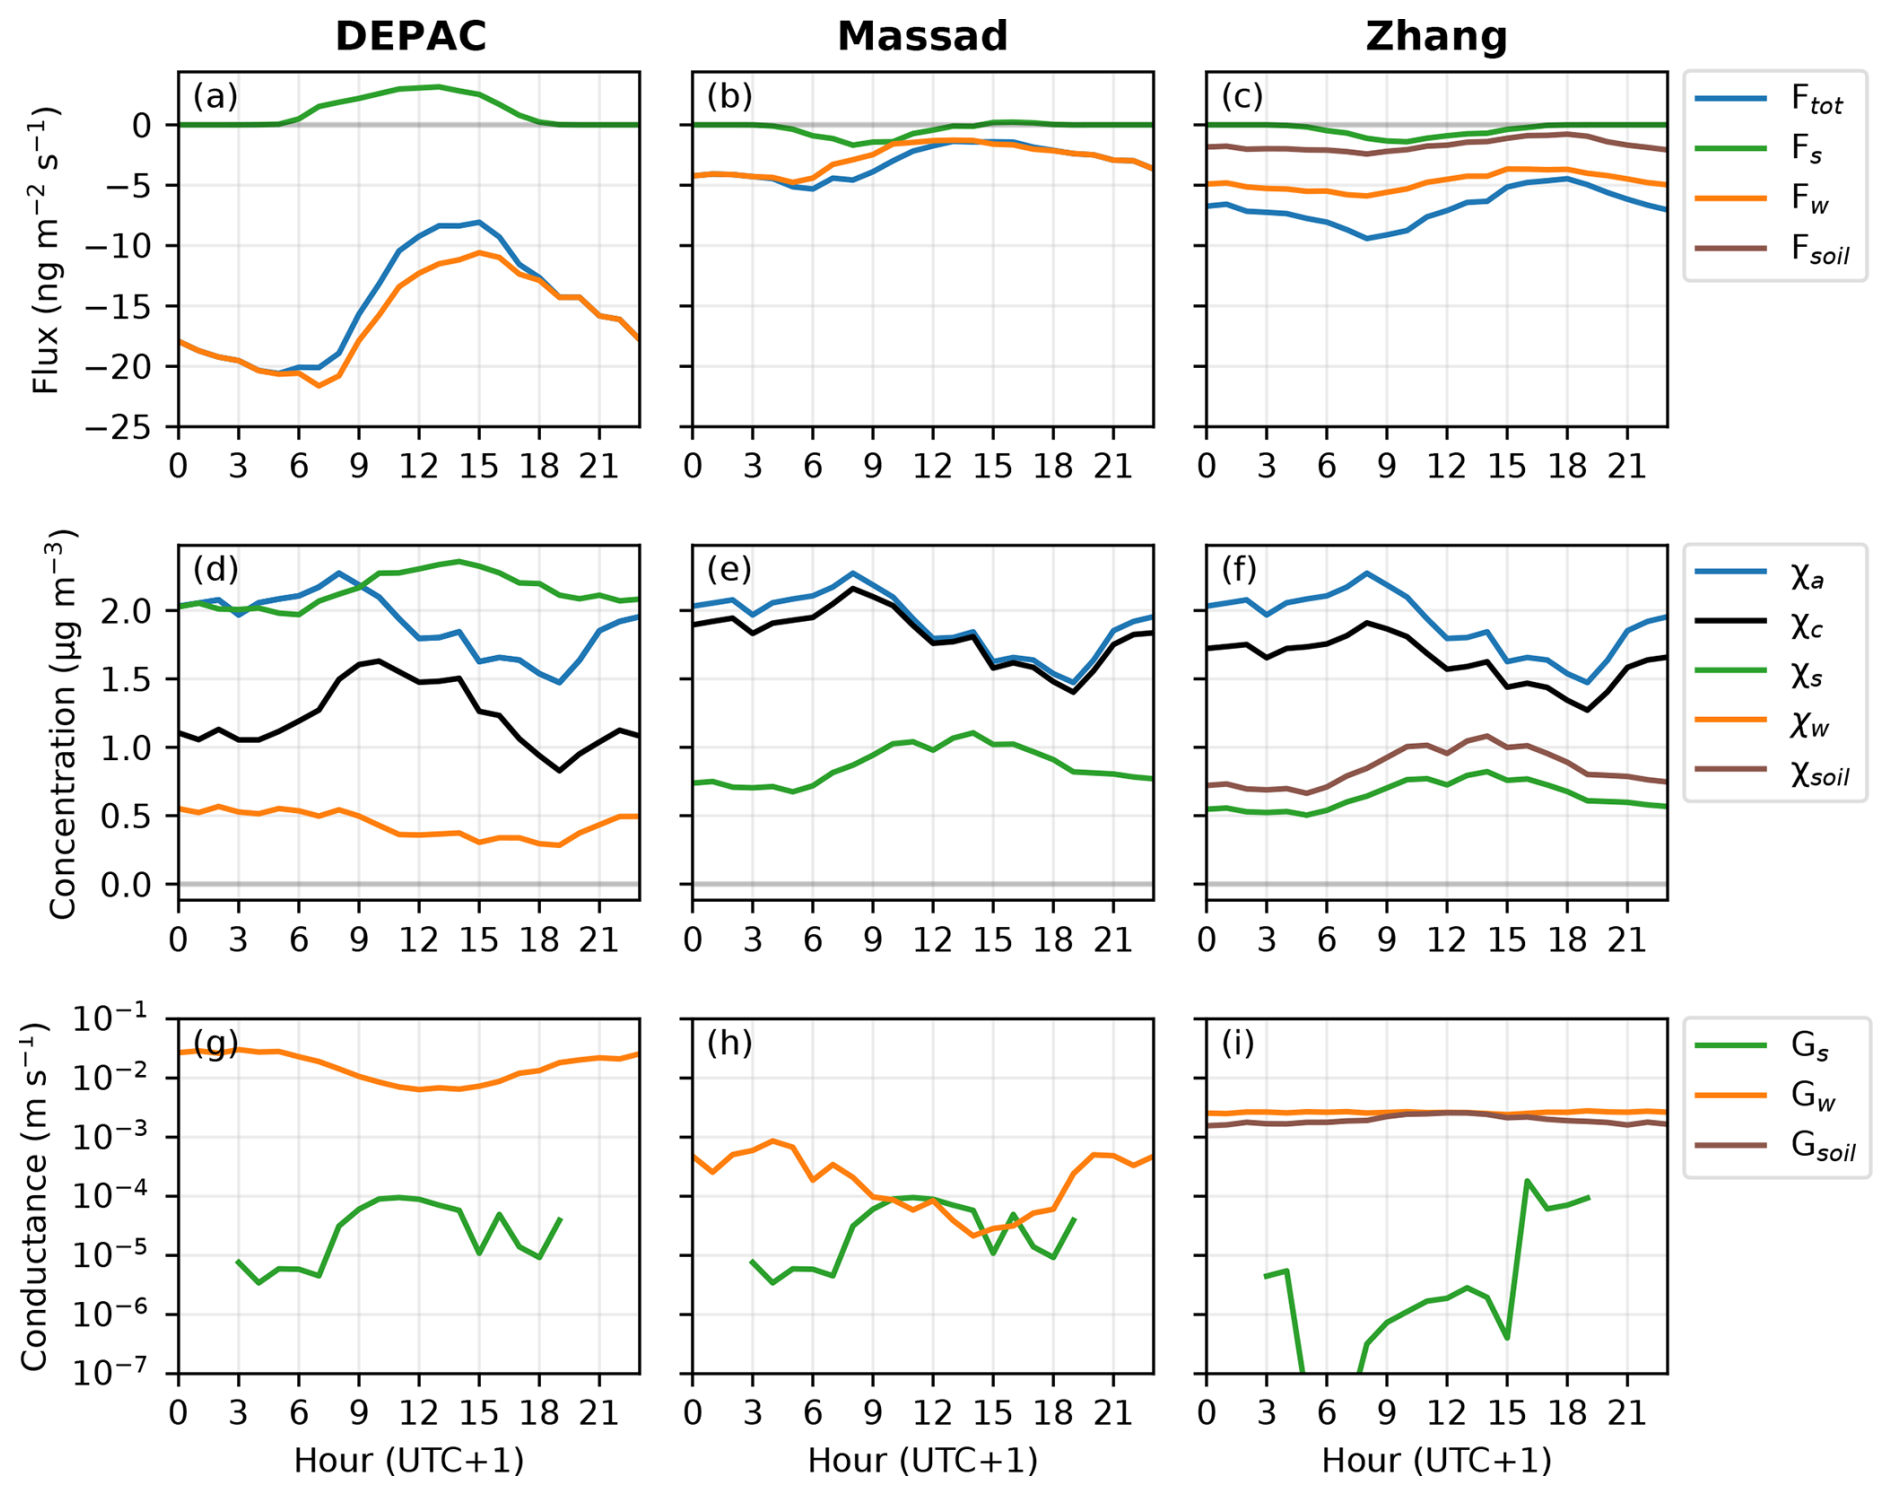
Figure 5Diurnally averaged fluxes (a–c), compensation points (d–f), and conductances (g–i) per exchange pathway of the DEPAC, Massad, and Zhang schemes.
In the DEPAC scheme, the external flux is higher than the other two schemes, caused by the higher external conductance Gw (Fig. 5g), resulting in the highest deposition flux among all three schemes. The high Gw modelled in the DEPAC scheme aligns with the findings by Schrader et al. (2016). Both the DEPAC and Massad schemes show that Gw is highest during the evening and night and lower during the day.
In contrast, Gw in the Massad scheme is several orders of magnitude lower than in the DEPAC scheme. This difference is due to (i) a higher base resistance (α or Rw,min) of 31.5 s m−1 compared to 2 s m−1 in the DEPAC scheme, (ii) a lower RH scaling parameter β of 8.3 compared to 12 in the DEPAC scheme, and (iii) the inclusion of the βT parameter, which increases Rw with rising temperature.
The Zhang scheme, however, does not exhibit a strong diurnal cycle of Gw, indicating that it is less dependent on RH compared to the other two schemes. Similarly, the soil conductance Gsoil in the Zhang scheme does not show a diurnal cycle and has a similar magnitude to Gw (Fig. 5i). Despite this, the soil flux is significantly lower than the external flux (Fig. 5c), caused by the incorporation of a soil compensation point, which counteracts soil deposition.
Finally, while both the DEPAC and Massad schemes use the same parameterization for Rs, the DEPAC scheme calculates stomatal emission rather than deposition, unlike the Massad scheme. This contrast is caused by the high stomatal compensation point χs in the DEPAC scheme (Fig. 5d). Both functions for Γs in the DEPAC and Massad scheme are derived with a least squares fit from measurements at multiple land use types (grasslands, semi-natural, and forests), but the exact reason for the significant difference between Γs in the DEPAC and Massad schemes remains unclear.
3.3 Uncertainty and sensitivity analysis
The results of the uncertainty analysis, presented in Table 3 and Fig. A1, indicate significant uncertainties in the modelled flux of the three exchange schemes. The total uncertainty of the DEPAC scheme ranges from a 107 % deposition increase to a −142 % decrease (i.e. net emission would take place), showing a large range of possible outcomes. The Massad scheme shows an even greater spread, with uncertainties ranging from a 471 % increased deposition to a −132 % decrease. In contrast, the Zhang scheme showed a more moderate uncertainty ranging from an 81 % deposition increase to a −69 % decrease. When comparing the absolute uncertainty of the mean modelled flux at Solleveld, the DEPAC scheme showed the largest spread of [−30.3; 6.1 ], followed by the Massad scheme with an interval of [−17.4; 1.0 ] and the Zhang scheme with an uncertainty range of [−12.3; −2.1 ].
Table 3Results of the uncertainty analysis (top row) and the sensitivity analysis of the three exchange schemes, showing the percentage increase/decrease of the mean modelled flux at Solleveld during the measurement period. Positive values indicate an increase in the deposition and negative values a decrease in the deposition. Percentage changes lower than −100 % imply net emission. Sensitivities >10 % are in bold. The lower and upper values represent the 2σ confidence intervals shown in Table A1.
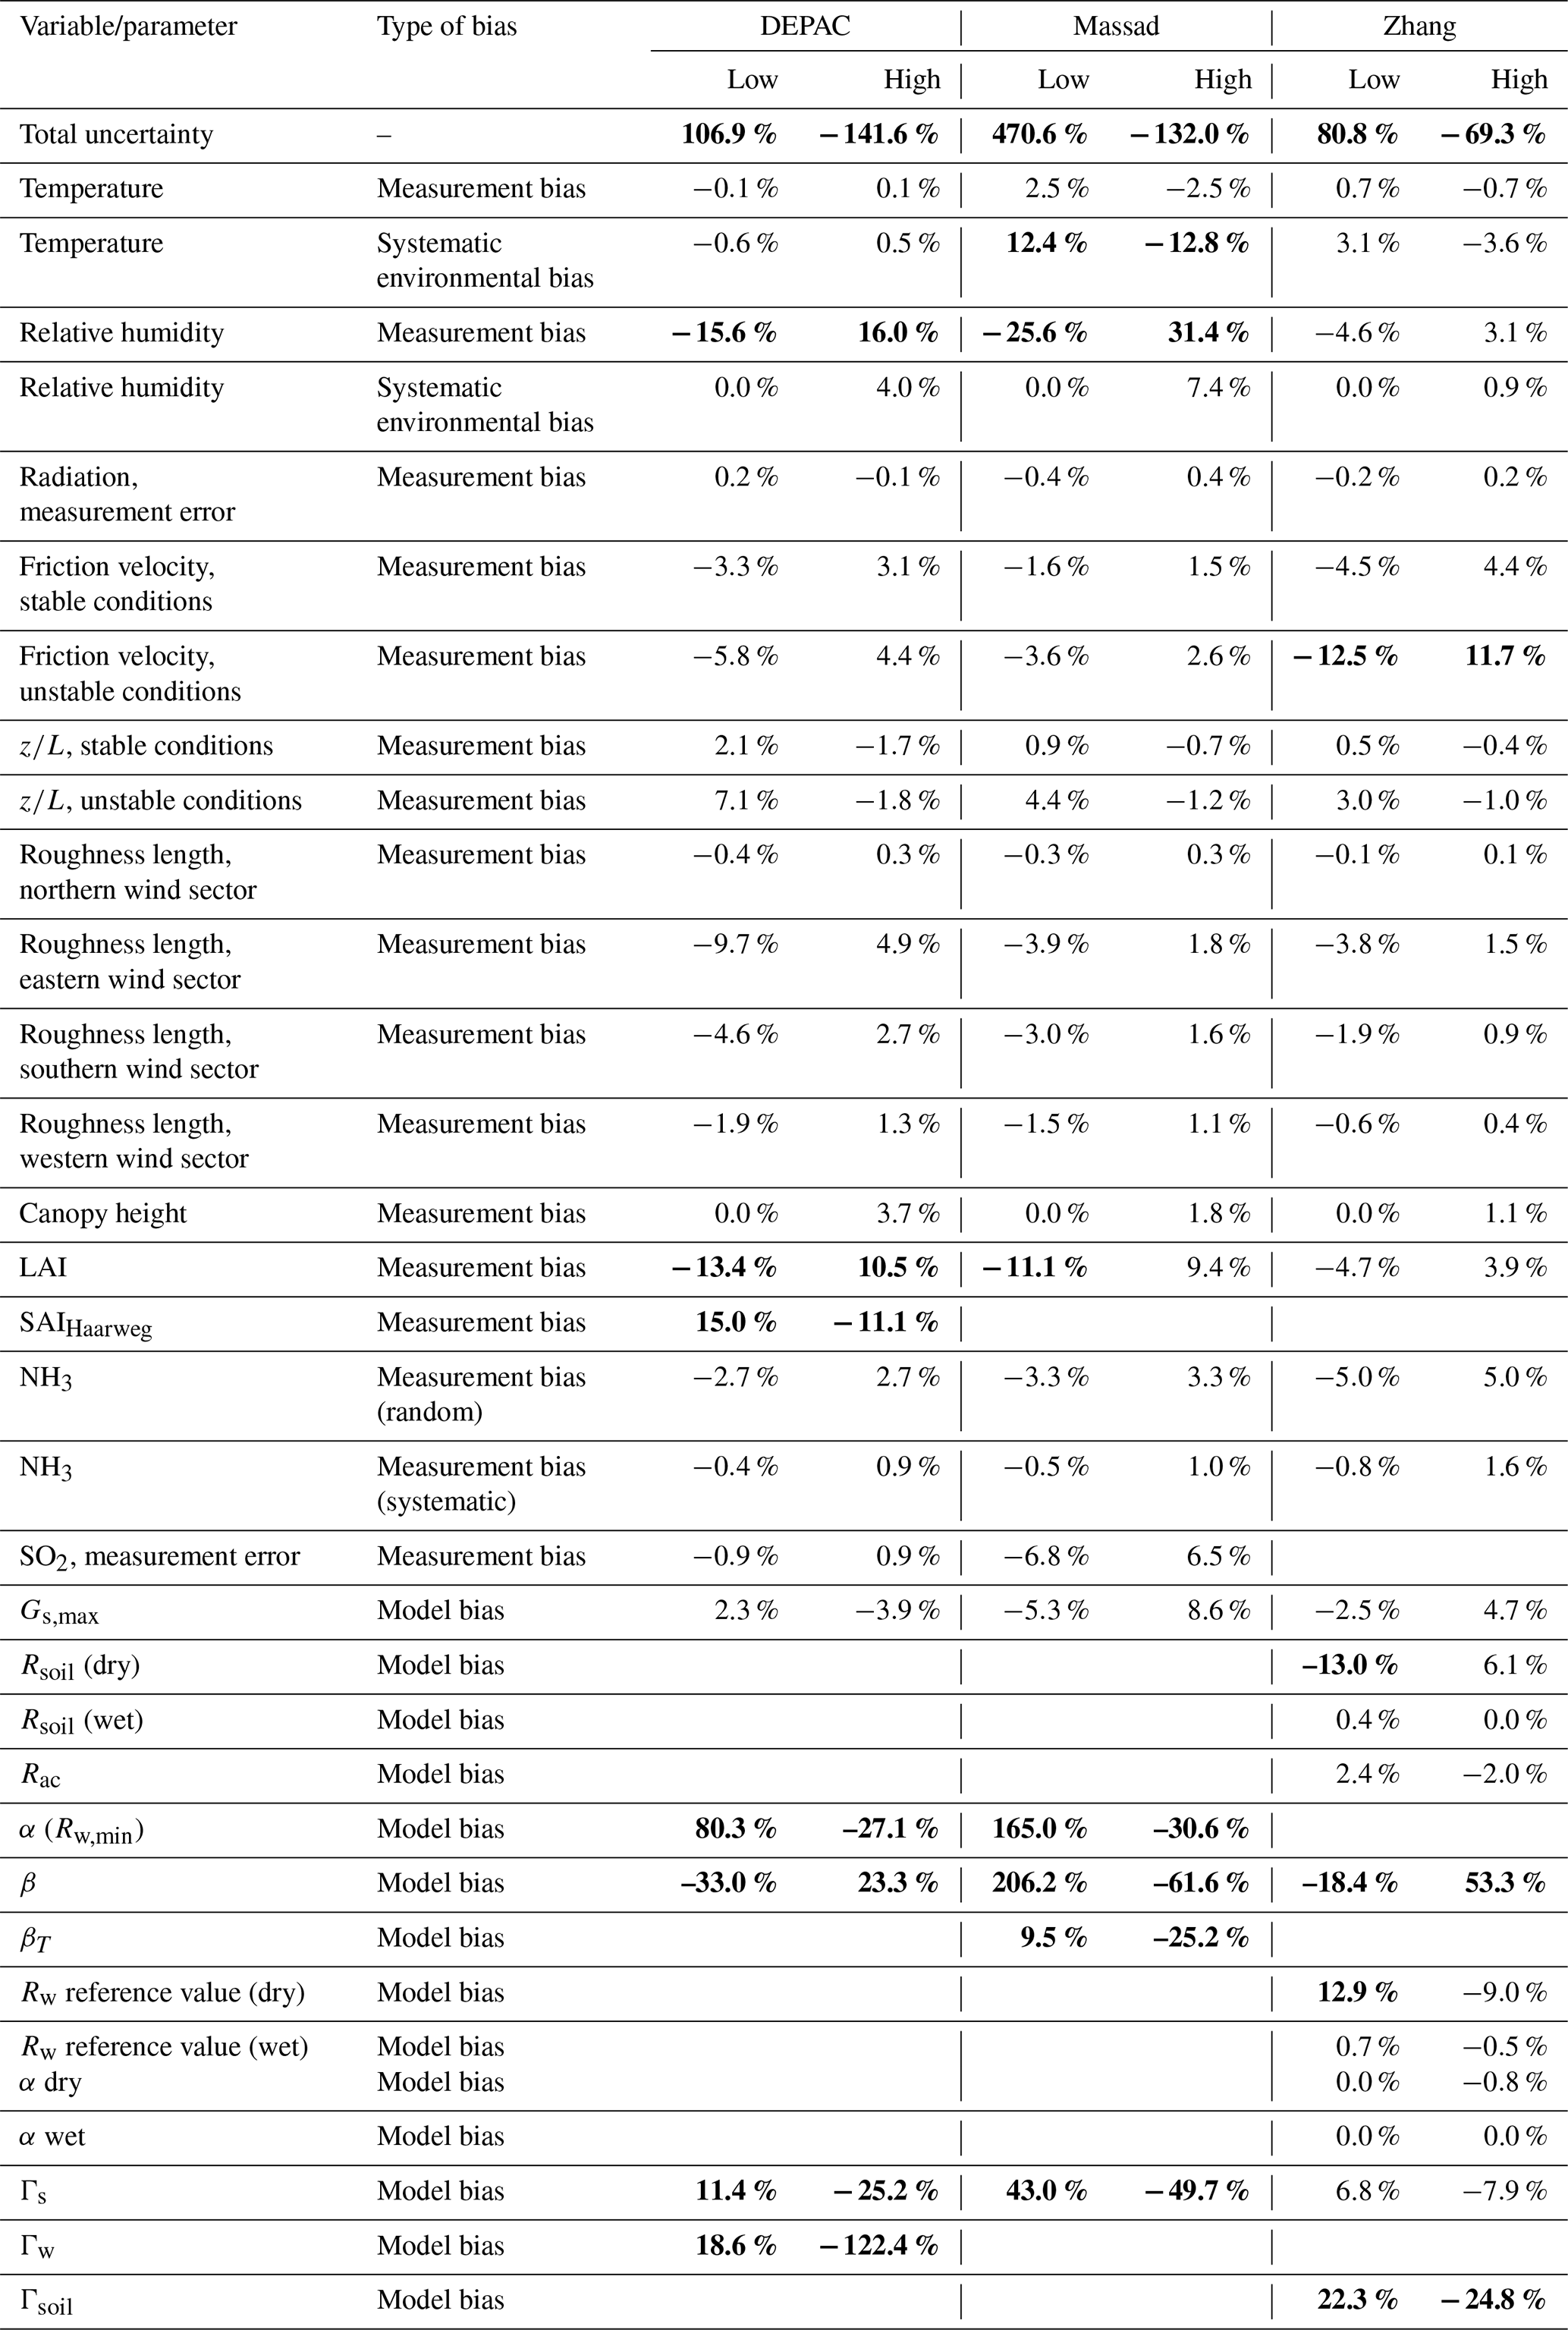
The outcome of the uncertainty analysis can be further interpreted when viewed alongside the results of the sensitivity analysis, as shown in Table 3. The values of the variables and parameters in this sensitivity analysis are both increased and decreased, whereas the upper and lower parameter values are based on the 2σ confidence bounds (see Table A1). The sensitivity of each parameter is expressed as the percentage increase or decrease of the mean flux at Solleveld, caused by the perturbation. As stated in the methods section, three types of biases have been considered: measurement biases, systematic environmental biases, and model biases. The measurement bias of the RH instrument has the most pronounced impact on the modelled fluxes in the DEPAC and Massad schemes, which can be explained by the strong dependency of these two schemes on the Rw. For similar reasons, the sensitivity of the LAI measurement error is more pronounced in these schemes. The measurement bias for RH and LAI was not as pronounced in the Zhang scheme, which can be explained by the slightly lesser dominance of the external pathway (see Fig. A3). Conversely, the Zhang scheme is more affected by the measurement error of u∗ given its importance in both Rw and Rsoil parameterization. The influence of the measurement bias of temperature and radiation was not significant. The effect of systematic environmental biases on in-canopy and above-canopy temperature and RH has also been analysed. Only the Massad scheme showed strong changes in the output caused by the systematic temperature differences, as Rw is also a function of temperature due to the βT parameter. The insensitivity of the DEPAC scheme to systematic temperature difference was surprising, given the strong relationship between temperature and the compensation points. However, model output has shown that χs increased significantly, consequently increasing the stomatal emission flux. However, this effect was completely counteracted by the χw, which decreased, as Γw is inversely proportional to temperature, therefore increasing the external flux.
Generally, the most sensitive parameters in all three schemes can be related to model biases with sensitivities often surpassing a ±50 % change in the modelled flux: In the DEPAC scheme, uncertainties in Γw, α, and β significantly impacted the model's output. In the Massad scheme, the most sensitive parameters are β, α, and βT. In both the DEPAC and the Massad schemes, these sensitive parameters can, in some cases, cause the direction of the flux to shift from net deposition to net emission. In the Zhang scheme, the parameters with the highest sensitivities were β and Γsoil. From this analysis, it can be concluded that (i) in all three exchange schemes, the most sensitive variables are primarily related to the exchange of NH3 via the external leaf path and the compensation point parameterization and (ii) that the DEPAC and Massad schemes are more sensitive to parameter perturbations than the Zhang scheme, as indicated by the stronger impact the perturbations have on the modelled fluxes.
The comparison of the three exchange schemes revealed that the Zhang scheme has a better performance than the DEPAC and Massad schemes when validated against the Solleveld measurement. Additionally, the exchange at the external leaf surface is a key process across all three schemes, which has also been observed in previous studies (e.g. Hansen et al., 2013; Jones et al., 2007; Neirynck and Ceulemans, 2008; Wyers and Erisman, 1998). This also implies that the parameterization of external leaf surface exchange of NH3 is primarily responsible for the stark differences between the schemes, in accordance with results by Flechard et al. (2011). In contrast, differences in the parameterization of stomatal and soil exchange only resulted in subtle differences between the schemes. A critical issue that arises from the results is the inability of all three schemes to accurately model emission fluxes (see Fig. 2), pointing to significant shortcomings in the parameterization of compensation points. The sensitivity analysis confirms these findings, showing that the greatest uncertainties lie in the parameterization of Rw and compensation points, significantly affecting model outcomes. The results of this study align with the findings of Schrader et al. (2016), as the external flux in the DEPAC scheme was stronger than in the Massad scheme, and both studies recognize the sensitivity of NH3 exchange schemes to environmental parameters such as temperature and relative humidity. While Schrader et al. (2016) only focused on the non-stomatal parameterization of the DEPAC and Massad schemes during nighttime conditions at four sites (including the Solleveld dataset), this study extended the analysis by incorporating both stomatal and the non-stomatal parameterization and validated the schemes during nighttime and daytime conditions. Moreover, it offers a more comprehensive evaluation of schemes as the Zhang scheme is included, and it uses post-processed Solleveld data, whereas Schrader et al. (2016) used preliminary data from Solleveld.
In this section, we first discuss several hypotheses as to why observed emissions were not modelled by the three schemes. The following section elaborates on how desorption processes from the external water layers are currently not modelled by any of the three exchange schemes and how dynamic modelling approaches can resolve this issue. Finally, the influence of the uncertainty of RH and temperature measurements on the model output is discussed, and the limitations of this research are given.
4.1 Determining the emission source
The results of the scheme intercomparison indicate that emissions are not modelled properly across all three schemes (see Fig. 2). Given the fact that soil exchange could not be ruled out at Solleveld, it was not possible to isolate the fluxes properly in order to derive the source of the emission. However, several hypotheses can be made regarding the source of the emission. The origin could be the desorption of NH3 from the leaf surfaces, although these emissions usually take place in the morning and would not fully explain the emissions that take place in the afternoon (see Fig. 3). These emissions could also originate from the stomata, as χs would increase during the day, caused by the temperature increase. This phenomenon of stomatal emission would be in line with previous analyses on non-fertilized fields (e.g. Horváth et al., 2005; Wichink Kruit et al., 2007). The soil and litter layer could also be a potential source of NH3 that should not be overlooked. At Solleveld, the LAI is very low, which makes it less likely for the overlying vegetation to recapture NH3 (David et al., 2009; Hansen et al., 2013; Sutton et al., 2009). However, given that Solleveld is a non-fertilized ecosystem, it could be expected that Γsoil is not large, thus reducing the likelihood of the soil layer acting as a strong NH3 source. Yet research on soil and litter NH3 exchange is limited, particularly in non-fertilized ecosystems such as Solleveld. Therefore, Γsoil (and Γlitter) measurements similar to the work by Wentworth et al. (2014) would be valuable. Additionally, flux measurements over bare soil would be useful, which could be utilized for improving our understanding regarding the significance of soil NH3 exchange, as well as for validating and revising Rsoil parameterization.
Auxiliary measurements that would help identify the emission sources at Solleveld, as well as in other ecosystems, include direct Γ measurements of the apoplasts, leaf surface water, soil, and litter to derive the compensation points per pathway. Ideally, these measurements would also be done over longer periods of time to understand seasonal and ecosystem-related influences on the Γ values. Moreover, H2O or CO2 fluxes could be measured parallel to NH3 flux measurements to serve as an indication for the stomatal conductance Gs (Schrader et al., 2020; Schulte et al., 2024). Such a setup will simplify isolating and determining the flux of each exchange pathway by subtracting the stomatal flux from the total flux, aiding in determining the magnitude of the external flux and soil flux, which are currently subject to the greatest uncertainty. This would also enable a derivation of a parameterization for Rw based on daytime measurements. The current parameterization of Rw has been based on nighttime flux data, possibly resulting in a systematic bias for nocturnal conditions, such as lower temperatures, higher RHs, and lower turbulence. Theoretically, soil fluxes could also have been estimated from the Solleveld dataset; however, after filtering for conditions when stomatal and external exchange are assumed to be limited (i.e. RH<71 and no solar radiation), only a small subset of data (n=88) was left which was too little to infer reliable claims about soil NH3 exchange.
4.2 Rw and external exchange
Given the importance of Rw, we further examine the key parameters involved in its calculation. Both the DEPAC and Massad schemes use the structure to determine Rw, whereas the Zhang scheme follows a slightly different framework. The parameters α and β play a crucial role in these parameterizations, yet their physical interpretation remains poorly understood. The α parameter indicates the minimal Rw resistance, and the β parameter can be described as the RH-response coefficient (Wichink Kruit, 2010). The Rw equations (also presented in Table 1) are as follows:
where SAI is the surface area index, α=2.0 s m−1 and β=12.
where α=31.5 s m−1, β=0.12, and AR is the acid : NH3 ratio. Note that β in the Massad scheme operates as a multiplier, whereas in DEPAC, it is a denominator.
where the minimum resistances of 100 s m−1 and 20 s m−1, for dry and wet conditions respectively, can be interpreted as an effective Rw,min, or α value.
The strong sensitivity of these two parameters can be seen both in the model intercomparison and the sensitivity analysis: the DEPAC scheme has the lowest α value of 2.0 s m−1, whereas the Massad scheme has the highest α of 31.5 s m−1, which results in a much stronger external flux in the DEPAC scheme (see Fig. 5g and h). Similarly, the sensitivity analysis revealed that propagation of the uncertainties of α and β led to strongly varying model outcomes (see Table 3).
To reduce the uncertainty of modelling NH3 exchange via the external leaf surface, it is essential to understand the underlying physical properties of the α and β parameters. Massad et al. (2010) discuss that α is impacted by the SO2:NH3 ratio, while the β parameter is affected by leaf hygroscopicity and aerosol deposition. They also supply α and β values derived from multiple measurement campaigns, revealing significant differences in these parameters both among different ecosystem types and within each type. The Massad scheme provides ecosystem-specific β values, albeit with great uncertainties where the standard deviations of β are almost equal to the β value itself. Options for improved Rw parameterization include a more diverse set of α and β values for different ecosystem types and pollution conditions or the formulation of parameterization to derive location-specific α and β values. The availability of significantly more NH3 flux measurements allows for revisiting the α and β parameters.
Big steps forward can be made by including χw parameterization in the Massad and Zhang schemes to account for the adsorption–desorption dynamics at the external leaf surface. Although χw parameterization is already included in the DEPAC scheme, it is not able to explicitly model NH3 re-emission from the external leaf surface as χw is a function of χa. Wentworth et al. (2016) found that 94 % of the NH3 emitted during the morning could be attributed to NH3 accumulated in the water layer overnight, indicating that NH3 re-emission is a phenomenon that should not be overlooked. Moreover, it is hard to properly interpret the specific “roles” of the Rw and χw parameters in the DEPAC scheme, and it may be possible to rely on compensation points alone to model the external flux. This requires further research.
The formula of Γw in the DEPAC scheme is empirically inferred from 3 years of flux measurements at the Haarweg grasslands site (Wichink Kruit et al., 2010). This parameterization is used across all land use classes, which could introduce a systematic bias when used for other land use classes: interspecies differences in the chemical composition of the water layer (e.g. caused by guttation) and differences in wettability caused by the wax content of the cuticula could result in variations in NH3 absorption among different plant species (Flechard et al., 1999). The effect of interspecies differences on NH3 external leaf layer exchange is understudied, but despite the knowledge gap, analyses can already be performed on existing flux datasets to validate whether the χw parameterization is accurate across different ecosystem types. Note that this was challenging for the Solleveld dataset, as the external compensation point could not be inferred from the measurements due to the inability to rule out soil NH3 exchange. Moreover, the χw values were inferred from micrometeorological measurements, which could contain considerable noise. Direct surface water measurements of Γw are scarce (Burkhardt et al., 2009; Sutton et al., 1995a; Wentworth et al., 2016), and for the development and calibration of more accurate parameterization of χw, measurements of Γw with a high temporal resolution would be valuable. Additionally, this dataset would be useful to infer whether micrometeorological inference is an accurate method for estimating Γw values.
Given the challenges of modelling NH3 exchange with the external leaf surface, we suggest moving beyond the static Rw parameterization by adopting a more mechanistic and dynamic modelling approach. Here, the inclusion of a memory effect could, for example, aid in modelling the NH3 re-emission that is often observed in the morning, as nighttime NH3 reservoirs in water layers are depleted, as discussed earlier in this section. Dynamic models for NH3 exchange have already been developed (Flechard et al., 1999; Sutton et al., 1998), which considers preceding fluxes, an adsorption charge, and leaf surface chemistry, which moderates NH3 solution due to saturation effects. Neirynck and Ceulemans (2008) found that the accuracy of the dynamic model from Sutton et al. (1998) had a better performance than a unidirectional model for Rw and was also able to model emission events. The latter is promising, as NH3 desorption from the external leaf layer is not modelled by any of the three exchange schemes in this study. The downside of the dynamic approach is that it requires additional input data such as surface water pH, which is generally unavailable; however, initial efforts can be made to estimate surface water pH. As mentioned previously, direct surface water measurements of Γw would be valuable for this purpose.
4.3 Relative humidity and temperature biases
In the DEPAC and Massad schemes, RH is a crucial parameter for estimating Rw. The sensitivity analysis for RH showed a significant impact on the mean modelled flux in both schemes, with changes of approximately ±15 % and ±30 % respectively (see Table 3). Therefore, precise RH equipment is essential for providing accurate input when modelling the NH3 fluxes and for properly analysing NH3 flux data when developing new parameterization. Although the influence of systematic differences in RH was analysed in the sensitivity analysis, the effect on the modelled NH3 flux was small.
The influence of the random error of the temperature measurement equipment of ±0.1 °C has also been analysed but remained small across all three exchange schemes. In contrast, the influence of systematic temperature changes inside and outside of the canopy was significant in the Massad scheme, which can be attributed to the inclusion of the βT parameter in Rw. Studies on typical temperature and RH profiles in dune ecosystems were not found, and the systematic uncertainties therefore had to be estimated. Hence, it is recommended to perform NH3 flux measurements together with RH or temperature profile measurements for different vegetation types, to determine the influence of neglecting these systematic differences in NH3 flux modelling.
Personne et al. (2009) elaborated further on these systematic temperature differences and coupled a deposition scheme to an energy budget model that explicitly models in-canopy temperatures. Their results indicate that systematic temperature variations should be explicitly considered in parameterization, particularly due to the exponential relationship between compensation points and temperature, as well as the relationship between stomatal conductance and temperature. However, while the sensitivity analysis shows that the Massad scheme is significantly affected by the systematic temperature difference, the net effect on the modelled flux is limited in the Zhang scheme and nearly zero in the DEPAC scheme. It must be noted that the uncertainty range used to test the sensitivity to systematic temperature difference of ±1 °C was fairly conservative. Personne et al. (2009) report on temperature differences exceeding more than 4 °C; propagating such temperature differences would likely lead to stronger variations in modelled fluxes.
4.4 Methodological constraints
Several limitations should be taken into account. First, the results and implications in this study are drawn from measurements at a dune ecosystem, and therefore it remains an open question whether these results apply to other ecosystems as well. It is recommended to extend this study across different ecosystem types, similar to analyses by Flechard et al. (2011) and Schrader et al. (2016).
Second, this study did not discuss the influence and contribution of soil exchange, as it was challenging to isolate the soil flux from the stomatal and external flux. This limitation prevented a deeper mechanistic analysis at Solleveld, where each exchange pathway could be quantitatively evaluated. This also implies that although the exchange schemes signal that the external flux is the most dominant flux at Solleveld, consistent with previous research (Hansen et al., 2013; Jones et al., 2007; Neirynck and Ceulemans, 2008; Wyers and Erisman, 1998), this does not necessarily mean it was the most dominant flux in reality. Incorporating auxiliary measurements of CO2 or H2O fluxes along with Γs, Γw, Γsoil and Γlitter, as discussed in Sect. 4.1, would address these issues. Additionally, directly inserting in situ Γ values into the model descriptions – rather than calculating the Γ using the model equations – would allow for a more targeted validation of the resistance parameterization. By using measured Γ values, errors related to the compensation point parameterization can be ruled out, making it easier to assess the accuracy of the resistance terms – assuming that the measured Γ values themselves are accurate. Consequently, this would enable the validation of Rw parameterization and evaluate whether a soil pathway should be incorporated in exchange schemes for dune ecosystems, as done in the Zhang scheme. Especially in ecosystems with low LAIs such as Solleveld, the contribution of soil exchange should be understood better. Moreover, this would aid in identifying the emission sources, which are currently not accounted for by any of the three schemes.
Third, several state-of-the-art models such as SURFATM-NH3 (Personne et al., 2009), CMAQ-EPIC (Pleim et al., 2019) and the dynamic model by Sutton et al. (1998) were not included in this study, as they required additional input parameters, which were unavailable or difficult to estimate. This touches upon the trade-off between a model's usability and accuracy, as more complex models might be more accurate but require extra input data, which are often not readily available. Fourth, specific parameterization for dunelands does not exist, and grasslands or semi-natural vegetation parameterization has been used across all schemes instead. Yet systematic differences between these land use classes and dunelands can lie in the LAI, the apoplastic ratio, the wettability of plant surfaces, and the potential presence of soil NH3 exchange. This also calls for expanding available land use classes in all three schemes (e.g. dunelands, heathlands, and moorlands) and conducting additional measurements to develop new parameterization. Fifth, due to the temporal resolution of the GRAHAM instrument of approximately 30 min (Wichink Kruit et al., 2010), and further aggregation to hourly averages in this study, sudden temporal features such as emission or deposition pulses can be smoothed out. This limitation can hinder the ability to accurately study diurnal dynamics and detect short-lived events such as emission pulses. Sixth, some meteorological input data such as temperature, RH, and radiation have not been measured at Solleveld but at a meteorological station at Valkenburg, which is approximately 20 km to the northeast, which can introduce inaccuracies in the model output due to local differences between the two locations. Seventh, although the uncertainty ranges for each input variable or model parameter defined for the uncertainty and sensitivity analysis were assessed with great care, decisions such as defining these ranges and the distribution type (i.e. normal, uniform, etc.) inevitably involved a degree of subjectivity, which could impact the outcome of the analyses. Moreover, the uncertainty analysis only accounts for the uncertainty in processes or variables that are explicitly included in the schemes, meaning the analysis will not capture the uncertainty of these excluded processes.
Eighth, as stated in the methods section, the Γsoil value in the Zhang scheme has been lowered from 2000 to 395. We acknowledge this is a modification to the Zhang scheme, which strongly alters the modelled output of the scheme; however, it is justifiable given the mismatch between the original parameterization and the empirical findings by Wentworth et al. (2014) for unfertilized ecosystems. With the original Γsoil value of 2000, the Zhang scheme (purple line) would strongly underestimate the deposition at Solleveld and even predicts a slight net emission (see Fig. 6). In addition, the effect of the Γsoil adaptation on the average diurnal cycle is displayed in Fig. A2.
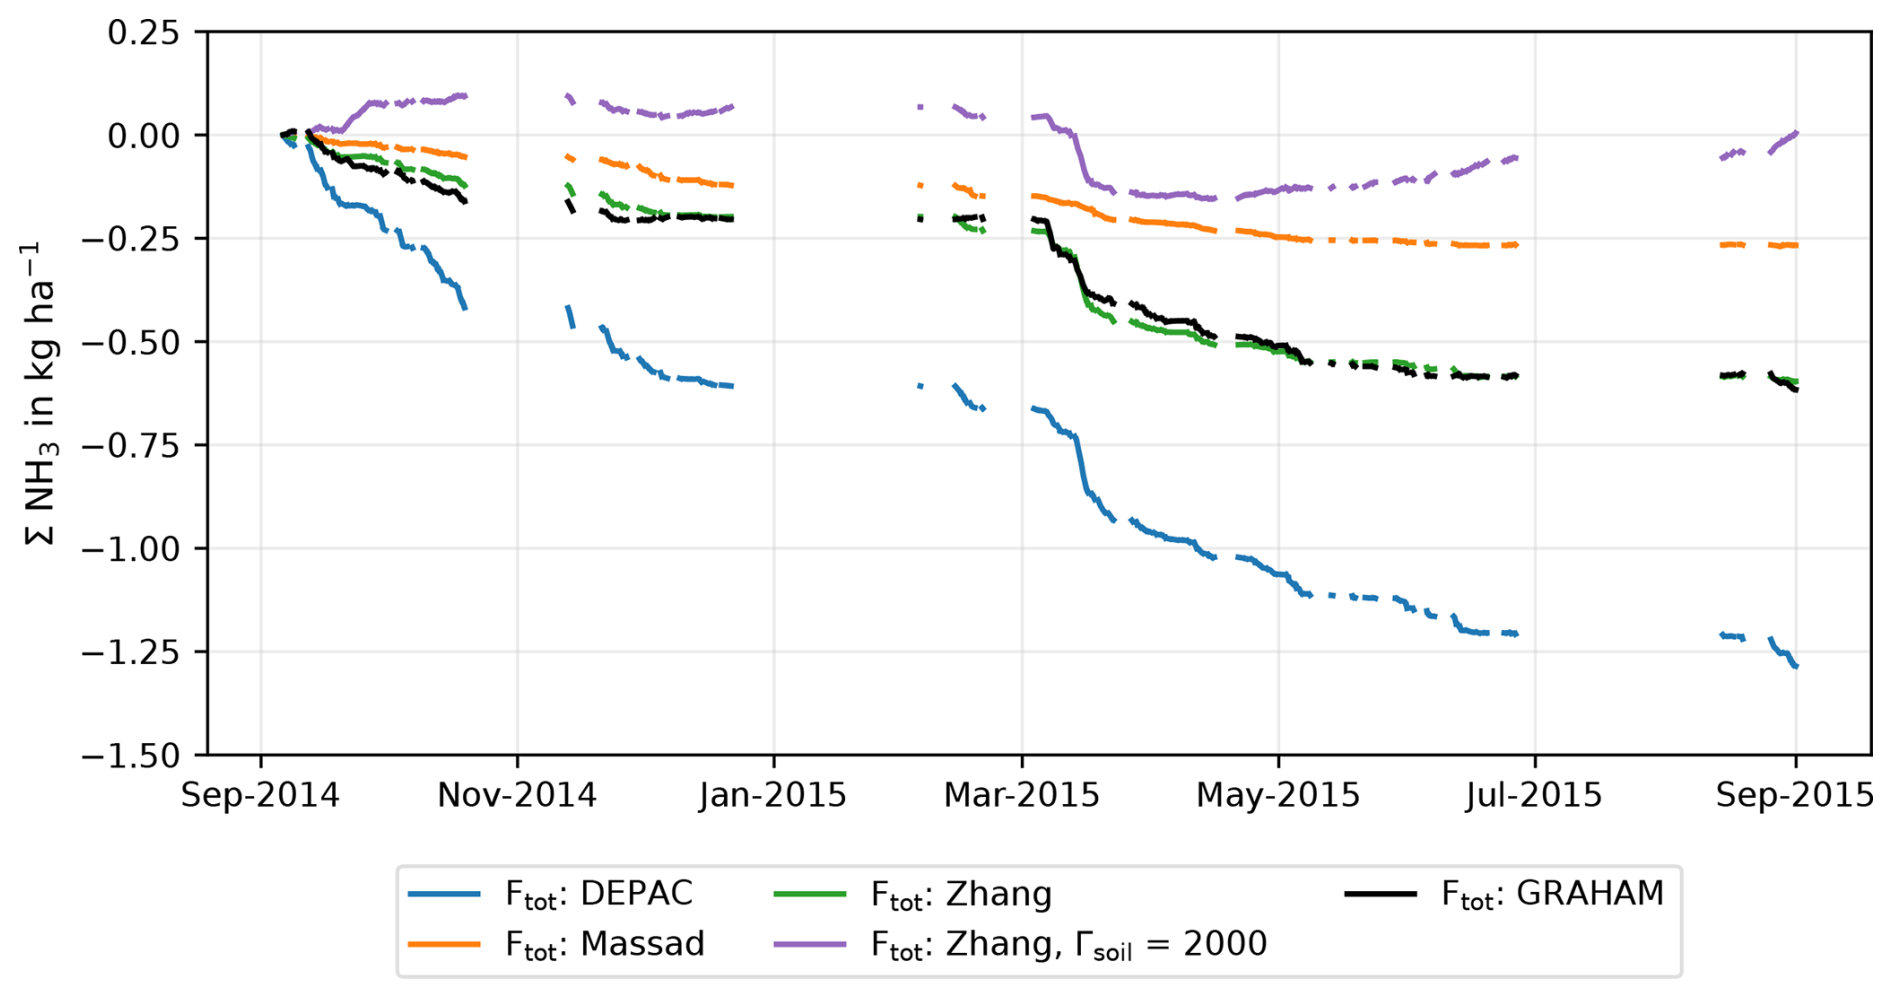
Figure 6Accumulated deposition at Solleveld during the measurement period, including the accumulated flux of the unmodified Zhang scheme with a Γsoil value of 2000.
Finally, the parameters in the surface exchange schemes stem from flux measurements and are empirically translated into parameterization. That means that generalization to different environmental circumstances or pollution climates can give different outcomes, as demonstrated by the differing results per exchange scheme in this study. Thus, more flux measurements across a range of environmental conditions are necessary.
This study aimed to determine the accuracy of three state-of-the-art NH3 exchange schemes in a dune ecosystem and to identify the key factors that contribute to model uncertainties. The results of this study indicate that the performance of the exchange schemes differed significantly at the Solleveld dune site: both on hourly and monthly timescales. The Zhang scheme accurately models the NH3 exchange, whereas the DEPAC and Massad schemes respectively overestimate and underestimate the total deposition. However, the Zhang scheme does not capture the average daily cycle well: the DEPAC scheme captures this most realistically. The results also reveal that the exchange with the external leaf layer is the most important exchange pathway in all exchange schemes, which is in coherence with previous studies (e.g. Erisman and Wyers, 1993; Burkhardt et al., 2009). A serious flaw identified among all three models is that the frequent emission events at Solleveld are poorly modelled, implying that the compensation point parameterization is ineffective. The sensitivity analysis of individual model parameters demonstrates that the biggest portion of the uncertainty can be attributed to the model uncertainty in the Rw parameterization and the compensation point modelling. The findings of these analyses provide additional quantification of the model uncertainties and corroborate the findings of Schrader et al. (2016), who also highlighted the difficulties in modelling Rw. Additionally, the sensitivity analysis has shown that the random bias in RH measurements can lead to strong fluctuations in the modelled fluxes in the DEPAC and Massad schemes. The effect of propagating systematic temperature differences inside and outside the canopy only led to strong effects on the modelled flux in the Massad scheme. Similarly, the net effect of a potentially higher RH in the canopy was minimal in all three schemes.
To address these uncertainties, we recommend conducting additional external leaf water measurements to quantify Γw to better understand the adsorption–desorption processes taking place at the wet leaf surfaces and to calibrate and improve the parameterization of Γw. Furthermore, auxiliary measurements of H2O or CO2 fluxes as a proxy for stomatal conductance can aid in isolating the stomatal, external, and soil fluxes from each other, making it easier to estimate the contribution per exchange pathway. Moreover, although the external leaf pathway is identified as a crucial pathway in NH3 exchange, the soil pathway remains understudied. Additional measurements of Γsoil and measurements over bare soil to validate Rsoil parameterization would be viable for reducing the modelling uncertainty.
Future research should focus on improving our understanding of the mechanisms controlling NH3 exchange with the external leaf layer, as this process is pivotal for accurate NH3 exchange modelling. Environmental factors influencing the α and β parameters here are key. Additionally, despite the relevance of NH3 desorption from the external leaf surface, it is not explicitly included in either of the three exchange schemes in this study. Dynamic models simulating external leaf surface fluxes can be an effective alternative to the current Rw parameterization methods, and promising work in dynamic modelling of leaf surface NH3 exchange (Sutton et al., 1998; Flechard et al., 1999; Burkhardt et al., 2009) should be further pursued.
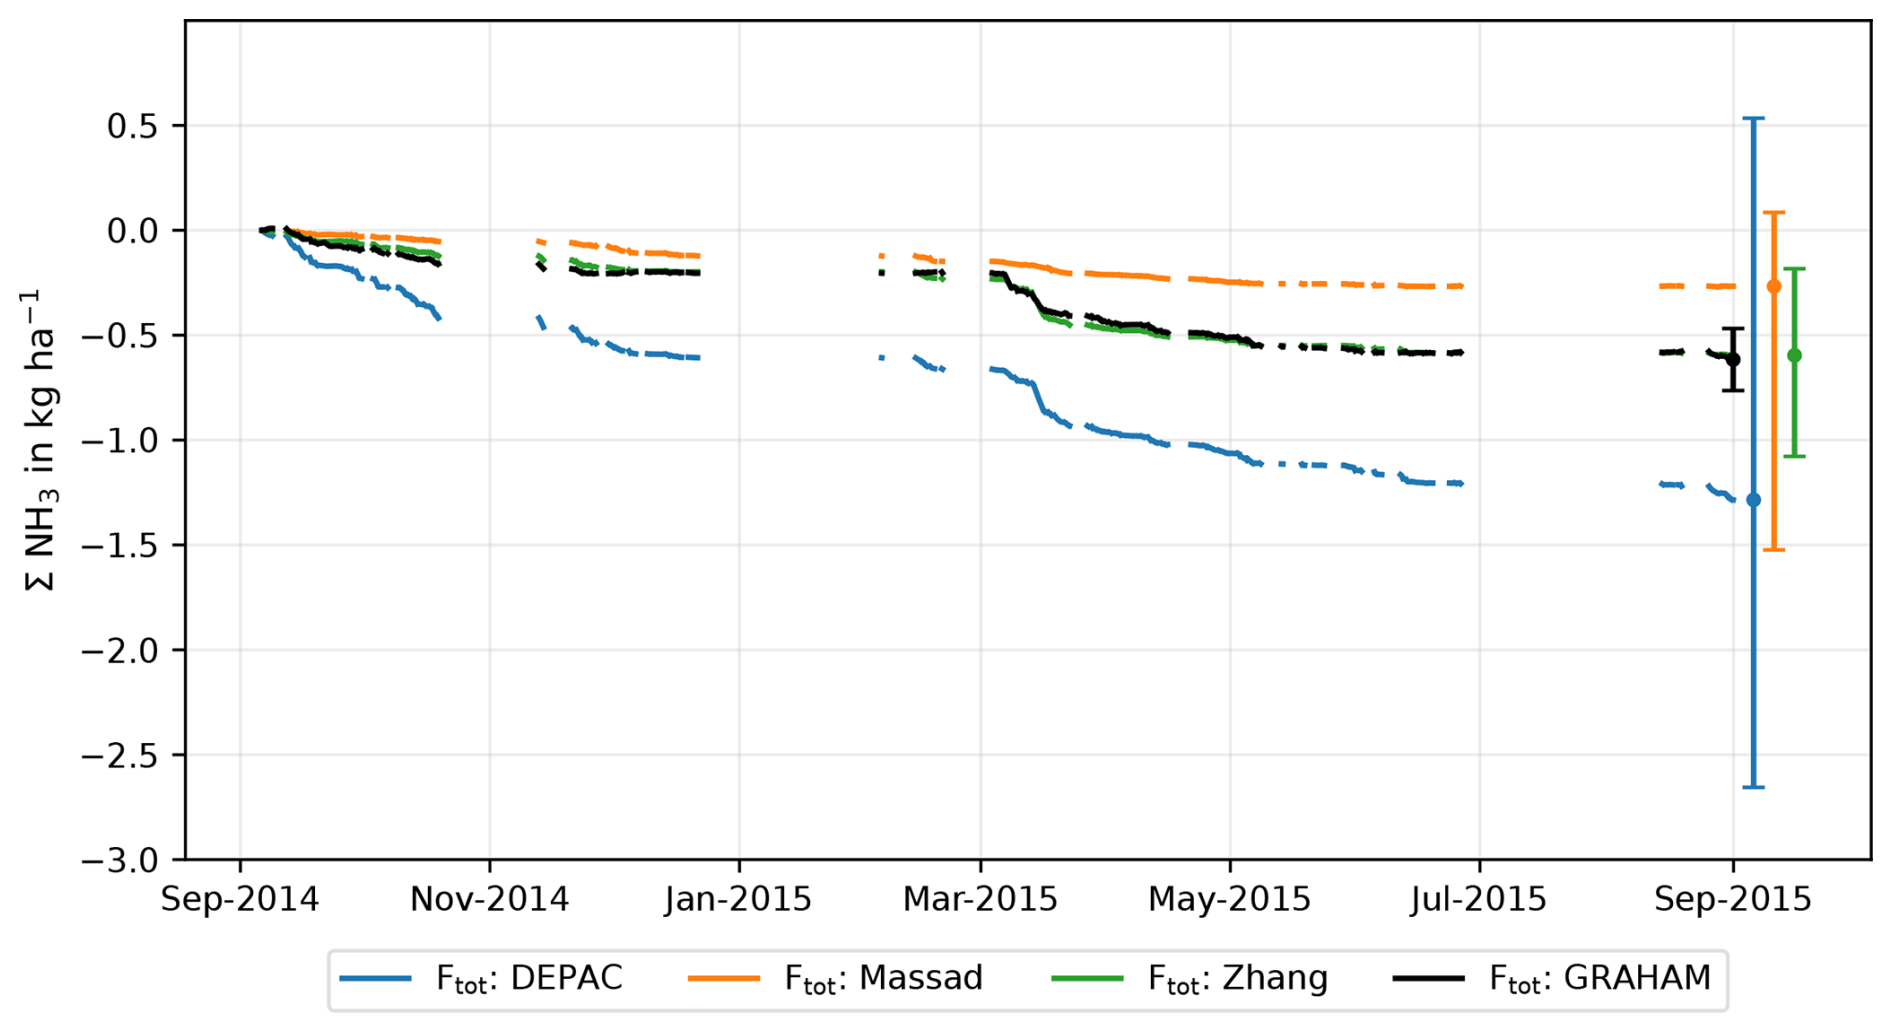
Figure A1Accumulated deposition at Solleveld during the measurement period. The error bars on the right represent the uncertainty range (95 % CI) of the schemes, calculated by the Monte Carlo uncertainty analysis.
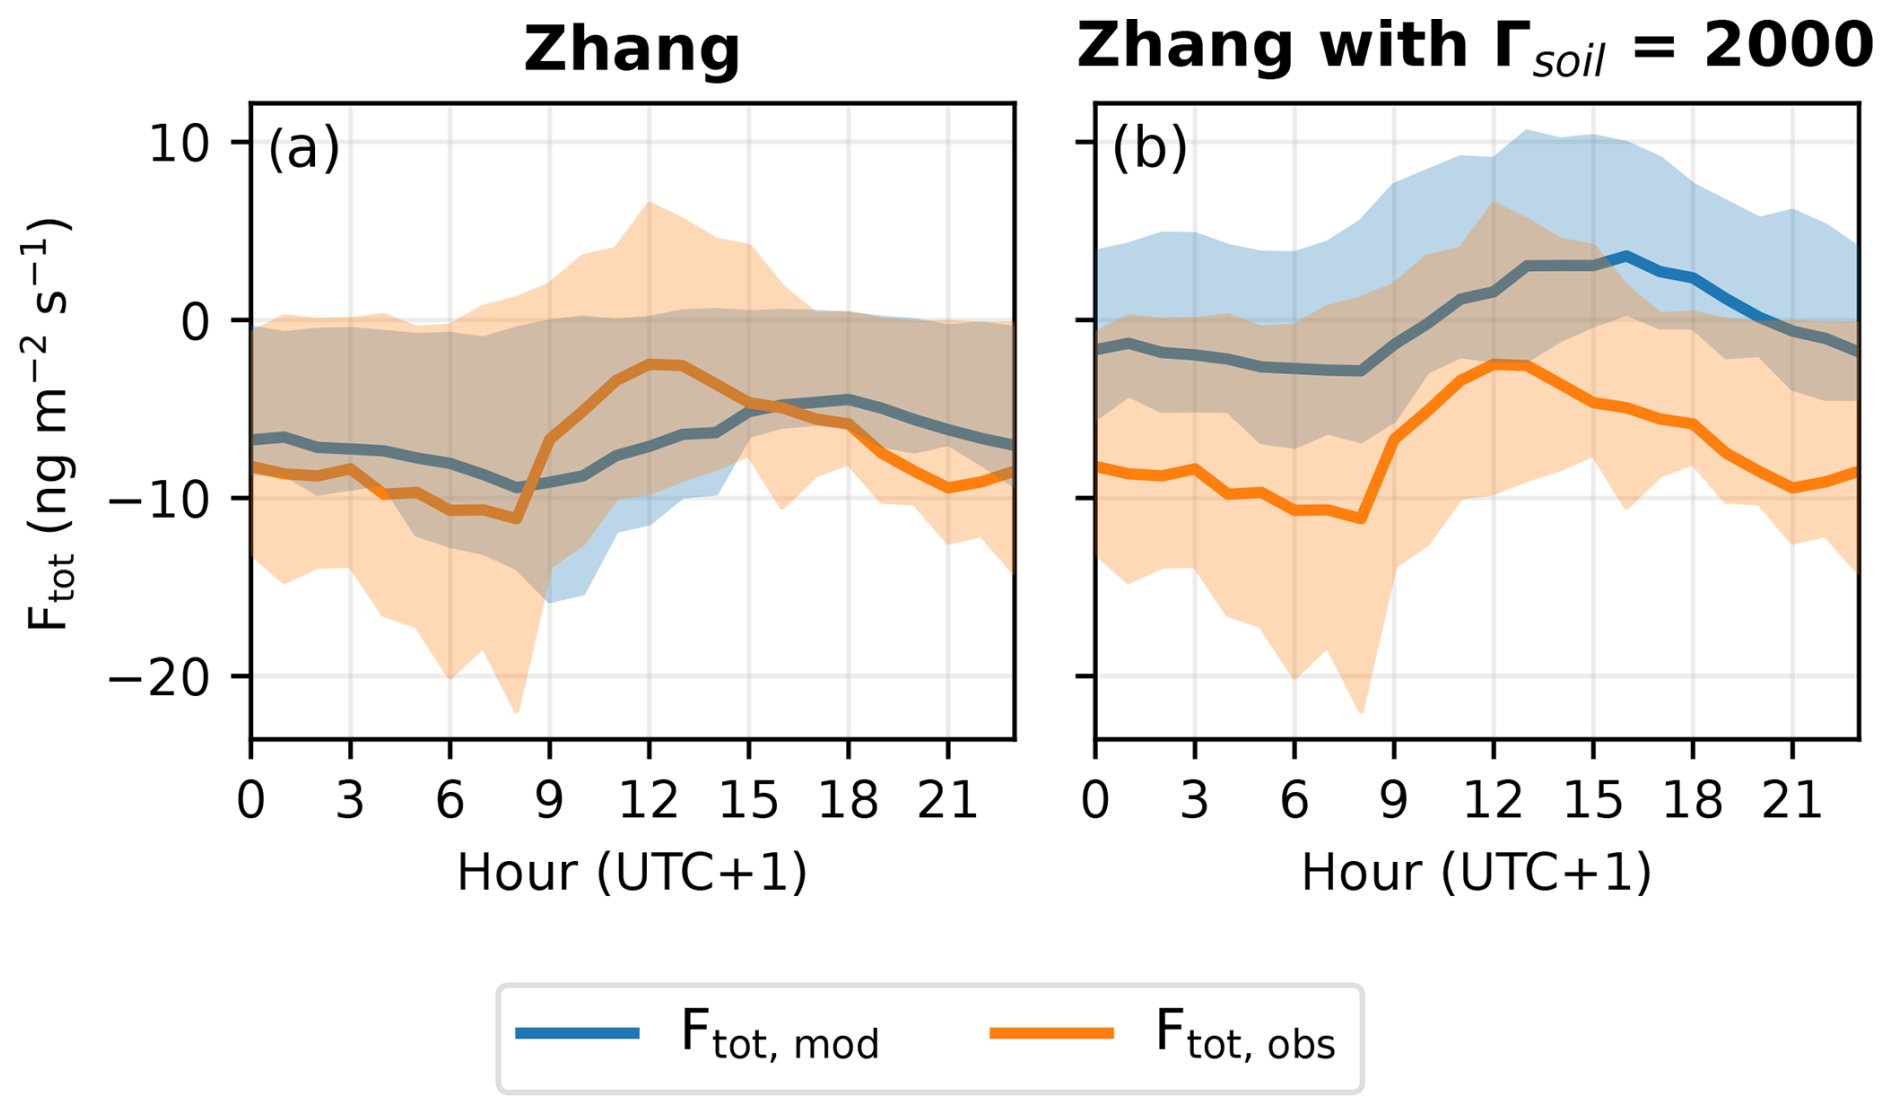
Figure A2Modelled and observed average diurnal cycle of the Zhang scheme at Solleveld, comparing the adjusted parameterization used in this study (a) to the original parameterization with a Γsoil of 2000 (b).
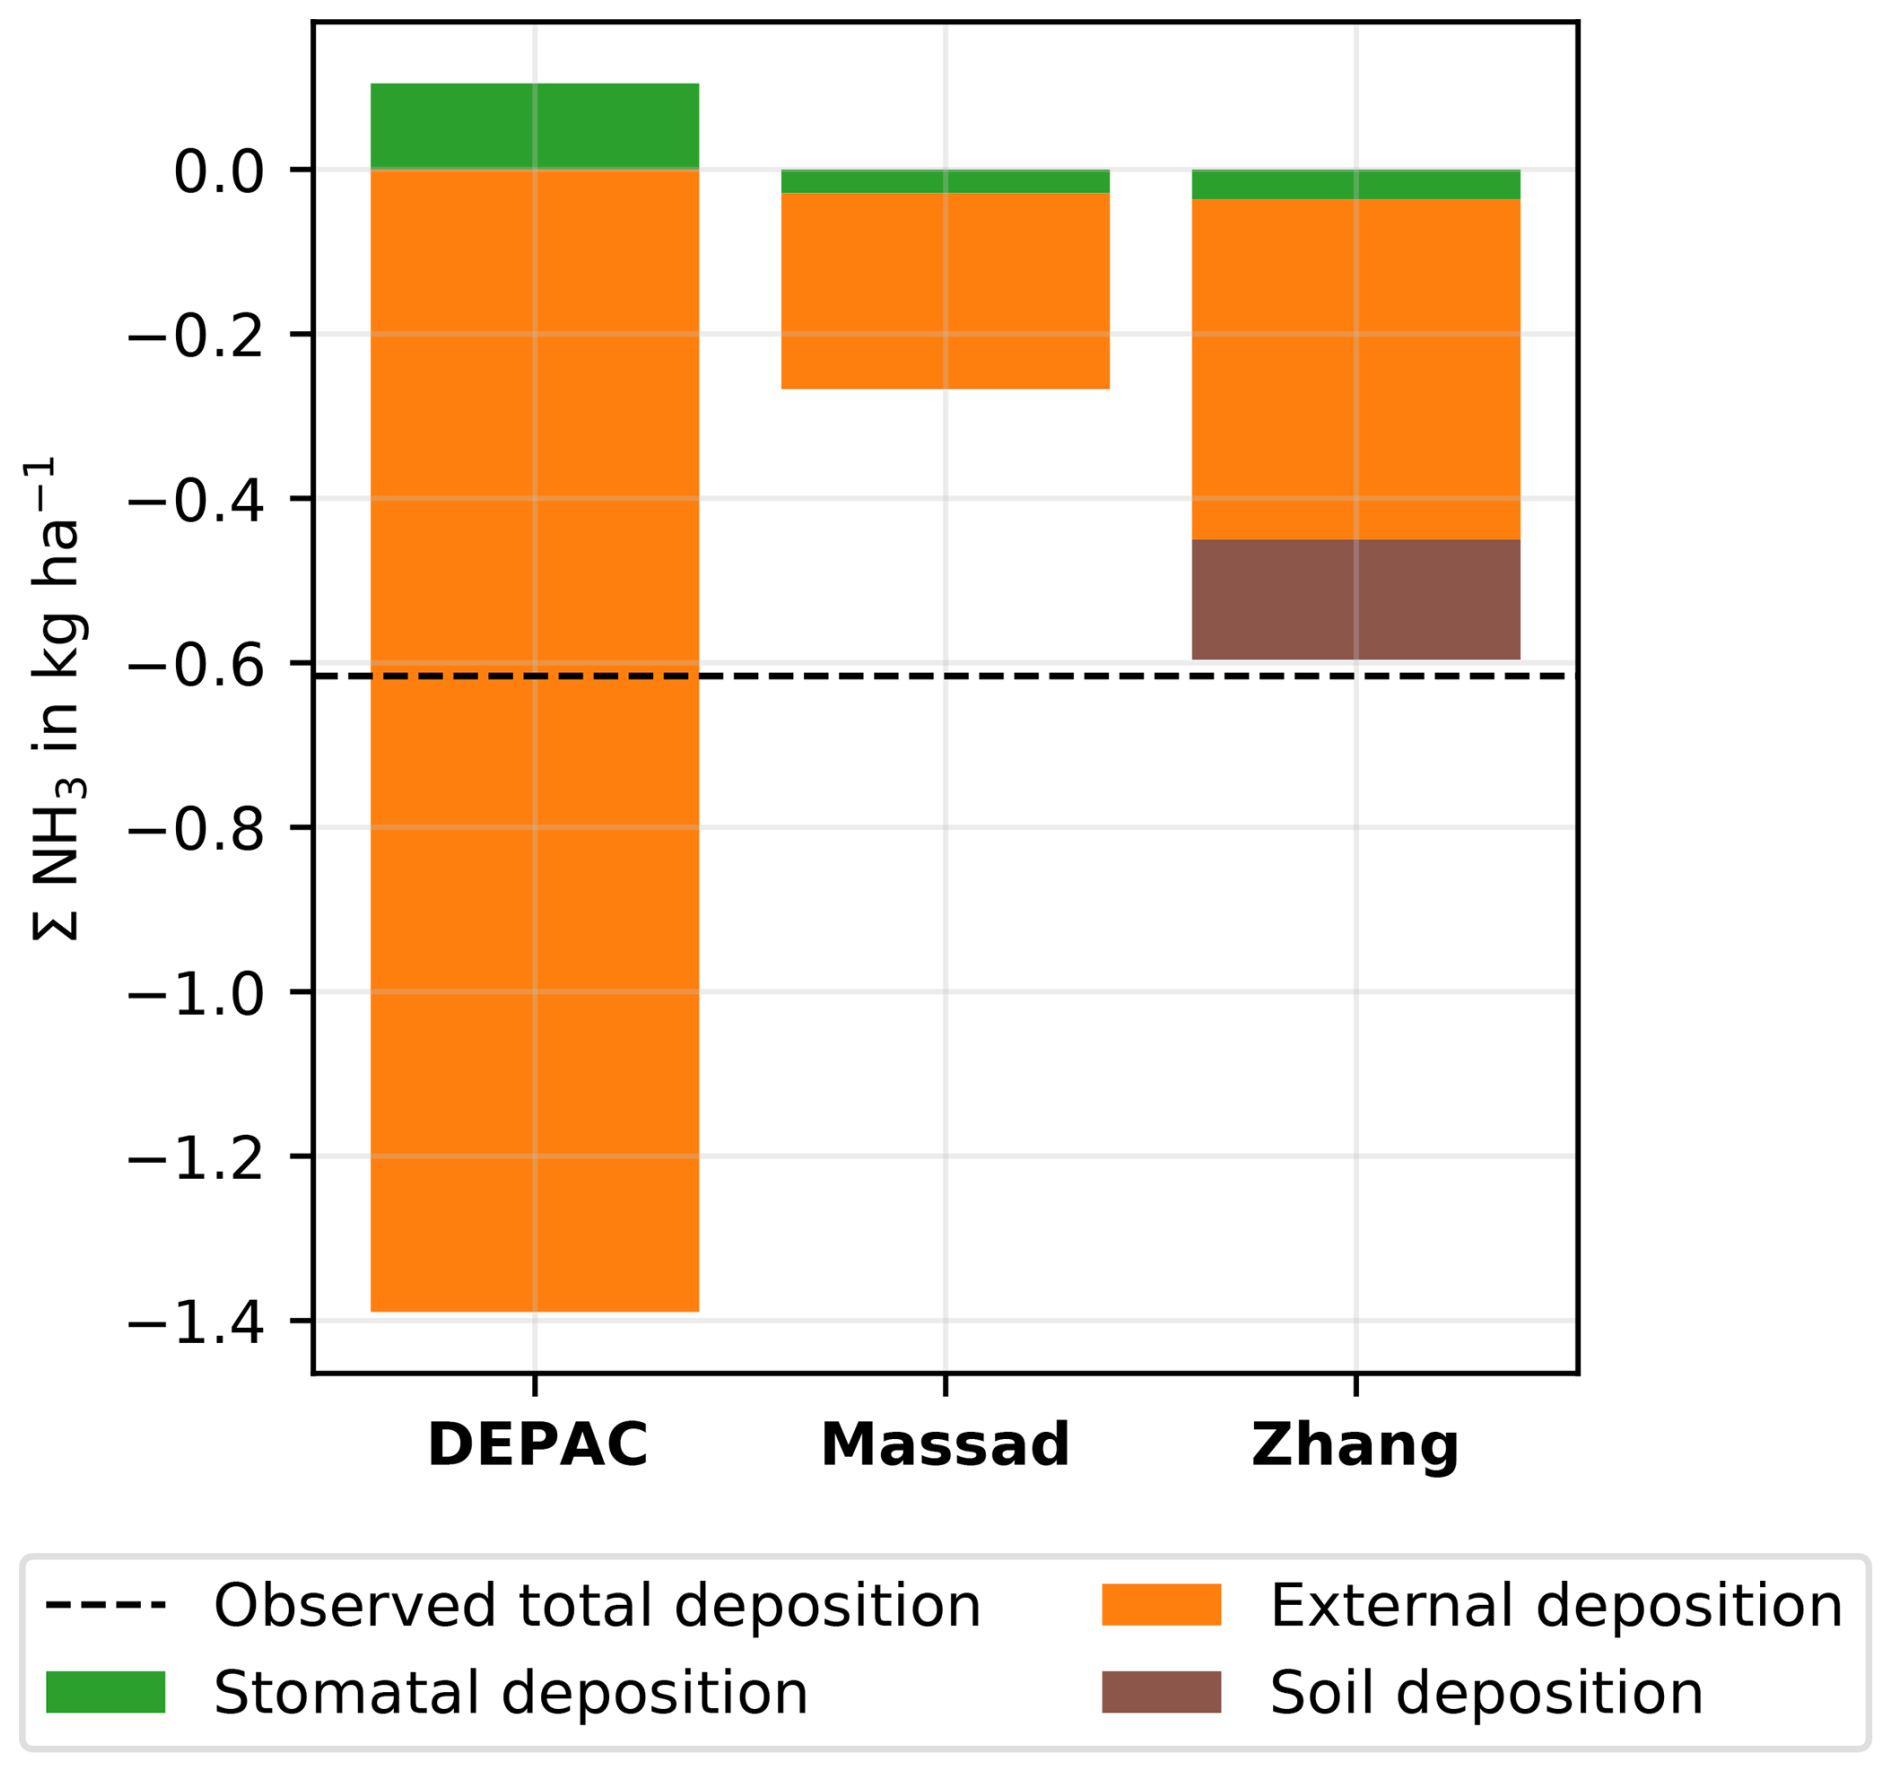
Figure A3Accumulated flux per exchange pathway at Solleveld per exchange scheme. Note that the DEPAC scheme models net stomatal emission, hence the positive value. The striped line depicts the total deposition measured with the GRAHAM at Solleveld.
Table A1Input variables and model parameters and the bias categories, the associated uncertainty (1σ), the lower and upper bound values, and the chosen distribution functions. The lower and upper bounds represent the 2σ values, forming the 95 % confidence interval.
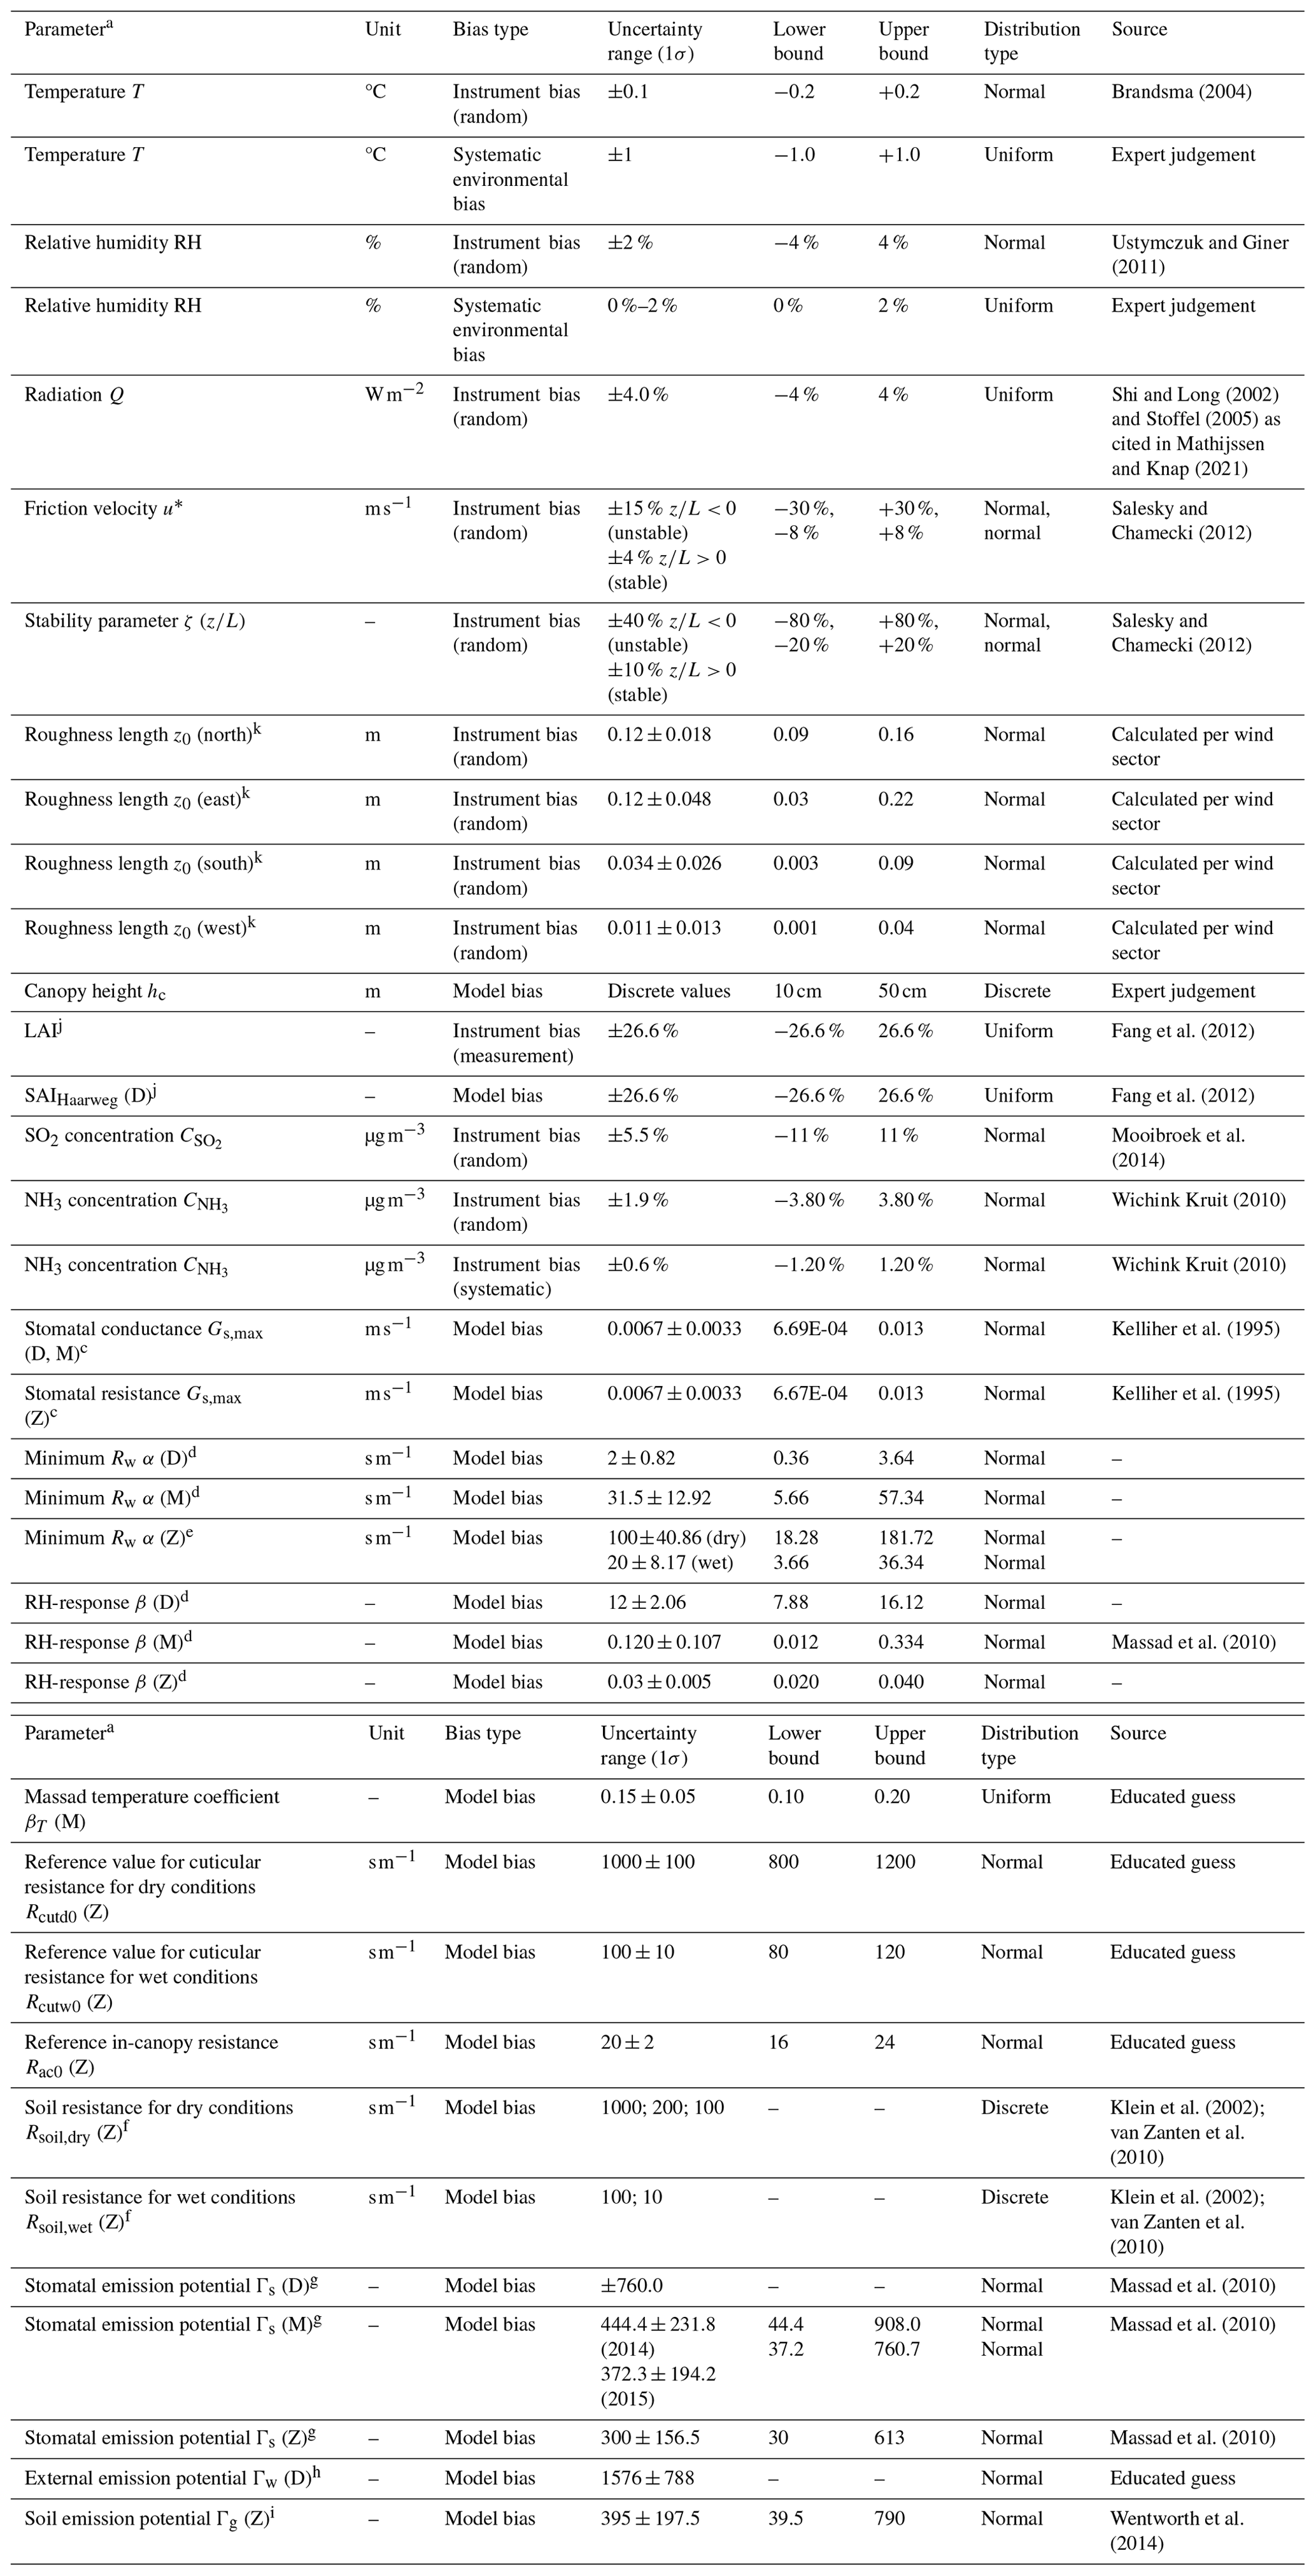
a The D, M, or Z in parentheses denotes the DEPAC, Massad, or Zhang scheme respectively. b For some variables, the lower bound would become negative, which is physically impossible (e.g. for Gs,max or the roughness length). In these cases, the lower value was capped at 10 % of the base value. c Kelliher et al. (1995) reported a Gs,max of 0.008 with a standard deviation σ of 0.004, from which a coefficient of variation () of 0.5 is calculated. This CV is subsequently used to define the and the variability space for Gs,max in the three exchange schemes. d The uncertainty ranges of the α and β parameters used in Rw are based on the data from van Hove et al. (1989) and Benner et al. (1992). These data are also displayed in Fig. 4 in Sutton et al. (1995b), from which the α and β values of 2 s m−1 and 12 s m−1 respectively are derived. Note that these parameter values are also used in the DEPAC scheme. A curve has been fitted to this dataset in Python using SciPy's curve_fit function, which supplied a covariance matrix. Consequently, the standard deviations of the α and β parameters were determined. From this, the CVα=0.41 and CVβ=0.17 were calculated. Using these CVs, the σα and σβ were calculated for α and β per scheme. For σβ,Massad, the standard deviation reported by Massad et al. (2010, p. 10379) is used instead. Note that slightly different parameters for α and β were found with the curve_fit function in this study compared to the values reported by Sutton et al. (1995b), but uncertainty ranges have been scaled proportionally to the original α and β values found by Sutton et al. (1995b). e The Zhang scheme does not explicitly have an α value but has a cut-off value of 100 s m−1 and 20 s m−1 for dry and wet conditions respectively, which can be interpreted as an α value. The CVα of 0.41 is used to derive the standard deviation applied to these cut-off values. f The constant Rsoil parameter for dry and wet conditions is randomly replaced with Rsoil values for dry and wet conditions used in the Zhang, DEPAC, and MATCH schemes (Klein et al., 2002; van Zanten et al., 2010). g From Table 3 in Massad et al. (2010), measured Γs values from different studies are listed together with the uncertainty range. From this, an average CVΓs=0.52 is derived. This CVΓs is also used to derive the σ of Γs in the DEPAC and Zhang schemes. The standard deviation of Γs in the DEPAC scheme is derived from the mean modelled Γs at Solleveld (=1461.5), leading to a standard deviation of 760. h The CVΓw in the DEPAC scheme is assumed here to be of the same order of magnitude as CVΓs and CVΓsoil, which are 0.52 and 0.50 respectively. Therefore, CVΓw is estimated here as 0.5. Based on a mean Γw of 1576 at Solleveld, a standard deviation of 788 has been derived. i A CVΓsoil of 0.5 has been derived from Γsoil data from a non-fertilized grassland (Wentworth et al., 2014). From the Γsoil (=395) in the Zhang scheme, a standard deviation of 197.5 has been derived. j The leaf area index (LAI) has been altered according to Vendel et al. (2023) to a minimum LAI of 0.5 and a maximum LAI of 1.0. These values have been derived from MODIS LAI data. Fang et al. (2012) derive a relative uncertainty of 26.6 % for the MODIS LAI product. For consistency, this value has also been used for the SAIHaarweg parameter used in the DEPAC scheme. k As in Vendel et al. (2023), roughness lengths are wind sector dependent, accounting for the heterogenous footprint of Solleveld, and are calculated with the u∗ measurements from the sonic anemometer, according to Moene and van Dam (2016, p. 119). The standard deviation of the z0 per wind sector is used to describe the uncertainty in z0.
The code for the model output analysis, the uncertainty analysis, the sensitivity analysis, and the creation of the figures in this study can be accessed from the following Zenodo repository: https://doi.org/10.5281/zenodo.14938114 (Jongenelen et al., 2025).
The Solleveld measurements can be accessed from the following Zenodo repository: https://doi.org/10.21945/566085A2-A00F-4E0A-833D-3FCF975027D2 (Vendel et al., 2025).
TJ: conceptualization, methodology, formal analysis, software, visualization, writing (original draft preparation as well as review and editing). MvZ: conceptualization, methodology, supervision, writing (original draft preparation as well as review and editing). ED: conceptualization, methodology, supervision, writing (original draft preparation as well as review and editing). RWK: writing (review and editing). AH: investigation, writing (review and editing). LG: software, writing (review and editing). JWE: conceptualization, methodology, supervision, writing (original draft preparation as well as review and editing).
The contact author has declared that none of the authors has any competing interests.
Publisher's note: Copernicus Publications remains neutral with regard to jurisdictional claims made in the text, published maps, institutional affiliations, or any other geographical representation in this paper. While Copernicus Publications makes every effort to include appropriate place names, the final responsibility lies with the authors.
Special thanks go to Kim Vendel for her assistance in interpreting and clarifying the Solleveld measurements and to Cor Jacobs for his guidance on the Fortran code of DEPAC 1D. We also thank the two anonymous referees for their valuable input.
This research has been funded by the Dutch Ministry of Agriculture, Nature and Food Quality (LNV) as part of the National Knowledge Program Nitrogen (Nationaal Kennisprogramma Stikstof – NKS).
This paper was edited by Leiming Zhang and reviewed by two anonymous referees.
Benner, W. H., Ogorevc, B., and Novakov, T.: Oxidation of SO2 in thin water films containing NH3, Atmos. Environ. A-Gen., 26, 1713–1723, https://doi.org/10.1016/0960-1686(92)90069-W, 1992.
Brandsma, T.: Parallel air temperature measurements at the KNMI-terrain in De Bilt (the Netherlands) May 2003–April 2005, KNMI, https://www.knmi.nl/kennis-en-datacentrum/publicatie/parallel-air-temperature-measurements-at-the-knmi-terrain-in (last access: 12 April 2024), 2004.
Burkhardt, J., Flechard, C. R., Gresens, F., Mattsson, M., Jongejan, P. A. C., Erisman, J. W., Weidinger, T., Meszaros, R., Nemitz, E., and Sutton, M. A.: Modelling the dynamic chemical interactions of atmospheric ammonia with leaf surface wetness in a managed grassland canopy, Biogeosciences, 6, 67–84, https://doi.org/10.5194/bg-6-67-2009, 2009.
Bytnerowicz, A., Johnson, R. F., Zhang, L., Jenerette, G. D., Fenn, M. E., Schilling, S. L., and Gonzalez-Fernandez, I.: An empirical inferential method of estimating nitrogen deposition to Mediterranean-type ecosystems: the San Bernardino Mountains case study, Environ. Pollut., 203, 69–88, https://doi.org/10.1016/j.envpol.2015.03.028, 2015.
Chen, J. and GEM-MACH Development Team: GEM-MACH CFFEPS rev m3848_CFFEPS, Zenodo [code], https://doi.org/10.5281/zenodo.2579386, 2019.
David, M., Loubet, B., Cellier, P., Mattsson, M., Schjoerring, J. K., Nemitz, E., Roche, R., Riedo, M., and Sutton, M. A.: Ammonia sources and sinks in an intensively managed grassland canopy, Biogeosciences, 6, 1903–1915, https://doi.org/10.5194/bg-6-1903-2009, 2009.
Dyer, A. J.: A review of flux-profile relationships, Bound.-Lay. Meteorol., 7, 363–372, https://doi.org/10.1007/BF00240838, 1974.
Emberson, L., Simpson, D., Tuovinen, J., Ashmore, M., and Cambridge, H.: Towards a model of ozone deposition and stomatal uptake over Europe, MSC-W, Norwegian Meteorological Institute, https://emep.int/publ/reports/2000/dnmi_note_6_2000.pdf (last access: 20 October 2024), 2000.
Erisman, J. W. and Wyers, G. P.: Continuous measurements of surface exchange of SO2 and NH3, Implications for their possible interaction in the deposition process, Atmos. Environ. A-Gen., 27, 1937–1949, https://doi.org/10.1016/0960-1686(93)90266-2, 1993.
Famulari, D., Fowler, D., Hargreaves, K., Milford, C., Nemitz, E., Sutton, M. A., and Weston, K.: Measuring eddy covariance fluxes of ammonia using tunable diode laser absorption spectroscopy, Water Air Soil Poll. Focus, 4, 151–158, https://doi.org/10.1007/s11267-005-3025-9, 2005.
Fang, H., Wei, S., Jiang, C., and Scipal, K.: Theoretical uncertainty analysis of global MODIS, CYCLOPES, and GLOBCARBON LAI products using a triple collocation method, Remote Sens. Environ., 124, 610–621, https://doi.org/10.1016/j.rse.2012.06.013, 2012.
Farquhar, G. D., Firth, P. M., Wetselaar, R., and Weir, B.: On the Gaseous Exchange of Ammonia between Leaves and the Environment: Determination of the Ammonia Compensation Point, Plant Physiol., 66, 710–714, https://doi.org/10.1104/pp.66.4.710, 1980.
Flechard, C. R., Fowler, D., Sutton, M. A., and Cape, J. N.: A dynamic chemical model of bi-directional ammonia exchange between semi-natural vegetation and the atmosphere, Q. J. Roy. Meteor. Soc., 125, 2611–2641, https://doi.org/10.1002/qj.49712555914, 1999.
Flechard, C. R., Nemitz, E., Smith, R. I., Fowler, D., Vermeulen, A. T., Bleeker, A., Erisman, J. W., Simpson, D., Zhang, L., Tang, Y. S., and Sutton, M. A.: Dry deposition of reactive nitrogen to European ecosystems: a comparison of inferential models across the NitroEurope network, Atmos. Chem. Phys., 11, 2703–2728, https://doi.org/10.5194/acp-11-2703-2011, 2011.
Flechard, C. R., Massad, R.-S., Loubet, B., Personne, E., Simpson, D., Bash, J. O., Cooter, E. J., Nemitz, E., and Sutton, M. A.: Advances in understanding, models and parameterizations of biosphere-atmosphere ammonia exchange, Biogeosciences, 10, 5183–5225, https://doi.org/10.5194/bg-10-5183-2013, 2013.
Galloway, J. N., Aber, J. D., Erisman, J. W., Seitzinger, S. P., Howarth, R. W., Cowling, E. B., and Cosby, B. J.: The Nitrogen Cascade, BioScience, 53, 341, https://doi.org/10.1641/0006-3568(2003)053[0341:TNC]2.0.CO;2, 2003.
Hansen, K., Sørensen, L. L., Hertel, O., Geels, C., Skjøth, C. A., Jensen, B., and Boegh, E.: Ammonia emissions from deciduous forest after leaf fall, Biogeosciences, 10, 4577–4589, https://doi.org/10.5194/bg-10-4577-2013, 2013.
Hicks, B. B., Baldocchi, D. D., Meyers, T. P., Hosker, R. P., and Matt, D. R.: A preliminary multiple resistance routine for deriving dry deposition velocities from measured quantities, Water Air Soil Poll., 36, 311–330, https://doi.org/10.1007/BF00229675, 1987.
Holtslag, A. A. M. and De Bruin, H. A. R.: Applied Modeling of the Nighttime Surface Energy Balance over Land, J. Appl. Meteorol., 27, 689–704, https://doi.org/10.1175/1520-0450(1988)027<0689:AMOTNS>2.0.CO;2, 1988.
Hoogerbrugge, R., Braam, M., Siteur, K., Jacobs, C., and Hazelhorst, S.: Uncertainty in the determined nitrogen deposition in the Netherlands, Status report 2023, National Institute for Public Health and the Environment, Bilthoven, https://doi.org/10.21945/RIVM-2022-0085, 2024.
Horváth, L., Asztalos, M., Führer, E., Mészáros, R., and Weidinger, T.: Measurement of ammonia exchange over grassland in the Hungarian Great Plain, Agr. Forest Meteorol., 130, 282–298, https://doi.org/10.1016/j.agrformet.2005.04.005, 2005.
Jones, M. R., Leith, I. D., Raven, J. A., Fowler, D., Sutton, M. A., Nemitz, E., Cape, J. N., Sheppard, L. J., and Smith, R. I.: Concentration-dependent NH3 deposition processes for moorland plant species with and without stomata, Atmos. Environ., 41, 8980–8994, https://doi.org/10.1016/j.atmosenv.2007.08.015, 2007.
Jongenelen, T., van Zanten, M., Dammers, E., Wichink Kruit, R., Hensen, A., Geers, L., and Erisman, J. W.: Data and and code for “Validation and uncertainty quantification of three state-of-the-art ammonia surface exchange schemes using NH3 flux measurements in a dune ecosystem”, Zenodo [code], https://doi.org/10.5281/zenodo.14938114, 2025.
Kelliher, F. M., Leuning, R., Raupach, M. R., and Schulze, E.-D.: Maximum conductances for evaporation from global vegetation types, Agr. Forest Meteorol., 73, 1–16, https://doi.org/10.1016/0168-1923(94)02178-M, 1995.
Klein, T., Bergström, R., and Persson, C.: Parameterization of dry deposition in MATCH, SMHI, https://www.smhi.se/en/publications-from-smhi/publications/2002-11-01-parameterization-of-dry-deposition-in-match (last access: 12 April 2024), 2002.
KNMI: Toename in zwaveldioxide in Nederland door vulkaanuitbarstingen IJsland 2014, https://www.knmi.nl/kennis-en-datacentrum/achtergrond/, toename-in-zwaveldioxide-in-nederland-in-september-2014-ten-gevolge-van-de-holuhraun-vulkanische-erupties-op-ijsland (last access: 13 June 2024), 2024.
Massad, R.-S., Nemitz, E., and Sutton, M. A.: Review and parameterisation of bi-directional ammonia exchange between vegetation and the atmosphere, Atmos. Chem. Phys., 10, 10359–10386, https://doi.org/10.5194/acp-10-10359-2010, 2010.
Mathijssen, T. and Knap, W.: Pyranometer intercomparison at the BSRN site in Cabauw, the Netherlands, KNMI, De Bilt, https://www.knmi.nl/kennis-en-datacentrum/publicatie/pyranometer-intercomparison-at-the-bsrn-site-in-cabauw-the (last access: 12 April 2024), 2021.
Moene, A. F. and van Dam, J. C.: Transport in the Atmosphere-Vegetation-Soil Continuum, Cambridge University Press, Cambridge, https://doi.org/10.1017/CBO9781139043137, 2016.
Mooibroek, D., Berkhout, J. P. J., and Hoogerbrugge, R.: Jaaroverzicht Luchtkwaliteit 2013, National Institute for Public Health and the Environment, Bilthoven, https://www.rivm.nl/publicaties/jaaroverzicht-luchtkwaliteit-2013 (last access: 29 May 2024), 2014.
Neirynck, J. and Ceulemans, R.: Bidirectional ammonia exchange above a mixed coniferous forest, Environ. Pollut., 154, 424–438, https://doi.org/10.1016/j.envpol.2007.11.030, 2008.
Nemitz, E., Sutton, M. A., Gut, A., San José, R., Husted, S., and Schjoerring, J. K.: Sources and sinks of ammonia within an oilseed rape canopy, Agr. Forest Meteorol., 105, 385–404, https://doi.org/10.1016/S0168-1923(00)00205-7, 2000.
Nemitz, E., Milford, C., and Sutton, M. A.: A two-layer canopy compensation point model for describing bi-directional biosphere-atmosphere exchange of ammonia, Q. J. Roy. Meteor. Soc., 127, 815–833, https://doi.org/10.1002/qj.49712757306, 2001.
Paulson, C. A.: The Mathematical Representation of Wind Speed and Temperature Profiles in the Unstable Atmospheric Surface Layer, J. Appl. Meteorol., 9, 857–861, https://doi.org/10.1175/1520-0450(1970)009<0857:TMROWS>2.0.CO;2, 1970.
Personne, E., Loubet, B., Herrmann, B., Mattsson, M., Schjoerring, J. K., Nemitz, E., Sutton, M. A., and Cellier, P.: SURFATM-NH3: a model combining the surface energy balance and bi-directional exchanges of ammonia applied at the field scale, Biogeosciences, 6, 1371–1388, https://doi.org/10.5194/bg-6-1371-2009, 2009.
Pleim, J. E., Ran, L., Appel, W., Shephard, M. W., and Cady-Pereira, K.: New Bidirectional Ammonia Flux Model in an Air Quality Model Coupled With an Agricultural Model, J. Adv. Model. Earth Sy., 11, 2934–2957, https://doi.org/10.1029/2019MS001728, 2019.
RIVM: Archief van voorgaande GDN rondes, https://www.rivm.nl/gcn-gdn-kaarten/depositiekaarten/downloaden/archief (last access: 29 May 2024), 2024.
Salesky, S. T. and Chamecki, M.: Random Errors in Turbulence Measurements in the Atmospheric Surface Layer: Implications for Monin–Obukhov Similarity Theory, J. Atmos. Sci., 69, 3700–3714, https://doi.org/10.1175/JAS-D-12-096.1, 2012.
Schrader, F., Brümmer, C., Flechard, C. R., Wichink Kruit, R. J., van Zanten, M. C., Zöll, U., Hensen, A., and Erisman, J. W.: Non-stomatal exchange in ammonia dry deposition models: comparison of two state-of-the-art approaches, Atmos. Chem. Phys., 16, 13417–13430, https://doi.org/10.5194/acp-16-13417-2016, 2016.
Schrader, F., Erisman, J. W., and Brümmer, C.: Towards a coupled paradigm of NH3-CO2 biosphere–atmosphere exchange modelling, Glob. Change Biol., 26, 4654–4663, https://doi.org/10.1111/gcb.15184, 2020.
Schulte, R. B., Vilà-Guerau de Arellano, J., Rutledge-Jonker, S., van der Graaf, S., Zhang, J., and van Zanten, M. C.: Observational relationships between ammonia, carbon dioxide and water vapor under a wide range of meteorological and turbulent conditions: RITA-2021 campaign, Biogeosciences, 21, 557–574, https://doi.org/10.5194/bg-21-557-2024, 2024.
Shephard, M. W. and Cady-Pereira, K. E.: Cross-track Infrared Sounder (CrIS) satellite observations of tropospheric ammonia, Atmos. Meas. Tech., 8, 1323–1336, https://doi.org/10.5194/amt-8-1323-2015, 2015.
Shi, Y. and Long, C. N.: Techniques and Methods used to determine the Best Estimate of Radiation Fluxes at SGP Central Facility, in: Proceedings of the Twelfth ARM Science Team Meeting Proceedings, St. Petersburg, Florida, Backup Publisher: Pacific Northwest National Lab. (PNNL), Richland, WA, USA, https://www.arm.gov/publications/proceedings/conf12/extended_abs/shi-y.pdf?id=52 (last access: 12 April 2024), 2002.
Stoffel, T.: Solar Infrared Radiation Station (SIRS) Handbook, DOE Office of Science Atmospheric Radiation Measurement (ARM) Program (United States), Washington, D.C., 29 pp., https://digital.library.unt.edu/ark:/67531/metadc838156/ (last access: 12 April 2024), 2005.
Sutton, M. A., Asman, W. A. H., and Schjørring, J. K.: Dry deposition of reduced nitrogen, Tellus B, 46, 255, https://doi.org/10.3402/tellusb.v46i4.15796, 1994.
Sutton, M. A., Fowler, D., Burkhardt, J. K., and Milford, C.: Vegetation atmosphere exchange of ammonia: Canopy cycling and the impacts of elevated nitrogen inputs, Water Air Soil Poll., 85, 2057–2063, https://doi.org/10.1007/BF01186137, 1995a.
Sutton, M. A., Schjørring, J. K., and Wyers, G. P.: Plant–atmosphere exchange of ammonia, Philos. T. Roy. Soc. A, 351, 261–278, https://doi.org/10.1098/rsta.1995.0033, 1995b.
Sutton, M. A., Burkhardt, J. K., Guerin, D., Nemitz, E., and Fowler, D.: Development of resistance models to describe measurements of bi-directional ammonia surface-atmosphere exchange, Atmos. Environ., 32, 473–480, https://doi.org/10.1016/S1352-2310(97)00164-7, 1998.
Sutton, M. A., Nemitz, E., Milford, C., Campbell, C., Erisman, J. W., Hensen, A., Cellier, P., David, M., Loubet, B., Personne, E., Schjoerring, J. K., Mattsson, M., Dorsey, J. R., Gallagher, M. W., Horvath, L., Weidinger, T., Meszaros, R., Dämmgen, U., Neftel, A., Herrmann, B., Lehman, B. E., Flechard, C., and Burkhardt, J.: Dynamics of ammonia exchange with cut grassland: synthesis of results and conclusions of the GRAMINAE Integrated Experiment, Biogeosciences, 6, 2907–2934, https://doi.org/10.5194/bg-6-2907-2009, 2009.
Swart, D., Zhang, J., van der Graaf, S., Rutledge-Jonker, S., Hensen, A., Berkhout, S., Wintjen, P., van der Hoff, R., Haaima, M., Frumau, A., van den Bulk, P., Schulte, R., van Zanten, M., and van Goethem, T.: Field comparison of two novel open-path instruments that measure dry deposition and emission of ammonia using flux-gradient and eddy covariance methods, Atmos. Meas. Tech., 16, 529–546, https://doi.org/10.5194/amt-16-529-2023, 2023.
Ustymczuk, A. and Giner, S. A.: Relative humidity errors when measuring dry and wet bulb temperatures, Biosyst. Eng., 110, 106–111, https://doi.org/10.1016/j.biosystemseng.2011.07.004, 2011.
van Hove, L. W. A., Adema, E. H., Vredenberg, W. J., and Pieters, G. A.: A study of the adsorption of NH3 and SO2 on leaf surfaces, Atmos. Environ. 1967, 23, 1479–1486, https://doi.org/10.1016/0004-6981(89)90407-1, 1989.
van Zanten, M. C., Sauter, F. J., Wichink Kruit, R. J., van Jaarsveld, J. A., and van Pul, W. A. J.: Description of the DEPAC module, Rijksinstituut voor Volksgezondheid en Milieu RIVM, https://rivm.openrepository.com/entities/publication/b1b7afbb-4075-46b7-a5c0-91f5fea107e0 (last access: 24 November 2022), 2010.
Vendel, K. J. A., Wichink Kruit, R. J., Blom, M., Van Den Bulk, P., Van Egmond, B., Frumau, A., Rutledge-Jonker, S., Hensen, A., and Van Zanten, M. C.: Dry deposition of ammonia in a coastal dune area: Measurements and modeling, Atmos. Environ., 298, 119596, https://doi.org/10.1016/j.atmosenv.2023.119596, 2023.
Vendel, K. J. A., Wichink Kruit, R. J., Blom, M., van den Bulk, P., van Egmond, B., Frumau, A., Rutledge-Jonker, S., Hensen, A., and van Zanten, M. C.: Data supporting “Dry deposition of ammonia in a coastal dune area: Measurements and modeling”, National Institute for Public Health and the Environment [data set], https://doi.org/10.21945/566085A2-A00F-4E0A-833D-3FCF975027D2, 2025.
von Arx, G., Dobbertin, M., and Rebetez, M.: Spatio-temporal effects of forest canopy on understory microclimate in a long-term experiment in Switzerland, Agr. Forest Meteorol., 166–167, 144–155, https://doi.org/10.1016/j.agrformet.2012.07.018, 2012.
Wang, K., Kang, P., Lu, Y., Zheng, X., Liu, M., Lin, T.-J., Butterbach-Bahl, K., and Wang, Y.: An open-path ammonia analyzer for eddy covariance flux measurement, Agr. Forest Meteorol., 308–309, 108570, https://doi.org/10.1016/j.agrformet.2021.108570, 2021.
Wen, D., Zhang, L., Lin, J. C., Vet, R., and Moran, M. D.: An evaluation of ambient ammonia concentrations over southern Ontario simulated with different dry deposition schemes within STILT-Chem v0.8, Geosci. Model Dev., 7, 1037–1050, https://doi.org/10.5194/gmd-7-1037-2014, 2014.
Wentworth, G. R., Murphy, J. G., Gregoire, P. K., Cheyne, C. A. L., Tevlin, A. G., and Hems, R.: Soil–atmosphere exchange of ammonia in a non-fertilized grassland: measured emission potentials and inferred fluxes, Biogeosciences, 11, 5675–5686, https://doi.org/10.5194/bg-11-5675-2014, 2014.
Wentworth, G. R., Murphy, J. G., Benedict, K. B., Bangs, E. J., and Collett Jr., J. L.: The role of dew as a night-time reservoir and morning source for atmospheric ammonia, Atmos. Chem. Phys., 16, 7435–7449, https://doi.org/10.5194/acp-16-7435-2016, 2016.
Wesely, M. L. and Hicks, B. B.: Some Factors that Affect the Deposition Rates of Sulfur Dioxide and Similar Gases on Vegetation, JAPCA J. Air Waste Ma., 27, 1110–1116, https://doi.org/10.1080/00022470.1977.10470534, 1977.
Westreenen, A. V., Zhang, N., Douma, J. C., Evers, J. B., Anten, N. P. R., and Marcelis, L. F. M.: Substantial differences occur between canopy and ambient climate: Quantification of interactions in a greenhouse-canopy system, PLoS One, 15, e0233210, https://doi.org/10.1371/journal.pone.0233210, 2020.
Wichink Kruit, R. J.: Surface-atmosphere exchange of ammonia: measurements and modeling over non-fertilized grassland in the Netherlands, PhD Thesis, Wageningen University, 175 pp., https://doi.org/10.18174/137586, 2010.
Wichink Kruit, R. J., van Pul, W. A. J., Sauter, F. J., van den Broek, M., Nemitz, E., Sutton, M. A., Krol, M., and Holtslag, A. A. M.: Modeling the surface-atmosphere exchange of ammonia, Atmos. Environ., 44, 945–957, https://doi.org/10.1016/j.atmosenv.2009.11.049, 2010.
Wichink Kruit, R. J., Schaap, M., Sauter, F. J., van Zanten, M. C., and van Pul, W. A. J.: Modeling the distribution of ammonia across Europe including bi-directional surface–atmosphere exchange, Biogeosciences, 9, 5261–5277, https://doi.org/10.5194/bg-9-5261-2012, 2012.
Wichink Kruit, R. J., Aben, J., De Vries, W., Sauter, F., Van Der Swaluw, E., Van Zanten, M. C., and Van Pul, W. A. J.: Modelling trends in ammonia in the Netherlands over the period 1990–2014, Atmos. Environ., 154, 20–30, https://doi.org/10.1016/j.atmosenv.2017.01.031, 2017.
Wichink Kruit, R. J. (Roy), Van Pul, W. A. J., Otjes, R. P., Hofschreuder, P., Jacobs, A. F. G., and Holtslag, A. A. M.: Ammonia fluxes and derived canopy compensation points over non-fertilized agricultural grassland in The Netherlands using the new gradient ammonia–high accuracy–monitor (GRAHAM), Atmos. Environ., 41, 1275–1287, https://doi.org/10.1016/j.atmosenv.2006.09.039, 2007.
Wyers, G. P. and Erisman, J. W.: Ammonia exchange over coniferous forest, Atmos. Environ., 32, 441–451, https://doi.org/10.1016/S1352-2310(97)00275-6, 1998.
Zhang, L., Wright, L. P., and Asman, W. A. H.: Bi-directional air-surface exchange of atmospheric ammonia: A review of measurements and a development of a big-leaf model for applications in regional-scale air-quality models, J. Geophys. Res.-Atmos., 115, D20310, https://doi.org/10.1029/2009JD013589, 2010.