the Creative Commons Attribution 4.0 License.
the Creative Commons Attribution 4.0 License.
 | 07 May 2025
A comprehensive global modeling assessment of nitrate heterogeneous formation on desert dust
María Gonçalves Ageitos
Dene Bowdalo
Marc Guevara
Carlos Pérez García-Pando
Desert dust undergoes complex heterogeneous chemical reactions during atmospheric transport, forming nitrate coatings that influence hygroscopicity, gas partitioning, optical properties, and aerosol radiative forcing. Contemporary atmospheric chemistry models show significant disparities in aerosol nitrogen species due to varying parameterizations and inaccuracies in representing heterogeneous chemistry and dust alkalinity. This study investigates key processes in nitrate formation in the presence of dust and evaluates their representation in models. We incorporate varying levels of dust heterogeneous chemistry complexity into the Multiscale Online Nonhydrostatic AtmospheRe CHemistry (MONARCH) model, assessing sensitivity to critical processes. Our analyses address the condensation pathways of gas species onto dust (irreversible and reversible); the influence of nitrate representation on species burdens, lifetimes, and size distribution; and the role of alkalinity. Using annual global simulations, we compare particulate and gas species surface concentrations to observations and evaluate global budgets and spatial distributions. Findings show significant outcome dependence on methodology, particularly on reversible vs. irreversible gas condensation on dust, with wide ranges for particulate nitrate burdens (0.66 to 1.93 Tg) and correlations with observations (0.66 to 0.91). In contrast, particulate ammonium burdens show lower variability (0.19 to 0.31 Tg). Incorporating dust (together with sea-salt) alkalinity improves consistency with observations, with reversible condensation along with alkalinity representation yielding the best agreement, while showing consistent gas and particle partitioning. In contrast, irreversible uptake reactions overestimate coarse particulate nitrate formation. Our findings offer guidelines for integrating nitrate heterogeneous formation on dust in models, paving the road for improved estimates of aerosol radiative effects.
- Article
(11450 KB) - Full-text XML
-
Supplement
(57950 KB) - BibTeX
- EndNote


Desert dust is produced by wind erosion of arid and semi-arid surfaces, contributing approximately 40 % of the total dry aerosol mass globally and between 70 % and 80 % if sea-salt aerosol (SS) is not considered (Boucher et al., 2013; Adebiyi and Kok, 2020). Dust interacts with shortwave and longwave radiation, affects cloud formation, and alters atmospheric composition, modifying the Earth’s energy and water cycles (Pérez et al., 2011; Boucher et al., 2013). When deposited, dust also affects the biogeochemical cycles of the ocean and continental areas (Mahowald et al., 2014; Li et al., 2016; Bergas‐Massó et al., 2023). If inhaled, dust can be potentially harmful for animal and human health (Usher et al., 2003). Temporal variations in dust emissions, from interannual to geological timescales, have been a key driver of the past climate of the Earth, as observed in ice cores and ocean sediment samples (Rea, 1994). All these considerations make desert dust particles a key component of the Earth system that influence climate (Semeniuk and Dastoor, 2020).
Climate perturbations by dust depend fundamentally upon the dust particles’ physical and chemical properties. These properties are mainly the particle size distribution (PSD), shape, surface characteristics, mineral composition, and mixing state (Usher et al., 2003; Riemer et al., 2019). These characteristics depend on the dust source region and on its chemical transformations while transported in the atmosphere (Claquin et al., 1999). These two factors determine the final dust optical properties and consequently its radiative forcing.
A particularly significant factor driving the chemical evolution of dust in the atmosphere is heterogeneous chemistry: chemical reactions involving more than one phase of matter (e.g., gas, liquid, and solid particles) that might occur on the surfaces of aerosol particles or within their liquid phases (Schwartz, 1986; Dentener et al., 1996; Usher et al., 2003; Bauer et al., 2004, 2007; Riemer et al., 2019).
For example, the condensation of atmospheric gas species on liquid or solid particles is key to particle growth and changes in optical properties during atmospheric transport (Vlasenko et al., 2009; Fairlie et al., 2010; Karydis et al., 2016). Heterogeneous reactions involving nitrogen, for example, can even cause dust to act as a transport medium for nitrates from nitrate-rich areas to regions downwind of dust sources (Ma et al., 2021).
Heterogeneous reactions mainly occur when dust mixes with anthropogenic pollutants emitted in urban and industrial areas. Nitric acid (HNO3(g)), ammonia (NH3(g)), sulfur dioxide (SO2(g)), and sulfuric acid (H2SO4(g)) are the most important anthropogenic species that react with dust (Usher et al., 2003; Yue et al., 2022). These interactions lead to (1) the formation of aqueous coatings around the particles (Usher et al., 2003; Krueger et al., 2003, 2004; Fountoukis and Nenes, 2007; Li and Shao, 2009) and (2) the reaction of gases with the nonvolatile cations (NVCs) present at the particles' surfaces and dissolved in their liquid envelopes (Dentener et al., 1996; Goodman, 2000; Usher et al., 2003; Li and Shao, 2009). These processes transfer mass from the gas to the aerosol phase, through either irreversible reactions of low-volatility gas vapors with the bulk material of the particle or reversible condensation–evaporation processes between the gas phase and the liquid coating (Usher et al., 2002, 2003; Krueger et al., 2003; Crowley et al., 2010).
Each gas species' chemical transformation follows a distinct pathway depending on its solubility and reactivity with other atmospheric species dissolved in the particle's liquid coating and with the NVCs in dust. Among these, HNO3(g) plays a major role in dust heterogeneous chemistry due to its relatively high solubility and reactivity with ammonium () from dissolved NH3(g), leading to the formation of ammonium nitrate (NH4NO3) (Metzger et al., 2002; Usher et al., 2003). Aqueous H2SO4(g) is also paramount, competing with dissolved HNO3(g) to neutralize . However, the neutralization by H2SO4(g) predominates due to its very low vapor pressure, preventing its evaporation back to the gas phase and resulting in the formation of ammonium sulfate ((NH4)2SO4) (Usher et al., 2003; Uno et al., 2020). These are the main formation pathways of particulate nitrate (), particulate ammonium (), and particulate sulfate () from the HNO3–NH3–H2SO4 neutralization system in the particles' liquid coating. Additionally, SO2(g) is relevant in the aqueous medium as it converts to H2SO4(g) through oxidation with O3 and H2O2 (Seinfeld and Pandis, 1998; Usher et al., 2002).
The dust minerals also provide additional reactive surfaces to neutralize HNO3(g), with their reactivity depending on their solubility and the environmental relative humidity (RH). Under low RH, solid minerals may serve as the active sites for reactions with gas species on the particle surfaces (Usher et al., 2003). Conversely, at high RH, minerals can dissociate in the aqueous medium, releasing NVCs such as Ca2+, K+, Mg2+, and Na+. The active sites in dust minerals and NVCs play a key role in neutralizing dissolved HNO3(g) and forming compounds (i.e., Ca(NO3)2(a), Mg(NO3)2(a), KNO3(a), and NaNO3(a)) (Fenter et al., 1995; Krueger et al., 2004). Consequently, these nitrate salts may form on the surface of the dust under low RH or dissociate in the particle's liquid coating (Usher et al., 2003; Jones et al., 2021). These reactions represent the primary pathways for formation in the presence of dust and are highly sensitive to NOx and sulfate concentrations (Fenter et al., 1995; Riemer et al., 2003). For instance, the combination of reduced sulfate emissions along with unchanged or even enhanced NH3(g) emissions, as predicted by 21st century emission scenarios, implies a reduction in particle acidity (Bauer et al., 2007; Bellouin et al., 2011; Boucher et al., 2013; Hauglustaine et al., 2014; Bian et al., 2017; Karydis et al., 2021). This scenario, alongside a potential rise in dust (Usher et al., 2002; Adebiyi et al., 2023), would lead to an increase in formation, especially in the fine mode, if NOx emissions are not concurrently reduced (Bauer et al., 2016; Bian et al., 2017; Zaveri et al., 2021). Therefore, accurate modeling of dust heterogeneous chemistry in atmospheric models is important for present and future air quality control (Myhre et al., 2006).
In recent decades, several approximations have been introduced in atmospheric chemistry models to address nitrate heterogeneous reactions on both dust and SS, with a particular focus on HNO3(g) condensation. These approaches range from dynamic mass transfer (DMT) calculations between gas and aerosol phases (Meng and Seinfeld, 1996; Lurmann et al., 1997; Song and Carmichael, 2001; Feng and Penner, 2007; Zaveri et al., 2008; Trump et al., 2015) to the assumption that the bulk gas–aerosol phases instantly reach thermodynamic equilibrium (TEQ), with the calculation of their correspondent concentrations (Lurmann et al., 1997). While DMT can accurately capture processes far from TEQ (e.g., the condensation of gas species at low temperatures, under extreme RH conditions, or onto coarse particles), the inherent stiffness of inorganic heterogeneous chemistry renders DMT a rigorous but computationally expensive methodology (Feng and Penner, 2007; Zaveri et al., 2008; Trump et al., 2015; Benduhn et al., 2016). On the other hand, assuming instantaneous TEQ is more efficient and has gained popularity despite its tendency to overestimate coarse nitrate formation (Nenes et al., 1998; Feng and Penner, 2007; Bauer et al., 2007; Hauglustaine et al., 2014; Paulot et al., 2016; Bian et al., 2017). To balance accuracy and computational cost, several intermediate strategies have been developed, including (1) simplifying the DMT equations to a first-order irreversible uptake reaction (UPTK), which ignores the evaporation back to the gas phase of those species taken up in the aerosol phase (Jacob, 2000; Bauer et al., 2004; Feng and Penner, 2007; Fairlie et al., 2010), (2) the double call of the TEQ concentration calculation for both the fine (diameter up to 2.5 µm) and coarse (diameter above 2.5 µm) modes of dust and SS (double-call method, DBCLL) after either kinetically limiting the gas condensing in each bin or mode (Pringle et al., 2010) or redistributing the condensed mass from the bulk TEQ using kinetic coefficients (Karydis et al., 2016), and (3) employing an hybrid approach (HYB) that applies TEQ to the fine bins or modes and UPTK to the coarse ones (Capaldo et al., 2000; Hodzic et al., 2006; Hauglustaine et al., 2014; Trump et al., 2015). Overall, methods involving DMT or TEQ calculations allow us to simulate the reversible heterogeneous reactions (condensation–evaporation dynamics), and the UPTK calculates the irreversible uptake of gas species, accounting for gas specifications, particle alkalinity, and environmental RH (Fairlie et al., 2010; Paulot et al., 2016).
Despite these efforts to incorporate nitrate heterogeneous reactions on coarse particles, atmospheric models still significantly diverge in their predictions of the tropospheric burden of oxidized () and reduced () nitrogen, often struggling to reproduce the observational data of these species (Fairlie et al., 2010; Hauglustaine et al., 2014; Paulot et al., 2016; Zakoura and Pandis, 2018; Luo et al., 2019; Jones et al., 2021; Rémy et al., 2022). For instance, the particulate nitrate AeroCom phase III experiment (Bian et al., 2017), an extensive intercomparison study of atmospheric models incorporating formation processes on dust and SS, highlights substantial disagreements. The average atmospheric burden among the models is 0.63 Tg, with a standard deviation of 0.56 Tg, nearly 90 % of the mean value. Similar variability is observed for (0.32±0.20 Tg). The study also highlights the general inaccuracy of current models in reproducing observations of concentrations after long-range transport of precursor species, indicating that nitrogen heterogeneous chemistry processes on dust and SS are often misrepresented in models.
The scope of the present work is to understand the role of dust in formation through a systematic investigation of the underlying processes governing dust heterogeneous chemistry. To achieve this goal, we incorporate a variety of mechanisms of different complexities into a global model. This enables a comprehensive analysis of the partitioning between gas and aerosol phases, the suitability of irreversible and reversible parameterizations for the condensation of gas species on dust, and the role of explicit representation of alkalinity. While our primary emphasis is on the heterogeneous chemistry on dust surfaces, we also account for nitrate formation on SS and its alkalinity.
This paper is structured as follows. Section 2 introduces the Multiscale Online Nonhydrostatic AtmospheRe CHemistry (MONARCH) model (Sect. 2.1), detailing the specific developments implemented for this study (Sect. 2.2), the setup of the simulations conducted (Sect. 2.5), and the datasets used for evaluation (Sect. 2.6). Section 3 presents an analysis of the global simulations and their evaluation against observational data. This section includes a comparison of the spatial distributions and an examination of the total nitrogen burden and gas/particle partitioning. Additionally, we discuss the budgets of reduced and oxidized nitrogen species, depositions, production/loss rates, and lifetimes. Our results are contextualized with findings from previous studies, providing a comprehensive understanding of the results. Section 4 provides a summary of our key findings.
2.1 The MONARCH model
MONARCH is an atmospheric chemistry model developed by the Earth Sciences department of the Barcelona Supercomputing Center (Pérez et al., 2011; Jorba et al., 2012; Badia et al., 2017; Klose et al., 2021; Gonçalves Ageitos et al., 2023; Navarro-Barboza et al., 2024). It simulates the atmospheric life cycle of aerosol- and gas-phase species through an online coupling with the Nonhydrostatic Multiscale Model on the B grid (NMMB) (Janjic and Gall, 2012). NMMB allows us to run both global and regional atmospheric simulations with embedded telescoping nests. The Arakawa B grid is used in the horizontal direction and the Lorenz hybrid pressure–sigma coordinate in the vertical direction. MONARCH global simulations use a regular latitude–longitude grid with polar filtering, and a rotated longitude–latitude grid is adopted for regional applications. The NMMB numerical schemes are based on principles described in Janjic and Gall (2012). The physical parameterizations used in the model include (1) a surface layer scheme based on the Monin–Obukhov similarity theory (Monin and Obukhov, 1954) combined with a viscous sublayer on continental and water surfaces (Zilitinkevich, 1965; Janjic, 1984, 1996), (2) the Mellor–Yamada–Janjic (MYJ) planetary boundary layer and the free-troposphere turbulence scheme (Janjić, 2001), (3) the unified NCEP–NCAR–AFWA Noah land surface model (Ek et al., 2003) to compute the surface heat and moisture fluxes, (4) the 1D Rapid Radiative Transfer Model for Global circulation Models (RRTMG) (Iacono et al., 2008) for the calculation of shortwave and longwave radiative fluxes, (5) the Ferrier microphysics scheme (Ferrier et al., 2002) for grid-scale clouds, and (6) the Betts–Miller–Janjic convective cloud scheme (Betts and Miller, 1986; Emanuel and Živković Rothman, 1999; Janjić, 2000). The same advection and vertical mixing schemes formulated in NMMB are used for both meteorological and chemistry species for consistency.
MONARCH includes a gas-phase module combined with a hybrid sectional–bulk multicomponent mass-based aerosol module. The gas-phase chemistry is based on the Carbon Bond 2005 (CB05) chemical mechanism extended with chlorine chemistry (Yarwood et al., 2005; Whitten et al., 2010), designed to describe urban-to-remote tropospheric conditions. The photolysis rates are computed using the Fast-J scheme (Wild et al., 2000) accounting for aerosols, clouds, and absorbers such as ozone. A resistance approach is adopted for dry deposition (Wesely, 1989), and in-cloud scavenging, below-cloud scavenging, and wet deposition follow Byun (1999) and Foley et al. (2010).
The aerosol representation in MONARCH considers eight main components, namely dust, SS, black carbon, organic matter (both primary and secondary), , , , and non-speciated aerosol mass. Mineral dust and SS are described with a sectional size distribution of eight bins, with diameters spanning 0.2–20 µm for dust and 0.2–30 µm for SS. All the other aerosol components are represented by a fine mode, except , which is represented by both fine and coarse modes to consider the condensation of HNO3(g) on coarse particles. Table S2 in the Supplement reports the bin volumetric and effective radii, density, and their fractional contributions to PM2.5 and PM10.
Black carbon is represented in two primary modes: hydrophobic and hydrophilic, with 80 % of its emitted mass initially classified as hydrophobic. During atmospheric transport, an aging process with an e-folding time of 1.2 d facilitates the transition of mass from the hydrophobic to the hydrophilic mode (Chin et al., 2002). Organic aerosols are represented using the simplified scheme of Pai et al. (2020), which assumes fixed secondary organic aerosol (SOA) yields calibrated to align with more complex volatility-based approaches. For primary organic aerosols, a dual-mode representation – hydrophobic and hydrophilic – is adopted, similar to black carbon. In this scheme, 50 % of the emitted mass is classified as hydrophobic, with an aging e-folding time of 1.15 d transitioning it to the hydrophilic mode. Originally designed for global models, this approach has also demonstrated strong performance at regional scales (Navarro-Barboza et al., 2024).
A simplified gas–aqueous–aerosol mechanism accounts for sulfur chemistry through the oxidation of SO2(g) and dimethyl sulfide (DMS) to H2SO4(g). At the end of each chemistry integration time step, the remaining H2SO4(g) that has not formed aqueous sulfate is assumed to fully nucleate into fine particulate (Spada, 2015). The heterogeneous hydrolysis of N2O5(g) on aqueous sulfate particles is included to account for additional HNO3(g) formation, following the formulation of Riemer et al. (2003). Prior to this study, secondary nitrate–ammonium aerosols were modeled using the TEQ module EQuilibrium Simplified Aerosol Model version v03b (EQSAM v03b; Metzger et al., 2002) for fine particles. It is important to note that EQSAM v03b exclusively considers sulfate–nitrate–ammonium partitioning and does not account for the presence of other species (i.e., dust or SS alkalinity). In Sect. 2.2.2 we detail the adoption of ISORROPIA-II v1 (Fountoukis and Nenes, 2007) for this study. To account for secondary nitrate aerosol formation on coarse dust and SS particles, a hybrid (HYB) approach was employed through an uptake reaction (UPTK) of HNO3(g).
The reaction uses the uptake rate (K) defined by Jacob (2000) as a first-order function (Schwartz, 1986):
where r is the aerosol bin radius, Dfg the gas-phase diffusion coefficient, v the mean molecular speed, S the aerosol-specific surface area, and γ the uptake coefficient, defined as the ratio of the number of gas molecules reacting with the particle's surface over the fraction of molecules being absorbed by the given surface (i.e., the accommodation coefficient) (Phadnis and Carmichael, 2000; Guimbaud et al., 2002).
A γ value of 0.1 was assumed for dust (Hanisch and Crowley, 2001; Vlasenko et al., 2006), and 0.01 was used for SS (Tolocka et al., 2004). The production of fine and coarse was traced in separated bins.
Finally, MONARCH includes meteorology-driven emission modules for key species. Emissions of biogenic non-methane volatile organic compounds (NMVOCs) and NO are calculated from the Model of Emissions of Gases and Aerosols from Nature (MEGAN) v2.04 (Guenther et al., 2006). Several SS source functions are available in the model (Spada et al., 2013); here, we use the Jaeglé et al. (2011) formulation. Similarly, different parameterizations for dust emissions are available, ranging from more simplified to more physics-based descriptions (Klose et al., 2021).
Following Gonçalves Ageitos et al. (2023), the G01-UST scheme based on Ginoux et al. (2001) described in Klose et al. (2021) is used in this work.
Dust emission is limited to areas presenting a frequency of occurrence of dust optical depth above 0.2, identified using maps created from the Moderate Resolution Imaging Spectroradiometer (MODIS) Deep Blue retrievals (Hsu et al., 2004; Ginoux et al., 2012). The surface roughness influence on dust emission is parameterized based on Raupach et al. (1993), whose vegetation cover is determined using surface reflectance from Landsat and MODIS monthly data (Raupach et al., 1993; Guerschman et al., 2015).
For the evaluation of the model's dust cycle, the reader is referred to Klose et al. (2021) and Gonçalves Ageitos et al. (2023), and for the SS cycle to Spada et al. (2013).
2.2 Model updates
In this study, we investigate the primary chemical pathways responsible for formation on preexisting particles, with a particular focus on coarse dust particles, by integrating mechanisms of varying complexity within the global model MONARCH (Fig. 1). Table 1 lists the irreversible and reversible heterogeneous reactions considered in our analysis. Here, we detail the enhancements implemented in MONARCH to partially or fully address the array of reactions of interest, with a primary focus on maintaining a balance between complexity, accuracy, and computational efficiency in the resulting solution.
To trace the formation of fine and coarse , , and under moist conditions – the primary regime where these formation pathways occur (Usher et al., 2003; Jordan et al., 2003) – an additional hydrophilic bin for the coarse mode of these species is added to the default MONARCH size parametrization, as detailed in Supplement Table S2. The new bins account for the total mass of , , and formed on both dust and SS particles indiscriminately. Sensitivity tests, with and without dust and SS in the UPTK and TEQ processes, assess their relative contributions (see Sect. 2.4).
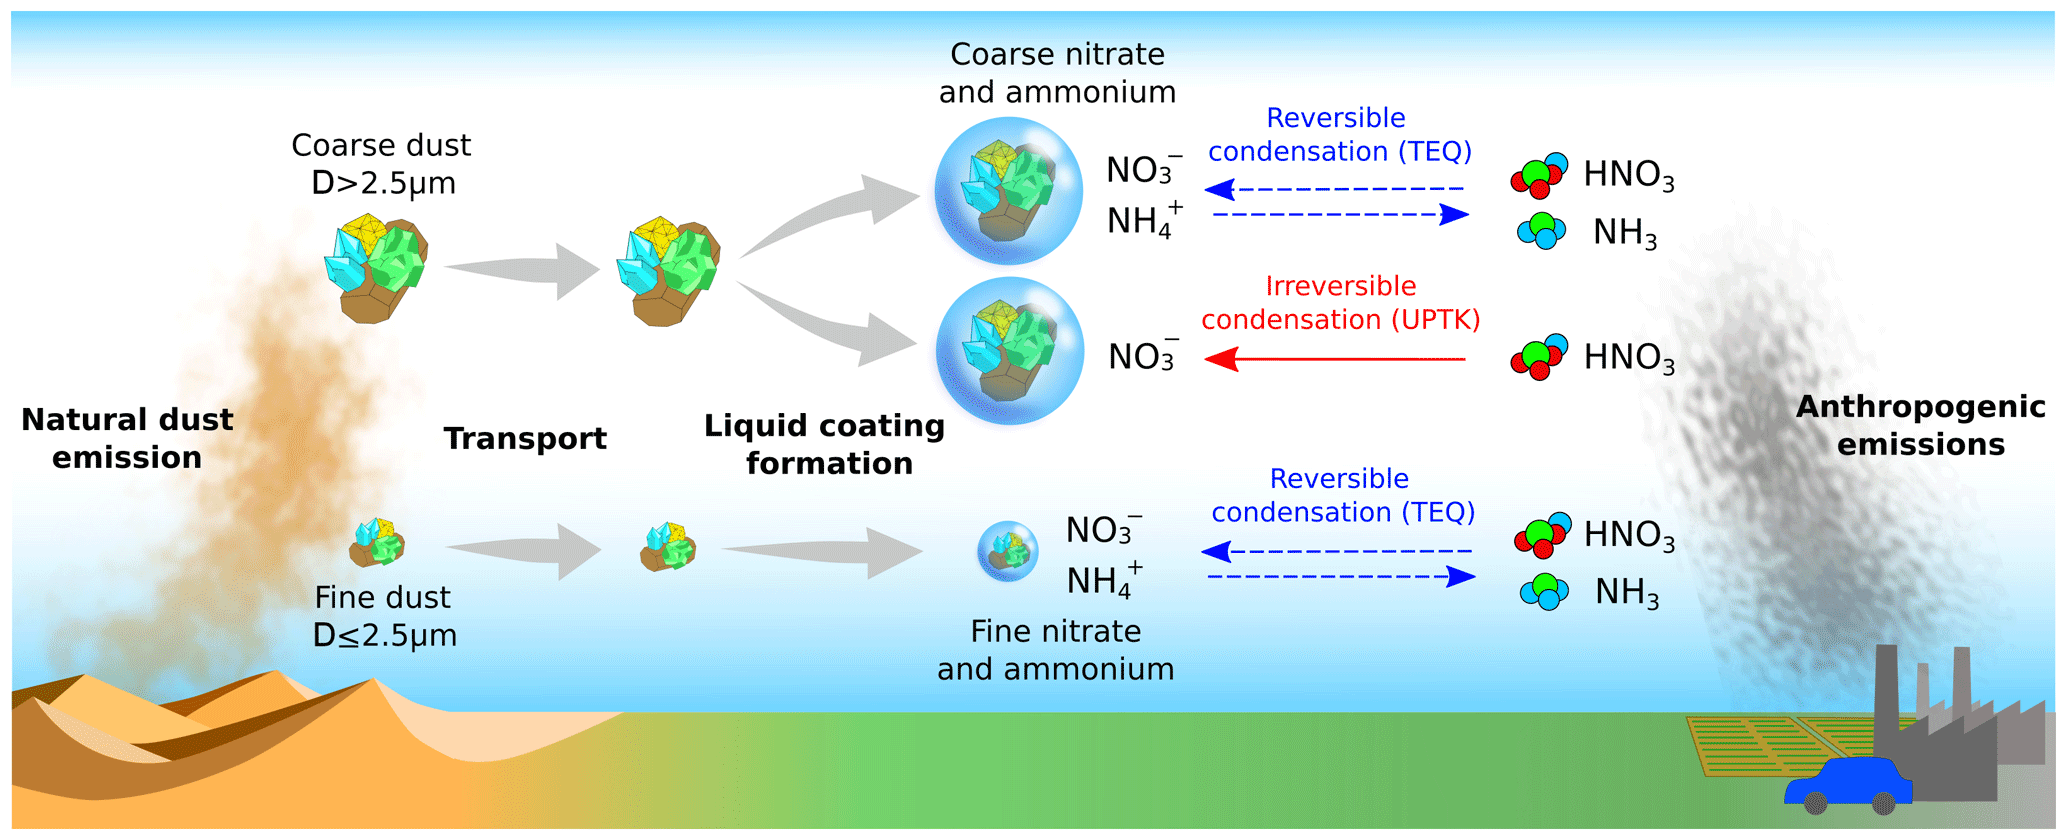
Figure 1Illustration of the mineral dust heterogeneous chemistry mechanisms implemented in this work for fine and coarse particles. Fine dust aqueous coating is assumed to reach thermodynamic equilibrium (TEQ) with anthropogenic gas species to form fine particulate nitrate (). Conversely, coarse particulate nitrate is formed through either the reversible condensation (i.e. through TEQ) of HNO3(g) and NH3(g) after kinetic limitation or the irreversible uptake reaction (UPTK) of HNO3(g) on coarse dust particles. Particulate ammonium () is formed through TEQ in both size modes.
Table 1Heterogeneous reactions implemented in MONARCH. Dust and sea-salt particles are referred as DU and SS, respectively.
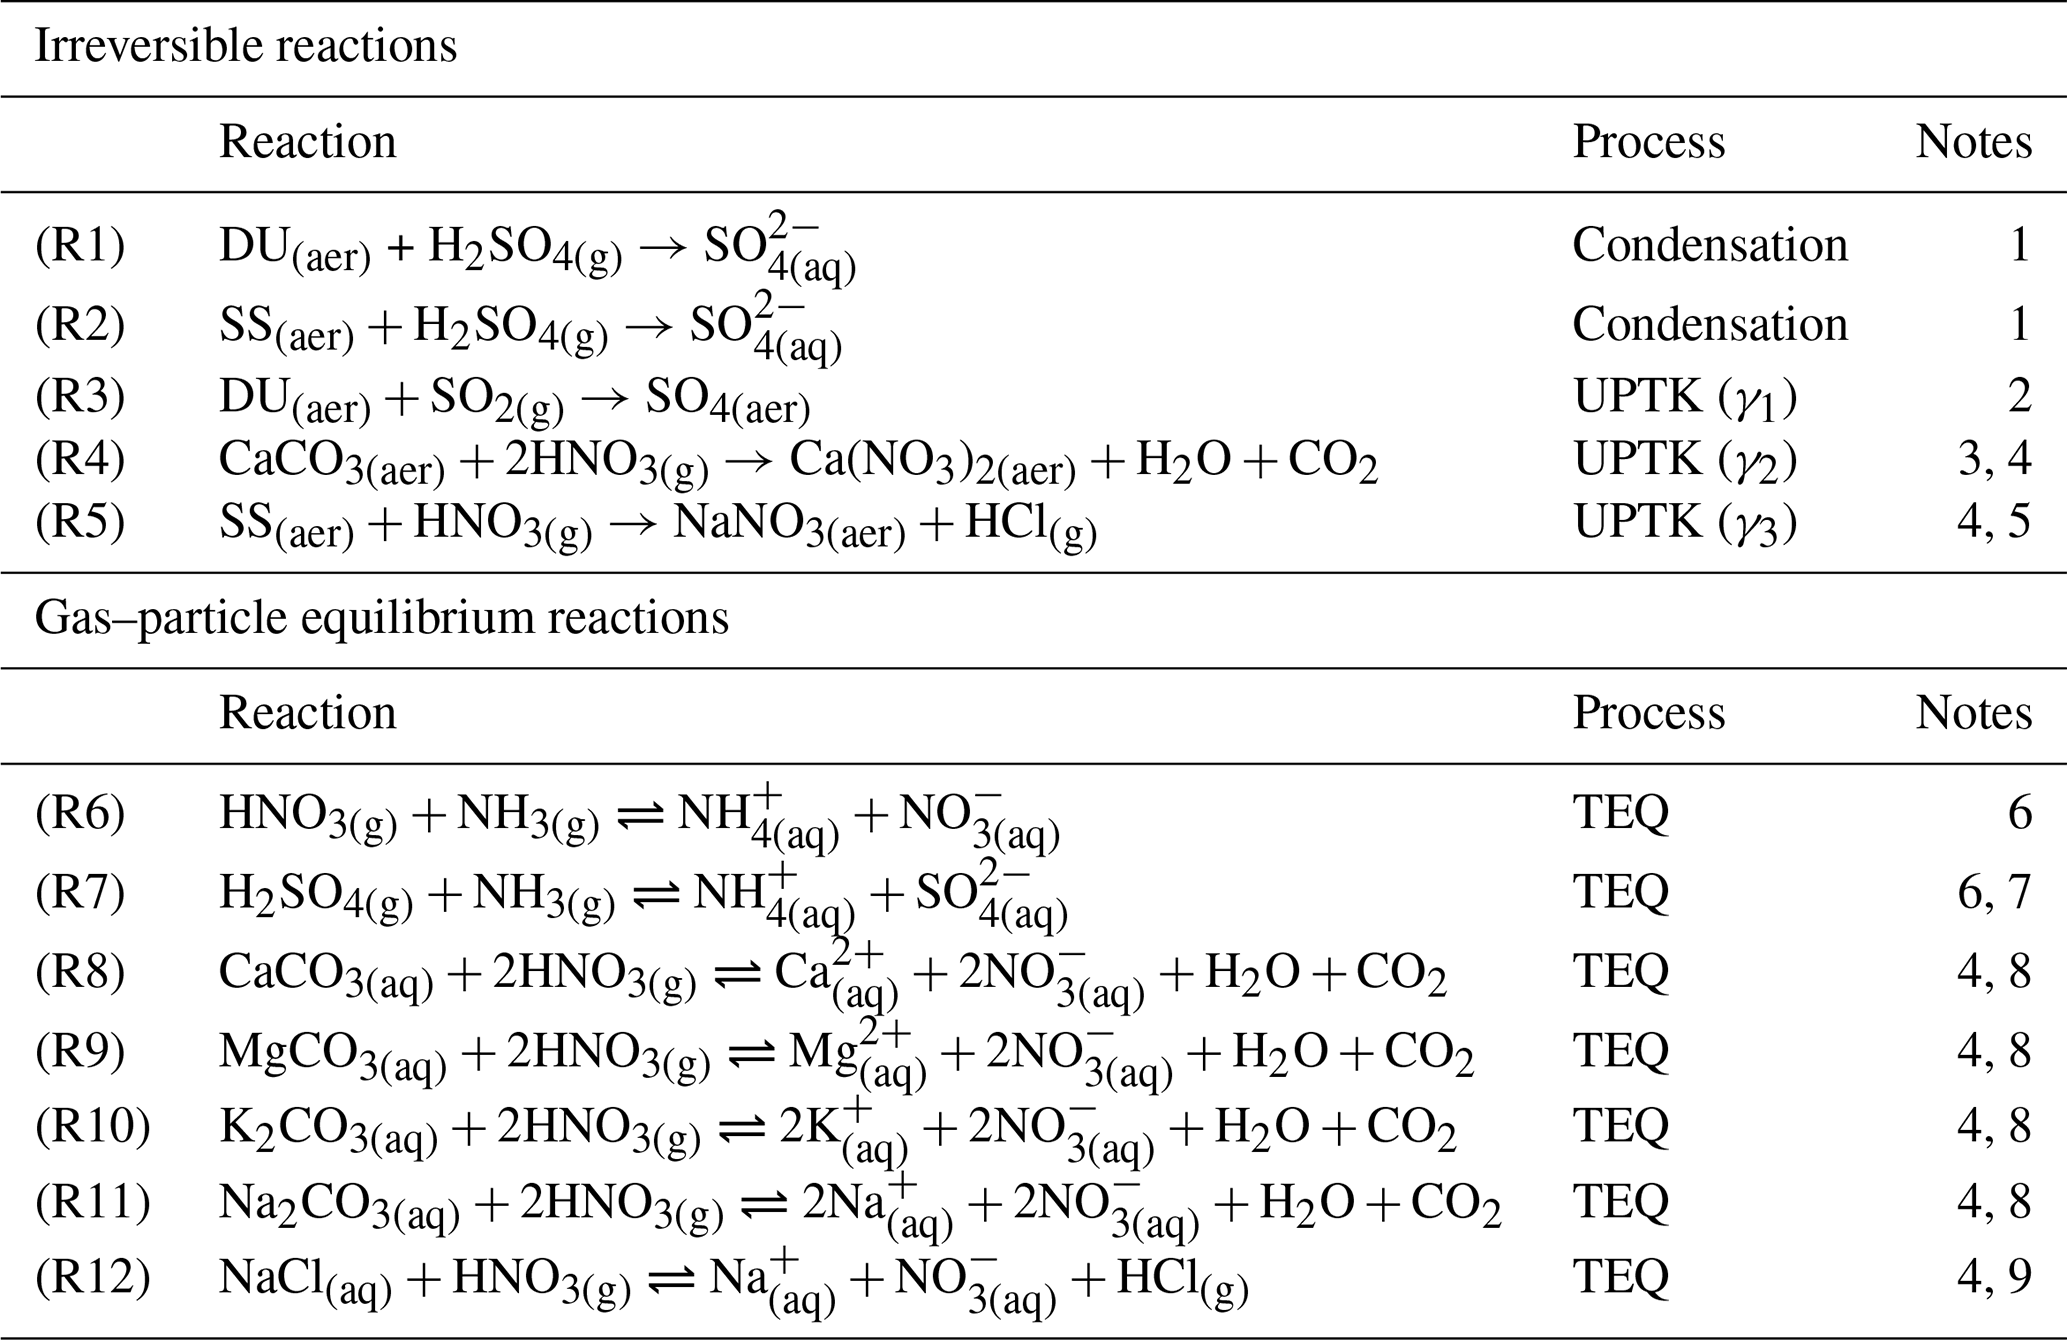
1. Sulfuric acid (H2SO4(g)) is assumed to completely condense on fine and coarse dust and SS, transferring mass to each size mode. The condensation reaction does not depend on dust and SS alkalinity but solely on their specific surface areas based on Pringle et al. (2010).
(2. The sulfur dioxide (SO2(g)) uptake coefficient on dust (γ1) is a function of RH as defined in Fairlie et al. (2010) and based on experimental studies performed on calcite particles by Prince et al. (2007). However, to account for SO2(g) oxidation by deliquesced O3 and NO2, the UPTK reaction of SO2(g) is performed even in the absence of alkalinity. That is why this reaction is considered to happen over DU(aer) and not only over CaCO3(aq), although it assumes the same dust alkalinity as in nitric acid uptake (Reaction R4).
3. The nitric acid (HNO3(g)) uptake coefficient on CaCO3(aq) (γ2) is a function of RH as defined by Fairlie et al. (2010) based on experimental studies performed on calcite particles by Liu et al. (2008). The CaCO3(aq) concentration is used instead of the DU(aer) concentration because the uptake coefficient is scaled for alkalinity, as shown in Eq. (2).
4. CaCO3(aq), MgCO3(aq), K2CO3(aq), Na2CO3(aq), and NaCl(aq) refer to the NVC content derived from the DU(aer) and SS(aer) concentrations using the fractions from Gonçalves Ageitos et al. (2023) for dust and from Seinfeld and Pandis (2006) for SS (Sect. 2.2.3).
5. The HNO3(g) uptake coefficient on SS (γ3) is based on the experimental study by Liu et al. (2007) that reports HNO3(g) uptake kinetics for different RH and sea-salt particle sizes. An average value of γ3=0.05 for particles from 2.5 to 10 µm (coarse mode) is assumed, given ambient RH = 80 %.
6. Neutralization of HNO3(g) and H2SO4(g) by ammonia is calculated through TEQ with ISORROPIA-II. It is assumed to happen in the fine mode for all mechanisms and additionally in the coarse mode over coarse particles in those mechanisms, given coarse and formation (Myhre et al., 2006; Usher et al., 2003; Uno et al., 2020). All reactants and products are assumed to remain in the aqueous phase (metastable assumption).
7. The result of the neutralization of H2SO4(g) can be (NH4)2SO4(aer), NH4HSO4(aer), or (NH4)3H(SO4)2(aer) if solid results are assumed (Liu et al., 2022), but under the metastable assumption, only aqueous ions of are considered.
8. Calcium, magnesium, potassium, and sodium (NVCs) deliquesced from carbonates present in the bulk of dust particles neutralize HNO3(g) in the liquid coating of dust aerosols (Usher et al., 2003; Krueger et al., 2004; Fountoukis and Nenes, 2007; Hauglustaine et al., 2014). Dust NVC content (i.e., alkalinity) is dependent on particle size and is globally averaged from the Journet et al. (2014) mineral data.
9. Sodium chloride from sea-salt particles dissolves and reacts with HNO3(g) in the liquid coating of sea-salt particles (Myhre et al., 2006). Sea salt also presents other NVCs that are included in Reactions (R8)–(R11), which are assumed to be globally homogeneous, following Seinfeld and Pandis (2006) and Karydis et al. (2016).
2.2.1 Irreversible heterogeneous chemistry of nitrate and sulfate
A widely adopted method to simulate and formation on coarse particles involves incorporating irreversible heterogeneous reactions of gas species on dust and SS through a first-order uptake parameterization. Specifically, the uptake of HNO3(g) on coarse particles is commonly assumed to drive coarse formation (Jacob, 2000; Hodzic et al., 2006; Bauer et al., 2004; Feng and Penner, 2007; Fairlie et al., 2010; Hauglustaine et al., 2014; Paulot et al., 2016; Jones et al., 2021), while the uptake of SO2(g) is known to lead to the formation of coarse (Phadnis and Carmichael, 2000; Song and Carmichael, 2001; Usher et al., 2002; Prince et al., 2007; Fairlie et al., 2010; Li et al., 2012; Liu and Abbatt, 2021; Yue et al., 2022). Most models assume constant uptake coefficients (γ) for these reactions, for example γ=0.1 for HNO3(g) uptake on dust (Dentener et al., 1996; Hanisch and Crowley, 2001, 2003; Bauer et al., 2004; Hodzic et al., 2006; Wei, 2010). However, recent studies have shown that using this value tends to overestimate formation (Vlasenko et al., 2006; Mashburn et al., 2006; Fairlie et al., 2010). This suggests that the uptake coefficient for HNO3(g) should be lower and that it is highly influenced by RH (Goodman, 2000; Krueger et al., 2003; Vlasenko et al., 2006, 2009; Fairlie et al., 2010; Wei, 2010) and dust alkalinity (Goodman, 2000; Hanisch and Crowley, 2001; Krueger et al., 2004; Liu et al., 2007; Prince et al., 2007; Wei, 2010; Crowley et al., 2010). Recent studies increasingly implement γ as a function of RH and employ different parameterizations of this function to account for dust alkalinity.
For our study, we extended the chemical mechanism of MONARCH to incorporate pathways for the formation of coarse and sulfate aerosols (Fig. 2). This extension involved refining irreversible heterogeneous parameterizations within the model, specifically the uptake of HNO3(g) on dust and SS particles (Reactions R4–R5 in Table 1), as well as the uptake of SO2(g) on dust particles (Reaction R3 in Table 1). No additional heterogeneous chemistry, such as the transformation of NO2(g) to HNO3(g) on the surface of dust particles, was considered due to its relatively low significance (Jacob, 2000; Jordan et al., 2003; Liao et al., 2003; Li et al., 2024).
Our implementation incorporates dependencies of γ on RH and on the alkalinity of dust (Vlasenko et al., 2006, 2009; Liu et al., 2007, 2008; Crowley et al., 2010; Fairlie et al., 2010; Wei, 2010). The γ dependency on RH is modeled akin to a Brunauer–Emmett–Teller (BET) isotherm, which characterizes water adsorption on dust particles (Vlasenko et al., 2006). We employed a modified BET function to formulate γ, extending it to account for dust alkalinity. This formulation is represented by the following equation:
where RH is the relative humidity (ranging from 0 to 1), c1 and c2 denote the water adsorption scaling factors (Vlasenko et al., 2006), and Sc is a factor dependent on dust alkalinity. For the uptake of HNO3(g) on dust (Reaction R4 in Table 1), typical values assumed for c1 and c2 are 8.0 and 7.0, respectively (Li et al., 2012; Paulot et al., 2016; Wang et al., 2017). For Sc, however, the literature reports varying values based on dust alkalinity assumptions, ranging from for the industrially standardized Arizona test dust (Möhler et al., 2006; Herich et al., 2009; Suman et al., 2024) to Sc = 0.018 for samples from the China loess with 39 % CaCO3 content (Krueger et al., 2004; Wei, 2010).
We adopt the uptake RH functions for both HNO3(g) and SO2(g) on dust from Fairlie et al. (2010). To fit experimental data from Song et al. (2007) and the RH function reported by Fairlie et al. (2010), for γ(HNO3) (Reaction R4 in Table 1) we determine and c2=0.56. Additionally, Fairlie et al. (2010) assumed an NVC content of 3.0 % Ca and 0.6 % Mg, which differ from the NVC values used in the present study. Therefore, we use the alkalinity scaling factor Sc to normalize the Fairlie et al. (2010) function accordingly. Specifically, values for Sc are defined as the ratio of Ca and Mg percentages used in our study relative to those assumed by Fairlie et al. (2010), resulting in Sc=1.80 and Sc=1.52 for the two average alkalinity values derived from Journet et al. (2014) and Claquin et al. (1999), respectively, that are used in our experiments (see Sect. 2.2.3 below). Note that Sc is zero if no alkalinity is considered and that a constant value of is used for RH higher than 80 %.
Similarly, we determined the γ(SO2) on dust (Reaction R3 in Table 1), fitting Eq. (2) to experimental data from Prince et al. (2007) and the RH function from Fairlie et al. (2010), yielding values of and . The same Sc values used for γ(HNO3) are applied for γ(SO2): Sc=1.80 and Sc=1.52.
However, if alkalinity is not considered, Sc is set to 1.0 (and not zero, as is the case for γ(HNO3)) to account for the oxidation of SO2(g) by deliquesced O3 and NO2 (Usher et al., 2002; Prince et al., 2007; Yu et al., 2017; Li et al., 2024). For RH above 90 %, γ(SO2) remains constant at .
For the HNO3(g) uptake on SS (Reaction R5 in Table 1), we adopted the γ(HNO3) values of Liu et al. (2007), which provide experimental estimates of this factor for different particle sizes and RH. However, a clear uptake function on these parameters has not been found in the literature. Therefore, for the sake of simplicity, we defer an implementation of an uptake coefficient dependent on these metrics to future research. In this study, we did not account for the RH dependency of γ(HNO3), and instead we used average values at 80 % RH, resulting in γ(HNO3)=0.15 for SS particles in the range of 0.1 to 2.5 µm and γ(HNO3)=0.05 for particles larger than 2.5 µm.
While larger values have been reported by Guimbaud et al. (2002), we opted for these values as they align with more widely accepted ranges found in the literature (Saul et al., 2006; Pratte and Rossi, 2006; Liu et al., 2007; Fagerli et al., 2015). Using higher values could potentially overestimate the uptake on SS particles.
The condensation of H2SO4(g) (Reactions R1–R2 in Table 1) on dust and SS is another relevant source of introduced in our model. Due to the extremely low volatility of H2SO4(g) at atmospheric temperatures, its condensation onto existing particles is assumed to be irreversible and complete. This process signifies a direct mass transfer from the gas to the aerosol phase (Zaveri et al., 2008; Hauglustaine et al., 2014). The amount of H2SO4(g) that condenses in the fine and coarse modes is determined using the kinetic diffusive coefficients calculated as described in Sect. 2.3.
2.2.2 Reversible heterogeneous chemistry of nitrate and ammonium
The gas–aerosol partitioning of semivolatile inorganic aerosols in previous studies with MONARCH was based on the EQSAM v03b TEQ model. EQSAM provides a computationally efficient approach that bypasses the expensive iterative activity coefficient calculation employed in other thermodynamic models. EQSAM was originally designed to handle the partitioning of the ammonium–sulfate–nitrate–water system, excluding solid components, and was extended to include solids, HCl, and in version v03b, the one used in MONARCH. One of the limitations of this version is the lack of information on NVCs and/or mineral species in traced species.
For this study, we implemented the ISORROPIA-II v1 (Fountoukis and Nenes, 2007) TEQ model as an additional option in MONARCH to investigate the sensitivity of the partitioning of semivolatile inorganic compounds to NVCs. While a more recent version of ISORROPIA-II (v2.3) exists, which improves aerosol pH estimations at near-pH-neutral conditions (Song et al., 2018), global-scale simulations have shown only minor differences when compared to ISORROPIA-II v1 (Milousis et al., 2024).
ISORROPIA-II v1 determines TEQ concentrations of gas, liquid, and solid phases. It can assume either stable conditions, where compounds precipitate into solids, or metastable conditions, where compounds remain as supersaturated liquid solutions. To enhance computational efficiency, ISORROPIA-II employs a segmented approach to calculate TEQ concentrations. This approach defines five different regimes based on the ratios of precursor species (i.e., sulfate, sodium, and crustal species), RH, and temperature. Each regime addresses a specific subset of relevant species and equilibrium equations. Efficiency is further improved by retrieving species' activity coefficients from lookup tables (Fountoukis and Nenes, 2007; Milousis et al., 2024). The medium's acidity is determined by the concentrations of acidic and basic gaseous species (HNO3(g), NH3(g), H2SO4(g)), particles (, , ), and crustal ions (K+, Ca2+, Mg2+, Na2+, Cl−), which are inputs to ISORROPIA-II. After TEQ is calculated with these species, the resulting pH is provided by the thermodynamic model.
In this work, we use the metastable solution of ISORROPIA-II, assuming that all the resulting particulate compounds from the TEQ computation remain in the liquid phase. Previous studies comparing stable and metastable methodologies with ISORROPIA-II have reported only marginal differences in global nitrate budgets between both modes. At global scales, these differences showed slightly higher pH values (0.5) and nitrate formation (2 %) when using the metastable assumption (Karydis et al., 2016, 2021; Milousis et al., 2024), although these differences are reported to be more important (<2 pH units and < 60 % nitrate concentrations) close to regions with low RH and a high concentration of crustal species or in their downwind areas. However, given the global-scale scope of the present study, we used the metastable assumption since it allows for full traceability of total aerosol nitrate, ammonium, and sulfate formation (Reactions R6–R12 in Table 1).
We also adopt the temperature and pressure applicability range for ISORROPIA-II proposed by Sulprizio (2022), which highlights potential instabilities in reactions occurring below 250 °K and 200 hPa. Consequently, ISORROPIA-II computations are limited to cells with temperature and pressure values above these thresholds.
2.2.3 Dust and sea-salt alkalinity
Alkalinity refers to the ability of a substance to neutralize acids and maintain a stable pH level. Both dust and SS particles contain NVCs that contribute to the overall alkalinity of the aerosol, thereby neutralizing gas acidic species such as HNO3(g) and sulfates.
To investigate the importance of representing dust alkalinity, we derive a global average size-dependent NVC content from 5-year-long MONARCH simulations that explicitly track dust mineral species (Gonçalves Ageitos et al., 2023). To assess the uncertainty arising from our limited knowledge of the soil mineralogy of dust sources, we relied on two different MONARCH experiments detailed in Gonçalves Ageitos et al. (2023), which utilized the Claquin et al. (1999) and Journet et al. (2014) soil mineralogical datasets. The simulation based on Claquin et al. (1999) accounts for 8 distinct minerals, whereas the simulations based on Journet et al. (2014) for 12 minerals (Table S3). The Claquin et al. (1999) dataset includes quartz, feldspar, illite, smectite, kaolinite, calcite, gypsum, and hematite. The Journet et al. (2014) dataset includes those minerals as well as chlorite, vermiculite, mica, and goethite (Table S5). In this study, we adopt an upper bound for the mineral solubility and reactivity with gas species based on Hanisch and Crowley (2001). Moreover, we assume size-dependent but globally homogeneous values for dust mineralogy, and consequently dust alkalinity and NVC, to focus on understanding heterogeneous reaction parameterizations. We defer the analysis of the potential importance of geographical dust mineralogical variations on dust heterogeneous chemistry to a forthcoming study.
Based on the global average mineral mass fraction for each dust size bin derived from the mineralogy simulations and the elemental composition associated with each mineral (see the Supplement Tables S4 and S6), we estimate the average NVC content per dust size bin at each time step following Eq. (3):
where the NVC concentration for each element j (i.e., Ca, Mg, K, Na) and size bin i (NVCi,j) at a given location is derived by considering the molar fraction of each element in each mineral k (fNVCk,j), the global average mass fraction of each mineral and size bin (Mi,k), and the bin's dust concentration at the specified location (DUi). NVCi,j serves as input to the TEQ calculation. We consider only minerals soluble in water or acids that may at least partly dissolve in the liquid coating of the particles (Usher et al., 2003), and only NVCs reacting with the gas species in ISORROPIA-II are used (calcite, magnesium, potassium, sulfate, chlorite, or sodium) for the calculation.
The dust NVC global average content results in 5.17 % Ca2+, 0.79 % Na+, 2.37 % K+, and 1.32 % Mg2+ for the Journet et al. (2014) dataset and 3.68 % Ca2+, 0.87 % Na+, 3.15 % K+, and 1.75 % Mg2+ for Claquin et al. (1999).
The size-resolved NVC percentages for each dust bin are reported in the Supplement Tables S3, S4, S5, and S6.
In most of the sensitivity runs, the Journet et al. (2014) global average is employed if not stated otherwise (see Table 3). Values for Claquin et al. (1999) are used solely in one sensitivity test, as explained in Sect. 2.4. These values are within the range reported by Karydis et al. (2016) (5.36 ± 3.69 % Ca2+, 2.46 ± 1.90 % Na+, 2.08 ± 1.34 % K+, and 1.96 ± 2.20 % Mg2+). The Journet et al. (2014) dataset results in a higher proportion of Ca2+ compared with the Claquin et al. (1999) one, while similar fractions for Na+ and K+ are reported.
Additionally, as discussed in Sect. 2.2.1, the dust NVCs derived imply the application of the scaling factors Sc=1.80 and Sc=1.52 in Eq. (2) for the irreversible uptake experiments, assuming the average alkalinity derived from the Journet et al. (2014) and Claquin et al. (1999) simulations, respectively.
Regarding SS, we use a global average composition from Seinfeld and Pandis (2006), with 55 % Cl−, 30.6 % Na+, 7.7 % , 3.7 % Mg2+, 1.2 % Ca2+, and 1.1 % K+.
Table 2Sequence of reactions and calculations performed for each scheme (rows). In columns, the sequence order (tN) and the gas/aerosol mode of each process are indicated. Dust and sea-salt particles are referred to as DU and SS, respectively, and condensation is abbreviated as Cond.

2.3 Nitrate mechanisms under study
In atmospheric conditions, HNO3(g) and NH3(g) exhibit higher volatility compared to H2SO4(g). As a result, their condensation onto liquid coatings around particles is a reversible process and should not be assumed to be irreversible uptake reactions (Usher et al., 2003). Different mechanisms have been proposed to model the partitioning of nitrate and ammonium across the entire aerosol size range, aiming to mitigate the computationally expensive cost of solving the dynamic mass transfer equations (Capaldo et al., 2000; Feng and Penner, 2007; Hauglustaine et al., 2014).
The assumption of TEQ between the gas and aerosol phases provides a practical approximation to account for the potential evaporation of already dissolved molecules in the liquid coating of fine particles. Equilibrium timescales for fine ammonium nitrate (diameter less than 1 µm) are typically on the order of minutes under typical atmospheric conditions (Wexler and Seinfeld, 1990; Dassios and Pandis, 1999). However, in TEQ models, it is assumed that TEQ is reached within each model time step (on the order of few minutes). This assumption is reasonable for fine particles but less so for coarse particles, where achieving equilibrium can take minutes to hours (Feng and Penner, 2007).
To overcome this limitation, different approaches have been proposed in the literature to incorporate the condensation–evaporation of HNO3(g) and NH3(g) on coarse particles while minimizing computational costs. In this study, we explore two such methods. (1) The hybrid method (HYB) (Hodzic et al., 2006; Feng and Penner, 2007) solves the partitioning over fine particles using a TEQ model and employs a first-order irreversible uptake (UPTK) reaction for condensation over coarse particles (Sect. 2.2.1). (2) A more refined approach treats the formation of coarse as a reversible process through the combination of a double call of the TEQ calculation, one for the fine and one for the coarse mode (DBCLL), together with a kinetic limitation of the gas species involved in the partitioning (Pringle et al., 2010). These two mechanisms are evaluated in this study to assess their impact on the formation of coarse and , as illustrated in Fig. 2. Additionally, for the purpose of comparison, a scheme neglecting coarse formation (fTEQ) is also employed. We briefly describe each approach below.
The fTEQ approach solves the partitioning of semivolatile inorganic species with ISORROPIA-II exclusively within the fine mode to assess the effect of neglecting coarse and formation on atmospheric composition. This mechanism solves the nitric–ammonia–sulfate neutralization (Reactions R6–R7 in Table 1), accounting for the effects of alkalinity (Reactions R8–R12 in Table 1) if fine dust and SS are considered in the mixture. Since H2SO4(g) and influence the ambient pH, they are always involved in any TEQ calculation. As described in Sect. 2.1, aqueous sulfate formation is solved through the oxidation of SO2(g) and DMS. Here, however, only 50 % of the remaining H2SO4(g) is assumed to directly nucleate as fine through the aqueous-phase chemistry, while the rest condenses into fine through Reactions (R1) and (R2) in Table 1 (Fig. 2a). While in our study fTEQ serves as a sensitivity test to assess the impact of neglecting coarse and formation, the fTEQ approach may be appropriate in environments where coarse particles are sparse or in applications focusing primarily on fine particle formation (Bian et al., 2017).
Conversely, the HYB mechanism (Fig. 2a) is a commonly employed strategy in atmospheric chemistry models to represent nitrate formation on coarse particles. It solves formation through a sequential implementation of (1) the TEQ reaction between HNO3(g) and NH3(g), considering internal mixing with the fine dust and SS modes (Reactions R6–R12 in Table 1), and (2) an irreversible first-order UPTK reaction of the remaining HNO3(g) on the coarse modes of dust and SS, excluding its evaporation back to the gas phase (Reactions R4 and R5 in Table 1). The UPTK reaction of HNO3(g) follows the implementation detailed in Sect. 2.2.1. Sulfate is treated in an analogous manner to the fTEQ mechanism.
Finally, the DBCLL mechanism (Fig. 2b) (Pringle et al., 2010) treats coarse and formation as a reversible condensation–evaporation process. Firstly, the DBCLL methodology involves the calculation of kinetic diffusion limitation (DIFFLIM) coefficients for both the fine and coarse size modes of each of the condensing gas species, which restricts the amount of gas available to condense on each mode (Table 2). DIFFLIM has been implemented based on the formulation by Vignati et al. (2004) for H2SO4(g) and its extension to other gases by Pringle et al. (2010). Following DIFFLIM, sequential TEQ calculations are conducted over the fine and coarse modes (double call of the TEQ model, Reactions R8–R12 in Table 1), using the DIFFLIM coefficients to limit the availability of the gas condensing in each mode.
Regarding the sulfate treatment in DBCLL, a similar approach to fTEQ is employed, but the DIFFLIM coefficients calculated for H2SO4(g) are used to condense the available H2SO4(g) into either the fine mode or the coarse mode of (Reactions R1 and R2 in Table 1 and Fig. 2b).
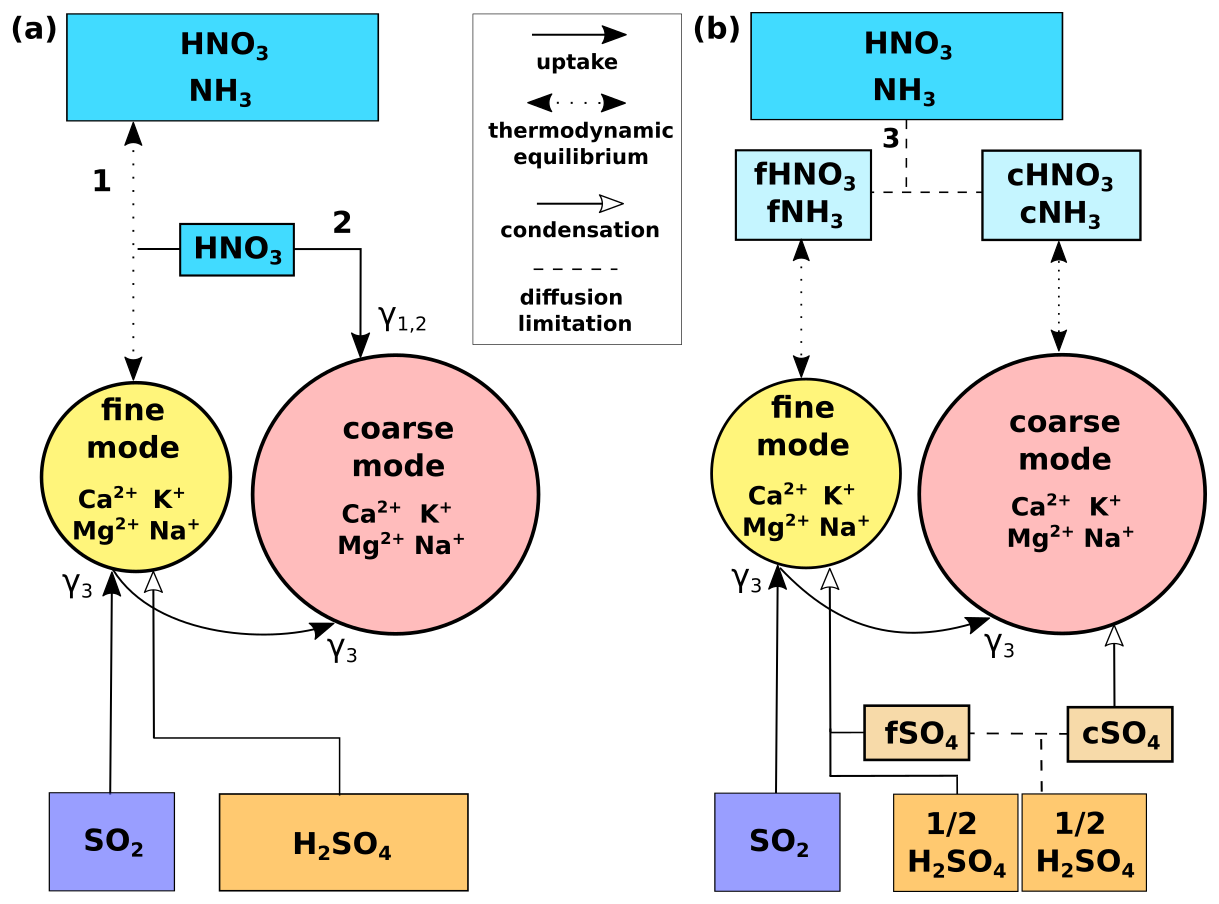
Figure 2Scheme of the heterogeneous chemistry reactions on dust and SS developed in this work. (a) Schemes for the fTEQ and HYB mechanisms. (b) Scheme for the DBCLL mechanism that includes the kinetic diffusion limitation of gas species. The legend for the line patterns is included in the center box. Numbers represent (1) fTEQ, (2) HYB, and (3) DBCLL. At the bottom, the pathways for the processing of SO2(g) and H2SO4(g) gases for each scheme are represented: SO2(g) is taken up by fine particles and the remaining gas is taken up by coarse particles. For H2SO4(g), (a) the fTEQ and HYB mechanisms assume that it nucleates directly as fine , while (b) the DBCLL mechanism assumes that 50 % of its concentration nucleates and the rest is divided by diffusion limitation to form fine and coarse modes of particulate sulfate, completely condensing on each of them. The uptake coefficients used for the uptake processes (solid arrows) are γ1,2 for HNO3(g) uptake on dust and SS and γ3 for SO2(g) uptake on dust.
2.4 Sensitivity runs
We performed global simulations based on the mechanisms described in Sect. 2.3. Overall, 11 different runs (Table 3) are analyzed to test different degrees of complexity and sensitivity to parameterizations when simulating heterogeneous chemistry of dust, such as the hypothesis on reversibility of nitrate formation and the role that dust (and SS) alkalinity play in the partitioning of gas and aerosol species. Unless otherwise stated, all the experiments employ dust alkalinity derived from the average of the Journet et al. (2014) simulation, as explained in Sect. 2.2.3.
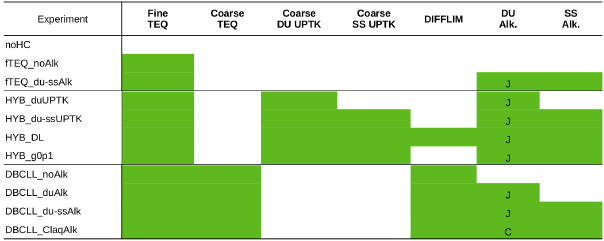
Three initial run sets are conducted neglecting coarse formation, serving as a comparison reference for following experiments including coarse . The noHC run assumes that there is no formation of , , or aerosol through heterogeneous chemistry on any aerosol particle, serving as a baseline to estimate the burden of gas condensing in particles in other configurations and the influence of particle formation on nitrogen deposition rates. Additionally, two sensitivity experiments with fTEQ are included to discuss the impact of ignoring the partitioning of semivolatile inorganic species on coarse particles: fTEQ_noAlk neglects the presence of dust or SS in the aerosol mixture (Reactions R6–R7 in Table 1), while fTEQ_du-ssAlk considers TEQ between gas and NVCs in the fine modes of dust and SS particles (Reactions R6–R12 in Table 1).
Next, we addressed the condensation of nitrate across the entire particle size range with runs employing the HYB and DBCLL mechanisms. We conducted two sensitivity runs with the HYB mechanism to explore the impact of implementing the HNO3(g) UPTK reaction on coarse dust only (HYB_duUPTK, Reaction R4 from Table 1) and on both coarse dust and SS (HYB_du-ssUPTK, Reactions R4 and R5), comparing their results to assess the relative contributions of dust and SS in heterogeneous chemistry under the assumption of HNO3(g) irreversible UPTK in the coarse mode.
In the HYB approach, all HNO3(g) and NH3(g) concentrations are initially available to condense in the fine mode through TEQ reactions. Only the HNO3(g) remaining after the TEQ calculation is considered for UPTK reactions in the coarse mode. This assumption may potentially lead to a misrepresentation of fine and coarse formation, such as the underproduction of fine and overproduction of coarse (Feng and Penner, 2007; Hauglustaine et al., 2014; Bian et al., 2017; Jones et al., 2021). To address this potential limitation, an additional simulation (HYB_DL) was conducted using the DIFFLIM calculation to distribute the HNO3(g) and NH3(g) gas that is kinetically available for condensation in the fine mode through TEQ and the HNO3(g) that can form coarse through UPTK reactions.
Furthermore, to assess the influence of the UPTK coefficient of HNO3(g) on the results, instead of using an RH function (see Sect. 2.2.1), we also conducted a simulation setting γ(HNO3)=0.1 for dust (HYB_g0p1), following experimental findings (Fenter et al., 1995; Hanisch and Crowley, 2001, 2003) and various modeling studies (Dentener et al., 1996; Liao et al., 2003; Bauer et al., 2004; Hodzic et al., 2006; Bauer et al., 2007; Feng and Penner, 2007).
Finally, we conducted four sensitivity simulations using the DBCLL mechanism, which accounts for reversible heterogeneous nitrate chemistry on both fine and coarse modes. These simulations evaluate the influence of alkalinity, including the DBCLL_noAlk run that excludes both dust and SS NVC content (Reactions R6–R7, Table 1), the DBCLL_duAlk run accounting for dust alkalinity only (Reactions R8–R11), and the DBCLL_du-ssAlk run accounting for both dust and SS alkalinity (Reactions R8–R12). Additionally, since all three cases use dust alkalinity from the average of the Journet et al. (2014) simulation, an additional simulation was performed using the average dust alkalinity from the Claquin et al. (1999) simulations (DBCLL_Claq) instead of that of Journet et al. (2014) to assess the effect of the specific dust alkalinity content used.
2.5 Experimental setup
The model simulations were conducted on a global domain at a spatial resolution of 1.4° longitude by 1.0° latitude, utilizing 48 hybrid pressure–sigma vertical layers up to 5 hPa. The dynamics time step was set to 180 s, and results were stored every 6 h. The analysis period is the year 2018 after a spin-up period of half a year to initialize the concentration fields. Meteorological variables were initialized from the ERA5 reanalysis (Hersbach et al., 2023) every 24 h to keep the modeled circulation close to observations. A meteorological spin-up of 12 h was used in each daily cycle before solving the chemistry. The initial state of the chemistry fields is that prognostically calculated by MONARCH the day before.
In addition to the meteorology-driven online emissions described in Sect. 2.1, the High-Elective Resolution Modeling Emission System version 3 (HERMESv3; Guevara et al., 2019) was employed to process both anthropogenic and biomass burning primary emissions. The global inventory CAMS-GLOB-ANT_v4.2 (Soulie et al., 2024) for 2016 was used for anthropogenic sources, with updated temporal profiles that provide gridded monthly, day-of-the-year, day-of-the-week, and hourly weighting factors for the temporal disaggregation of emitted fluxes (Guevara et al., 2021). The biomass burning emissions are provided by the GFASv1.2 dataset (Kaiser et al., 2012), which accounts for forest, grassland, and agricultural waste fires derived from satellite products. Oceanic natural emissions of DMS are provided by CAMS-GLOB-OCE_v3.1 (Lana et al., 2011; Denier van der Gon et al., 2023).
Table S1 summarizes the total emissions (anthropogenic, biogenic, and biomass burning) used in this work. The emitted mass of the main anthropogenic aerosol precursors is 104.4 Tg for SO2(g), 93.8 Tg for NOx(g), and 61.8 Tg for NH3(g).
Table 3The sensitivity experiments conducted in this study and the processes performed in each one of them (green boxes). Fine TEQ and coarse TEQ refer to the respective calculations of the TEQ for the fine and coarse modes of dust and SS, referred to as DU and SS, respectively. Coarse DU UPTK and coarse SS UPTK indicate the irreversible UPTK of HNO3(g) on coarse dust and SS, respectively. Alkalinity is denoted as alk., and for the dust alkalinity column, the alkalinity derived from the Journet et al. (2014) and Claquin et al. (1999) simulations is indicated by J and C, respectively.
2.6 Model evaluation
The model results are evaluated against surface observational datasets from several networks sourced from the Globally Harmonised Observational Surface Treatment (GHOST) project, an initiative of BSC's Earth Department dedicated to the harmonization of publicly available global surface observations (Bowdalo et al., 2024). Figure S13 in the Supplement shows the stations used for each of the species analyzed. For gas and aerosol nitrate, ammonia, and sulfate species, GHOST includes datasets from the Clean Air Status and Trends Network (US-EPA-CASTNET), the US EPA Air Quality System (US-EPA-AQS), and the Canada National Air Pollution Surveillance Program (NAPS) for North and Central America; the East Asia Acid Deposition Monitoring Network (EANET) for Asia; and the EBAS and the European Environmental Agency Air Quality (EEA AQ eReporting) for Europe.
These observations are filtered for rural and background sites only in order to exclude stations near emission sources not representative of the background conditions depicted by the model resolution, which describes the long-range transport of , , and formation. However, information on the station type was not available for the EANET and US-EPA-CASTNET data. For these networks, all stations were used, a factor that has to be accounted for when evaluating the results.
Regarding PM2.5 and PM10, GHOST includes data from the CHILE-SINCA network for Chile, the Beijing Municipal Ecological and Environmental Monitoring Center (BJMEMC), the China National Environmental Monitoring Centre (CNEMC), the WMO World Data Center for Aerosols (EBAS-WMO-WDCA) for Europe, the Japan National Institute for Environmental Studies (NIES), the Ministerio de Transición Ecológica (MITECO) for Spain, the UK AIR network for the United Kingdom, and the global AirNow DOS network (US-EPA-AirNow-DOS). For these networks, the station type was not included as a criterion for inclusion in the evaluation. The statistical metrics used in the evaluation are outlined in the Supplement Sect. S3 and the quality flags for the selected stations in Table S8.
Additionally, we compare our model results with the budgets reported in the literature (Hauglustaine et al., 2014; Bian et al., 2017; Rémy et al., 2022). Namely, the AeroCom phase III nitrate experiment (Bian et al., 2017) compares global budgets from nine global models for the year 2008. Particular discussion is devoted to results shown there from the GMI (Bian et al., 2009) and EMAC (Karydis et al., 2016) models that introduce approaches that are of interest to our work. Complementarily, results from Hauglustaine et al. (2014) and Rémy et al. (2022) are also used. The comparison provides a qualitative view of current estimates of particulate formation in the atmosphere and the role of representing key processes in models. Since results from the literature are provided for different years, some of the differences may be attributed to changes in emissions and environmental conditions.
3.1 Spatial distributions
The spatial distribution of nitrate species exhibits significant variability depending on the assumed formation mechanisms. Here, we analyze the results of the main sensitivity runs arranged in order of increasing complexity, as detailed in Sect. 2.4. These simulations range from a basic scenario that considers only fine formation while excluding dust and sea-salt alkalinity (i.e., fTEQ) to a comprehensive approach that incorporates reversible formation in both fine and coarse modes (i.e., HYB and DBCLL).
Spatial distributions of surface concentration, column load, and zonal average concentration for all sensitivity simulations (see Table 3) are averaged for 2018 and presented for HNO3(g) and particulate (Figs. 3, S1, and S2 in the Supplement), NH3(g) and (Figs. S4, S5, and S6 in the Supplement), and SO2(g) and (Figs. S7, S8, and S9 in the Supplement). To facilitate readability, the analysis of the HYB_g0p1, DBCLL_duAlk, and DBCLL_ClaqAlk runs is provided in Supplement Sect. S5.
3.1.1 Effects of omitting coarse nitrate formation
In the fTEQ_noAlk sensitivity run, fine particulate primarily forms in regions with significant anthropogenic pollution – areas where emissions of NOx(g), NH3(g), and SO2(g) are dominant – such as northern China and India, Europe, and eastern North America. In these regions, reaches average concentrations of 2 to 10 µg m−3 (Fig. 3e). At the surface, is mostly associated with fine , presenting concentrations between 1 and 3 µg m−3 (Figs. 3e and S4e in the Supplement). At higher altitudes, fine also forms in the presence of dust and SS, resulting in column burdens ranging from 1 to 3 mg m−2 (Figs. S5 and S8 in the Supplement). This occurs because neutralizes particulate , which forms when H2SO4(g) and SO2(g) condense on fine dust and SS particles.
The omission of dust and SS alkalinity leads to globally low pH values. Over oceanic and dusty regions, aerosol pH typically ranges from 1 to 2, while in industrialized regions, such as Europe and Asia, pH values can reach up to 5 (Fig. 4a).
Aerosol pH increases significantly when dust and SS NVC are included in the fTEQ_du-ssAlk run (Fig. 4b). This effect is especially pronounced over the open ocean, where pH increases from 1 to 5, and over dust source regions such as the Sahara Desert, where pH increases from 1 to 9.
Column burdens of HNO3(g) are notably affected by the elevated pH, decreasing by approximately 5 mg m−2 across the Northern Hemisphere compared to the fTEQ_noAlk scenario (Fig. S1d, g in the Supplement). This decline predominantly happens in the upper troposphere (above 500 hPa, Fig. S2d, g), where concentrations decrease by about 0.5 µg m−3 (Fig. S2 in the Supplement). Conversely, column burdens of fine increase substantially, by more than 5 mg m−2 over dusty regions such as the Saharan Desert and Middle East (Fig. S1e, h). In remote oceanic regions, fine column burdens increase by approximately 1 mg m−2, with transoceanic transport at low latitudes showing column loads ranging from 4 to 7 mg m−2 (Fig. S1h in the Supplement).
At the surface, the inclusion of dust and SS alkalinity has a minimal impact on continental HNO3(g) concentrations (Fig. 3d, g). Surface fine concentrations of about 0.5 µg m−3 are present across the equatorial belt, with higher values, up to 2 µg m−3, over remote dusty regions. However, no significant increase in fine concentrations is simulated in polluted areas such as Europe and Asia (Fig. 3e, h and Fig. S2e, h).
These results suggest that the condensation of HNO3(g) on dust and SS happens mostly during long-range transport, representing a key driver of nitrate formation in this scenario. They also indicate that incorporating Reactions (R8)–(R12) increases fine concentrations, with the majority forming on dust rather than on SS. This is attributed to the relatively higher alkalinity of dust compared to SS, as derived from the Journet et al. (2014) dataset (see Sect. 2.2.3).
3.1.2 Effects of assuming irreversible formation of coarse nitrate
The HYB methods exclude the possibility of coarse evaporating back to the gas phase, which may lead to positive biases in global burdens.
In the HYB_duUPTK sensitivity run, coarse forms exclusively on dust, redistributing the available HNO3(g) towards coarse production in regions affected by dust, such as the Middle East and East Asia. Coarse column loads average between 0.5 and 4.0 mg m−2 across the Northern Hemisphere, with peaks reaching 10–20 mg m−2 (Fig. S1l in the Supplement). Notably, this impact is less pronounced in the Saharan dust belt, where limited HNO3(g) availability constrains coarse formation. The production of coarse is accompanied by a modest reduction in fine column loads over dusty regions (around 1 mg m−2) compared to that in the fTEQ_du-ssAlk simulation, driven by the availability of HNO3(g) for fine formation.
The uptake of HNO3(g) significantly influences the long-range transport of , showcasing notable transatlantic and transpacific transport (Fig. S1 in the Supplement). This transport predominantly occurs below 800hPa, with concentrations around 1 µg m−3, although lower concentrations of coarse are also discernible at altitudes up to 400 hPa (Fig. S2 in the Supplement). At the surface, coarse concentrations also increase, ranging from 2 to 10 µg m−3 over regions such as China, India, and the Middle East (Fig. 3 l).
The HYB_du-ssUPTK run investigates the role of SS by enabling both Reaction (R4) and Reaction (R5) (Table 1).
The uptake of HNO3(g) on SS enhances the formation of coarse over the open ocean and those coastal areas affected by SS outbreaks (Fig. S11 in the Supplement). Surface concentrations in Europe and North America reach 1–2 µg m−3, with regions exceeding 5 µg m−3 significantly expanding (Fig. 3o). Coarse also becomes notable over western Siberia, eastern South America, and southern Africa (0.5–1 µg m−3) and over remote oceanic regions (0.2 µg m−3). Its presence extends to high altitudes in the Southern Hemisphere (Fig. S2o in the Supplement). Long-range transport of coarse is enhanced over oceans, with column burdens increasing by approximately 3.5 mg m−2 (Fig. S1o in the Supplement) compared to those in the HYB_duUPTK case. This increase is attributed to greater depletion of HNO3(g) through irreversible uptake over dust and SS (Fig. S1m in the Supplement), resulting in lower HNO3(g) concentrations in the atmosphere compared to the other simulations.
Results obtained by increasing the value of γ(HNO3) in the HYB_g0p1 scenario (Supplement Sect. S5 and Fig. S3) provide insights into the nature of the coarse transoceanic transport. While the inclusion of UPTK on SS enhances long-range transport, the HYB_g0p1 run shows a slight increase in coarse compared to HYB_du-ssUPTK, particularly over the Sahara and across the Atlantic and Pacific oceans. Although these differences are not major, they suggest that the availability of HNO3(g) may act as a limiting factor for coarse formation.
To further explore this phenomenon, we used the HYB_DL run, which is equivalent to the HYB_du-ssUPTK run but constrains the available gas using the DIFFLIM calculation (see Methods section). This approach results in coarse column burdens just below those obtained in HYB_g0p1. The similarity between HYB_DL and HYB_du-ssUPTK can be attributed to two possible factors: (1) HYB_DL conserves more HNO3(g) for reactions on coarse dust during long-range transport via Reactions (R4) and (R5) (Table 1) or (2) there is an intrinsic overestimation of the uptake coefficients, leading to similar coarse formation rates regardless of the HNO3(g) available. This is further discussed in Sect. 3.2.
Overall, results show that the HYB mechanisms preferentially condense HNO3(g) via TEQ in the fine mode and over SS through R5 in the coarse mode rather than over coarse dust through R4, as noted here and also assessed in subsequent sections.
A comparison of the spatial distributions obtained by the EMEP, INCA, and GMI models in Bian et al. (2017), which employ HYB approaches similar to our HYB_du-ssUPTK run, reveals comparable trends. All models show significant formation of total (fine and coarse) over polluted regions, although our results, ranging from 10 to 25 mg m−2, generally exceed the column loads reported by AeroCom models, which range from 7 to 16 mg m−2 (Fig. S1n, o in the Supplement). AeroCom models do not show such the pronounced transport of coarse across the North Atlantic, as was observed in our study, with column burdens of 0.2–0.5 mg m−2 compared to 4 mg m−2 in our results. Section 3.4 further investigates the excessive formation of particulate in the HYB mechanism in terms of the total nitrogen budget.
A closer comparison with Hauglustaine et al. (2014), using the LMDz-INCA model with UPTK reactions on dust and SS, shows strong agreement with our HYB_duUPTK run but not with HYB_du-ssUPTK. For instance, concentrations of total over polluted areas in Hauglustaine et al. (2014) align with HYB_duUPTK in both geographical distribution and magnitude (14–20 mg m−2 in HYB_duUPTK vs. 10–20 mg m−2 in Hauglustaine et al. (2014), Fig. S1l). Similarly, Hauglustaine et al. (2014) simulate fine transport downwind of the Sahara and coarse across the North Atlantic, with column burdens around 1–2 mg m−2, slightly below our HYB_duUPTK results of 1–5 mg m−2. This preferential similarity of Hauglustaine et al. (2014) to HYB_duUPTK rather than HYB_du-ssUPTK, may be attributed to the HNO3(g) UPTK coefficient for SS employed in Hauglustaine et al. (2014). For this reaction, instead of a constant value as used in HYB_du-ssUPTK, Hauglustaine et al. (2014) use a function of RH ranging from to 0.1, leading to lower formation over SS in their model. This comparison suggests a potential overestimation of the UPTK coefficient for HNO3(g) on SS in the HYB_du-ssUPTK simulation. This conclusion is further discussed in the observational evaluation (Sect. 3.2) and the budget analysis (Sect. 3.4).
As a final remark, it is important to note that, similar to the findings of Hauglustaine et al. (2014), the HYB_duUPTK simulations overestimate particulate concentrations compared to observational data, as discussed in Sect. 3.2.
To further investigate the source of the coarse overestimation in the HYB_du-ssUPTK simulation, we compare our spatial distributions with those from Jones et al. (2021), which employ a similar HYB mechanism using the Met Office Unified Model (UM). In Jones et al. (2021), fine formation is computed using adaptations from Hauglustaine et al. (2014), specifically by testing different accommodation coefficients for HNO3(g) onto preexisting ammonium nitrate aerosols – although this adjustment has minimal impact on coarse concentrations. Coarse is formed through the uptake of HNO3(g), with coefficients sourced from Fairlie et al. (2010) for dust and Burkholder et al. (2020) for SS. Despite using different uptake coefficients for HNO3(g) on SS, the resulting coarse distribution is broadly comparable to that of the HYB_du-ssUPTK simulation. However, key differences emerge between the two models. Compared to the Jones et al. (2021) model, HYB_du-ssUPTK exhibits a stronger tendency for coarse formation over polluted areas such as Europe, eastern North America, and Asia (8–20 mg m−2 in HYB_du-ssUPTK vs. 4 mg m−2 in Jones et al., 2021), as well as over oceanic regions (1.5–3.0 vs. 0.4–2.0 mg m−2) rather than over sub-Saharan areas. Remarkably, significant North Atlantic transport of coarse (2.0–4.0 mg m−2) is only present in our simulation and is absent in Jones et al. (2021). The global budget comparison in Sect. 3.4 and Table 5 further highlights the fact that Jones et al. (2021) report significantly lower global burdens compared to our HYB runs, including HYB_duUPTK. This suggests that the HYB mechanisms in our simulations may produce coarse excessively, as both the burdens and distributions of coarse in Jones et al. (2021) are consistently lower, despite also accounting for SS in nitrate formation.
Nevertheless, several alternative explanations could account for the differences between the models. These include differences in the fine formation mechanism, variations in the study period (2018 in our study vs. a 20-year average in Jones et al., 2021), and differing parameterizations of HNO3(g) uptake on SS.
Overall, the comparison of spatial distributions between our HYB mechanisms and those reported in the literature supports the initial hypothesis that the assumption of irreversible HNO3(g) uptake, and potentially the uptake coefficients used, may contribute to the overestimation of formation. This issue is examined in greater detail in Sects. 3.2 and 3.4.
3.1.3 Effects of accounting for reversible formation of coarse nitrate
The DBCLL simulations (described in Sect. 2.4 and Tables 2 and 3) assess the impact of reversible chemistry and the roles of dust and SS NVC in nitrate partitioning.
The DBCLL_noAlk run produces spatial distributions of HNO3(g) and fine similar to those in the fTEQ_noAlk run. HNO3(g) remains predominantly in the gas phase across the Northern Hemisphere (Fig. S1p in the Supplement), while fine primarily associates with fine over regions lacking dust or SS influence, such as parts of China, India, Europe, and eastern North America (Fig. 3q). Minimal concentrations of fine are simulated at higher altitudes (Fig. S2q in the Supplement), although fine coexists with sulfate particles at elevated levels, as observed in the fTEQ_du-ssAlk case. In contrast, coarse is nearly absent in DBCLL_noAlk, with only minimal surface concentrations over northern China (0.4 µg m−3) and no clear correlation with dust and SS presence (Fig. 3r). Coarse formation is similarly limited, with a slight presence over the Persian Gulf and the Sahara (0.02–0.1 mg m−2), primarily in anthropologically polluted regions where it forms alongside coarse (0.2 mg m−2) (Figs. S5r and S8r). The simultaneous formation of coarse and particles is attributed to diffusion limitation, where NH3(g) preferentially neutralizes coarse sulfate particles.
The differences between fTEQ_noAlk and DBCLL_noAlk illustrate the impact of diffusion limitation before the partitioning of semivolatile species. While fine formation remains consistent between both runs, the assumption of allowing all acid species to partition into the fine mode in fTEQ_noAlk leads to enhanced fine particle production and long-range transport – an effect not observed in DBCLL_noAlk. Consistently, the pH in the fine mode closely mirrors that in fTEQ_noAlk, while the pH of particles in the coarse mode indicates even greater acidity (Fig. 4f1, f2).
Including dust and SS alkalinity in DBCLL_du-ssAlk produces an important increase in the pH over arid regions and oceanic regions – from 1 to 5–6 in the fine mode and above 7 in the coarse mode – compared to DBCLL_noAlk (Fig. 4h1, h2). Relative to DBCLL_du-Alk (dust alkalinity only; see Supplement Sect. S5), DBCLL_du-ssAlk redistributes the partitioning toward the coarse mode: fine concentrations approximately halve across regions, while coarse surface concentrations and column loads roughly double over dusty regions but not over the ocean (Fig. 3w, x and S1w, x). This shift leads to enhanced transatlantic and transpacific transport, with column loads of 2–4 mg m−2, surface concentrations of 0.4 µg m−3, and zonal averages of 0.5–1.0 µg m−3. Over continental regions with dust concentrations, coarse reaches column loads of 4–5 mg m−2 and surface concentrations of 0.5–1.0 µg m−3. Additionally, HNO3(g) surface concentrations increase from 0.1 to 1.0 µg m−3 in the heavily polluted areas (Fig. 3s, v). The enhancement of coarse formation is attributed to SS NVCs (see Sect. 2.2.3), with Cl− suppressing fine formation and leaving more HNO3(g) available for transport and subsequent coarse formation over dusty regions.
Including SS alkalinity reduces fine loads over Europe and eastern North America from 3 to 1 mg m−2 and slightly lowers values over Asia (2–3 mg m−2). Conversely, coarse increases over Europe and eastern North America (0.1–0.2 mg m−2), Asia (up to 1.0 mg m−2), and transoceanic regions (0.1 mg m−2) (Fig. S5x in the Supplement). This redistribution mirrors the particulate patterns, highlighting the strong coupling between these species when TEQ is applied to both fine and coarse partitioning. These results emphasize the sensitivity of nitrate formation to SS alkalinity, particularly due to basic NVCs like Na+.
Compared to the HYB_du-ssUPTK run, DBCLL_du-ssAlk shows lower coarse concentrations and shifts coarse formation toward dusty rather than anthropologically polluted areas. For example, over Europe, surface concentrations in DBCLL_du-ssAlk do not exceed 0.5 µg m−3, while HYB_du-ssUPTK reports 1–2 µg m−3 (Fig. 3x).
Overall, regardless of the mechanism used, the results demonstrate the high sensitivity of formation to dust and SS alkalinity, significantly altering its spatial distribution (Reactions R8 to R12, Table 1). However, implementing the DIFFLIM calculation in the DBCLL mechanism has a limited impact, as shown by the comparison between fTEQ_noAlk and DBCLL_noAlk.
We compare DBCLL_du-ssAlk and the results from the EMAC model (Karydis et al., 2016), which similarly employs TEQ for the bulk gas and aerosol mass, followed by DIFFLIM. Additionally, EMAC makes use of globally heterogeneous dust alkalinity based on 12 mineralogy source data points. Results from the EMAC model are reported in Bian et al. (2017) and Karydis et al. (2016) (Table 5 and Supplement Sect. S4). Surface distributions of aerosol are closely aligned in both models over Europe and North America, with surface concentrations ranging from 1 to 3 µg m−3. However, DBCLL_du-ssAlk shows higher concentrations over Asia, India, and the Middle East compared to EMAC (5–10 µg m−3 vs. 6–15 µg m−3, respectively). Additionally, our results show some variations over secondary areas compared to those of Karydis et al. (2016). EMAC reports biases, such as underestimating coarse over southern Europe and central-eastern Asia, attributed to excessive sulfate condensation on dust – a limitation mitigated in our study due to lower sulfate levels (Fig. S7 in the Supplement). Additionally, while EMAC overestimates fine over the Arctic, this is not observed in our results due to the RH and temperature restrictions applied in ISORROPIA-II (see Sect. 2.2.2). Over central Africa, EMAC overpredicts coarse due to excessive HNO3(g) from biomass burning coupled with low H2SO4(g) concentrations from where Karydis et al. (2016) suggested that an HYB approach could reduce the bias. Our DBCLL_du-ssAlk and HYB runs report lower concentrations, although still potentially overestimated due to too-low HNO3(g) levels. Total particulate and are in close agreement in both EMAC and the DBCLL_du-ssAlk run (Fig. S4w, x and S7w, x in the Supplement), with only slightly higher formation of coarse over the Indian subcontinent in MONARCH compared to EMAC.
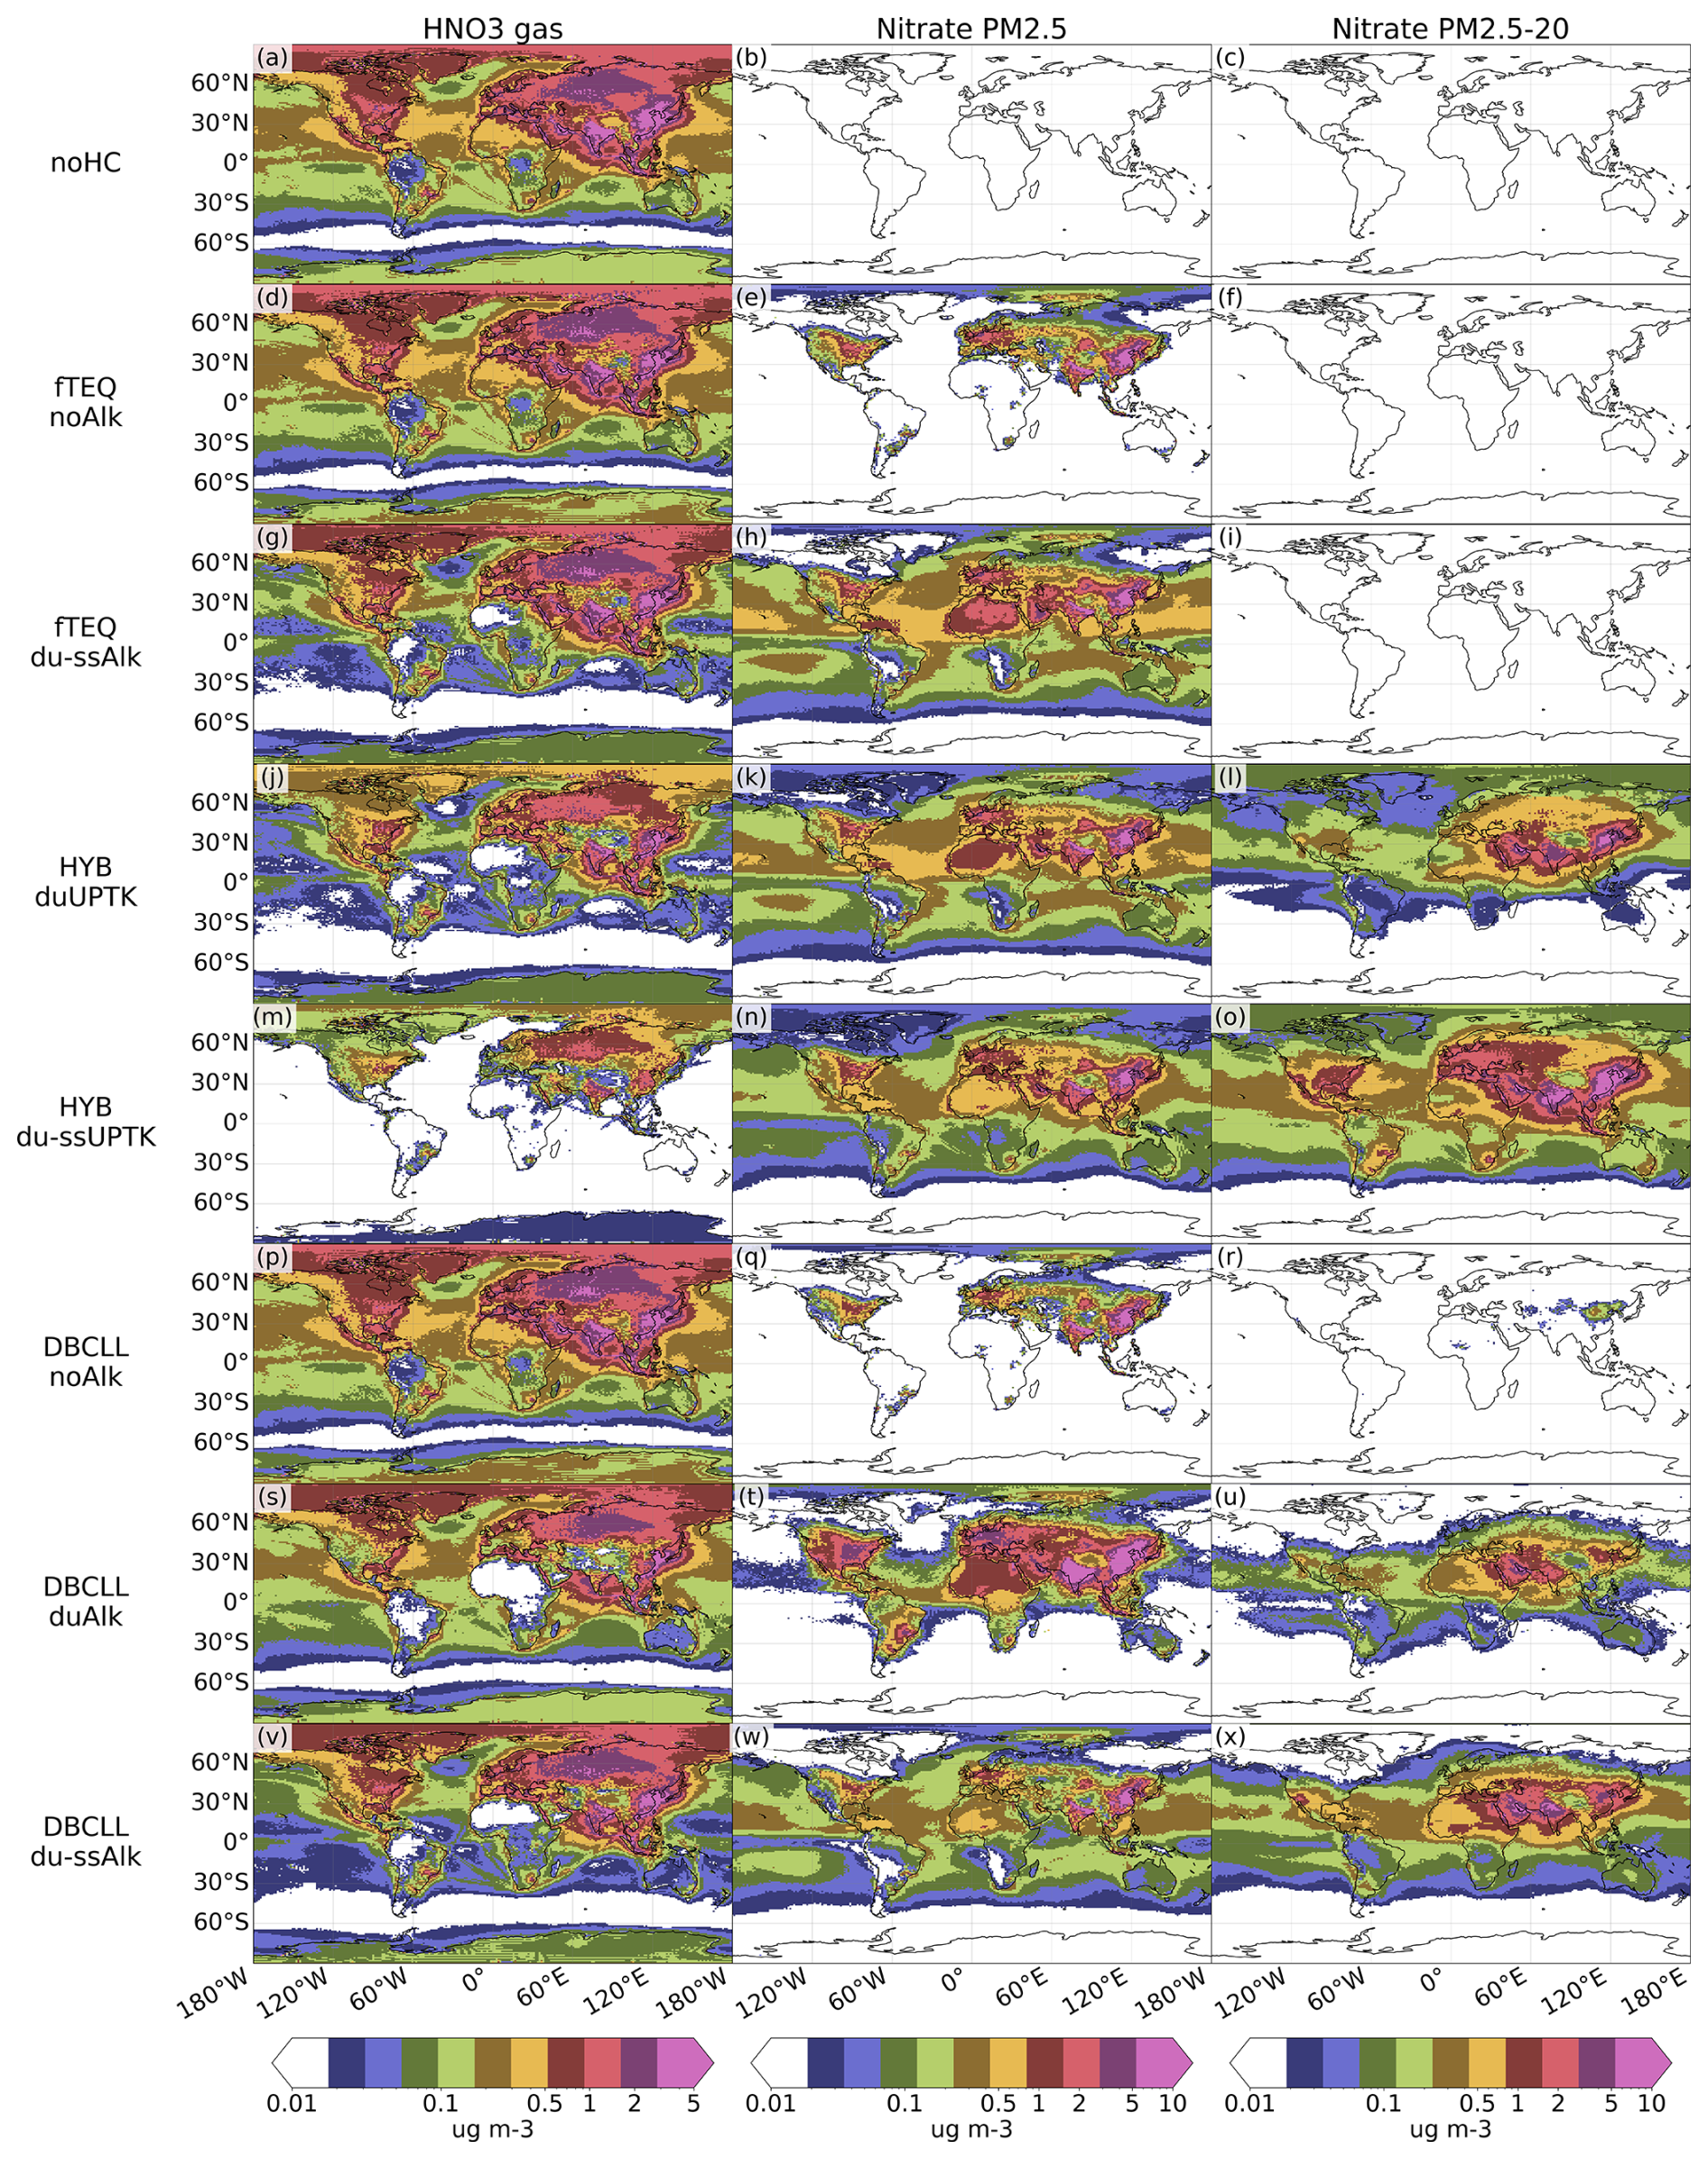
Figure 3Surface concentrations (µg m−3) of HNO3(g) and fine and coarse simulated by the different mechanisms and averaged for 2018.
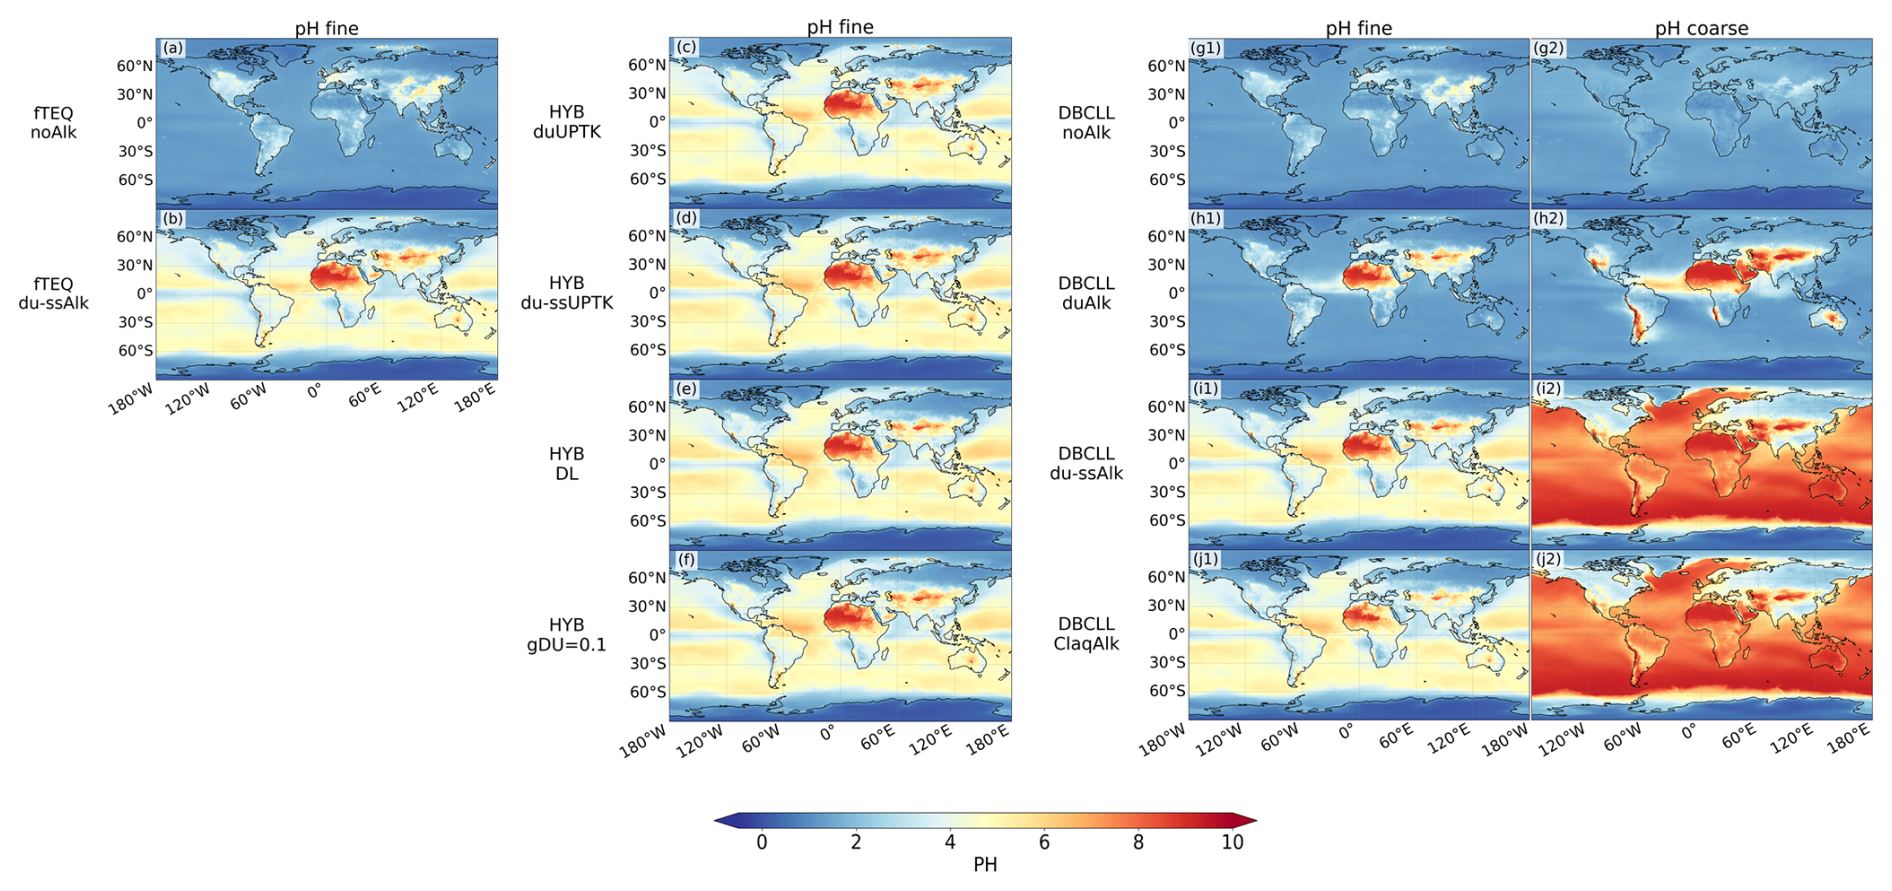
Figure 4Surface pH of the mechanisms studied for fine and coarse aerosol size modes, averaged for 2018.
3.2 Evaluation with observations
To assess the performance of each sensitivity run, we compare simulated surface concentrations of key species involved in nitrate formation with observational data, as described in Sect. 2.6. This evaluation includes analyses of both statistics and time series of monthly mean values, focusing on how effectively each modeled mechanism captures observed nitrate variability on a global scale. Globally averaged results are shown in Fig. 5, while region-specific evaluations for Europe, Asia, and central North America are presented in Fig. S12 in the Supplement. It is important to note that the number of stations and spatial coverage vary significantly by species, as illustrated in Fig. S13. Consequently, certain evaluation metrics may not fully reflect global model performance and could instead represent accuracy in data-rich regions.
Correlation coefficients, bias, and root-mean-square error (RMSE) metrics for the different sensitivity simulations are reported in Table 4, with methodological details outlined in Supplement Sect. S3. A detailed evaluation of the HYB_g0p1, DBCLL_duAlk and DBCLL_ClaqAlk simulations is available in Supplement Sect. S5. Additionally, a similar evaluation for total reduced and oxidized nitrogen species is presented in Supplement Sect. S6 and further discussed in Sect. 3.3.2.
3.2.1 Nitrate species
Fine particulate nitrate (PM2.5NO3) is consistently formed by all mechanisms (through TEQ), with the exception of the DBCLL scheme, which incorporates a DIFFLIM coefficient to limit its formation. Consequently, the fTEQ and HYB mechanisms produce higher PM2.5NO3 from October to April (0.5–1.0 µg m−3) than DBCLL does, which reports approximately half of these values. This discrepancy is more pronounced over North and Central America than in Europe, although both regions exhibit similar seasonal patterns. From April to October, differences among mechanisms diminish, except in the HYB_du-ssUPTK, which significantly overestimates PM2.5NO3 during these months.
Notably, the runs considering the effects of dust and SS alkalinity in the partitioning process reduce the negative bias in PM2.5NO3 significantly, especially during February.
Greater variability among experiments emerges when evaluating HNO3(g) and Total , with more observational data available over North and Central America than over Europe or Asia. This variability is highly influenced by how each mechanism models coarse formation, especially over Asia (Fig. S12 in the Supplement). For example, the HYB runs, which rely on irreversible uptake reactions, consistently overestimate total across all regions. In contrast, the DBCLL runs, which assume reversible partitioning, align better with observations.
From the HYB simulations, the HYB_duUPTK run demonstrates strong correlation coefficients for both fine and total concentrations (0.8 and 0.9, respectively). The seasonal variability in this run closely resembles that of the fTEQ_noAlk and fTEQ_du-ssAlk experiments, which fully neglect coarse formation. This similarity suggests a limited number of sites affected significantly by coarse formation, while highlighting the relevant role of the TEQ calculation in the fine mode. Despite showing a systematic positive bias (0.03, 0.04, and 0.29 µg m−3 for HNO3(g), fine , and total , respectively), HYB_duUPTK maintains consistency across continents. However, it notably overestimates total over Asia in November and over Europe from May to September, likely due to dust events affecting the monitoring sites.
Including the UPTK reactions on SS in the HYB_du-ssUPTK run exacerbates this overestimation due to excessive HNO3(g) condensation into coarse . Specifically, the correlation for total drops from 0.9 to 0.66, HNO3(g) concentrations are underestimated (bias of −0.10 µg m−3), and total surface concentrations are overestimated by 1.50 µg m−3 – the highest bias among all sensitivity runs (Table 4). This overestimation is most pronounced over Asia (3–5 µg m−3 vs. 1 µg m−3) and North and Central America (1.5–2.5 µg m−3 vs. 1.0 µg m−3). Discrepancies in European sites are more pronounced during summer and fall (Fig. S12 in the Supplement).
To evaluate whether this overestimation results from unlimited HNO3(g), we examined the HYB_g0p1 and HYB_DL configurations (Supplement Sect. S5). Increasing the uptake coefficient γ(HNO3) in HYB_g0p1 further enhances the overestimation of total by an additional 30 %, suggesting that HNO3(g) availability is not the limiting factor. Similarly, HYB_DL shows only a marginal reduction in total bias (from 1.5 to 1.3 µg m−3), reinforcing the idea that the overestimation stems from the overly high γ(HNO3) values for SS particles, as previously discussed in Sect. 3.1.2. This highlights the need to refine HYB schemes.
Conversely, DBCLL mechanisms markedly reduce surface concentration biases. Without alkalinity, the total bias shifts from 0.29 to −0.43 µg m−3 between the HYB and DBCLL runs. Incorporating dust and SS NVCs further improves the bias, reducing it from 1.5 to −0.1 µg m−3 between the HYB_du-ssUPTK and DBCLL_du-ssAlk runs (Table 4). All consistently achieve high correlation coefficients (approximately 0.8).
However, the DBCLL_noAlk run tends to underestimate total (bias of −0.43 µg m−3) and overestimates HNO3(g) (bias of +0.13 µg m−3), failing to capture its seasonal cycle (correlations of 0.06). Surprisingly, the fTEQ runs outperform DBCLL_noAlk despite neglecting coarse formation.
Including dust and SS alkalinity in DBCLL_du-ssAlk substantially improves these biases. Enhanced condensation of HNO3(g) into both fine and coarse (Fig. 5) yields a reduced bias in total (−0.10 µg m−3) and a strong seasonal agreement, with correlation coefficients of 0.82 and 0.78 for fine and total , respectively. These results also outperform the DBCLL_duAlk run, which excludes SS alkalinity (Supplement Sect. S5 and Table S7).
The evaluation of the DBCLL experiments highlights the paramount importance of accounting for formation on both dust and SS to accurately represent HNO3(g) and particulate concentrations.
The sensitivity of model performance to the dust NVC representation is further assessed using the DBCLL_Claq run, which applies an average dust alkalinity based on Claquin et al. (1999) instead of on Journet et al. (2014) (see Sect. 2.2.3). Results show limited differences compared to DBCLL_du-ssAlk, with the correlation and bias for total just slightly improved in DBCLL_Claq, at 0.81 and −0.09 µg m−3, respectively (Supplement Sect. S5 and Table S7). The time series from Fig. S14 compared to Fig. 5 also shows comparably similar results when using DBCLL with the Claquin et al. (1999) or Journet et al. (2014) mineral datasets. Overall, based on the limited number of observation sites used in our evaluation, the impact of dust NVC representation on surface concentrations does not appear to be significant at the observational points.
3.2.2 Ammonia and particulate ammonium
Results for NH3(g) and particulate are generally more consistent across all mechanisms compared to outcomes. This consistency is expected, as all sensitivity runs use the same condensation pathway for the conversion of NH3(g) to fine through Reactions (R6) and (R7) (Table 1).
All mechanisms effectively capture the seasonal cycle of both NH3(g) and fine . Correlation coefficients for NH3(g) range from 0.85 to 0.88, while those for fine range from 0.59 to 0.77. However, model performance is slightly weaker for total , with correlations between 0.41 and 0.54.
The DBCLL_du-ssAlk and DBCLL_Claq runs yield the lowest errors for . RMSEs are 0.17 µg m−3 for fine and 0.12 µg m−3 for total concentrations, with corresponding biases of −0.02 and 0.08 µg m−3 (Tables 4 and S7). These results highlight the significant sensitivity of predictions to the treatment of dust and SS NVCs. Including or omitting NVC representation notably affects the biases across different schemes. Unlike , increased particle alkalinity reduces the condensation of NH3(g), thereby limiting formation. This effect helps mitigate biases when compared to observational data.
Overall, biases for both fine and total remain relatively low in most experiments, ranging from −0.02 to 0.29 µg m−3.
3.2.3 Sulfur species
Results for SO2(g) and particulate are consistent across all sensitivity simulations. This consistency is expected since sulfate formation is independent of the pathways used for coarse formation. In all cases, particulate is produced from SO2(g) and H2SO4(g) in a similar manner (see Sect. 2.3). Differences arise solely from variations in the treatment of the γ(SO2) coefficient when accounting for dust alkalinity, which introduces slight differences in formation. Overall, the model slightly underestimates both SO2(g) and total , particularly at European monitoring sites. In contrasts, fine is marginally overestimated, mainly driven by observations from Central and North American sites. Temporal correlation coefficients average around 0.6, with slightly lower values for total .
For SO2(g), the slight mismatch with observational data primarily stems from the European evaluation, which presents a consistent negative bias of −0.5 µg m−3 throughout the period studied (Fig. S12 in the Supplement). Fine and total concentrations also show generally good agreement with observations. However, there is a modest overestimation of fine concentrations, with an average bias of 0.30 µg m−3, particularly over Central and North America. Conversely, total particulate surface concentrations are underestimated over Europe, with an average bias of −0.43 (Table 4 and Fig. S12 in the Supplement).
The negative bias in concentrations may be attributed to the sulfate formation scheme and sulfur emission inventories employed in our runs. Reevaluating the SO2(g) uptake coefficient could provide valuable insights. The current implementation uses the uptake coefficient function from Fairlie et al. (2010). Alternative formulations have been suggested in the literature, such as the uptake coefficient values proposed by Phadnis and Carmichael (2000) for SO2(g) uptake on dust and those by Song and Carmichael (2001) for uptake on SS, as reported in Li et al. (2012). Exploring these alternatives may help improve the model's representation of sulfur species.
3.2.4 Fine and total particulate matter
Results for PM2.5 and PM10 are consistent across the different sensitivity runs (Fig. 5), indicating that the total mass is more influenced by components other than secondary inorganic species.
Globally, the seasonal cycles of PM2.5 are reproduced well across all sensitivity runs, with correlation coefficients consistently around 0.75. However, annual PM2.5 concentrations are overestimated by an average of 20 µg m−3 (Table 4). In contrast, PM10 concentrations over Asia show good agreement with observations, indicating that the model underestimates coarse particulate matter (PM), especially at monitoring sites in mainland China (Supplement Figs. S12 and S13). It is important to note that regions with significant PM2.5 overestimation do not overlap with the limited sites where chemical composition measurements are available – locations where the model accurately represents total particulate and (Supplement Fig. S12). Our results suggest that the absence of anthropogenic coarse dust emissions in the CAMS emission inventory may hinder the formation of coarse inorganic species, including . The formation of coarse is critical for scavenging HNO3(g) and suppressing the formation of fine particulate by providing surfaces for heterogeneous reactions. The significant influence of typically neglected anthropogenic coarse PM emissions on nitrate formation has been emphasized in previous studies (e.g., Zhai et al., 2023), highlighting the need for improved emission inventories to better capture the interactions between coarse particles and nitrogen species.
In contrast, PM2.5 model results over Europe and North and Central America are well aligned with observations (Fig. S12). The evaluation of PM10 shows just slightly worsened RMSEs (ranging from 22.49 to 30.42 µg m−3) and correlation coefficients (from 0.36 to 0.46) compared to PM2.5 (RMSEs from 24.74 to 26.16 µg m−3 and correlations from 0.74 to 0.76, Table 4). This is attributed to the PM10 surface concentration underestimations over North and Central America, especially from April to September, which do not seem to be caused by the underestimation of any secondary inorganic aerosol species studied in this work. Over Europe, our results are in agreement with those reported by Jones et al. (2021).
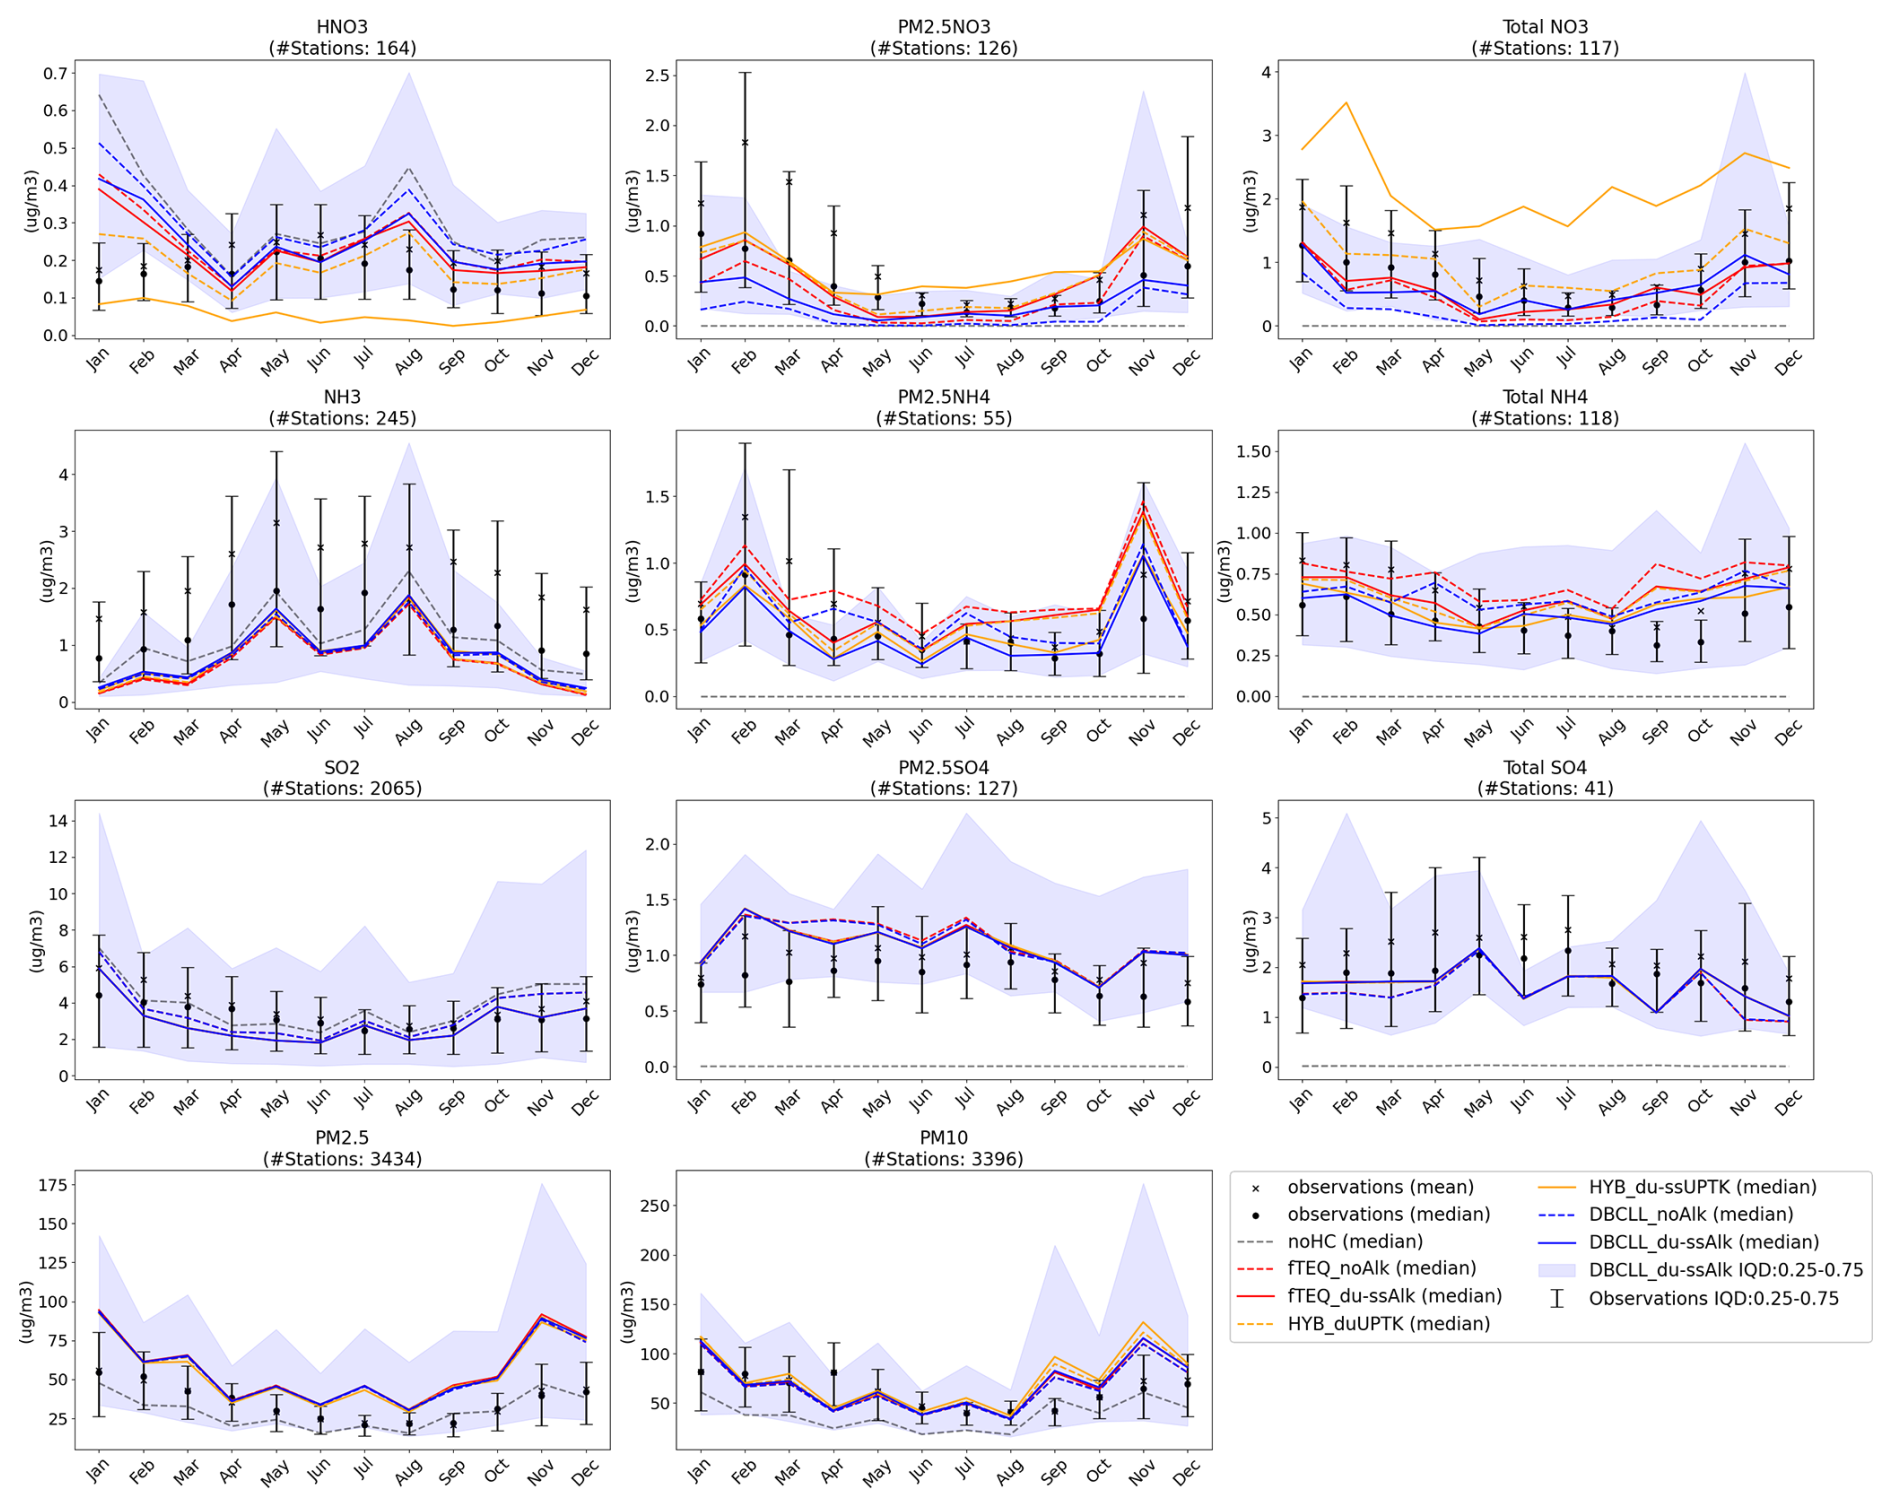
Figure 5Observational evaluation of gas and particulate species surface concentrations. Solid-black dots and crosses represent the monthly median and mean of the observations, respectively. Colored lines represent each configuration's monthly median over the observational points. Error bars are the observational interquartile 0.25 to 0.75 distance. Blue shading is the interquartile 0.25–0.75 distance for the DBCLL_du-ssAlk simulation. For the total modes, the available data from the European, Asian, and North and Central American stations have been averaged together, despite data from Asia and North and Central America referring to total particle concentration, while data from Europe is limited strictly to particles with diameters up to 10 µm.
Table 4Correlation coefficients, bias (µg m−3), and root-mean-square error (RMSE, µg m−3) of each configuration's median with respect to the median of the observations, corresponding to the time series shown in Fig. 5.
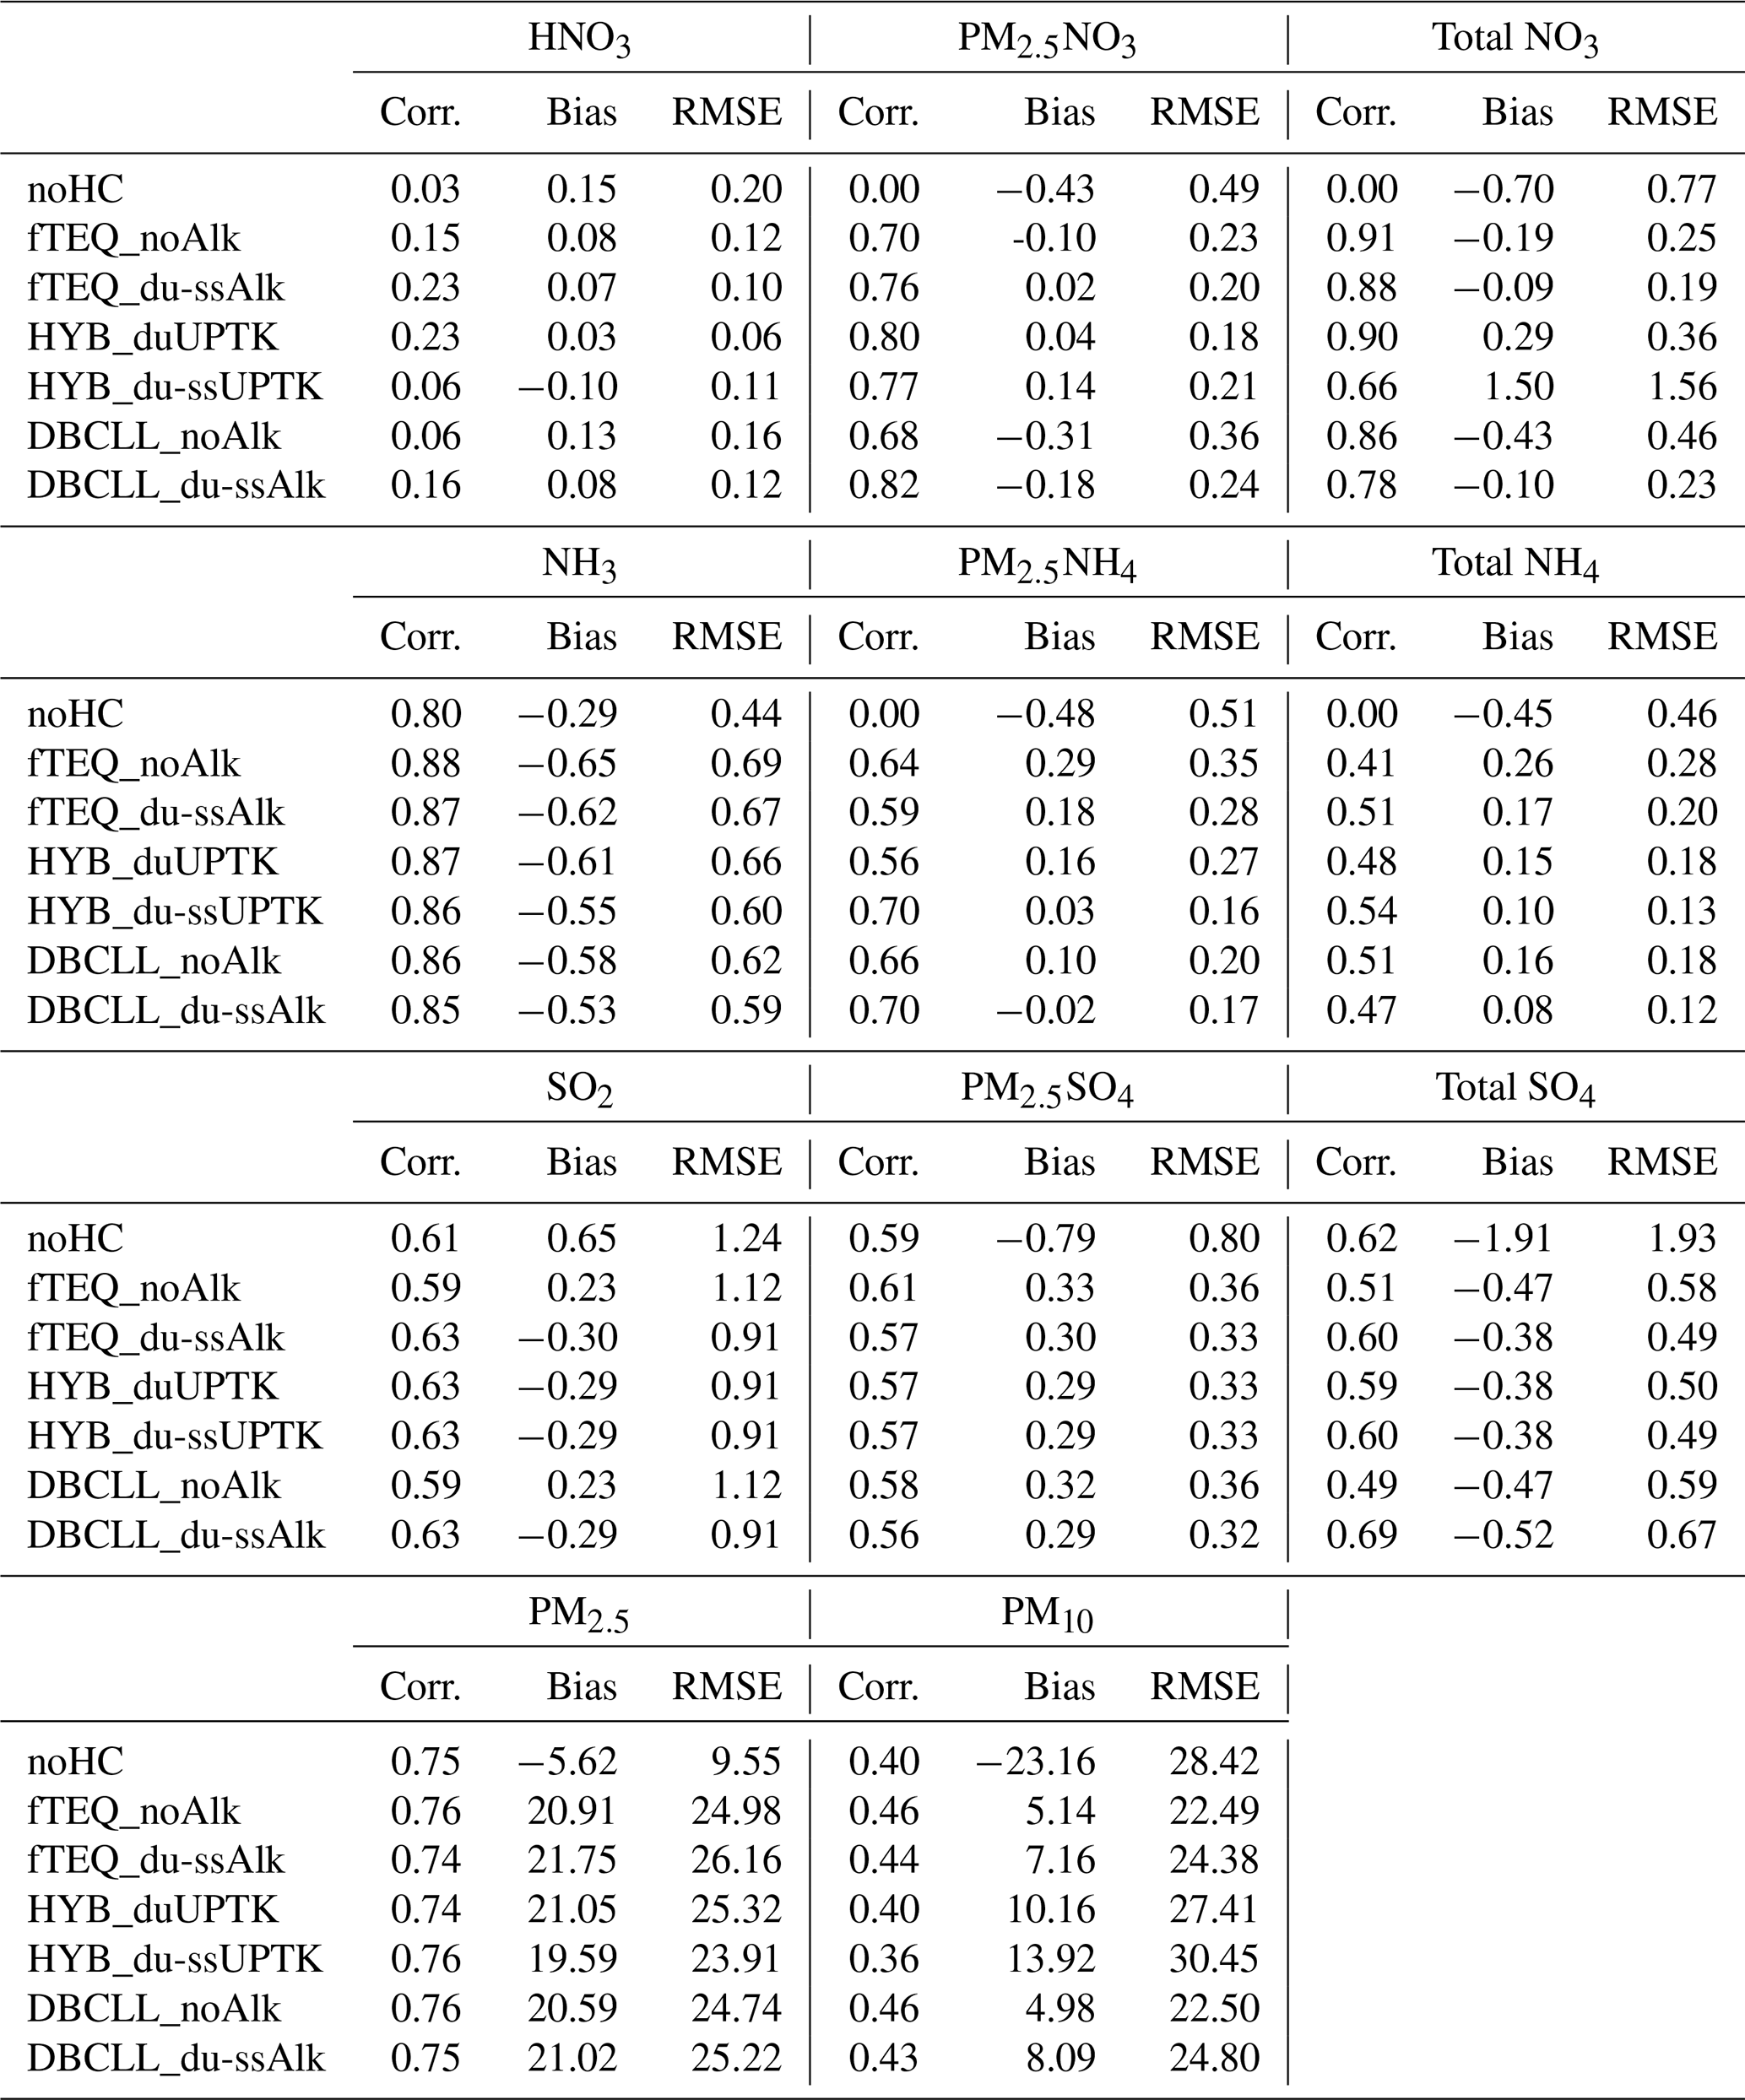
3.3 Nitrogen partitioning
In this section, we explore the impact of coarse particulate formation on the overall partitioning of atmospheric nitrogen between the gas and particle phases (Sect. 3.3.1). Additionally, we analyze how this formation influences the distribution of nitrogen between its oxidized and reduced forms (Sect. 3.3.2). The observational evaluation of surface concentrations of total reduced and oxidized nitrogen is presented in Supplement Sect. S6.
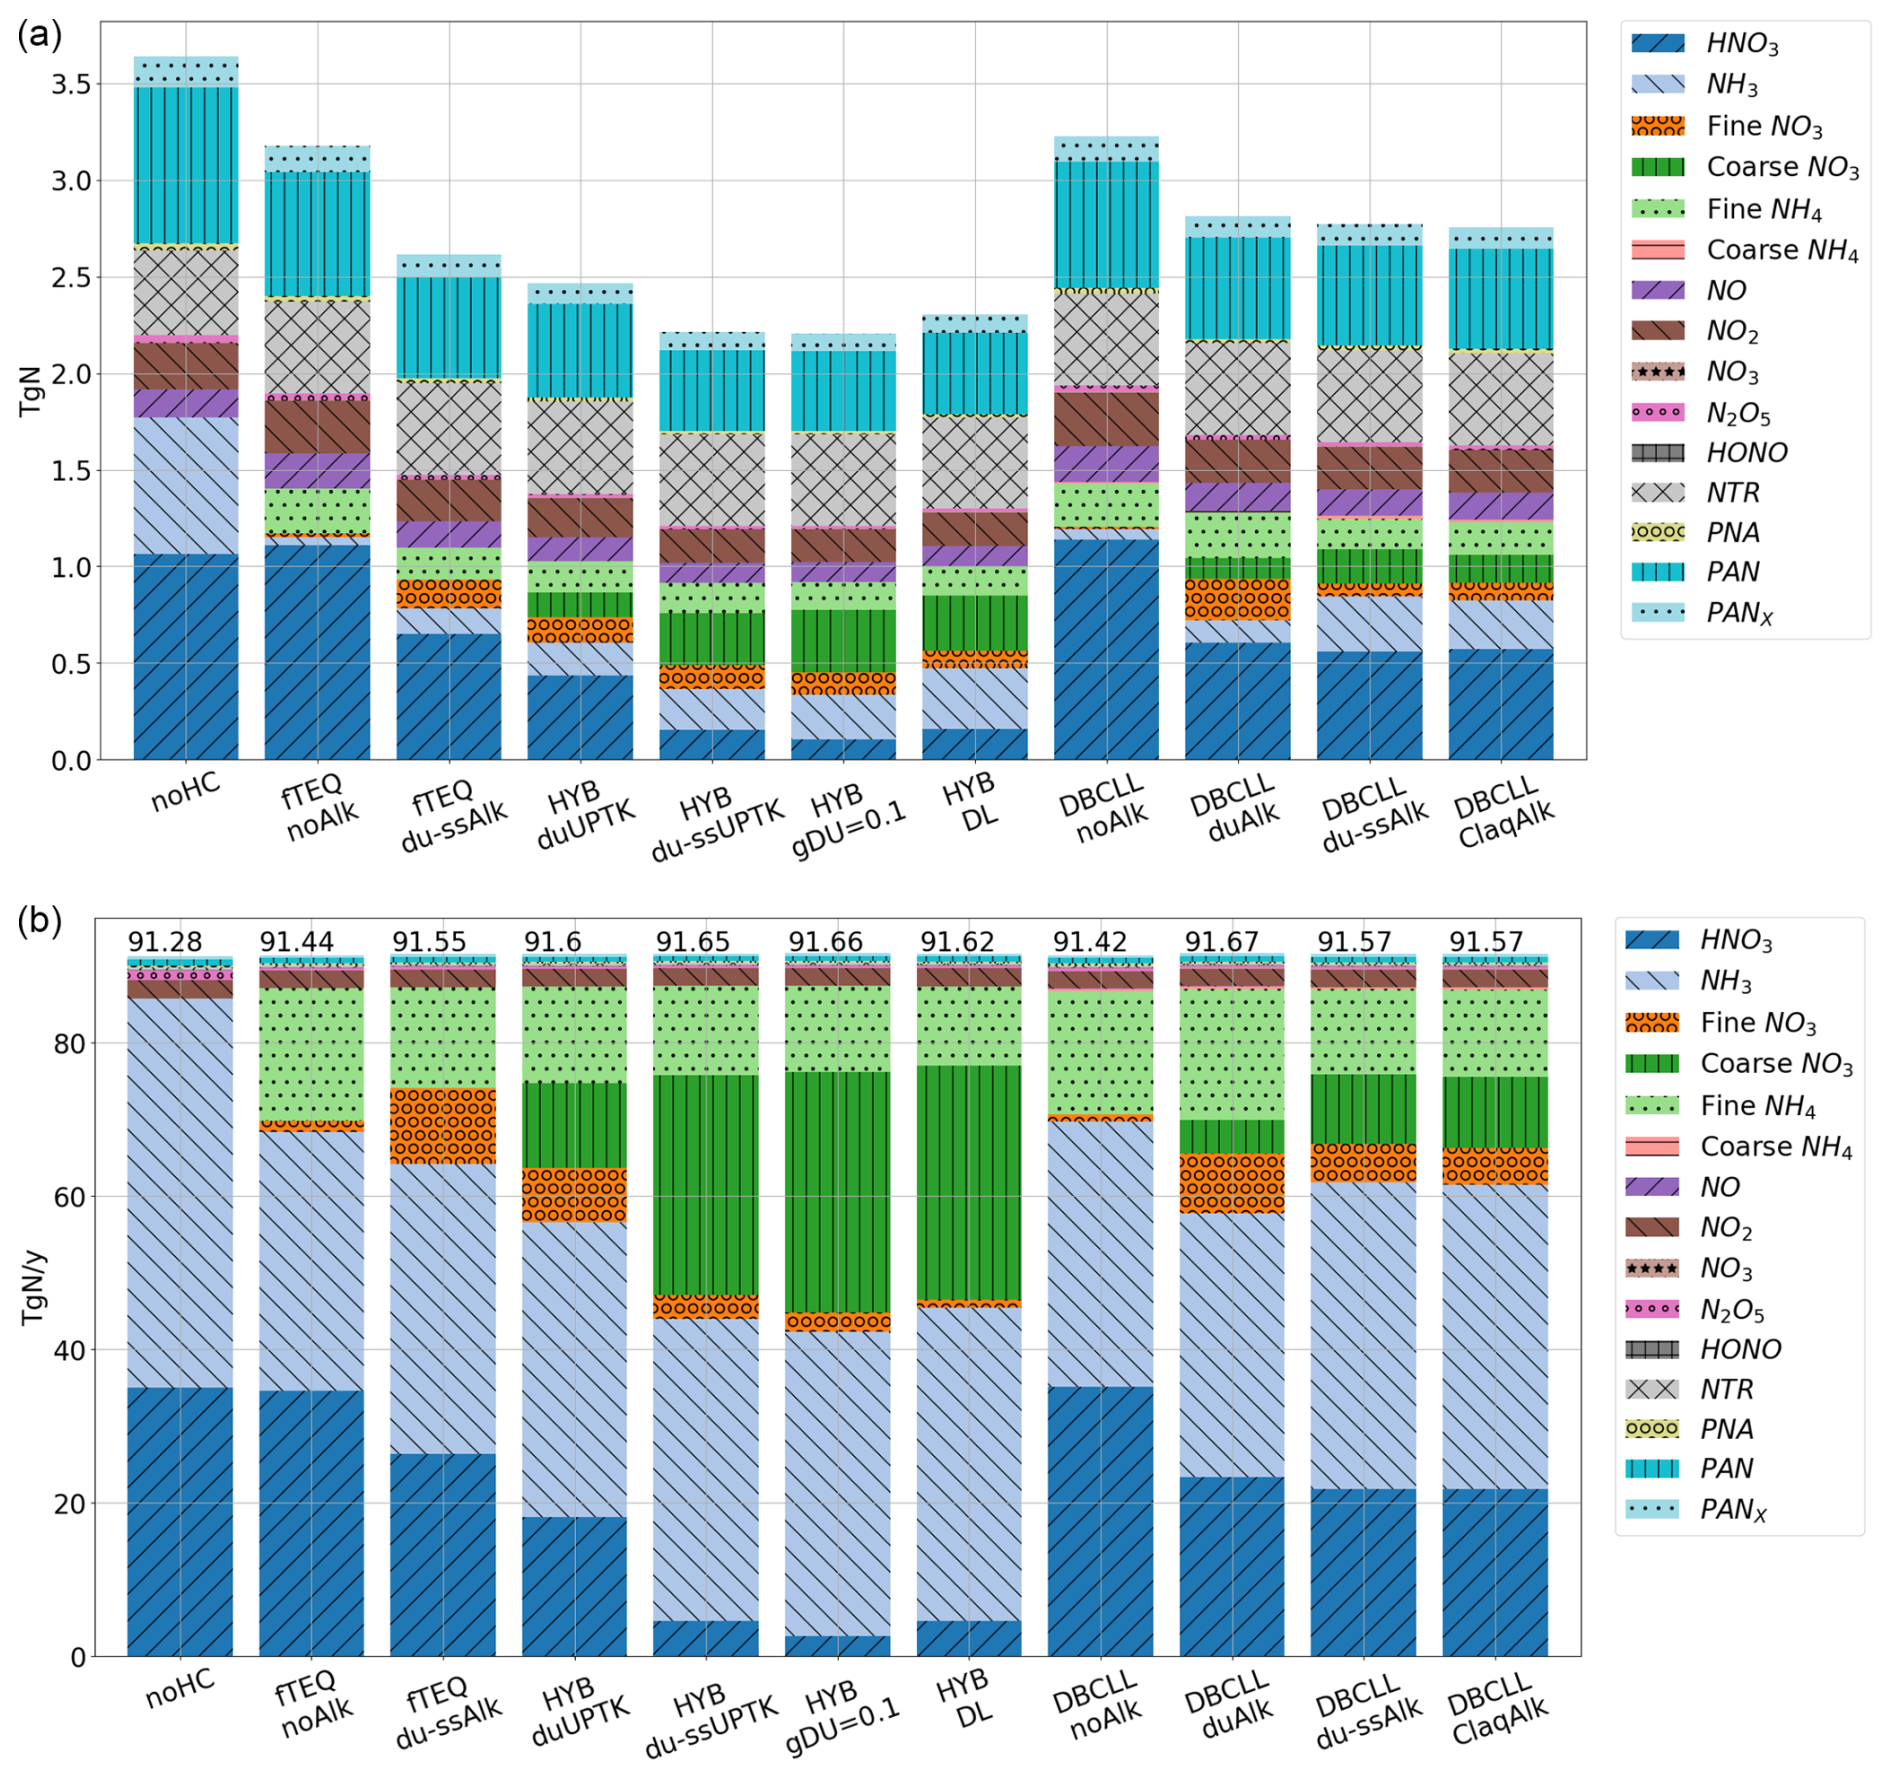
Figure 6Atmospheric nitrogen average burdens (a) and accumulated depositions (b) in teragrams of nitrogen (TgN) for the different dust heterogeneous chemistry mechanisms. The corresponding fractions of the nitrogen-containing species simulated in MONARCH are shown in each bar plot. Total nitrogen deposition is reported at the top of each bar of the deposition chart.
3.3.1 Partitioning between gas and particle phases
The partitioning of atmospheric nitrogen species into the gas and aerosol phases varies according to the underlying chemical assumptions. We analyze the average atmospheric burden and deposition of nitrogen species in the MONARCH model across sensitivity runs (Fig. 6 and Table S13 in the Supplement).
The simulation labeled noHC, excluding heterogeneous chemistry involving nitrate, serves as the baseline for understanding the distribution of nitrogen species in the gas phase. Under this configuration, the dominant nitrogen species are HNO3(g), peroxyacetyl nitrate (PAN), NH3(g), and NOx, with burdens of 1.06, 0.8, 0.71, and 0.38 TgN, respectively. The longer atmospheric lifetimes of HNO3(g) and PAN result from their chemical stability compared to more reactive NOx species. Notably, N2O5(g) plays a key role in nighttime HNO3(g) production via heterogeneous hydrolysis (Riemer et al., 2003).
The total nitrogen burden is highly sensitive to the nitrate formation mechanism. Schemes promoting efficient coarse mode formation significantly reduce nitrogen burdens.
For example, assuming irreversible condensation of HNO3(g) onto coarse particles reduces nitrogen load by 32 % and 40 % when considering dust only (HYB_duUPTK) and both dust and SS (HYB_du-ssUPTK), respectively. In HYB_duUPTK, 0.13 TgN partitions into fine and coarse on dust. Including SS (HYB_du-ssUPTK) further increases consumption of HNO3(g) and coarse formation, leading to a total burden of 0.27 TgN, while the fine burden remains unchanged at 0.12 TgN (Supplement Table S13).
Comparing HYB runs to fTEQ_du-ssAlk reveals that dust and SS uptake reduces HNO3(g) burdens by 0.21 TgN (dust) and 0.50 TgN (dust and SS) relative to TEQ-only partitioning. This is driven by irreversible uptake in the coarse mode. Consequently, the deposition rate of increases from 80 to 140 Tg yr−1, and its atmospheric lifetime decreases from 2.6 to 2.3 d (Table 5). The combined UPTK on dust and SS nearly depletes HNO3(g), leaving only 0.15 TgN, which contributes to the overestimation of surface (Sects. 3.1 and 3.2).
Irreversible condensation also reduces the NO(g), NO2(g), and N2O5(g) burdens to 0.11, 0.17, and 0.01 TgN, respectively, due to enhanced N2O5(g) hydrolysis on increased particle surfaces. This reduction can be attributed to increased particle formation and, consequently, the available surface where hydrolysis of N2O5(g) can take place. Ultimately, this produces more HNO3(g) available for partitioning into the particle phase.
Conversely, nitrogen loads increase when reversible condensation of HNO3(g) and NH3(g) is considered in the fTEQ and DBCLL sensitivity simulations. A larger proportion of nitrogen remains in the gas phase compared to in the HYB schemes. Notably, neglecting dust and SS alkalinity (fTEQ_noAlk, DBCLL_noAlk) slightly increases HNO3(g) burdens (from 1.11 to 1.14 TgN) and elevates NO(g) and NO2(g) by 0.29 % and 0.12 %, respectively. When dust and SS alkalinity are considered (fTEQ_du-ssAlk, DBCLL_duAlk, DBCLL_du-ssAlk), HNO3(g) burdens decrease by 40 %–50 %, enhancing particulate formation. This shift towards the aerosol phase results from the neutralization of NVC from dust and SS by HNO3(g). In these cases, the NO(g), NO2(g), and N2O5(g) budgets decrease by approximately 20 % compared to analogous mechanisms without alkalinity, driven by the more efficient N2O5(g) aqueous dissociation due to the increased particle presence. SS alkalinity alters the partitioning of aerosol from fine (−72 %) towards coarse mode (+63 %) when comparing DBCLL_duAlk and DBCLL_du-ssAlk, resulting in burdens of 0.06 (fine) and 0.18 TgN (coarse) (Fig. 6). This surge in coarse formation with dust and SS alkalinity causes a 26 % decrease in the total burden and a 14 % increase in deposition rates compared to the DBCLL_duAlk case, mainly driven by the enhanced wet deposition of coarse , from 11.0 to 27.5 Tg yr−1 (Table 5). This can be attributed to the higher deposition efficiency of SS particles due to their larger size ranges and abundances near the surface. Consequently, the presence of SS decreases the atmospheric lifetime of particulate from 4.9 to 3.1 d, contrasting with scenarios that consider only dust alkalinity.
Additionally, SS NVCs (e.g., Na+) inhibit NH3(g) condensation into , reducing burdens from 0.31 to 0.22 Tg (Table S11).
3.3.2 Reduced and oxidized nitrogen
Figure 7 presents the annual averaged burdens and depositions of oxidized (HNO3(g) and ) and reduced (NH3(g) and ) nitrogen for each sensitivity run. These results are compared with global estimates from the AeroCom phase III nitrate experiment (Bian et al., 2017), which offers a comprehensive range of budgets derived from different global aerosol models employing mechanisms similar to those analyzed in our study. As additional references, the results from the EMAC model (Karydis et al., 2016) and the LMDz-INCA model (Hauglustaine et al., 2014) are shown separately from the average of AeroCom in Fig. 7 due to their similarities to the DBCLL and HYB mechanisms, respectively.
The HYB mechanisms yield an annual average burden of oxidized nitrogen of 0.55 TgN, slightly below the AeroCom multimodel mean but in close agreement with that of Hauglustaine et al. (2014).
Compared to the fTEQ and DBCLL mechanisms that account for dust and sea salt (SS) alkalinity, which show higher oxidized nitrogen burdens (0.6–0.8 TgN), the HYB mechanisms fall on the lower end of the distribution. This reduction is primarily due to the efficient deposition of particulate and the limited atmospheric presence of HNO3(g) under the assumption of irreversible uptake, as discussed in Sect. 3.2 and 3.3.1.
For reduced nitrogen species, the HYB mechanisms produce an average burden of approximately 0.3 TgN, aligning well with the AeroCom mean. However, HYB configurations yield lower particulate burdens (0.15 TgN, Table S11 in the Supplement) and higher NH3(g) levels in the gas phase compared to the Hauglustaine et al. (2014) mechanism and others. Among HYB cases, NH3(g) budgets show an inverse relationship with HNO3(g), indicating that HNO3(g) acts as a limiting factor for the NH3(g) neutralization in the fine mode. Given that most HNO3(g) is consumed by the UPTK reactions in the HYB mechanism, these results suggest that the mass formed with this configuration is mainly a product of NH3(g) neutralization with sulfate through the fTEQ calculation.
The fTEQ and DBCLL mechanisms exhibit a high sensitivity in the partitioning of oxidized and reduced nitrogen to alkalinity, regardless of whether coarse formation is considered. When dust and SS alkalinity are neglected (fTEQ_noAlk and DBCLL_noAlk), oxidized nitrogen burdens rise significantly, to 1.1 TgN, primarily due to the accumulation of unreacted HNO3(g), which slightly exceeds the burden in the noHC run (1.05 TgN). This is attributed to the sensitivity of N2O5(g) hydrolysis to aerosol loading. Conversely, reduced nitrogen burdens in these schemes remain relatively low compared to other mechanisms due to the high consumption of NH3(g) by the neutralization of HNO3(g), which acts as an important sink of reduced nitrogen as particulate . The introduction of dust and SS NVCs into the reactions decreases oxidized nitrogen by an enhanced consumption of HNO3(g) to form . Furthermore, reduced nitrogen concentrations increase as a consequence of the lower availability of HNO3(g) to neutralize NH3(g). This phenomenon is similarly observed in simulations, including TEQ calculations over fine (fTEQ_du-ssAlk) and over both fine and coarse modes (DBCLL_duAlk and DBCLL_du-ssAlk). Comparatively, the presence of dust and SS alkalinity decreases the oxidized nitrogen burdens by approximately 27 % compared to analogous simulations neglecting NVCs. However, contrasting the results between DBCLL_duAlk and DBCLL_du-ssAlk shows that while the presence of SS NVCs further enhances the consumption of HNO3(g) by 20 %, it concurrently reduces burdens by 5 %. This is likely due to SS contributing acidic anions such as Cl− and (see Sect. 2.2.3), which hinders the formation of particulate in the fine mode and leaves more HNO3(g) available to form coarse over dust. This is consistent with the spatial distributions discussed in Sect. 3.1.3 and the nitrogen budgets presented in Sect. 3.3.1 and Fig. 6.
Alkalinity leads to higher reduced nitrogen budgets due to enhanced basic conditions (high pH, as shown in Fig. 4) facilitated by dust and SS NVCs. This environment inhibits NH3(g) condensation over dust and SS particles, thereby increasing the NH3(g) atmospheric lifetime (Table S10) and allowing it to mix with sulfate from polluted areas, as can be seen in the spatial correlation between particulate and (see discussion in Sect. 3.1 and Figs. S4 and S7). Consequently, alkalinity facilitates the formation of through the neutralization of NH3(g) by sulfate, contrasting with the neutralization process involving HNO3(g) observed in the DBCLL_noAlk simulation.
Overall, the DBCLL_du-ssAlk run aligns with the average of AeroCom in both oxidized and reduced partitions, although its reduced phase falls below EMAC levels. This discrepancy can be attributed to EMAC showing very low deposition rates of NH3(g) (see Table S10), which enhances its atmospheric burden.
The observational evaluation of both reduced and oxidized species, along with the monitoring stations used, can be found in the Supplement Sect. S6. Overall, general good agreement with observations is obtained. Oxidized nitrogen species exhibit low biases in all mechanisms except HYB_du-ssUPTK, which overestimates observations throughout the period studied, supporting the conclusion that the UPTK coefficients used are excessively efficient. Reduced nitrogen species, while slightly underestimated, remain well within the observational variability range.
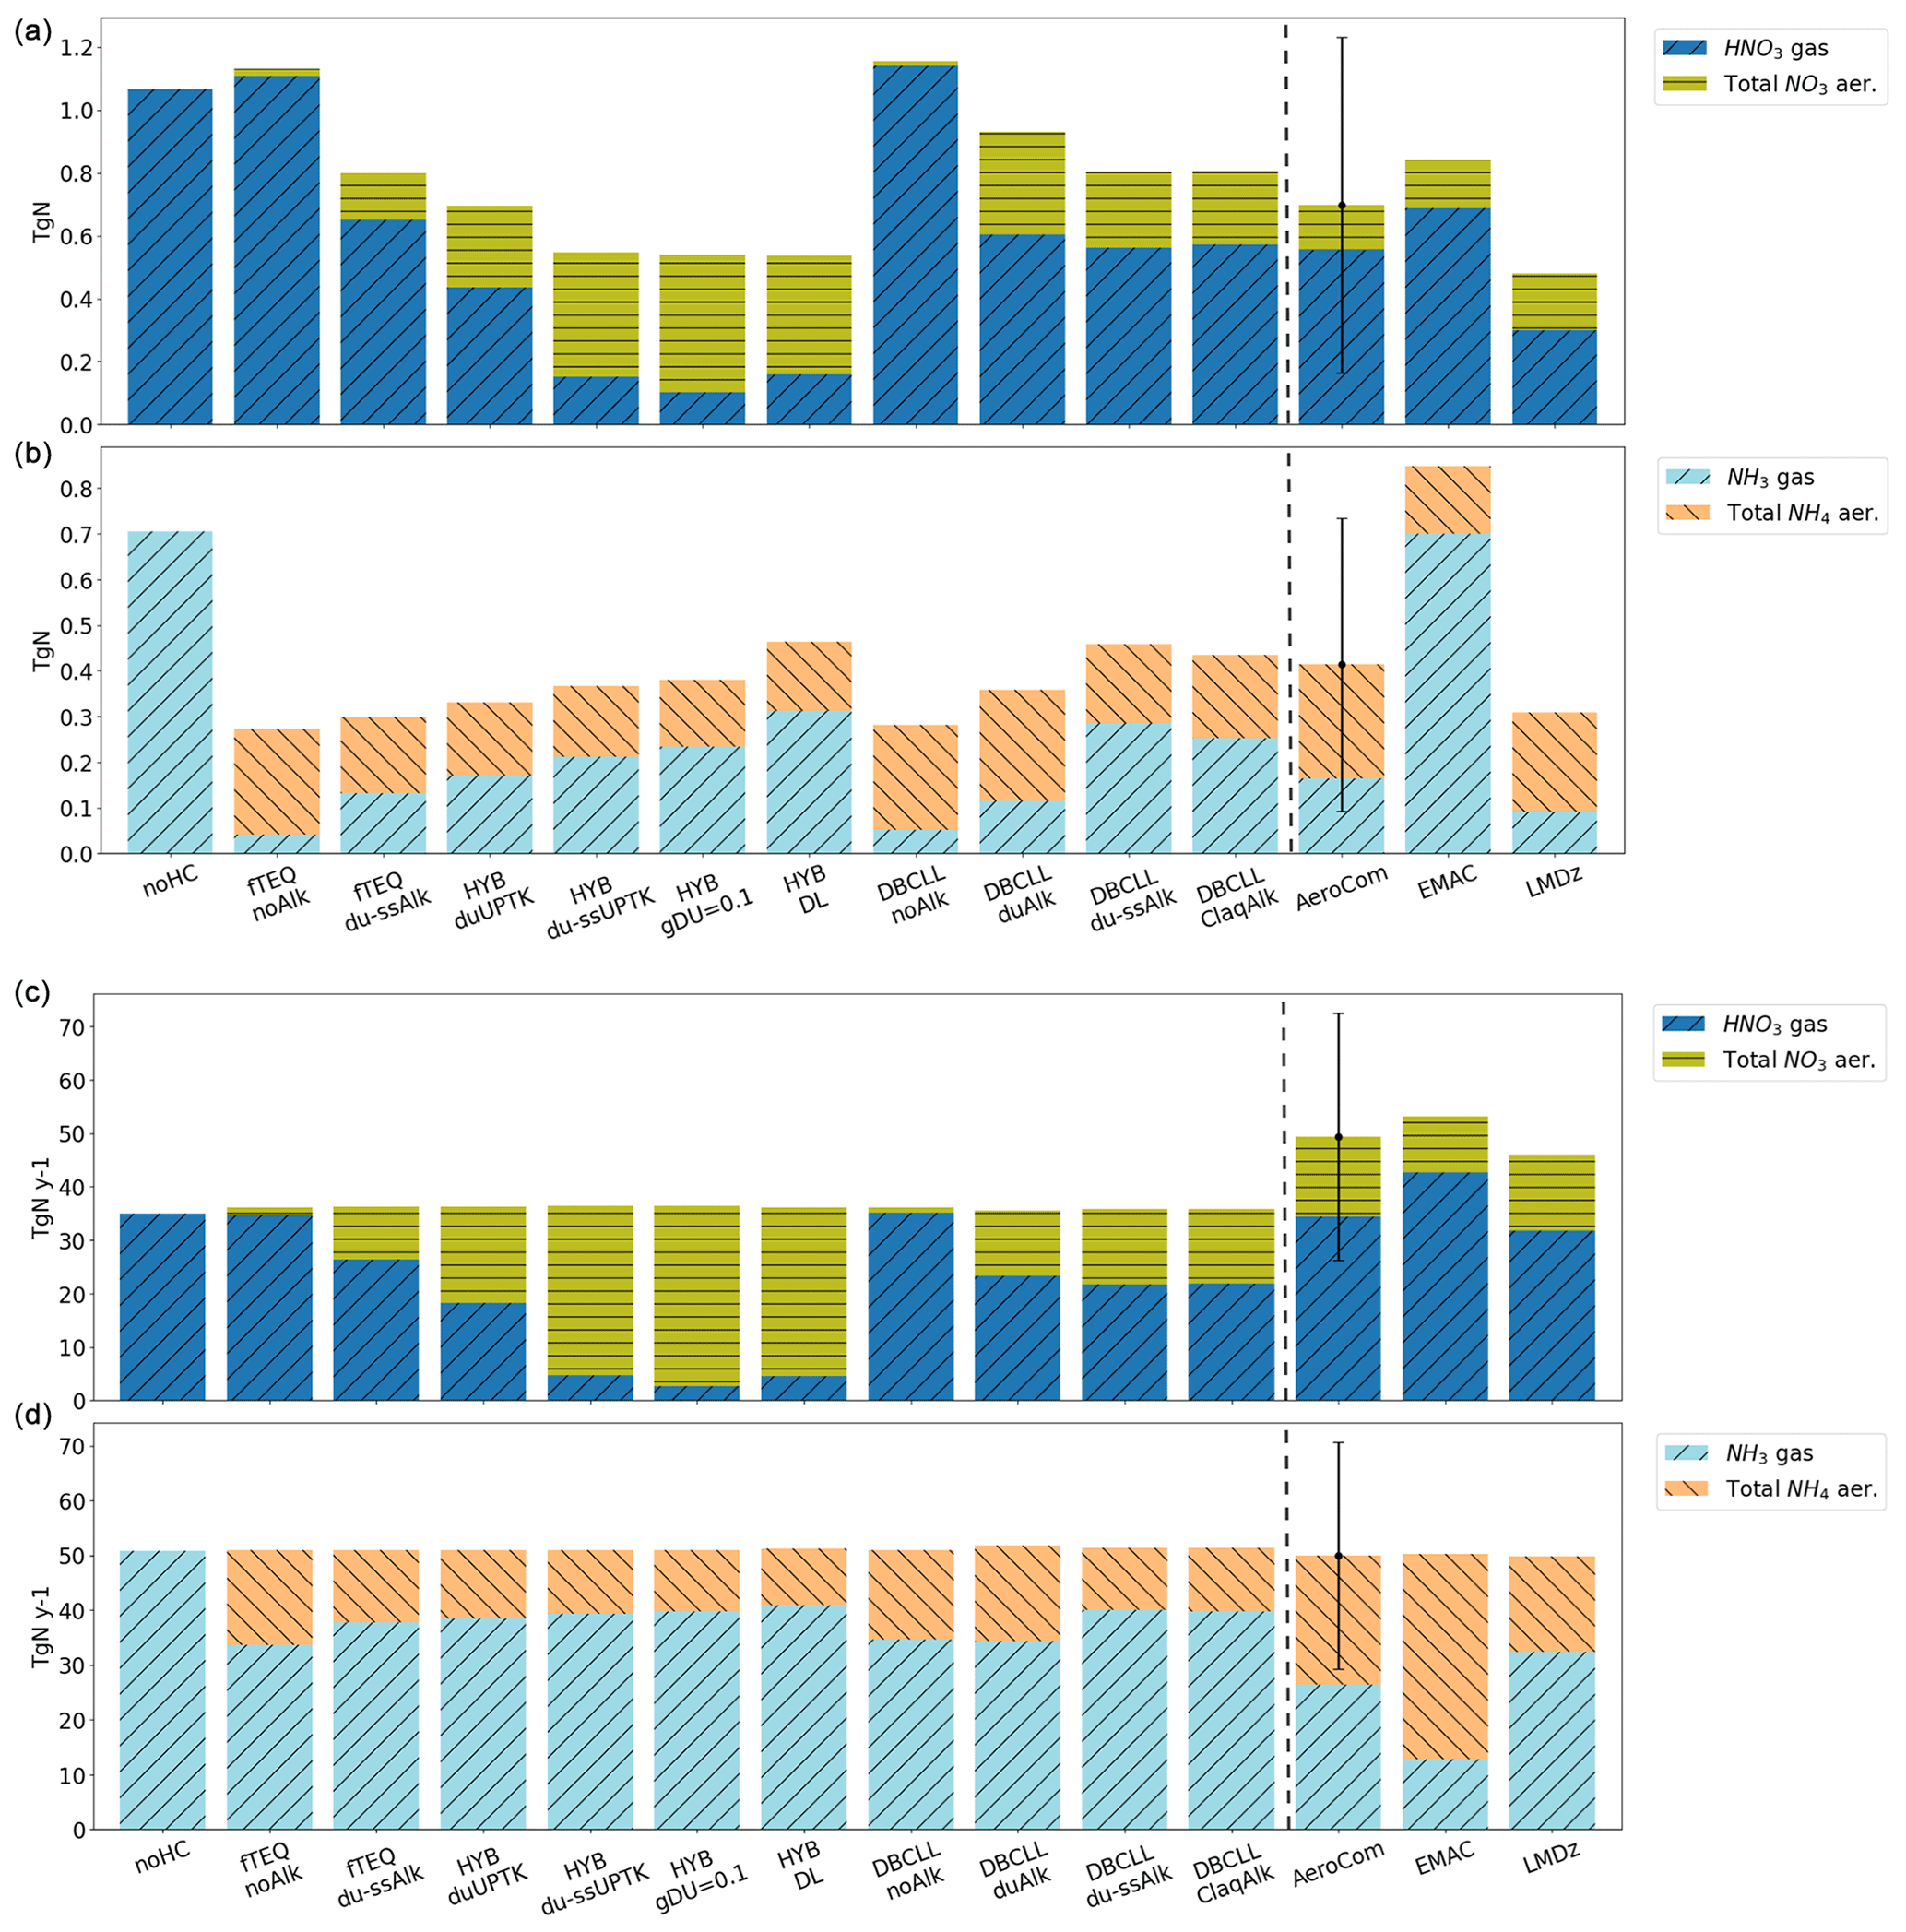
Figure 7Average 2018 nitrogen budgets (a, b) and depositions (c, d) for the different dust heterogeneous chemistry mechanisms. Each plot shows oxidized (a, c) and reduced (b, d) mass for each mechanism (bars). They are compared with references from the literature (the final three bars on the right).
3.4 Nitrate budgets
The budgets from the sensitivity runs are summarized in Table 5, including burdens; wet and dry deposition; productivities; and the lifetimes of fine, coarse, and total . Comparative data from previous studies (Bian et al., 2017; Karydis et al., 2016; Rémy et al., 2022; Hauglustaine et al., 2014; Jones et al., 2021) are also included. Analogous information on HNO3(g), NH3(g), , and can be found in Supplement Sect. S4 (Tables S9 to S12).
Table 5Results for fine, coarse, and total particulate obtained using the heterogeneous chemistry mechanisms studied. Results from the literature references are reported in the second half of the table: the average of all the participating models in the intercomparison AeroCom phase III nitrate experiment for 2008 (AeroCom), specifying their standard deviation (SD AeroCom), results from the GMI model (GMI, using a similar HYB approach with UPTK reactions on dust and SS), and results from the EMAC model (EMAC 2008, using a similar approach to DBCLL_du-ssAlk). Also using the EMAC model, results obtained by the Karydis et al. (2016) study are reported as EMAC 2005–2008. Results from models using a similar approach to HYB_du-ssUPTK are reported as IFS for Rémy et al. (2022), LMDz-INCA for Hauglustaine et al. (2014), and Met Office UM for Jones et al. (2021).
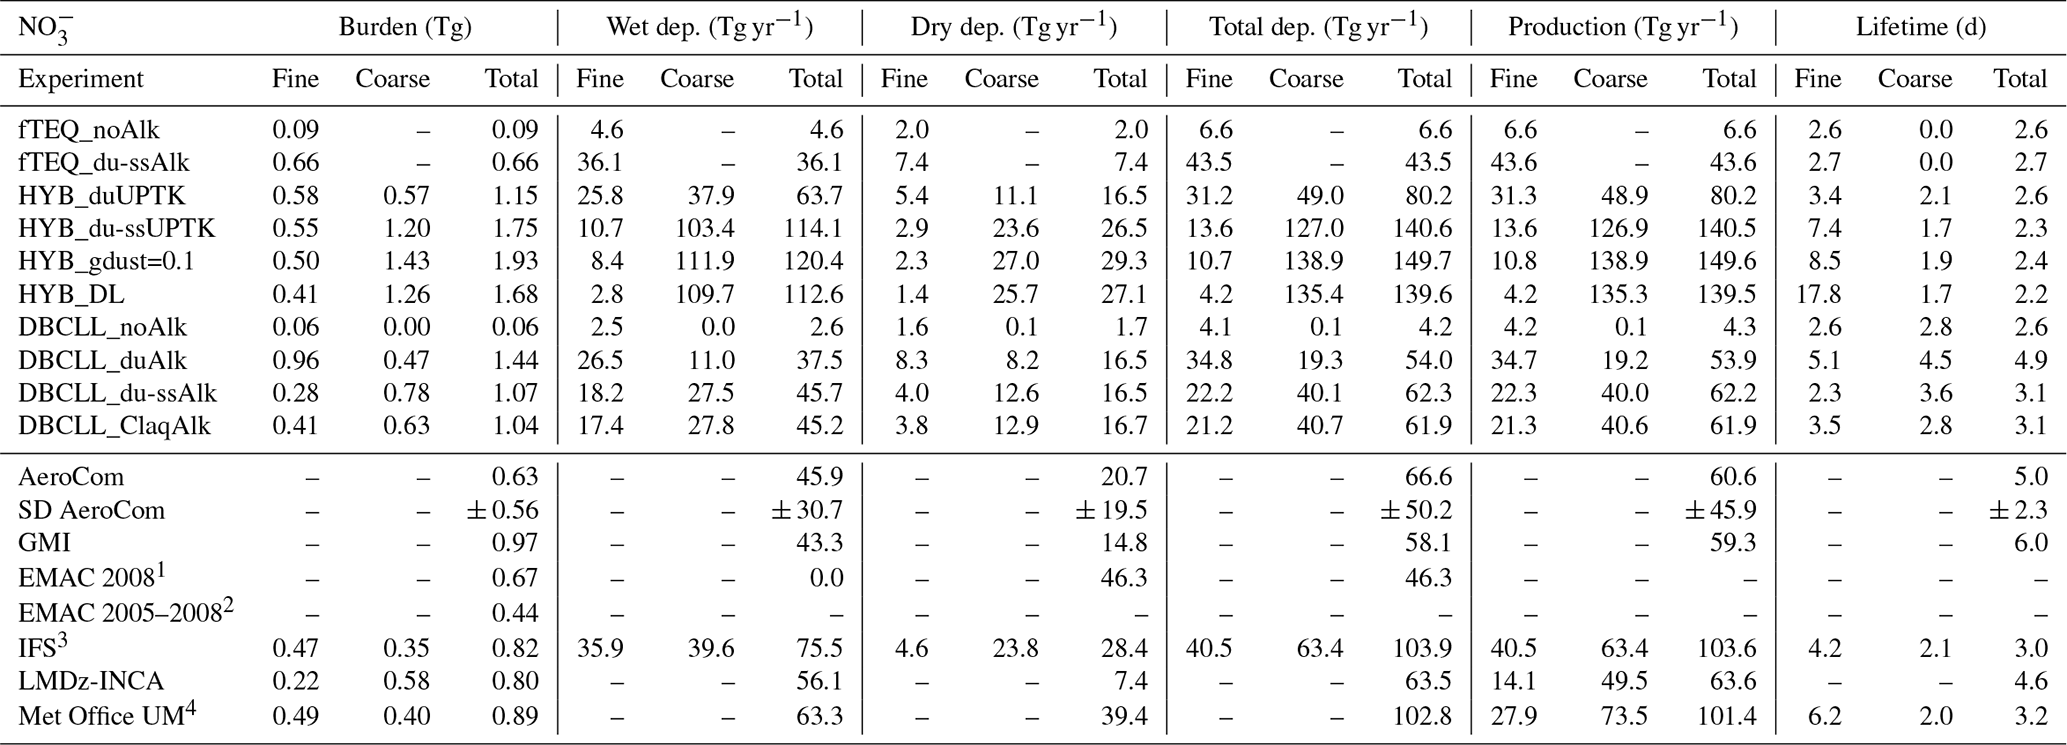
1. From Bian et al. (2017).
2. From Karydis et al. (2016).
3. Fine is reported from neutralization of nitric acid, ammonia, and sulfate. Coarse is from heterogeneous chemistry. (Rémy et al., 2022).
4. Jones et al. (2021) perform two sensitivity tests with the accommodation coefficient used for formation in the fine mode: FAST, with 0.193, and SLOW, with 0.001. Here, results from the FAST test are reported on the basis that they present similar fine formation rates to our average fine results.
The sensitivity runs conducted in this study yield a wide range of total burdens, ranging from 0.09 to 1.93 Tg. Experiments neglecting coarse and the role of NVCs fall on the lower end of this spectrum, while the HYB schemes consistently report higher burdens. The coarse-to-fine ratio decreases in the mechanisms that neglect NVCs partly or completely in the nitrate partitioning, and HYB runs consistently simulate the highest coarse burdens (0.57 to 1.43 Tg). Compared to the reported values in the literature, both the HYB (1.15 to 1.93 Tg) and DBCLL (1.04 to 1.44 Tg) schemes considering NVCs fall within the upper range of the Aerocom total burden (Bian et al., 2017) and above specific global models such as IFS (Rémy et al., 2022) or Met Office UM (Jones et al., 2021). Similar differences are found in total annual depositions, with ranges that span a factor of 2 among schemes. For wet deposition, DBCLL mechanisms show values ranging from 37 to 45 Tg yr−1, within the lower half of the range found in the literature (45 ± 30 Tg yr−1 for AeroCom to 75 Tg yr−1 for IFS), while HYB consistently simulates higher estimates even beyond the reported values (63 to 120 Tg). This feature is also seen in the dry deposition. Consequently, the lifetimes of total shown in Table 5 range from 2.3 to 2.6 d for the HYB schemes, systematically estimating the lowest lifetimes. Conversely, models introducing reversible partitioning provide longer lifetimes (2.6 to 4.9 d). To better understand the possible reasons for such a wide range of estimates, in the next paragraphs we analyze some of our sensitivity runs compared to similar systems in the literature.
The assumption of irreversibility of HNO3(g) condensation onto dust and SS particles (HYB_du-ssUPTK run) produces the largest increase in coarse formation, exceeding the values reported in the literature. For instance, the HYB_du-ssUPTK model reports a total burden of 1.75 Tg, which is higher than the AeroCom range (0.63 ± 0.56 Tg) and than values from models such as EMAC in AeroCom (Bian et al., 2017), as well as findings from Bian et al. (2017), Jones et al. (2021), Rémy et al. (2022), and Hauglustaine et al. (2014) (0.67, 0.89, 0.82, and 0.80 Tg, respectively). Interestingly, the results surpass those from three AeroCom models (EMEP, INCA, and GMI) using a similar HYB approach with UPTK reactions on dust and SS, which range from 0.26 to 0.95 Tg of total (see Bian et al., 2017). Multiple reasons could explain the excessive formation found in this comparison. For instance, Hauglustaine et al. (2014) employ a similar HYB implementation and UPTK coefficients for dust as the HYB_du-ssUPTK run, although a different parametrization for the HNO3(g) UPTK on SS. Despite Hauglustaine et al. (2014) also overestimating particulate , with a global normalized mean bias of +68 %, the HYB_du-ssUPTK simulation still reports higher burdens for (0.80 vs. 1.75 Tg) and lower burdens for HNO3(g) (1.35 vs. 0.69 Tg, Table S9). Our study also presents lower NOx emissions than those in Hauglustaine et al. (2014), which would imply a reduced availability of precursor gases that would typically result in lower formation (40.8 vs. 46.0 TgN, Table S1 in the Supplement). Additionally, the run neglecting the uptake on SS (HYB_duUPTK) reports values closer to observations (Sect. 3.2) and to the budgets in the literature.
This suggests that the high coefficients used for HNO3(g) UPTK on SS may be excessively efficient. This conclusion is consistent with analyses discussed in Sect. 3.1.2, 3.2, and 3.3. In comparison, other systems (Hauglustaine et al., 2014; Jones et al., 2021; Rémy et al., 2022) typically employ much lower UPTK coefficients for SS compared to our implementation.
Therefore, a function for the uptake coefficient on SS dependent on relative humidity and on SS particle size should be considered in future work, following the same approach as for dust (Eq. 2). However, such a function has not clearly been determined in the literature. While Hauglustaine et al. (2014) assume a BET isotherm for the HNO3(g) UPTK on SS similar to the UPTK on dust (Fairlie et al., 2010), it remains unclear if this approach is as suitable for SS as it is for dust. To our best knowledge, the most appropriate alternative to the assumption of averaged UPTK coefficients for SS would be to fit a function to the experimental values reported by Liu et al. (2007), which provides uptake coefficient dependencies with relative humidity and particle size. However, several discrepancies between Liu et al. (2007) and previous studies still remain unresolved (Tolocka et al., 2004; Saul et al., 2006), presenting difficulties in reaching a common agreement on a HNO3(g) UPTK coefficient function on SS.
Beyond the excessive formation driven by the UPTK on SS, the sole implementation of HNO3(g) UPTK on dust (HYB_duUPTK run) still slightly exceeds the particulate burdens and deposition rates reported by the references (Table 5). This is also observed when compared to observational surface concentrations (see Sect. 3.2), suggesting that the sole UPTK on dust results in excessive formation. Given that previous studies have consistently shown non-negligible HNO3(g) uptake on SS (Myhre et al., 2006; Athanasopoulou et al., 2008), these biases could be explained by (1) an excessive UPTK coefficient employed for HNO3(g) UPTK on dust, (2) the inherent inappropriateness of the irreversible condensation assumption of gas species on particles to simulate particulate formation, or (3) the different atmospheric lifetimes of coarse particles among different systems. Regarding possible issues in the UPTK parameterization on dust adopted in our study, the inclusion of the scaling factor for alkalinity added to the dust uptake coefficients (Sc in Eq. 2) could contribute to excessively high UPTK rates. This alkalinity scaling factor is based on the NVC fractions provided by Fairlie et al. (2010), namely calcium and magnesium (see Sect. 2.2.1). Since our study includes additional NVCs (i.e., potassium and sodium), this estimation might not be representative and could result in excessive condensation. However, additional information on the NVC content in Fairlie et al. (2010) is missing to refine our approach. Concerning the possible inappropriateness of the irreversible condensation assumption, indeed, models implementing such an approach with similar UPTK coefficients tend to overestimate particulate formation (Hauglustaine et al., 2014; Jones et al., 2021; Rémy et al., 2022). This might point to the assumption of reversible evaporation–condensation of gas species or to the inclusion of alkalinity consumption as necessary implementations to improve the results.
Lastly, a longer lifetime of coarse particles such as dust or SS could contribute to the enhancement of production regardless of the mechanism adopted. Spada et al. (2013) compared different SS emission schemes in the MONARCH model and reported lifetimes ranging from 4 to 12 d, including results from the literature. These findings highlight significant differences in emission, transport, and sedimentation schemes among global models, which are not negligible. Such differences could explain part of the variations identified in our analysis. For instance, if a model assumes a longer lifetime for coarse particles, it would result in a prolonged period during which HNO3(g) can condense onto these particles, thus increasing the overall burden of particulate . Understanding and standardizing these lifetimes could be crucial to achieve more consistent and accurate predictions of aerosol formation across different modeling frameworks.
Linking with the limitations of irreversible approaches, we finally analyze the DBCLL runs to illustrate the paramount role of alkalinity in formation. Neglecting NVC in the partitioning (DBCLL_noAlk) results in negligible formation, with a burden of just 0.06 Tg in the fine mode (Table 5). In contrast, only considering dust alkalinity (DBCLL_duAlk) significantly increases the burden of both fine and coarse modes to 0.96 and 0.47 Tg, respectively, which exceeds the estimates reported in other works (Hauglustaine et al., 2014; Jones et al., 2021; Rémy et al., 2022).
Additionally, accounting for SS alkalinity (Reaction R12 from Table 1), the DBCLL_du-ssAlk run shifts particulate formation from the fine towards the coarse mode, increasing coarse burdens from 0.47 Tg in DBCLL_duAlk to 0.78 Tg. Consequently, this leads to higher total deposition rates, rising from 54 to 62 Tg yr−1. Including both dust and SS alkalinity results in a notable agreement for total (1.07 Tg) and HNO3(g) (2.53 Tg) burdens with the values reported in the literature. This improvement highlights the importance of considering both dust and SS alkalinity when accurately modeling formation and deposition rates in atmospheric chemistry simulations.
Some differences emerge when comparing the size distribution to references that report fine and coarse budgets. Specifically, the fine burden tends to be on the lower end of the range of the literature references (0.28 Tg vs. 0.39 Tg on average), while the coarse burden is on the higher end (0.78 Tg vs. 0.54 Tg on average), although the relatively high variability between the references in both modes should be considered. Despite these variations, accounting for alkalinity significantly improves the agreement of lifetime (3.1 d) compared to AeroCom (5.0 ± 2.3 d), Rémy et al. (2022) (3.0 d), and Jones et al. (2021) (3.2 d).
To delve into the differences observed between simulations employing constant dust alkalinity derived from Journet et al. (2014) (DBCLL_du-ssAlk) and that from Claquin et al. (1999) (DBCLL_ClaqAlk, discussed in Supplement Sect. S5) as shown in Table 5, it becomes evident that DBCLL_ClaqAlk results in a noticeable shift towards fine formation (from 0.28 to 0.40 Tg), with fine increasing its lifetime (from 2.3 to 3.5 d) and coarse decreasing it (from 3.6 to 2.8 d). Also, we observe a slightly higher burden of HNO3(g) (from 2.53 to 2.58 Tg) and a lower burden of NH3(g) (from 0.35 to 0.31 Tg) (see Supplement Tables S9 and S10). This can be attributed to the higher fraction of Ca2+ NVCs in the fine mode derived from Journet et al. (2014) (5.73 %) compared to that of Claquin et al. (1999) (3.68 %). Both datasets present more similar fractions of Ca2+ for the coarse mode (4.61 % vs. 3.74 %) (see Supplement Tables S4 and S6). This underscores the important role that Ca2+ NVCs play in heterogeneous chemistry. As a matter of fact,Ca2+ fractions surpasses the fractions of other NVC in the Claquin et al. (1999) dataset (0.07 % Na, 0.78 % K, and 0.43 % Mg, Tables S3 to S6). The comparison between DBCLL_du-ssAlk and DBCLL_ClaqAlk provides a quantification of the impact that mineral distributions among dust sources (especially calcite) have on gas–aerosol partitioning, especially in the formation of particulate . It also highlights the importance of advancing the representation of mineralogical dust composition at the global scale and its regional variability.
Finally, we compare the outcomes from the DBCLL_du-ssAlk simulation with those reported by the EMAC model, which employs a similar approach to the DBCLL mechanism and also accounts for dust and SS alkalinity (see Sect. 3.1.3). The analysis is performed against two studies where EMAC budgets were reported: the AeroCom intercomparison nitrate experiment (Bian et al., 2017) and Karydis et al. (2016) (Table 5). It is notable that the total burden (1.07 Tg) in DBCLL_du-ssAlk exceeds both the EMAC results from AeroCom (0.67 Tg) and Karydis et al. (2016) (0.44 Tg), although our findings show reasonable agreement with observations, especially over Asia (see Sect. 3.2). Regarding the total budget of HNO3(g) (2.53 Tg), despite our result closely matching the AeroCom experiment average (2.50 ± 1.83 Tg, Table S9), it is below the values reported by EMAC in this experiment (3.10 Tg) while significantly exceeding results from Karydis et al. (2016) (1.65 Tg). These outcomes reveal intrinsic differences in the rates of HNO3(g) condensation on dust and SS between both models. Conversely, the NH3(g) burden (0.35 Tg) in our simulation falls below those reported by both studies (0.85 and 0.82 Tg, respectively), potentially due to the high formation of particulate over dust and SS NVCs in our study. Nevertheless, the resulting burdens for align with both references (0.22 vs. 0.19 and 0.17 Tg for EMAC in AeroCom and Karydis et al. (2016), respectively). Various factors could explain the differences observed between EMAC and the DBCLL_du-ssAlk simulation: the different simulated periods between our study and those of Karydis et al. (2016) and AeroCom (2018 vs. 2005–2008 average and 2008, respectively), the varying NVC contents assumed for dust and SS between DBCLL_du-ssAlk and EMAC (Sect. 3.1.3), and the intrinsic differences in the heterogeneous chemistry mechanisms employed in both models (DIFFLIM and DBCLL in MONARCH and bulk TEQ followed by DIFFLIM in EMAC). Despite their conceptual equivalence, our results demonstrate that these mechanisms may yield different outcomes.
In this study, we conducted a comprehensive exploration of the processes driving nitrate formation on fine and coarse particles at a global scale using the MONARCH atmospheric model. Our sensitivity simulations incorporated state-of-the-art dust heterogeneous chemistry mechanisms, including reversible condensation–evaporation through thermodynamic equilibrium (TEQ) and irreversible uptake reactions (UPTK) between gas and aerosol phases. Three mechanisms for particulate nitrate formation were implemented: (1) fTEQ, which considers fine nitrate formation through reversible TEQ reactions and neglects coarse nitrate; (2) HYB, where fine nitrate forms via TEQ with a subsequent irreversible uptake of HNO3(g) on coarse particles; and (3) DBCLL, which allows for both fine and coarse nitrate formation through reversible TEQ processes with kinetic gas limitation.
Key assumptions such as uptake coefficients, reversible partitioning, and the inclusion of dust and sea-salt alkalinity were thoroughly assessed. Global average dust alkalinity was sourced from previous dust mineralogy simulations (Gonçalves Ageitos et al., 2023) using the Journet et al. (2014) and Claquin et al. (1999) mineral atlases, while globally homogeneous sea-salt alkalinity values are derived from Seinfeld and Pandis (2006). We evaluated annual cycle surface concentrations against observations for various atmospheric species and compared global spatial distributions and budgets with the existing literature. Additionally, we investigated the partitioning of nitrogen species and assessed the impact of dust and sea-salt heterogeneous chemistry on total nitrogen budgets.
Neglecting coarse nitrate formation (fTEQ_du-ssAlk run) results in budgets and distributions of fine nitrate that closely match observational surface concentrations of total nitrate (−0.09 µg m−3 bias, 0.88 correlation). This good agreement suggests that observational stations are dominated by fine nitrate concentrations or that fine nitrate formation is overestimated in this run. Since this mechanism aligns with references forming both fine and coarse nitrate (Bian et al., 2017; Rémy et al., 2019; Hauglustaine et al., 2014), it likely compensates for the lack of coarse nitrate formation through the instantaneous TEQ of gas species in the fine mode, thus not accurately reflecting the size distribution of particles.
The formation of coarse nitrate through the irreversible uptake of HNO3(g) on coarse particles (HYB methodologies) is highly sensitive to whether the HNO3(g) uptake is assumed to occur solely on dust or on both dust and sea-salt particles. The uptake solely on dust (HYB_duUPTK run) closely reproduces fine and total particulate nitrate seasonality (correlations of 0.8 and 0.9, respectively), although it slightly overestimates observations (+0.29 µg m−3 bias), particularly over Asia, and overestimates nitrate budgets compared to the literature (1.15 vs. 0.74 Tg on average). An excessively efficient HNO3(g) uptake on dust particles could explain such performance, which could be improved through more accurate scaling factors adopted for alkalinity. However, the lack of information in the literature poses a challenge when implementing such adjustments.
The introduction of the HNO3(g) uptake on sea salt (HYB_du-ssUPTK run) further increases the formation of coarse nitrate, exceeding the reported burdens in the literature (1.75 vs. 0.74 Tg from the average of the references) and overestimating observational surface concentrations (+1.50 µg m−3 bias). Moreover, some deviations with respect to references are observed in the latitude and magnitude of the transatlantic transport of coarse nitrate formed during long-range transport of dust and sea salt. These findings indicate the need for a revision of the HNO3(g) uptake coefficients on sea salt. A potential alternative could involve its implementation as a function of relative humidity and particle size, aligning it with experimental data from Liu et al. (2007), although discrepancies compared to earlier experimental studies present difficulties in determining consistent uptake coefficients for sea salt.
The reversible condensation–evaporation of gas species on both fine and coarse modes of dust and sea salt (DBCLL mechanism) highlight the paramount importance of accounting for alkalinity to derive consistent results both globally and across continents. Remarkably, the DBCLL_du-ssAlk run, which accounts for dust and sea-salt alkalinity, effectively captures monthly global concentrations of fine and total nitrate, with correlations of 0.82 and 0.78 and concentrations that are slightly underestimated, with −0.18 and −0.10 µg m−3 bias, respectively. These good results extend to particulate ammonium for both fine and total fractions (−0.02 and 0.08 µg m−3 bias, respectively). The consistent excessive formation of total PM2.5 (+20 µg m−3 bias) over Asia across the experiments may be explained by the absence of anthropogenic coarse dust emissions in the CAMS inventory employed. This omission leads to the overestimation of fine particulate matter formation, compensating for the misrepresentation of coarse particulate matter.
Including both dust and sea-salt alkalinity in the DBCLL mechanism significantly raises global pH levels, which enhances particulate nitrate formation by 94 % in comparison to the same mechanism with no alkalinity. This incorporation also reduces NOx budgets and lowers the reduced nitrogen burden due to an increase in ammonium formation. Moreover, the sole inclusion of sea-salt alkalinity is identified as being responsible for substantially shifting the size partitioning of particulate nitrate from fine (−72 %) to coarse (+63 %), along with the rise in wet deposition of particulate nitrate due to the high scavenging rate of sea-salt particles, overall reducing the total aerosol nitrate atmospheric lifetime from 4.9 to 3.1 d.
Comparison with references reveals that while surface concentrations in the DBCLL_du-ssAlk simulation align well with observations, its global burden (1.07 Tg) sits at the upper limit of AeroCom's reported range (0.63 ± 0.56 Tg) and slightly exceeds the average reported by other studies (0.74 Tg). Fundamental differences between the models, such as the alkalinity factors, intrinsic differences in the heterogeneous chemistry, aerosol representation, and transport processes, can partly explain the wide range of results reported in the literature. Overall, the DBCLL_du-ssAlk scheme demonstrates the best accuracy compared to the other configurations tested, as evidenced by its closer alignment with observations.
A comparison between runs adopting the two different dust alkalinity fractions derived from averaging simulations using the Journet et al. (2014) and Claquin et al. (1999) soil mineralogy datasets as described in Gonçalves Ageitos et al. (2023) reveals that assumptions regarding the dust composition are crucial, particularly influencing the particulate nitrate size distribution. A decrease from 5.17 % to 3.68 % in ionic Ca2+ fractions, along with slight increases in Na, K, and Mg between the Journet et al. (2014) and Claquin et al. (1999) mineral datasets, leads to a +35 % increase in fine and −21 % decrease in coarse nitrate formation. This high sensitivity is especially attributed to the lower calcite content and its different size distribution in the Claquin et al. (1999) database compared to that of Journet et al. (2014).
It is important to note that our computational cost analysis reveals highly similar processing times across the sensitivity runs, with a standard variation of only 5 %. This is within the estimated variability in the supercomputing resources utilized for the present work. Consequently, the computational cost does not indicate a clear advantage in efficiency for any of the methodologies assessed.
This study establishes a crucial benchmark for future investigations into the impact of incorporating regional variations in dust alkalinity, as derived from Claquin et al. (1999), Journet et al. (2014), and the upcoming spectroscopically based EMIT surface mineralogical dataset (Green et al., 2018; Thompson et al., 2024; Brodrick et al., 2023), on the formation of particulate nitrate and atmospheric composition. The findings also evaluate the significance of dust and sea-salt alkalinity in inorganic aerosol heterogeneous chemistry, providing insights into the optimal representation of dust alkalinity in atmospheric models. Ultimately, these results aim to enhance the ability of atmospheric and climate models to simulate the formation of aerosol nitrate, ammonium, and sulfate, potentially improving our ability to estimate the radiative effects of these species in climate projections.
The MONARCH code is available at https://earth.bsc.es/gitlab/es/monarch (last access: 21 July 2024, Badia et al., 2017), and the HERMESv3_GR code is accessible at https://earth.bsc.es/gitlab/es/hermesv3_gr (last access: 21 July 2024, Guevara et al., 2019).
The GHOST dataset is made freely available via the following repository: https://doi.org/10.5281/zenodo.10637449 (Bowdalo et al., 2024). The model output used in this work is available in the Zenodo data repository at https://doi.org/10.5281/zenodo.12789730 (Sousse, 2024).
The supplement related to this article is available online at https://doi.org/10.5194/acp-25-4719-2025-supplement.
RS, OJ, and CPGP developed the model, designed the methodology and the conceptualization, and performed the investigation and analysis of the results. RS designed and conducted the sensitivity simulations and the postprocessing of the results, as well as validation and visualization, assisted by OJ and CPGP. MGA provided the simulations with the average mineralogy from the mineral dust datasets utilized. DB provided the observational evaluation data and developed the GHOST dataset and the evaluation software. MGV provided the CAMS-ANTv4.2 emission dataset and developed the HERMESv3_GR emission model. RS wrote the paper, which was re-edited by OJ and CPGP, with contributions from all other co-authors.
The contact author has declared that none of the authors has any competing interests.
Publisher’s note: Copernicus Publications remains neutral with regard to jurisdictional claims made in the text, published maps, institutional affiliations, or any other geographical representation in this paper. While Copernicus Publications makes every effort to include appropriate place names, the final responsibility lies with the authors.
We acknowledge support from the European Union’s Horizon 2020 research and innovation program under grant agreement no. 821205 (FORCeS) and from the Department of Research and Universities of the Government of Catalonia via the Research Group Atmospheric Composition (grant no. 2021 SGR 01550). The authors also acknowledge the computer resources at Marenostrum and the technical support provided by the Barcelona Supercomputing Center (RES-AECT-2022-3-0013, RES-AECT-2023-2-0008, RES-AECT-2023-3-0026), with special mention to Alejandro García, Carles Tena, Gilbert Montane, and Albert Vila.
This research was supported by the European Research Council (FRAGMENT, grant no. 773051), the AXA Research Fund (AXA Chair on Sand and Dust Storms at the Barcelona Supercomputing Center), and grant no. PID2022-140365OB-I00 funded by MCIN/AEI /10.13039/501100011033 and by ERDF/EU. Rubén Soussé Villa was funded by the predoctoral program AGAUR-FI ajuts (grant no. 2023 FI-1 01106) Joan Oró, which is backed by the Secretariat of Universities and Research of the Department of Research and Universities of the Generalitat of Catalonia, as well as the European Social Plus Fund.
This paper was edited by Manish Shrivastava and reviewed by three anonymous referees.
Adebiyi, A., Kok, J. F., Murray, B. J., Ryder, C. L., Stuut, J. B. W., Kahn, R. A., Knippertz, P., Formenti, P., Mahowald, N. M., García-Pando, C. P., Klose, M., Ansmann, A., Samset, B. H., Ito, A., Balkanski, Y., Biagio, C. D., Romanias, M. N., Huang, Y., and Meng, J.: A review of coarse mineral dust in the Earth system, Aeolian Res., 60, 100849, https://doi.org/10.1016/j.aeolia.2022.100849, 2023. a
Adebiyi, A. A. and Kok, J. F.: Climate models miss most of the coarse dust in the atmosphere, Sci. Adv., 6, 1–10, https://doi.org/10.1126/sciadv.aaz9507, 2020. a
Athanasopoulou, E., Tombrou, M., Pandis, S. N., and Russell, A. G.: The role of sea-salt emissions and heterogeneous chemistry in the air quality of polluted coastal areas, Atmos. Chem. Phys., 8, 5755–5769, https://doi.org/10.5194/acp-8-5755-2008, 2008. a
Badia, A., Jorba, O., Voulgarakis, A., Dabdub, D., García-Pando, C. P., Hilboll, A., Gonçalves, M., and Janjic, Z.: Description and evaluation of the Multiscale Online Nonhydrostatic AtmospheRe CHemistry model (NMMB-MONARCH) version 1.0: gas-phase chemistry at global scale, Geosci. Model Dev, 10, 609–638, https://doi.org/10.5194/gmd-10-609-2017, 2017. a, b
Bauer, S. E., Balkanski, Y., Schulz, M., Hauglustaine, D. A., and Dentener, F.: Global modeling of heterogeneous chemistry on mineral aerosol surfaces: Influence on tropospheric ozone chemistry and comparison to observations, J. Geophys. Res.-Atmos., 109, 2304, https://doi.org/10.1029/2003JD003868, 2004. a, b, c, d, e
Bauer, S. E., Mishchenko, M. I., Lacis, A. A., Zhang, S., Perlwitz, J., and Metzger, S. M.: Do sulfate and nitrate coatings on mineral dust have important effects on radiative properties and climate modeling?, J. Geophys. Res.-Atmos., 112, 6307, https://doi.org/10.1029/2005JD006977, 2007. a, b, c, d
Bauer, S. E., Tsigaridis, K., and Miller, R.: Significant atmospheric aerosol pollution caused by world food cultivation, Geophys. Res. Lett., 43, 5394–5400, https://doi.org/10.1002/2016GL068354, 2016. a
Bellouin, N., Rae, J., Jones, A., Johnson, C., Haywood, J., and Boucher, O.: Aerosol forcing in the Climate Model Intercomparison Project (CMIP5) simulations by HadGEM2-ES and the role of ammonium nitrate, J. Geophys. Res.-Atmos., 116, D20206, https://doi.org/10.1029/2011JD016074, 2011. a
Benduhn, F., Schallock, J., and Lawrence, M. G.: Early growth dynamical implications for the steerability of stratospheric solar radiation management via sulfur aerosol particles, Geophys. Res. Lett., 43, 9956–9963, 2016. a
Bergas‐Massó, E., Ageitos, M. G., Myriokefalitakis, S., Miller, R. L., van Noije, T., Sager, P. L., Pinto, G. M., and García‐Pando, C. P.: Pre‐Industrial, Present and Future Atmospheric Soluble Iron Deposition and the Role of Aerosol Acidity and Oxalate Under CMIP6 Emissions, Earth's Future, 11, e2022EF003353, https://doi.org/10.1029/2022ef003353, 2023. a
Betts, A. K. and Miller, M. J.: A new convective adjustment scheme. Part II: Single column tests using GATE wave, BOMEX, ATEX and arctic air-mass data sets, Q. J. Roy. Meteorol. Soc., 112, 693–709, https://doi.org/10.1002/QJ.49711247308, 1986. a
Bian, H., Chin, M., Rodriguez, J. M., Yu, H., Penner, J. E., and Strahan, S.: Sensitivity of aerosol optical thickness and aerosol direct radiative effect to relative humidity, Atmos. Chem. Phys., 9, 2375–2386, https://doi.org/10.5194/ACP-9-2375-2009, 2009. a
Bian, H., Chin, M., Hauglustaine, D. A., Schulz, M., Myhre, G., Bauer, S. E., Lund, M. T., Karydis, V. A., Kucsera, T. L., Pan, X., Pozzer, A., Skeie, R. B., Steenrod, S. D., Sudo, K., Tsigaridis, K., Tsimpidi, A. P., and Tsyro, S. G.: Investigation of global particulate nitrate from the AeroCom phase III experiment, Atmos. Chem. Phys., 17, 12911–12940, https://doi.org/10.5194/acp-17-12911-2017, 2017. a, b, c, d, e, f, g, h, i, j, k, l, m, n, o, p, q, r, s
Boucher, O., Randall, D., Artaxo, P., Bretherton, C., Artaxo, P., Bretherton, C., Feingold, G., Forster, P., Kerminen, V.-M., Kondo, Y., Liao, H., Lohmann, U., Rasch, P., Satheesh, S., Sherwood, S., Stevens, B., and Zhang, X.-Y.: Clouds and Aerosols, in: Climate Change 2013: The Physical Science Basis, Contribution of Working Group I to the Fifth Assessment Report of the Intergovernmental Panel on Climate Change, Cambridge University Press, 571–657, https://doi.org/10.1017/CBO9781107415324.016, 2013. a, b, c
Bowdalo, D., Basart, S., Guevara, M., Jorba, O., Pérez García-Pando, C., Jaimes Palomera, M., Rivera Hernandez, O., Puchalski, M., Gay, D., Klausen, J., Moreno, S., Netcheva, S., and Tarasova, O.: GHOST: a globally harmonised dataset of surface atmospheric composition measurements, Earth Syst. Sci. Data, 16, 4417–4495, https://doi.org/10.5194/essd-16-4417-2024, 2024. a, b
Brodrick, P., Okin, G., Ochoa, F., Thompson, D., Clark, R., Ehlmann, B., Keebler, A., Miller, R., Mohawald, N., Ginoux, P., Garcia-Pando, C., Goncalves, M., and Green, R.: EMIT L3 Aggregated Mineral Spectral Abundance and Uncertainty 0.5 Deg V001, [data set], https://doi.org/10.5067/EMIT/EMITL3ASA.001, 2023. a
Burkholder, J. B., Sander, S. P., Abbatt, J. P. D., Barker, J. R., Cappa, C., Crounse, J. D., Dibble, T. S., Huie, R. E., Kolb, C. E., Kurylo, M. J., Orkin, V. L., Percival, C. J., Wilmouth, D. M., and Wine, P. H.: Chemical kinetics and photochemical data for use in atmospheric studies; evaluation number 19, Pasadena, CA, Jet Propulsion Laboratory, National Aeronautics and Space Administration, 2020, 2020. a
Byun, D.: Dynamically Consistent Formulations in Meteorological and Air Quality Models for Multiscale Atmospheric Studies, Part I: Governing Equations in a Generalized Coordinate System, J. Atmos. Sci., 56, 3789–3807, https://doi.org/10.1175/1520-0469(1999)056<3789:DCFIMA>2.0.CO;2, 1999. a
Capaldo, K. P., Pilinis, C., and Pandis, S. N.: A computationally efficient hybrid approach for dynamic gas/aerosol transfer in air quality models, Atmos. Environ., 34, 3617–3627, https://doi.org/10.1016/s1352-2310(00)00092-3, 2000. a, b
Chin, M., Ginoux, P., Kinne, S., Torres, O., Holben, B. N., Duncan, B. N., Martin, R. V., Logan, J. A., Higurashi, A., and Nakajima, T.: Tropospheric Aerosol Optical Thickness from the GOCART Model and Comparisons with Satellite and Sun Photometer Measurements, J. Atmos. Sci., 59, 461–483, https://doi.org/10.1175/1520-0469(2002)059<0461:TAOTFT>2.0.CO;2, 2002. a
Claquin, T., Schulz, M., and Balkanski, Y. J.: Modeling the mineralogy of atmospheric dust sources, J. Geophys. Res.-Atmos., 104, 22243–22256, https://doi.org/10.1029/1999JD900416, 1999. a, b, c, d, e, f, g, h, i, j, k, l, m, n, o, p, q, r, s, t, u
Crowley, J. N., Ammann, M., Cox, R. A., Hynes, R. G., Jenkin, M. E., Mellouki, A., Rossi, M. J., Troe, J., and Wallington, T. J.: Atmospheric Chemistry and Physics Evaluated kinetic and photochemical data for atmospheric chemistry: Volume V-heterogeneous reactions on solid substrates, Atmos. Chem. Phys, 10, 9059–9223, https://doi.org/10.5194/acp-10-9059-2010, 2010. a, b, c
Dassios, K. G. and Pandis, S. N.: The mass accommodation coefficient of ammonium nitrate aerosol, Atmos. Environ., 33, 2993–3003, https://doi.org/10.1016/S1352-2310(99)00079-5, 1999. a
Denier van der Gon, H., Gauss, M., Granier, C., Arellano, S., Benedictow, A., Darras, S., Dellaert, S., Guevara, M., Jalkanen, J.-P., Krueger, K., Kuenen, J., Liaskoni, M., Liousse, C., Markova, J., Perez, A. P., Quack, B., Simpson, D., Sindelarova, K., and Soulie, A.: Documentation of CAMS emission inventory products, Copernicus Atmosphere Monitoring Service, https://doi.org/10.24380/q2si-ti6i, 2023. a
Dentener, F. J., Carmichael, G. R., Zhang, Y., Lelieveld, J., and Crutzen, P. J.: Role of mineral aerosol as a reactive surface in the global troposphere, J. Geophys. Res.-Atmos., 101, 22869–22889, https://doi.org/10.1029/96jd01818, 1996. a, b, c, d
Ek, M. B., Mitchell, K. E., Lin, Y., Rogers, E., Grunmann, P., Koren, V., Gayno, G., and Tarpley, J. D.: Implementation of Noah land surface model advances in the National Centers for Environmental Prediction operational mesoscale Eta model, J. Geophys. Res.-Atmos., 108, 8851, https://doi.org/10.1029/2002JD003296, 2003. a
Emanuel, K. A. and Živković Rothman, M.: Development and Evaluation of a Convection Scheme for Use in Climate Models, J. Atmos. Sci., 56, 1766–1782, https://doi.org/10.1175/1520-0469(1999)056<1766:DAEOAC>2.0.CO;2, 1999. a
Fagerli, H., Tsyro, S., Simpson, D., Schulz, M., Gauss, M., Jonson, J. E., Benedictow, A., Wind, P., Ágnes Nyíri, Steensen, B. M., Valiyaveetil, S., Aas, W., Hjellbrekke, A.-G., Solberg, S., Stebel, K., Tørseth, K., Yttri, K. E., Mareckova, K., Wankmüller, R., Pinterits, M., Ullrich, B., Posch, M., van der Gon, H. D., Alastuey, A., and Theys, N.: Transboundary particulate matter, photo-oxidants, acidifying and eutrophying components, EMEP Status Report 2015, https://emep.int/publ/reports/2015/EMEP_Status_Report_1_2015.pdf (last access: 24 April 2025), 2015. a
Fairlie, T. D., Jacob, D. J., Dibb, J. E., Alexander, B., Avery, M. A., van Donkelaar, A., and Zhang, L.: Impact of mineral dust on nitrate, sulfate, and ozone in transpacific Asian pollution plumes, Atmos. Chem. Phys., 10, 3999–4012, https://doi.org/10.5194/acp-10-3999-2010, 2010. a, b, c, d, e, f, g, h, i, j, k, l, m, n, o, p, q, r, s, t, u, v
Feng, Y. and Penner, J. E.: Global modeling of nitrate and ammonium: Interaction of aerosols and tropospheric chemistry, J. Geophys. Res.-Atmos., 112, D01304, https://doi.org/10.1029/2005JD006404, 2007. a, b, c, d, e, f, g, h, i, j
Fenter, F. F., Caloz, F., and Rossi, M. J.: Atmospheric, Sci. Ltd, 29, 3365–3372, 1995. a, b, c
Ferrier, B. S., Jin, Y., Lin, Y., Black, T., Rogers, E., and Dimego, G.: Implementation of a new grid-scale cloud and precipitation scheme in the NCEP Eta model, 15th Conf. on Numerical Weather Prediction, 12–16 August, San Antonio, Texas, 47241, American Meteorological Society, 280–283, 2002. a
Foley, K. M., Roselle, S. J., Appel, K. W., Bhave, P. V., Pleim, J. E., Otte, T. L., Mathur, R., Sarwar, G., Young, J. O., Gilliam, R. C., Nolte, C. G., Kelly, J. T., Gilliland, A. B., and Bash, J. O.: Incremental testing of the Community Multiscale Air Quality (CMAQ) modeling system version 4.7, Geosci. Model Dev., 3, 205–226, https://doi.org/10.5194/gmd-3-205-2010, 2010. a
Fountoukis, C. and Nenes, A.: ISORROPIAII: A computationally efficient thermodynamic equilibrium model for K+–Ca2+–Mg2+–NH–Na+–SO–NO–Cl−–H2O aerosols, Atmos. Chem. Phys., 7, 4639–4659, https://doi.org/10.5194/acp-7-4639-2007, 2007. a, b, c, d, e
Ginoux, P., Chin, M., Tegen, I., Prospero, J. M., Holben, B., Dubovik, O., and Lin, S. J.: Sources and distributions of dust aerosols simulated with the GOCART model, J. Geophys. Res.-Atmos., 106, 20255–20273, https://doi.org/10.1029/2000JD000053, 2001. a
Ginoux, P., Prospero, J. M., Gill, T. E., Hsu, N. C., and Zhao, M.: Global-scale attribution of anthropogenic and natural dust sources and their emission rates based on MODIS Deep Blue aerosol products, Rev. Geophys., 50, 1–36, https://doi.org/10.1029/2012RG000388, 2012. a
Gonçalves Ageitos, M., Obiso, V., Miller, R. L., Jorba, O., Klose, M., Dawson, M., Balkanski, Y., Perlwitz, J., Basart, S., Di Tomaso, E., Escribano, J., Macchia, F., Montané, G., Mahowald, N. M., Green, R. O., Thompson, D. R., and Pérez García-Pando, C.: Modeling dust mineralogical composition: sensitivity to soil mineralogy atlases and their expected climate impacts, Atmos. Chem. Phys., 23, 8623–8657, https://doi.org/10.5194/acp-23-8623-2023, 2023. a, b, c, d, e, f, g, h
Goodman, A. L.: A laboratory study of the heterogeneous reaction of nitric acid on calcium carbonate particles, J. Geophys. Res.-Atmos., 105, 29053–29064, https://doi.org/10.1029/2000JD900396, 2000. a, b, c
Green, R. O., Mahowald, N. M., Clark, R. N., Ehlmann, B. L., Ginoux, P. A., Kalashnikova, O. V., Miller, R. L., Okin, G., Painter, T. H., Pérez García-Pando, C., Realmuto, V. J., Swayze, G. A., Thompson, D. R., Middleton, E., Guanter, L., Ben Dor, E., and Phillips, B. R.: NASA’s Earth Surface Mineral Dust Source Investigation, in: AGU Fall Meeting Abstracts, vol. 2018, 10–14 December, Washington, D.C., A24D–01, https://ui.adsabs.harvard.edu/abs/2018AGUFM.A24D..01G (last access: 24 April 2025), 2018. a
Guenther, A., Karl, T., Harley, P., Wiedinmyer, C., Palmer, P. I., and Geron, C.: Estimates of global terrestrial isoprene emissions using MEGAN (Model of Emissions of Gases and Aerosols from Nature), Atmos. Chem. Phys., 6, 3181–3210, https://doi.org/10.5194/ACP-6-3181-2006, 2006. a
Guerschman, J. P., Scarth, P. F., McVicar, T. R., Renzullo, L. J., Malthus, T. J., Stewart, J. B., Rickards, J. E., and Trevithick, R.: Assessing the effects of site heterogeneity and soil properties when unmixing photosynthetic vegetation, non-photosynthetic vegetation and bare soil fractions from Landsat and MODIS data, Remote Sens. Environ., 161, 12–26, https://doi.org/10.1016/j.rse.2015.01.021, 2015. a
Guevara, M., Tena, C., Porquet, M., Jorba, O., and García-Pando, C. P.: HERMESv3, a stand-alone multi-scale atmospheric emission modelling framework-Part 1: Global and regional module, Geosci. Model Dev., 12, 1885–1907, https://doi.org/10.5194/GMD-12-1885-2019, 2019. a, b
Guevara, M., Jorba, O., Tena, C., Denier van der Gon, H., Kuenen, J., Elguindi, N., Darras, S., Granier, C., and Pérez García-Pando, C.: Copernicus Atmosphere Monitoring Service TEMPOral profiles (CAMS-TEMPO): global and European emission temporal profile maps for atmospheric chemistry modelling, Earth Syst. Sci. Data, 13, 367–404, https://doi.org/10.5194/essd-13-367-2021, 2021. a
Guimbaud, C., Arens, F., Gutzwiller, L., Gäggeler, H. W., and Ammann, M.: Uptake of HNO3 to deliquescent sea-salt particles: A study using the short-lived radioactive isotope tracer 13N, Atmos. Chem. Phys., 2, 249–257, https://doi.org/10.5194/acp-2-249-2002, 2002. a, b
Hanisch, F. and Crowley, J. N.: The heterogeneous reactivity of gaseous nitric acid on authentic mineral dust samples, and on individual mineral and clay mineral components, Phys. Chem. Chem. Phys., 3, 2474–2482, https://doi.org/10.1039/b101700o, 2001. a, b, c, d, e
Hanisch, F. and Crowley, J. N.: Heterogeneous reactivity of NO and HNO3 on mineral dust in the presence of ozone, Phys. Chem. Chem. Phys., 5, 883–887, https://doi.org/10.1039/b211503d, 2003. a, b
Hauglustaine, D. A., Balkanski, Y., and Schulz, M.: A global model simulation of present and future nitrate aerosols and their direct radiative forcing of climate, Atmos. Chem. Phys., 14, 11031–11063, https://doi.org/10.5194/acp-14-11031-2014, 2014. a, b, c, d, e, f, g, h, i, j, k, l, m, n, o, p, q, r, s, t, u, v, w, x, y, z, aa, ab, ac, ad, ae, af, ag, ah
Herich, H., Tritscher, T., Wiacek, A., Gysel, M., Weingartner, E., Lohmann, U., Baltensperger, U., and Cziczo, D. J.: Water uptake of clay and desert dust aerosol particles at sub- and supersaturated water vapor conditions, Phys. Chem. Chem. Phys., 11, 7804–7809, https://doi.org/10.1039/b901585j, 2009.
Hersbach, H., Bell, B., Berrisford, P., Biavati, G., Horányi, A., Muñoz Sabater, J., Nicolas, J., Peubey, C., Radu, R., Rozum, I., Schepers, D., Simmons, A., Soci, C., Dee, D., and Thépaut, J.-N.: ERA5 hourly data on single levels from 1940 to present, Climate Data Store, https://doi.org/10.24381/cds.adbb2d47, 2023. a
Hodzic, A., Bessagnet, B., and Vautard, R.: A model evaluation of coarse-mode nitrate heterogeneous formation on dust particles, Atmos. Environ., 40, 4158–4171, https://doi.org/10.1016/j.atmosenv.2006.02.015, 2006. a, b, c, d, e
Hsu, N. C., Tsay, S.-C., King, M. D., and Herman, J. R.: Aerosol properties over bright-reflecting source regions, IEEE Trans. Geosci. Remote Sens., 42, 557–569, https://doi.org/10.1109/TGRS.2004.824067, 2004. a
Iacono, M. J., Delamere, J. S., Mlawer, E. J., Shephard, M. W., Clough, S. A., and Collins, W. D.: Radiative forcing by long-lived greenhouse gases: Calculations with the AER radiative transfer models, J. Geophys. Res.-Atmos., 113, 13103, https://doi.org/10.1029/2008JD009944, 2008. a
Jacob, D. J.: Heterogeneous chemistry and tropospheric ozone, 2000. a, b, c, d
Jaeglé, L., Quinn, P. K., Bates, T. S., Alexander, B., and Lin, J. T.: Global distribution of sea salt aerosols: New constraints from in situ and remote sensing observations, Atmos. Chem. Phys., 11, 3137–3157, https://doi.org/10.5194/ACP-11-3137-2011, 2011. a
Janjic, Z.: Nonlinear Advection Schemes and Energy Cascade on Semi-Staggered Grids, AMS, https://doi.org/10.1175/1520-0493(1984)112<1234:NASAEC>2.0.CO;2, 1984. a
Janjic, Z. and Gall, R.: Scientific Documentation of the NCEP Nonhydrostatic Multiscale Model on the B grid (NMMB), Part 1: Dynamics, University Corporation for Atmospheric Research, https://doi.org/10.5065/D6WH2MZX, 2012. a, b
Janjic, Z. I.: The Mellor-Yamada level 2.5 turbulence closure scheme in the NCEP Eta Model, American Meteorological Society, 354–355, 1996. a
Janjić, Z. I.: Comments on “Development and Evaluation of a Convection Scheme for Use in Climate Models”, J. Atmos. Sci., 57, 3686–3686, https://doi.org/10.1175/1520-0469(2000)057<3686:CODAEO>2.0.CO;2, 2000. a
Janjić, Z. I.: Nonsingular Implementation of the Mellor-Yamada Level 2.5 Scheme in the NCEP Meso model, NCEP Office Note; 437, https://repository.library.noaa.gov/view/noaa/11409 (last access: 24 April 2025), 2001. a
Jones, A. C., Hill, A., Remy, S., Abraham, N. L., Dalvi, M., Hardacre, C., Hewitt, A. J., Johnson, B., Mulcahy, J. P., and Turnock, S. T.: Exploring the sensitivity of atmospheric nitrate concentrations to nitric acid uptake rate using the Met Office's Unified Model, Atmos. Chem. Phys., 21, 15901–15927, https://doi.org/10.5194/acp-21-15901-2021, 2021. a, b, c, d, e, f, g, h, i, j, k, l, m, n, o, p, q, r, s, t, u, v
Jorba, O., Dabdub, D., Blaszczak-Boxe, C., Pérez, C., Janjic, Z., Baldasano, J. M., Spada, M., Badia, A., and Gonçalves, M.: Potential significance of photoexcited NO2 on global air quality with the NMMB/BSC chemical transport model, J. Geophys. Res.-Atmos., 117, 13301, https://doi.org/10.1029/2012JD017730, 2012. a
Jordan, C. E., Dibb, J. E., Anderson, B. E., and Fuelberg, H. E.: Uptake of nitrate and sulfate on dust aerosols during TRACE-P, J. Geophys. Res., 108, 8817, https://doi.org/10.1029/2002JD003101, 2003. a, b
Journet, E., Balkanski, Y., and Harrison, S. P.: A new data set of soil mineralogy for dust-cycle modeling, Atmos. Chem. Phys., 14, 3801–3816, https://doi.org/10.5194/ACP-14-3801-2014, 2014. a, b, c, d, e, f, g, h, i, j, k, l, m, n, o, p, q, r, s, t, u, v, w
Kaiser, J. W., Heil, A., Andreae, M. O., Benedetti, A., Chubarova, N., Jones, L., Morcrette, J.-J., Razinger, M., Schultz, M. G., Suttie, M., and Werf, G. R. V. D.: Biomass burning emissions estimated with a global fire assimilation system based on observed fire radiative power, Biogeosciences, 9, 527–554, https://doi.org/10.5194/bg-9-527-2012, 2012. a
Karydis, V. A., Tsimpidi, A. P., Pozzer, A., Astitha, M., and Lelieveld, J.: Effects of mineral dust on global atmospheric nitrate concentrations, Atmos. Chem. Phys., 16, 1491–1509, https://doi.org/10.5194/acp-16-1491-2016, 2016. a, b, c, d, e, f, g, h, i, j, k, l, m, n, o, p, q, r, s
Karydis, V. A., Tsimpidi, A. P., Pozzer, A., and Lelieveld, J.: How alkaline compounds control atmospheric aerosol particle acidity, Atmos. Chem. Phys, 21, 14983–15001, https://doi.org/10.5194/acp-21-14983-2021, 2021. a, b
Klose, M., Jorba, O., Ageitos, M. G., Escribano, J., Dawson, M. L., Obiso, V., Tomaso, E. D., Basart, S., Pinto, G. M., Macchia, F., Ginoux, P., Guerschman, J., Prigent, C., Huang, Y., Kok, J. F., Miller, R. L., and García-Pando, C. P.: Mineral dust cycle in the Multiscale Online Nonhydrostatic AtmospheRe CHemistry model (MONARCH) Version 2.0, Geosci. Model Dev, 14, 6403–6444, https://doi.org/10.5194/gmd-14-6403-2021, 2021. a, b, c, d
Krueger, B. J., Grassian, V. H., Laskin, A., and Cowin, J. P.: The transformation of solid atmospheric particles into liquid droplets through heterogeneous chemistry: Laboratory insights into the processing of calcium containing mineral dust aerosol in the troposphere, Geophys. Res. Lett., 30, 1148, https://doi.org/10.1029/2002GL016563, 2003. a, b, c
Krueger, B. J., Grassian, V. H., Cowin, J. P., and Laskin, A.: Heterogeneous chemistry of individual mineral dust particles from different dust source regions: The importance of particle mineralogy, Atmos. Environ., 38, 6253–6261, https://doi.org/10.1016/j.atmosenv.2004.07.010, 2004. a, b, c, d, e
Lana, A., Bell, T. G., Simó, R., Vallina, S. M., Ballabrera-Poy, J., Kettle, A. J., Dachs, J., Bopp, L., Saltzman, E. S., Stefels, J., Johnson, J. E., and Liss, P. S.: An updated climatology of surface dimethlysulfide concentrations and emission fluxes in the global ocean, Global Biogeochem. Cy., 25, GB1004, https://doi.org/10.1029/2010GB003850, 2011. a
Li, J., Wang, Z., Zhuang, G., Luo, G., Sun, Y., and Wang, Q.: Mixing of Asian mineral dust with anthropogenic pollutants over East Asia: A model case study of a super-duststorm in March 2010, Atmos. Chem. Phys., 12, 7591–7607, https://doi.org/10.5194/acp-12-7591-2012, 2012. a, b, c
Li, W. J. and Shao, L. Y.: Observation of nitrate coatings on atmospheric mineral dust particles, Atmos. Chem. Phys., 9, 1863–1871, https://doi.org/10.5194/acp-9-1863-2009, 2009. a, b
Li, X., Yu, Z., Yue, M., Liu, Y., Huang, K., Chi, X., Nie, W., Ding, A., Dong, X., and Wang, M.: Impact of mineral dust photocatalytic heterogeneous chemistry on the formation of the sulfate and nitrate: A modelling study over East Asia, Atmos. Environ., 316, 120166, https://doi.org/10.1016/j.atmosenv.2023.120166, 2024. a, b
Li, Y., Schichtel, B. A., Walker, J. T., Schwede, D. B., Chen, X., Lehmann, C. M., Puchalski, M. A., Gay, D. A., and Collett, J. L.: Increasing importance of deposition of reduced nitrogen in the United States, P. Natl. Acad. Sci. USA, 113, 5874–5879, https://doi.org/10.1073/pnas.1525736113, 2016. a
Liao, H., Adams, P. J., Chung, S. H., Seinfeld, J. H., Mickley, L. J., and Jacob, D. J.: Interactions between tropospheric chemistry and aerosols in a unified general circulation model, J. Geophys. Res.-Atmos., 108, 4001, https://doi.org/10.1029/2001jd001260, 2003. a, b
Liu, T. and Abbatt, J. P. D.: Oxidation of sulfur dioxide by nitrogen dioxide accelerated at the interface of deliquesced aerosol particles, Nat. Chem., 13, 1173–1177, https://doi.org/10.1038/s41557-021-00777-0, 2021. a
Liu, Y., P., C. J., Wang, H., and Laskin, A.: Kinetic Study of Heterogeneous Reaction of Deliquesced NaCl Particles with Gaseous HNO3, J. Phys. Chem. A, 111, 10026–10043, 2007. a, b, c, d, e, f, g, h
Liu, Y., Gibson, E. R., Cain, J. P., Wang, H., Grassian, V. H., and Laskin, A.: Kinetics of heterogeneous reaction of CaCO3 particles with gaseous HNO3 over a wide range of humidity, J. Phys. Chem. A, 112, 1561–1571, https://doi.org/10.1021/jp076169h, 2008. a, b
Liu, Y., Zhan, J., Zheng, F., Song, B., Zhang, Y., Ma, W., Hua, C., Xie, J., Bao, X., Yan, C., Bianchi, F., Petäjä, T., Ding, A., Song, Y., He, H., and Kulmala, M.: Dust emission reduction enhanced gas-to-particle conversion of ammonia in the North China Plain, Nat. Commun., 13, 6887, https://doi.org/10.1038/s41467-022-34733-4, 2022. a
Luo, G., Yu, F., and Schwab, J.: Revised treatment of wet scavenging processes dramatically improves GEOS-Chem 12.0.0 simulations of surface nitric acid, nitrate, and ammonium over the United States, Geosci. Model Dev., 12, 3439–3447, https://doi.org/10.5194/gmd-12-3439-2019, 2019. a
Lurmann, F. W., Wexler, A. S., Pandis, S. N., Musarra, S., Kumar, N., and Seinfeld, J. H.: Modelling urban and regional aerosols – II. Application to California's South Coast Air Basin, Atmos. Environ., 31, 2695–2715, https://doi.org/10.1016/S1352-2310(97)00100-3, 1997. a, b
Ma, Q., Zhong, C., Ma, J., Ye, C., Zhao, Y., Liu, Y., Zhang, P., Chen, T., Liu, C., Chu, B., and He, H.: Comprehensive Study about the Photolysis of Nitrates on Mineral Oxides, Environ. Sci. Technol., 55, 8604–8612, 2021. a
Mahowald, N., Albani, S., Kok, J. F., Engelstaeder, S., Scanza, R., Ward, D. S., and Flanner, M. G.: The size distribution of desert dust aerosols and its impact on the Earth system, Aeolian Res., 15, 53–71, https://doi.org/10.1016/j.aeolia.2013.09.002, 2014. a
Mashburn, C. D., Frinak, E. K., and Tolbert, M. A.: Heterogeneous uptake of nitric acid on Na-montmorillonite clay as a function of relative humidity, J. Geophys. Res.-Atmos., 111, D15213, https://doi.org/10.1029/2005JD006525, 2006. a
Meng, Z. and Seinfeld, J. H.: Time scales to achieve atmospheric gas-aerosol equilibrium for volatile species, Atmos. Environ., 30, 2889–2900, https://doi.org/10.1016/1352-2310(95)00493-9, 1996. a
Metzger, S., Dentener, F., Pandis, S., and Lelieveld, J.: Gas/aerosol partitioning: 1. A computationally efficient model, J. Geophys. Res., 107, 4312, https://doi.org/10.1029/2001JD001102, 2002. a, b
Milousis, A., Tsimpidi, A. P., Tost, H., Pandis, S. N., Nenes, A., Kiendler-Scharr, A., and Karydis, V. A.: Implementation of the ISORROPIA-lite aerosol thermodynamics model into the EMAC chemistry climate model (based on MESSy v2.55): implications for aerosol composition and acidity, Geosci. Model Dev., 17, 1111–1131, https://doi.org/10.5194/gmd-17-1111-2024, 2024. a, b, c
Möhler, O., Field, P. R., Connolly, P., Benz, S., Saathoff, H., Schnaiter, M., Wagner, R., Cotton, R., Krämer, M., Mangold, A., and Heymsfield, A. J.: Efficiency of the deposition mode ice nucleation on mineral dust particles, Atmos. Chem. Phys., 6, 3007–3021, https://doi.org/10.5194/acp-6-3007-2006, 2006.
Monin, A. S. and Obukhov, A. M.: Basic laws of turbulent mixing in the surface layer of the atmosphere, in: Tr. Akad. Nauk SSSR Geophiz. Inst, Vol. 24, 163–187, 1954. a
Myhre, G., Grini, A., and Metzger, S.: Modelling of nitrate and ammonium-containing aerosols in presence of sea salt, Atmos. Chem. Phys., 6, 4809–4821, https://doi.org/10.5194/acp-6-4809-2006, 2006. a, b, c, d
Navarro-Barboza, H., Pandolfi, M., Guevara, M., Enciso, S., Tena, C., Via, M., Yus-Díez, J., Reche, C., Pérez, N., Alastuey, A., Querol, X., and Jorba, O.: Uncertainties in source allocation of carbonaceous aerosols in a Mediterranean region, Environ. Int., 183, 108252, https://doi.org/10.1016/j.envint.2023.108252, 2024. a, b
Nenes, A., Pandis, S. N., and Pilinis, C.: ISORROPIA: A New Thermodynamic Equilibrium Model for Multiphase Multicomponent Inorganic Aerosols, Aquat. Geochem., 4, 123–152, https://doi.org/10.1023/A:1009604003981, 1998. a
Pai, S. J., Heald, C. L., Pierce, J. R., Farina, S. C., Marais, E. A., Jimenez, J. L., Campuzano-Jost, P., Nault, B. A., Middlebrook, A. M., Coe, H., Shilling, J. E., Bahreini, R., Dingle, J. H., and Vu, K.: An evaluation of global organic aerosol schemes using airborne observations, Atmos. Chem. Phys., 20, 2637–2665, https://doi.org/10.5194/acp-20-2637-2020, 2020. a
Paulot, F., Ginoux, P., Cooke, W. F., Donner, L. J., Fan, S., Lin, M.-Y., Mao, J., Naik, V., and Horowitz, L. W.: Sensitivity of nitrate aerosols to ammonia emissions and to nitrate chemistry: implications for present and future nitrate optical depth, Atmos. Chem. Phys, 16, 1459–1477, https://doi.org/10.5194/acp-16-1459-2016, 2016. a, b, c, d, e
Phadnis, M. J. and Carmichael, G. R.: Numerical investigation of the influence of mineral dust on the tropospheric chemistry of east Asia, J. Atmos. Chem., 36, 285–323, https://doi.org/10.1023/A:1006391626069, 2000. a, b, c
Pratte, P. and Rossi, M. J.: Nitric acid uptake on NaCl and sea salt aerosol at relative humidities in the range 2.8 to 25 % at ambient temperature, 1–22, https://doi.org/10.13140/2.1.2053.4562, 2006. a
Prince, A. P., Kleiber, P., Grassian, V. H., and Young, M. A.: Heterogeneous interactions of calcite aerosol with sulfur dioxide and sulfur dioxide–nitric acid mixtures, Phys. Chem. Chem. Phys., 9, 3432–3439, https://doi.org/10.1039/B703296J, 2007. a, b, c, d, e
Pringle, K. J., Tost, H., Message, S., Steil, B., Giannadaki, D., Nenes, A., Fountoukis, C., Stier, P., Vignati, E., and Lelieveld, J.: Description and evaluation of GMXe: A new aerosol submodel for global simulations (v1), Geosci. Model Dev., 3, 391–412, https://doi.org/10.5194/gmd-3-391-2010, 2010. a, b, c, d, e
Pérez, C., Haustein, K., Janjic, Z., Jorba, O., Huneeus, N., Baldasano, J. M., Black, T., Basart, S., Nickovic, S., Miller, R. L., Perlwitz, J. P., Schulz, M., and Thomson, M.: Atmospheric dust modeling from meso to global scales with the online NMMB/BSC-Dust model – Part 1: Model description, annual simulations and evaluation, Atmos. Chem. Phys., 11, 13001–13027, https://doi.org/10.5194/acp-11-13001-2011, 2011. a, b
Raupach, M. R., Gillette, D. A., and Leys, J. F.: The effect of roughness elements on wind erosion threshold, J. Geophys. Res.-Atmos., 98, 3023–3029, 1993. a, b
Rea, D. K.: The paleoclimatic record provided by eolian deposition in the deep sea: The geologic history of wind, Rev. Geophys., 32, 159–195, https://doi.org/10.1029/93RG03257, 1994. a
Riemer, N., Vogel, H., Vogel, B., Schell, B., Ackermann, I., Kessler, C., and Hass, H.: Impact of the heterogeneous hydrolysis of N2O5 on chemistry and nitrate aerosol formation in the lower troposphere under photosmog conditions, J. Geophys. Res.-Atmos., 108, 4144, https://doi.org/10.1029/2002JD002436, 2003. a, b, c
Riemer, N., Ault, A. P., West, M., Craig, R. L., and Curtis, J. H.: Aerosol Mixing State: Measurements, Modeling, and Impacts, Rev. Geophys., 57, 187–249, https://doi.org/10.1029/2018RG000615, 2019. a, b
Rémy, S., Kipling, Z., Flemming, J., Boucher, O., Nabat, P., Michou, M., Bozzo, A., Ades, M., Huijnen, V., Benedetti, A., Engelen, R., Peuch, V.-H., and Morcrette, J.-J.: Description and evaluation of the tropospheric aerosol scheme in the European Centre for Medium-Range Weather Forecasts (ECMWF) Integrated Forecasting System (IFS-AER, cycle 45R1), Geosci. Model Dev., 12, 4627–4659, https://doi.org/10.5194/gmd-12-4627-2019, 2019. a
Rémy, S., Kipling, Z., Huijnen, V., Flemming, J., Nabat, P., Michou, M., Ades, M., Engelen, R., and Peuch, V. H.: Description and evaluation of the tropospheric aerosol scheme in the Integrated Forecasting System (IFS-AER, cycle 47R1) of ECMWF, Geosci. Model Dev., 15, 4881–4912, https://doi.org/10.5194/gmd-15-4881-2022, 2022. a, b, c, d, e, f, g, h, i, j, k, l
Saul, T. D., Tolocka, M. P., and Johnston, M. V.: Reactive uptake of nitric acid onto sodium chloride aerosols across a wide range of relative humidities, J. Phys. Chem. A, 110, 7614–7620, https://doi.org/10.1021/jp060639a, 2006. a, b
Schwartz, S. E.: Mass-Transport Considerations Pertinent to Aqueous Phase Reactions of Gases in Liquid-Water Clouds, 415–471, Springer Berlin Heidelberg, ISBN 978-3-642-70627-1, 1986. a, b
Seinfeld, J. and Pandis, S.: Atmos. Chem. Phys.: From Air Pollution to Climate Change, 2nd Edn., https://www.scirp.org/reference/ReferencesPapers?ReferenceID=1345321 (last access: 24 April 2025), 2006. a, b, c, d
Seinfeld, J. H. and Pandis, S. N.: Atmos. Chem. Phys.: From Air Pollution to Climate Change, Environment: Science and Policy for Sustainable Development, 40, 26, https://doi.org/10.1080/00139157.1999.10544295, 1998. a
Semeniuk, K. and Dastoor, A.: Current state of atmospheric aerosol thermodynamics and mass transfer modeling: A review, Atmosphere, 11, 1–71, https://doi.org/10.3390/atmos11020156, 2020. a
Song, C. H. and Carmichael, G. R.: A three-dimensional modeling investigation of the evolution processes of dust and sea-salt particles in east Asia, J. Geophys. Res.-Atmos., 106, 18131–18154, https://doi.org/10.1029/2000JD900352, 2001. a, b, c
Song, C. H., Kim, C. M., Lee, Y. J., Carmichael, G. R., Lee, B. K., and Lee, D. S.: An evaluation of reaction probabilities of sulfate and nitrate precursors onto East Asian dust particles, J. Geophys. Res, 112, 18206, https://doi.org/10.1029/2006JD008092, 2007. a
Song, S., Gao, M., Xu, W., Shao, J., Shi, G., Wang, S., Wang, Y., Sun, Y., and McElroy, M. B.: Fine-particle pH for Beijing winter haze as inferred from different thermodynamic equilibrium models, Atmos. Chem. Phys., 18, 7423–7438, https://doi.org/10.5194/acp-18-7423-2018, 2018. a
Soulie, A., Granier, C., Darras, S., Zilbermann, N., Doumbia, T., Guevara, M., Jalkanen, J. P., Keita, S., Liousse, C., Crippa, M., Guizzardi, D., Hoesly, R., and Smith, S. J.: Global anthropogenic emissions (CAMS-GLOB-ANT) for the Copernicus Atmosphere Monitoring Service simulations of air quality forecasts and reanalyses, Earth Syst. Sci. Data, 16, 2261–2279, https://doi.org/10.5194/ESSD-16-2261-2024, 2024. a
Sousse, R.: “A Comprehensive Global Modelling Assessment of Nitrate Heterogeneous Formation on Desert Dust”: Column loads monthly means per species, Zenodo [data set], https://doi.org/10.5281/zenodo.12789730, 2024. a
Spada, M.: Development and evaluation of an atmospheric aerosol module implemented within the NMMB/BSC-CTM, Ph.D. thesis, Universitat Politècnica de Catalunya, http://hdl.handle.net/2117/95991 (last access: 24 April 2025), 2015. a
Spada, M., Jorba, O., García-Pando, C. P., Janjic, Z., and Baldasano, J. M.: Modeling and evaluation of the global sea-salt aerosol distribution: Sensitivity to emission schemes and resolution effects at coastal/orographic sites, Atmos. Chem. Phys., 13, 11735–11755, https://doi.org/10.5194/ACP-13-11735-2013, 2013. a, b, c
Sulprizio, M.: Chemistry instability introduced by ISORROPIA v2.2, http://wiki.seas.harvard.edu/geos-chem/index.php/ISORROPIA_II#Chemistry_instability_introduced_by_ISORROPIA_v2.2 (last access: 24 April 2025), 2022. a
Suman, A., Zanini, N., Vulpio, A., and Pinelli, M.: Apparatus and methods for the calibration and correction of a polydispersed dust feeding system applied in multiphase flow experiments, Exp. Therm. Fluid Sci., 151, 111074, https://doi.org/10.1016/j.expthermflusci.2023.111074, 2024.
Thompson, D., Green, R., Bradley, C., Brodrick, P., Mahowald, N., Ben-Dor, E., Bennett, M., Bernas, M., Carmon, N., Chadwick, K. D., Clark, R., Coleman, R., Cox, E., Diaz, E., Eastwood, M., Eckert, R., Ehlmann, B., Ginoux, P., Gonçalves Ageitos, M., and Zandbergen, S.: On-orbit calibration and performance of the EMIT imaging spectrometer, Remote Sens. Environ., 303, 113986, https://doi.org/10.1016/j.rse.2023.113986, 2024. a
Tolocka, M. P., Saul, T. D., and Johnston, M. V.: Reactive Uptake of Nitric Acid into Aqueous Sodium Chloride Droplets Using Real-Time Single-Particle Mass Spectrometry, J. Phys. Chem. A, 108, 2659–2665, https://doi.org/10.1021/jp036612y, 2004. a, b
Trump, E. R., Fountoukis, C., Donahue, N. M., and Pandis, S. N.: Improvement of simulation of fine inorganic PM levels through better descriptions of coarse particle chemistry, Atmos. Environ., 102, 274–281, https://doi.org/10.1016/j.atmosenv.2014.11.059, 2015. a, b, c
Uno, I., Wang, Z., Itahashi, S., Yumimoto, K., Yamamura, Y., Yoshino, A., Takami, A., Hayasaki, M., and Kim, B.-G. G.: Paradigm shift in aerosol chemical composition over regions downwind of China, Sci. Rep., 10, 1–11, https://doi.org/10.1038/s41598-020-63592-6, 2020. a, b
Usher, C. R., Al-Hosney, H., Carlos-Cuellar, S., and Grassian, V. H.: A laboratory study of the heterogeneous uptake and oxidation of sulfur dioxide on mineral dust particles, J. Geophys. Res.-Atmos., 107, 4713, https://doi.org/10.1029/2002JD002051, 2002. a, b, c, d, e
Usher, C. R., Michel, A. E., and Grassian, V. H.: Reactions on Mineral Dust, Chem. Rev., 103, 4883–4939, https://doi.org/10.1021/cr020657y, 2003. a, b, c, d, e, f, g, h, i, j, k, l, m, n, o, p
Vignati, E., Wilson, J., and Stier, P.: M7: An efficient size-resolved aerosol microphysics module for large-scale aerosol transport models, J. Geophys. Res.-Atmos., 109, D22202, https://doi.org/10.1029/2003JD004485, 2004. a
Vlasenko, A., Sjogren, S., Weingartner, E., Stemmler, K., Gäggeler, H. W., and Ammann, M.: Atmospheric Chemistry and Physics Effect of humidity on nitric acid uptake to mineral dust aerosol particles, Atmos. Chem. Phys., 6, 2147, https://doi.org/10.5194/acp-6-2147-2006, 2006. a, b, c, d, e, f
Vlasenko, A., Huthwelker, T., Gäggeler, H. W., and Ammann, M.: Kinetics of the heterogeneous reaction of nitric acid with mineral dust particles: An aerosol flowtube study, Phys. Chem. Chem. Phys., 11, 7921–7930, https://doi.org/10.1039/b904290n, 2009. a, b, c
Wang, Z., Pan, X., Uno, I., Li, J., Wang, Z., Chen, X., Fu, P., Yang, T., Kobayashi, H., Shimizu, A., Sugimoto, N., and Yamamoto, S.: Significant impacts of heterogeneous reactions on the chemical composition and mixing state of dust particles: A case study during dust events over northern China, Atmos. Environ., 159, 83–91, https://doi.org/10.1016/j.atmosenv.2017.03.044, 2017. a
Wei, C.: Modeling the effects of heterogeneous reactions on atmospheric Modeling the effects of heterogeneous reactions on atmospheric chemistry and aerosol properties chemistry and aerosol properties, Ph.D. thesis, University of Iowa, https://doi.org/10.17077/etd.2xewzpnz, 2010. a, b, c, d, e
Wesely, M.: Parameterization of surface resistances to gaseous dry deposition in regional-scale numerical models, Atmos. Environ., 23, 1293–1304, https://doi.org/10.1016/0004-6981(89)90153-4, 1989. a
Wexler, A. S. and Seinfeld, J. H.: The distribution of ammonium salts among a size and composition dispersed aerosol, Atmos. Environ. Pt. A., 24, 1231–1246, https://doi.org/10.1016/0960-1686(90)90088-5, 1990. a
Whitten, G. Z., Heo, G., Kimura, Y., McDonald-Buller, E., Allen, D. T., Carter, W. P., and Yarwood, G.: A new condensed toluene mechanism for Carbon Bond: CB05-TU, Atmos. Environ., 44, 5346–5355, https://doi.org/10.1016/J.ATMOSENV.2009.12.029, 2010. a
Wild, O., Zhu, X., and Prather, M. J.: Fast-J: Accurate Simulation of In- and Below-Cloud Photolysis in Tropospheric Chemical Models, J. Atmos. Chem., 37, 245–282, https://doi.org/10.1023/A:1006415919030, 2000. a
Yarwood, G., Rao, S., Yocke, M., and Whitten, G. Z.: Updates to the carbon bond chemical mechanism: CB05 final report to the US EPA, RT-0400675, https://www.regulations.gov/document/EPA-HQ-OAR-2010-0162-3417 (last access: 24 April 2025), 2005. a
Yu, Z., Jang, M., and Park, J.: Modeling atmospheric mineral aerosol chemistry to predict heterogeneous photooxidation of SO2, 17, 10001–10017, https://doi.org/10.5194/acp-17-10001-2017, 2017. a
Yue, Y., Cheng, J., Lee, K. S., Stocker, R., He, X., Yao, M., and Wang, J.: Effects of relative humidity on heterogeneous reaction of SO2 with CaCO3 particles and formation of CaSO4 ⋅ 2H2O crystal as secondary aerosol, Atmos. Environ., 268, 118776, https://doi.org/10.1016/J.ATMOSENV.2021.118776, 2022. a, b
Zakoura, M. and Pandis, S. N.: Overprediction of aerosol nitrate by chemical transport models: The role of grid resolution, Atmos. Environ., 187, 390–400, https://doi.org/10.1016/j.atmosenv.2018.05.066, 2018. a
Zaveri, R. A., Easter, R. C., Fast, J. D., and Peters, L. K.: Model for Simulating Aerosol Interactions and Chemistry (MOSAIC), J. Geophys. Res.-Atmos., 113, 1–29, https://doi.org/10.1029/2007JD008782, 2008. a, b, c
Zaveri, R. A., Easter, R. C., Singh, B., Wang, H., Lu, Z., Tilmes, S., Emmons, L. K., Vitt, F., Zhang, R., Liu, X., Ghan, S. J., and Rasch, P. J.: Development and Evaluation of Chemistry-Aerosol-Climate Model CAM5-Chem-MAM7-MOSAIC: Global Atmospheric Distribution and Radiative Effects of Nitrate Aerosol, J. Adv. Model. Earth Sy., 13, e2020MS002346, https://doi.org/10.1029/2020MS002346, 2021. a
Zhai, S., Jacob, D. J., Pendergrass, D. C., Colombi, N. K., Shah, V., Yang, L. H., Zhang, Q., Wang, S., Kim, H., Sun, Y., Choi, J.-S., Park, J.-S., Luo, G., Yu, F., Woo, J.-H., Kim, Y., Dibb, J. E., Lee, T., Han, J.-S., Anderson, B. E., Li, K., and Liao, H.: Coarse particulate matter air quality in East Asia: implications for fine particulate nitrate, Atmos. Chem. Phys., 23, 4271–4281, https://doi.org/10.5194/acp-23-4271-2023, 2023. a
Zilitinkevich, S. S.: Bulk characteristics of turbulence in the atmospheric planetary boundary layer, Trudy GGO, 167, 49–52, 1965. a