the Creative Commons Attribution 4.0 License.
the Creative Commons Attribution 4.0 License.
 | 26 Mar 2025
Construction and application of a pollen emissions model based on phenology and random forests
Jiangtao Li
Xingqin An
Zhaobin Sun
Caihua Ye
Qing Hou
Yuxin Zhao
Zhe Liu
In recent years, the intensification of global climate change and environmental pollution has led to a marked increase in pollen-induced allergic diseases. This study leverages 16 years of continuous pollen monitoring data, alongside meteorological factors and plant functional type data, to construct a pollen emissions model using phenology and random forests (RFs). This model is then employed to simulate the emission characteristics of three primary types of autumn pollen (Artemisia, chenopods and total pollen concentration), elucidating the emission patterns throughout the seasonal cycle in Beijing. Phenology and RFs precisely simulate the start and end day of year of pollen, as well as the annual pollen production. There are significant spatiotemporal differences among the three types of pollen. On average, pollen dispersal begins around 10 August, peaks around 30 August and concludes by 25 September, with a dispersal period lasting approximately 45 d. Furthermore, the relationship between pollen emissions and meteorological factors is investigated, revealing that temperature, relative humidity (RH) and sunshine hours (SSHs) significantly influence annual pollen emissions. Specifically, temperature and RH exhibit a strong positive correlation with annual pollen emissions, while SSHs show a negative correlation. Different pollen types display varied responses to meteorological factors. Finally, the constructed pollen emissions model is integrated into the ICTP Regional Climate Model (RegCM) and validated using pollen observation data, confirming its reliability in predicting pollen concentrations. This study not only enhances the understanding of pollen release mechanisms but also provides scientific evidence for the selection and planting of urban greening plants.
- Article
(4934 KB) - Full-text XML
-
Supplement
(5255 KB) - BibTeX
- EndNote


Pollen consists of microscopic particles, typically ranging from 5 to 100 µm in diameter, released by plants to transfer male genetic material for reproduction. These particles, significant allergens, disperse into the atmosphere via wind, contributing to atmospheric particulate matter, interacting with clouds and radiation, and playing a pivotal role in plant fertilization and gene dissemination (Damialis et al., 2011; Lei et al., 2023). Additionally, pollen is linked to allergic diseases such as allergic rhinitis and asthma and may even elevate the risk of gastrointestinal and neurological disorders (Guzman et al., 2007; Krishna et al., 2020; Chen et al., 2020; Stas et al., 2021). In China, the incidence of pollen allergies has surged from 5 % to 17.8 % and continues to rise rapidly (Lou et al., 2017). Pollen-induced respiratory allergic symptoms, such as allergic rhinitis (AR), affect up to 30 % of the global population, particularly children under 18 (Mir et al., 2012; Wang et al., 2016; Zhang and Steiner, 2022; Zhao et al., 2023). It is generally believed that these respiratory allergic diseases are more prevalent in developed countries (Emanuel, 1988; Ibrahim et al., 2021). However, the International Study of Asthma and Allergies in Childhood (ISAAC) global reports indicate that these diseases are equally or even more prevalent in some developing countries compared to developed ones (Asher et al., 2006; Mallol et al., 2013). Children, as a vulnerable population, are particularly susceptible to AR and its complications (Cingi et al., 2017). Without effective early intervention, allergic symptoms in children can persist throughout their lives, imposing a substantial economic burden on families and healthcare systems (Ahmed et al., 2018) and potentially posing a life-threatening risk (Schmidt, 2016). In China, a densely populated developing country, the proportion of pediatric allergic diseases within the spectrum of childhood illnesses is increasing annually, leading to significant economic and health losses due to medical expenses, impacts on human life, and premature death (National Cooperative Group on Childhood Asthma, 1993; Chen and National Cooperative Group on Childhood Asthma, 2003; National Cooperative Group on Childhood Asthma et al., 2013). Furthermore, since pollen release is closely linked to environmental factors, climate change may influence pollen release, thereby affecting the incidence of allergic diseases (Wang et al., 2018; Bishan et al., 2020). In recent decades, the pollen season has exhibited a trend of becoming longer and more intense, which may exacerbate the conditions of allergic rhinitis and asthma (D'Amato et al., 2016; Lake et al., 2017; Aerts et al., 2020; Kurganskiy et al., 2021).
With the improvement in living standards and heightened health awareness, airborne pollen diseases, such as hay fever, have garnered widespread attention. As a typical seasonal epidemic (Yin et al., 2005; Lei et al., 2023), hay fever significantly impacts global health. Existing studies have demonstrated that the incidence of airborne pollen diseases is closely associated with the concentration of airborne allergenic pollen, particularly during peak pollen seasons (Frei and Gassner, 2008; Bastl et al., 2018; Kurganskiy et al., 2021). Due to the regional nature of airborne pollen, the types and concentrations of pollen vary geographically. Although the annual variation trend of total pollen amount generally exhibits a similar bimodal pattern, increasing annual climatic variability amidst global warming has led to significant changes in the pollen seasons of various plants, with discrepancies of more than 20 d in some years. This variability poses practical challenges for conducting pollen monitoring research and providing public meteorological services (He et al., 2001; Gu and Liao, 2003; Bai et al., 2009; Lei et al., 2023). Therefore, studying pollen concentration and distribution is crucial for understanding the pathogenesis of airborne pollen diseases, conducting effective pollen monitoring research and delivering accurate public meteorological services.
However, compared to regions such as Europe and the United States, China faces significant challenges in pollen monitoring due to fewer monitoring stations, shorter monitoring histories and a lower prevalence of automated facilities. These limitations have resulted in China's pollen simulation research remaining primarily at the level of simple statistical methods, focusing only on basic statistical studies of the impact of meteorological conditions on pollen concentration. In contrast, numerical models are rarely employed for regional simulation of pollen concentration. This situation reflects the relative lag in China's pollen monitoring and research system, hindering a deeper understanding of pollen dispersion patterns and the scientific study of related health issues (Wu et al., 2011; Meng et al., 2016; Guan et al., 2021; Gao et al., 2022).
Although numerical models play a crucial role in simulating pollen concentration, they require a clear understanding of pollen emissions. Numerical models are broad mathematical frameworks used to simulate various physical processes through numerical approximations, including atmospheric dynamics and climate systems. In contrast, a pollen emissions model specifically estimates the release and distribution of pollen into the atmosphere, taking into account factors such as pollen phenology, vegetation types and environmental conditions. Pollen emissions are influenced not only by meteorological factors but also by vegetation types, land use changes and human activities (Sofiev et al., 2006; Wozniak and Steiner, 2017; Zhang and Steiner, 2022; He et al., 2023; Lei et al., 2023). Particularly in the context of accelerated urbanization, the selection and layout of urban greening plants have a significant impact on pollen emissions. The complex interactions of these factors pose significant challenges to accurately simulating pollen emissions.
Since 2004, various pollen prediction models have been developed to enhance the accuracy of pollen emission estimates. Helbig et al. (2004) introduced a parameterization method for calculating pollen release and resuspension fluxes, implemented in the KAMM/DRAIS mesoscale model, although it relied on assumptions due to limited observational data. Subsequently, Sofiev et al. (2006) analyzed the feasibility of large-scale atmospheric migration of allergenic pollen, validating existing dispersion models and providing key parameterizations for dry and wet deposition, which were applied in Finland's SILAM (System for Integrated modeLling of Atmospheric coMposition) system. However, this direct simulation of pollen concentration based on numerical models has significant complexity and uncertainty. Wozniak and Steiner (2017) developed the Pollen Emission Prediction Model (PECM1.0), which simulates seasonal pollen counts based on geography, vegetation and meteorology. The model establishes empirical relationships between historical average temperatures and pollen season timings for four vegetation types. It captures up to 57 % of seasonal variations, allowing for analysis of climate change impacts on wind-driven pollen emissions. Building on this, Zhang and Steiner (2022) introduced PECM2.0, which incorporates precipitation and CO2 factors while refining the linear relationship between annual pollen production and temperature, ultimately predicting the temperature effects by the end of the century. However, the linear relationships based on historical temperatures have significant uncertainties, limiting their applicability for regional studies. Therefore, the challenge of constructing a pollen emissions model that is better suited for regional scales and has broader applicability warrants careful consideration and further research. Such advancements could significantly enhance our understanding of pollen dynamics and improve the accuracy of related health risk assessments.
Given the importance of accurately modeling pollen emissions, validation of numerical models for pollen emissions is necessary. These models not only provide a framework for simulating atmospheric processes but also allow for a more nuanced understanding of how various factors influence pollen dynamics. RegCM (Regional Climate Model) is the pioneering regional climate model system used for climate downscaling, originating in the late 1980s and early 1990s at the National Center for Atmospheric Research (NCAR) in the United States. It has since undergone several development iterations and is currently maintained at the International Centre for Theoretical Physics (ICTP) in Italy. This open-source system is widely utilized by numerous research teams, forming an extensive network for regional climate research. The model can be applied globally and is evolving into a fully coupled regional earth system model, incorporating ocean, lake, aerosol, desert dust, chemistry, hydrology and land surface processes. The version used in this study is RegCM4.7.1.
Therefore, this study constructs a pollen emissions model for the Beijing area, leveraging pollen concentration and meteorological monitoring data, combined with pollen phenology and the random forest (RF) algorithm. It conducts a simulation study on the emission phenology of three types of pollen in Beijing (Artemisia, chenopods and total pollen concentration) to calculate the pollen emissions potential. The study also investigates the seasonal and spatiotemporal distribution characteristics of pollen in Beijing and its potential correlations with meteorological factors and climatic conditions. Additionally, the constructed pollen emissions parameterization method is applied to RegCM and evaluated for accuracy using 15 years of pollen observation data. This comprehensive study will enhance the understanding of pollen sources, provide innovative guidance for the selection and planting of greening plants, and promote sustainable development in ecological protection and urban planning.
2.1 Model description
2.1.1 Parameterization method for pollen emissions
This study's pollen emissions potential integrates geographical parameters, vegetation types and meteorological data and incorporates autumn pollen phenology and RFs to enhance the simulation of pollen phenology (Wozniak and Steiner, 2017; Zhang and Steiner, 2022). This approach is used to predict pollen concentration and distribution within the seasonal cycle. The specific calculation formula is as follows:
In the formula, Ei(t) represents the pollen emissions potential for pollen type i on day t of the year (DOY), t represents a specific day of the year and i represents the ith type of pollen. fi represents the vegetation land cover fraction, which is the percentage (%) of different vegetation types within a unit area. Pannual,i represents the production factor of the ith vegetation type, which is the number of pollen grains released during the pollen season, measured in grains per m2 per year. In this study, Pannual,i is calculated based on the RF algorithm (Sect. 2.1.3). represents the phenological evolution of pollen emissions, controlling the pollen release process. The formula indicates that pollen emissions during the pollen season follow a Gaussian distribution, where μ (and δ) are the mean and standard deviation of the Gaussian distribution. These parameters are calculated from sDOY (start day of year) and eDOY (end day of year) of the pollen season, as follows:
In this context, sDOY and eDOY are optimized using autumn pollen phenology (Sect. 2.1.2). The parameter a represents a fitting parameter that explains the conversion between the empirical phenological dates based on pollen count thresholds and the equivalent width of the emission curve. In this study, the value of a is set to 4.
This equation can be applied to a specific type of pollen or to the calculation of pollen concentration over the entire pollen season, depending mainly on the land cover type. The emission can be calculated offline using this equation or applied in online calculations.
2.1.2 Autumn pollen phenology model
In this study, we used three different calculation methods (Rs1, Rs2, Rssig) for the autumn phenology model to simulate sDOY and eDOY of autumn pollen (Meier and Bigler, 2023). Each model is related to temperature and sunshine hours (SSHs). The specific calculation formulas are as follows:
In the above equations, Rs1, Rs2 and Rssig represent three different autumn phenology model categories. Ti and Li represent the temperature and SSHs on a given day, respectively, while Tbase and Lbase represent the thresholds for temperature and SSHs, respectively. In the Rs1 and Rs2 models, when the temperature and SSHs are below the threshold or the date exceeds a fixed DOY, Rs starts accumulating. In the Rssig model, temperature and SSHs accumulate inversely in an exponential form. The day tn, when the cumulative amount exceeds the threshold Y, represents the final simulated pollen start/end date. t0 represents the start day of accumulation, which is the first day when Ti<Tbase and Li<Lbase. The parameters that need to be adjusted are Y, Tbase, Lbase, x, y and start_day. In this study, the simulated annealing (SA) algorithm is used for parameter adjustment. The principle of the SA is to simulate the random optimization process of the annealing process in solid-state physics, which can accept non-optimal solutions with a certain probability to avoid falling into local optima and eventually achieve the global optimum.
2.1.3 Random forests
Random forest (RF) is an ensemble learning algorithm introduced by Breiman (2001) for classification and regression tasks. This algorithm enhances model prediction performance and robustness by constructing multiple decision trees and combining their outputs. The core principle involves drawing multiple sample sets with replacement from the original training set, training a decision tree for each sample set and randomly selecting a subset of features at each node split to reduce correlation between the trees. Ultimately, RF generates the final prediction by averaging (for regression) or voting (for classification) the outputs of these trees. The advantages of this method include high prediction accuracy, strong resistance to overfitting, suitability for high-dimensional data and efficient training processes. The RF algorithm has been widely applied across various fields (Virro et al., 2022; Li et al., 2023; Chen et al., 2024; Valipour Shokouhi et al., 2024).
In this study, the RF algorithm is employed to simulate annual pollen production. Each pollen dataset is divided into training and testing sets in a 4:1 ratio, with the training set used for model training and the testing set for accuracy validation. Additionally, a grid search with cross-validation is applied to optimize the hyperparameters of each estimator. Key parameters for RF adjustment include n_estimators, max_depth, min_samples_split and min_samples_leaf. Hyperparameter optimization is a crucial step in enhancing model performance.
2.1.4 Implementation of pollen emissions in RegCM
In this model, a pollen emissions model based on phenology and RF calculates the emission potential of different types of pollen offline, and this is then incorporated into the RegCM model. The calculation of pollen concentration in this model follows the method of Sofiev et al. (2013), with the formula as follows:
where fw, fr and fh represent the wind, precipitation and relative humidity (RH) factors, respectively, influencing pollen emissions concentration. fw is exponentially related to the 10 m wind speed u10 and vertical turbulent wind speed uconv. pr and rh represent precipitation and RH. When precipitation is below the threshold prlow, the precipitation factor is 1. When precipitation exceeds the threshold prhigh, the factor is 0. When precipitation is between these thresholds, the factor is calculated as the ratio of the difference between the high threshold and precipitation to the difference between the thresholds, with default values pr mm and prhigh=0.5 mm. Similarly, the RH factor is related to RH and its thresholds, with default values rhlow=50 % and rhhigh=80 %. These factors explain the impact of wind, precipitation and humidity on pollen emissions. Given the significant influence of precipitation and RH on pollen emissions, this study adjusts prhigh and rhhigh values to 1 mm and 90 %, respectively. Higher thresholds can prevent excessive suppression of pollen emissions under frequent precipitation and high humidity conditions, thus more accurately simulating actual pollen concentration changes and better adapting the model to different climatic conditions.
Moreover, RegCM includes the pollen tracer transport equation (Solmon et al., 2006), as follows:
where χ represents the tracer; FH and FV represent horizontal and vertical diffusion; TC represents convective transport, RWls and RWc represent large-scale and convective precipitation wet removal processes, respectively; and Dd represents dry removal processes. This transport equation comprehensively considers various physical processes and removal mechanisms of pollen in the atmosphere, allowing the simulation of the entire process from pollen release to atmospheric dispersion and deposition. This provides a foundation for fully describing the spatial distribution and temporal evolution of pollen in the atmosphere, which is crucial for studying pollen dispersion in the air, determining the spatial distribution of pollen concentration and predicting future changes in pollen concentration.
2.2 Data
2.2.1 Observed pollen concentrations
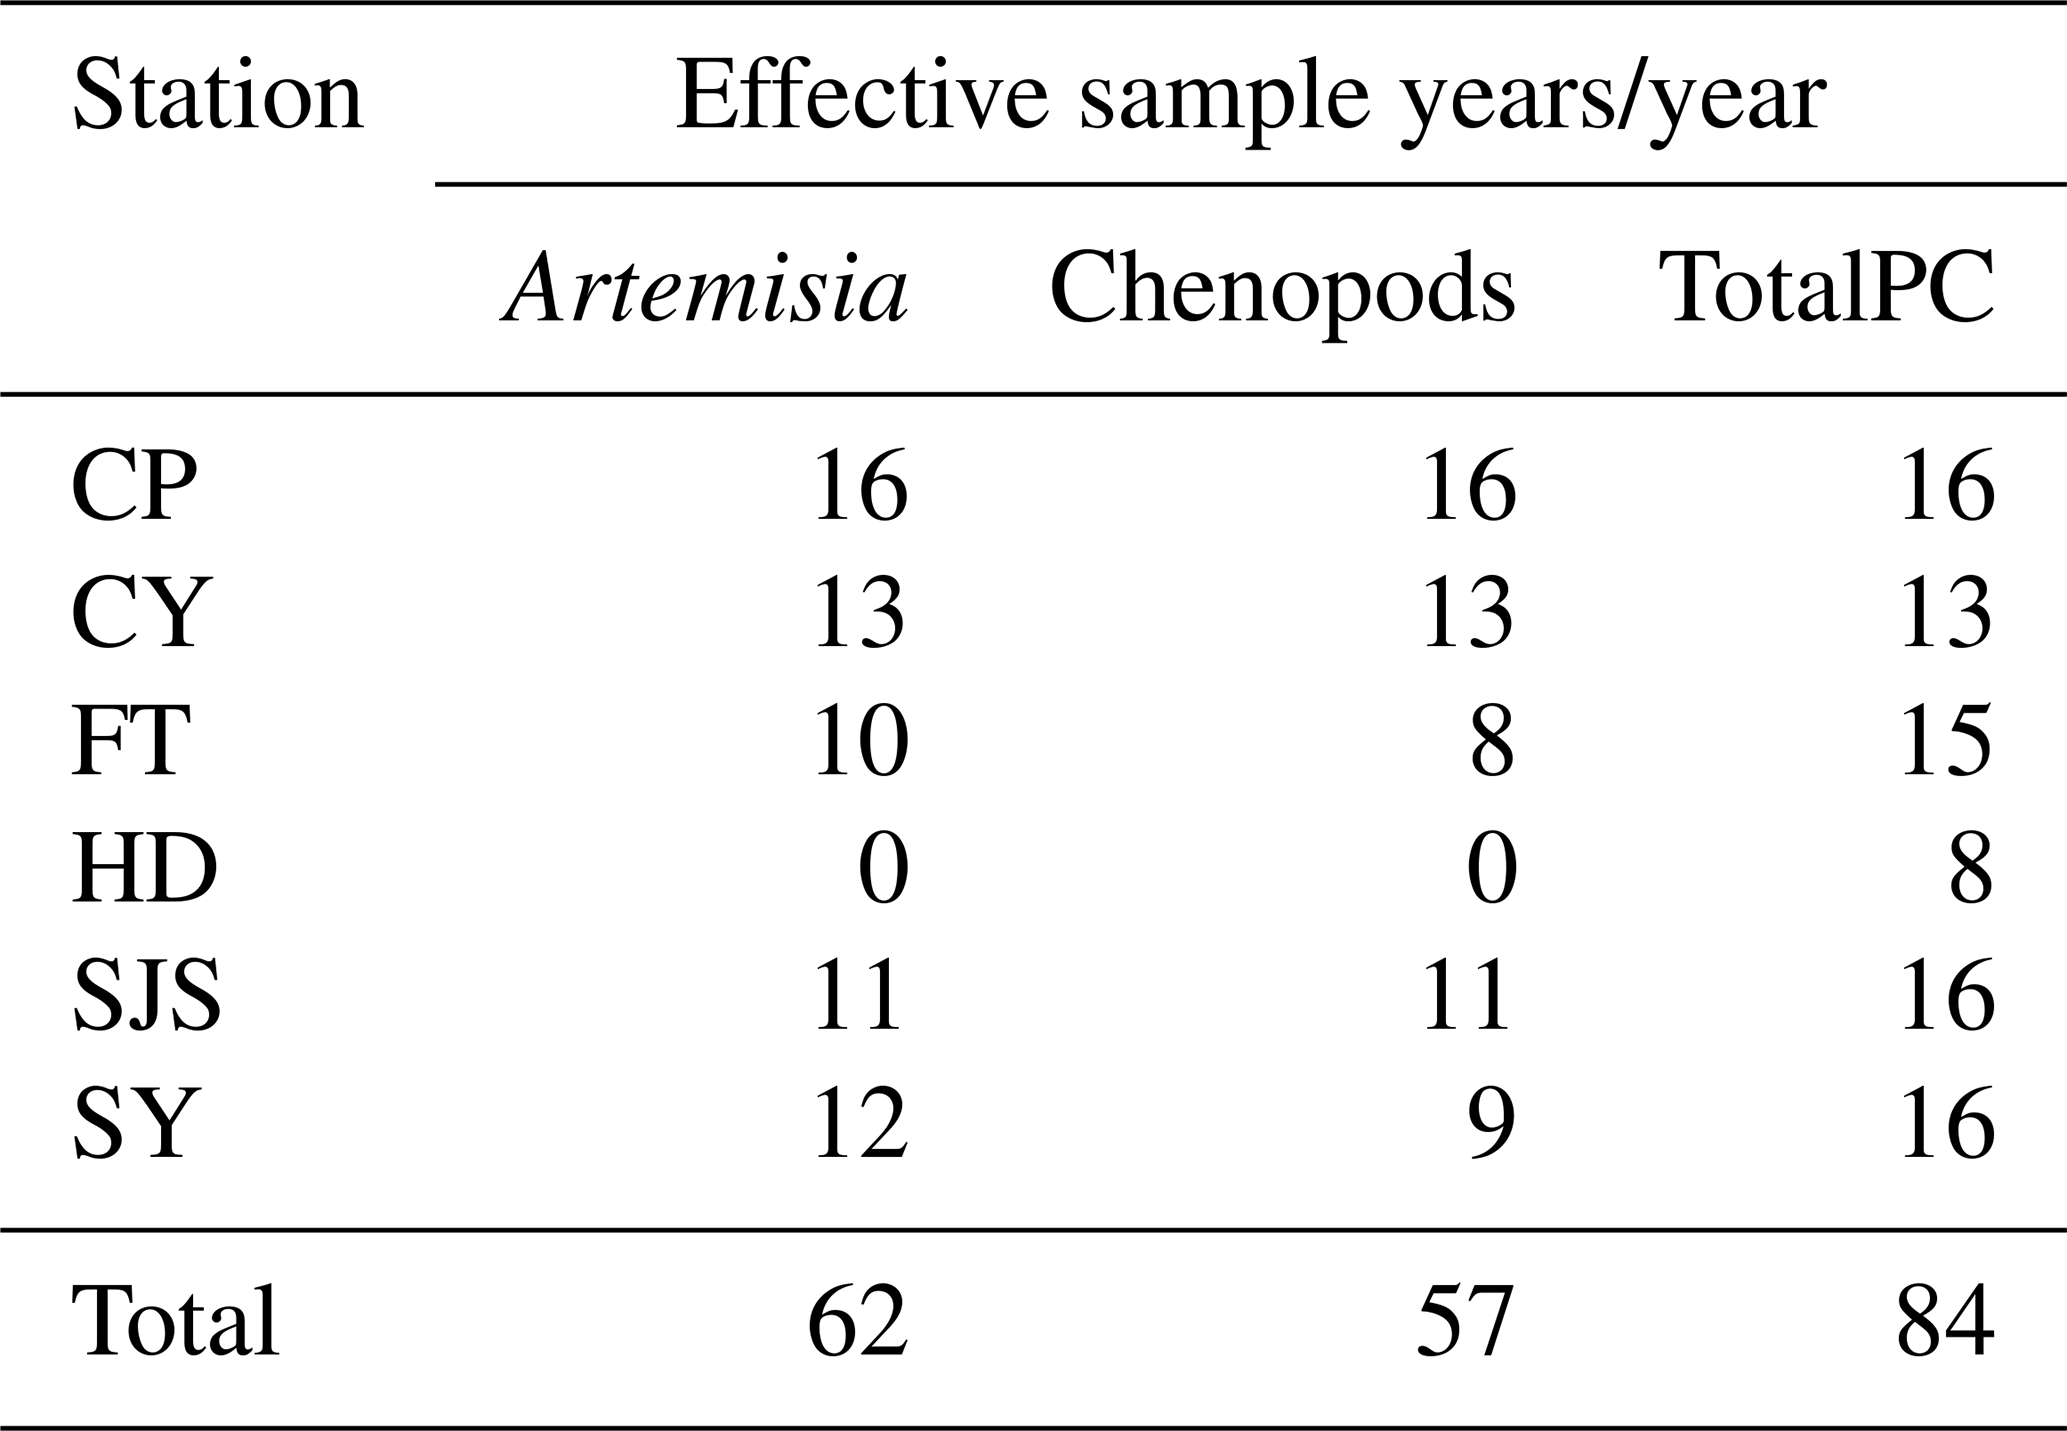
The daily pollen concentration data were collected from six monitoring stations in Beijing: Changping (CP), Chaoyang (CY), Fengtai (FT), Haidian (HD), Shijingshan (SJS) and Shunyi (SY), as shown in Fig. 1. The monitoring period spanned April to October each year from 2006 to 2021, covering the main pollen season in Beijing. The gravitational settling method (unit: 103 grains per m2 per day) was used for monitoring. The pollen concentration data included total pollen concentration (the sum of pollen concentrations from all taxa, abbreviated as TotalPC) and the concentrations of pollen from 10 common allergenic plants. These species included trees such as pine, poplar, birch, cypress, ash and elm, as well as weeds like Artemisia, chenopods, Humulus and Amaranthus. Although autumn pollen concentrations are lower compared to spring, autumn weed pollen has a higher allergenic potential (Zhao et al., 2023). Therefore, this study focuses on the analysis of autumn weed pollen. Due to significant data gaps in the pollen concentration of specific species, we only selected the data that were more complete and of higher allergenic potential, specifically Artemisia, chenopods and TotalPC. Table 1 provides basic information, such as the number of effective sample years for these three types of pollen across the six stations.
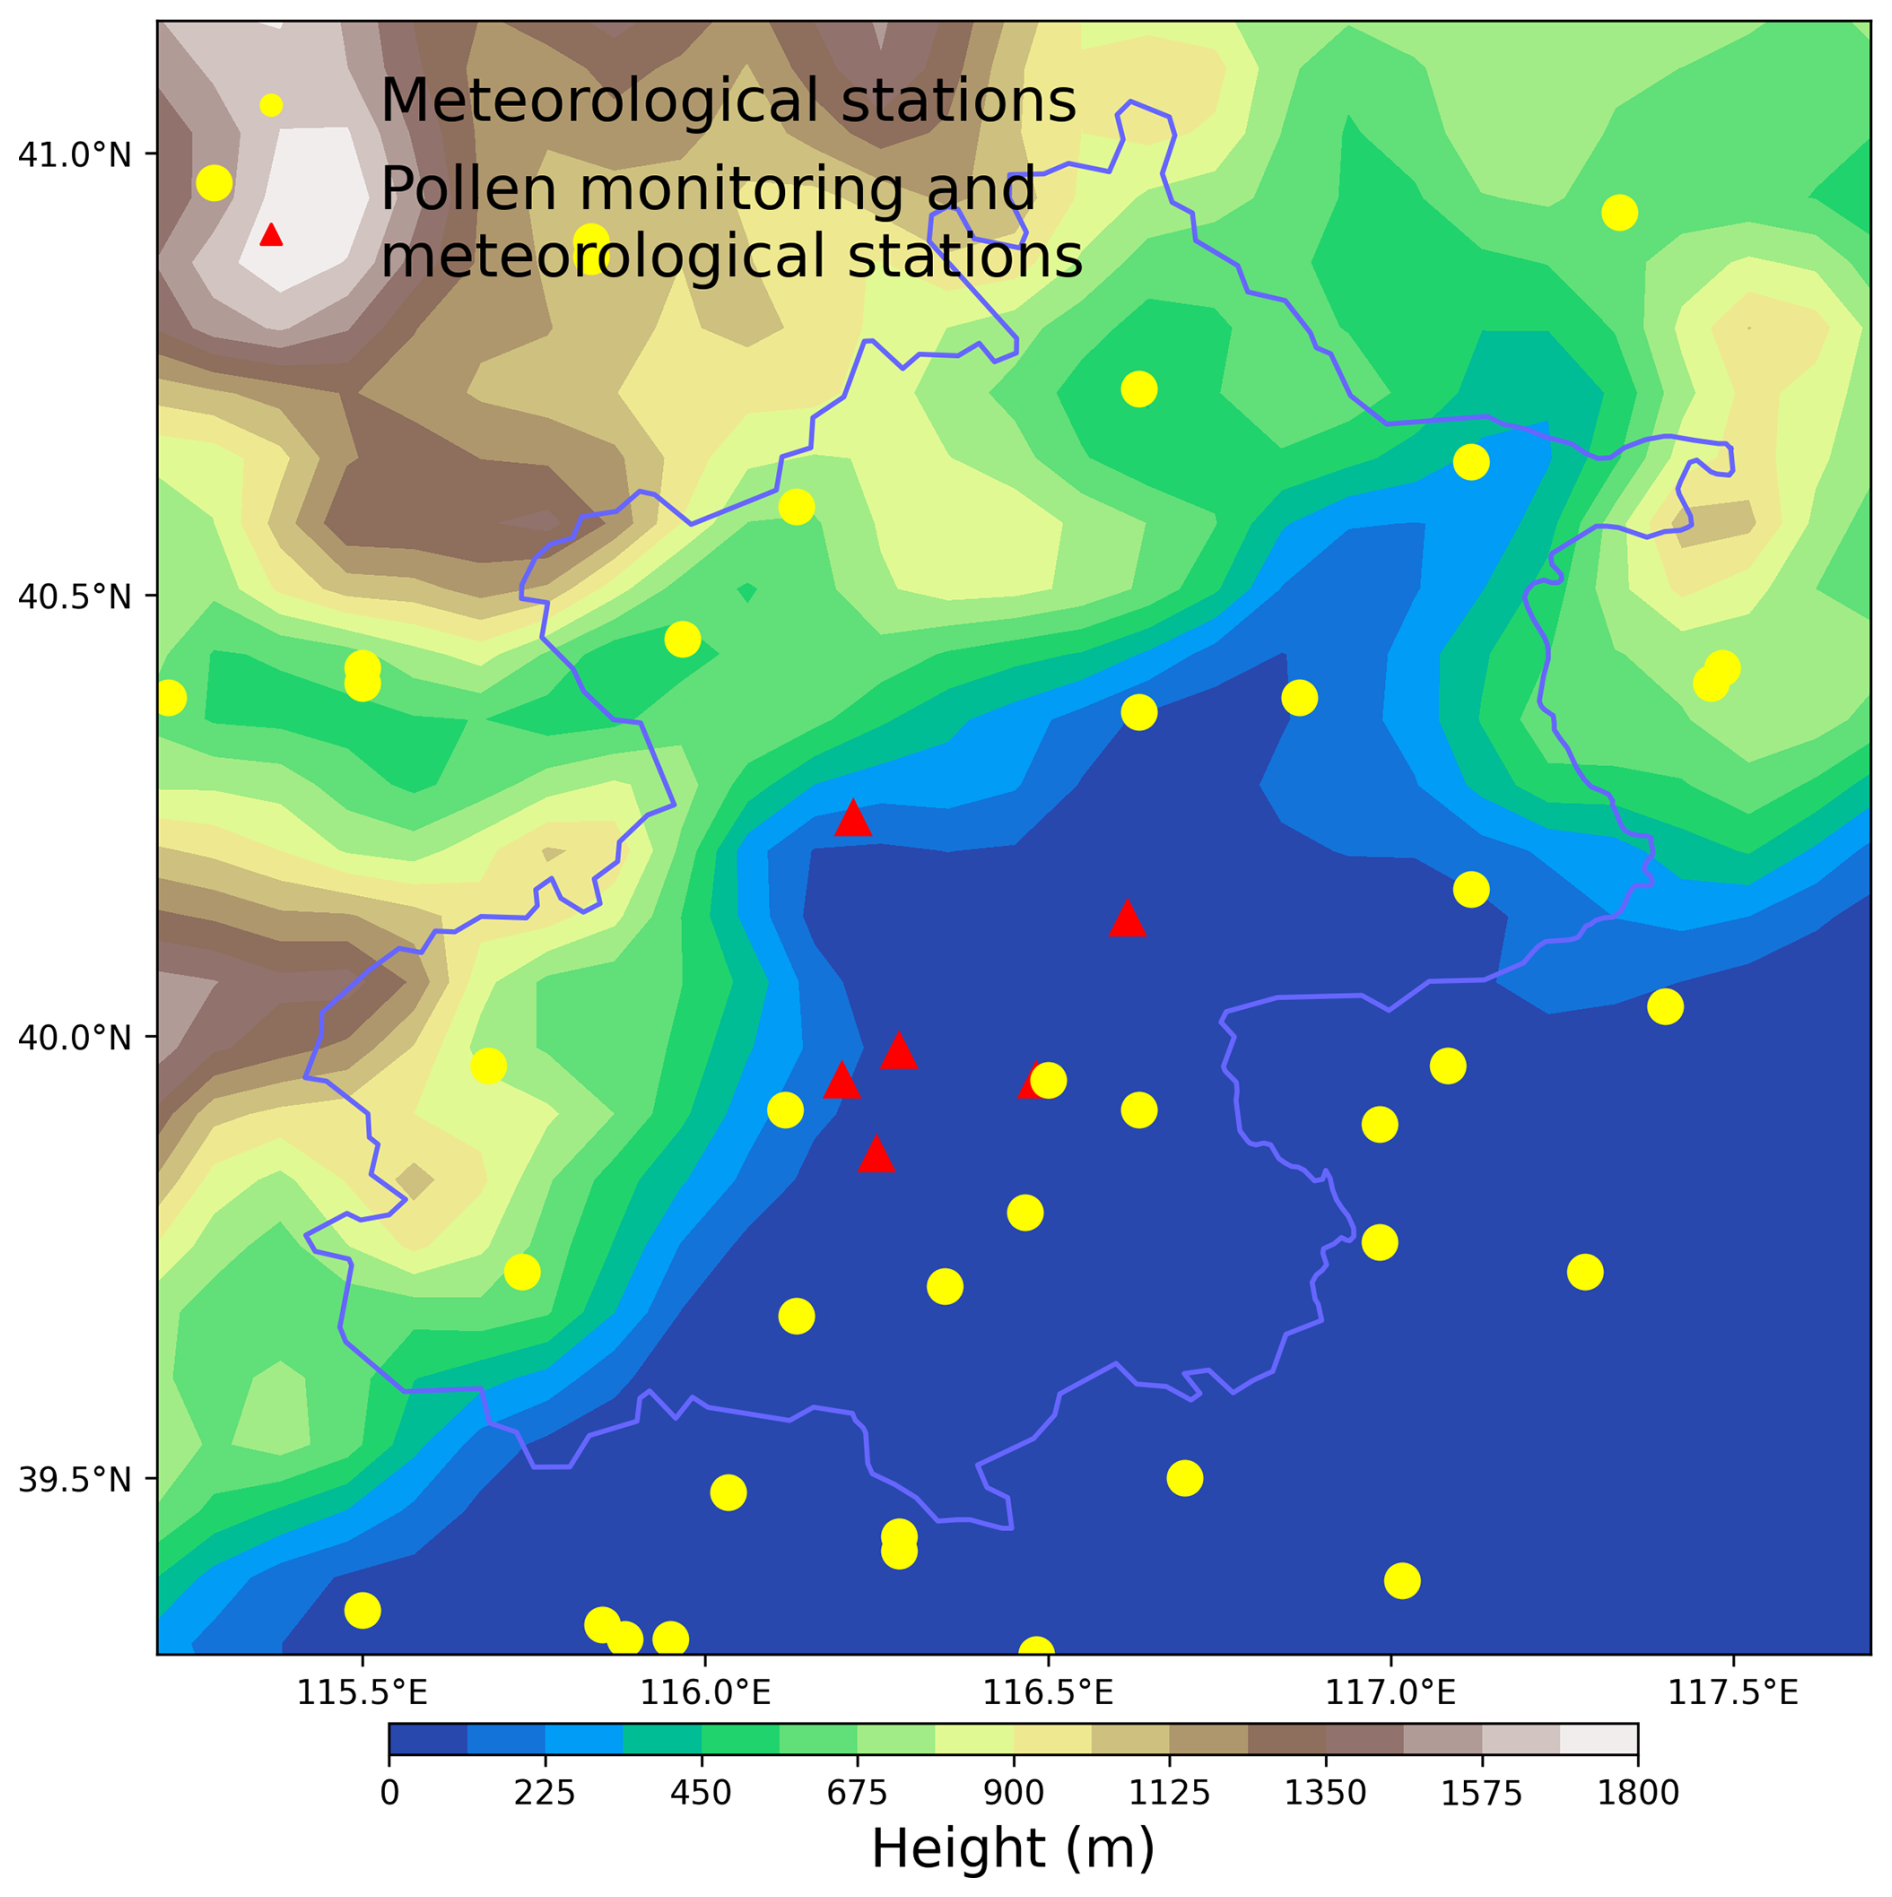
Figure 1Distribution map of geopotential height, pollen observation stations (triangle) and meteorological monitoring stations (circle) in the Beijing area.
Table 1Explanation of effective sample years for pollen monitoring stations in Beijing (2006–2021).
To prevent anomalies in the data, we excluded outliers in the pollen concentration data for each species and any data points where the concentration exceeded the 99th percentile. Furthermore, we applied a 5 d moving average to the pollen monitoring data to smooth it. This approach not only eliminates noise from the data (Li et al., 2019, 2022) but also mitigates the influence of daily meteorological changes and advection diffusion on daily pollen emissions. (To further analyze the impact of key factors such as meteorological factors and advection diffusion on daily pollen emissions, we used RegCM in Sect. 3.3. This model accurately reflects the effects of daily meteorological factors such as temperature, precipitation, humidity and wind speed on pollen emissions while also describing key physical processes such as advection diffusion, convective transport, and dry and wet deposition, thus providing a comprehensive analysis of the behavior of pollen in the atmosphere.) This smoothing process allows us to more clearly explore the daily variation trends of pollen.
Additionally, to better simulate the temporal and spatial distribution of pollen during the autumn pollen period, we defined the autumn pollen period based on observed pollen concentration data as DOY 215 < DOY < 280. Subsequently, we determined the sDOY and eDOY for the autumn pollen period for each station and year by identifying the day of year at which the cumulative pollen concentration reached 5 % (start) and 95 % (end) of the total for that period (Khwarahm et al., 2017; Li et al., 2019, 2022).
To better simulate sDOY and eDOY for pollen, this study first applied the Gaussian model to the autumn pollen data of each station and year. The Gaussian model was chosen for its effectiveness in capturing peaks in time series data, which are often reflected in pollen concentration data. Taking the CP station as an example, Gaussian fitting distribution was performed on the autumn Artemisia, chenopods and TotalPC for 2006–2021 (Figs. S1–S3 in the Supplement). The results indicated that the autumn pollen concentration exhibited a significant Gaussian distribution, confirming that the Gaussian model could aptly fit the time series changes of autumn pollen. Therefore, by Gaussian fitting the pollen concentrations of each station, the autumn pollen sDOY and eDOY under the Gaussian model simulation were further determined. Comparing the sDOY and eDOY derived from observed pollen concentration data with those obtained via Gaussian model simulation (Fig. S4), we found a high correlation coefficient (R) and a low root mean square error (RMSE) between the two. Thus, the sDOY and eDOY obtained from Gaussian model simulation were utilized to study the autumn pollen phenology.
2.2.2 Meteorological observation and land cover data
The meteorological data for this study were sourced from the Daily Surface Climate Dataset for China, encompassing observations from all benchmark and basic meteorological stations in China. Specifically, we utilized data from 66 valid meteorological stations in Beijing and its surrounding areas (39–41.5° N, 115–118° E) covering the period from 2006 to 2020 (Fig. 1). This dataset includes meteorological observations corresponding to the pollen monitoring stations (our meteorological data extend only up to 2020). The variables incorporated in this study comprise average temperature (TEM_Avg), maximum temperature (TEM_Max), minimum temperature (TEM_Min), sunshine hours (SSHs), station altitude (Alti), average pressure (PRS_Avg), maximum pressure (PRS_Max), minimum pressure (PRS_Min), maximum wind speed (WIN_S_Max), extreme wind speed (WIN_S_Inst_Max), average 2 min wind speed (WIN_S_2mi_Avg), ground surface temperature (GST_Avg_Xcm, X=5, 10, 15, 20, 40, 80, 160, 320 cm), average ground surface temperature (GST_Avg), minimum ground surface temperature (GST_Min), maximum ground surface temperature (GST_Max), average relative humidity (RHU_Avg), minimum relative humidity (RHU_Min), average vapor pressure (VAP_Avg), precipitation from 20:00 to 20:00 LT (PRE_Time_2020) and precipitation from 08:00 to 08:00 LT (PRE_Time_0808). The first four meteorological factors were utilized to simulate the autumn phenology model of pollen, predicting various pollen sDOY and eDOY. All meteorological factors served as training datasets for the RF algorithm to simulate annual pollen production.
For land use data, this study employed the Community Land Model 4 (CLM4) dataset (Oleson et al., 2010), which includes 25 plant functional types such as needleleaf forests, broadleaf forests, shrubs, grasses (C3 and C4) and crops, with a spatial resolution of 0.05°. As Artemisia and chenopods primarily fall under the C3 plant category (Yorimitsu et al., 2019; Septembre-Malaterre et al., 2020; Qiao et al., 2023), the simulation of pollen utilization for Artemisia and chenopods used plant functional C3 grass, while the TotalPC simulation incorporated both C3 and C4 grasses. The distribution of these two plant functional types in Beijing is illustrated in Fig. 2.
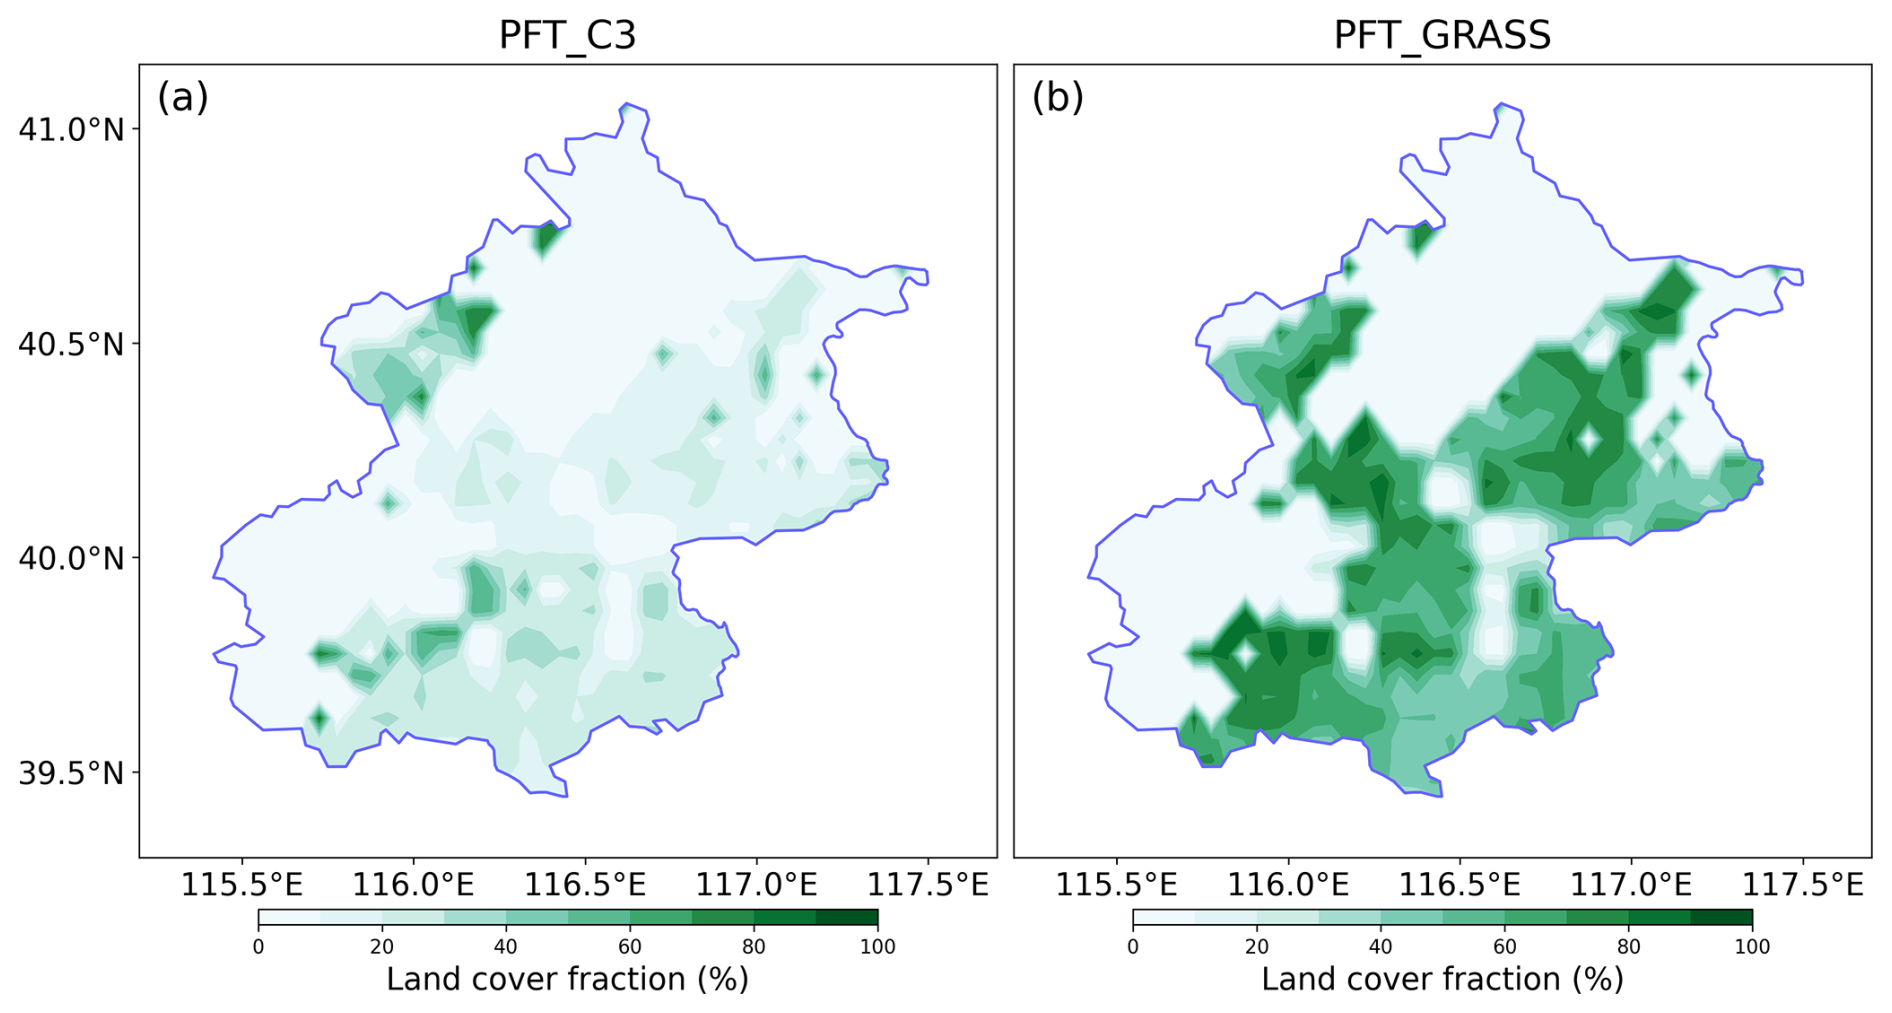
Figure 2The distribution of plant functional type C3 (a) and GRASS (b) in the Beijing area.
3.1 Pollen phenology simulation
In this study, we analyzed the phenological changes of three types of pollen – Artemisia, chenopods and TotalPC – during the autumn season based on three different autumn pollen phenology calculation methods (Rs1, Rs2 and Rssig). Specifically, we examined the seasonal phenological simulations of these pollen concentrations under three different temperature conditions (TEM_Avg, TEM_Max and TEM_Min) (Mo et al., 2023), with a primary focus on sDOY and eDOY. Additionally, the annual pollen production (Pannual) was simulated using the RF algorithm.
3.1.1 Simulation of sDOY and eDOY based on autumn phenology model
Table 2 presents the statistical indicators for simulating the phenology of Artemisia using different phenological methods and temperature conditions. For simulating the sDOY for Artemisia, the Rs1, Rs2 and Rssig methods demonstrated high accuracy when TEM_Avg and TEM_Min were employed as temperature conditions. The R values for both the training and testing sets exceeded 0.45, with some R values in the testing set surpassing 0.7, and the RMSE values were relatively low. This indicates that these three methods effectively capture the phenological characteristics of Artemisia at the onset of autumn. Notably, the Rssig method, when using TEM_Avg as the condition, achieved R values of 0.53 and 0.80 for the training and testing sets, respectively, with RMSE values of 6.61 and 4.86 d, showing the best simulation performance. However, when TEM_Max was used as the temperature condition, the simulation performance of all three methods declined. The R value of the Rs1 method fell below 0.2, and the RMSE values were high, exceeding 8 d. Comparatively, the Rssig method performed slightly better but still yielded inferior results compared to TEM_Avg and TEM_Min, indicating lower model stability when predicting Artemisia sDOY with TEM_Max. For the simulation of Artemisia eDOY, the performance of the three methods was relatively close, with R values in the training and testing sets generally ranging from 0.3 to 0.5 and similar RMSE values. Among them, the Rs1 method performed better when TEM_Min and TEM_Avg were used as temperature conditions, with R values of 0.66 and 0.51 in the testing set and RMSE values of 3.32 d and 3.9 d, respectively. Compared to the Rs1 method, the Rs2 and Rssig methods were relatively weaker in predicting eDOY, indicating that the Rs1 method better captures the phenological trends of Artemisia at the end of autumn. Additionally, when comparing the simulation results of sDOY and eDOY, sDOY generally had higher R values, but eDOY had lower overall RMSE values.
Table 2Statistical indicators of Artemisia phenology under different phenological methods and temperature conditions (unit of RMSE: day).
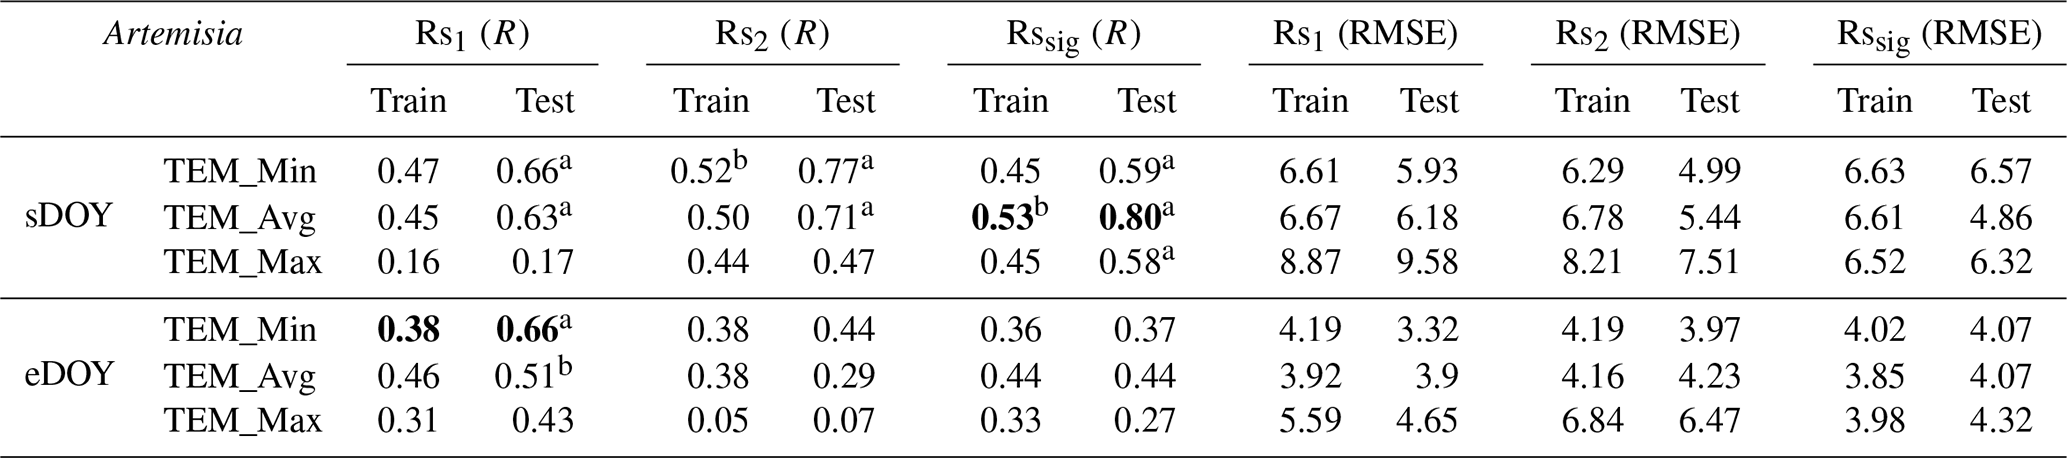
Note that bold represents the best model performance. a Significance levels at P<0.001. b Significance levels at P<0.005.
The statistical indicators for simulating the phenology of chenopods under different phenological methods and temperature conditions are shown in Table S1 in the Supplement. For the simulation of the sDOY for chenopods, the Rs1 and Rs2 methods demonstrated high accuracy when using TEM_Min and TEM_Avg as temperature conditions. The R values for both the training and testing sets were around 0.5, and the RMSE values were relatively low. It is clear that using TEM_Avg as the temperature condition yields higher R values and a lower RMSE (in the case of the Rs1 method) compared to TEM_Min, indicating that these two methods effectively capture the phenological changes of chenopods at the onset of autumn when using TEM_Avg as the temperature condition. However, when TEM_Max was used as the temperature condition, the simulation performance of all three methods declined, particularly for Rs1, which had an R value of −0.1 and an RMSE greater than 9 d in the testing set. The Rssig method, when using TEM_Avg, achieved an R value of 0.51 in the training set but only 0.28 in the testing set, with a high RMSE of 5.32 d, indicating poor model stability in this scenario. In contrast to TotalPC and Artemisia, the simulation of the eDOY for chenopods was not satisfactory for any of the three methods. The R values for both the training and testing sets were all below 0.42. Particularly when using TEM_Max as the temperature condition, the simulation performance of all three methods was poor, with the testing set R value reaching only 0.1. This indicates that the models have limited ability to capture the end of the autumn season for chenopods.
Table S2 shows the phenological simulation statistical indicators of TotalPC under different phenological methods and temperature conditions. From the data in the table, it can be seen that for the simulation of the sDOY of TotalPC, all three phenological methods (Rs1, Rs2, and Rssig) performed with high accuracy (R>0.5) and a relatively low RMSE when using TEM_Min. This indicates that these three methods, when using TEM_Min, can effectively capture the trend of the sDOY of TotalPC during the autumn season. Meanwhile, the Rs1 method also showed good simulation performance when using TEM_Avg as the temperature condition, with R reaching 0.54 for both the training and testing sets. The Rssig method, using TEM_Avg, had good simulation performance in the training set, but the R in the testing set only reached 0.38. Compared to TEM_Min and TEM_Avg, the Rs2 and Rssig methods showed slightly inferior simulation performance when using TEM_Max as the temperature condition. Surprisingly, the Rs1 method's simulation of the sDOY showed a negative correlation when using TEM_Max, indicating the worst performance. For the simulation of the eDOY of TotalPC, the overall simulation performance was worse in terms of R compared to sDOY, but the RMSE values were generally better. Specifically, using TEM_Avg as the temperature condition, the Rs2 and Rssig methods showed relatively good simulation performance and a lower RMSE. However, the Rs2 method performed much worse on the testing set compared to the training set, with the R on the testing set being only 0.32.
Overall, different pollen types exhibit varying sensitivity to different phenological models and temperature conditions. TEM_Avg is generally the best temperature condition for predicting the sDOY of the three pollen types, providing higher R values and a lower RMSE. This suggests that TEM_Avg can effectively predict the start of the autumn pollen season. At the same time, TEM_Min also performs well in predicting the sDOY of TotalPC and Artemisia, whereas TEM_Max generally shows the poorest prediction performance. For predicting eDOY, different pollen types show different sensitivities to temperature conditions, but overall, the models perform worse for eDOY compared to sDOY, especially in the simulation of chenopods.
Based on the above discussion, we selected the most suitable phenological and temperature conditions for the three types of pollen (bold parts in Tables 2, S1 and S2), simulated their sDOY and eDOY, and generated line and scatter plots (Fig. 3). According to the line plots in Fig. 3 (top), the predicted results for Artemisia are the closest to the actual observed results. The predictions for TotalPC follow, while the predictions for chenopods show some deviation, particularly in eDOY, indicating the need for a more suitable phenological model to accurately simulate the phenology of chenopods. The scatter plots in Fig. 3 (bottom) illustrate that for sDOY predictions, Artemisia exhibited the strongest correlation between predicted and observed pollen phenology, with an R value of 0.69 and an RMSE of 5.77 d. In contrast, chenopods had the lowest correlation, with an R value of 0.49 and an RMSE of 4.98 d. It can also be observed that higher R values are associated with a higher overall RMSE, possibly due to the models being more sensitive to noise or outliers in the data, which increases the overall error. For high-correlation predictions like those for Artemisia, the model may be more affected by random fluctuations in the data, leading to increased error. Additionally, different pollen types may exhibit varying characteristics or response patterns in phenological models, resulting in a non-linear or inconsistent relationship between correlation and error. For eDOY predictions, the correlation between predicted and observed is highest for Artemisia, with an R value of 0.53 and an RMSE of 3.77 d. Chenopods have the lowest correlation for eDOY predictions, with an R value of only 0.26 and an RMSE of 4.57 d. The poorer performance in simulating eDOY for chenopods may be due to lower data quality compared to Artemisia and TotalPC, as well as the smallest sample size, resulting in insufficient information and samples for the model to learn and predict accurately.
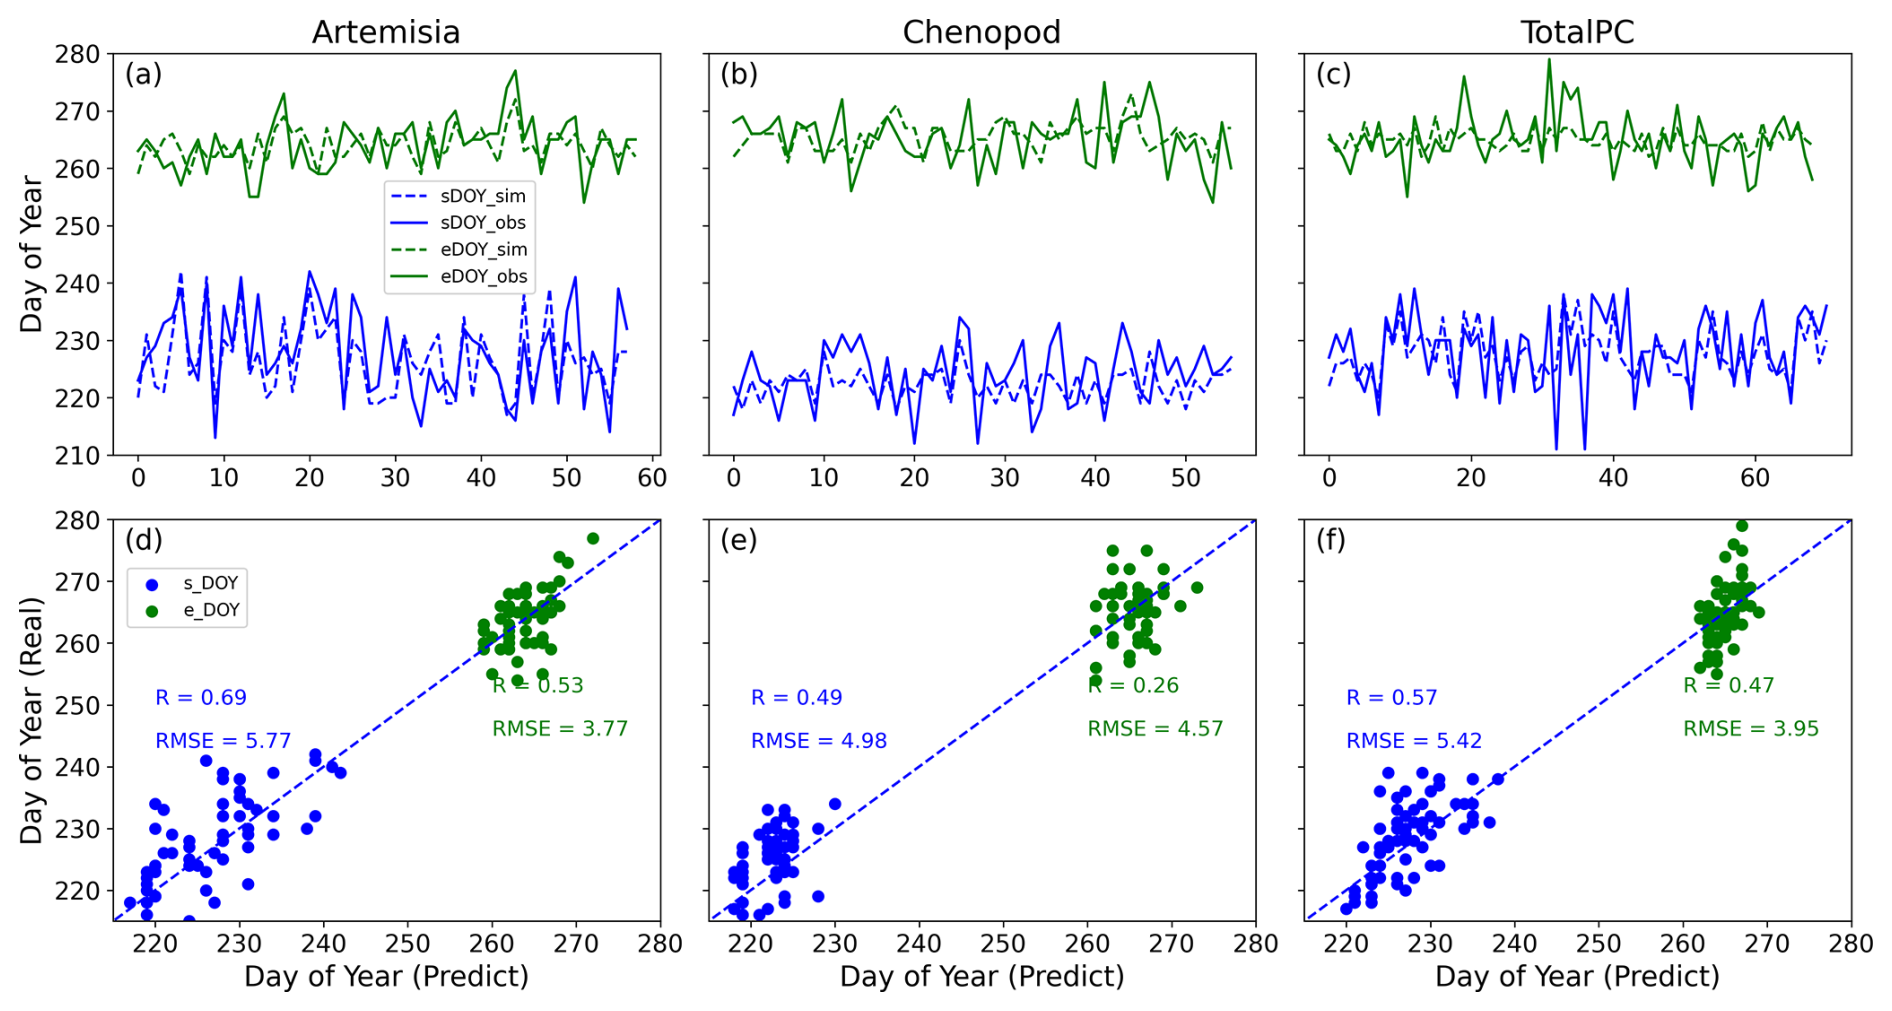
Figure 3Comparison of pollen sDOY and eDOY in autumn phenology: simulation vs. observation. Line plots of three different pollen sDOY and eDOY (a–c) and scatter plot comparison of the same (d–f). Specific comparisons for Artemisia (a, d), chenopods (b, e) and TotalPC (c, f). The horizontal axis of (a)–(c) represents the sequential distribution of effective sample counts for the three types of pollen.
Additionally, Table 3 shows the proportion of simulations with errors less than 5 and 3 d for sDOY and eDOY across the three pollen types. It can be seen that the proportion of eDOY simulations with errors less than 5 and 3 d is higher than that for sDOY, indicating that eDOY simulations generally have better accuracy in terms of error. Specifically, for chenopod eDOY simulations, although the R value is poor, 76.79 % of simulations have errors less than 5 d, and 55.36 % have errors less than 3 d, meaning that more than half of the eDOY simulations have errors within 3 d. This performance is comparable to the other two pollen types (64.41 % and 68.12 %, respectively). Compared to Mo et al. (2023), who simulated the spring start pollen season (SPS) using 17 phenological models, this study has slightly lower R values but a much lower RMSE (around 11 d in their study). Li et al. (2022) used satellite data to simulate the SPS for birch, oak and poplar, achieving RMSE values between 4.26 and 8.77 d. Furthermore, this study's process-based phenological models for sDOY and eDOY show smaller errors and higher correlations compared to empirical linear models based solely on temperature used by Wozniak and Steiner (2017) and Zhang and Steiner (2022).
Table 3Statistics on the proportion of errors between simulation and observation of three different types of pollen sDOY and eDOY within 5 and 3 d.
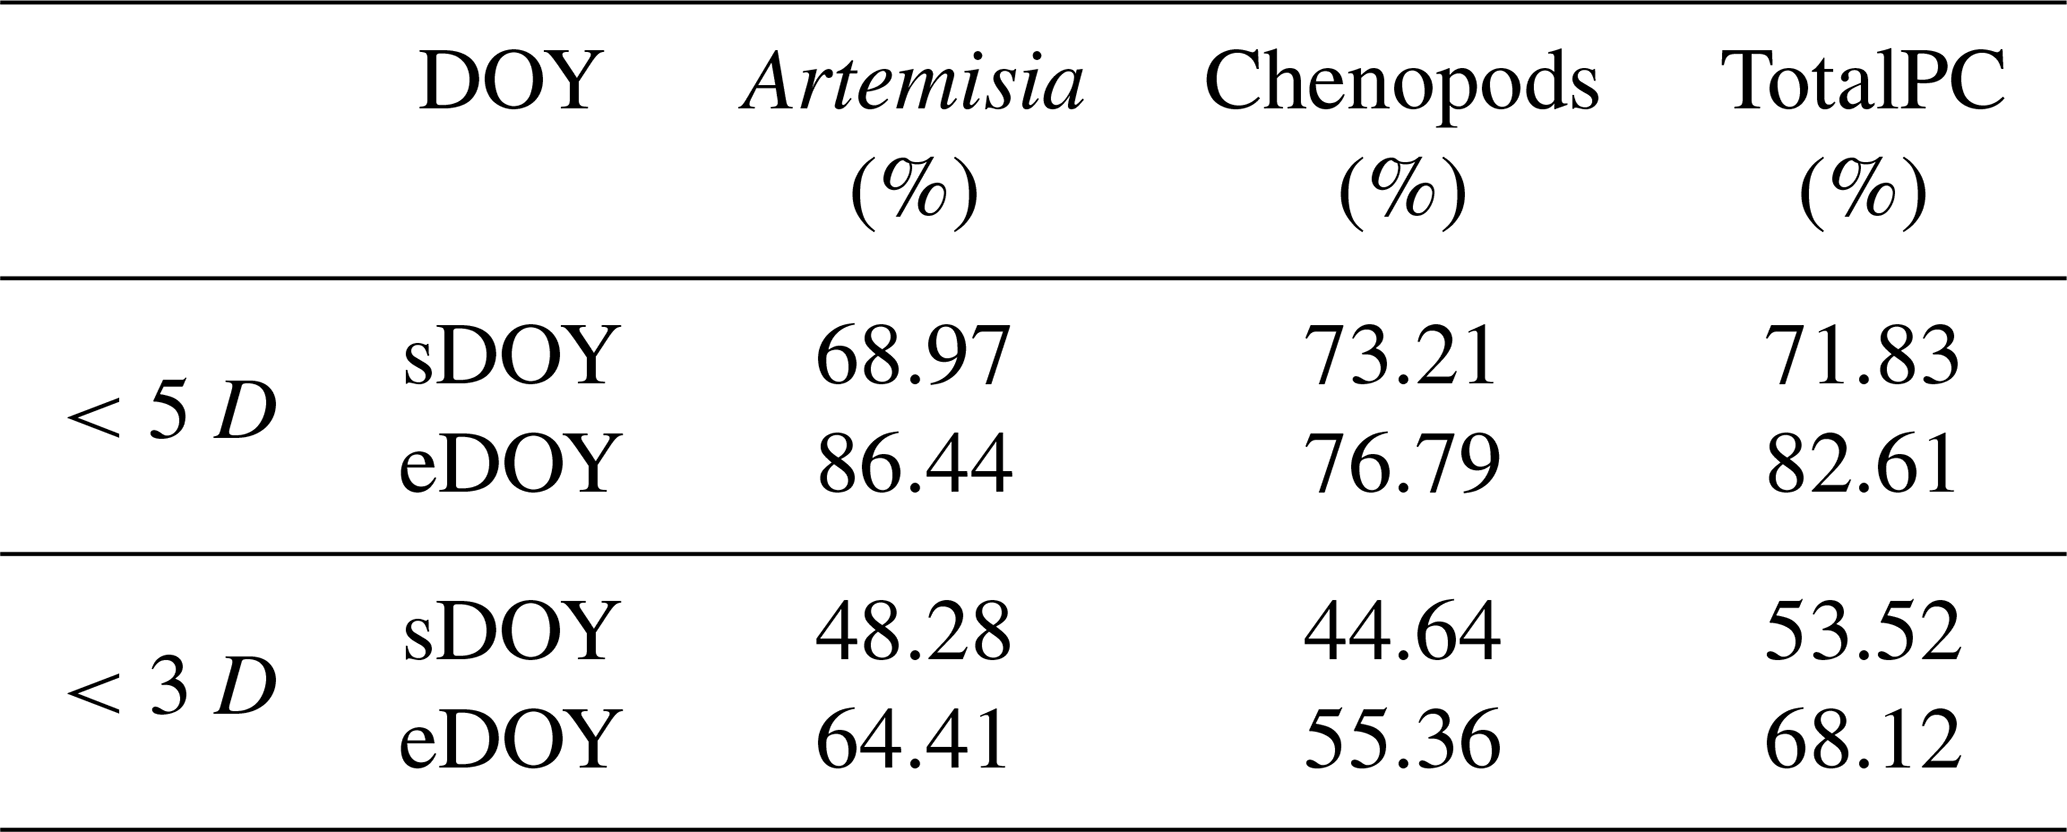
Therefore, from an error analysis perspective, the simulation performance of chenopod eDOY maintains a relatively low error while also demonstrating some stability, indicating that the autumn phenological model can accurately capture the seasonal variation trend of chenopods. This makes the simulation results reliable. Overall, the autumn phenological models provide good simulation performance for the phenology of the three pollen types, laying a solid foundation for further analysis of pollen temporal characteristics.
Based on the temperature and SSH observational station data from the Beijing area, we interpolated the station data into a grid dataset with a horizontal resolution of 0.1°. Using the selected autumn phenological models, we then performed gridded simulations of the sDOY and eDOY for three pollen types. This approach enabled us to map the regional distribution of autumn pollen sDOY and eDOY in Beijing from 2006 to 2020, thereby laying the groundwork for further simulations of autumn pollen emissions potential.
3.1.2 Simulation of annual pollen production based on RF
The simulation of annual pollen production (Pannual, referring to the cumulative pollen concentration during each autumn pollen season) was conducted using the RF algorithm. The training data comprised all station-observed pollen data from Table 1 and the corresponding meteorological observation data from Sect. 2.2.2. Four-fifths of the station data were randomly selected as the training set to train the RF algorithm, while the remaining one-fifth was used as the test set to validate the accuracy of the RF's Pannual simulation. Figure 4 presents the scatter plots of observed versus simulated Pannual for three different pollen types (Artemisia, chenopods and TotalPC) based on the RF in the test set. The R values between simulated and observed values for the three pollen types were all above 0.5, with chenopods reaching 0.65. The calculated RMSE was around 0.2×10⁶ grains per m2 per year (with TotalPC having an RMSE of 2.12×10⁶ grains per m2 per year). This indicates that the prediction performance of the RF varies among different pollen types, with the best performance for chenopods and the poorest for TotalPC annual production. Compared to the temperature-based empirical linear models for Pannual by Zhang and Steiner (2022), the machine-learning-algorithm-based simulations in this study have smaller errors and higher correlations. Overall, the RF effectively simulates Pannual.
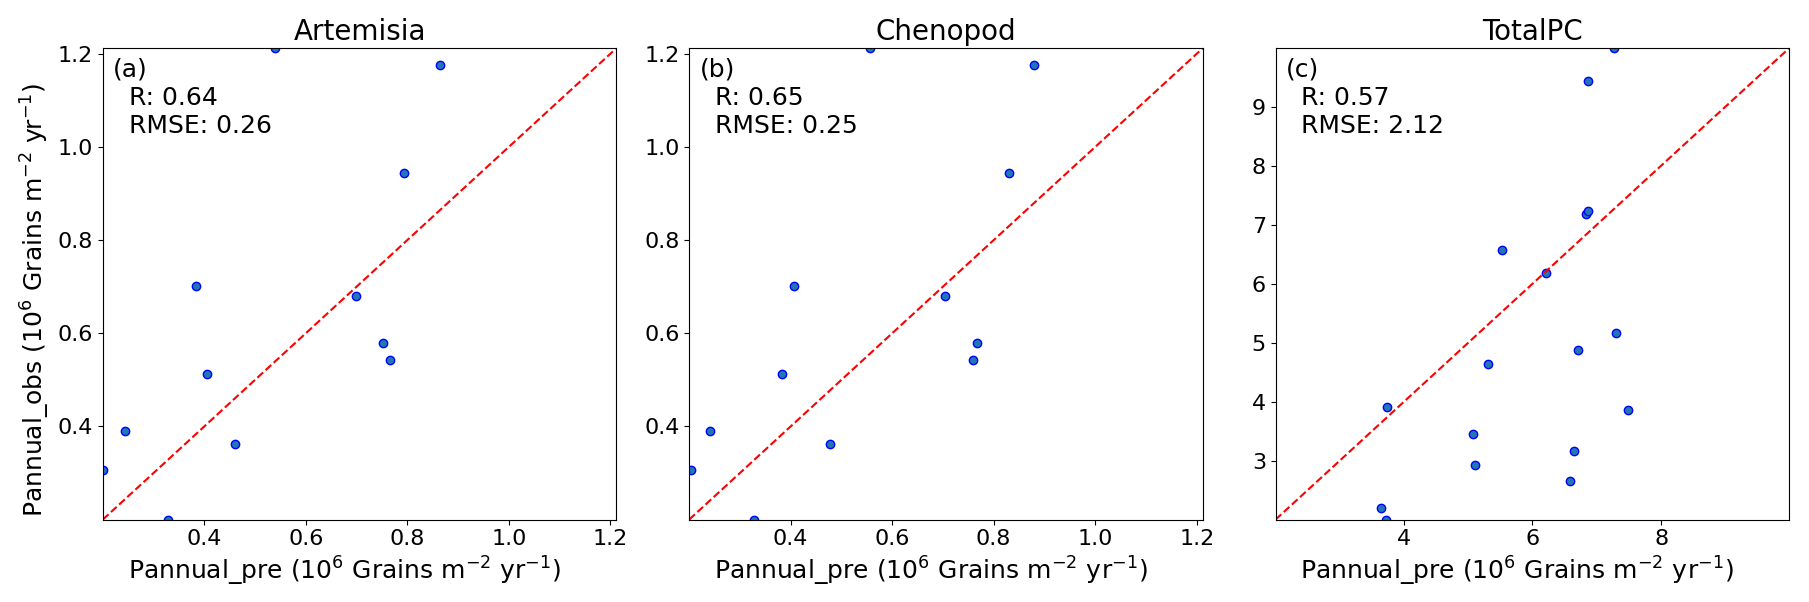
Figure 4Scatter plots of simulated and observed annual pollen (Pannual) based on RF. Comparisons for Artemisia (a), chenopods (b) and TotalPC (c).
Based on meteorological observation data from stations in and around Beijing, the station data were interpolated into a gridded dataset with a horizontal resolution of 0.1°. Subsequently, all station data for each pollen type were used as the training set, with 12 stations in the gridded dataset cyclically selected as the test set for gridded simulations. This ultimately resulted in the spatial distribution of Pannual in Beijing from 2006 to 2020, laying the foundation for further simulation of autumn pollen emissions potential.
3.2 Simulation of pollen emissions in the Beijing area
Based on the simulation results of autumn pollen phenology (sDOY, eDOY and Pannual) from Sect. 3.1 and the pollen emissions potential parameterization method from Sect. 2.1.1, this study calculated the pollen emissions potential in the Beijing area. Figures 5, S5 and S6 present a comparison between the observed and simulated average site values of Artemisia, chenopods and TotalPC in Beijing from 2006 to 2020. In these figures, blue dots represent the actual daily observed pollen counts, and red lines represent the simulated pollen emissions. To assess the consistency between the simulated and observed data, we calculated R and RMSE values. As illustrated in the figures, the simulated data closely match the actual observations in most years, with correlation coefficients around 0.9. Specifically, the Artemisia emissions in 2010; chenopod emissions in 2016; and TotalPC emissions in 2007, 2009, 2018 and 2019 show R values as high as 0.98 and relatively low RMSE levels, demonstrating the high accuracy of this study in simulating pollen emissions potential.
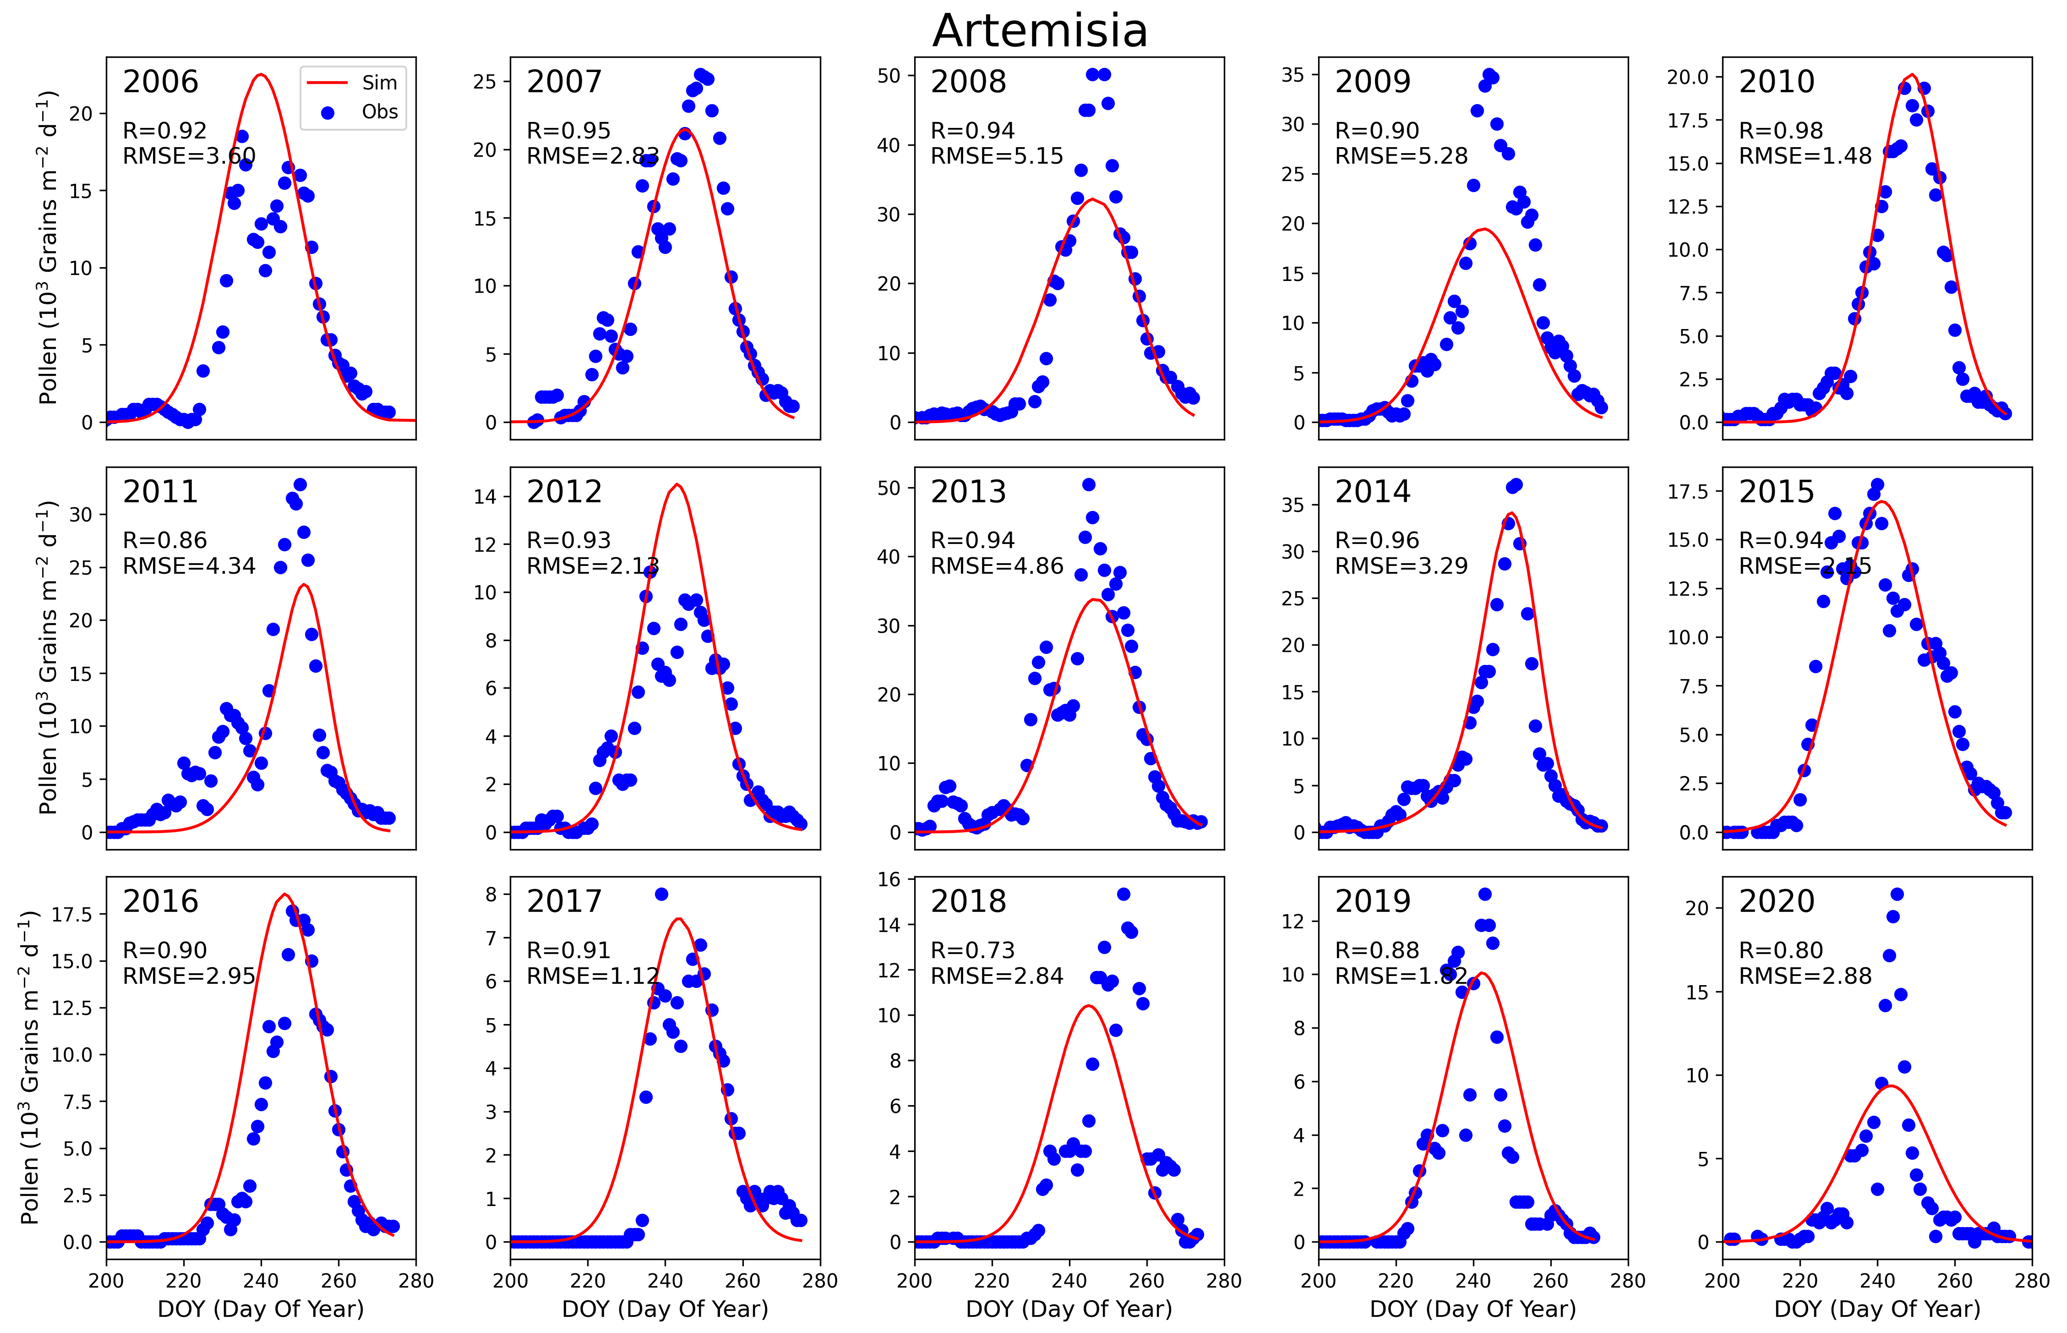
Figure 5Time series of observation and simulation of average Artemisia emissions at stations in Beijing from 2006 to 2020. The solid red line represents the simulation of pollen emissions model, while blue dots depict observations.
Additionally, the simulation results for sDOY and eDOY were also satisfactory, though there were slight advances in the start of the pollen season in certain years, such as 2017 and 2018 for Artemisia and chenopods. While the peak pollen emissions simulations were highly accurate in most years, there were instances of overestimation and underestimation in some years. For example, the peak emissions of Artemisia in 2008, 2009 and 2020; chenopods in 2007; and TotalPC in 2013 and 2020 were significantly underestimated. Conversely, the peak simulations of TotalPC in 2011 and 2012 were slightly overestimated. This indicates that, despite the high accuracy of the annual pollen production simulations based on the RF, there is still room for improvement.
Overall, this study achieved significant results in simulating pollen emissions, demonstrating the potential application of autumn phenological models and the RF algorithm in simulating pollen emissions. However, to further enhance the accuracy of these simulations, future research needs to investigate and address the instances of overestimation and underestimation in greater detail.
To further investigate the spatial distribution of annual pollen production, we simulated the spatial distribution of annual Artemisia, chenopods and TotalPC production in Beijing from 2006 to 2020 (Figs. 6, S7 and S8). The results reveal significant spatial and temporal variations in annual pollen production. Spatially, Artemisia production is predominantly concentrated in the southeastern, northeastern and certain northwestern regions of Beijing, with occasional occurrences in the central urban area during specific years (2008 and 2013). Chenopod production is highest in the southern part of Beijing and lowest in the northern parts and surrounding areas. Notably, from 2006 to 2008, the southern region exhibited high concentrations of chenopod production. TotalPC is mainly distributed in the southeastern plains of Beijing, forming a strip-like pattern, while lower production is observed in the northwestern mountainous areas, indicating a possible influence of geographical location on TotalPC distribution. Temporally, the annual production of these three pollen types demonstrates distinct interannual variations. Artemisia shows little change in both distribution area and production concentration over time. In contrast, chenopods and TotalPC exhibit a general declining trend, reaching their lowest levels between 2016 and 2018, which may be attributed to recent climatic changes, vegetation shifts and human activities in the Beijing area.
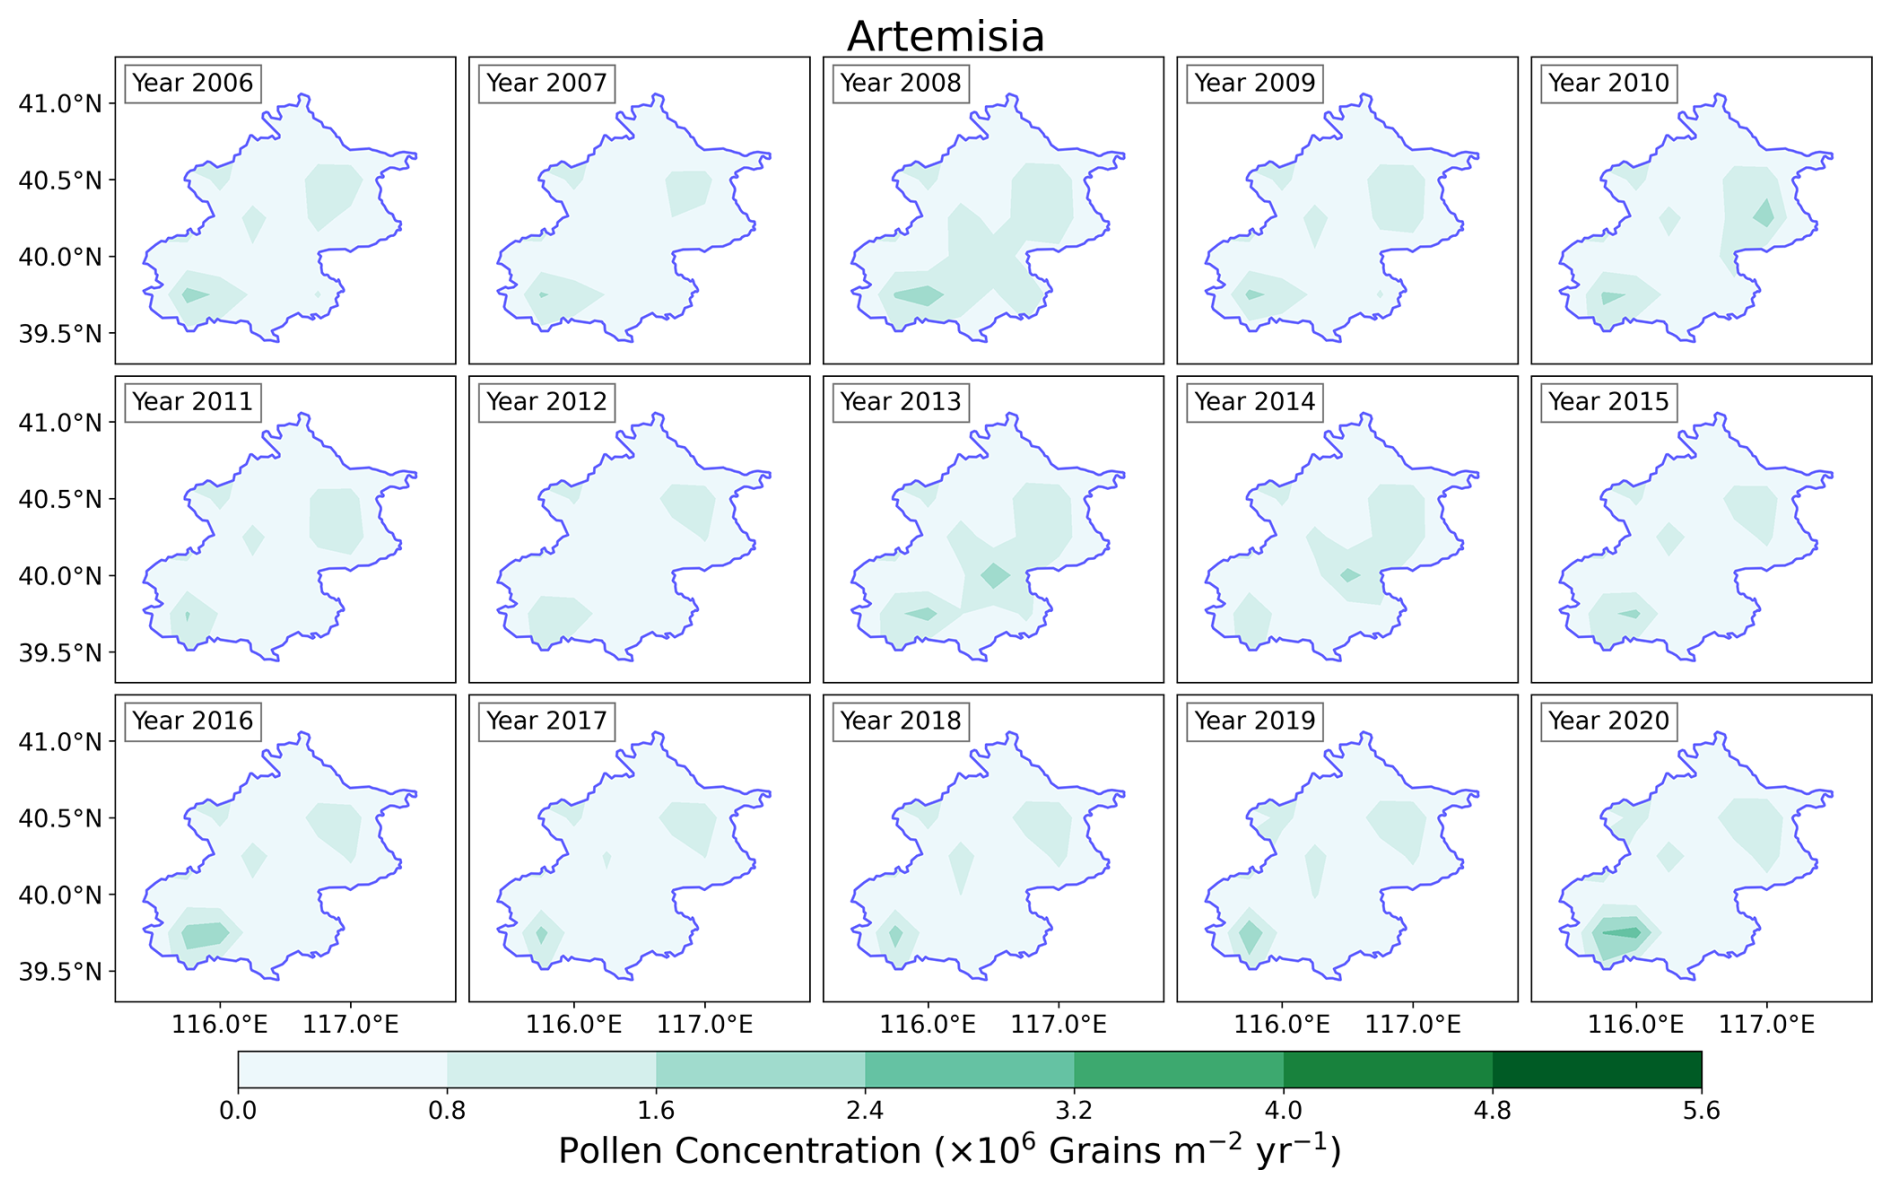
Figure 6Distribution of Artemisia in Beijing from 2006 to 2020 based on pollen emissions model.
The simulation results for annual pollen production of Artemisia, chenopods and TotalPC in Beijing from 2006 to 2020, based on autumn phenology and the RF pollen emissions model, indicate pronounced spatial differences and temporal variation characteristics. Analyzing the spatial distribution and temporal variation of annual pollen production in Beijing enhances our understanding of the spatiotemporal patterns of pollen in the region, providing crucial insights for the control and mitigation of pollen allergies.
To more intuitively reflect the temporal variation trends in the annual production of three types of pollen, we further analyzed the interannual variation of the regional average cumulative concentration of these pollen types during the autumn pollen season in Beijing from 2006 to 2020 (Fig. 7). The annual production of Artemisia, chenopods and TotalPC in Beijing averages between 0.8–1.6, 0.5–1.4 and 6.5–9 grains per m2 per year, respectively. The annual production of Artemisia and chenopods is notably similar. Over time, the regional annual production of these pollen types in Beijing exhibits significant fluctuations. Nonetheless, Artemisia remains relatively stable, whereas chenopods and TotalPC production demonstrates a discernible declining trend, particularly in TotalPC. The annual production of all three pollen types reached a local nadir in 2012. Following a surge in 2013, production steadily declined from 2014 to 2017, reaching the lowest levels observed in nearly 15 years (with TotalPC being the lowest in 2018). Subsequently, from 2018 to 2020, an increasing trend was observed. Overall, the annual pollen production in Beijing appears to follow a minor cyclical pattern, intimately linked to the impacts of climate change. Building on this analysis, it suggests that interannual variations in pollen production may be influenced by multiple climate-related factors, such as temperature, precipitation and SSHs. These climatic elements can influence the phenology and growth cycles of pollen-producing plants, thereby affecting their annual production levels. For example, higher temperatures may lead to earlier flowering times, potentially shifting the timing and duration of pollen release. Variations in precipitation impact soil moisture, which can affect plant health and, consequently, pollen output. The observed trends in Beijing's pollen production, including the declining patterns in chenopods and TotalPC, could correspond to climate shifts that are less favorable for these species. Thus, these fluctuations in pollen production underscore the sensitivity of pollen phenology to both local and broader climate variations.
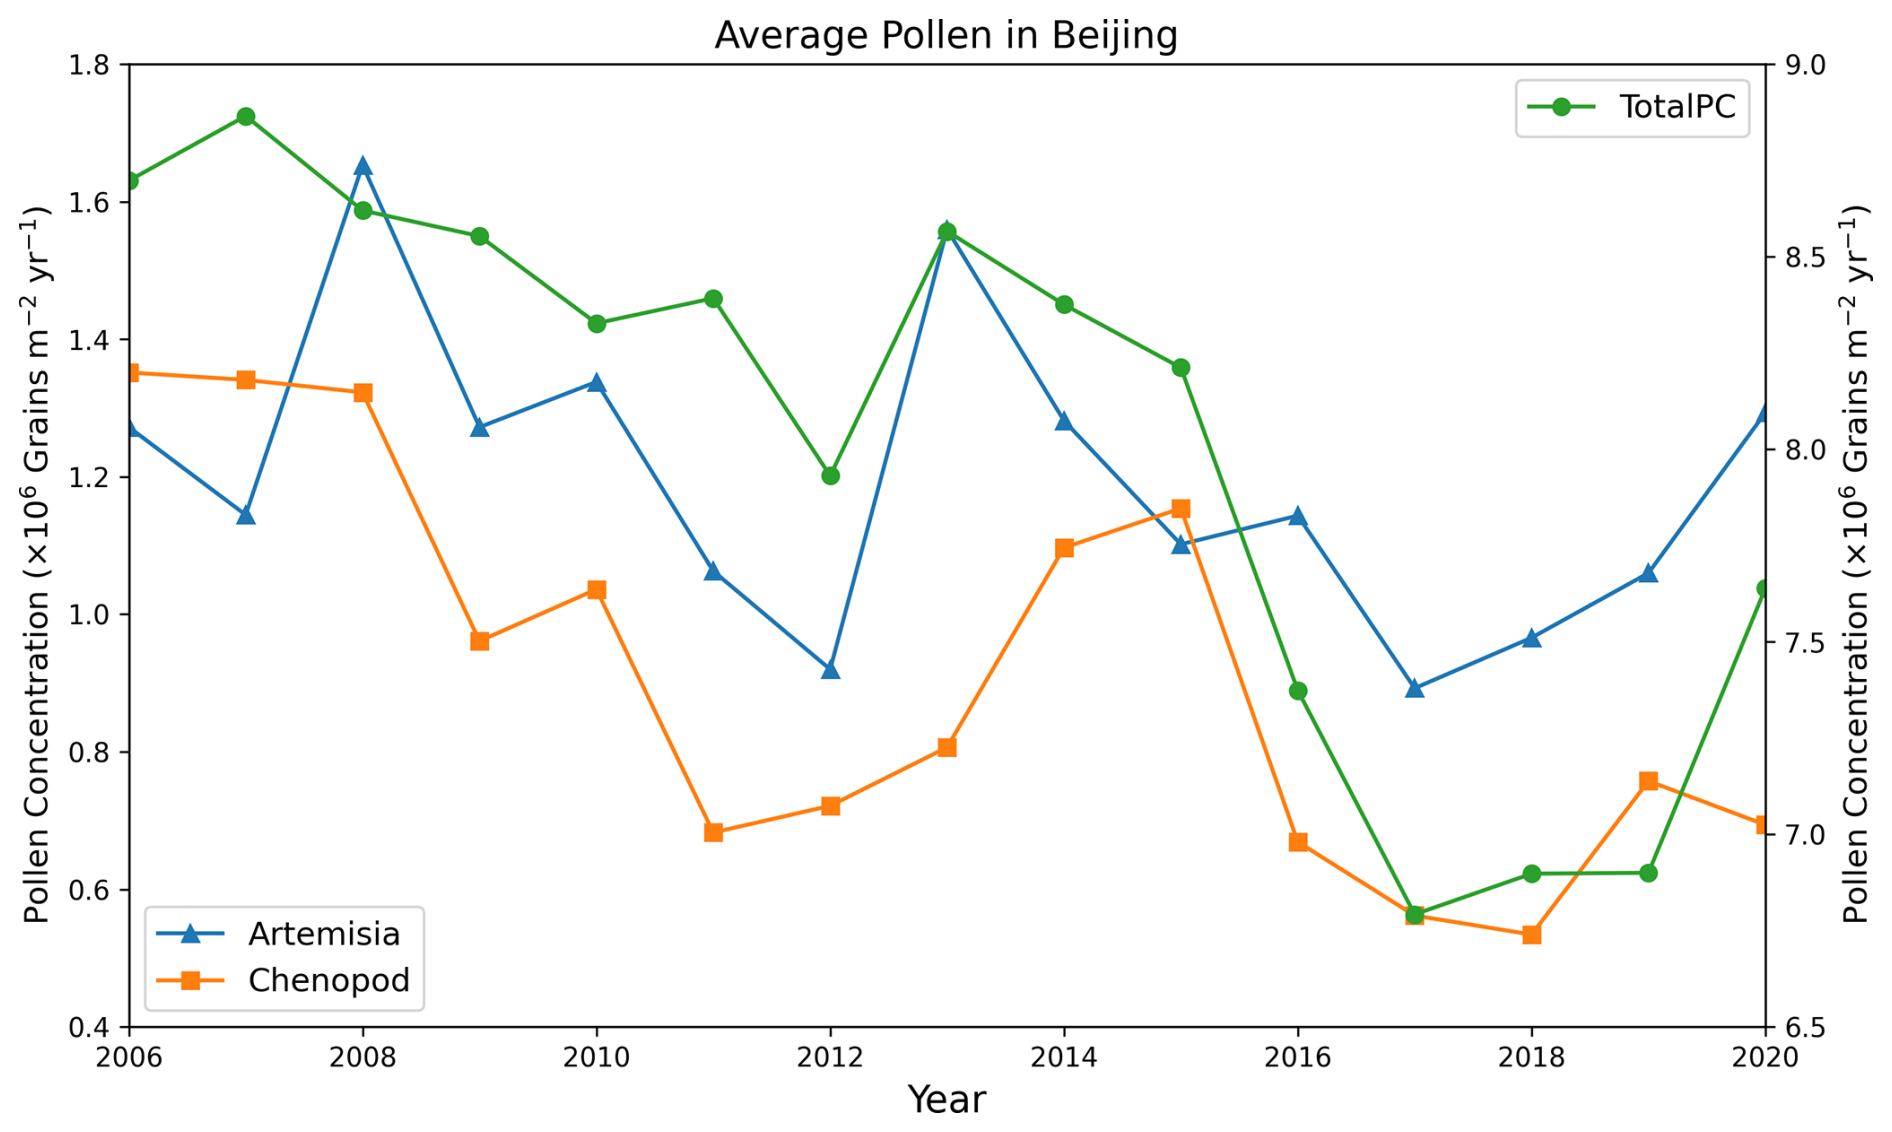
Figure 7Time series variation chart of regional average annual production of three types of pollen in Beijing from 2006 to 2020. Due to the different magnitudes of pollen concentrations, the left y axis represents the concentrations of Artemisia and chenopods, while the right y axis represents TotalPC. Plotting the time series distributions of the three pollen concentrations on a single graph allows for a clearer observation of the trends in their variations over time.
To further explore the meteorological factors influencing average annual pollen production in Beijing, we selected six meteorological variables during the autumn pollen season from 2006 to 2020 for temporal and regional average calculations. These factors include maximum temperature (TEM_Max), average temperature (TEM_Avg), minimum temperature (TEM_Min), average relative humidity (RHU_Avg), sunshine hours (SSHs) and precipitation time (PRE_Time_0808). The annual variations of these meteorological factors were analyzed, and their correlations with annual pollen production variations were calculated (Fig. 8).
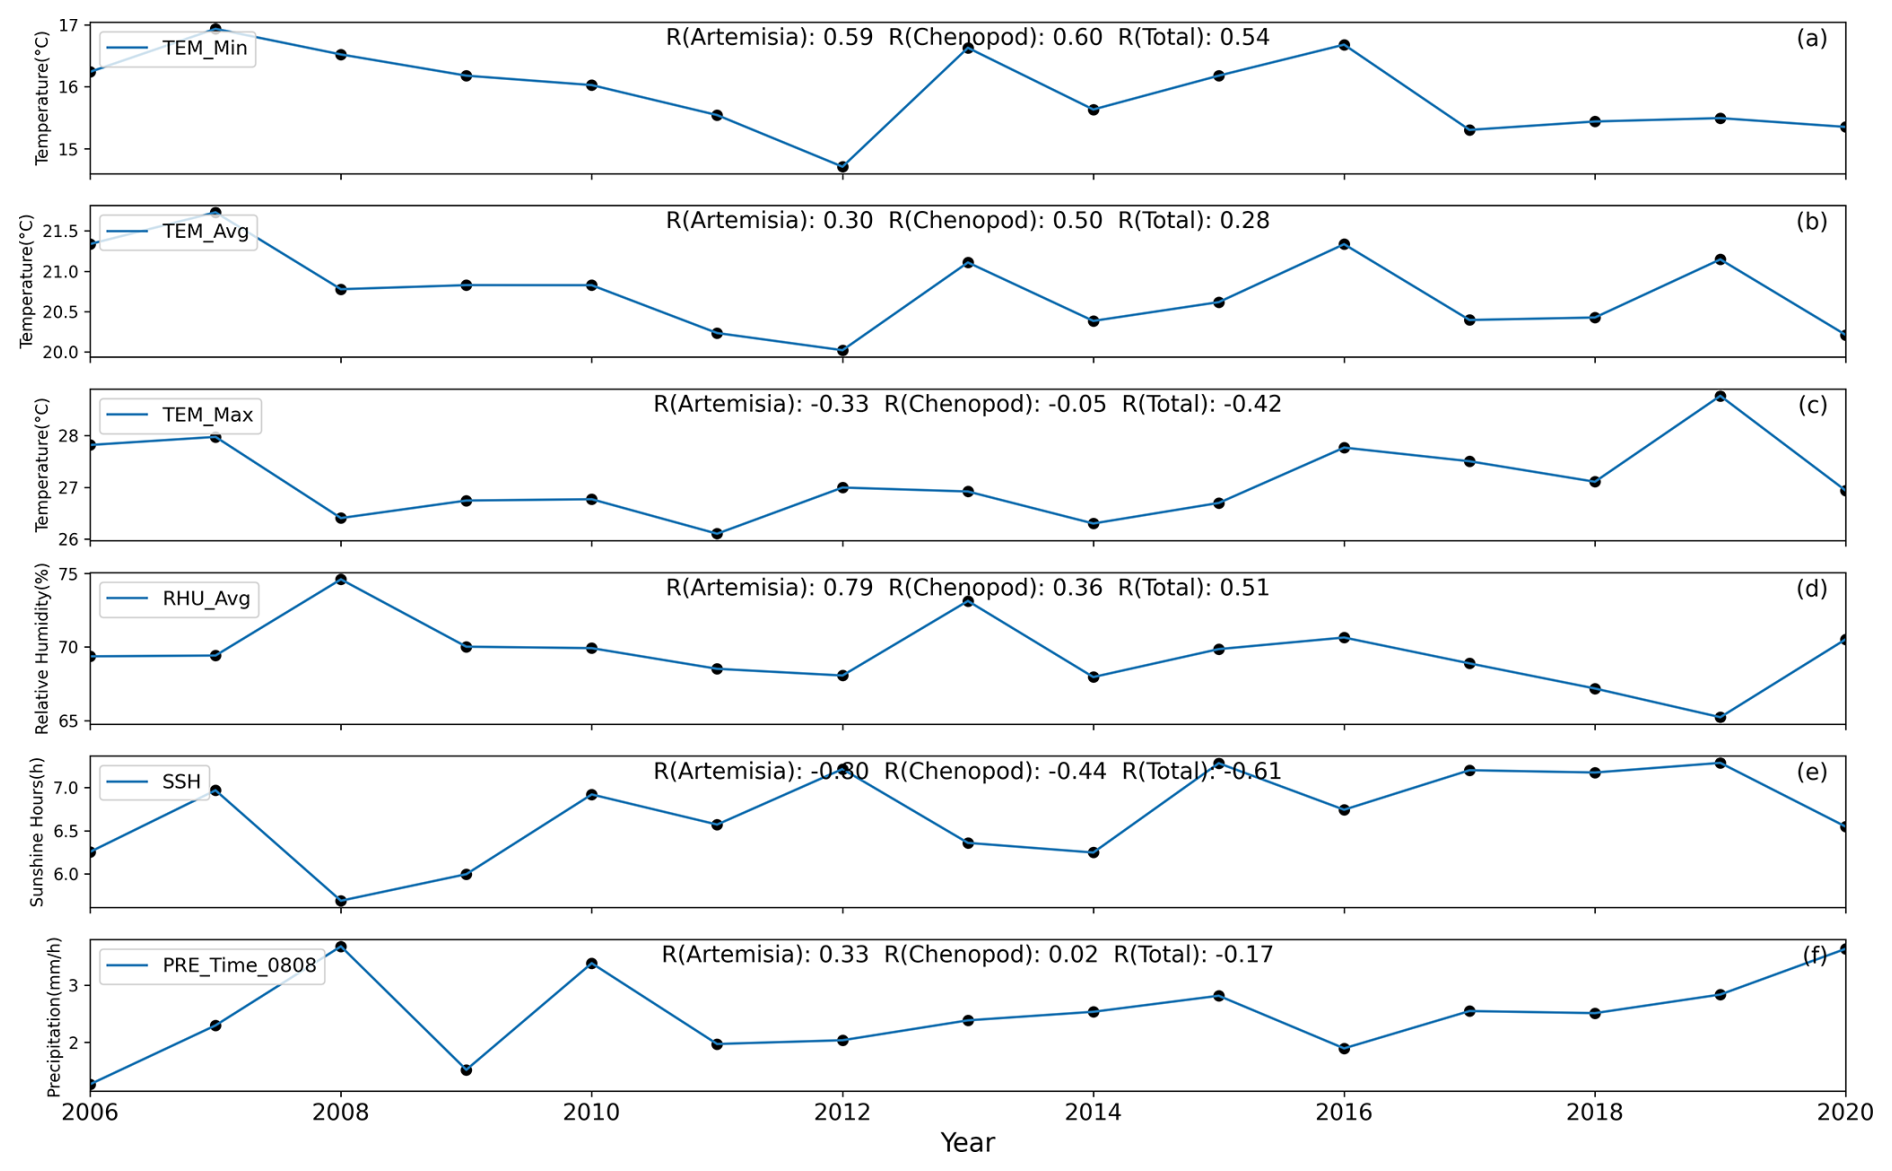
Figure 8Time series variation chart of average values of different meteorological factors in Beijing from 2006 to 2020. (The correlation coefficient between the average meteorological factors and the regional average annual production of three types of pollen is calculated in the figure.)
The trends in annual variations of each meteorological factor and the calculated correlations reveal that for Artemisia, TEM_Min and RHU_Avg have a significant positive correlation with its production, especially RHU_Avg, which shows a correlation of 0.79. This indicates that an increase in relative humidity promotes Artemisia production. Conversely, SSHs have a correlation of −0.8 with Artemisia, indicating that longer sunshine hours inhibit its production. Meanwhile, TEM_Avg and PRE_Time_0808 have minor promoting effects on Artemisia production, while TEM_Max has a slight inhibitory effect. For chenopods, TEM_Min is the most significant promoting factor, while SSHs have an inhibitory effect, although its negative correlation is lower than that for Artemisia, indicating a limited inhibitory effect on chenopod production. For TotalPC, similar to Artemisia, increases in TEM_Min and RHU_Avg promote production, while increases in SSHs and TEM_Max inhibit production. Notably, the three types of pollen reached local minimum concentrations in 2012, 2017 and 2018, when TEM_Min and SSHs respectively reached local minimum and maximum values, further demonstrating the promoting effect of TEM_Min and the inhibitory effect of SSHs on annual average pollen concentration. Rahman et al. (2020) and Lei et al. (2023) indicated that temperature is the main factor affecting the interannual variation of pollen and is positively correlated with pollen production. Our findings are largely consistent with these conclusions, although they did not consider the effect of SSHs on interannual changes in pollen concentration. In summary, the annual production of pollen in Beijing is significantly influenced by meteorological conditions, particularly temperature, relative humidity and sunshine hours. Different meteorological factors exhibit distinct promoting and inhibiting effects on pollen production.
Figures 9, S9 and S10 illustrate the spatial distribution of the average concentrations of Artemisia, chenopods and TotalPC during the autumn pollen season in Beijing from 2006 to 2020. During this period, the concentration of all three pollen types initially increases and then decreases. The pollen season begins around 10 August each year and concludes around 25 September. The peak concentrations for Artemisia and chenopod pollen occur around 30 August, while the peak concentration for TotalPC is observed around 5 September. The entire pollen season lasts approximately 45 d.
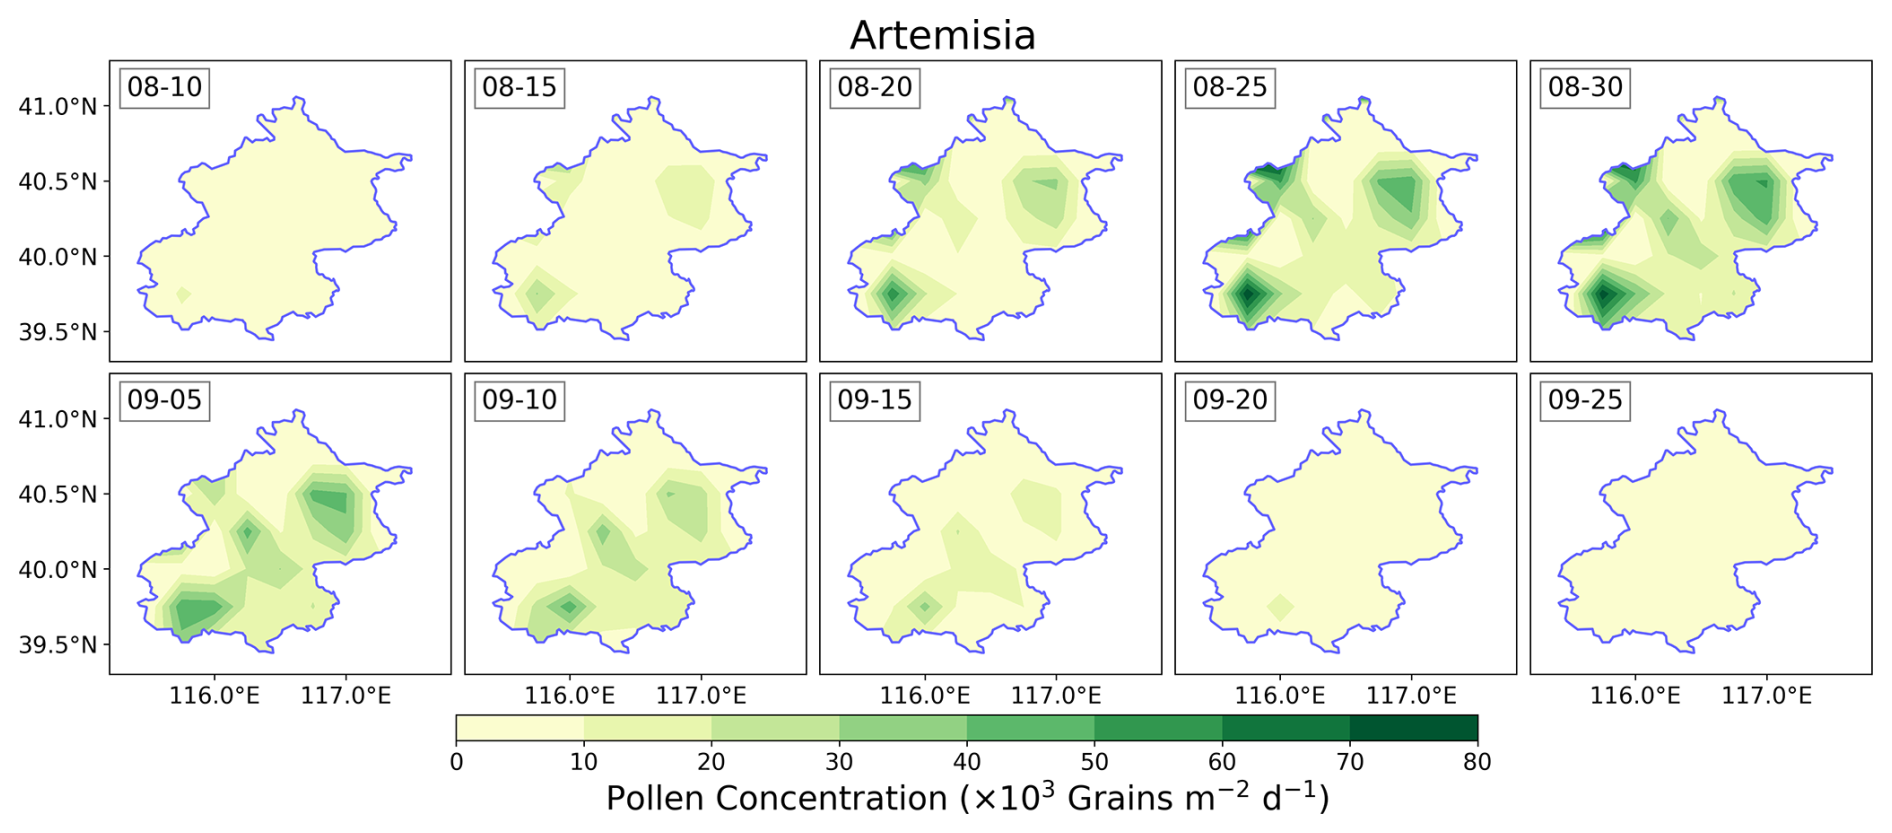
Figure 9Temporal and spatial distribution of Artemisia in Beijing (average from 2006 to 2020).
Regarding the average pollen concentration distribution, Artemisia is primarily concentrated in the southwest, northeast and parts of the northwest of Beijing, with lower concentrations in the southeast. In contrast, chenopods and TotalPC are mainly distributed in the southeastern plains. The maximum average concentrations for Artemisia, chenopods and TotalPC reach 81.1×10³, 42.0×10³ and 351.8×10³ grains per m2 per day, respectively.
3.3 Simulation of pollen emissions in a regional climate model
To evaluate the pollen emissions model based on autumn pollen phenology and RF, this study integrates the offline calculated pollen emissions into the regional climate model RegCM. By comparing the simulated atmospheric pollen concentrations with data from ground-based pollen monitoring stations, we assess the performance of this pollen emissions potential model.
3.3.1 Evaluation of pollen simulation accuracy in RegCM
Figures 10, S11 and S12 depict the time series distribution of the concentrations of three pollen types simulated by RegCM compared to observed concentrations from 2006 to 2020. The RegCM successfully captures the temporal variation trends of pollen concentrations during the autumn pollen season, generally showing an initial increase followed by a decrease. Daily pollen concentrations fluctuate significantly due to meteorological factors such as temperature, precipitation and RH, as well as key physical processes like advection, convection, and dry and wet deposition. Overall, the simulated pollen concentrations by RegCM align well with the observed trends, though some discrepancies remain.
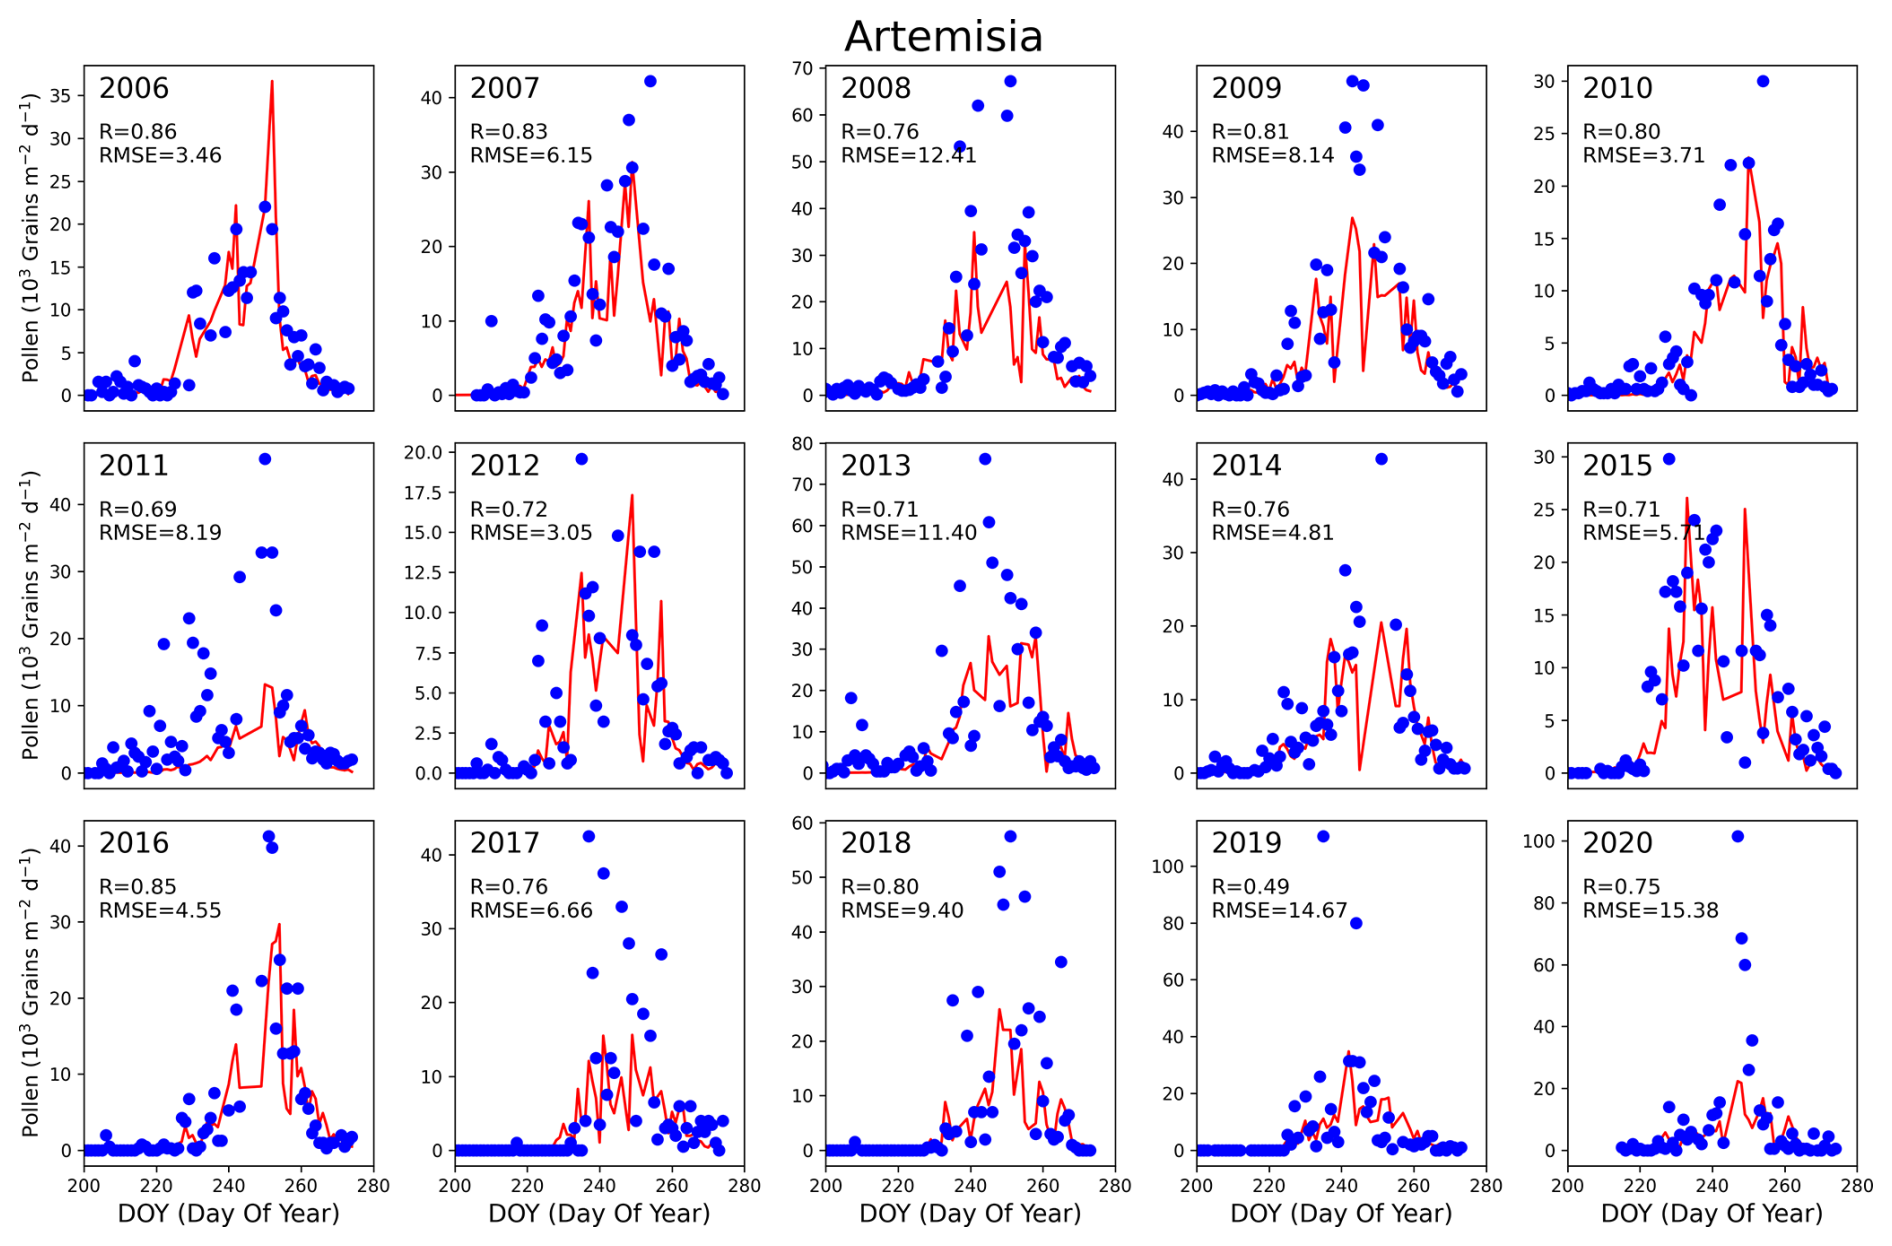
Figure 10Time series distribution of Artemisia under the RegCM simulation compared to observations (averaged across effective pollen monitoring sites). The solid red line represents model simulations, while blue dots depict observations.
In the simulation of Artemisia (Fig. 10), the sDOY and pollen production vary annually due to meteorological conditions and key physical processes. The annual peak pollen concentrations generally range from 20–70×103 grains per m2 per day, while in 2019–2020, observed pollen concentrations exceeded 100×103 grains per m2 per day, with notable spikes and drops likely due to abrupt meteorological changes or possible issues with the quality of observation data. The RegCM accurately simulates the sDOY and eDOY, displaying a similar frequency to observations. For peak pollen simulations, years such as 2006, 2007, 2010, 2012, 2015 and 2016 show good performance, with R above 0.7, particularly in 2006 and 2016, where R exceeds 0.85 and the RMSE is only 4×10³ grains per m2 per day. However, for other years, peak simulations are underestimated to varying degrees. For 2011, although the trend is consistent, the observed peak is near 50×103 grains per m2 per day, while the simulated peak is only 12×103 grains per m2 per day, indicating a significant underestimation. This underestimation is also noticeable in 2008, 2013 and 2017–2020. In 2019, although the peak concentrations align, the trend correlation is low (R=0.49), and the RMSE is high. The variability in observation station data quality and quantity could influence these results, with some years having fewer than six effective stations (minimum of two), impacting the average and peak values. Box plots (Fig. 11) reveal that Artemisia concentrations in 2019–2020 are more dispersed, suggesting possible anomalies in observation data. Overall, the R for RegCM simulations ranges from 0.69 to 0.86 (except 2019), with an RMSE between 3.05–15.38×10³ grains per m2 per day.
For chenopod simulations (Fig. S11), the overall performance is similar to Artemisia. The annual peak concentrations are generally lower, around 20–50×103 grains per m2 per day, except for 2007, which reaches 120×103 grains per m2 per day. The years 2006, 2008–2009, 2012–2013, 2015 and 2019 show good simulation performance, accurately reflecting peak concentrations, particularly in 2016 (R=0.84, RMSE = 3.11×10³ grains per m2 per day). However, 2007, 2010, 2017–2018 and 2020 exhibit underestimation, with the exceptionally high observed concentrations in 2007 likely causing the model's underestimation. Figure 11 indicates increasing peak concentrations in recent years (2017–2020) for both Artemisia and chenopods, with room for improvement in peak simulations by RegCM. Despite the lower concentrations compared to spring pollen, autumn pollen significantly impacts pollen-induced diseases (pollinosis), prompting more attention and efforts in pollen management, which contributes to the decreasing trend in monitored pollen concentrations.
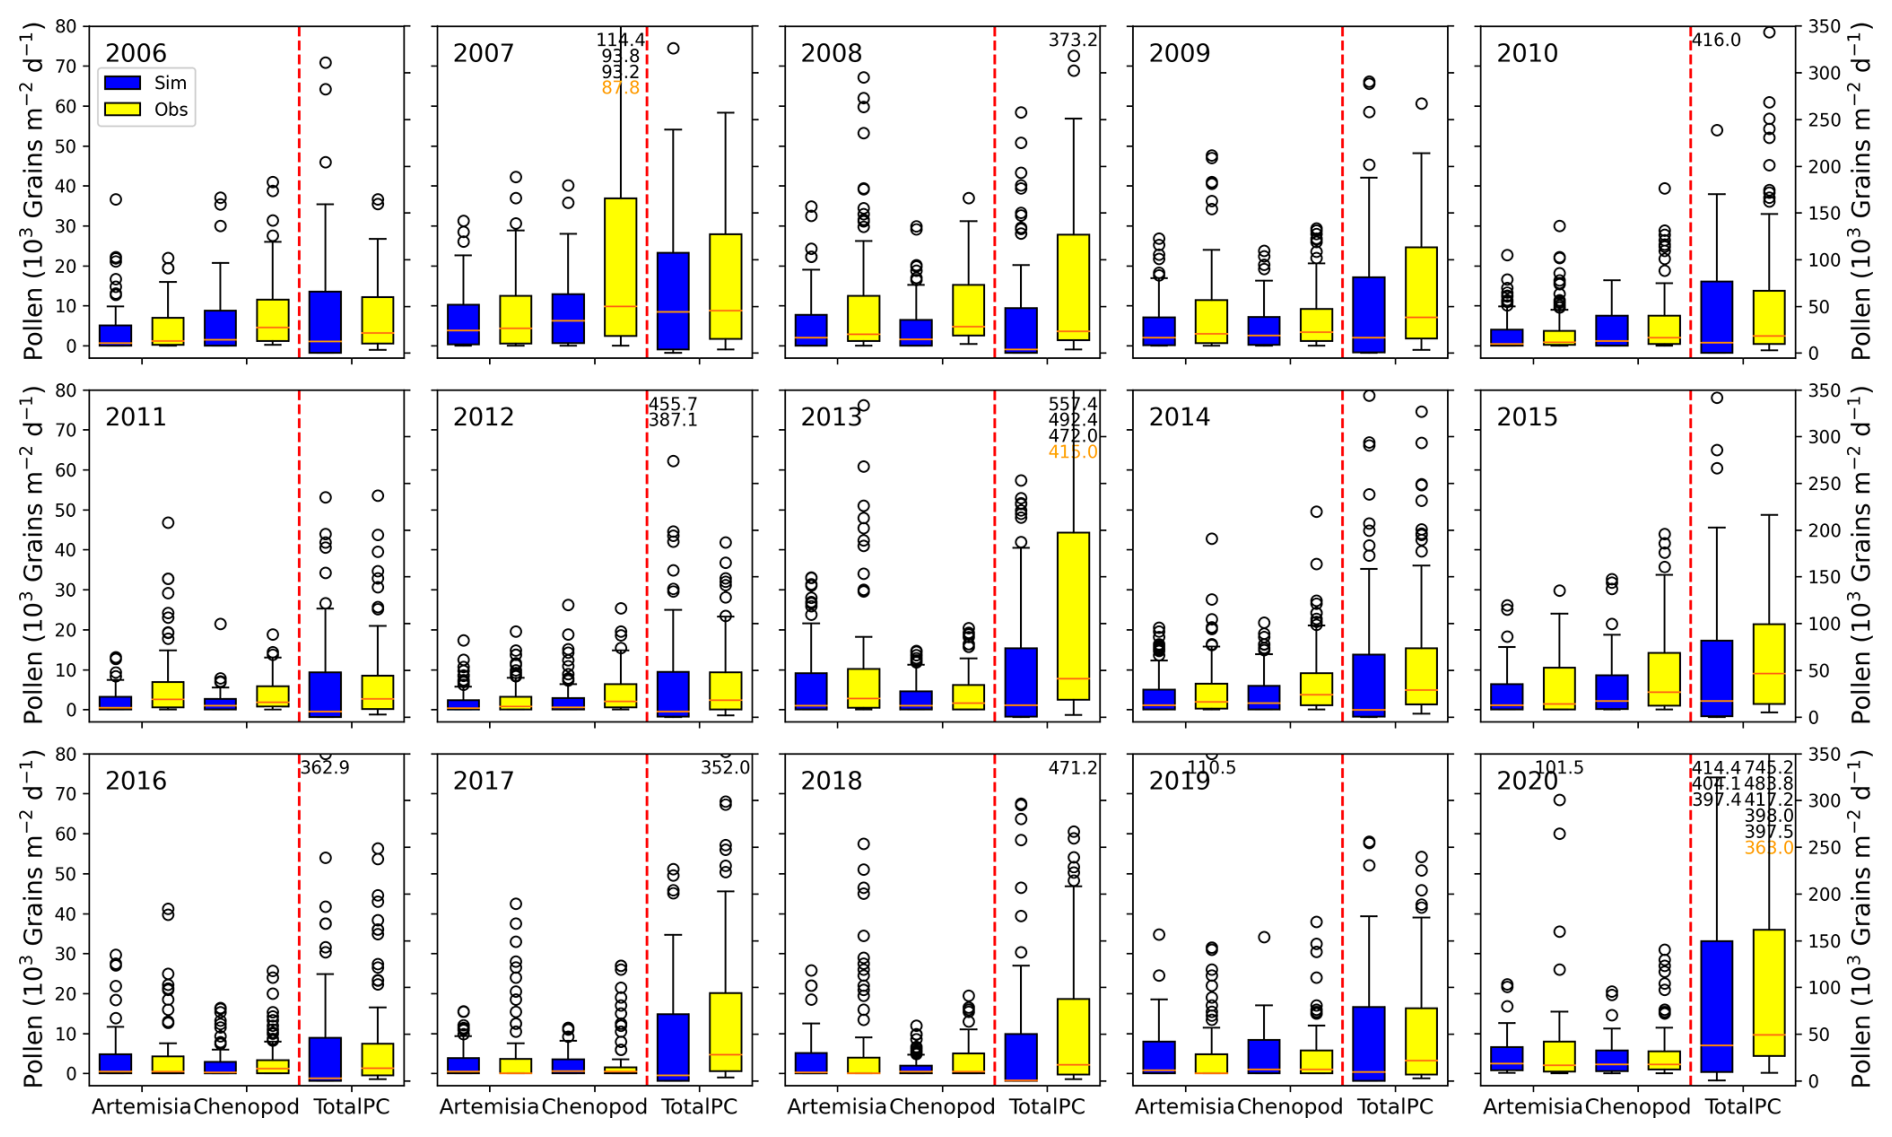
Figure 11Box plot statistics of pollen concentration under the RegCM simulation compared to observed values. Each subplot features box plots denoted by dashed red lines: on the left side representing Artemisia and chenopod concentrations with values referenced on the left y axis and on the right side depicting TotalPC with values referenced on the right y axis. In each box plot, from bottom to top, the box and whiskers indicate the minimum, lower quartile, median, upper quartile and maximum values (extending up to 1.5 times the interquartile range, IQR). Black circles denote outliers exceeding 1.5 times IQR. Orange numbers annotated in the subplot indicate the maximum values unseen within the box, while black numbers denote unseen outliers.
TotalPC generally exhibits higher concentration levels compared to Artemisia and chenopods (Fig. S12). Annual peak TotalPC can reach 150–500×103 grains per m2 per day, with the highest observed concentration in 2020 at 745×103 grains per m2 per day. Due to the higher quality and completeness of TotalPC monitoring data, the simulation results are more accurate, with R generally above 0.76 (except 2015, R=0.64). Over 60 % of the years have R above 0.8, with fewer years showing significant underestimation of peak concentrations (e.g., 2013). This highlights the critical role of high-quality pollen monitoring data for accurate simulations. High-quality data enable the precise capture of pollen concentration trends and peaks, providing robust support for regional pollen phenology research.
In summary, RegCM demonstrates high accuracy in simulating the concentrations of the three pollen types, especially TotalPC. Accurate simulations of pollen concentrations and peaks enhance the effectiveness of pollen emissions models, improve health risk warnings, and provide a scientific basis for urban planning and environmental management.
This study utilized years of autumn pollen concentration data from Beijing, alongside meteorological and land use data, to develop an autumn pollen emissions model using autumn phenology and the RF algorithm. We conducted an in-depth analysis of the spatiotemporal distribution characteristics of Artemisia, chenopods and TotalPC in Beijing and examined their relationships with meteorological factors. Finally, we validated the accuracy and reliability of the constructed pollen emissions model using RegCM. Through a series of simulations and validations, several significant conclusions and findings were obtained.
-
Construction of the pollen emissions model. By incorporating phenology and the RF algorithm, we calculated autumn pollen emissions, thereby avoiding the poor simulation results of sDOY, eDOY and annual pollen production based solely on temperature linear simulations. The study demonstrates that using a phenology model for sDOY and eDOY simulations captures the temporal variations of pollen release more accurately, effectively reducing simulation errors. The RF algorithm excels in handling multivariate and nonlinear relationships, significantly improving the simulation accuracy of the pollen emissions model. The optimized annual pollen production simulations better reflect seasonal changes in pollen, showcasing the applicability and reliability of the RF algorithm in processing meteorological and environmental data.
-
Spatiotemporal distribution characteristics of pollen concentration. The study found significant spatial and temporal variations in pollen concentration in Beijing. The autumn pollen peak occurs between DOY 215–280, with considerable differences in peak times and concentrations among monitoring stations. These differences are closely related to the vegetation types, topographical features and local climatic conditions around each station. Optimized simulations of pollen concentration data further reveal the spatiotemporal variation patterns of pollen concentrations.
-
Impact of meteorological factors on annual pollen emissions. Meteorological factors significantly influence pollen concentrations. The study reveals that temperature, RH and SSHs are crucial factors affecting annual pollen emissions in Beijing. There is a positive correlation between temperature and RH with annual pollen emissions, while SSHs have a negative correlation. The response of different pollen types to meteorological factors varies due to their distinct biological characteristics and ecological environments. This comprehensive analysis provides a scientific basis for predicting future changes in pollen concentrations.
-
Validation of pollen emissions models using RegCM. The RegCM accurately reflects the daily impact of meteorological factors on pollen emissions. Key physical processes, such as advection, convection, and wet and dry deposition, play essential roles in simulating the atmospheric dispersion and deposition of pollen. This study validated the accuracy and reliability of the optimized emission potential models for three pollen types using RegCM, effectively describing the daily variations in pollen concentrations influenced by meteorological factors and key physical processes. Furthermore, the pollen emissions model developed in this study can be applied to other regions, offering potential for wider application. These comprehensive results provide essential scientific support for pollen monitoring, allergy prevention and the selection of urban greening plants. Future research can extend these methods and findings to larger-scale pollen emissions simulations and forecasts, enhancing responses to pollen-related public health issues.
-
Limitations and future prospects. Despite significant progress in constructing the pollen emissions model and analyzing the spatiotemporal distribution of pollen concentrations, some limitations persist. For broader application, more extensive observation stations are needed to verify the model's accuracy, considering the limited spatiotemporal resolution of current pollen concentration data. Simulating specific species' pollen concentrations requires detailed plant functional type distributions, which significantly impact the spatial distribution of pollen emissions potential. The current research utilizes static plant functional type data, but dynamic data would better reflect the impact of land use changes on pollen climates over various temporal and spatial scales. Additionally, the complex relationship between meteorological factors and pollen concentrations suggests that future research could introduce more environmental and meteorological variables and apply advanced machine learning algorithms to enhance the model's predictive capability.
In conclusion, this study successfully constructed a pollen emissions potential model, systematically analyzed the spatiotemporal distribution of different pollen types in autumn in Beijing and explored their relationship with meteorological factors. The model's accuracy and stability were validated using RegCM, yielding notable research results. Future research can further validate and extend this approach on a larger scale and with higher resolution, providing comprehensive scientific support for ecological environment protection and public health.
Meteorological data were sourced from the Daily Surface Climate Dataset for China (https://data.cma.cn/data/cdcindex/cid/f0fb4b55508804ca.html, National Meteorological Science Data Center, 2025), which requires appropriate permissions for access. Pollen data were provided by the Beijing Meteorological Bureau, and the authors do not have permission to share these data.
The supplement related to this article is available online at https://doi.org/10.5194/acp-25-3583-2025-supplement.
JL performed the analysis, investigation, methodology, software development, validation and original draft preparation. XA conceptualized the paper, provided resources, acquired funding, and conducted the review and editing. ZS and CY contributed resources, visualization and data curation. HQ, YZ and ZL were involved in visualization. All authors contributed to manuscript revisions.
The contact author has declared that none of the authors has any competing interests.
Publisher's note: Copernicus Publications remains neutral with regard to jurisdictional claims made in the text, published maps, institutional affiliations, or any other geographical representation in this paper. While Copernicus Publications makes every effort to include appropriate place names, the final responsibility lies with the authors.
The simulations in this research were performed on the high-performance computer Pi at the China Meteorological Administration, where the model output was also stored. We would like to thank the four anonymous reviewers for their helpful comments.
This research has been supported by the National Key Research and Development Program of China (grant no. 2022YFC3701205), the Science and Technology Development Fund of the Chinese Academy of Meteorological Sciences (grant no. 2023Z026), and the National Natural Science Foundation of China (grant no. 41975173).
This paper was edited by Guangjie Zheng and reviewed by four anonymous referees.
Aerts, R., Stas, M., Vanlessen, N., Hendrickx, M., Bruffaerts, N., Hoebeke, L., Dendoncker, N., Dujardin, S., Saenen, N. D., Van Nieuwenhuyse, A., Aerts, J.-M., Van Orshoven, J., Nawrot, T. S., and Somers, B.: Residential green space and seasonal distress in a cohort of tree pollen allergy patients, Int. J. Hygien. Environ. Health, 223, 71–79, https://doi.org/10.1016/j.ijheh.2019.10.004, 2020.
Ahmed, A., Hakim, A., and Becker, A.: Evaluation of eczema, asthma, allergic rhinitis and allergies among the Grade-1 children of Iqaluit, Allerg. Asthma Clin. Immunol., 14, 9, https://doi.org/10.1186/s13223-018-0232-2, 2018.
Asher, M. I., Montefort, S., Björkstén, B., Lai, C. K. W., Strachan, D. P., Weiland, S. K., and Williams, H.: Worldwide time trends in the prevalence of symptoms of asthma, allergic rhinoconjunctivitis, and eczema in childhood: ISAAC Phases One and Three repeat multicountry cross-sectional surveys, Lancet, 368, 733–743, https://doi.org/10.1016/S0140-6736(06)69283-0, 2006.
Bai, Y., Liu, A., Sun, M., Liu, G., and Meng, Y.: Effect of Pollen Pollution on Human Health, J. Anhui Agri. Sci., 37, 2220–2222, 2009.
Bastl, K., Kmenta, M., Berger, M., and Berger, U.: The connection of pollen concentrations and crowd-sourced symptom data: new insights from daily and seasonal symptom load index data from 2013 to 2017 in Vienna, World Allerg. Org. J., 11, 24, https://doi.org/10.1186/s40413-018-0203-6, 2018.
Bishan, C., Bing, L., Chixin, C., Junxia, S., Shulin, Z., Cailang, L., Siqiao, Y., and Chuanxiu, L.: Relationship between airborne pollen assemblages and major meteorological parameters in Zhanjiang, South China, PLOS ONE, 15, e0240160, https://doi.org/10.1371/journal.pone.0240160, 2020.
Breiman, L.: Random Forests, Mach. Learn., 45, 5–32, https://doi.org/10.1023/A:1010933404324, 2001.
Chen, H., Li, J., Cheng, L., Gao, Z. s., Lin, X., Zhu, R., Yang, L., Tao, A., Hong, H., Tang, W., Guo, Y., Huang, H., Sun, J.-l., Lai, H., Lei, C., Liu, G., Xiang, L., Chen, Z., Ma, H., Chan, A. W.-M., Hao, C., and Sun, B.: China Consensus Document on Allergy Diagnostics, Allerg.Asthma Immunol. Res., 13, 177–205, 2020.
Chen, J., Zhu, S., Wang, P., Zheng, Z., Shi, S., Li, X., Xu, C., Yu, K., Chen, R., Kan, H., Zhang, H., and Meng, X.: Predicting particulate matter, nitrogen dioxide, and ozone across Great Britain with high spatiotemporal resolution based on random forest models, Sci. Total Environ., 926, 171831, https://doi.org/10.1016/j.scitotenv.2024.171831, 2024.
Chen, Y. Z. and National Cooperation Group On Childhood Asthma: A nationwide survey in China on prevalence of asthma in urban children, Chin. J. Pediatr., 41, 123–127, 2003.
Cingi, C., Gevaert, P., Mösges, R., Rondon, C., Hox, V., Rudenko, M., Muluk, N. B., Scadding, G., Manole, F., Hupin, C., Fokkens, W. J., Akdis, C., Bachert, C., Demoly, P., Mullol, J., Muraro, A., Papadopoulos, N., Pawankar, R., Rombaux, P., Toskala, E., Kalogjera, L., Prokopakis, E., Hellings, P. W., and Bousquet, J.: Multi-morbidities of allergic rhinitis in adults: European Academy of Allergy and Clinical Immunology Task Force Report, Clin. Transl. Allerg., 7, 17, https://doi.org/10.1186/s13601-017-0153-z, 2017.
D'Amato, G., Vitale, C., Lanza, M., Molino, A., and D'Amato, M.: Climate change, air pollution, and allergic respiratory diseases: an update, Curr. Opin. Allerg. Clin. Immunol., 16, 434–440, https://doi.org/10.1097/aci.0000000000000301, 2016.
Damialis, A., Fotiou, C., Halley, J. M., and Vokou, D.: Effects of environmental factors on pollen production in anemophilous woody species, Trees, 25, 253–264, 2011.
Emanuel, M. B.: Hay fever, a post industrial revolution epidemic: a history of its growth during the 19th century, Clin. Exp. Allerg., 18, 295–304, https://doi.org/10.1111/j.1365-2222.1988.tb02872.x, 1988.
Frei, T. and Gassner, E.: Climate change and its impact on birch pollen quantities and the start of the pollen season an example from Switzerland for the period 1969–2006, Int. J. Biometeorol., 52, 667–674, https://doi.org/10.1007/s00484-008-0159-2, 2008.
Gao, Q. Q., Gao, Q. Y., Li, J., Shen, F., Ji, S., and Guan, L.: Preliminary Study on the Variation Characteristics of Pollen Concentration and Pollen Allergy Grade in Langfang Area in Spring, J. Agricult. Catastrophol., 12, 16–18, 2022.
Gu, D. and Liao, K.: The relationship between urban pollen dispersal and meteorological conditions, Hubei Meteorol., 3, 36–37, 2003.
Guan, L., Gao, Q. Y., Li, H., Li, J., and Gao, Q. Q.: Characteristics of Airborne Pollen Variation in Langfang City and Its Relationship with Meteorological Factors, Agricult. Technol. Serv., 38, 93–98, 2021.
Guzman, A., Tonelli, L. H., Roberts, D., Stiller, J. W., Jackson, M. A., Soriano, J. J., Yousufi, S., Rohan, K. J., Komarow, H., and Postolache, T. T.: Mood-worsening with high-pollen-counts and seasonality: A preliminary report, J. Affect. Disord., 101, 269–274, https://doi.org/10.1016/j.jad.2006.11.026, 2007.
He, H., Zhang, D., and Qiao, B.: Preliminary approach of the relationship between Airborne pollen amount and meteorological factors in Beijing urban area, Chin. J. Microbiol. Immunol., S2, 36–38, 2001.
He, X., Liu, D., Pan, Y., He, X., Zhang, M., and Yang, S.: Distribution and sources of fluvial pollen in the middle reaches of the Yellow River in China and their relationship with vegetation and land use, Sci. Total Environ., 856, 159109, https://doi.org/10.1016/j.scitotenv.2022.159109, 2023.
Helbig, N., Vogel, B., Vogel, H., and Fiedler, F.: Numerical modelling of pollen dispersion on the regional scale, Aerobiologia, 20, 3–19, https://doi.org/10.1023/B:AERO.0000022984.51588.30, 2004.
Ibrahim, N. M., Almarzouqi, F. I., Al Melaih, F. A., Farouk, H., Alsayed, M., and AlJassim, F. M.: Prevalence of asthma and allergies among children in the United Arab Emirates: A cross-sectional study, World Allerg. Org. J., 14, 100588, https://doi.org/10.1016/j.waojou.2021.100588, 2021.
Khwarahm, N. R., Dash, J., Skjøth, C. A., Newnham, R. M., Adams-Groom, B., Head, K., Caulton, E., and Atkinson, P. M.: Mapping the birch and grass pollen seasons in the UK using satellite sensor time-series, Sci. Total Environ., 578, 586-600, https://doi.org/10.1016/j.scitotenv.2016.11.004, 2017.
Krishna, M. T., Mahesh, P. A., Vedanthan, P. K., Mehta, V., Moitra, S., and Christopher, D. J.: The burden of allergic diseases in the Indian subcontinent: barriers and challenges, Lancet Glob. Health, 8, e478–e479, https://doi.org/10.1016/s2214-109x(20)30061-9, 2020.
Kurganskiy, A., Creer, S., de Vere, N., Griffith, G. W., Osborne, N. J., Wheeler, B. W., McInnes, R. N., Clewlow, Y., Barber, A., Brennan, G. L., Hanlon, H. M., Hegarty, M., Potter, C., Rowney, F., Adams-Groom, B., Petch, G. M., Pashley, C. H., Satchwell, J., de Weger, L. A., Rasmussen, K., Oliver, G., Sindt, C., Bruffaerts, N., and Skjøth, C. A.: Predicting the severity of the grass pollen season and the effect of climate change in Northwest Europe, Sci. Adv., 7, eabd7658, https://doi.org/10.1126/sciadv.abd7658, 2021.
Lake, I. R., Jones, N. R., Agnew, M., Goodess, C. M., Giorgi, F., Hamaoui-Laguel, L., Semenov, M. A., Solmon, F., Storkey, J., Vautard, R., and Epstein, M. M.: Climate Change and Future Pollen Allergy in Europe, Environ. Health Perspect., 125, 385–391, https://doi.org/10.1289/ehp173, 2017.
Lei, Y., Miao, Y., Zhao, Y., Zhang, S., Cao, H., Lan, X., Zhang, Z., and Jin, H.: The effects of meteorological conditions on allergenic airborne pollen in arid Northwest China, Atmos. Environ., 299, 119647, https://doi.org/10.1016/j.atmosenv.2023.119647, 2023.
Li, L., Hao, D., Li, X., Chen, M., Zhou, Y., Jurgens, D., Asrar, G., and Sapkota, A.: Satellite-based phenology products and in-situ pollen dynamics: A comparative assessment, Environ. Res., 204, 111937, https://doi.org/10.1016/j.envres.2021.111937, 2022.
Li, X., Zhou, Y., Meng, L., Asrar, G., Sapkota, A., and Coates, F.: Characterizing the relationship between satellite phenology and pollen season: A case study of birch, Remote Sens. Environ., 222, 267–274, https://doi.org/10.1016/j.rse.2018.12.036, 2019.
Li, Z., Chen, Y., Tao, Y., Zhao, X., Wang, D., Wei, T., Hou, Y., and Xu, X.: Mapping the personal PM2.5 exposure of China's population using random forest, Sci. Total Environ., 871, 162090, https://doi.org/10.1016/j.scitotenv.2023.162090, 2023.
Lou, H., Ma, S., Zhao, Y., Cao, F., He, F., Liu, Z., Bousquet, J., Wang, C., Zhang, L., and Bachert, C.: Sensitization patterns and minimum screening panels for aeroallergens in self-reported allergic rhinitis in China, Sci. Rep., 7, 9286, https://doi.org/10.1038/s41598-017-10111-9, 2017.
Mallol, J., Crane, J., von Mutius, E., Odhiambo, J., Keil, U., and Stewart, A.: The International Study of Asthma and Allergies in Childhood (ISAAC) Phase Three: A global synthesis, Allergolog. Immunopathol., 41, 73–85, https://doi.org/10.1016/j.aller.2012.03.001, 2013.
Meier, M. and Bigler, C.: Process-oriented models of autumn leaf phenology: ways to sound calibration and implications of uncertain projections, Geosci. Model Dev., 16, 7171–7201, https://doi.org/10.5194/gmd-16-7171-2023, 2023.
Meng, L., Wang, X., Ouyang, Z., Ren, Y., and Wang, Q.: Seasonal Dynamics of Airborne Pollens and Its Relationship with Meteorological Factors in Beijing Urban Area, Environ. Sci., 37, 452–458, 2016.
Mir, E., Panjabi, C., and Shah, A. K.: Impact of allergic rhinitis in school going children, Asia Pacif. Allerg., 2, 93–100, 2012.
Mo, Y., Zhang, J., Jiang, H., and Fu, Y. H.: A comparative study of 17 phenological models to predict the start of the growing season, Front. Forests Global Change, 5, 1032066, https://doi.org/10.3389/ffgc.2022.1032066, 2023.
National Cooperative Group on Childhood Asthma: A nationwide surrey on the prevalence of asthma among 0–14 year old population in China (1988–1990), Chin. J. Tuberc. Respir. Dis., 16, 64–68, 1993.
National Cooperative Group on Childhood Asthma, Institute of Environmental Health and Related Product Safety, Chinese Center for Disease Control and Prevention, and Chinese Center for Disease Control and Prevention: Third nationwide survey of childhood asthma in urban areas of China, Chin. J. Pediatr., 51, 729–735, 2013.
National Meteorological Science Data Center: China Meteorological Data Network, https://data.cma.cn/data/cdcindex/cid/f0fb4b55508804ca.html (last access: 20 March 2025), 2025.
Oleson, K., Lawrence, D., Bonan, G., Flanner, M., Kluzek, E., Lawrence, P., Levis, S., Swenson, S., Thornton, P., Dai, A., Decker, M., Dickinson, R., Feddema, J., Heald, C., Hoffman, F., Lamarque, J., Mahowald, N., Niu, G., Qian, T., Randerson, J., Running, S., Sakaguchi, K., Slater, A., Stöckli, R., Wang, A., Yang, Z., Zeng, X. D., and Zeng, X. B.: Technical Description of Version 4.0 of the Community Land Model (CLM), University Corporation for Atmospheric Research, https://doi.org/10.5065/D6FB50WZ, 2010.
Qiao, Y., Wu, L., Yang, S., Wang, Q., Gu, H., Wei, L., Liu, G., Zhou, S., Wang, P., and Song, M.: Metabolomic and transcriptomic analyses provide insights into variations in flavonoids contents between two Artemisia cultivars, BMC Plant Biol., 23, 288, https://doi.org/10.1186/s12870-023-04295-8, 2023.
Rahman, A., Luo, C., Chen, B., Haberle, S., Khan, M. H. R., Jiang, W., Xiang, R., Liu, J., Wang, L., Lin, G., Yang, M., and Thilakanayaka, V.: Regional and seasonal variation of airborne pollen and spores among the cities of South China, Ac. Ecolog. Sin., 40, 283–295, https://doi.org/10.1016/j.chnaes.2019.05.012, 2020.
Schmidt, C. W.: Pollen Overload: Seasonal Allergies in a Changing Climate, Environ. Health Perspect., 124, 70–75, https://doi.org/10.1289/ehp.124-A70, 2016.
Septembre-Malaterre, A., Lalarizo Rakoto, M., Marodon, C., Bedoui, Y., Nakab, J., Simon, E., Hoarau, L., Savriama, S., Strasberg, D., Guiraud, P., Selambarom, J., and Gasque, P.: Artemisia annua, a Traditional Plant Brought to Light, Int. J. Mol. Sci., 21, 4986, https://doi.org/10.3390/ijms21144986, 2020.
Sofiev, M., Siljamo, P., Ranta, H., and Rantio-Lehtimäki, A.: Towards numerical forecasting of long-range air transport of birch pollen: theoretical considerations and a feasibility study, Int. J. Biometeorol., 50, 392–402, https://doi.org/10.1007/s00484-006-0027-x, 2006.
Sofiev, M., Siljamo, P., Ranta, H., Linkosalo, T., Jaeger, S. R., Rasmussen, A., Rantio-Lehtimäki, A., Severova, E. E., and Kukkonen, J.: A numerical model of birch pollen emission and dispersion in the atmosphere. Description of the emission module, Int. J. Biometeorol., 57, 45–58, 2013.
Solmon, F., Giorgi, F., and Liousse, C.: Aerosol modelling for regional climate studies: application to anthropogenic particles and evaluation over a European/African domain, Tellus B, 58, 51–72, https://doi.org/10.1111/j.1600-0889.2005.00155.x, 2006.
Stas, M., Aerts, R., Hendrickx, M., Delcloo, A., Dendoncker, N., Dujardin, S., Linard, C., Nawrot, T., Van Nieuwenhuyse, A., Aerts, J.-M., Van Orshoven, J., and Somers, B.: Exposure to green space and pollen allergy symptom severity: A case-crossover study in Belgium, Sci. Total Environ., 781, 146682, https://doi.org/10.1016/j.scitotenv.2021.146682, 2021.
Valipour Shokouhi, B., de Hoogh, K., Gehrig, R., and Eeftens, M.: Estimation of historical daily airborne pollen concentrations across Switzerland using a spatio temporal random forest model, Sci. Total Environ., 906, 167286, https://doi.org/10.1016/j.scitotenv.2023.167286, 2024.
Virro, H., Kmoch, A., Vainu, M., and Uuemaa, E.: Random forest-based modeling of stream nutrients at national level in a data-scarce region, Sci. Total Environ., 840, 156613, https://doi.org/10.1016/j.scitotenv.2022.156613, 2022.
Wang, X. D., Zheng, M., Lou, H. F., Wang, C. S., Zhang, Y., Bo, M. Y., Ge, S. Q., Zhang, N., Zhang, L., and Bachert, C.: An increased prevalence of self-reported allergic rhinitis in major Chinese cities from 2005 to 2011, Allergy, 71, 1170–1180, https://doi.org/10.1111/all.12874, 2016.
Wang, X. Y., Ma, T. T., Wang, X. Y., Zhuang, Y., Wang, X. D., Ning, H. Y., Shi, H. Y., Yu, R. L., Yan, D., Huang, H. D., Bai, Y. F., Shan, G. L., Zhang, B., Song, Q. K., Zhang, Y. F., Zhang, T. J., Jia, D. Z., Liu, X. L., Kang, Z. X., Yan, W. J., Yang, B. T., Bao, X. Z., Sun, S. H., Zhang, F. F., Yu, W. H., Bai, C. L., Wei, T., Yang, T., Ma, T. Q., Wu, X. B., Liu, J. G., Du, H., Zhang, L., Yan, Y., and Wang, D. Y.: Prevalence of pollen-induced allergic rhinitis with high pollen exposure in grasslands of northern China, Allergy, 73, 1232–1243, https://doi.org/10.1111/all.13388, 2018.
Wozniak, M. C. and Steiner, A. L.: A prognostic pollen emissions model for climate models (PECM1.0), Geosci. Model Dev., 10, 4105–4127, https://doi.org/10.5194/gmd-10-4105-2017, 2017.
Wu, Z., Liu, A., Bai, Y., Liu, B., and Wang, C.: Study on Evaluation of Economic Benefitsfrom Pollen Forecast and Service in Tianjin, Meteorol. Month., 37, 626–632, 2011.
Yin, J., Yue, F. M., Wang, L. L., He, H. J., Xu, T., Zhang, H. Y., Li, H., Wen, L. P., Sun, J. L., Gu, J. Q., Han, S. M., and Ye, S. T.: The clinical study of the relationship between allergic rhinitis and allergic asthma in the patients with autumnal pollinosis, Zhonghua Yi Xue Za Zhi, 85, 1683–1687, 2005.
Yorimitsu, Y., Kadosono, A., Hatakeyama, Y., Yabiku, T., and Ueno, O.: Transition from C3 to proto-Kranz to C3–C4 intermediate type in the genus Chenopodium (Chenopodiaceae), J. Plant Res., 132, 839–855, https://doi.org/10.1007/s10265-019-01135-5, 2019.
Zhang, Y. and Steiner, A. L.: Projected climate-driven changes in pollen emission season length and magnitude over the continental United States, Nat. Commun., 13, 1234, https://doi.org/10.1038/s41467-022-28764-0, 2022.
Zhao, Y., Sun, Z., Xiang, L., An, X., Hou, X., Shang, J., Han, L., and Ye, C.: Effects of pollen concentration on allergic rhinitis in children: A retrospective study from Beijing, a Chinese megacity, Environ. Res., 229, 115903, https://doi.org/10.1016/j.envres.2023.115903, 2023.