the Creative Commons Attribution 4.0 License.
the Creative Commons Attribution 4.0 License.
 | 08 Dec 2025
Decadal changes in atmospheric ammonia and dry deposition across China inferred from space-ground measurements and model simulations
Fan Sun
Yu Cui
Jiayin Su
Mark W. Shephard
Shailesh K. Kharol
Yifan Zhang
Xuejing Shi
Junqing Zhang
Huili Liu
Qitao Xiao
Zhao-Cheng Zeng
Timothy J. Griffis
Cheng Hu
Ammonia (NH3), a key alkaline gas in the atmosphere, significantly influences ecosystem nitrogen cycling and the formation of fine particulate matter (PM2.5). However, limited ground-based monitoring hinders understanding of NH3's spatial and temporal dynamics and its dry deposition across China, which is ranked as one of the largest global NH3 emission hotspots. This study integrated 2013–2023 satellite-derived NH3 column concentrations from the Cross-track Infrared Sounder (CrIS) with adjustments from approximately five years ground in-situ ground observations to derive spatial-temporal variation in ground-level NH3 concentrations across China. We also used the GEOS-Chem transport model and a random forest algorithm by using emission inventories and reanalysis meteorological fields to simulate NH3 dry deposition velocity and fluxes, and explore the mechanisms driving observed trends. The CrIS observations results show that column-averaged (averages from ground to ∼ 1 km) NH3 concentrations were the highest in the North China Plain (> 10 ppb), with notable annual and seasonal increasing trends. NH3 concentrations in 2023 were 13.8 %–30.6 % higher than in 2013. CrIS retrievals aligned well with in-situ data, though were generally about twice as high. After applying the regression equation between ground in-situ observations and CrIS column-averaged NH3 concentrations, we derive the spatial-temporal ground-level (1–1.5 m) NH3 concentrations and dry deposition fluxes from 2013 to 2023. The NH3 dry deposition fluxes exhibited a clear east-west gradient, with maxima in the North China Plain, and another hotpot region is also observed in the Sichuan Basin, southwestern China. Increases in ground-level NH3 concentrations and deposition were most pronounced in urban, cropland, and forest regions, with urban areas experiencing the fastest growth and grasslands the highest total deposition. The national mean ground-level NH3 concentration and dry deposition flux were 4.98 ppb and 0.51 g NH3 m−2 yr−1, respectively. Anthropogenic emissions explained 77.4 % of the variability in ground-level NH3 concentration trend, and meteorological factors accounted for the remainder. Besides, 72.6 %–81.2 % of the NH3 dry deposition trend was governed by NH3 concentration changes. This study identifies the underlying cause of increasing ammonia pollution, which can be used to better inform nitrogen management strategies in China.
- Article
(6397 KB) - Full-text XML
-
Supplement
(3980 KB) - BibTeX
- EndNote


Ammonia (NH3), as the most abundant alkaline gas in the atmosphere, readily reacts with acidic species such as nitric acid and sulfuric acid to form secondary inorganic aerosols. These aerosols contribute significantly to fine particulate matter (PM2.5), thereby adversely affecting human health, air quality, and atmospheric visibility (Na et al., 2007; Hauglustaine et al., 2014; He et al., 2001). Reducing NH3 emissions has been identified as a cost-effective strategy for mitigating air pollution (Pinder et al., 2007; Wu et al., 2016). In addition, excessive atmospheric NH3 can also deposit onto terrestrial and aquatic ecosystems through dry and wet processes, leading to soil acidification, eutrophication, and biodiversity loss (Hernández et al., 2016; Fu et al., 2017; Hu et al., 2021). Therefore, monitoring and quantifying atmospheric NH3 concentrations and deposition rates within different land cover types, especially at global emission hotspots, are critical for informing nitrogen management strategies and protecting air, soil, and water resources, as well as human health (Liu et al., 2017a; Griffis et al., 2019).
As the world's largest agricultural country in terms of total crop yield, China is also among the top NH3 emitters globally. In 2018, the global NH3 emissions from rice, wheat and corn fields were 4.3 ± 1.0 Tg N yr−1, of which China's emissions per unit area were as high as 19.7 kg N ha−1 yr−1, which was much higher than that of the United States (9.1 kg N ha−1 yr−1) and India (10.8 kg N ha−1 yr−1) (Zhan et al., 2021; Luo et al., 2022). From global inventories such as EDGAR and CEDS, China's NH3 emissions accounted for 19.8 % of the global total in 2013. In 2022, this proportion had declined to about 14.5 % (Crippa et al., 2024). In recent years, the proportion of NH3 deposition to total nitrogen (N) deposition has increased steadily, accounting for approximately 67.0 % in China in 2020 (Liu et al., 2024c). This upward trend is expected to continue, driven by declining NOx and SO2 emissions due to pollution control policies and rising NH3 emissions associated with global agricultural intensification (Erisman et al., 2008; Goldberg et al., 2021; Pinder et al., 2008).
NH3 deposition in China is nearly double that of the EU (Liu et al., 2024c), mainly due to excessive nitrogen fertilizer application. In 2014, agricultural NH3 volatilization accounted for 12 Tg N yr−1 globally, with China contributing about 34 % (Ma, 2020). Anthropogenic activities have nearly doubled NH3 emission over the past few decades, with cropland and livestock sources making up around 80 % of the global total emissions. Non-agricultural sources – such as wildfire biomass burning, wastewater treatment, human excreta, and transportation – remain relatively minor (Behera et al., 2013; Zhu et al., 2015; Van Damme et al., 2018; Lutsch et al., 2019). Although the growth rate of both agricultural and non-agricultural NH3 emissions in China has slowed in recent years, the absolute emissions continue to rise (Chen et al., 2023a).
Atmospheric NH3 concentration serves as a key indicator of emission intensity due to its relatively short atmospheric lifetimes, typically the order of hours in the atmospheric boundary layer (hereafter ABL) (Evangeliou et al., 2021). Therefore, accurately quantifying its spatiotemporal variations and identifying the underlying drivers is essential for constraining NH3 emission estimates, evaluating the ecological and environmental impacts and informing effective mitigation strategies. Due to its high reactivity and predominant agricultural sources, NH3 exhibits pronounced temporal and spatial variability. To date, China operates two national observation networks dedicated to monitoring NH3 concentrations and deposition: The National Nitrogen Deposition Monitoring Network (NNDMN, established in 2004) and the Ammonia Monitoring Network of China (AMoN-China, established in 2015). While these networks provide high-quality measurements, their sparse spatial coverage limits their ability to characterize regional patterns for China (Liu et al., 2017a, b). Additionally, few sites offer long-term (> 10 years) continuous data records (Wang et al., 2023), posing challenges for trend analysis across China. The limited availability of NH3 monitoring data impedes our understanding of its spatial-temporal patterns and impacts on air quality, climate, and ecosystems.
In addition to surface monitoring, the chemical transport models (CTMs, i.e. GEOS-Chem, WRF-Chem) are widely used to simulate NH3 concentrations and dry deposition, as they incorporate processes such as emission, transport, deposition, and chemical transformation (Hu et al., 2020, 2021; Lu et al., 2020). However, their accuracy is constrained by uncertainties in emission inventories and model parameterizations (e.g. bi-directional flux), where the bias in both NH3 emissions and other species (e.g. NOx and SO2) can lead to considerable uncertainty in simulating NH3 concentration and corresponding deposition to ground (Kharol et al., 2018; van der Graaf et al., 2022; Liu et al., 2024d). NH3 emission estimates remain highly uncertain due to outdated activity data, poorly constrained emission factors, and underrepresented sources such as cities (Chang et al., 2021). Compared to most other air pollutants, NH3 exhibits greater variability and uncertainty in different inventories and models, particularly because of its diverse agricultural sources and large influence from meteorological factors and human activities (Beusen et al., 2008; Behera et al., 2013).
Recent advances in satellite remote sensing offer new opportunities to monitor boundary layer atmospheric NH3, which was first demonstrated by Beer et al. (2008) with NASA's Tropospheric Emission Spectrometer (TES) observations. The first global NH3 distribution map was derived in 2009 using data from the Infrared Atmospheric Sounding Interferometer (IASI) onboard the MetOp-A satellite (Clarisse et al., 2009). Since then, other hyperspectral infrared instruments have been used to map NH3 concentrations over large regions, such as NASA TES sensor, NASA/NOAA Cross-track Infrared Sounder (CrIS), the NASA Atmospheric Infrared Sounder (AIRS), JAXA Greenhouse Gases Observing Satellite (GOSAT), and the Geostationary Interferometric Infrared Sounder (GIIRS) on board China's FengYun-4B satellite (Shephard et al., 2011; Shephard and Cady-Pereira, 2015; Someya et al., 2020; Chen et al. 2023a; Zeng et al., 2023). Satellite observations provide wide spatial coverage and continuous temporal resolution, helping to fill spatial-temporal observation gaps by ground networks. Satellite-derived NH3 retrievals contain approximately 1 independent piece of information driven by peak sensitivity (averaging kernel) in the ABL (∼ 1–3 km) (Shephard et al., 2011, 2020) that can be represented as profiles with limited vertical resolution or integrated column-averaged values. Therefore, column-averaged satellite retrievals cannot directly replace ground-level (1–1.5 m) concentrations but provide complementary information that helps fill in monitoring gaps.
Despite these limitations, satellite observations have been increasingly used to constrain NH3 emissions, assess deposition flux, and identify trends (Chen et al., 2021; Kharol et al., 2018; Van Damme et al., 2021). For instance, Liu et al. (2019a) estimated global surface NH3 concentrations from IASI data and identified high concentrations (> 6 µg N m−3) in the North China Plain and northern India. Linear trend analysis from 2008 to 2016 revealed strong increases in eastern China (> 0.2 µg N m−3 yr−1). More recently, satellite data have been used to investigate urban NH3 concentrations globally, showing a significant rise (1.2 % yr−1) in 2008–2019 (Liu et al., 2024d). These studies demonstrate the utility of satellite retrievals in characterizing NH3 pollution and its spatiotemporal evolution, especially in regions lacking surface monitoring. In addition to these near surface ammonia concentration observations (from either in-situ surface or satellite observations), the dry deposition estimations also depend on deposition velocities (Lei et al., 2021; Liu et al., 2024d). Therefore, an alternative and reliable approach is to combine model simulated dry deposition, ground-level NH3 concentration from sites and satellite-based column-averaged observations, which can make full use of corresponding advantages and eliminate the large uncertainty from emission inventories of different pollution species.
Therefore, accurate estimation of NH3 dry deposition and its driving factors are becoming increasingly critical. Kharol et al. (2018) reported that NH3 contributed more than NO2 to dry N fluxes over much of North America in the warm season. Liu et al. (2019a) used satellite-derived data to estimate global NH3 dry deposition during 2008–2016, with results broadly consistent with ground measurements, highlighting the potential for satellite-based NH3 observations to fill spatial-temporal gaps in NH3 deposition assessment. In China, satellite observations indicate that elevated NH3 concentrations are predominantly observed in the North China Plain, Northeast China, and the Sichuan Basin, whereas lower concentrations are found on the Tibetan Plateau (Liu et al., 2017b). Despite the prominent NH3 pollution identified in several regions of China, there remains a lack of comprehensive long-term studies that examine the spatiotemporal variations of NH3 concentrations and dry deposition. The key drivers behind these variations – impacted by rapid urbanization, land-use changes, climate change, and shifts in fertilizer application practices – have not been sufficiently quantified. While observational studies conducted over a ten-year period cannot fully address the data gap, they offer valuable insights into the medium- and long-term trends in NH3 concentrations and deposition patterns.
To robustly constrain and quantify the spatiotemporal variations in column-averaged near surface level (average from ground to ∼ 1 km), ground-level (1–1.5 m) NH3 concentrations and dry deposition over the past decade, we integrated multiple data sources and analytical approaches. These included high-resolution satellite-derived NH3 retrievals from 2013 to 2023, ground-based observational datasets, simulations from the GEOS-Chem chemical transport model, and dry deposition velocity estimates derived using a random forest algorithm. This study aims to address the following key scientific questions: (1) What are the spatial and temporal patterns of near surface level and ground-level NH3 concentrations across different land cover types in China over the past decade from 2013 to 2023? (2) What are the temporal trends in NH3 dry deposition across China during this period, and what are the primary driving factors? (3) What are the NH3 concentrations and dry deposition fluxes in China compared to those in other regions globally? By addressing these questions, this study seeks to advance understanding of the nitrogen cycle in China and provide a scientific foundation for evaluating ecological impacts and informing targeted strategies for nitrogen management and sustainable agriculture.
2.1 Satellite-based atmospheric NH3 concentration
The CrIS (version 1.6.4) satellite-based atmospheric NH3 concentration will be used in this study. The CrIS is a hyperspectral infrared sounder onboard the Suomi National Polar-orbiting Partnership (Suomi NPP), NOAA-20, and NOAA-21 satellites (Shephard et al., 2020). Operating in a sun-synchronous orbit at an altitude of approximately 824 km, CrIS provides global coverage twice daily, with local overpass time around 13:30 (daytime) and 01:30 (nighttime). The instrument has a swath width of up to 2200 km, with a nadir spatial resolution of approximately 14 km, and excellent signal-to-noise ratio (Zavyalov et al., 2013). The CrIS fast physical retrieval (CFPR) algorithm (Shephard and Cady-Pereira, 2015) produces NH3 retrievals using CrIS onboard Suomi NPP from May 2012 to May 2021, and CrIS onboard NOAA-20 since 8 March 2019.
In this study, the near surface level of CrIS-derived atmospheric NH3 retrieved profile concentrations was utilized, which are strongly correlated with ABL values around 900 hPa (∼ 1 km) and can represent column average NH3 concentration from ground to ∼ 1 km. To avoid misunderstanding, we define near surface level in this study as the lowest level of CrIS-derived NH3 retrieved profile (average from ground to ∼ 1 km), and the ground-level as height of 1–1.5 m, which is the typical height of site-based observations. As this study focuses on China, we used NH3 data over regions of 73–136° E and 3–54° N and extracted NH3 concentration within China. To ensure data reliability, only high-quality retrievals were included, filtered using a Quality Flag (QF) ≥ 3 and Cloud_Flag = 0. Non-detects (Cloud_Flag = 3) that account for values below the detection limit of the sensor were not included in this study (White et al., 2023; Shephard et al., 2025), but are not expected to have a significant impact in source regions found in China. The analysis period spans from 2013 to 2023, covering both the SNPP and NOAA-20 satellite missions, and provides an 11-year, near-continuous time series of atmospheric NH3 observations over China. To assess the consistency between the two satellite missions, a regression analysis was performed using monthly averaged NH3 concentrations from the overlapping period (2019–2021), revealing strong agreement and consistency across China (Fig. S1 in the Supplement). For subsequent analyses, the original satellite retrievals were resampled to a uniform spatial resolution of 0.1° × 0.1°.
2.2 Ground-based observations of atmospheric NH3 concentration
The dry deposition of NH3 is the product of ground-level (usually calculated by site-based observations of 1–1.5 m height) NH3 concentration and modeled dry deposition velocity. Our previous observation and modeling study in the U.S. Corn Belt found significant vertical gradients within ABL height (∼ 1–2 km) in years of 2017–2019 (Griffis et al., 2019; Hu et al., 2020, 2021). Therefore, the coarse vertical resolution regional satellite mixing ratio values in the lower boundary NH3 concentration should be converted to better represent local ground level values at 1–1.5 m, which will further be used to derive NH3 dry deposition flux. To validate and adjust the regional satellite-derived NH3 concentrations to better represent surface level sampling observations, we used measurements from the National Nitrogen Deposition Monitoring Network (NNDMN), which was established since 2010 and comprises 43 monitoring sites across China, encompassing different land cover types especially for urban, rural (cropland), and background (coastal, forest, and grassland) regions. The network provides high-quality observations of atmospheric reactive nitrogen (Nr) species in gas, particulate, and precipitation phases, including measurements of both wet and dry nitrogen deposition by using simulated dry deposition velocities (Xu et al., 2015).
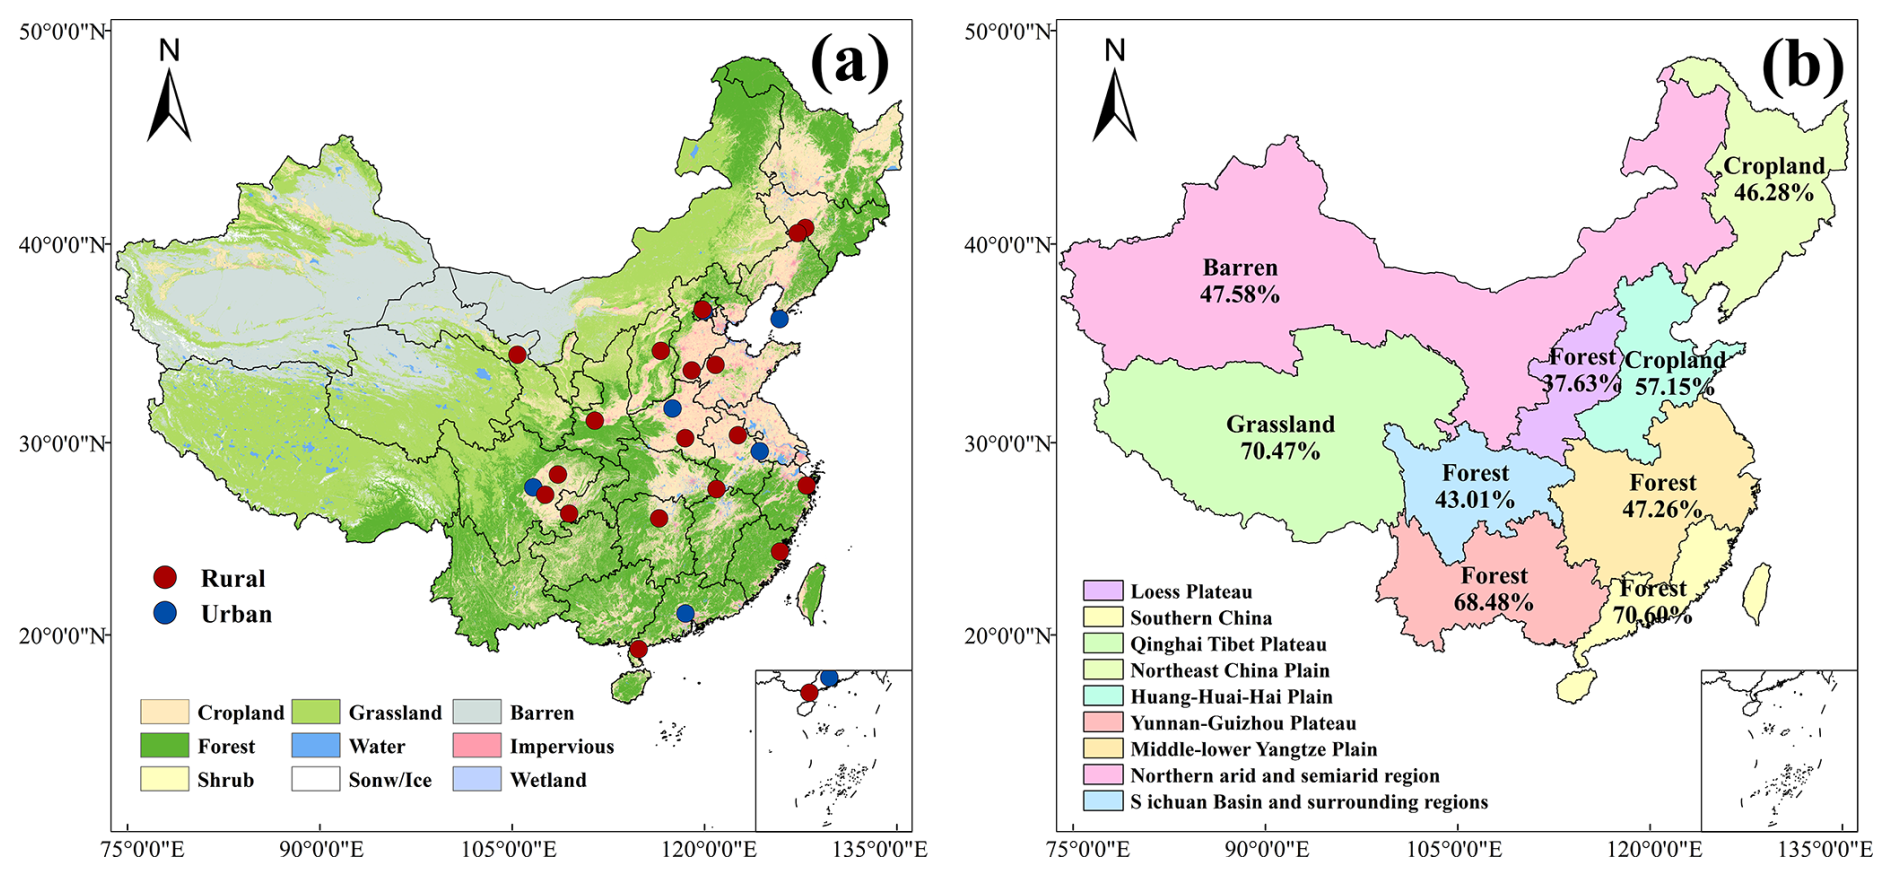
Figure 1(a) Spatial distribution of land cover types and NH3 monitoring sites in China in 2022, (b) classification of China into nine major agroecological zones based on agricultural practices and climatic conditions, note the percentage values represent area proportion of main land cover type (as list above) to total area in corresponding region.
NNDMN employs two monitoring methods: the long-term active denuder for long-term atmospheric sampling (DELTA) and the low-cost, passive Active Leading Passive High Absorption (ALPHA) sampler (Flechard et al., 2011). Monthly surface NH3 concentrations are primarily monitored using DELTA, with a few sites utilizing ALPHA. Xu et al. (2015) demonstrated that these two methods yield statistically consistent NH3 measurements. The observation periods for most sites range from 2010 to 2015, with detailed site information, including site names, locations, land cover types, and observation periods, provided in Table S1. Given that the satellite data selected for this study spans from 2013 to 2023, the analysis is limited to the period corresponding to the satellite data coverage. For sites where the observation period does not overlap with the satellite research period, and considering the typically low NH3 concentrations at background sites, this study selected 24 representative urban and rural stations for adjustment to improve the reliability of subsequent NH3 dry deposition estimates. The locations of monitoring sites and land cover types across China are also shown in Fig. 1a.
As noted above, the calculation of NH3 dry deposition flux depends on ground-level NH3 concentrations, although tens of site-based NH3 concentration observations are available, they cannot provide long term spatial-temporal resolved NH3 distributions especially in regions with high spatial heterogeneity within China. Therefore, we combined the advantage of ground-based NH3 observations of which can represent heights of 1–1.5 m, and satellite based spatial-temporal NH3 distributions. A linear relationship was constructed by comparing both datasets at the same location and period (Hu et al., 2017; Liu et al., 2024b), where the regression equation was used to adjust the lower boundary layer satellite mixing ratio observations to ground-level of 1–1.5 m.
2.3 Estimation of NH3 dry deposition
Dry deposition flux of atmospheric NH3 was estimated by multiplying the observed ground-level NH3 concentration with the modeled dry deposition velocity, following the equation:
Here, F denotes the dry deposition flux, C is the ground-level NH3 concentration (ppb) obtained from satellite retrievals and subsequently adjusted using ground-based measurements, and Vd is the dry deposition velocity (cm s−1), which is highly variable in space and time due to its sensitivity to land surface characteristics and meteorological conditions.
The most widely used approach to derive Vd is by model simulation. Here we first used the GEOS-Chem chemical transport model to simulate spatial-temporal varied Vd across China in 2015, with spatial resolution of 0.5° × 0.625° at hourly scale. However, considering (1) the spatial resolution of 0.5° × 0.625° will lead to aggregation errors when quantifying NH3 concentration and dry deposition from different land cover types within the same grid cell, and (2) the GEOS-Chem model requires substantial computational resources for one decade, and to further improve spatial resolution and computational efficiency (Fig. S2), a random forest machine learning algorithm was also applied to simulate dry deposition velocities from 2013 to 2023 based on output from GEOS-Chem model (see more details in Sect. 2.4), where the spatial resolution can improve to 0.25°, see more details in Sect. 2.4.
2.4 Simulation of NH3 dry deposition velocity (Vd)
2.4.1 Simulation of Vd by using GEOS-Chem model
We applied a hybrid modeling approach that combines the GEOS-Chem model with a random forest regression algorithm to estimate NH3 dry deposition velocities across China. GEOS-Chem is a global 3-D chemical transport model driven by meteorological inputs from NASA's Goddard Earth Observing System (GEOS), developed for simulating atmospheric composition and chemistry (Eastham et al., 2014). In this study, we used GEOS-Chem v13.3.1 to simulate NH3 dry deposition velocity over China for the year 2015. The model was driven by assimilated meteorological data from NASA's MERRA-2 reanalysis. Simulations were conducted on a nested horizontal grid of 0.5° × 0.625° covering the domain of 60—149.375° E and 11° S–54.5° N (Lu et al., 2025).
2.4.2 Simulation of Vd by using random forest machine learning algorithm
To improve the spatial resolution and model efficiency, we used the GEOS-Chem model based Vd simulations to train a random forest model that can predict dry deposition velocities under various meteorological and land surface conditions and with finer spatial resolution for the entire study period. This data-driven approach enables downscaling to a 0.25° resolution and extends predictions to the entire study period from 2013 to 2023 by using ERA5 reanalysis data.
The random forest (RF) algorithm is a widely adopted ensemble machine learning method that integrates multiple decision trees using the bagging strategy to capture complex nonlinear relationships between predictors and response variables. Overall, the RF model was used for two purposes, (1) for simulating dry deposition velocity (Vd) across 2013–2023, which is displayed in this section; and (2) to simulate NH3 concentration and identify key drivers of atmospheric NH3 changes as illustrated in Sect. 2.6.1. This RF model has been widely used in atmospheric environment assessments, nitrogen management in agriculture, and model validation studies, providing a robust framework for evaluating the ecological impacts of NH3 deposition (Asadi and McPhedran, 2021; Ai et al., 2024; Zhang et al., 2024). As shown in Fig. S2, the RF model was trained on multiple bootstrapped datasets and evaluated by aggregating outputs from multiple trees to obtain stable and accurate predictions. We selected five meteorological and hydrological variables from ERA5 reanalysis data as predictors: planetary boundary layer height, 10 m wind speed, volumetric soil water of surface layer, surface temperature, and total precipitation. The dataset was randomly split into a training set (60 %) and a validation set (40 %), the comparisons of Vd simulation by using GEOS-Chem and RF model are evaluated in Sect. 3.4.1.
2.5 Geographical division in China and other supporting data
To investigate spatial heterogeneity in interannual trends, China was divided into nine subregions based on the classification system from the Resource and Environmental Science Data Center (Fig. 1b). These regions include: Northeast China Plain, Yunnan-Guizhou Plateau, Northern Arid and Semi-Arid Region, Southern China, Sichuan Basin and Surrounding Areas, Middle-Lower Yangtze Plain, Qinghai-Tibet Plateau, Loess Plateau, and Huang-Huai-Hai Plain. Table S2 summarizes the dominant land cover types and their proportional areas within each subregion, and the provinces contained in each region are listed in Table S3, the details of main land cover categories and corresponding proportions in each region are also displayed in Fig. 1b and Sect. S2.
To clarify the characteristics of atmospheric NH3 concentrations and dry deposition flux across different land cover types, we utilized the 30 m resolution China annual Land Cover Dataset (CLCD) to classify surface types. The CLCD is the first annual land cover product for China derived from Landsat imagery, covering the period from 1985 to 2022 (Yang and Huang, 2021). The dataset categorizes land cover into nine classes: cropland, forest, shrubland, grassland, water bodies, snow/ice, barren land, impervious surfaces, and wetlands. Based on this classification, we conducted a systematic analysis of the spatial variation and temporal trends in NH3 concentrations and dry deposition fluxes across different land surface types.
In this study, multiple emission inventories of SO2, NOx, and NH3 were utilized to investigate the drivers behind changes in atmospheric NH3 concentrations and to assess potential future trends. The reason of using multiple emission inventories instead of only EDGAR is based on the fact that many previous studies have concluded large potential bias in using a single inventory caused by highly uncertain emission factors and activity data discrepancies (Crippa et al., 2019; Liu et al., 2024a). Therefore, we make full use of all available inventories from different data sources to provide robust evaluation of their emission changes. The emission inventories for SO2 and NOx include: (2) the Inversed Emission Inventory for Chinese Air Quality (CAQIEI, https://www.scidb.cn/en/detail?dataSetId=81cc0de9c68b4a4981e2f295ac612fbf, last access: 10 July 2024); (2) the Multi-resolution Emission Inventory for China (MEIC, http://meicmodel.org.cn/?page_id=560, last access: 13 October 2024); (3) the Air Benefit and Cost and Attainment Assessment System – Emission Inventory (ABaCAS, https://abacas-dss.com/abacasChinese/Default.aspx, last access: 5 August 2024); (4) the Community Emissions Data System (CEDS, https://github.com/JGCRI/CEDS/, last access: 26 May 2024); and (5) the Emissions Database for Global Atmospheric Research (EDGAR, https://edgar.jrc.ec.europa.eu/dataset_ap81#p3, last access: 29 July 2024). Due to the relatively late development of ammonia (NH3) research and the limited availability of comprehensive emission inventories, this study employed only two datasets – EDGAR v8.1 and MEIC – for NH3 emission analysis. In addition, the Dynamic Projection model for Emissions in China (DPEC, http://meicmodel.org.cn/?page_id=1917, last access: 8 May 2025), developed by Tsinghua University, was used to project future emission trends. Further details on all six emission inventories are provided in Sect. S3 and Tables S4–S5. Note the emissions from EDGAR will be used in this study to simulate spatial-temporal patterns of NH3 concentration, which does not include biomass burning. However, we also extracted emissions from biomass burning from the MEIC inventory for 2013–2020, the total emissions of SO2, NOx, and NH3 during this period in China, as well as the average annual emissions and their proportions from biomass burning were displayed in Table S6. And the contribution of biomass burning to these three gases was less than 3 %, indicating relatively small influence of biomass burning in simulating NH3 concentrations.
2.6 Quantification of influencing factors to annual trend of NH3 concentration and dry deposition
2.6.1 Simulation of ground NH3 concentration by using random forest model
To assess the contributions of meteorological conditions and emissions to NH3 concentrations over the study period, we constructed another RF model to simulate ground-level NH3 concentration. Here the CrIS-retrieved NH3 concentrations for 2022 were used to train this RF model considering the most updated emission inventory is available for 2022, and input parameters included five ERA5-derived meteorological and hydrological variables (ABL height, wind speed, soil moisture, temperature, and precipitation) and three emission datasets from the EDGAR inventory (SO2, NOx, and NH3 emissions). To isolate the effects of emissions and meteorological variables, we conducted a few sensitivity experiments using the 2022-trained model as the baseline. By holding emissions constant or regressing meteorological data back to 2013 (and vice versa), we simulated NH3 concentrations attributable solely to changes in meteorology or emissions (for all or each of NH3, SO2 and NOx). The contributions of each factor were then normalized to calculate the percentage influence on NH3 concentration changes. Note previous modeling results (i.e. PM2.5) always suffers from bias in 1/3 of modeling days and it's better to choose days with good predictions. And in this study for NH3 observations, they were measured by passive sampler, representing averages of one week instead of hourly or daily scales. Therefore, to avoid the random errors from observations and simulations, monthly average was conducted for NH3 concentration for machine learning.
2.6.2 Quantification of influencing factors to annual trends of NH3 concentration
We further used the logarithmic differentiation method to decompose the relative contributions of NH3 concentration and dry deposition velocity to the overall change in dry deposition flux. The logarithmic form allows the multiplicative relationship to be transformed into an additive form, making it suitable for quantifying variable impacts, particularly when concentration and velocity change in opposite directions. The decomposition is based on the following:
The respective contributions of concentration (Δln C) and deposition velocity (Δln Vd) are calculated as:
where Δln denotes the change in the natural logarithm, ηC and represent relative contributions from NH3 concentration and dry deposition velocity to dry deposition of F, respectively. These contributions were normalized to provide intuitive percentage values. This method is particularly effective in quantifying dynamic and opposing changes and does not assume linear relationship, offering a more robust analysis than traditional linear regression. Additionally, the Mann-Kendall (MK) trend test was employed to statistically evaluate the temporal trends in NH3 concentrations over the study period (Sect. S1).
3.1 Spatial patterns of near surface satellite NH3 concentration and its trend analysis
Using CrIS satellite-derived near surface NH3 concentrations (representing average between ground to ∼ 1 km) from 2013 to 2023, a high-resolution (0.1° × 0.1°) monthly averaged NH3 concentration dataset across China over an 11-year period was generated. The observation from the near surface layer can reflect the impact of human activities and natural source emissions on the near-Earth atmospheric environment. We first displayed the annual averaged spatial patterns and its trend from 2013–2023 at both the national scale and within specific subregions, followed by an analysis of seasonal variations (Figs. 2a–j and S3–S7). The results of the annual average indicate that the North China Plain (also known as the Huang-Huai-Hai Plain) consistently exhibited the highest NH3 concentrations (> 10 ppb) during the study period (Fig. 2a). This region is recognized as one of China's most intensive agricultural zones, accounting for approximately 25 % of China's total arable land area and grain production (Song, 2024), and is thus subject to frequent fertilizer application, contributing significantly to elevated NH3 emissions and corresponding concentration.
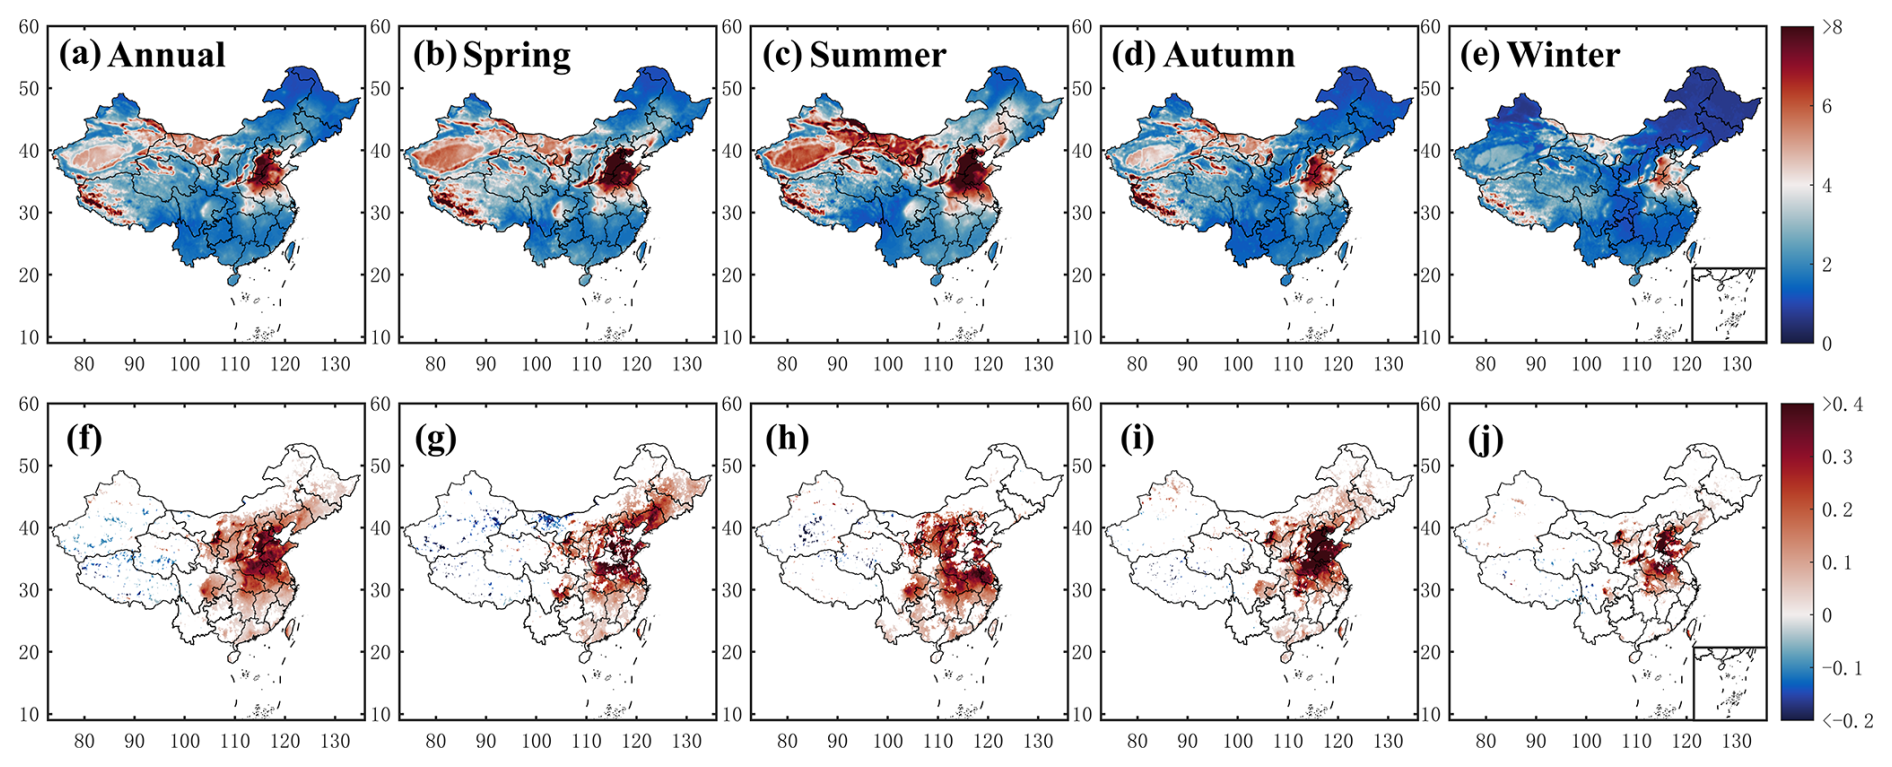
Figure 2Spatial distribution of annual and seasonal averages of column-averaged NH3 concentration from 2013 to 2023, (a) annual averages, (b) average in spring, (c) average in summer, (d) average in autumn, (e) average in winter; and trend of corresponding column-averaged NH3 concentration from 2013 to 2023 for (f) annual averages, (g) average in spring, (h) average in summer, (i) average in autumn, (j) average in winter (Units: ppb for concentration; ppb yr−1 for trend), note the white areas in the figure indicate trends that were not statistically significant at the 0.05 level.
The secondary NH3 concentration hotspots were observed in the Guanzhong Plain in Shaanxi Province and the southeastern margin of the Tibetan Plateau. The Guanzhong Plain region is another major agricultural production area in western China, with cultivated land accounting for 49.4 % of Shaanxi Province's total arable area. Intensive fertilizer application and related activities are the main sources of NH3 emissions in this region. The elevated NH3 concentrations in southeastern Tibet are likely attributed to emissions from extensive livestock farming, particularly yak and sheep husbandry. In addition to these agricultural and pastoral regions, relatively high NH3 concentrations were also observed in arid zones such as Xinjiang and Inner Mongolia. However, these apparent NH3 enhancements are likely artifacts of satellite retrievals potentially influenced by surface radiative properties or dust. Higher accuracy is typically associated with higher thermal contrast; conversely, lower thermal contrast would lead to higher uncertainties in NH3 retrievals, leading to overestimation of NH3 concentrations due to limitations in retrieval algorithms and thermal contrast biases (Liu et al., 2020b).
To further explore spatial patterns in temporal change, the pixel-wise trend analysis of annual NH3 concentrations was also conducted (Fig. 2b). Significant positive trends (> 0.4 ppb yr−1) were found in the central and eastern parts of China, particularly in major agricultural zones with intensive crop fertilization. These results are consistent with findings by Warner et al. (2017), who reported a substantial increase in NH3 concentrations over eastern China using AIRS data from 2002 to 2016. Our study extends this trend through 2023, indicating that NH3 concentrations in these regions have continued to rise significantly in recent years. In contrast, western China generally showed stable or declining trends. Although northern Xinjiang exhibited moderate NH3 increases in areas where the trend passed significance testing, other parts of the west demonstrated declining trends. This pattern may be associated with grassland restructuring policies implemented by the Chinese government to reduce overgrazing and restore degraded ecosystems. These measures have significantly alleviated the ecological pressure on grasslands and fostered the transformation and upgrading of grassland animal husbandry, as well as environmental optimization. Therefore, with policy support, they contribute to reducing environmental pollution from animal husbandry in grassland areas, thereby lowering NH3 emissions.
The spatial patterns of NH3 concentration increases correspond closely to regions of high population density and agricultural land cover types, such as the North China Plain and Sichuan Basin. These areas are also hotspots for reductions in SO2 and NOx emissions due to stringent air pollution control measures as displayed in Figs. S8–S9. The decline in acid gases may reduce atmospheric neutralization capacity, thereby enhancing the lifetime and apparent abundance of NH3 in the atmosphere (Dong et al., 2023), contributing to the pronounced upward trends observed in these regions.
We also displayed the seasonal variations and its trend during 2013–2023, clear seasonal differences in NH3 spatial distribution were observed during the whole study period (Figs. 2c–j and S4–S7). In spring, the NH3 distribution resembled the annual pattern but exhibited concentrations approximately 13.9 % higher. The Huang-Huai-Hai Plain showed especially concentrated and elevated values, likely due to extensive fertilizer use during spring planting. In contrast, the northwest exhibited little seasonal deviation from annual averages, as emissions are more influenced by pastoral activities than by seasonal patterns of fertilization in agricultural regions. In autumn, NH3 levels declined sharply, despite localized fertilizer application, primarily due to reduced emissions and cooler temperatures. High concentrations remained in Shandong Province and adjacent regions. Winter concentrations were the lowest, reflecting widespread agricultural dormancy and low temperatures, although lower thermal contrast and reduced NH3 signal strength increase retrieval uncertainties.
In summer, NH3 concentrations peaked across China, with higher concentration regions expanding westward into semi-arid areas. This peak seasonality contrasts with trends in Europe and the U.S., where springtime peak is also more typical. In China, summer fertilization is applied for the key agricultural crops as rice paddy, maize, corn and wheat – often involving both mineral and organic fertilizers – contributes to the observed summer peak (Paulot et al., 2014; Luo et al., 2025). Elevated temperatures further enhance volatilization from manure of agricultural area and urban waste in cities, intensifying atmospheric NH3 concentration. Although urbanization has increased over the past decade, many system-scale farms continue to be used for agricultural production. As reported by Liu et al. (2024d) that temperature increases accounted for up to 20.0 % of urban NH3 increases between 2008 and 2019. Notably, elevated NH3 levels were also observed along the Yangtze River basin, corresponding to fertilizer use in rice paddies.
The spatial distributions of the 11-years trend analyses for each season are also displayed (Fig. 2d, f, h and j), they show significant increases across eastern China, particularly during summer and autumn. Overall, these results indicate the annual trend of surface NH3 concentration occurred throughout each season. Winter trends were the weakest in magnitude and spatial extent. Consistent with annual patterns, the North China Plain and Sichuan Basin showed the most pronounced increases. There was no significant change in trend in most parts of western China. There was a slight increasing trend in summer and autumn in northern Xinjiang. Other regions exhibiting a significant trend were decreasing.
3.2 Temporal variation of near surface satellite NH3 concentrations for different regions
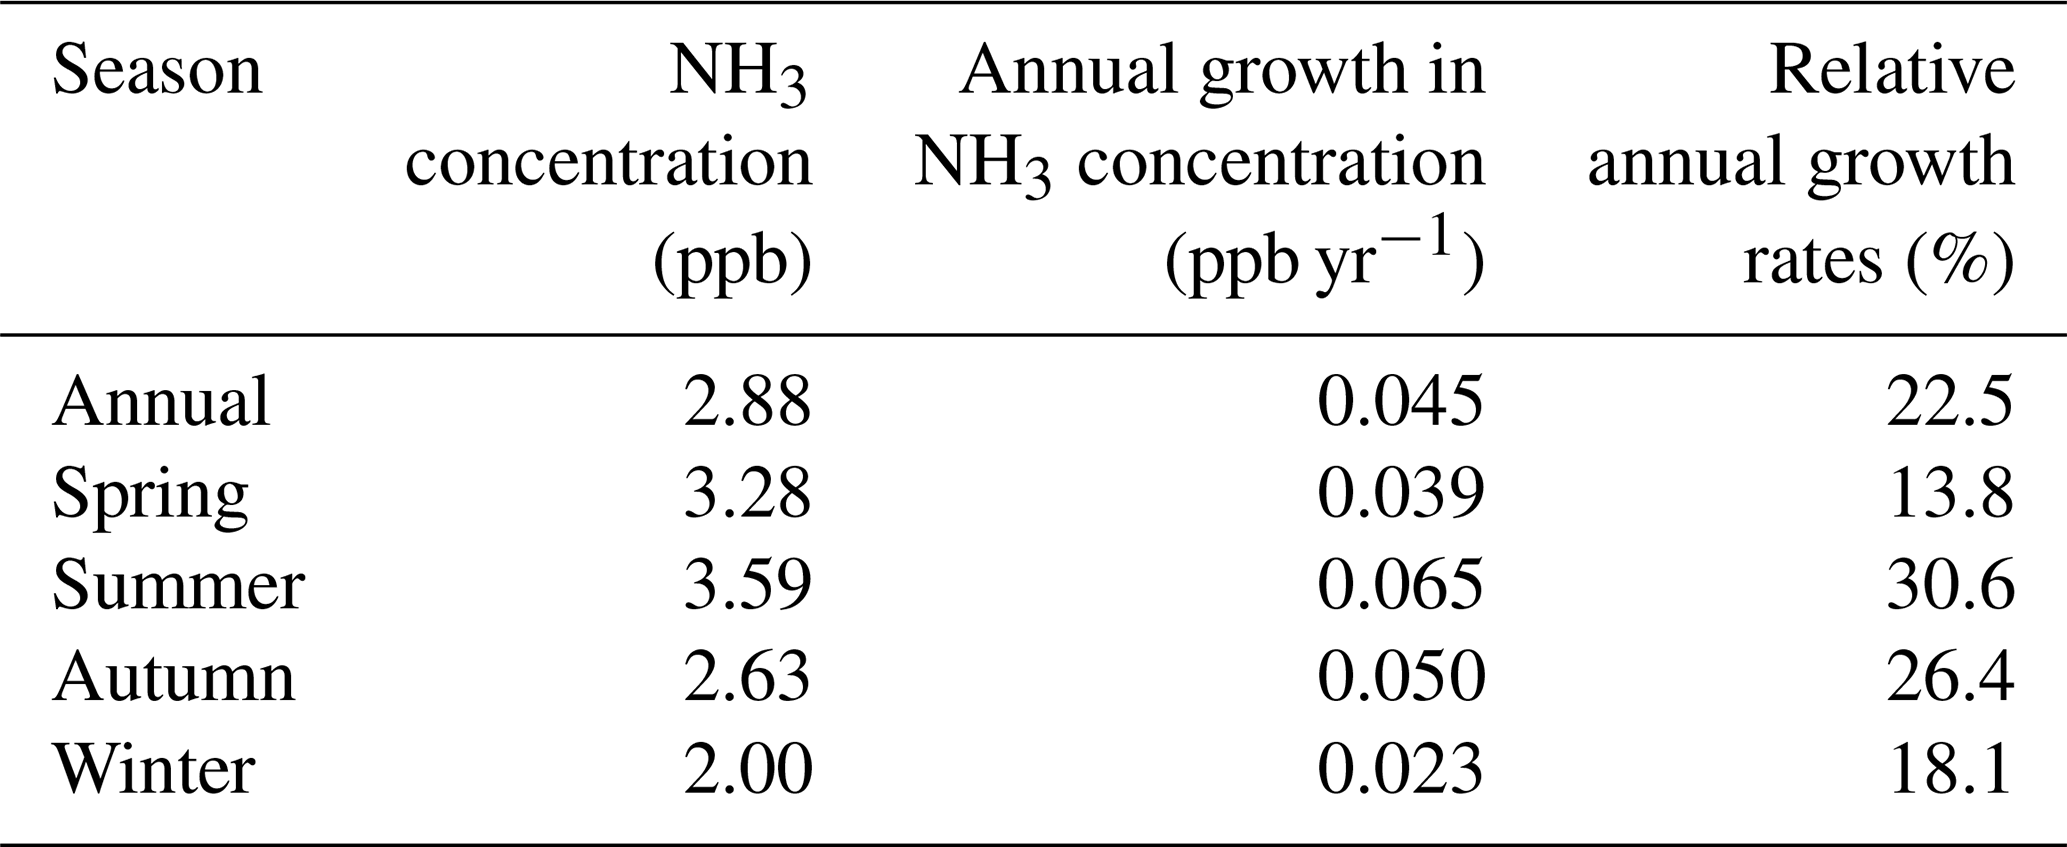
In this section, we continue to present the spatiotemporal near-surface NH3 concentrations derived from CrIS lower ABL mixing ratio values. The temporal variation of annual NH3 concentrations and across different seasons from 2013 to 2023 is displayed in Fig. 3a. Over this period, the annual mean NH3 concentration in China increased by 22.5 %, with seasonal increases of 13.8 % in spring, 30.6 % in summer, 26.4 % in autumn, and 18.1 % in winter, respectively. Among these seasons, summer exhibited the highest mean concentration (3.60 ppb), followed by spring (3.28 ppb), with annual, autumn, and winter means recorded at 2.88, 2.63, and 2.00 ppb, respectively (Table 1). The Mann-Kendall trend test results (Table 1) indicated statistically significant upward trends for spring, summer, autumn, and annual mean concentrations (p < 0.05). Although winter showed a positive trend (Z > 0), it did not reach statistical significance. The seasonal rates of increase, in descending order, were: summer (0.065 ppb yr−1), autumn (0.050 ppb yr−1), annual (0.045 ppb yr−1), spring (0.039 ppb yr−1), and winter (0.023 ppb yr−1). The most pronounced increase during summer from 2013 to 2023 also aligns with previous findings by Liu et al. (2018), which only analyze the North China Plain region from 2008 to 2016. However, their trend is slightly lower than our results, the comparisons reveal a significant increase in NH3 concentrations after 2016, which could potentially be attributed to enhanced NH3 emissions, favorable climatic conditions, or a decrease in NOx SO2 emissions, as discussed and quantified below.
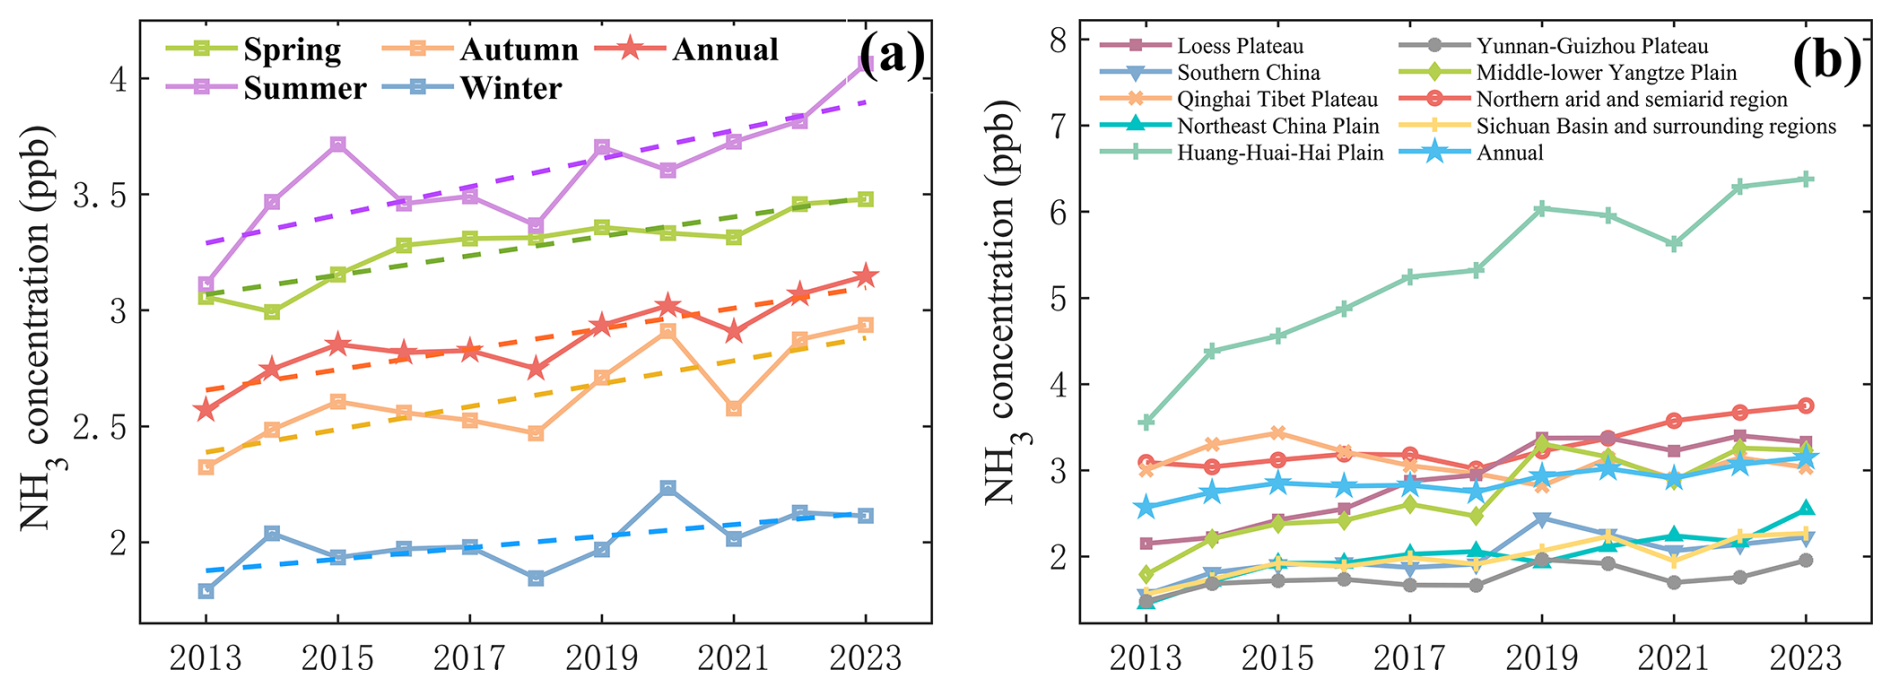
Figure 3(a) Seasonal and (b) regional variations in CrIS satellite-based column-averaged (from ground to 1 km) NH3 concentrations across China from 2013 to 2023 (Unit: ppb).
Table 1Annual and seasonal average NH3 concentrations and their annual mean increment and relative growth rate during entire study period.
The increasing summer trend of atmospheric NH3 is likely related to global warming in study period (Fig. S10). The summer temperatures in China rose by 0.3 °C from 2013 to 2023. As reported in our previous study on the U.S. Corn Belt, NH3 emissions are projected to increase by a factor of 2.5 for every 10 °C rise in summer temperatures (Hu et al., 2020, 2021). Other studies also showed that over 40 % of fertilizer application and approximately 25 % of livestock emissions occur during the summer months (Xu et al., 2015; Kang et al., 2016), which enhances NH3 volatilization from ground to atmosphere. The slower rate of increase in spring may be associated with China's national fertilizer reduction policies, such as the “Action Plan for Fertilizer Reduction by 2025”. Fertilizer use increased until peaking in 2015 and subsequently declined for eight consecutive years, resulting in a 15.1 % reduction from 2013 to 2023, with the national application totaling 50.22 million t in 2023 (Fig. S11).
The decrease in chemical fertilizer use, combined with the adoption of organic fertilizers, has contributed to a gradual slowdown in the rise of NH3 concentrations. By 2024, the nitrogen use efficiency (NUE) for rice, maize, and wheat reached 42.6 %, helping to reduce fertilizer input without compromising yields and mitigating NH3 emissions and nutrient pollution. Zhan et al. (2021) identified improving NUE as the most effective and cost-efficient strategy for NH3 mitigation in agriculture, a finding supported by cost-benefit assessments. Autumn also showed a substantial increase in NH3 concentrations, second only to summer. Current emission reduction efforts have primarily focused on spring and summer, reflecting crop planting cycles, while autumn has often been overlooked, contributing to this seasonal gap in mitigation. These findings highlight the need for seasonally and crop-specific emission control strategies in future NH3 management efforts.
Table 2Average NH3 concentration per unit area and annual mean increment and corrected NH3 concentration in the nine major agricultural regions of China from 2013 to 2023.
Significant spatial heterogeneity was observed in the interannual variation of NH3 concentrations across different regions. Figure 3b illustrates long-term trends in NH3 concentrations for nine subregions. Most regions exhibited increasing trends, with the Huang-Huai-Hai Plain standing out for its consistently elevated concentrations – approximately twice as high as the national average (Table 2). This region is China's primary agricultural zone, characterized by high population density and intensive agricultural activity, both of which contribute to substantial NH3 emissions. Additionally, it has been a focal area for SO2 and NOx emission reductions, and the combined effects of high emissions and reduced atmospheric neutralization capacity have led to persistent NH3 accumulation.
The trend analysis further revealed statistically significant upward trends in the Huang-Huai-Hai Plain, the Northern Arid and Semi-Arid Region, the Loess Plateau, the Middle-Lower Yangtze Plain, South China, the Northeast China Plain, and the Sichuan Basin and its surrounding regions. We used compound annual growth rate (CAGR) method to calculate the annual growth rate of NH3 concentration across the country and in the Huang-Huai-Hai Plain region. The Huang-Huai-Hai Plain showed the steepest increase, with an average annual rise of 0.24 ppb, corresponding to a 6.0 % per year growth rate – 3 times the national average of 2.0 % (Manisha et al., 2023). The primary driver of this sharp increase is the marked reduction in atmospheric SO2, which has disrupted the NH3-acid gas neutralization balance (Xu et al., 2019a). The Loess Plateau ranked second, with an average increase of 0.14 ppb per year. In contrast, the Yunnan-Guizhou Plateau exhibited a mild, non-significant increase, with relatively stable concentrations. The Tibetan Plateau showed a slight downward trend, which also lacked statistical significance (p > 0.05), indicating a relatively stable NH3 regime in this high-altitude, low-emission region.
3.3 Comparison between satellite and ground-based NH3 observations and adjustment from surface level to ground-level NH3 concentration
As stated in Sect. 2.1, although satellite-based observations provide extensive spatial coverage and long-term data for atmospheric NH3 studies, they have limited vertical profile resolution of mixing ratio values near the surface that often cannot capture the reported fine scale vertical gradient in the lower ABL created from the reactive nature of ammonia and its role in chemical transformation processes (Hu et al., 2020, 2021; Griffis et al., 2019). Further, the dry deposition of NH3 is the product of ground-level (usually calculated by site-based observations of 1–1.5 m height) NH3 concentration and dry deposition velocity. Therefore, to enable accurate estimation of NH3 dry deposition, we conducted a comparative analysis between satellite-derived and multiple years of observations at 24 ground-based NH3 sites, and their relationship will be used to adjust the lower vertical resolution satellite observations to ground-based surface observations.
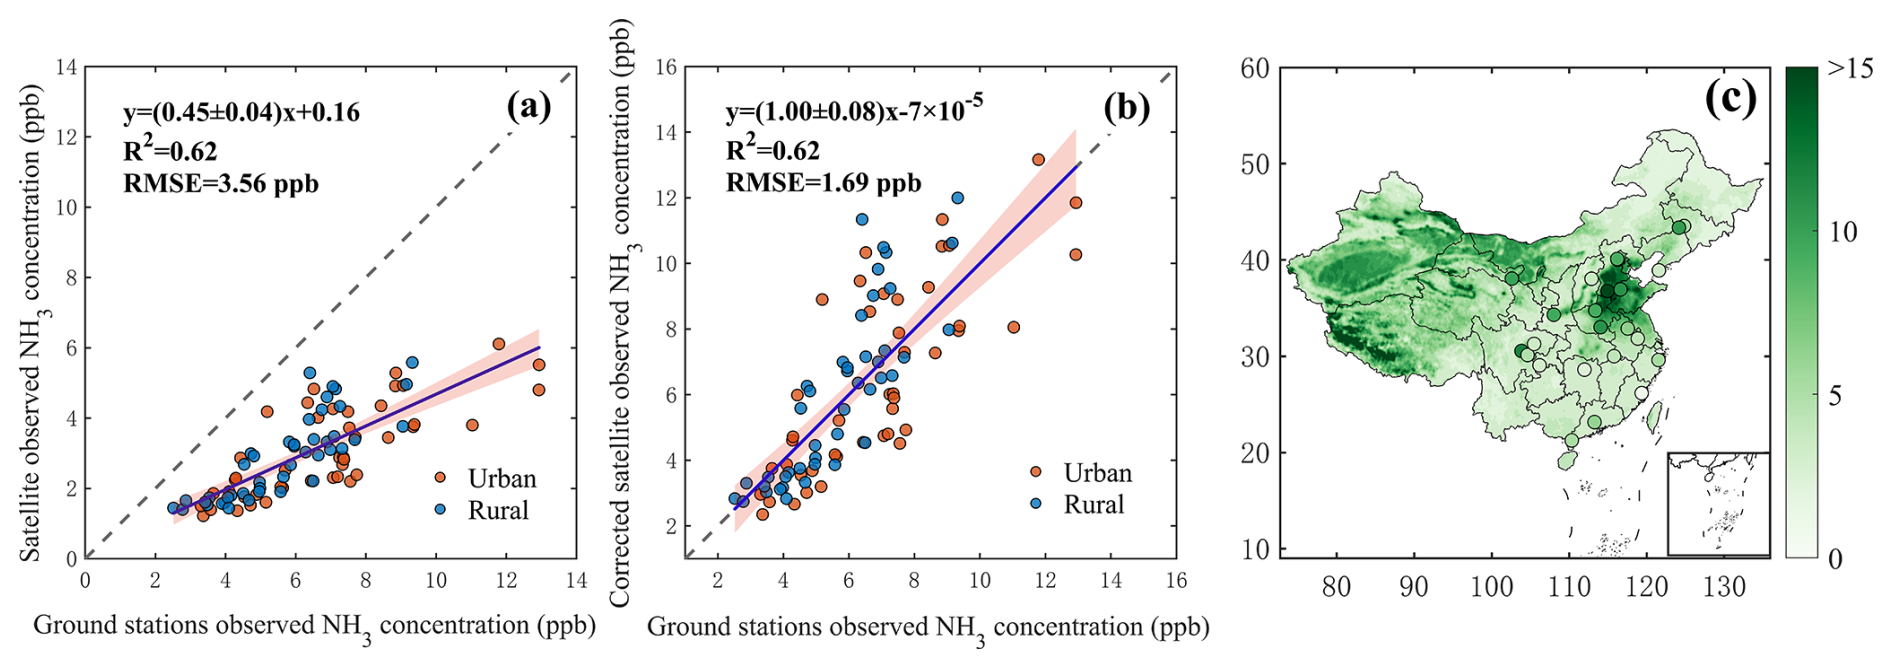
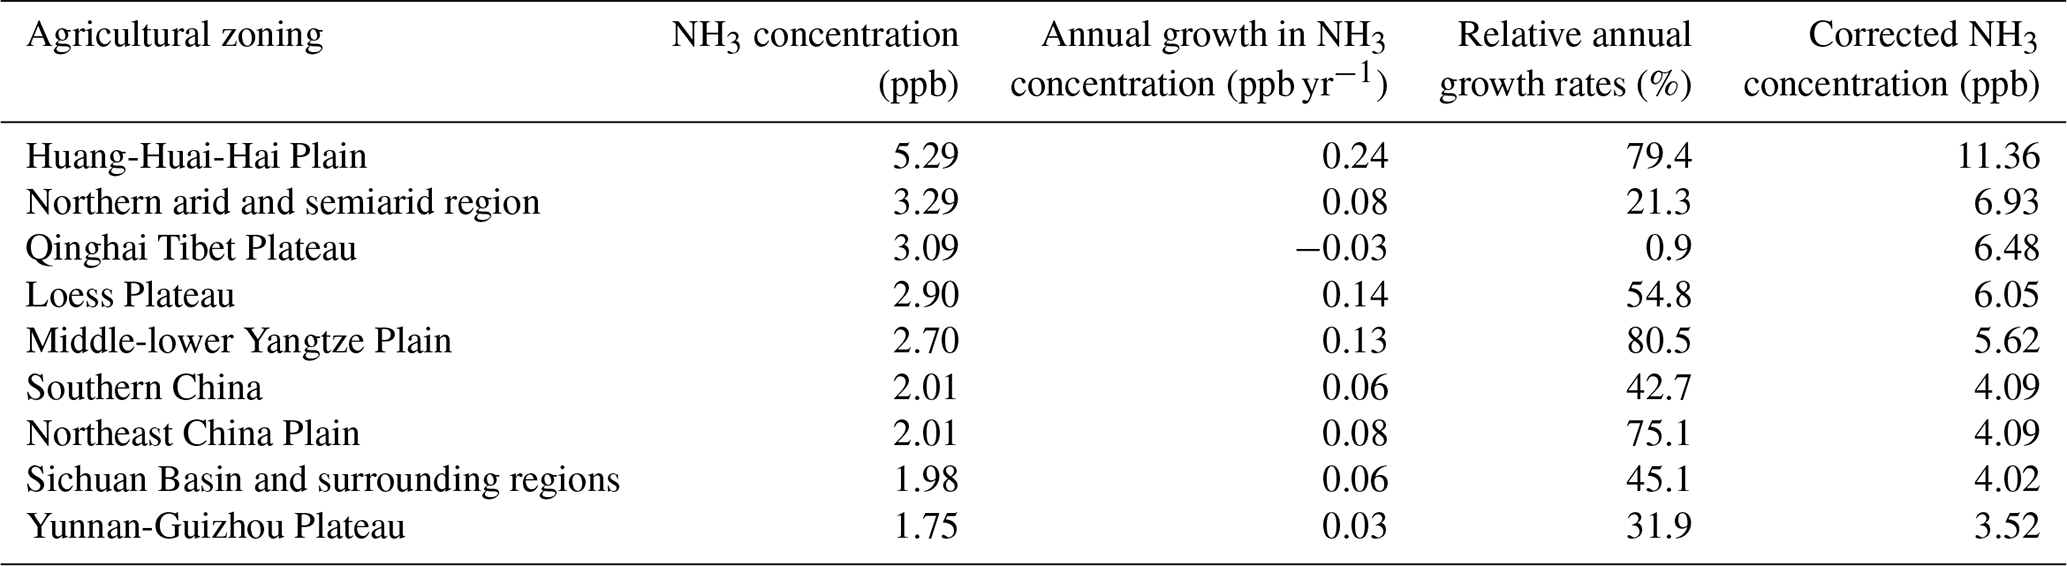
Figure 4(a) Comparison between CrIS satellite-based column average (from ground to ∼ 1 km) NH3 concentration and ground site based (∼ 1.5 m) NH3 observations before adjustment; (b) comparison between CrIS satellite-based column average NH3 concentration and ground site based NH3 observations after adjustment to ground-level; (c) spatial distribution of adjusted satellite-based NH3 concentration and comparisons with ground site based NH3 concentrations in 2015 (Unit: ppb), note the adjustment from CrIS satellite-based column average (ground to ∼ 1 km) to ground-level (∼ 1.5 m) is conducted by using the linear regression equation derived from panel (a), each scatter plot represents monthly averages of all available observations for either urban or rural site.
As shown in Fig. 4a, the scatter plots of monthly averaged site-based ground-level NH3 concentrations and corresponding satellite-based observations exhibit a strong correlation with a coefficient of determination (R2) of 0.62 and a root mean square error (RMSE) of 3.56 ppb. Note, to minimize the random error, each plot in Fig. 4a represents averages of all observations at urban or rural sites during each overlap month. Overall, it illustrates that the ground-level measurements are, on average, approximately twice as high as those retrieved by satellite. This discrepancy can be attributed to the vertical gradient of NH3 in the atmosphere: ground-based sensors typically local point source observations operate at heights of 1–1.5 m, while satellite observations are regional (14 km) with low vertical resolution (∼ 1 km or more), which is shown from the averaging kernels (Shephard et al., 2011, 2020). Many pioneer studies have demonstrated that when the land surface acts as an NH3 source, its vertical distribution decreases logarithmically with height (Hu et al., 2020, 2021; Shephard et al., 2011, 2020). For example, our previous studies of tall tower observations in the United States reported an NH3 mixing ratio gradient of −0.27 ppb per 100 m, with modeled gradients ranging from −0.21 to −0.84 ppb per 100 m (Hu et al., 2020, 2021; Griffis et al., 2019), showing good agreement between observations and simulations of the vertical profiles within boundary layer. When using the gradient of above reported values, the average of 0–1000 m column NH3 concentration should be around 1–4 ppb lower than ground-level, this pronounced vertical gradient is a major reason for the systematic underestimation of NH3 by satellites when compared with ground-level observations.
To address this inconsistency, we used the regression relationship derived from Fig. 4a to adjust the satellite retrievals. After correction, a new regression (Fig. 4b) shows a nearly 1 : 1 agreement between satellite and ground-based measurements, with the RMSE reduced from 3.56 to 1.69 ppb. The purpose of the linear regression equation is to adjust the column-averaged NH3 concentration to the ground-level at 1.5 m, as described in Sect. 2.2. The approach we used is applying an additive shift (bias correction), where R2 remain almost the same (Fig. 4a–b), it's also based on “K-theory” (gradient diffusion theory) with the well-mixed assumption in the ABL. This method assumes that transport flux can be represented analogously to molecular diffusion, where fluxes are proportional to the mean gradient of the transported quantity. This adjustment enables the derivation of NH3 dry deposition, which can then be compared with global observations. The reason that the R2 value remained unchanged is that the same equation, , was applied to all scatter plots. This theoretically affects only the RMSE and does not influence the R2 value. The reduction in RMSE further indicates that this approach effectively adjusts the column-averaged NH3 concentration to the ground-level at 1.5 m. The conversion is given by , where y represents the CrIS satellite-based column-averaged NH3 concentration (from ground to 1 km), and x denotes the NH3 concentration after adjustment to 1.5 m. This approach is conceptually similar to using a simple multiplicative (or additive) conversion factor. It is important to acknowledge that spatial-temporal uncertainties or potential systematic biases may exist in the relationship between ground-based and satellite-derived NH3 observations across different regions and under varying thermal contrast and boundary-layer conditions. As demonstrated in the scatter plots of Fig. 4a–b, which exhibit significant variability. Nevertheless, the regression slope and associated uncertainty were 0.45 ± 0.04, indicating that the potential systematic biases mentioned above could result in an error of approximately 9 % when deriving ground-level NH3 concentrations and dry deposition rates. This error was calculated by dividing the uncertainty extent (0.04) by the regression slope (0.45). These uncertainties can be mitigated by increasing the number of ground-based NH3 observations in diverse regions in future studies.
To further assess the adjustment effectiveness, we selected the year 2015 – when both satellite and ground data are available – for analysis. As shown in Fig. 4c, the adjusted satellite-based NH3 concentrations closely match ground observations across almost all sites, confirming the reliability of using the adjustment approach. This adjustment function was then applied to the full 2013–2023 satellite dataset to improve the reliability of NH3 dry deposition estimates. Table 2 illustrated the adjusted average of ground-level NH3 concentrations across different regions, with the Huang-Huai-Hai Plain exhibiting the highest value of 11.36 ppb. This was followed by the Northern Arid and Semi-Arid Region (6.93 ppb), the Qinghai-Tibet Plateau (6.48 ppb), and the Loess Plateau (6.05 ppb). Although the height-corrected NH3 concentrations in these regions ranked immediately after the Huang-Huai-Hai Plain, their values were approximately two times lower than those observed in the Huang-Huai-Hai Plain.
3.4 Estimation of spatiotemporal variations of NH3 dry deposition across China
3.4.1 Simulation of spatiotemporal dry deposition velocities
As illustrated in Method Sect. 2.4, to estimate NH3 dry deposition flux across China, we first used the GEOS-Chem model to simulate NH3 dry deposition velocities for the year 2015 (Fig. 5a). Considering the high computational cost, limited temporal flexibility and spatial resolution of the GEOS-Chem model, we adopted a hybrid modeling approach by training a random forest (RF) machine learning model on the GEOS-Chem model-based simulation results. This approach allowed us to extend the simulation to the full 2013–2023 period, while improving both computational efficiency and spatial resolution from 0.5° × 0.625° to 0.25° × 0.25°.
Figure 5NH3 dry deposition velocity in China in 2015: (a) GEOS-Chem simulation; (b) random forest simulation (includes both validation set and training set); (c) model difference (Unit: cm s−1).
The resulting RF-predicted dry deposition velocities for 2015 show high spatial agreement with the GEOS-Chem outputs (Figs. 5b and S12). Both models identify southern China as a hotspot for dry deposition velocity, likely due to the region's warm and humid conditions that facilitate gaseous NH3 deposited onto ground surface. Additionally, southern China is a major rice-producing region where surface resistance in paddy fields is lower than in dryland fields, further enhancing dry deposition rates. Figure 5c shows the differences between the two model outputs, with over 99 % of grid cells having discrepancies less than 0.1 cm s−1, indicating strong consistency and validating the reliability of the RF model for long-term simulations. Using this trained model, we further simulated NH3 dry deposition velocities from 2013 to 2023 at monthly averages.
3.4.2 The spatiotemporal variations of NH3 dry deposition in China
With the adjusted spatiotemporal ground-level NH3 concentrations and simulated deposition velocities from 2013 to 2023, we derived the monthly grid-level NH3 dry deposition flux for China. These were further aggregated to estimate average NH3 dry deposition flux and total deposition over different land cover types (Figs. 6 and S13). Figure 6a illustrates the spatial distribution of NH3 dry deposition flux average from 2013 to 2023. Distinct spatial differences are evident, where the eastern coastal regions exhibited significantly higher deposition flux than inland areas, with values higher than 1.8 g NH3 m−2 yr−1. Notably, the Huang-Huai-Hai Plain and the southwestern region of the Qinghai-Tibet Plateau emerged as prominent hotspots of NH3 dry deposition, highlighting the substantial impact of intensive agricultural activities and industrial emissions. Elevated deposition rates were also observed in the southern Tibetan Plateau, driven by locally high NH3 concentrations.
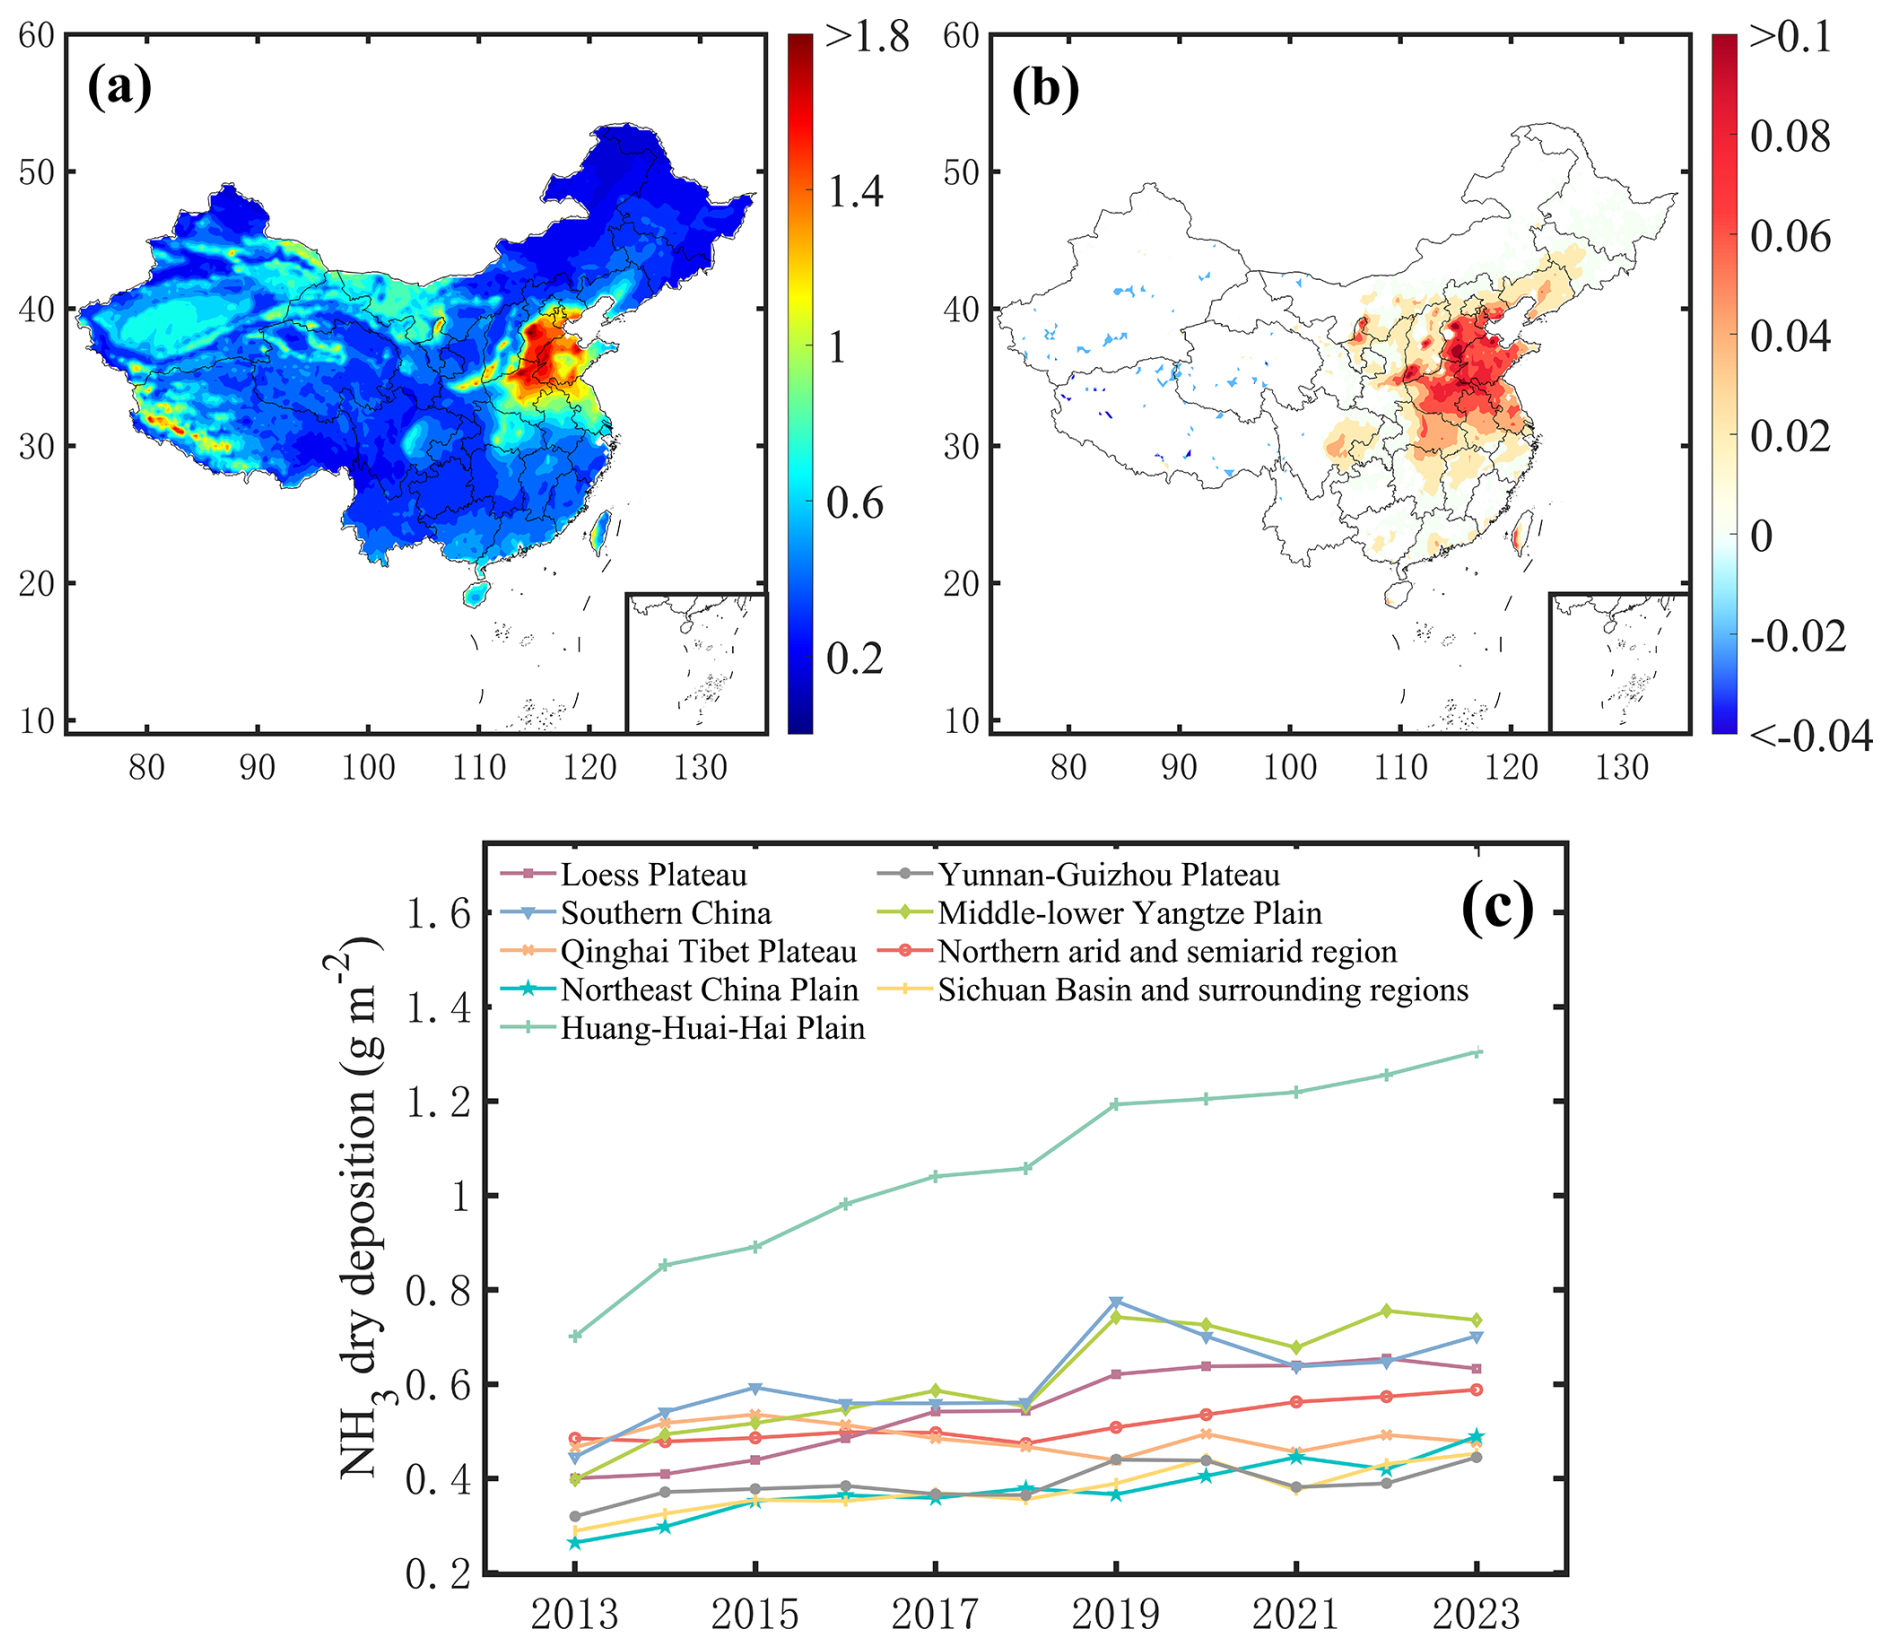
Figure 6Spatial and regional trends in annual mean NH3 dry deposition in China from 2013 to 2023: (a) spatial distribution of annual mean NH3 dry deposition (Unit: g m−2); (b) temporal trend of NH3 dry deposition (Unit: g m−2 yr−1); (c) interannual variation of NH3 dry deposition across different regions (Unit: g m−2).
A trend analysis of dry deposition over the 11-year period (Fig. 6b) shows statistically significant increases in deposition flux in eastern coastal areas (> 0.1 g m−2 yr−1), likely reflecting rising NH3 concentrations in these regions. In contrast, western China shows minimal change, with some areas even exhibiting slight declines. Unlike the NH3 concentration trends, there is no region in western China that displayed a statistically significant increase in dry deposition flux, which was caused by the trend of Vd in this region, emphasizing the spatial decoupling between emission intensity and deposition patterns in less industrialized regions.
Table 3Average NH3 dry deposition per unit area and annual mean increment in the nine major agricultural regions of China from 2013 to 2023.
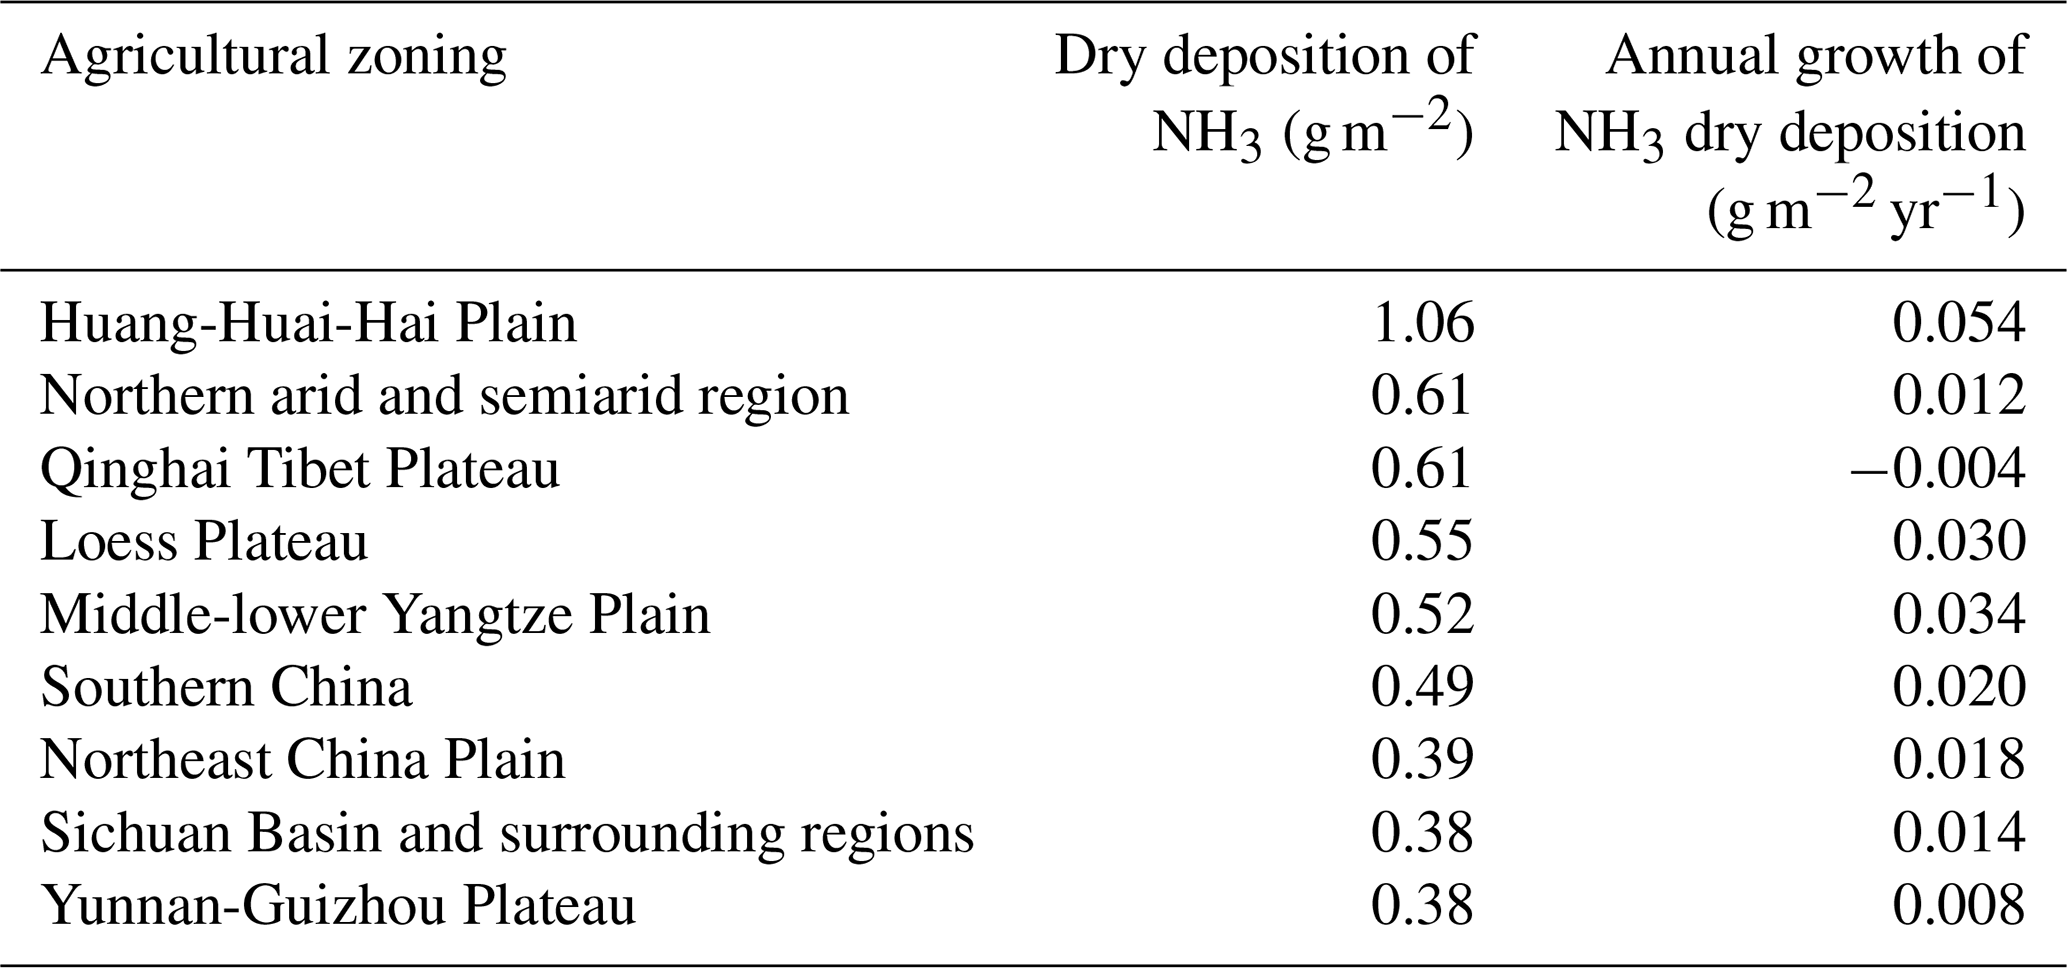
The interannual variation of NH3 dry deposition also exhibited significant spatial heterogeneity at the regional scale (Fig. 6c and Table 3). The Huang-Huai-Hai Plain, characterized by persistently high NH3 concentrations, recorded the highest area-specific dry deposition flux, reaching 1.06 g m−2 yr−1 – approximately twice the levels observed in other regions. MK trend analysis indicated a significant increasing trend in dry deposition flux across all regions except the Tibetan Plateau, where a weak downward trend was observed but was not statistically significant. The most pronounced increase was found in the Huang-Huai-Hai Plain, with an average annual increment of 0.05 g m−2 yr−1, followed by the middle and lower reaches of the Yangtze River, at 0.03 g m−2 yr−1, detailed numbers are displayed in Table 3.
3.4.3 Comparisons of ground-level NH3 concentration, dry deposition velocity and flux in different land cover types
In addition to meteorological factors, land cover types play a pivotal role in regulating dry deposition processes. In this section, we annually extracted and compared ground-level NH3 concentrations, dry deposition velocities, and dry deposition fluxes across different land cover categories. The analysis focused on four representative land-use types – urban, cropland, forest, and grassland – selected based on their distinct NH3 emission characteristics (Fig. 7; Table S7). The average NH3 concentrations, ranked from highest to lowest, were: urban (8.76 ppb), cropland (6.27 ppb), national average (6.01 ppb), grassland (5.72 ppb), and forest (3.76 ppb) (Fig. 7a). Urban areas exhibited both the highest concentrations and the largest interannual variability, with a statistically significant upward trend (p < 0.05, Z > 1.96), increasing at an average rate of 0.39 ppb yr−1. This trend is primarily attributed to anthropogenic sources such as vehicular emissions, as well as the urban heat island effect, which raises urban temperatures by 1–3 °C – and occasionally by over 10 °C – relative to surrounding rural areas (Santamouris, 2013; Cao et al., 2016; Chang et al., 2021). These elevated temperatures, further amplified by global warming, facilitate enhanced NH3 volatilization within cities.
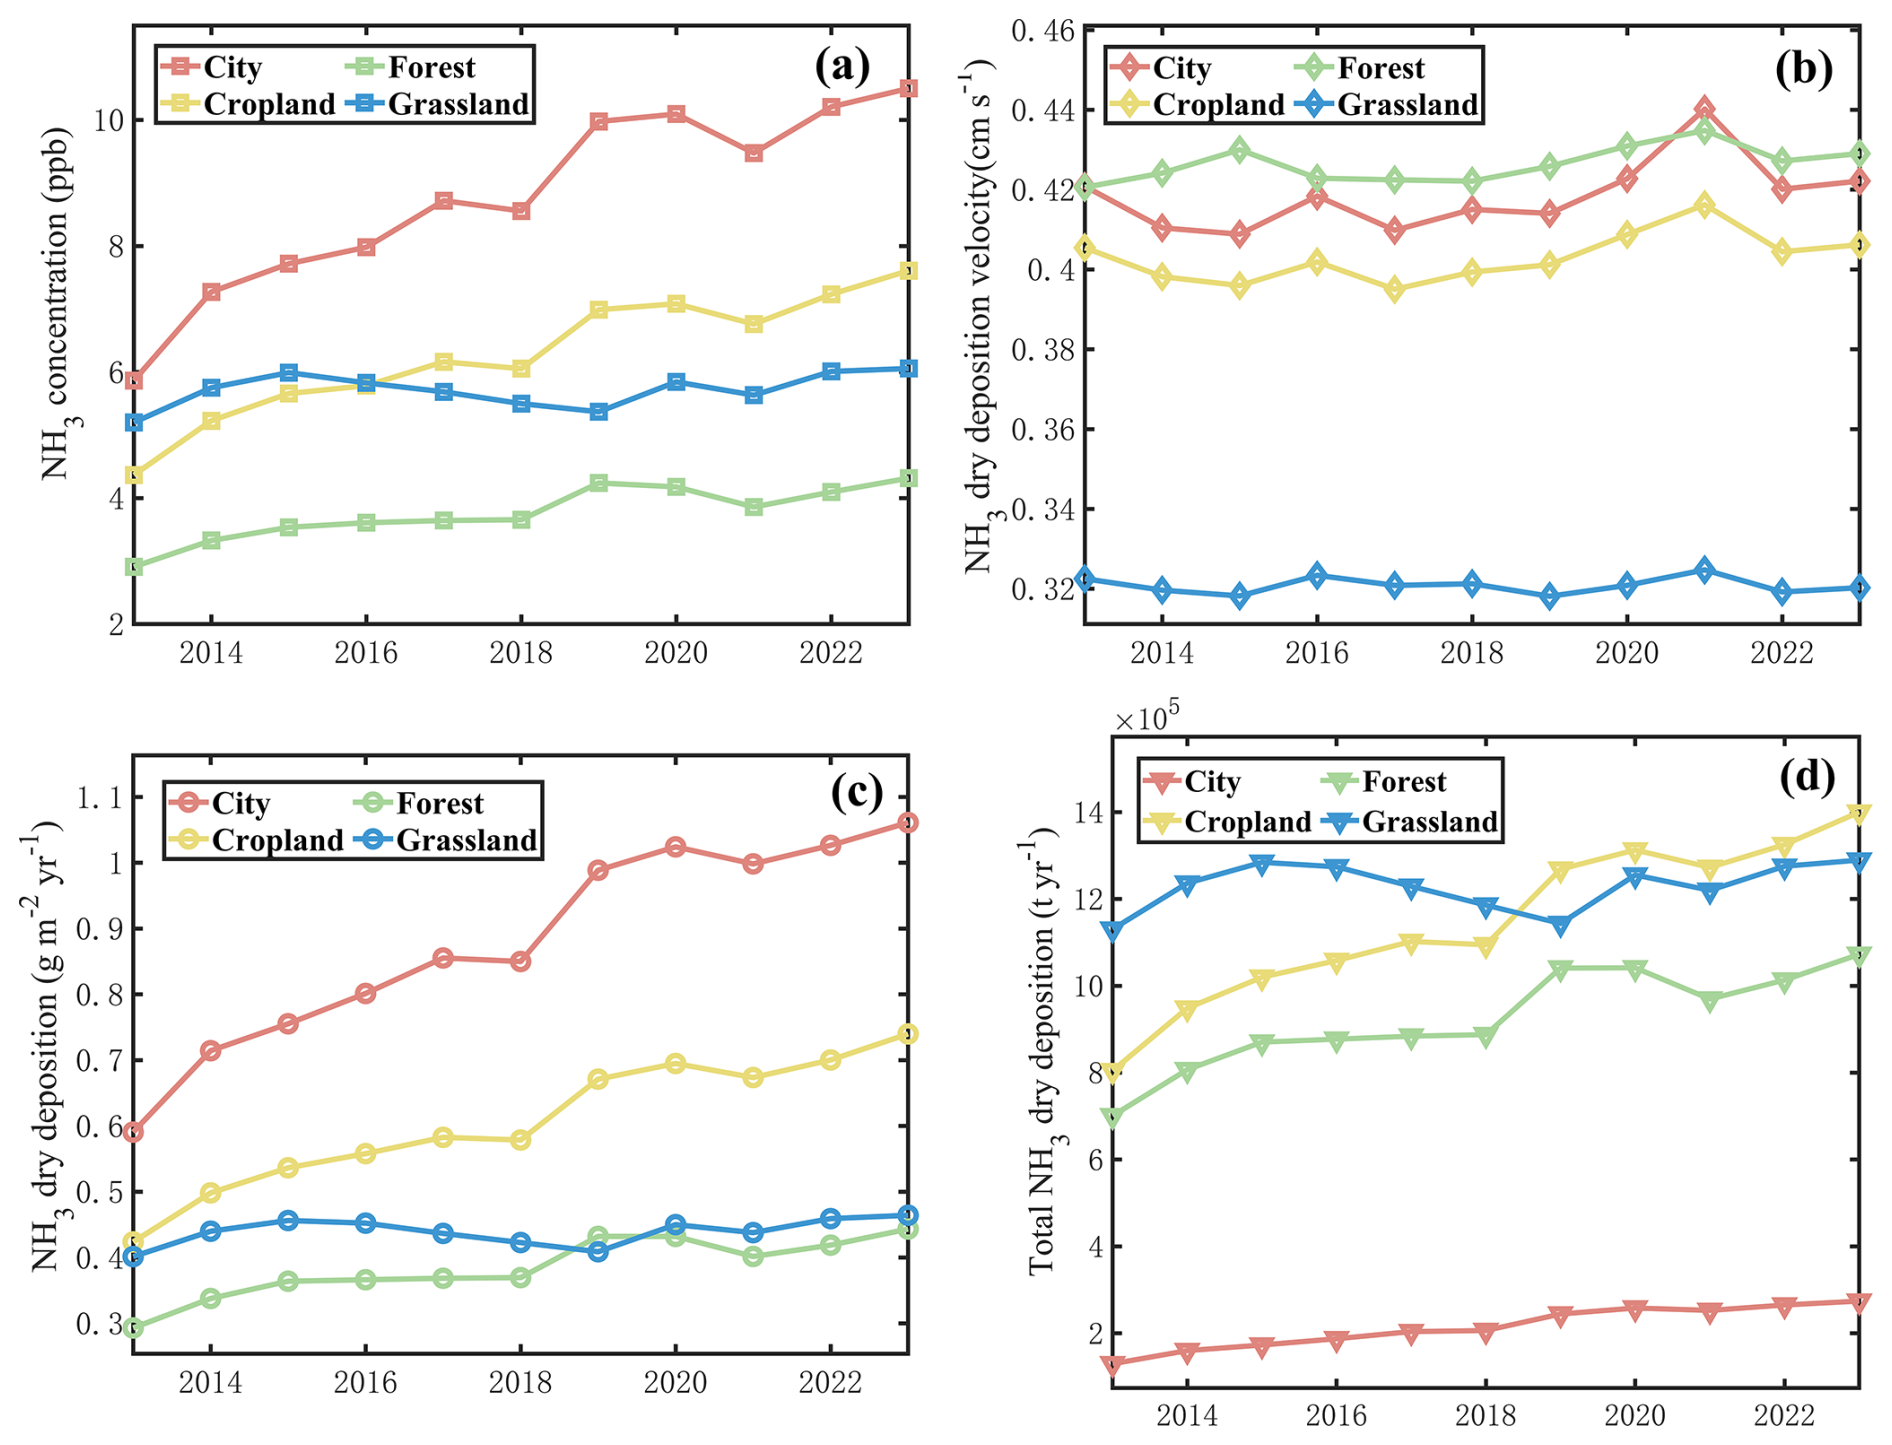
Figure 7Trends in NH3 concentration, dry deposition velocity, and dry deposition amount in China from 2013 to 2023: (a) trends in corrected NH3 concentrations across different land surface types (Unit: ppb); (b) NH3 dry deposition velocities over different land surface types (Unit: cm s−1); (c) trends in NH3 dry deposition flux per unit area over different land surface types (Unit: g m−2); (d) interannual variation in annual NH3 dry deposition over different land cover types (Unit: t yr−1).
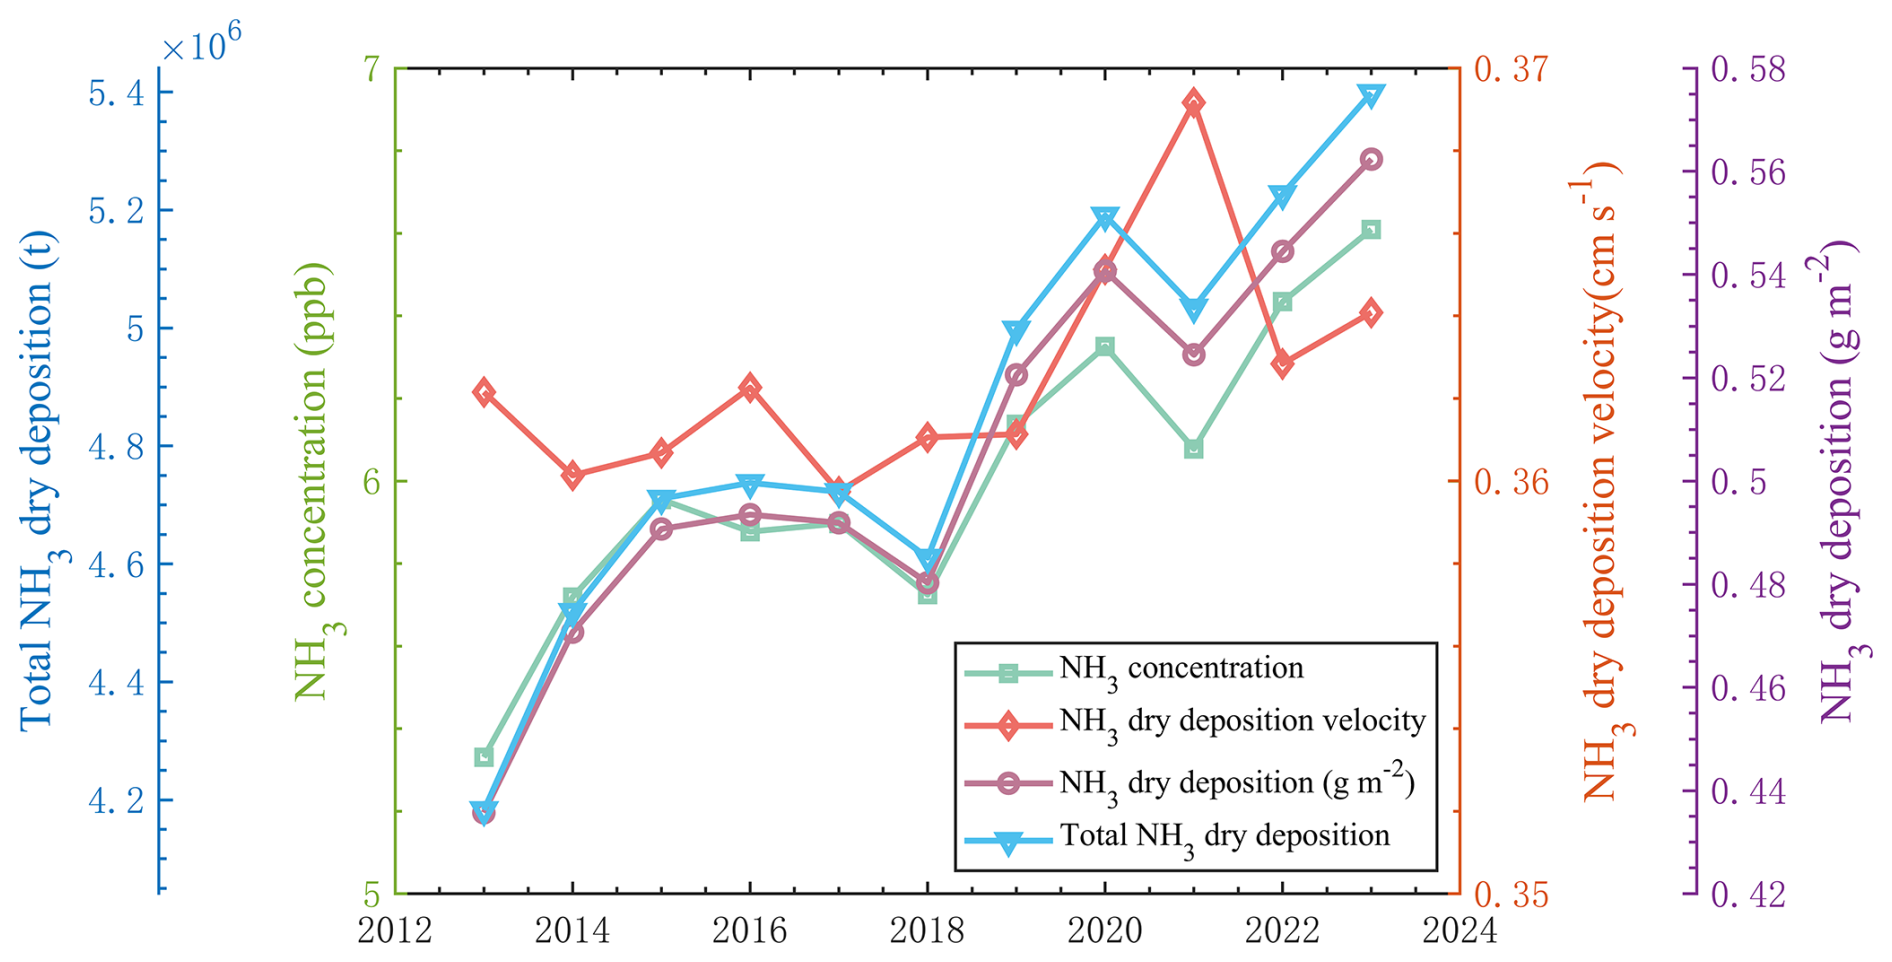
Figure 8Annual changes in NH3 concentration, dry deposition velocity, dry deposition flux and total dry deposition for China from 2013 to 2023.
While ground-level NH3 concentrations over grassland areas remained relatively stable throughout the study period, cropland regions exhibited a continuous upward trend, with the two trends intersecting in 2016 (Fig. 7a), after which NH3 concentrations in croplands exceeded those in grasslands. NH3 emissions in grassland ecosystems are predominantly associated with livestock grazing, and the stabilization observed is likely attributable to the implementation of grazing restrictions and ecological restoration policies. In contrast, despite the introduction of fertilizer reduction policies in some agricultural areas, rising food demand driven by population growth has sustained or even increased fertilizer application, thereby contributing to the observed increase in cropland NH3 concentrations. At the national scale, NH3 concentrations exhibited a statistically significant upward trend, with an average increase of 0.10 ppb yr−1 (equivalent to an annual growth rate of 2.2 %). Forested regions, which are minimally impacted by anthropogenic sources such as synthetic fertilizers and livestock emissions, maintained the lowest and most stable NH3 concentrations, showing only a slight upward trend that may be linked to climate warming (Figs. 7a and 8).
Dry deposition velocities exhibited limited interannual variability across different land cover types. Forested areas recorded the highest average deposition velocity, likely attributable to greater surface roughness and enhanced canopy-induced turbulence, followed by urban and cropland regions (Figs. 7b and 8). The mean NH3 dry deposition velocities for forest, urban, cropland, grassland, and the national average were 0.43, 0.42, 0.40, 0.32, and 0.36 cm s−1, respectively. Mann-Kendall trend analysis revealed statistically significant increasing trends in urban and cropland areas, with annual rates of 0.0013 and 0.0012 cm s−1 yr−1, respectively. Although forests maintained the highest mean velocity and exhibited a positive trend, the change was not statistically significant. At the national scale, deposition velocity showed a weak but consistent upward trend. In contrast, grassland areas experienced a slight decline in deposition velocity over the 11-year period, though this trend was not statistically significant.
Area-specific NH3 dry deposition fluxes closely followed the spatial distribution of atmospheric concentrations across different land cover types (Figs. 7c and 8). Urban regions exhibited the highest deposition flux (0.88 g m−2 yr−1), followed by cropland areas (0.61 g m−2 yr−1). Both urban and national average fluxes demonstrated statistically significant upward trends over the study period. The steepest increase was observed in urban areas, with a rate of 0.04 g m−2 yr−1 – approximately four times the national average – followed by croplands at 0.03 g m−2 yr−1. Our findings also agree with the previous study by Chen et al. (2023b), which conducted that, although fertilizer application has been partially reduced under agricultural emission control policies, non-agricultural sources – such as industrial processes and transportation – have become the predominant contributors to NH3 emissions in China, particularly concentrated in urban areas. This shift has contributed to elevated NH3 concentrations and enhanced dry deposition fluxes in cities.
In contrast, forests and grasslands showed relatively stable fluxes, likely due to lower levels of anthropogenic disturbance. Nevertheless, a statistically significant increasing trend in forest deposition flux was detected, which may have important ecological implications. Sustained increases in NH3 deposition could lead to adverse effects such as plant nutrient imbalances, biodiversity loss, and eutrophication of adjacent aquatic systems, potentially compromising forest health and long-term ecosystem stability. Furthermore, interannual variability in dry deposition was more pronounced in urban areas, reflecting the dynamic nature of urban development and emission variability, whereas cropland fluxes exhibited a more gradual trend in response to evolving fertilizer management practices.
Trends in total NH3 dry deposition across different land cover types generally mirrored those of area-specific fluxes; however, total dry deposition values of NH3 were modulated by the area of each land cover type. Grasslands accounted for the largest share of annual total NH3 dry deposition (1.23 Tg), followed by croplands (1.15 Tg), forests (0.92 Tg), urban areas (0.21 Tg), and a national total of 4.85 Tg. Over the 11-year study period, statistically significant upward trends in total dry deposition were observed at the national scale, as well as in cropland, forest, and urban areas, with annual increases of 0.10, 0.05, 0.03, and 0.01 Tg yr−1, respectively. Although grasslands also exhibited an increasing trend, it was not statistically significant. Changes in annual total NH3 dry deposition are driven not only by atmospheric concentrations and deposition velocities but also by land-use dynamics (Figs. 7d and 8). In particular, the continuous expansion of urban areas from 2013 to 2023 contributed substantially to the increasing trend in total urban NH3 deposition (Fig. S14). These findings highlight the importance of considering both biogeochemical processes and anthropogenic land-use changes in assessing long-term trends in reactive nitrogen deposition.
3.5 Simulation of ground-level NH3 concentration and contribution factors analysis to both NH3 concentration and deposition flux
In this section, we quantified and partitioned the contributions influencing the trends in the NH3 concentration and dry deposition flux, and further investigated the key drivers of atmospheric NH3 concentrations using the Random Forest (RF) regression model. Model performance was evaluated by comparing simulated NH3 concentrations with observations for the period 2013–2023, showing good agreement (Fig. 9). The RF model effectively captured the spatial variability of NH3 concentrations, with deviations generally within ±0.1 ppb, indicating robust predictive capability. The input variables were categorized into two major groups: meteorological factors and anthropogenic emissions, including NH3 emissions as well as SO2 and NOx emissions. The feature-importance ranking figure illustrates the relative importance of eight driving factors in predicting NH3 concentrations using the Random Forest model (Fig. S15). Among the emission and meteorological-hydrological factors, the latter plays a more prominent role in explaining the spatial and temporal variability of NH3 concentrations. Within the meteorological-hydrological factors, the 10 m wind speed (20.3 %), 2 m temperature (14.9 %), and boundary layer height (13.1 %) are the most influential variables affecting the NH3 concentration simulation. These variables collectively reflect the role of atmospheric diffusion capacity and volatilization conditions in regulating the distribution of NH3 concentrations. Total precipitation (11.0 %) and surface soil moisture content (13.6 %) contribute to the removal of NH3 from the atmosphere, though their relative importance is lower. Among the emission factors, NH3 emissions (16.4 %) are the most significant, followed by NOx (11.0 %) and SO2 (5.1 %) emissions. This suggests that, in addition to direct emissions, precursor chemical processes also have an indirect influence on the distribution of NH3 concentrations.
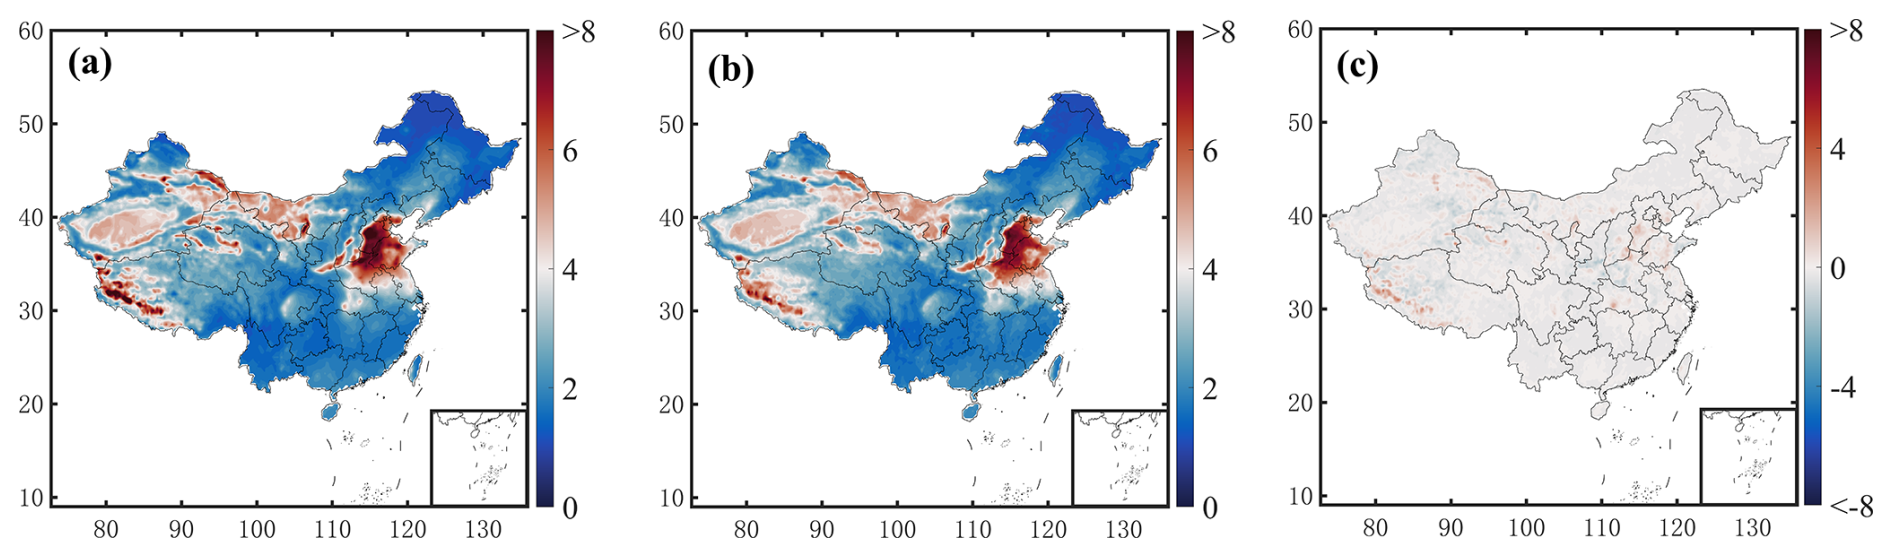
Figure 9(a) Spatial distribution of adjusted ground-level NH3 concentration for averages between 2013 and 2023, (b) simulation of adjusted ground-level NH3 concentration by RF model for averages between 2013 and 2023, (c) difference between panel (a) and (b), Units: ppb.
To quantify the contribution of emissions and meteorological factors to changes in NH3 concentrations, we used a random forest model to simulate NH3 concentration with different sensitivity test by replacing single factor, and the difference between them can be treated as contributions from corresponding factor. Figure 10a shows the adjusted ground-level NH3 concentration in 2022 and the simulation results under three different meteorological and emission scenarios. The simulated concentrations are 3.08, 3.14, 3.10 ppb. Both meteorological and emission contributions are calculated from the simulation results. Simulation results from the random forest model showed that anthropogenic emissions were the main driver, accounting for approximately 77.4 % of the NH3 concentration changes, while meteorological conditions accounted for the remaining 22.6 % (Fig. 10a).
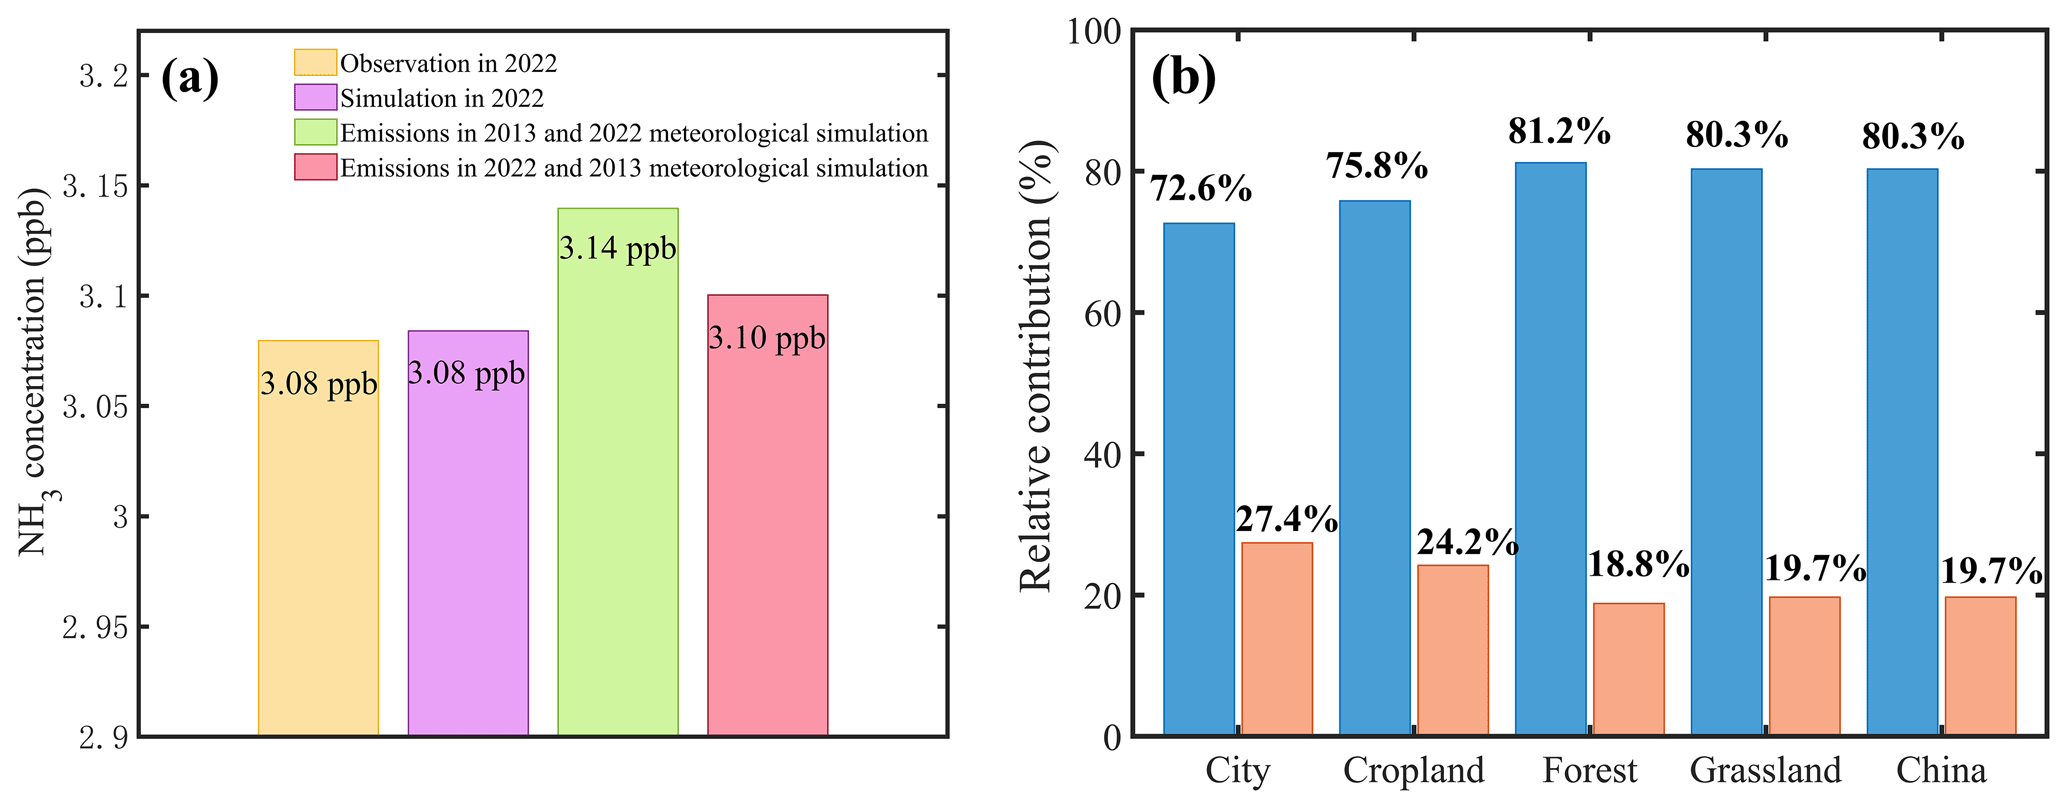
Figure 10(a) Adjusted ground-level NH3 concentrations and simulations by random forest models under different meteorological and emission scenarios in 2022; (b) relative contribution of NH3 concentration and dry deposition velocity to the dry deposition flux changes. Note: in panel (a), the yellow bar represents the adjusted ground-level NH3 concentration in 2022, the purple bar represents the random forest model simulated NH3 concentration, the green bar represents the simulated NH3 concentration using 2013 emissions and 2022 meteorological data, and the red bar represents the simulated NH3 concentration using 2013 meteorological data and 2022 emissions data. And in panel (b), the relative contributions of meteorological factors and emissions can be obtained by comparison with the difference in NH3 concentration in the purple bar graph.
The above relative contributions are calculated by the method that using the emissions and meteorological-hydrological factors from 2013 as the baseline (more details in Method Sect. 2.6.1), we first simulated the NH3 concentration for 2022 using the emissions and meteorological-hydrological factors from that year. The simulated concentration was 3.08 ppb, which was consistent with the satellite-observed concentration for 2022, yielding a relative error of 0.1 %. Subsequently, we replaced the emissions data with those from 2013 while keeping the 2022 meteorological-hydrological factors constant, resulting in a simulated concentration of 3.14 ppb. We then replaced the meteorological-hydrological factors with those from 2013 while keeping the 2022 emissions constant, leading to a simulated concentration of 3.10 ppb. By subtracting the two simulated concentrations from the 2022 NH3 concentration simulation, we quantified the effects of changes in emissions and meteorological-hydrological factors on NH3 concentration. Finally, the results were normalized, revealing that the relative contributions of emissions and meteorological-hydrological factors to the concentration changes were 77.4 % and 22.6 %, respectively.
Among meteorological parameters, air temperature emerged as the most influential factor, whereas other variables (e.g., relative humidity, wind speed) exhibited minimal interannual variation and lower predictive importance. Analysis of ERA5 reanalysis data revealed a persistent warming trend over the past decade, with the annual mean surface temperature in 2023 being 8.4 % higher than in 2013 (Fig. S10). Previous studies, such as Hu et al. (2020), reported an exponential relationship between NH3 mixing ratios and temperature, with NH3 concentrations increasing from 4 to 19 ppb as temperature increased from 0 to 10 °C. The regional temperature sensitivity (Q10) of NH3 emissions was estimated to be approximately 2.5, indicating that continued warming will likely enhance NH3 volatilization. This may further exacerbate nitrogen loss from agricultural systems and elevate NH3 dry deposition to downwind natural ecosystems, potentially intensifying ecological risks such as eutrophication and biodiversity loss.
Figure S16 illustrates multi-year emission trends of SO2, NOx, and NH3 derived from multiple emission inventories, including EDGAR and MEIC; considering the potential uncertainty of pollution emission inventories, the comparisons of different inventories can provide robust results of emission trends. Although observed atmospheric NH3 concentrations have increased over the period 2013–2023, all inventories consistently indicate a slight decline in NH3 emissions. This apparent contradiction suggests that the observed rise in NH3 concentrations may be primarily driven by reduced emissions of acidifying species – namely SO2 and NOx – which typically enhance NH3 partitioning into the particulate phase. The reductions in SO2 and NOx emissions may have suppressed their atmospheric reactions with NH3, thereby decreasing the formation of particulate ammonium and leaving a greater fraction of NH3 un-neutralized in the gas phase. This shift likely contributed to elevated ambient NH3 concentrations, as reported in previous studies (Xu et al., 2019a; Liu et al., 2018, 2017a).
We also investigated the temporal changes of agricultural fertilizer application and livestock farming in China from 2013 to 2023, which are treated as the dominating source of NH3 emissions in China (Figs. S17–S18). During the study period, the application rate of agricultural fertilizers in China showed a trend of first increasing and then decreasing, reaching a peak in 2015, and then continuing to decline until 2023. In order to reveal the changing characteristics of different regions more clearly, we examined the change of agricultural fertilizer amount in each region, and the results indicated that all regions showed a downward trend. At the same time, the total amount of livestock breeding in China first decreased and then rose during the same period.
Furthermore, it is important to note that, although satellite based observations from 2013 to 2023 reveal a clear upward trend in NH3 concentrations at both column-averaged near surface level and ground-level, emission inventories from EDGAR, MEIC, and previous bottom-up estimates suggest that NH3 emissions in China have stabilized or declined gradually in recent years (Liao et al., 2022; Zheng et al., 2018). This discrepancy is not only evident in the current study but has also been observed in other research, where some satellite-based NH3 inversion studies show varying degrees of increasing trends (Zhang et al., 2017; Evangeliou et al., 2021; Luo et al., 2022). The difference may stem from the inherent contrasts between “bottom-up” and “top-down” estimation methods as displayed in Fig. 13c. Several top-down studies indicate that the observed rise in NH3 emissions could be partially explained by the neglect of SO2 and NOx column concentration changes. For instance, Luo et al. (2022) estimated global NH3 emissions from 2008 to 2018 using a top-down approach and found that NH3 emissions in eastern China increased by 61 % per decade (6.6 Tg a−1 per decade), particularly after 2013, driven primarily by the rise in IASI NH3 column concentrations. However, when the model incorporated the decreasing SO2 and NOx column concentrations, NH3 emissions in eastern China were found to decrease by 19 % per decade, with the decline becoming more pronounced after 2013 (28 % per decade), aligning more closely with inventory results. This suggests that SO2 and NOx concentrations play a significant role in mitigating atmospheric NH3 levels. Additionally, both SO2 and NOx emissions are negatively correlated with NH3 concentrations to some extent. In summary, there are large differences in the estimation of NH3 emissions by different methods, so it is necessary to further strengthen the comprehensive analysis and mutual verification of various methods (such as emission factor method, satellite observation inversion method and field observation method) to improve the accuracy and reliability of estimation results (Chen et al., 2023b).
According to EDGAR data, national SO2 and NOx emissions declined by approximately 20.0 % from 2013 to 2022, following the implementation of the Air Pollution Prevention and Control Action Plan in 2013, which led to substantial reductions in these precursor gases. It is important to note that our Random Forest model does not account for atmospheric chemical processes involving the formation and partitioning of secondary inorganic aerosols, such as nitrate (NO), sulfate (SO), and ammonium (NH). Therefore, for future investigations aiming to quantify the role of atmospheric chemistry in modulating NH3 concentrations and deposition, the use of comprehensive atmospheric chemical transport models such as WRF-Chem or GEOS-Chem is strongly recommended. These models are capable of resolving multiphase chemical reactions and the thermodynamic partitioning of NH3 into the aerosol phase, thereby offering a more mechanistic understanding of NH3 dynamics in response to co-emitted precursor changes.
To further elucidate the drivers of NH3 dry deposition trends, we employed the method described in Sect. 2.6.2 to decompose the relative contributions of changes in NH3 concentrations and deposition velocities across different land cover types (Fig. 10b; Table S8). All variables were normalized to facilitate comparison of relative contributions. The results show that the change of NH3 dry deposition was mainly driven by the change of atmospheric NH3 concentration, which accounted for 72.6 %–81.2 % of the total contribution in China and four land cover types. Among them, the concentration changes in urban areas contributed the least (72.6 %), and the dry deposition rate change contributed the most (27.4 %), likely reflecting the more complex aerodynamic and surface resistance conditions in urban environments. In contrast, forested areas showed the highest concentration-driven contribution (81.2 %), consistent with their relatively stable surface characteristics and low anthropogenic disturbance.
To quantify the individual contribution from SO2 and NOx, we also applied the constructed RF model with the method introduced in Sect. 2.6.1. Taking 2013 as the benchmark, the SO2 and NOx emissions in 2022 are simulated back to the level of 2013, and the results are normalized to calculate the relative contribution. The results show that the contribution of SO2 is 27.1 % and that of NOx is 72.9 %. The contribution of NOx is significantly higher than that of SO2, which is closely related to the earlier start of SO2 emission reduction. Long-term SO2 emission reduction has changed the composition of acid gases in the atmosphere, causing the relative concentration of NOx to rise, gradually becoming the main acid gas reacting with NH3 (Liu et al., 2024d).
Considering the neutralization effect of SO2 and NOx acid gases on NH3, we analyzed the changes of the three emissions (Table S9). The data in Table S9 shows that the relative annual reduction rates and total reduction rates of the three are similar, with values around 2.5 % and 20.5 %. However, in terms of the average annual reduction, the reduction scale of SO2 is about 3 times that of NH3, and that of NOx is about 2.4 times that of NH3. Since the reduction of SO2 and NOx is larger, more NH3 is distributed in the free state in the atmosphere. In addition, SO2 and NOx, as acid gases, can react with NH3 in the atmosphere, and they have a synergistic effect in consuming NH3. Therefore, although the relative annual reduction rates of the three are similar, the contribution of acid gas as a whole to emission reduction is more significant.
From the perspective of chemical reaction measurement relationship, the equation for the reaction between SO2 and NH3 to generate ammonium sulfate is: . In this reaction, 1 molecule of SO2 can consume 2 molecules of NH3; the equation for the reaction between NOx and NH3 to generate ammonium nitrate is: NH3 + HNO3 NH4NO3. This reaction is a 1 : 1 measurement relationship and is a reversible reaction. It will re-decompose and release NH3 under higher temperature or lower concentration conditions. With the intensification of global warming, NH4NO3 in the atmosphere will also decompose and release NH3. Therefore, although the emissions of SO2, NOx and NH3 have all decreased by about 20.5 % from 2013 to 2025, the massive emission reduction of SO2 and NOx has weakened the consumption capacity of NH3, resulting in a relative surplus of NH3 that should have been neutralized, causing NH3 in the atmosphere. The concentration continues to rise, and the increase of NH3 concentration also promotes the increase of NH3 dry deposition.
In summary, the observed increase in atmospheric NH3 concentrations across China is largely attributable to the substantial reductions in SO2 and NOx emissions. Concurrently, changes in NH3 dry deposition fluxes are primarily driven by rising NH3 concentrations, which are indirectly influenced by declining SO2 and NOx emissions. This inference is supported by consistent evidence from both satellite and ground-based monitoring networks, which document a marked decrease in SO2 concentrations (Liu et al., 2019b; Xi et al., 2021), alongside improvements in acid rain conditions.
Previous studies have indicated that optimizing fertilizer application and adjusting protein content in animal feed could potentially reduce NH3 emissions by up to 30 % without compromising agricultural yields or incurring additional costs (Zhang et al., 2020). In contrast, regulation of NH3 emissions has lagged behind that of other pollutants. It was not until the implementation of the 2018 “Three-Year Action Plan for Winning the Blue-Sky Defense Battle” that agricultural NH3 emissions were formally addressed. This plan emphasized enhanced recycling of livestock waste and measures to reduce NH3 volatilization. Subsequently, the “14th Five-Year Plan for Energy Conservation and Emission Reduction” further targeted improvements in fertilizer and pesticide use efficiency, setting a goal to reduce NH3 emissions from large-scale livestock operations in the Beijing-Tianjin-Hebei region by 5 %. Although these recent policies have initiated efforts to mitigate NH3 emissions, the rate of reduction remains substantially lower than that achieved for SO2.
Furthermore, in the context of future warming, we analyzed projected emissions of SO2, NOx, and NH3 under five SSP scenarios based on the Dynamic Projection Emission Coefficient (DPEC) inventory developed by Tsinghua University (Fig. S19). All scenarios indicate declining trends for these pollutants; however, NH3 exhibits the smallest reduction, amounting to roughly two-thirds of the decreases projected for SO2 and NOx. This discrepancy, combined with rising temperatures and decreasing acid gas emissions, is expected to further enhance atmospheric NH3 concentrations. Consequently, despite ongoing mitigation efforts targeting NH3 emissions, the atmospheric NH3 concentration may continue to increase. To counteract the synergistic effects of warming and reductions in acid-neutralizing pollutants, more stringent NH3 emission control policies will be required in China over the coming decades to effectively stabilize or reduce atmospheric NH3 concentrations.
To evaluate and contextualize atmospheric NH3 concentrations and dry deposition in China relative to other global regions and different land cover types, we conducted a comprehensive literature review summarized in Table 4. This table integrates the findings of the present study with previous assessments of atmospheric NH3 levels and dry deposition fluxes worldwide. The comparative analysis highlights considerable spatial variability, with NH3 concentrations ranging from approximately 2 to 10 ppb and area-specific dry deposition fluxes spanning 0.06 to 1.00 g m−2 yr−1. The values reported in this study are generally consistent with those documented in comparable geographic and climatic regions.
Table 4Comparison of global and regional NH3 concentrations and dry deposition rates across different studies. note: All results have been standardized to uniform units.
This study estimates the national average NH3 concentration in China at 4.98 ppb and the corresponding dry deposition flux at 0.51 g m−2 yr−1, and the results for each province of China were also displayed in Fig. S20. The national average results closely align with those of Liu et al. (2020a), who employed IASI satellite retrievals and reported NH3 concentrations of 4.15 ppb and dry deposition fluxes of 0.58 g m−2 yr−1. The Tianjin megacity, Shandong province, Henan province, Hebei province and Beijing megacity ranked as the largest top 5 regions for NH3 concentration and dry deposition flux, where Tianjin and Beijing are located within North China Plain hotspots, and were largely influenced by atmospheric transport process from nearby agricultural fields. Compared to Liu et al. (2020a), our analysis extends the observation period and incorporates adjustments against ground-based monitoring data, thereby achieving higher accuracy. Jia et al. (2016) estimated the global NH3 dry deposition flux using empirical models based on ground station measurements, reporting a value of 0.68 g m−2 yr−1 for China.
In contrast, Xu et al. (2015), utilizing averages from 43 ground stations (including 10 urban stations, 22 rural stations and 11 background stations) from the National Nitrogen Deposition Monitoring Network (NNDMN), reported substantially higher values for China (10.65 ppb and 1.00 g m−2 yr−1) than our study of spatial coverage of whole China. It can be explained by the representation bias due to the predominance of monitoring sites in urban and rural (mostly agriculture dominated) regions characterized by elevated NH3 emissions and underrepresentation of background locations, resulting in overestimation of national averages when averaging these observation sites. Further evidence of spatial variability is provided by Hu et al. (2020, 2021), who documented significant differences in NH3 concentrations and deposition rates between cropland and forested background sites, underscoring the critical influence of land cover and emission sources on atmospheric NH3 dynamics.
Overall, the synthesis of data summarized in Table 4 indicates that NH3 concentrations in China generally range from 4 to 10 ppb, with corresponding dry deposition fluxes between 0.5 and 1.0 g m−2 yr−1. The observed variability is primarily attributed to differences in observation periods, measurement methodologies, and spatial coverage. By comparison, the United States exhibits average NH3 concentrations of approximately 2.65 ppb and dry deposition fluxes ranging from 0.07 to 0.3 g m−2 yr−1, while Europe reports concentrations near 3.13 ppb and deposition fluxes between 0.1 and 0.3 g m−2 yr−1. These findings highlight that both NH3 concentrations and deposition fluxes in China are substantially higher than those reported for the United States, Europe, and global averages. Notably, Europe has integrated NH3 control into its air pollution regulatory framework, resulting in measurable emission reductions in recent years. This experience underscores the importance of implementing more stringent NH3 mitigation policies in China to effectively address the ongoing increases in atmospheric NH3 concentrations and dry deposition fluxes.
Previous studies have typically examined either atmospheric NH3 concentrations or dry deposition independently, with relatively few providing a comprehensive assessment integrating both components. This study addresses this gap by combining satellite-based lower ABL NH3 concentrations with ground-based observations and utilizing the GEOS-Chem atmospheric chemistry transport model in conjunction with a machine learning-based Random Forest algorithm to simulate deposition velocities and fluxes. This integrated approach facilitates the generation of high-resolution, multi-year estimates of NH3 dry deposition across China. The resulting dataset provides a robust scientific basis for improving national nitrogen management policies and offers valuable insights into regional and global nitrogen cycling processes.
This study presents a comprehensive analysis of the spatial distribution and temporal trends of atmospheric ammonia (NH3) concentrations and dry deposition across China during 2013–2023. The key findings are as follows:
-
The North China Plain exhibited persistently high NH3 concentrations (> 10 ppb), with significant annual increases in central and eastern regions (> 0.4 ppb yr−1). The largest seasonal increases occurred in summer (0.065 ppb yr−1). NH3 concentrations in 2023 were 13.8 %–30.6 % higher than in 2013 across all seasons. CrIS satellite retrievals were strongly correlated with in-situ measurements (R = 0.79), but are larger than the later by a factor of about two.
-
The spatial pattern of NH3 dry deposition revealed a pronounced east-west gradient, with the highest flux in the North China Plain and Sichuan Basin, and a significant upward trend along the eastern coast (> 0.1 g m−2 yr−1). Over the 11-year period, NH3 concentrations, deposition flux, and total deposition increased significantly in the land cover types of urban, cropland, and forest ecosystems. Urban areas showed the highest concentration and deposition flux as well as the fastest growth rates, while grasslands exhibited the largest total deposition.
-
The national mean NH3 concentration and dry deposition flux were estimated to be 4.98 ppb and 0.51 g m−2 yr−1, respectively. In addition, our analysis indicated that anthropogenic emissions were the dominant driver, accounting for approximately 77.4 % of the variance in NH3 concentrations, and meteorological conditions explained the remaining 22.6 %; 72.6 %-81.2 % of trend for NH3 dry deposition was governed by changes in NH3 concentrations. These findings underscore the increasing NH3 pollution across China and provide a critical scientific basis for informed nitrogen management within one of global largest NH3 emission hotspots regions.
CrIS satellite retrievals of NH3 were obtained from Environment and Climate Change Canada (ECCC) at https://hpfx.collab.science.gc.ca/~mas001/satellite_ext/cris/ (last access: 13 May 2025) (Shephard and Cady-Pereira, 2015; Shephard et al., 2020). Ground-based NH3 measurements were sourced from Xu et al. (2019b), available at https://www.nature.com/articles/s41597-019-0061-2 (last access: 27 July 2025). NH3 emission inventories were obtained from the Multi-resolution Emission Inventory for China (MEIC; http://meicmodel.org.cn/?page_id=560), the Emissions Database for Global Atmospheric Research (EDGAR v8.1; https://edgar.jrc.ec.europa.eu/dataset_ap81#p3), and the Dynamic Projection model for Emissions in China (DPEC; http://meicmodel.org.cn/?page_id=1917). Emission data for SO2 and NOx were derived from the Inversed Emission Inventory for Chinese Air Quality (CAQIEI; https://doi.org/10.57760/sciencedb.13151. Lei et al., 2024), the Air Benefit and Cost and Attainment Assessment System (ABaCAS; https://abacas-dss.com/abacasChinese/Default.aspx), and the Community Emissions Data System (CEDS; https://github.com/JGCRI/CEDS/, last access: 13 March 2025; Hoesly et al., 2018, https://doi.org/10.5194/gmd-11-369-2018). The MEIC and EDGAR inventories were used for both NH3 and SO2 NOx emissions. Meteorological data were obtained from the ERA5 reanalysis dataset provided by the European Centre for Medium-Range Weather Forecasts (ECMWF) at https://doi.org/10.24381/cds.adbb2d47 (Hersbach et al., 2023). The data of agricultural fertilizer application and livestock population are derived from the National Bureau of Statistics of China (https://www.stats.gov.cn/sj/ndsj/2024/indexch.htm, last access: 21 August 2025). Agricultural zoning data were obtained from the Resource and Environmental Science Data Center (https://www.resdc.cn/Default.aspx, last access: 28 August 2025), and land cover data were retrieved from the National Cryosphere Desert Data Center (https://www.ncdc.ac.cn/portal/metadata/9de270f3-b5ad-4e19-afc0-2531f3977f2f, last access: 16 July 2025).
The supplement related to this article is available online at https://doi.org/10.5194/acp-25-17907-2025-supplement.
FS and CH conducted the data analysis and wrote the draft under supervision of CH, CH designed the study and revised this paper, JS and XL conducted GEOS-Chem modeling, all other co-authors collected supporting data, read and approved the final manuscript.
The contact author has declared that none of the authors has any competing interests.
Publisher's note: Copernicus Publications remains neutral with regard to jurisdictional claims made in the text, published maps, institutional affiliations, or any other geographical representation in this paper. While Copernicus Publications makes every effort to include appropriate place names, the final responsibility lies with the authors. Views expressed in the text are those of the authors and do not necessarily reflect the views of the publisher.
Cheng Hu is supported by the National Science founding of China (grant nos. 42475125, 42105117, 42021004 and 41975143), this work was also supported by the National Key R&D Program of China (nos. 2019YFA0607202 and 2020YFA0607501); Jiangsu Science Foundation for Distinguished Young Scholar (No. BK20220055); the 333 Project of Jiangsu Province (No. BRA2017402); R&D Foundation of Jiangsu Province, China (No. BK20220020). Cheng Hu also thanks the founding support from Key Laboratory of Ecosystem Carbon Source and Sink, China Meteorological Administration (ECSS-CMA202403). We also Sincerely thank the support from Environment and Climate Change Canada (ECCC) CrIS group.
This paper was edited by Leiming Zhang and reviewed by Xiaohong Yao and one anonymous referee.
Ai, X., Hu, C., Yang, Y., Zhang, L., Liu, H., Zhang, J., Chen, X., Bai, G., and Xiao, W.: Quantification of Central and Eastern China's atmospheric CH4 enhancement changes and its contributions based on machine learning approach, journal of environmental sciences, 138, 236–248, https://doi.org/10.1016/j.jes.2023.03.010, 2024.
Asadi, M. and McPhedran, K. N.: Greenhouse gas emission estimation from municipal wastewater using a hybrid approach of generative adversarial network and data-driven modelling, Science of The Total Environment, 800, 149508, https://doi.org/10.1016/j.scitotenv.2021.149508, 2021.
Beer, R., Shephard, M. W., Kulawik, S. S., Clough, S. A., Eldering, A., Bowman, K. W., Sander, S. P., Fisher, B. M., Payne, V. H., Luo, M., Osterman, G. B., and Worden, J. R.: First Satellite Observations of Lower Tropospheric Ammonia and Methanol, Geophysical Research Letters, 35, https://doi.org/10.1029/2008GL033642, 2008.
Behera, S. N., Sharma, M., Aneja, V. P., and Balasubramanian, R.: Ammonia in the atmosphere: a review on emission sources, atmospheric chemistry and deposition on terrestrial bodies, Environmental Science and Pollution Research, 20, 8092–8131, https://doi.org/10.1007/s11356-013-2051-9, 2013.
Beusen, A. H. W., Bouwman, A. F., Heuberger, P. S. C., Van Drecht, G., and Van Der Hoek, K. W.: Bottom-up uncertainty estimates of global ammonia emissions from global agricultural production systems, Atmospheric Environment, 42, 6067–6077, https://doi.org/10.1016/j.atmosenv.2008.03.044, 2008.
Cao, C., Lee, X., Liu, S., Schultz, N., Xiao, W., Zhang, M., and Zhao, L.: Urban heat islands in China enhanced by haze pollution, Nature Communications, 7, 12509, https://doi.org/10.1038/ncomms12509, 2016.
Chang, Y., Gao, Y., Lu, Y., Qiao, L., Kuang, Y., Cheng, K., Wu, Y., Lou, S., Jing, S., Wang, H., and Huang, C.: Discovery of a Potent Source of Gaseous Amines in Urban China, Environ. Sci. Technol. Lett., 8, 725–731, https://doi.org/10.1021/acs.estlett.1c00229, 2021.
Chen, J., Cheng, M., Krol, M., De Vries, W., Zhu, Q., Liu, X., Zhang, F., and Xu, W.: Trends in anthropogenic ammonia emissions in China since 1980: A review of approaches and estimations, Front. Environ. Sci., 11, 1133753, https://doi.org/10.3389/fenvs.2023.1133753, 2023a.
Chen, P., Xiao, X., Wang, Q.: High-resolution characteristics of NH3 emission from 2010 to 2020 in China based on satellite observation, Environmental Science, 43, 2673–2682, https://doi.org/10.19674/j.cnki.issn1000-6923.20230131.002, 2023b.
Chen, Y., Shen, H., Kaiser, J., Hu, Y., Capps, S. L., Zhao, S., Hakami, A., Shih, J.-S., Pavur, G. K., Turner, M. D., Henze, D. K., Resler, J., Nenes, A., Napelenok, S. L., Bash, J. O., Fahey, K. M., Carmichael, G. R., Chai, T., Clarisse, L., Coheur, P.-F., Van Damme, M., and Russell, A. G.: High-resolution hybrid inversion of IASI ammonia columns to constrain US ammonia emissions using the CMAQ adjoint model, Atmos. Chem. Phys., 21, 2067–2082, https://doi.org/10.5194/acp-21-2067-2021, 2021.
Clarisse, L., Clerbaux, C., Dentener, F., Hurtmans, D., and Coheur, P.-F.: Global ammonia distribution derived from infrared satellite observations, Nature Geosci., 2, 479–483, https://doi.org/10.1038/ngeo551, 2009.
Crippa, M., Janssens-Maenhout, G., Guizzardi, D., Van Dingenen, R., and Dentener, F.: Contribution and uncertainty of sectorial and regional emissions to regional and global PM2.5 health impacts, Atmos. Chem. Phys., 19, 5165–5186, https://doi.org/10.5194/acp-19-5165-2019, 2019.
Crippa, M., Guizzardi, D., Pagani, F., Schiavina, M., Melchiorri, M., Pisoni, E., Graziosi, F., Muntean, M., Maes, J., Dijkstra, L., Van Damme, M., Clarisse, L., and Coheur, P.: Insights into the spatial distribution of global, national, and subnational greenhouse gas emissions in the Emissions Database for Global Atmospheric Research (EDGAR v8.0), Earth Syst. Sci. Data, 16, 2811–2830, https://doi.org/10.5194/essd-16-2811-2024, 2024.
Dong, J., Li, B., Li, Y., Zhou, R., Gan, C., Zhao, Y., Liu, R., Yang, Y., Wang, T., and Liao, H.: Atmospheric ammonia in China: Long-term spatiotemporal variation, urban-rural gradient, and influencing factors, Science of The Total Environment, 883, 163733, https://doi.org/10.1016/j.scitotenv.2023.163733, 2023.
Eastham, S. D., Weisenstein, D. K., and Barrett, S. R.: Development and evaluation of the unified tropospheric–stratospheric chemistry extension (UCX) for the global chemistry-transport model GEOS-Chem, Atmospheric Environment, 89, 52–63, https://doi.org/10.1016/j.atmosenv.2014.02.001, 2014.
Erisman, J. W., Sutton, M. A., Galloway, J., Klimont, Z., and Winiwarter, W.: How a century of ammonia synthesis changed the world, Nature Geoscience, 1, 636–639, https://doi.org/10.1038/ngeo325, 2008.
Evangeliou, N., Balkanski, Y., Eckhardt, S., Cozic, A., Van Damme, M., Coheur, P.-F., Clarisse, L., Shephard, M. W., Cady-Pereira, K. E., and Hauglustaine, D.: 10-year satellite-constrained fluxes of ammonia improve performance of chemistry transport models, Atmos. Chem. Phys., 21, 4431–4451, https://doi.org/10.5194/acp-21-4431-2021, 2021.
Flechard, C. R., Nemitz, E., Smith, R. I., Fowler, D., Vermeulen, A. T., Bleeker, A., Erisman, J. W., Simpson, D., Zhang, L., Tang, Y. S., and Sutton, M. A.: Dry deposition of reactive nitrogen to European ecosystems: a comparison of inferential models across the NitroEurope network, Atmos. Chem. Phys., 11, 2703–2728, https://doi.org/10.5194/acp-11-2703-2011, 2011.
Fu, X., Wang, S., Xing, J., Zhang, X., Wang, T., and Hao, J.: Increasing Ammonia Concentrations Reduce the Effectiveness of Particle Pollution Control Achieved via SO2 and NOx Emissions Reduction in East China, Environ. Sci. Technol. Lett., 4, 221–227, https://doi.org/10.1021/acs.estlett.7b00143, 2017.
Goldberg, D. L., Anenberg, S. C., Lu, Z., Streets, D. G., Lamsal, L. N., McDuffie, E. E., and Smith, S. J.: Urban NOx emissions around the world declined faster than anticipated between 2005 and 2019, Environmental Research Letters, 16, 115004, https://doi.org/10.1088/1748-9326/ac2c34, 2021.
Griffis, T. J., Hu, C., Baker, J. M., Wood, J. D., Millet, D. B., Erickson, M., Yu, Z., Deventer, M. J., Winker, C., and Chen, Z.: Tall Tower Ammonia Observations and Emission Estimates in the U.S. Midwest, Journal of Geophysical Research: Biogeosciences, 124, 3432–3447, https://doi.org/10.1029/2019JG005172, 2019.
Hauglustaine, D. A., Balkanski, Y., and Schulz, M.: A global model simulation of present and future nitrate aerosols and their direct radiative forcing of climate, Atmos. Chem. Phys., 14, 11031–11063, https://doi.org/10.5194/acp-14-11031-2014, 2014.
He, K., Yang, F., Ma, Y., Zhang, Q., Yao, X., Chan, C. K., Cadle, S., Chan, T., and Mulawa, P.: The characteristics of PM2.5 in Beijing, China, Atmospheric Environment, 35, 4959–4970, https://doi.org/10.1016/S1352-2310(01)00301-6, 2001.
Hernández, D. L., Vallano, D. M., Zavaleta, E. S., Tzankova, Z., Pasari, J. R., Weiss, S., Selmants, P. C., and Morozumi, C.: Nitrogen pollution is linked to US listed species declines, BioScience, 66, 213–222, https://doi.org/10.1093/biosci/biw003, 2016.
Hersbach, H., Bell, B., Berrisford, P., Biavati, G., Horányi, A., Muñoz Sabater, J., Nicolas, J., Peubey, C., Radu, R., Rozum, I., Schepers, D., Simmons, A., Soci, C., Dee, D., and Thépaut, J.-N.: ERA5 hourly data on single levels from 1940 to present, Copernicus Climate Change Service (C3S) Climate Data Store (CDS) [data set], https://doi.org/10.24381/cds.adbb2d47, 2023.
Hoesly, R. M., Smith, S. J., Feng, L., Klimont, Z., Janssens-Maenhout, G., Pitkanen, T., Seibert, J. J., Vu, L., Andres, R. J., Bolt, R. M., Bond, T. C., Dawidowski, L., Kholod, N., Kurokawa, J.-I., Li, M., Liu, L., Lu, Z., Moura, M. C. P., O'Rourke, P. R., and Zhang, Q.: Historical (1750–2014) anthropogenic emissions of reactive gases and aerosols from the Community Emissions Data System (CEDS), Geosci. Model Dev., 11, 369–408, https://doi.org/10.5194/gmd-11-369-2018, 2018.
Hu, C., Wang, Y., Wang, W., Liu, S., Piao, M., Xiao, W., and Lee, X.: Trends in evaporation of a large subtropical lake, Theor. Appl. Climatol., 129, 159–170, https://doi.org/10.1007/s00704-016-1768-z, 2017.
Hu, C., Griffis, T. J., Baker, J. M., Wood, J. D., Millet, D. B., Yu, Z., and Lee, X.: Modeling the Sources and Transport Processes During Extreme Ammonia Episodes in the U.S. Corn Belt, Journal of Geophysical Research: Atmospheres, 125, e2019JD031207, https://doi.org/10.1029/2019JD031207, 2020.
Hu, C., Griffis, T. J., Frie, A., Baker, J. M., Wood, J. D., Millet, D. B., Yu, Z., Yu, X., and Czarnetzki, A. C.: A Multiyear Constraint on Ammonia Emissions and Deposition Within the US Corn Belt, Geophysical Research Letters, 48, e2020GL090865, https://doi.org/10.1029/2020GL090865, 2021.
Jia, Y., Yu, G., Gao, Y., He, N., Wang, Q., Jiao, C., and Zuo, Y.: Global inorganic nitrogen dry deposition inferred from ground- and space-based measurements, Sci. Rep., 6, 19810, https://doi.org/10.1038/srep19810, 2016.
Kang, Y., Liu, M., Song, Y., Huang, X., Yao, H., Cai, X., Zhang, H., Kang, L., Liu, X., Yan, X., He, H., Zhang, Q., Shao, M., and Zhu, T.: High-resolution ammonia emissions inventories in China from 1980 to 2012, Atmos. Chem. Phys., 16, 2043–2058, https://doi.org/10.5194/acp-16-2043-2016, 2016.
Kharol, S. K., Shephard, M. W., McLinden, C. A., Zhang, L., Sioris, C. E., O'Brien, J. M., Vet, R., Cady-Pereira, K. E., Hare, E., Siemons, J., and Krotkov, N. A.: Dry Deposition of Reactive Nitrogen From Satellite Observations of Ammonia and Nitrogen Dioxide Over North America, Geophysical Research Letters, 45, 1157–1166, https://doi.org/10.1002/2017GL075832, 2018.
Lei, K., Tang, X., Wang, Z., Zhu, J., Li, J., Wu, H., Wu, Q., Chen, H., Zhu, L., Wang, W., Liu, B., Wang, Q., Chen, D., Pan, Y., Li, J., Wu, L. and Gregory C.: Inversed Emission Inventory for Chinese Air Quality (CAQIEI) version 1.0[DS/OL], V2, Science Data Bank [data set], https://doi.org/10.57760/sciencedb.13151, 2024.
Lei, M., Cheng, T., Li, X., Shi, S., Zuo, X., Guo, H., and Wu, Y.: Atmospheric ammonia point source detection technique at regional scale using high resolution satellite imagery and deep learning, Atmospheric Research, 257, 105587, https://doi.org/10.1016/j.atmosres.2021.105587, 2021.
Liao, W., Liu, M., Huang, X., Wang, T., Xu, Z., Shang, F., Song, Y., Cai, X., Zhang, H., Kang, L., and Zhu, T.: Estimation for ammonia emissions at county level in China from 2013 to 2018, Sci. China Earth Sci., 65, 1116–1127, https://doi.org/10.1007/s11430-021-9897-3, 2022.
Liu, C., Huang, J., Hu, C., Cao, C., Yue, K., Fang, X., Zhu, R., and Lee, X.: Sensitivity of surface downward longwave radiation to aerosol optical depth over the Lake Taihu region, China, Atmos. Res., 305, 107444, https://doi.org/10.1016/j.atmosres.2024.107444, 2024a.
Liu, H., Hu, C., Xiao, Q., Zhang, J., Sun, F., Shi, X., Chen, X., Yang, Y., and Xiao, W.: Analysis of anthropogenic CO2 emission uncertainty and influencing factors at city scale in Yangtze River Delta region: One of the world's largest emission hotspots, Atmos. Pollut. Res., 15, 102281, https://doi.org/10.1016/j.apr.2024.102281, 2024b.
Liu, L., Zhang, X., Xu, W., Liu, X., Lu, X., Wang, S., Zhang, W., and Zhao, L.: Ground Ammonia Concentrations over China Derived from Satellite and Atmospheric Transport Modeling, Remote Sens., 9, 467, https://doi.org/10.3390/rs9050467, 2017a.
Liu, L., Zhang, X., Xu, W., Liu, X., Li, Y., Lu, X., Zhang, Y., and Zhang, W.: Temporal characteristics of atmospheric ammonia and nitrogen dioxide over China based on emission data, satellite observations and atmospheric transport modeling since 1980, Atmos. Chem. Phys., 17, 9365–9378, https://doi.org/10.5194/acp-17-9365-2017, 2017b.
Liu, L., Zhang, X., Wong, A. Y. H., Xu, W., Liu, X., Li, Y., Mi, H., Lu, X., Zhao, L., Wang, Z., Wu, X., and Wei, J.: Estimating global surface ammonia concentrations inferred from satellite retrievals, Atmos. Chem. Phys., 19, 12051–12066, https://doi.org/10.5194/acp-19-12051-2019, 2019a.
Liu, L., Zhang, X., Xu, W., Liu, X., Wei, J., Wang, Z., and Yang, Y.: Global estimates of dry ammonia deposition inferred from space-measurements, Science of The Total Environment, 730, 139189, https://doi.org/10.1016/j.scitotenv.2020.139189, 2020a.
Liu, L., Zhang, X., Xu, W., Liu, X., Lu, X., Wei, J., Li, Y., Yang, Y., Wang, Z., and Wong, A. Y. H.: Reviewing global estimates of surface reactive nitrogen concentration and deposition using satellite retrievals, Atmos. Chem. Phys., 20, 8641–8658, https://doi.org/10.5194/acp-20-8641-2020, 2020b.
Liu, L., Wen, Z., Liu, S., Zhang, X., and Liu, X.: Decline in atmospheric nitrogen deposition in China between 2010 and 2020, Nat. Geosci., 17, 733–736, https://doi.org/10.1038/s41561-024-01484-4, 2024c.
Liu, M., Huang, X., Song, Y., Xu, T., Wang, S., Wu, Z., Hu, M., Zhang, L., Zhang, Q., Pan, Y., Liu, X., and Zhu, T.: Rapid SO2 emission reductions significantly increase tropospheric ammonia concentrations over the North China Plain, Atmos. Chem. Phys., 18, 17933–17943, https://doi.org/10.5194/acp-18-17933-2018, 2018.
Liu, M., Huang, X., Song, Y., Tang, J., Cao, J., Zhang, X., Zhang, Q., Wang, S., Xu, T., Kang, L., Cai, X., Zhang, H., Yang, F., Wang, H., Yu, J. Z., Lau, A. K. H., He, L., Huang, X., Duan, L., Ding, A., Xue, L., Gao, J., Liu, B., and Zhu, T.: Ammonia emission control in China would mitigate haze pollution and nitrogen deposition, but worsen acid rain, Proc. Natl. Acad. Sci. USA, 116, 7760–7765, https://doi.org/10.1073/pnas.1814880116, 2019b.
Liu, S., Xu, H., Wang, J., Ding, J., Liu, P., Yang, Y., and Liu, L.: Evidence for global increases in urban ammonia pollution and their drivers, Science of The Total Environment, 955, 176846, https://doi.org/10.1016/j.scitotenv.2024.176846, 2024d.
Lu, X., Zhang, L., Wu, T., Long, M. S., Wang, J., Jacob, D. J., Zhang, F., Zhang, J., Eastham, S. D., Hu, L., Zhu, L., Liu, X., and Wei, M.: Development of the global atmospheric chemistry general circulation model BCC-GEOS-Chem v1.0: model description and evaluation, Geosci. Model Dev., 13, 3817–3838, https://doi.org/10.5194/gmd-13-3817-2020, 2020.
Lu, X., Liu, Y., Su, J., Weng, X., Ansari, T., Zhang, Y., He, G., Zhu, Y., Wang, H., Zeng, G., Li, J., He, C., Li, S., Amnuaylojaroen, T., Butler, T., Fan, Q., Fan, S., Forster, G. L., Gao, M., Hu, J., Kanaya, Y., Latif, M. T., Lu, K., Nédélec, P., Nowack, P., Sauvage, B., Xu, X., Zhang, L., Li, K., Koo, J.-H., and Nagashima, T.: Tropospheric ozone trends and attributions over East and Southeast Asia in 1995–2019: an integrated assessment using statistical methods, machine learning models, and multiple chemical transport models, Atmos. Chem. Phys., 25, 7991–8028, https://doi.org/10.5194/acp-25-7991-2025, 2025.
Luo, Y., Ye, X., Chuai, X., Yu, X., Xu, Y., Li, S., Wang, T., and Xiang, A.: Spatiotemporal patterns and carbon balance of non-grain cultivation across China: coupling coordination analysis and multi-objective optimization, Environ. Dev. Sustain., https://doi.org/10.1007/s10668-025-06776-2, 2025.
Luo, Z., Zhang, Y., Chen, W., Van Damme, M., Coheur, P.-F., and Clarisse, L.: Estimating global ammonia (NH3) emissions based on IASI observations from 2008 to 2018, Atmos. Chem. Phys., 22, 10375–10388, https://doi.org/10.5194/acp-22-10375-2022, 2022.
Lutsch, E., Strong, K., Jones, D. B. A., Ortega, I., Hannigan, J. W., Dammers, E., Shephard, M. W., Morris, E., Murphy, K., Evans, M. J., Parrington, M., Whitburn, S., Van Damme, M., Clarisse, L., Coheur, P., Clerbaux, C., Croft, B., Martin, R. V., Pierce, J. R., and Fisher, J. A.: Unprecedented Atmospheric Ammonia Concentrations Detected in the High Arctic From the 2017 Canadian Wildfires, J. Geophys. Res. Atmospheres, 124, 8178–8202, https://doi.org/10.1029/2019JD030419, 2019.
Ma, S.: High-resolution assessment of ammonia emissions in China: Inventories, driving forces and mitigation, Atmospheric Environment, 229, 117458, https://doi.org/10.1016/j.atmosenv.2020.117458, 2020.
Manisha, K., Singh, I., and Chettry, V.: Investigating and analyzing the causality amid tourism, environment, economy, energy consumption, and carbon emissions using Toda–Yamamoto approach for Himachal Pradesh, India, Environ. Dev. Sustain., 27, 8731–8766, https://doi.org/10.1007/s10668-023-04252-3, 2023.
Na, K., Song, C., Switzer, C., and Cocker, D. R.: Effect of Ammonia on Secondary Organic Aerosol Formation from α-Pinene Ozonolysis in Dry and Humid Conditions, Environ. Sci. Technol., 41, 6096–6102, https://doi.org/10.1021/es061956y, 2007.
Paulot, F., Jacob, D. J., Pinder, R. W., Bash, J. O., Travis, K., and Henze, D. K.: Ammonia emissions in the United States, European Union, and China derived by high-resolution inversion of ammonium wet deposition data: Interpretation with a new agricultural emissions inventory (MASAGE_NH3), Journal of Geophysical Research: Atmospheres, 119, 4343–4364, https://doi.org/10.1002/2013JD021130, 2014.
Phillips, S. B., Aneja, V. P., Kang, D., and Arya, S. P.: Modelling and analysis of the atmospheric nitrogen deposition in North Carolina, International Journal of Global Environmental Issues, 6, 231, https://doi.org/10.1504/IJGENVI.2006.010156, 2006.
Pinder, R. W., Adams, P. J., and Pandis, S. N.: Ammonia Emission Controls as a Cost-Effective Strategy for Reducing Atmospheric Particulate Matter in the Eastern United States, Environ. Sci. Technol., 41, 380–386, https://doi.org/10.1021/es060379a, 2007.
Pinder, R. W., Gilliland, A. B., and Dennis, R. L.: Environmental impact of atmospheric NH3 emissions under present and future conditions in the eastern United States, Geophysical Research Letters, 35, 2008GL033732, https://doi.org/10.1029/2008GL033732, 2008.
Santamouris, M.: Energy and climate in the urban built environment, Routledge, https://doi.org/10.4324/9781315073774, 2013.
Shao, S.-C., Chang, Y.-H., Cao, F., Ling, Y.-Q., Fan, M.-Y., Xie, F., Hong, Y.-H., and Zhang, Y.-L.: High-frequency evolution of urban atmospheric ammonia and ammonium and its gas-to-particle conversion mechanism in Nanjing City, Huan Jing ke Xue = Huanjing Kexue, 40, 4355–4363, https://doi.org/10.13227/j.hjkx.201904050, 2019.
Shephard, M. W. and Cady-Pereira, K. E.: Cross-track Infrared Sounder (CrIS) satellite observations of tropospheric ammonia, Atmos. Meas. Tech., 8, 1323–1336, https://doi.org/10.5194/amt-8-1323-2015, 2015.
Shephard, M. W., Cady-Pereira, K. E., Luo, M., Henze, D. K., Pinder, R. W., Walker, J. T., Rinsland, C. P., Bash, J. O., Zhu, L., Payne, V. H., and Clarisse, L.: TES ammonia retrieval strategy and global observations of the spatial and seasonal variability of ammonia, Atmos. Chem. Phys., 11, 10743–10763, https://doi.org/10.5194/acp-11-10743-2011, 2011.
Shephard, M. W., Dammers, E., Cady-Pereira, K. E., Kharol, S. K., Thompson, J., Gainariu-Matz, Y., Zhang, J., McLinden, C. A., Kovachik, A., Moran, M., Bittman, S., Sioris, C. E., Griffin, D., Alvarado, M. J., Lonsdale, C., Savic-Jovcic, V., and Zheng, Q.: Ammonia measurements from space with the Cross-track Infrared Sounder: characteristics and applications, Atmos. Chem. Phys., 20, 2277–2302, https://doi.org/10.5194/acp-20-2277-2020, 2020.
Shephard, M. W., Kharol, S. K., Dammers, E., Sioris, C. E., Bell, A., Jansen, R., Caron, J., Snel, R., Palombo, E., and Cady-Pereira, K. E.: Infrared Satellite Detection Limits for Monitoring Atmospheric Ammonia, IEEE Journal of Selected Topics in Applied Earth Observations and Remote Sensing, https://doi.org/10.1109/JSTARS.2025.3557240, 2025.
Someya, Y., Imasu, R., Shiomi, K., and Saitoh, N.: Atmospheric ammonia retrieval from the TANSO-FTS/GOSAT thermal infrared sounder, Atmos. Meas. Tech., 13, 309–321, https://doi.org/10.5194/amt-13-309-2020, 2020.
Song, X.: Study on the present situation and countermeasures of agricultural sustainable development in Huang-Huai-Hai Plain, Agricultural Science, 7, 74–76, https://doi.org/10.12238/as.v7i5.2493, 2024.
Van Damme, M., Clarisse, L., Whitburn, S., Hadji-Lazaro, J., Hurtmans, D., Clerbaux, C., and Coheur, P.-F.: Industrial and agricultural ammonia point sources exposed, Nature, 564, 99–103, https://doi.org/10.1038/s41586-018-0747-1, 2018.
Van Damme, M., Clarisse, L., Franco, B., Sutton, M. A., Erisman, J. W., Kruit, R. W., Van Zanten, M., Whitburn, S., Hadji-Lazaro, J., and Hurtmans, D.: Global, regional and national trends of atmospheric ammonia derived from a decadal (2008–2018) satellite record, Environmental Research Letters, 16, 055017, https://doi.org/10.1088/1748-9326/abd5e0, 2021.
van der Graaf, S. C., Dammers, E., Schaap, M., and Erisman, J. W.: Technical note: How are NH3 dry deposition estimates affected by combining the LOTOS-EUROS model with IASI-NH3 satellite observations?, Atmos. Chem. Phys., 18, 13173–13196, https://doi.org/10.5194/acp-18-13173-2018, 2018.
van der Graaf, S., Dammers, E., Segers, A., Kranenburg, R., Schaap, M., Shephard, M. W., and Erisman, J. W.: Data assimilation of CrIS NH3 satellite observations for improving spatiotemporal NH3 distributions in LOTOS-EUROS, Atmos. Chem. Phys., 22, 951–972, https://doi.org/10.5194/acp-22-951-2022, 2022.
Wang, R., Pan, D., Guo, X., Sun, K., Clarisse, L., Van Damme, M., Coheur, P.-F., Clerbaux, C., Puchalski, M., and Zondlo, M. A.: Bridging the spatial gaps of the Ammonia Monitoring Network using satellite ammonia measurements, Atmos. Chem. Phys., 23, 13217–13234, https://doi.org/10.5194/acp-23-13217-2023, 2023.
Warner, J. X., Dickerson, R. R., Wei, Z., Strow, L. L., Wang, Y., and Liang, Q.: Increased atmospheric ammonia over the world's major agricultural areas detected from space, Geophysical Research Letters, 44, 2875–2884, https://doi.org/10.1002/2016GL072305, 2017.
White, E., Shephard, M. W., Cady-Pereira, K. E., Kharol, S. K., Ford, S., Dammers, E., Chow, E., Thiessen, N., Tobin, D., Quinn, G., O'Brien, J., and Bash, J.: Accounting for Non-Detects: Application to Satellite Ammonia Observations, Remote Sens (Basel), 15, 2610, https://doi.org/10.3390/rs15102610, 2023.
Wu, Y., Gu, B., Erisman, J. W., Reis, S., Fang, Y., Lu, X., and Zhang, X.: PM2.5 pollution is substantially affected by ammonia emissions in China, Environmental Pollution, 218, 86–94, https://doi.org/10.1016/j.envpol.2016.08.027, 2016.
Xi, Y., Zhu, J., Zhang, Q., Dai, G., He, N., and Wang, Q.: Hysteresis response of wet nitrate deposition to emission reduction in Chinese terrestrial ecosystems, Atmospheric Environment, 260, 118555, https://doi.org/10.1016/j.atmosenv.2021.118555, 2021.
Xu, W., Luo, X. S., Pan, Y. P., Zhang, L., Tang, A. H., Shen, J. L., Zhang, Y., Li, K. H., Wu, Q. H., Yang, D. W., Zhang, Y. Y., Xue, J., Li, W. Q., Li, Q. Q., Tang, L., Lu, S. H., Liang, T., Tong, Y. A., Liu, P., Zhang, Q., Xiong, Z. Q., Shi, X. J., Wu, L. H., Shi, W. Q., Tian, K., Zhong, X. H., Shi, K., Tang, Q. Y., Zhang, L. J., Huang, J. L., He, C. E., Kuang, F. H., Zhu, B., Liu, H., Jin, X., Xin, Y. J., Shi, X. K., Du, E. Z., Dore, A. J., Tang, S., Collett Jr., J. L., Goulding, K., Sun, Y. X., Ren, J., Zhang, F. S., and Liu, X. J.: Quantifying atmospheric nitrogen deposition through a nationwide monitoring network across China, Atmos. Chem. Phys., 15, 12345–12360, https://doi.org/10.5194/acp-15-12345-2015, 2015.
Xu, W., Liu, X., Liu, L., Dore, A. J., Tang, A., Lu, L., Wu, Q., Zhang, Y., Hao, T., Pan, Y., Chen, J., and Zhang, F.: Impact of emission controls on air quality in Beijing during APEC 2014: Implications from water-soluble ions and carbonaceous aerosol in PM2.5 and their precursors, Atmospheric Environment, 210, 241–252, https://doi.org/10.1016/j.atmosenv.2019.04.050, 2019a.
Xu, W., Zhang, L., and Liu, X.: A database of atmospheric nitrogen concentration and deposition from the nationwide monitoring network in China, Scientific Data, 6, 51, https://doi.org/10.1038/s41597-019-0061-2, 2019b.
Yang, J. and Huang, X.: The 30 m annual land cover dataset and its dynamics in China from 1990 to 2019, Earth Syst. Sci. Data, 13, 3907–3925, https://doi.org/10.5194/essd-13-3907-2021, 2021.
Zavyalov, V., Esplin, M., Scott, D., Esplin, B., Bingham, G., Hoffman, E., Lietzke, C., Predina, J., Frain, R., Suwinski, L., Han, Y., Major, C., Graham, B., and Phillips, L.: Noise performance of the CrIS instrument, J. Geophys. Res. Atmospheres, 118, https://doi.org/10.1002/2013JD020457, 2013.
Zeng, Z.-C., Lee, L., Qi, C., Clarisse, L., and Van Damme, M.: Optimal estimation retrieval of tropospheric ammonia from the Geostationary Interferometric Infrared Sounder on board FengYun-4B, Atmos. Meas. Tech., 16, 3693–3713, https://doi.org/10.5194/amt-16-3693-2023, 2023.
Zhan, X., Adalibieke, W., Cui, X., Winiwarter, W., Reis, S., Zhang, L., Bai, Z., Wang, Q., Huang, W., and Zhou, F.: Improved Estimates of Ammonia Emissions from Global Croplands, Environ. Sci. Technol., 55, 1329–1338, https://doi.org/10.1021/acs.est.0c05149, 2021.
Zhang, J., Ji, D., Hu, C., Griffis, T. J., Xiao, Q., Ai, X., Liu, H., Shi, X., Sun, F., Qi, B., and Xiao, W.: Multiple-model based simulation of urban atmospheric methane concentration and the attributions to its seasonal variations: A case study in Hangzhou megacity, China, Environmental Pollution, 361, 124781, https://doi.org/10.1016/j.envpol.2024.124781, 2024.
Zhang, L., Jacob, D. J., Knipping, E. M., Kumar, N., Munger, J. W., Carouge, C. C., van Donkelaar, A., Wang, Y. X., and Chen, D.: Nitrogen deposition to the United States: distribution, sources, and processes, Atmos. Chem. Phys., 12, 4539–4554, https://doi.org/10.5194/acp-12-4539-2012, 2012.
Zhang, X., Wu, Y., Liu, X., Reis, S., Jin, J., Dragosits, U., Van Damme, M., Clarisse, L., Whitburn, S., Coheur, P.-F., and Gu, B.: Ammonia Emissions May Be Substantially Underestimated in China, Environ. Sci. Technol., 51, 12089–12096, https://doi.org/10.1021/acs.est.7b02171, 2017.
Zhang, X., Gu, B., van Grinsven, H., Lam, S. K., Liang, X., Bai, M., and Chen, D.: Societal benefits of halving agricultural ammonia emissions in China far exceed the abatement costs, Nat. Commun., 11, 4357, https://doi.org/10.1038/s41467-020-18196-z, 2020.
Zheng, B., Tong, D., Li, M., Liu, F., Hong, C., Geng, G., Li, H., Li, X., Peng, L., Qi, J., Yan, L., Zhang, Y., Zhao, H., Zheng, Y., He, K., and Zhang, Q.: Trends in China's anthropogenic emissions since 2010 as the consequence of clean air actions, Atmos. Chem. Phys., 18, 14095–14111, https://doi.org/10.5194/acp-18-14095-2018, 2018.
Zhu, L., Henze, D. K., Bash, J. O., Cady-Pereira, K. E., Shephard, M. W., Luo, M., and Capps, S. L.: Sources and Impacts of Atmospheric NH3: Current Understanding and Frontiers for Modeling, Measurements, and Remote Sensing in North America, Curr. Pollution Rep., 1, 95–116, https://doi.org/10.1007/s40726-015-0010-4, 2015.