the Creative Commons Attribution 4.0 License.
the Creative Commons Attribution 4.0 License.
 | 03 Dec 2025
Regime-based aerosol–cloud interactions from CALIPSO-MODIS and the Energy Exascale Earth System Model version 2 (E3SMv2) over the Eastern North Atlantic
David Painemal
Meng Zhang
Shaocheng Xie
Zhujun Li
Robert Jacob
Bethany Lusch
This study investigates aerosol-cloud interactions in marine boundary layer (MBL) clouds using an advanced deep-learning-driven synoptic-regime-based framework, combining satellite data (CALIPSO vertically resolved aerosol extinction and MODIS cloud properties) with 1° nudged Energy Exascale Earth System Model version 2 (E3SMv2) simulation over the Eastern North Atlantic (ENA; , 2006–2014). The E3SMv2 captures observed seasonal variations in cloud droplet number concentrations (Nd) and liquid water path (LWP), though it systematically underestimates Nd. We then partition ENA meteorology into four synoptic regimes (Pre-Trough, Post-Trough, Ridge, Trough) via a deep-learning clustering of ERA5 reanalysis fields, enabling regime-dependent aerosol-cloud interactions analyses. Both satellite and E3SMv2 exhibit an inverted-V LWP-Nd relationship. In Post-Trough and Ridge regimes, the satellite shows stronger negative LWP-Nd sensitivities than in Pre-Trough regime. The Trough regime displays a muted satellite LWP response. In comparison, the model predicts more exaggerated LWP responses across regimes, with LWP increasing too quickly at low Nd and decreasing more sharply at high Nd, especially in Pre-Trough and Trough regimes. These exaggerated model LWP sensitivities may stem from uncertainties in representing drizzle processes, entrainment, and turbulent mixing. As for Nd susceptibility to aerosols, Nd increases with MBL aerosol extinction in both datasets, but the simulated aerosol-cloud interactions appear oversensitive to meteorological conditions. Overall, E3SMv2 better captures aerosol effects under regimes that favor stratiform clouds (Post-Trough, Ridge), but performance deteriorates for regimes with deeper, dynamically complex clouds (Trough), highlighting the need for improved representations of those cloud processes in climate models.
- Article
(10723 KB) - Full-text XML
-
Supplement
(817 KB) - BibTeX
- EndNote


Marine boundary layer (MBL) clouds play a pivotal role in regulating the Earth's energy budget due to their extensive coverage over the oceans and high albedo (Albrecht et al., 1995; Wood et al., 2015; Dong et al., 2023; Wall et al., 2023). Central to the quantification of the radiative impact of MBL cloud properties is to determine the sensitivity of clouds to the presence of aerosols. Aerosols can impact cloud microphysical properties, such as the cloud droplet number concentration (Nd) and droplet effective radius (re), and, consequently, alter cloud optical and macrophysical properties, including liquid water path (LWP) and cloud fraction (Twomey, 1977; Albrecht, 1989; Zheng et al., 2020; Dedrick et al., 2025). The interactions between aerosols and clouds, commonly termed aerosol-cloud interactions (ACI), contribute to one of the largest uncertainties in climate projections (IPCC, 2021). These uncertainties in the aerosol-induced cloud microphysical responses and the accompanying cloud adjustments stem from the inherent complexity of cloud microphysical processes (e.g., droplet activation, precipitation suppression, and entrainment-induced evaporation) and their interactions with dynamically evolving MBL, where aerosol perturbations can potentially contribute to either the brightening or darkening of clouds (Wall et al., 2022; Feingold et al., 2024).
Satellite remote sensing observations are essential in efforts to quantify the cloud adjustment to aerosol perturbations, by providing spatially extensive datasets. Numerous studies using satellite data have demonstrated a significant relationship and progressively advanced our understanding of cloud adjustments to aerosols (Bellouin et al., 2020; Diamond et al., 2020; Yuan et al., 2023; Feingold, et al., 2025; Goren et al., 2025). Observational evidence frequently shows that, at lower Nd conditions, with the increased aerosol concentration, cloud droplets become more numerous in smaller sizes. It leads to decrease in efficiency in colliding and coalescing into raindrops and suppress precipitation (Albrecht, 1989). This suppression results in less cloud water being lost through rainfall and, consequently, an increase in LWP. Furthermore, the combined effects of entrainment-sedimentation feedback and precipitation-stabilization may lead to weaker entrainment drying in relatively clean clouds, further enhancing the LWP under lower Nd conditions (Bretherton et al., 2007; Wood, 2012; Possner et al., 2020). In contrast, at higher Nd levels, the increased abundance of small droplets expands the surface area available for evaporation at the cloud top (Gupta et al., 2021; Zhang et al., 2022; Zheng et al., 2022a). This enhancement in evaporation promotes cooling and intensifies localized turbulent mixing, which, in turn, facilitates the entrainment of dry air from above the cloud. The subsequent mixing further accelerates the evaporation of cloud droplets, reducing the overall liquid water content and decreasing LWP. However, distinguishing causality from correlations is a persistent challenge, as atmospheric variability, retrieval biases, and sampling limitations can obscure true aerosol-induced effects (Arola et al., 2022; Goren et al., 2023; Liu et al., 2024).
Parallel to observational advances, the modeling community has made significant progress in simulating aerosol-cloud interactions within global climate models (GCMs). Recent GCM versions incorporate more physically based cloud microphysics parameterizations, which enable the simulation of precipitation suppression and enhanced entrainment responding to aerosol changes. For instance, studies by Mülmenstädt et al. (2024a) show that some of the GCMs in the Coupled Model Intercomparison Project Phase 6 (CMIP6), namely the US Department of Energy (DOE) Exascale Earth System Model version 1 (E3SMv1; Golaz et al., 2019) and others, can capture the inverted V-shaped relationship between LWP and Nd, as often observed from satellite retrievals, although discrepancies persist regarding the causal interpretation of these relationships. Tang et al. (2024) highlights that even when E3SM version 2 (E3SMv2; Golaz et al., 2022) simulates the overall cloud macrostructure, the microphysical responses to aerosol perturbations are still subject to systematic uncertainties related to precipitation processes and turbulence–microphysics interactions. Collectively, these studies illustrate both the strides made and challenges remained in representing aerosol-cloud interactions in large-scale models. While some GCMs may successfully replicate observed negative LWP-Nd relationships under the present-day conditions, they struggle to accurately simulate the turbulence, entrainment, and precipitation feedback, that govern cloud adjustments to aerosol changes (Mülmenstädt et al., 2024b). Assessing model performance in simulating cloud microphysical responses to aerosol perturbations using observation is a crucial step toward improving the process-level understanding.
Accurate assessment of aerosol effects on cloud microphysics faces several hurdles. Methodological inconsistencies in sampling, aerosol proxies, and comparison metrics limit direct observation-model comparisons. Studies that use vertical aerosol extinction profiles rather than column integrated aerosol optical depth report stronger links between aerosols and cloud microphysics, highlighting the need for refined observational strategies (Painemal et al., 2019, 2020). Furthermore, satellite retrieval errors, vertical mismatch between aerosol and cloud layer, updraft variability, and precipitation effects, can bias the estimates of cloud sensitivity to aerosol perturbations (Quaas et al., 2020; Gryspeerdt et al., 2022; Jia et al., 2022; Alexandri et al., 2024). Uncertainties in cloud adjustment processes, particularly the balance between precipitation suppression and entrainment driven evaporation, remain a persistent source of discrepancy between observational inferences and model simulations (Mülmenstädt et al., 2024b; Zhang and Feingold, 2023). These challenges are compounded by the complex, multiscale nature of ACIs, where small-scale processes interact nonlinearly with larger-scale meteorological drivers. Moreover, synoptic systems organize boundary-layer clouds on multi-day timescales and strongly modulate aerosol-cloud-precipitation pathways (Mechem et al., 2018; Lee et al., 2025). Therefore, quantifying the untangled aerosol-cloud sensitivities require conditioning on the synoptic environment. For example, Zhang et al. (2022) found that the relationship between LWP and Nd is not only sensitive to aerosol loading but also modulated by the underlying meteorological conditions. And McCoy et al. (2020) used a cyclone compositing approach to demonstrate that aerosol-cloud interactions (e.g., the sign of LWP change with Nd) can differ inside vs. outside midlatitude cyclones. These considerations motivate our use of an objective synoptic-regime classification to control meteorology when evaluating the synoptic-regime-dependent ACI.
The Eastern North Atlantic (ENA) region is uniquely advantageous for advancing our understanding of ACIs in MBL clouds (Wood et al., 2015; Tian et al., 2025). Located at the confluence of subtropical and midlatitude air masses, the ENA is characterized by diverse meteorological conditions and cloud regimes. This region frequently experiences well-organized stratocumulus cloud decks and other MBL cloud types, which are sensitive to both local and long-range transported aerosols (Wang et al., 2020b, 2022). Observations document distinct aerosol and cloud properties, and the relatively pristine marine background punctuated by episodic aerosol events helps separate aerosol driven cloud adjustments from meteorological variability (Zheng et al., 2022b; Varble et al., 2023; Christensen et al., 2024; Qiu et al., 2024). Moreover, the ENA has been extensively sampled, with long-term observational data collected at multiple spatiotemporal resolutions from various platforms including the DOE's Atmospheric Radiation Measurement (ARM) research facility (Wood et al., 2015), and several satellite remote sensing products such as those from the Cloud Aerosol Lidar and Infrared Pathfinder Satellite Observations (CALIPSO; Winker et al., 2009), and the MOderate Resolution Imaging Spectroradiometer (MODIS) on board Terra and Aqua (Barnes et al., 1998; Platnick et al., 2003; King et al., 2013). These comprehensive observational datasets make the ENA an ideal testbed for evaluating model aerosol-cloud interactions.
In this study, we employ a novel regime-based evaluation framework that combines the recently developed CALIPSO-derived vertical-resolved aerosol extinction profiles and MODIS-derived cloud properties with simulations from the DOE E3SM version 2 (E3SMv2). By applying a clustered-meteorology-regime-based analysis over the ENA, we aim to isolate the impact of aerosol perturbations on cloud microphysical properties by regime and seek to provide a robust observational and modeling framework for quantitatively assessing aerosol-induced cloud adjustments. This approach is not only intended for reconciling discrepancies between satellite observations and model simulations but also for informing about potential model uncertainties in ACIs in connection with specific meteorological regimes. The data and methods used in this study are introduced in Sect. 2. The seasonality of aerosols, clouds, and their interactions are introduced in Sect. 3. And more importantly, Sect. 4 presents the meteorological-regime-based analysis of the aerosol-cloud interaction and cloud adjustments. Section 5 summarizes conclusions with discussion, and outlines future work.
2.1 Satellite retrievals of aerosols and clouds
In this study, aerosol extinction coefficient (σEXT) is a research product derived from the Cloud-Aerosol Lidar with Orthogonal Polarization (CALIOP) on the CALIPSO. These retrievals are produced at a 1 km along-track resolution using the Fernald–Klett iterative approach, constrained by an independent CALIOP-based aerosol optical depth (AOD), and are limited to cloud-free pixels. The retrieved profiles have been evaluated against airborne High Spectral Resolution Lidar (HSRL) measurements during the Caribbean 2010 field campaign and show good agreement. The detailed aerosol retrieval methodology and product evaluation are described in Painemal et al. (2019) and Li et al. (2022).
Cloud properties, including the liquid water path (LWP) and the cloud droplet number concentration (Nd), are obtained from MODIS Aqua at 1 km resolution using Clouds and Earth's Radiant Energy System (CERES) Edition 4.0 algorithms (Minnis et al., 2021). The MODIS-retrieved LWP is estimated to have uncertainties of approximately 10 %–15 % when compared with ARM surface-based observations (Xi et al., 2014; Painemal et al., 2016). The Nd is retrieved using the adiabatic formulation (Painemal and Zuidema, 2011; Grosvenor et al., 2018):
Where the cloud droplet effective radius (re) and cloud optical depth (τ) are estimated from MODIS 3.79 and 0.64 µm bands, respectively (Painemal et al., 2020). Γ denotes the adiabatic lapse rate of condensation (Albrecht et al., 1990), which is calculated from the cloud-top temperature and pressure derived from MODIS (Painemal et al., 2020). ρW is the water density and k represents the ratio between the cloud droplet volume mean radius and the effective radius, assumed to be constant at 0.8 (Martin et al., 1994).
Although the relative errors in Nd retrieval can be significant at the pixel scale (Grosvenor et al., 2018), previous studies have shown that the Nd compares well with measurements from 11 aircraft campaigns, demonstrating a decent correlation when sampling the marine stratocumulus clouds, with r2 values of 0.5∼0.8 (Gryspeerdt et al., 2022). Therefore, to minimize known retrieval uncertainties, we focus on low-level liquid clouds where satellite Nd shows the strongest aircraft agreement and typical normalized root mean squared deviation of (Gryspeerdt et al., 2022). Moreover, the aggregated collocation method significantly reduces the MODIS Aqua Nd bias (Painemal et al., 2020), resulting in a relationship between aerosol and cloud properties less affected by artifacts. Note that to avoid diurnal variations in aerosol-cloud relationships, we fix the sampling to the Aqua local-afternoon overpass and do not merge with Terra morning orbits, while extending the collocation and quality-control framework to Terra is left for future work.
To collocate aerosol and cloud retrievals from the two satellite datasets, the following matching method is employed. For each 1 km CALIOP aerosol pixel, five 1 km MODIS pixels are selected on each side of the CALIPSO track (thus 10 MODIS pixels in total). The CALIOP retrievals are first averaged to produce a 5 km along-track resolution product, and the MODIS cloud retrievals are aggregated into four 5 km×5 km grids (two grids east and two west of the CALIPSO track). These datasets are then further averaged over approximately 25 km along-track segments, ensuring that the aerosol and cloud data are matched at similar spatial scales. Hence, the clear-sky aerosol extinction profiles can be collocated in the vicinity of the clouds, enabling the “simultaneous” assessment of aerosol-cloud interaction from the satellite data around 01:00 p.m. local time over ENA region. In addition, the CloudSat Cloud Profiling Radar (CPR) is used to determine precipitation status from the satellite. The drizzle condition is defined as the ratio of pixels with maximum radar reflectivity between −15 and −7 dBZ to the total number of pixels (19) within the 25 km satellite collocated segment, while the thresholds for light rain and rain conditions are defined as maximum radar reflectivity greater than −7 dBZ but less than zero dBZ, and greater than 0 dBZ, respectively. For a detailed description of the data-matching strategy, please refer to Painemal et al. (2020) and Li et al. (2025).
To simplify terminology, all aerosol and cloud properties retrieved from the different satellite products are hereafter referred to collectively as “satellite” data.
2.2 E3SM simulations
E3SMv2 is a fully coupled Earth System model (Golaz et al., 2022). Its atmospheric component, EAMv2, closely follows its predecessor EAMv1, as described in Rasch et al. (2019) and Xie et al. (2018), with only minor updates to its physical parameterizations. EAMv2 employs a spectral element dynamical core with approximately 110 km horizontal resolution and 72 vertical layers. The radiation and aerosol treatments in EAMv2 follow the Rapid Radiative Transfer Model (RRTM; Mlawer et al., 1997) and the four-mode version of the Modal Aerosol Module (MAM4; Liu et al., 2016; Wang et al., 2020a), respectively. Turbulence, shallow convection, and cloud macrophysics are handled by the Cloud Layers Unified by Binormals (CLUBB) scheme (Larson, 2017; Golaz et al., 2022), while stratiform cloud microphysics is simulated by the Morrison-Gettelman (MG2) scheme (Gettelman and Morrison, 2015). Deep convection is represented by the Zhang and McFarlane Scheme (Zhang and McFarlane, 1995), as in EAMv1, but with a revised convective triggering function in EAMv2 that improves the simulation of precipitation and its diurnal cycle (Xie et al., 2019).
In this study, EAMv2 was run at standard resolution (∼ 110 km) with the meteorology nudged to ERA5. The model was nudged toward the ERA5 zonal (U) and meridional (V) wind and temperature fields using a relaxation time of 6 h. This nudging reduces errors in the simulated large-scale state, facilitating the examination of aerosols and clouds. The nudged simulations reduce errors in simulated meteorological conditions, facilitating the examination of aerosol and clouds. Hourly outputs are available from 2006–2014 over the ENA domain (33.5–43.5° N, 23–33° W), comprising 54 model columns. The σEXT profile is directly outputted from the model. The MBL cloud samples are defined below 680 hPa to better match the satellite observations, and a cloud fraction threshold greater than 5 % is used to determine a valid MBL cloud layer as in Kang et al. (2024). To further compare with the MODIS-retrieved cloud-top height (CTH), CTH is inferred by the diagnosed inversion height in E3SM. The inversion height is determined where is minimized, with the θl denoting liquid-water potential temperature and RH denoting relative humidity derived from the model outputs. Given the coarse vertical resolution of E3SM near the cloud top (), this approach accounts for strong thermodynamic inversions and the effects of entraining dry air from the free troposphere (Erfani et al., 2022). The cloud-base height (CBH) is similarly identified using the 5 % cloud fraction threshold. The in-cloud Nd is obtained from grid-box-averaged cloud liquid number, weighted by cloud fraction at each vertical level. Lastly, the cloud LWP is computed by integrating the in-cloud liquid water content (LWC) between cloud-top (CTH) and cloud-base (CBH) levels: .
2.3 Clustering Model
Clustering meteorological patterns allows us to systematically characterize and categorize the diverse atmospheric conditions that modulate aerosol-cloud interactions in the ENA region. By identifying distinct meteorological regimes, we can, to some extent, isolate the aerosol-driven microphysical responses from the meteorological variability. In this study, we adapted an advanced deep learning-based clustering model proposed by Faruque et al. (2023), which features the architecture of the convolutional neural networks (CNN), and long short-term memory (LSTM) layers combined with a Deep Embedded Clustering (DEC) framework. This hybrid CNN-LSTM-DEC model was designed to capture complex spatiotemporal dependencies in meteorological data, overcoming limitations associated with conventional clustering methods that often treat spatial and temporal features separately (Zheng et al., 2025c).
The clustering model was applied to ERA5 reanalysis data over a domain (33.5–43.5° N, 23–33° W) in the ENA region for 2006–2014, with data at 13:00 LT (01:00 p.m. local time) daily to better match the time of satellite records. Input variables included 500 hPa geopotential height (Z500), mean sea level pressure (SLP), and the 10 m u and v wind components. The CNN-LSTM-DEC architecture employs a sequence-to-sequence autoencoder with an encoder comprising four convolutional blocks (with filter sizes of 64, 128, 256, and 512), each followed by max-pooling to distill spatial features. An LSTM layer with 512 units captures temporal dependencies, and a dense layer with 256 units (using ReLU activation) defines the compressed latent space. A key aspect of our study was the fine-tuning of model hyperparameters through the grid search technique, which enabled us to systematically optimize clustering performance. The optimal configuration utilized a Stochastic Gradient Descent (SGD) optimizer with a learning rate of 0.01, momentum of 0.95, and a batch size of 32.
We first pretrained the CNN-LSTM autoencoder using a reconstruction loss. Then, the latent features extracted by the encoder were clustered using K-means, with which clustering into four groups yielded the highest silhouette score of 0.267, compared to scores of 0.257, 0.178, and 0.167 for five, six, and seven clusters, respectively. Hence, the determination of final cluster numbers (four, in this study) is based on a combination of silhouette score analysis (i.e., measures of cluster cohesion and separation for different cluster numbers) and the sensitivity of aerosol and cloud property distinctions to the chosen number of clusters.
To further refine the clustering assignments, we then ran DEC with that fixed cluster number of four, as determined with K-means optimization. DEC was initialized by the K-means centroids and optimized the KL-divergence clustering loss (between soft assignments and a sharpened target distribution) with periodic centroid updates, which increased the silhouette score to 0.358, indicating enhanced cluster cohesion and separation. This two-step clustering process significantly reduced intra-cluster variability while accentuating differences between clusters, as suggested by Faruque et al. (2023). Their work also demonstrated that integrating both CNN and LSTM layers produces more robust latent representations, which are the reduced-dimensional encoding of the input that captures its most significant attributes, compared to CNN-only models or traditional approaches such as K-means and self-organizing maps. Furthermore, Zheng et al. (2025c) showed that including additional meteorological variables, notably the 10 m wind components, improved the model's ability to distinguish subtle synoptic regimes over the ENA region compared to studies that considered Z500 only (e.g., Mechem et al., 2018). Overall, the refined CNN-LSTM-DEC model demonstrates a marked improvement in clustering performance over traditional methods for analyzing large-scale meteorological phenomena.
3.1 Seasonal distribution of cloud properties
Figure 1 illustrates the seasonal variations in the Nd and LWP for low-level clouds over the ENA, from satellite (MODIS) retrievals and E3SMv2. Annual means are and for satellite Nd and LWP, and and for E3SMv2 (Fig. 1e and j). Satellite-derived Nd exhibits a pronounced annual cycle, with the highest mean values during summer (JJA, 121.89 cm−3) and spring (MAM, 102.22 cm−3), followed by fall (SON, 73.36 cm−3), and the lowest during winter (DJF, 60.37 cm−3). E3SMv2 reproduces the Nd trend with a JJA peak 100.06 cm−3 and a DJF minimum 49.00 cm−3 but underestimates Nd in every season (Fig. 1a–d), with the largest low biases in MAM 40.5 cm−3 and JJA 21.83 cm−3. Satellite observations display broader distributions with higher variability especially during MAM (96.09 cm−3) and JJA (123.34 cm−3). In contrast, the E3SMv2 exhibits generally narrower Nd distributions, with distinct peaks at low concentrations in all seasons except JJA. The model bias of overproducing frequent low Nd scenarios in MBL clouds in previous E3SM versions remains in E3SMv2 (Varble et al., 2023; Tang et al., 2023; Kang et al., 2024). Satellite LWP in Fig. 1e to 1 h varies modestly with a DJF maximum (95.38 g m−2) and a JJA minimum (74.46 g m−2). Spread is greatest in DJF and smallest in JJA. E3SMv2 captures the phase with DJF (91.52 g m−2) and JJA (54.31 g m−2) and matches seasonal means best in DJF and SON, yet the distributions are more positively skewed, indicating a tendency for more frequent low LWP.
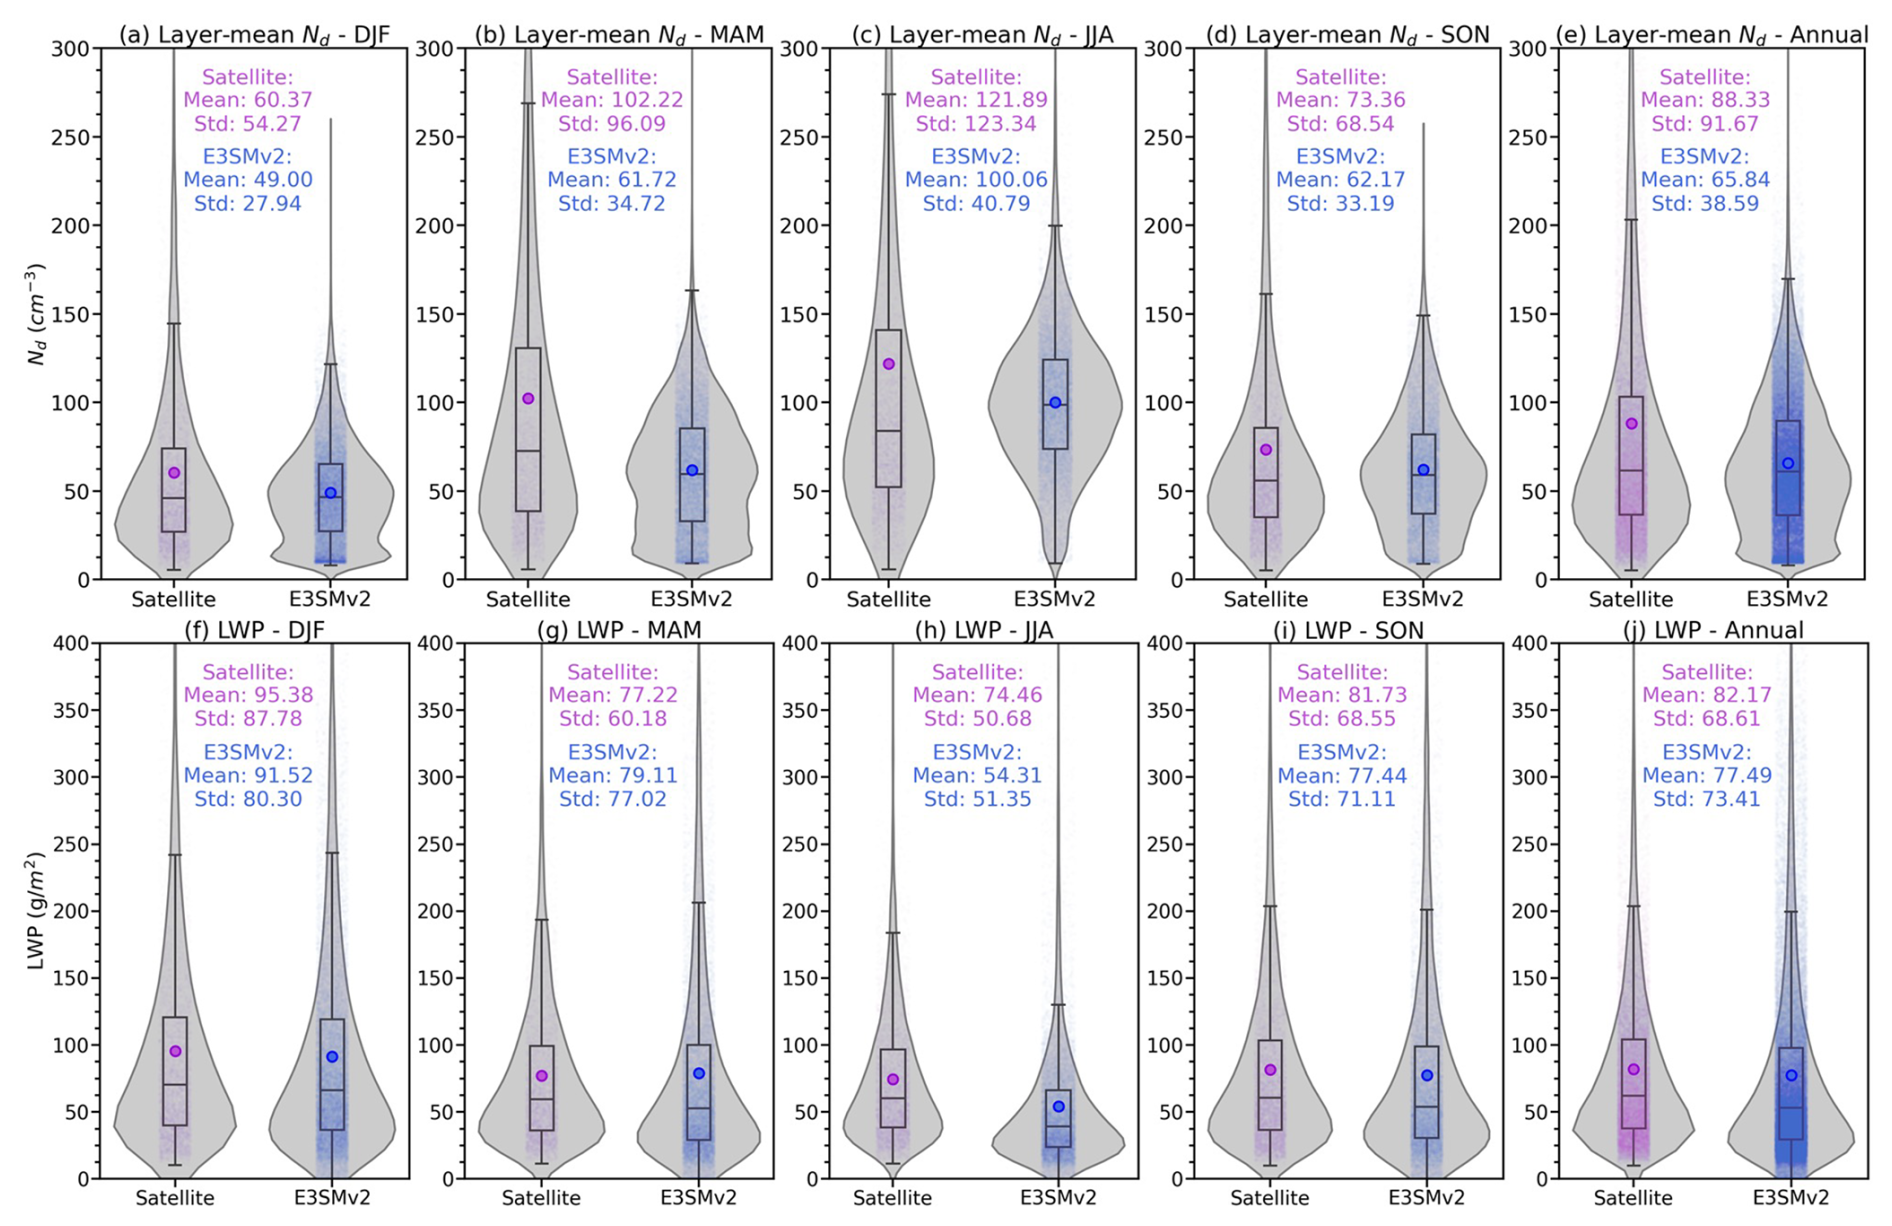
Figure 1Violin plots of cloud droplet number concentration (Nd, top panels) and cloud liquid water path (LWP, bottom panels) from satellite retrievals (purple) and E3SMv2 simulations (blue), during winter, DJF (a, f), spring, MAM (b, g), summer, JJA (c, h), fall, SON (d, i), and Annual (e, j). The mean value is indicated by the color-coded dot. The smoothed shape of each violin shows the Gaussian kernel density estimate (KDE). From top to bottom within each violin, the box plot lines represent the third quartile (Q3, 75th percentile), median (Q2, 50th percentile), and first quartile (Q1, 25th percentile), respectively. The upper whisker extends to (interquartile range), and the lower whisker extends to .
Overall, higher Nd and lower LWP in warm seasons and the opposite in cold seasons agree with prior ground based, satellite, and aircraft evidence (Wu et al., 2020; Varble et al., 2023; Zheng et al., 2024). E3SMv2 successfully captures the broad seasonal variations in both Nd and LWP, but underestimates the amplitude and variability of Nd, especially during the warm seasons, pointing to needed refinements in aerosol cloud interactions and microphysical process representation.
3.2 Responses of LWP to Nd
The dependence of LWP on Nd for both satellite data and E3SMv2 simulations, is presented in Fig. 2. We quantify the response of LWP to changes in Nd using a LWP adjustment index defined as
We compute ℒ0 as the slope of an ordinary least squares fit in log–log space between Nd and LWP. Hence, the ℒ0 derived from satellite observations and model simulations is and , respectively. The “±” values reported are the standard errors (SE) of the slope from that fit (equivalently, 95 % confidence level , under standard linear-regression assumptions). The bulk values are consistent with previous satellite studies over the eastern Atlantic region (Gryspeerdt et al., 2019; Christensen et al., 2023; Zhang et al., 2025). Both datasets show an inverted-V LWP-Nd relationship. LWP rises with Nd at low Nd then turns negative at higher Nd, with a turning point near 20 cm−3. In the observations (Fig. 2a), increasing Nd suppresses precipitation and allows LWP to accumulate at low Nd, while at higher Nd the response becomes negative, consistent with enhanced entrainment and evaporative losses. These results are broadly consistent with prior satellite studies over marine stratocumulus: an inverted-V LWP-Nd relationship has been reported for Nd ranges of in the southeast Pacific (Goren et al., 2025), globally (Gryspeerdt et al., 2019, 2022), and for subtropical stratocumulus (Possner et al., 2020). In contrast, the model simulations appear to generate a similar, yet exaggerated, shape predominantly through parameterized precipitation suppression (Mülmenstädt and Feingold et al., 2018; Mülmenstädt et al., 2024b).
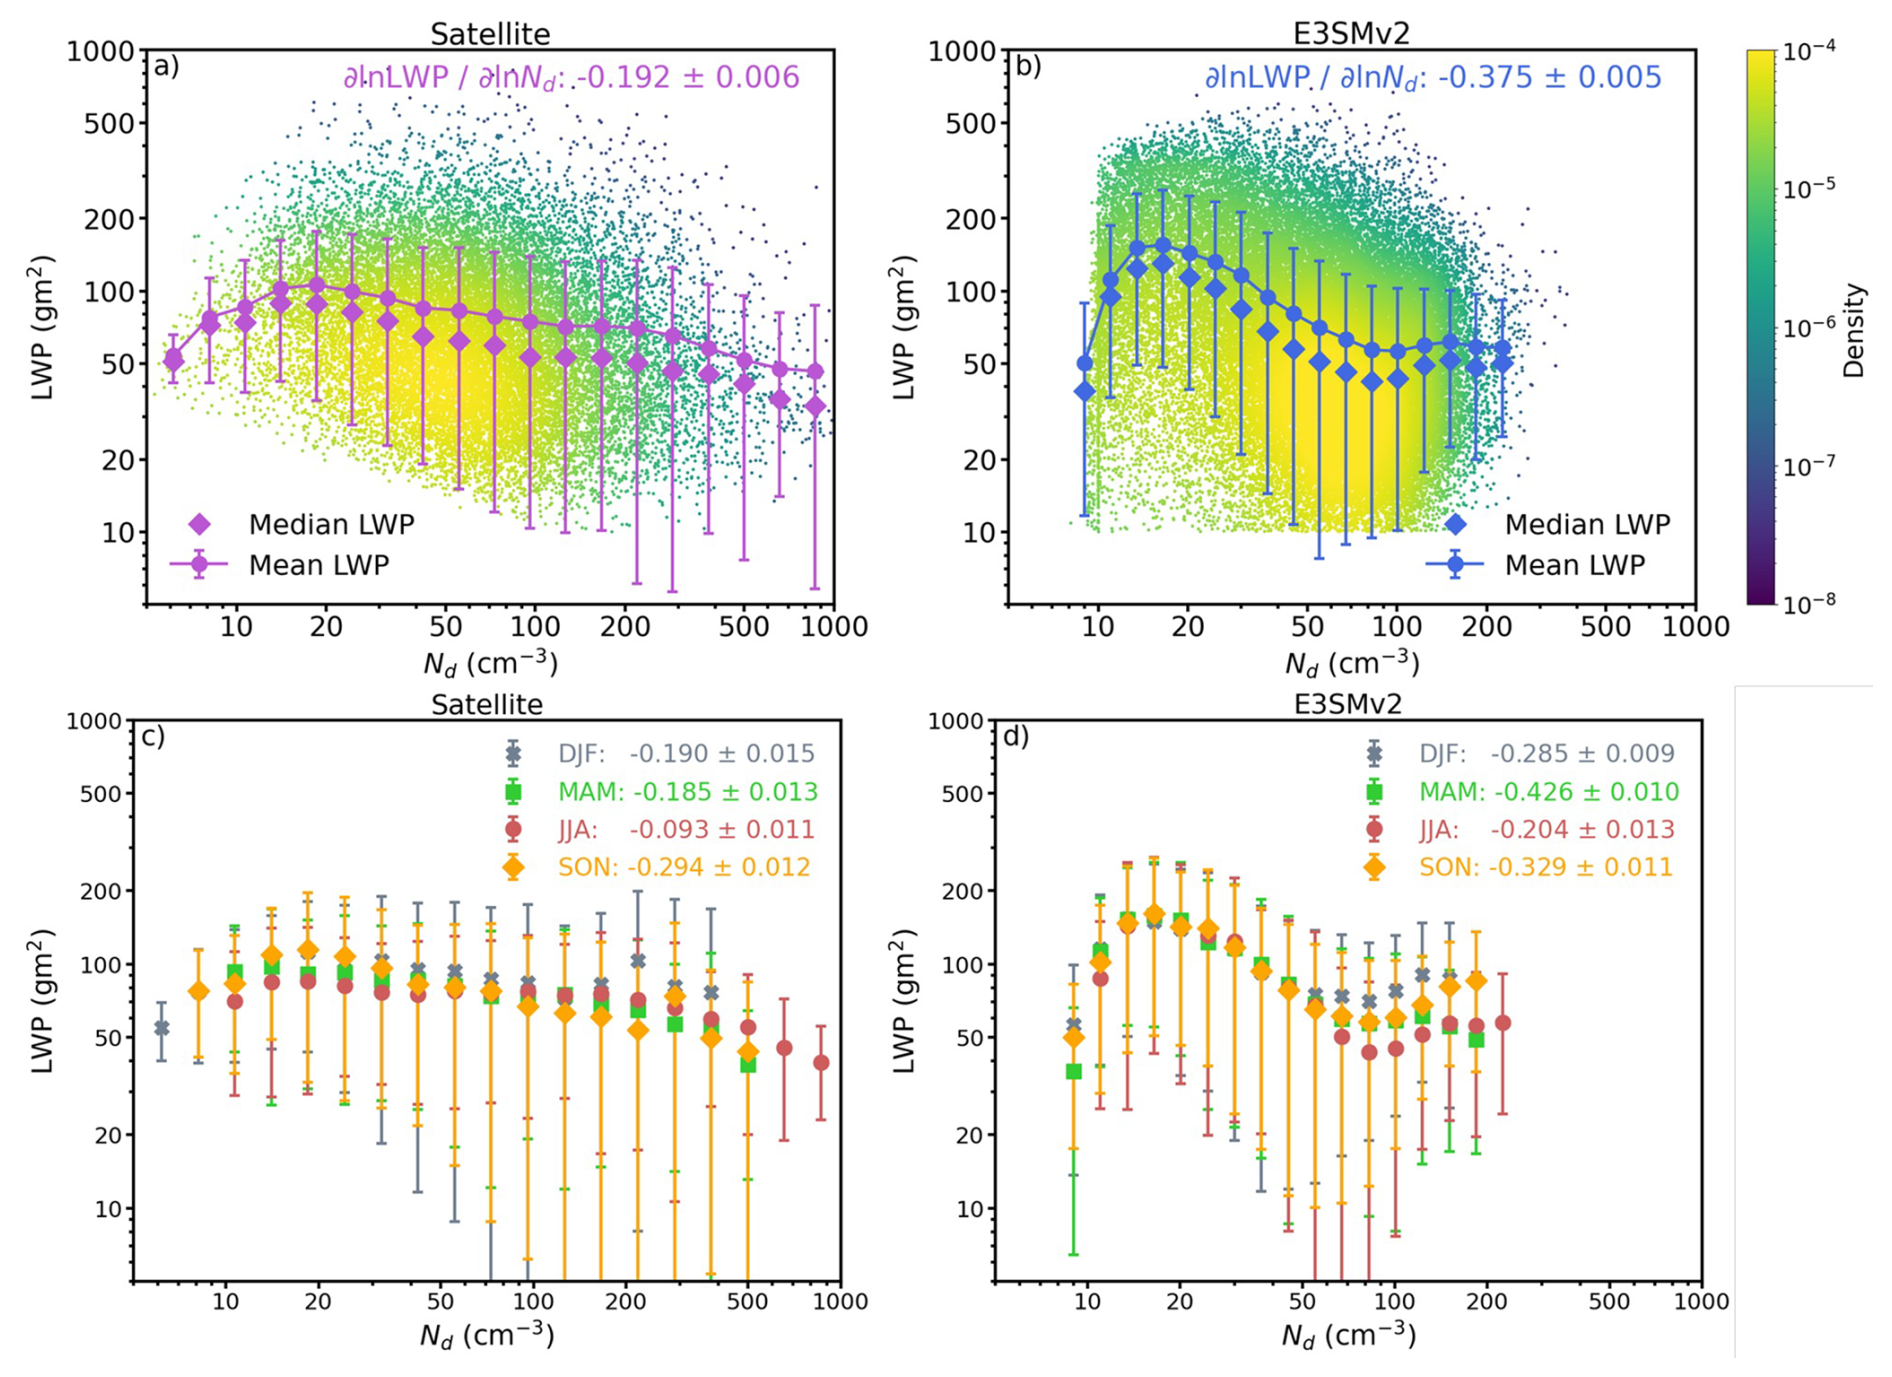
Figure 2Top Panel: Bulk LWP binned as a function of Nd from (a) satellite and (b) E3SMv2, the Gaussian kernel density estimate (KDE) is shown as color-shaded scatter points area. The mean (median) LWP values in Nd bins are shown as solid-dotted lines (diamond symbols); Bottom panel: seasonality of the LWP dependences from (c) satellite and (d) E3SMv2, with colored symbols denote mean LWP in Nd bins. Error bars denote standard deviations of LWP in Nd bins. Slopes are ordinary least squares fits of , and “±” values are standard errors of the fitted slopes.
Global climate models such as E3SMv2 typically lack the resolution to explicitly simulate small-scale turbulent mixing and entrainment, instead, relying on bulk parameterizations that tend to overestimate precipitation suppression (Varble et al., 2023; Mülmenstädt et al., 2024a; Zhang et al., 2024). Noticeably, E3SMv2 (Fig. 2b) captures the relationship between LWP versus Nd qualitatively. However, the model systematically produces higher LWP at low Nd, and lower LWP at high Nd than observation, suggesting that E3SMv2 overestimate the sensitivity of LWP to Nd. This discrepancy may reflect uncertainties in the parameterization of cloud adjustments, particularly those involving entrainment and aerosol-cloud microphysical interactions in E3SMv2, as discussed further in Sect. 4.
The inverted-V shape in the LWP-Nd relationship persists across seasons in both satellite observations and E3SMv2 simulations (Fig. 2c and d), though its intensity and turning point vary. Satellite observations (Fig. 2c) generally exhibit a weaker negative slope of LWP with Nd during winter (DJF) and autumn (SON) than in summer (JJA), with transitional behavior in spring (MAM). In contrast, E3SMv2 (Fig. 2d) show stronger LWP changes with Nd in every season, consistent with the bulk tendency. Despite the overall similarity in seasonal patterns, the discrepancies between the model and observations become more apparent when the data are stratified by season.
To gauge how satellite retrieval uncertainty affects the LWP versus Nd relationship, we note that satellite Nd studies report normalized root-mean-square differences of about 30 %–50 % relative to aircraft data as in Gryspeerdt et al. (2022). In log space a multiplicative Nd error is additive in ln Nd, implying an expected slope damping of roughly 10 %–30 %. Consistent with this expectation, a Monte Carlo test that multiplied satellite Nd by lognormal noise with coefficient of variation and refit the slope 1000 times reduced the bulk satellite slope from −0.192 to a median of −0.157, an attenuation of about 18 %, with a 95 % sensitivity band of −0.170 to −0.143. However, this does not alter the sign or the comparative result reported here, but it does indicate that observed magnitudes should be interpreted with caution.
3.3 Vertical distribution of aerosol extinction coefficient
Figure 3 shows seasonal aerosol extinction profiles over the ENA. Both the satellite record and E3SMv2 feature strongest extinction near the surface below about 1 km with a rapid drop above roughly 2 km. This steep gradient suggests that the aerosols are more concentrated within the MBL, consistent with surface aerosol sources such as the oxidation of dimethyl sulfide (DMS) and sea spray aerosols (Zheng et al., 2018; Wang et al., 2021; Ghate et al., 2023). Also, the relatively higher relative humidity within the MBL might impacts the optical properties of aerosols (Baynard et al., 2006; Feng et al., 2016).
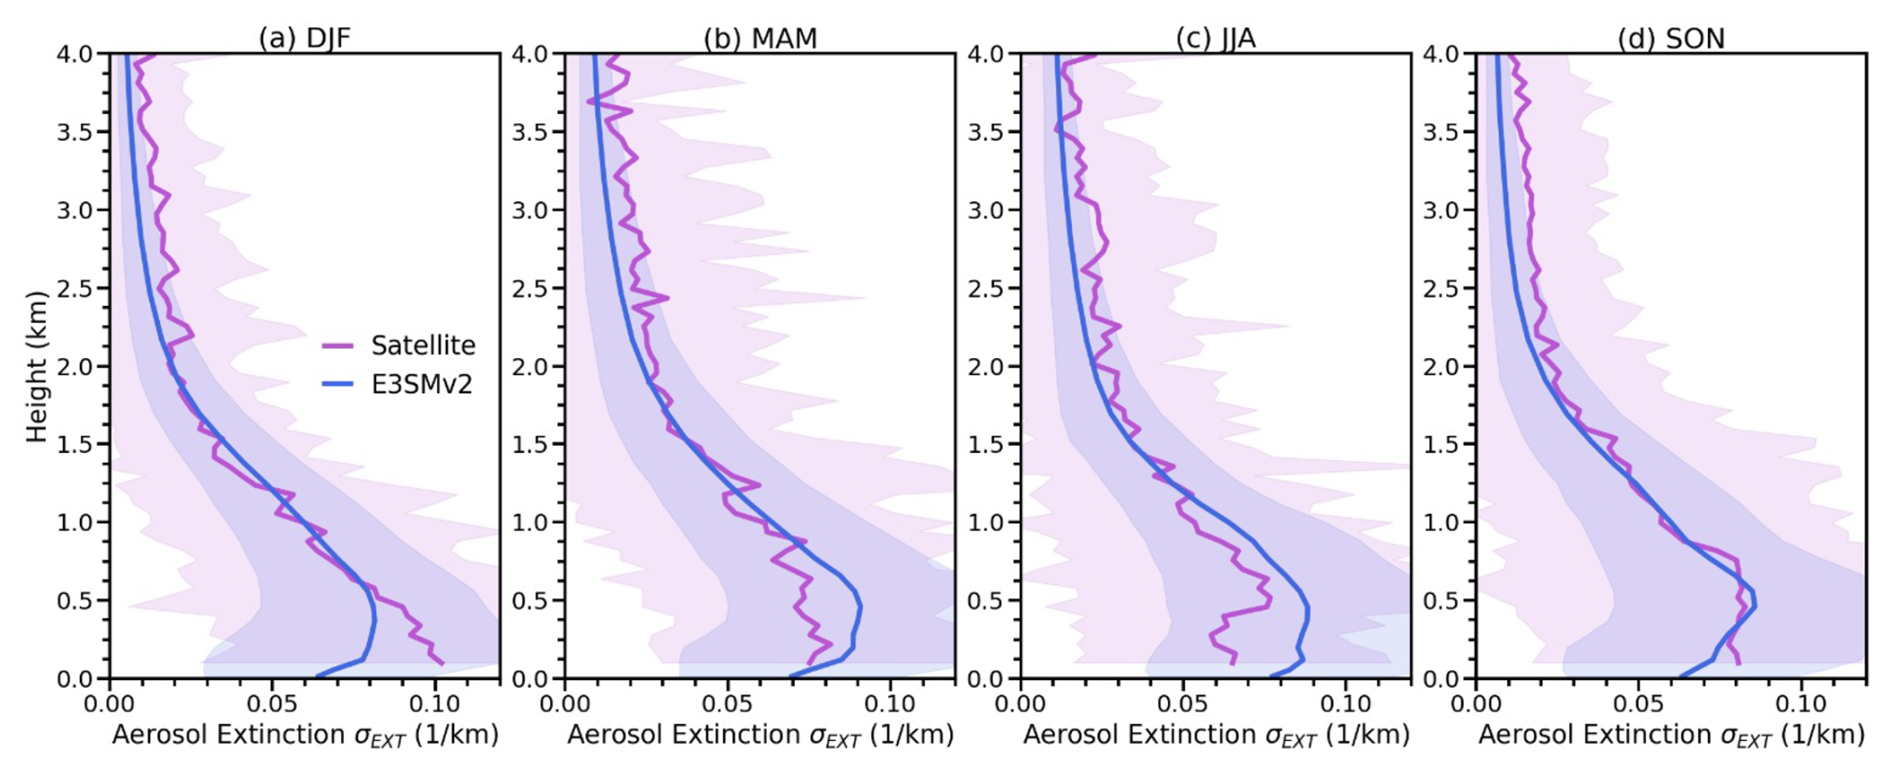
Figure 3Domain averaged vertical distribution of aerosol extinction coefficients (σEXT) in the presence of clouds from Satellite (purple) and E3SMv2 (blue) during (a) winter, DJF; (b) spring, MAM; (c) summer, JJA, and (d) fall, SON. Shaded area denote the standard deviation of σEXT for each level.
In winter (DJF) and fall (SON), the model underestimates σEXT below 1 km compared to satellite observations, whereas in spring (MAM) and summer (JJA) it overestimates near-surface extinction. Recent studies like Logan et al. (2014) and Zheng et al. (2018) demonstrated that the seasonality in the MBL aerosol properties are highly sensitive to local meteorological conditions and long-range transport events. During the cold seasons (DJF and SON), the ENA region experiences high wind speeds in the MBL due to an intensified pressure gradient between the Icelandic Low and the Azores High (Logan et al., 2014; Ghate et al., 2021). The observed high σEXT in cold seasons reflects coarse-mode contributions from both enhanced sea-salt emissions under strong MBL winds and episodic Saharan dust intrusions that reach the ENA via the synoptic northwestward transport (Logan et al., 2014; Gläser et al., 2015; Rodríguez and López-Darias, 2024). E3SMv2 likely underpredicts this signal due to low sea spray (Burrows et al., 2022) and an underrepresentation of dust vertical extent and transport (Feng et al., 2022), a broader model tendency that appears over the North Atlantic as well (Wang et al., 2020a; Qin et al., 2024).
In warm months (MAM and JJA), ENA is characterized by enhanced formation of secondary organic aerosols (SOA) and DMS-derived sulfate (Zheng et al., 2018; Sanchez et al., 2018), dominated by fine-mode aerosols, with weaker sea salt under lower winds and reduced dust transport as the Azores High strengthens. (Wang et al., 2021). Conversely, the overestimation of σEXT by E3SMv2 may be partially attributed to the overproduced sulfate and organic matter at the surface (Hassan et al., 2024; Huang et al., 2024). On the other hand, CALIPSO retrieval limitations under very clean conditions (Painemal et al., 2019) may also contribute to model-observation differences in the free troposphere. Overall, E3SMv2 captures the seasonal evolution of the vertical profile and the mean boundary-layer extinction well enough to support subsequent analysis of simulated cloud responses to aerosol changes.
3.4 Nd susceptibility to aerosol extinction coefficient
To quantify the aerosol impact on cloud microphysics, we define an aerosol-cloud interaction (ACI) index as:
where the σMBL denotes the mean value of the below-cloud-top σEXT. This parameter represents the sensitivity of Nd to changes in aerosols within the marine boundary layer (MBL). Aircraft in situ measurements near cloud base provide the most physically robust ACI assessment (Gupta et al., 2021; Zheng et al., 2024). However, it is challenging to do that with satellite data and model outputs, because satellite remote sensing like CALIOP cannot reliably determine cloud-base height, and the model's coarse vertical resolution makes it difficult to collocate the model cloud-base with CALIOP layers. Hence, those factors necessitate the use of the mean aerosol properties within the below-cloud-top MBL in the present study, facilitating a consistent comparative assessment of aerosols between satellite observations and model simulations.
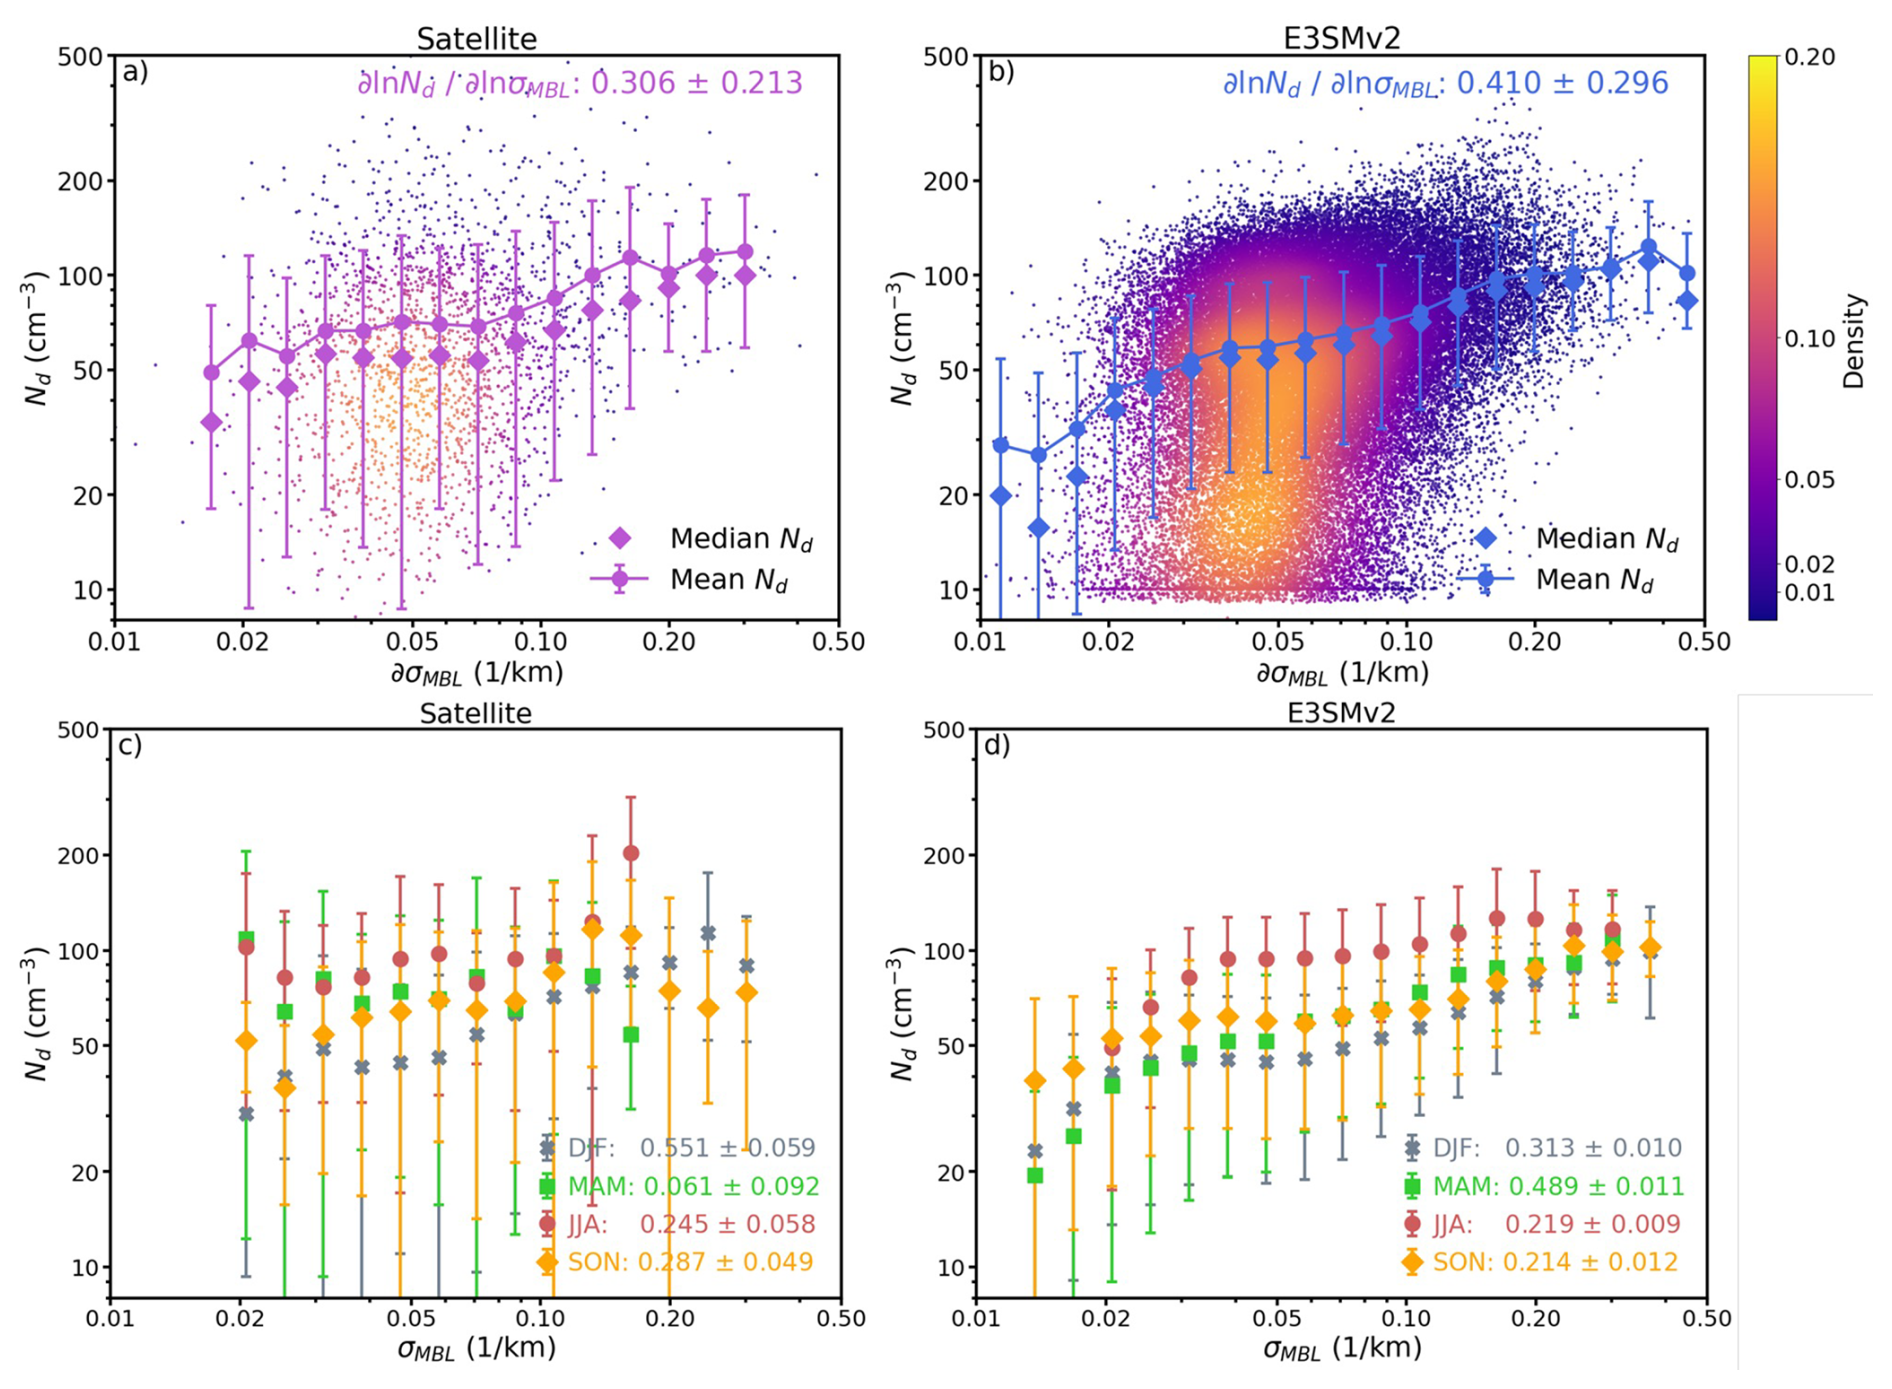
Figure 4Top Panel: Nd binned as a function of σMBL from (a) satellites and (b) E3SMv2. The Gaussian kernel density estimate (KDE) is shown as color-shaded scatter points area. The mean (median) Nd values in σMBL bins are shown as solid-dotted lines (diamond symbols). Bottom panel: seasonality of the Nd dependences from (c) satellite and (d) E3SMv2, with colored symbols denote mean Nd in σMBL bins. Error bars denote standard deviations of Nd in σMBL bins. Slopes are ordinary least squares fits of , and “±” values are standard errors of the fitted slopes.
The top row of Fig. 4 compares the satellite-derived and E3SMv2-simulated relationships between Nd and σMBL. Satellites (Fig. 4a) show a moderate Nd sensitivity with considerable scatter (). The positive ACIN reflects the Twomey effect and lies within reported satellite ranges over marine stratocumulus and the eastern Atlantic. For example, McCoy et al. (2017) found a log–log slope of 0.31 between Nd and sulfate mass, Jia et al. (2021) reported 0.14–0.51 for Nd versus AOD over oceans, and recent reviews summarize satellite-based susceptibilities of about 0.1–0.7 depending on sampling and aerosol proxies (Gryspeerdt et al., 2023). In comparison, E3SMv2 (Fig. 4b) reproduces the qualitative increase of Nd with σMBL, but with a noticeably steeper slope, consistent with an overly sensitive microphysical or activation response noted in previous studies (Christensen et al., 2023; Varble et al., 2023). In other words, for the same fractional change in σMBL, E3SMv2 predicts a larger fractional change in Nd compared to satellite data. This model–observation discrepancy may reflect uncertainties in how E3SMv2 parameterizes aerosol activation, updraft velocities at the cloud base, or boundary-layer processes such as entrainment and mixing (Tang et al., 2024; Wan et al., 2025), as discussed further in Sect. 4.
In terms of seasonal variations in Nd susceptibility, Satellite derived ACIN (Fig. 4c) is largest in DJF near 0.55 and smallest in MAM near 0.06, with JJA and SON intermediate. E3SMv2 (Fig. 4d) remains positive in all seasons but spans a narrower range, including a much stronger MAM value near 0.49 than observed and a weaker DJF response than satellites, while JJA and SON are closer to observations, yet the model maintains a higher and more uniform sensitivity overall.
Taken together, E3SMv2 tends to produce both stronger LWP responses to Nd and enhanced Nd responses to aerosol than satellite derived relationships. A notable limitation of this seasonal grouping is that it fails to disentangle the complexities of aerosol-cloud interactions from characteristic meteorological variations. Aggregating data into seasons makes it challenging to unambiguously attribute changes in cloud properties to aerosol variations rather than to shifts in large-scale dynamics or thermodynamic conditions (Zheng et al., 2022b; Zhang and Feingold, 2023). This limitation necessitates the regime-based analysis in Sect. 4, in which samples are clustered in dominant meteorological regimes and can more effectively isolate microphysical processes from the confounding effects of synoptic-scale and seasonal variability (Mülmenstädt et al., 2012; Mechem et al., 2018; Zheng et al., 2025c).
4.1 Distinctive Meteorological Regimes over ENA
As detailed earlier, the CNN–LSTM–DEC clustering of 3286 daily ERA5 states results in the identification of four distinct synoptic-scale regimes (Fig. 5). Namely, Pre-Trough (regime 1), Post-Trough (regime 2), Ridge (regime 3) and Trough (regime 4). For each regime, composites were computed as the arithmetic mean of the corresponding ERA5 fields across all time steps assigned to that regime.
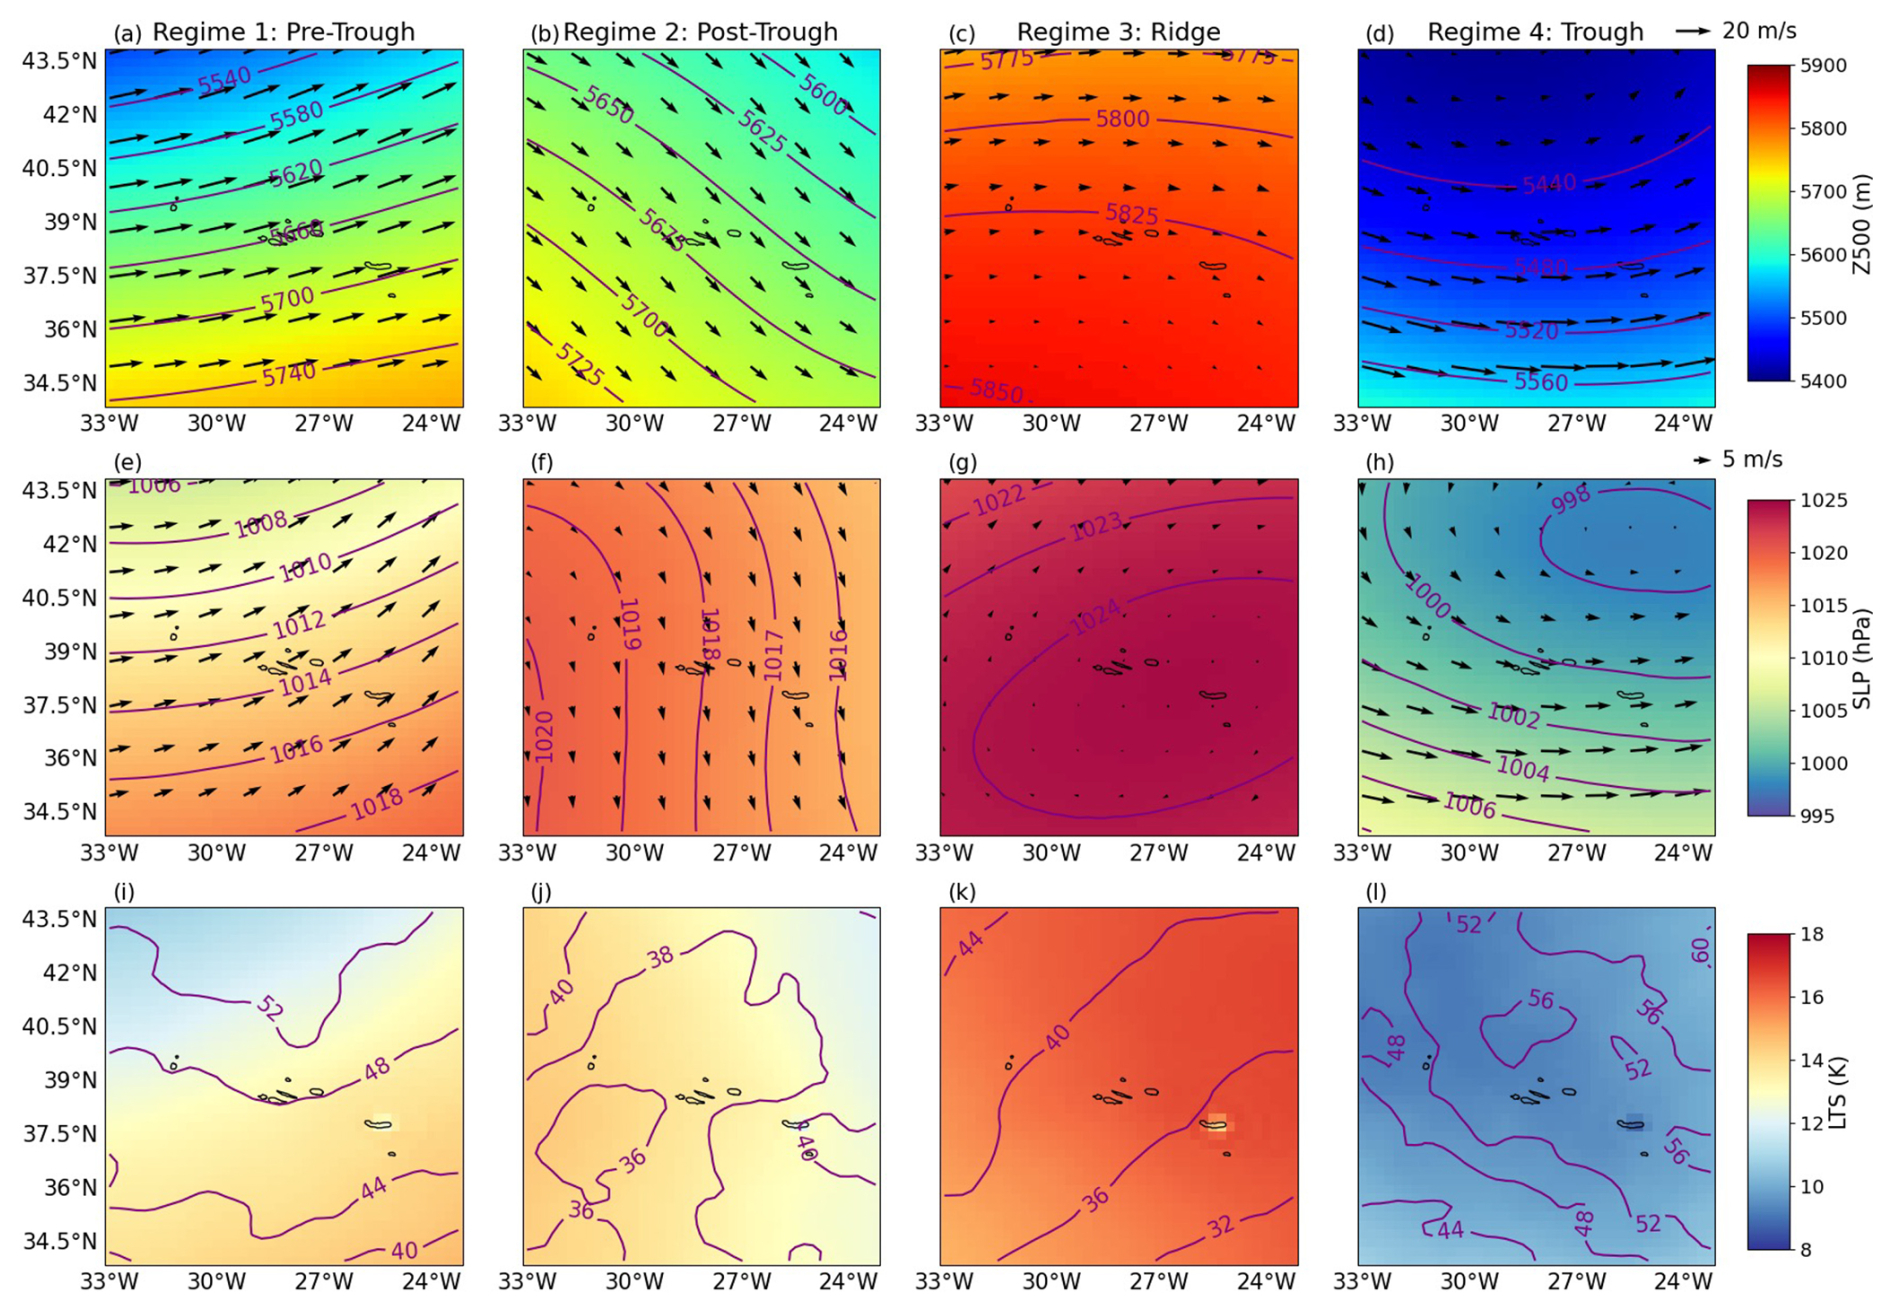
Figure 5Meteorological composites for each synoptic regime classified by the clustering model: Regime 1 (a, e, i), Regime 2 (b, f, j), Regime 3 (c, g, k), and Regime 4 (d, h, l). The first row shows 500 hPa geopotential height (Z500) shaded and contoured, with 500 hPa wind vectors overlaid. The second row presents sea level pressure (SLP) in both shaded and contoured formats, together with 10 m surface wind vectors. The third row displays lower tropospheric stability (LTS) at 700 hPa as the shaded field and 700 hPa relative humidity (RH700) in contours.
Regime 1 (Fig. 5a, e, and i) represents the Pre-Trough phase, characterized by a developing trough approaching the Azores. This regime features strong southwesterly winds at both 500 hPa and near the surface, moderate mid-level moisture, and low lower tropospheric stability (LTS). Such conditions typically precede frontal development and passage and are associated with the early stages of midlatitude cyclone progression, therefore resulting in a wet free troposphere and low LTS (Mechem et al., 2018; Zheng et al., 2025c).
Regime 2 denotes the typical Post-Trough condition that follows the passage of a trough, characterized by prevailing northwesterly winds (Fig. 5b) and transitional stability. The SLP field reveals a relatively weak pressure gradient, corresponding to a post-frontal environment in which drier and colder air is advected into the region (Fig. 5f and j). Although LTS remains moderate, it is slightly higher than in Regime 1, reflecting the gradual stabilization behind the frontal system. Taken together, Regimes 1 and 2 depict the typical meteorological evolution associated with mid-latitude cyclones traversing the ENA, which occur regularly throughout the year (Table 2), particularly during colder seasons when mid-latitude cyclone activity is more frequent (Wood et al., 2015; Mechem et al., 2018).
Regime 3 corresponds to the Ridge phase, in which a pronounced ridge dominates the region. Both the SLP and 500 hPa geopotential height (Z500) fields constitute a broad anticyclonic pattern, with relatively weak and variable winds from the surface up to 500 hPa. This pattern coincides with the driest free troposphere and the most stable lower troposphere observed among all regimes, which generally favor a more coupled and shallower (MBL) (Carrillo et al., 2016; Zheng et al., 2025c). As indicated in Table 2, Regime 3 is the most frequently occurring regime (63.8 %) in the region, peaking during the summer months when the center of the Azores High predominantly lies to the southwest of the Azores Islands. This finding is consistent with previous studies (Mechem et al., 2018; Wang et al., 2022), and the synoptic categorization is similar to that in Painemal et al. (2023) for the Western North Atlantic.
Regime 4 represents a typical Trough phase, characterized by a canonical 500 hPa trough with stronger cyclonic flow at the surface. The lower troposphere exhibits reduced static stability, while the contours of relative humidity at 700 hPa (RH700, Fig. 4l) indicate a more humid troposphere. These conditions imply enhanced ascent and moist processes. Note that among the four regimes, Regime 4 is the least frequent (3.4 %) and is largely confined to the colder seasons (winter and spring), confirming the findings from previous studies (Wood et al., 2015; Mechem et al., 2018; Wang et al., 2022).
4.2 Cloud properties under different regimes
In order to provide synergy on the meteorology and cloud for reference in this study, a brief and qualitative summary of meteorology patterns and cloud and precipitation status are listed in Table 1. Furthermore, based on the four distinct meteorological regimes identified through clustering, we stratify cloud properties from both satellite retrievals and E3SMv2 simulations. Both Nd and LWP exhibit systematic regime-dependent behavior and model biases (Fig. 6). And the detailed quantities are listed in Table 3.
Table 1Summary of meteorological and cloud categories in different regimes.
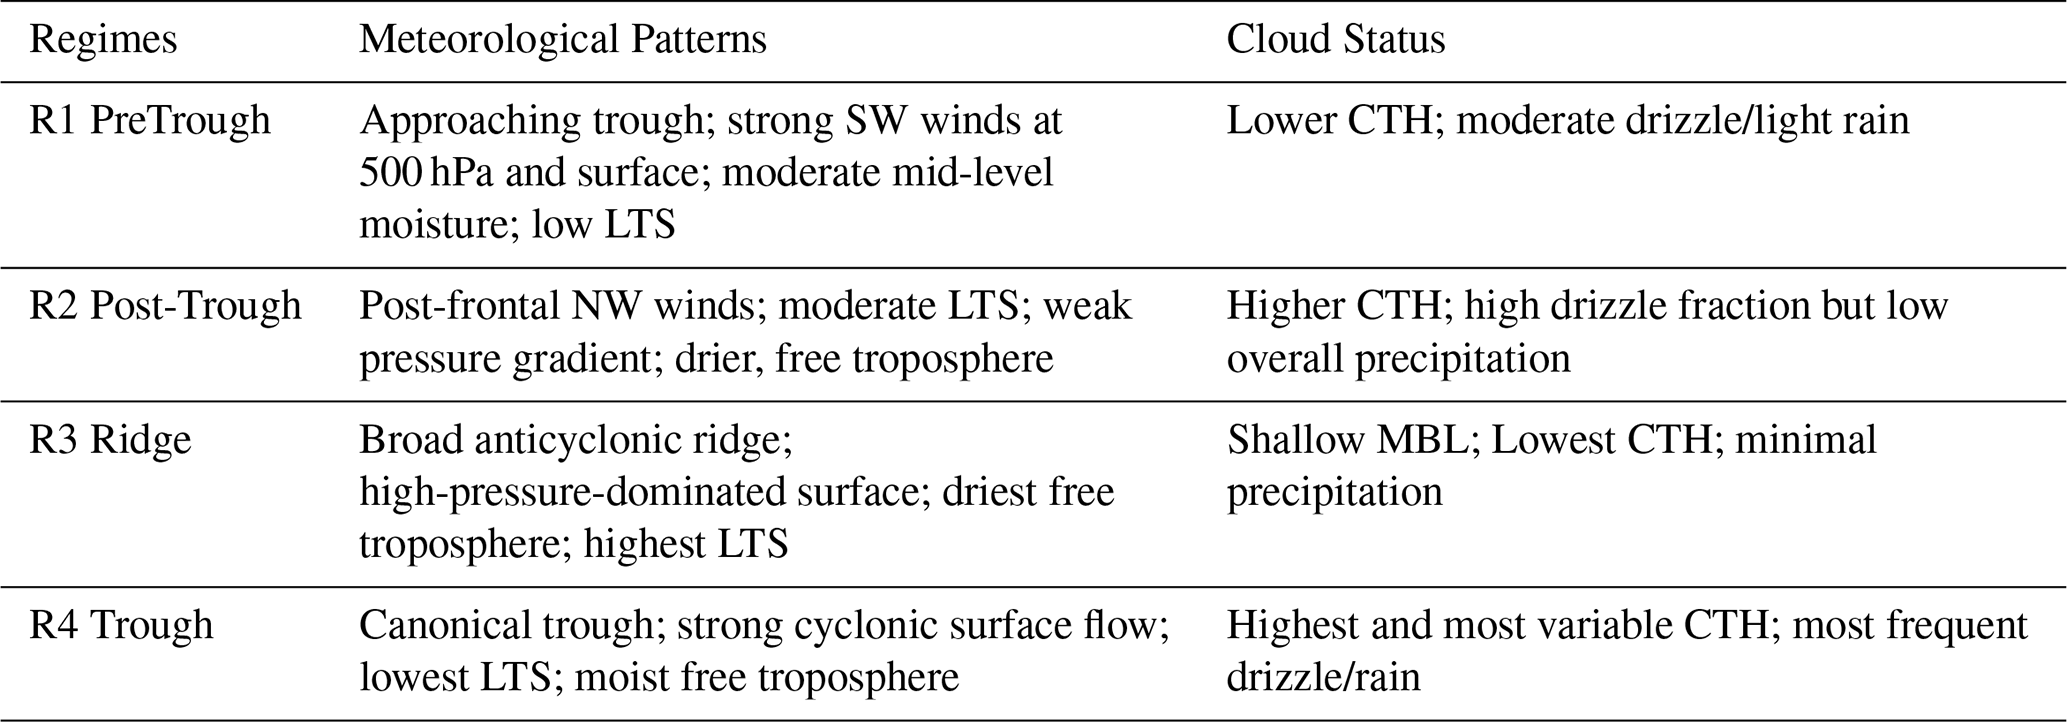
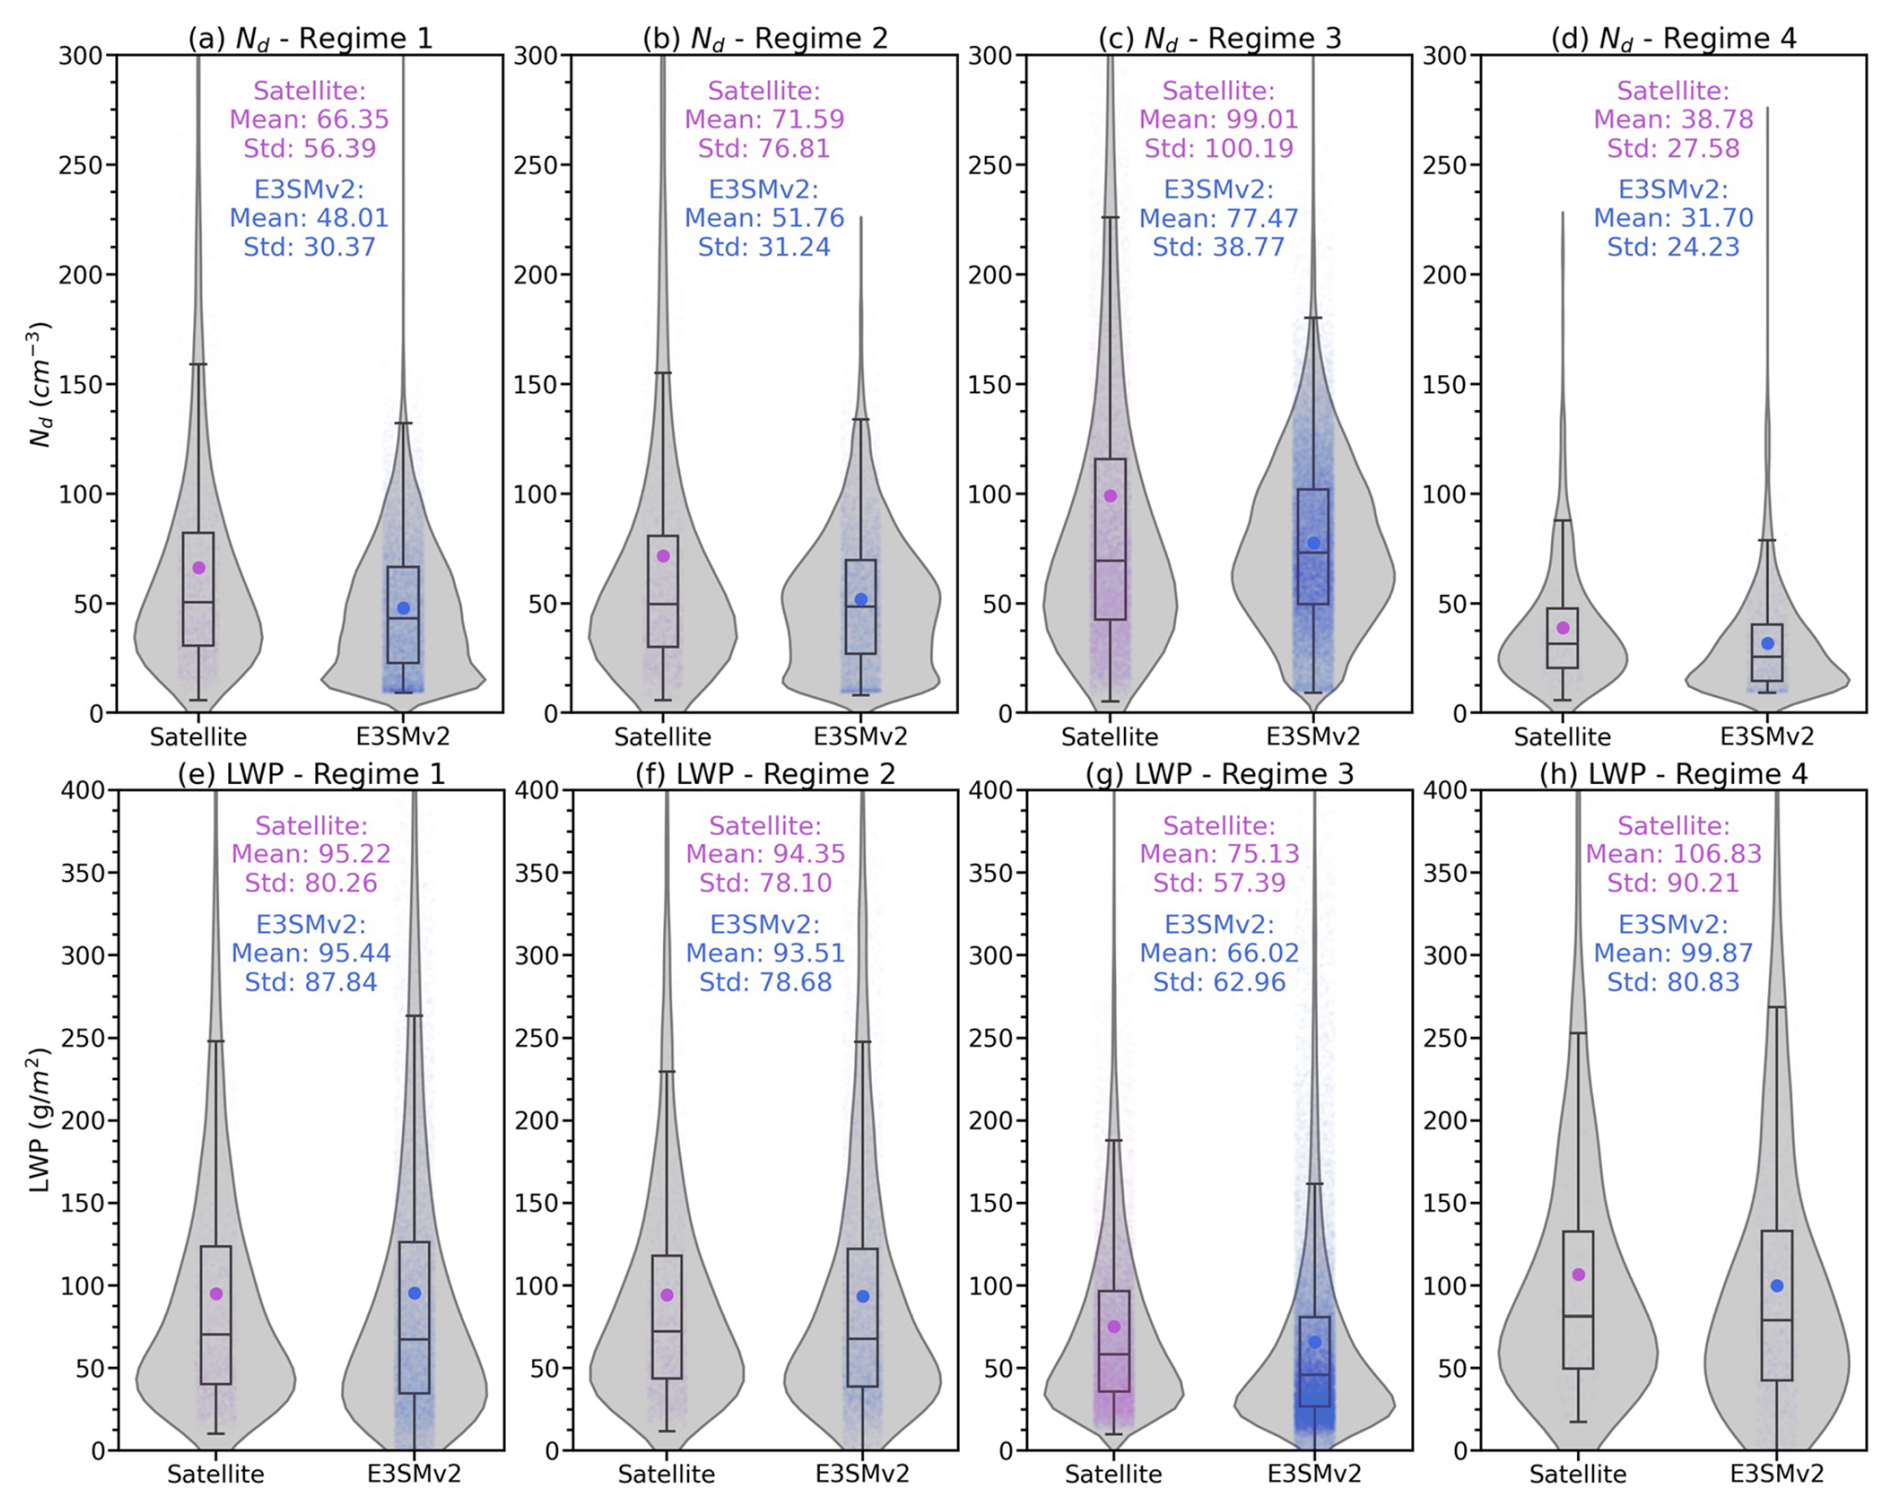
Figure 6Violin plots of cloud droplet number concentration (Nd, top panels) and cloud liquid water path (LWP, bottom panels) from satellite retrievals (purple) and E3SMv2 simulations (blue), grouped by Regime 1 (a, e), Regime 2 (b, f), Regime 3 (c, g), and Regime 4 (d, h). The mean value is indicated by the color-coded dot. The smoothed shape of each violin shows the Gaussian kernel density estimate (KDE). From top to bottom within each violin, the box plot lines represent the third quartile (Q3, 75th percentile), median (Q2, 50th percentile), and first quartile (Q1, 25th percentile), respectively. The upper whisker extends to (IQR: interquartile range), and the lower whisker extends to .
Across all regimes, E3SMv2 tends to underestimate Nd while representing LWP more accurately. A rigorous comparison of surface precipitation rates between satellite data and E3SMv2 is limited in this study due to lack of collocated precipitation rate measurements from the satellite. Therefore, we choose to compare the in-cloud fractional occurrences of rain and rain LWP from E3SMv2 with the fractional occurrences of drizzle, light rain, and rain from CloudSat (Table S1 in the Supplement). In addition, CTH statistics, stratified by regime from both satellite and E3SMv2 datasets, are presented in Table 2, with composite maps shown in Figs. S1 and S2 in the Supplement. To quantify the variability of CTH under different regimes, Moran's I indices, a measure of spatial autocorrelation, were computed and then normalized for each regime to account for the differences in spatial resolution between the satellite and E3SMv2 datasets. A normalized Moran's I index of 0 means the least autocorrelated, and 1 means the most autocorrelated. The normalized Moran's I indices for the satellite (E3SMv2) datasets are 0.61 (0.0), 0.64 (0.89), 1.0 (1.0), and 0.0 (0.13) for Regimes 1, 2, 3, and 4, respectively.
Table 2Regime occurrences over ENA at 13:00 LT (01:00 p.m. local time) from ERA5 inputs.
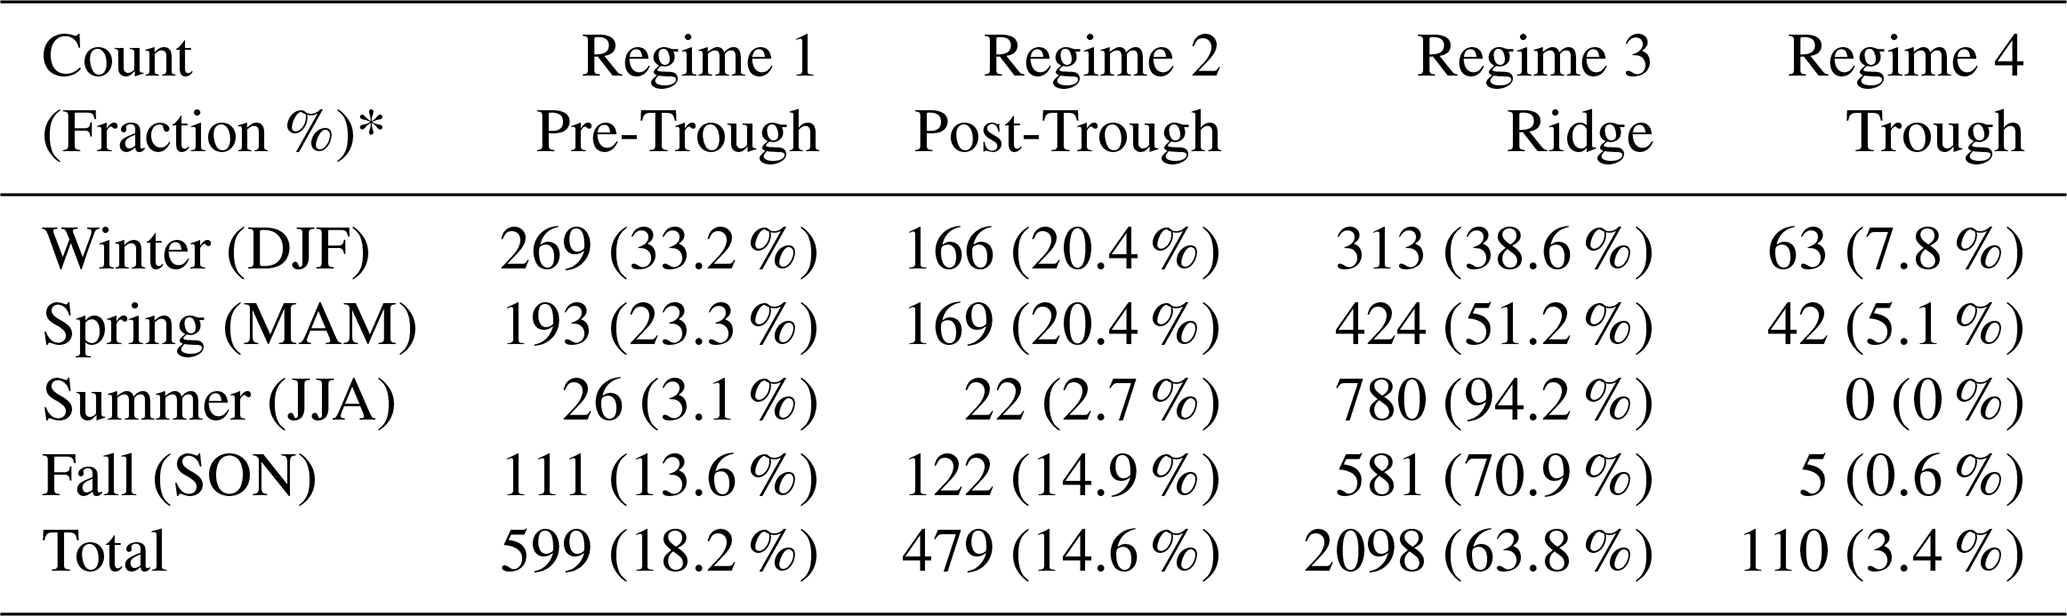
* Percentages in bracket denote the fractional occurrence of specific regime among total sample in each season category (and total sample).
Regime 1, characterized by an approaching trough with southwesterly flow, moderate moisture, and relatively weak subsidence, exhibits a mean Nd of 66.35 cm−3 in satellite observations, whereas E3SMv2 simulates a lower mean Nd of 48.01 cm−3 with reduced variability. The mean LWP in E3SMv2 (95.44 g m−2) is similar to that of the satellite retrievals (95.22 g m−2), with a slightly broader distribution. These findings suggest that while E3SMv2 captures the overall liquid water content in cloud layers under pre-frontal conditions, it systematically underestimates Nd. Moreover, the CTH in Regime 1 remains low (Table 3), reflecting a shallower MBL in the transitional environment of the approaching front (Jeong et al., 2022). Precipitation statistics indicate moderate fractions of drizzle and light rain (Table S1), consistent with the notion that although pre-trough instability favors drizzle production, the boundary layer does not fully deepen to support frequent or intense rainfall (Wood, 2005; Wu et al., 2017; Zheng et al., 2022b). The partial uplift and moderate moisture convergence can occasionally enhance cloud thickness, as indicated by a moderately high normalized Moran's I index (0.61), yet the overall shallower structure typically limits heavier precipitation.
Table 3Regime-based aerosol and cloud variables from Satellite and E3SMv2.
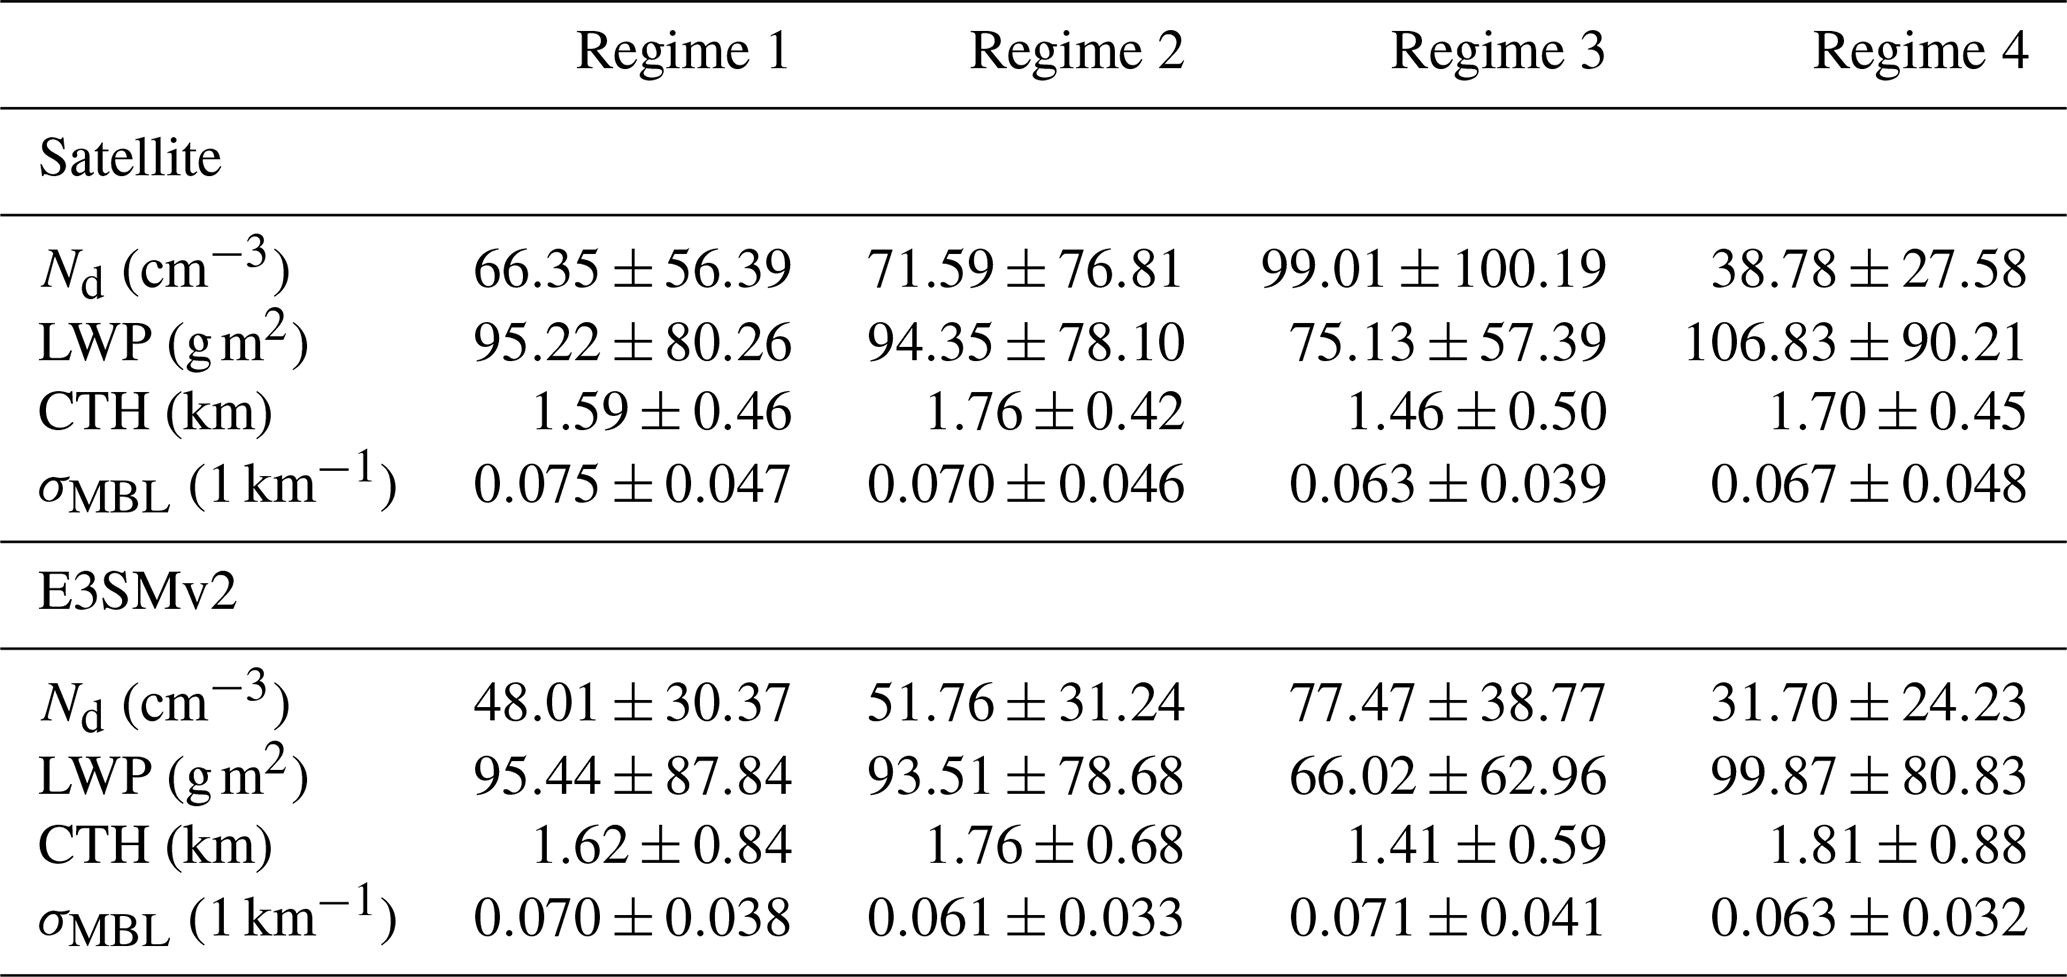
In the post-trough environment of Regime 2, the northwesterly flow advects drier and cooler air behind the frontal system. Such conditions are typically associated with increased subsidence and a deeper MBL conducive to the development of stratocumulus clouds (Wu et al., 2020; Jensen et al., 2021; Jeong et al., 2022). Consequently, satellite-derived CTH values (Table 3 and Fig. S1b) are higher than those in Regime 1, indicating a deeper MBL. Furthermore, clouds in Regime 2 are also associated with the highest fractional occurrences of drizzle among the four regimes (Table S1). Drizzle formation and turbulent mixing can lead to heterogeneous cloud structures with less cloud adiabaticity (Wu et al., 2017), as reflected by a normalized Moran's I index of 0.64 and in Fig. S1b, in contrast to the more uniform CTH variation in Regime 3. E3SMv2 captures the relative CTH variation and precipitation frequency reasonably well under this regime. As for Regime 1, E3SMv2 still systematically underestimates Nd (51.76 cm−3 vs. 71.59 cm−3) while simulating the observed mean LWP well (93.51 vs. 94.35 g m−2 ).
Regime 3 features with a pronounced ridge, reduced convective activity, and generally lower moisture in the boundary layer. Satellite retrievals show the highest mean Nd (99.01 cm−3, Fig. 6c), which could be attributed to the less active drizzle processes and droplet evaporation in shallower cloud deck within a more stable MBL (Wood et al., 2012; Zheng et al., 2024). In contrast, E3SMv2 simulates a lower mean Nd (77.47 cm−3) and fails to capture the broad observed distribution. Moreover, LWP in this ridge regime is the lowest among all regimes, with E3SMv2 underestimating satellite observations (66.02 vs. 75.13 g m−2 ; Fig. 6g). From both satellite and model perspectives, the cloud field is characterized by shallower, more homogeneous decks that span large horizontal areas yet produce only light or sporadic drizzle, as reflected by lower CTH (Figs. S1c and S2c) and the lowest precipitation fractions among the four regimes (Table S1). Overall, the results in Regime 3 align with the signature of shallow stratus and stratocumulus clouds (Rémillard and Tselioudis, 2015; Mechem et al., 2018; Wu et al., 2020; Jensen et al., 2021).
Under a well-developed trough in Regime 4, satellite observations record the lowest Nd (38.78 cm−3) but the highest LWP (106.83 g m−2) among four regimes, reflecting the prevalence of deep and warm-rain-active cloud systems formed by strong uplift and abundant moisture. These conditions yield the highest and most variable CTH among the four regimes (Table 3), along with frequent precipitation in the form of drizzle or rain. Stronger vertical motion promotes the development of deeper clouds with higher rainfall efficiency, contributing to spatially heterogeneous precipitating cloud fields observed in both the satellite data and model simulations (Figs. S1d and S2d; Table S1). Notably, E3SMv2 simulates the high LWP (99.87 g m−2) and elevated liquid water content as in the observations, but underestimates variability. Similarly, the model underestimates Nd (31.70 cm−3) relative to satellite observations as in the other regimes.
Overall, these results demonstrate the clear meteorological impact on both cloud microphysical (Nd) and macrophysical (LWP) properties. Pre- and post-trough conditions (Regimes 1 and 2) favor moderate Nd and LWP, while ridge-dominated conditions (Regime 3) promote stable, stratiform-dominated environments with high mean Nd but relatively low LWP. In contrast, developed troughs (Regime 4) yield lower Nd yet substantially higher LWP in more vertically developed cloud systems. Although E3SMv2 captures the LWP mean and distributions across these synoptic regimes, it systematically underestimates Nd. This discrepancy suggests that the challenges in simulating cloud droplets are irrespective of the meteorological influences.
4.3 LWP-Nd relationships under different regimes
The relationship between LWP and Nd across the four synoptic regimes in both satellite retrievals and the E3SMv2 model exhibits the characteristic inverted-V shape (Fig. 7), as shown in the seasonal assessment in Sect. 3. Furthermore, regime-specific meteorological differences, particularly variations in stability and moisture transport, strongly influence the shape and peak of the LWP-Nd relationship. Across regimes, the peak in the satellite data of the inverted LWP-Nd curve occurs at (particularly, 96.5 cm−3 at Regime 4), and at LWP ; whereas the E3SMv2 peaks at a much narrower with higher peak LWP . The quantitative LWP adjustment (ℒ0) values are listed in Table 4.
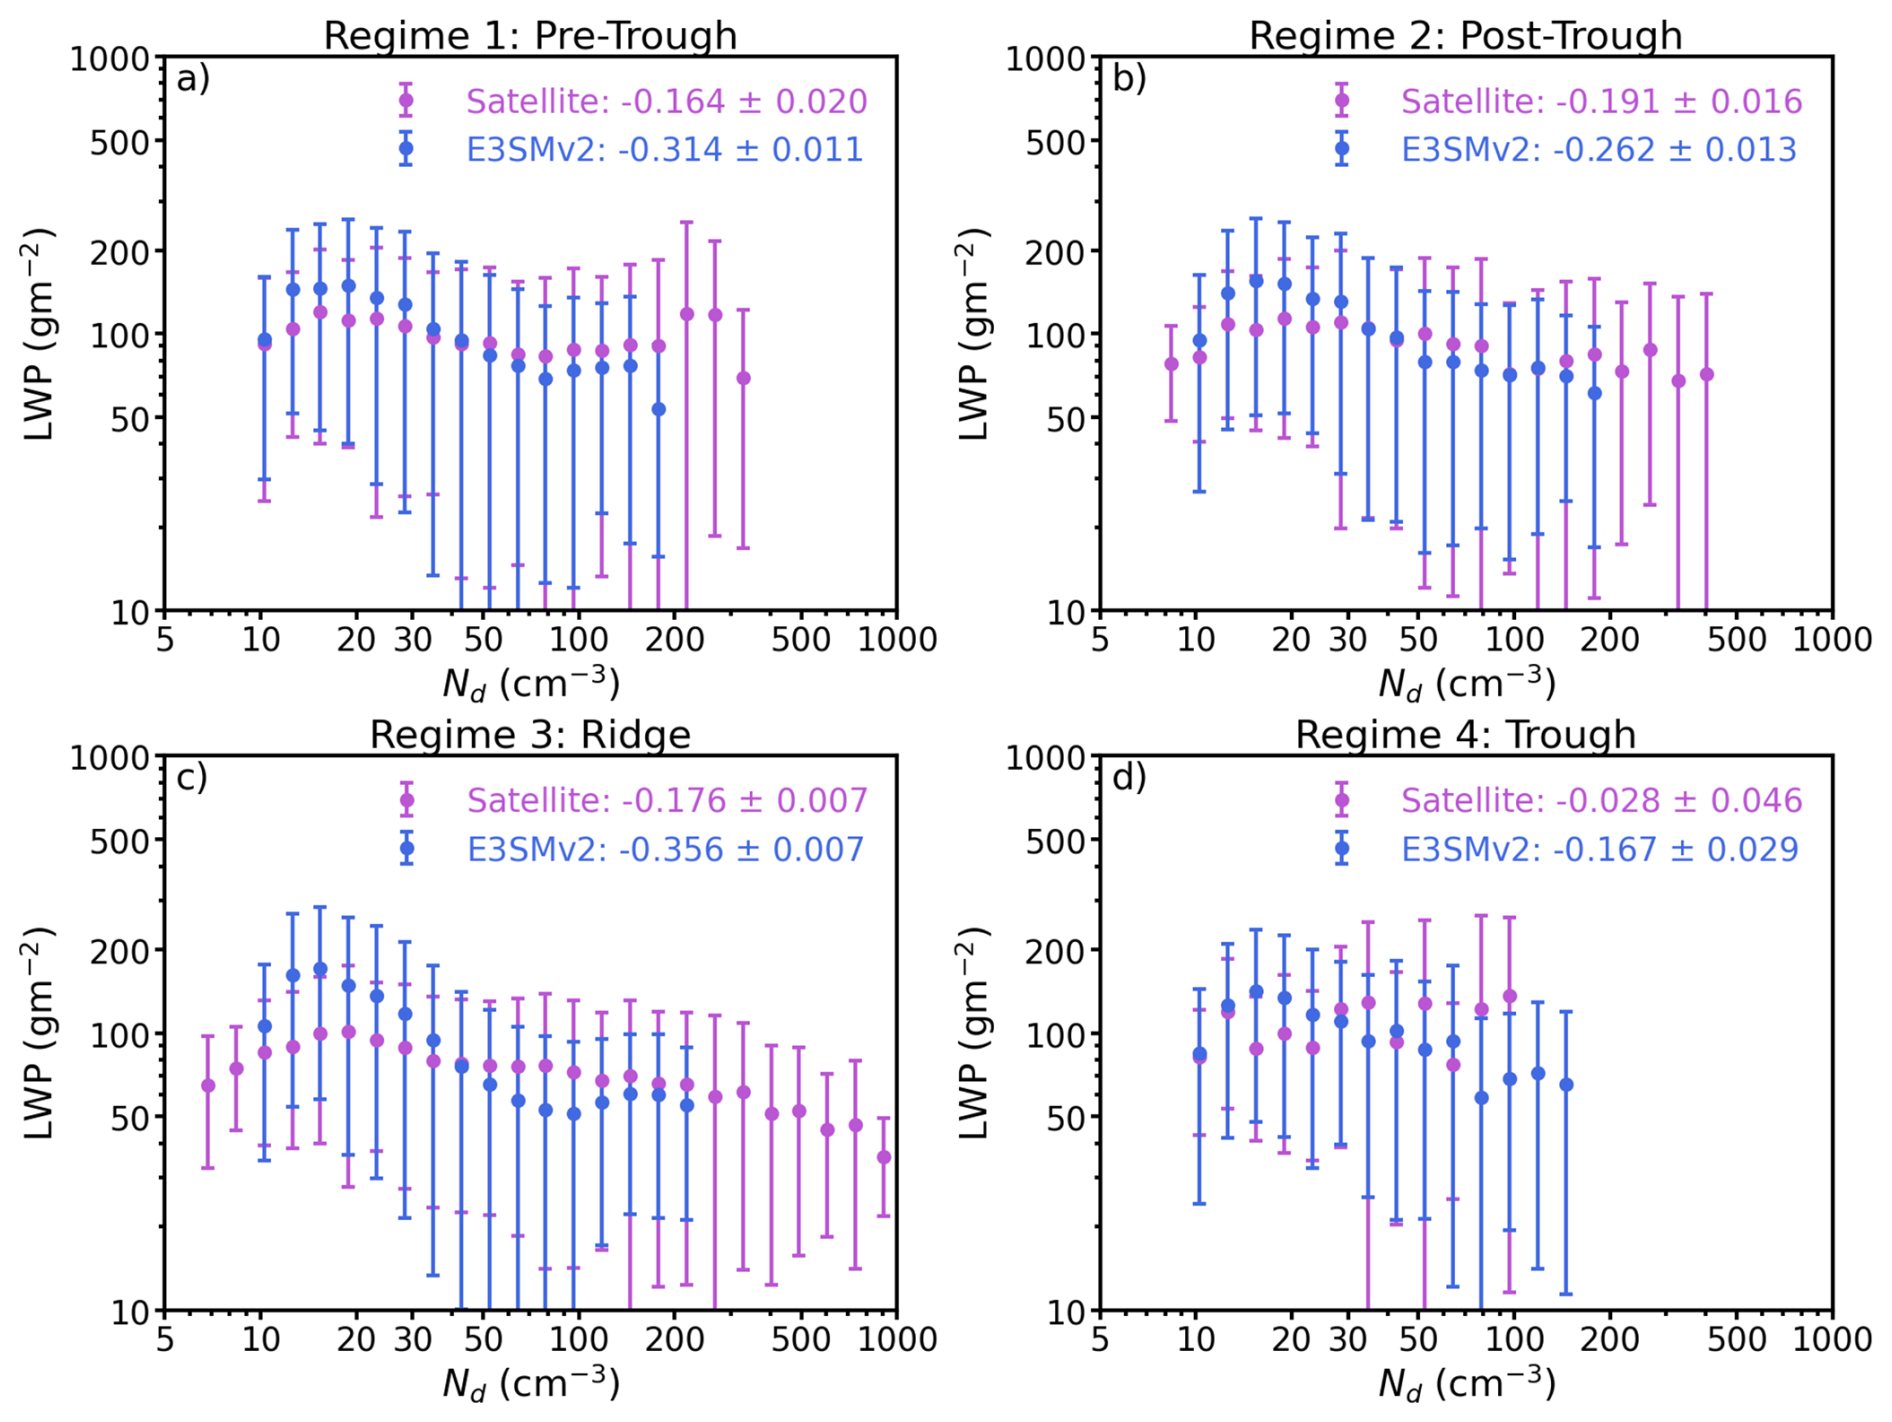
Figure 7LWP responses on Nd from satellite (purple) and E3SMv2 (blue) for (a) Regime 1, (b) Regime 2, (c) Regime 3, and (d) Regime 4. Colored dots denote mean LWP in Nd bins, and whiskers denote standard deviations. The quantitative LWP adjustment index is denoted in the legend, and “±” values are standard errors of the fitted slopes.
Noticeably, satellite retrievals in the Ridge regime (R3) display a more pronounced inverted-V shape compared to themselves in other regimes, with LWP consistently declining as Nd increases at high values (Fig. 7c). Under Ridge conditions, strong subsidence limits vertical growth, reduces moisture convergence, and produces a shallower, more stable cloud layer. Although the mixing rate from entraining drier free-tropospheric air might not be as intense as in thicker and more turbulent clouds, the drying effect propagates more efficiently through the thinner cloud layer, exerting a significant impact (Sanchez et al., 2020; Chun et al., 2023). Furthermore, since the Ridge regime features more high-Nd conditions, the resulting smaller cloud droplets are more susceptible to entrainment-evaporation, leading to a more efficient removal of cloud water (Possner et al., 2020). In contrast, the E3SMv2 model significantly overestimates the maximum LWP, and yields a significantly greater LWP decline with Nd (ℒ0 values of −0.356 for model vs. −0.176 for satellite).
Under Regime 1 (Pre-Trough, Fig. 7a), the satellite and model data show a rise in LWP as Nd increases from very low values, while the characteristic inverted-V shape is partially masked by increased scatter in the satellite-retrieved LWP at high Nd, likely due to the complexity of drizzle, entrainment, and mixing processes in the pre-frontal environment. The enhanced drizzle formation, indicated by the relatively higher drizzle and rain fractions in clouds, can reduce the temperature gradient near cloud-top via condensation warming, stabilizing the cloud layer and partially offsetting the entrainment cooling and retaining the LWP. Similar to those in Regime 3, the model also exhibits a nearly double ℒ0 (−0.314) compared to satellite (−0.164). One possible explanation is that the model microphysics suppresses drizzle too aggressively when Nd increases occur at lower values (Varble et al., 2023; Mülmenstädt et al., 2024b), thereby promoting the accumulation of cloud liquid water prior to the onset of entrainment-drying or precipitation. Furthermore, the MG2 microphysics scheme may trigger the entrainment–evaporation feedback too rapidly in the model, resulting in an LWP adjustment timescale much shorter than observed (Zhou et al., 2025). As a result, the model depletes cloud liquid water too quickly (Xie et al., 2018; Rasch et al., 2019). These combined model uncertainties lead to an excessively steeper ℒ0 compared to satellite observations.
In the Post-Trough regime (Regime 2; Fig. 7b), the residual dynamic forcing from the trough coupled with the onset of entrainment-induced evaporation, produces an intermediate LWP-Nd sensitivity, particularly under the high Nd condition, between the Pre-Trough and Ridge regimes. On the one hand, in the Post-Trough environment, the cloud field is more variable and relatively thicker, which is found to be favorable for stronger entrainment rates (Wu et al., 2017; Chun et al., 2023), hence depleting LWP. On the other hand, this effect might be closely intermingled with patches of high LWP sustained by the precipitation-stabilization effect (Possner et al., 2020; Wu et al., 2020). These competing effects result in an averaged LWP decline with increasing Nd that is stronger than in the Pre-Trough state but remains less pronounced than the sharp decrease observed in the Ridge regime. Compared to the satellite observations, E3SMv2 underestimates LWP at high Nd, coupled with the slightly steeper LWP-Nd slope. The model bias likely results from parameterized entrainment and in-cloud mixing (Zhang et al., 2024), which may intensify cloud-top evaporation cooling and promote LWP loss; in contrast, real clouds exhibit more heterogeneous mixing that better preserves liquid water at high Nd.
In Regime 4 (Fig. 7d), characterized by a well-developed trough with enhanced ascent and high moisture availability, clouds deepen, and LWP peaks at relatively high Nd, as observed by satellites. The muted LWP decrease seen in satellite data may be largely a consequence of combined factors. Since the satellite Nd is derived assuming an adiabatic vertical profile and a constant Nd throughout the cloud, the expected increase in subadiabaticity for Regime 4, as suggested by the enhanced precipitation, might induce retrieval bias that dampens the apparent sensitivity of LWP to Nd (Grosvenor et al., 2018). At the same time, retrievals tend to average over heterogeneous cloud fields in the Trough regime, where cloud properties vary on small scales, further smoothing out the true microphysical sensitivity (Gryspeerdt et al., 2022). Excluding the retrieval-induced bias, strong updrafts in this regime can promote moisture convergence, which in turn maintain or even enhance LWP despite higher Nd (Goren et al., 2018; Zhang et al., 2022; Painemal et al., 2023). In some cases, heavy precipitation may also drive locally precipitation-generated cold pooling that enhances the cloud base updraft that helps maintain LWP following precipitation. Such muted LWP response to Nd, has been reported for the stratocumulus clouds over the southeast Pacific, particularly in thickening stratocumulus clouds with a higher likelihood of producing more intense precipitation (Smalley et al., 2024), suggesting the precipitation-suppressing overwhelms the entrainment-drying effect on LWP. In contrast, E3SMv2 maintains an evident inverted-V shape of LWP-Nd curve as in other regimes, albeit with a smaller ℒ0 (−0.167), resulting from the explicitly parameterized microphysical processes.
Overall, the model simulations exhibit an excessively sharp rise-and-fall pattern in LWP, producing an exaggerated inverted-V in the LWP-Nd relationship, compared to the more subtle shapes in satellite results. This suggests that microphysical feedback to cloud water may be triggered too early and too rapidly in the model. Such behavior may originate from the MG2 microphysics scheme's nonlinear autoconversion rate (Gettelman and Morrison, 2015), which acts to suppress drizzle too aggressively at low Nd, thereby retaining excess LWP, but truncates liquid water accumulation as Nd increases (Wang et al., 2023; Ovchinnikov et al., 2024). These limitations hinder E3SMv2's ability to capture observed cloud feedback, particularly in regimes with shallower clouds (e.g., Pre-Trough and Ridge). Addressing these issues may require recalibrating autoconversion rates using observational constraints (e.g., ARM data) and improving scale-aware entrainment schemes that better differentiate mixing regimes.
4.4 Nd susceptibility to aerosols under different regimes
Figure 8 illustrates how Nd responds to changes in MBL aerosol extinction (σMBL) across each meteorological regime, as quantified by the aerosol–cloud interaction index (ACIN). Under all regimes, both observations and E3SMv2 simulations show that Nd generally increases with increasing σMBL, reflecting the typical ACI in which cloud droplet concentration rises with increased aerosol loading. And it is worth noting that the model is able to simulate the quantitative relationship between Nd and σMBL, with exception of Regime 2. The ACIN values are listed in Table 4. Since each regime is characterized by distinct large-scale meteorological conditions, these environmental factors influence the ACI remarkably, as the aerosol activation is highly influenced by updraft strength, moisture availability, and in-cloud supersaturation (Chen et al., 2011; Kirschler et al., 2022; Zheng et al., 2024).
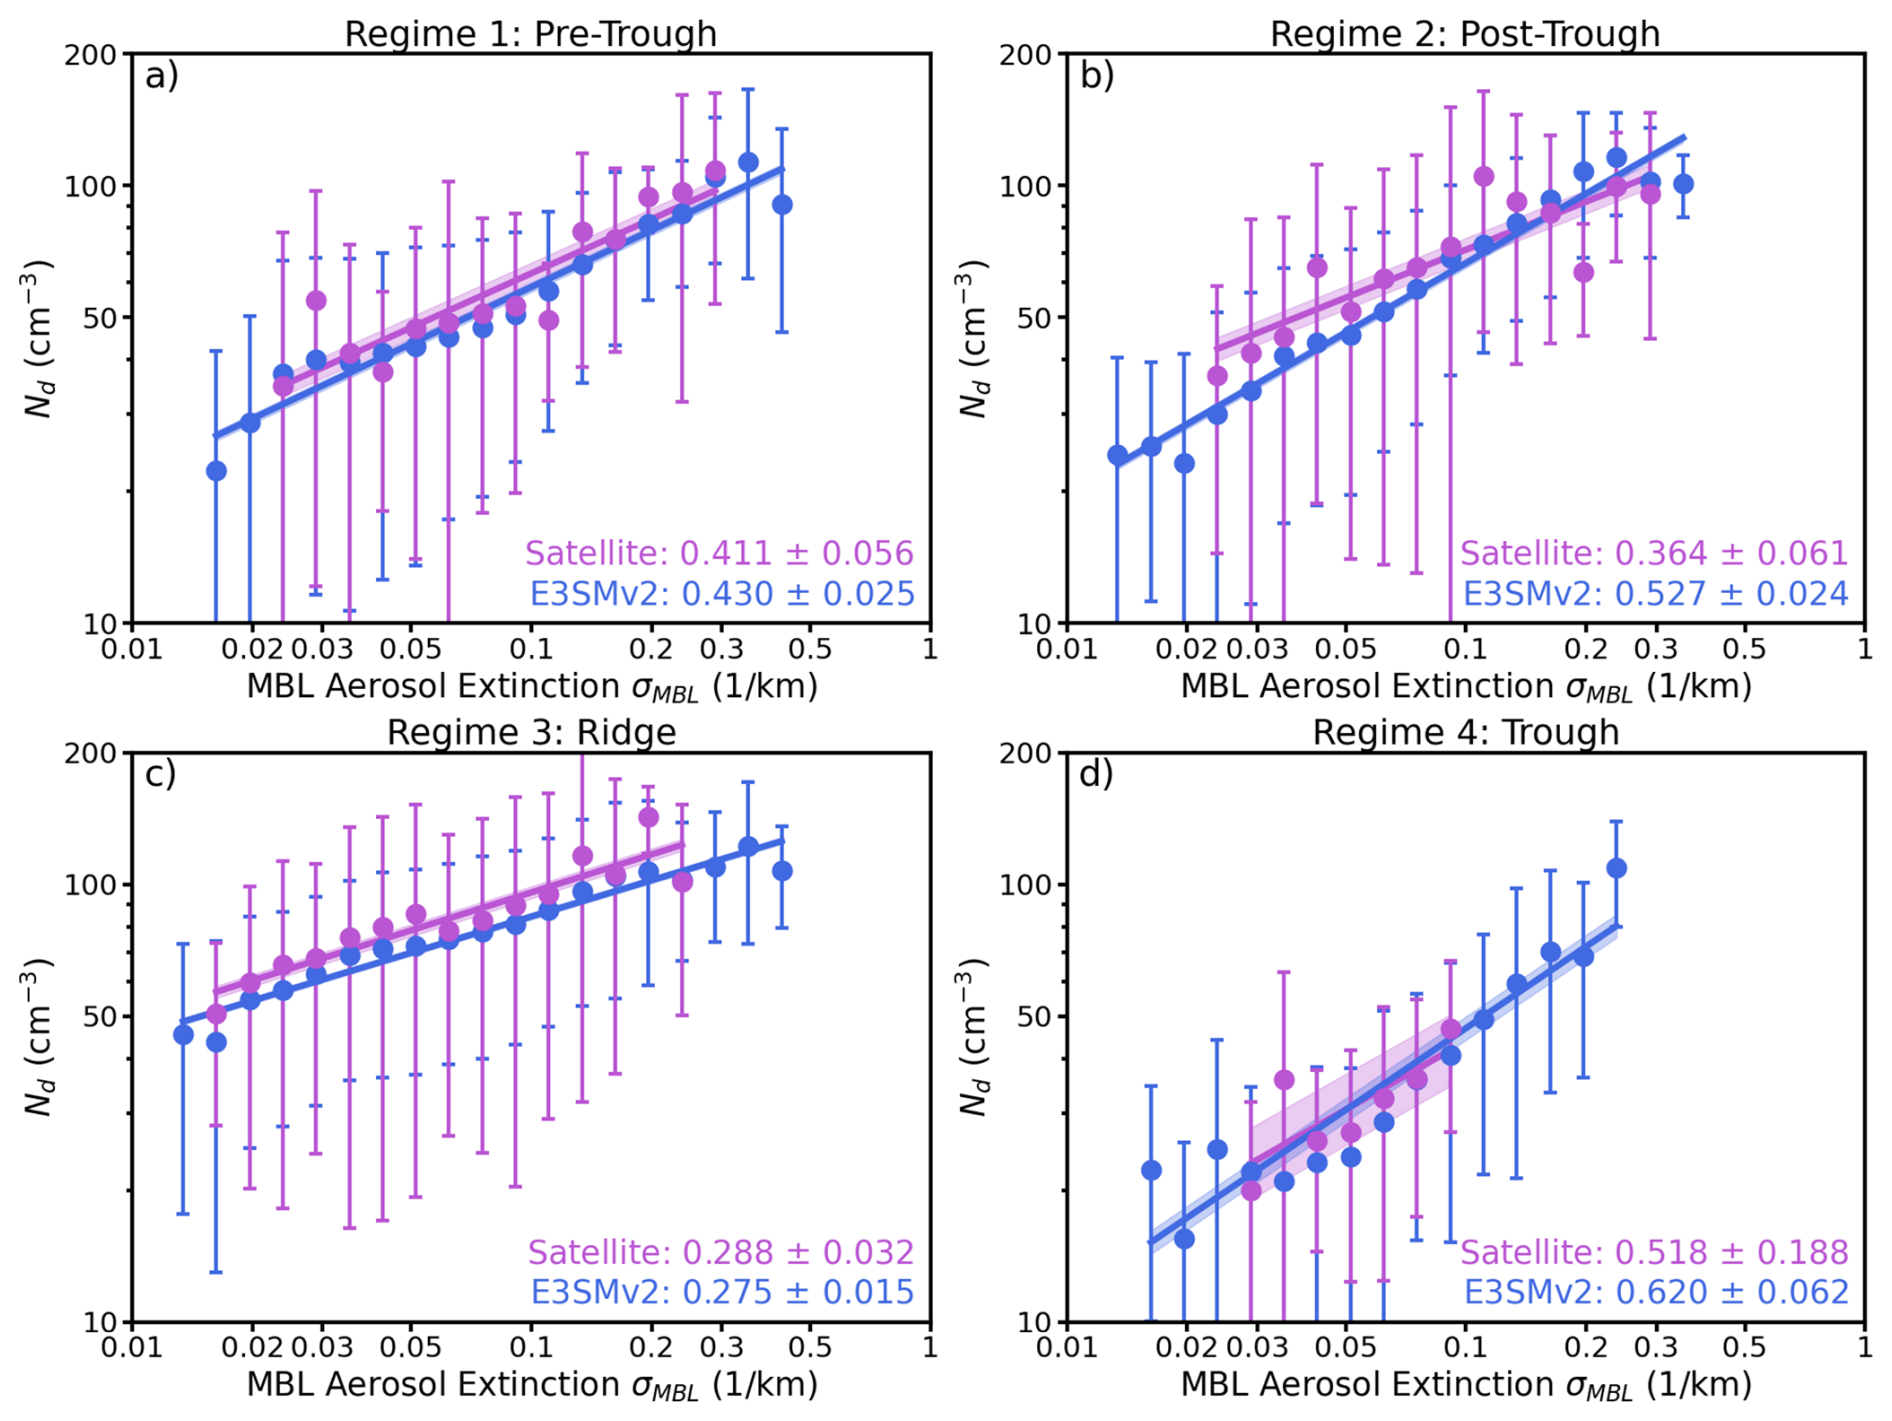
Figure 8Cloud droplet number concentrations (Nd) dependence on the mean MBL aerosol extinction coefficient (σMBL) from satellite retrievals (purple) and E3SMv2 simulation (blue), under (a) Regime 1; (b) Regime 2; (c) Regime 3 and (d) Regime 4. The solid line indicates the regression line, and the Nd susceptibility is denoted in the legend, and “±” values are standard errors of the fitted slopes.
Both satellite retrievals and E3SMv2 yield the lowest Nd susceptibility under the Ridge scenario (Regime 3, Fig. 8c), consistent with the stabilizing effect of subsidence that suppresses updraft variability and limits cloud depth. Furthermore, solar heating on cloud top, especially prominent in the local afternoon, can offset the longwave radiative cooling, thereby stabilize the cloud layer and reduce in-cloud supersaturation (Wood, 2012; Zheng et al., 2018), hence dampening the Nd susceptibility to aerosols. Such mechanism can exert a larger influence on Regime 3, as it is dominated by the warm season (summer and fall) occurrences. The good agreement between the model and satellite observations under these steady conditions suggests that, when cloud-top mixing and convective vigor are limited, E3SMv2 aerosol activation and microphysics perform reasonably well.
Conversely, under trough conditions (Regime 4), retrievals and E3SMv2 produce the highest Nd susceptibility among all regimes (Fig. 8d). In these conditions, stronger updraft and abundant moisture produce deeper MBL clouds, and effectively increase the in-cloud supersaturation (Gong et al., 2023). Therefore, the environmental conditions and the relatively less Nd provide aerosols a greater opportunity to modulate droplet numbers (Hudson and Noble, 2014; Zheng et al., 2024). The E3SMv2 exhibits a steeper slope than that observed, suggesting that the model may overestimate the efficiency with which additional aerosol activates into new droplets, though the discrepancy is less pronounced than those in Regime 2.
Interestingly, the largest overestimation of ACIN by E3SMv2 occurs under Post-Trough conditions (Regime 2, Fig. 8b). In this regime, the model exhibits a much higher ACIN than observations, suggesting that the model either overestimates aerosol activation or underrepresents processes that limit droplet concentration, such as drizzle formation and entrainment mixing. In thicker MBL clouds, the greater vertical extent may allow for enhanced droplet recirculation and collision–coalescence, resulting in a reduction of Nd that dampens aerosol effects (O et al., 2018; Zheng et al., 2024). Under Pre-Trough conditions (Regime 1, Fig. 8a), the model slightly overestimates Nd susceptibility yet agrees better with observations compared to Post-Trough. Previous studies have shown that E3SMv1 exhibits greater sensitivity of Nd to aerosols than do ground-based and satellite observations (Christensen et al., 2023; Varble et al., 2023), and this issue appears to persist in E3SMv2 over the ENA, consistent with Huang et al. (2024). It is possible that the model does not accurately represent the postfrontal boundary layer, possibly due to the unresolved subgrid turbulence (Ma et al., 2022), which may lead to an exaggerated Nd response to aerosol extinction.
Note that under low MBL aerosol (σMBL) conditions, the model yields more occasions of low Nd compared to the satellite, though it can be due to the limited sample sizes in the satellite, yet the Nd increases with σMBL are also more subtle, especially in the Post-Trough and Ridge regimes. Previous studies suggest that when environmental conditions limit activation and updraft, the resulting droplet numbers are systematically low (Tang et al., 2023; Varble et al., 2023). In other words, the model parameterizations lead to under-activation of aerosols in low-aerosol or weak-turbulence regimes. In contrast, sensitivity experiments by Wan et al. (2025) show that while stronger updrafts can boost Nd, doing so would undesirably increase the effective radiative forcing. Therefore, the model aerosol activation scheme might be oversensitive to the environmental factors, as shown in the present study. It is also noteworthy that E3SMv2 simulates a greater extent of σMBL than is observed by satellites under all scenarios, particularly in Regime 4, where precipitation is more prevalent. This discrepancy may arise from insufficient drizzle scavenging at moderate to high aerosol loads (Shan et al., 2024), whereby the model fails to effectively remove aerosols, rendering it overly sensitive to incremental changes in σMBL.
4.5 Aerosol-cloud interactions under different regimes
In order to further illustrate the impact of aerosols on the behavior of the LWP-Nd relationship, both satellite and E3SMv2 data are grouped into lower and higher half σMBL categories, defined by the pooled median of the combined satellite and E3SM samples (0.594), and this single threshold is applied to all regimes and both datasets to ensures an identical conditioning (Fig. 9).
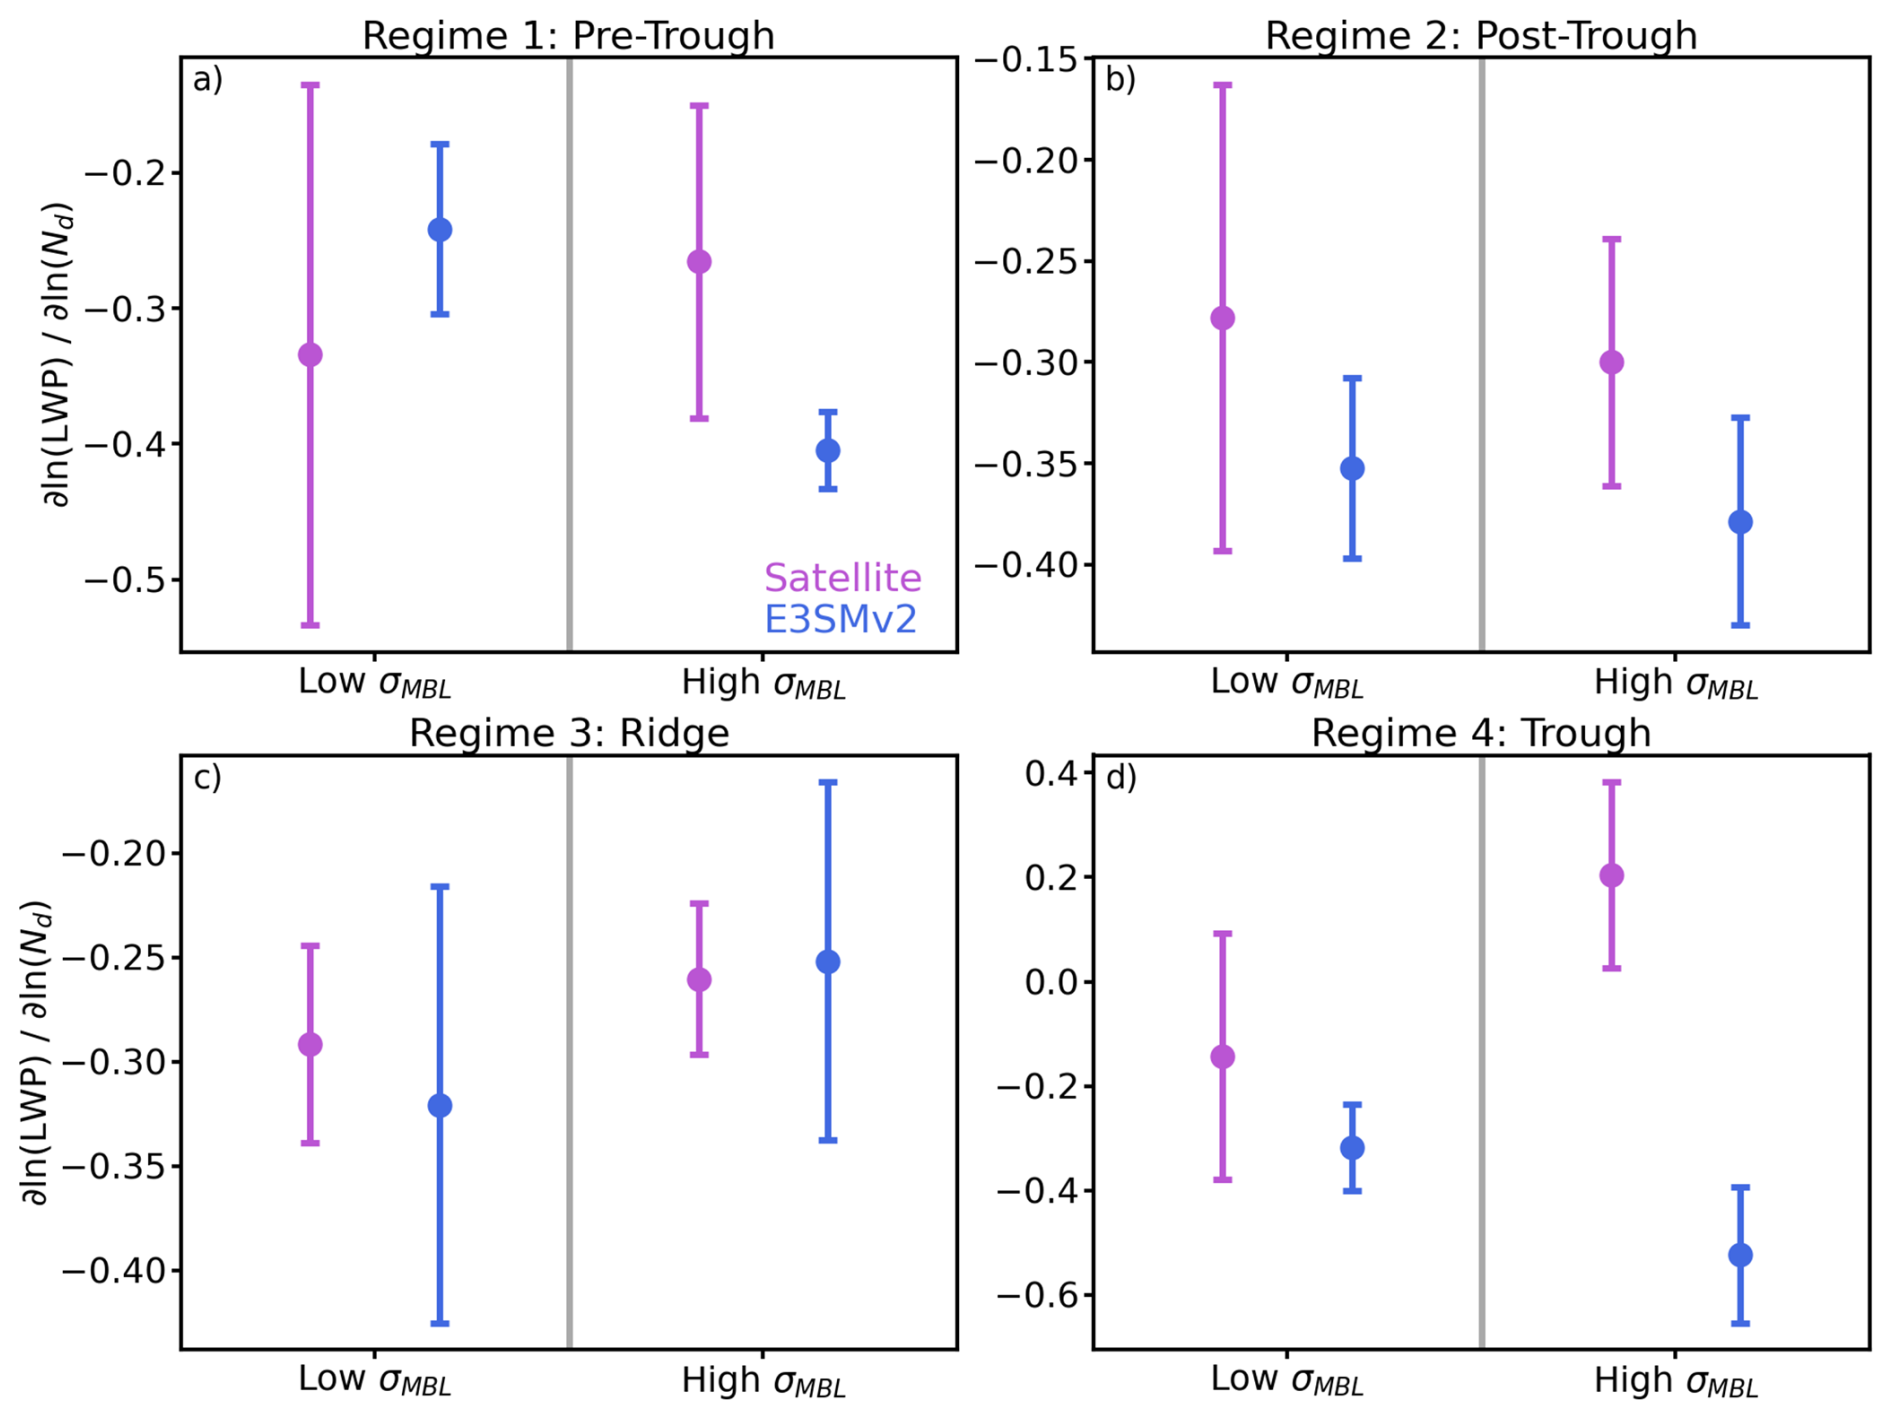
Figure 9LWP adjustment due to Nd under low and high σMBL categories, separated by the median σMBL values (gray line) from the aggregate satellite (purple) and E3SMv2 (blue) dataset. For (a) Regime 1; (b) Regime 2; (c) Regime 3; (d) Regime 4. Error bars denote standard errors of fitted slopes in each category.
In the Pre-Trough regime (Fig. 9a), clouds exhibit low tops and moderate precipitation, featuring a regime where precipitation suppression competes with entrainment drying. Satellite retrievals show a weaker negative LWP-Nd sensitivity under high aerosol loading (i.e., LWP declines less steeply with Nd), whereas E3SMv2 simulates a steeper negative slope. The satellites may observe a weaker decline in LWP with increasing Nd because moderate precipitation in this regime allows sub-cloud drizzle evaporation to moisten the boundary layer, which weakens the in-cloud humidity gradient and reduces the entrainment efficiency, thereby buffering LWP losses (Chen et al., 2011; Jia et al., 2022). In the Ridge regime (Regime 3; Fig. 9c), characterized by shallow clouds and minimal precipitation, both satellite retrievals and E3SMv2 simulations yield a relatively weak (less negative) LWP-Nd sensitivity under high aerosol conditions. At higher aerosol loadings, increased Nd suppresses precipitation more effectively in these shallow clouds, stabilizing LWP by limiting drizzle loss. This mechanistic alignment between observations and E3SMv2 may explain their convergence toward a weaker negative slope (Quaas et al., 2020; Jia et al., 2022).
Post-Trough clouds (Regime 2; Fig. 9b), with greater cloud-top heights and moderate precipitation, exhibit a steeper negative LWP-Nd sensitivity in both observations and E3SMv2. The greater depth of Post-Trough clouds amplifies the vertical moisture gradient between the cloud layer and the overlying dry free troposphere. In this scenario, the primary mechanism reducing LWP is enhanced entrainment-driven evaporation. Once droplets are smaller (high Nd), they evaporate faster at cloud top, enhancing evaporative cooling. This strengthens entrainment through buoyancy reversal, creating positive feedback that accelerates LWP loss (Gryspeerdt et al., 2019). Although precipitation suppression can still play a role, the net result in a deeper cloud is often dominated by entrainment drying rather than by the retention of liquid water. Consequently, as aerosol loading increases, the slope of LWP-Nd becomes more negative, aligning with findings that deeper clouds, with stronger inversions, exhibit steeper negative slopes in LWP-Nd (Zhang and Feingold, 2023).
The Trough regime (Fig. 9d), marked by deep, precipitating clouds and unstable conditions, highlights a key model-observation discrepancy: satellites detect a weak or even positive LWP-Nd relationship at high aerosol loadings, while E3SMv2 simulates a steeply negative slope. It could be possible that, under the moist and unstable environment, the increasing Nd provides more surface areas for water vapor condensation and hence offsets the entrainment drying loss (Gryspeerdt et al., 2019). Also, under this regime with relatively low Nd, the increasing evaporation is favorable for more latent heat release, allowing the cloud to be invigorated and expand in vertical extent, hence increasing the LWP (Altaratz et al., 2014). Moreover, satellite retrievals in this regime may be also biased by vertical cloud inhomogeneity and drizzle contamination, which could artificially inflate LWP estimates in high-Nd conditions (Zhang et al., 2022). Meanwhile, E3SMv2 relies on parameterizations for turbulence and entrainment that are calibrated for shallow stratocumulus and may not fully capture the intermittency of entrainment in thicker, more precipitating cloud regimes (Gettelman and Morrison, 2015; Wang et al., 2023; Tang et al., 2023). This may cause the model to amplify entrainment drying relative to what might be observed, thereby producing a more strongly negative LWP-Nd slope than indicated by satellites. Ultimately, these contrasting signals reflect both retrieval limitations in complex cloud systems and the model's sensitivity to microphysical closure assumptions (Christensen et al., 2023).
Such model-satellite discrepancies are further confirmed in the bulk indirect susceptibility, which quantifies the integrated response of LWP to changes in marine boundary layer aerosol extinction. As shown in Table 4, satellite-derived susceptibilities range from −0.070 to −0.015, while E3SMv2 simulations consistently yield larger negative values (from −0.138 to −0.098), especially for Regime 2 and 3, which feature more stratiform-like clouds. That is, for a given increase in aerosol loading, E3SMv2 predicts a stronger LWP reduction than satellite observations. This systematic overestimation by E3SMv2 indicates that the model may be overly sensitive to aerosol perturbations, translating into an exaggerated indirect effect on LWP. Potential causes for this discrepancy include overly aggressive drizzle suppression in the MG2 microphysics scheme, which may retain excess LWP at low Nd but prematurely truncate water accumulation as Nd increases. In addition, limitations in representing subgrid-scale turbulent mixing and entrainment could further contribute to the observed biases. While E3SMv2 captures the qualitative trends of aerosol–cloud interactions, the quantitative discrepancies highlight the need for further refinement in aerosol activation and cloud microphysical parameterizations, as well as improved process-level representations of drizzle processes and entrainment mixing. Addressing these issues is essential for enhancing the model ability to simulate the indirect effects of aerosols on cloud properties in the ENA region.
Table 4Indirect susceptibility of LWP to Aerosol for Satellite and E3SMv2.
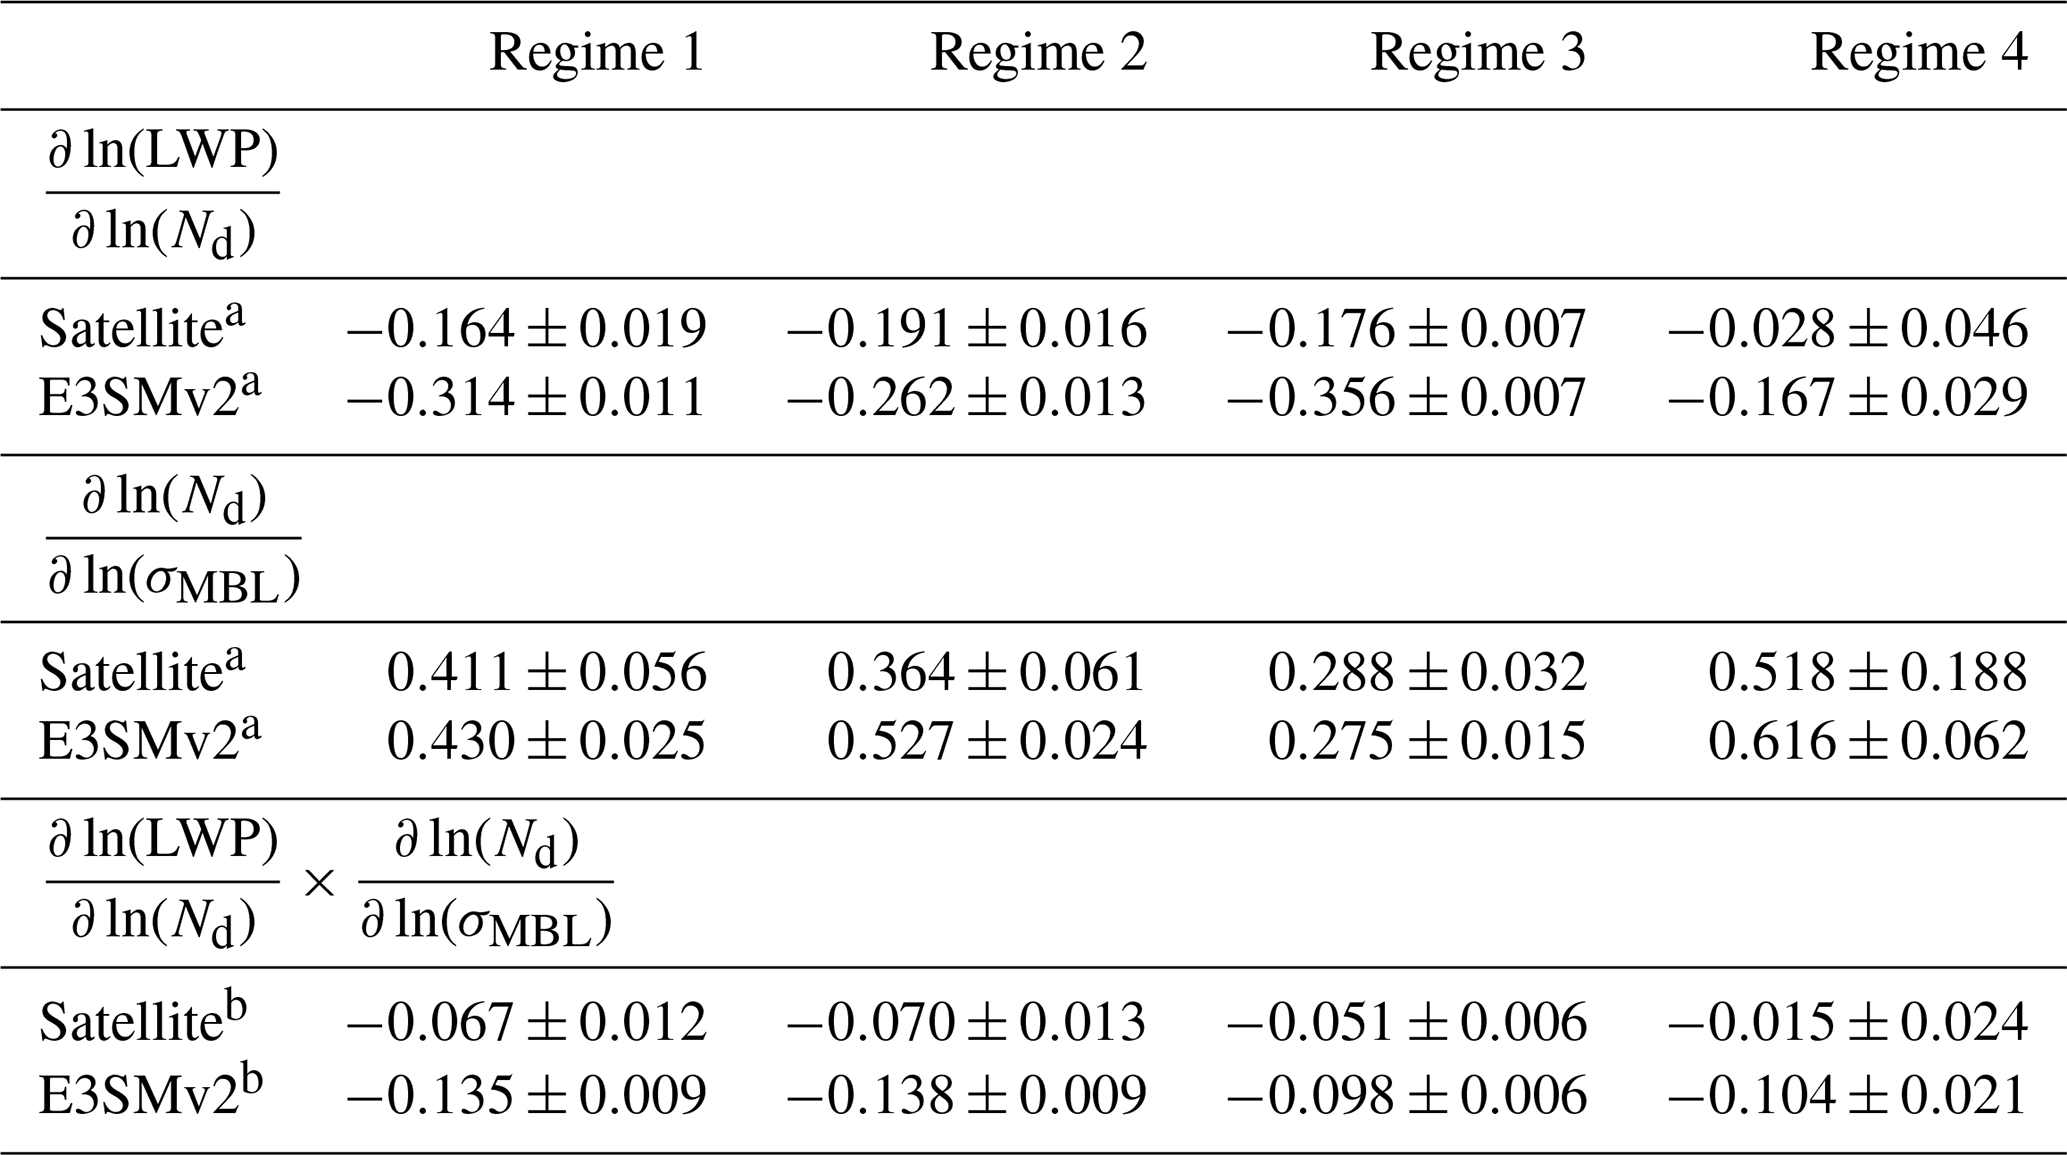
a Values are slopes from ordinary least squares fits in log–log space. The “±” entries are standard errors.
b The errors for the product is obtained by propagating the standard errors of the component ( and ) slopes (multiplicative propagation).
This study investigated aerosol-cloud interaction processes over the ENA by assessing satellite retrievals and simulations from E3SMv2. Using newly developed CALIPSO-derived vertical-resolved aerosol extinction and the collocated MODIS cloud properties, along with model output from a 1° nudged E3SMv2 simulation over a domain from 2006–2014. Leveraging a novel regime-based evaluation framework that places E3SMv2 and satellite observations side-by-side within the clustered synoptic regimes, the variations of marine low-cloud and aerosol properties, and the cloud responses to aerosols are examined.
Our analysis reveals distinct seasonal variations in cloud and aerosol properties, with satellites and E3SMv2 exhibit higher Nd with lower LWP in warm seasons and lower Nd with higher LWP in cold seasons. E3SMv2 consistently underestimates Nd while producing more comparable LWP, in line with prior work. In general, satellite retrievals and E3SMv2 simulations capture the qualitative trends where higher Nd under increased aerosol loading and a characteristic inverted-V relationship between LWP and Nd. However, while the LWP response to Nd in the satellite dataset is primarily attributed to precipitation suppression and entrainment and evaporative processes, the model simulations generate a similar but more dramatic shape due to deficiencies in representing these processes within the model parameterizations. Furthermore, it is possible that satellite retrieval biases and sampling strategies may contribute to the observed inverted-V behavior in the LWP-Nd relationship (Grosvenor et al., 2018; Arola et al., 2022; Gryspeerdt et al., 2022), though we addressed retrieval uncertainties to some extent by applying several data screenings documented in Painemal et al. (2020). Another possibility is that the inverted-V shape may reflects natural spatial variability that leads to both increases and decreases of Nd with LWP (Goren et al., 2025).
To better isolate meteorological controls, we employ a deep-learning-based clustering method to partition the ENA meteorology into four distinct synoptic regimes. Namely, Pre-Trough (regime 1), Post-Trough (regime 2), Ridge (regime 3) and Trough (regime 4). This clustering approach captures spatial and temporal variability more effectively than traditional methods and reveals that meteorology strongly modulates aerosol-cloud interactions. The inverted-V LWP-Nd relationship persists across regimes, with regime dependent differences between satellites and E3SMv2.
Regime 3 (Ridge) shows the strongest simulated inverted-V response among all four regimes, where LWP decreases at high Nd, driven by the stronger contribution of the entrainment-drying effect in a thinner, more stable cloud layer. In the pre-trough regime, the LWP decline with high Nd is partially masked by the interplay between precipitation-stabilization and entrainment-mixing processes. In the Post-Trough regime, deeper clouds with intermediate precipitation display a more negative LWP-Nd sensitivity due to enhanced entrainment-drying effect, a process the model appears to overestimate compared to observations. Conversely, the Trough regime, characterized by deep, precipitating clouds, features complex behavior where satellite retrievals yield a muted LWP response, likely because of precipitation-suppressing overwhelming the entrainment-drying effect on LWP. The model overpredicts the LWP responses across all regimes with different magnitudes. Both datasets show increasing LWP with Nd at low Nd, but E3SMv2 peaks at a lower Nd, suggesting overly aggressive drizzle suppression and insufficient representation of subgrid moisture variability. Moreover, the E3SMv2 simulates steeper declines of LWP with Nd at higher values, indicating that the model parameterization induces more rapid entrainment-drying effects contributing to excessive LWP loss.
Both satellites and E3SMv2 show Nd increasing with MBL aerosol extinction in every regime. However, model Nd susceptibility varies more with meteorology than the satellite record. In the regimes with relatively shallow clouds, both data and model exhibit the lower Nd susceptibility to aerosol. In contrast, E3SMv2 shows a markedly steeper Nd response than observed in regimes with deeper and more precipitating clouds, likely due to an overestimation of aerosol emission and activation or underrepresentation of limiting processes such as insufficient drizzle scavenging. Such discrepancies suggest that the parameterizations in model aerosol activation schemes might be overly sensitive to environmentally controlled factors, which leads to a larger range of ACIN.
The regime-wise LWP responses on Nd are analyzed under low and high MBL aerosol extinction conditions. In shallower and less precipitating cloud conditions, such as the Ridge regime, both satellite retrievals and E3SMv2 simulations converge to a weaker (less negative) sensitivity under high aerosol loading. By contrast, in more precipitating and vertically extended regimes, E3SMv2 exhibits significantly stronger LWP depletions on Nd with increasing aerosols. The E3SMv2 operates at relatively coarse horizontal and vertical resolutions, and the parameterized microphysics. Previous sensitivity studies indicate that changes in low clouds from E3SMv2 are noticeably controlled by CLUBB, and followed by MG2, tunings (Zhang et al., 2023). And the MG2 scheme, tends to overemphasize the entrainment-driven drying and droplet evaporation as it was calibrated for shallow stratus and stratocumulus conditions (Tang et al., 2024). As a result, the transition from shallow to deep cloud regimes, where natural processes evolve continuously, may not be adequately captured, leading to an exaggerated drying signal in the model. While independent analysis of the MG2 scheme show bias in warm rain processes, as it realizes the negative LWP pathway too rapidly and strongly (Zhou et al., 2025), implicating the turbulence-microphysics coupling as a persistent bias source that aligns with our regime-specific over-depletion of LWP at high Nd. Regarding model resolution, vertically resolved physics and concurrent horizontal and vertical refinement improve the representation of entrainment mixing processes and reduce stubborn stratocumulus biases (Lee et al., 2022; Bogenschutz et al., 2023). Hence, we cautiously attribute the potential E3SMv2 discrepancies versus satellite results to those simulated processes in the model, while acknowledging that they can be also the combined effects from multiple feedback and interplay between the model schemes.
It is noteworthy that previous ACI studies in a synoptic context have been largely cyclone-centric (e.g., McCoy et al., 2020; Lee et al., 2025). Our regime-stratified results are consistent with that literature: in cyclone-associated conditions (Pre-Trough, Trough) we see LWP increases or smaller decreases with higher Nd, whereas in the anticyclonic conditions (Ridge) LWP decreases markedly with higher Nd, as expected in stable, dry high-pressure environments. Our clustering approach extends the synoptic pattern classification by providing a flexible, data-driven identification that captures the same physical contrasts as cyclone masks while explicitly considering the other two regimes (Ridge and Post-Trough). Therefore, our approach might be more general, and remaining applicable beyond the regions dominated by midlatitude storm tracks. Model behavior also parallels prior findings: E3SMv2's overly steep LWP reductions in Ridge conditions mirror the overestimation of LWP sensitivity outside cyclones reported by McCoy et al. In short, our aim is to develop a data-driven way to untangle meteorology from cloud responses without pre-specifying synoptic systems, and the learned regimes would naturally recover the traditional cyclone phases (pre-, post-trough, trough). And we also view this as transferable to other regions of the globe, including marine stratocumulus regions with weaker cyclone influence (e.g., the southeastern Atlantic).
In summary, our findings report the satellite-observed and model-simulated range of aerosol-cloud interaction indices from both seasonal and regime-based perspectives over the ENA. Moreover, the regime-based analysis demonstrates that the interplay between aerosol loading and cloud microphysics is highly sensitive to the prevailing meteorological conditions. While E3SMv2 reliably reproduces the overall trends in aerosol effects on stratiform clouds, its performance degrades in deeper, more dynamically complex regimes. Given uncertainties in the satellite observations, it is critical for future studies to integrate datasets from airborne, ground-based, and satellite platforms. This strategy would enable the quantification of errors as well as corroborating the results presented here. In terms of the feasibility of potential model improvements, we think that a feasible approach would be the fine-tuning of the microphysical parameterization, ideally constrained by high-resolution observational data from field campaigns such as ARM. This may reduce the persistent uncertainties in simulating aerosol-cloud interactions, particularly under the dynamic meteorological transitions typical of the ENA region. Furthermore, emulation from high-resolution modeling (e.g., LES) of cloud and rain microphysics processes can be used to replace the bulk microphysics scheme, which can contribute to better performance with manageable cost as shown in previous studies such as Gettelman et al. (2021). Increasing spatial resolution is also feasible in a regionally refined mesh, and increasing vertical resolution might follow, but both would noticeably increase computational cost, so trade-offs should be considered with caution. Lastly, the development of new schemes that bridge the gap between shallow and deep cloud regimes remains particularly challenging, as current large-scale model schemes still treat them separately.
Future research will focus on exploring the transferability of this regime-based analysis to other global marine regions, assessing the scaling effects and exploring the process-level understanding of aerosol-cloud interactions within models, and extending the investigation to include aerosol-cloud-radiation interactions, thereby providing better constraints on effective radiative forcing. Such efforts are essential to refine microphysical parameterizations and enhance the overall fidelity of climate models in representing these critical processes.
The E3SMv2 nudged simulation output is available at: https://doi.org/10.5281/zenodo.15670340 (Zheng et al., 2025b). The ERA5 reanalysis is available at: https://doi.org/10.24381/cds.bd0915c6 (Hersbach et al., 2023). The original clustering model is available at: https://doi.org/10.5281/zenodo.14720991 (Zheng et al., 2025a). The hyperparameter-tuned model and the collocated CALIPSO-MODIS dataset are available upon request.
The supplement related to this article is available online at https://doi.org/10.5194/acp-25-17473-2025-supplement.
The idea of this study was developed by XZ, YF, and DP. XZ performed the analyses and wrote the manuscript under the supervision of YF. MZ performed the nudged E3SM simulation. DP and ZL constructed the collocated CALIPSO-MODIS dataset. XZ, YF, DP, MZ, SX, ZL, RJ and BL participated in further scientific discussions and provided substantial comments and edits on the paper.
At least one of the (co-)authors is a member of the editorial board of Atmospheric Chemistry and Physics. The peer-review process was guided by an independent editor, and the authors also have no other competing interests to declare.
Publisher's note: Copernicus Publications remains neutral with regard to jurisdictional claims made in the text, published maps, institutional affiliations, or any other geographical representation in this paper. While Copernicus Publications makes every effort to include appropriate place names, the final responsibility lies with the authors. Views expressed in the text are those of the authors and do not necessarily reflect the views of the publisher.
This research was funded by the CloudSat and CALIPSO Science Team Recompete Program under the Science Mission Directorate of NASA (NNH21ZDA001N-CCST). Yan Feng, Meng Zhang, Shaocheng Xie, and Robert Jacob would like to acknowledge the support of the Energy Exascale Earth System Model (E3SM) project, Yan Feng also acknowledges the support of the Atmospheric System Research (ASR) program; both projects are funded by the U.S. Department of Energy (DOE), Office of Science, Office of Biological and Environmental Research. The work at Argonne National Laboratory was supported by the U.S. DOE Office of Science under contract DE-AC02-06CH11357. Bethany Lusch would like to acknowledge the support of the Argonne Leadership Computing Facility, a U.S. Department of Energy Office of Science User Facility at Argonne National Laboratory. (ALCF is also under contract DE-AC02-06CH11357.) Work at Lawrence Livermore National Laboratory was performed under the auspices of the US DOE by Lawrence Livermore National Laboratory under contract No. DE-AC52-07NA27344. We acknowledge the computing resources provided on Improv, a high-performance computing cluster operated by the Laboratory Computing Resource Center at Argonne National Laboratory.
This research has been supported by the National Aeronautics and Space Administration, Science Mission Directorate (grant-no. NNH21ZDA001N-CCST).
This paper was edited by Lynn M. Russell and reviewed by Mónica Zamora Zapata and two anonymous referees.
Albrecht, B. A.: Aerosols, Cloud Microphysics, and Fractional Cloudiness, Science, 245, 1227–1230, https://doi.org/10.1126/science.245.4923.1227, 1989.
Albrecht, B. A., Fairall, C. W., Thomson, D. W., White, A. B., Snider, J. B., and Schubert, W. H.: Surface-based remote sensing of the observed and the Adiabatic liquid water content of stratocumulus clouds, Geophys. Res. Lett., 17, 89–92, https://doi.org/10.1029/GL017i001p00089, 1990.
Albrecht, B. A., Bretherton, C. S., Johnson, D., Scubert, W. H., and Frisch, A. S.: The Atlantic Stratocumulus Transition Experiment – ASTEX, B. Am. Meteorol. Soc., 76, 889–904, https://doi.org/10.1175/1520-0477(1995)076<0889:Taste>2.0.Co;2, 1995.
Alexandri, F., Müller, F., Choudhury, G., Achtert, P., Seelig, T., and Tesche, M.: A cloud-by-cloud approach for studying aerosol–cloud interaction in satellite observations, Atmos. Meas. Tech., 17, 1739–1757, https://doi.org/10.5194/amt-17-1739-2024, 2024.
Altaratz, O., Koren, I., Remer, L. A., and Hirsch, E.: Review: Cloud invigoration by aerosols – Coupling between microphysics and dynamics, Atmos. Res., 140–141, 38–60, https://doi.org/10.1016/j.atmosres.2014.01.009, 2014.
Arola, A., Lipponen, A., Kolmonen, P., Virtanen, T. H., Bellouin, N., Grosvenor, D. P., Gryspeerdt, E., Quaas, J., and Kokkola, H.: Aerosol effects on clouds are concealed by natural cloud heterogeneity and satellite retrieval errors, Nature Communications, 13, 7357, https://doi.org/10.1038/s41467-022-34948-5, 2022.
Barnes, W. L., Pagano, T. S., and Salomonson, V. V.: Prelaunch characteristics of the Moderate Resolution Imaging Spectroradiometer (MODIS) on EOS-AM1, IEEE T. Geosci. Remote, 36, 1088–1100, https://doi.org/10.1109/36.700993, 1998.
Baynard, T., Garland, R. M., Ravishankara, A. R., Tolbert, M. A., and Lovejoy, E. R.: Key factors influencing the relative humidity dependence of aerosol light scattering, Geophys. Res. Lett., 33, L06813, https://doi.org/10.1029/2005GL024898, 2006.
Bellouin, N., Quaas, J., Gryspeerdt, E., Kinne, S., Stier, P., Watson-Parris, D., Boucher, O., Carslaw, K. S., Christensen, M., Daniau, A. L., Dufresne, J. L., Feingold, G., Fiedler, S., Forster, P., Gettelman, A., Haywood, J. M., Lohmann, U., Malavelle, F., Mauritsen, T., McCoy, D. T., Myhre, G., Mülmenstädt, J., Neubauer, D., Possner, A., Rugenstein, M., Sato, Y., Schulz, M., Schwartz, S. E., Sourdeval, O., Storelvmo, T., Toll, V., Winker, D., and Stevens, B.: Bounding Global Aerosol Radiative Forcing of Climate Change, Rev. Geophys., 58, e2019RG000660, https://doi.org/10.1029/2019RG000660, 2020.
Bogenschutz, P. A., Eldred, C., and Caldwell, P. M.: Horizontal resolution sensitivity of the Simple Convection-Permitting E3SM Atmosphere Model in a doubly-periodic configuration, J. Adv. Model. Earth Syst., 15, e2022MS003466, https://doi.org/10.1029/2022MS003466, 2023.
Bretherton, C. S., Blossey, P. N., and Uchida, J.: Cloud droplet sedimentation, entrainment efficiency, and subtropical stratocumulus albedo, Geophys. Res. Lett., 34, https://doi.org/10.1029/2006GL027648, 2007.
Burrows, S. M., Easter, R. C., Liu, X., Ma, P. L., Wang, H., Elliott, S. M., Singh, B., Zhang, K., and Rasch, P. J.: OCEANFILMS (Organic Compounds from Ecosystems to Aerosols: Natural Films and Interfaces via Langmuir Molecular Surfactants) sea spray organic aerosol emissions – implementation in a global climate model and impacts on clouds, Atmos. Chem. Phys., 22, 5223-5251, https://doi.org/10.5194/acp-22-5223-2022, 2022.
Carrillo, J., Guerra, J. C., Cuevas, E., and Barrancos, J.: Characterization of the Marine Boundary Layer and the Trade-Wind Inversion over the Sub-tropical North Atlantic, Bound.-Lay. Meteorol., 158, 311–330, https://doi.org/10.1007/s10546-015-0081-1, 2016.
Chen, Y. C., Xue, L., Lebo, Z. J., Wang, H., Rasmussen, R. M., and Seinfeld, J. H.: A comprehensive numerical study of aerosol-cloud-precipitation interactions in marine stratocumulus, Atmos. Chem. Phys., 11, 9749-9769, https://doi.org/10.5194/acp-11-9749-2011, 2011.
Christensen, M. W., Ma, P.-L., Wu, P., Varble, A. C., Mülmenstädt, J., and Fast, J. D.: Evaluation of aerosol–cloud interactions in E3SM using a Lagrangian framework, Atmos. Chem. Phys., 23, 2789–2812, https://doi.org/10.5194/acp-23-2789-2023, 2023.
Christensen, M. W., Wu, P., Varble, A. C., Xiao, H., and Fast, J. D.: Aerosol-induced closure of marine cloud cells: enhanced effects in the presence of precipitation, Atmos. Chem. Phys., 24, 6455–6476, https://doi.org/10.5194/acp-24-6455-2024, 2024.
Chun, J.-Y., Wood, R., Blossey, P., and Doherty, S. J.: Microphysical, macrophysical, and radiative responses of subtropical marine clouds to aerosol injections, Atmos. Chem. Phys., 23, 1345–1368, https://doi.org/10.5194/acp-23-1345-2023, 2023.
Dedrick, J. L., Pelayo, C. N., Russell, L. M., Lubin, D., Mülmenstädt, J., and Miller, M.: Competition response of cloud supersaturation explains diminished Twomey effect for smoky aerosol in the tropical Atlantic, P. Natl. Acad. Sci. USA, 122, e2412247122, https://doi.org/10.1073/pnas.2412247122, 2025.
Diamond, M. S., Director, H. M., Eastman, R., Possner, A., and Wood, R.: Substantial cloud brightening from shipping in subtropical low clouds, AGU Adv., 1, e2019AV000111, https://doi.org/10.1029/2019AV000111, 2020.
Dong, X., Zheng, X., Xi, B., and Xie, S.: A Climatology of Midlatitude Maritime Cloud Fraction and Radiative Effect Derived from the ARM ENA Ground-Based Observations, J. Climate, 36, 531–546, https://doi.org/10.1175/JCLI-D-22-0290.1, 2023.
Erfani, E., Blossey, P., Wood, R., Mohrmann, J., Doherty, S. J., Wyant, M., and O, K.-T.: Simulating Aerosol Lifecycle Impacts on the Subtropical Stratocumulus-to-Cumulus Transition Using Large-Eddy Simulations, J. Geophys. Res.-Atmos., 127, e2022JD037258, https://doi.org/10.1029/2022JD037258, 2022.
Faruque, O., Nji, F. N., Cham, M., Salvi, R. M., Zheng, X., and Wang, J.: Deep Spatiotemporal Clustering: A Temporal Clustering Approach for Multi-dimensional Climate Data, ArXiv, https://arxiv.org/abs/2304.14541, 2023.
Feingold, G., Ghate, V. P., Russell, L. M., Blossey, P., Cantrell, W., Christensen, M. W., Diamond, M. S., Gettelman, A., Glassmeier, F., Gryspeerdt, E., Haywood, J., Hoffmann, F., Kaul, C. M., Lebsock, M., McComiskey, A. C., McCoy, D. T., Ming, Y., Mülmenstädt, J., Possner, A., Prabhakaran, P., Quinn, P. K., Schmidt, K. S., Shaw, R. A., Singer, C. E., Sorooshian, A., Toll, V., Wan, J. S., Wood, R., Yang, F., Zhang, J., and Zheng, X.: Physical science research needed to evaluate the viability and risks of marine cloud brightening, Sci. Adv., 10, eadi8594, https://doi.org/10.1126/sciadv.adi8594, 2024.
Feingold, G., Glassmeier, F., Zhang, J., and Hoffmann, F.: Opinion: Inferring process from snapshots of cloud systems, Atmos. Chem. Phys., 25, 10869–10885, https://doi.org/10.5194/acp-25-10869-2025, 2025.
Feng, Y., Cadeddu, M., Kotamarthi, V. R., Renju, R., and Raju, C. S.: Humidity bias and effect on simulated aerosol optical properties during the Ganges Valley Experiment, Curr. Sci., 111, 93–100, https://doi.org/10.18520/cs/v111/i1/93-100, 2016.
Feng, Y., Wang, H., Rasch, P. J., Zhang, K., Lin, W., Tang, Q., Xie, S., Hamilton, D. S., Mahowald, N., and Yu, H.: Global Dust Cycle and Direct Radiative Effect in E3SM Version 1: Impact of Increasing Model Resolution, Journal of Advances in Modeling Earth Systems, 14, e2021MS002909, https://doi.org/10.1029/2021MS002909, 2022.
Gettelman, A. and Morrison, H.: Advanced Two-Moment Bulk Microphysics for Global Models. Part I: Off-Line Tests and Comparison with Other Schemes, J. Climate, 28, 1268–1287, https://doi.org/10.1175/JCLI-D-14-00102.1, 2015.
Gettelman, A., Gagne, D. J., Chen, C.-C., Christensen, M. W., Lebo, Z. J., Morrison, H., and Gantos, G.: Machine learning the warm rain process, J. Adv. Model. Earth Syst., 13, e2020MS002268, https://doi.org/10.1029/2020MS002268, 2021.
Ghate, V. P., Cadeddu, M. P., Zheng, X., and O'Connor, E.: Turbulence in the Marine Boundary Layer and Air Motions below Stratocumulus Clouds at the ARM Eastern North Atlantic Site, J. Appl. Meteorol. Clim., 60, 1495–1510, https://doi.org/10.1175/JAMC-D-21-0087.1, 2021.
Ghate, V. P., Surleta, T., Magaritz-Ronen, L., Raveh-Rubin, S., Gallo, F., Carlton, A. G., and Azevedo, E. B.: Drivers of Cloud Condensation Nuclei in the Eastern North Atlantic as Observed at the ARM Site, J. Geophys. Res.-Atmos., 128, e2023JD038636, https://doi.org/10.1029/2023JD038636, 2023.
Gläser, G., Wernli, H., Kerkweg, A., and Teubler, F.: The transatlantic dust transport from North Africa to the Americas – Its characteristics and source regions, J. Geophys. Res.-Atmos., 120, 11231–211252, https://doi.org/10.1002/2015JD023792, 2015.
Golaz, J.-C., Caldwell, P. M., Van Roekel, L. P., Petersen, M. R., Tang, Q., Wolfe, J. D., Abeshu, G., Anantharaj, V., Asay-Davis, X. S., Bader, D. C., Baldwin, S. A., Bisht, G., Bogenschutz, P. A., Branstetter, M., Brunke, M. A., Brus, S. R., Burrows, S. M., Cameron-Smith, P. J., Donahue, A. S., Deakin, M., Easter, R. C., Evans, K. J., Feng, Y., Flanner, M., Foucar, J. G., Fyke, J. G., Griffin, B. M., Hannay, C., Harrop, B. E., Hoffman, M. J., Hunke, E. C., Jacob, R. L., Jacobsen, D. W., Jeffery, N., Jones, P. W., Keen, N. D., Klein, S. A., Larson, V. E., Leung, L. R., Li, H.-Y., Lin, W., Lipscomb, W. H., Ma, P.-L., Mahajan, S., Maltrud, M. E., Mametjanov, A., McClean, J. L., McCoy, R. B., Neale, R. B., Price, S. F., Qian, Y., Rasch, P. J., Reeves Eyre, J. E. J., Riley, W. J., Ringler, T. D., Roberts, A. F., Roesler, E. L., Salinger, A. G., Shaheen, Z., Shi, X., Singh, B., Tang, J., Taylor, M. A., Thornton, P. E., Turner, A. K., Veneziani, M., Wan, H., Wang, H., Wang, S., Williams, D. N., Wolfram, P. J., Worley, P. H., Xie, S., Yang, Y., Yoon, J.-H., Zelinka, M. D., Zender, C. S., Zeng, X., Zhang, C., Zhang, K., Zhang, Y., Zheng, X., Zhou, T., and Zhu, Q.: The DOE E3SM Coupled Model Version 1: Overview and Evaluation at Standard Resolution, Journal of Advances in Modeling Earth Systems, 11, 2089–2129, https://doi.org/10.1029/2018MS001603, 2019.
Golaz, J.-C., Van Roekel, L. P., Zheng, X., Roberts, A. F., Wolfe, J. D., Lin, W., Bradley, A. M., Tang, Q., Maltrud, M. E., Forsyth, R. M., Zhang, C., Zhou, T., Zhang, K., Zender, C. S., Wu, M., Wang, H., Turner, A. K., Singh, B., Richter, J. H., Qin, Y., Petersen, M. R., Mametjanov, A., Ma, P.-L., Larson, V. E., Krishna, J., Keen, N. D., Jeffery, N., Hunke, E. C., Hannah, W. M., Guba, O., Griffin, B. M., Feng, Y., Engwirda, D., Di Vittorio, A. V., Dang, C., Conlon, L. M., Chen, C.-C.-J., Brunke, M. A., Bisht, G., Benedict, J. J., Asay-Davis, X. S., Zhang, Y., Zhang, M., Zeng, X., Xie, S., Wolfram, P. J., Vo, T., Veneziani, M., Tesfa, T. K., Sreepathi, S., Salinger, A. G., Reeves Eyre, J. E. J., Prather, M. J., Mahajan, S., Li, Q., Jones, P. W., Jacob, R. L., Huebler, G. W., Huang, X., Hillman, B. R., Harrop, B. E., Foucar, J. G., Fang, Y., Comeau, D. S., Caldwell, P. M., Bartoletti, T., Balaguru, K., Taylor, M. A., McCoy, R. B., Leung, L. R., and Bader, D. C.: The DOE E3SM Model Version 2: Overview of the Physical Model and Initial Model Evaluation, Journal of Advances in Modeling Earth Systems, 14, e2022MS003156, https://doi.org/10.1029/2022MS003156, 2022.
Gong, X., Wang, Y., Xie, H., Zhang, J., Lu, Z., Wood, R., Stratmann, F., Wex, H., Liu, X., and Wang, J.: Maximum Supersaturation in the Marine Boundary Layer Clouds Over the North Atlantic, AGU Advances, 4, e2022AV000855, https://doi.org/10.1029/2022AV000855, 2023.
Goren, T., Rosenfeld, D., Sourdeval, O., and Quaas, J.: Satellite observations of precipitating marine stratocumulus show greater cloud fraction for decoupled clouds in comparison to coupled clouds, Geophysical Research Letters, 45, 5126–5134, https://doi.org/10.1029/2018GL078122, 2018.
Goren, T., Sourdeval, O., Kretzschmar, J., and Quaas, J.: Spatial Aggregation of Satellite Observations Leads to an Overestimation of the Radiative Forcing due to Aerosol-Cloud Interactions, Geophys. Res. Lett., 50, e2023GL105282, https://doi.org/10.1029/2023GL105282, 2023.
Goren, T., Choudhury, G., Kretzschmar, J., and McCoy, I.: Co-variability drives the inverted-V sensitivity between liquid water path and droplet concentrations, Atmos. Chem. Phys., 25, 3413–3423, https://doi.org/10.5194/acp-25-3413-2025, 2025.
Grosvenor, D. P., Sourdeval, O., Zuidema, P., Ackerman, A., Alexandrov, M. D., Bennartz, R., Boers, R., Cairns, B., Chiu, J. C., Christensen, M., Deneke, H., Diamond, M., Feingold, G., Fridlind, A., Hünerbein, A., Knist, C., Kollias, P., Marshak, A., McCoy, D., Merk, D., Painemal, D., Rausch, J., Rosenfeld, D., Russchenberg, H., Seifert, P., Sinclair, K., Stier, P., van Diedenhoven, B., Wendisch, M., Werner, F., Wood, R., Zhang, Z., and Quaas, J.: Remote Sensing of Droplet Number Concentration in Warm Clouds: A Review of the Current State of Knowledge and Perspectives, Rev. Geophys., 56, 409–453, https://doi.org/10.1029/2017RG000593, 2018.
Gryspeerdt, E., Goren, T., Sourdeval, O., Quaas, J., Mülmenstädt, J., Dipu, S., Unglaub, C., Gettelman, A., and Christensen, M.: Constraining the aerosol influence on cloud liquid water path, Atmos. Chem. Phys., 19, 5331–5347, https://doi.org/10.5194/acp-19-5331-2019, 2019.
Gryspeerdt, E., McCoy, D. T., Crosbie, E., Moore, R. H., Nott, G. J., Painemal, D., Small-Griswold, J., Sorooshian, A., and Ziemba, L.: The impact of sampling strategy on the cloud droplet number concentration estimated from satellite data, Atmos. Meas. Tech., 15, 3875–3892, https://doi.org/10.5194/amt-15-3875-2022, 2022.
Gryspeerdt, E., Povey, A. C., Grainger, R. G., Hasekamp, O., Hsu, N. C., Mulcahy, J. P., Sayer, A. M., and Sorooshian, A.: Uncertainty in aerosol–cloud radiative forcing is driven by clean conditions, Atmos. Chem. Phys., 23, 4115–4122, https://doi.org/10.5194/acp-23-4115-2023, 2023.
Gupta, S., McFarquhar, G. M., O'Brien, J. R., Delene, D. J., Poellot, M. R., Dobracki, A., Podolske, J. R., Redemann, J., LeBlanc, S. E., Segal-Rozenhaimer, M., and Pistone, K.: Impact of the variability in vertical separation between biomass burning aerosols and marine stratocumulus on cloud microphysical properties over the Southeast Atlantic, Atmos. Chem. Phys., 21, 4615–4635, https://doi.org/10.5194/acp-21-4615-2021, 2021.
Hassan, T., Zhang, K., Li, J., Singh, B., Zhang, S., Wang, H., and Ma, P.-L.: Impacts of spatial heterogeneity of anthropogenic aerosol emissions in a regionally refined global aerosol–climate model, Geosci. Model Dev., 17, 3507–3532, https://doi.org/10.5194/gmd-17-3507-2024, 2024.
Hersbach, H., Bell, B., Berrisford, P., Biavati, G., Horányi, A., Muñoz Sabater, J., Nicolas, J., Peubey, C., Radu, R., Rozum, I., Schepers, D., Simmons, A., Soci, C., Dee, D., and Thépaut, J.-N.: ERA5 hourly data on pressure levels from 1940 to present, Copernicus Climate Change Service (C3S) Climate Data Store (CDS) [data set], https://doi.org/10.24381/cds.bd0915c6, 2023.
Huang, M., Ma, P.-L., Fast, J., Hassan, T., Li, J., Qin, Y., Tang, S., Ullrich, P., Varble, A., and Yao, Yu: Evaluation of E3SM simulated aerosols and aerosol-cloud interactions across GCM and convection-permitting scales, ESS Open Archive, https://doi.org/10.22541/essoar.173179990.05795821/v1, 2024.
Hudson, J. G. and Noble, S.: CCN and Vertical Velocity Influences on Droplet Concentrations and Supersaturations in Clean and Polluted Stratus Clouds, J. Atmos. Sci., 71, 312–331, https://doi.org/10.1175/JAS-D-13-086.1, 2014.
IPCC. Climate Change 2021: The Physical Science Basis. Contribution of Working Group I to The Sixth Assessment Report of the Intergovernmental Panel on Climate Change, edited by: Masson-Delmotte, V., Zhai, P., Pirani, A., Connors, S. L., Pe'an, C., Berger, S., Caud, N., Chen, Y., Goldfarb, L., Gomis, M. I., Huang, M., Leitzell, K., Lonnoy, E., Matthews, J. B. R., Maycock, T. K., Waterfield, T., Yelekçi, O., Yu, R., and Zhou, B., Cambridge University Press, Cambridge, United Kingdom and New York, NY, USA, https://doi.org/10.1017/9781009157896, 2021.
Jensen, M. P., Ghate, V. P., Wang, D., Apoznanski, D. K., Bartholomew, M. J., Giangrande, S. E., Johnson, K. L., and Thieman, M. M.: Contrasting characteristics of open- and closed-cellular stratocumulus cloud in the eastern North Atlantic, Atmos. Chem. Phys., 21, 14557-14571, https://doi.org/10.5194/acp-21-14557-2021, 2021.
Jeong, J.-H., Witte, M. K., Glenn, I. B., Smalley, M., Lebsock, M. D., Lamer, K., and Zhu, Z.: Distinct Dynamical and Structural Properties of Marine Stratocumulus and Shallow Cumulus Clouds in the Eastern North Atlantic, J. Geophys. Res.-Atmos., 127, e2022JD037021, https://doi.org/10.1029/2022JD037021, 2022.
Jia, H., Ma, X., Yu, F., Quaas, J., and Rosenfeld, D.: Significant underestimation of radiative forcing by aerosol–cloud interactions derived from satellite-based methods, Nat. Commun., 12, 3649, https://doi.org/10.1038/s41467-021-23888-1, 2021.
Jia, H., Quaas, J., Gryspeerdt, E., Böhm, C., and Sourdeval, O.: Addressing the difficulties in quantifying droplet number response to aerosol from satellite observations, Atmos. Chem. Phys., 22, 7353–7372, https://doi.org/10.5194/acp-22-7353-2022, 2022.
Kang, L., Marchand, R. T., Ma, P.-L., Huang, M., Wood, R., and Jongebloed, U., and Becky, A.: Understanding Biases in E3SMv2 Simulated Cloud Droplet Number and Aerosol Concentrations over the Southern Ocean, ESS Open Archive, https://doi.org/10.22541/essoar.172574475.50852357/v1, 2024.
King, M. D., Platnick, S., Menzel, W. P., Ackerman, S. A., and Hubanks, P. A.: Spatial and Temporal Distribution of Clouds Observed by MODIS Onboard the Terra and Aqua Satellites, IEEE T. Geosci. Remote, 51, 3826–3852, https://doi.org/10.1109/TGRS.2012.2227333, 2013.
Kirschler, S., Voigt, C., Anderson, B., Campos Braga, R., Chen, G., Corral, A. F., Crosbie, E., Dadashazar, H., Ferrare, R. A., Hahn, V., Hendricks, J., Kaufmann, S., Moore, R., Pöhlker, M. L., Robinson, C., Scarino, A. J., Schollmayer, D., Shook, M. A., Thornhill, K. L., Winstead, E., Ziemba, L. D., and Sorooshian, A.: Seasonal updraft speeds change cloud droplet number concentrations in low-level clouds over the western North Atlantic, Atmos. Chem. Phys., 22, 8299–8319, https://doi.org/10.5194/acp-22-8299-2022, 2022.
Larson, V.: CLUBB-SILHS: A parameterization of subgrid variability in the atmosphere, arXiv, https://doi.org/10.48550/arXiv.1711.03675, 2017.
Lee, H.-H., Bogenschutz, P., and Yamaguchi, T.: Resolving away stratocumulus biases in modern global climate models, Geophys. Res. Lett., 49, e2022GL099422, https://doi.org/10.1029/2022GL099422, 2022.
Lee, H.-H., Zheng, X., Qiu, S., and Wang, Y.: Numerical case study of the aerosol–cloud interactions in warm boundary layer clouds over the eastern North Atlantic with an interactive chemistry module, Atmos. Chem. Phys., 25, 6069–6091, https://doi.org/10.5194/acp-25-6069-2025, 2025.
Li, Z., Painemal, D., Schuster, G., Clayton, M., Ferrare, R., Vaughan, M., Josset, D., Kar, J., and Trepte, C.: Assessment of tropospheric CALIPSO Version 4.2 aerosol types over the ocean using independent CALIPSO–SODA lidar ratios, Atmos. Meas. Tech., 15, 2745–2766, https://doi.org/10.5194/amt-15-2745-2022, 2022.
Li, Z., Painemal, D., Feng, Y., and Zheng, X.: Progress in the quantification of aerosol-cloud interactions estimated from the CALIPSO-CloudSat-Aqua/MODIS record, EGUsphere [preprint], https://doi.org/10.5194/egusphere-2025-4769, 2025.
Liu, J., Zhu, Y., Wang, M., Rosenfeld, D., Cao, Y., and Yuan, T.: Cloud Susceptibility to Aerosols: Comparing Cloud-Appearance Versus Cloud-Controlling Factors Regimes, J. Geophys. Res.-Atmos., 129, e2024JD041216, https://doi.org/10.1029/2024JD041216, 2024.
Liu, X., Ma, P.-L., Wang, H., Tilmes, S., Singh, B., Easter, R. C., Ghan, S. J., and Rasch, P. J.: Description and evaluation of a new four-mode version of the Modal Aerosol Module (MAM4) within version 5.3 of the Community Atmosphere Model, Geosci. Model Dev., 9, 505–522, https://doi.org/10.5194/gmd-9-505-2016, 2016.
Logan, T., Xi, B., and Dong, X.: Aerosol properties and their influences on marine boundary layer cloud condensation nuclei at the ARM mobile facility over the Azores, J. Geophys. Res.-Atmos., 119, 4859–4872, https://doi.org/10.1002/2013JD021288, 2014.
Ma, P.-L., Harrop, B. E., Larson, V. E., Neale, R. B., Gettelman, A., Morrison, H., Wang, H., Zhang, K., Klein, S. A., Zelinka, M. D., Zhang, Y., Qian, Y., Yoon, J.-H., Jones, C. R., Huang, M., Tai, S.-L., Singh, B., Bogenschutz, P. A., Zheng, X., Lin, W., Quaas, J., Chepfer, H., Brunke, M. A., Zeng, X., Mülmenstädt, J., Hagos, S., Zhang, Z., Song, H., Liu, X., Pritchard, M. S., Wan, H., Wang, J., Tang, Q., Caldwell, P. M., Fan, J., Berg, L. K., Fast, J. D., Taylor, M. A., Golaz, J.-C., Xie, S., Rasch, P. J., and Leung, L. R.: Better calibration of cloud parameterizations and subgrid effects increases the fidelity of the E3SM Atmosphere Model version 1, Geosci. Model Dev., 15, 2881–2916, https://doi.org/10.5194/gmd-15-2881-2022, 2022.
Martin, G. M., Johnson, D. W., and Spice, A.: The Measurement and Parameterization of Effective Radius of Droplets in Warm Stratocumulus Clouds, J. Atmos. Sci., 51, 1823–1842, https://doi.org/10.1175/1520-0469(1994)051<1823:TMAPOE>2.0.CO;2, 1994.
McCoy, D. T., Bender, F. A.-M., Mohrmann, J. K. C., Hartmann, D. L., Wood, R., and Grosvenor, D. P.: The global aerosol-cloud first indirect effect estimated using MODIS, MERRA, and AeroCom, J. Geophys. Res. Atmos., 122, 1779–1796, https://doi.org/10.1002/2016JD026141, 2017.
McCoy, D. T., Field, P., Gordon, H., Elsaesser, G. S., and Grosvenor, D. P.: Untangling causality in midlatitude aerosol–cloud adjustments, Atmos. Chem. Phys., 20, 4085–4103, https://doi.org/10.5194/acp-20-4085-2020, 2020.
Mechem, D. B., Wittman, C. S., Miller, M. A., Yuter, S. E., and de Szoeke, S. P.: Joint synoptic and cloud variability over the Northeast Atlantic near the Azores, J. Appl. Meteorol. Climatol., 57, 1273–1290, https://doi.org/10.1175/JAMC-D-17-0211.1, 2018.
Minnis, P., Sun-Mack, S., Chen, Y., Chang, F. L., Yost, C. R., Smith, W. L., Heck, P. W., Arduini, R. F., Bedka, S. T., Yi, Y., Hong, G., Jin, Z., Painemal, D., Palikonda, R., Scarino, B. R., Spangenberg, D. A., Smith, R. A., Trepte, Q. Z., Yang, P., and Xie, Y.: CERES MODIS Cloud Product Retrievals for Edition 4 – Part I: Algorithm Changes, IEEE T. Geosci. Remote, 59, 2744–2780, https://doi.org/10.1109/TGRS.2020.3008866, 2021.
Mlawer, E. J., Taubman, S. J., Brown, P. D., Iacono, M. J., and Clough, S. A.: Radiative transfer for inhomogeneous atmospheres: RRTM, a validated correlated-k model for the longwave, J. Geophys. Res.-Atmos., 102, 16663–16682, https://doi.org/10.1029/97JD00237, 1997.
Mülmenstädt, J., and Feingold, G.: The Radiative Forcing of Aerosol–Cloud Interactions in Liquid Clouds: Wrestling and Embracing Uncertainty, Curr Clim Change Rep 4, 23–40, https://doi.org/10.1007/s40641-018-0089-y, 2018.
Mülmenstädt, J., Lubin, D., Russell, L. M., and Vogelmann, A. M.: Cloud Properties over the North Slope of Alaska: Identifying the Prevailing Meteorological Regimes, J. Climate, 25, 8238–8258, https://doi.org/10.1175/JCLI-D-11-00636.1, 2012.
Mülmenstädt, J., Ackerman, A. S., Fridlind, A. M., Huang, M., Ma, P.-L., Mahfouz, N., Bauer, S. E., Burrows, S. M., Christensen, M. W., Dipu, S., Gettelman, A., Leung, L. R., Tornow, F., Quaas, J., Varble, A. C., Wang, H., Zhang, K., and Zheng, Y.: Can general circulation models (GCMs) represent cloud liquid water path adjustments to aerosol–cloud interactions?, Atmos. Chem. Phys., 24, 13633–13652, https://doi.org/10.5194/acp-24-13633-2024, 2024a.
Mülmenstädt, J., Gryspeerdt, E., Dipu, S., Quaas, J., Ackerman, A. S., Fridlind, A. M., Tornow, F., Bauer, S. E., Gettelman, A., Ming, Y., Zheng, Y., Ma, P.-L., Wang, H., Zhang, K., Christensen, M. W., Varble, A. C., Leung, L. R., Liu, X., Neubauer, D., Partridge, D. G., Stier, P., and Takemura, T.: General circulation models simulate negative liquid water path–droplet number correlations, but anthropogenic aerosols still increase simulated liquid water path, Atmos. Chem. Phys., 24, 7331–7345, https://doi.org/10.5194/acp-24-7331-2024, 2024b.
O, K.-T., Wood, R., and Bretherton, C. S.: Ultraclean Layers and Optically Thin Clouds in the Stratocumulus-to-Cumulus Transition. Part II: Depletion of Cloud Droplets and Cloud Condensation Nuclei through Collision–Coalescence, J. Atmos. Sci., 75, 1653–1673, https://doi.org/10.1175/JAS-D-17-0218.1, 2018.
Ovchinnikov, M., Ma, P.-L., Kaul, C. M., Pressel, K. G., Huang, M., Shpund, J., and Tang, S.: Evaluation of Autoconversion Representation in E3SMv2 Using an Ensemble of Large-Eddy Simulations of Low-Level Warm Clouds, Journal of Advances in Modeling Earth Systems, 16, e2024MS004280, https://doi.org/10.1029/2024MS004280, 2024.
Painemal, D. and Zuidema, P.: Assessment of MODIS cloud effective radius and optical thickness retrievals over the Southeast Pacific with VOCALS-REx in situ measurements, J. Geophys. Res.-Atmos., 116, https://doi.org/10.1029/2011JD016155, 2011.
Painemal, D., Greenwald, T., Cadeddu, M., and Minnis, P.: First extended validation of satellite microwave liquid water path with ship-based observations of marine low clouds, Geophys. Res. Lett., 43, 6563–6570, https://doi.org/10.1002/2016GL069061, 2016.
Painemal, D., Clayton, M., Ferrare, R., Burton, S., Josset, D., and Vaughan, M.: Novel aerosol extinction coefficients and lidar ratios over the ocean from CALIPSO–CloudSat: evaluation and global statistics, Atmos. Meas. Tech., 12, 2201–2217, https://doi.org/10.5194/amt-12-2201-2019, 2019.
Painemal, D., Chang, F.-L., Ferrare, R., Burton, S., Li, Z., Smith Jr., W. L., Minnis, P., Feng, Y., and Clayton, M.: Reducing uncertainties in satellite estimates of aerosol–cloud interactions over the subtropical ocean by integrating vertically resolved aerosol observations, Atmos. Chem. Phys., 20, 7167–7177, https://doi.org/10.5194/acp-20-7167-2020, 2020.
Painemal, D., Chellappan, S., Smith Jr., W. L., Spangenberg, D., Park, J. M., Ackerman, A., Chen, J., Crosbie, E., Ferrare, R., Hair, J., Kirschler, S., Li, X.-Y., McComiskey, A., Moore, R. H., Sanchez, K., Sorooshian, A., Tornow, F., Voigt, C., Wang, H., Winstead, E., Zeng, X., Ziemba, L., and Zuidema, P.: Wintertime Synoptic Patterns of Midlatitude Boundary Layer Clouds Over the Western North Atlantic: Climatology and Insights From In Situ ACTIVATE Observations, J. Geophys. Res.-Atmos., 128, e2022JD037725, https://doi.org/10.1029/2022JD037725, 2023.
Platnick, S., King, M. D., Ackerman, S. A., Menzel, W. P., Baum, B. A., Riedi, J. C., and Frey, R. A.: The MODIS cloud products: algorithms and examples from Terra, IEEE T. Geosci. Remote, 41, 459–473, https://doi.org/10.1109/TGRS.2002.808301, 2003.
Possner, A., Eastman, R., Bender, F., and Glassmeier, F.: Deconvolution of boundary layer depth and aerosol constraints on cloud water path in subtropical stratocumulus decks, Atmos. Chem. Phys., 20, 3609–3621, https://doi.org/10.5194/acp-20-3609-2020, 2020.
Qin, Y., Zheng, X., Klein, S. A., Zelinka, M. D., Ma, P.-L., Golaz, J.-C., and Xie, S.: Causes of Reduced Climate Sensitivity in E3SM From Version 1 to Version 2, Journal of Advances in Modeling Earth Systems, 16, e2023MS003875, https://doi.org/10.1029/2023MS003875, 2024.
Qiu, S., Zheng, X., Painemal, D., Terai, C. R., and Zhou, X.: Daytime variation in the aerosol indirect effect for warm marine boundary layer clouds in the eastern North Atlantic, Atmos. Chem. Phys., 24, 2913–2935, https://doi.org/10.5194/acp-24-2913-2024, 2024.
Quaas, J., Arola, A., Cairns, B., Christensen, M., Deneke, H., Ekman, A. M. L., Feingold, G., Fridlind, A., Gryspeerdt, E., Hasekamp, O., Li, Z., Lipponen, A., Ma, P.-L., Mülmenstädt, J., Nenes, A., Penner, J. E., Rosenfeld, D., Schrödner, R., Sinclair, K., Sourdeval, O., Stier, P., Tesche, M., van Diedenhoven, B., and Wendisch, M.: Constraining the Twomey effect from satellite observations: issues and perspectives, Atmos. Chem. Phys., 20, 15079–15099, https://doi.org/10.5194/acp-20-15079-2020, 2020.
Rasch, P. J., Xie, S., Ma, P. L., Lin, W., Wang, H., Tang, Q., Burrows, S. M., Caldwell, P., Zhang, K., Easter, R. C., Cameron-Smith, P., Singh, B., Wan, H., Golaz, J. C., Harrop, B. E., Roesler, E., Bacmeister, J., Larson, V. E., Evans, K. J., Qian, Y., Taylor, M., Leung, L. R., Zhang, Y., Brent, L., Branstetter, M., Hannay, C., Mahajan, S., Mametjanov, A., Neale, R., Richter, J. H., Yoon, J. H., Zender, C. S., Bader, D., Flanner, M., Foucar, J. G., Jacob, R., Keen, N., Klein, S. A., Liu, X., Salinger, A. G., Shrivastava, M., and Yang, Y.: An Overview of the Atmospheric Component of the Energy Exascale Earth System Model, Journal of Advances in Modeling Earth Systems, 11, 2377–2411, https://doi.org/10.1029/2019MS001629, 2019.
Rémillard, J. and Tselioudis, G.: Cloud Regime Variability over the Azores and Its Application to Climate Model Evaluation, J. Climate, 28, 9707–9720, https://doi.org/10.1175/JCLI-D-15-0066.1, 2015.
Rodríguez, S. and López-Darias, J.: Extreme Saharan dust events expand northward over the Atlantic and Europe, prompting record-breaking PM10 and PM2.5 episodes, Atmos. Chem. Phys., 24, 12031–12053, https://doi.org/10.5194/acp-24-12031-2024, 2024.
Sanchez, K. J., Chen, C.-L., Russell, L. M., Betha, R., Liu, J., Price, D. J., Massoli, P., Ziemba, L. D., Crosbie, E. C., Moore, R. H., Müller, M., Schiller, S. A., Wisthaler, A., Lee, A. K. Y., Quinn, P. K., Bates, T. S., Porter, J., Bell, T. G., Saltzman, E. S., Vaillancourt, R. D., and Behrenfeld, M. J.: Substantial Seasonal Contribution of Observed Biogenic Sulfate Particles to Cloud Condensation Nuclei, Sci. Rep., 8, 3235, https://doi.org/10.1038/s41598-018-21590-9, 2018.
Sanchez, K. J., Roberts, G. C., Diao, M., and Russell, L. M.: Measured Constraints on Cloud Top Entrainment to Reduce Uncertainty of Nonprecipitating Stratocumulus Shortwave Radiative Forcing in the Southern Ocean, Geophys. Res. Lett., 47, e2020GL090513, https://doi.org/10.1029/2020GL090513, 2020.
Shan, Y., Fan, J., Zhang, K., Shpund, J., Terai, C., Zhang, G. J., Song, X., Chen, C.-C.-J., Lin, W., Liu, X., Shrivastava, M., Wang, H., and Xie, S.: Improving Aerosol Radiative Forcing and Climate in E3SM: Impacts of New Cloud Microphysics and Improved Wet Removal Treatments, Journal of Advances in Modeling Earth Systems, 16, e2023MS004059, https://doi.org/10.1029/2023MS004059, 2024.
Smalley, K. M., M. D. Lebsock, and R. Eastman (2024), Diurnal Patterns in the Observed Cloud Liquid Water Path Response to Droplet Number Perturbations, Geophys. Res. Lett., 51, e2023GL107323, https://doi.org/10.1029/2023GL107323.
Tang, S., Varble, A. C., Fast, J. D., Zhang, K., Wu, P., Dong, X., Mei, F., Pekour, M., Hardin, J. C., and Ma, P.-L.: Earth System Model Aerosol–Cloud Diagnostics (ESMAC Diags) package, version 2: assessing aerosols, clouds, and aerosol–cloud interactions via field campaign and long-term observations, Geosci. Model Dev., 16, 6355–6376, https://doi.org/10.5194/gmd-16-6355-2023, 2023.
Tang, S., Wang, H., Li, X.-Y., Chen, J., Sorooshian, A., Zeng, X., Crosbie, E., Thornhill, K. L., Ziemba, L. D., and Voigt, C.: Understanding aerosol–cloud interactions using a single-column model for a cold-air outbreak case during the ACTIVATE campaign, Atmos. Chem. Phys., 24, 10073–10092, https://doi.org/10.5194/acp-24-10073-2024, 2024.
Tian, J., Comstock, J., Geiss, A., Wu, P., Silber, I., Zhang, D., Kooloth, P., and Feng, Y.-C.: Mesoscale Cellular Convection Detection and Classification Using Convolutional Neural Networks: Insights From Long-Term Observations at ARM Eastern North Atlantic Site, Journal of Geophysical Research: Machine Learning and Computation, 2, e2024JH000486, https://doi.org/10.1029/2024JH000486, 2025.
Twomey, S.: The Influence of Pollution on the Shortwave Albedo of Clouds, J. Atmos. Sci., 34, 1149–1152, https://doi.org/10.1175/1520-0469(1977)034<1149:TIOPOT>2.0.CO;2, 1977.
Varble, A. C., Ma, P.-L., Christensen, M. W., Mülmenstädt, J., Tang, S., and Fast, J.: Evaluation of liquid cloud albedo susceptibility in E3SM using coupled eastern North Atlantic surface and satellite retrievals, Atmos. Chem. Phys., 23, 13523–13553, https://doi.org/10.5194/acp-23-13523-2023, 2023.
Wall, C. J., Norris, J. R., Possner, A., McCoy, D. T., McCoy, I. L., and Lutsko, N. J.: Assessing effective radiative forcing from aerosol–cloud interactions over the global ocean, P. Natl. Acad. Sci. USA, 119, e2210481119, https://doi.org/10.1073/pnas.2210481119, 2022.
Wall, C. J., Storelvmo, T., and Possner, A.: Global observations of aerosol indirect effects from marine liquid clouds, Atmos. Chem. Phys., 23, 13125–13141, https://doi.org/10.5194/acp-23-13125-2023, 2023.
Wan, H., Yenpure, A., Geveci, B., Easter, R. C., Rasch, P. J., Zhang, K., and Zeng, X.: Features of mid- and high-latitude low-level clouds and their relation to strong aerosol effects in the Energy Exascale Earth System Model version 2 (E3SMv2), Geosci. Model Dev., 18, 5655–5680, https://doi.org/10.5194/gmd-18-5655-2025, 2025.
Wang, H., Easter, R. C., Zhang, R., Ma, P.-L., Singh, B., Zhang, K., Ganguly, D., Rasch, P. J., Burrows, S. M., Ghan, S. J., Lou, S., Qian, Y., Yang, Y., Feng, Y., Flanner, M., Leung, L. R., Liu, X., Shrivastava, M., Sun, J., Tang, Q., Xie, S., and Yoon, J.-H.: Aerosols in the E3SM Version 1: New Developments and Their Impacts on Radiative Forcing, Journal of Advances in Modeling Earth Systems, 12, e2019MS001851, https://doi.org/10.1029/2019MS001851, 2020a.
Wang, J., Wood, R., Jensen, M. P., Chiu, J. C., Liu, Y., Lamer, K., Desai, N., Giangrande, S. E., Knopf, D. A., Kollias, P., Laskin, A., Liu, X., Lu, C., Mechem, D., Mei, F., Starzec, M., Tomlinson, J., Wang, Y., Yum, S. S., Zheng, G., Aiken, A. C., Azevedo, E. B., Blanchard, Y., China, S., Dong, X., Gallo, F., Gao, S., Ghate, V. P., Glienke, S., Goldberger, L., Hardin, J. C., Kuang, C., Luke, E. P., Matthews, A. A., Miller, M. A., Moffet, R., Pekour, M., Schmid, B., Sedlacek, A. J., Shaw, R. A., Shilling, J. E., Sullivan, A., Suski, K., Veghte, D. P., Weber, R., Wyant, M., Yeom, J., Zawadowicz, M., and Zhang, Z.: Aerosol and Cloud Experiments in the Eastern North Atlantic (ACE-ENA), B. Am. Meteorol. Soc., 103, E619-E641, https://doi.org/10.1175/BAMS-D-19-0220.1, 2022.
Wang, Y., Zheng, X., Dong, X., Xi, B., Wu, P., Logan, T., and Yung, Y. L.: Impacts of long-range transport of aerosols on marine-boundary-layer clouds in the eastern North Atlantic, Atmos. Chem. Phys., 20, 14741–14755, https://doi.org/10.5194/acp-20-14741-2020, 2020b.9
Wang, Y., Zheng, G., Jensen, M. P., Knopf, D. A., Laskin, A., Matthews, A. A., Mechem, D., Mei, F., Moffet, R., Sedlacek, A. J., Shilling, J. E., Springston, S., Sullivan, A., Tomlinson, J., Veghte, D., Weber, R., Wood, R., Zawadowicz, M. A., and Wang, J.: Vertical profiles of trace gas and aerosol properties over the eastern North Atlantic: variations with season and synoptic condition, Atmos. Chem. Phys., 21, 11079–11098, https://doi.org/10.5194/acp-21-11079-2021, 2021.
Wang, Y., Zheng, X., Dong, X., Xi, B., and Yung, Y. L.: Insights of warm-cloud biases in Community Atmospheric Model 5 and 6 from the single-column modeling framework and Aerosol and Cloud Experiments in the Eastern North Atlantic (ACE-ENA) observations, Atmos. Chem. Phys., 23, 8591–8605, https://doi.org/10.5194/acp-23-8591-2023, 2023.
Winker, D. M., Vaughan, M. A., Omar, A., Hu, Y., Powell, K. A., Liu, Z., Hunt, W. H., and Young, S. A.: Overview of the CALIPSO Mission and CALIOP Data Processing Algorithms, J. Atmos. Ocean. Tech., 26, 2310-2323, https://doi.org/10.1175/2009JTECHA1281.1, 2009.
Wood, R.: Drizzle in Stratiform Boundary Layer Clouds. Part I: Vertical and Horizontal Structure, J. Atmos. Sci., 62, 3011-3033, https://doi.org/10.1175/JAS3529.1, 2005.
Wood, R.: Stratocumulus Clouds, Mon. Weather Rev., 140, 2373–2423, https://doi.org/10.1175/MWR-D-11-00121.1, 2012.
Wood, R., Leon, D., Lebsock, M., Snider, J., and Clarke, A. D.: Precipitation driving of droplet concentration variability in marine low clouds, J. Geophys. Res.-Atmos., 117, https://doi.org/10.1029/2012JD018305, 2012.
Wood, R., Wyant, M., Bretherton, C. S., Rémillard, J., Kollias, P., Fletcher, J., Stemmler, J., de Szoeke, S., Yuter, S., Miller, M., Mechem, D., Tselioudis, G., Chiu, J. C., Mann, J. A. L., O'Connor, E. J., Hogan, R. J., Dong, X., Miller, M., Ghate, V., Jefferson, A., Min, Q., Minnis, P., Palikonda, R., Albrecht, B., Luke, E., Hannay, C., and Lin, Y.: Clouds, Aerosols, and Precipitation in the Marine Boundary Layer: An Arm Mobile Facility Deployment, B. Am. Meteorol. Soc., 96, 419–440, https://doi.org/10.1175/BAMS-D-13-00180.1, 2015.
Wu, P., Dong, X., Xi, B., Liu, Y., Thieman, M., and Minnis, P.: Effects of environment forcing on marine boundary layer cloud-drizzle processes, J. Geophys. Res.-Atmos., 122, 4463–4478, https://doi.org/10.1002/2016JD026326, 2017.
Wu, P., Dong, X., and Xi, B.: A Climatology of Marine Boundary Layer Cloud and Drizzle Properties Derived from Ground-Based Observations over the Azores, J. Climate, 33, 10133–10148, https://doi.org/10.1175/JCLI-D-20-0272.1, 2020.
Xi, B., Dong, X., Minnis, P., and Sun-Mack, S.: Comparison of marine boundary layer cloud properties from CERES-MODIS Edition 4 and DOE ARM AMF measurements at the Azores, J. Geophys. Res.-Atmos., 119, 9509–9529, https://doi.org/10.1002/2014JD021813, 2014.
Xie, S., Lin, W., Rasch, P. J., Ma, P.-L., Neale, R., Larson, V. E., Qian, Y., Bogenschutz, P. A., Caldwell, P., Cameron-Smith, P., Golaz, J.-C., Mahajan, S., Singh, B., Tang, Q., Wang, H., Yoon, J.-H., Zhang, K., and Zhang, Y.: Understanding Cloud and Convective Characteristics in Version 1 of the E3SM Atmosphere Model, Journal of Advances in Modeling Earth Systems, 10, 2618–2644, https://doi.org/10.1029/2018MS001350, 2018.
Xie, S., Wang, Y.-C., Lin, W., Ma, H.-Y., Tang, Q., Tang, S., Zheng, X., Golaz, J.-C., Zhang, G. J., and Zhang, M.: Improved Diurnal Cycle of Precipitation in E3SM With a Revised Convective Triggering Function, Journal of Advances in Modeling Earth Systems, 11, 2290–2310, https://doi.org/10.1029/2019MS001702, 2019.
Yuan, T., Song, H., Painemal, D., and Platnick, S.: Observational evidence of strong forcing from aerosol effect on low cloud coverage, Sci. Adv., 9, eadh7716, https://doi.org/10.1126/sciadv.adh7716, 2023.
Zhang, J. and Feingold, G.: Distinct regional meteorological influences on low-cloud albedo susceptibility over global marine stratocumulus regions, Atmos. Chem. Phys., 23, 1073–1090, https://doi.org/10.5194/acp-23-1073-2023, 2023.
Zhang, G. J., and McFarlane, N. A.: Sensitivity of climate simulations to the parameterization of cumulus convection in the Canadian climate centre general circulation model, Atmosphere-Ocean, 33(3), 407–446, https://doi.org/10.1080/07055900.1995.9649539, 1995.
Zhang, J., Zhou, X., Goren, T., and Feingold, G.: Albedo susceptibility of northeastern Pacific stratocumulus: the role of covarying meteorological conditions, Atmos. Chem. Phys., 22, 861–880, https://doi.org/10.5194/acp-22-861-2022, 2022.
Zhang, J., Chen, Y.-S., Gryspeerdt, E., Yamaguchi, T., and Feingold, G.: Radiative forcing from the 2020 shipping fuel regulation is large but hard to detect, Communications Earth and Environment, 6, 18, https://doi.org/10.1038/s43247-024-01911-9, 2025.
Zhang, Y., Xie, S., Qin, Y., Lin, W., Golaz, J.-C., Zheng, X., Ma, P.-L., Qian, Y., Tang, Q., Terai, C. R., and Zhang, M.: Understanding changes in cloud simulations from E3SM version 1 to version 2, Geosci. Model Dev., 17, 169–189, https://doi.org/10.5194/gmd-17-169-2024, 2024.
Zheng, G., Wang, Y., Aiken, A. C., Gallo, F., Jensen, M. P., Kollias, P., Kuang, C., Luke, E., Springston, S., Uin, J., Wood, R., and Wang, J.: Marine boundary layer aerosol in the eastern North Atlantic: seasonal variations and key controlling processes, Atmos. Chem. Phys., 18, 17615–17635, https://doi.org/10.5194/acp-18-17615-2018, 2018.
Zheng, X., Xi, B., Dong, X., Logan, T., Wang, Y., and Wu, P.: Investigation of aerosol–cloud interactions under different absorptive aerosol regimes using Atmospheric Radiation Measurement (ARM) southern Great Plains (SGP) ground-based measurements, Atmos. Chem. Phys., 20, 3483–3501, https://doi.org/10.5194/acp-20-3483-2020, 2020.
Zheng, X., Dong, X., Ward, D. M., Xi, B., Wu, P., and Wang, Y.: Aerosol-Cloud-Precipitation Interactions in a Closed-cell and Non-homogenous MBL Stratocumulus Cloud, Adv. Atmos. Sci., 39, 2107–2123, https://doi.org/10.1007/s00376-022-2013-6, 2022a.
Zheng, X., Xi, B., Dong, X., Wu, P., Logan, T., and Wang, Y.: Environmental effects on aerosol–cloud interaction in non-precipitating marine boundary layer (MBL) clouds over the eastern North Atlantic, Atmos. Chem. Phys., 22, 335–354, https://doi.org/10.5194/acp-22-335-2022, 2022b.
Zheng, X., Dong, X., Xi, B., Logan, T., and Wang, Y.: Distinctive aerosol–cloud–precipitation interactions in marine boundary layer clouds from the ACE-ENA and SOCRATES aircraft field campaigns, Atmos. Chem. Phys., 24, 10323–10347, https://doi.org/10.5194/acp-24-10323-2024, 2024.
Zheng, X., Faruque, O., Wang, J., and Nji, F.: Deep Spatiotemporal Clustering Model: A Temporal Clustering Approach for Multi-dimensional Climate Data, Zenodo [code], https://doi.org/10.5281/zenodo.14720991, 2025a.
Zheng, X., Feng, Y., Zhang, M., and Xie, S.: E3SMv2 Nudged Model Simulation over ENA region for Zheng et al., 2025, Zenodo [data set], https://doi.org/10.5281/zenodo.15670340, 2025b.
Zheng, X., Qiu, S., Zhang, D., Adebiyi, A., Zheng, X., Faruque, O., Wu, P., and Wang, J.: Variability of Eastern North Atlantic Summertime Marine Boundary Layer Clouds and Aerosols Across Different Synoptic Regimes Identified With Multiple Conditions, J. Geophys. Res.-Atmos., 130, e2024JD042240, https://doi.org/10.1029/2024JD042240, 2025c.
Zhou, X., Painemal, D., Gettleman, A., and Feingold, G.: Exploring causal relationships and adjustment timescales of aerosol–cloud interactions in geostationary satellite observations and CAM6 using wavelet phase coherence analysis, Geophys. Res. Lett., 52, e2024GL111961, https://doi.org/10.1029/2024GL111961, 2025.
- Abstract
- Introduction
- Data and Method
- Aerosol and cloud properties from satellite and E3SMv2
- Regime-based Analysis of Aerosol, cloud properties, and their interactions
- Summary and discussions
- Code and data availability
- Author contributions
- Competing interests
- Disclaimer
- Acknowledgements
- Financial support
- Review statement
- References
- Supplement