the Creative Commons Attribution 4.0 License.
the Creative Commons Attribution 4.0 License.
 | 02 Dec 2025
Intercomparison of tropopause height climatologies: high-resolution radiosonde measurements versus ERA5 reanalysis
Yu Gou
Jian Zhang
Wuke Wang
Kaiming Huang
Shaodong Zhang
The tropopause plays a critical role in stratosphere-troposphere exchange and climate change. Its height is widely defined based on the World Meteorological Organization (WMO) threshold temperature gradient. High-resolution (5–10 m) soundings, therefore, are expected to substantially minimize uncertainties of tropopause height (TH) arising from limited vertical resolution and imprecise temperature measurements. The high-resolution radiosonde data, accumulated from 2000 to 2023 from a globally distributed, sparse network (about 1.5 million profiles from 222 stations), offers valuable insights into climatological tropopause variability. While radiosonde observations are limited by spatiotemporal coverage, European Centre for Medium–Range Weather Forecasts Reanalysis v5 (ERA5) reanalysis datasets offer globally complete tropopause representations. To leverage both the high resolution of radiosonde measurements and the global coverage of ERA5, this study compares their TH estimates and analyzes long-term trends across different latitude zones and seasons. The results indicate that the mean and absolute differences (radiosonde minus ERA5) in TH were 32 and 336 m, respectively, with larger discrepancies observed during the spring season in the tropics (±20°). Overall, point-to-point comparisons indicate that ERA5 effectively captures climatological TH variations in both time and space. Long-term trend analyses revealed increases of +9 m yr−1 (radiosonde) and +7 m yr−1 (ERA5) based on point-to-point comparisons. However, these site-specific trends may differ substantially from the long-term trends observed in ERA5 with complete spatiotemporal resolution, even showing opposite trends. Therefore, continued accumulation of high-resolution radiosonde profile data is crucial to further characterize tropopause changes in a warming climate.
- Article
(6058 KB) - Full-text XML
- BibTeX
- EndNote


The tropopause, marking the boundary between the turbulent troposphere and the stably stratified stratosphere, is a “gate” for exchange of energy, air masses, water vapor and short-lived substances (Fueglistaler et al., 2009). Furthermore, given the impact of global warming and ozone depletion on the troposphere and stratosphere, tropopause variations can serve as an indicator of anthropogenic environmental influences (Santer et al., 2003). Moreover, its extreme sensitivity to climate variability and change makes the tropopause a pivotal factor in understanding and predicting future climate scenarios (Sausen and Santer, 2003; Seidel and Randel, 2006).
The tropopause exhibits unique chemical and dynamical characteristics, and its maintenance relies on complex interactions between large-scale and small-scale circulation patterns, deep convection, cloud formation, and radiation (Randel and Jensen, 2013). For instance, water vapor abundance can influence tropopause height (TH), as an increase in TH accompanies increased optical thickness to maintain a constant emitted temperature. In addition, TH is generally controlled by a combination of diabatic forcing and adiabatic dynamical effects (Zurita-Gotor and Vallis, 2013). These intricate mechanisms eventually lead to a marked difference in TH between the tropics and the poles, with the annual average reaching approximately 16 km in the tropics and 8 km in the polar regions. The subtropical jet streams (STJs), which are typically located at 20–40° latitude in each hemisphere and 12 km height (Manney and Hegglin, 2018) will reinforces the Hadley circulation via “eddy pump” (Staten et al., 2018). The large-scale downwelling in the subtropical Hadley circulation sharply lowers the tropopause, sometimes creating a discontinuity known as the “subtropical tropopause break”, which aligns with the STJ (Turhal et al., 2024).
There are multiple ways to calculate the TH, relying on several empirical criteria based on properties exhibiting sharp transitions between the troposphere and stratosphere. The cold point tropopause (CPT) get the tropopause via the minimum temperature in the vertical temperature profile, which is unsuitable for extratropical regions (Highwood and Hoskins, 1998), and the dynamic tropopause (WMO, 1985; Hoinka, 1998), typically defined by potential vorticity (PV) thresholds of 1.5–4 potential vorticity unit (PVU) (Turhal et al., 2024), is less reliable in regions of low absolute potential vorticity, such as the tropics, and sometimes in mid-latitudes where strong anticyclonic flow prevails (Hoerling et al., 1991). However, the tropopause definition (WMO, 1957), which is thermodynamic, proposed by the World Meteorological Organization offers a more robust global approach (though it may occasionally fail in polar regions), providing reliable TH estimates from various datasets (Hoffmann and Spang, 2022).
Current primary data sources for TH determination include in-situ measurements from radiosonde, meteorological reanalysis datasets, and radio occultation data from the Constellation Observing System for Meteorology Ionosphere and Climate (COSMIC) Data Analysis and Archive Center (CDAAC) of the Global Navigation Satellite System (GNSS). Radiosonde data, collected at stations worldwide, feature long-term records with high accuracy and reliability, yet suffer from sparse and highly uneven global coverage. Global atmospheric reanalysis products provide comprehensive long-term atmospheric information through continuously improved forecast models, observational data, and assimilation schemes (Fujiwara et al., 2017). Modern reanalysis datasets, such as the state-of-the-art ERA5 developed by the European Centre for Medium-Range Weather Forecasts (ECMWF), and Modern-Era Retrospective analysis for Research and Applications, Version 2 (MERRA-2) produced by National Aeronautics and Space Administration (NASA) Global Modeling and Assimilation Office (GMAO) (Gelaro et al., 2017), overcome the spatial and temporal limitations of observational records, offering a global perspective of the tropopause. GNSS-based datasets from various satellite missions (e.g., COSMIC, COSMIC-2, MetOp-A, MetOp-B, and MetOp-C) provide high-density measurements with near-global coverage. Data products from these missions, including those from the MetOp-A (MetOp-B, MetOp-C) GRAS instruments as processed and distributed by the Radio Occultation Meteorology Satellite Application Facility (ROM SAF), are particularly suitable for analyzing global-scale tropopause characteristics (Son et al., 2011).
More and more evidence suggests an upward trend in TH under a changing climate (Santer et al., 2003; Sausen and Santer, 2003; Seidel and Randel, 2006; Añel et al., 2006). For instance, Seidel and Randel (2006) observed a 64 ± 21 m per decade upward trend from 1980 to 2004, and Son et al. (2009) projected continued future increase, albeit with a weaker trend. Analyses by Xian and Homeyer (2019) using radiosonde observations and reanalysis datasets from 1981–2015 detected a significant upward trend (40–120 m per decade). Meng et al. (2021) reported a TH increase of 50–60 m per decade (2001–2020) in the Northern Hemisphere based on radiosonde data. More recently, Zou et al. (2023) leveraged European Centre for Medium–Range Weather Forecasts (ECMWF) Reanalysis v5 (ERA5) data to reveal a widespread upward and cooling trend in the tropical tropopause from 1980–2021, demonstrating an increase of approximately 60 ± 10 m per decade (95 % confidence). It is worthwhile to note that these radiosonde-related studies use data from the Integrated Global Radiosonde Archive (IGRA). In contrast to the original high-resolution soundings, IGRA provides a consolidated dataset with a coarser and non-uniform vertical resolution, as it reports values at standard levels (Durre et al., 2006, 2018), and the ERA5 137-level model, however, has a vertical resolution of roughly 300 m at altitudes of 5 km and above, both these radiosonde data and reanalysis/model datasets, while useful for studying global tropopause variations, suffer from limitations in vertical resolutions (Raman and Chen, 2014).
In recent decades, newly developed high vertical resolution (5–10 m) of the radiosonde data allows for fine detailed observation of temperature structure changes within the troposphere and stratosphere. High-resolution sounding data benefits the detection of fine-scale tropopause structures research like multiple tropopause events and provide more reliable estimates of TH changes across hundreds of stations. Furthermore, the global dataset is accumulating, with increasingly long records approaching climate-relevant timescales. Examples include the US (starting in 2005; Ko et al., 2019), China (starting in 2011), and Europe (starting in approximately 1991).
However, reanalysis datasets offer a globally continuous spatial and temporal representation of TH, complementing radiosonde data. Datasets like ERA-Interim are widely recognized for their utility in climate monitoring (Dee et al., 2011), overcoming the spatial resolution limitations of radiosonde data. Therefore, ERA5 has naturally been the subject of intercomparison studies with radiosondes in different regions (e.g., Shao et al., 2023; Velikou et al., 2022; Hoffmann and Spang, 2022). However, global comparative analyses of high-resolution (10 m) radiosonde data with ERA5 at the tropopause level remain scarce.
Consequently, this study addresses the following questions: (1) What does a systematic comparison reveal about ERA5 and high-resolution radiosonde TH climatologies? (2) What the global long-term change of TH according radiosonde data and ERA5 reanalysis data? To this end, Sect. 2 details the data and the methods we used. Section 3 presents the comparative analysis and long-term change of TH derived from radiosonde observations and ERA5 reanalysis data. Section 4 ends with a short summary.
2.1 Radiosonde
Radiosondes are fundamental and crucial data sources for numerical weather prediction models. They are typically carried aloft by weather balloons and burst at altitudes of approximately 27 km (Kumar, 2023). As the radiosonde ascends, it transmits meteorological data including temperature, pressure, relative humidity and air pressure to ground, sea, or air-based receiving stations (Durre et al., 2006). Radiosondes are launched from approximately 800 sites worldwide, regularly twice a day (Ingleby et al., 2016; Durre et al., 2018). Radiosonde data are widely used in studies of planetary boundary layer height (Sorbjan and Balsley, 2008; Seidel et al., 2010), tropopause structure (Birner, 2006; Seidel and Randel, 2006; Añel et al., 2008; Sunilkumar et al., 2017) and gravity waves (Ki and Chun, 2010; Yoo et al., 2018). Key advantages of radiosonde data include in-situ measurements, high vertical resolution, and general reliability. Limitations, however, include relatively low and uneven spatial resolution, as well as a limited temporal frequency of typically twice daily measurements.
Following Guo et al. (2021) and Zhang et al. (2022), we utilized a high-vertical-resolution radiosonde (HVRRS) dataset spanning 2000 to 2023, compiled from multiple sources including the China Meteorological Administration (CMA), the National Oceanic and Atmospheric Administration (NOAA) of the United States, the Deutscher Wetterdienst (Climate Data Center), the Centre for Environmental Data Analysis (CEDA) of the United Kingdom, the Global Climate Observing System (GCOS) Reference Upper-Air Network (GRUAN), and the University of Wyoming.
The original data, sampled at 1–2 s intervals, have a native vertical resolution of approximately 5–10 m. These data were then uniformly resampled at 10 m intervals using cubic spline interpolation. This interpolation method provides a good balance between smoothness and accuracy at the scale of interest. Given that the resampling grid spacing (10 m) is comparable to the original data spacing (5–10 m), the potential for spurious oscillations is minimal. Data acquisition was typically performed at 00:00 and 12:00 UTC each day. To ensure data quality, only records with at least 10 d (at least one record per day) for which the World Meteorological Organization (WMO) definition of the first tropopause was derived were considered to be valid month and radiosonde stations with at least 10 valid months per year were considered to be valid in that year. Two distinct data selection criteria were established according to study objectives: (1) For radiosonde-ERA5 intercomparison, we analyzed 222 stations (≥ 5 valid years each) with 1 530 517 vertical profiles during years 2000–2023; (2) For long-term TH trend detection, we had 108 stations (≥ 10 valid years each) containing 1 103 730 vertical profiles (Fig. 1).
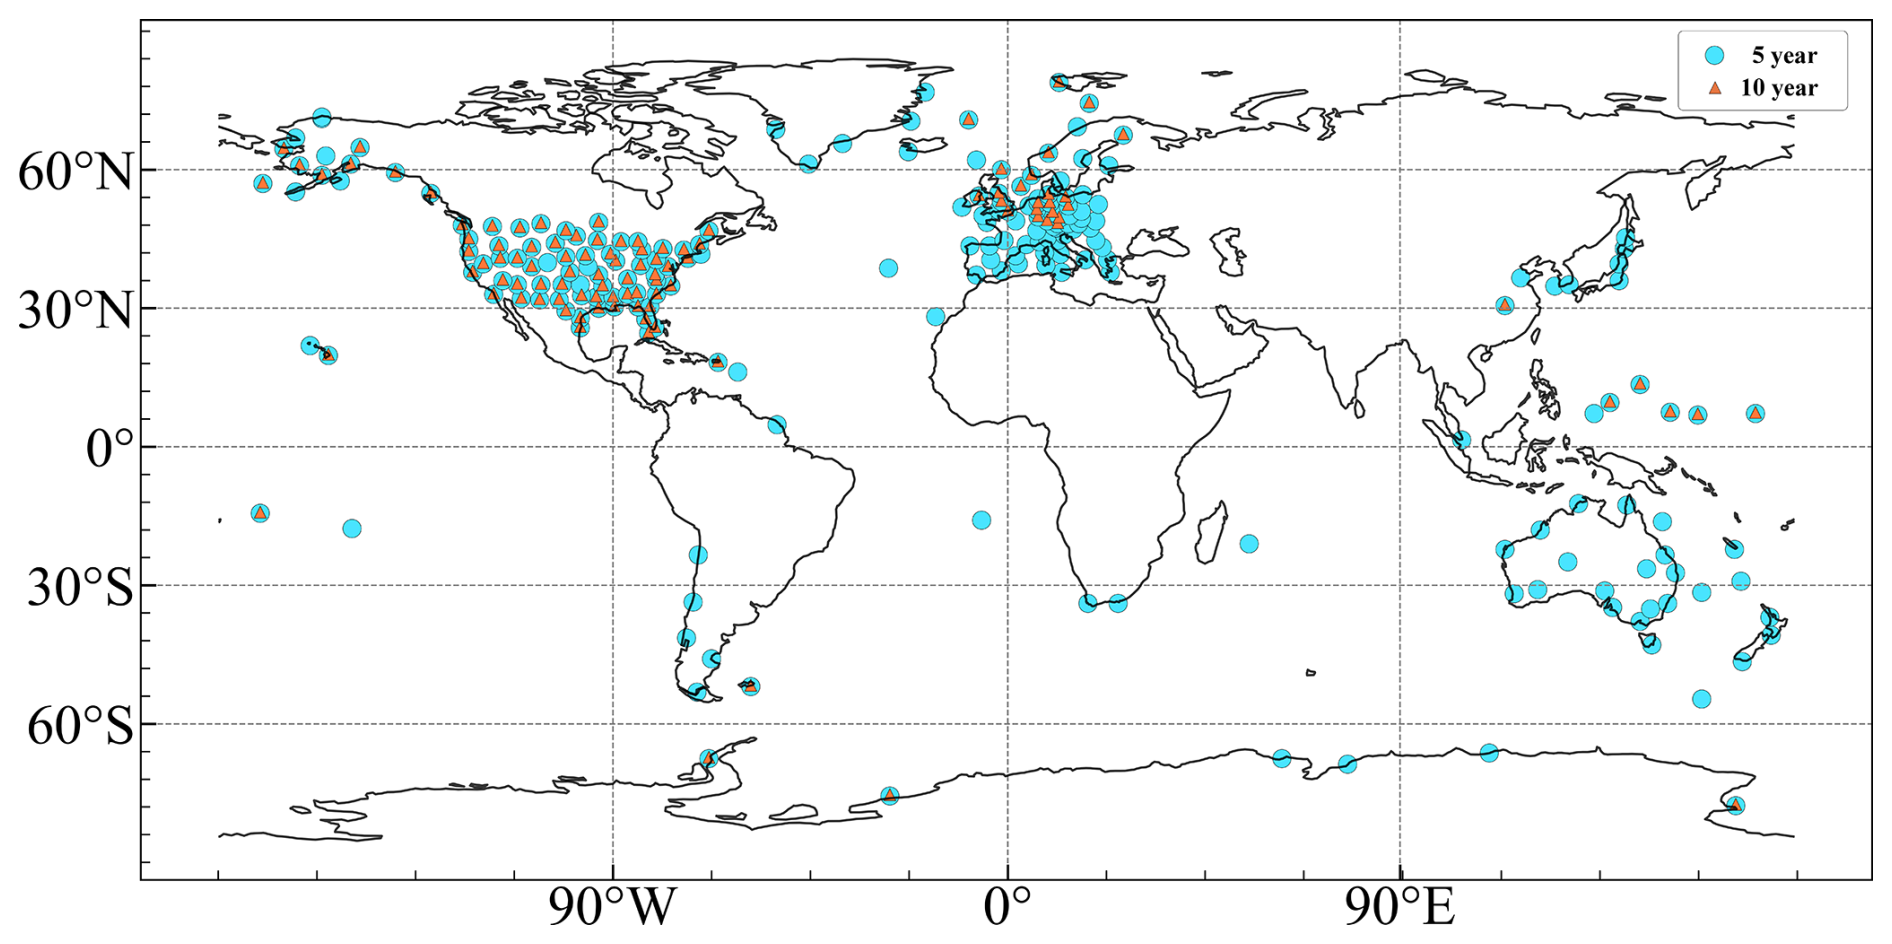
Figure 1Spatial distribution of the qualifying radiosonde stations used in this study. The number of qualifying radiosonde stations with valid data records for 10 years (indicated by orange triangles) is 108, and that for 5 years (indicated by cyan dots) is 222. The United States and Europe are data-intensive.
2.2 ERA5
ERA5 is the latest fifth-generation global atmospheric reanalysis product, stands out as one of the best high–resolution atmospheric reanalysis products currently available, utilizing the ECMWF Integrated Forecasting System (IFS) Cy41r2, combined with a 4D-Var assimilation scheme (Hersbach et al., 2020). This remarkable initiative within the Copernicus Climate Change Service (Thépaut et al., 2018) benefits from advancements in modeling and data assimilation over a decade, providing a comprehensive and high-quality record of essential climate variables (Raoult et al., 2017). Key technical specifications of ERA5 include an hourly temporal resolution, a horizontal resolution of approximately 31 km (0.25° × 0.25°), and 137 hybrid sigma-pressure levels from the surface up to 0.01 hPa (about 80 km height).
Hoffmann and Spang (2022) employed the WMO definition to calculate global THs from ERA5 data, making this ERA5-based product available for research purposes. This study utilizes the 2000–2023 ERA5-based data, characterized by a horizontal resolution of 0.3° × 0.3° and a temporal resolution of 1 h.
2.3 Multivariate regression model for trend analysis
We assessed interannual variability (Sect. 3.2) using monthly height time series from 2000 to 2023. To investigate the variability driven by tropospheric and stratospheric forcing, the monthly mean TH, y(t), is described by the following multiple linear regression model:
Here, t is the time in months. The coefficient a represents the linear trend. QBO1 and QBO2 are two orthogonal time series representing the variability of the Quasi-Biennial Oscillation (QBO), constructed from the first two Empirical Orthogonal Functions (EOFs) of stratospheric wind data from the Freie Universität Berlin radiosonde stratospheric winds (Naujokat, 1986). ENSO (El Niño/Southern Oscillation) is represented by the multivariate ENSO Index (source: https://psl.noaa.gov/enso/mei/, last access: October 2025). VOL denotes the stratospheric aerosol optical depth at 525 nm, obtained from the Global Space-based Stratospheric Aerosol Climatology project (Thomason et al., 2018). The Monthk are monthly dummy variables (, which are used to eliminate the seasonal influence on tropopause height variations. B1, B2, C, D and Ek are the corresponding regression coefficients. Significance is tested based on a two-tailed test with a 95 % confidence interval.
2.4 WMO-defined tropopause
The WMO tropopause definition is more robust and generally applicable across a wider range of latitudes. Therefore, calculating TH from radiosonde data using the WMO definition is currently the most suitable method for global tropopause comparisons. As provided by the WMO:
- a.
The first tropopause is defined as the lowest level at which the lapse rate decreases to 2 °C km−1 or less, provided also the average lapse rate between this level and all higher levels within 2 km does not exceed 2 °C km−1;
- b.
if above the first tropopause the average lapse rate between any level and all higher levels within 1 km exceed 3 °C km−1, then a second tropopause is defined by the same criterion as under (a). This tropopause may be either within or above the 1 km layer.
The lapse rates are calculated as follows:
with T represents temperature, and z represents geopotential height.
Following the WMO definition, Fig. 2 presents four examples of radiosonde temperature profiles alongside the corresponding profiles from the nearest ERA5 grid point and its four adjacent points. Cases (a) and (c) show good agreement in tropopause identification. In contrast, cases (b) and (d) reveal significant discrepancies despite having matched overall temperature profiles. In these instances, the high vertical-resolution radiosonde detects a distinct inversion layer – a fine-scale structure not captured by ERA5 – which results in a much lower tropopause height (TH). These cases show fine-scale structure could complicate tropopause detection, implying that the existing WMO definition could be further refined for high-resolution dataset.
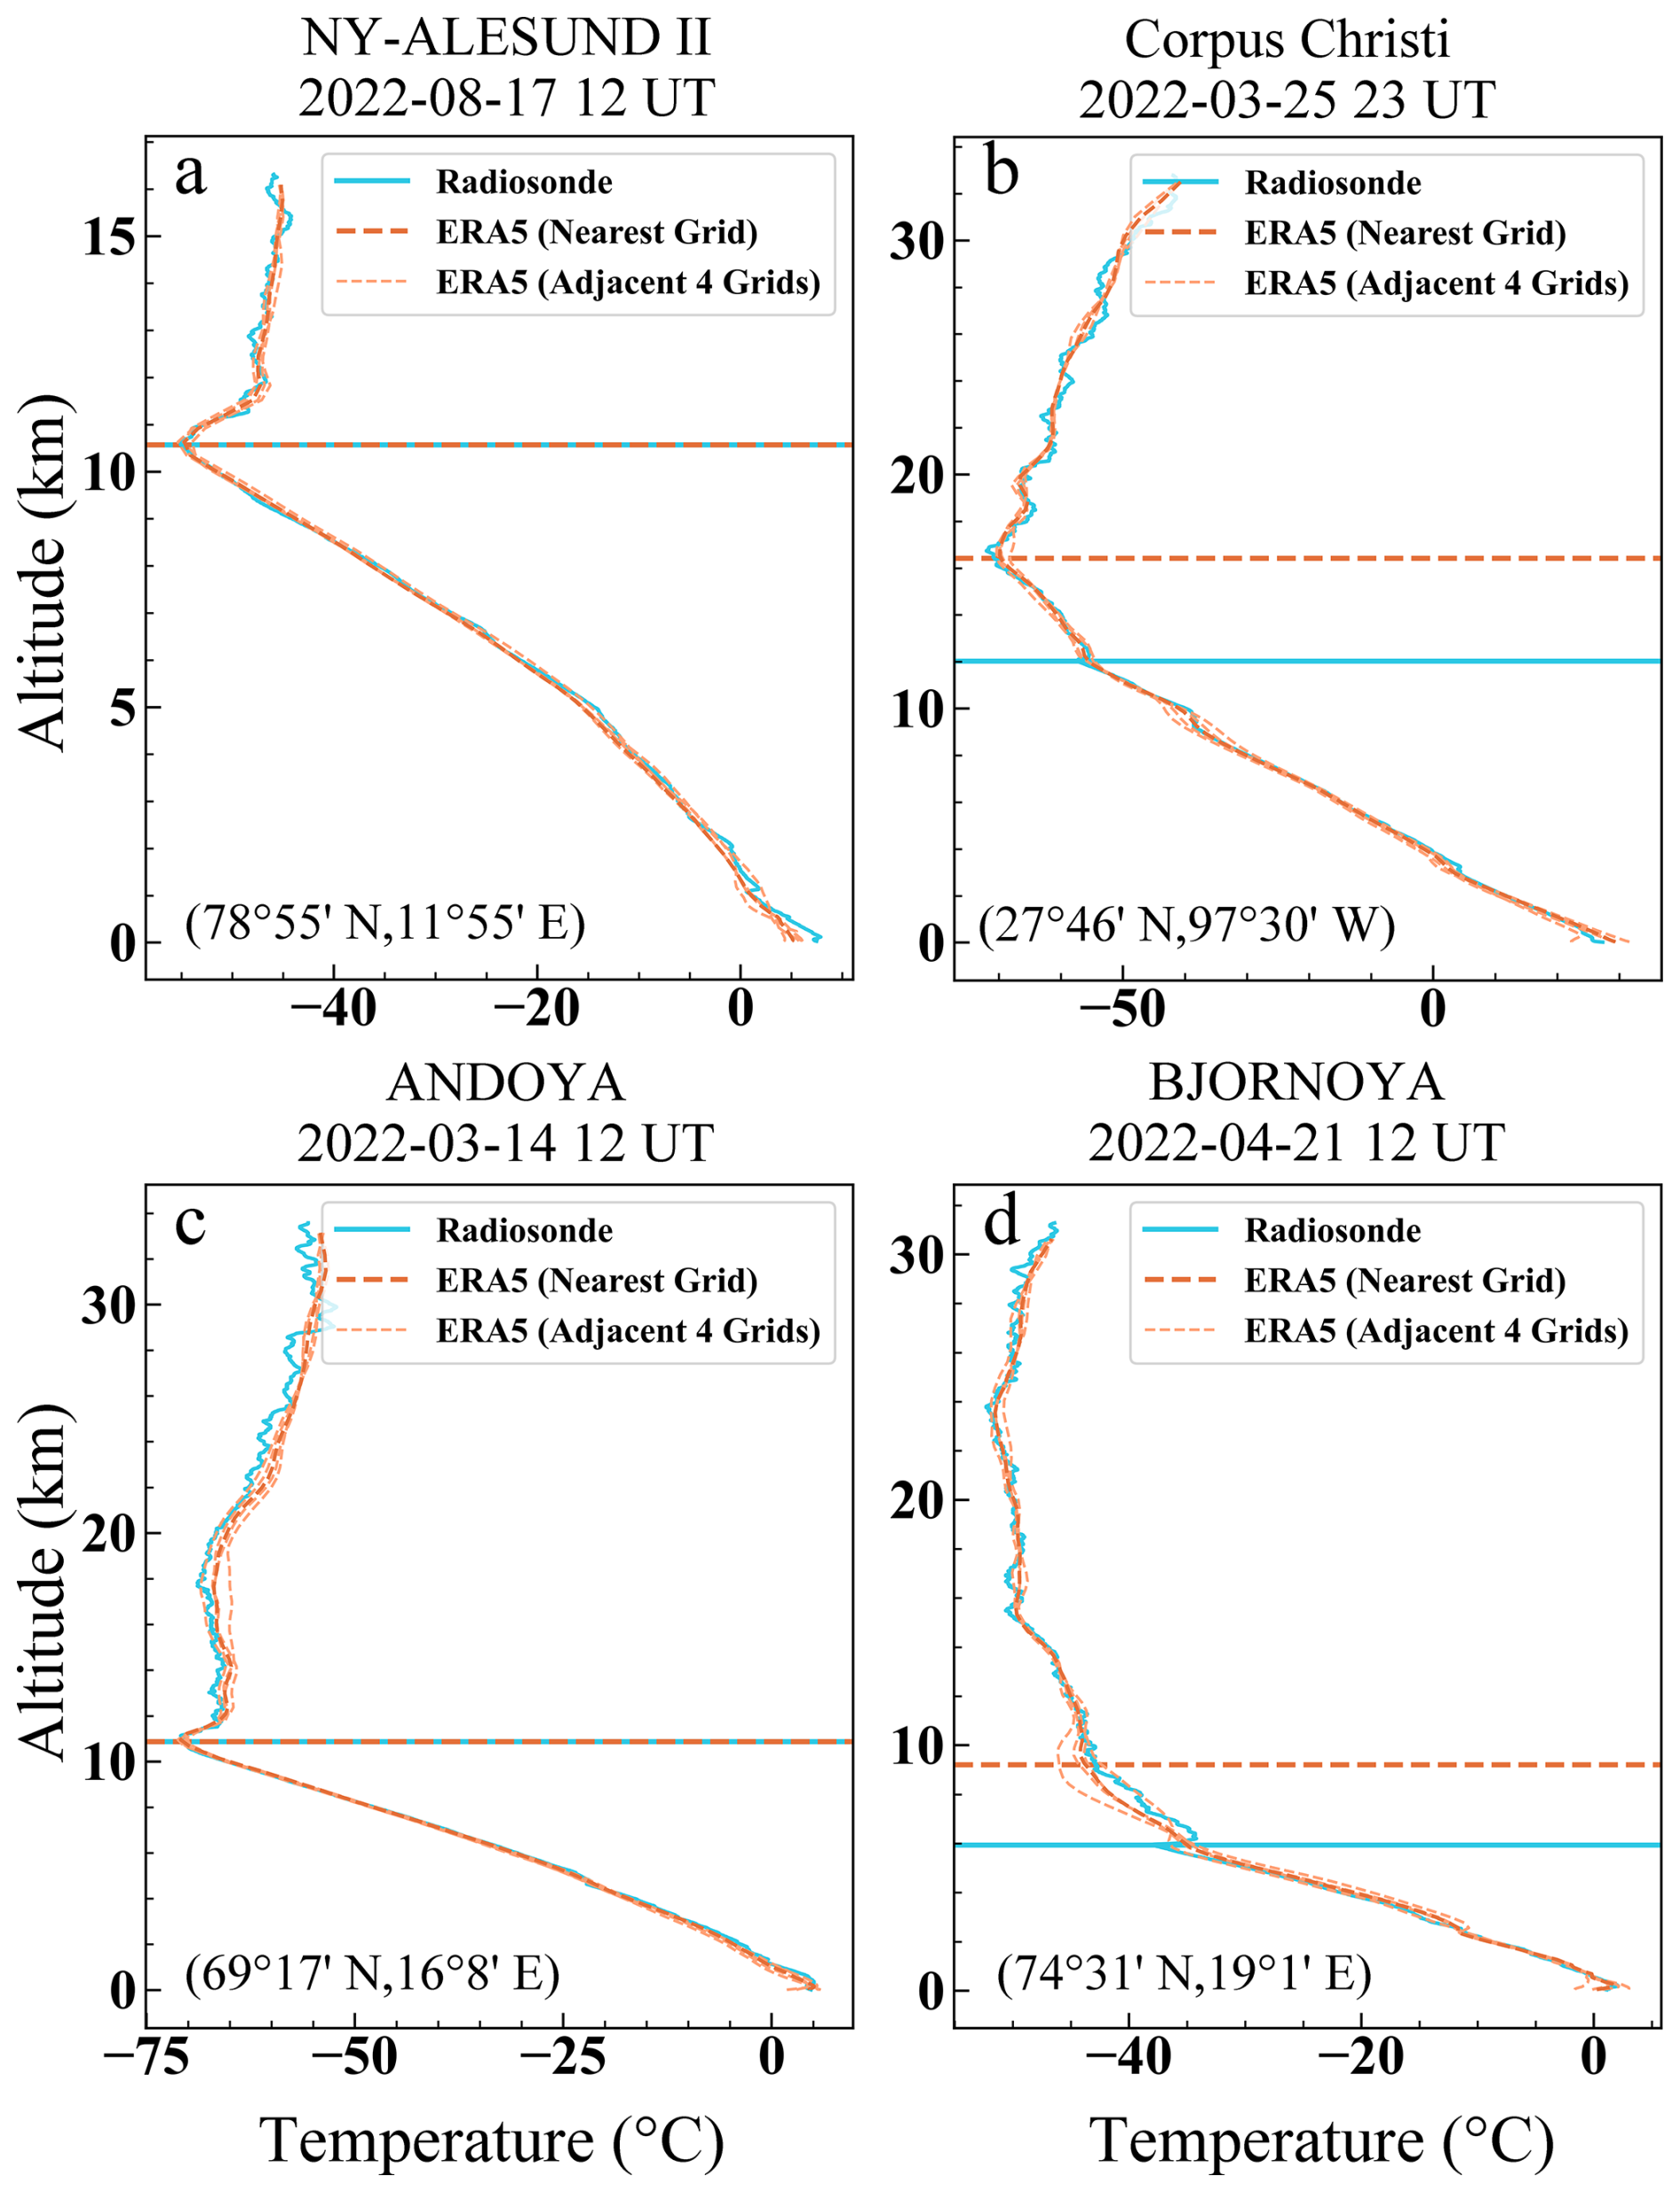
Figure 2Tropopause height identification from Radiosonde and ERA5 temperature profiles. The Radiosonde profile (cyan) is compared against the nearest ERA5 grid point (solid orange) and its four adjacent points (thin orange). The diagnosed tropopause is marked by a horizontal line. The Radiosonde location, date, and time are indicated in each subplot.
3.1 Radiosonde-ERA5 tropopause height comparison and its seasonal variation
Figure 3 demonstrates that the THs derived from the radiosonde observations and ERA5 reanalysis data are in strong agreement. The linear regression equation () derived from the kernel density scatter plot (Fig. 3a) closely follows the 1:1 line. Close agreement between radiosonde and ERA5 is observed for THs around 13 km, with a slight positive bias in radiosonde. A pronounced discrepancy emerges at greater heights (e.g., above 13 km), characterized by increased scatter and deviation from the 1:1 line, forming a distinctive cross-like pattern. Figure 3a reveals several notable outliers, particularly where ERA5 indicates a high tropopause (15–17 km) while the radiosonde data suggest a much lower tropopause height (e.g., 5–6 km). Three potential causes could lead to these outliers. First, the WMO lapse-rate definition is highly sensitive to fine-scale structures in high-resolution data, such as strong inversions, which can be misinterpreted as a tropopause. Second, pronounced inversions associated with phenomena like large-scale subsidence or strong fronts may genuinely satisfy the tropopause criteria at a lower altitude. Third, despite quality control, subtle data issues cannot be entirely ruled out. This might suggest that both datasets exhibit certain limitations in capturing the TH within the subtropical tropopause break region. Figure 3b displays the distribution of differences between radiosonde and ERA5. On average, TH derived from radiosondes is 32 m higher than that from ERA5, with a mean absolute difference of 336 m. The root mean square error is 756 m, while the Pearson correlation coefficient reaches 0.958 (p<0.05), indicating a statistically significant agreement. Overall, the discrepancy between ERA5 and radiosonde data is minimal, demonstrating strong consistency between the two datasets.
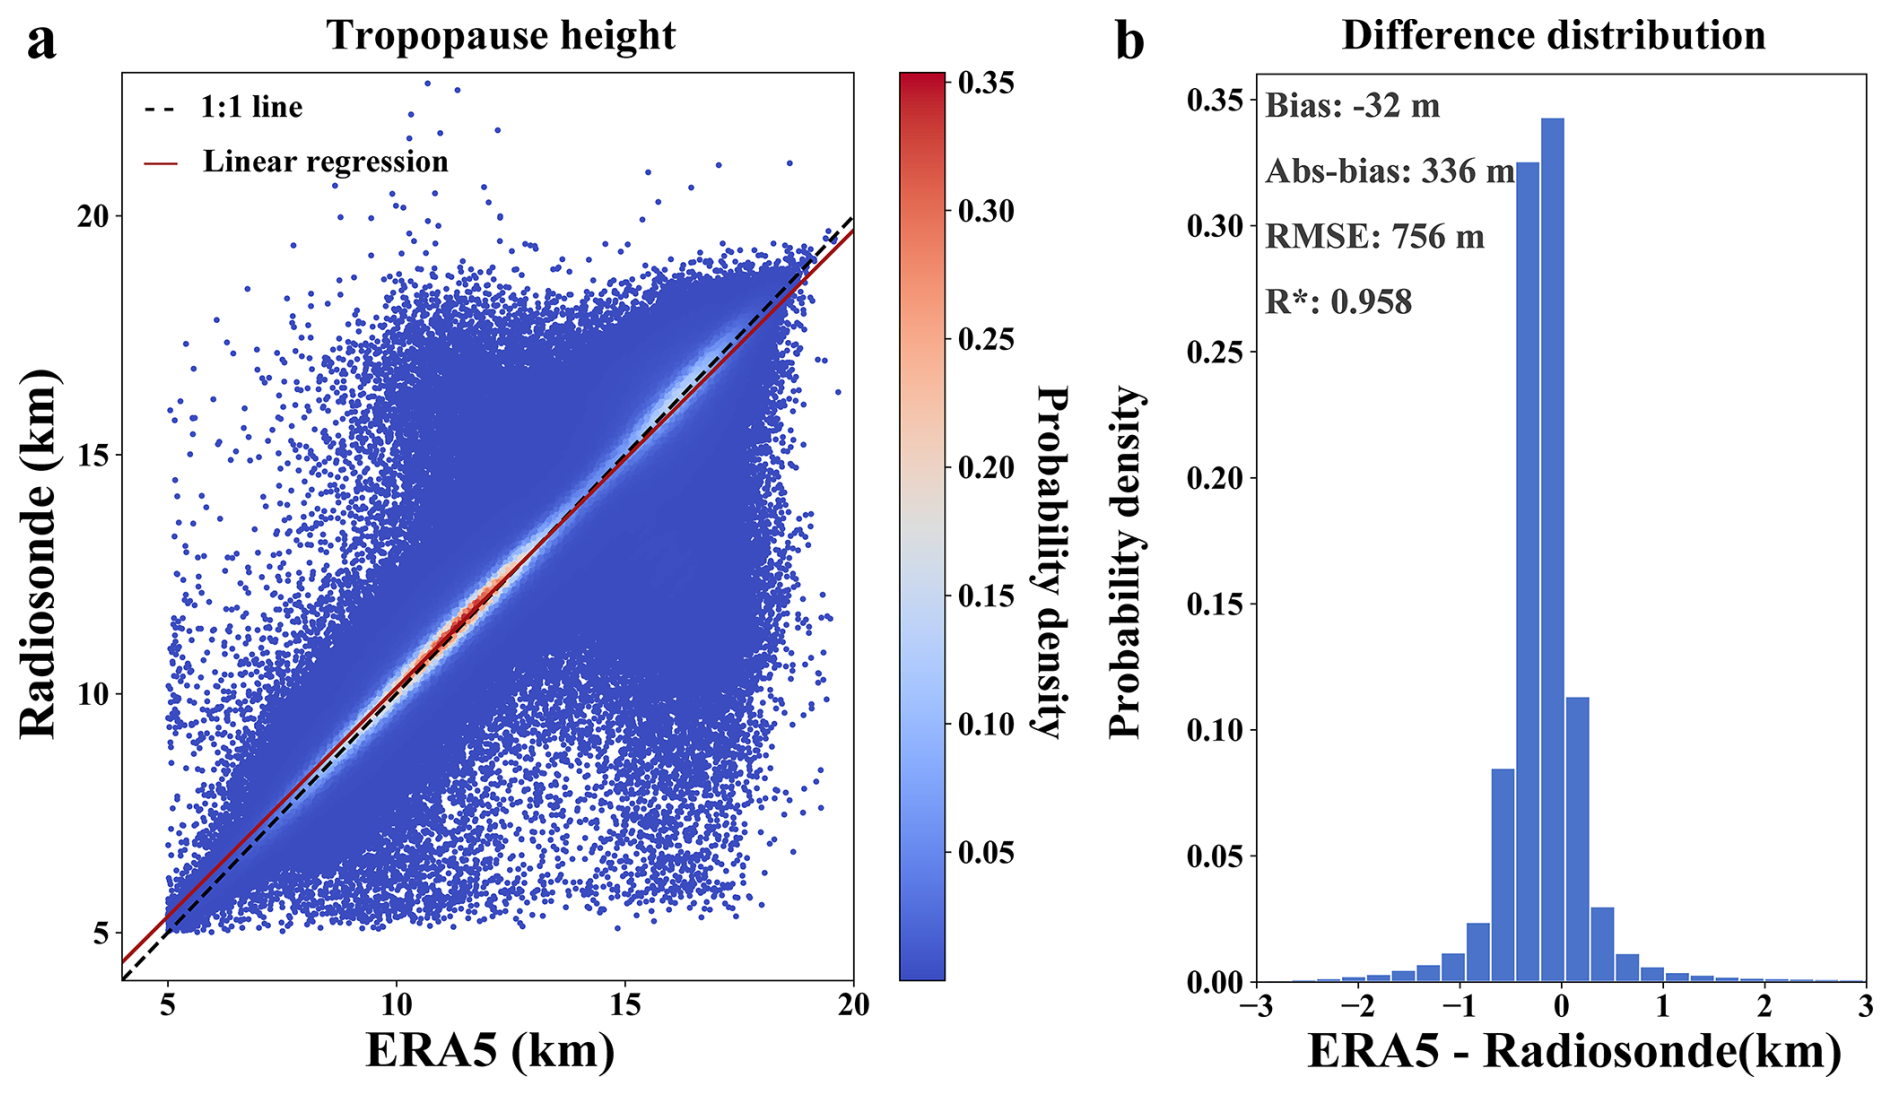
Figure 3Kernel density scatter plot (a) and probability density histogram (b) comparing tropopause heights. The black dotted line indicates a 1:1 relationship, the red line shows the linear regression (). Bias (average of differences, ERA5 minus Radiosonde), absolute bias (average of absolute values of differences), RMSE (root mean square error), and R (Pearson correlation coefficient, p<0.05) are also indicated.
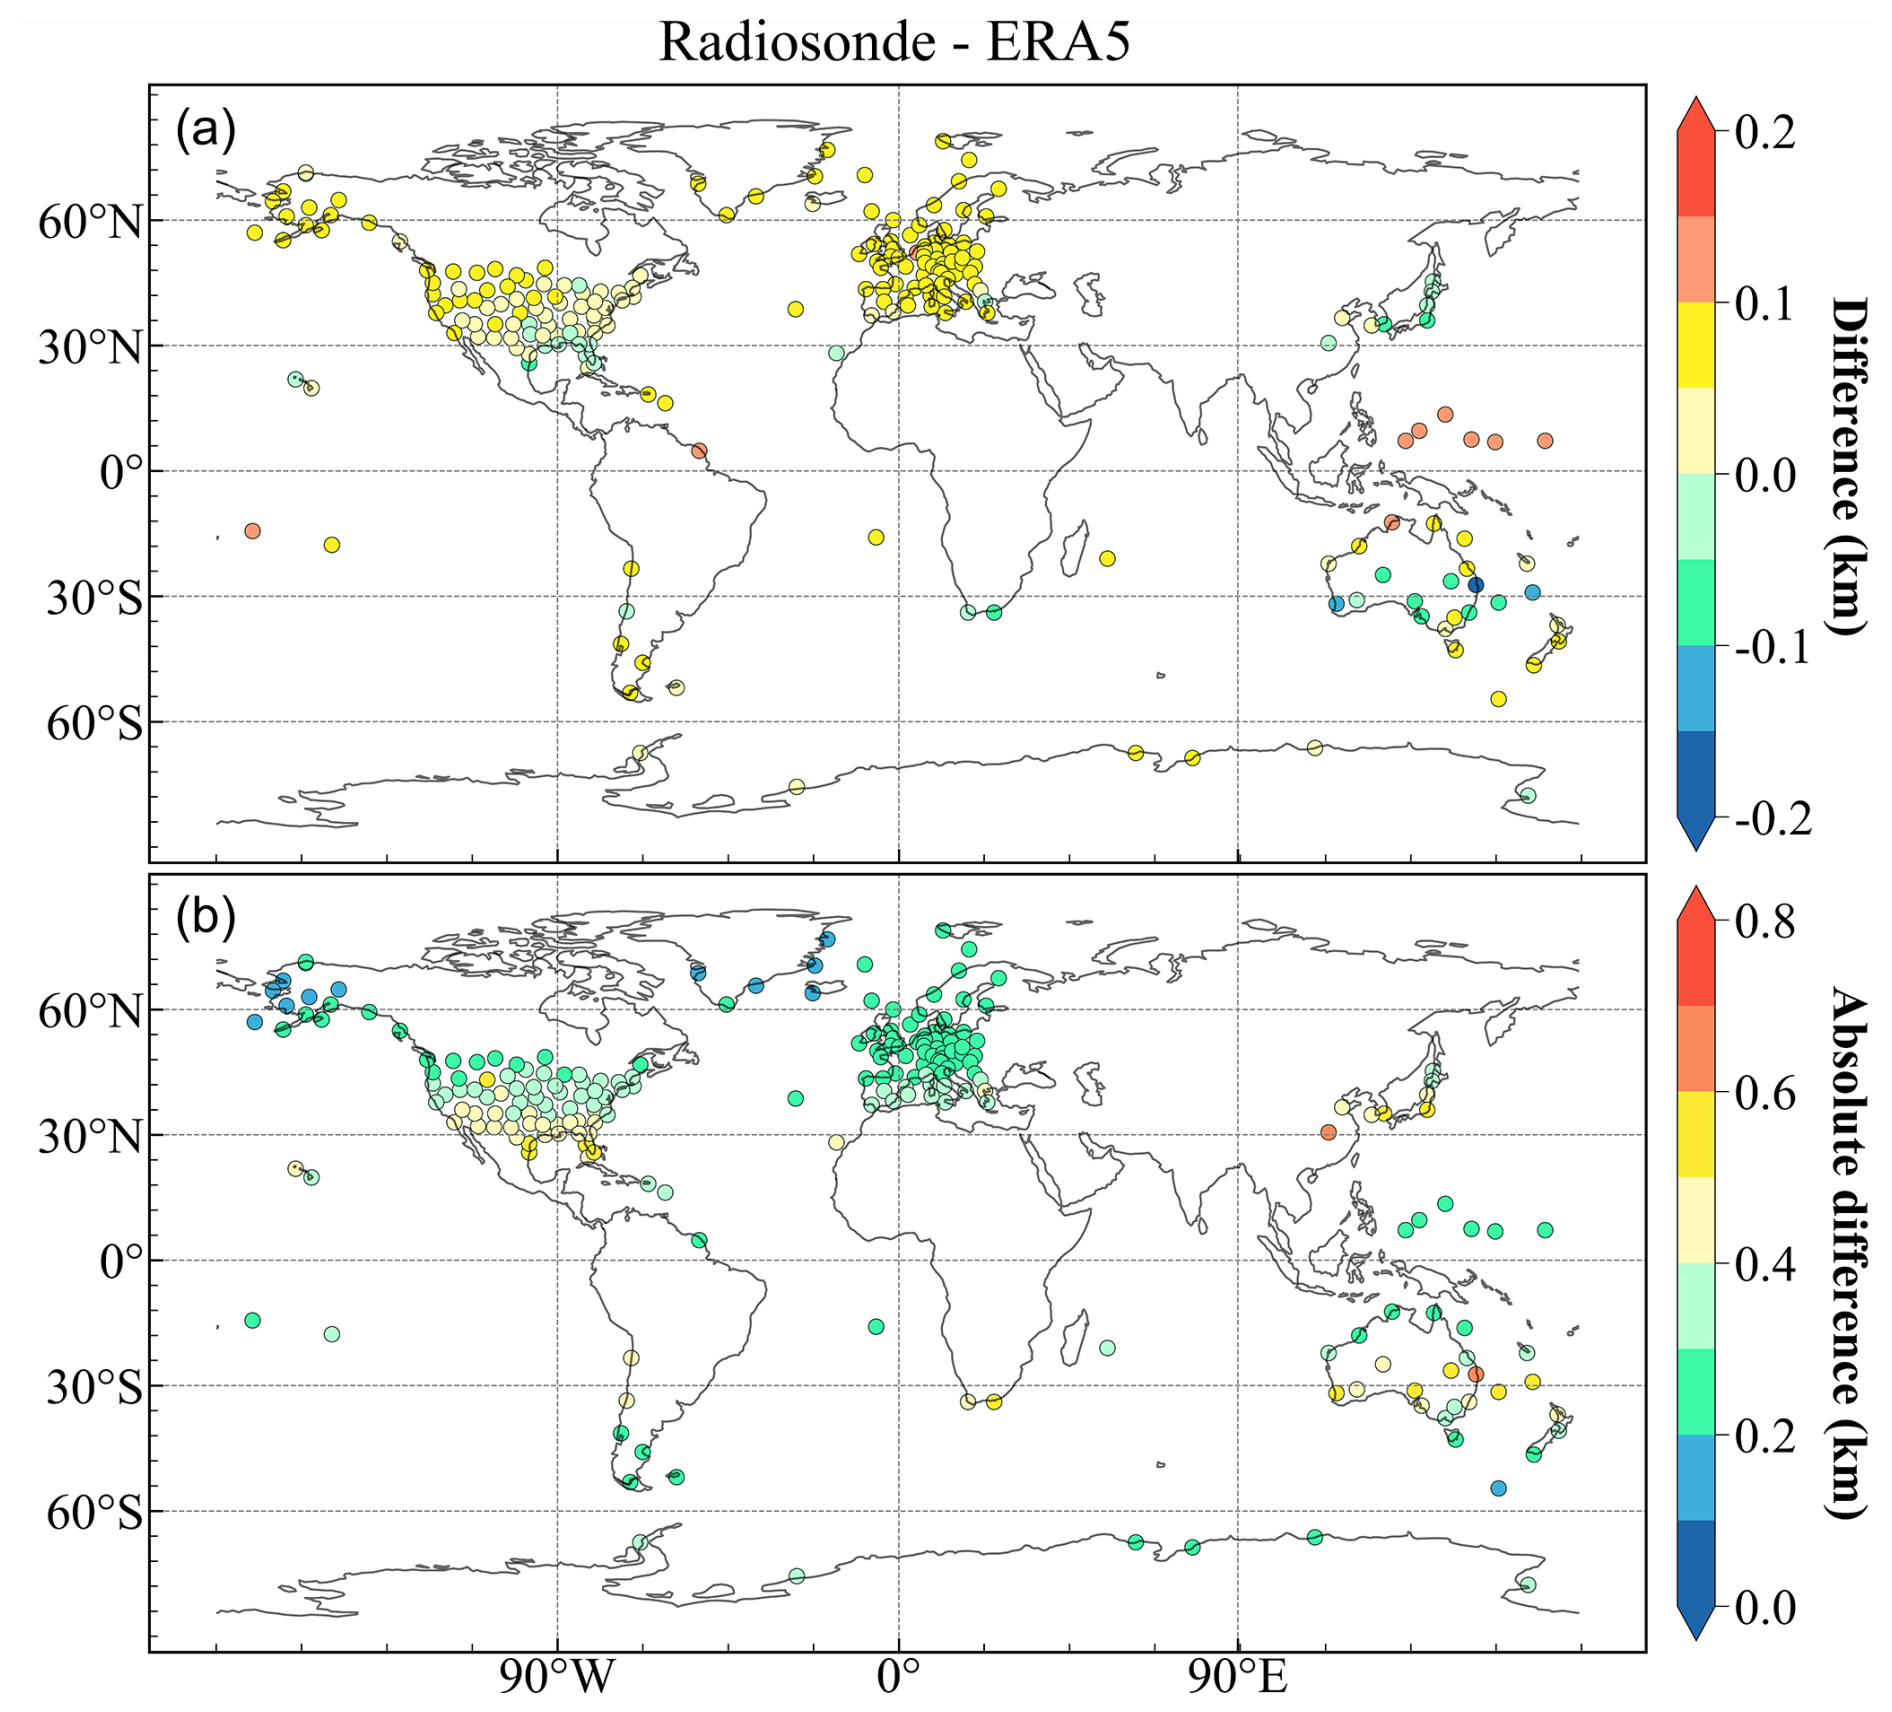
Figure 4Global distribution of station-mean differences between radiosonde observations and ERA5 (a) and station-mean absolute differences (b).
Figure 4 presents the global distribution of mean differences (radiosonde minus ERA5) and mean absolute differences between the two datasets. Across all stations, 85 % (187 stations) showed higher mean THs in radiosonde data compared to ERA5. At 206 stations (93 %), the mean absolute difference remains within 500 m. Table 1 details the statistical differences for each year from 2000 to 2023, revealing a gradual increase in observation data over time. Intercomparison statistics, detailed in Table 1, reveal that the ERA5-radiosonde TH differences are not homogeneous over time. Instead, the record is marked by two transition points. The most pronounced shift occurs around 2006, characterized by a decrease in the mean difference and an increase in the mean absolute difference. This discontinuity is likely attributable to two concurrent events. First, ERA5 exhibits a significant cold bias in its stratospheric temperature analysis for the period 2000–2006. To address this, the ERA5.1 reanalysis was produced, which applied the background error covariance from the 1979–1999 period (Simmons et al., 2020). Thus, the discontinuity around 2006 likely stems from the transition from the ERA5.1 to the ERA5 reanalysis within the dataset. Secondly, the launch of COSMIC GNSS-RO satellites in 2006 markedly increased the availability of high-precision GNSS-RO data, strengthening the observational constraints on the upper troposphere and lower stratosphere. Together, these developments may have caused the observed changes in mean tropopause height and variability. A secondary shift occurred around 2016, marked by an increase in the mean difference and a decrease in the mean absolute difference. While this signal could be associated with climatic events like the 2015–2016 El Niño event, the mechanisms behind it are not yet clear and warrant future study.
Table 1Statistical analysis by years, RS-E5: Radiosonde minus ERA5-based, Bias: average of differences (ERA5-based minus Radiosonde), Abs-bias: average of absolute values of differences, RMSE: root mean square error, R*: Pearson correlation coefficient (p<0.05).

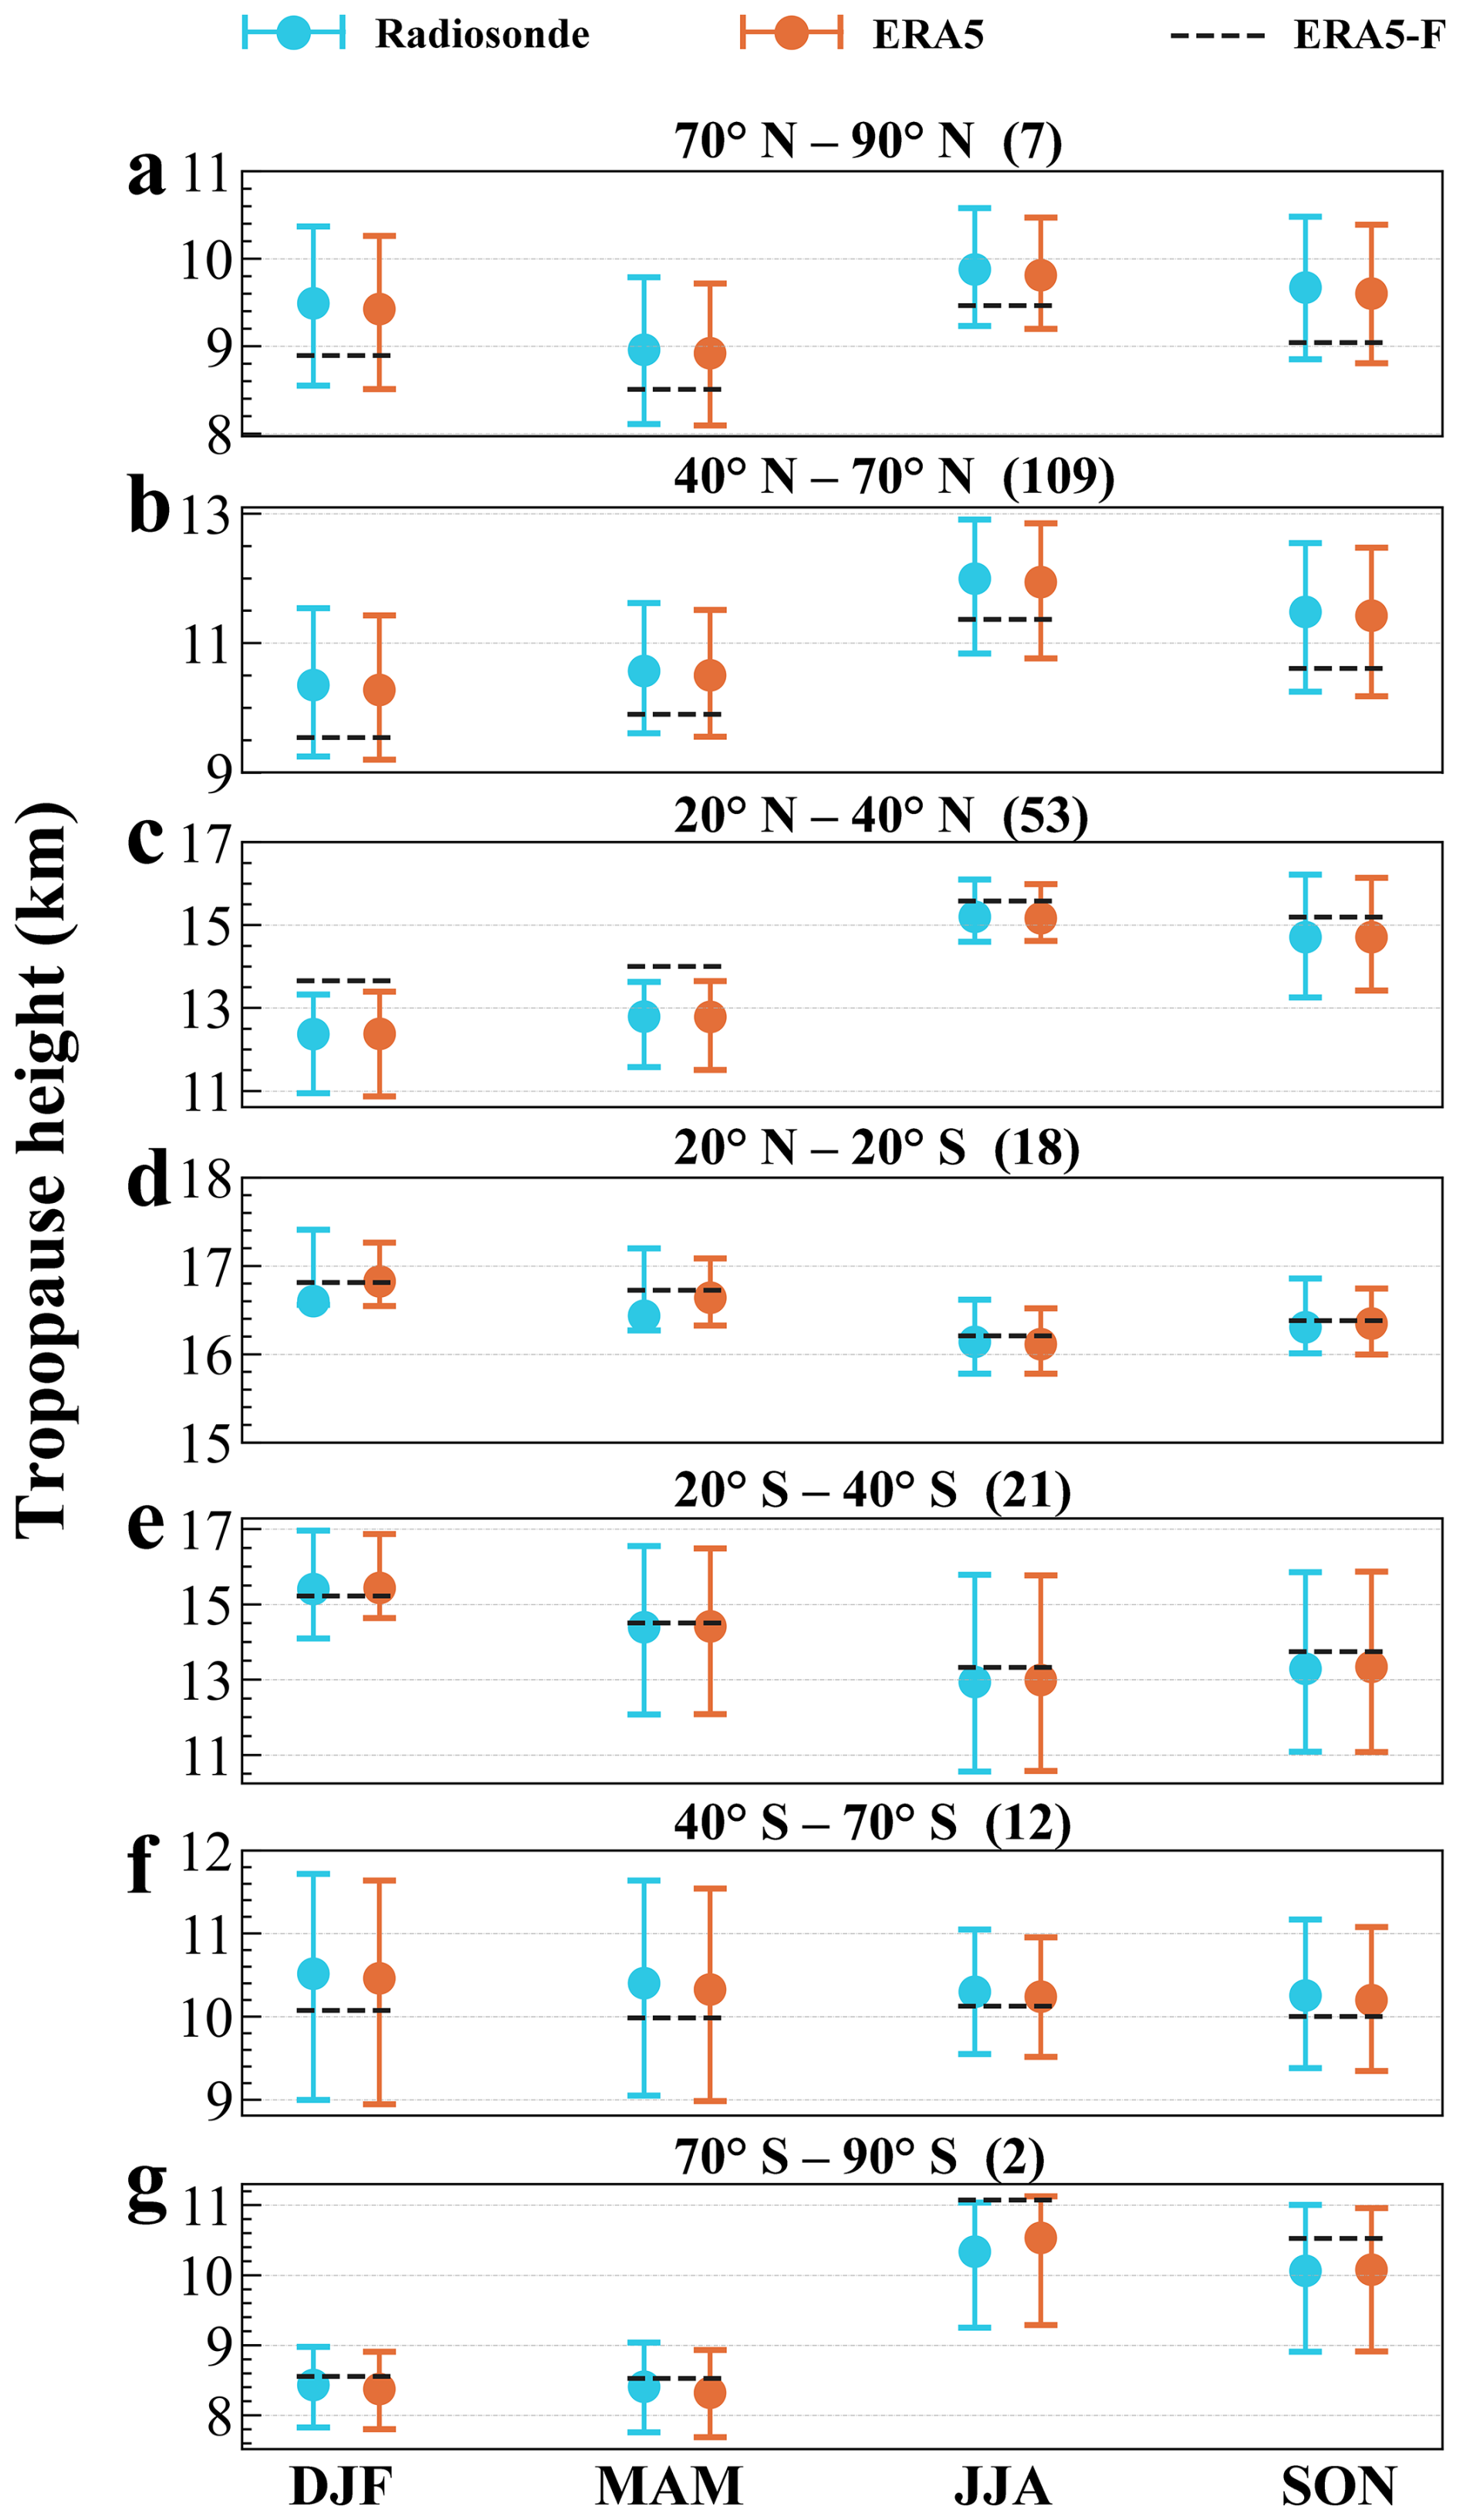
Figure 5Seasonal change across 7 latitudinal bands. The number of stations on the right side of the latitude band titles. ERA5 is a one-dimensional data that corresponds one-to-one in time and space with the radiosonde data, and ERA5-F is the overall mean of the ERA5 global seasonal averages over the period 2000 to 2023 in a two-dimensional plane divided according to latitudinal bands. DJF: December–January–February, MAM: March–April–May, JJA: June–July–August, SON: September–October–November. The dots represent the mean, and the bar represents the 25 % or 75 % quantiles
Figure 5 presents 24-year (2000–2023) seasonal mean TH data from radiosonde and ERA5 across different latitudinal bands. Radiosonde and ERA5 data were divided into seven climate zones: Northern Hemisphere/Southern Hemisphere polar (70–90°), Northern Hemisphere/Southern Hemisphere mid-latitude (40–70°), Northern Hemisphere/Southern Hemisphere subtropics (20–40°), and tropics (20° S–20° N) (Houchi et al., 2010). Seasonal analysis was performed on the station data within each latitudinal band. The uneven and sometimes sparse distribution of radiosonde stations means that their density varies significantly across latitude bands (as indicated on the right side of each latitudinal title in Fig. 5). For example, the 40–70° N band contains the most stations (109 stations), while the 70–90° S band has only two stations. This variation makes it challenging to compute a representative regional mean directly from the station data. Although the primary focus of the analysis is the point-to-point ERA5 data, the ERA5 zonal mean (ERA5-F) provides a comprehensive background reference. Except in the tropics and Southern Hemisphere polar region, the seasonal TH variations show consistent patterns: TH reaches maximum values during autumn (June–July–August) and winter (September–October–November), and minimum values during spring (December–January–February) and summer (March–April–May). This pattern is observed in all regions except the tropics and the Southern Hemisphere polar region.
3.2 Tropopause height long-term trend derived from Radiosonde and ERA5
For long-term trend analysis, we used data with at least 10 years of valid records. Figure 6 presents the annual mean trends over a 24-year period from ERA5 globally. In Fig. 6a, the long-term trend of the TH derived from ERA5 data shows a strong latitudinal dependence. Approximately 77 % of the regions exhibit a positive trend, with a global average increase (ERA5-F) of +3 m yr−1. In contrast to the latitudinal distribution of TH – which is higher at low latitudes and lower at high latitudes – the long-term trend generally displays an opposite pattern: lower trends at low latitudes and higher trends at high latitudes. According to ERA5 global data, the Southern Hemisphere exhibits more regions with significant weakening trends than the Northern Hemisphere. Figure 6b compares the long-term trends of the TH between radiosonde and ERA5. The results indicate that the globally averaged TH trend is higher in radiosonde data (+9 m yr−1) than in ERA5 (+7 m yr−1), which is consistent with the finding that 83 % of individual radiosonde stations also show higher trends.
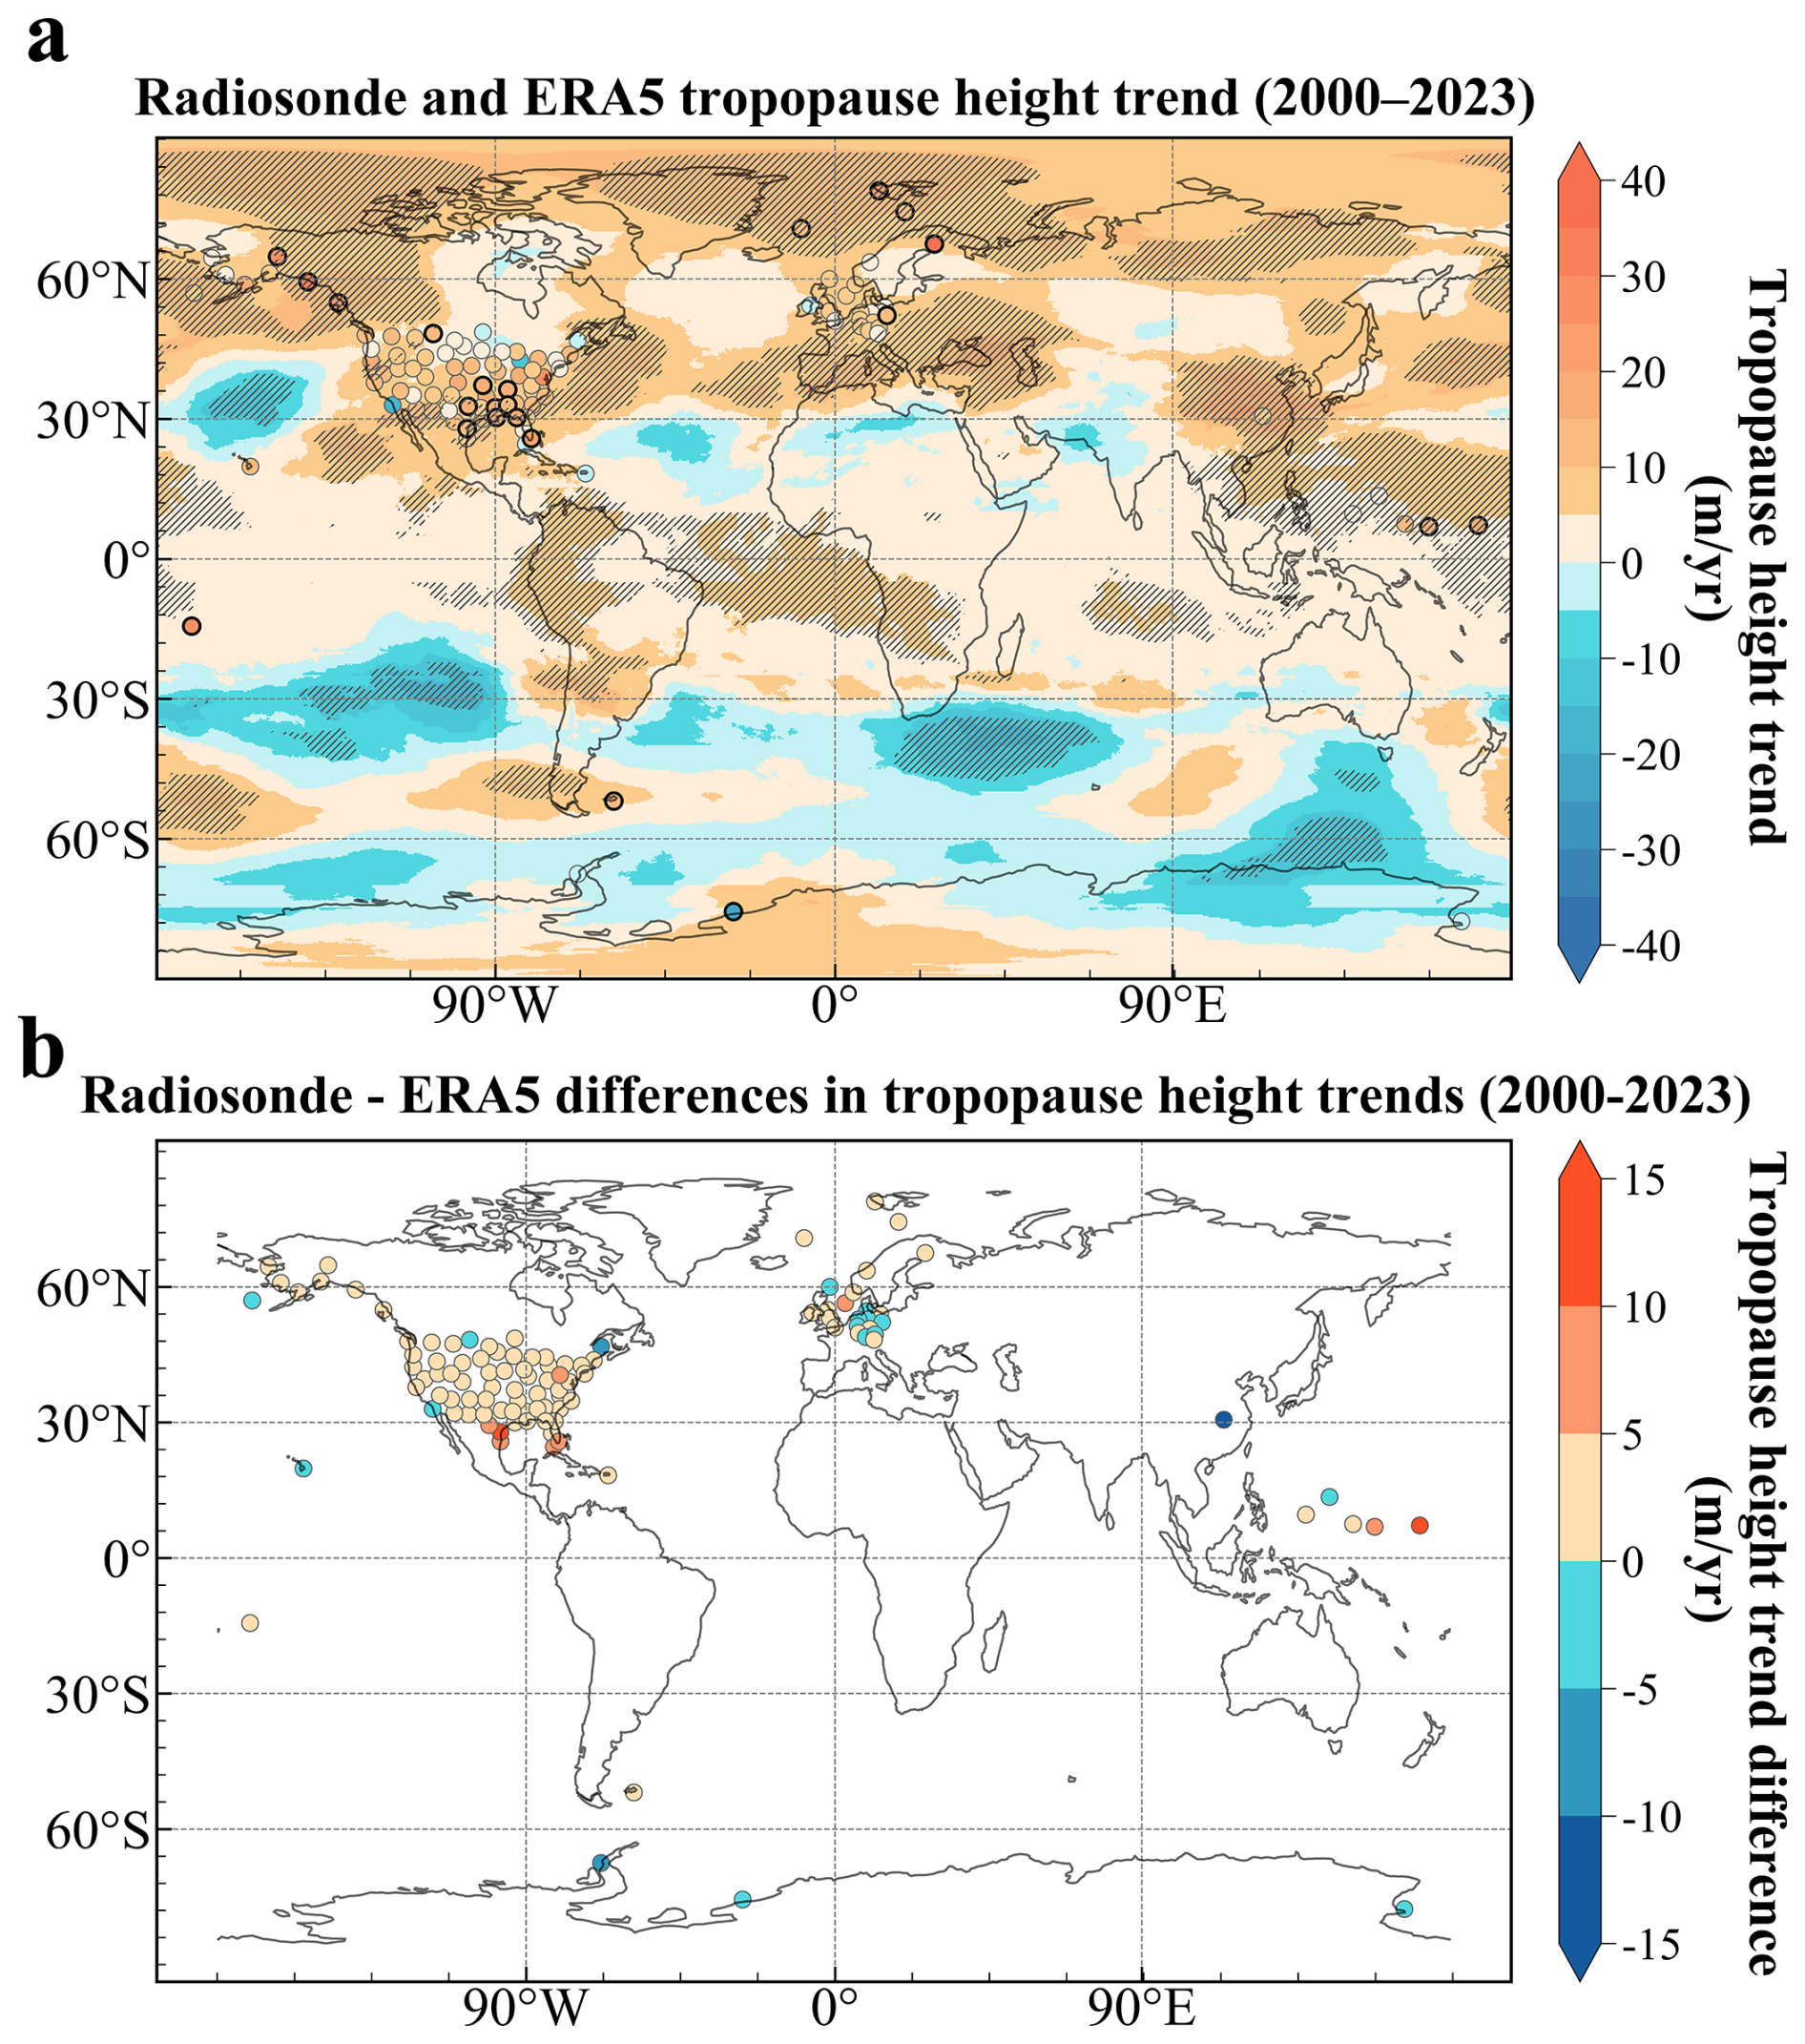
Figure 6Global map of tropopause height trend (a) and its difference (b) using radiosonde and ERA5 data. The shaded area (ERA5) and black thick ring (radiosonde) in panel (a) indicate statistically significant trends in tropopause height (p<0.05), based on the multiple regression analysis at each ERA5 grid point and radiosonde station.
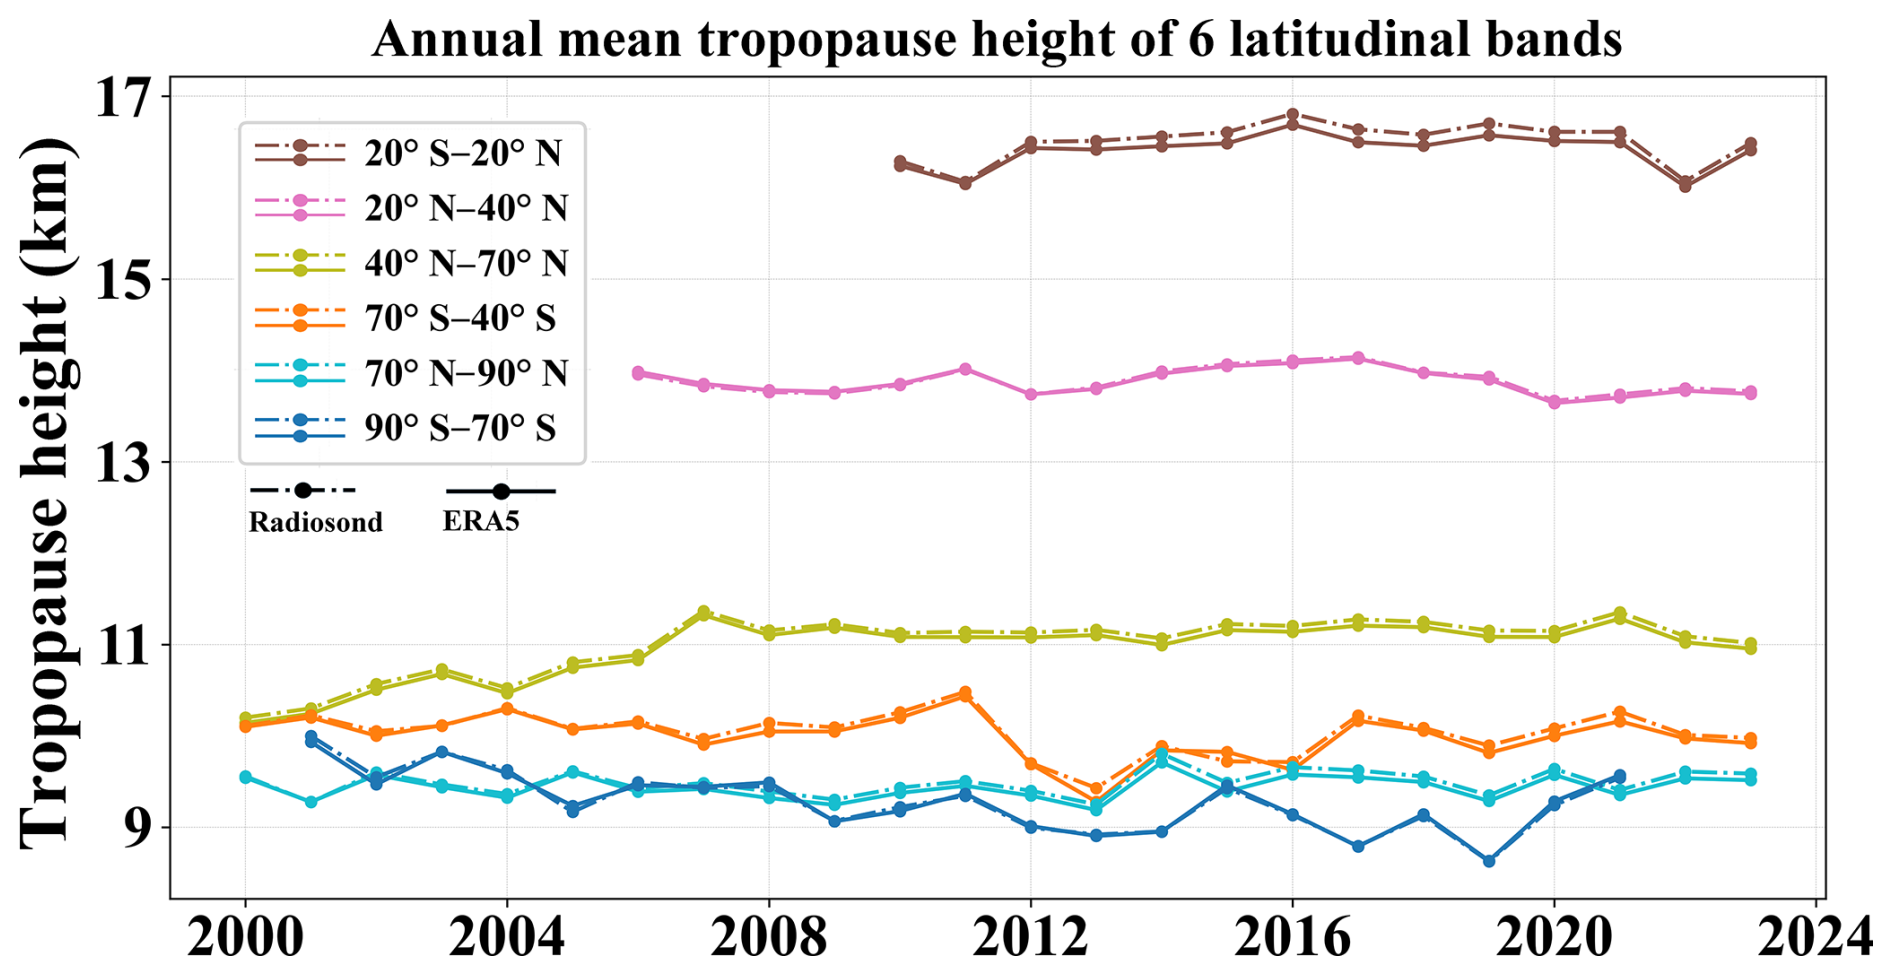
Figure 7The time series are shown for six latitude bands (no data available for 20–40° S). Data from radiosonde and ERA5 are depicted by dashed and solid lines, respectively.
Figure 7 displays the annual variations of TH across different latitudinal bands from 2000 to 2023, as observed by radiosonde and ERA5. The results show strong agreement between radiosonde and ERA5 in terms of the annual mean TH. The figure further shows that the coverage periods of high-resolution radiosonde data deemed suitable for long-term trend analysis according to Sect. 2.1 vary across different latitude zones, with the tropical zone (20° S–20° N) having the shortest record (2010–2023). Multiple regression analysis (Table 2) reveals a significant global-scale increase in TH and distinct latitudinal patterns in the annual trends. The most robust increase (+15 m yr−1 for radiosonde and +13 for ERA5) occurs in the Northern Hemisphere polar (70–90° N), while the Southern Hemisphere polar (70–90° S) exhibits a unique and sharp decline (−13 m yr−1 for radiosonde and −11 m yr−1 for ERA5). Serving as a spatial background, the ERA5-F is characterized by a stronger upward trend in the Northern Hemisphere, while the Southern Hemisphere exhibits an insignificant upward or downward trend. The long-term trend values for TH derived from radiosonde observations and spatially/temporally collocated ERA5 data show high consistency across latitudinal bands. However, due to the limited number of stations, the trends in the following regions should be interpreted with caution: 70–90° S, 40–70° S, and 70–90° N.
Table 2Tropopause height trend from different latitude zones (stations with ≥ 10 years valid records; 40–70° S excluded due to data absence). ERA5 is a one-dimensional data that corresponds one-to-one in time and space with the Radiosonde data, and ERA5-F is the overall mean of the ERA5 global trend averages over the period 2000 to 2023 in a two-dimensional plane divided according to latitudinal bands.

TH is an indispensable metric in climate change research, directly influenced by the temperature structure of the troposphere and stratosphere. Direct observations of the tropopause via radiosonde are generally most reliable, but are limited by the uneven global distribution of measurement stations, posing a significant constraint on global climate change studies. Recent reanalysis studies (e.g., Xian and Homeyer, 2019; Tegtmeier et al., 2020; Hoffmann and Spang, 2022; Zou et al., 2023) have advanced our understanding of TH variability. However, systematic intercomparisons of their biases and spatiotemporal patterns against high-resolution radiosonde data have yet to be fully conducted, particularly for newer reanalyses such as ERA5. While radiosondes represent the most reliable data source, they suffer from stringent spatiotemporal limitations. In contrast, the ERA5 reanalysis dataset provides complete spatiotemporal coverage and has been widely utilized in atmospheric studies. Therefore, a systematic intercomparison between high-resolution radiosonde and ERA5 THs is essential to both reconcile dataset discrepancies and optimize their combined use for robust trend analysis.
This study investigates the spatial and temporal discrepancies between ERA5-derived THs and high-resolution radiosonde data. Building upon previous research by Xian and Homeyer (2019) and Hoffmann and Spang (2022), the present study identifies a difference in TH, with radiosonde values averaging 32 m higher than ERA5. This systematic offset falls within the range of uncertainties reported in earlier intercomparison efforts. Furthermore, we highlight that the WMO-defined thermodynamic tropopause may share mathematical similarities with thin, low-altitude temperature inversions detected in high-resolution radiosonde profiles, introducing complexity in TH determination. In the statistical analysis, the differences between radiosonde and ERA5 are more pronounced in the subtropical region. This discrepancy may be linked to the subtropical tropopause break phenomenon, suggesting a region-specific bias that warrants attention in future reanalysis developments. Regarding the seasonal variation of TH, except in the tropics and the Southern Hemisphere polar region, TH peaks in autumn and winter while being lower in spring and summer (seasons are reversed between hemispheres). However, radiosonde and ERA5 exhibit strong consistency in TH, with only minor differences about 32 m.
A comprehensive intercomparison with high-resolution radiosonde observations demonstrates ERA5's exceptional performance in capturing TH characteristics, including absolute values, temporal variations, and spatial correlations. Application of the WMO tropopause definition to high-resolution soundings reveals potential limitations, particularly in subtropical regions where strong temperature inversions may lead to detection artifacts. These thin but intense inversion layers are often unresolved by coarse-resolution temperature profiles.
The global tropopause elevation trend is quantified at +90 m/decade based on radiosonde measurements. Given the 10 m vertical resolution of the sounding data, this rising trend represents a statistically robust signal, while ERA5 shows a trend of +70 m per decade, with 83 % of radiosonde stations exhibiting higher trends than ERA5. Point-to-point comparisons reveal a systematic difference, with ERA5 showing approximately 40 % weaker long-term TH trends compared to radiosondes. This discrepancy warrants further investigation through coordinated model-observation intercomparison studies. The ERA5-F global analysis reveals that 77 % of regions exhibit an increasing trend in TH. The global TH exhibits a significant but spatially uneven upward trend, with hemispheric asymmetry. The Arctic region shows the most pronounced increase (+15 m yr−1 for radiosonde and +13 for ERA5), while the Antarctic exhibits a sharp downward trend (−13 m yr−1 for radiosonde and −11 for ERA5).
However, radiosonde and ERA5 data demonstrate high consistency, yet limited station coverage (particularly in the Southern Hemisphere) remains a primary source of uncertainty, necessitating cautious interpretation of regional trends. The variation of TH with climate exhibits significant latitudinal and longitudinal differences. But many regions lack high-resolution, continuous radiosonde observations for intercomparison. This necessitates further verification through expanded station coverage and longer-term observations, which are identified in this and other studies as critical for understanding TH dynamics.
The authors would like to acknowledge the National Meteorological Information Centre (NMIC) of CMA, NOAA, German Deutscher Wetterdienst (Climate Data Center), UK Centre for Environmental Data Analysis (CEDA), GRUAN, and the University of Wyoming (https://catalogue.ceda.ac.uk/, CMA, 2025; https://www.aparc-climate.org/data-centre/data-access/us-radiosonde/, NOAA, 2025; https://opendata.dwd.de/climate_environment/CDC/observations_germany/radiosondes/high_resolution/historical/, Deutscher Wetterdienst, 2025; http://data.cma.cn/en, CEDA, 2025; https://www.gruan.org/data/file-archive/rs92-gdp2-at-lc/, GRUAN, 2025; http://weather.uwyo.edu, The University of Wyoming, 2025) for providing the high-resolution sounding data. And the ERA5 reanalysis dataset can be accessed at https://datapub.fz-juelich.de/slcs/tropopause/ (Hoffmann and Spang, 2022).
JZ conceptualized this study. YG carried out the analysis with comments from other co-authors. YG and JZ wrote the original manuscript. WW, SZ provided useful suggestions for the study. All authors contributed to the improvement of paper.
The contact author has declared that none of the authors has any competing interests.
Publisher’s note: Copernicus Publications remains neutral with regard to jurisdictional claims made in the text, published maps, institutional affiliations, or any other geographical representation in this paper. While Copernicus Publications makes every effort to include appropriate place names, the final responsibility lies with the authors. Views expressed in the text are those of the authors and do not necessarily reflect the views of the publisher.
The authors would like to acknowledge the National Meteorological Information Centre (NMIC) of CMA, NOAA, the Deutscher Wetterdienst (Climate Data Center), the UK Centre for Environmental Data Analysis (CEDA), GRUAN, ECMWF, and the University of Wyoming for continuously collecting and generously providing high-resolution radiosonde data.
This study jointly supported by the National Natural Science Foundation of China under grant 42205074 and the Open Grants of the State Key Laboratory of Severe Weather Meteorological Science and Technology (2024LASW-B01).
This paper was edited by Geraint Vaughan and reviewed by two anonymous referees.
Añel, J. A., Gimeno, L., de la Torre, L., and Nieto, R.: Changes in tropopause height for the Eurasian region determined from CARDS radiosonde data, Naturwissenschaften, 93, 603–609, https://doi.org/10.1007/s00114-006-0147-5, 2006.
Añel, J. A., Antuña, J. C., de la Torre, L., Castanheira, J. M., and Gimeno, L.: Climatological features of global multiple tropopause events, J. Geophys. Res. Atmos., 113, D00B08, https://doi.org/10.1029/2007JD009697, 2008.
Birner, T.: Fine–scale structure of the extratropical tropopause region, J. Geophys. Res., 111, D04104, https://doi.org/10.1029/2005JD006301, 2006.
CEDA: radiosonde data, https://catalogue.ceda.ac.uk/, last access: 16 June 2025.
CMA: radiosonde data, http://data.cma.cn/en, last access: 16 June 2025.
Durre, I., Vose, R. S., and Wuertz, D. B.: Overview of the Integrated Global Radiosonde Archive, J. Climate, 19, 53–68, https://doi.org/10.1175/JCLI3594.1, 2006.
Dee, D. P., Uppala, S. M., Simmons, A. J., Berrisford, P., Poli, P., Kobayashi, S., Andrae, U., Balmaseda, M. A., Balsamo, G., Bauer, P., Bechtold, P., Beljaars, A. C. M., van de Berg, L., Bidlot, J., Bormann, N., Delsol, C., Dragani, R., Fuentes, M., Geer, A. J., Haimberger, L., Healy, S. B., Hersbach, H., Hólm, E. V., Isaksen, L., Kållberg, P., Köhler, M., Matricardi, M., McNally, A. P., Monge–Sanz, B. M., Morcrette, J.-J., Park, B.-K., Peubey, C., de Rosnay, P., Tavolato, C., Thépaut, J.-N., and Vitart, F.: The ERA–Interim reanalysis: configuration and performance of the data assimilation system, Q. J. R. Meteorol. Soc., 137, 553–597, https://doi.org/10.1002/qj.828, 2011.
Durre, I., Yin, X., Vose, R. S., Applequist, S., and Arnfield, J.: Enhancing the Data Coverage in the Integrated Global Radiosonde Archive, J. Atmos. Oceanic Technol., 35, 1753–1770, https://doi.org/10.1175/JTECH-D-17-0223.1, 2018.
Deutscher Wetterdienst (Climate Data Center): radiosonde data, https://opendata.dwd.de/climate_environment/CDC/observations_germany/radiosondes/high_resolution/historical/, last access: 16 June 2025.
Fueglistaler, S., Dessler, A. E., Dunkerton, T. J., Folkins, I., Fu, Q., and Mote, P. W.: Tropical tropopause layer, Rev. Geophys., 47, https://doi.org/10.1029/2008RG000267, 2009.
Fujiwara, M., Wright, J. S., Manney, G. L., Gray, L. J., Anstey, J., Birner, T., Davis, S., Gerber, E. P., Harvey, V. L., Hegglin, M. I., Homeyer, C. R., Knox, J. A., Krüger, K., Lambert, A., Long, C. S., Martineau, P., Molod, A., Monge-Sanz, B. M., Santee, M. L., Tegtmeier, S., Chabrillat, S., Tan, D. G. H., Jackson, D. R., Polavarapu, S., Compo, G. P., Dragani, R., Ebisuzaki, W., Harada, Y., Kobayashi, C., McCarty, W., Onogi, K., Pawson, S., Simmons, A., Wargan, K., Whitaker, J. S., and Zou, C.-Z.: Introduction to the SPARC Reanalysis Intercomparison Project (S-RIP) and overview of the reanalysis systems, Atmos. Chem. Phys., 17, 1417–1452, https://doi.org/10.5194/acp-17-1417-2017, 2017.
Gelaro, R., McCarty, W., Suárez, M. J., Todling, R., Molod, A., Takacs, L., Randles, C. A., Darmenov, A., Bosilovich, M. G., Reichle, R., Wargan, K., Coy, L., Cullather, R., Draper, C., Akella, S., Buchard, V., Conaty, A., da Silva, A. M., Gu, W., Kim, G.-K., Koster, R., Lucchesi, R., Merkova, D., Nielsen, J. E., Partyka, G., Pawson, S., Putman, W., Rienecker, M., Schubert, S. D., Sienkiewicz, M., and Zhao, B.: The Moder+n-Era Retrospective analysis for research and applications, version 2 (MERRA-2), J. Clim., 30, 5419–5454, https://doi.org/10.1175/JCLI-D-16-0758.1, 2017.
Guo, J., Zhang, J., Yang, K., Liao, H., Zhang, S., Huang, K., Lv, Y., Shao, J., Yu, T., Tong, B., Li, J., Su, T., Yim, S. H. L., Stoffelen, A., Zhai, P., and Xu, X.: Investigation of near-global daytime boundary layer height using high-resolution radiosondes: first results and comparison with ERA5, MERRA-2, JRA-55, and NCEP-2 reanalyses, Atmos. Chem. Phys., 21, 17079–17097, https://doi.org/10.5194/acp-21-17079-2021, 2021.
GRUAN: radiosonde data, https://www.gruan.org/data/file-archive/rs92-gdp2-at-lc/, last access: 16 June 2025.
Hoerling, M. P., Schaack, T. K., and Lenzen, A. J.: Global objective tropopause analysis, Mon. Wea. Rev., 119, 1816–1831, 1991.
Highwood, E. J. and Hoskins, B. J.: The tropical tropopause, Q. J. R. Meteorol. Soc., 124, 1579–1604, 1998.
Hoinka, K. P.: Statistics of the Global Tropopause Pressure, Mon. Wea. Rev., 126, 3303–3325, https://doi.org/10.1175/1520-0493(1998)126<3303:SOTGTP>2.0.CO;2, 1998.
Houchi, K., Stoffelen, A., Marseille, G. J., and De Kloe, J.: Comparison of wind and wind shear climatologies derived from high-resolution radiosondes and the ECMWF model, J. Geophys. Res., 115, D22123, https://doi.org/10.1029/2009JD013196, 2010.
Hersbach, H., Bell, B., Berrisford, P., Hirahara, S., Horányi, A., Muñoz-Sabater, J., Nicolas, J., Peubey, C., Radu, R., Schepers, D., Simmons, A., Soci, C., Abdalla, S., Abellan, X., Balsamo, G., Bechtold, P., Biavati, G., Bidlot, J., Bonavita, M., De Chiara, G., Dahlgren, P., Dee, D., Diamantakis, M., Dragani, R., Flemming, J., Forbes, R., Fuentes, M., Geer, A., Haimberger, L., Healy, S., Hogan, R. J., Hólm, E., Janisková, M., Keeley, S., Laloyaux, P., Lopez, P., Lupu, C., Radnoti, G., de Rosnay, P., Rozum, I., Vamborg, F., Villaume, S., and Thépaut, J.-N.: The ERA5 global reanalysis, Q. J. R. Meteorol. Soc., 146, 1999-2049, https://doi.org/10.1002/qj.3803, 2020.
Hoffmann, L. and Spang, R.: An assessment of tropopause characteristics of the ERA5 and ERA-Interim meteorological reanalyses, Atmos. Chem. Phys., 22, 4019–4046, https://doi.org/10.5194/acp-22-4019-2022, 2022 (data available at: https://datapub.fz-juelich.de/slcs/tropopause/, last access: 16 June 2025).
Ingleby, B., Pauley, P., Kats, A., Ator, J., Keyser, D., Doerenbecher, A., Fucile, E., Hasegawa, J., Toyoda, E., Kleinert, T., Qu, W., James, J. S., Tennant, W., and Weedon, R.: Progress toward High-Resolution, Real-Time Radiosonde Reports, Bull. Amer. Meteor. Soc., 97, 2149–2161, https://doi.org/10.1175/BAMS-D-15-00169.1, 2016.
Ki, M. O. and Chun, H. Y.: Characteristics and sources of inertia–gravity waves revealed in the KEOP–2007 radiosonde data, Asia–Pacific, J. Atmos. Sci., 46, 261–277, https://doi.org/10.1007/s13143-010-1001-4, 2010.
Ko, H. C., Chun, H. Y., Wilson, R., and Geller, M. A.: Characteristics of atmospheric turbulence retrieved from high vertical-resolution radiosonde data in the United States, J. Geophys. Res. Atmos., 124, 7553–7579, https://doi.org/10.1029/2019JD030287, 2019.
Kumar, S.: Balloon–Based Remote Sensing of the Atmosphere, Atmos. Remote. Sens., 211–226, https://doi.org/10.1016/B978-0-323-99262-6.00020-1, 2023.
Manney, G. L. and Hegglin, M. I.: Seasonal and regional variations of long-term changes in upper-tropospheric jets from reanalyses, J. Climate, 31, 423–448, https://doi.org/10.1175/jcli-d-17-0303.1, 2018.
Meng, L., Liu, J., Tarasick, D, W., Randel, W, J., Steiner, A. K., Wilhelmsen, H., Wang, L., and Haimberger, L.: Continuous rise of the tropopause in the Northern Hemisphere over 1980–2020, Sci. Adv., 7, eabi8065, https://doi.org/10.1126/sciadv.abi8065, 2021.
Naujokat, B.: An update of the observed quasi-biennial oscillation of the stratospheric winds over the tropics, J. Atmos. Sci., 43, 1873–1877, 1986.
NOAA: radiosonde data, https://www.aparc-climate.org/data-centre/data-access/us-radiosonde/, last access: 16 June 2025.
Randel, W. and Jensen, E.: Physical processes in the tropical tropopause layer and their roles in a changing climate, Nature Geosci., 6, 169–176, https://doi.org/10.1038/ngeo1733, 2013.
Raman, M. R. and Chen, W.: Trends in Monthly Tropopause Characteristics Observed over Taipei, Taiwan, J. Atmos. Sci., 71, 1323–1338, https://doi.org/10.1175/JAS-D-13-0230.1, 2014.
Raoult, B., Bergeron, C., Alós, A. L., Thépaut, J. N., and Dee, D. P.: Climate service develops user–friendly data store, ECMWF Newsletter, 151, 22–27, https://doi.org/10.21957/p3c285, 2017.
Santer, B. D., Wehner, M. F., Wigley, T. M. L., Sausen, R., Meehl, G. A., Taylor, K. E., Ammann, C., Arblaster, J., Washington, W. M., Boyle, J. S., and Brüggemann, W.: Contributions of Anthropogenic and Natural Forcing to Recent Tropopause Height Changes, Science, 301, 479–483, https://doi.org/10.1126/science.1084123, 2003.
Sausen, R. and Santer, B. D.: Use of changes in tropopause height to detect human influences on climate, Meteorol. Z., 12, 131–136, https://doi.org/10.1127/0941-2948/2003/0012-0131, 2003.
Seidel, D. J. and Randel, W. J.: Variability and trends in the global tropopause estimated from radiosonde data, J. Geophys. Res., 111, D21101, https://doi.org/10.1029/2006JD007363, 2006.
Seidel, D. J., Ao, C. O., and Li, K.: Estimating climatological planetary boundary layer heights from radiosonde observations: Comparison of methods and uncertainty analysis, J. Geophys. Res., 115, D16113, https://doi.org/10.1029/2009JD013680, 2010.
Shao, J., Zhang, J., Wang, W., Zhang, S., Yu, T., and Dong, W.: Occurrence frequency of subcritical Richardson numbers assessed by global high-resolution radiosonde and ERA5 reanalysis, Atmos. Chem. Phys., 23, 12589–12607, https://doi.org/10.5194/acp-23-12589-2023, 2023.
Son, S.-W., Polvani, L. M., Waugh, D. W., Birner, T., Akiyoshi, H., Garcia, R. R., Gettelman, A., Plummer, D. A., and Rozanov, E.: The impact of stratospheric ozone recovery on tropopause height trends, J. Climate, 22, 429–445, https://doi.org/10.1175/2008JCLI2215.1, 2009.
Son, S. W., Tandon, N. F., and Polvani, L. M.: The fine-scale structure of the global tropopause derived from COSMIC GPS radio occultation measurements, J. Geophys. Res., 116, D20113, https://doi.org/10.1029/2011JD016030, 2011.
Sorbjan, Z. and Balsley, B. B.: Microstructure of Turbulence in the Stably Stratified Boundary Layer, Bound. Layer Meteor., 129, 191–210, https://doi.org/10.1007/s10546-008-9310-1, 2008.
Sunilkumar, S. V., Muhsin, M., Ratnam, M. V., Parameswaran, K., Murthy, B. V. K., and Emmanuel, M.: Boundaries of tropical tropopause layer (TTL): A new perspective based on thermal and stability profiles, J. Geophys. Res. Atmos., 122, 741–754, https://doi.org/10.1002/2016JD025217, 2017.
Staten, P. W., Lu, J., Grise, K. M., Davis, S. M., and Birner, T.: Re-examining tropical expansion, Nat. Clim. Change, 8, 1758–6798, https://doi.org/10.1038/s41558-018-0246-2, 2018.
Simmons, A., Soci, C., Nicolas, J., Bell, B., Berrisford, P., Dragani, R., Flemming, J., Haimberger, L., Healy, S., Hersbach, H., Horányi, A., Inness, A., Muñoz-Sabater, J., Radu, R., and Schepers, D.: Global stratospheric temperature bias and other stratospheric aspects of ERA5 and ERA5.1, ECMWF, https://doi.org/10.21957/rcxqfmg0, 2020.
Tegtmeier, S., Anstey, J., Davis, S., Dragani, R., Harada, Y., Ivanciu, I., Pilch Kedzierski, R., Krüger, K., Legras, B., Long, C., Wang, J. S., Wargan, K., and Wright, J. S.: Temperature and tropopause characteristics from reanalyses data in the tropical tropopause layer, Atmos. Chem. Phys., 20, 753–770, https://doi.org/10.5194/acp-20-753-2020, 2020.
Thépaut, J. N., Dee, D. P., Engelen, R. and Pinty, B.: The Copernicus programme and its climate change service, IGARSS 2018–2018 IEEE International Geoscience and Remote Sensing Symposium, 1591–1593, https://doi.org/10.1109/IGARSS.2018.8518067, 2018.
The University of Wyoming: radiosonde data, http://weather.uwyo.edu, last access: 16 June 2025.
Thomason, L. W., Ernest, N., Millán, L., Rieger, L., Bourassa, A., Vernier, J.-P., Manney, G., Luo, B., Arfeuille, F., and Peter, T.: A global space-based stratospheric aerosol climatology: 1979–2016, Earth Syst. Sci. Data, 10, 469–492, https://doi.org/10.5194/essd-10-469-2018, 2018.
Turhal, K., Plöger, F., Clemens, J., Birner, T., Weyland, F., Konopka, P., and Hoor, P.: Variability and trends in the potential vorticity (PV)-gradient dynamical tropopause, Atmos. Chem. Phys., 24, 13653–13679, https://doi.org/10.5194/acp-24-13653-2024, 2024.
Velikou, K., Lazoglou, G., Tolika, K., and Anagnostopoulou, C.: Reliability of the ERA5 in Replicating Mean and Extreme Temperatures across Europe, Water, 14, 543, https://doi.org/10.3390/w14040543, 2022.
WMO: Meteorology A Three–Dimensional Science: Second Session of the Commission for Aerology, WMO Bull., iv, 134–138, 1957.
WMO: Assessment of Our Understanding of the Processes Controlling Its Present Distribution and Change, Atmospheric Ozone, World Meteorological Organization (WMO)/National Aeronautics and Space Administration (NASA), Report No. 16, p. 152, 1985.
Xian, T. and Homeyer, C. R.: Global tropopause altitudes in radiosondes and reanalyses, Atmos. Chem. Phys., 19, 5661–5678, https://doi.org/10.5194/acp-19-5661-2019, 2019.
Yoo, J. H., Choi, T., Chun, H. Y., Kim, Y. H., Song, I. S., and Song, B. G.: Inertia–gravity waves revealed in radiosonde data at Jang Bogo Station, Antarctica (74°37′ S, 164°13′ E): 1. Characteristics, energy, and momentum flux, J. Geophys. Res. Atmos., 123, 305–331, https://doi.org/10.1029/2018JD029164, 2018.
Zurita-Gotor, P. and Vallis, G. K.: Determination of Extratropical Tropopause Height in an Idealized Gray Radiation Model, J. Atmos. Sci., 70, 2272–2292, https://doi.org/10.1175/JAS-D-12-0209.1, 2013.
Zhang, J., Guo, J., Zhang, S., and Shao, J.: Inertia-gravity wave energy and instability drive turbulence: Evidence from a near-global high-resolution radiosonde dataset, Clim. Dynam., 58, 2927–2939, https://doi.org/10.1007/s00382-021-06075-2, 2022.
Zou, L., Hoffmann, L., Müller, R., and Spang, R.: Variability and trends of the tropical tropopause derived from a 1980–2021 multi–reanalysis assessment, Front. Earth Sci., 11, https://doi.org/10.3389/feart.2023.1177502, 2023.