the Creative Commons Attribution 4.0 License.
the Creative Commons Attribution 4.0 License.
 | 05 Feb 2025
Climate variability can outweigh the influence of climate mean changes for extreme precipitation under global warming
Nora L. S. Fahrenbach
Bjørn H. Samset
As global warming progresses, weather conditions like daily temperature and precipitation are changing due to changes in their means and distributions of day-to-day variability. In this study, we show that changes in variability have a stronger influence on the number of extreme precipitation days than the change in the mean state in many locations. We analyze daily precipitation and maximum temperatures at four levels of global warming and under different emission scenarios for the Northern Hemisphere (NH) summer (June–August). Our analysis is based on initial-condition large-ensemble simulations from three fully coupled Earth system models (MPI-ESM1-2-LR, CanESM5 and ACCESS-ESM1-5) contributing to the Climate Model Inter-comparison Project Phase 6 (CMIP6). We also use information from the Precipitation Driver Response Model Intercomparison Project (PDRMIP) to discern the influence of different climate drivers (notably aerosols and greenhouse gases). We decompose the total changes in daily NH summer precipitation and daily maximum temperature into mean and variability components (standard deviation and skewness). Our results show that in many locations, variability exerts a stronger influence than mean changes on daily precipitation. Changes in the widths and shapes of precipitation distributions are especially dominating over mean changes in Asia, the Arctic and sub-Saharan Africa. In contrast, temperature changes are primarily driven by changes in the mean state. For the near future (2020–2040), we find that reductions in aerosol emissions would increase the likelihood of extreme summertime precipitation only over Asia. This study emphasizes the importance of incorporating daily variability changes into climate change impact assessments and advocates that future emulator and impact model development should focus on improving the representation of daily variability.
- Article
(22302 KB) - Full-text XML
- BibTeX
- EndNote


In 2023, many regions experienced an unusually hot summer with record-breaking temperatures, widespread wildfires and heavy rainfall followed by severe flooding events (Rantanen and Laaksonen, 2024; Copernicus, 2023; WMO, 2023). Changes in climate can be driven by different natural factors, like volcanic emissions and ocean variability, as well as different anthropogenic drivers, like anthropogenic aerosol and CO2 emissions. Aerosols and CO2 affect regional climates differently: CO2 blocks surface upwelling longwave radiation. Sulfate aerosols reflect incoming solar radiation, which results in surface cooling during daytime. In contrast, absorbing aerosols, like black carbon, absorb incoming solar radiation and thus lead to a warming of surrounding air masses (Nordling et al., 2021; Szopa et al., 2021). These different climate forcings not only affect temperatures differently but also wet and dry extremes (Sillmann et al., 2019) and the diurnal cycle (Stjern et al., 2020). However, while the effects of carbon dioxide are relatively well constrained, the impact of aerosols constitutes still one of the major uncertainties in climate science (Chen et al., 2021). For instance, while the global temperature impact of absorbing aerosols is relatively weak, they play a possibly large but still uncertain role in regional precipitation changes (Samset, 2022). The aerosol effect on climate is further complicated by the fact that the induced climate response is dependent on the location of the aerosol emissions (Persad, 2023; Westervelt et al., 2020; Persad and Caldeira, 2018) and that the aerosol effects of locally emitted aerosols can reach far beyond their local emission regions (Wilcox et al., 2019; Fahrenbach and Bollasina, 2023). For example, Asian aerosol emissions have pronounced effects on Arctic temperatures due to changes in energy transport and albedo feedback (Merikanto et al., 2021) and the Australian monsoon due to changes in teleconnection patterns (Fahrenbach et al., 2024). Thus, it is certainly plausible that regional aerosol emission changes induce changes in daily weather and extremes in local and remote regions.
Daily weather variability, in particular, plays a key role in extreme events and is of utmost importance when it comes to adapting to climate change since climate risk mitigation strategies depend on our understanding of day-to-day weather patterns. Changes in weather extremes are influenced by changes in the mean climate conditions (which are influenced by global warming), variability on decadal timescales and day-to-day variations in weather (which are driven primarily by daily-to-annual-scale internal climate variability). We have observed that extreme weather events have already changed and are continuing to do so as our planet warms (Myhre et al., 2019; Sippel et al., 2020). For example, the unprecedented summer heat wave in Europe in 2019 would have been impossible without anthropogenic climate change (Ma et al., 2020).
Previous studies have investigated changes in probability density functions (PDFs) of precipitation under global warming. Pendergrass et al. (2017) showed that the variability of weather patterns is increasing across most regions under a warming climate. This is evident in the widening of PDFs, indicating a growing range of possible weather outcomes. Zhang et al. (2021), utilizing the HadGEM3-GC3.05 model, found that precipitation variability is increasing on all timescales, from daily variability to year-to-year differences. This study highlights that changes on short timescales are closely linked to alterations in synoptic-scale weather patterns, emphasizing the broad-reaching impacts of climate change on precipitation. Samset et al. (2019b) focused on the evolution of regional PDFs under global warming, particularly focusing on changes in daily PDFs of temperature and precipitation. Using the CESM1 large ensemble, they discovered that even a modest increase in global temperature (+1.5 °C) results in significantly more variable precipitation over regions like Africa and South America. Katzenberger et al. (2022) studied the future precipitation variability over the Indian monsoon region and found that the likelihood of extreme rainfall is expected to increase significantly (up to 6-fold) by the end of this century depending on future emissions. This illustrates the severe regional impacts of climate change, particularly in areas which are already vulnerable to extreme weather events.
When it comes to temperature, there is a clear footprint of global warming on the change in temperature variability. In high latitudes, the annual temperature variability tends to decrease, whereas it increases in lower latitudes in the near future (Kotz et al., 2021). However, this pattern varies between seasons and models. Suarez-Gutierrez et al. (2020) investigated how temperature-related extreme events evolve with global warming using the MPI-GE large ensemble. They discovered that daily temperatures exceeding 50 °C become more common in the Arabian Peninsula, northern India and Pakistan at a global warming level of 2 °C. However, beyond the 2 °C threshold, these extreme temperatures are expected to occur on every continent. Future emissions play an important role in shaping how variability and extreme weather events will change in the near to far future. For example, Wilcox et al. (2020) shows that a reduction of aerosol emissions in the near future could lead to an increase in the Asian summer monsoon. Understanding these dynamic changes is crucial when evaluating future extreme changes on a regional scale.
What remains unclear is the role of variability: are precipitation and temperature extremes becoming more severe due to changes in the mean state or due to changes in day-to-day variability? Another uncertainty relates to the climate models themselves. Despite generally agreeing on the direction of changes in extreme precipitation, the current state-of-the-art climate models show significant uncertainty regarding the magnitude of these changes, especially at regional scales. In particular, the different implementations for anthropogenic aerosols and different climate sensitivities of different ESMs add to this uncertainty. Another gap in the current knowledge is how to translate the changes in the daily distribution of weather variability to meaningful quantities, like the number of extreme weather events.
In this study, we focus on examining how daily variability in the Northern Hemisphere (NH) summer precipitation and daily maximum temperature is evolving under global warming and different emission scenarios. We also show result for NH winter months in the appendix. Using large-ensemble simulation from CMIP6, we investigate changes in the mean and variability (characterized by the width and shape of the PDFs) using a similar method as in van der Wiel and Bintanja (2021), Samset et al. (2019b), and Lund et al. (2023) and further identify the key anthropogenic drivers (aerosols or greenhouse gases) of those changes. Our results show key regions where changes in extremes are driven by changes in variability rather than the mean state. By examining the daily variability of weather in the context of a changing climate, we can improve our understanding of the challenges and opportunities for climate change adaptation.
2.1 Analysis of changes in mean and variability using PDFs
We are using simulations from single-model initial-condition large ensembles (SMILEs) from CMIP6, similarly to (Samset et al., 2019b), who studied how daily weather at a regional scale changes with global warming. In SMILEs each model is run multiple times with the same forcing and model configuration but different initial states. Figure 1 illustrates our methodology of defining daily PDFs for precipitation and maximum temperature using daily CMIP6 data from CanESM5, MPI-EMS1-2 and ACCESS-ESM-1-5. First, we defined the 1–4 °C global warming levels (GWLs) following the definition outlined in the IPCC AR6 report (Lee and Zhou, 2021) (see Fig. 1a). For this, a 20-year centered running mean of annual temperature for each ensemble member is calculated, and the GWL is then defined as the period ±10 years from the first year in which the global warming threshold was surpassed. A PDF is defined in this way for each grid point, which can be used to find changes in both mean and variability (here referred to as the “PDF of total change”). The second step involves removing the annual cycle at each grid point for each GWL, which gives a PDF that only differs in daily variability (shape and width of the PDF) for each GWL. This results in PDFs for each GWL which differ only by the influence of change in standard deviation, kurtosis and skewness. We quantify changes to the daily mean by calculating the difference between the means of the GWL and pre-industrial (PI) PDFs and then shifting the PI (0 GWL) PDF by the corresponding amount. Figure 1c illustrates the PDF changes due to the (1) total change, (2) change in the mean and (3) change in variability (standard deviation (SD) and skewness). The final step is to calculate the number of days during which extreme weather events occur for each PDF (see Fig. 1d). Here, an extreme event is defined as one that exceeds the 0.999th quantile. The return period for these extremes, as simulated by the different models, is approximately 10 years. Thus, the extreme events analyzed in this paper refer to events occurring once or less every 10 years in the pre-industrial era. To test if underlying PDFs are statistically different, we use Kolmogorov–Smirnov test and the p value.
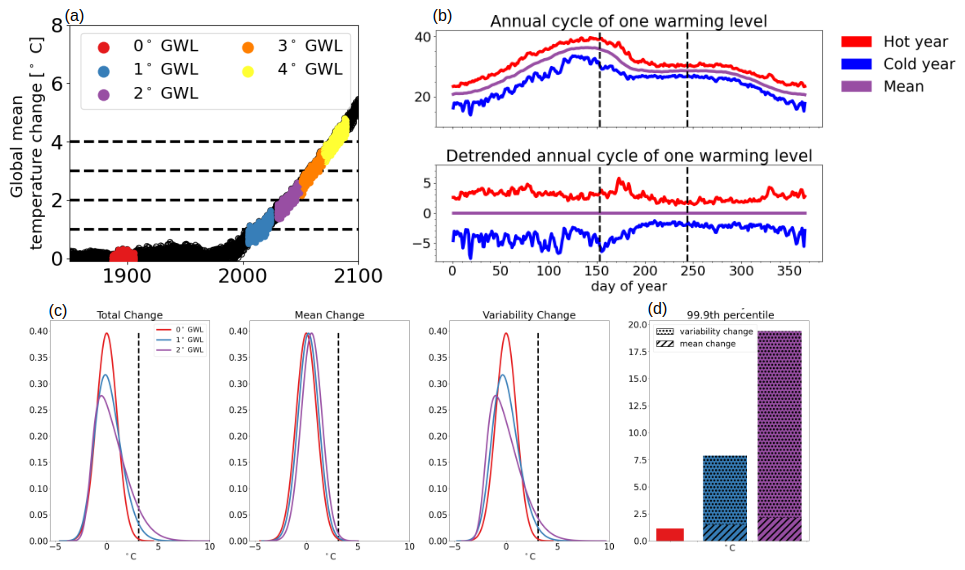
Figure 1Method description. (a) Selection of years for each global warming level. (b) Example of regional daily maximum temperature with and without subtracting off the annual cycle to extract daily variability from Southeast Asia using the MPI-ESM1-2-LR model. Dashed lines indicates June–July–August months. (c) Idealized PDFs of the total changes, the decomposition in mean and change in variability (shape and width), with a dashed line on the 99.9th percentile as well as changes in the number of extreme days.
For the near-future analysis, we follow the same process described above to define the PDFs but calculate the PDFs for four different Shared Socioeconomic Pathway (SSP) scenarios (SSP1-2.6, SSP2-4.5, SSP3-7.0 and SSP5-8.5; O'Neill et al., 2016) over three distinct time periods (2025–2034, 2035–2044 and 2045–2054) instead of using GWLs. For each time period and each SSP scenario, there is an underlying PDF, which we refer to as the PDF of total change, similar to the GWL analysis. We then remove the annual cycle as in the GWL analysis to obtain a PDF that contains only changes attributable to variability (change in SD and skewness). Here, we quantify changes to the mean by calculating the difference between the means of the given SSP (and time period) and the PI PDF, and then shifting the PI (0 GWL) PDF by the corresponding amount.
These time periods are chosen to represent the largest differences in aerosol pathways across the different SSPs where the full range of uncertainty in greenhouse gas emissions has not yet emerged (although they are not negligible and are included in our simulated climate response) (Lund et al., 2019; Wilcox et al., 2020; Guo et al., 2021). SSP1-2.6 includes a rapid reduction in global aerosol emissions until 2050, except for an increase over southern Africa due to rapid industrialization. The aerosol emissions in SSP2-4.5 and SSP5-8.5 show a similar, but weaker, pattern, with a decrease over the NH and increase in the Southern Hemisphere (SH) as well as a strong Asian aerosol dipole (i.e., a large increase over South Asia and large decrease over East Asia) until the 2040s (Wilcox et al., 2020; Samset et al., 2019a). The main difference between SSP2-4.5 and SSP5-8.5 lies in the black carbon (BC) emissions from South Asia, which show an increase and decrease until the 2040s, respectively, as well as the aerosol emissions over South America related to different rates of deforestation (Lawrence et al., 2016). SSP3-7.0 also shows an NH decrease and SH increase in emissions. However, the sulfur dioxide (precursor of sulfate aerosols) emissions stay nearly constant over East Asia but increase over South Asia, with opposite changes in BC emissions. As multiple emissions are changing in the SSPs, it is not possible to quantify the effect of aerosols and greenhouse gas (GHG) changes separately. However, we can identify the main trend of emission changes, which is large aerosol and GHG reductions in SSP1-2.6, while SSP3-7.0 has the opposite emission trend (Wilcox et al., 2020).
2.2 Data
2.2.1 CMIP6 data
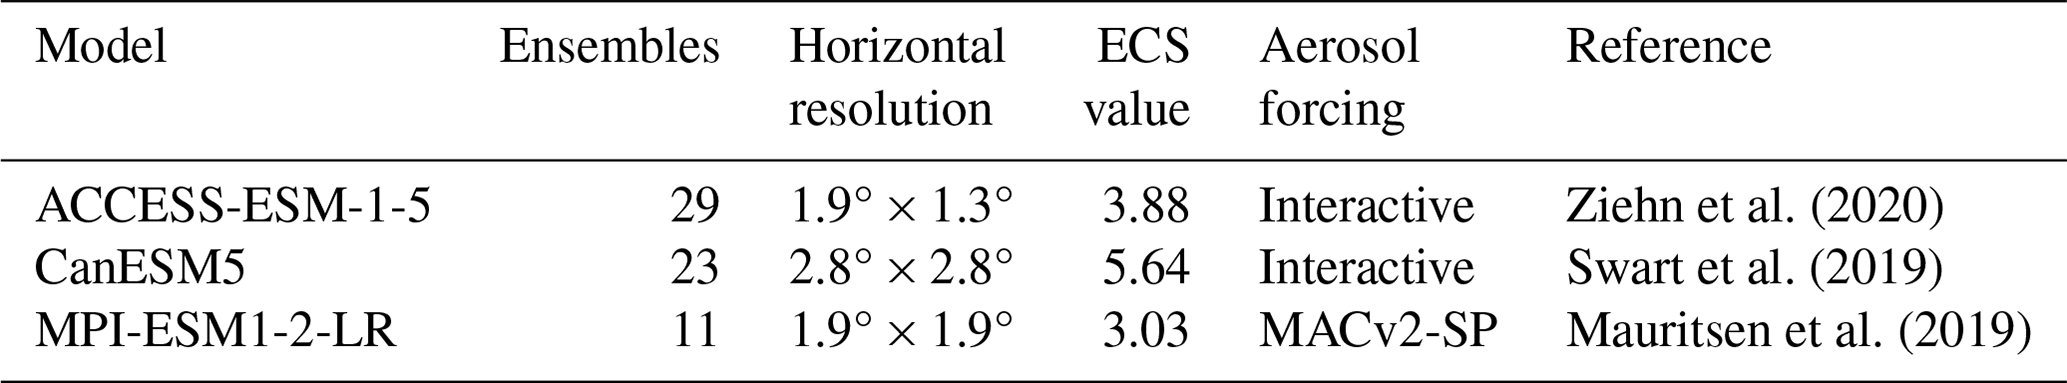
We utilize large-ensemble simulations for the SSP1-2.6, SSP2-4.5, SSP3-7.0, and SSP5-8.5 scenarios performed by three CMIP6 models, namely MPI-ESM1-2-LR (Mauritsen et al., 2019), CanESM5 (Swart et al., 2019) and ACCESS-ESM5-1.5 (Ziehn et al., 2020). Table 1 gives the model resolutions and number of ensemble members for each model. We use the same models as Lund et al. (2023) for which the summertime variability of precipitation and daily maximum temperature was verified using ERA-5 data.
Ziehn et al. (2020)Swart et al. (2019)Mauritsen et al. (2019)Table 1List of the CMIP6 large-ensemble models used in this study which performed the required SSP1-2.6, SSP2-4.5, SSP3-7.0 and SSP5-8.5 simulations. The equilibrium climate sensitivity (ECS) values are taken from Zelinka et al. (2020).
2.2.2 PDRMIP data
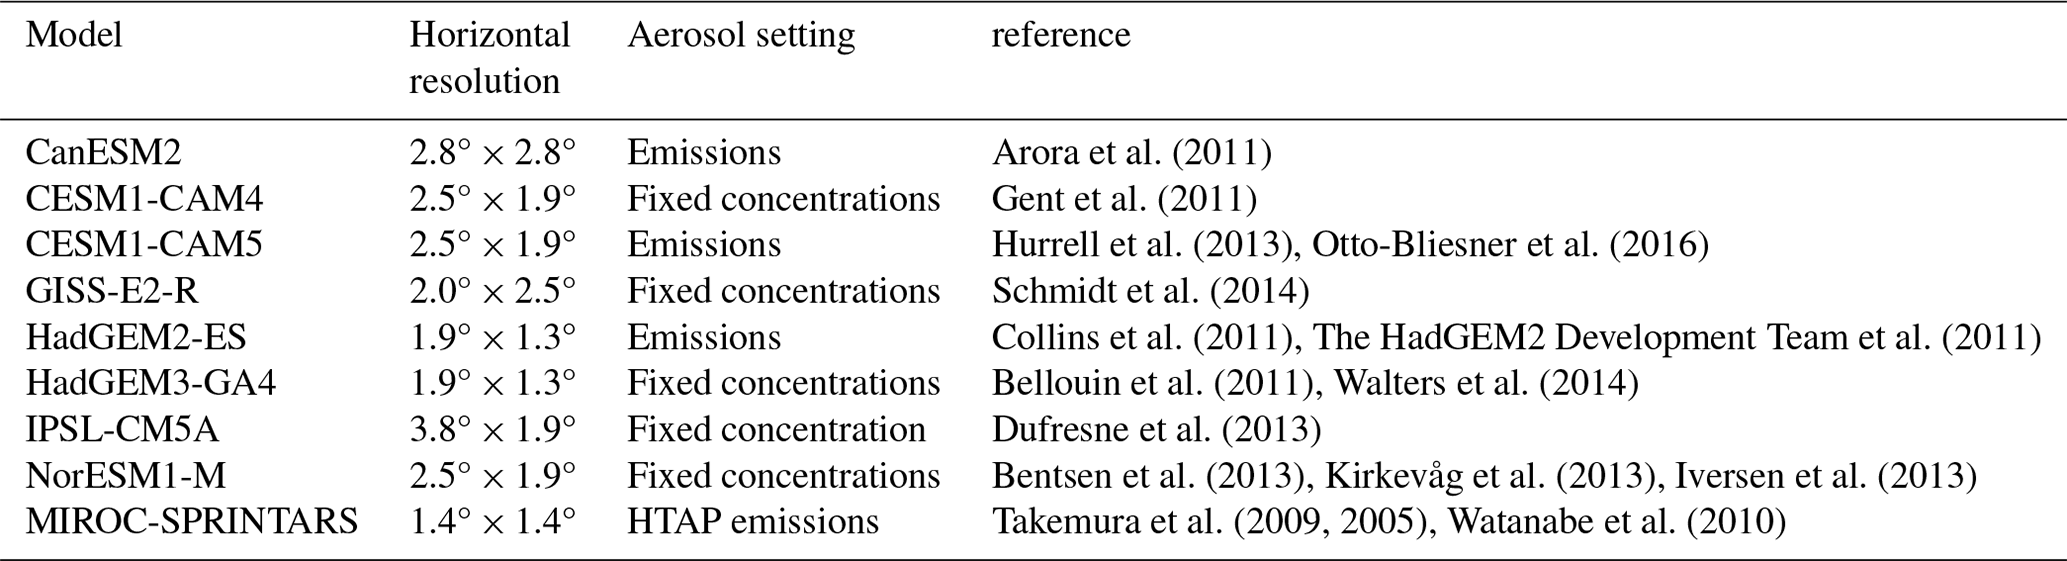
We also use idealized single forcing simulations from the Precipitation Driver Response Model Intercomparison Project (PDRMIP; Myhre et al., 2017) to assess the expected impacts of different anthropogenic drivers on daily weather variability. In particular, we focus on experiments simulating a global doubling of CO2 concentrations (hereafter CO2 × 2), a 5-fold increase in sulfate concentrations or emissions (hereafter SUL × 5), and a 10-fold increase in black carbon concentrations or emissions (hereafter BC × 10) relative to the year 2000. We use the multi-model mean across nine CMIP5-generation models which participated in PDRMIP to get a robust estimate of daily variability changes (Table 2). Throughout the analysis, we examine the years 50–100 of the coupled simulations, discarding the first decades as spin-up. For the extreme event definition for PDRMIP, we use the 0.90 percentile threshold to ensure that enough data are available to accurately estimate variability. The different definition of an extreme event compared to the CMIP6 analysis described above is due to the fact that PDRMIP consists of only one member ensemble per model.
Arora et al. (2011)Gent et al. (2011)Hurrell et al. (2013)Otto-Bliesner et al. (2016)Schmidt et al. (2014)Collins et al. (2011)The HadGEM2 Development Team et al. (2011)Bellouin et al. (2011)Walters et al. (2014)Dufresne et al. (2013)Bentsen et al. (2013)Kirkevåg et al. (2013)Iversen et al. (2013)Takemura et al. (2009, 2005)Watanabe et al. (2010)Table 2List of models which participated in PDRMIP and performed the coupled global experiments (CO2 × 2, SUL × 5, BC × 10).
3.1 Expected change in daily variability due to different anthropogenic drivers
Here, we first examine changes in daily weather variability in response to global increases in CO2, sulfate and black carbon aerosols simulated as part of PDRMIP. Figure 2 shows how a 5-fold global increase in sulfate emissions (first column), 10-fold increase in black carbon emissions (second column) and doubling of CO2 concentrations (third column) affect the number of days of precipitation above the 90th percentile in pre-industrial conditions. In CO2 × 2, all models show an increase in intense summertime precipitation over Asia, although the exact pattern over Asia differs between models (Fig. A1). NorESM1 shows the smallest changes in intense precipitation overall, with strong increases being located around the Tibetan Plateau. These changes correlate with changes in the SD. Other common features among the models include a decreasing number of days of intense precipitation over the southern part of Europe (Fig. 2). Spatial correlation values between changes in SD and changes in number of days of extremes vary from 0.22 to 0.49 (Fig. A4), indicating that changes in the SD can explain some of the changes in extremes but not all.
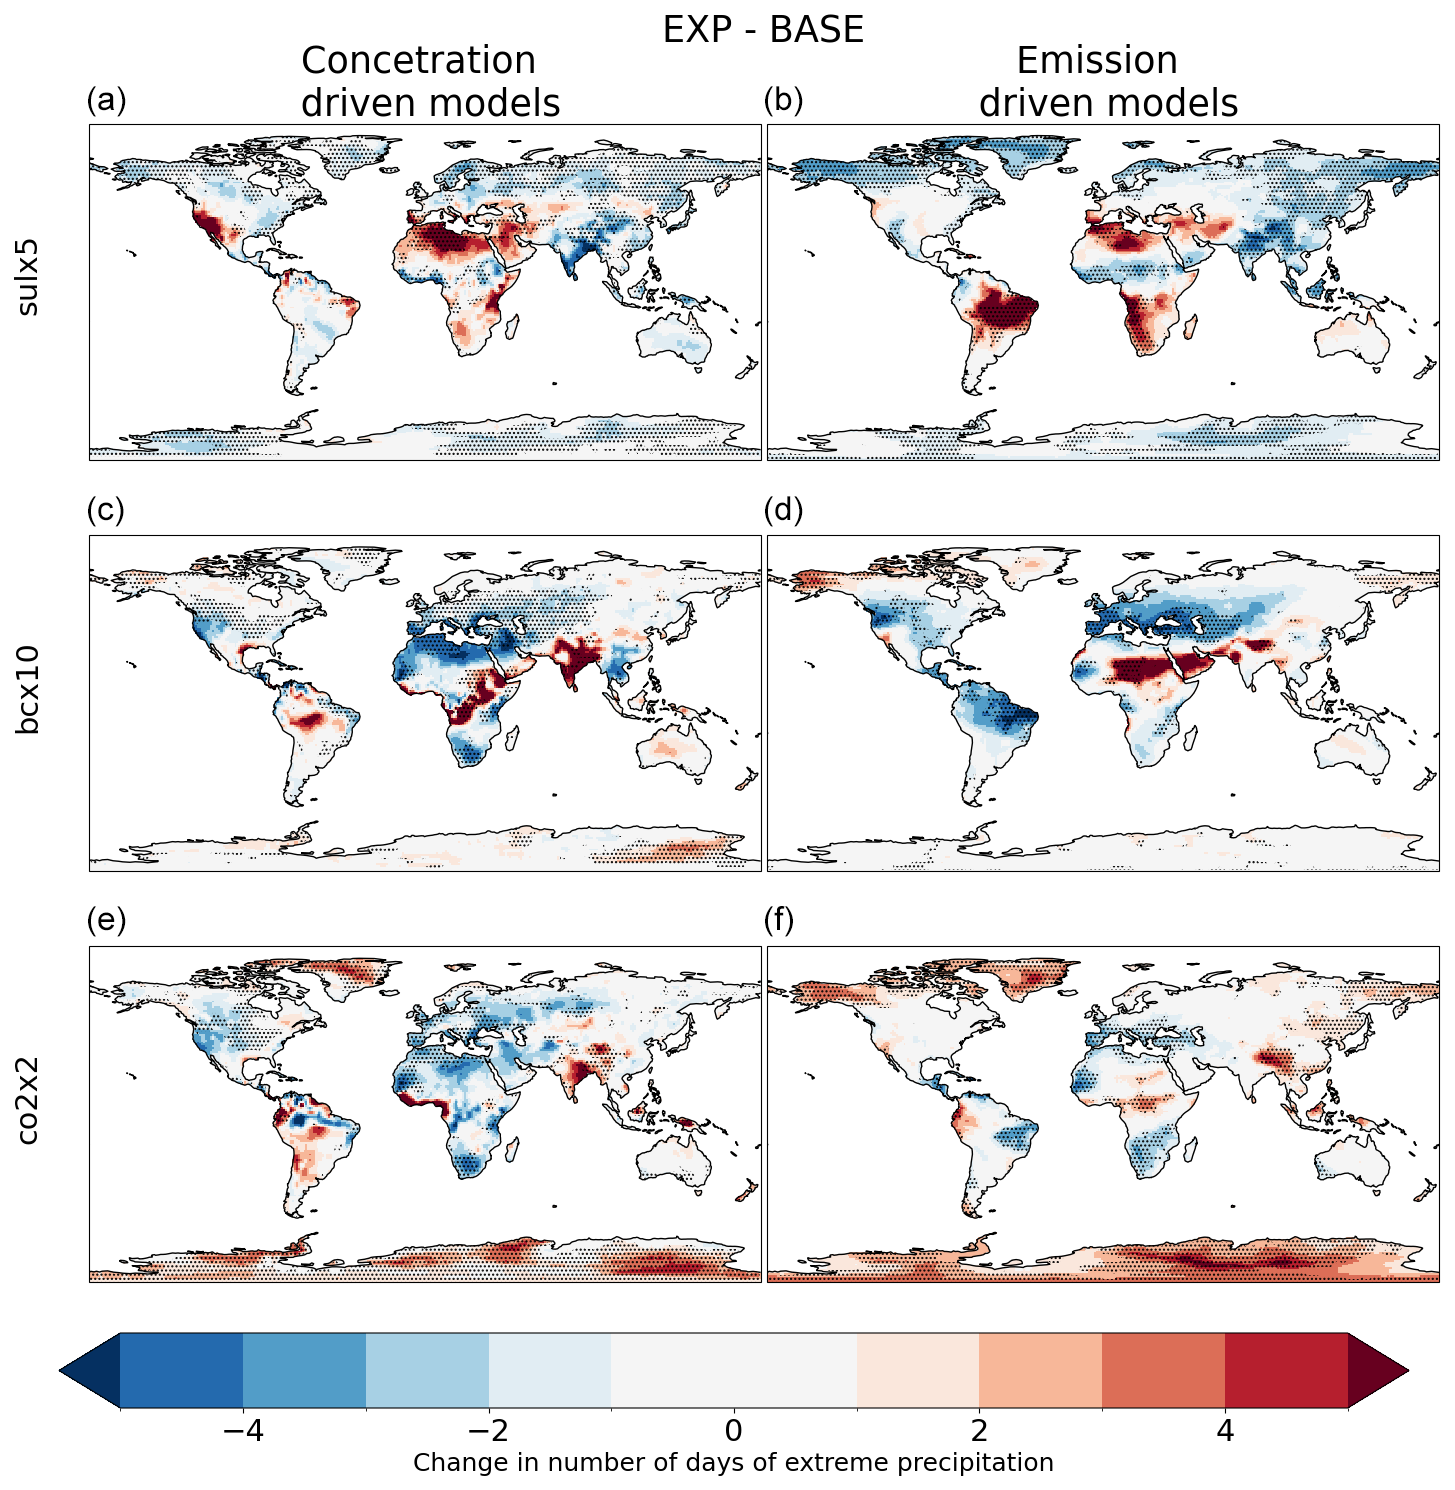
Figure 2Changes in the average number of days per year of extreme (0.90 quantile) precipitation due to global doubling of CO2 concentrations (CO × 2), a 5-fold increase in sulfate emissions (SUL × 5) and a 10-fold increase in black carbon (BC × 10) emissions as simulated by PDRMIP models. Panels (a), (c) and (e) show the results for concentration-driven models, and panels (b), (d) and (f) show the results for emission-driven models. Stippling indicates where all emission-driven or concentration-driven models agree on the sign of change.
The impact of aerosols differs from that of CO2. The climate response in SUL × 5 shows a similar pattern but of opposite sign to that of CO2, as expected since sulfate aerosols cool the climate while greenhouse gases warm it. For instance, HadGEM3 shows a decrease in precipitation extremes over Asia and sub-Saharan Africa and an increase over Europe, with all these signals being opposite to the response in the doubling of CO2. Additionally, all models simulate a decrease in the number of extreme days across the high latitudes in the NH. Figure A5 shows spatial distribution of change in the PDF SD. These SD differences are significant at a p level < 0.05 using the Kolmogorov–Smirnov test. The spatial correlation between the change in SD and the change in the number of extreme days for SUL × 5 varies from 0.42 to 0.61 (Fig. A5).
For BC × 10, the spatial correlation between changes in SD and changes in the number of extreme days is quite variable and ranges from 0.44 to 0.74 (Fig. A6). The results show a higher correlation between changes in SD and extremes for the aerosol simulations than for the CO2 × 2 experiment. This indicates that aerosols lead to a wider/narrower distribution and thus more days of extreme precipitation than the influence of CO2. Additionally, the effect of aerosols is highly regionally dependent, whereas the PDFs for a CO2 increase are getting wider over all regions.
3.2 Changes in extreme events under global warming
Changes in the probability of extreme precipitation events (> 99th percentile) due to global warming can be attributed to two primary factors: changes in the mean state and variability. The combined impact of these two contributing factors is depicted in Fig. 3, which illustrates how extreme precipitation events are evolving in response to global warming. The spatial pattern of these changes in extreme precipitation closely follows the overall pattern of annual precipitation changes, as discussed in IPCC (2021). In essence, regions that were already dry are experiencing increased in dryness, while areas with high climatological levels of precipitation are becoming even wetter (Feng and Zhang, 2015; Xiong et al., 2022). To provide a more detailed understanding of the total changes highlighted in Fig. 3, one can decompose these changes into two components: changes in variability (as shown in Fig. 4) and changes in the mean state (as shown in Fig. 5).
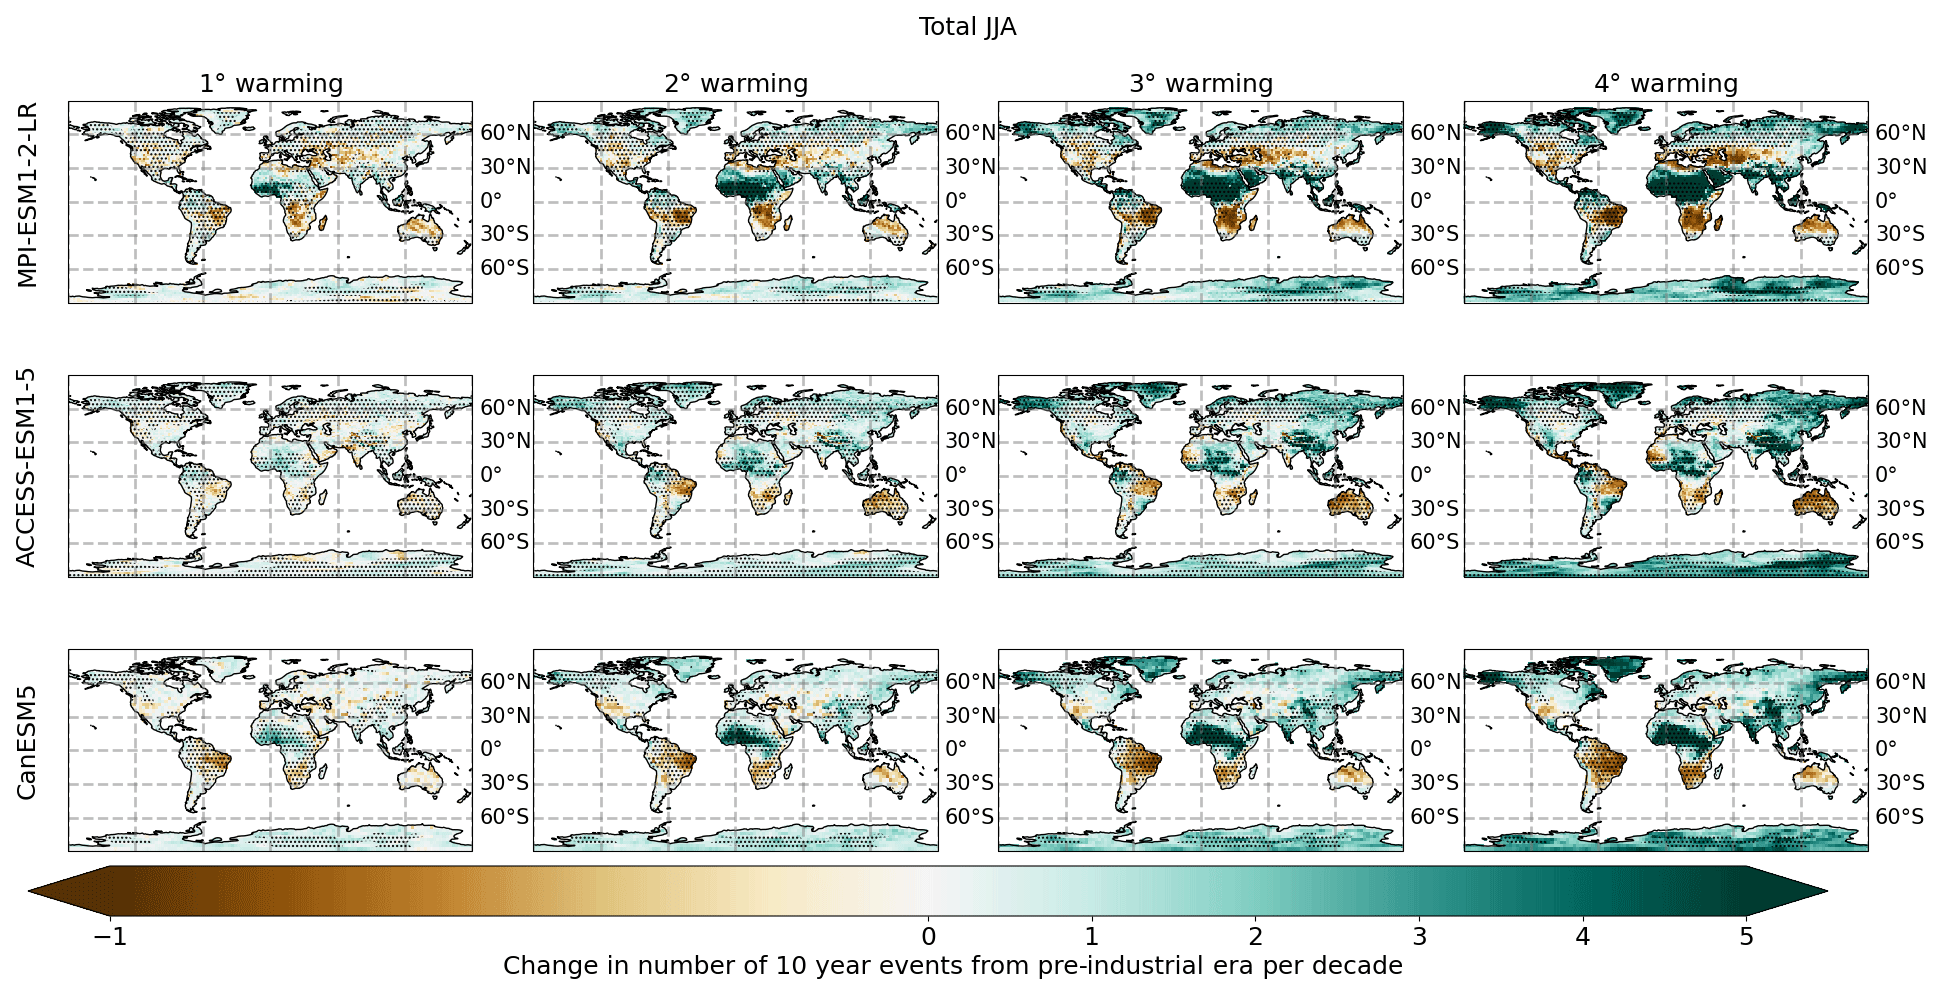
Figure 3Total change in the number of days of intense precipitation events during JJA under different global warming levels. Stippling indicates regions where changes in PDFs are significant at p > 0.05.
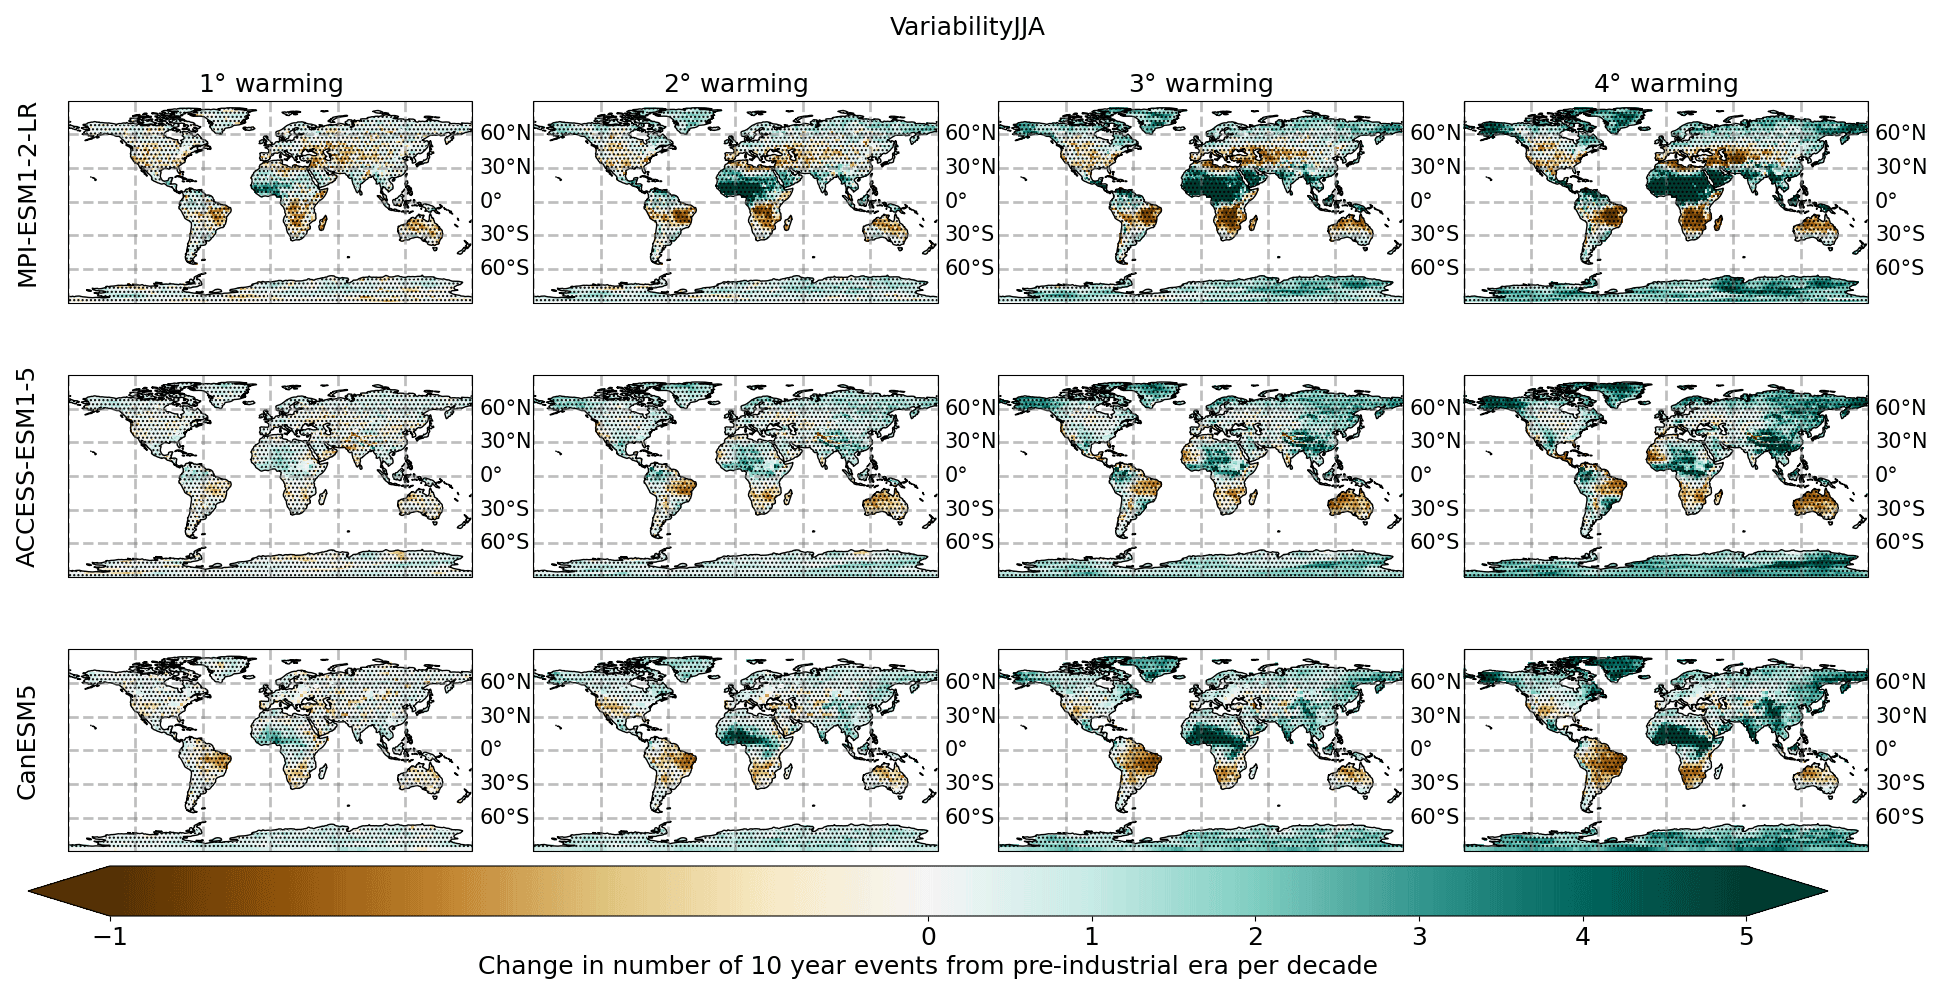
Figure 4Changes in the number of days of intense JJA precipitation events due to changes in variability under different global warming levels. Stippling indicates regions where changes in PDFs are significant at p > 0.05.
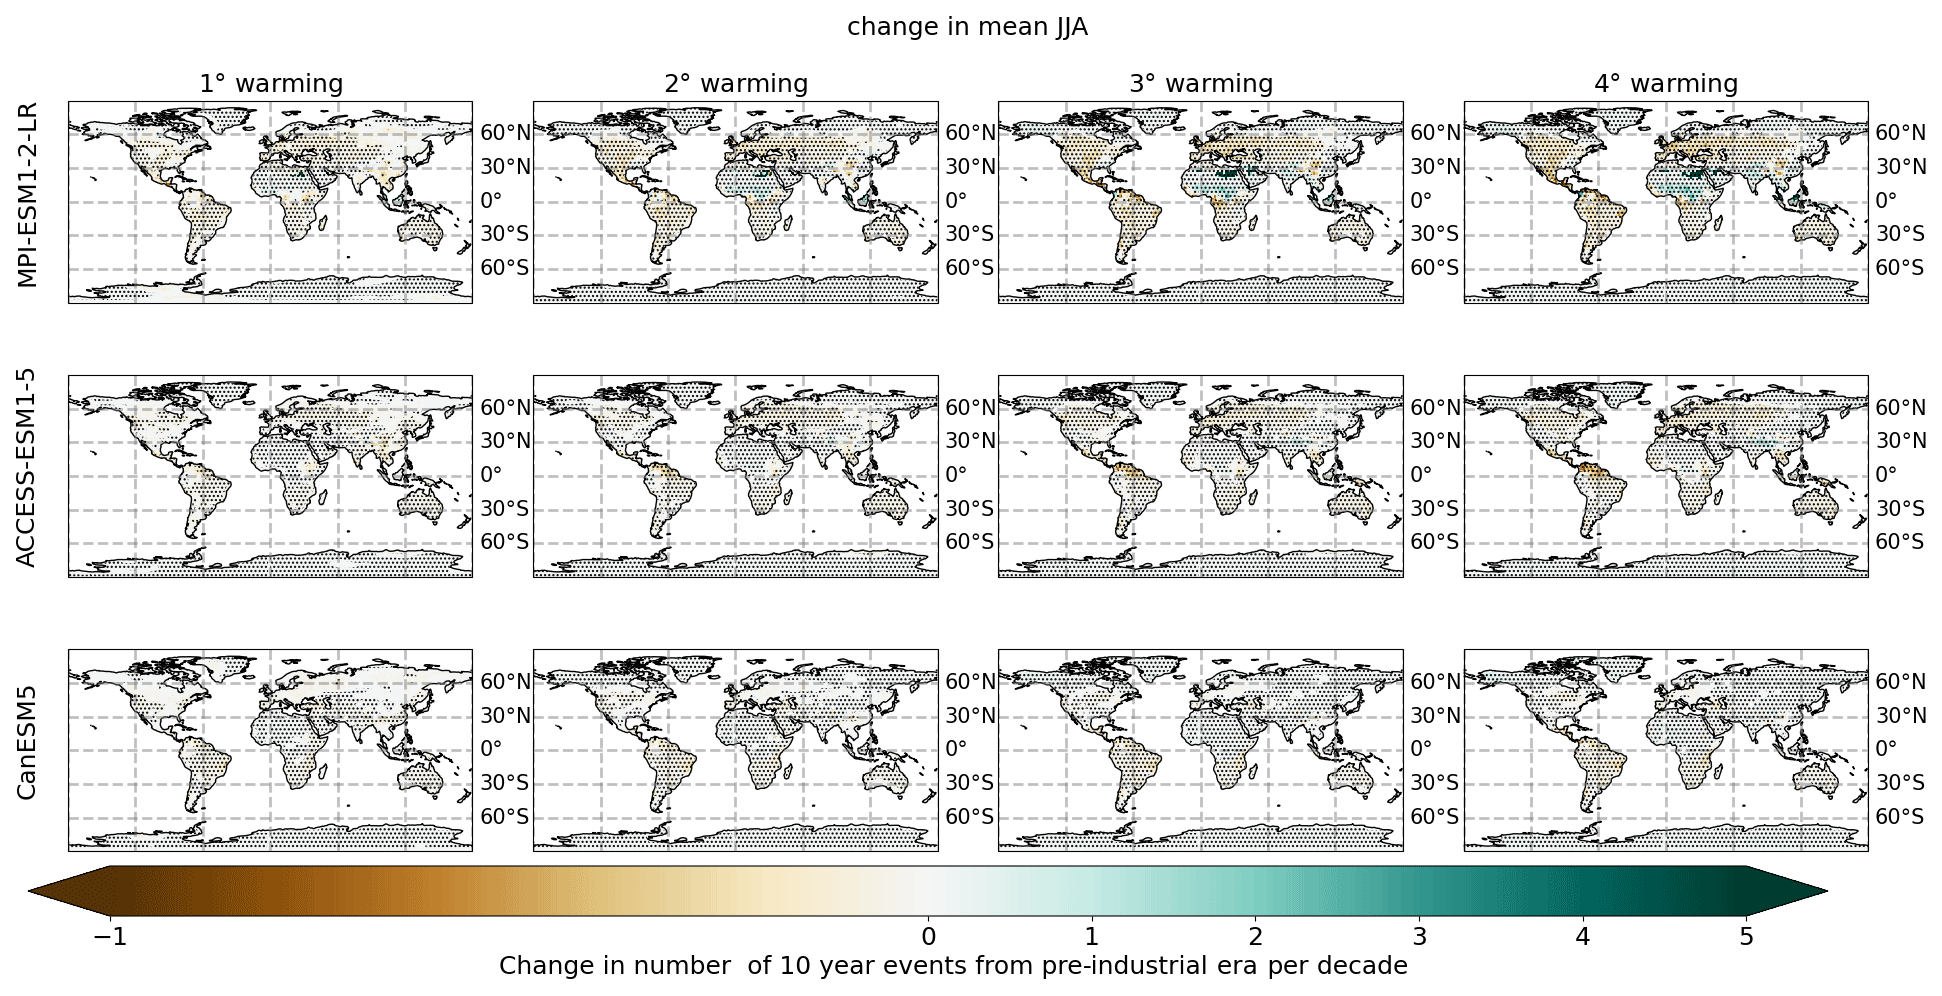
Figure 5Changes in the number of extreme JJA precipitation events due to changes in the mean under different global warming levels. Stippling indicates regions where changes in PDFs are significant at p > 0.05.
Figure 4 shows how changes in precipitation variability are changing the likelihood of extreme precipitation events, defined as those events that occur more than once every decade in the pre-industrial era. This phenomenon is observed globally, with an overall increase in the number of such extreme events in most regions. However, there are notable exceptions: in regions like the Amazon basin, southern Africa and Australia, there is a slight decrease in extreme precipitation events during the NH summer months. Already, a 1° change in global warming shows a significant increase in the likelihood of extreme precipitation, especially over the Sahel region, as simulated by MPI-ESM1-2-LR and CanESM5.
While there is broad agreement among the models about the increase in extreme precipitation, particularly in Asia, there are differences in the exact location of these changes. The most significant changes in extreme summer precipitation due to variability are seen in three main regions: Southeast Asia and South Asia, sub-Saharan Africa, and the Arctic region. Each of these areas shows a distinct pattern in the increase of extreme precipitation events, underscoring the diverse impacts of changing precipitation variability across different parts of the world.

Figure 6Decomposition of regional changes in JJA precipitation and daily maximum temperature extremes into changes in the mean and changes in variability under four warming levels (columns). The figure shows the mean of three models, and hatching indicates regions where all three models do not agree. Orange colors indicate regions where the changes in the mean dominate changes in the extremes, and purple colors indicate regions where variability dominates.
Changes in precipitation patterns can also be influenced by shifts in the mean state of precipitation driven by global warming. Figure 5 provides an overview of how shifts in the mean state affect the number of extreme precipitation days, although those changes are not as large as those resulting from shifts in variability. A consistent increase in dry days can be seen over southern Europe and, to a large extent, North America (Fig. 5). Figure 6 shows whether changes in the mean state (shown in brown) or variability (shown in purple) are the dominant factors influencing the overall change in extreme precipitation events. The relative importance of change in the mean state and change in variability is defined by . All three models agree on the spatial pattern of changes in variability.
The behavior of daily maximum temperature during summer is quite different from that of daily precipitation (Fig. 6). While changes in daily precipitation are primarily driven by changes in variability, daily maximum temperatures are predominantly influenced by changes in their mean state. On a global scale, all regions experience an increase in extreme daily maximum temperatures due to shifts in the average daily maximum temperature. In a 4° warmer world, the daily maximum temperature distributions in almost every region are shifted outside pre-industrial ranges. However, there is some variability among climate models regarding spatial patterns of the increase in daily maximum temperatures. For instance, only the ACCESS-ESM1-5 model predicts that all summer days in Alaska will surpass rarely observed (0.999 quantile) pre-industrial temperatures in a 4° warmer world (see Fig. A7).
3.3 Different climate drivers in the near future
In the near future, the Earth's climate will be influenced by different anthropogenic drivers depending on different future emission scenarios and associated emission reductions. Above, we have shown the influence of different anthropogenic drivers on Earth's climate using idealized PDRMIP simulations (Sect. 3.1). It is not evident that different anthropogenic drivers have an effect on rare extreme events that occurred only once per decade during the pre-industrial period in the near-future SSP scenarios. However, when examining more frequent extreme events (events which occur once per year), differences between aerosol-driven changes and greenhouse gas-induced warming become evident. Figures C1, C2 and C3 show changes in the likelihood of these extremes in the near future under different SSP scenarios (particularly, SSP1-2.6, SSP2.4-5, SSP3-7.0 and SSP5-8.5) for all three models due to changes in variability. Similar to the changes in extremes under global warming, the most distinct near-future changes are seen in sub-Saharan Africa, where greenhouse gas emissions are expected to dominate. In contrast, most of the reduction in aerosol emissions is expected to occur over Asia in the future (Lund et al., 2019).
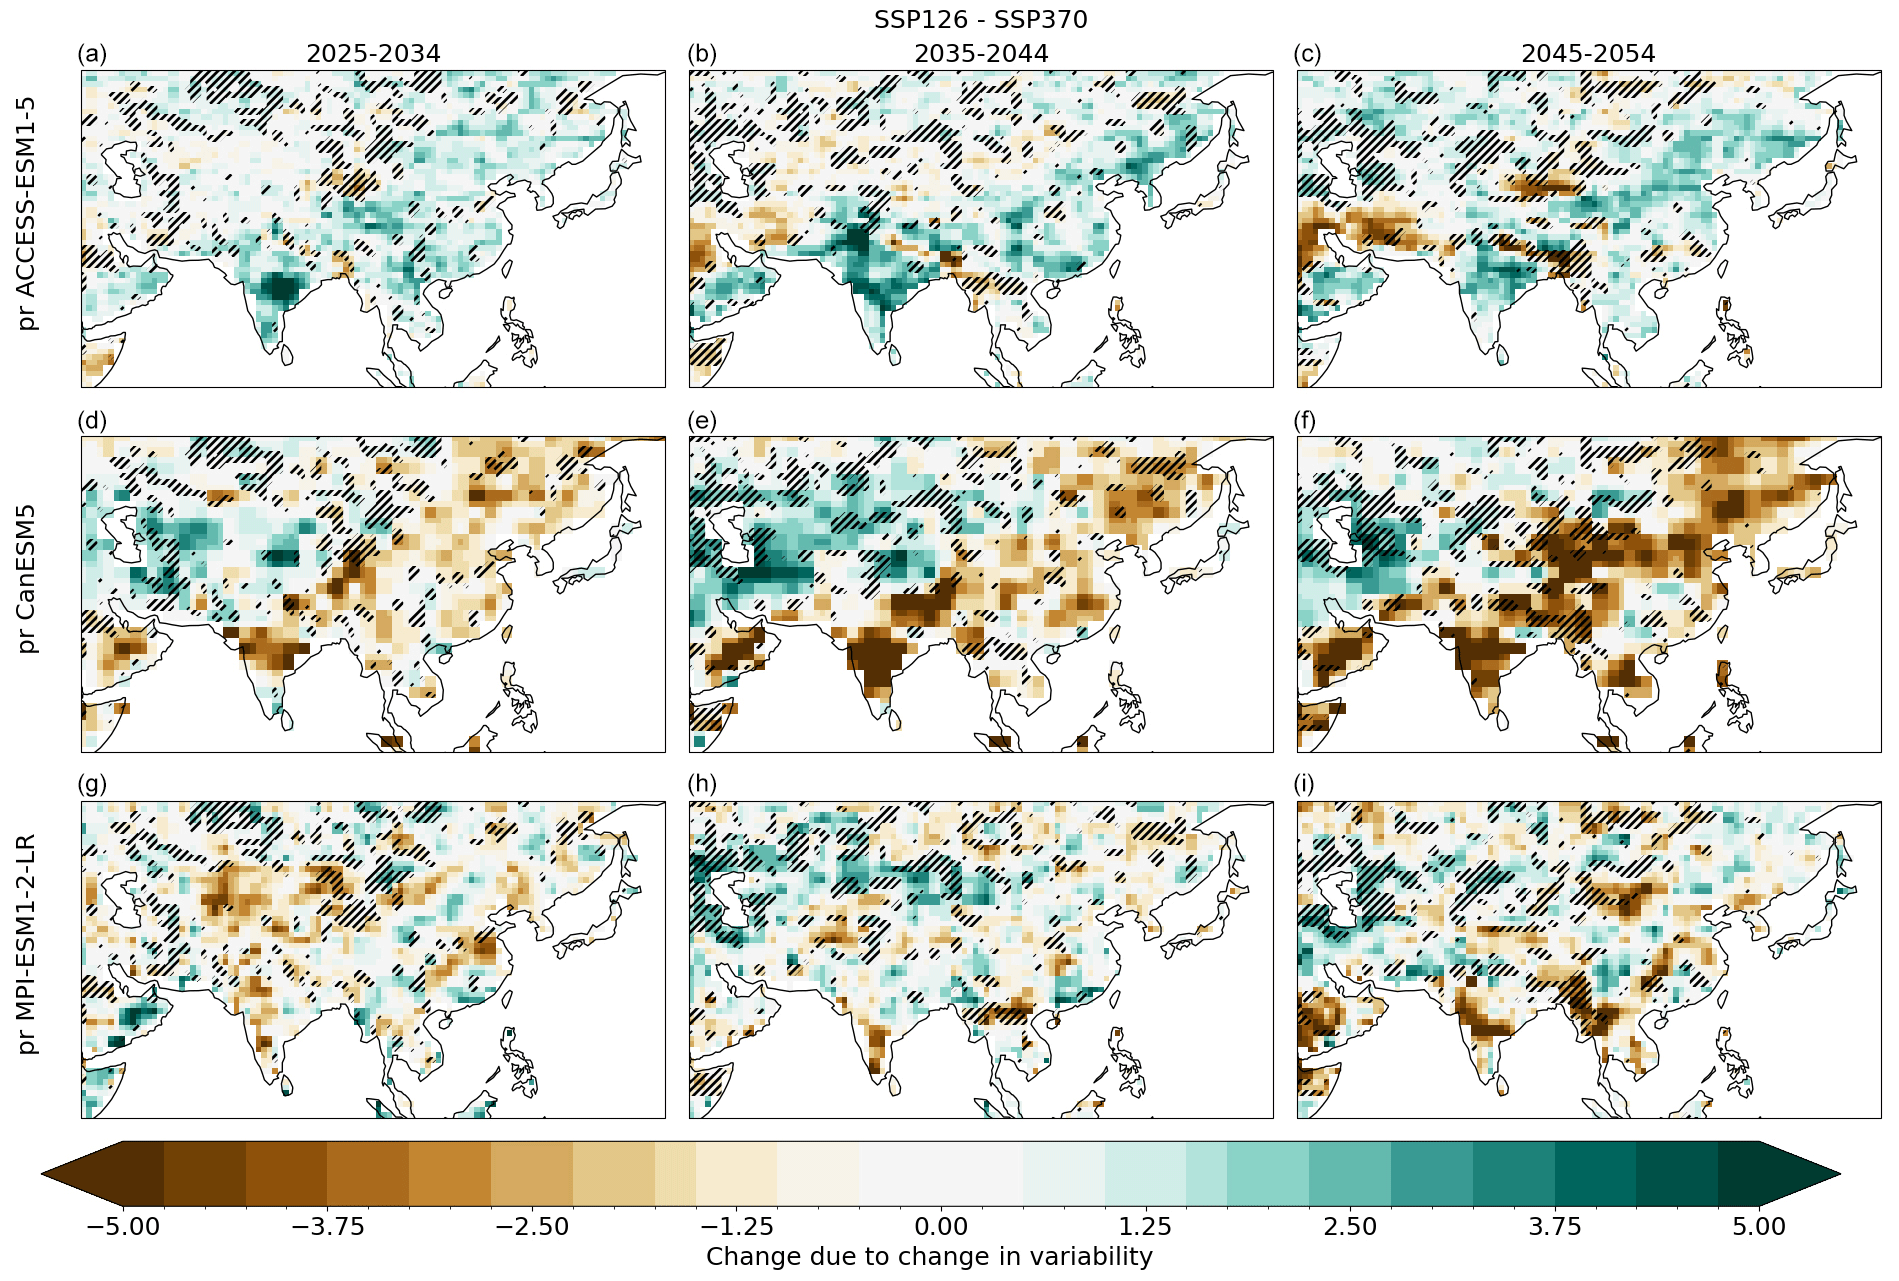
Figure 7Change in the likelihood of days of extreme JJA precipitation between SSP1-2.6 and SSP3-7.0 over Asia for three different models: ACCESS-ESM1-5 (a–c), CanESM5 (d–f) and MPI-ESM1-2-LR (g–i). Hatching indicates regions where all three models agree on the sign of the change.
We can estimate the effects of aerosols by subtracting the changes seen in SSP3-7.0 from SSP1-2.6, where the most drastic aerosol reductions occur over Southeast Asia and South Asia (Lund et al., 2019). While greenhouse gas emission and land use changes will also contribute, previous work has found this method to give a reasonable first approximation of the aerosol influence over the coming decades (Wilcox et al., 2020). Figure 7 shows the effect of aerosol emission reductions according to the SSP1-2.6 scenario for the three different climate models over Asia (for the global pattern see Fig. C4). There is no model agreement on the pattern or sign of change over most land regions. The CanESM5 model suggests that the increase in the likelihood of extreme precipitation events is continuously reduced in the near future in South Asia and East Asia regions with a continuous reduction in aerosol emissions. In contrast, MPI-ESM1-2-LR indicates a slight decrease in extreme weather events from 2025 to 2034, followed by an increase from 2035 to 2044 over the Tibetan Plateau. This would indicate that reducing aerosol emissions might make extreme weather more likely during this latter period. The ACCESS-ESM1-5 model shows the most prominent effect: a reduction of aerosol emissions leads to a clear rise in the chance of extreme rain or snow events between 2035 and 2044. This seems aligned with previous results which showed that anthropogenic aerosols suppress precipitation, including extreme precipitation, over Asia (Yang et al., 2022; Wilcox et al., 2020; Persad, 2023).
These model differences likely stem from differences in the implementation of aerosols as well as the model's sensitivity to greenhouse gases. MPI-ESM1-2-LR uses a simplified approach, namely the MACv2-SP parameterization (Stevens et al., 2017), to represent aerosols (black carbon and sulfate), which only accounts for the first indirect aerosol effect without considering more complex interactions. CanESM5 has a very high climate sensitivity (see Table 1), leading to greenhouse-gas-dominated responses even when aerosol emissions are reduced. CanESM5, further, has a high atmospheric absorption value due to black carbon which is likely masking part of the cooling effect due to sulfate aerosols (Fiedler et al., 2023). ACCESS-ESM1-5, on the other hand, employs the CLASSIC aerosol model (Ziehn et al., 2020; The HadGEM2 Development Team et al., 2011; Mackallah et al., 2022), which is a very detailed representation considering seven different aerosol types and including direct and indirect effects.
3.4 Model discrepancies
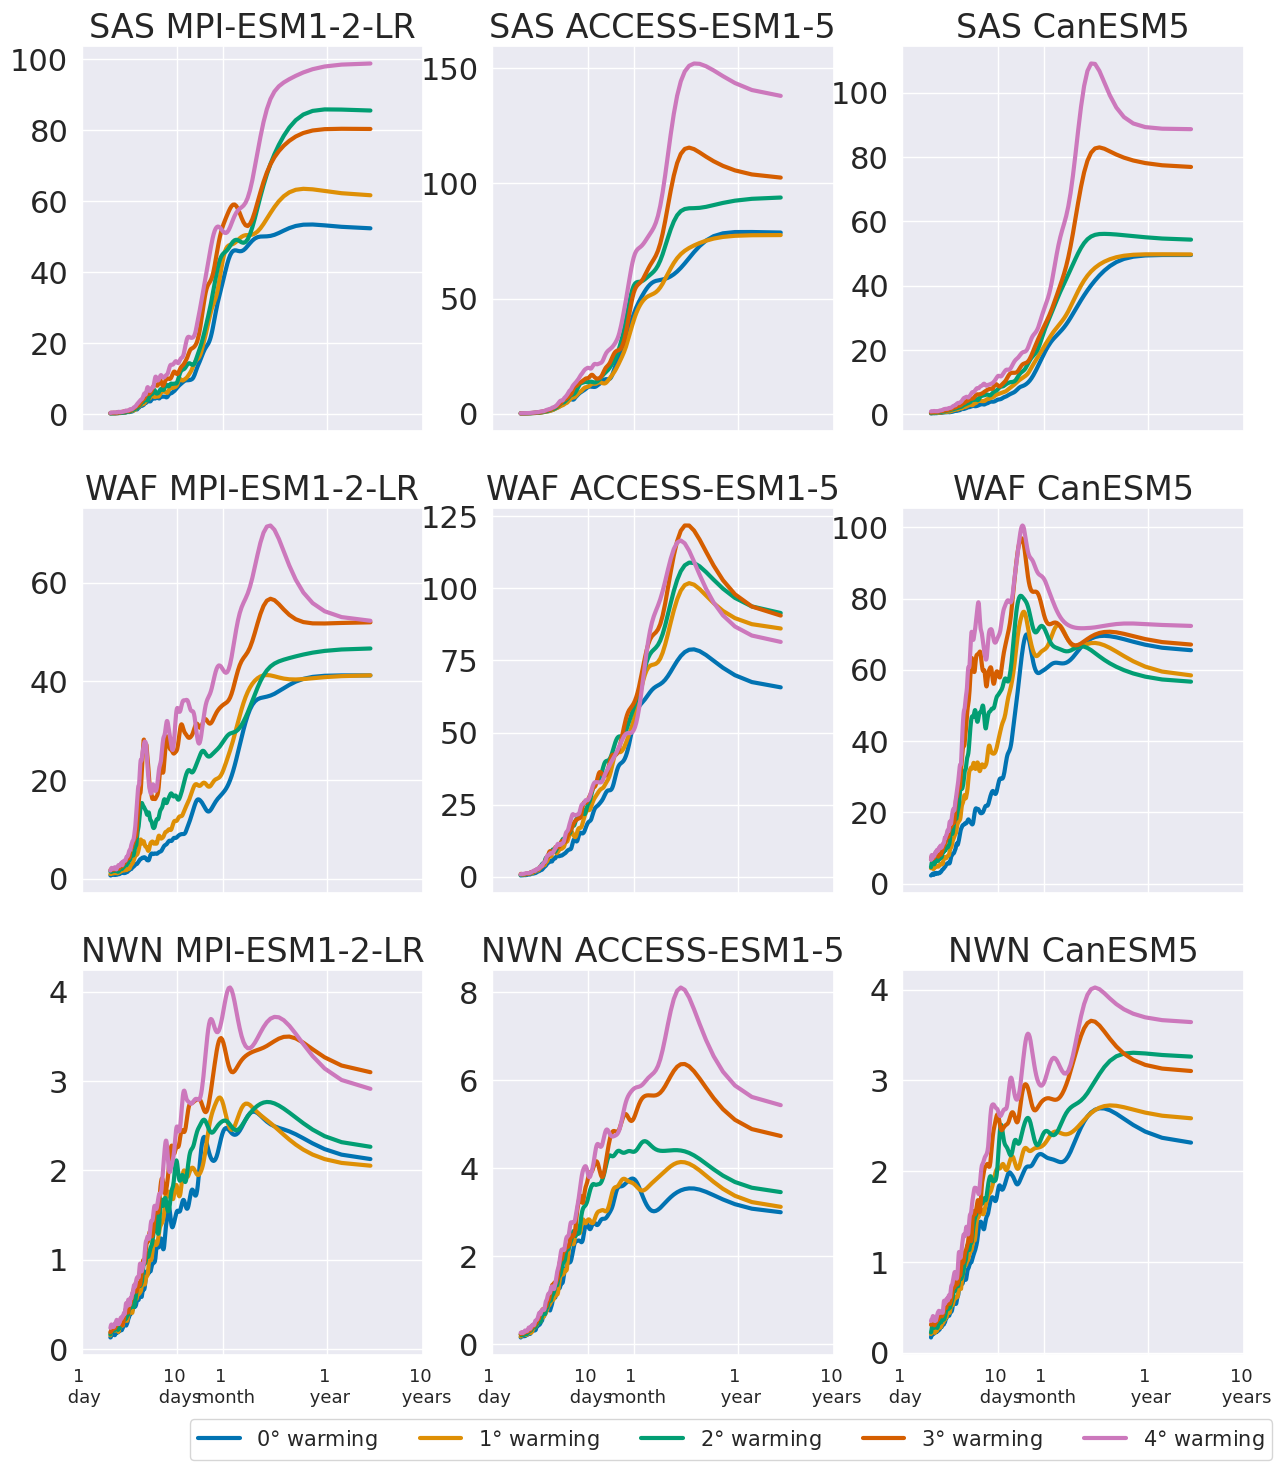
While all models used here show similar regional changes in the likelihood of summertime extreme precipitation, they have different underlying PDFs and associated impacts on the likelihood of extremes. Figure 8 shows regional mean PDFs for total changes in daily summertime precipitation for South Asia (SAS), Western Africa (WAF) and North-Western North America (NWN) (using the region definitions from the IPCC report; Iturbide et al., 2020). All these regions show a significant increase in the number of intense precipitation days due to changes in variability.
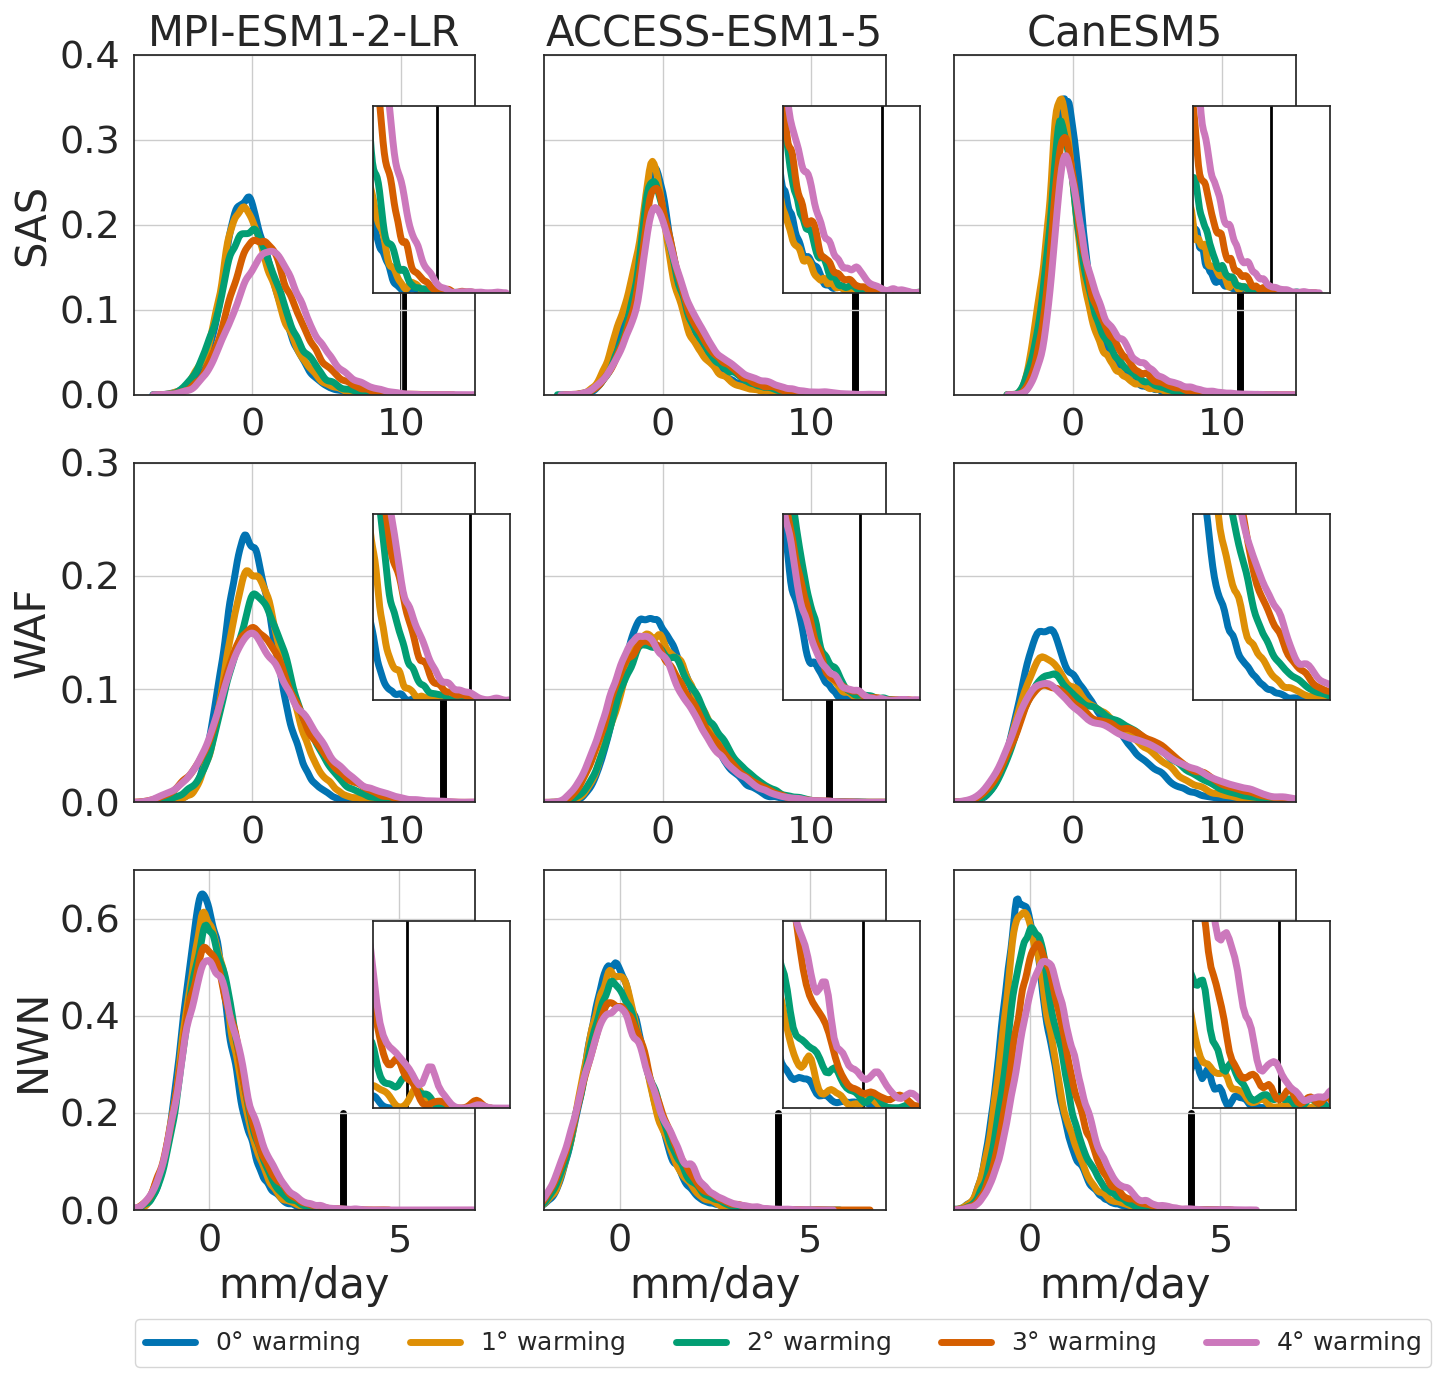
Figure 8PDFs of total changes in JJA precipitation over South Asia (SAS), Western Africa (WAF) and North-Western North America (NWN) under different global warming levels for all three models. Inserts show the upper tail of the distributions, and the black horizontal line indicates the 0.999 quantile threshold.
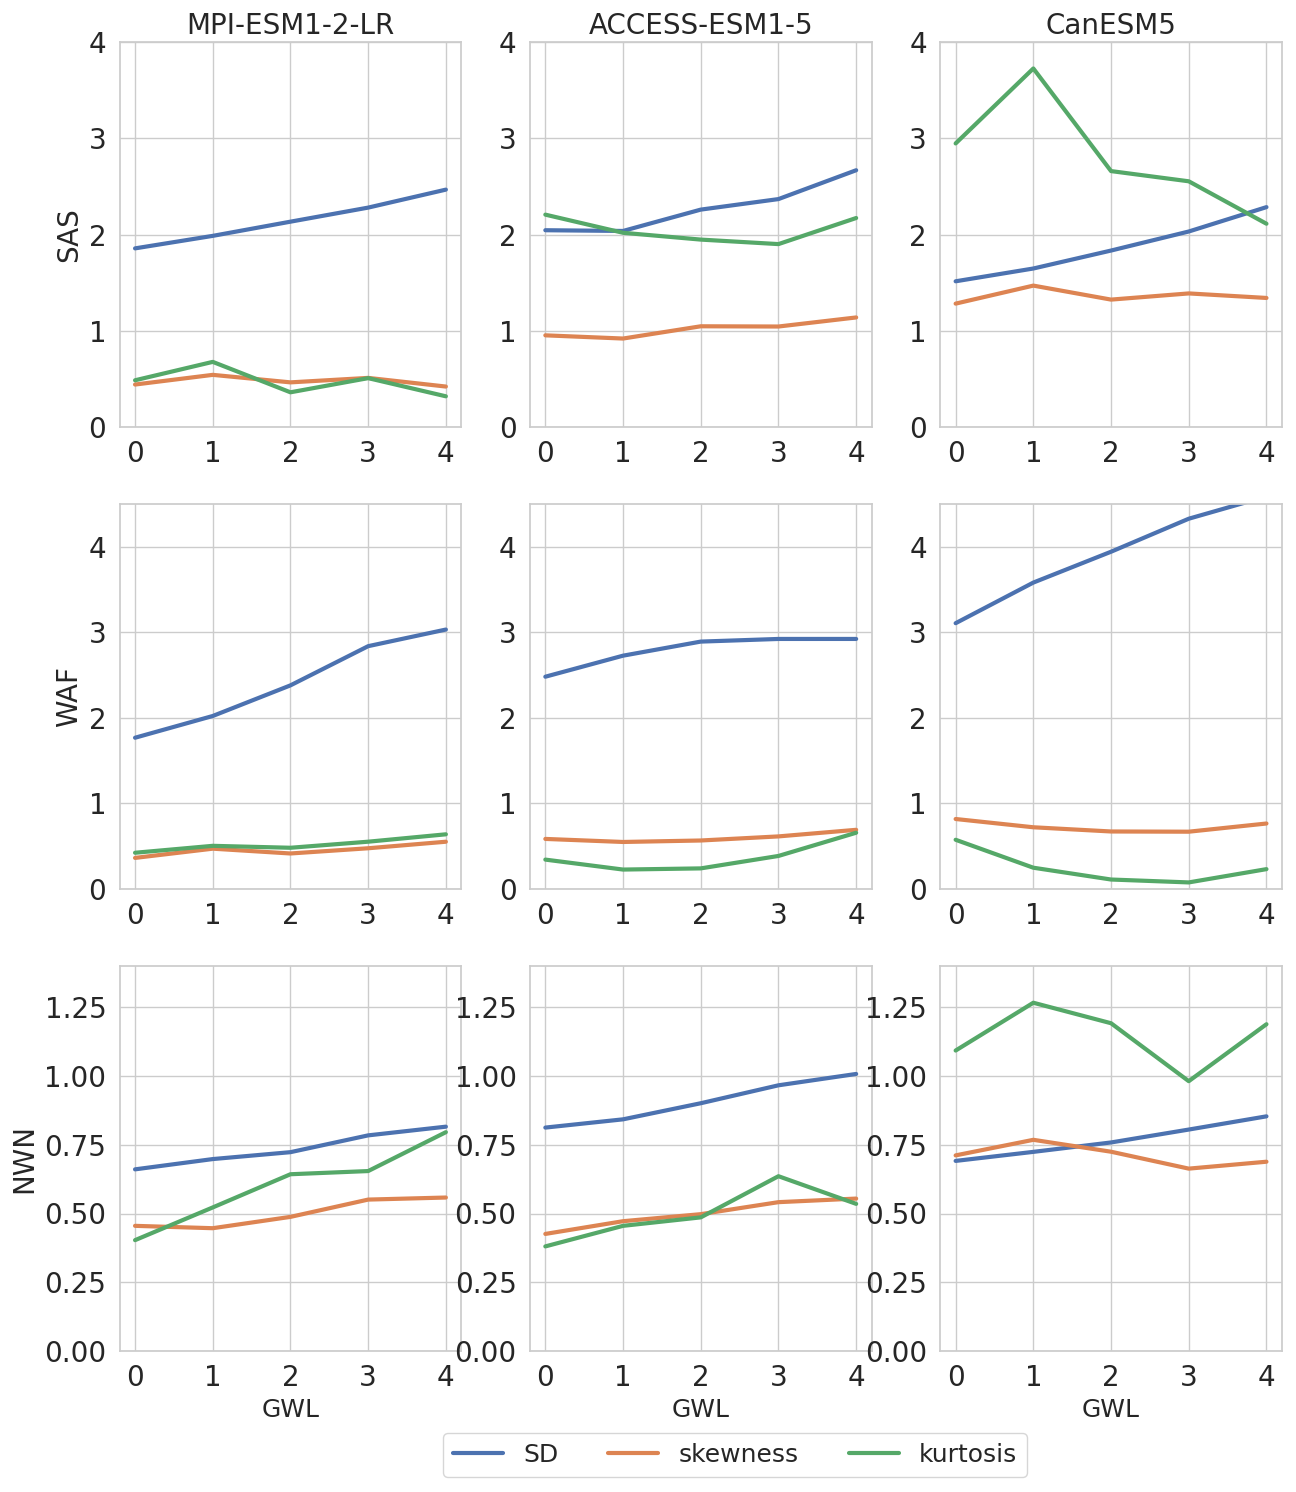
For SAS, the underlying PDFs are quite different between the individual models. The most prominent difference relates to changes in the kurtosis (Fig. D1). ACCESS-ESM1-5 and CanESM5 show higher kurtosis values than MPI-ESM1-2-LR. CanESM5 is the only model that shows decreasing kurtosis with global warming. Nonetheless, all models show a similar widening of the distributions with global warming.
Over the WAF region, all three models exhibit a similar evolution in skewness. With global warming, the MPI-ESM1-2-LR and CanESM5 distributions are getting wider, indicating an increase in daily variability and an associated increase in extremes at both ends. CanESM5's evolution in standard deviation plateaus after two degrees of global warming. While CanESM5 shows a widening of the PDF, similar to the other two models, it also shows a clear change in the mean of the distribution. As a result, the likelihood of extreme values primarily increases at the high end of the tails. The most prominent discrepancy between the models is in the evolution of kurtosis, where it shows an increasing trend in MPI-ESM1-2-LR and ACCESS-ESM1-5 but decreasing trend in CanESM5.
Over NWN, all three models exhibit similar PDF shapes (while the distributions are statistically different). However, the model responses diverge regarding the PDF evolution under global warming. CanESM5 shows a change in the mean and little change in the width, whereas ACCESS-ESM1-5 and MPI-ESM1-2-LR changes are mostly in width and shape. Despite these discrepancies in underlying PDFs, all three models show a robust increase in summertime variability under global warming, which leads to an increased likelihood of extreme precipitation in the Arctic, Asia and Africa.
The next question is about which change dominates the overall changes: does the change in the SD or the skewness dominate? Figure 9 shows how these two measures change in the three different regions (WAF, NWN and SAS) and for the different models, as well as how this relates to the change in the likelihood of extreme days. Each marker in Fig. 9 represents one grid point. For CanESM5 most of the changes are due to changes in the skewness (shape of the PDF), and the underlying PDFs are even getting narrower. Both ACCESS-ESM1-5 and MPI-ESM1-2-LR show an increase of SD together with an increase in skewness.
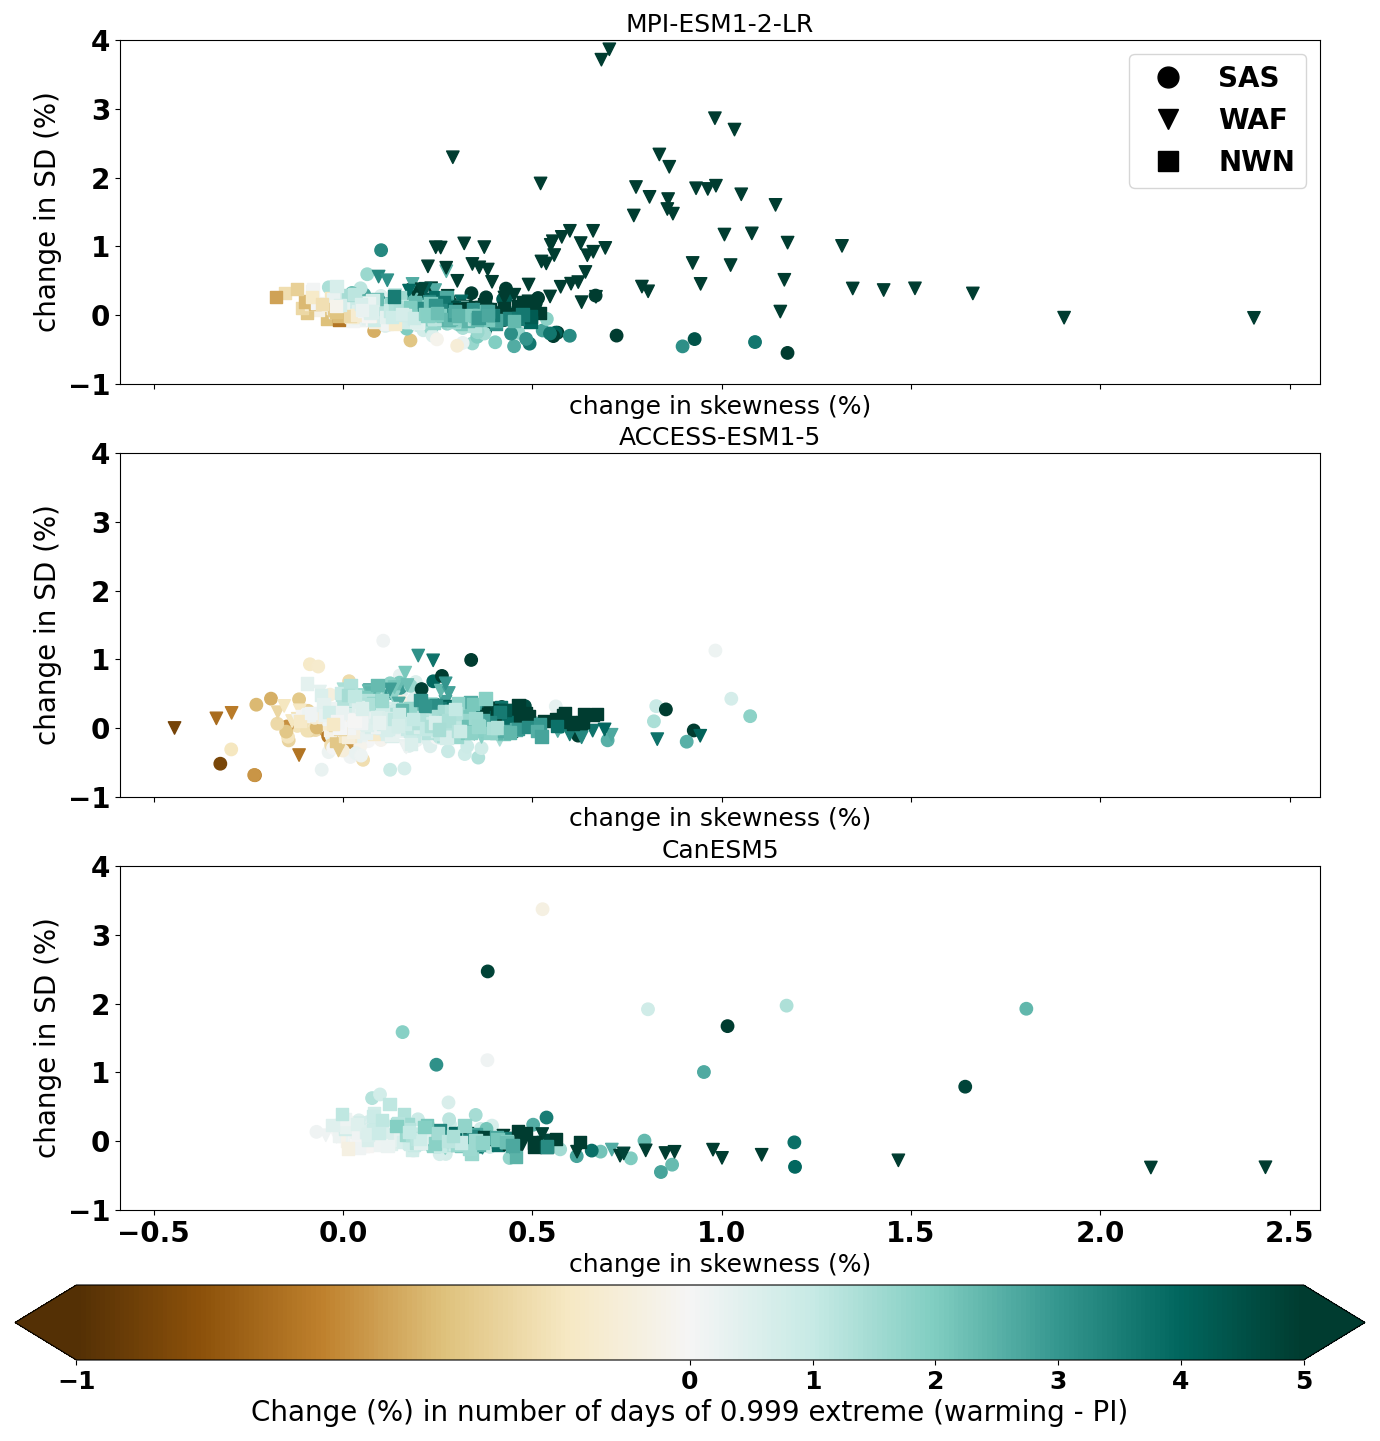
Figure 9Regional changes in the SD and skewness for extreme JJA precipitation events are shown for SAS, WAF and NWN for each of the three models. Each marker in the figure represents one grid point.
Another interesting aspect is the regional dependence of the relative roles of changes in SD versus skewness. Here, we find that each region and model behaves differently. Over WAF, MPI shows large changes in both skewness and SD, whereas CanESM5 shows small changes in SD over WAF. Interestingly, CanESM5 shows the largest change in SD over SAS. These findings highlight that each region responds differently to global warming and that there is significant model uncertainty regarding how variability changes.
What physical mechanisms drive the changes in variability, and what is the relationship between different mechanisms and changes in SD and skewness? We calculated power spectral densities for each region for all three models to evaluate the dependence on different timescales (Fig. D2). Zhang et al. (2021) performed a moisture budget analysis on a parameter perturbed ensemble of the HadGEM3-GC3.05 model. Compared to initial-condition ensembles, this also samples the uncertainty from the model uncertainty space, whereas SMILEs only sample uncertainty from climate internal variability. Their moisture budget analysis reveals that changes in variability are driven by changes in vertical moisture advection and thermodynamics. Similar conclusions are drawn by Zhang et al. (2024) using the observed increase in precipitation variability in ERA5. On longer timescales there might be a link to ENSO variability suggested by Kohyama and Hartmann (2017).
Most regions where changes in the mean dominate the summertime precipitation variations are located in the SH. The influence of seasons plays a significant role in this hemispheric asymmetry. Figures B1–B4 illustrate similar results for the NH during NH winter (DJF). Some of the observed changes are related to seasonal shifts. For example, there is an increase in intense precipitation due to changes in variability during DJF, while the number of these days decreases in JAS in South America (excluding the Amazon region) and southern Africa. In Southeast Asia similarly, the number of intense precipitation events decreases due to changes in variability. However, only the MPI-ESM1-2-LR model shows that changes in the mean dominate future changes in wintertime intense precipitation over Southeast Asia.
Some extreme attribution studies follow the method from Philip et al. (2020), which assumes that the shape of the distribution stays constant. However, we find that this assumption cannot be made in a future climate, although the exact distribution changes remain uncertain due to large discrepancies between CMIP6 models. Nonetheless, our findings highlight the importance of including daily variability in climate change impact and attribution studies. While we find a small or no change in the summertime mean precipitation, a clear increase in the number of extreme precipitation days is evident. Therefore, impact studies which only concentrate on the mean climate would inevitably underestimate the effects of extreme events.
This is further applicable to, for instance, the development of statistical emulators. Most emulators only consider global-mean temperature or precipitation effects or apply simple linear scaling (Nath et al., 2022; Watson-Parris et al., 2021). Based on the findings from this study, we recommend that the training of emulators should include training with daily weather variability to capture the complete climate change impacts. Furthermore, more work is needed so that emulators and simple climate models can fully simulate the effects of different climate drivers, as already highlighted by Persad et al. (2023). For future applications, it is relevant to know how well current ESMs can replicate observed daily climate variability. Lund et al. (2023) shows that the MPI-ESM1-2-LR and CanESM5 models capture the mean present-day precipitation rates well. However, evaluating the accuracy of climate models in predicting present-day extreme events is challenging due to sparse observational data. With only three rare extreme events recorded (based on our definition), the limited dataset hampers robust model validation, leading to uncertainty in the model's ability to reliably reproduce such rare but impactful occurrences. As different models show different kinds of underlying distributions, the limitation of this study is the small number of ESM ensembles used.
Although our findings primarily focus on the impact of climate change on wet extremes, it is essential to note that changes in both mean and variability can enhance or reduce the occurrence of dry extreme events as well. When examining total changes occurring due to changes in the variability and mean, we found that changes in the mean reduce the likelihood of dry extremes while changes in variability exacerbate changes in wet extremes. This finding underlines that it is crucial to recognize that although changes in climate variability can influence the frequency of extreme events, these effects may be offset by shifts in the mean climatic conditions for dry extremes.
This study investigates the role of changes in mean and variability separately on daily summertime precipitation and maximum temperature for three different large-ensemble CMIP6 models. We focus on changes under four different global warming levels (1–4 °C) as well as changes in the near future driven by different anthropogenic drivers (specifically anthropogenic aerosols and greenhouse gases).
Our main findings are listed below.
-
Changes in daily variability are the main drivers of changes in the likelihood of extreme summertime precipitation. In contrast, the change in the mean state is the primary driver of changes in temperature.
-
Three key regions, namely Asia, the Arctic and sub-Saharan Africa, show that changes in the width and shape of the PDFs are particularly relevant in influencing summertime precipitation.
-
In the near future, aerosol emission reductions are likely to increase the likelihood of extreme summertime precipitation over Asia.
-
Model discrepancies dominate estimates of the impact of different climate drivers in the near future.
We find that aerosol emissions play a key role in the near-future evolution of regional precipitation extremes due to the ongoing reduction of anthropogenic aerosol emissions and their strong influence on daily precipitation variability. This would suggest that simple aerosol representations, as implemented in the MPI-ESM1-2-LR model, lead to an underestimation of aerosol impacts compared to models with more advanced aerosol schemes, like in ACCESS-ESM1-5. Still, large uncertainty remains on how regional PDFs of precipitation will change (shape and width) in the future under different emission pathways. Global warming will lead to more extreme precipitation in many regions. How the near-term mix of anthropogenic and natural drivers will influence the width and shape of the distributions of daily weather, however, is still a relevant topic for future research.
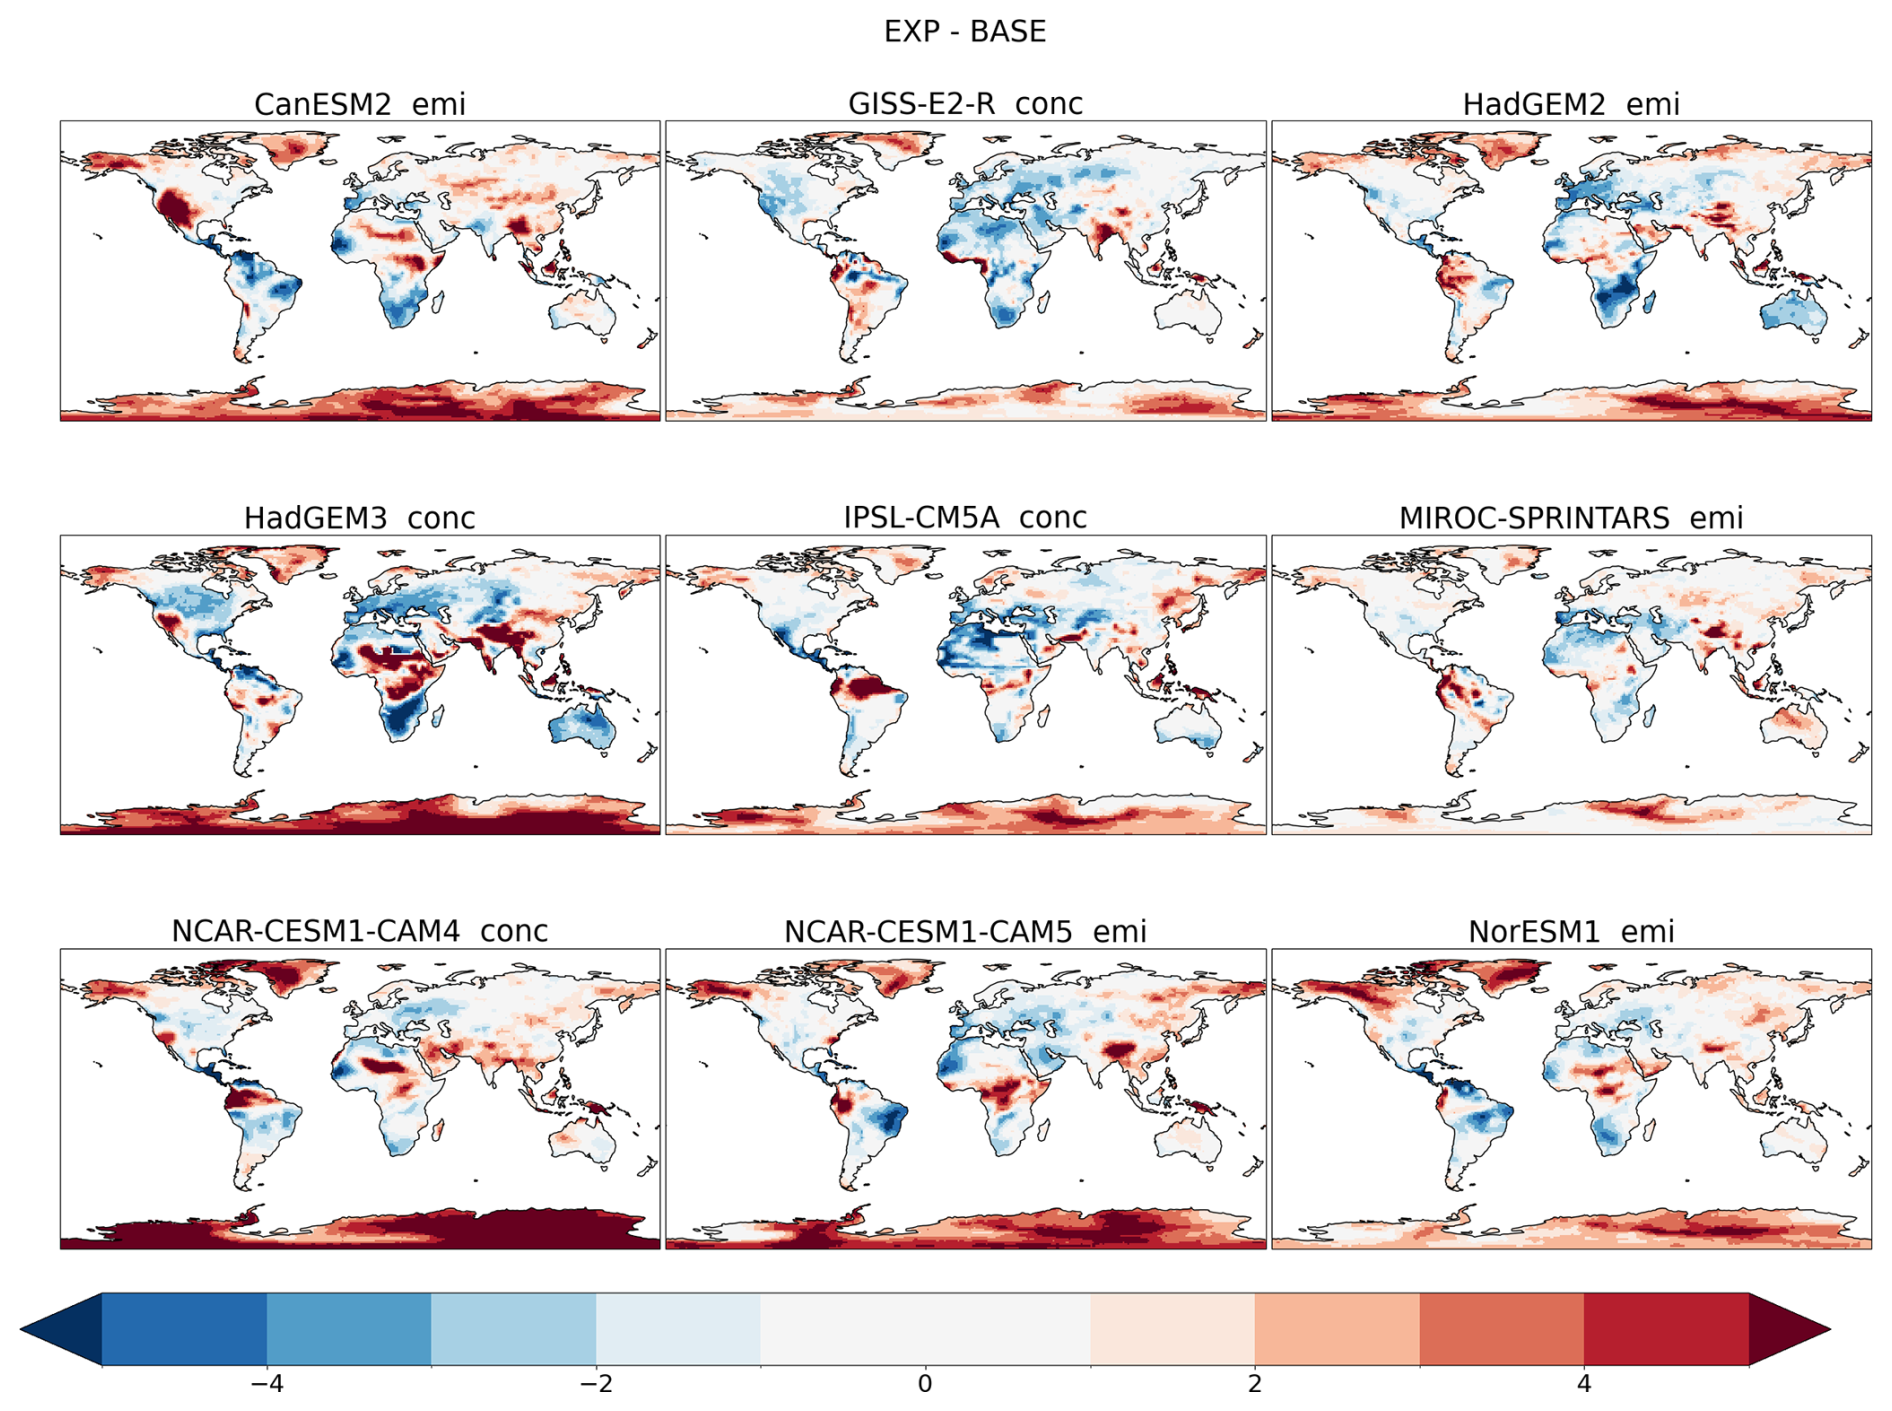
Figure A1Changes in the average number of days per year of extreme (0.90 quantile) precipitation due to the global doubling of CO2 concentrations as simulated by nine different PDRMIP models. Panel titles indicate if a model is emission-driven (emi) or concentration-driven (conc).
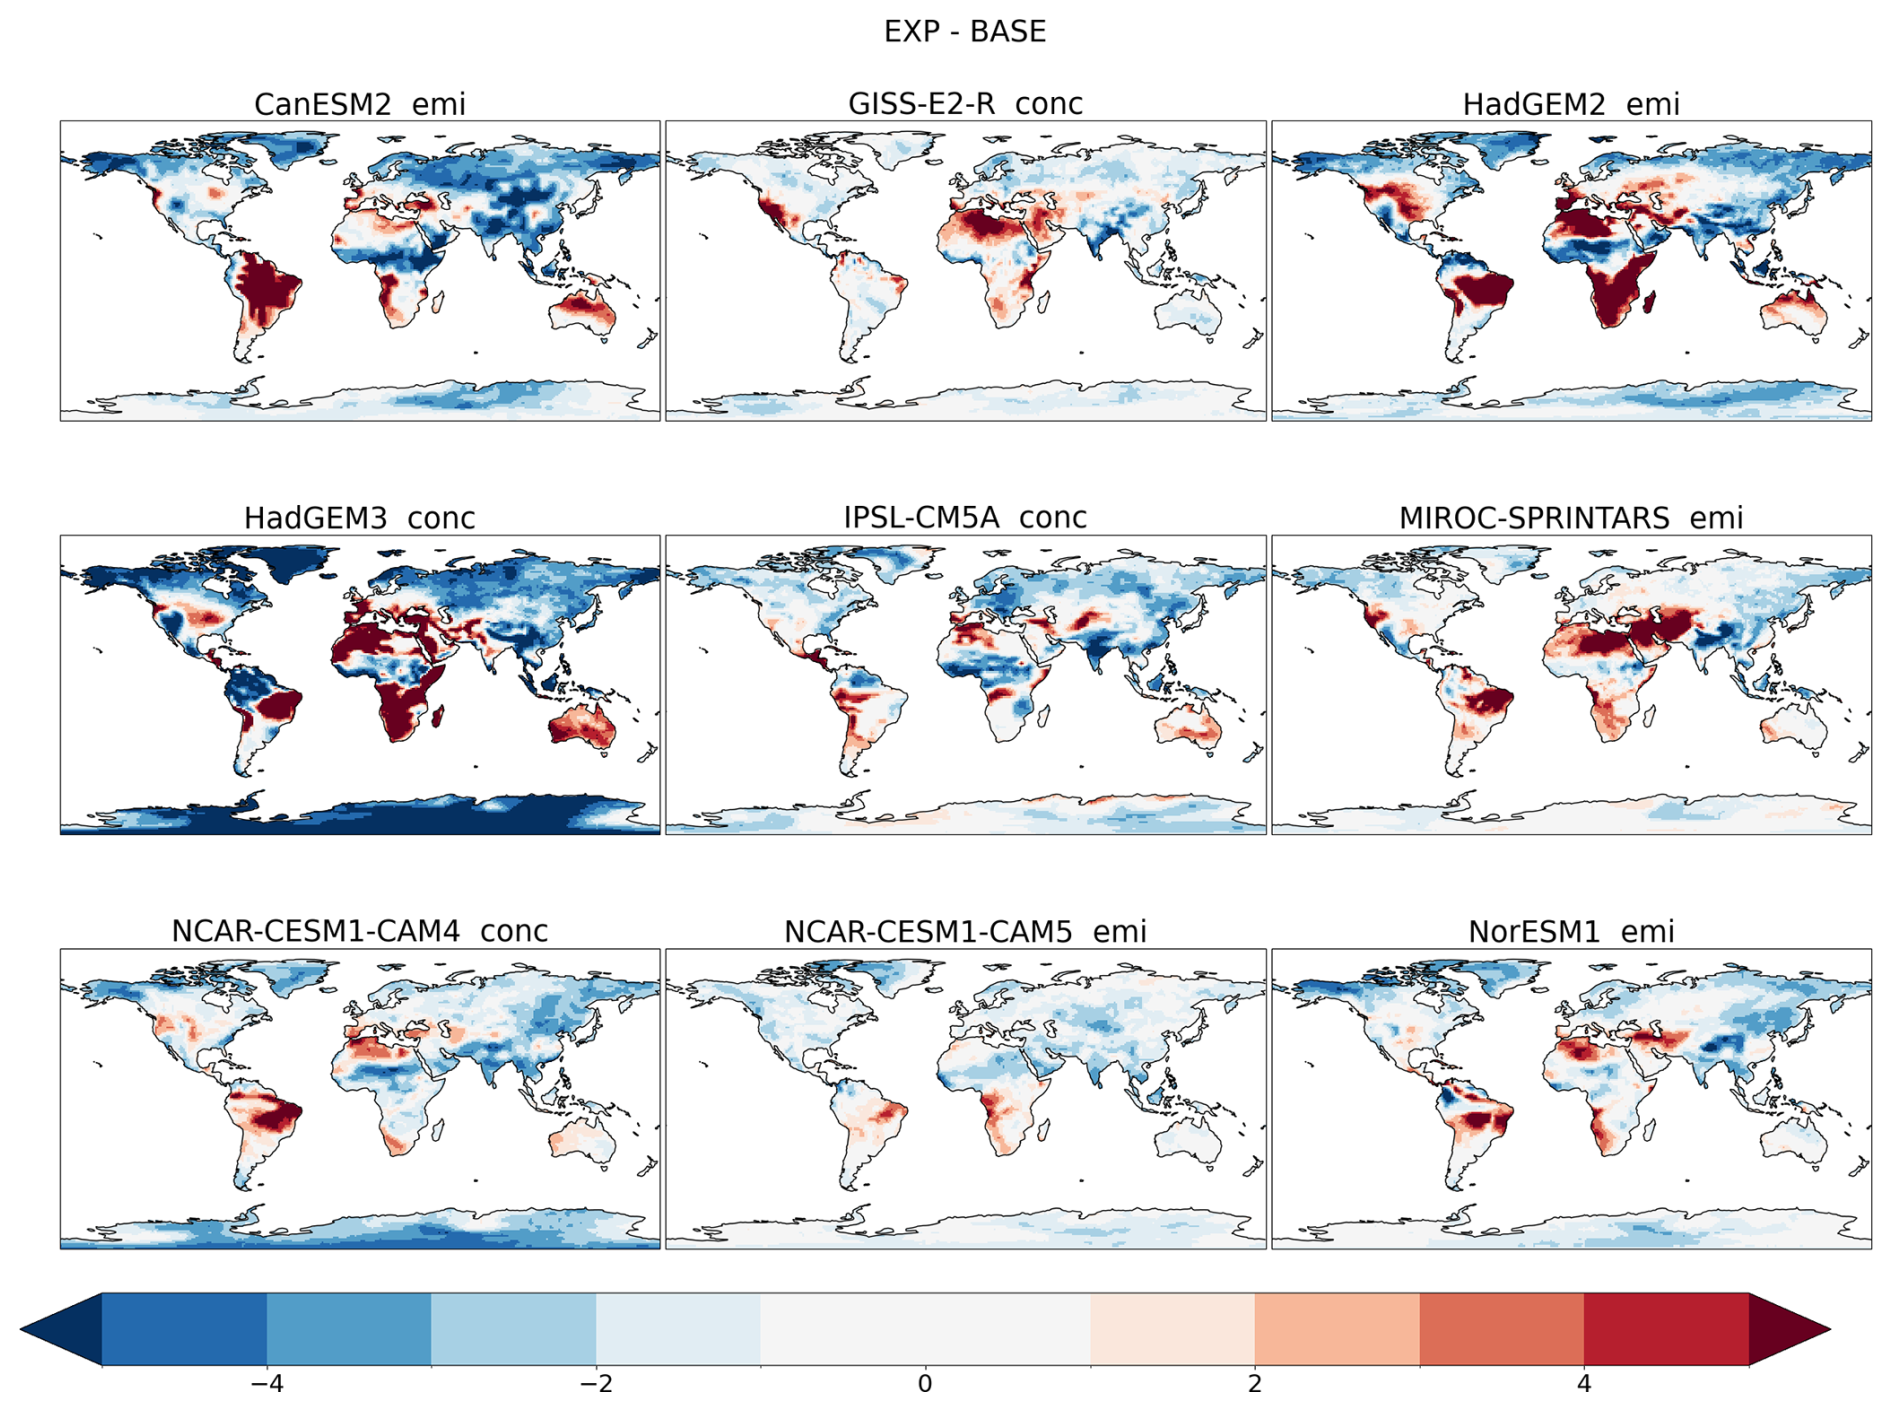
Figure A2Changes in the average number of days per year of extreme (0.90 quantile) precipitation due to a global 5-fold increase in sulfate emissions as simulated by nine different PDRMIP models. Panel titles indicate if a model is emission-driven (emi) or concentration-driven (conc).
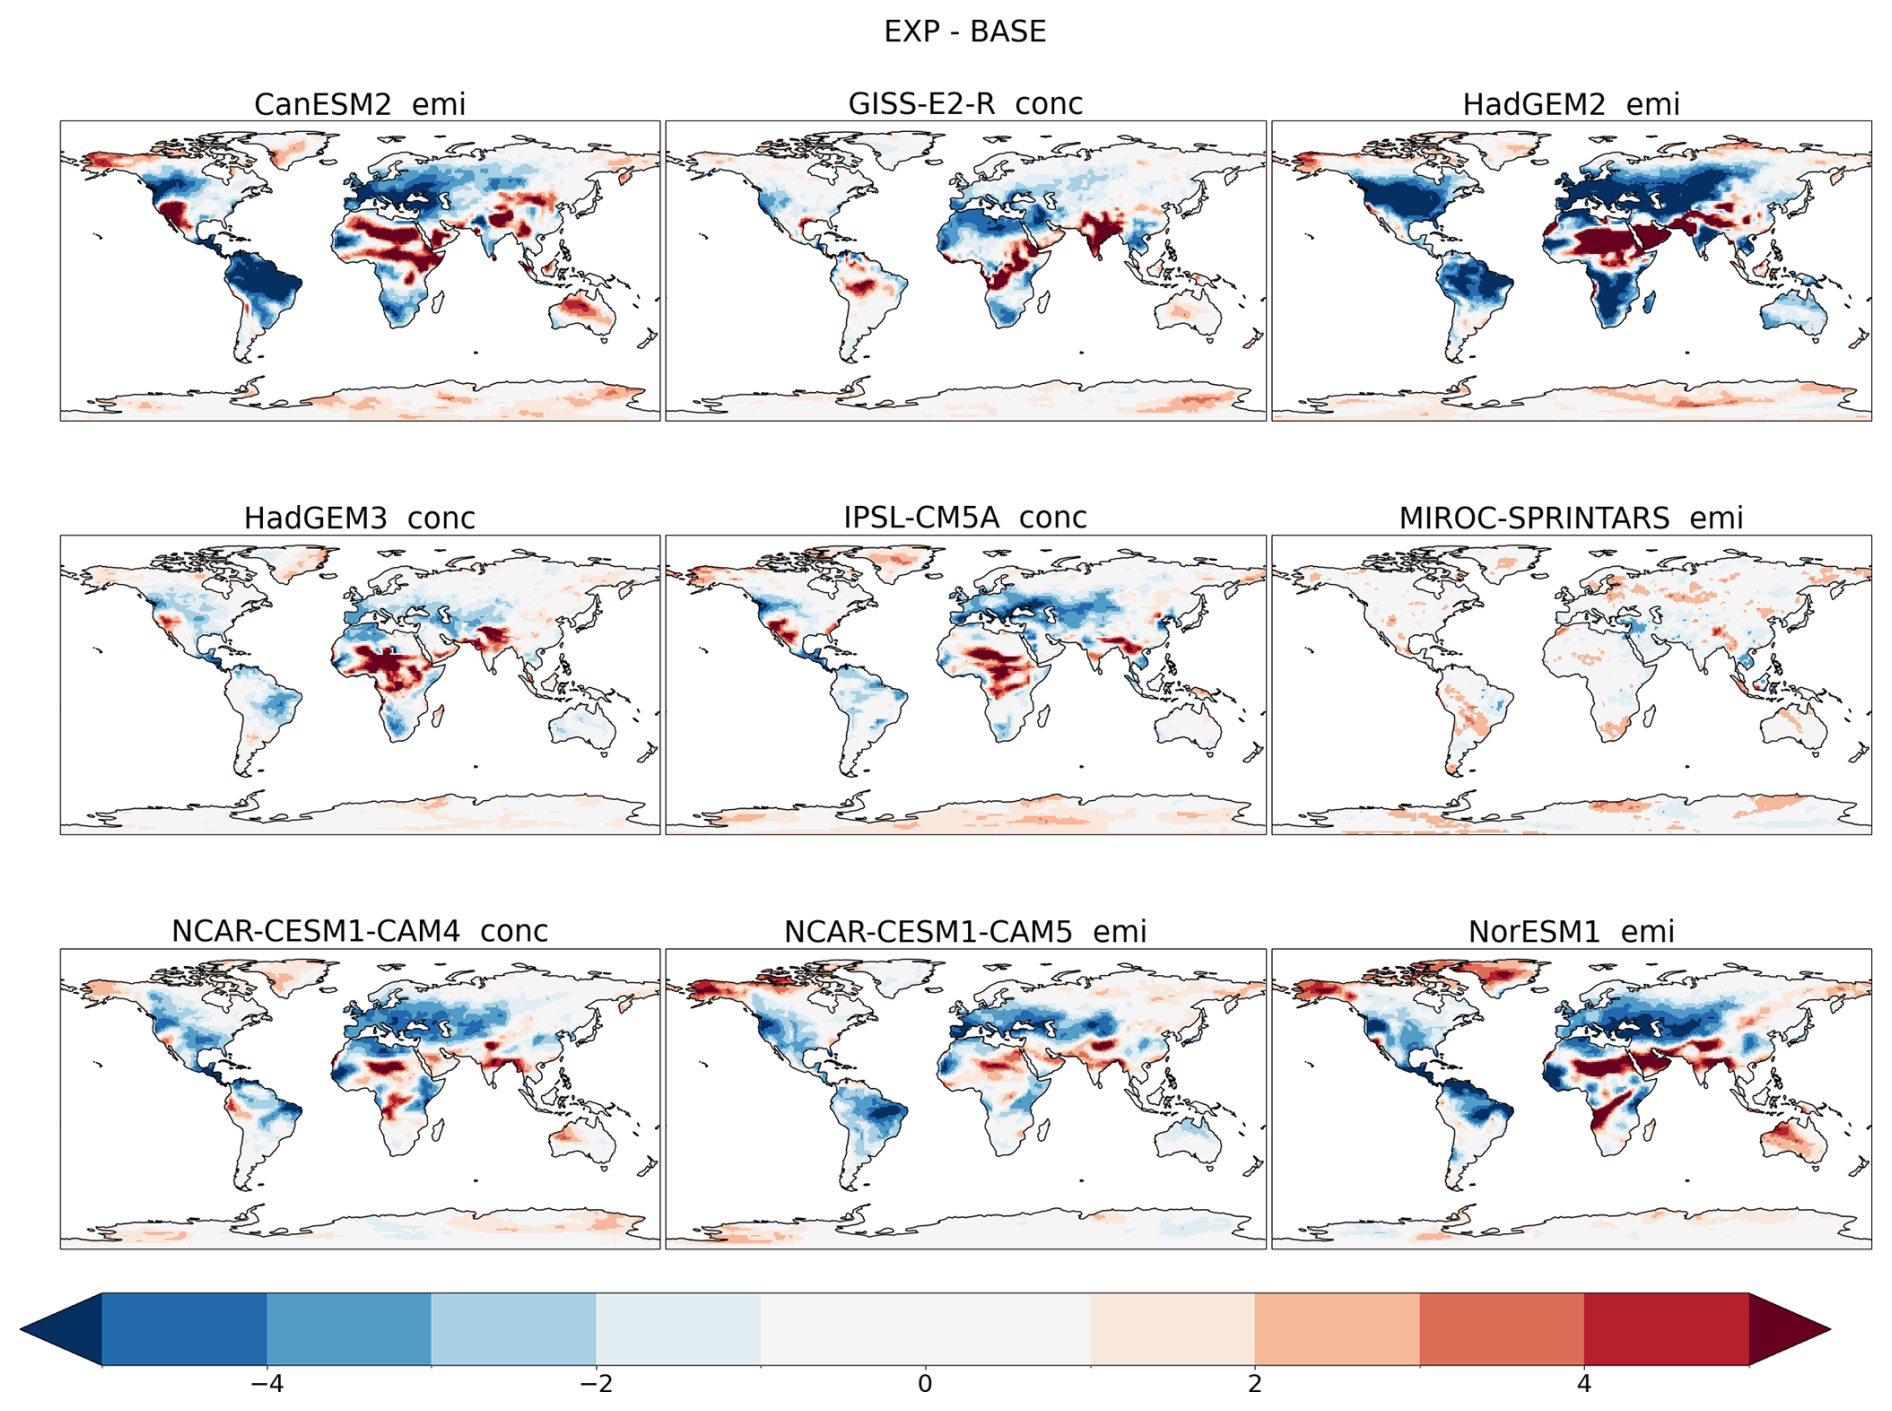
Figure A3Changes in the average number of days per year of extreme (0.90 quantile) precipitation due to a global 10-fold increase in black carbon emissions as simulated by nine different PDRMIP models. Panel titles indicate if a model is emission-driven (emi) or concentration-driven (conc).
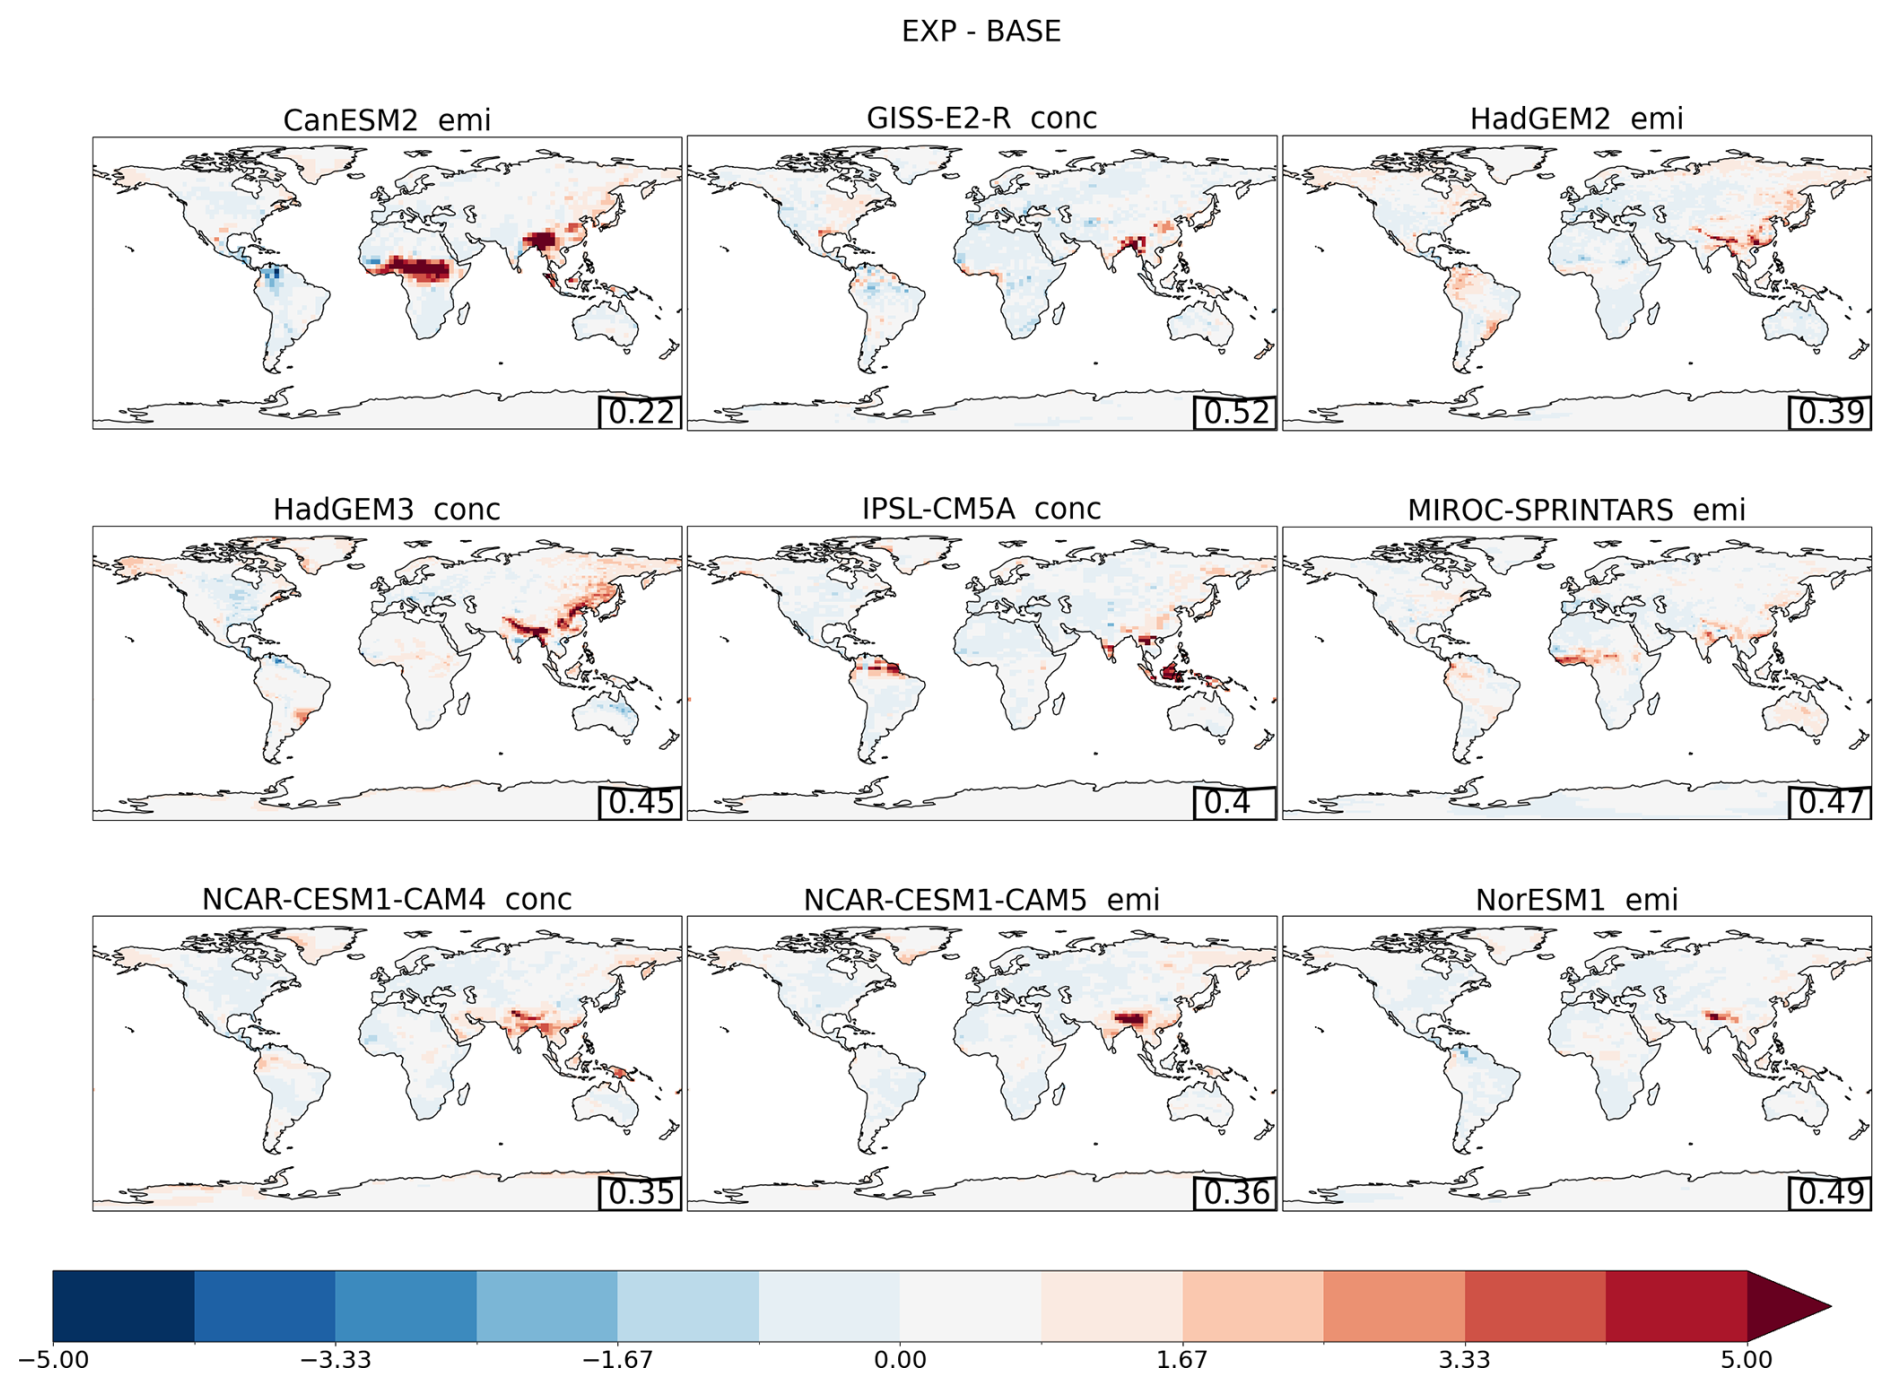
Figure A4Changes in the daily summertime PDF standard deviation due to a global doubling of CO2 concentrations as simulated by nine different PDRMIP models. Panel titles indicate if a model is emission-driven (emi) or concentration-driven (conc). Correlation between standard deviation and change in extremes is shown in the corner.
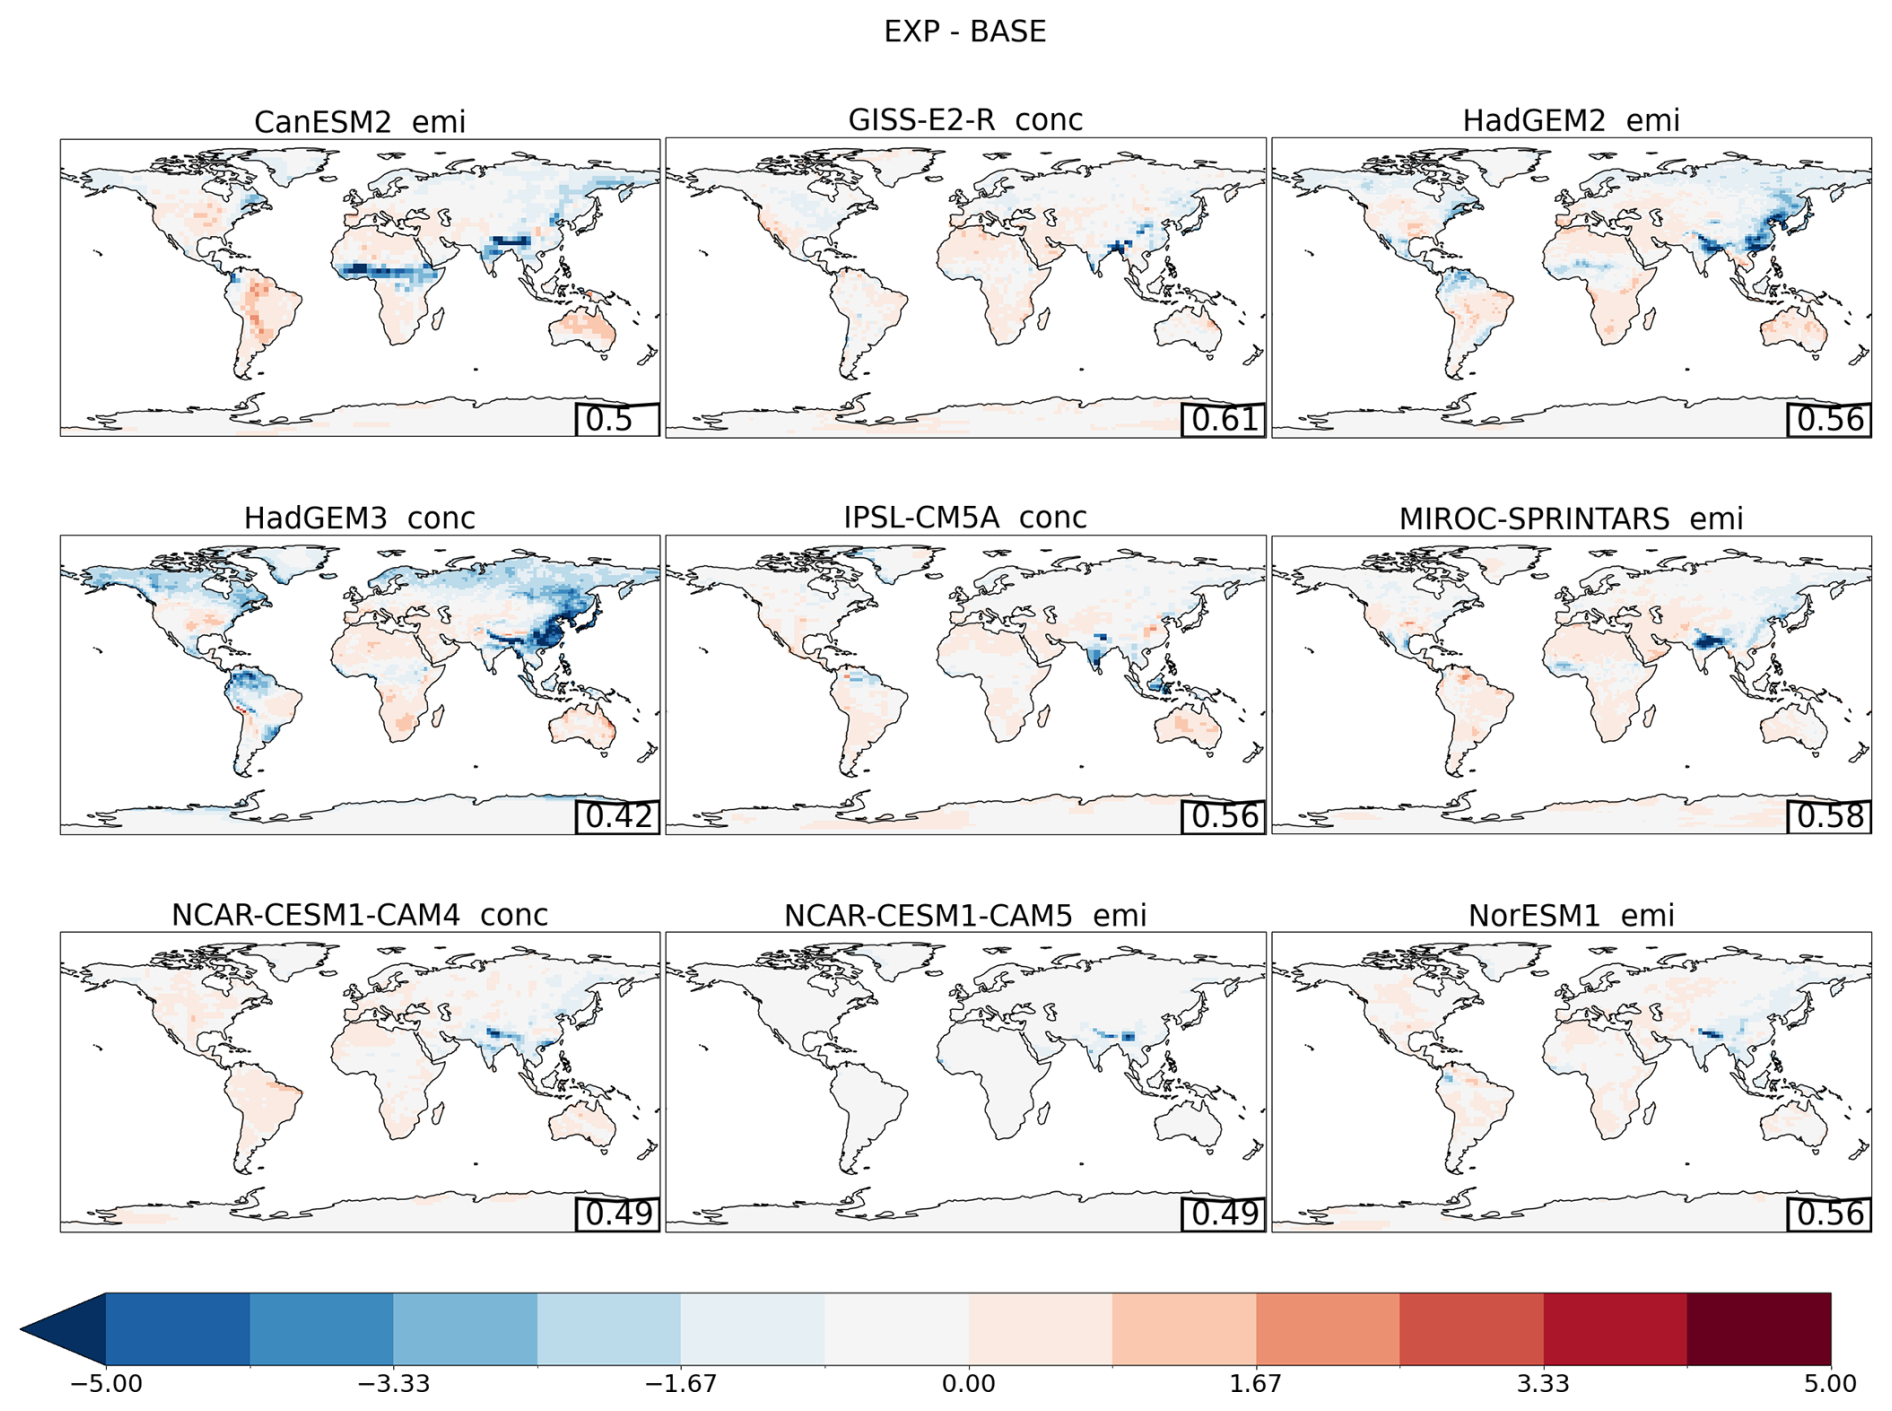
Figure A5Changes in the daily summertime PDF standard deviation due to a global 5-fold increase in sulfate emissions as simulated by nine different PDRMIP models. Panel titles indicate if a model is emission-driven (emi) or concentration-driven (conc). Correlation between standard deviation and change in extremes is shown in the corner.

Figure A6Changes in the daily summertime PDF standard deviation due to a global 10-fold increase in black carbon emissions as simulated by nine different PDRMIP models. Panel titles indicate if a model is emission-driven (emi) or concentration-driven (conc). Correlation between standard deviation and change in extremes is shown in the corner.

Figure A7Change in number of extreme heat days due to change in global warming levels.
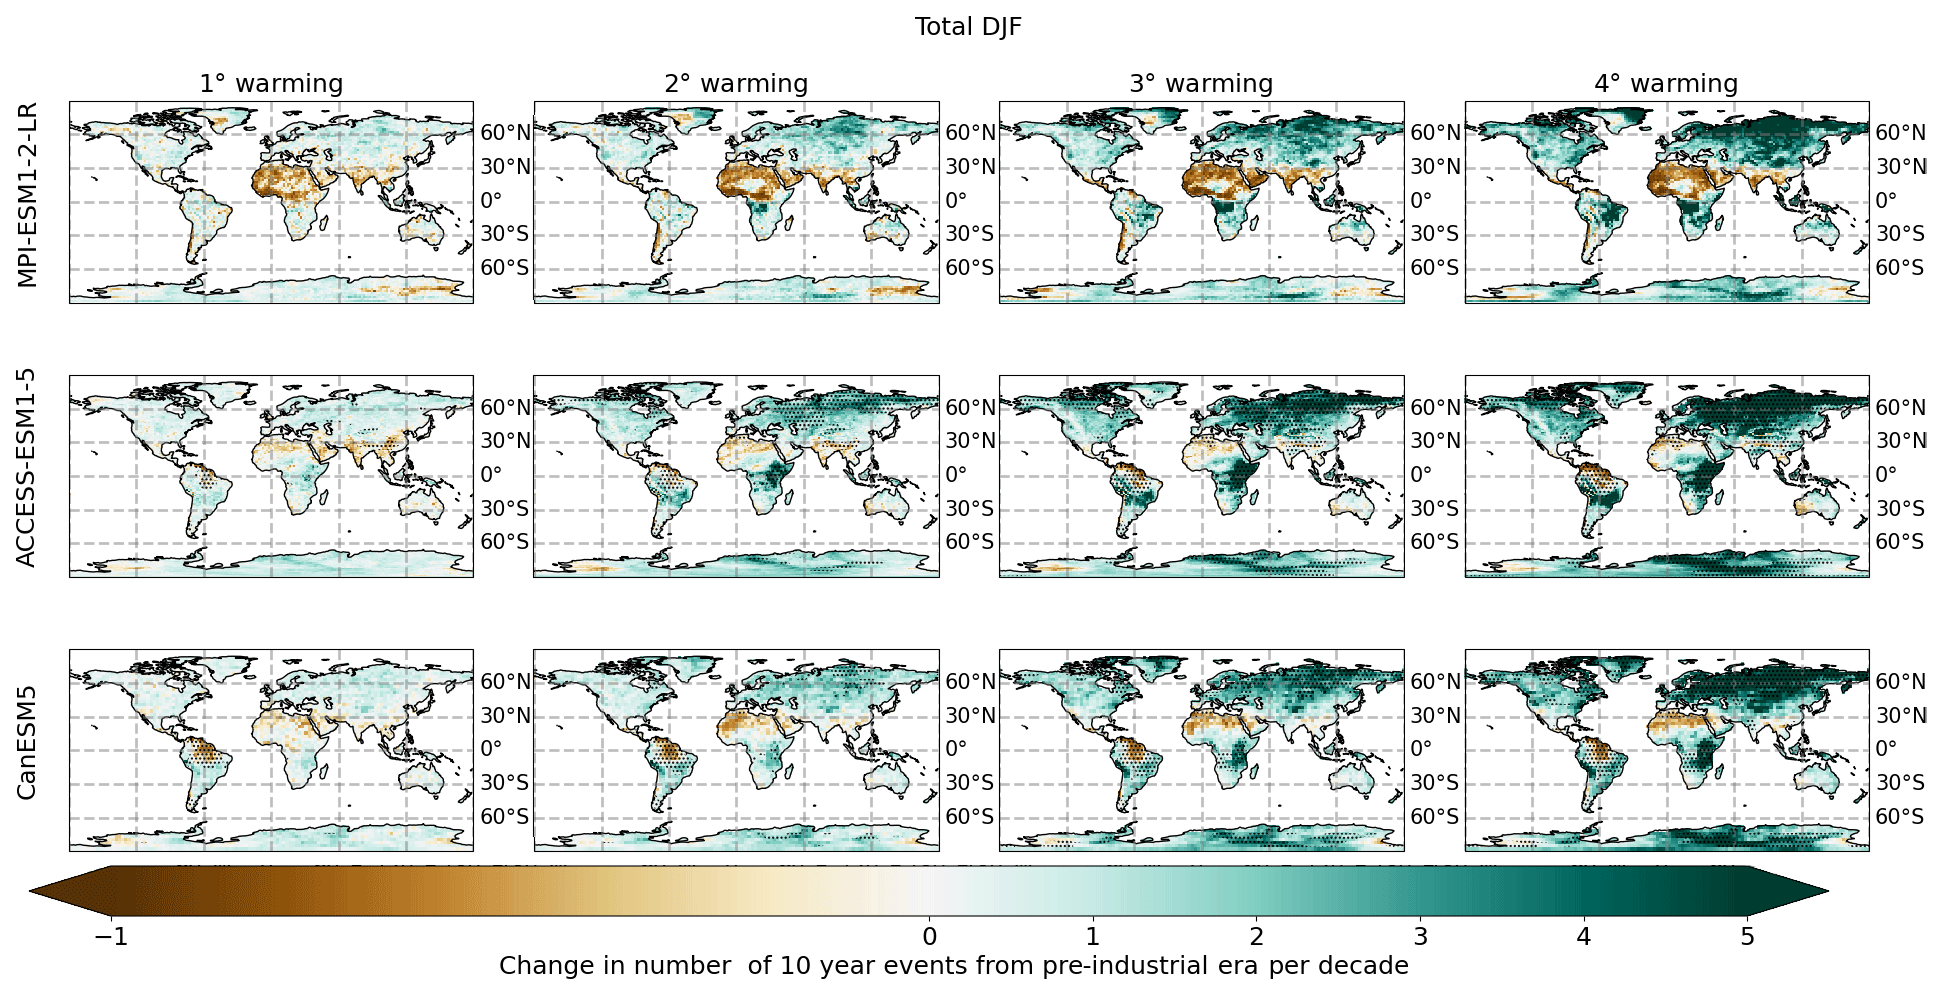
Figure B1Total change in the number of days of intense precipitation events during DJF under different global warming levels. Stippling indicates regions where changes in PDFs are significant at p > 0.05.
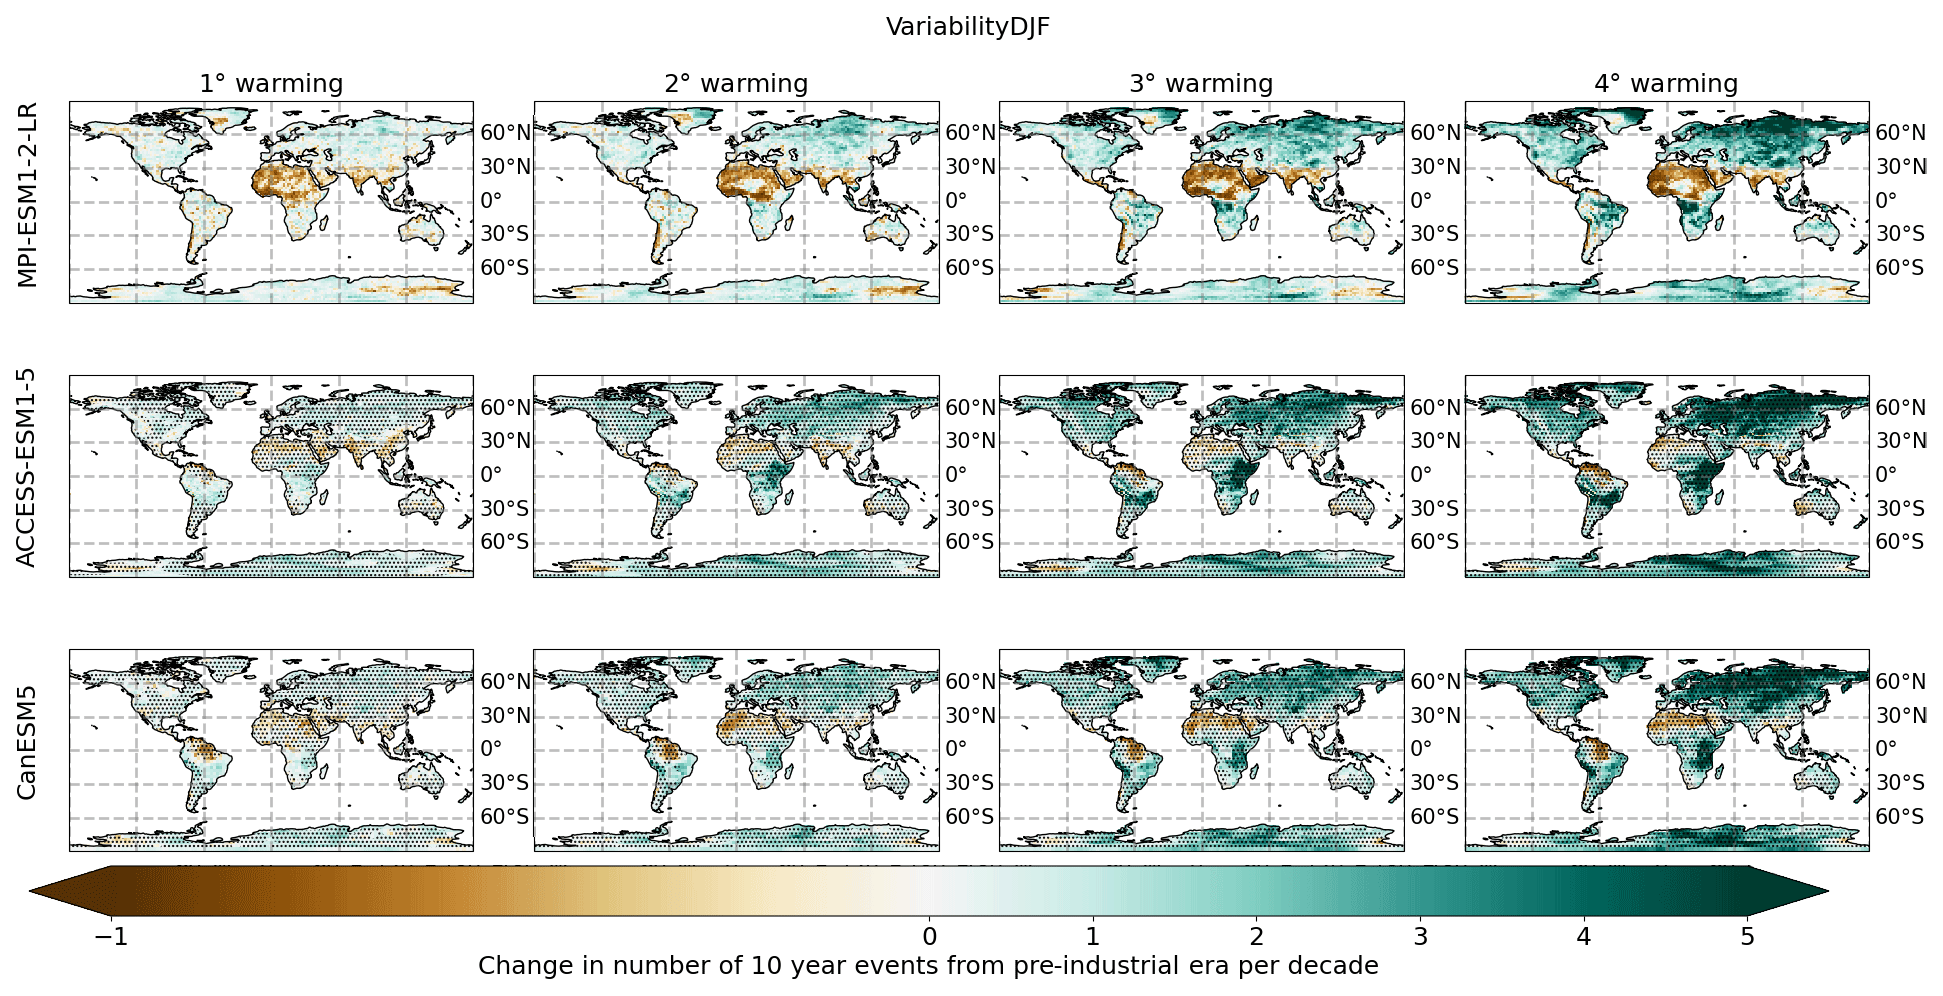
Figure B2Changes in the number of days of intense DJF precipitation events due to changes in variability under different global warming levels. Stippling indicates regions where changes in PDFs are significant at p > 0.05.
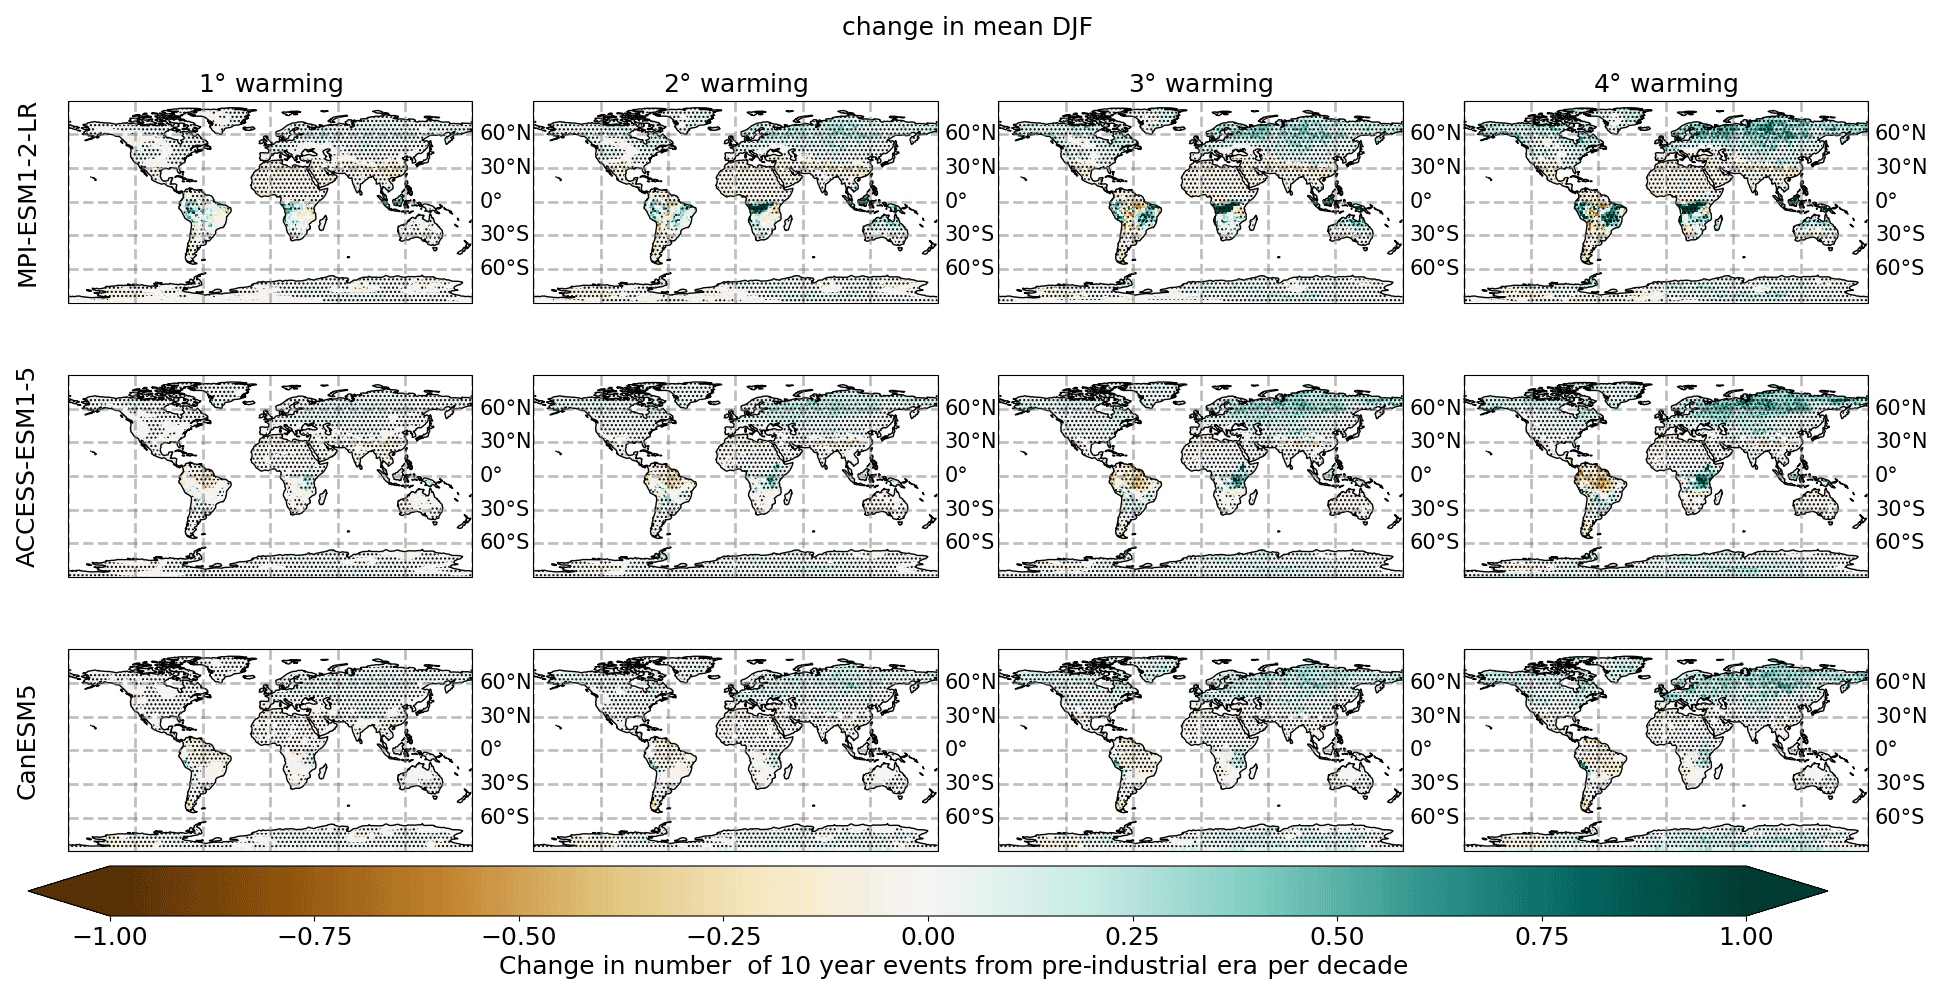
Figure B3Changes in the number of extreme DJF precipitation events due to changes in the mean under different global warming levels. Stippling indicates regions where changes in PDFs are significant at p > 0.05.
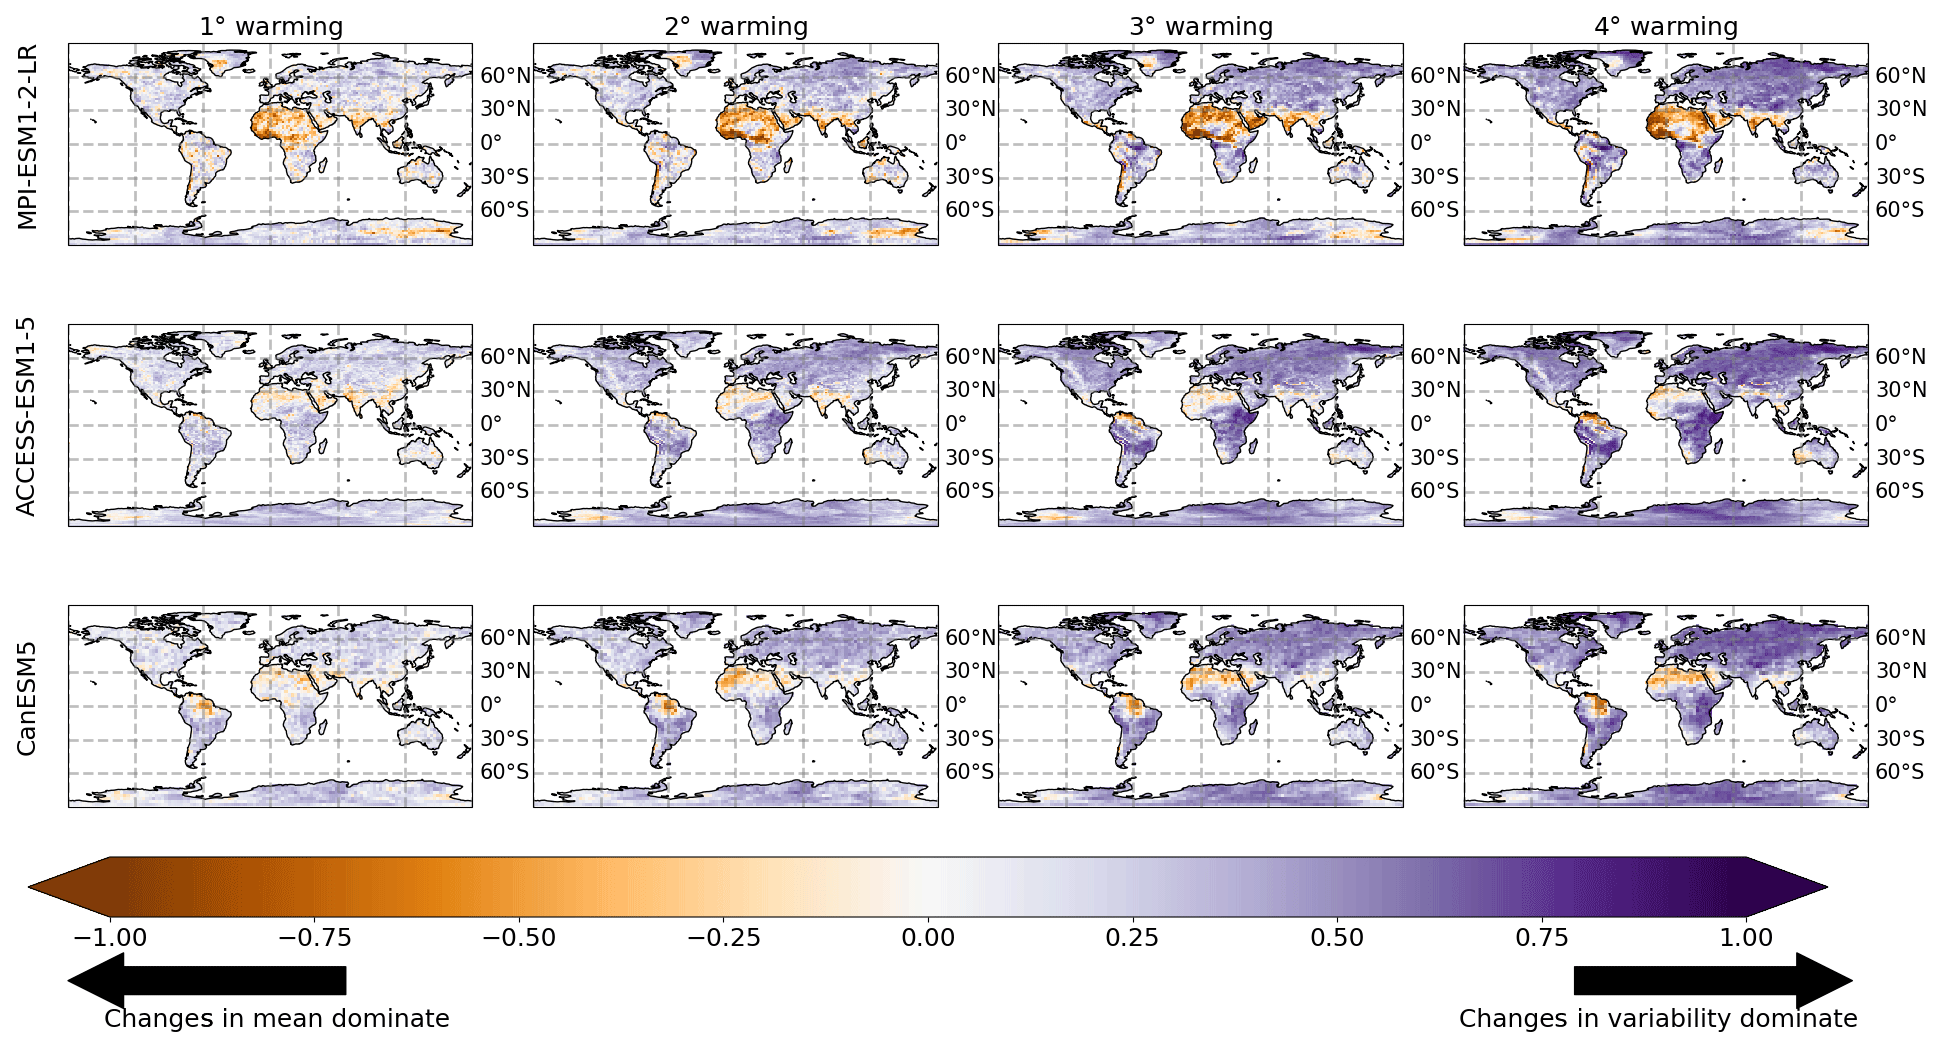
Figure B4Decomposition of regional changes in DJF precipitation and daily maximum temperature extremes into changes in the mean and changes in variability under four warming levels (columns). The figure shows the mean of three models, and hatching indicates regions where all three models do not agree. Orange colors indicate regions where the changes in the mean dominate changes in the extremes, and purple colors indicate regions where variability dominates.
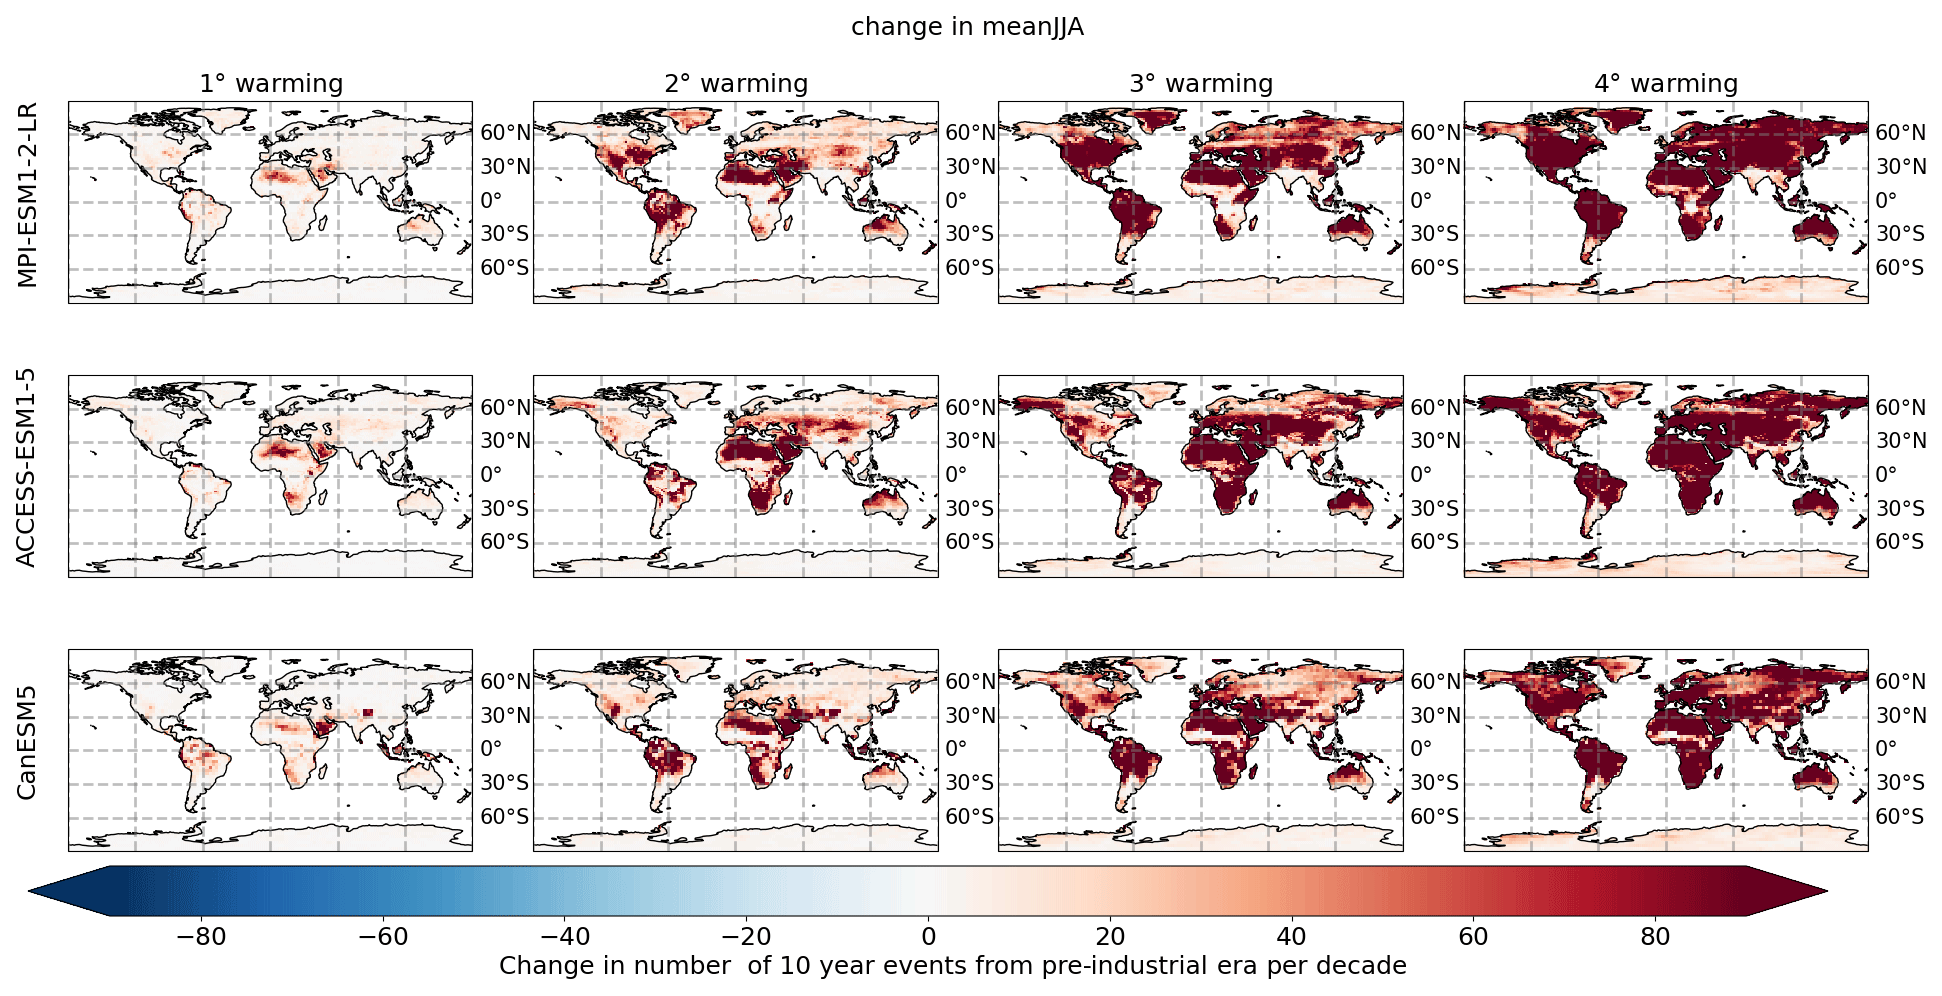
Figure B5Change in number of extreme heat days due to change in mean with respect to global warming levels.
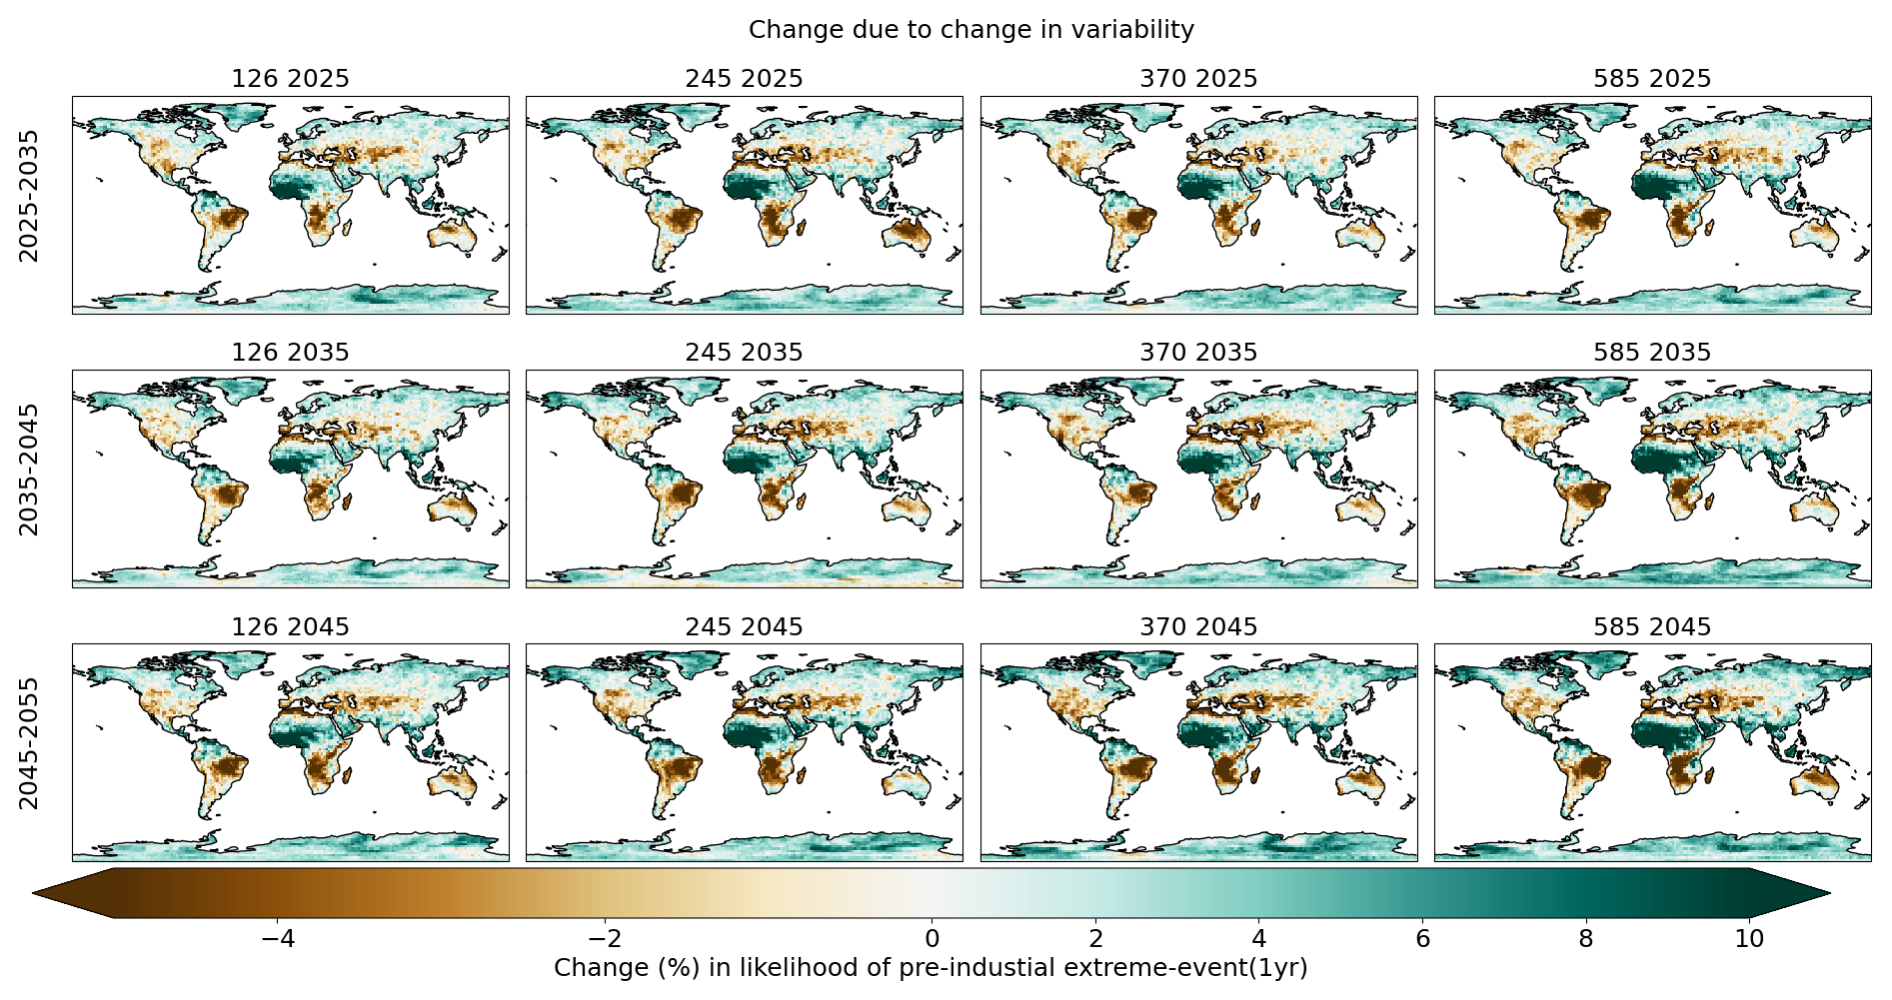
Figure C1Near-future changes in number of extreme precipitation days for MPI-ESM1-2-LR under four different SSP scenarios (columns) and for three different time periods (from left to right: 2025–2035, 2035–2045 and 2045–2050).
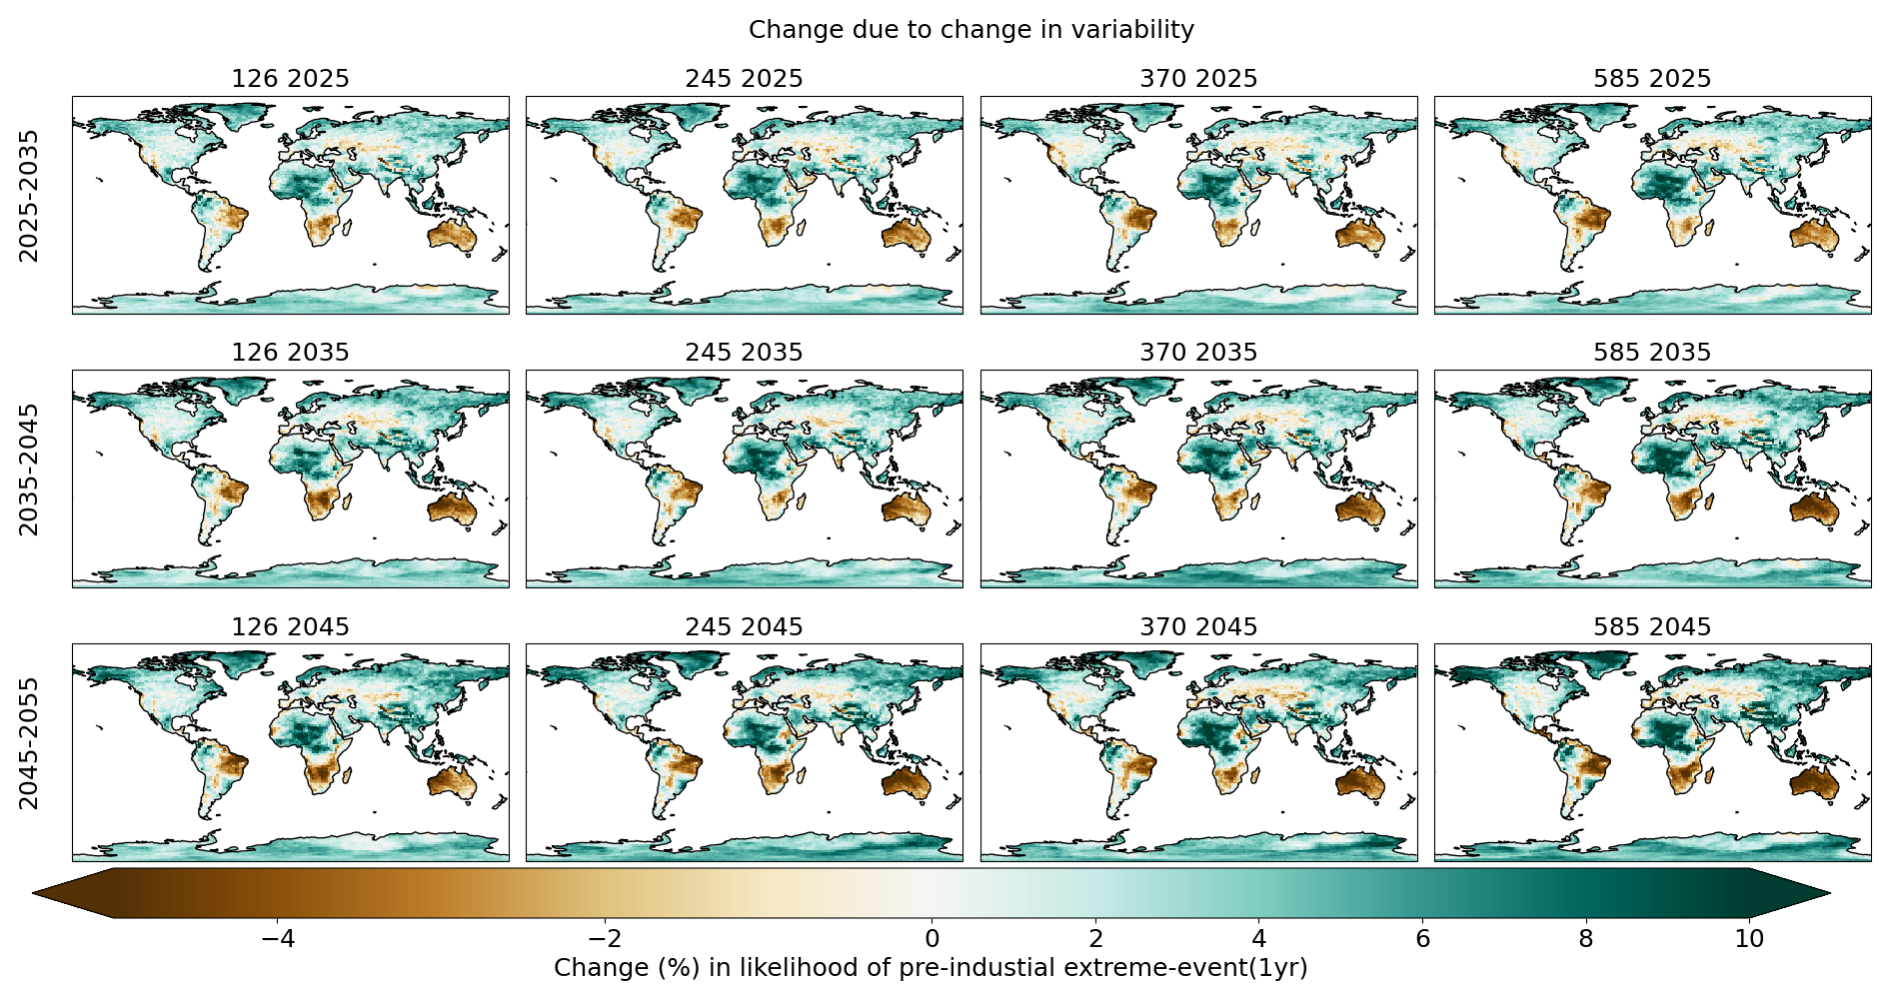
Figure C2Near-future changes in number of extreme precipitation days for ACCESS-ESM1-5 under four different SSP scenarios (columns) and for three different time periods (from left to right: 2025–2035, 2035–2045 and 2045–2050).
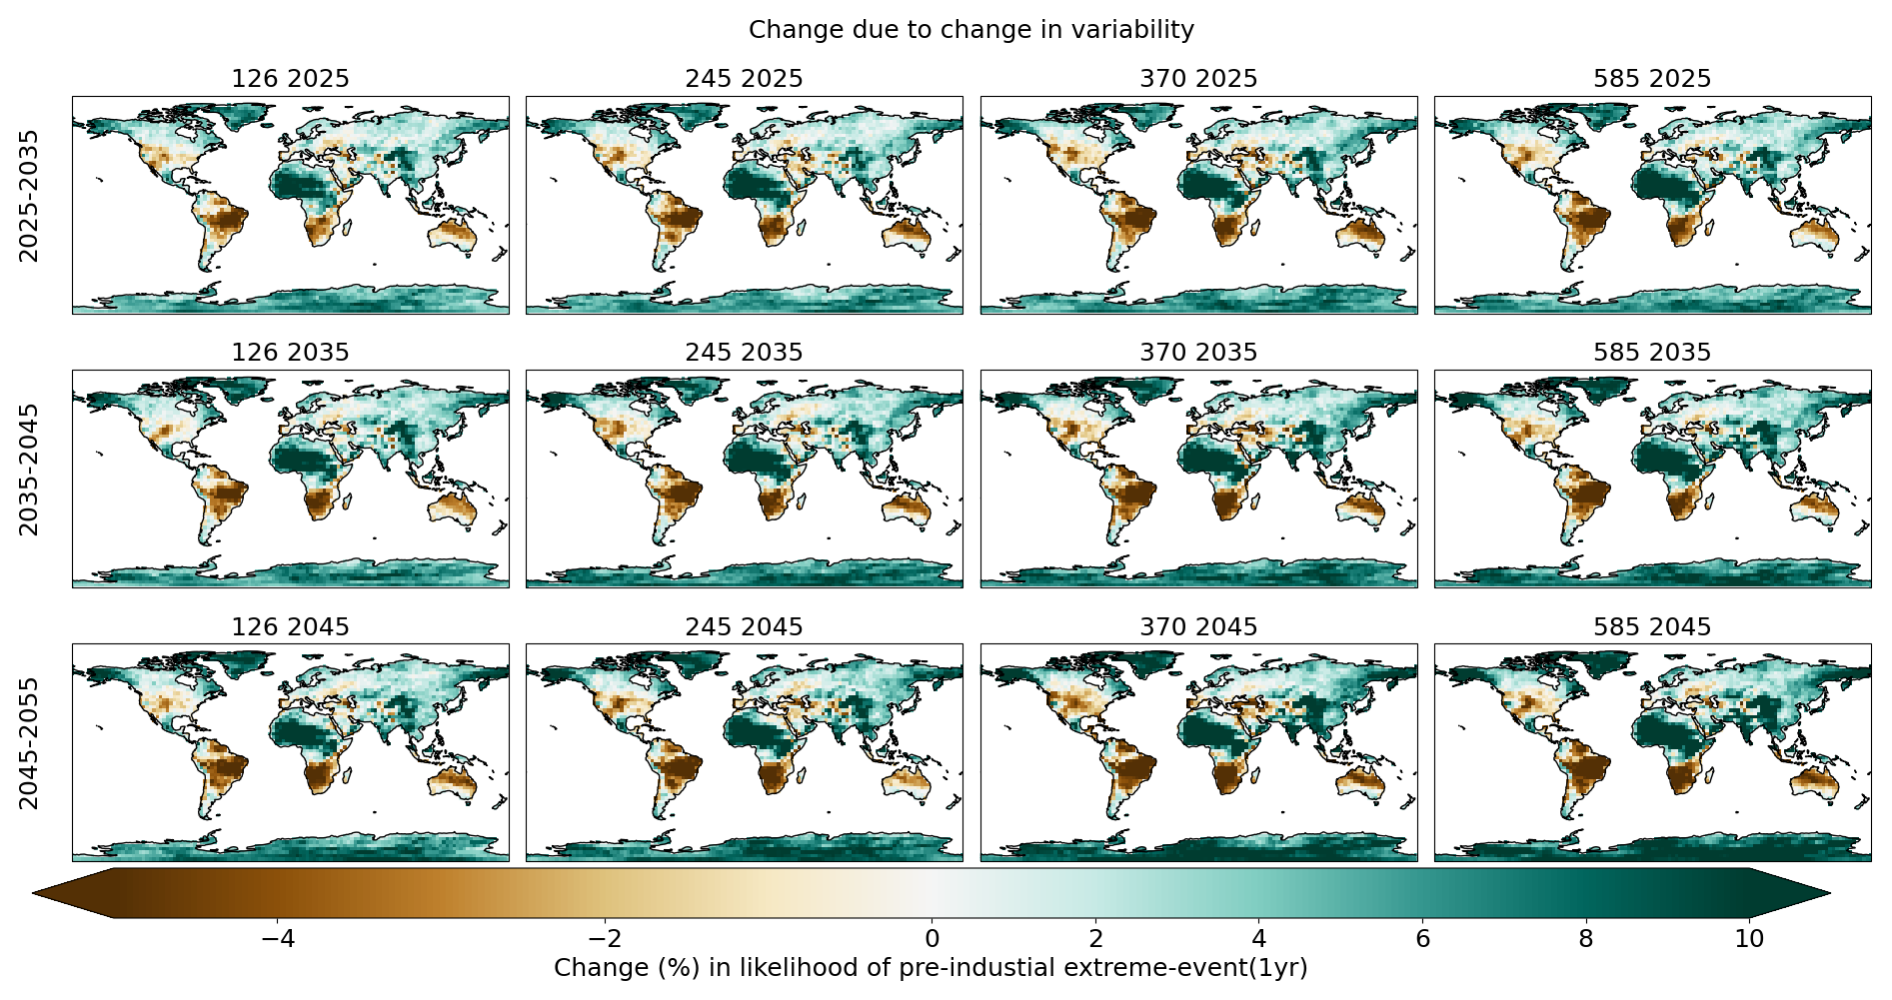
Figure C3Near-future changes in the number of extreme precipitation days for CanESM5 under four different SSP scenarios (columns) and for three different time periods (from left to right: 2025–2035, 2035–2045 and 2045–2050).
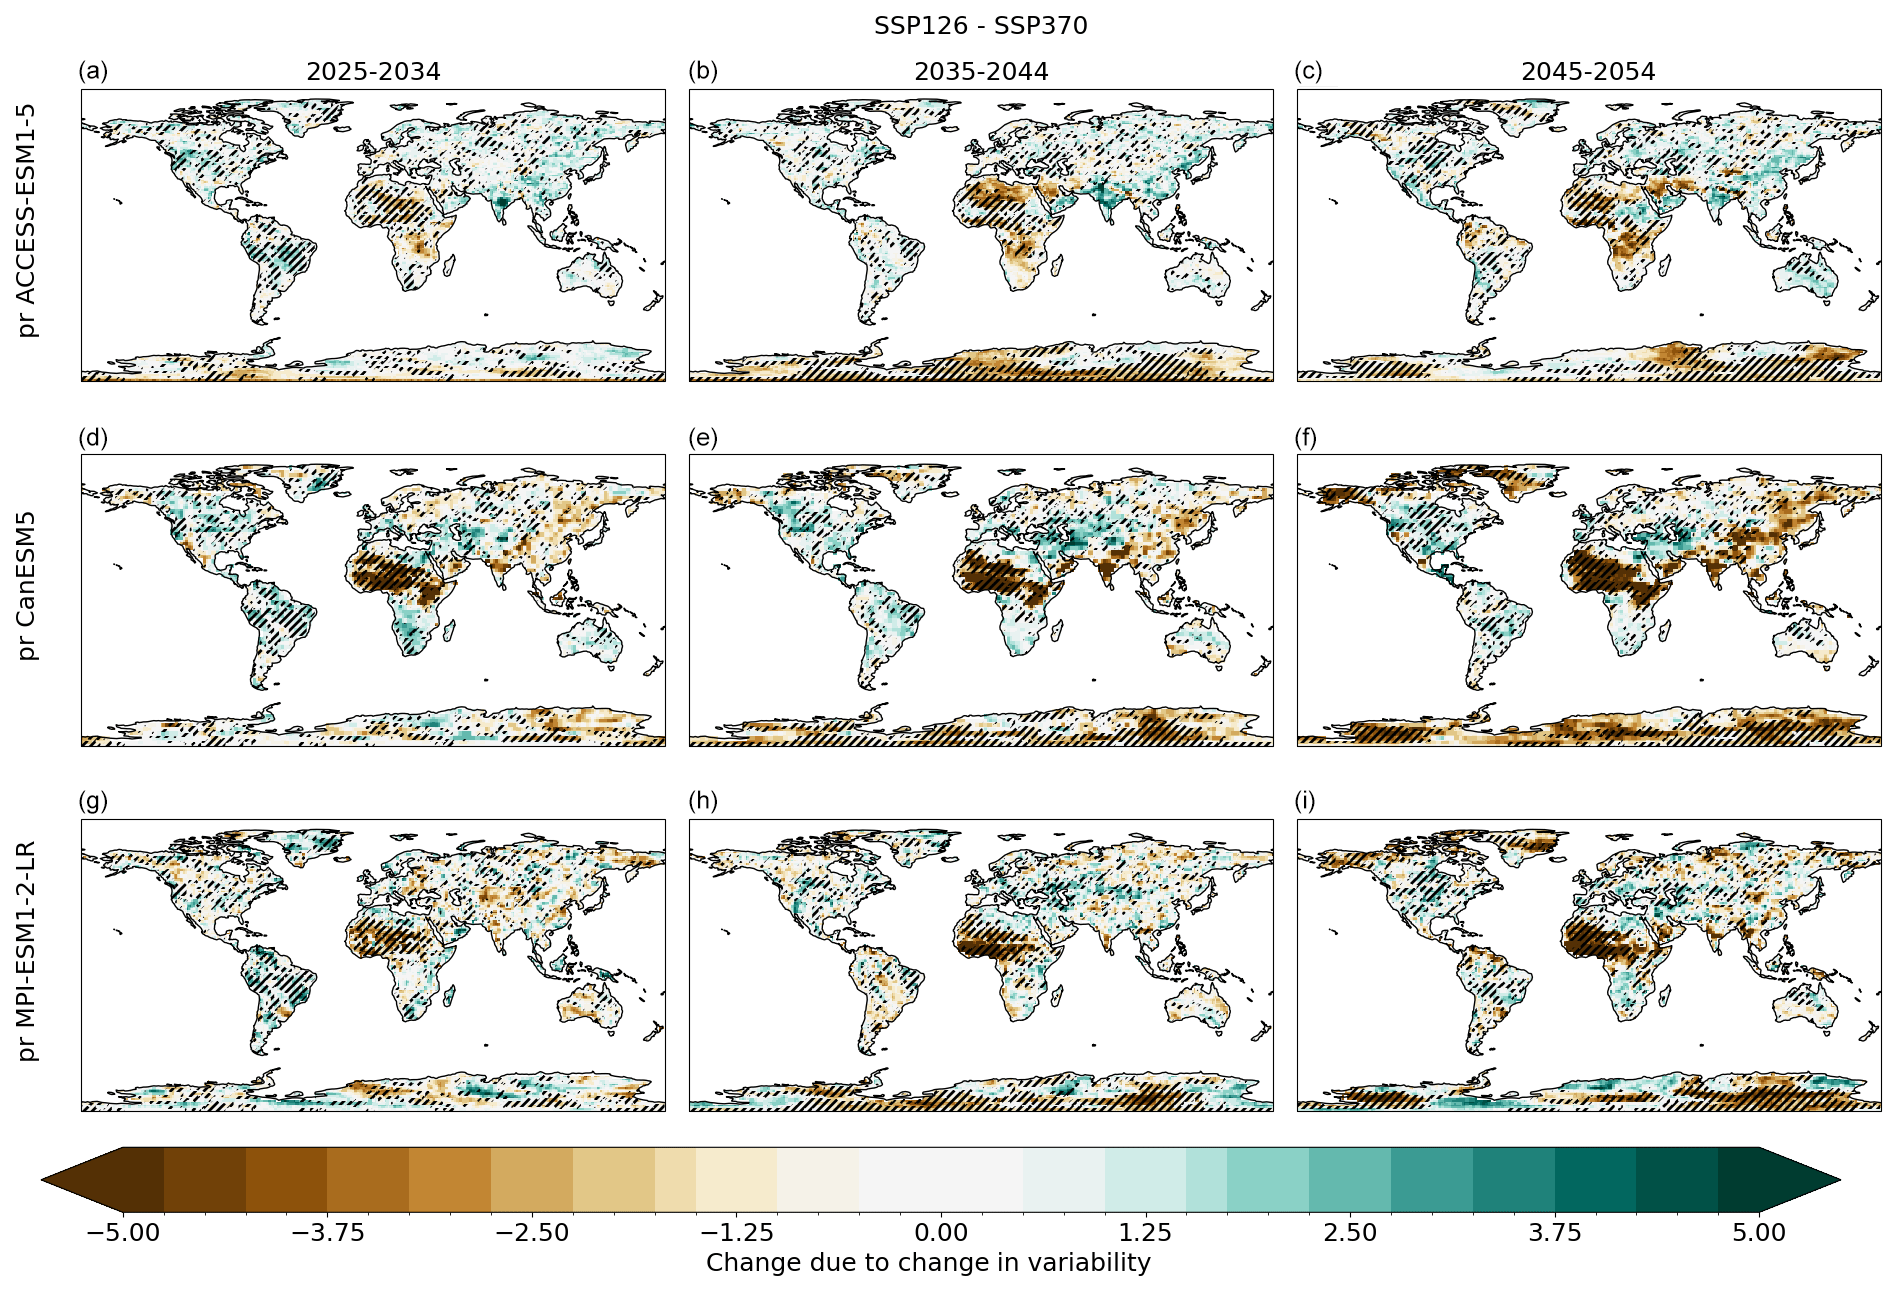
Figure C4Change in likelihood in days of extreme JJA precipitation between SSP1-2.6 and SSP3-7.0 for three different models: ACCESS-ESM1-5 (a–c), CanESM5 (d–f) and MPI-ESM1-2-LR (g–i). Hatching indicates regions where all three models agree on the sign of the change.
All codes used in this study can be accessed via https://github.com/kallenordling/variability (last access: 9 April 2024; https://doi.org/10.5281/zenodo.14792740, Nordling, 2025).
Data used in this paper are available from https://doi.org/10.5281/zenodo.10796384 (Nordling, 2024).
All authors contributed to the writing. BHS came up with the original concept, NLSF came up with the concept of extremes and KN performed the analysis.
The contact author has declared that none of the authors has any competing interests.
Publisher's note: Copernicus Publications remains neutral with regard to jurisdictional claims made in the text, published maps, institutional affiliations, or any other geographical representation in this paper. While Copernicus Publications makes every effort to include appropriate place names, the final responsibility lies with the authors.
We acknowledge support by the Research Council of Norway (grant no. 324182 (CATHY)) and the Centre for Advanced Study in Oslo, Norway, which funded and hosted the HETCLIF center during the academic year of 2023–2024. We also acknowledge the resources provided by UNINETT Sigma2 – the National Infrastructure for High Performance Computing and Data Storage in Norway (project account NS9042KK). We also acknowledge the Academy of Finland (grant no. 337552).
This research has been supported by the Norges Forskningsråd (CATHY, grant no. 324182), the Centre for Advanced Study in Oslo, Norway, and the Suomalainen Tiedeakatemia (grant no. 337552).
This paper was edited by Ewa Bednarz and reviewed by three anonymous referees.
Arora, V. K., Scinocca, J., Boer, G., Christian, J., Denman, K., Flato, G., Kharin, V., Lee, W., and Merryfield, W.: Carbon emission limits required to satisfy future representative concentration pathways of greenhouse gases, Geophys. Res. Lett., 38, L05805, https://doi.org/10.1029/2010GL046270, 2011. a
Bellouin, N., Rae, J., Jones, A., Johnson, C., Haywood, J., and Boucher, O.: Aerosol forcing in the Climate Model Intercomparison Project (CMIP5) simulations by HadGEM2-ES and the role of ammonium nitrate, J. Geophys. Res.-Atmos., 116, D20206, https://doi.org/10.1029/2011JD016074, 2011. a
Bentsen, M., Bethke, I., Debernard, J. B., Iversen, T., Kirkevåg, A., Seland, Ø., Drange, H., Roelandt, C., Seierstad, I. A., Hoose, C., and Kristjánsson, J. E.: The Norwegian Earth System Model, NorESM1-M – Part 1: Description and basic evaluation of the physical climate, Geosci. Model Dev., 6, 687–720, https://doi.org/10.5194/gmd-6-687-2013, 2013. a
Chen, D., Rojas, M., Samset, B., Cobb, K., Diongue Niang, A., Edwards, P., Emori, S., Faria, S., Hawkins, E., Hope, P., Huybrechts, P., Meinshausen, M., Mustafa, S., Plattner, G.-K., and Tréguier, A.-M.: Framing, Context, and Methods, in: Climate Change 2021: The Physical Science Basis. Contribution of Working Group I to the Sixth Assessment Report of the Intergovernmental Panel on Climate Change, edited by: Masson-Delmotte, V., Zhai, P., Pirani, A., Connors, S. L., Péan, C., Berger, S., Caud, N., Chen, Y., Goldfarb, L., Gomis, M. I., Huang, M., Leitzell, K., Lonnoy, E., Matthews, J. B. R., Maycock, T. K., Waterfield, T., Yelekçi, O., Yu, R., and Zhou, B., book section 1, Cambridge University Press, Cambridge, UK and New York, NY, USA, https://doi.org/10.1017/9781009157896.003, 2021. a
Collins, W. J., Bellouin, N., Doutriaux-Boucher, M., Gedney, N., Halloran, P., Hinton, T., Hughes, J., Jones, C. D., Joshi, M., Liddicoat, S., Martin, G., O'Connor, F., Rae, J., Senior, C., Sitch, S., Totterdell, I., Wiltshire, A., and Woodward, S.: Development and evaluation of an Earth-System model – HadGEM2, Geosci. Model Dev., 4, 1051–1075, https://doi.org/10.5194/gmd-4-1051-2011, 2011. a
Copernicus: 2023 is the hottest year on record, with global temperatures close to the 1.5 °C limit, Copernicus, https://climate.copernicus.eu/copernicus-2023-hottest-year-record (last access: 9 April 2024), 2023. a
Dufresne, J.-L., Foujols, M.-A., Denvil, S., Caubel, A., Marti, O., Aumont, O., Balkanski, Y., Bekki, S., Bellenger, H., Benshila, R., Bony, S., Bopp, L., Braconnot, P., Brockmann, P., Cadule, P., Cheruy, F., Codron, F., Cozic, A., Cugnet, D., de Noblet, N., Duvel, J.-P., Ethé, C., Fairhead, L., Fichefet, T., Flavoni, S., Friedlingstein, P., Grandpeix, J.-Y., Guez, L., Guilyardi, E., Hauglustaine, D., Hourdin, F., Idelkadi, A., Ghattas, J., Joussaume, S., Kageyama, M., Krinner, G., Labetoulle, S., Lahellec, A., Lefebvre, M.-P., Lefevre, F., Levy, C., Li, Z. X., Lloyd, J., Lott, F., Madec, G., Mancip, M., Marchand, M., Masson, S., Meurdesoif, Y., Mignot, J., Musat, I., Parouty, S., Polcher, J., Rio, C., Schulz, M., Swingedouw, D., Szopa, S., Talandier, C., Terray, P., Viovy, N., and Vuichard, N.: Climate change projections using the IPSL-CM5 Earth System Model: from CMIP3 to CMIP5, Clim. Dynam., 40, 2123–2165, https://doi.org/10.1007/s00382-012-1636-1, 2013. a
Fahrenbach, N. L., Bollasina, M. A., Samset, B. H., Cowan, T., and Ekman, A. M.: Asian Anthropogenic Aerosol Forcing Played a Key Role in the Multidecadal Increase in Australian Summer Monsoon Rainfall, J. Climate, 37, 895–911, 2024. a
Fahrenbach, N. L. S. and Bollasina, M. A.: Hemispheric-wide climate response to regional COVID-19-related aerosol emission reductions: the prominent role of atmospheric circulation adjustments, Atmos. Chem. Phys., 23, 877–894, https://doi.org/10.5194/acp-23-877-2023, 2023. a
Feng, H. and Zhang, M.: Global land moisture trends: Drier in dry and wetter in wet over land, Sci. Rep., 5, 18018, https://doi.org/10.1038/srep18018, 2015. a
Fiedler, S., van Noije, T., Smith, C. J., Boucher, O., Dufresne, J.-L., Kirkevåg, A., Olivié, D., Pinto, R., Reerink, T., Sima, A., and Schulz, M.: Historical Changes and Reasons for Model Differences in Anthropogenic Aerosol Forcing in CMIP6, Geophys. Res. Lett., 50, e2023GL104848, https://doi.org/10.1029/2023GL104848, 2023. a
Gent, P. R., Danabasoglu, G., Donner, L. J., Holland, M. M., Hunke, E. C., Jayne, S. R., Lawrence, D. M., Neale, R. B., Rasch, P. J., Vertenstein, M., Worley, P. H., Yang, Z.-L., and Zhang, M.: The Community Climate System Model Version 4, J. Climate, 24, 4973–4991, https://doi.org/10.1175/2011JCLI4083.1, 2011. a
Guo, L., Wilcox, L. J., Bollasina, M., Turnock, S. T., Lund, M. T., and Zhang, L.: Competing effects of aerosol reductions and circulation changes for future improvements in Beijing haze, Atmos. Chem. Phys., 21, 15299–15308, https://doi.org/10.5194/acp-21-15299-2021, 2021. a
Hurrell, J. W., Holland, M. M., Gent, P. R., Ghan, S., Kay, J. E., Kushner, P. J., Lamarque, J.-F., Large, W. G., Lawrence, D., Lindsay, K., Lipscomb, W. H., Long, M. C., Mahowald, N., Marsh, D. R., Neale, R. B., Rasch, P., Vavrus, S., Vertenstein, M., Bader, D., Collins, W. D., Hack, J. J., Kiehl, J., and Marshall, S.: The Community Earth System Model: A Framework for Collaborative Research, B. Am. Meteorol. Soc., 94, 1339–1360, https://doi.org/10.1175/BAMS-D-12-00121.1, 2013. a
IPCC: Summary for Policymakers, in: Climate Change 2021: The Physical Science Basis. Contribution of Working Group I to the Sixth Assessment Report of the Intergovernmental Panel on Climate Change, edited by: Masson-Delmotte, V., Zhai, P., Pirani, A., Connors, S. L., Péan, C., Berger, S., Caud, N., Chen, Y., Goldfarb, L., Gomis, M. I., Huang, M., Leitzell, K., Lonnoy, E., Matthews, J. B. R., Maycock, T. K., Waterfield, T., Yelekçi, O., Yu, R., and Zhou, B., Cambridge University Press, Cambridge, United Kingdom and New York, NY, USA, 3−-32, https://doi.org/10.1017/9781009157896.001, 2021. a
Iturbide, M., Gutiérrez, J. M., Alves, L. M., Bedia, J., Cerezo-Mota, R., Cimadevilla, E., Cofiño, A. S., Di Luca, A., Faria, S. H., Gorodetskaya, I. V., Hauser, M., Herrera, S., Hennessy, K., Hewitt, H. T., Jones, R. G., Krakovska, S., Manzanas, R., Martínez-Castro, D., Narisma, G. T., Nurhati, I. S., Pinto, I., Seneviratne, S. I., van den Hurk, B., and Vera, C. S.: An update of IPCC climate reference regions for subcontinental analysis of climate model data: definition and aggregated datasets, Earth Syst. Sci. Data, 12, 2959–2970, https://doi.org/10.5194/essd-12-2959-2020, 2020. a
Iversen, T., Bentsen, M., Bethke, I., Debernard, J. B., Kirkevåg, A., Seland, Ø., Drange, H., Kristjansson, J. E., Medhaug, I., Sand, M., and Seierstad, I. A.: The Norwegian Earth System Model, NorESM1-M – Part 2: Climate response and scenario projections, Geosci. Model Dev., 6, 389–415, https://doi.org/10.5194/gmd-6-389-2013, 2013. a
Katzenberger, A., Levermann, A., Schewe, J., and Pongratz, J.: Intensification of very wet monsoon seasons in India under global warming, Geophys. Res. Lett., 49, e2022GL098856, https://doi.org/10.1029/2022GL098856, 2022. a
Kirkevåg, A., Iversen, T., Seland, Ø., Hoose, C., Kristjánsson, J. E., Struthers, H., Ekman, A. M. L., Ghan, S., Griesfeller, J., Nilsson, E. D., and Schulz, M.: Aerosol–climate interactions in the Norwegian Earth System Model – NorESM1-M, Geosci. Model Dev., 6, 207–244, https://doi.org/10.5194/gmd-6-207-2013, 2013. a
Kohyama, T. and Hartmann, D. L.: Nonlinear ENSO warming suppression (NEWS), J. Climate, 30, 4227–4251, 2017. a
Kotz, M., Wenz, L., and Levermann, A.: Footprint of greenhouse forcing in daily temperature variability, P. Natl. Acad. Sci. USA, 118, e2103294118, https://doi.org/10.1073/pnas.2103294118, 2021. a
Lawrence, D. M., Hurtt, G. C., Arneth, A., Brovkin, V., Calvin, K. V., Jones, A. D., Jones, C. D., Lawrence, P. J., de Noblet-Ducoudré, N., Pongratz, J., Seneviratne, S. I., and Shevliakova, E.: The Land Use Model Intercomparison Project (LUMIP) contribution to CMIP6: rationale and experimental design, Geosci. Model Dev., 9, 2973–2998, https://doi.org/10.5194/gmd-9-2973-2016, 2016. a
Lee, J.-Y., Marotzke, J., Bala, G., Cao, L., Corti, S., Dunne, J. P., Engelbrecht, F., Fischer, E., Fyfe, J. C., Jones, C., Maycock, A., Mutemi, J., Ndiaye, O., Panickal, S., and Zhou, T.: Future Global Climate: Scenario-Based Projections and Near-Term Information, in: Climate Change 2021: The Physical Science Basis. Contribution of Working Group I to the Sixth Assessment Report of the Intergovernmental Panel on Climate Change, edited by: Masson-Delmotte, V., Zhai, P., Pirani, A., Connors, S. L., Péan, C., Berger, S., Caud, N., Chen, Y., Goldfarb, L., Gomis, M. I., Huang, M., Leitzell, K., Lonnoy, E., Matthews, J. B. R., Maycock, T. K., Waterfield, T., Yelekçi, O., Yu, R., and Zhou, B., Cambridge University Press,Cambridge, United Kingdom and New York, NY, USA, 553–672, https://doi.org/10.1017/9781009157896.006, 2021. a
Lund, M. T., Myhre, G., and Samset, B. H.: Anthropogenic aerosol forcing under the Shared Socioeconomic Pathways, Atmos. Chem. Phys., 19, 13827–13839, https://doi.org/10.5194/acp-19-13827-2019, 2019. a, b, c
Lund, M. T., Nordling, K., Gjelsvik, A. B., and Samset, B. H.: The influence of variability on fire weather conditions in high latitude regions under present and future global warming, Environmental Research Communications, 5, 065016, https://doi.org/10.1088/2515-7620/acdfad, 2023. a, b, c
Ma, F., Yuan, X., Jiao, Y., and Ji, P.: Unprecedented Europe heat in June–July 2019: Risk in the historical and future context, Geophys. Res. Lett., 47, e2020GL087809, https://doi.org/10.1029/2020GL087809, 2020. a
Mackallah, C., Chamberlain, M. A., Law, R. M., Dix, M., Ziehn, T., Bi, D., Bodman, R., Brown, J. R., Dobrohotoff, P., Druken, K., Evans, B., Harman, I. N., Hayashida, H., Holmes, R., Kiss, A. E., Lenton, A., Liu, Y., Marsland, S., Meissner, K., Menviel, L., O’Farrell, S., Rashid, H. A., Ridzwan, S., Savita, A., Srbinovsky, J., Sullivan, A., Trenham, C., Vohralik, P. F., Wang, Y.-P., Williams, G., Woodhouse, M. T., and Yeung, N.: ACCESS datasets for CMIP6: methodology and idealised experiments, Journal of Southern Hemisphere Earth Systems Science, 72, 93–116, https://doi.org/10.1071/ES21031, 2022. a
Mauritsen, T., Bader, J., Becker, T., Behrens, J., Bittner, M., Brokopf, R., Brovkin, V., Claussen, M., Crueger, T., Esch, M., Fast, I., Fiedler, S., Fläschner, D., Gayler, V., Giorgetta, M., Goll, D. S., Haak, H., Hagemann, S., Hedemann, C., Hohenegger, C., Ilyina, T., Jahns, T., Jimenéz-de-la Cuesta, D., Jungclaus, J., Kleinen, T., Kloster, S., Kracher, D., Kinne, S., Kleberg, D., Lasslop, G., Kornblueh, L., Marotzke, J., Matei, D., Meraner, K., Mikolajewicz, U., Modali, K., Möbis, B., Müller, W. A., Nabel, J. E. M. S., Nam, C. C. W., Notz, D., Nyawira, S.-S., Paulsen, H., Peters, K., Pincus, R., Pohlmann, H., Pongratz, J., Popp, M., Raddatz, T. J., Rast, S., Redler, R., Reick, C. H., Rohrschneider, T., Schemann, V., Schmidt, H., Schnur, R., Schulzweida, U., Six, K. D., Stein, L., Stemmler, I., Stevens, B., von Storch, J.-S., Tian, F., Voigt, A., Vrese, P., Wieners, K.-H., Wilkenskjeld, S., Winkler, A., and Roeckner, E.: Developments in the MPI-M Earth System Model version 1.2 (MPI-ESM1.2) and Its Response to Increasing CO2, J. Adv. Model. Earth Syst., 11, 998–1038, https://doi.org/10.1029/2018MS001400, 2019. a, b
Merikanto, J., Nordling, K., Räisänen, P., Räisänen, J., O'Donnell, D., Partanen, A.-I., and Korhonen, H.: How Asian aerosols impact regional surface temperatures across the globe, Atmos. Chem. Phys., 21, 5865–5881, https://doi.org/10.5194/acp-21-5865-2021, 2021. a
Myhre, G., Forster, P. M., Samset, B. H., Hodnebrog, O., Sillmann, J., Aalbergsjo, S. G., Andrews, T., Boucher, O., Faluvegi, G., Flaeschner, D., Iversen, T., Kasoar, M., Kharin, V., Kirkevag, A., Lamarque, J. F., Olivie, D., Richardson, T. B., Shindell, D., Shine, K. P., Stjern, C. W., Takemura, T., Voulgarakis, A., and Zwiers, F.: PDRMIP: A Precipitation Driver and Response Model Intercomparison Project-Protocol and preliminary results, B. Am. Meteorol. Soc., 98, 1185–1198, https://doi.org/10.1175/BAMS-D-16-0019.1, 2017. a
Myhre, G., Alterskjær, K., Stjern, C. W., Hodnebrog, Ø., Marelle, L., Samset, B. H., Sillmann, J., Schaller, N., Fischer, E., Schulz, M., and Stohl, A.: Frequency of extreme precipitation increases extensively with event rareness under global warming, Sci. Rep., 9, 16063, https://doi.org/10.1038/s41598-019-52277-4, 2019. a
Nath, S., Lejeune, Q., Beusch, L., Seneviratne, S. I., and Schleussner, C.-F.: MESMER-M: an Earth system model emulator for spatially resolved monthly temperature, Earth Syst. Dynam., 13, 851–877, https://doi.org/10.5194/esd-13-851-2022, 2022. a
Nordling, K.: Climate variability can outweigh the influence of climate mean changes for extreme precipitation under global warming, Zenodo [data set], https://doi.org/10.5281/zenodo.10796384, 2024. a
Nordling, K.: kallenordling/variability: Codes making figures for Climate variability can outweigh the influence of climate mean changes for extreme precipitation under global warming (Version v1), Zenodo [code], https://doi.org/10.5281/zenodo.14792740, 2025. a
Nordling, K., Korhonen, H., Räisänen, J., Partanen, A.-I., Samset, B. H., and Merikanto, J.: Understanding the surface temperature response and its uncertainty to CO2, CH4, black carbon, and sulfate, Atmos. Chem. Phys., 21, 14941–14958, https://doi.org/10.5194/acp-21-14941-2021, 2021. a
O'Neill, B. C., Tebaldi, C., van Vuuren, D. P., Eyring, V., Friedlingstein, P., Hurtt, G., Knutti, R., Kriegler, E., Lamarque, J.-F., Lowe, J., Meehl, G. A., Moss, R., Riahi, K., and Sanderson, B. M.: The Scenario Model Intercomparison Project (ScenarioMIP) for CMIP6, Geosci. Model Dev., 9, 3461–3482, https://doi.org/10.5194/gmd-9-3461-2016, 2016. a
Otto-Bliesner, B. L., Brady, E. C., Fasullo, J., Jahn, A., Landrum, L., Stevenson, S., Rosenbloom, N., Mai, A., and Strand, G.: Climate variability and change since 850 CE: An ensemble approach with the Community Earth System Model, B. Am. Meteorol. Soc., 97, 735–754, 2016. a
Pendergrass, A., Knutti, R., Lehner, F., Deser, C., and Sanderson, B.: Precipitation variability increases in a warmer climate, Sci. Rep., 7, 17966, https://doi.org/10.1038/s41598-017-17966-y, 2017. a
Persad, G., Samset, B. H., Wilcox, L. J., Allen, R. J., Bollasina, M. A., Booth, B. B. B., Bonfils, C., Crocker, T., Joshi, M., Lund, M. T., Marvel, K., Merikanto, J., Nordling, K., Undorf, S., van Vuuren, D. P., Westervelt, D. M., and Zhao, A.: Rapidly evolving aerosol emissions are a dangerous omission from near-term climate risk assessments, Environmental Research: Climate, 2, 032001, https://doi.org/10.1088/2752-5295/acd6af, 2023. a
Persad, G. G.: The dependence of aerosols' global and local precipitation impacts on the emitting region, Atmos. Chem. Phys., 23, 3435–3452, https://doi.org/10.5194/acp-23-3435-2023, 2023. a, b
Persad, G. G. and Caldeira, K.: Divergent global-scale temperature effects from identical aerosols emitted in different regions, Nat. Commun., 9, 3289, https://doi.org/10.1038/s41467-018-05838-6, 2018. a
Philip, S., Kew, S., van Oldenborgh, G. J., Otto, F., Vautard, R., van der Wiel, K., King, A., Lott, F., Arrighi, J., Singh, R., and van Aalst, M.: A protocol for probabilistic extreme event attribution analyses, Adv. Stat. Clim. Meteorol. Oceanogr., 6, 177–203, https://doi.org/10.5194/ascmo-6-177-2020, 2020. a
Rantanen, M. and Laaksonen, A.: The jump in global temperatures in September 2023 is extremely unlikely due to internal climate variability alone, npj Clim. Atmos. Sci., 7, 34, https://doi.org/10.1038/s41612-024-00582-9, 2024. a
Samset, B. H.: Aerosol absorption has an underappreciated role in historical precipitation change, Communications Earth & Environment, 3, 242, https://doi.org/10.1038/s43247-022-00576-6, 2022. a
Samset, B. H., Lund, M. T., Bollasina, M., Myhre, G., and Wilcox, L.: Emerging Asian aerosol patterns, Nat. Geosci., 12, 582–584, 2019a. a
Samset, B. H., Stjern, C. W., Lund, M. T., Mohr, C. W., Sand, M., and Daloz, A. S.: How Daily Temperature and Precipitation Distributions Evolve With Global Surface Temperature, Earths Future, 7, 1323–1336, 2019b. a, b, c
Schmidt, G. A., Kelley, M., Nazarenko, L., Ruedy, R., Russell, G. L., Aleinov, I., Bauer, M., Bauer, S. E., Bhat, M. K., Bleck, R., Canuto, V., Chen, Y.-H., Cheng, Y., Clune, T. L., Del Genio, A., de Fainchtein, R., Faluvegi, G., Hansen, J. E., Healy, R. J., Kiang, N. Y., Koch, D., Lacis, A. A., LeGrande, A. N., Lerner, J., Lo, K. K., Matthews, E. E., Menon, S., Miller, R. L., Oinas, V., Oloso, A. O., Perlwitz, J. P., Puma, M. J., Putman, W. M., Rind, D., Romanou, A., Sato, M., Shindell, D. T., Sun, S., Syed, R. A., Tausnev, N., Tsigaridis, K., Unger, N., Voulgarakis, A., Yao, M.-S., and Zhang, J.: Configuration and assessment of the GISS ModelE2 contributions to the CMIP5 archive, J. Adv. Model. Earth Syst., 6, 141–184, https://doi.org/10.1002/2013MS000265, 2014. a
Sillmann, J., Stjern, C. W., Myhre, G., Samset, B. H., Hodnebrog, Ø., Andrews, T., Boucher, O., Faluvegi, G., Forster, P., Kasoar, M. R., Kharin, V. V., Kirkevåg, A., Lamarque, J.-F., Olivié, D. J. L., Richardson, T. B., Shindell, D., Takemura, T., Voulgarakis, A., and Zwiers, F. W.: Extreme wet and dry conditions affected differently by greenhouse gases and aerosols, npj Clim. Atmos. Sci., 2, 24, https://doi.org/10.1038/s41612-019-0079-3, 2019. a
Sippel, S., Meinshausen, N., Fischer, E. M., Székely, E., and Knutti, R.: Climate change now detectable from any single day of weather at global scale, Nat. Clim. Change, 10, 35–41, 2020. a
Stevens, B., Fiedler, S., Kinne, S., Peters, K., Rast, S., Müsse, J., Smith, S. J., and Mauritsen, T.: MACv2-SP: a parameterization of anthropogenic aerosol optical properties and an associated Twomey effect for use in CMIP6, Geosci. Model Dev., 10, 433–452, https://doi.org/10.5194/gmd-10-433-2017, 2017. a
Stjern, C. W., Samset, B. H., Boucher, O., Iversen, T., Lamarque, J.-F., Myhre, G., Shindell, D., and Takemura, T.: How aerosols and greenhouse gases influence the diurnal temperature range, Atmos. Chem. Phys., 20, 13467–13480, https://doi.org/10.5194/acp-20-13467-2020, 2020. a
Suarez-Gutierrez, L., Müller, W. A., Li, C., and Marotzke, J.: Hotspots of extreme heat under global warming, Clim. Dynam., 55, 429–447, 2020. a
Swart, N. C., Cole, J. N. S., Kharin, V. V., Lazare, M., Scinocca, J. F., Gillett, N. P., Anstey, J., Arora, V., Christian, J. R., Hanna, S., Jiao, Y., Lee, W. G., Majaess, F., Saenko, O. A., Seiler, C., Seinen, C., Shao, A., Sigmond, M., Solheim, L., von Salzen, K., Yang, D., and Winter, B.: The Canadian Earth System Model version 5 (CanESM5.0.3), Geosci. Model Dev., 12, 4823–4873, https://doi.org/10.5194/gmd-12-4823-2019, 2019. a, b
Szopa, S., Naik, V., Adhikary, B., Artaxo, P., Berntsen, T., Collins, W., Fuzzi, S., Gallardo, L., Kiendler-Scharr, A., Klimont, Z., Liao, H., Unger, N., and Zanis, P.: Short-Lived Climate Forcers, in: Climate Change 2021: The Physical Science Basis. Contribution of Working Group I to the Sixth Assessment Report of the Intergovernmental Panel on Climate Change, edited by: Masson-Delmotte, V., Zhai, P., Pirani, A., Connors, S. L., Péan, C., Berger, S., Caud, N., Chen, Y., Goldfarb, L., Gomis, M. I., Huang, M., Leitzell, K., Lonnoy, E., Matthews, J. B. R., Maycock, T. K., Waterfield, T., Yelekçi, O., Yu, R., and Zhou, B., book section 6, Cambridge University Press, Cambridge, UK and New York, NY, USA, https://doi.org/10.1017/9781009157896.008, 2021. a
Takemura, T., Nozawa, T., Emori, S., Nakajima, T. Y., and Nakajima, T.: Simulation of climate response to aerosol direct and indirect effects with aerosol transport-radiation model, J. Geophys. Res.-Atmos., 110, D02202, https://doi.org/10.1029/2004JD005029, 2005. a
Takemura, T., Egashira, M., Matsuzawa, K., Ichijo, H., O'ishi, R., and Abe-Ouchi, A.: A simulation of the global distribution and radiative forcing of soil dust aerosols at the Last Glacial Maximum, Atmos. Chem. Phys., 9, 3061–3073, https://doi.org/10.5194/acp-9-3061-2009, 2009. a
The HadGEM2 Development Team: G. M. Martin, Bellouin, N., Collins, W. J., Culverwell, I. D., Halloran, P. R., Hardiman, S. C., Hinton, T. J., Jones, C. D., McDonald, R. E., McLaren, A. J., O'Connor, F. M., Roberts, M. J., Rodriguez, J. M., Woodward, S., Best, M. J., Brooks, M. E., Brown, A. R., Butchart, N., Dearden, C., Derbyshire, S. H., Dharssi, I., Doutriaux-Boucher, M., Edwards, J. M., Falloon, P. D., Gedney, N., Gray, L. J., Hewitt, H. T., Hobson, M., Huddleston, M. R., Hughes, J., Ineson, S., Ingram, W. J., James, P. M., Johns, T. C., Johnson, C. E., Jones, A., Jones, C. P., Joshi, M. M., Keen, A. B., Liddicoat, S., Lock, A. P., Maidens, A. V., Manners, J. C., Milton, S. F., Rae, J. G. L., Ridley, J. K., Sellar, A., Senior, C. A., Totterdell, I. J., Verhoef, A., Vidale, P. L., and Wiltshire, A.: The HadGEM2 family of Met Office Unified Model climate configurations, Geosci. Model Dev., 4, 723–757, https://doi.org/10.5194/gmd-4-723-2011, 2011. a, b
van der Wiel, K. and Bintanja, R.: Contribution of climatic changes in mean and variability to monthly temperature and precipitation extremes, Communications Earth & Environment, 2, 1, https://doi.org/10.1038/s43247-020-00077-4, 2021. a
Walters, D. N., Williams, K. D., Boutle, I. A., Bushell, A. C., Edwards, J. M., Field, P. R., Lock, A. P., Morcrette, C. J., Stratton, R. A., Wilkinson, J. M., Willett, M. R., Bellouin, N., Bodas-Salcedo, A., Brooks, M. E., Copsey, D., Earnshaw, P. D., Hardiman, S. C., Harris, C. M., Levine, R. C., MacLachlan, C., Manners, J. C., Martin, G. M., Milton, S. F., Palmer, M. D., Roberts, M. J., Rodríguez, J. M., Tennant, W. J., and Vidale, P. L.: The Met Office Unified Model Global Atmosphere 4.0 and JULES Global Land 4.0 configurations, Geosci. Model Dev., 7, 361–386, https://doi.org/10.5194/gmd-7-361-2014, 2014. a
Watanabe, M., Suzuki, T., O’ishi, R., Komuro, Y., Watanabe, S., Emori, S., Takemura, T., Chikira, M., Ogura, T., Sekiguchi, M., Takata, K., Yamazaki, D., Yokohata, T., Nozawa, T., Hasumi, H., Tatebe, H., and Kimoto, M.: Improved Climate Simulation by MIROC5: Mean States, Variability, and Climate Sensitivity, J. Climate, 23, 6312–6335, http://www.jstor.org/stable/26190291 (last access: 9 April 2024), 2010. a
Watson-Parris, D., Williams, A., Deaconu, L., and Stier, P.: Model calibration using ESEm v1.1.0 – an open, scalable Earth system emulator, Geosci. Model Dev., 14, 7659–7672, https://doi.org/10.5194/gmd-14-7659-2021, 2021. a
Westervelt, D. M., Mascioli, N. R., Fiore, A. M., Conley, A. J., Lamarque, J.-F., Shindell, D. T., Faluvegi, G., Previdi, M., Correa, G., and Horowitz, L. W.: Local and remote mean and extreme temperature response to regional aerosol emissions reductions, Atmos. Chem. Phys., 20, 3009–3027, https://doi.org/10.5194/acp-20-3009-2020, 2020. a
Wilcox, L. J., Dunstone, N., Lewinschal, A., Bollasina, M., Ekman, A. M. L., and Highwood, E. J.: Mechanisms for a remote response to Asian anthropogenic aerosol in boreal winter, Atmos. Chem. Phys., 19, 9081–9095, https://doi.org/10.5194/acp-19-9081-2019, 2019. a
Wilcox, L. J., Liu, Z., Samset, B. H., Hawkins, E., Lund, M. T., Nordling, K., Undorf, S., Bollasina, M., Ekman, A. M. L., Krishnan, S., Merikanto, J., and Turner, A. G.: Accelerated increases in global and Asian summer monsoon precipitation from future aerosol reductions, Atmos. Chem. Phys., 20, 11955–11977, https://doi.org/10.5194/acp-20-11955-2020, 2020. a, b, c, d, e, f
WMO: Provisional State of the Global Climate in 2023, WMO, https://wmo.int/publication-series/provisional-state-of-global-climate-2023 (last access: 9 April 2024), 2023. a
Xiong, J., Guo, S., Abhishek, Chen, J., and Yin, J.: Global evaluation of the “dry gets drier, and wet gets wetter” paradigm from a terrestrial water storage change perspective, Hydrol. Earth Syst. Sci., 26, 6457–6476, https://doi.org/10.5194/hess-26-6457-2022, 2022. a
Yang, Y., Ren, L., Wu, M., Wang, H., Song, F., Leung, L. R., Hao, X., Li, J., Chen, L., Li, H., Zeng, L., Zhou, Y., Wang, P., Liao, H., Wang, J., and Zhou, Z.-Q.: Abrupt emissions reductions during COVID-19 contributed to record summer rainfall in China, Nat. Commun., 13, 959, https://doi.org/10.1038/s41467-022-28537-9, 2022. a
Zelinka, M. D., Myers, T. A., Mccoy, D. T., Po-Chedley, S., Caldwell, P. M., Ceppi, P., Klein, S. A., and Taylor, K. E.: Causes of higher climate sensitivity in CMIP6 models, Geophys. Res. Lett., 47, e2019GL085782, https://doi.org/10.1029/2019GL085782, 2020. a
Zhang, W., Furtado, K., Wu, P., Zhou, T., Chadwick, R., Marzin, C., Rostron, J., and Sexton, D.: Increasing precipitation variability on daily-to-multiyear time scales in a warmer world, Sci. Adv., 7, eabf8021, https://doi.org/10.1126/sciadv.abf8021, 2021. a, b
Zhang, W., Zhou, T., and Wu, P.: Anthropogenic amplification of precipitation variability over the past century, Science, 385, 427–432, 2024. a
Ziehn, T., Chamberlain, M. A., Law, R. M., Lenton, A., Bodman, R. W., Dix, M., Stevens, L., Wang, Y.-P., and Srbinovsky, J.: The Australian earth system model: ACCESS-ESM1.5, Journal of Southern Hemisphere Earth Systems Science, 70, 193–214, 2020. a, b, c
- Abstract
- Introduction
- Method and data
- Results
- Discussion
- Conclusions
- Appendix A: Results from PDRMIP
- Appendix B: Main figures for DJF
- Appendix C: Near future
- Appendix D: Model discrepancies
- Code availability
- Data availability
- Author contributions
- Competing interests
- Disclaimer
- Acknowledgements
- Financial support
- Review statement
- References