the Creative Commons Attribution 4.0 License.
the Creative Commons Attribution 4.0 License.
 | 13 Nov 2025
Atmospheric and watershed modelling of trifluoroacetic acid from oxidation of HFO-1234ze(E) released by prospective pressurised metered-dose inhaler use in three major river basins
Shivendra G. Tewari
Krish Vijayaraghavan
Liji M. David
Katie Tuite
Felix Kristanovich
Yuan Zhuang
Benjamin Yang
Cecilia Hurtado
Dimitrios K. Papanastasiou
Paul Giffen
Holly Kimko
Megan Gibbs
Stefan Platz
Trans-1,3,3,3-tetrafluoroprop-1-ene (HFO-1234ze(E); E-CF3CH=CHF) is a hydrofluoroolefin (HFO) with near-zero global warming potential, developed as a propellant for use in pressurised metered-dose inhalers (pMDIs). HFO-1234ze(E) contains a “–CF3” moiety, which makes formation of trifluoroacetic acid (TFA) possible in the atmosphere. To quantify the contribution of TFA formed from prospective HFO-1234ze(E)-based pMDIs, we applied a global atmospheric model coupled with detailed watershed modelling. Our atmospheric model incorporates the master chemical mechanism for HFO-1234ze(E) and assumes pMDIs as its sole emission source. Based on global pMDI volume-sales data, we estimate HFO-1234ze(E) emissions at 4.736 Gg yr−1. Although emissions are higher in northern-temperate regions, our model predicts that the highest TFA deposition rates occur in the tropics, likely due to more intensive photolysis of trifluoroacetic aldehyde in temperate zones (favouring non-TFA products) and/or transport of TFA into the tropical zone from nearby regions. Using predicted TFA deposition rates around the Hudson, Cauvery, and Rhine river basins, we applied a fate-and-transport model to estimate TFA concentrations in surface water, soil, and sediments over 30 years. Modelled surface-water TFA levels ranged from 0.8 to 19.3 ng L−1 across the three watersheds, indicating substantial variability between regions. Comparison of Rhine results with the conservative Netherlands drinking-water thresholds (2200 ng L−1) yields a margin of exposure of approximately 700-to-2500-fold. These findings suggest that modelled TFA levels from continuous pMDI-related HFO-1234ze(E) emissions over the study period in the Rhine region are unlikely to pose a risk to human health or the environment.
- Article
(6553 KB) - Full-text XML
-
Supplement
(4324 KB) - BibTeX
- EndNote


Asthma and chronic obstructive pulmonary disease (COPD) are potentially life-threatening diseases, affecting roughly half a billion people globally and cause nearly 4 million deaths each year (Soriano et al., 2020). Patients living with respiratory diseases generally rely on pressurised metered dose inhalers (pMDIs), dry powder inhalers, or soft-mist inhalers for treatment of these conditions. Of these options, pMDIs are the most prescribed devices globally with greater than 90 % usage in some countries (Bell et al., 2023). pMDI devices rely on a medical propellant for delivering the active pharmaceutical ingredient (API) to a patient's lungs. Present-day pMDI devices use hydrofluorocarbons (HFCs) as the medical propellant; however, all HFC-based propellants have high global warming potential (GWP), e.g., HFC-134a has a GWP (100-year time horizon) that is 1470 times greater than CO2 (WMO, 2022), and are subject to phase down under the Kigali Amendment of the Montreal Protocol (Heath, 2017). The American Innovation and Manufacturing (AIM) Act, enacted by Congress in 2020, authorised US Environmental Protection Agency (EPA) to phase down the production and consumption of hydrofluorocarbons, such as HFCs, by 2036 (Logan, 2021). Similarly, the European F-gas regulation aims to reduce the supply of HFCs to 3 % of the original baseline by 2050 (Official Journal of the European Union, 2024).
To ensure supply of these essential medications to patients, the pharmaceutical industry in collaboration with Honeywell has developed a near-zero GWP medical propellant (Tewari et al., 2023), trans-1,3,3,3-tetrafluoroprop-1-ene (the E-isomer), correctly written as E-CF3CH=CHF or HFO-1234ze(E) or next-generation medical propellant (NGP) (a hydrofluoroolefin; HFO), with initial pMDI devices expected to transition this year and transition of all pMDI devices anticipated by 2030. The direct GWP (100-year time horizon) of HFO-1234ze(E) is 1 (WMO, 2022). McGillen et al. (2023) reported a small yield (∼3 %) of trifluoromethane (HFC-23; CHF3) from its atmospheric degradation, suggesting the GWP could increase to about 12 on a 100-year horizon. However, their model used temperature-independent rate coefficients, even though these reactions are known to have strong temperature dependence. For example, the ozone reaction rate with cis-dichloroethene – a compound with similar reactivity to HFO-1234ze(E) – decreases by a factor of about 100 between 298 and 220 K (Leather et al., 2011). Moreover, the reaction rate constants indicate that OH-initiated chemistry is expected to dominate over ozonolysis (McGillen et al., 2023). Therefore, accounting for this temperature dependence would be expected to further reduce the estimated loss of HFO-1234ze(E) via ozone reaction by McGillen et al. (2023), and thus lower both the predicted global yield of HFC-23 and the indirect GWP of HFO-1234ze(E). Because the formation of HFC-23 via the ozonolysis pathway represents a minor contribution relative to OH-driven removal and other loss pathways, we did not pursue HFC-23 production in this study.
According to the Organization for Economic Cooperation and Development (OECD) definition, HFO-1234ze(E) belongs to a group of synthetic chemicals called per- and polyfluoroalkyl substances (PFAS) which are typically resistant to environmental breakdown. PFAS are a group of nearly 15 000 known chemicals (Williams et al., 2017) with substantially diverse physicochemical properties, e.g., HFO-1234ze(E) upon release in the atmosphere breaks down within ∼20 d (Tewari et al., 2023; Neale et al., 2021) while some PFAS can take tens of decades to decompose, e.g., perfluorooctanoic acid. Despite the diverse structure and behaviour of PFAS chemicals, in 2023, five European Union (EU) countries submitted a blanket-restriction proposal under the Registration, Evaluation, Authorisation and Restriction of Chemicals (REACH) banning all manufacturing and usage of PFAS in the EU with exceptions for human and veterinary APIs, biocides, pesticides, and a few fully degradable PFAS subgroups.
HFO-1234ze(E) falls under the purview of the PFAS-restriction proposal because its structure contains a trifluoromethyl group (–CF3) which makes formation of trifluoroacetic acid (TFA) possible in the atmosphere; TFA is the most abundant PFAS in the environment (Arp et al., 2024); presently, there are nearly 2000 known chemicals that have the potential of forming TFA in the environment (Adlunger et al., 2022). The atmospheric chemistry of HFO-1234ze(E) has been the subject of a few past studies and is relatively well understood (Søndergaard et al., 2007; Javadi et al., 2008; Burkholder et al., 2015b). HFO-1234ze(E) primarily interacts with OH radicals in the atmosphere, leading to the formation of trifluoroacetic aldehyde (TFAA) as the main product (Javadi et al., 2008; Burkholder et al., 2015b). TFAA is mainly eliminated from the atmosphere through photolysis, a process that does not result in the formation of TFA (Tewari et al., 2023). However, it has been suggested that the OH-initiated TFAA atmospheric degradation and the subsequent reaction of the corresponding peroxy radicals with HO2 radicals can lead to TFA formation (Sulbaek-Andersen et al., 2004). In addition, several other TFAA degradation pathways have been suggested in the literature, e.g., ozonolysis reaction (Pérez-Peña et al., 2023; Sulbaek-Andersen and Nielsen, 2022), gem-diol formation (Calvert et al., 2011), the HO2 reaction channel (Long et al., 2022), which, ultimately, can affect the overall atmospheric chemistry of HFO-1234ze(E) and therefore its potential to form TFA. To the best of our knowledge, except for a box-modelling study using a simplistic HFO-1234ze(E) degradation mechanism (Tewari et al., 2023), there is no other work that explored the formation of TFA from HFO-1234ze(E) utilising a global chemical transport modelling. Lastly, provided that any TFA formed from the atmospheric degradation of fluorinated gases is, eventually, deposited on Earth's surface via wet and dry deposition, it is also important to evaluate its fate and transport in surface soil and water media, upon deposition.
We therefore performed a state-of-the-art study coupling global chemical transport modelling with TFA surface fate and transport modelling to estimate surface water, sediment, and surface soil concentrations of TFA over a period of 30 years due to continued, global sales of prospective pMDIs using only HFO-1234ze(E) as the medical propellant. We used IQVIA MIDAS® monthly volume sales for 2022, for 51 countries, to estimate the volume of propellant present in all pMDI units sold worldwide. Lastly, we compared our estimates of environmental TFA production due to pMDI usage with that from all other sources.
2.1 Software
We applied a global three-dimensional Eulerian chemical transport model, GEOS-Chem (version 14.2.2, https://doi.org/10.5281/zenodo.10034733, The International GEOS-Chem User Community, 2023), driven by meteorological data assimilated from the Goddard Earth Observing System (GEOS) at the National Aeronautics and Space Administration (NASA) Global Modeling and Assimilation Office. The model incorporates a detailed mechanism for oxidant-aerosol chemistry computed within the troposphere and the stratosphere at 30 min time intervals using a fourth-order Rosenbrock kinetic solver implemented with the Kinetic preprocessor version 3.0 (Lin et al., 2023). Emissions were calculated at 30 min time steps using the Harmonized Emissions Component (HEMCO) module version 3.0 (Lin et al., 2021).
In this study, GEOS-Chem was configured to use modern-era retrospective analysis for research and applications, version 2 (MERRA-2) reanalysis meteorology data with varying temporal resolutions: 3 h for three-dimensional fields, such as wind components (zonal wind and meridional wind) and temperature, and hourly for surface variables and mixing depths, including soil moisture, heat fluxes, and albedo (Gelaro et al., 2017). We conducted the global modelling at a 2° × 2.5° resolution across 47 vertical “eta” levels from the surface to approximately 80 km; here, “eta” refers to vertical levels in hybrid sigma-pressure coordinates. Additionally, the horizontal resolution of the meteorological fields was updated to align with the 2° × 2.5° grid of the model. The wet deposition of aerosols and soluble gases by precipitation includes the scavenging in convective updrafts, in-cloud rainout, and below-cloud washout (Liu et al., 2001). The dry deposition was calculated using a resistance-in-series parameterisation, which is dependent on environmental variables and lookup table values (Wesely, 2007). To obtain initial concentrations, model spin-up simulations were performed at 4° × 5° grid resolution for approximately eight years until the concentrations of species varied little from one year to the next. The final simulations were performed at 2° × 2.5° resolution for the year 2022.
2.2 Anthropogenic and Natural Trace gas, and HFO1234ze(E) emissions
The global anthropogenic emissions are from the Community Emissions Data System (CEDS version 2) inventory for 1980–2019 at 0.1° × 0.1° resolution (Hoesly et al., 2018). They include chemically reactive gases (sulfur dioxide, SO2; nitrogen oxides NOx; ammonia, NH3; methane, CH4; carbon monoxide, CO; and non-methane volatile organic compounds, NMVOCs), carbonaceous aerosol (black carbon and organic carbon), and carbon dioxide (CO2). Emissions are provided on an annual basis at the level of country and sector, with a monthly temporal resolution. The CEDS inventory includes emissions from ships for all species included in the inventory and is used as the global ship emissions inventory in the model. Ethane emissions were from Tzompa-Sosa et al. (2017) and propane emissions from Xiao et al. (2008). Aircraft emissions are from the AEIC 2019 inventory (Simone et al., 2013). The monthly-averaged 0.25° × 0.25° biomass burning emissions were obtained from the Global Fire Emissions Database version 4 (GFED4, van der Werf et al., 2017). The biogenic volatile organic compounds emissions were derived from the Model of Emissions of Gases and Aerosols from Nature (MEGAN) version 2.1 (Guenther et al., 2012), as implemented by Hu et al. (2015), and calculated offline to improve reproducibility across scales (Weng et al., 2020). The mineral dust emissions were calculated offline at native meteorological resolution using the Dust Entrainment and Deposition scheme of Zender et al. (2003), combined with an updated high-resolution dust source function (Meng et al., 2021). Sea salt emissions from the open ocean are dependent on wind speed and sea surface temperature, and follow the algorithm of Jaeglé et al. (2011). The algorithm for above-canopy soil NOx emissions follows Hudman et al. (2012), with the efficiency of loss to the canopy depending on vegetation type and density. Emissions from other natural sources (e.g., lightning and volcanoes) were also included (Carn et al., 2015; Murray et al., 2012).
To estimate global HFO-1234ze(E) emissions from prospective pMDI use, we used IQVIA MIDAS® monthly sales data for the top 51 countries in 2022 (see Supplement), based on an assumed daily dose of 4 puffs per day and approximately 14 g of HFO-1234ze(E) per pMDI unit. These emissions were calculated as monthly totals and then spatially distributed within each country using NO emissions from the residential and commercial sectors in the CEDS inventory as a proxy. This method assumes that NO emissions in these sectors correlate with population density and, therefore, with likely pMDI usage. As a result, the spatial resolution of our emission estimates matches that of the CEDS proxy data and does not represent the true distribution of pMDI use among patients with respiratory diseases. Global spatial patterns of estimated HFO-1234ze(E) emissions are discussed in Sect. 3.
2.3 HFO-1234ze(E) degradation mechanism
The standard GEOS-Chem model uses a set of chemical mechanisms implemented with a kinetic preprocessor. The model includes aerosol chemistry and stratospheric chemistry (Eastham et al., 2014), and reaction rates and products are based on NASA Jet Propulsion Laboratory (JPL) Panel for Data Evaluation or the International Union of Pure and Applied Chemistry (IUPAC) Task Group on Atmospheric Chemical Kinetic Data Evaluation recommendations (Burkholder et al., 2015a; Sander et al., 2006, 2010). Photolysis frequencies are calculated with the Fast-JX code (version 7.0) (Bian and Prather, 2002) as implemented in GEOS-Chem by Mao et al. (2010) for the troposphere and by Eastham et al. (2014) for the stratosphere. There are a total of 921 reactions, including 104 photolysis reactions, in the model.
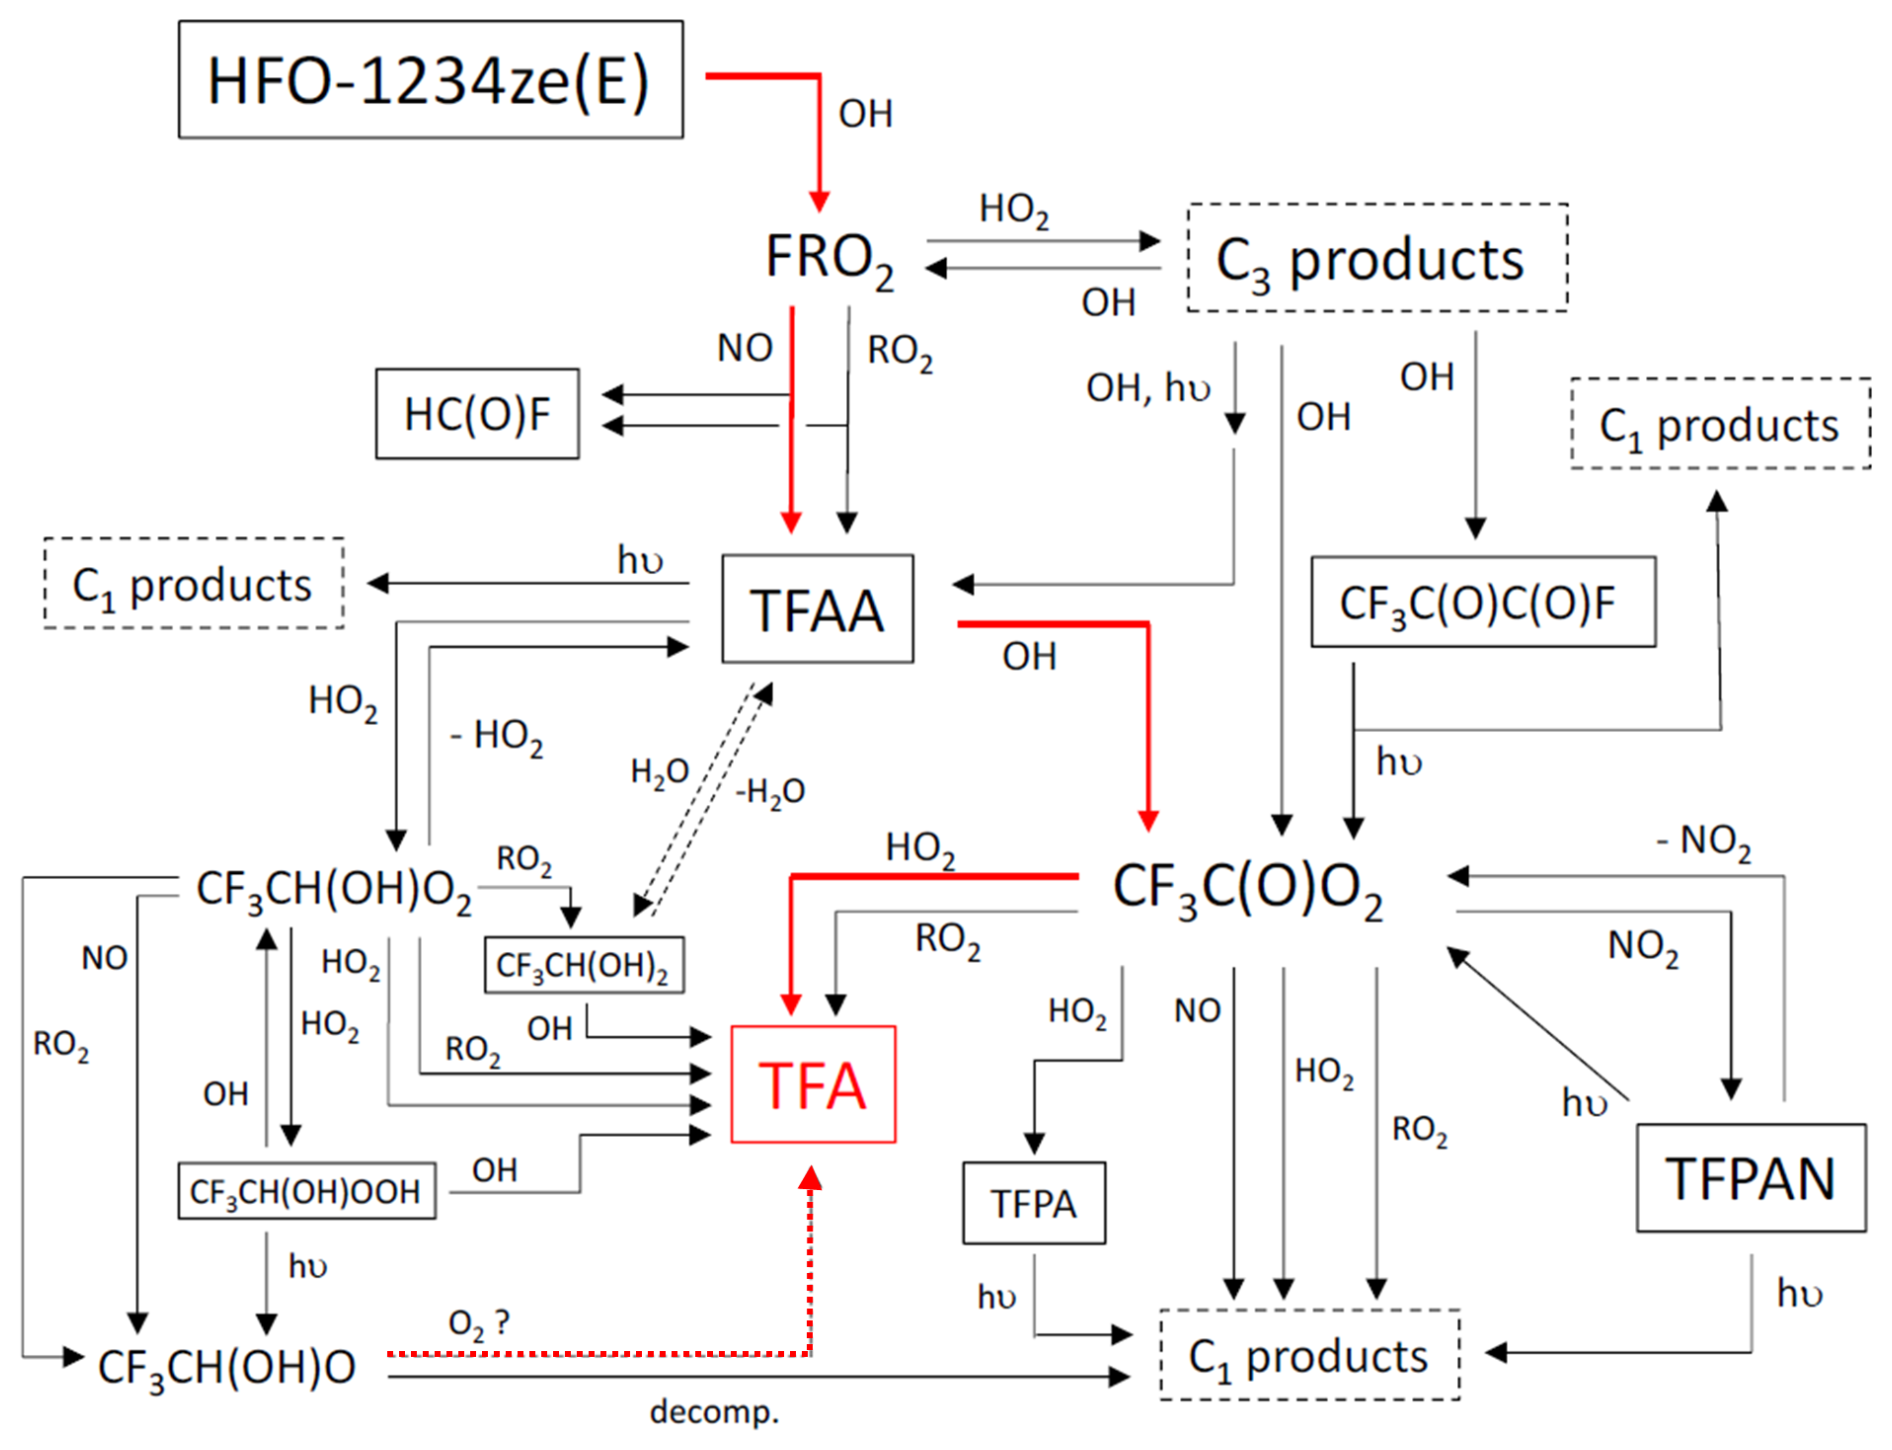
Figure 1Schematic of gas-phase degradation mechanism for HFO-1234ze(E). Solid red arrows show the primary route for TFA (trifluoroacetic acid, CF3C(O)OH) formation; dashed red arrow shows the theoretical route of TFA formation via the reaction of TFAA with HO2 (Long et al., 2022). The in-cloud hydration of TFAA (shown using dotted lines) followed by its outgassing and reaction with OH radicals has been discussed as a possible route to TFA formation; however, due to lack of sufficient information, this pathway has not been considered in the existing mechanism. Abbreviations: FRO2, peroxy radicals CF3CH(OH)CH(O2)F and CF3CH(O2)CH(OH)F; TFAA, trifluoroacetic aldehyde; TFPAN, trifluoracetyl peroxy nitrate; TFPA, trifluoroperacetic acid; and C3 products, CF3CH(OH)CH(OOH)F, CF3CH(OOH)CH(OH)F, CF3CH(OH)C(O)F and CF3C(O)CH(OH)F.
A detailed gas phase degradation mechanism for HFO-1234ze(E) has been constructed, in a format that is compatible with that used in the Master Chemical Mechanism, MCM (Jenkin et al., 1997, 2003, 2015; Saunders et al., 2003). The mechanism makes use of published kinetic and mechanistic information relevant to HFO-1234ze(E) degradation and, where possible, applies parameters recommended either by the IUPAC https://iupac.aeris-data.fr (last access: 26 October 2023), http://jpldataeval.jpl.nasa.gov/ (last access: 26 October 2023) or the JPL. Where no information is available, kinetic parameters and product channel contributions are estimated using published estimation methods, e.g., Jenkin et al. (2019), Kwok and Atkinson (1995), or assigned by analogy with chemistry reported for structurally similar species. Figure 1 shows the full mechanism, which contains 68 reactions. Table S1 in the Supplement describes these reactions and the origin of the assigned kinetic parameters. To reduce the computational burden of the GEOS-Chem model, we have simplified the mechanism to twenty-nine reactions, including four photolysis reactions and reactions associated with TFA formation. We have excluded some atmospheric species, such as O2 and H2O, from the chemical reactions since concentrations of these species are provided by the meteorological input data (MERRA2) and including them explicitly in every chemical reaction can add unnecessary complexity without significantly improving the model accuracy.
The first step is the hydroxyl radical (OH)-initiated oxidation of CF3CH=CHF, represented by a single reaction in GEOS-Chem (Tewari et al., 2023):
Here, FRO2 denotes the peroxy-radicals CF3CH(OH)CH(O2)F and CF3CH(O2)CH(OH)F. The rate constant for Reaction (R1) is from the IUPAC (Ammann et al., 2016). The peroxy radical from Reaction (R1) reacts with NO and HO2. The reaction with NO generates 2,2,2- trifluoroacetic aldehyde (TFAA; CF3CHO) and formyl fluoride (HCOF), while its reaction with HO2 forms a hydroxy-carbonyl product, CF3CH(OH)C(O)F:
The rate constants for Reactions (R2) and (R3) are based on IUPAC recommendations for similar species (Ammann et al., 2016). The hydroxy-carbonyl product (R3) is removed from the atmosphere by reacting with hydroxyl radical forming 3,3,3-trifluoro-2-oxo-propionyl fluoride, CF3C(O)C(O)F, and CF3CHO:
We included the photolysis of CF3C(O)C(O)F, which forms acyl peroxy radicals (CF3C(O)O2) given as:
A wavelength dependent cross-section of CH3C(O)CHO (Ammann et al., 2016) was used for CF3C(O)C(O)F as shown in Fig. S1 in the Supplement. The wavelength dependent quantum yield is also based on CH3C(O)CHO and is 1 between 225–380 nm but decreases at higher wavelengths.
There are two major pathways for the degradation of CF3CHO in the atmosphere. First, it undergoes photolysis. The initial products formed via photolysis undergo a series of additional reactions to give CO2 and hydrogen fluoride (HF) (Sulbaek-Andersen et al., 2018):
For Reaction (R5a), we applied a wavelength-dependent cross-section (Ammann et al., 2016), shown in Fig. S1. A wavelength-dependent quantum yield was calculated considering the recommended values from IUPAC (Ammann et al., 2016) and values from Sulbaek-Andersen and Nielsen (2022). Second, oxidation initiated by OH radical produces CF3C(O)O2, which can react with HO2, NO, and NO2.
Because IUPAC only provides a rate recommendation for Recation (R5b) at 298 K (Ammann et al., 2016), we determined the temperature dependence of Recation (R5b) using IUPAC recommendations for CCl3CHO, which has comparable reactivity. There are several reactions and reaction channels for CF3C(O)O2 that compete with its TFA-forming reaction with HO2:
According to kinetic analysis data from Maricq et al. (1996) and Wallington et al. (1994), IUPAC recommends a rate constant for Reaction (R6a) of exp(560/T) cm3 molec.−1 s−1. Reaction (R6b) is a termolecular reaction, with its rate coefficient depending on pressure. The IUPAC recommended value for this rate coefficient is based on data from Wallington et al. (1994). The product of Reaction (R6b) is trifluoracetyl peroxy nitrate (TFPAN), which is thermally unstable and dissociates back into reactants (Reaction R6c) at higher temperatures, exhibiting strong temperature dependence. The TFPAN lifetime ranges from approximately 0.5 d at the Earth's surface to several months or even years at higher altitudes (Ammann et al., 2016). Consequently, TFPAN is expected to undergo significant transport within the troposphere and can serve as a reservoir for CF3C(O)O2, which may be released again in warmer regions. In addition to Reaction (R6c), TFPAN can also photolyse:
The assigned photolysis rates for TFPAN are based on the absorption cross sections recommended by the NASA JPL (Burkholder et al., 2020), and typically result in a lifetime with respect to photolysis of about 2 or 3 weeks, with photolysis becoming the major loss reaction at altitudes above about 4 km. Reactions (R7a)–(R7c) comprise a complex sequence of processes, with Reaction (R7b) forming TFA (CF3C(O)OH). Because the branching ratios for Reactions (R7a–c) have been evaluated at only 296 K by (Sulbaek-Andersen et al., 2004), we have considered them to be temperature independent in this study. Among these reactions, Reaction (R7c) is predominant with a branching ratio of 0.56±0.05, followed by Reaction (R7b) with 0.38±0.04 and Reaction (R7a) with 0.09±0.04. By analogy with the corresponding reaction for CH3C(O)O2, the contribution of channel (Reaction R7a) might be expected to increase at lower temperatures and needs to be experimentally investigated. We have also considered the reaction of CF3C(O)O2 with the tropospheric pool of peroxy radicals, RO2, i.e., CH3O2. The reaction in this case was based on the IUPAC recommendation for the reaction of CH3C(O)O2 with CH3O2:
Reaction (R8b) provides an additional pathway to TFA formation but is calculated to be an order of magnitude less important than Reaction (R7b). CF3CHO formed in reaction R4b can react with HO2 (Reaction R5c) that has been characterised in a theoretical study by Long et al.(2022).
Under most tropospheric conditions, the significance of Reaction (R5c) is constrained by the rapid thermal decomposition of the peroxy radical, CF3CH(OH)O2, which produces CF3CHO and HO2 (Reaction R9a), as reported by Long et al. (2022). However, this decomposition rate is highly temperature dependent. At the lower temperatures found in the upper troposphere, the subsequent reactions of CF3CH(OH)O2 with NO (Reaction R9b) and HO2 (Reaction R9c) become competitive, potentially creating pathways for TFA formation. Reaction R9b combines two potential pathways for the initially formed intermediate species CF3CH(OH)O, which can decompose to form HCOOH (Orlando et al., 2000; Jenkin et al., 2005) and CF3C(O)O or can react with O2 to form TFA and HO2. While the decomposition pathway is expected to be significant throughout the troposphere, reaction with O2 may be competitive at high altitudes and low temperatures and its inclusion in the chemical mechanism likely provides an upper estimate of TFA formation.
The impact of Reactions (R9a), (R9b), and (R9c) on TFA formation is critically dependent on the competition between the thermal decomposition of the peroxy radical (Reaction R9a) and its reaction with NO (Reaction R9b) and HO2 (Reaction R9c). Additionally, CF3CH(OH)OOH can be oxidised by the OH radical and can also undergo photolysis, and Reactions (R10a) and (R10c) have the potential to lead to TFA formation.
A wavelength dependent cross-section for CH3OOH was applied to CF3CH(OH)OOH in reaction R10c as recommended by IUPAC (Fig. S1). Gas-phase TFA is expected to be deposited either through dry or wet deposition or by reacting with OH radicals as follows:
2.4 Surface fate and transport modelling of TFA
We next performed modelling to assess the fate and transport of TFA in surface water resulting from environmental TFA deposition due to atmospheric degradation of HFO-1234ze(E) via reactions presented in Sect. 2.3. Specifically, we used GEOS-Chem to calculate gridded deposition fields, including TFA wet, dry, and total deposition values in kg km−2 yr−1 for each grid cell at a spatial resolution of 2° × 2.5°. These data were then imported into a Geographic Information System and overlaid with the watershed boundaries. A weighted average was computed for each subbasin, based on the area of overlap between the TFA deposition data and the watershed boundaries, to produce a subbasin-specific, area-weighted average TFA deposition.
We chose the Hudson River, Rhine River, and Cauvery River as three representative watersheds, also known as drainage basins or catchment areas. In addition to their large populations (see Figs. S2–S4), we selected these three watersheds for the following specific reasons: (i) the Rhine watershed in Europe was chosen as the primary location due to the availability of numerous TFA-related literature references for comparison; (ii) the Hudson (USA) watershed was selected because the USA has the highest pMDI volume sales globally and the Hudson River basin's proximity to New York City – which has the country's highest population density – implies high pMDI usage (i.e., propellant emissions) within the USA; and (iii) although the phasedown of HFCs in India will take longer than in the USA or Europe, we selected India as the third location because it has the third-largest pMDI volume sales in the world, after the USA and the UK. Since we were already considering the Rhine watershed (Europe), we decided to include India instead of the UK as the third location. The selection of the Cauvery watershed within India was guided by the availability of watershed modelling parameters and the fact that it represents a source of drinking water to a very large population centre, i.e., Bengaluru (see Fig. S4).
The TFA concentrations in the surface water, sediment, and soil in the Hudson River, Rhine River, and Cauvery River watersheds were simulated through fate and transport modelling based on the model-predicted annual average deposition rates (see Results & Discussion). The modelling methodology aligns with the USEPA Human Health Risk Assessment Protocol (HHRAP) for Hazardous Waste Combustion Facilities (United States Environmental Protection Agency, 2005). We determined the TFA loading of the water column using the following mechanisms: (1) Direct deposition, (2) Runoff from surfaces within the watershed, (3) Soil erosion over the total watershed, (4) Benthic burial, (5) Inputs from the upstream river segment, and (6) Discharge to ocean. We assumed that the contributions from other potential mechanisms as compared to those listed above are negligible. Because TFA is resistant to degradation in the environment, we do not account for chemical or biological transformation of TFA after it is deposited on the ground or on surface water. In this model, we have not considered evaporative loss of TFA into the environment because TFA ionises in water and should not evaporate in the river. Table 1 lists the physical and chemical properties of TFA used in the modelling.
Table 1Physical/Chemical Properties for TFA.
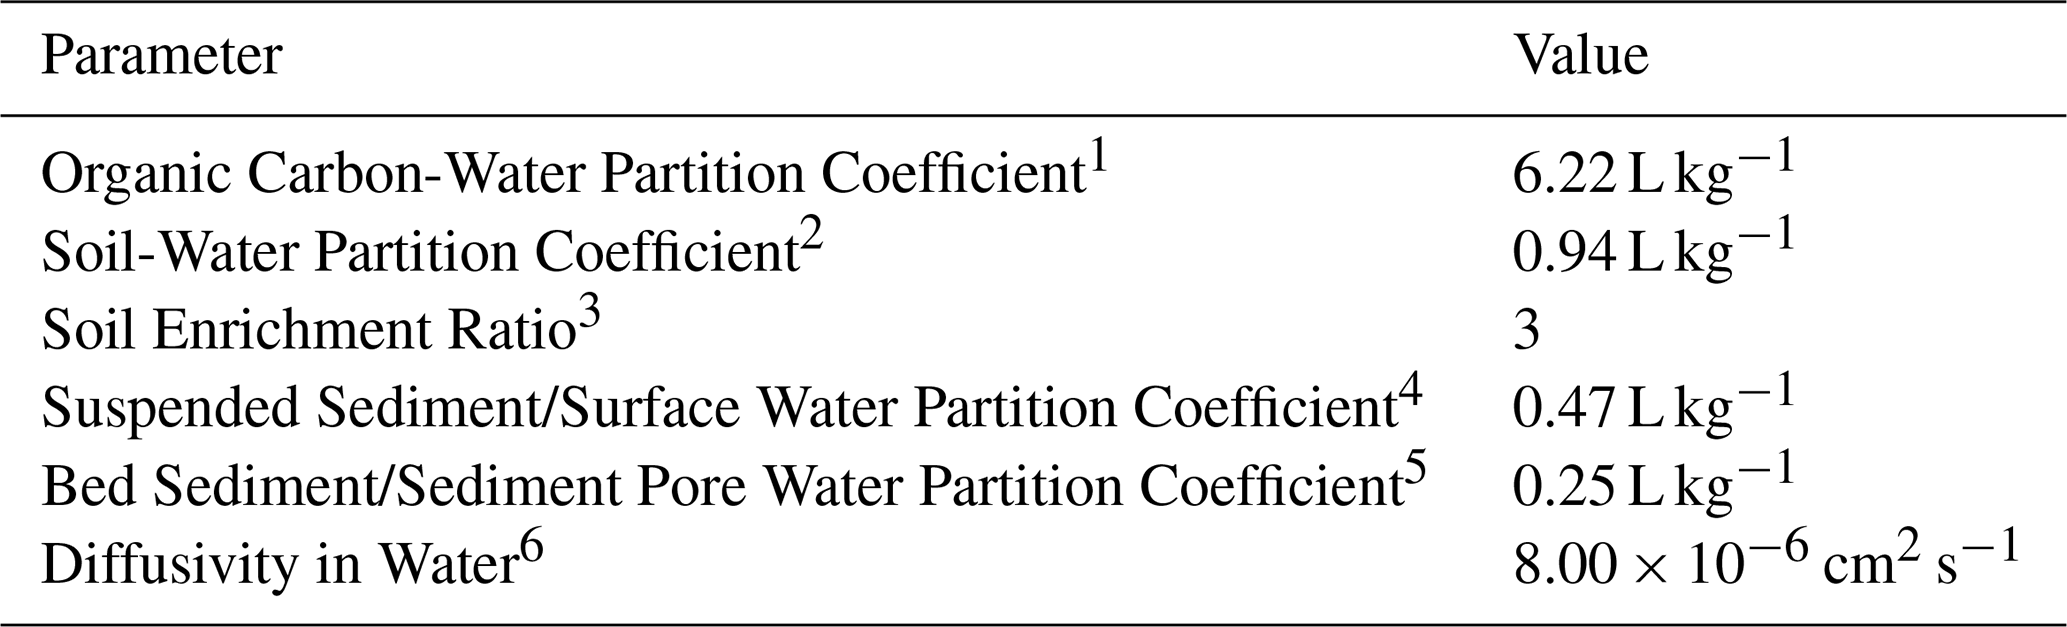
1 Calculated according to the equation from Sabljic and Güsten (Güsten and Sabljic, 1995), using the class of non-hydrophobic chemicals. In the case of TFA, the class “organic acid” is more relevant. Therefore the Koc is calculated as follows: logKoc logKow +0.32, with LogKow =0.79 (ECHA TFA Endpoint Summary for Transport and Distribution – Adsorption/Desorption: https://echa.europa.eu/registration-dossier/-/registered-dossier/5203/5/5/2, last access: 31 July 2024). 2 Adsorption/desorption tests results show that TFA is poorly adsorbed to the soil and is considered as a mobile organic compound in the majority of soils investigated. The Kd ranged between 0.17 to 20 L kg−1 for organic and mineral soils (the organic horizon exhibiting greater retention) giving a geometric mean of 0.94 L kg−1 (SD =4.86, n=20) (ECHA TFA Endpoint Summary for Transport and Distribution – Adsorption/Desorption: https://echa.europa.eu/registration-dossier/-/registered-dossier/5203/5/5/2, last access: 31 July 2024). 3 Default value for organic compounds (United States Environmental Protection Agency, 2005, Appendix B, Table B-4-11). 4 Calculated using the Koc and a default mid-range value of surface water foc of 0.075 (United States Environmental Protection Agency, 2005, Appendix A-2). 5 Calculated using the Koc and a default mid-range value of sediment foc of 0.04 (United States Environmental Protection Agency, 2005, Appendix A-2). 6 Taken from George et al. (1994). Notes: cm2 s−1: Square centimetre per second; foc: Fraction of organic carbon; L kg−1: Litre per kilogram; Koc: Organic Carbon-Water Partition Coefficient.
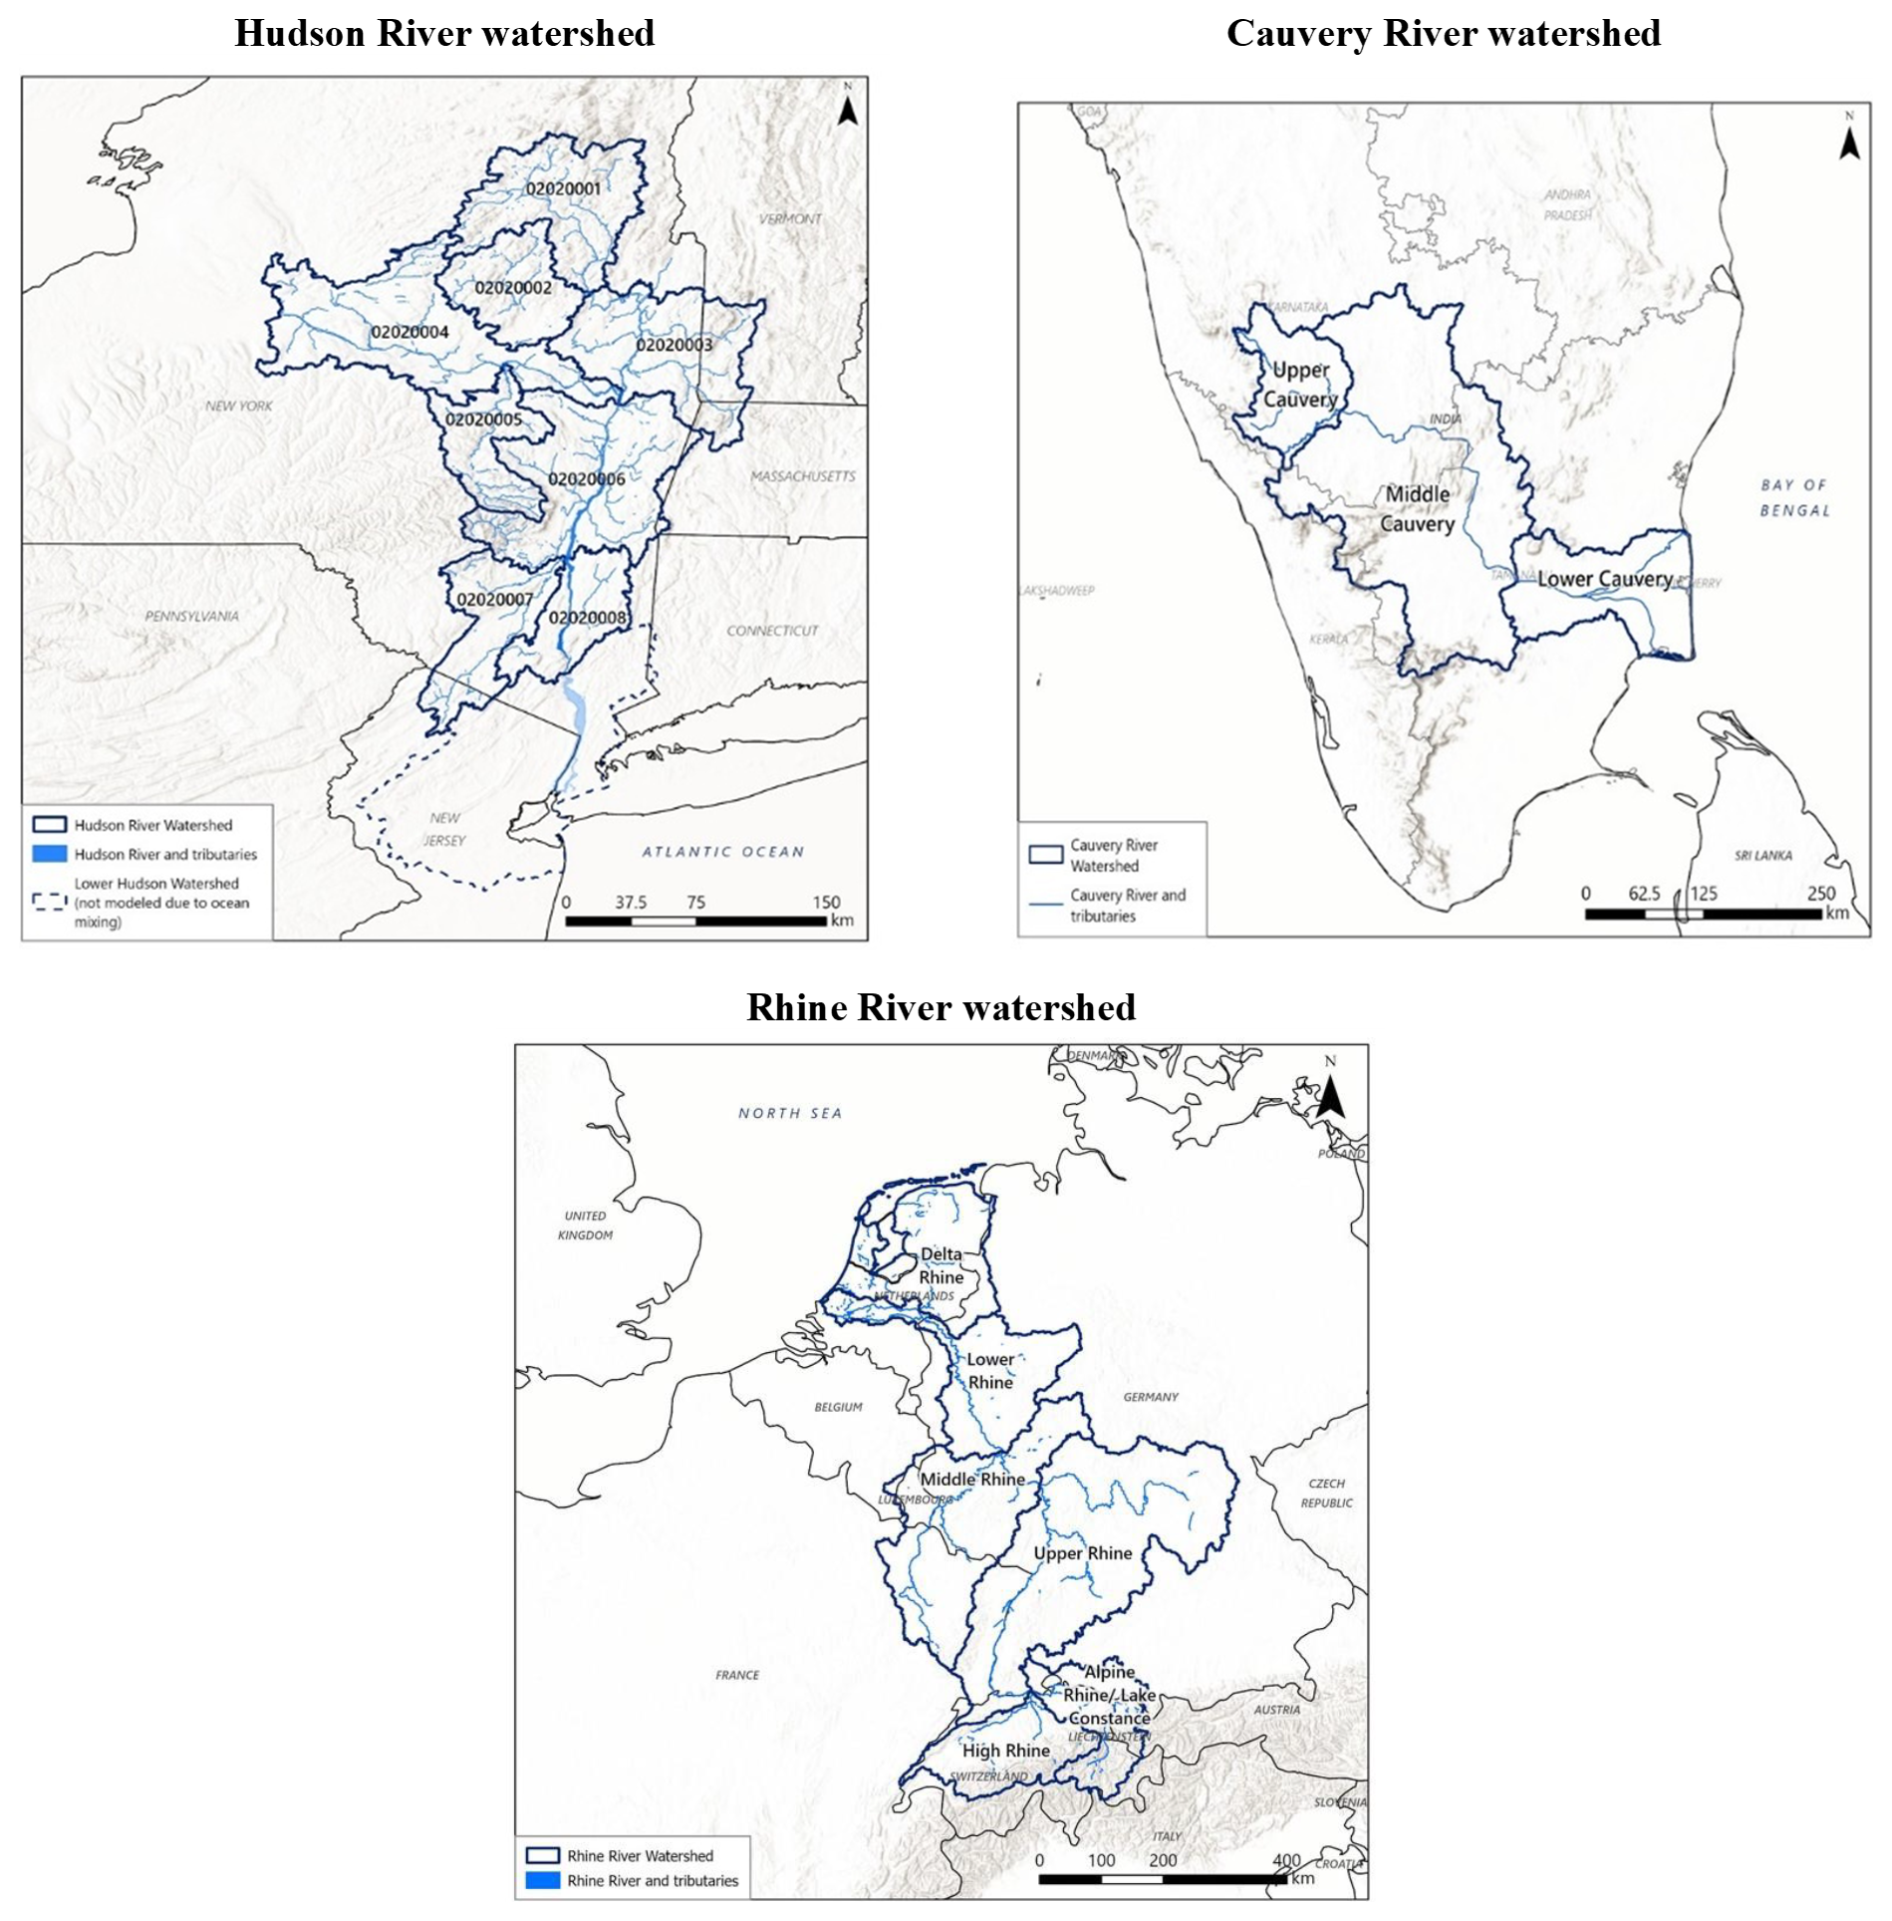
Figure 2Sub-Basins in the Hudson River watershed (upper-left), Cauvery River watershed (upper-right), and Rhine River watershed (bottom). Note that we modelled the Hudson River watershed assuming the following three sub-basins: Sub-basin #1: 02020001 and 02020002; Sub-basin #2: 02020003, 02020004 and 02020005; and Sub-basin #3: 02020006, 02020007 and 02020008. The lower Hudson River sub-watershed was not evaluated because this zone has high mixing of river water and the Atlantic Ocean.
To simulate mobilisation of TFA in watershed sub-basins, we used a series of compartment models that represent the sub-basins in a river system from the headwaters to the mouth of the river where it discharges into the ocean (Fig. 2). Note that for Hudson watershed, we did not evaluate the lower Hudson River sub-basin because this section of the Hudson is generally the zone of greatest mixing of river water and the Atlantic Ocean.
Our surface fate and transport model predicts the steady-state concentrations of TFA in the water column and sediment layer beneath the water column. It does not account for the fluctuating flow of TFA between the water column and sediment in response to variations in external inputs. The overall concentration of TFA is divided between the sediment and the water column. Per HHRAP Guidance, the rate of soil erosion from the watershed is calculated by the Universal Soil Loss Equation (USLE) and a sediment delivery ratio. The sum of the TFA concentration dissolved in water and the TFA concentration associated with suspended solids constitutes the total estimated water column TFA concentration. The detailed methodology and governing equations used in the modelling are outlined in the USEPA HHRAP Guidance (United States Environmental Protection Agency, 2005). In the Supplement (Tables S2–S7), we have summarised the watershed and waterbody parameters for each sub-basin for the Hudson River, Rhine River, and Cauvery River. Some default modelling parameters are available, and these recommended values typically reflect national average conditions in the United States, such as the default empirical intercept coefficient of 0.6 for watersheds larger than 1000 square miles or 2560 km2 from the USEPA HHRAP (United States Environmental Protection Agency, 2005) which was used in the modelling for all three rivers. The uncertainties associated with the selection of the watershed and waterbody parameters are also discussed in Sect. S1 in the Supplement.
3.1 Global HFO-1234ze(E) emissions and TFA deposition flux
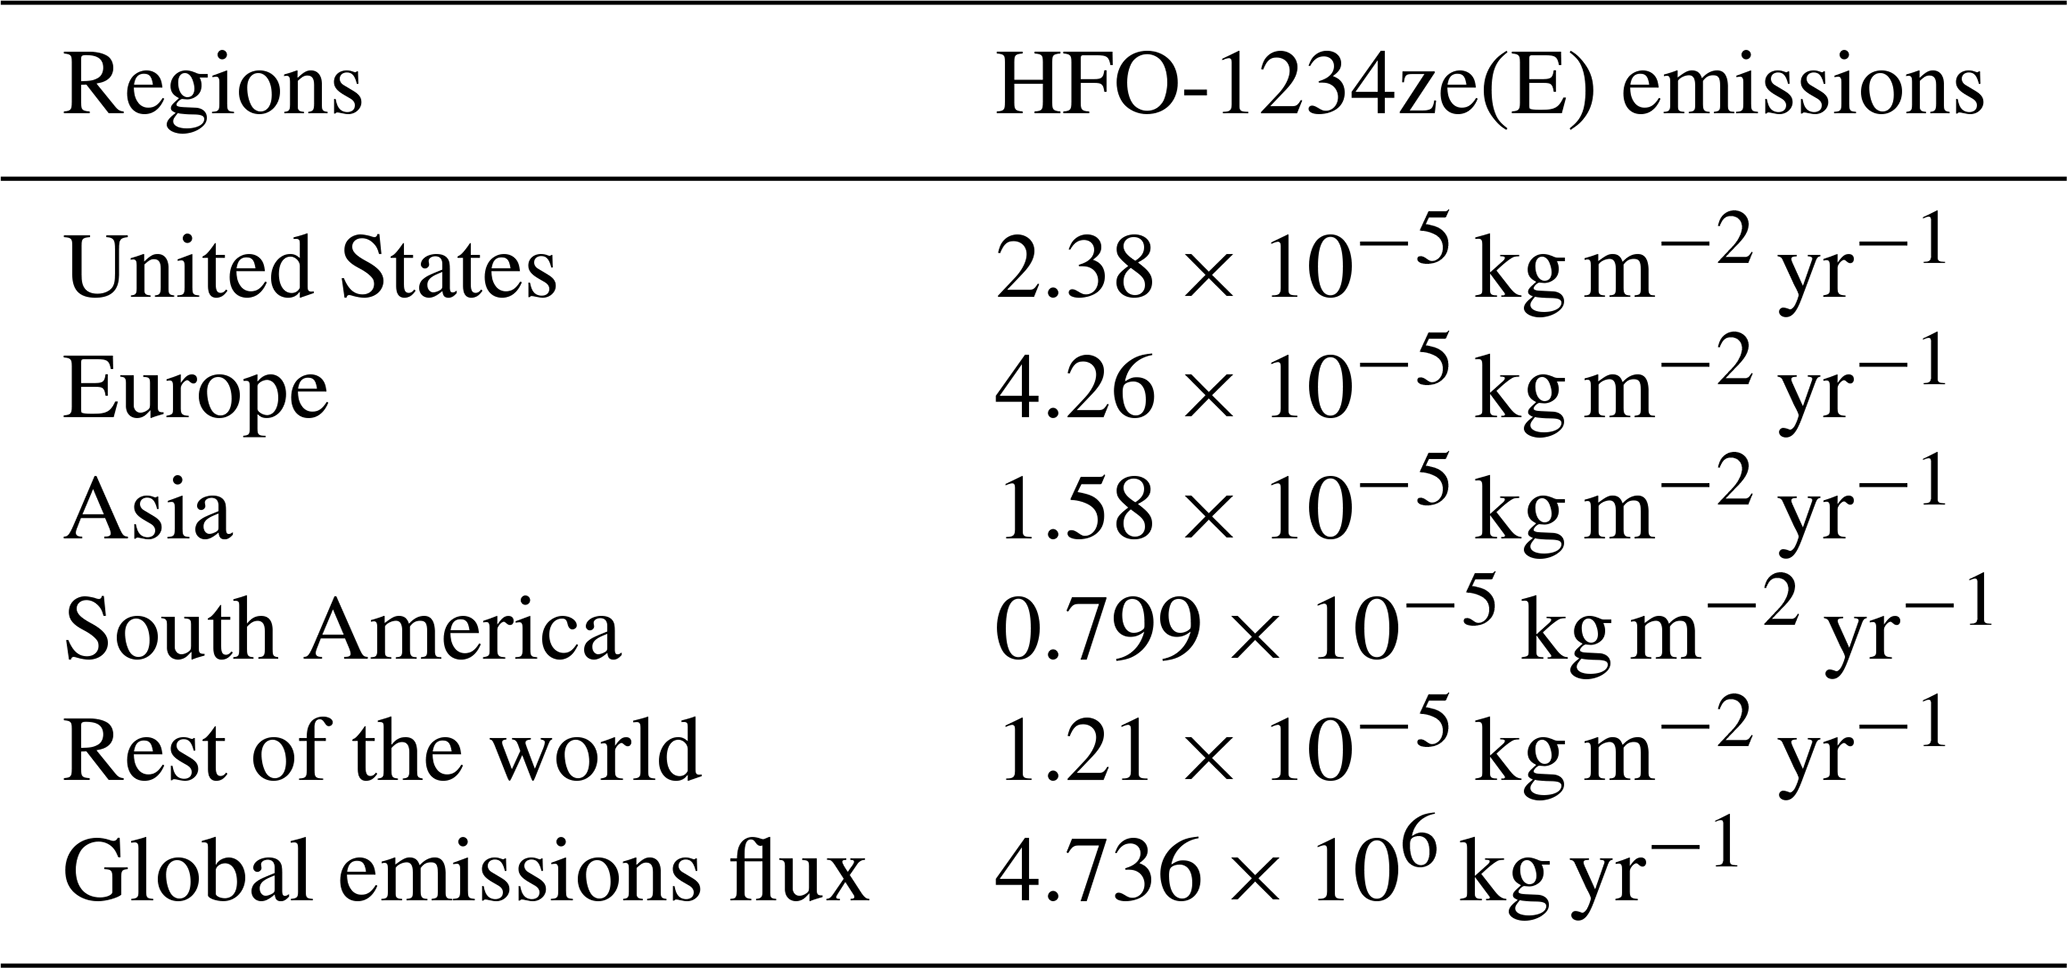
We used monthly pMDI volume sales data (IQVIA MIDAS®) for the period 2022 from top 51 countries to calculate the total NGP emissions per month per country, assuming daily dose of 4 puffs per day and ∼14 g of HFO-1234ze(E) per pMDI (see Supplement data). The spatial distribution of HFO-1234ze(E) emissions within each country in the GEOS-Chem model was estimated using anthropogenic nitric oxide (NO) emissions from the CEDS inventory as a proxy, based on the assumption that NO emissions from residential and commercial sectors correlate with population density and, hence, pMDI usage. Figure 3 shows the annual spatial distribution of HFO-1234ze(E) emissions at a 2° × 2.5° resolution in GEOS-Chem, and Table 2 provides the HFO-1234ze(E) emissions in different regions of the world and the entire world. The worldwide emissions of HFO-1234ze(E) from pMDI use in the 51 countries are estimated to be 4.736 Gg yr−1 (or kt yr−1). Although respiratory disease symptoms can vary by season, our estimates of global HFO-1234ze(E) emissions show small variations with different seasons suggesting sustained demand of pMDIs in the respiratory disease community (Fig. S5). This apparent consistency is primarily because different regions of the world experience their peak NGP emissions at different times of the year. For example, if you compare the monthly emissions data for the UK and Brazil in the Supplement, you will see different peak periods. When these regional trends are averaged at the global level, these seasonal differences are effectively smoothed out.
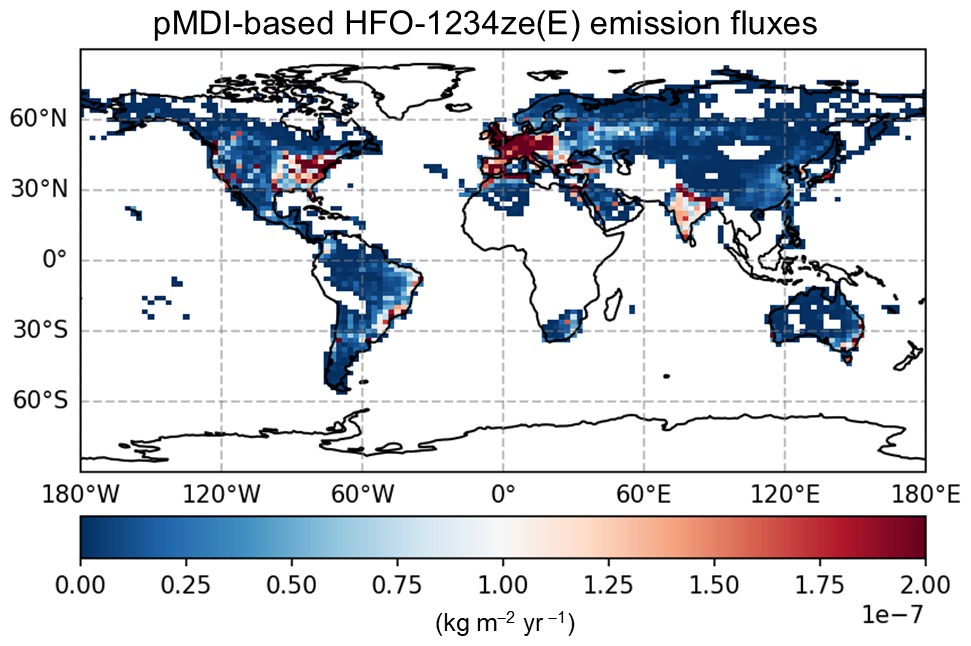
Figure 3Global annual distribution of HFO-1234ze(E) emissions at 2° × 2.5° resolution in GEOS-Chem. This distribution of HFO-1234ze(E) emissions is based on global pMDI volume sales data, assuming pMDI devices sold by all manufacturers in 2022 used HFO-1234ze(E) as the propellant.
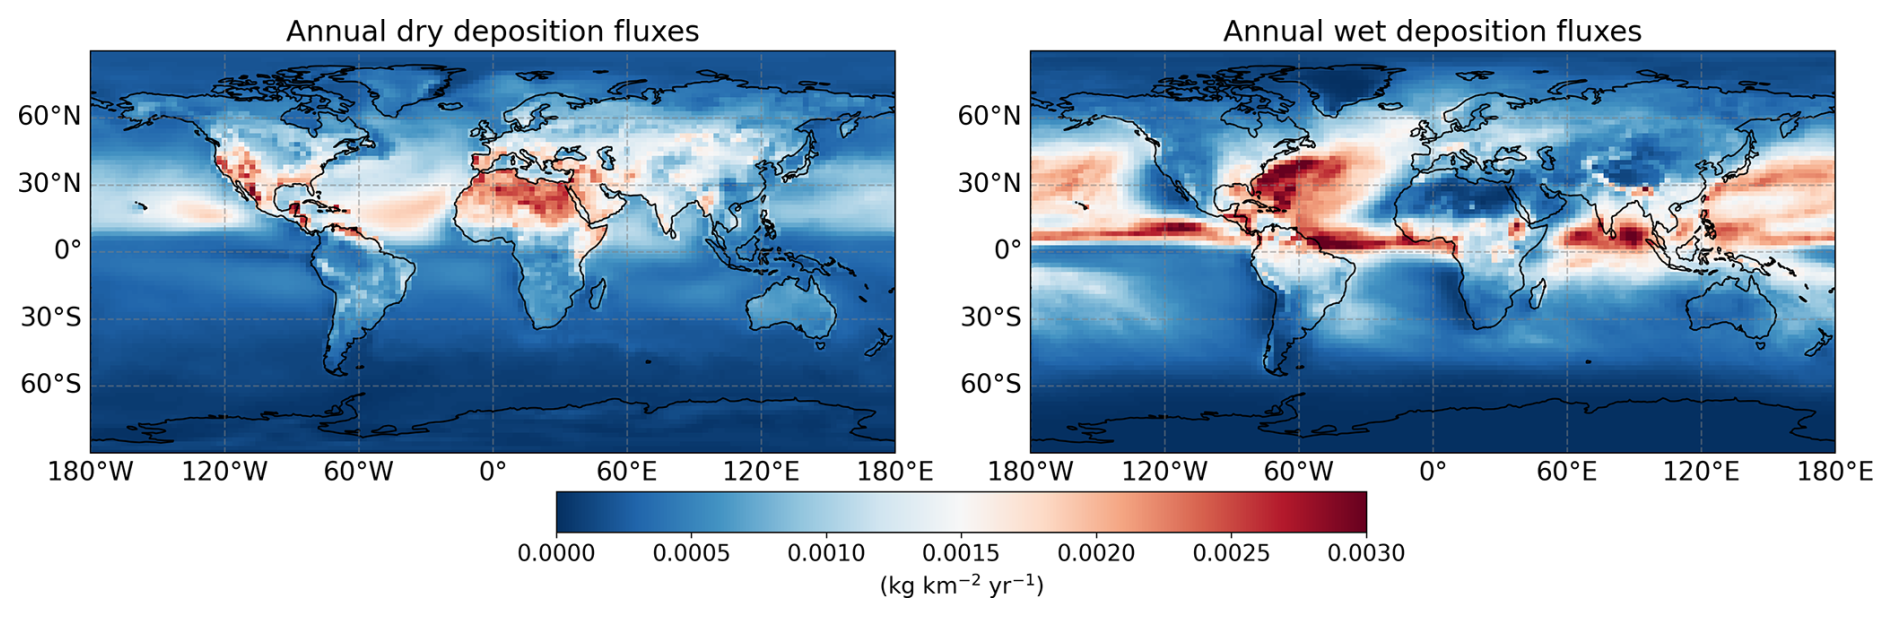
Figure 4Annual global dry and wet deposition fluxes of TFA. These fluxes reflect the average of TFA deposited over a year. Note that dry deposition fluxes are highest in African region and wet deposition fluxes are highest around the ocean near the northern tropical region.
We followed the formulation of Wesely (2007), subsequently modified by Wang et al. (1998), for computation of dry deposition of gas-phase species onto surfaces in GEOS-Chem, which calculates dry deposition velocities using data for surface momentum, sensible heat fluxes, temperature, and solar radiation. To incorporate the dry deposition of TFA, we assumed its behaviour in this process to be analogous to that of nitric acid, following the approach of Luecken et al. (2010) and Henne et al. (2012). Figure 4 shows the modelled annual global dry and wet deposition fluxes of TFA. While previous studies (for example, Luecken et al., 2010; Henne et al., 2012; Wang et al., 2018; Sulbaek-Andersen et al., 2018) have concluded that wet deposition is the dominant pathway for TFA removal, our results indicate that dry deposition may play a more significant role under certain tropical and subtropical conditions. This divergence is likely due to differences in the chemical formation of TFA – particularly via TFAA – and in regional meteorological patterns that influence deposition processes.
The monthly variations in global dry and wet deposition of TFA are shown in Figs. S6–S7, which capture the effect of different seasons on TFA deposition fluxes globally. We note that TFA tends to have higher deposition rates in the summer as refrigerants are more commonly used in warmer months and more oxidants are present in summer, although precipitation is also a factor as it allows for more wet deposition. Wang et al. (2018) also noted that maximum wet and dry TFA deposition occurred during the summer, accounting for 71 % of global yearly deposition, followed by autumn with 12 % global yearly deposition. Wang et al. (2018) also stated that although parent-molecule emissions are the dominant factor for TFA deposition, but convective mass flux and precipitation also have an effect.
We found that the total deposition between 0 and 45° north latitudes is approximately 61 % of the global total deposition. Even though NGP emission fluxes are four times lower in Africa as compared to Europe (Table 2), the dry deposition fluxes are higher in Africa as compared to Europe. This is presumably due to the higher concentration of hydroxyl radicals around the Equator (Pimlott et al., 2022) that will increase the formation of CF3CO(O)2 from TFAA via Reaction (R5b). However, transport of other intermediate species, such as TFA itself, into the tropical region as a cause of higher TFA deposition flux cannot be completely ruled out.
To understand the effects of seasonal variation and altitude on TFA-deposition fluxes in two identified regions in Europe and Africa (Fig. S8), we computed correlation between daily TFAA and TFA formed per day for each month at different altitudes (Fig. S9). We found a negative correlation between TFAA and TFA in the identified regions of Europe and Africa for almost the entire year, confirming that the hydroxyl radical channel (Recation R5b) is the primary route of TFA formation under different environmental conditions. In contrast to this general agreement, we found that reaction channels other than R5b contribute to TFA formation during May through September in the identified region of Africa (Fig. S9; Spearman's ρ ” 0).
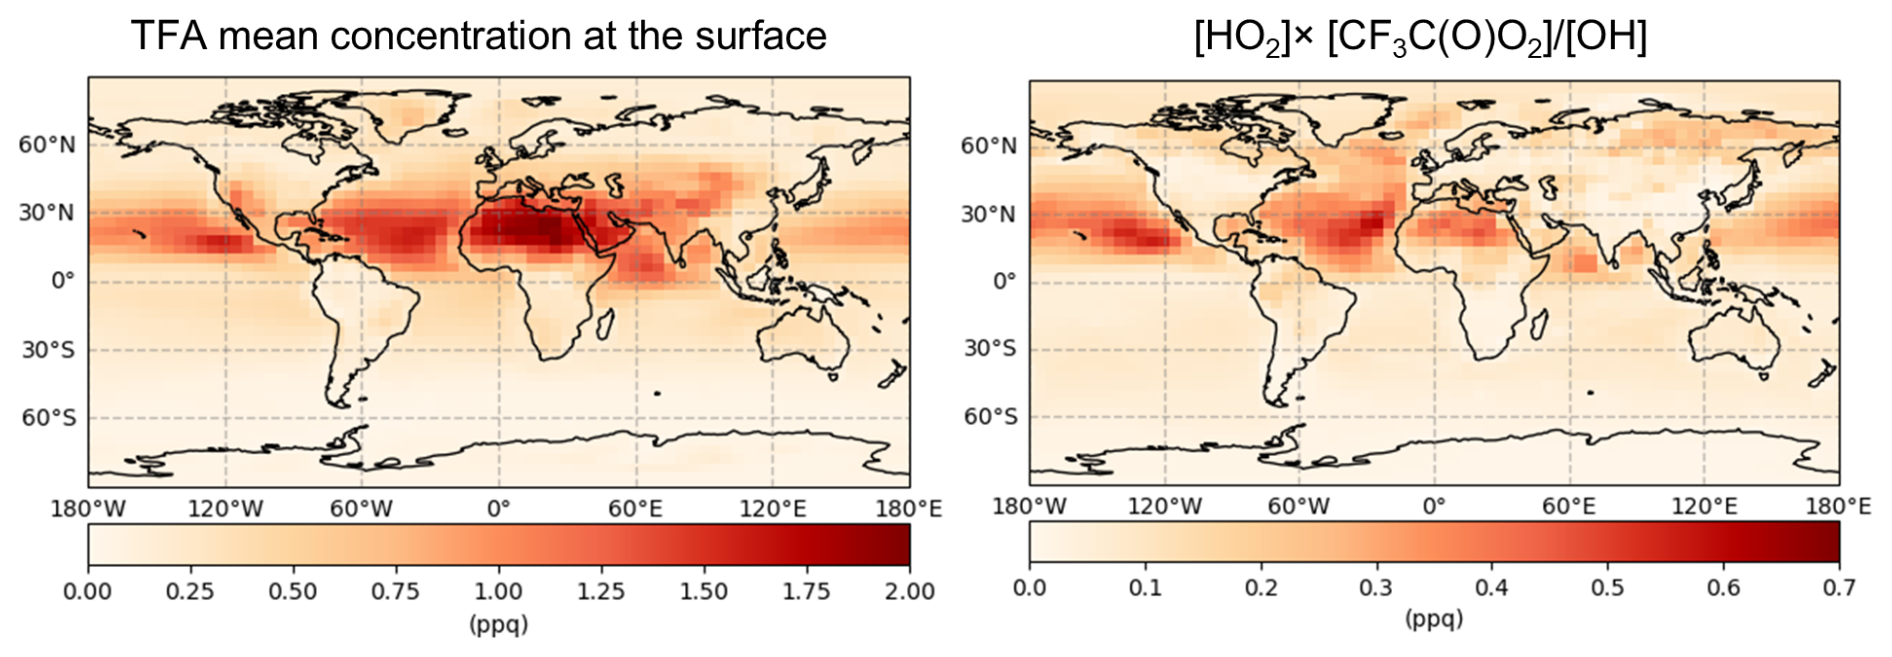
Figure 5Annual mean-surface concentrations (gas-phase) of TFA and ([HO2] × [CF3C(O)O2])/[OH] at 4–5° resolution. The spatial pattern of the ratio of ([HO2] × [CF3C(O)O2])/[OH] generally matches the spatial pattern of the TFA.
To understand contribution of primary TFA-forming pathways on the spatial pattern of TFA, we examined concentrations of various-related species at the surface after the last spin-up simulations at 4–5° resolution (see Methods). Our assessment of initial oxidation products suggests that HFO-1234ze(E) emissions at the surface largely correlate with corresponding TFAA concentrations at the surface (Sect. S2; Fig. S10d) and show little correspondence with the initial oxidation products (Fig. S10b,c). The subsequent degradation of TFAA can occur via OH (Reaction R5b) or HO2 (Reaction R5c); of these two possible routes, the OH-pathway which forms CF3C(O)O2 is about three orders of magnitude faster as compared to the HO2 pathway (Table S1), leading to more CF3C(O)O2 concentrations (Reaction R5b) than CF3CH(OH)O2 (Reaction R5c), see Fig. S11. Lastly, we calculated the ratio [HO2] × [CF3C(O)O2]/[OH] to quantify the contribution of species that form TFA (R7b) and that remove TFA from the atmosphere (R11). Figure 5 compares the gas-phase concentrations of TFA and [HO2] × [CF3C(O)O2]/[OH] at the surface. This analysis suggests that (1) reactions that form TFA generally dominate over those that remove it in the atmosphere, and (2) CF3C(O)O2 reaction is the primary precursor that forms TFA in the atmosphere.
In general, the steady-state concentration of any atmospheric species is governed by processes that control both its production and removal; in the case of gas-phase TFA, however, our analysis reveals a distinct scenario. The key detail is that gas-phase TFA is removed from the atmosphere almost exclusively through a single OH-driven, temperature-independent oxidation process (R11; Reaction 67 in Table S1). The rate of this removal pathway is significantly lower – by about an order of magnitude – than the rates of the major TFA formation reactions, including the OH-dependent reaction that forms TFA. As a result, the atmospheric burden and spatial patterns of gas-phase TFA are primarily determined by spatial patterns of chemical species that form TFA, rather than the ones that remove it.
We demonstrate this by showing that the spatial distribution of TFA closely matches that of the ratio [HO2] × [CF3C(O)O2]/[OH], which includes species that form and remove TFA in the atmosphere. The numerator reflects the major formation processes, while the denominator includes the OH species responsible for both TFA formation and removal. Thus, the observed spatial correlation in the figure is not simply a reflection of two unrelated quantities but encapsulates the dominant chemistry controlling TFA's presence in the atmosphere. Section S2 provides the entire process which shows atmospheric concentration of other crucial intermediates. This section demonstrates that the spatial patterns observed for TFA are distinct and are not mirrored by other intermediate species in the same way, supporting our mechanistic interpretation.
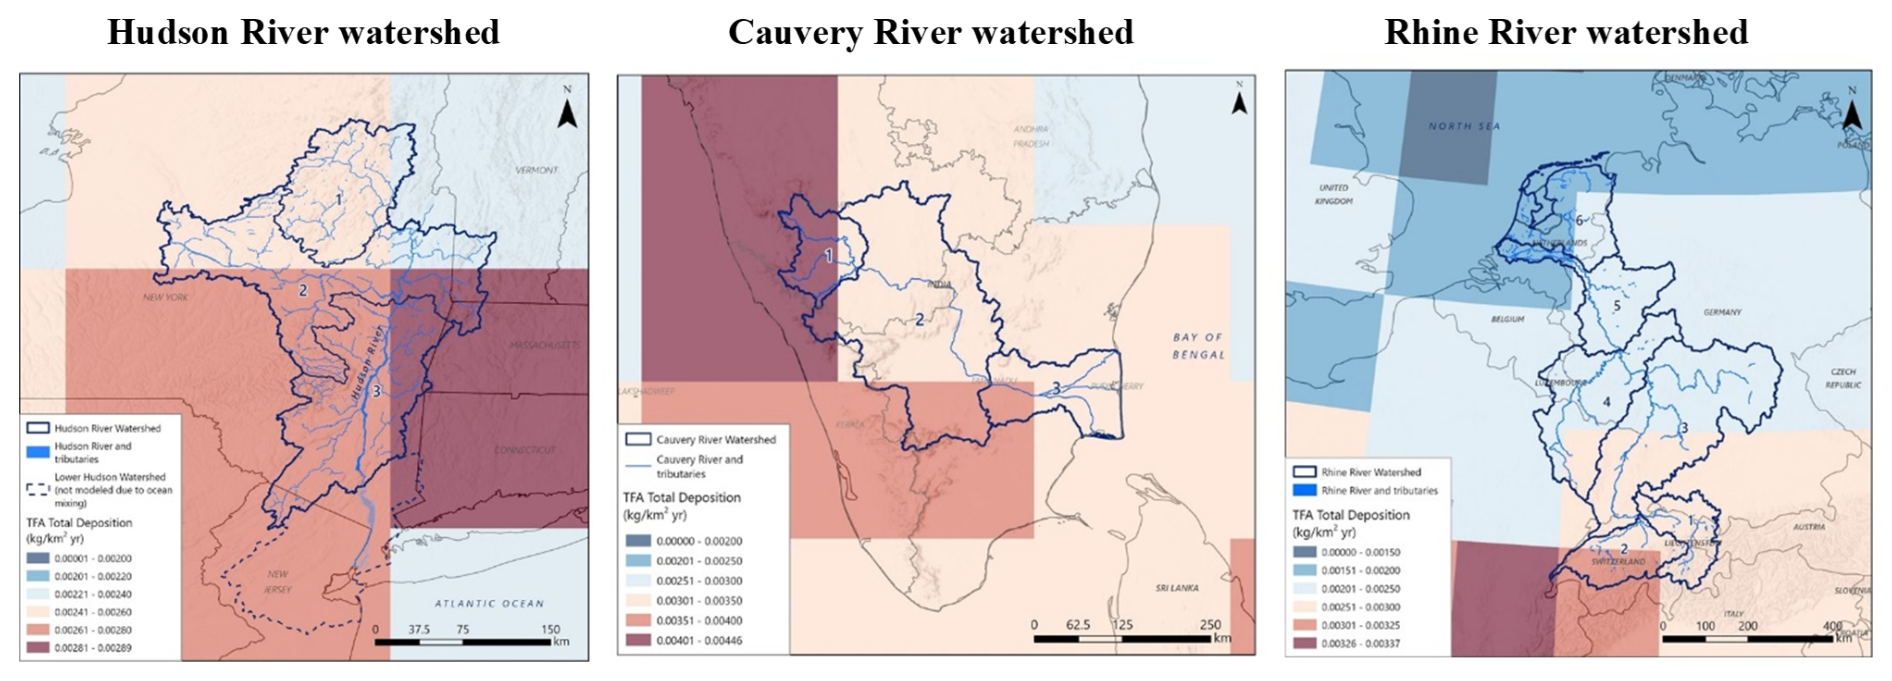
Figure 6Estimated total TFA gridded deposition in the Hudson River watershed and surrounding area, in the Cauvery River watershed and surrounding area, and in the Rhine River watershed and surrounding area. Note that the colour scale changes for each figure to display the range of deposition values within the extent of the map. Cauvery watershed: Sub-basin 1, Upper Cauvery; Sub-basin 2, Middle Cauvery; Sub-basin 3, Lower Cauvery. Rhine watershed: Sub-basin 1, Alpine Rhine; 2, High Rhine; 3, Upper Rhine; 4, Middle Rhine; 5, Lower Rhine; and 6, Delta Rhine. Hudson sub-basins are as described in the Method section.
3.2 Fate and transport modelling of pMDI-derived TFA
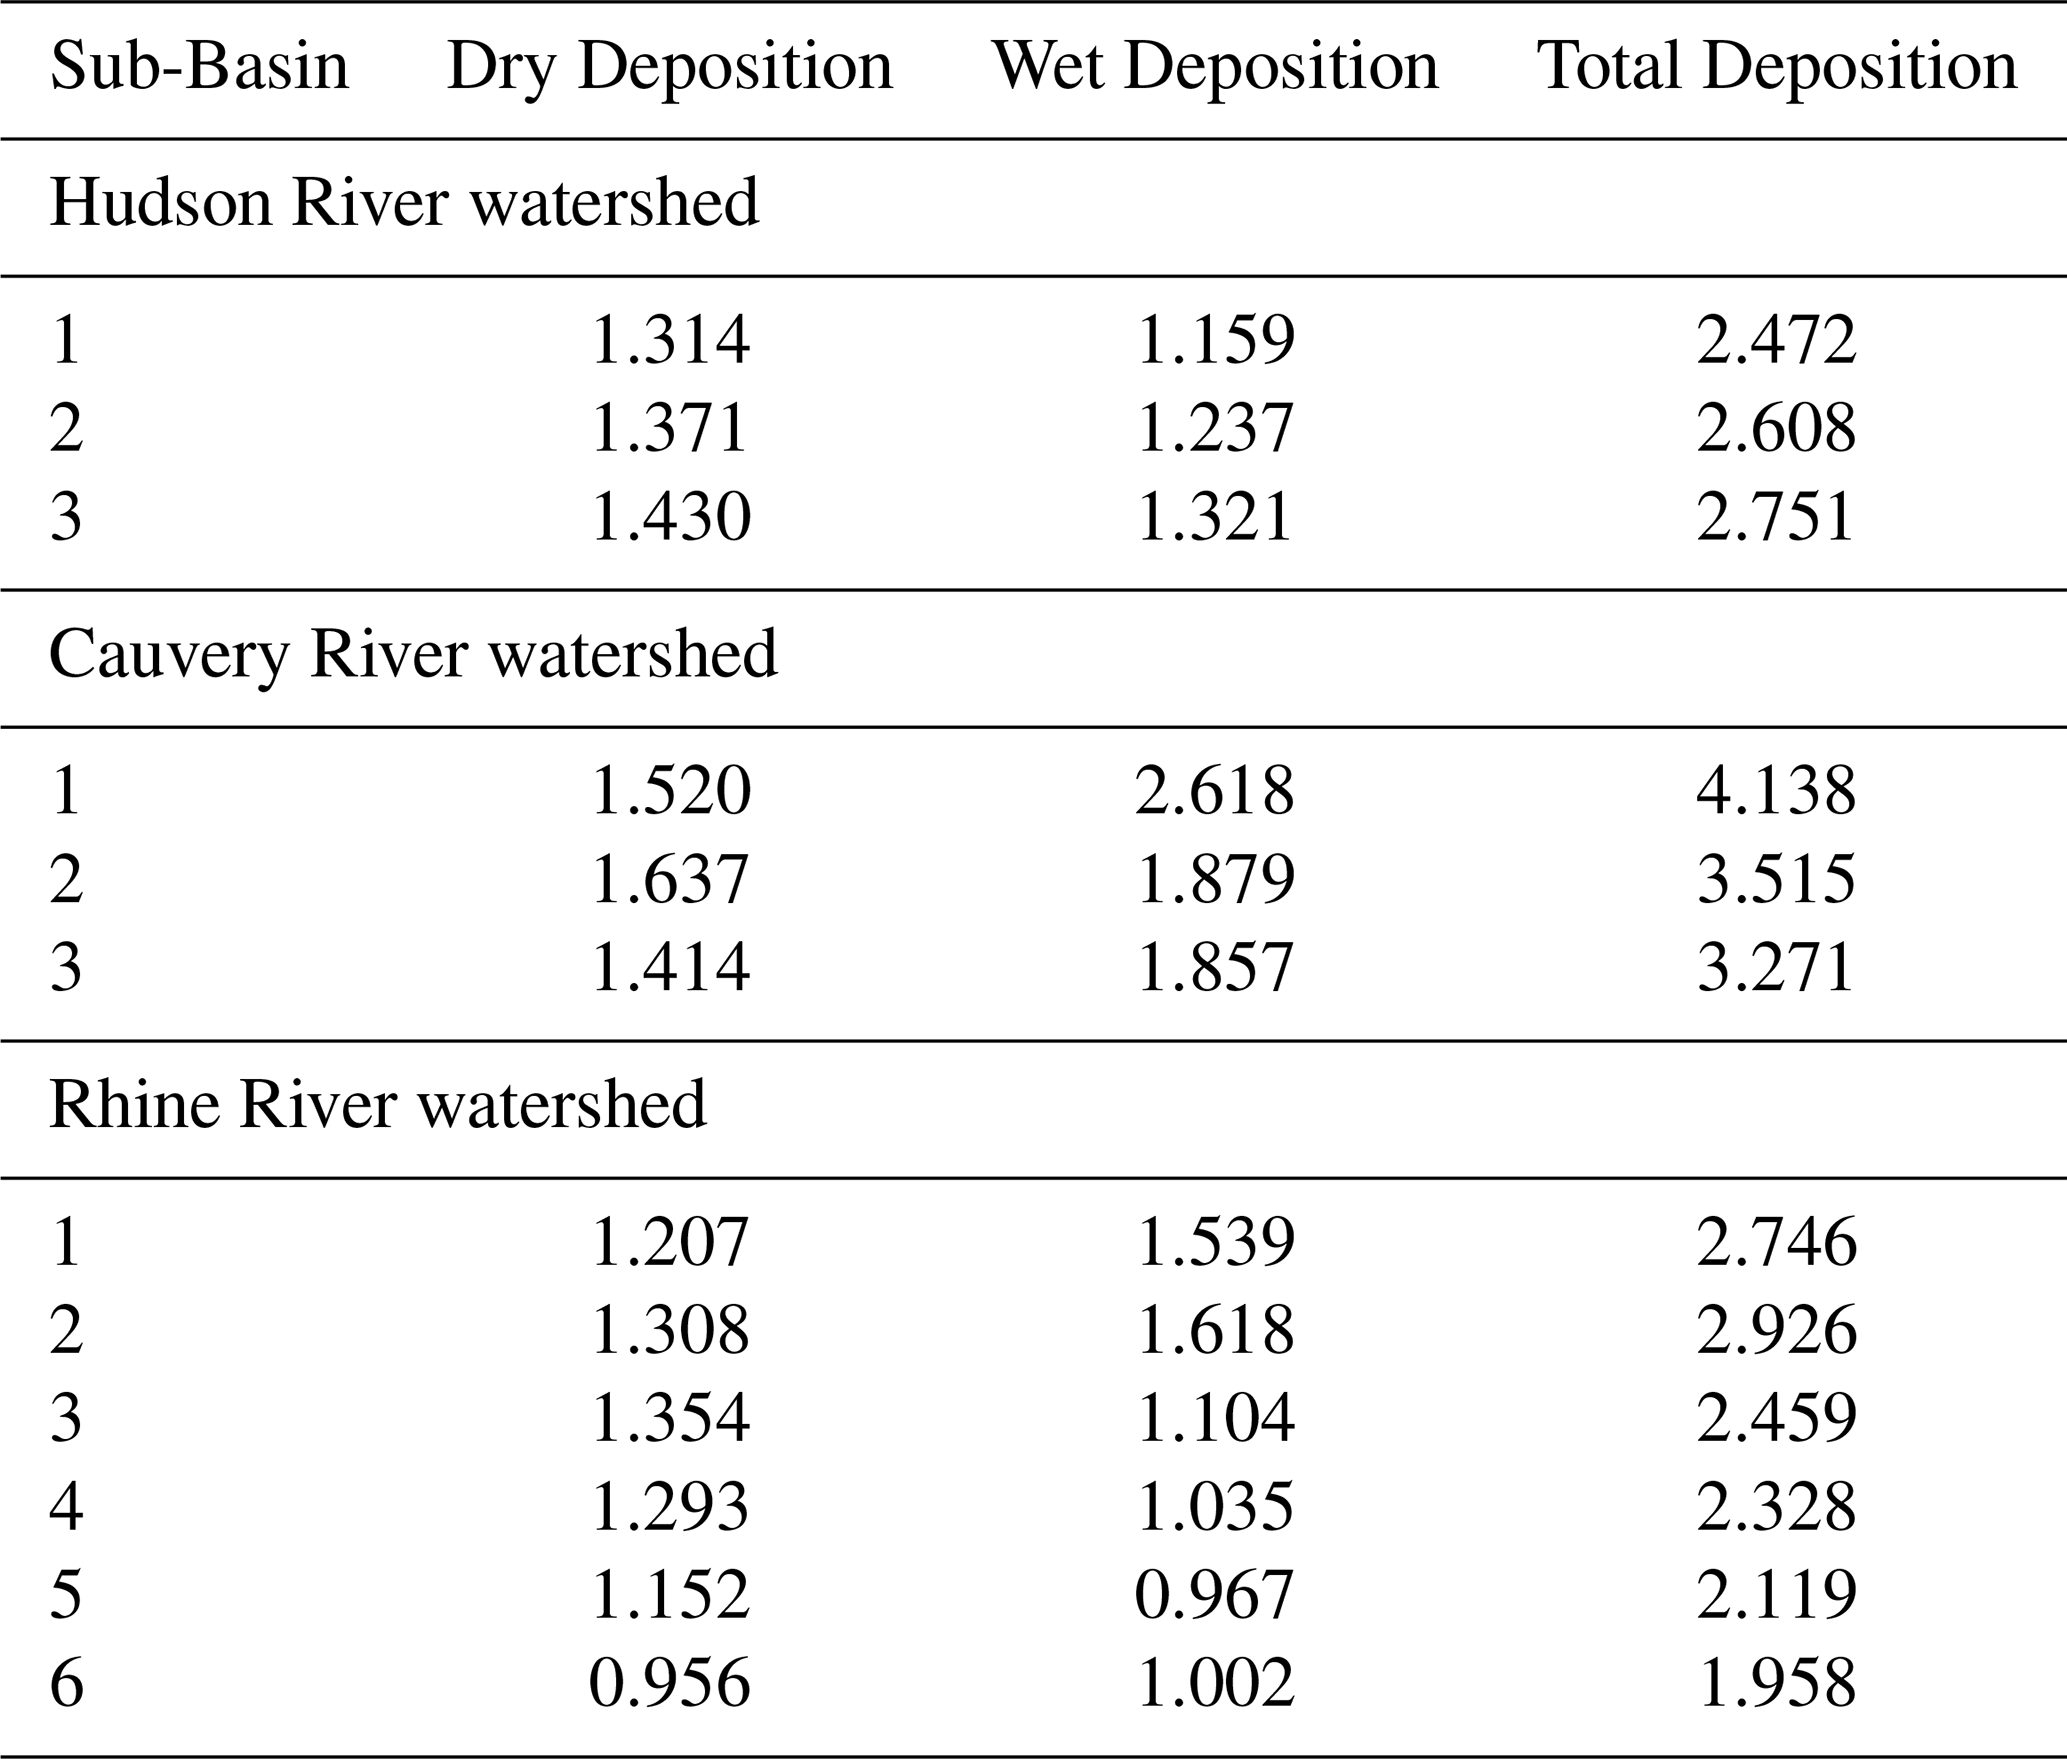
This section presents and discusses the modelled TFA concentrations in the surface water, surface sediment, and surface soil for the sub-basins of each of the three river watersheds and the mass balance of TFA in these systems. We have used the methodology described in Sect. 2.4 for estimating the TFA concentrations in the sub-basins of the Hudson, Rhine, and Cauvery River watersheds. The model is based on a series of connected compartment models for each sub-basin of the river system. The input of TFA from atmospheric deposition into the compartment for a sub-basin is based on area-weighted average (calculated based on the % of the grid cell areas overlapping with the sub-basin) TFA deposition flux for that sub-basin. Figure 6 shows the grid cells encasing spatial distribution of the total (dry + wet) TFA deposition flux and Table 3 lists weighted-average TFA deposition flux for each sub-basin of the three watersheds. Note that the distinct colour scales in Fig. 6 capture differences in the total TFA deposition flux values in the three watersheds.
Table 3Annual Average Atmospheric Deposition Flux of TFA (µg m−2 yr−1).
Assuming no inter-annual variability in the annual TFA deposition fluxes (Table 3), we estimated net TFA accumulations in the surface water, soil, and sediment of the three watersheds over a 30-year period. While TFA deposition varies seasonally, the focus here is on the accumulation of TFA over the 30-year period. Also, it is unknown how the seasonality itself would vary over the 30-year period. So the surface fate and transport modelling was based on the mean annual deposition flux. Based on the simulation results, the TFA concentrations in various river systems reach a steady state at different rates (Fig. 7), influenced by factors such as volumetric flow rates and deposition rates across sub- basins. We found that TFA concentrations reached steady state within one year in the Hudson River. Model predicted peak surface water TFA concentrations range from 2 ng L−1 in the upstream sub-basin (sub-basin 1) to 5.4 ng L−1 in the middle sub-basin (sub-basin 2). We found that these TFA accumulation variations within the sub-basins are impacted by factors such as differences in River flow rates, infiltration rates of the watersheds (see Tables S2–S7), and deposition rates (Table 3). Based on the simulation results of the TFA mass allocation in soil, sediment, surface water in the river, and the ocean, approximately 63 % of the TFA mass deposited from the air would be delivered to the ocean.
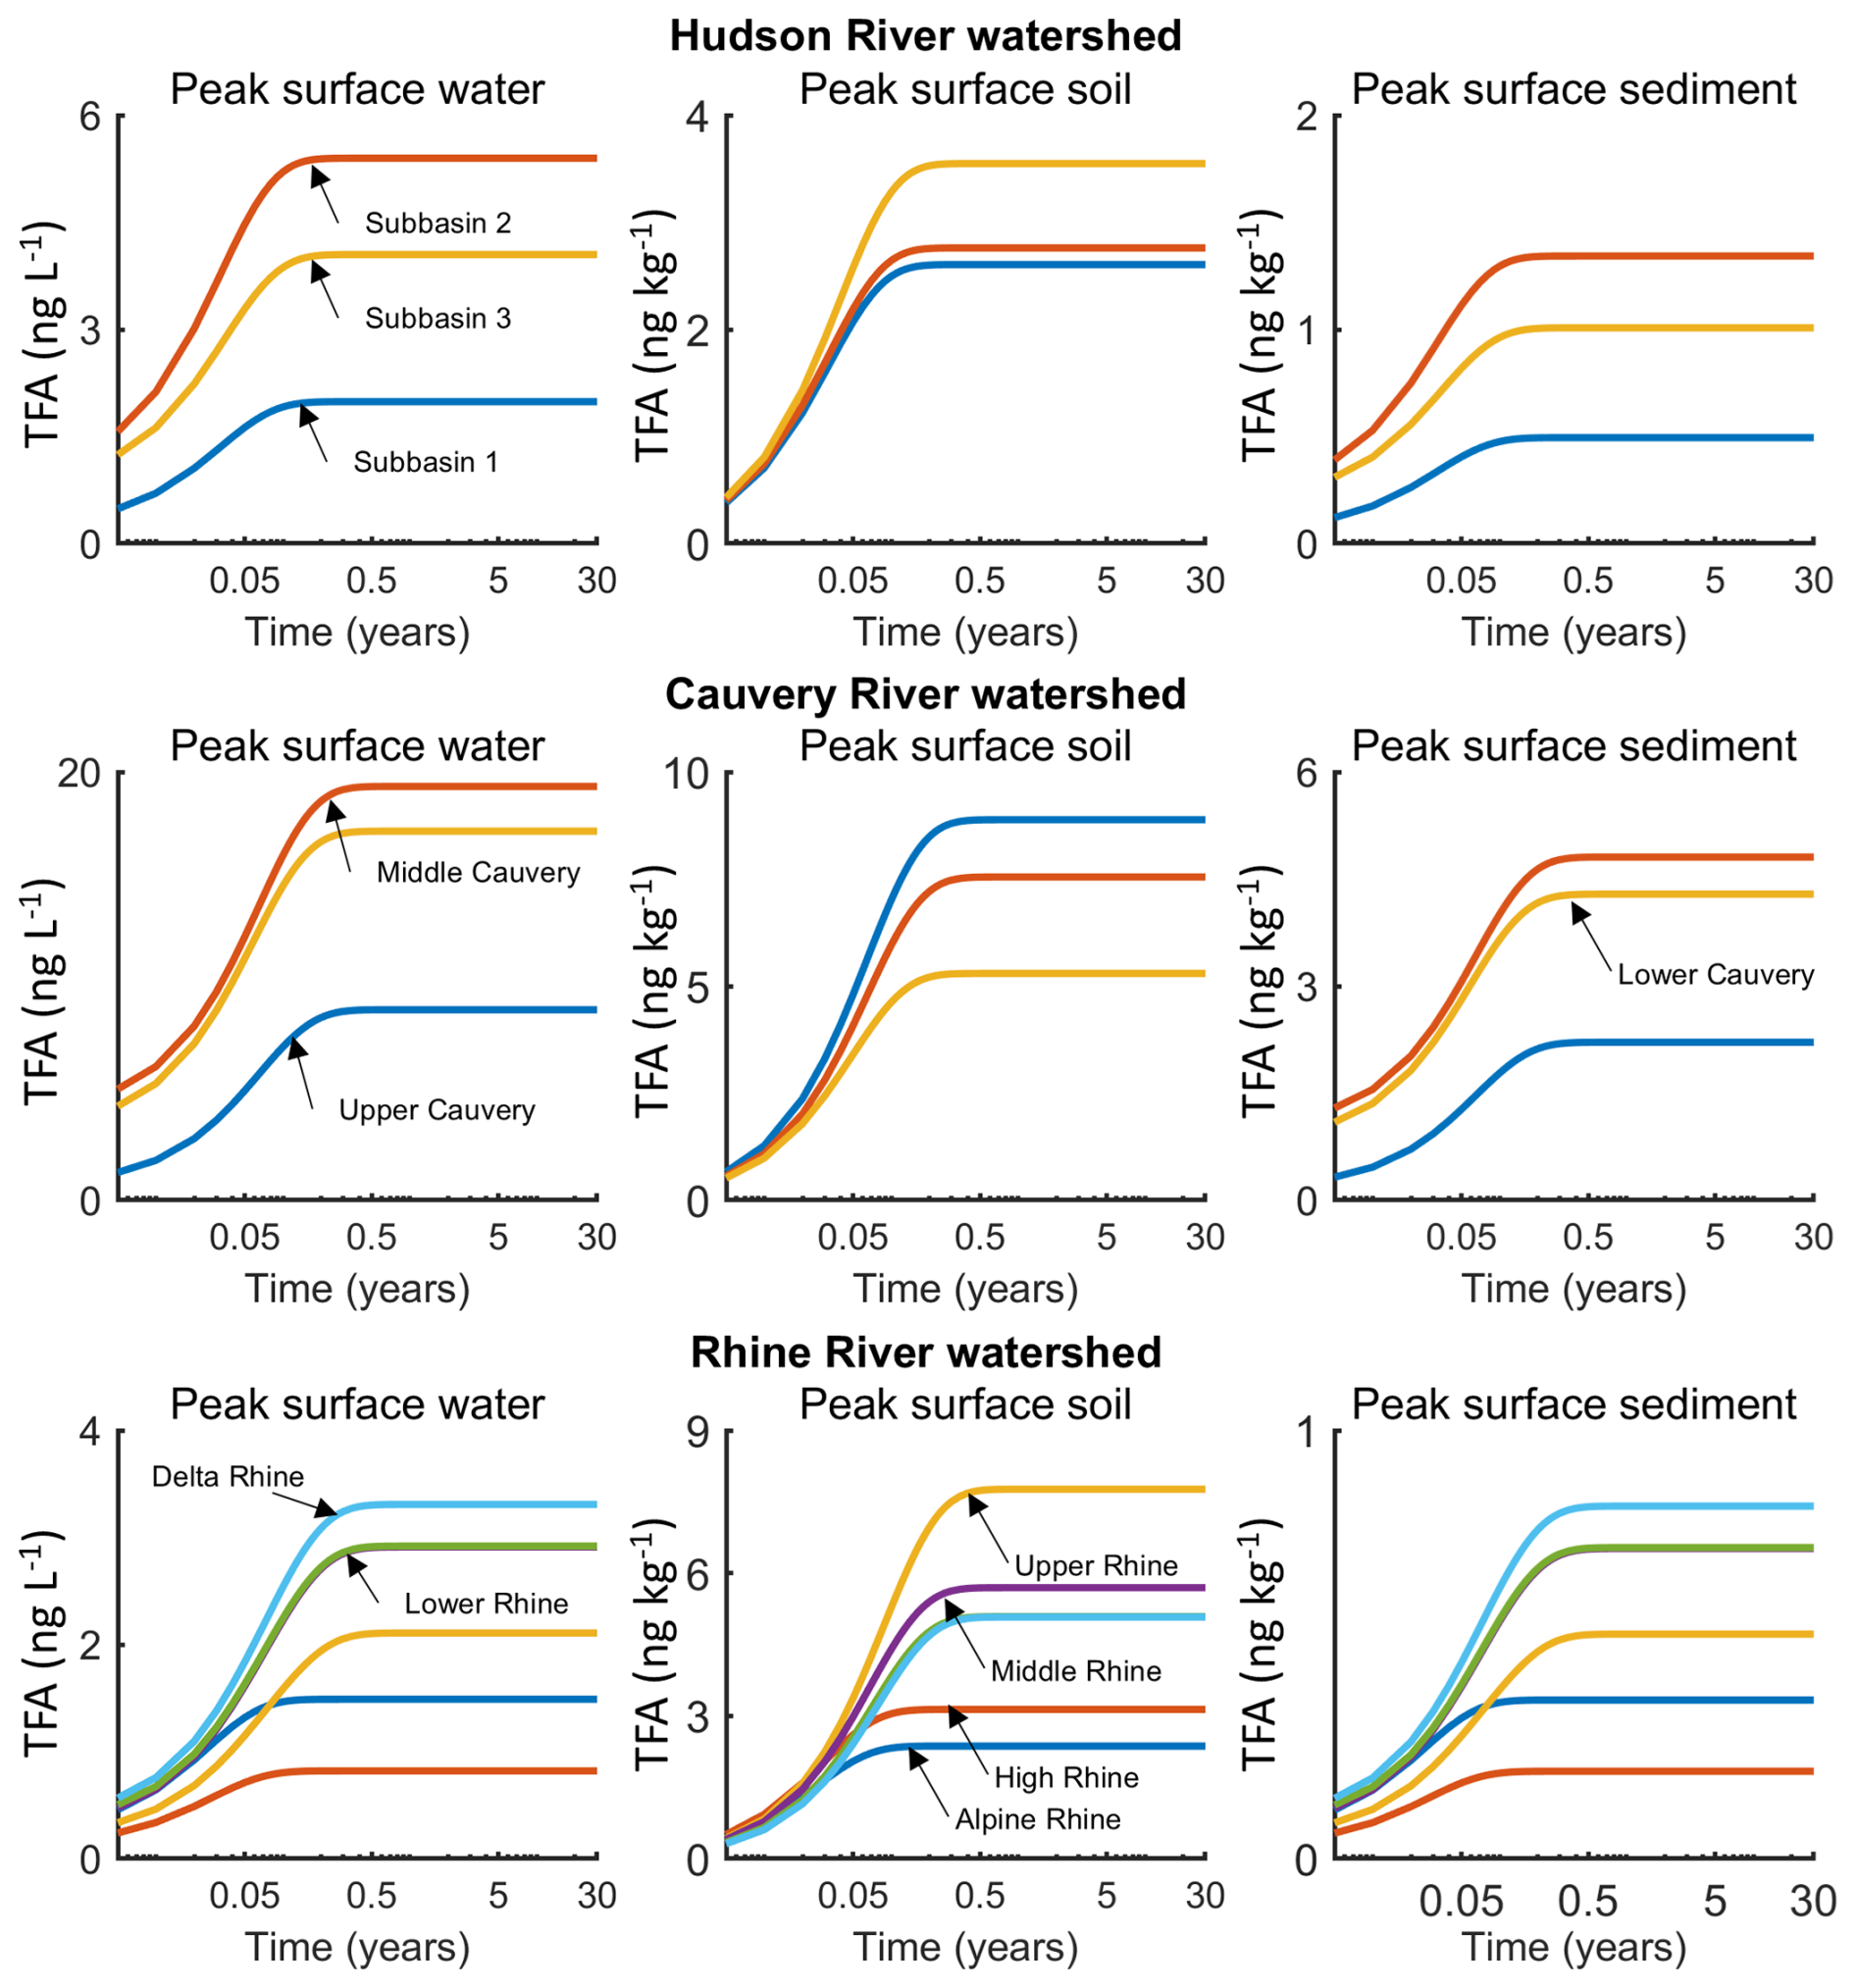
Figure 7Model predicted concentrations of TFA in surface water, surface soil, and surface sediment of Hudson River watershed (first row), Cauvery River watershed (middle row), and Rhine River watershed (bottom row) due to 30-years of continued NGP emissions via pMDI usage.
Akin to the Hudson River results, we found that peak TFA surface water concentrations in Cauvery sub-basins also reached steady state within a year. The model-predicted TFA concentrations range from 8.9 ng L−1 in the upper Cauvery sub-basin to 19.3 ng L−1 in the middle Cauvery sub-basin. Based on our TFA mass-allocation calculations, roughly 19 % of the TFA mass deposited from the air would be transported to the ocean, a small percentage (∼4 %) would remain in the river system (i.e., surface water and surface sediment) or the mixing zone of surface soil receiving deposition (i.e., assumed to be the top 2 centimetres of soil for this study), and roughly four-fifths would leach to deep soil or sediment, after the TFA concentrations reach steady state in the system (Fig. 7). The TFA mass allocation percentage to deep soil is higher for the Cauvery River basin than that for Hudson River basin and Rhine River basin (next paragraph) because Cauvery River is located in the tropical/sub-tropical zone and has much higher precipitation rates, and therefore, higher infiltration rates (determined by precipitation, irrigation, run-off, and evapotranspiration in the basin) which caused increased leaching process of TFA to deep soil in this basin. Note that TFA is highly mobile in soil due to its strong tendency to remain dissolved in water rather than binding to soil particles, so it does not permanently accumulate in soil but quickly leaches into deeper layers and potentially groundwater. Therefore, by accumulation in soil herein, we are referring to temporary retention of TFA in soil before leaching and does not indicate long-term storage of TFA in soil.
Akin to the other two watersheds, the peak surface water concentrations of TFA in the Rhine River sub-basins also reached steady state within a year, suggesting that region-specific TFA deposition differences are unsubstantial compared to River-specific flow rates' impact on the time of TFA to reach steady state in the river system. The peak surface water TFA concentrations in the three watersheds all reach steady state relatively quickly within the first year with some small variations, mainly due to the different flow rates relative to the water volumes in the rivers. The model-predicted surface water TFA concentrations range from 0.8 ng L−1 in High Rhine sub-basin to 3.3 ng L−1 in the Delta Rhine sub-basin. The Rhine sub-basin has higher peak concentrations than High Rhine sub-basin due to lower flow rates and higher suspended solids. Based on our TFA mass-allocation calculations, approximately 63 % of the TFA mass deposited from the air into the ocean, after the TFA concentrations reached steady state in the surface water and surface soil. According to Sturm et al. (2023), measurements of TFA in the surface water of the Rhine River are 400 ng L−1 near Karlsruhe, Germany (in the Upper Rhine, sub-basin 3) and 1100 ng L−1 near Mainz, Germany (in the Middle Rhine, sub-basin 4). These measurements suggest that future pMDIs using NGP as the medical propellant will form negligible TFA (up to 3.3 ng L−1, equivalent to less than 1 % of total) in Rhine surface water as compared to other sources that form TFA in the Rhine surface water.
Because it is not feasible to conduct detailed fate-and-transport analyses for all global watersheds, we instead estimated annual and monthly mean TFA concentrations in rainwater. This was done by dividing the monthly modelled wet deposition flux of TFA by the corresponding monthly modelled precipitation, using GEOS-Chem outputs driven by MERRA-2 reanalysis meteorology. Figure 8 displays the model-predicted annual mean concentrations of TFA in rainwater on a global scale. According to the colour scale, predicted concentrations generally range from about 0.005 to 0.040 µg L−1 (5–40 ng L−1). Most regions, including North America, Europe, and Asia, show values toward the lower end of this spectrum, while some arid areas in North Africa and the Middle East exhibit locally elevated concentrations approaching 40 ng L−1. Note that even though arid regions, such as North Africa and the Middle East, have higher TFA rainwater concentrations, the net TFA deposition in these regions will be lower due to low precipitation (Vet et al., 2014).
To contextualise these findings, we next compared these values with that reported in the literature and found that even the highest modelled concentrations are several folds lower than the observed values. For example, measured rainwater TFA in North America is frequently within 20–3779 ng L−1 (Garavagno et al., 2024), in Europe (including Germany) medians are between 69 and 350 ng L−1 (Freeling et al., 2020), and in Asia (China and Japan) measurements as high as 40–1800 ng L−1 have been reported (Garavagno et al., 2024). In the Supplement (Sect. S3), we have presented the monthly modelled mean TFA rainwater concentrations providing a more granular, month-wise rainwater TFA values that are also in agreement with these annual rainwater TFA comparison.
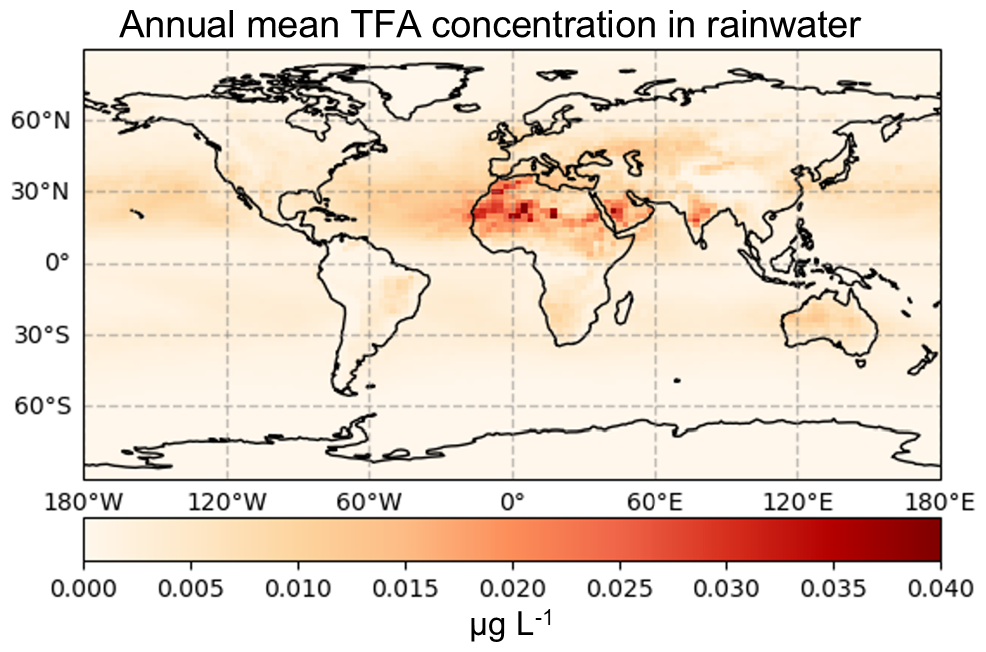
Figure 8Global annual TFA rainwater concentrations computed by dividing the wet TFA deposition flux by MERRA-2 driven predicted precipitation.
Inhaled respiratory medications delivered by pMDIs are relied upon by millions of patients, accounting for 78 % of inhaler usage globally (Bell et al., 2023). Due to their high GWP, present-day medical propellants (HFCs) are subject to phase down, under the Kigali Amendment. In this study, we estimated environmental TFA accumulation due to prospective usage of pMDIs that have HFO-1234ze(E), as the medical propellant which is not subject to phase-down under the Kigali Amendment due to its low GWP. In this study, we investigated atmospheric and surface behaviour of HFO-1234ze(E) and its atmospheric breakdown product TFA, focusing on deposition and transport of TFA within the Hudson, Rhine, and Cauvery River watersheds due to continued usage of these prospective pMDIs.
Based on IQVIA MIDAS® annual pMDI volume sales data from all manufacturers with HFO-1234ze(E) as their sole medical propellant, we estimate annual global propellant emissions of 4.736 Gg yr−1, concentrated in densely populated regions. As per Madronich et al. (2023), HFC-134a and HFO-1234yf are the two main sources of TFA in the environment. Their combined annual production rate of TFA is 0.04–0.06 Tg yr−1. Considering our estimates of annual pMDI-associated propellant emissions and theoretical TFA yield (Tewari et al., 2023), the global total TFA deposition due to future pMDI usage would be ∼0.0002 Tg yr−1, which suggests that propellant emissions based TFA production represents less than 0.5 % of the annual global TFA in the environment estimated by Madronich et al. (2023). Using the GEOS-Chem atmospheric model, adapted for MCM of HFO-1234ze(E), we simulated the effect of prospective pMDI usage, i.e., HFO-1234ze(E) emissions, on environmental TFA deposition patterns. Next, watershed-specific models that follow USEPA guidelines were used to estimate TFA concentrations over 30 years, showcasing how atmospheric TFA may spreads from rivers into the ocean following due to continued pMDI usage. Our study reveals that atmospheric TFA may deposit in soil and water bodies remote to pMDI usage, owing to its mobility and solubility. Atmospheric and watershed modelling predicts that future use of pMDIs may lead to TFA concentrations between 0.8 and 19.3 ng L−1 in surface waters, 2.3 and 8.8 ng kg−1 in surface soils, and 0.2 and 4.8 ng kg−1 in surface sediments across the three studied watersheds. These variations reflect local factors such as water flow, region-specific deposition rates, pMDI usage patterns, and weather conditions. In addition to modelling parameters, these results are also sensitive to the regional atmospheric conditions and pMDI-based HFO-1234ze(E) emission patterns. We have addressed these model-related and study-related limitations in the next section.
Lastly, the model's predicted TFA levels can be effectively evaluated by comparison with several established reference values. The highest surface water TFA concentrations attributable to pMDI use are more than 500-fold lower than the German Environment Agency's conservative drinking water threshold of 10 000 ng L−1 (Arp et al., 2024). Similarly, these modelled concentrations are greater than 100 times below the Netherlands' most recent drinking water guideline of 2200 ng L−1 (Arp et al., 2024), derived based on precautionary potency factors for PFAS. When placed in ecological context, the maximum TFA level estimated in surface water is also over 6000 times below the frequently cited no-observed-effect concentration (NOEC) of 120 000 ng L−1 for sensitive freshwater algae (Arp et al., 2024), indicating negligible risk to aquatic biota. For soils, predicted TFA loadings from pMDI emissions remain at least 90 000 times lower than the REACH long-term NOEC of 830 000 ng kg−1 for plant health (Arp et al., 2024). Furthermore, given that the lowest TFA concentration empirically measured in Rhine surface water is 400 ng L−1 (Sturm et al., 2023), prospective new emissions from pMDI use would represent less than 1 % of the total TFA present in this major watershed (or catchment).
Taken together, these findings indicate that even if HFO-1234ze(E) were to become the sole medical propellant in future pMDIs of all manufacturers, its continual atmospheric release would be expected to lead to only very low additional quantities of TFA in surface waters and soils in the assessed basins at levels orders of magnitude below available human health or ecological risk thresholds (see Sect. 5, Limitations of the Study). The maximum TFA concentrations projected here are lower than all currently relevant drinking water, aquatic, and agro-environmental benchmarks considered for these regions. Overall, the results suggest a substantial margin of safety for the assessed scenarios; however, recognising the study's assumptions and geographic scope, broader generalisation and cumulative, cross-sector assessments should be addressed in future work (see Sect. 5).
One limitation of the current study is that HFO-1234ze(E) emissions used in the atmospheric modelling of TFA are based on pMDI volume sales data from a single year (2022), which does not account for the projected increase in respiratory disease patients in the future. Emissions of species other than HFO-1234ze(E) were also held constant over the 30-year period. Future trends, particularly in NOx emissions, are expected to influence the yield of TFA due to changes in gas-phase chemistry. The 0.1° × 0.1° spatial resolution of the emissions data may not capture fine-scale variations (<11 km). However, since the smallest sub-basin has an area of approximately 7040 km2, this grid cell size is appropriate for the study's needs. Additionally, the limited geographical coverage of the emissions data may result in an incomplete representation of global HFO-1234ze(E) emissions, potentially affecting the accuracy of TFA formation and transport predictions on a broader scale.
Despite global coverage, the model's standard resolution (2° × 2.5° with 47 vertical levels) presents some uncertainty, as it may not capture fine-scale variations in chemistry and deposition processes, particularly in regions with complex topography or near emissions sources. TFA deposition estimates made with GEOS-Chem are subject to uncertainties arising from both the meteorological input data and model configuration.
The use of MERRA-2 meteorological inputs introduces uncertainty in projecting future scenarios, mainly due to the complexities of predicting future weather patterns associated with climate change. The chemical mechanism, implemented using KPP version 3.0 and including new chemical reactions for the MCM of HFO-1234ze(E), aims to represent our current understanding of complex atmospheric processes. Despite its detail, there are still uncertainties regarding reaction rate constants, product yields, and possible reaction pathways. Furthermore, to improve computational efficiency, we did not dynamically simulate atmospheric concentrations of H2O, OH, and HO2; instead, the model reads these from the meteorological input (MERRA-2). As a result, omitting them from the reactions does not affect their concentrations in the model, though it may have a minor impact on the spatial pattern of oxidation products.
To estimate the effects of prospective pMDI usage on surface water TFA, we modelled three different watershed regions. In scenarios lacking site-specific data, we used default modelling parameters reflecting average watershed conditions; thus, these may not always accurately represent specific water bodies. However, the impact of these defaults is usually small or insignificant, and most parameter estimates are based on generally available sub-basin data. For example, the empirical intercept coefficient's default value, derived from studies of various watersheds, minimally affects model results but may slightly over- or underestimate TFA concentrations. Since other watershed regions will have different synoptic meteorology and hydrologic properties, these results may not be generalisable beyond the specific regions studied; therefore, broader generalisation and cumulative, cross-sector assessments should be addressed in future work. This study quantifies TFA formation from HFO-1234ze(E) attributable to pMDI use only; our conclusions apply to the regions and scenarios assessed, and a cumulative, cross-sector evaluation (e.g., refrigeration/air-conditioning and other applications) will require integrated emissions inventories and harmonised atmospheric–hydrologic modelling. Finally, our conclusion that model-predicted TFA levels do not pose a threat to human health, or the environment is based on currently known safety thresholds and pMDI-use emissions inventories (magnitude and spatiotemporal pattern). As information on TFA toxicity continues to evolve, and because other sectors have different emissions inventories, these conclusions may not be generalisable to other sectors.
Inhaler-dependent HFO-1234ze(E) emissions data, the HFO-1234ze(E) chemical degradation mechanism with associated rate constants, and watershed model parameters are provided in the article and the Supplement. Additional data and information are available from the corresponding author upon reasonable request.
The supplement related to this article is available online at https://doi.org/10.5194/acp-25-15469-2025-supplement.
SGT designed the study and prepared the draft. SGT, KV, KZ, LMD, KT, FK, YZ, BY, and CH performed the data analysis. All authors edited the manuscript.
SGT, PG, HK, MG, and SP are employees of AstraZeneca and hold shares/share options in AstraZeneca. KV, KZ, LMD, KT, FK, YZ, and BY are employees of Ramboll. DKP is an employee of Honeywell.
IQVIA did not provide any support for the analysis or interpretation of the data. The statements, findings, conclusions, views, and opinions expressed are solely those of the authors and are not necessarily those of IQVIA.
Publisher’s note: Copernicus Publications remains neutral with regard to jurisdictional claims made in the text, published maps, institutional affiliations, or any other geographical representation in this paper. While Copernicus Publications makes every effort to include appropriate place names, the final responsibility lies with the authors. Views expressed in the text are those of the authors and do not necessarily reflect the views of the publisher.
The authors thank Michael E. Jenkin for developing the Master Chemical Mechanism of HFO-1234ze(E) and preparing the artwork illustrating its atmospheric degradation pathways; Zongrun Li and Viral Shah for their valuable assistance in incorporating photolysis reactions in GEOS-Chem; and Nigel Budgen for assisting with the global monthly pMDI volume sales data that were used for estimating world-wide HFO-1234ze(E) emissions. The pMDI volume sales data was obtained under license from the following information service: IQVIA MIDAS® monthly volume sales for the period 2022, for 51 countries, for inhalers across all respiratory conditions, reflecting estimates of real-world activity. Copyright IQVIA. All rights reserved, IQVIA market research information is proprietary to IQVIA and available on a confidential basis by subscription from IQVIA.
This paper was edited by Tanja Schuck and reviewed by two anonymous referees.
Adlunger, K., Anke, J., Bachem, G., Banning, H., Biegel-Engler, A., Blondzik, K., Braun, U., Eckhardt, A., Gildemeister, D., Hilliges, F., Hoffmann, G., Jentzsch, F., Klitzke, S., Kuckelkorn, J., Martens, K., Müller, A., Pickl, C., Pirntke, U., Rechenberg, J., Sättler, D., Schmidt, U., Speichert, G., Warnke, I., Wehner, J., and Wischer, R.: Reducing the input of chemicals into waters: trifluoroacetate (TFA) as a persistent and mobile substance with many sources, Dessau-Roßlau, Germany, 1–52, 2022.
Ammann, M., Cox, R., Crowley, J., Jenkin, M., Mellouki, A., Rossi, M., Troe, J., Wallington, T., Cox, B., and Atkinson, R.: IUPAC task group on atmospheric chemical kinetic data evaluation, https://iupac.aeris-data.fr (last access: 26 October 2023), 2016.
Arp, H. P. H., Gredelj, A., Glüge, J., Scheringer, M., and Cousins, I. T.: The global threat from the irreversible accumulation of trifluoroacetic acid (TFA), Environmental Science & Technology, 58, 19925–19935, 2024.
Bell, J., Ringall, A., Khezrian, M., Kocks, J., and Usmani, O.: An assessment of pressurized metered-dose inhaler use in countries in Europe and the rest of the world, in: D22. Hot topics in behavioral sciences and health services research, American Thoracic Society, A6315–A6315, 2023.
Bian, H. and Prather, M. J.: Fast-J2: Accurate simulation of stratospheric photolysis in global chemical models, Journal of Atmospheric Chemistry, 41, 281–296, 2002.
Burkholder, J., Sander, S., Abbatt, J., Barker, J., Huie, R., Kolb, C., Kurylo, M., Orkin, V., Wilmouth, D., and Wine, P.: Chemical kinetics and photochemical data for use in atmospheric studies: evaluation number 18, Pasadena, CA: Jet Propulsion Laboratory, National Aeronautics and Space, https://jpldataeval.jpl.nasa.gov (last access: 26 October 2023), 2015a.
Burkholder, J. B., Cox, R., and Ravishankara, A.: Atmospheric degradation of ozone depleting substances, their substitutes, and related species, Chemical Reviews, 115, 3704–3759, 2015b.
Burkholder, J., Sander, S., Abbatt, J., Barker, J., Cappa, C., Crounse, J., Dibble, T., Huie, R., Kolb, C., and Kurylo, M.: Chemical kinetics and photochemical data for use in atmospheric studies; evaluation number 19, Pasadena, CA: Jet Propulsion Laboratory, National Aeronautics and Space, https://jpldataeval.jpl.nasa.gov (last access: 26 October 2023), 2020.
Calvert, J., Mellouki, A., Orlando, J., Pilling, M., and Wallington, T.: Mechanisms of Atmospheric Oxidation of the Oxygenates, Oxford University Press, Oxford, 2011.
Carn, S., Yang, K., Prata, A., and Krotkov, N.: Extending the long-term record of volcanic SO2 emissions with the Ozone Mapping and Profiler Suite nadir mapper, Geophysical Research Letters, 42, 925–932, 2015.
Eastham, S. D., Weisenstein, D. K., and Barrett, S. R.: Development and evaluation of the unified tropospheric–stratospheric chemistry extension (UCX) for the global chemistry-transport model GEOS-Chem, Atmospheric Environment, 89, 52–63, 2014.
Freeling, F., Behringer, D., Heydel, F., Scheurer, M., Ternes, T. A., and Nödler, K.: Trifluoroacetate in precipitation: deriving a benchmark data set, Environmental Science & Technology, 54, 11210–11219, 2020.
Garavagno, M. d. l. A., Holland, R., Khan, M. A. H., Orr-Ewing, A. J., and Shallcross, D. E.: Trifluoroacetic acid: toxicity, sources, sinks and future prospects, Sustainability, 16, 31 pp., https://doi.org/10.3390/su16062382, 2024.
Gelaro, R., McCarty, W., Suárez, M. J., Todling, R., Molod, A., Takacs, L., Randles, C. A., Darmenov, A., Bosilovich, M. G., and Reichle, R.: The modern-era retrospective analysis for research and applications, version 2 (MERRA-2), Journal of Climate, 30, 5419–5454, 2017.
George, C., Saison, J., Ponche, J., and Mirabel, P.: Kinetics of mass transfer of carbonyl fluoride, trifluoroacetyl fluoride, and trifluoroacetyl chloride at the air/water interface, The Journal of Physical Chemistry, 98, 10857–10862, 1994.
Guenther, A. B., Jiang, X., Heald, C. L., Sakulyanontvittaya, T., Duhl, T., Emmons, L. K., and Wang, X.: The Model of Emissions of Gases and Aerosols from Nature version 2.1 (MEGAN2.1): an extended and updated framework for modeling biogenic emissions, Geosci. Model Dev., 5, 1471–1492, https://doi.org/10.5194/gmd-5-1471-2012, 2012.
Güsten, H. and Sabljic, A.: QSARs for soil sorption, in: Overview of Structure–Activity Relationships for Environmental Endpoints, edited by: Hermens, J. L. M., report prepared within the project “QSAR for Prediction of Fate and Effects of Chemicals in the Environment” (Environmental Technologies RTD Programme, DG XII/D-1, European Commission, contract EV5-CT92-0211), 1995.
Heath, E. A.: Amendment to the Montreal protocol on substances that deplete the ozone layer (Kigali amendment), International Legal Materials, 56, 193–205, 2017.
Henne, S., Shallcross, D. E., Reimann, S., Xiao, P., Brunner, D., O'Doherty, S., and Buchmann, B.: Future emissions and atmospheric fate of HFC-1234yf from mobile air conditioners in Europe, Environmental Science & Technology, 46, 1650–1658, 2012.
Hoesly, R. M., Smith, S. J., Feng, L., Klimont, Z., Janssens-Maenhout, G., Pitkanen, T., Seibert, J. J., Vu, L., Andres, R. J., Bolt, R. M., Bond, T. C., Dawidowski, L., Kholod, N., Kurokawa, J.-I., Li, M., Liu, L., Lu, Z., Moura, M. C. P., O'Rourke, P. R., and Zhang, Q.: Historical (1750–2014) anthropogenic emissions of reactive gases and aerosols from the Community Emissions Data System (CEDS), Geosci. Model Dev., 11, 369–408, https://doi.org/10.5194/gmd-11-369-2018, 2018.
Hu, L., Millet, D. B., Baasandorj, M., Griffis, T. J., Turner, P., Helmig, D., Curtis, A. J., and Hueber, J.: Isoprene emissions and impacts over an ecological transition region in the US Upper Midwest inferred from tall tower measurements, Journal of Geophysical Research: Atmospheres, 120, 3553–3571, 2015.
Hudman, R. C., Moore, N. E., Mebust, A. K., Martin, R. V., Russell, A. R., Valin, L. C., and Cohen, R. C.: Steps towards a mechanistic model of global soil nitric oxide emissions: implementation and space based-constraints, Atmos. Chem. Phys., 12, 7779–7795, https://doi.org/10.5194/acp-12-7779-2012, 2012.
Jaeglé, L., Quinn, P. K., Bates, T. S., Alexander, B., and Lin, J.-T.: Global distribution of sea salt aerosols: new constraints from in situ and remote sensing observations, Atmos. Chem. Phys., 11, 3137–3157, https://doi.org/10.5194/acp-11-3137-2011, 2011.
Javadi, M. S., Søndergaard, R., Nielsen, O. J., Hurley, M. D., and Wallington, T. J.: Atmospheric chemistry of trans-CF3CH=CHF: products and mechanisms of hydroxyl radical and chlorine atom initiated oxidation, Atmos. Chem. Phys., 8, 3141–3147, https://doi.org/10.5194/acp-8-3141-2008, 2008.
Jenkin, M., Andersen, M. S., Hurley, M., Wallington, T., Taketani, F., and Matsumi, Y.: A kinetics and mechanistic study of the OH and NO2 initiated oxidation of cyclohexa-1, 3-diene in the gas phase, Physical Chemistry Chemical Physics, 7, 1194–1204, 2005.
Jenkin, M. E., Saunders, S. M., and Pilling, M. J.: The tropospheric degradation of volatile organic compounds: a protocol for mechanism development, Atmospheric Environment, 31, 81–104, 1997.
Jenkin, M. E., Saunders, S. M., Wagner, V., and Pilling, M. J.: Protocol for the development of the Master Chemical Mechanism, MCM v3 (Part B): tropospheric degradation of aromatic volatile organic compounds, Atmos. Chem. Phys., 3, 181–193, https://doi.org/10.5194/acp-3-181-2003, 2003.
Jenkin, M. E., Young, J. C., and Rickard, A. R.: The MCM v3.3.1 degradation scheme for isoprene, Atmos. Chem. Phys., 15, 11433–11459, https://doi.org/10.5194/acp-15-11433-2015, 2015.
Jenkin, M. E., Valorso, R., Aumont, B., and Rickard, A. R.: Estimation of rate coefficients and branching ratios for reactions of organic peroxy radicals for use in automated mechanism construction, Atmos. Chem. Phys., 19, 7691–7717, https://doi.org/10.5194/acp-19-7691-2019, 2019.
Kwok, E. S. and Atkinson, R.: Estimation of hydroxyl radical reaction rate constants for gas-phase organic compounds using a structure-reactivity relationship: An update, Atmospheric Environment, 29, 1685–1695, 1995.
Leather, K. E., McGillen, M. R., Ghalaieny, M., Shallcross, D. E., and Percival, C. J.: Temperature-dependent kinetics for the ozonolysis of selected chlorinated alkenes in the gas phase, International Journal of Chemical Kinetics, 43, 120–129, 2011.
Lin, H., Jacob, D. J., Lundgren, E. W., Sulprizio, M. P., Keller, C. A., Fritz, T. M., Eastham, S. D., Emmons, L. K., Campbell, P. C., Baker, B., Saylor, R. D., and Montuoro, R.: Harmonized Emissions Component (HEMCO) 3.0 as a versatile emissions component for atmospheric models: application in the GEOS-Chem, NASA GEOS, WRF-GC, CESM2, NOAA GEFS-Aerosol, and NOAA UFS models, Geosci. Model Dev., 14, 5487–5506, https://doi.org/10.5194/gmd-14-5487-2021, 2021.
Lin, H., Long, M. S., Sander, R., Sandu, A., Yantosca, R. M., Estrada, L. A., Shen, L., and Jacob, D. J.: An Adaptive Auto-Reduction Solver for Speeding Up Integration of Chemical Kinetics in Atmospheric Chemistry Models: Implementation and Evaluation in the Kinetic Pre-Processor (KPP) Version 3.0.0, Journal of Advances in Modeling Earth Systems, 15, e2022MS003293, https://doi.org/10.1029/2022MS003293, 2023.
Liu, H., Jacob, D. J., Bey, I., and Yantosca, R. M.: Constraints from 210Pb and 7Be on wet deposition and transport in a global three-dimensional chemical tracer model driven by assimilated meteorological fields, Journal of Geophysical Research: Atmospheres, 106, 12109–12128, 2001.
Logan, L.: EPA Proposes Phasedown Program For Climate-Warming HFCs, Inside EPA's Clean Air Report, 32, 11–11, 2021.
Long, B., Xia, Y., and Truhlar, D. G.: Quantitative kinetics of HO2 reactions with aldehydes in the atmosphere: High-order dynamic correlation, anharmonicity, and falloff effects are all important, Journal of the American Chemical Society, 144, 19910–19920, 2022.
Luecken, D. J., Waterland, R. L., Papasavva, S., Taddonio, K. N., Hutzell, W. T., Rugh, J. P., and Andersen, S. O.: Ozone and TFA impacts in North America from degradation of 2, 3, 3, 3-tetrafluoropropene (HFO-1234yf), a potential greenhouse gas replacement, Environmental Science & Technology, 44, 343–348, 2010.
Madronich, S., Sulzberger, B., Longstreth, J., Schikowski, T., Andersen, M. S., Solomon, K., and Wilson, S.: Changes in tropospheric air quality related to the protection of stratospheric ozone in a changing climate, Photochemical & Photobiological Sciences, 22, 1129–1176, 2023.
Mao, J., Jacob, D. J., Evans, M. J., Olson, J. R., Ren, X., Brune, W. H., Clair, J. M. St., Crounse, J. D., Spencer, K. M., Beaver, M. R., Wennberg, P. O., Cubison, M. J., Jimenez, J. L., Fried, A., Weibring, P., Walega, J. G., Hall, S. R., Weinheimer, A. J., Cohen, R. C., Chen, G., Crawford, J. H., McNaughton, C., Clarke, A. D., Jaeglé, L., Fisher, J. A., Yantosca, R. M., Le Sager, P., and Carouge, C.: Chemistry of hydrogen oxide radicals (HOx) in the Arctic troposphere in spring, Atmos. Chem. Phys., 10, 5823–5838, https://doi.org/10.5194/acp-10-5823-2010, 2010.
Maricq, M. M., Szente, J. J., Khitrov, G. A., and Francisco, J. S.: The CF3C (O) O2 radical. Its UV spectrum, self-reaction kinetics, and reaction with NO, The Journal of Physical Chemistry, 100, 4514–4520, 1996.
McGillen, M. R., Fried, Z. T., Khan, M. A. H., Kuwata, K. T., Martin, C. M., O'Doherty, S., Pecere, F., Shallcross, D. E., Stanley, K. M., and Zhang, K.: Ozonolysis can produce long-lived greenhouse gases from commercial refrigerants, Proceedings of the National Academy of Sciences, 120, e2312714120, https://doi.org/10.1073/pnas.2312714120, 2023.
Meng, J., Martin, R. V., Ginoux, P., Hammer, M., Sulprizio, M. P., Ridley, D. A., and van Donkelaar, A.: Grid-independent high-resolution dust emissions (v1.0) for chemical transport models: application to GEOS-Chem (12.5.0), Geosci. Model Dev., 14, 4249–4260, https://doi.org/10.5194/gmd-14-4249-2021, 2021.
Murray, L. T., Jacob, D. J., Logan, J. A., Hudman, R. C., and Koshak, W. J.: Optimized regional and interannual variability of lightning in a global chemical transport model constrained by LIS/OTD satellite data, Journal of Geophysical Research: Atmospheres, 117, D19105, https://doi.org/10.1029/2012JD017934, 2012.
Neale, R. E., Barnes, P. W., Robson, T. M., Neale, P. J., Williamson, C. E., Zepp, R. G., Wilson, S. R., Madronich, S., Andrady, A. L., and Heikkilä, A. M.: Environmental effects of stratospheric ozone depletion, UV radiation, and interactions with climate change: UNEP Environmental Effects Assessment Panel, Update 2020, Photochemical & Photobiological Sciences, 20, 1–67, 2021.
Orlando, J. J., Nozière, B., Tyndall, G. S., Orzechowska, G. E., Paulson, S. E., and Rudich, Y.: Product studies of the OH-and ozone-initiated oxidation of some monoterpenes, Journal of Geophysical Research: Atmospheres, 105, 11561–11572, 2000.
Pérez-Peña, M. P., Fisher, J. A., Hansen, C., and Kable, S. H.: Assessing the atmospheric fate of trifluoroacetaldehyde (CF3 CHO) and its potential as a new source of fluoroform (HFC-23) using the AtChem2 box model, Environmental Science: Atmospheres, 3, 1767–1777, 2023.
Pimlott, M. A., Pope, R. J., Kerridge, B. J., Latter, B. G., Knappett, D. S., Heard, D. E., Ventress, L. J., Siddans, R., Feng, W., and Chipperfield, M. P.: Investigating the global OH radical distribution using steady-state approximations and satellite data, Atmos. Chem. Phys., 22, 10467–10488, https://doi.org/10.5194/acp-22-10467-2022, 2022.
Sander, S., Friedl, R., Golden, D., Kurylo, M., Moortgat, G., Wine, P., Ravishankara, A., Kolb, C., Molina, M., and Finlayson-Pitts, B.: Chemical kinetics and photochemical data for use in atmospheric studies evaluation number 15, JPL Publication 06‑3, Jet Propulsion Laboratory, Pasadena, CA, https://jpldataeval.jpl.nasa.gov (last access: 26 October 2023), 2006.
Sander, S., Friedl, R., Golden, D., Kurylo, M., Moortgat, G., Wine, P., Ravishankara, A., Kolb, C., Molina, M., and Finlyason-Pitts, B.: Chemical kinetics and photochemical data for use in atmospheric studies: Evaluation number 15, Pasadena, CA: Jet Propulsion Laboratory, California Institute of Technology, https://jpldataeval.jpl.nasa.gov (last access: 26 October 2023), 2010.
Saunders, S. M., Jenkin, M. E., Derwent, R. G., and Pilling, M. J.: Protocol for the development of the Master Chemical Mechanism, MCM v3 (Part A): tropospheric degradation of non-aromatic volatile organic compounds, Atmos. Chem. Phys., 3, 161–180, https://doi.org/10.5194/acp-3-161-2003, 2003.
Simone, N. W., Stettler, M. E., and Barrett, S. R.: Rapid estimation of global civil aviation emissions with uncertainty quantification, Transportation Research Part D: Transport and Environment, 25, 33–41, 2013.
Søndergaard, R., Nielsen, O. J., Hurley, M., Wallington, T., and Singh, R.: Atmospheric chemistry of trans-CF3CHCHF: kinetics of the gas-phase reactions with Cl atoms, OH radicals, and O3, Chemical Physics Letters, 443, 199–204, 2007.
Soriano, J. B., Kendrick, P. J., Paulson, K. R., Gupta, V., Abrams, E. M., Adedoyin, R. A., Adhikari, T. B., Advani, S. M., Agrawal, A., Ahmadian, E., and Alahdab, F.: Prevalence and attributable health burden of chronic respiratory diseases, 1990–2017: a systematic analysis for the Global Burden of Disease Study 2017, The Lancet Respiratory Medicine, 8, 585–596, 2020.
Sturm, S., Freeling, F., Bauer, F., Vollmer, T., aus der Beek, T., and Karges, U.: Trifluoroacetate (TFA): Laying the foundations for effective mitigation – Spatial analysis of the input pathways into the water cycle, German Environment Agency (Umweltbundesamt), Dessau-Roßlau, 75 pp., 2023.
Sulbaek-Andersen, M., Stenby, C., Nielsen, O., Hurley, M., Ball, J., Wallington, T., Martin, J., Ellis, D., and Mabury, S.: Atmospheric Chemistry of n-C x F2 x+ 1CHO (x= 1, 3, 4): Mechanism of the C x F2 x+ 1C (O) O2+ HO2 Reaction, The Journal of Physical Chemistry A, 108, 6325–6330, 2004.
Sulbaek-Andersen, M. P. and Nielsen, O. J.: Tropospheric photolysis of CF3CHO, Atmospheric Environment, 272, 118935, https://doi.org/10.1016/j.atmosenv.2021.118935, 2022.
Sulbaek-Andersen, M. P., Schmidt, J. A., Volkova, A., and Wuebbles, D. J.: A three-dimensional model of the atmospheric chemistry of E and Z-CF3CH= CHCl (HCFO-1233 (zd)(E/Z)), Atmospheric Environment, 179, 250–259, 2018.
Tewari, S. G., Bell, J. P., Budgen, N., Platz, S., Gibbs, M., Newham, P., and Kimko, H.: Pressurized metered-dose inhalers using next-generation propellant HFO-1234ze (E) deposit negligible amounts of trifluoracetic acid in the environment, Frontiers in Environmental Science, 11, 1297920, https://doi.org/10.3389/fenvs.2023.1297920, 2023.
The International GEOS-Chem User Community: geoschem/geos-chem: GEOS-Chem 14.2.2 (14.2.2), Zenodo, https://doi.org/10.5281/zenodo.10034733, 2023.
Tzompa-Sosa, Z. A., Mahieu, E., Franco, B., Keller, C. A., Turner, A., Helmig, D., Fried, A., Richter, D., Weibring, P., and Walega, J.: Revisiting global fossil fuel and biofuel emissions of ethane, Journal of Geophysical Research: Atmospheres, 122, 2493–2512, 2017.
Official Journal of the European Union: Regulation (EU) 2024/573 of the European Parliament and of the Council of 7 February 2024 on fluorinated greenhouse gases, amending Directive (EU) 2019/1937 and repealing Regulation (EU) No 517/2014 (Text with EEA relevance), https://eur-lex.europa.eu/eli/reg/2024/573/oj/eng (last access: 19 June 2025), 2024.
United States Environmental Protection Agency: Human Health Risk Assessment Protocol for Hazardous Waste Combustion Facilities, Final EPA530-R-05-006: Solid Waste and Emergency Response, Washington, D.C., 2005.
van der Werf, G. R., Randerson, J. T., Giglio, L., van Leeuwen, T. T., Chen, Y., Rogers, B. M., Mu, M., van Marle, M. J. E., Morton, D. C., Collatz, G. J., Yokelson, R. J., and Kasibhatla, P. S.: Global fire emissions estimates during 1997–2016, Earth Syst. Sci. Data, 9, 697–720, https://doi.org/10.5194/essd-9-697-2017, 2017.
Vet, R., Artz, R. S., Carou, S., Shaw, M., Ro, C.-U., Aas, W., Baker, A., Bowersox, V. C., Dentener, F., and Galy-Lacaux, C.: A global assessment of precipitation chemistry and deposition of sulfur, nitrogen, sea salt, base cations, organic acids, acidity and pH, and phosphorus, Atmospheric Environment, 93, 3–100, 2014.
Wallington, T. J., Sehested, J., and Nielsen, O. J.: Atmospheric chemistry of CF3C (O) O2 radicals. Kinetics of their reaction with NO2 and kinetics of the thermal decomposition of the product CF3C (O) O2NO2, Chemical Physics Letters, 226, 563–569, 1994.
Wang, Y., Jacob, D. J., and Logan, J. A.: Global simulation of tropospheric O3-NOx-hydrocarbon chemistry: 1. Model formulation, Journal of Geophysical Research: Atmospheres, 103, 10713–10725, 1998.
Wang, Z., Wang, Y., Li, J., Henne, S., Zhang, B., Hu, J., and Zhang, J.: Impacts of the degradation of 2, 3, 3, 3-tetrafluoropropene into trifluoroacetic acid from its application in automobile air conditioners in China, the United States, and Europe, Environmental Science & Technology, 52, 2819–2826, 2018.
Weng, H., Lin, J., Martin, R., Millet, D. B., Jaeglé, L., Ridley, D., Keller, C., Li, C., Du, M., and Meng, J.: Global high-resolution emissions of soil NOx, sea salt aerosols, and biogenic volatile organic compounds, Scientific Data, 7, 148, https://doi.org/10.1038/s41597-020-0488-5, 2020.
Wesely, M.: Parameterization of surface resistances to gaseous dry deposition in regional-scale numerical models, Atmospheric Environment, 41, 52–63, 2007.
Williams, A. J., Grulke, C. M., Edwards, J., McEachran, A. D., Mansouri, K., Baker, N. C., Patlewicz, G., Shah, I., Wambaugh, J. F., Judson, R. S., and Richard, A. M.: The CompTox Chemistry Dashboard: a community data resource for environmental chemistry, J. Cheminform, 9, 61, https://doi.org/10.1186/s13321-017-0247-6, 2017.
World Meteorological Organization (WMO): Scientific Assessment of Ozone Depletion, Global Atmosphere Watch Report No. 278, 2022.
Xiao, Y., Logan, J. A., Jacob, D. J., Hudman, R. C., Yantosca, R., and Blake, D. R.: Global budget of ethane and regional constraints on US sources, Journal of Geophysical Research: Atmospheres, 113, D21306, https://doi.org/10.1029/2007JD009415, 2008.
Zender, C. S., Bian, H., and Newman, D.: Mineral Dust Entrainment and Deposition (DEAD) model: Description and 1990s dust climatology, Journal of Geophysical Research: Atmospheres, 108, D14, 4416, https://doi.org/10.1029/2002JD002775, 2003.