the Creative Commons Attribution 4.0 License.
the Creative Commons Attribution 4.0 License.
 | 30 Oct 2025
Differentiation of primary and secondary marine organic aerosol with machine learning
Baihua Chen
Lu Lei
Emmanuel Chevassus
Ling Zhen
Haobin Zhong
Lin Wang
Chunshui Lin
Ru-Jin Huang
Darius Ceburnis
Colin O'Dowd
Jurgita Ovadnevaite
Marine primary organic aerosols (POAs) are important components of the marine climate system, regulating solar radiation budget and cloud dynamics. Despite their importance, there is a lack of extensive long-term observations of POA properties, introducing great uncertainty in their parameterization in models. This lack of information originates from the complexity of POA chemical composition, very few long-term high-resolution measurements of clean marine air, and the difficulty in performing source apportionment techniques over a long-term period. In this study, we utilize a comprehensive high-resolution time-of-flight aerosol mass spectrometer (HR-ToF-AMS) dataset spanning 1 decade (2009–2018) and introduce a machine learning (ML) approach to distinguish between marine POA and marine secondary organic aerosol (SOA). Results indicate that marine POA concentrations peak during summer months and reach their lowest levels in winter. On average, marine POA constitutes 51 % (ranging from 21 % to 76 %) of the marine organic aerosol (OA) annually and up to 63 % (48 % to 75 %) in summer. With the differentiated POA and SOA, we found diverse impacts of POA and SOA on aerosol hygroscopicity and mixing state. An increase in POA reduces the hygroscopicity and leads to an external state of mixing, while an increase in SOA sustains the relatively high hygroscopicity and leads to internal mixing. This study provides an observational dataset for marine POA and SOA and their diverse impacts on aerosol hygroscopicity, emphasizing a better appreciation of marine POA and SOA to improve the climate projections.
- Article
(3461 KB) - Full-text XML
-
Supplement
(1318 KB) - BibTeX
- EndNote


Marine aerosols constitute a large portion of the global aerosol budget and are pivotal in regulating the Earth's climate system (Fitzgerald, 1991; O'Dowd and Leeuw, 2007). It has been known for quite some time that marine aerosols contain a significant amount of organic matter (Blanchard, 1964). Cavalli et al. (2004) and O'Dowd et al. (2004) show the great contribution of organic matter to the Northeast Atlantic marine aerosol during periods of high biological activities. This marine organic aerosol (OA) originates from two sources: (1) bubble bursting that scavenges surface-active organic matter and other biogenic materials (bacteria, viruses, and detritus), producing primary organic aerosol (POA) (Barger and Garrett, 1970; Blanchard, 1964; Blanchard and Woodcock, 1957); (2) oxidation of marine volatile organic compounds (VOCs), such as dimethyl sulfide (DMS), aliphatic amines, isoprene, and monoterpenes, which can form secondary organic aerosol (SOA) (Bates et al., 1992; Bonsang et al., 1988; Charlson et al., 1987; Facchini et al., 2008; Meskhidze and Nenes, 2006; Wohl et al., 2023; Zheng et al., 2020).
Marine POA is crucial for regulating cloud properties, acting as cloud condensation nuclei (CCN) or ice nuclei (IN). Ovadnevaite et al. (2011a) documented a marine POA plume with a peak POA concentration of up to 3.8 µg m−3 in the Northeast Atlantic, which is comparable to levels found in European continental air. Ovadnevaite et al. (2011b) further highlighted that marine POA has low hygroscopicity but high CCN potential. Additionally, sea spray tank experiments have demonstrated a significant correlation between seawater nanophytoplankton cell abundances and sea spray CCN number fluxes (Sellegri et al., 2021).
Incorporating marine POA into global models necessitates a comprehensive understanding of the source strength and environmental response of POA. O'Dowd et al. (2008) proposed an integrated organic–inorganic sea spray source function that accounted for a size-dependent contribution of POA to total sea spray aerosol. Further parameterization efforts have considered factors such as chlorophyll a concentration and wind speed (Gantt et al., 2011; Gantt et al., 2012; Rinaldi et al., 2013), which have been integrated into global chemical transport models. However, the influence of marine biota on the chemical composition and cloud activation properties of POA remains a contentious topic. O'Dowd et al. (2015) observed significant changes in the CCN activities of sea spray aerosol during a phytoplankton plume over the Northeast Atlantic, whereas Quinn et al. (2014) and Bates et al. (2020) reported no substantial alterations in CCN activity over the Northwest Atlantic.
In summary, the source intensity, chemical composition, mixing state, and cloud condensation activation potential of marine POA remain poorly understood (Gantt and Meskhidze, 2013), with large discrepancies between modelled and measured POA (Gantt et al., 2015). A major challenge in improving POA parameterization and modelling is the lack of long-term datasets, which are critical for both understanding the environmental drivers of POA emissions and developing emission schemes for regional or global chemical transport models. The majority of the available data, such as those in Rinaldi et al. (2013), are derived from filter measurements that require extended sampling durations and result in low time resolution (days to weeks). Although filter-based methods can distinguish POA from SOA by using chemical molecular fingerprints (O'Dowd et al., 2004), they suffer from low temporal resolution, limiting their ability to capture dynamic changes in aerosol composition (minutes to hours).
The deployment of an aerosol mass spectrometer (AMS) in both coastal and remote marine atmospheres has provided an opportunity to improve the POA parameterization and refine model predictions (Choi et al., 2017; Huang et al., 2018; Ovadnevaite et al., 2014; Saliba et al., 2020; Sanchez et al., 2021; Schmale et al., 2013; Willis et al., 2017). The AMS enables near-real-time measurements of aerosol chemical composition (DeCarlo et al., 2004, 2006), including organic aerosol (OA), non-sea-salt sulfate (nss-SO4), ammonium (NH4), nitrate, methanesulfonic acid (Ovadnevaite et al., 2014), and sea salt (Ovadnevaite et al., 2012). While POA and SOA can be differentiated using their mass spectra fingerprints through positive matrix factorization (PMF), this method faces challenges in high-time-resolution long-term datasets due to the required workforce and computational cost (Chevassus et al., 2025).
In this study, we developed a machine learning (ML) model to differentiate the contributions of marine POA and SOA from the measured total marine OA, using long-term marine aerosol measurements obtained by an AMS at the Mace Head Atmospheric Research Station (MHD). This model effectively identified and quantified contributions from the marine POA from SOA. The impacts of POA and SOA on aerosol hygroscopicity were then investigated.
2.1 Data and instrumentation
Aerosol measurements were conducted at the Mace Head Atmospheric Research Station (53°19′ N, 9°54′ W) on the west coast of Ireland from 2009 to 2018. The station, regularly exposed to clean marine air masses from the North Atlantic, has been a representative site for studying clean marine aerosols for several decades (O'Dowd et al., 2014).
We employed a high-resolution time-of-flight AMS (HR-ToF-AMS; DeCarlo et al., 2004) at Mace Head (Ovadnevaite et al., 2014) to measure the PM1 (particulate matter with a diameter smaller than 1 µm) chemical composition, including organic aerosol (OA), non-sea-salt sulfate (nss-SO4), sea salt, methanesulfonic acid (MSA) (Ovadnevaite et al., 2014), ammonium (NH4), and nitrate (NO3). Additionally, black carbon (BC) was measured using a multi-angle absorption photometer (MAAP) to trace anthropogenic emissions. Meteorological conditions were also recorded, including air temperature, pressure, precipitation, relative humidity (RH), wind speed, and wind direction.
A humidified tandem differential mobility analyser (HTDMA) (Swietlicki et al., 2000) was used to measure aerosol hygroscopic growth at a fixed relative humidity of 90 % for aerosol with selected dried sizes of 35, 50, 75, 110, and 165 nm. The growth factors measured by the HTDMA were inverted using a piecewise linear function (Gysel et al., 2009).
The arithmetic mean GF (GFmean) was calculated as
To quantify the mixing state, the GF spread factor (SF), defined as the standard deviation of the GF-PDF divided by the GFmean, was calculated as
The GF was measured at 90 % RH; however, the RH of the second differential mobility analyser (DMA) fluctuated slightly with the ambient temperature. The data between 88 %–92 % RH were corrected using the κ-Köhler theory according to the formula derived from Petters and Kreidenweis (2007),
where aw is the water activity, and were obtained by Köhler theory:
where σs is the surface tension of the droplet, vw is the partial molar volume of water, R is the universal gas constant, T is the temperature, and D is the diameter of the droplet. The surface tension is assumed to be 0.072 mN m−1.
Data from the AMS and MAAP were averaged to a 10 min resolution, while the meteorological records were initially recorded hourly and later downscaled to 10 min intervals using linear interpolation to enlarge the dataset's availability. Any gaps in the AMS or MAAP data that contain invalid measurements were removed. Hourly boundary layer heights were obtained from ERA5 (Hersbach et al., 2020) and downscaled to 10 min resolution using linear interpolation.
2.2 Clean sector criteria and machine learning strategy
To differentiate between marine POA and SOA at the Mace Head Atmospheric Research Station (MHD), this study employs an ML model to predict the mass concentration of marine SOA. Subsequently, POA concentrations are obtained by subtracting SOA from the measured total OA. Marine SOA was chosen as the ML model predictor because SOA is expected to be impacted by environmental factors and because less is known about POA, emission strengthening, and source regions. To ensure the high quality of the SOA production period, we implemented multiple screening criteria to minimize the influence of anthropogenic and marine primary signatures. Firstly, we applied clean sector criteria, limiting BC concentration to less than 15 ng m−3 and selecting wind direction between 190 and 300° (O'Dowd et al., 2014) to exclude continental outflows and ship plumes. The clean sector criteria, which have been established and applied in various MHD research studies (O'Dowd et al., 2014; Ovadnevaite et al., 2014; Xu et al., 2022), were employed to isolate marine air masses from anthropogenic influences.
We then applied additional filtering processes to reduce the impact of POA production. We further refined the data by keeping instances with wind speed below 6 m s−1 and sea salt mass concentration under 0.03 µg m−3 to minimize the concentration of marine POA. Finally, we retained only those data points where nss-SO4 was the dominant component (nss-SO4/OA > 4) to ensure a predominantly secondary source. We presumed that, in these selected data, OA was predominantly SOA, with the contribution of POA represented by a minor and constant background concentration (POAbg).
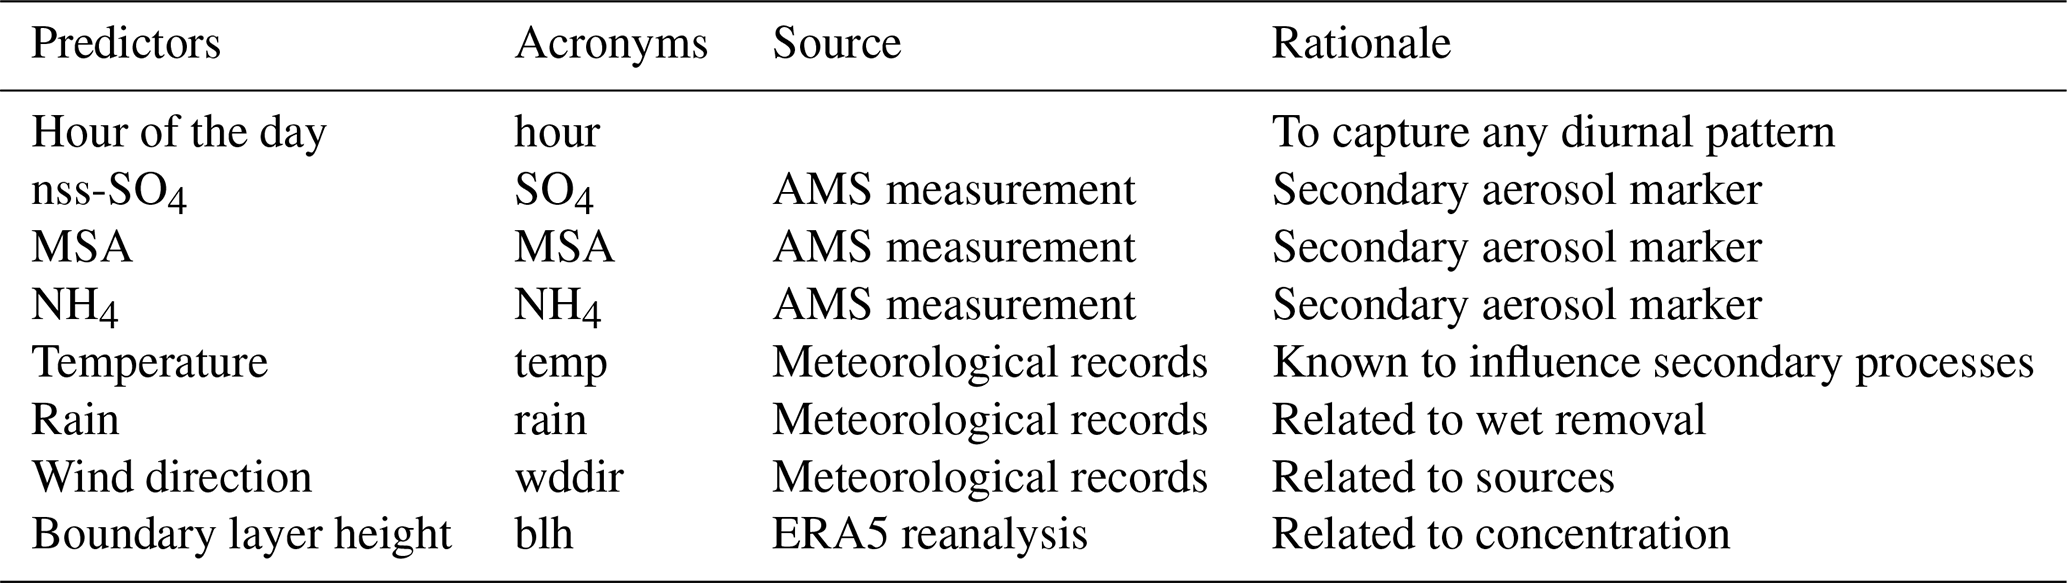
Subsequently, we employed a support vector regression (SVR) (Awad et al., 2015) trained on these rigorously selected SOA production periods. SVR was chosen for its generalizability in handling small datasets and its resistance to overfitting (Ghimire et al., 2022; Juang and Hsieh, 2009). Unlike tree-based models like random forest (Breiman, 2001), SVR model can predict continuous values (Ma et al., 2003; Tang et al., 2024). The hyperparameters, including the penalty coefficient (C) and gamma (γ) of the radial basis function (RBF) kernel, were tuned via grid research. The model targeted OA concentration, using nss-SO4, MSA, NH4, and meteorological parameters (temperature, relative humidity, boundary layer height, wind direction, and pressure) as predictors. We also included hours of the day to capture diurnal variations. Predictors not directly linked to secondary production, e.g. sea salt, NO3, and BC, are excluded to avoid over-fitting and ensure generalizability, even though including these might have enhanced the model performance in the training dataset. Wind speed was used to select the SOA production period; therefore, it was not suitable as a predictor. A summary of the variables employed as predictors is shown in Table 1. The SVR was trained using the “tidymodel 1.3.0” framework using R programming software (version 4.4.3).
The selected SOA production periods were split by the year 2015: data before 2015 were used to train the model. The training dataset covered a significant fraction of the variabilities in predictors, as illustrated in Fig. S1 in the Supplement. The hyperparameters of the SOA-SVR model were optimized using grid search and 5-fold cross-validation. The data after 2015, which were unseen for the training process, were used to challenge the model's generalizability. Overall, there are 1700 h of SOA production periods and 477 h (27.8 %) after 2015.
A schematic diagram of the proposed methodology is shown in Fig. 1. Initially, the clean marine dataset was extracted by applying the clean sector criteria, followed by additional filtering processes to minimize the influence of POA. To assess the representativeness of the selected data as secondary sources, the Fuzzy C-Means (FCM) clustering method (Bezdek et al., 1984) was utilized. Subsequently, data were divided into training, validation, and test sets for ML, with SOA (including minor POAbg) as the predictive variable. To mitigate experimental uncertainties, cross-validation and Monte Carlo simulations were performed. The study further investigated the magnitude of the POAbg values. Finally, the ML method was applied on the clean marine air mass data to predict marine SOA concentrations, enabling the differentiation of marine POA concentrations within the total marine OA.
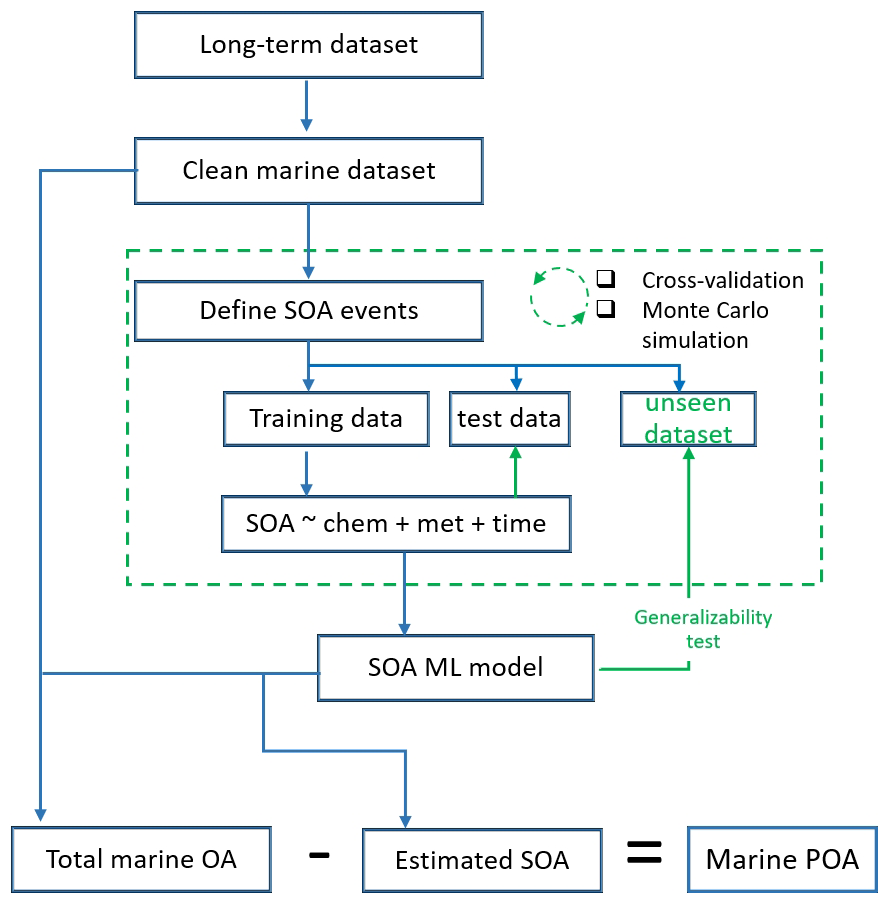
Figure 1The proposed data processing and model construction workflow. POAbg represents the assumed constant POA background concentration. ML (chem + met + time) represents the machine learning model that uses chemical composition and meteorological and time parameters as predictors.
2.3 Fuzzy C-Means clustering
FCM is a clustering algorithm that enables the grouping of data points into multiple clusters with varying degrees of membership. Unlike traditional hard clustering techniques, where each data point is assigned to a single cluster, FCM assigns membership levels to each data point, indicating the degree to which it belongs to each cluster. This soft clustering approach is particularly useful when dealing with complex datasets where boundaries between clusters are not well defined or overlap significantly. By optimizing an objective function that minimizes the weighted sum of squared errors, FCM iteratively updates the cluster centres and membership degrees, providing a flexible and robust means of uncovering underlying patterns and structures within data. In this study, the input variables for the FCM model included chemical components (sea salt, OA, NO3, SO4, NH4, MSA, and BC) and meteorological parameters (temperature (temp), relative humidity (rhum), wind speed (wdsp), and wind direction (wddir)). We randomly selected 10 000 samples and retained only those with positive concentrations for all chemical components. The data were then log10-transformed and Z-score-standardized. The FCM model was configured with five clusters, a fuzziness exponent of 1.2, and Euclidean distance as the distance metric.
3.1 Performance of the ML model in the SOA production period
We firstly examined the aerosol composition in the selected secondary marine aerosol dataset. In these SOA production periods, nss-SO4 constituted 68.9 ± 8.7 % of the PM1 mass, followed by OA at 12.1 ± 3.4 % and MSA at 6.8 ± 4.0 %. The average concentrations of sea salt and wind speed were 0.015 ± 0.009 µg m−3 and 4.6 ± 1.2 m s−1, respectively. The MSA–nss-SO4 ratio was 0.10 ± 0.06, aligning with previous findings at the same site (Ovadnevaite et al., 2014). BC concentrations remained well below the 15 ng m−3 threshold, averaging at 6.0 ± 3.7 ng m−3. Taken together, this chemical composition indicates the selected data mainly originated from secondary sources.
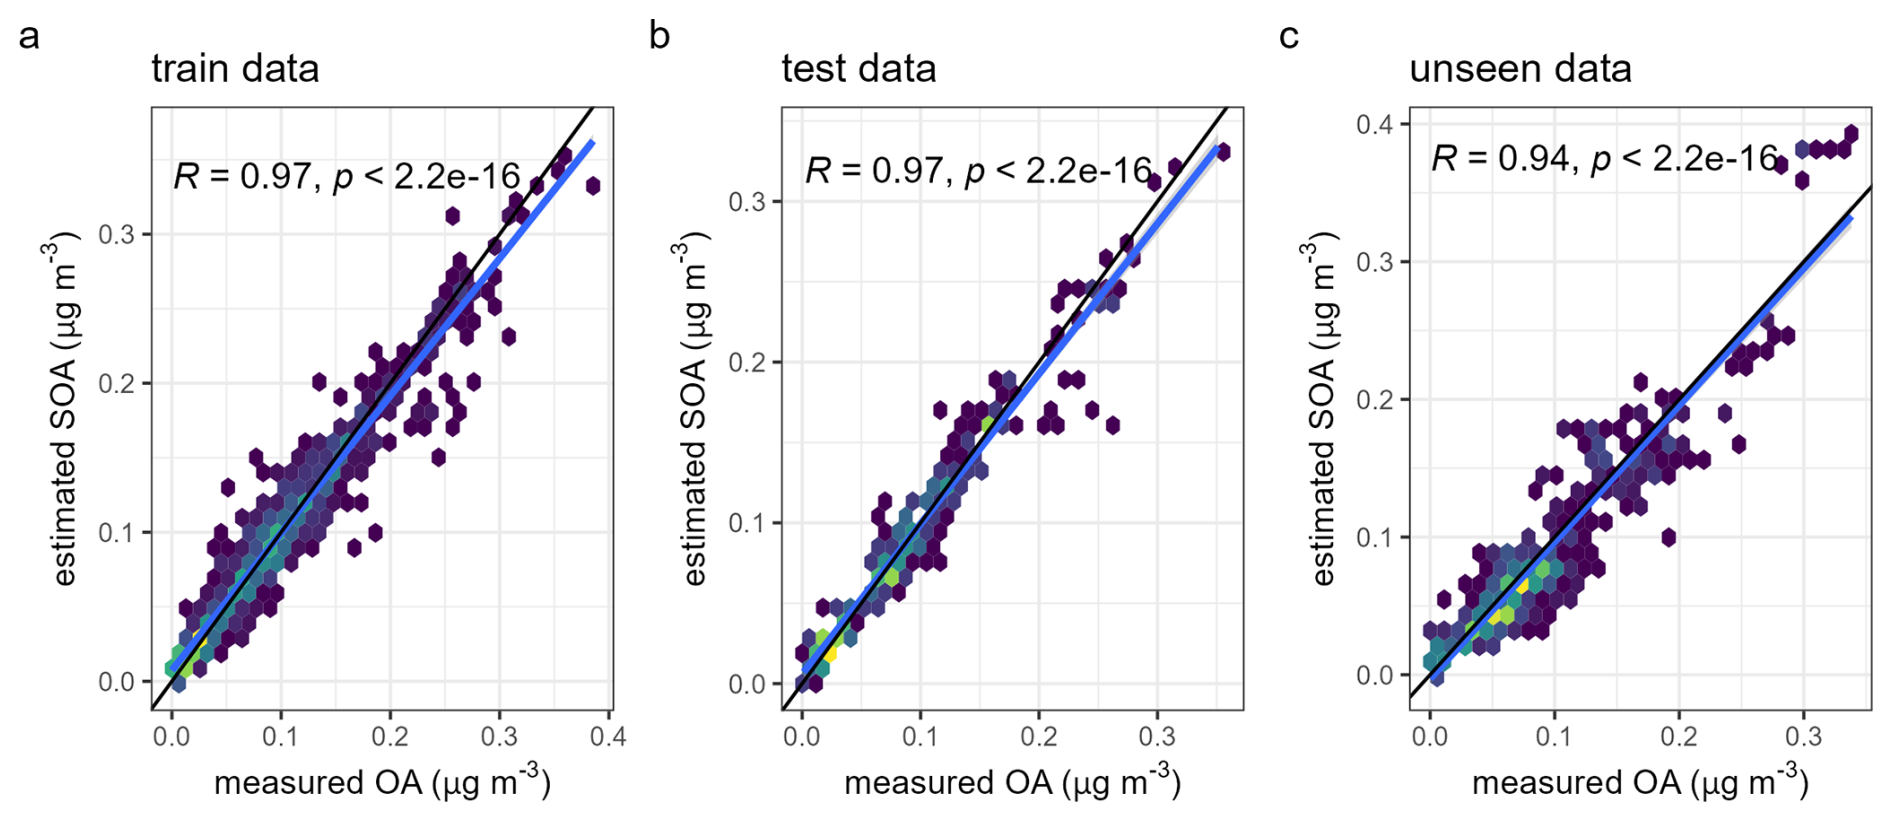
Figure 2Observed OA versus predicted (SOA +POAbg) for (a) training, (b) validation, and (c) test datasets. Data density is illustrated using a colour gradient, with darker colours indicating a lower data density. Black lines denote the 1:1 correspondence lines, and blue lines represent regression lines.
To ensure the representativeness of the selected training data as secondary sources, we applied the FCM method on the clean marine dataset to identify the characteristics of chemical and meteorological parameters from typical sources. Compared to more conventionally used k-means clustering, FCM allows data instances to belong to multiple clusters with varying degrees of membership (or probability). The membership is used to determine how strongly each data instance belongs to each cluster. The FCM clustering, which is independent of the selection of SOA production periods, provides further validation and examination of the data selection for model training. We selected those with any cluster membership higher than 80 % to show the clustering centre of each cluster. As shown in Fig. S2a, the second factor, which is featured by low sea salt, low wind speed, and high temperature, is most likely to be of the secondary origin. This factor also showed high MSA and nss-SO4, supporting the selection criteria for the SOA production period. Indeed, the highest possibility of the selected training data is found to be the second factor (Fig. S2b), reaffirming the SOA production characteristics.
Subsequently, we employed the SVR model, leveraging the clean marine dataset, to predict OA (SOA + POAbg) concentrations. Cross-validation yields Pearson's R of 0.97 for training and validation datasets, demonstrating the model's accuracy in predicting total OA (SOA + POAbg) concentration using the selected predictors. The slopes between estimated SOA + POAbg and measured OA were 0.97 for both the training and validation data, indicating robust pattern recognition across most concentration ranges. The model also exhibited great generalizability and performed consistently well on an unseen dataset (Fig. 2c), with a Pearson's R value of 0.94 and a slope of 0.98 between observed OA and estimated SOA + POAbg, reaffirming the model's efficacy in modelling the complex dynamics of SOA.
Permutation importance analysis highlighted nss-SO4 and MSA as the most influential variables, followed by NH4 (Fig. 3a). Partial dependence plots (Fig. 3b) indicate a nonlinear relationship between SOA and increasing levels of nss-SO4 and MSA. While these plots do not imply a causal relationship, they highlight the complexity of the interactions and underscore the importance of employing a machine learning model to effectively capture such intricate patterns. Various meteorological parameters were also found to influence SOA concentration, especially relative humidity and precipitation, but to a lower extent. It should be noted that the nss-SO4, although being found in marine secondary species, exhibits different formation dynamics and timescales with marine SOA, which might induce some extent of uncertainty. However, both marine SOA and nss-SO4 might originate from marine biological activities. Furthermore, marine air masses arriving in MHD are expected to be advected over the Northeast Atlantic for several days. The use of nss-SO4 can also be supported by the high correlation between nss-SO4 and MSA, which exhibit different atmospheric formation dynamics.
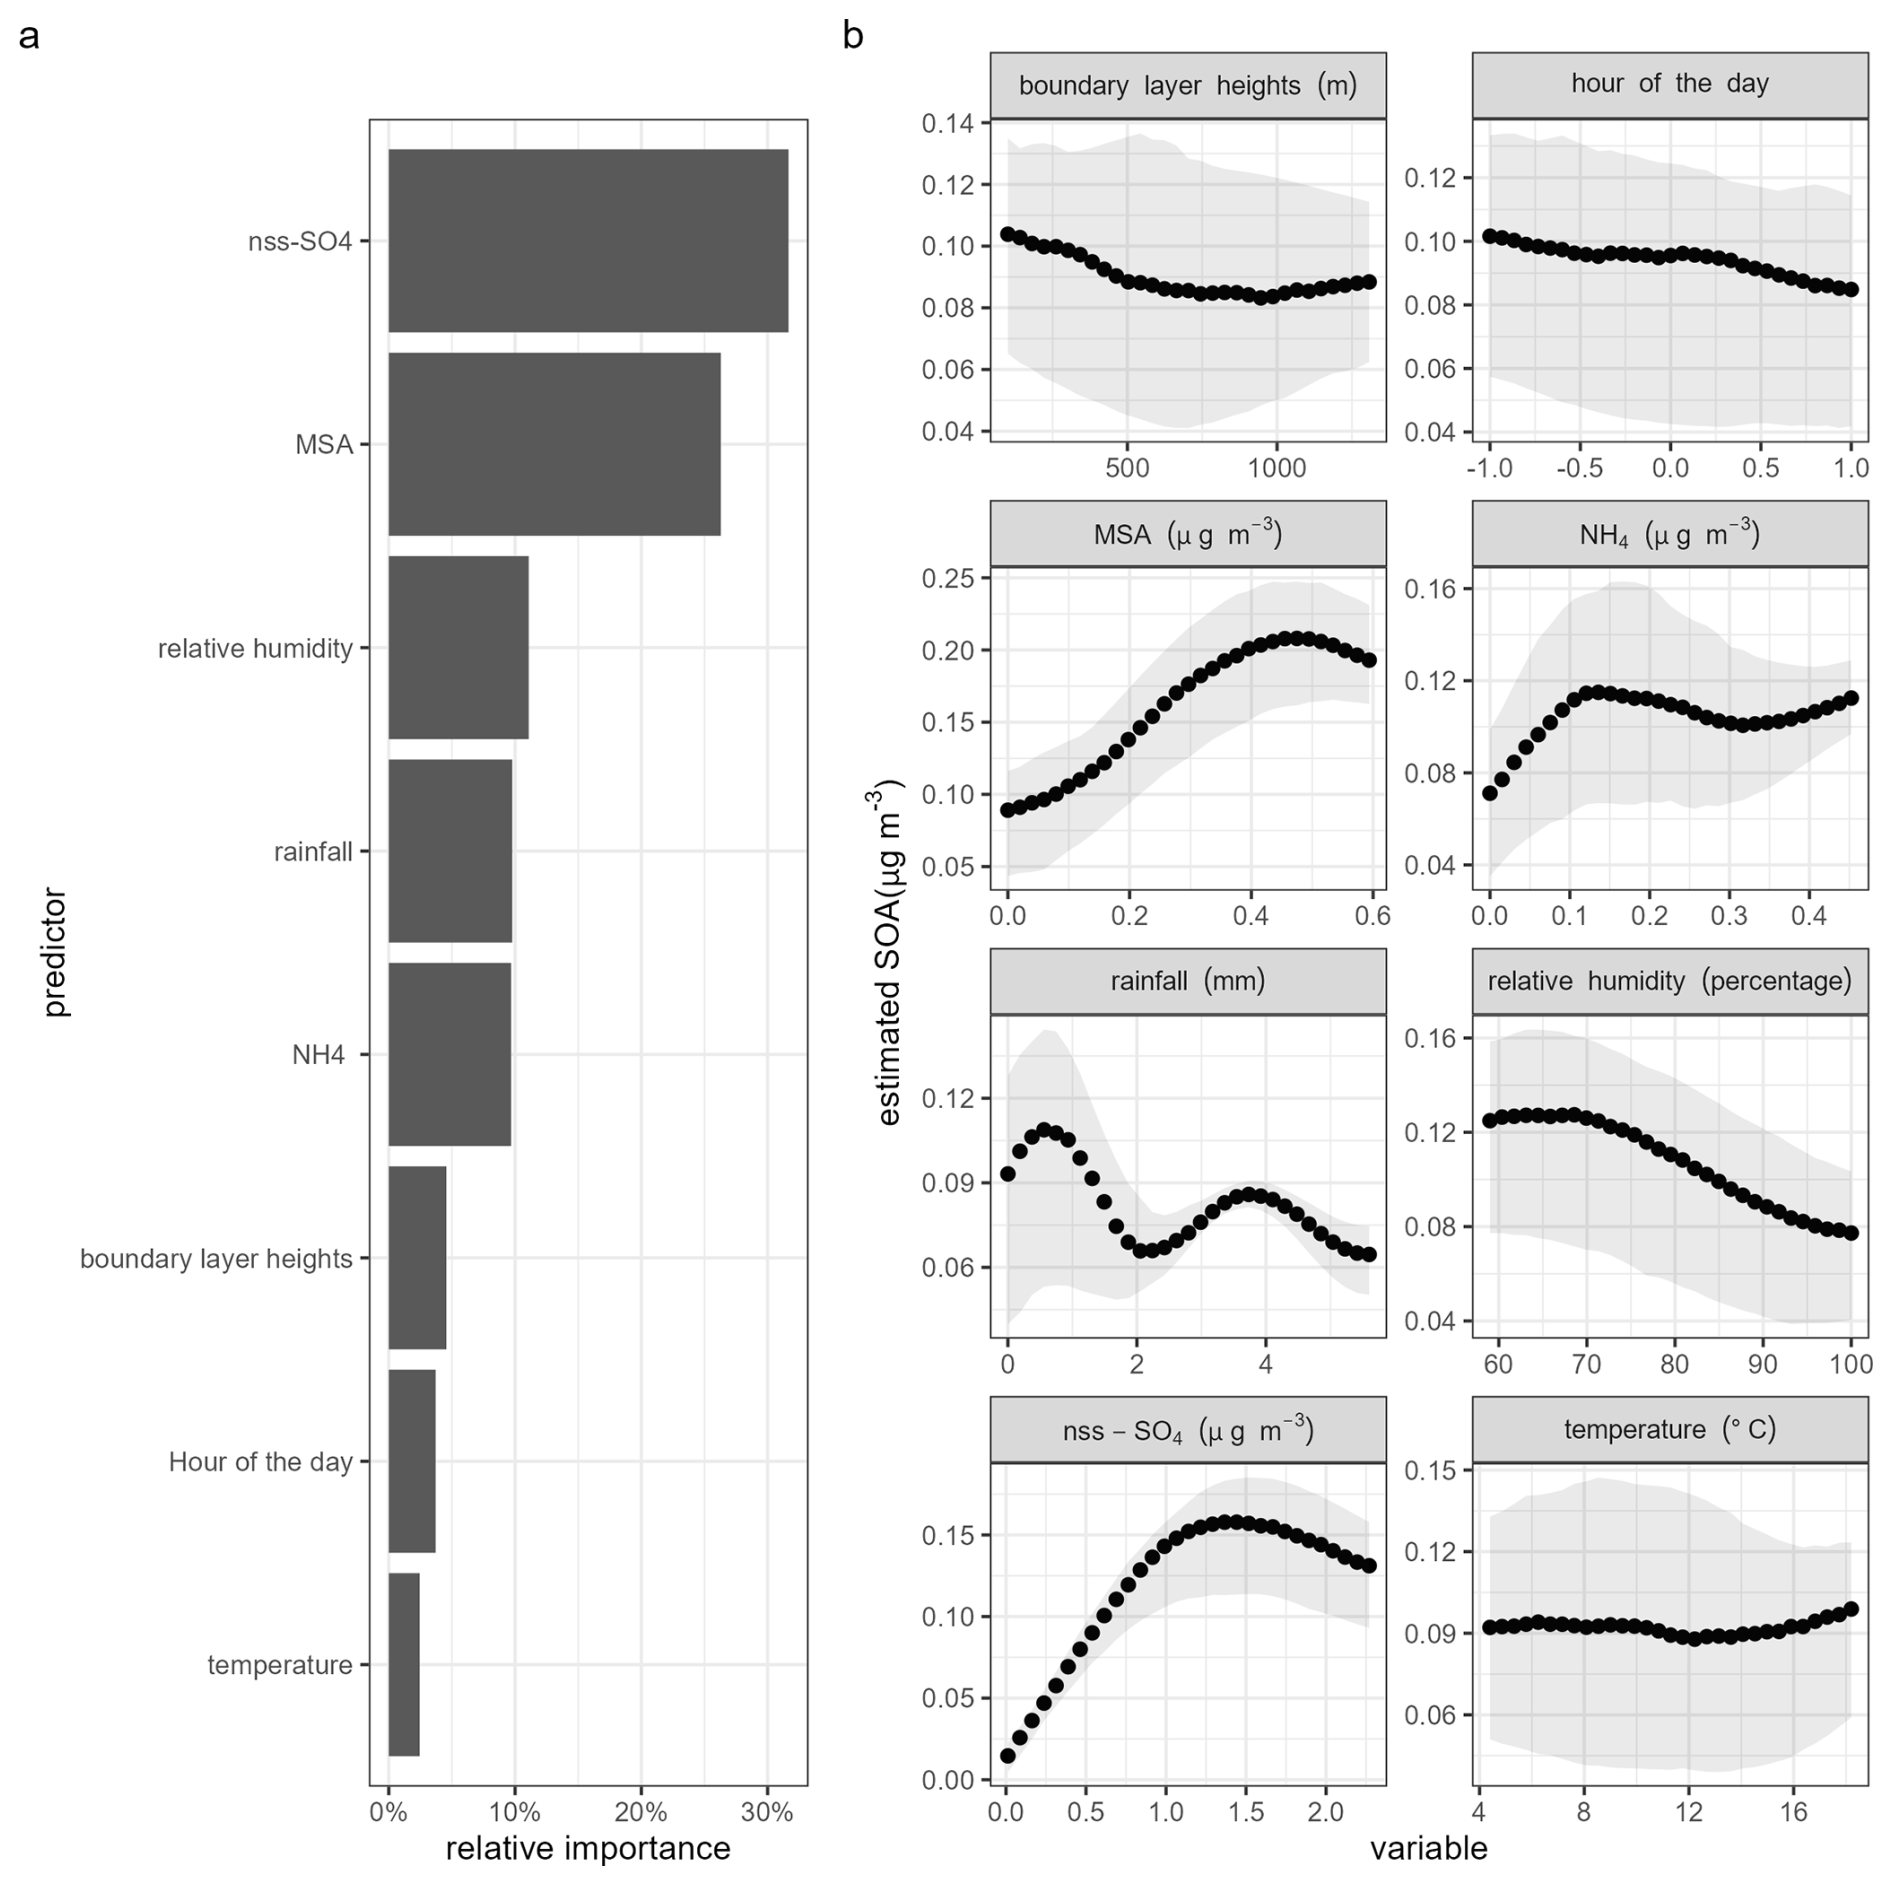
Figure 3(a) The relative importance of different predictors. The hour and month were transformed with cosine functions. The month and hour were transformed to preserve continuity in the data. (b) The partial dependence of estimated SOA to different predictors. The lines represent median values, and the shaded areas represent the 25th to 75th percentile; the 23:00 and 01:00 LT data are numerically far apart despite being temporally close. Therefore, the hour of the day for periodic functions is simulated with cosine functions: hour = cos(hour ).
In this study, one of the major assumptions of this approach is to assume that the OA in the selected secondary marine data for training the model is dominated by SOA. To evaluate the potential influence of POA contributions in those secondary marine data cases on the entire clean marine dataset, we conducted a sensitivity analysis. We assumed that POAbg constitutes 5 % to 30 % of OA. As shown in Fig. S3, compared to the original assumption, the monthly averaged concentration of POA systematically increased throughout most of the year, except during winter, when alternative assumption predicted POA concentrations lower than 0, which is, of course, nonphysical. Then, we applied the model to the entire clean marine dataset and tried different fixed POAbg values iteratively. As shown in Fig. S4, the POAbg of 0.01 µg m−3 yields the fewest nonphysical predictions (either POA or SOA lower than 0). Therefore, the POAbg of 0.01 µg m−3 was used in the following calculation. Based on this strategy, SOA concentrations were predicted, enabling the estimation of POA concentrations. Furthermore, if the POA production period is defined as a period with POA concentrations exceeding 0.1 µg m−3 for more than 12 h, there were more than 60 such POA production periods during the 10-year period (Fig. S5). Detecting these POA production periods allows detailed characterization, potentially enhancing its parameterization.
Note that the measurement itself contains relatively large uncertainty, compared to summertime measurement. Indeed, we manually tuned the POAbg value to minimize the negative values. This is supported by previous studies that the marine area is a large organic pool (Quinn et al., 2014). Given the inherent uncertainties in aerosol measurements, which are well documented in previous studies (Ovadnevaite et al., 2014), we further quantified the uncertainties associated with the ML model using Monte Carlo simulations. To do this, we performed a robustness test by randomly validating the model 1000 times, each time excluding 20 % of the data from the training set. The lower and upper limits of the estimated POA seasonality are shown in Fig. S6, which is similar to the original model. The Monte Carlo ensembles demonstrated negligible differences in the contribution of POA, indicating stable model performance across different scenarios. While it should be noted that the Monte Carlo bootstrapping is used to assess the random uncertainties, potential uncertainties associated with possible systematic uncertainties require further investigation.
To validate the ML-based POA concentrations, we further compared them with PMF-based POA concentrations from Chevassus et al. (2025). The PMF-based source apportionment was conducted for about 1 month. The Pearson's correlation coefficient between ML-based POA and PMF-based POA was about 0.91, indicating strong agreement between the two methods (Fig. 4). Compared to the conventional AMS-based OA source apportionment techniques, e.g. PMF, this ML approach requires significantly fewer computational resources and is less dependent on detailed knowledge of the mass spectra signatures of marine POA and SOA. For example, the model performed equally well even after removing MSA as a predictor (Fig. S7). Given that MSA can only be resolved by high-resolution AMS, this suggests that our approach could be extended to Aerosol Chemical Speciation Monitor (ACSM) data, which are more affordable and widely used but have a lower mass resolution. This would enable broader applications of our method, offering a more comprehensive understanding of marine POA over global oceans. Finally, although secondary production of OA and nss-SO4 relies on similar meteorological conditions, it should be noted that many marine VOC species do not share the same sources and oxidization pathways as DMS and its derivatives. For example, some VOCs are produced by different organisms or abiotically from the sea surface microlayer (Ciuraru et al., 2015; Mungall et al., 2017), which could introduce additional uncertainty in the SOA quantification based on periods of high nss-SO4, which adds to the uncertainty for POA attribution as well.
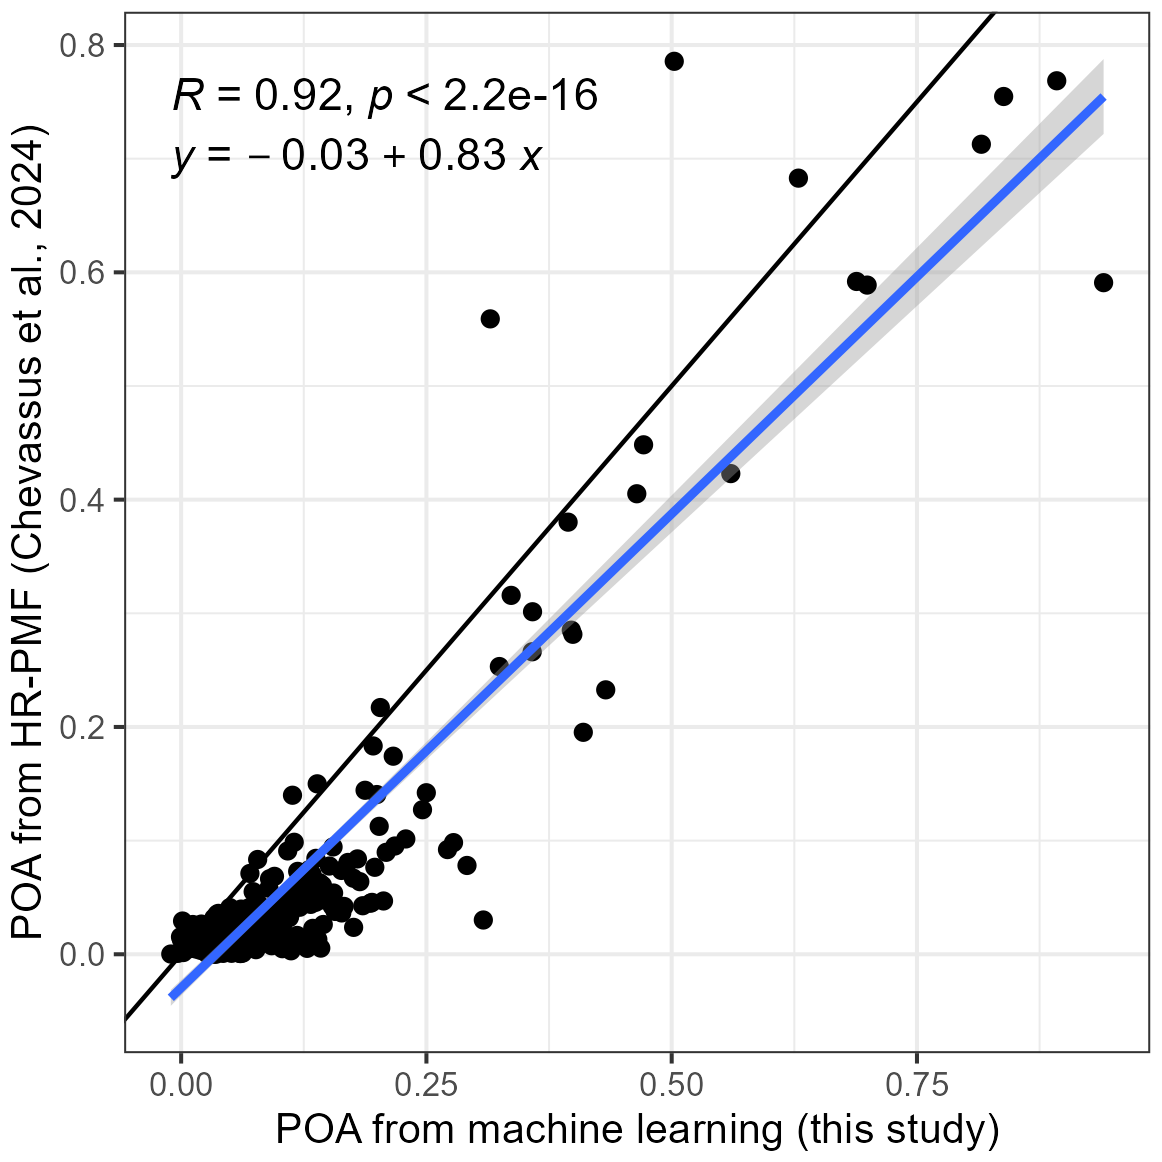
Figure 4The comparison between machine-learning-derived POA and HR-PMF POA. The HR-PMF POA data are taken from Chevassus et al. (2025). The blue line is the regression line, and the grey area represents the 95 % confidence interval. The black line represents the 1:1 line. Pearson's correlation coefficient and the equation of regression line are shown in the top left.
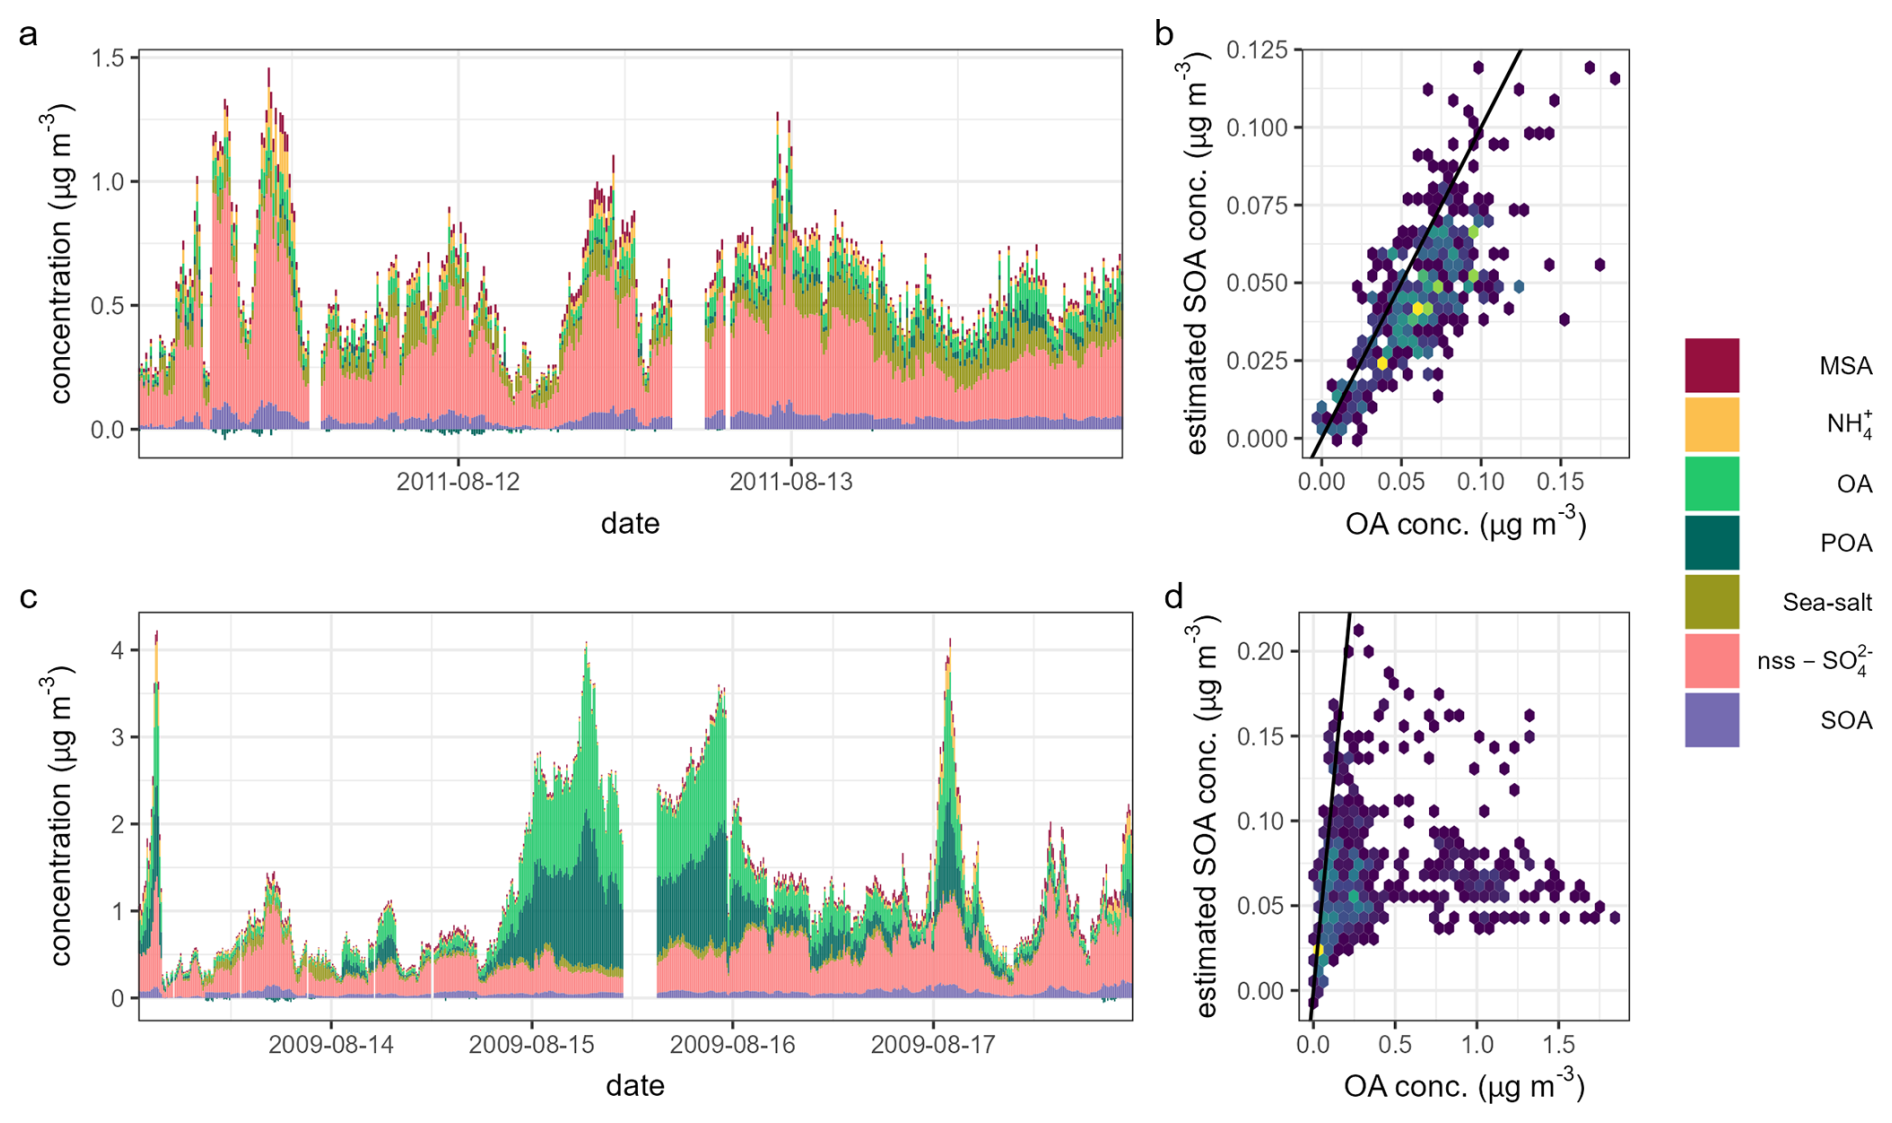
Figure 5Case study of (a–b) the SOA production period and (c–d) the POA production period. (a, c) Time series of PM1 chemical species and (b, d) measured OA versus estimated SOA. The colours represent data density, with darker colours indicating lower data density, and the black lines represent 1:1 lines.
3.2 Case study and long-term seasonality
The evaluation of the model's performance has shown a clear relationship between SOA and the predictor variables in the chosen SOA production period. Assuming there is little and constant contribution from POAbg, the estimated SOA concentration should be similar to the measured OA. We then evaluated the model's performance in well-defined cases over finer timescales. During a typical SOA production period from 11 to 14 August 2011 (Fig. 4a), which was not included in the training dataset because of the slightly elevated sea salt above the threshold of 0.03 µg m−3, the measured OA closely followed the variation in nss-SO4 and MSA, with Pearson's R values of over 0.80 and 0.84, respectively. These high correlations indicate a predominant secondary source of OA. The model's estimates of SOA concentrations were very close to the measured total OA (Fig. 4b), with an ratio of 1.03 ± 0.04. This further suggests that the ML model is able to predict the variability in SOA.
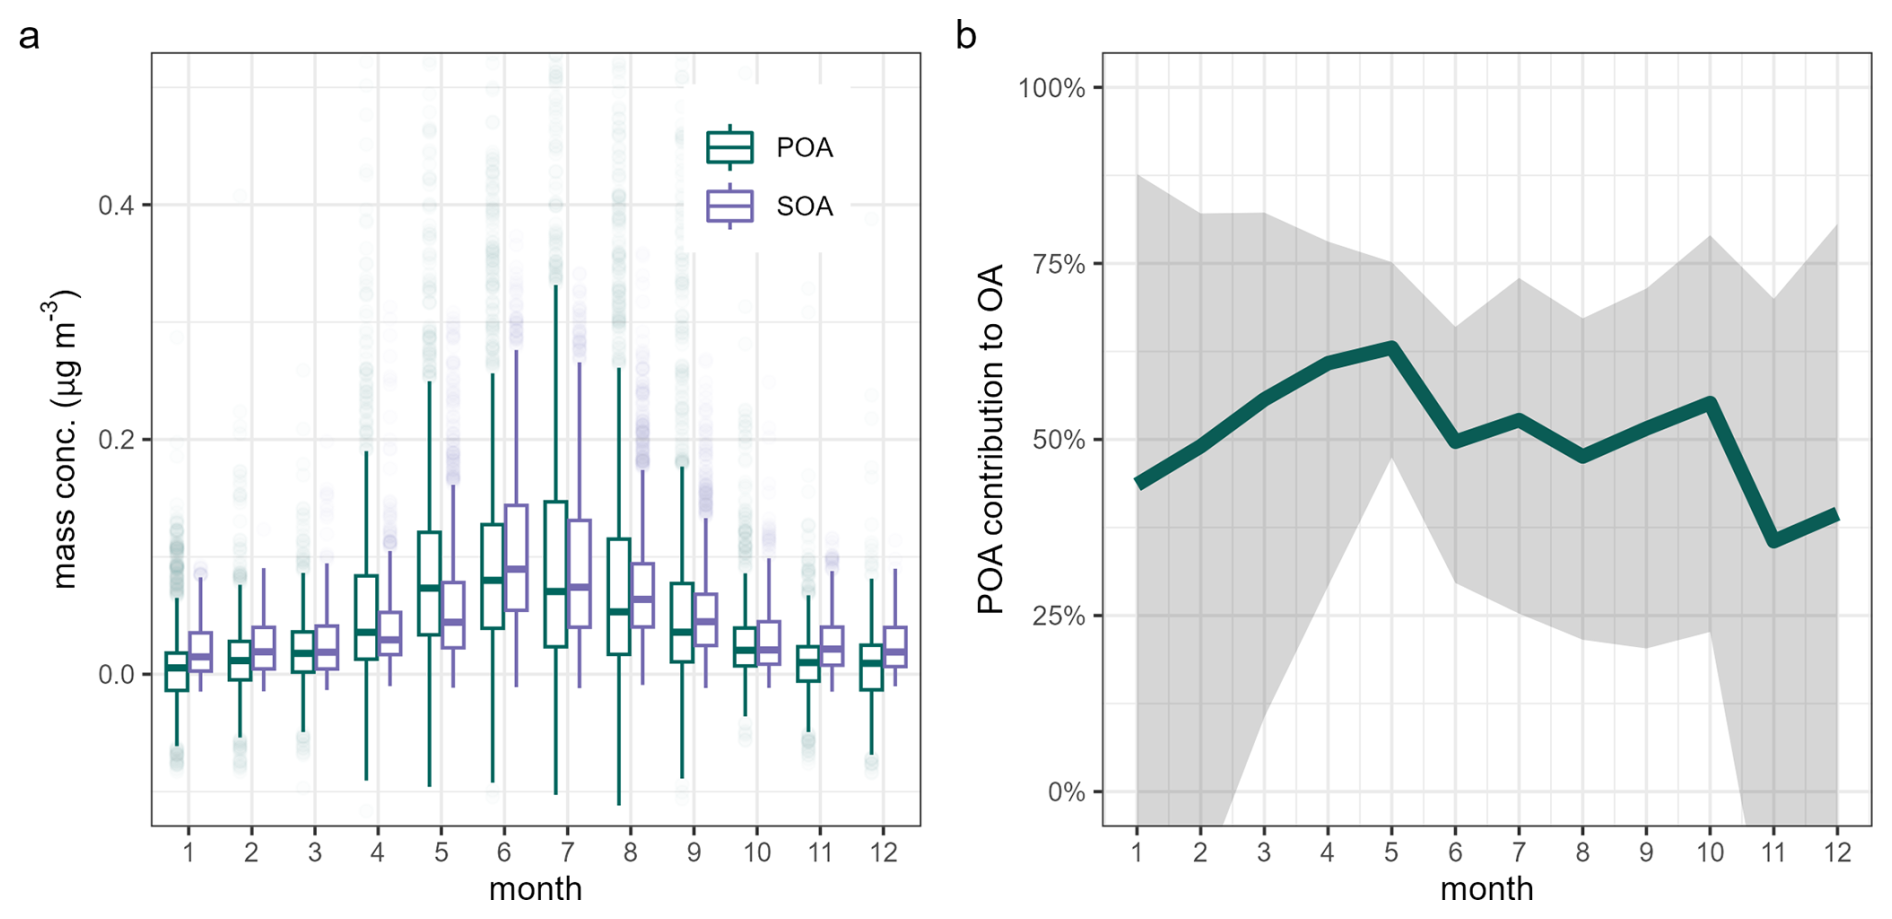
Figure 6The seasonality of POA and SOA. (a) Boxplot of the mass concentration of POA (dark green) and SOA (purple). The horizontal lines represent the median, the boxes represent the 25th and 75th quantiles, and the whiskers represent the 1.5 interquartile range. Note that outliers are not fully shown to ease visualization. (b) The contribution of POA to total OA. The line represents the monthly median, and the shaded area represents the 25th and 75th quantiles.
In contrast, during a well-documented marine POA plume, from 13 to 18 August 2009 (Fig. 5c), the OA dominated the PM1 concentration and showed little correlation with nss-SO4 or MSA (Pearson's R of 0.05 and 0.08, respectively). Notably, the estimated SOA deviates significantly from the observed OA (Fig. 5d). In this instance, the SOA estimated by the ML model accounted for only about 20 % of the total OA during the plume, underscoring the significant contribution of marine POA. The different performance, presented in Fig. 5, is expected. In Fig. 5a, the model is mostly influenced by the nss-SO4, a marker for secondary species, leading to a great agreement between modelled SOA and observed OA. Conversely, Fig. 5d shows a significant discrepancy between modelled SOA and observed OA. The difference is largely attributed to the contribution of POA. This case was reported by Ovadnevaite et al. (2011a), in which the marine POA was identified using HR-ToF-AMS mass spectra and the SOA during the period was not quantified.
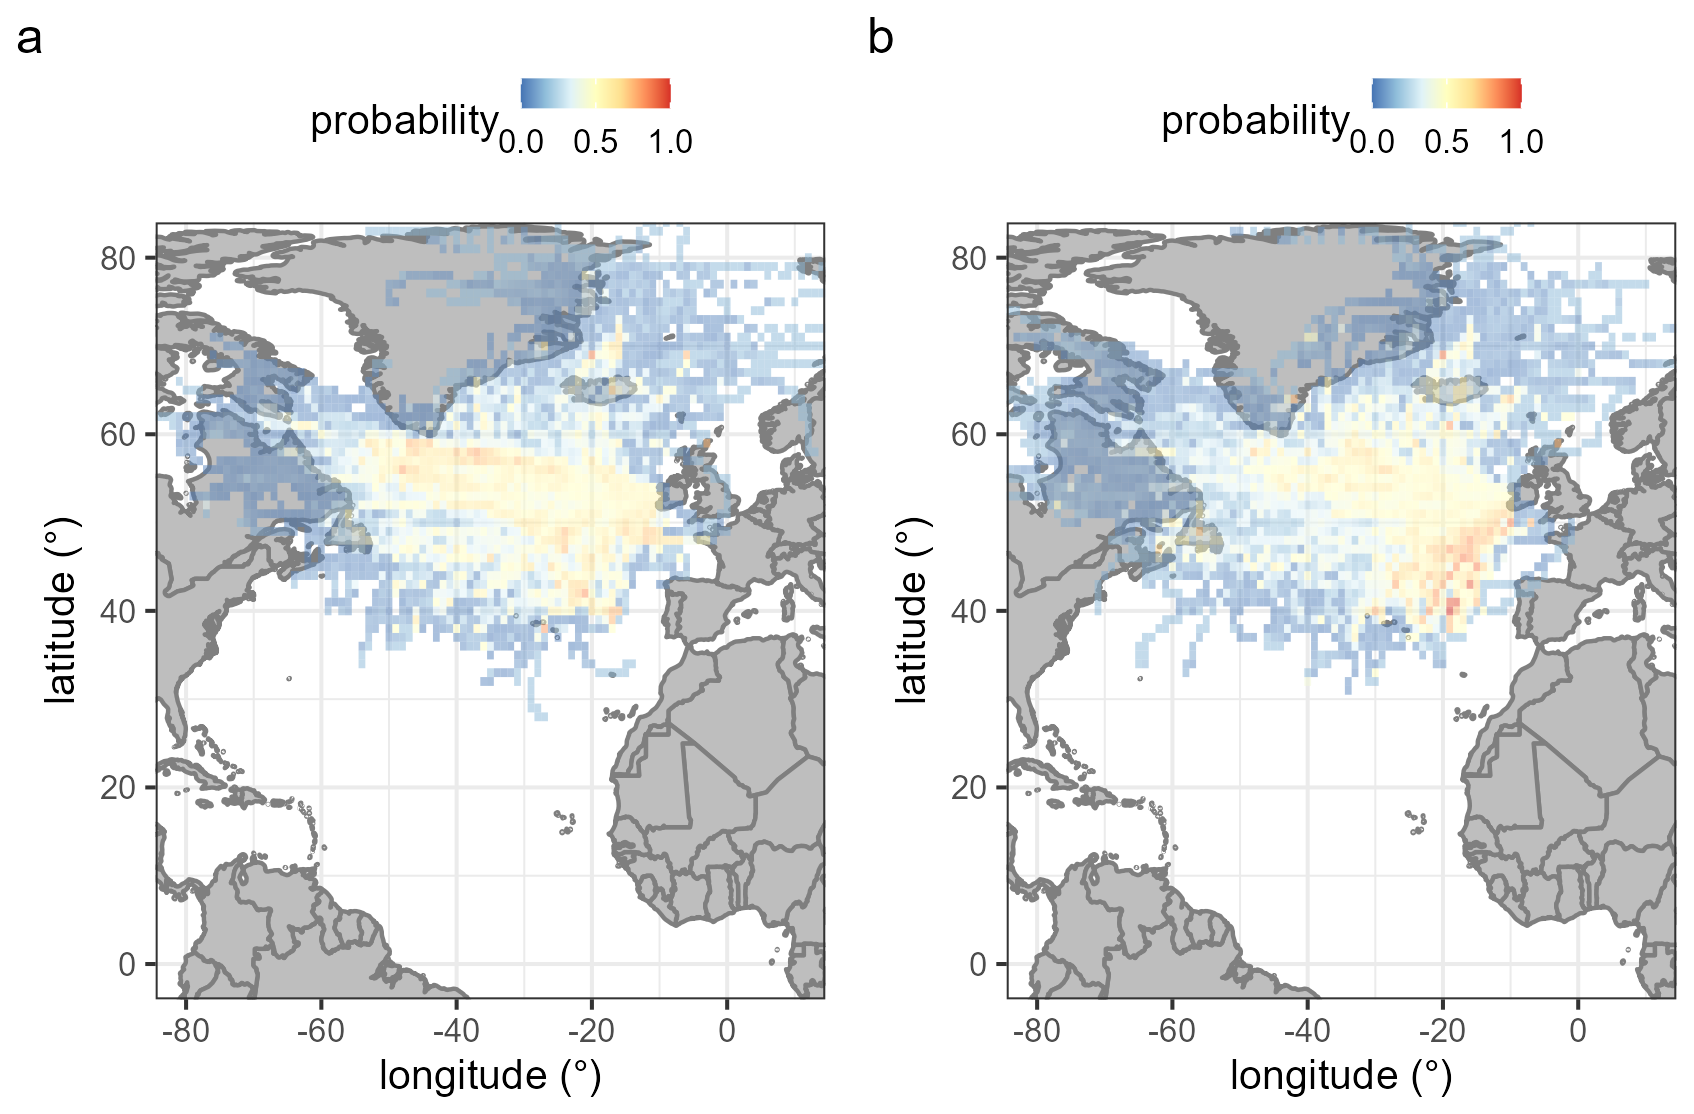
Figure 7The potential source contribution function analysis of marine POA (a) and SOA (b). The reddish colour represents higher probability.
The cases of SOA and POA production periods indicate the model's capability to predict the SOA and POA levels. As illustrated in Fig. 6, both POA and SOA reached their peak in June and dropped to their lowest during the winter months. Typically, median concentrations of SOA were higher than those of POA across most months, except for May. However, POA concentrations spiked periodically, highlighted by outliers. The mean relative contribution of POA to total OA, detailed in Fig. 6b, shows the lowest contribution in winter and the highest contribution from May to July, peaking at approximately 50 % and slightly later in summer than SOA. The pattern corresponds with the enhanced marine activities in late spring and early summer of the North Atlantic, involving extensive phytoplankton proliferation and other marine organisms that release organic matter into the atmosphere through wave breaking and bubble bursting.
It is important to note that the total marine OA concentrations during winter at Mace Head are very low, introducing substantial uncertainty in OA separation during this season. The minimal POA concentration observed in winter suggests a distinct relationship between total OA, secondary species, and environmental factors. This relationship closely mirrors the dynamics observed in SOA. As shown in Fig. S8, the estimated SOA closely aligns with measured OA throughout the winter, pointing to low contribution from POA. Conversely, during the summer, numerous data points shown in Fig. S8 deviate to the right of the 1:1 lines, indicating a substantial contribution from POA.
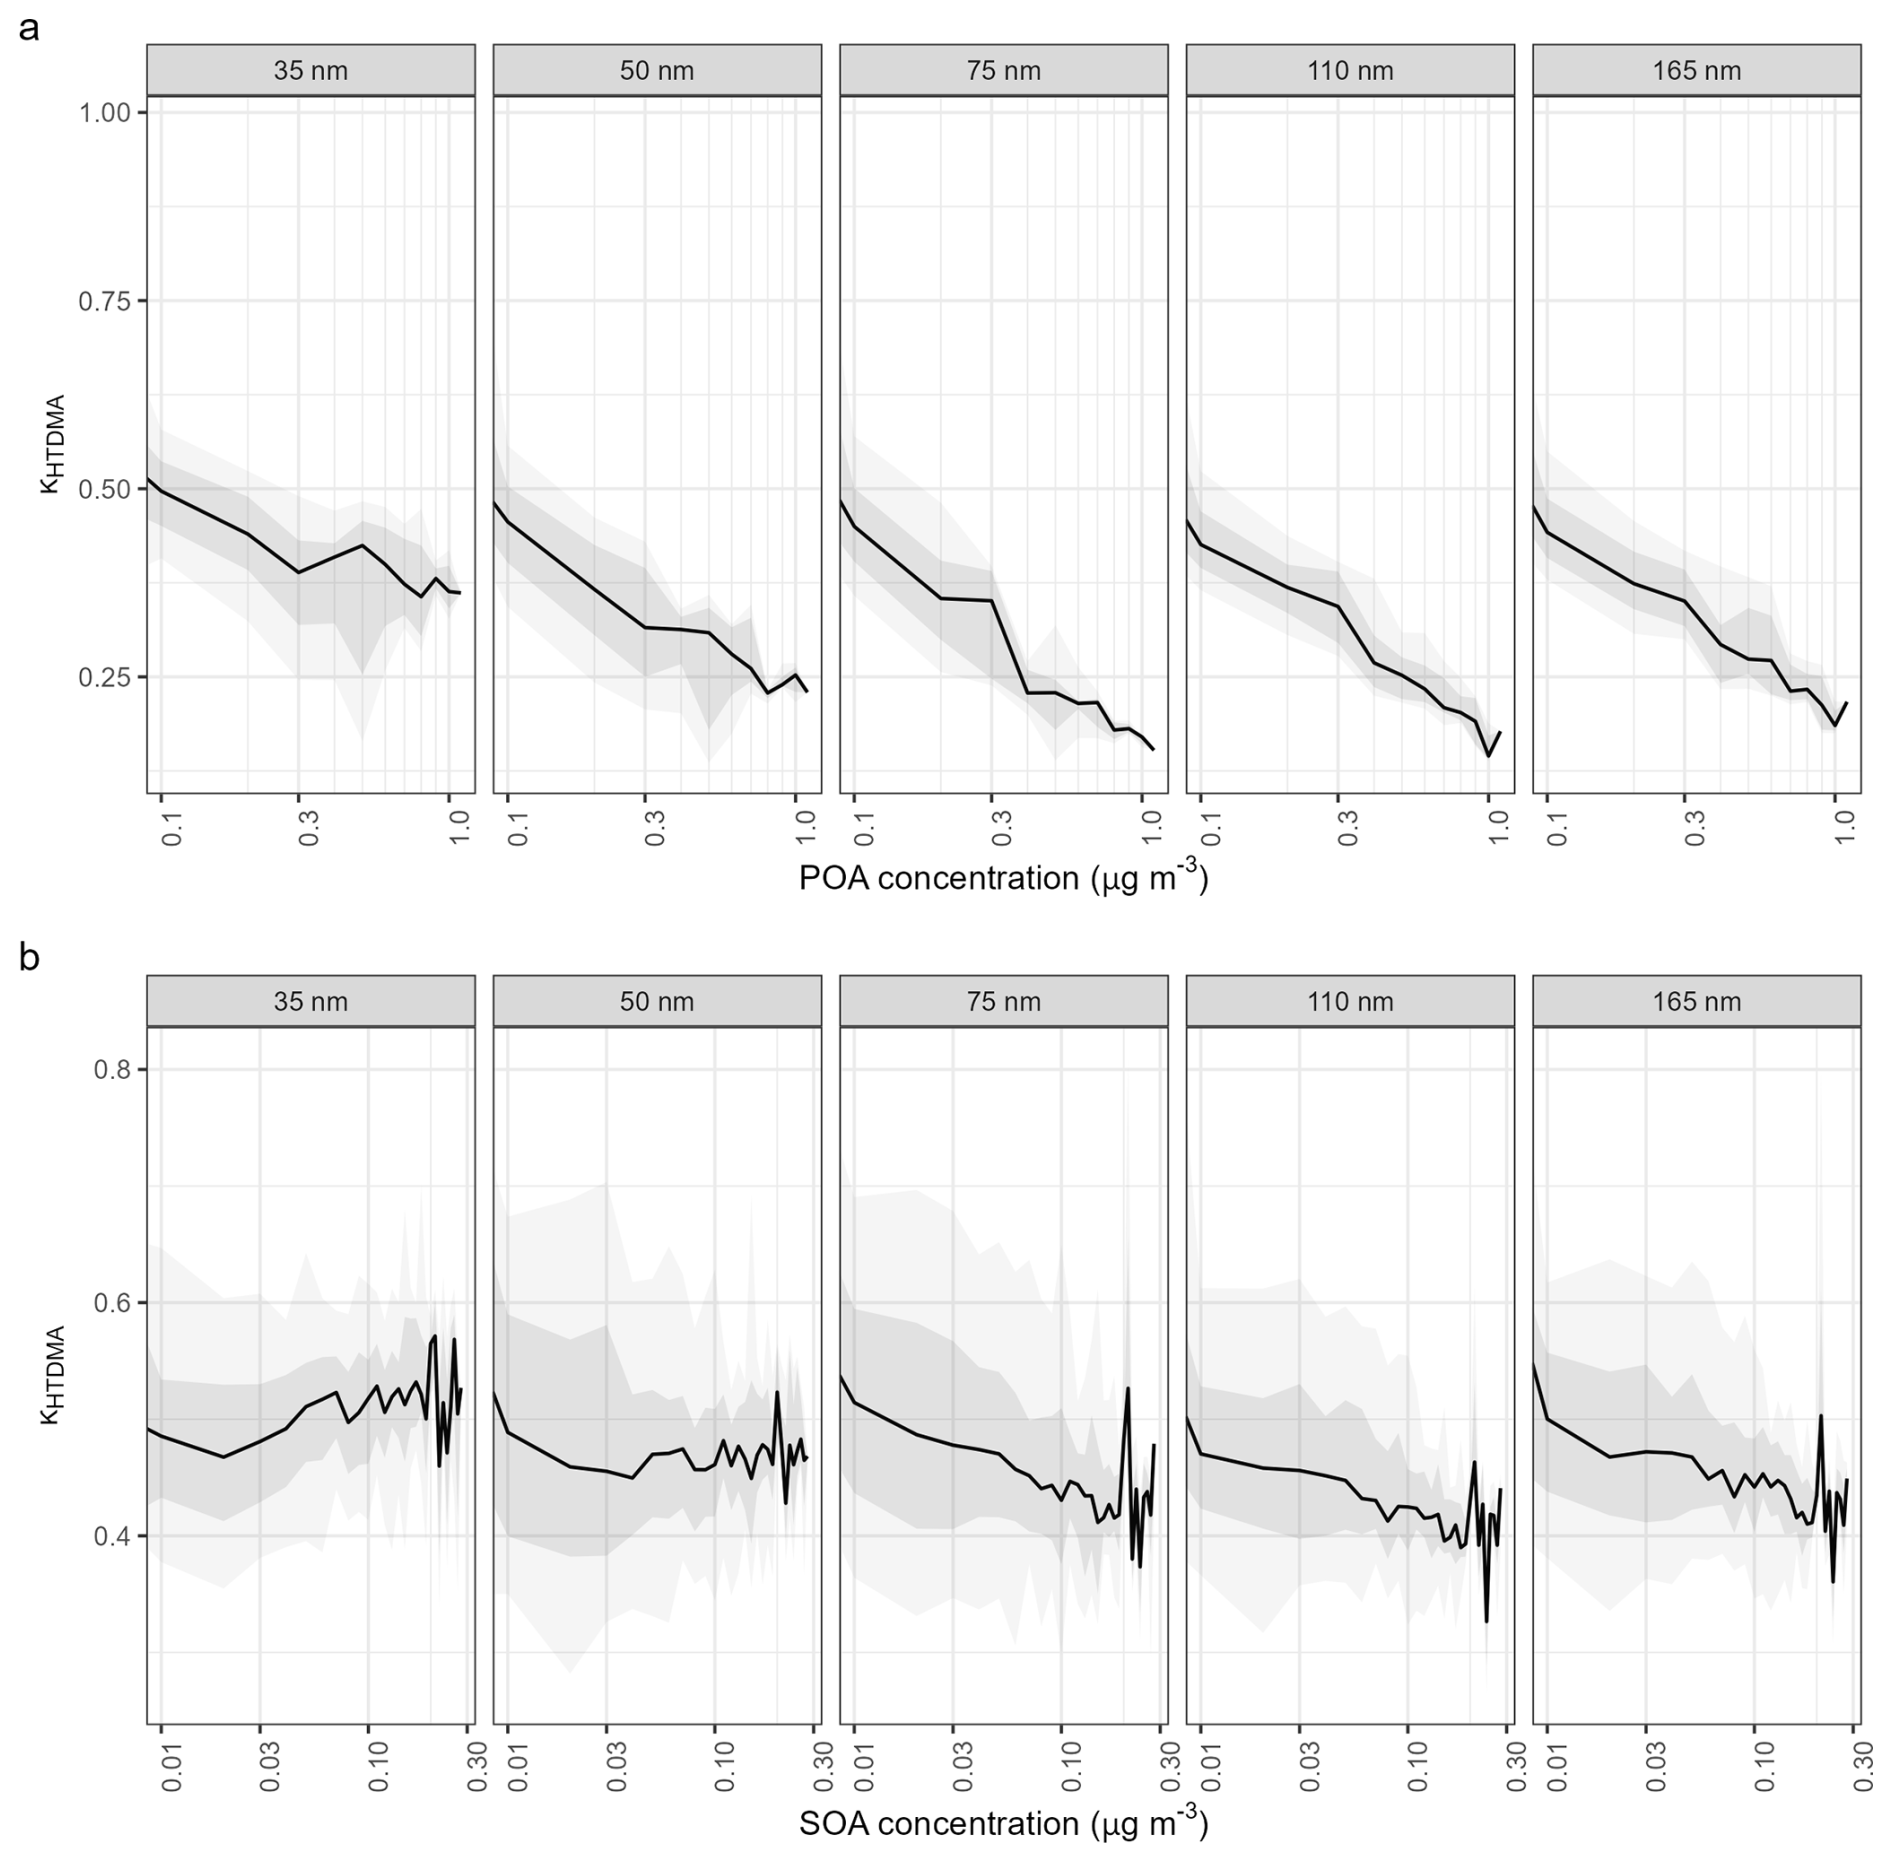
Figure 8The impact of POA (a) and SOA (b) on aerosol hygroscopicity parameter (κHTDMA) at different sizes. The analysis was limited to April to August to minimize the seasonal variations. The black lines represent medians, the dark shaded areas represent the 25th to 75th percentiles, and the darker shaded areas represent the 10th to 90th percentiles.
The differentiation of POA from SOA is further substantiated by additional correlation analysis. As shown in Fig. S9, the correlation between OA and nss-SO4 across the entire clean marine dataset is relatively low, at approximately 0.17, suggesting that nss-SO4 explains less than 3 % of the variability in marine OA. Upon decoupling the OA into POA and SOA, we observed distinct correlation patterns: the correlation between SOA and nss-SO4 increased to 0.88, reflecting a strong linkage, whereas, for POA, it decreased to 0.08. This stark contrast underscores the different sources and atmospheric behaviours of marine POA and SOA. This different correlation analysis provides a clear delineation of how POA and SOA contribute to marine OA and emphasizes the capacity of advanced modelling techniques and long-term observations to unravel complex atmospheric processes.
The potential sources of POA and SOA were investigated using the potential source contribution function (PSCF) combined with air mass backward trajectories (Mansour et al., 2020). As shown in Fig. 7, POA likely originates from the Northeast Atlantic polar marine regions (Fig. 7a), which are recognized as biologically active waters. In contrast, SOA sources are traced to tropical marine regions (Fig. 7b). The identified POA sources align with previous studies suggesting that regional marine biological activity is a key driver of POA production (O'Dowd et al., 2004; Sellegri et al., 2021). For SOA, enhanced photochemical reactions in lower-latitude waters likely promote the formation of secondary species. The distinct source regions of marine POA and SOA underscore the need for models to incorporate specific parameterization schemes that account for these spatial and mechanistic differences.
In contrast to prior studies that relied on filter-based measurements with limited temporal resolution, this study introduces an ML framework to systematically differentiate and quantify marine POA and SOA. While seasonal variations in POA/SOA have been reported previously, our decade-long dataset – the most extensive of its kind to date – provides unprecedented resolution to constrain and develop POA and SOA parameterization for climate models. Furthermore, the distinct source regions identified for POA (polar marine zones) and SOA (tropical waters) underscore their divergent formation mechanisms. Current model estimates of global emissions of POA span 6.9–76 Tg yr−1 for < 1 µm emissions, and the global source of SOA was thought to be substantially smaller than marine POA. Our measurements found similar contributions of POA and SOA, while it has to be noted that some fraction of SOA was transformed via atmospheric ageing from POA, which is difficult to quantify. A recent study found the photochemical reactions in the sea–air interface produced substantial VOC as the precursors of marine SOA (Brüggemann et al., 2018); the complex sources of SOA highlight the need for field observational data to challenge the models. The combined sensitivity to marine biological activities and photochemistry of marine OA was also supported by Sanchez et al. (2021), who found high correlation with downward shortwave flux and net primary production, although they did not separate POA and SOA.
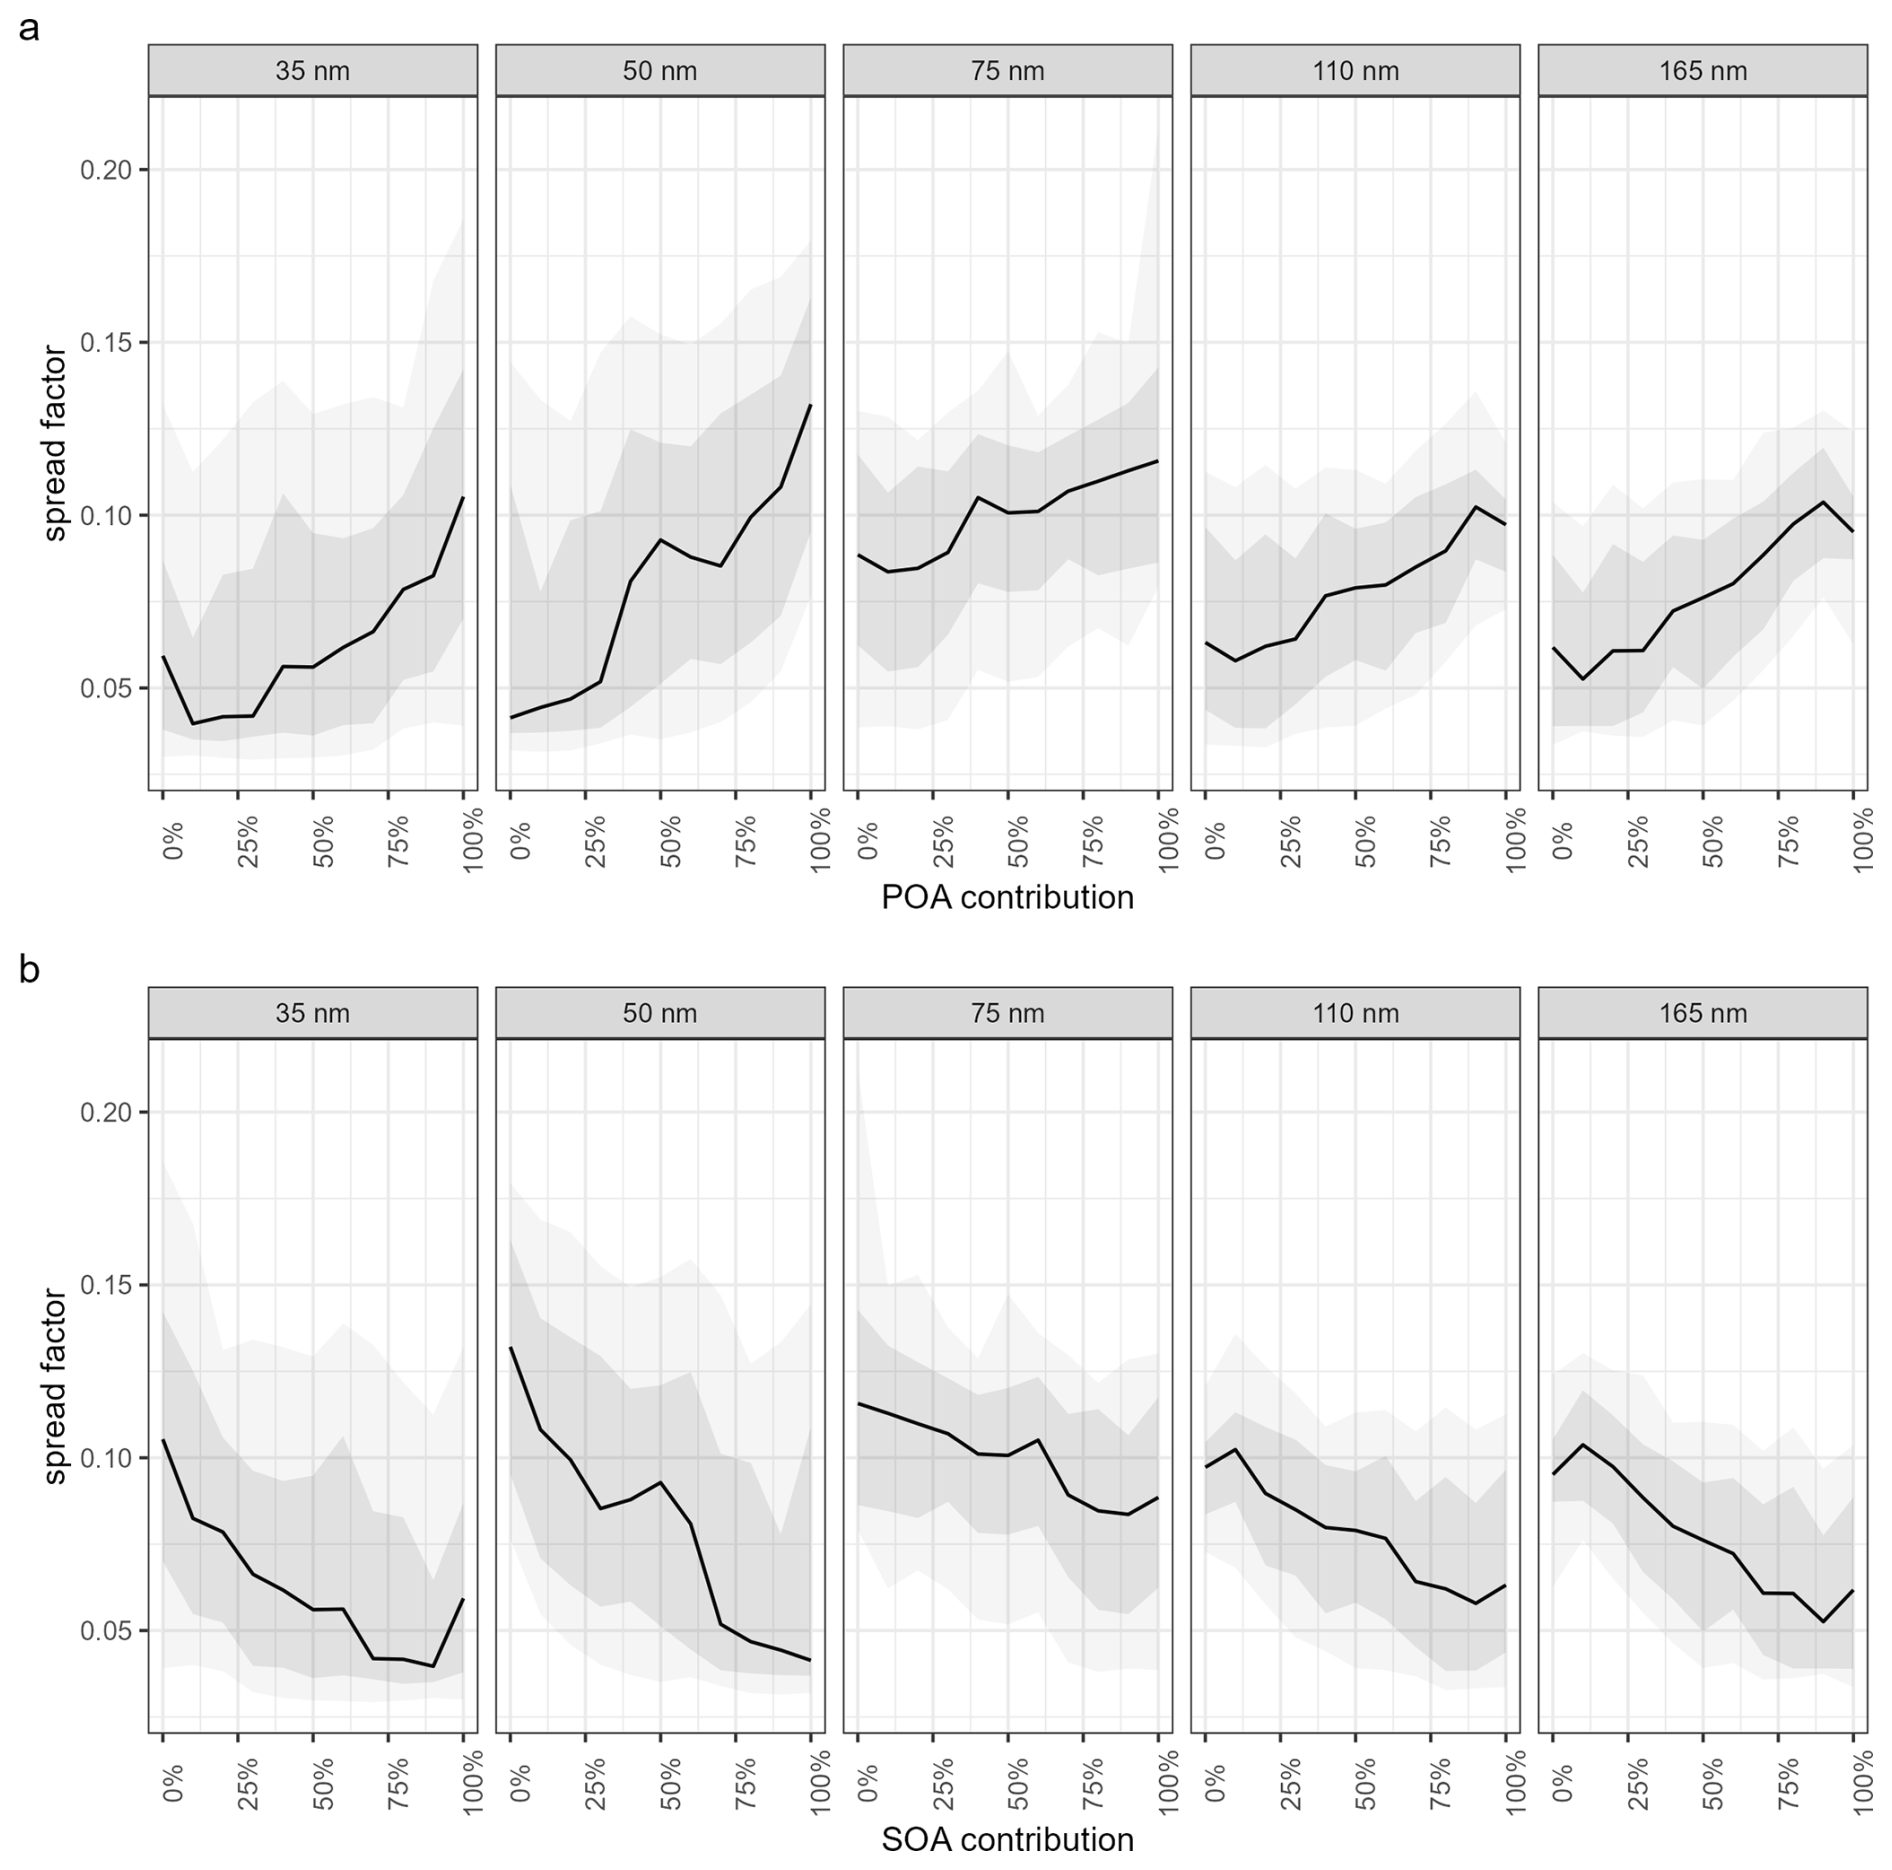
Figure 9The impact of percentage contribution of POA (a) and SOA (b) to aerosol mixing state (spread factor) at different sizes. The analysis was limited to April to August to minimize the seasonal variations. The black lines represent medians, the dark shaded areas represent the 25th to 75th percentiles, and the darker shaded areas represent the 10th to 90th percentiles.
3.3 Impact of marine organic aerosol on aerosol hygroscopicity and mixing state
The long-term marine POA and SOA time series now enable an assessment of their influence on aerosol hygroscopicity – a relationship which was previously uncertain. As shown in Fig. 8a, increasing POA concentrations from 0.1 to 1 µg m−3 reduces the hygroscopicity parameter (κ) across all particle sizes, dropping values from ∼ 0.5 to below 0.25. This finding contrasts with earlier experimental work suggesting POA production has negligible effects on aerosol hygroscopicity and CCN activity (Quinn et al., 2014) but aligns with our prior case study highlighting the inherently low hygroscopicity of POA (Ovadnevaite et al., 2011b). Quinn et al. (2014) investigated the impact of marine POA on its cloud condensation nuclei using a sea sweep device; they found no significant difference in POA contribution at different oceanic regions with diverse ranges of chlorophyll a, and they attributed the POA to the ocean carbon pool. However, based on our field measurements, it is unlikely that the ocean carbon pool induces such large variations in the observed POA, underscoring the importance of oceanic biological activities.
As for the SOA, the increasing SOA concentrations from 0.1 to 0.3 µg m−3 only slightly reduce κHTDMA values (from 0.5 to 0.45) for particles between 50 and 165 nm, with no significant change observed for 35 nm particles. This muted response may arise from co-varying increases in secondary species, such as nss-SO or MSA, which help maintain hygroscopicity at relatively high levels. This is consistent with our recent high-temporal-resolution online measurement, which shows a simultaneous increase in SOA and nss-SO during particle growth (Xu et al., 2024; Zheng et al., 2020). These results underscore the distinct roles of POA and SOA in modulating aerosol water uptake and cloud-forming potential, emphasizing the need to explicitly represent OA composition and sources in climate models.
The influence of POA and SOA on the aerosol mixing state was further investigated using the spread factor, calculated from growth factor probability density functions (Xu et al., 2020b). A spread factor of 0 indicates a theoretically internal mixture, while higher values reflect increasing external mixing. Based on established thresholds (Swietlicki et al., 2008; Xu et al., 2020a), a spread factor of ≤ 0.05 is classified as an internal mixture, whereas values ≥ 0.2 signify external mixing. POA and SOA exhibit divergent impacts on the aerosol mixing state. As shown in Fig. 9a, increasing the POA contribution from 0 % to 100 % elevates the spread factor, suggesting POA production promotes external mixing. Conversely, SOA accumulation drives the system toward a more internally mixed state. This aligns with aerosol ageing processes, where particles tend to homogenize over time. Accurately representing the hygroscopicity and mixing-state dynamics of POA and SOA is critical for assessing their climatic impacts, as these properties directly influence aerosol–cloud interactions and radiative forcing.
The quantification of marine POA and SOA traditionally relies on PMF applied to aerosol mass spectra, which is challenging for long-term data. This study presents a data-driven ML framework to identify and quantify marine POA by leveraging temporal data patterns rather than chemical mass signatures. The ML model, trained on rigorously selected SOA-dominated periods, was applied to a multi-year aerosol dataset, enabling the identification of numerous POA production events. At Mace Head, marine POA constitutes ∼ 50 % of total marine organic aerosol (OA), increasing to 63 % during late spring and early summer. Unlike PMF, this ML approach proves particularly effective for disentangling OA components in complex, long-term environments where high-resolution AMS data are unavailable.
Combined with aerosol hygroscopicity measurements, our analysis reveals distinct climatic impacts: marine POA significantly reduces aerosol hygroscopicity and promotes external mixing, whereas SOA exhibits weaker effects. These findings underscore the need to accurately quantify marine POA abundance and its influence on cloud-relevant properties. A key limitation lies in the selection of SOA-dominated periods for model training; future work should optimize ML performance for smaller or less curated datasets. Additionally, validating these marine POA results with global oceanic measurements is essential to refine POA parameterizations in climate and chemical transport models.
The code is available upon request to the corresponding author (wxu@iue.ac.cn) and Jurgita Ovadnevaite (jurgita.ovadneviate@universityofgalway.ie).
The AMS datasets used and/or analysed during the current study are available on reasonable request from the corresponding author, Jurgita Ovadnevaite (jurgita.ovadneviate@universityofgalway.ie). The aerosol hygroscopicity dataset is available via Mendeley Data (https://doi.org/10.17632/3dx6pnx869.1, Xu et al., 2021). ERA5 data are available from the CDS (https://cds.climate.copernicus.eu/#!/home, last access: 10 October 2025).
The supplement related to this article is available online at https://doi.org/10.5194/acp-25-14205-2025-supplement.
WX, LL, and JO conceived the study. WX, BC, LZ, EC, CL, LW, and HZ analysed the data and constructed the models. JO and DC conducted the AMS and BC measurements. WX, RH, and CO wrote the paper with input from all the other authors.
The contact author has declared that none of the authors has any competing interests.
Publisher’s note: Copernicus Publications remains neutral with regard to jurisdictional claims made in the text, published maps, institutional affiliations, or any other geographical representation in this paper. While Copernicus Publications makes every effort to include appropriate place names, the final responsibility lies with the authors. Views expressed in the text are those of the authors and do not necessarily reflect the views of the publisher.
This work is supported by the National Natural Science Foundation of China (grant nos. 42577115 and 42525301); the Natural Science Foundation of Fujian Province of China (grant no. 2025J01261); the Fund of Key Laboratory of Marine Ecological Conservation and Restoration, Ministry of Natural Resources/ Fujian Provincial Key Laboratory of Marine Ecological Conservation and Restoration (EPR2025009); the State Environmental Protection Key Laboratory of Formation and Prevention of Urban Air Pollution Complex (grant no. 2025080172); the National Key Research and Development Program of China (grant no. 2023YFC3705503); the Chinese Academy of Sciences (grant no. ZDBS-LY-DQC001); the Cross Innovative Team fund from the State Key Laboratory of Loess and Quaternary Geology (grant no. SKLLQGTD1801); the New Cornerstone Science Foundation through the XPLORER PRIZE; the Guiding Project of Seizing the Commanding Heights of City Self-Purifying Technology (grant no. IUE-CERAE-202403); and Taighde Éireann – Research Ireland under grant no. 22/FFP-A/10611, the EPA-Ireland, and the Department of Climate, Energy and the Environment.
This research has been supported by the National Key Research and Development Program of China (grant no. 2023YFC3705503) and the National Outstanding Youth Science Fund Project of the National Natural Science Foundation of China (grant no. 42307591).
This paper was edited by Benjamin A. Nault and reviewed by two anonymous referees.
Awad, M., Khanna, R., Awad, M., and Khanna, R.: Support vector regression, Efficient learning machines: Theories, concepts, and applications for engineers and system designers, Efficient Learning Machines, 67–80, https://doi.org/10.1007/978-1-4302-5990-9_4, 2015.
Barger, W. and Garrett, W.: Surface active organic material in the marine atmosphere, Journal of Geophysical Research, 75, 4561–4566, https://doi.org/10.1029/JC075i024p04561, 1970.
Bates, T. S., Calhoun, J. A., and Quinn, P. K.: Variations in the methanesulfonate to sulfate molar ratio in submicrometer marine aerosol particles over the south pacific ocean, Journal of Geophysical Research: Atmospheres, 97, 9859–9865, https://doi.org/10.1029/92JD00411, 1992.
Bates, T. S., Quinn, P. K., Coffman, D. J., Johnson, J. E., Upchurch, L., Saliba, G., Lewis, S., Graff, J., Russell, L. M., and Behrenfeld, M. J.: Variability in Marine Plankton Ecosystems are not Observed in Freshly Emitted Sea Spray Aerosol over the North Atlantic Ocean, Geophysical Research Letters, https://doi.org/10.1029/2019gl085938, 2020.
Bezdek, J. C., Ehrlich, R., and Full, W.: FCM: The fuzzy c-means clustering algorithm, Computers & Geosciences, 10, 191–203, https://doi.org/10.1016/0098-3004(84)90020-7, 1984.
Blanchard, D. C.: Sea-to-air transport of surface active material, Science, 146, 396–397, 1964.
Blanchard, D. C. and Woodcock, A.: Bubble formation and modification in the sea and its meteorological significance, Tellus, 9, 145–158, https://doi.org/10.3402/tellusa.v9i2.9094 ,1957.
Bonsang, B., Kanakidou, M., Lambert, G., and Monfray, P.: The marine source of C2–C6 aliphatic hydrocarbons, Journal of Atmospheric Chemistry, 6, 3–20, https://doi.org/10.1007/BF00048328, 1988.
Breiman, L.: Random Forests, Machine Learning, 45, 5–32, https://doi.org/10.1023/a:1010933404324, 2001.
Brüggemann, M., Hayeck, N., and George, C.: Interfacial photochemistry at the ocean surface is a global source of organic vapors and aerosols, Nature Communications, 9, 2101, https://doi.org/10.1038/s41467-018-04528-7, 2018.
Cavalli, F., Facchini, M., Decesari, S., Mircea, M., Emblico, L., Fuzzi,S., Ceburnis, D., Yoon, Y., O'Dowd, C., Putaud, J.-P., and Dell'Acqua, A.: Advancesin characterization of size-resolved organic matter in marine aerosolover the north atlantic, Journal of Geophysical Research: Atmospheres, 109, https://doi.org/10.1029/2004JD005137, 2004.
Charlson, R. J., Lovelock, J. E., Andreae, M. O., and Warren, S. G.: Oceanic phytoplankton, atmospheric sulphur, cloud albedo and climate, Nature, 326, 655–661, https://doi.org/10.1038/326655a0, 1987.
Chevassus, E., Fossum, K. N., Ceburnis, D., Lei, L., Lin, C., Xu, W., O'Dowd, C., and Ovadnevaite, J.: Marine organic aerosol at Mace Head: effects from phytoplankton and source region variability, Atmos. Chem. Phys., 25, 4107–4129, https://doi.org/10.5194/acp-25-4107-2025, 2025.
Choi, Y., Rhee, T. S., Collett, J. L., Park, T., Park, S.-M., Seo, B.-K., Park, G., Park, K., and Lee, T.: Aerosol concentrations and composition in the North Pacific marine boundary layer, Atmospheric Environment, 171, 165–172, https://doi.org/10.1016/j.atmosenv.2017.09.047, 2017.
Ciuraru, R., Fine, L., Pinxteren, M. van, D'Anna, B., Herrmann, H., and George, C.: Photosensitized production of functionalized and unsaturated organic compounds at the air-sea interface, Scientific Reports, 5, 12741, https://doi.org/10.1038/srep12741, 2015.
DeCarlo, P. F., Slowik, J. G., Worsnop, D. R., Davidovits, P., and Jimenez, J. L.: Particle Morphology and Density Characterization by Combined Mobility and Aerodynamic Diameter Measurements. Part 1: Theory, Aerosol Science and Technology, 38, 1185–1205, https://doi.org/10.1080/027868290903907, 2004.
DeCarlo, P. F., Kimmel, J. R., Trimborn, A., Northway, M. J., Jayne, J. T., Aiken, A. C., Gonin, M., Fuhrer, K., Horvath, T., Docherty, K. S., Worsnop, D. R., and Jimenez, J. L.: Field-Deployable, High-Resolution, Time-of-Flight Aerosol Mass Spectrometer, Analytical Chemistry, 78, 8281–8289, https://doi.org/10.1021/ac061249n, 2006.
Facchini, M. C., Decesari, S., Rinaldi, M., Carbone, C., Finessi, E., Mircea, M., Fuzzi, S., Moretti, F., Tagliavini, E., Ceburnis, D., and O'Dowd, C. D.: Important Source of Marine Secondary Organic Aerosol from Biogenic Amines, Environmental Science & Technology, 42, 9116–9121, https://doi.org/10.1021/es8018385, 2008.
Fitzgerald, J. W.: Marine aerosols: A review, Atmospheric Environment. Part A. General Topics, 25, 533–545, 1991.
Gantt, B. and Meskhidze, N.: The physical and chemical characteristics of marine primary organic aerosol: a review, Atmos. Chem. Phys., 13, 3979–3996, https://doi.org/10.5194/acp-13-3979-2013, 2013.
Gantt, B., Meskhidze, N., Facchini, M. C., Rinaldi, M., Ceburnis, D., and O'Dowd, C. D.: Wind speed dependent size-resolved parameterization for the organic mass fraction of sea spray aerosol, Atmos. Chem. Phys., 11, 8777–8790, https://doi.org/10.5194/acp-11-8777-2011, 2011.
Gantt, B., Johnson, M. S., Meskhidze, N., Sciare, J., Ovadnevaite, J., Ceburnis, D., and O'Dowd, C. D.: Model evaluation of marine primary organic aerosol emission schemes, Atmos. Chem. Phys., 12, 8553–8566, https://doi.org/10.5194/acp-12-8553-2012, 2012.
Gantt, B., Johnson, M. S., Crippa, M., Prévôt, A. S. H., and Meskhidze, N.: Implementing marine organic aerosols into the GEOS-Chem model, Geosci. Model Dev., 8, 619–629, https://doi.org/10.5194/gmd-8-619-2015, 2015.
Ghimire, S., Bhandari, B., Casillas-Pérez, D., Deo, R. C., and Salcedo-Sanz, S.: Hybrid deep CNN-SVR algorithm for solar radiation prediction problems in Queensland, Australia, Engineering Applications of Artificial Intelligence, 112, 104860, https://doi.org/10.1016/j.engappai.2022.104860, 2022.
Gysel, M., McFiggans, G., and Coe, H.: Inversion of tandem differential mobility analyser (TDMA) measurements, Journal of Aerosol Science, 40, 134–151, https://doi.org/10.1016/j.jaerosci.2008.07.013, 2009.
Hersbach, H., Bell, B., Berrisford, P., Hirahara, S., Horányi, A., Muñoz-Sabater, J., Nicolas, J., Peubey, C., Radu, R., Schepers, D., Simmons, A., Soci, C., Abdalla, S., Abellan, X., Balsamo, G., Bechtold, P., Biavati, G., Bidlot, J., Bonavita, M., De Chiara, G., Dahlgren, P., Dee, D., Diamantakis, M., Dragani, R., Flemming, J., Forbes, R., Fuentes, M., Geer, A., Haimberger, L., Healy, S., Hogan, R. J., Hólm, E., Janisková, M., Keeley, S., Laloyaux, P., Lopez, P., Lupu, C., Radnoti, G., Rosnay, P. de, Rozum, I., Vamborg, F., Villaume, S., and Thépaut, J.-N.: The ERA5 global reanalysis, Quarterly Journal of the Royal Meteorological Society, 146, 1999–2049, https://doi.org/10.1002/qj.3803, 2020.
Huang, S., Wu, Z., Poulain, L., van Pinxteren, M., Merkel, M., Assmann, D., Herrmann, H., and Wiedensohler, A.: Source apportionment of the organic aerosol over the Atlantic Ocean from 53° N to 53° S: significant contributions from marine emissions and long-range transport, Atmos. Chem. Phys., 18, 18043–18062, https://doi.org/10.5194/acp-18-18043-2018, 2018.
Juang, C.-F. and Hsieh, C.-D.: TS-fuzzy system-based support vector regression, Fuzzy Sets and Systems, 160, 2486–2504, https://doi.org/10.1016/j.fss.2008.11.022, 2009.
Ma, J., Theiler, J., and Perkins, S.: Accurate On-line Support Vector Regression, Neural Computation, 15, 2683–2703, https://doi.org/10.1162/089976603322385117, 2003.
Mansour, K., Decesari, S., Facchini, M. C., Belosi, F., Paglione, M., Sandrini, S., Bellacicco, M., Marullo, S., Santoleri, R., Ovadnevaite, J., Ceburnis, D., O'Dowd, C., Roberts, G., Sanchez, K., and Rinaldi, M.: Linking Marine Biological Activity to Aerosol Chemical Composition and Cloud-Relevant Properties Over the North Atlantic Ocean, Journal of Geophysical Research: Atmospheres, 125, https://doi.org/10.1029/2019jd032246, 2020.
Meskhidze, N. and Nenes, A.: Phytoplankton and Cloudiness in the Southern Ocean, Science, 314, 1419–1423, https://doi.org/10.1126/science.1131779, 2006.
Mungall, E. L., Abbatt, J. P. D., Wentzell, J. J. B., Lee, A. K. Y., Thomas, J. L., Blais, M., Gosselin, M., Miller, L. A., Papakyriakou, T., Willis, M. D., and Liggio, J.: Microlayer source of oxygenated volatile organic compounds in the summertime marine Arctic boundary layer, Proceedings of the National Academy of Sciences, 114, 6203–6208, https://doi.org/10.1073/pnas.1620571114, 2017.
O'Dowd, C. and de Leeuw, G.: Marine aerosol production: a review of the current knowledge, Philosophical Transactions of the Royal Society A: Mathematical, Physical and Engineering Sciences, 365, 1753–1774, https://doi.org/10.1098/rsta.2007.2043, 2007.
O'Dowd, C., Facchini, M. C., Cavalli, F., Ceburnis, D., Mircea, M., Decesari, S., Fuzzi, S., Yoon, Y. J., and Putaud, J.-P.: Biogenically driven organic contribution to marine aerosol, Nature, 431, 676–680, https://doi.org/10.1038/nature02959, 2004.
O'Dowd, C., Ceburnis, D., Ovadnevaite, J., Vaishya, A., Rinaldi, M., and Facchini, M. C.: Do anthropogenic, continental or coastal aerosol sources impact on a marine aerosol signature at Mace Head?, Atmos. Chem. Phys., 14, 10687–10704, https://doi.org/10.5194/acp-14-10687-2014, 2014.
O'Dowd, C. D., Langmann, B., Varghese, S., Scannell, C., Ceburnis, D., and Facchini, M. C.: A combined organic-inorganic sea-spray source function, Geophysical Research Letters, 35, https://doi.org/10.1029/2007gl030331, 2008.
O'Dowd, C. D., Ceburnis, D., Ovadnevaite, J., Bialek, J., Stengel, D. B., Zacharias, M., Nitschke, U., Connan, S., Rinaldi, M., Fuzzi, S., Decesari, S., Facchini, M. C., Marullo, S., Santoleri, R., Dell'Anno, A., Corinaldesi, C., Tangherlini, M., and Danovaro, R.: Connecting marine productivity to sea-spray via nanoscale biological processes: Phytoplankton Dance or Death Disco?, Scientific Reports, 5, https://doi.org/10.1038/srep14883, 2015.
Ovadnevaite, J., O'Dowd, C., Dall'Osto, M., Ceburnis, D., Worsnop, D. R., and Berresheim, H.: Detecting high contributions of primary organic matter to marine aerosol: A case study, Geophysical Research Letters, 38, L02807, https://doi.org/10.1029/2010gl046083, 2011a.
Ovadnevaite, J., Ceburnis, D., Martucci, G., Bialek, J., Monahan, C., Rinaldi, M., Facchini, M. C., Berresheim, H., Worsnop, D. R., and O'Dowd, C.: Primary marine organic aerosol: A dichotomy of low hygroscopicity and high CCN activity, Geophysical Research Letters, 38, L21806, https://doi.org/10.1029/2011GL048869, 2011b.
Ovadnevaite, J., Ceburnis, D., Canagaratna, M., Berresheim, H., Bialek, J., Martucci, G., Worsnop, D. R., and O'Dowd, C.: On the effect of wind speed on submicron sea salt mass concentrations and source fluxes, Journal of Geophysical Research: Atmospheres, 117, D16201, https://doi.org/10.1029/2011JD017379, 2012.
Ovadnevaite, J., Ceburnis, D., Leinert, S., Dall'Osto, M., Canagaratna, M., O'Doherty, S., Berresheim, H., and O'Dowd, C.: Submicron NE Atlantic marine aerosol chemical composition and abundance: Seasonal trends and air mass categorization, Journal of Geophysical Research: Atmospheres, 119, 850–11, 863, https://doi.org/10.1002/2013JD021330, 2014.
Petters, M. D. and Kreidenweis, S. M.: A single parameter representation of hygroscopic growth and cloud condensation nucleus activity, Atmos. Chem. Phys., 7, 1961–1971, https://doi.org/10.5194/acp-7-1961-2007, 2007.
Quinn, P. K., Bates, T. S., Schulz, K. S., Coffman, D. J., Frossard, A. A., Russell, L. M., Keene, W. C., and Kieber, D. J.: Contribution of sea surface carbon pool to organic matter enrichment in sea spray aerosol, Nature Geoscience, 7, 228–232, https://doi.org/10.1038/ngeo2092, 2014.
Rinaldi, M., Fuzzi, S., Decesari, S., Marullo, S., Santoleri, R., Provenzale, A., von Hardenberg, J., Ceburnis, D., Vaishya, A., O'Dowd, C. D., and Facchini, M. C.: Is chlorophyll-a the best surrogate for organic matter enrichment in submicron primary marine aerosol?, Journal of Geophysical Research: Atmospheres, 118, 4964–4973, https://doi.org/10.1002/jgrd.50417, 2013.
Saliba, G., Chen, C., Lewis, S., Russell, L. M., Quinn, P. K., Bates, T. S., Bell, T. G., Lawler, M. J., Saltzman, E. S., Sanchez, K. J., Moore, R., Shook, M., Rivellini, L., Lee, A., Baetge, N., Carlson, C. A., and Behrenfeld, M. J.: Seasonal Differences and Variability of Concentrations, Chemical Composition, and Cloud Condensation Nuclei of Marine Aerosol over the North Atlantic, Journal of Geophysical Research: Atmospheres, https://doi.org/10.1029/2020jd033145, 2020.
Sanchez, K. J., Zhang, B., Liu, H., Saliba, G., Chen, C.-L., Lewis, S. L., Russell, L. M., Shook, M. A., Crosbie, E. C., Ziemba, L. D., Brown, M. D., Shingler, T. J., Robinson, C. E., Wiggins, E. B., Thornhill, K. L., Winstead, E. L., Jordan, C., Quinn, P. K., Bates, T. S., Porter, J., Bell, T. G., Saltzman, E. S., Behrenfeld, M. J., and Moore, R. H.: Linking marine phytoplankton emissions, meteorological processes, and downwind particle properties with FLEXPART, Atmos. Chem. Phys., 21, 831–851, https://doi.org/10.5194/acp-21-831-2021, 2021.
Schmale, J., Schneider, J., Nemitz, E., Tang, Y. S., Dragosits, U., Blackall, T. D., Trathan, P. N., Phillips, G. J., Sutton, M., and Braban, C. F.: Sub-Antarctic marine aerosol: dominant contributions from biogenic sources, Atmos. Chem. Phys., 13, 8669–8694, https://doi.org/10.5194/acp-13-8669-2013, 2013.
Sellegri, K., Nicosia, A., Freney, E., Uitz, J., Thyssen, M., Grégori, G., Engel, A., Zäncker, B., Haëntjens, N., Mas, S., Picard, D., Saint-Macary, A., Peltola, M., Rose, C., Trueblood, J., Lefevre, D., D'Anna, B., Desboeufs, K., Meskhidze, N., Guieu, C., and Law, C. S.: Surface ocean microbiota determine cloud precursors, Scientific Reports, 11, 281, https://doi.org/10.1038/s41598-020-78097-5, 2021.
Swietlicki, E., Zhou, J., Covert, D. S., Hameri, K., Busch, B., Vakeva, M., Dusek, U., Berg, O. H., Wiedensohler, A., Aalto, P. P., Makela, J., Martinsson, B. G., Papaspiropoulos, G., Mentes, B., Frank, G., and Stratmann, F.: Hygroscopic properties of aerosol particles in the north- eastern Atlantic during ACE-2, Tellus B: Chemical and Physical Meteorology, 52, 201–227, https://doi.org/10.1034/j.1600-0889.2000.00036.x, 2000.
Swietlicki, E., Hansson, H. C., Hämeri, K., Svenningsson, B., Maßling, A., McFiggans, G., McMurry, P. H., Petaja, T., Tunved, P., Gysel, M., Topping, D. O., Weingartner, E., Baltensperger, U., Rissler, J., Wiedensohler, A., and Kulmala, M.: Hygroscopic properties of submicrometer atmospheric aerosol particles measured with H-TDMA instruments in various environmentsa review, Tellus B: Chemical and Physical Meteorology, 60, 432–469, https://doi.org/10.1111/j.1600-0889.2008.00350.x, 2008.
Tang, D., Zhan, Y., and Yang, F.: A review of machine learning for modeling air quality: Overlooked but important issues, Atmospheric Research, 300, 107261, https://doi.org/10.1016/j.atmosres.2024.107261, 2024.
Willis, M. D., Köllner, F., Burkart, J., Bozem, H., Thomas, J. L., Schneider, J., Aliabadi, A. A., Hoor, P. M., Schulz, H., Herber, A. B., Leaitch, W. R., and Abbatt, J. P. D.: Evidence for marine biogenic influence on summertime Arctic aerosol, Geophysical Research Letters, 44, 6460–6470, https://doi.org/10.1002/2017gl073359, 2017.
Wohl, C., Li, Q., Cuevas, C. A., Fernandez, R. P., Yang, M., Saiz-Lopez, A., and Simó, R.: Marine biogenic emissions of benzene and toluene and their contribution to secondary organic aerosols over the polar oceans, Science Advances, 9, eadd9031, https://doi.org/10.1126/sciadv.add9031, 2023.
Xu, W., Ovadnevaite, J., Fossum, K. N., Lin, C., Huang, R.-J., O'Dowd, C., and Ceburnis, D.: Aerosol hygroscopicity and its link to chemical composition in the coastal atmosphere of Mace Head: marine and continental air masses, Atmos. Chem. Phys., 20, 3777–3791, https://doi.org/10.5194/acp-20-3777-2020, 2020a.
Xu, W., Ovadnevaite, J., Fossum, K. N., Lin, C., Huang, R.-J., O'Dowd, C., and Ceburnis, D.: Aerosol hygroscopicity and its link to chemical composition in the coastal atmosphere of Mace Head: marine and continental air masses, Atmos. Chem. Phys., 20, 3777–3791, https://doi.org/10.5194/acp-20-3777-2020, 2020b.
Xu, W., Fossum, K., Ceburnis, D., Ovadnevaite, J., and O'Dowd, C.: Cloud condensation nuclei and hygroscopic growth measurement at Mace Head from 2009 to 2010, Mendeley Data [data set], V1, https://doi.org/10.17632/3dx6pnx869.1, 2021.
Xu, W., Ovadnevaite, J., Fossum, K. N., Lin, C., Huang, R.-J., Ceburnis, D., and O'Dowd, C.: Sea spray as an obscured source for marine cloud nuclei, Nature Geoscience, 15, https://doi.org/10.1038/s41561-022-00917-2, 2022.
Xu, W., Ovadnevaite, J., Fossum, K. N., Huang, R.-J., Huang, D. D., Zhong, H., Gu, Y., Lin, C., Huang, C., O'Dowd, C., and Ceburnis, D.: Condensation of organic-inorganic vapours governs the production of ultrafine secondary marine cloud nuclei, Communications Earth & Environment, 5, 359, https://doi.org/10.1038/s43247-024-01519-z, 2024.
Zheng, G., Kuang, C., Uin, J., Watson, T., and Wang, J.: Large contribution of organics to condensational growth and formation of cloud condensation nuclei (CCN) in the remote marine boundary layer, Atmos. Chem. Phys., 20, 12515–12525, https://doi.org/10.5194/acp-20-12515-2020, 2020.