the Creative Commons Attribution 4.0 License.
the Creative Commons Attribution 4.0 License.
 | 27 Oct 2025
Meteorological influence on surface ozone trends in China: assessing uncertainties caused by multi-dataset and multi-method
Xueqing Wang
Guanjie Jiao
Zhenjiang Yang
Lei Chen
Xipeng Jin
Hong Liao
China has witnessed notable increases in surface ozone (O3) concentrations since 2013, with meteorology identified as a critical driver. However, meteorological contributions vary with different meteorological datasets and analytical methods, and their uncertainties remain unassessed. This study leveraged decadal observational maximum daily 8-hour average O3 records (2013–2022) across China, revealing intensified nationwide O3 pollution with increasing O3 trends of 0.79–1.31 ppb yr−1 during four seasons. We gave special focus on uncertainties of meteorology-driven O3 trends by using diverse meteorological datasets (ERA5, MERRA2, FNL) and diverse analytical methods (Multiple Linear Regression, Random Forest, GEOS-Chem model). A useful statistic (coefficient of variation, CV) was adopted as an uncertainty quantification metric. For multi-dataset analysis, models driven by different meteorological datasets exhibited the maximum meteorology-driven O3 trend (+0.55 ppb yr−1, multi-dataset mean) with the highest consistency (CV = 0.25) in spring. The FNL-driven model always obtained larger trends compared to ERA5 and MERRA2, which could be attributed to inability to accurately evaluate planetary boundary layer height in FNL dataset. For multi-method analysis, three methods demonstrated optimal consistency in winter (CV = 0.40) and the worst consistency in summer (CV = 2.00). The meteorology-driven O3 trends obtained from GEOS-Chem model were almost smaller than those obtained by other two methods, partly resulting from higher simulated O3 values before 2018. Overall, all analyses driven by diverse meteorological datasets and analytical methods drew a robust conclusion that meteorological conditions almost boosted O3 increases during all seasons; the uncertainties caused by different analytical methods were larger than those caused by diverse meteorological datasets.
- Article
(5438 KB) - Full-text XML
-
Supplement
(2881 KB) - BibTeX
- EndNote


Since 2013, the Chinese government has implemented a series of policies to mitigate air pollution resulting from the rapid industrial and urban expansion, such as the “Air Pollution Prevention and Control Action Plan” (Wang, 2021). Several criteria air pollutants exhibited decreases due to the emission control efforts, but not ozone (O3) (Qi et al., 2023; Shen et al., 2020). In China, O3 concentrations were increased by 50–124 µg m−3 from 2015–2022 (Yao et al., 2024). The formation of surface O3 depends nonlinearly on its precursors and is strongly influenced by meteorological conditions and anthropogenic emissions (Wang et al., 2017). The impact of emission-related factors on O3 increases in China over the past decade has been extensively debated, including the ineffective control of volatile organic compounds (VOCs) emissions, the heightened O3 photochemical production due to the rapid decrease in PM2.5, and the reduced nitric oxide (NO) titration effect (Li et al., 2019, 2022; Lin et al., 2021a; Liu and Wang, 2020b; Ren et al., 2022).
Meteorological conditions also play a crucial role in shaping surface O3 trends (Liu et al., 2023; Lu et al., 2019b), resulting in increased O3 concentrations during warm seasons over most of the United States, the European Union, and China from 2014–2019 (Lyu et al., 2023). In China, the meteorological impacts on O3 levels may be comparable to the anthropogenic contributions (Li et al., 2020; Liu and Wang, 2020a). From 2013 to 2018, meteorology could account for 43 % of the daily variability in summer surface O3 concentrations in eastern China (Han et al., 2020). Adverse meteorological conditions were identified as the cause of the worsening O3 trends during 2015–2020 in Beijing-Tianjin-Hebei (BTH), Yangtze River Delta (YRD), and Pearl River Delta (PRD) regions (Hu et al., 2024b). In YRD, .Dang et al. (2021) found that meteorological factors contributed 84 % of the O3 increase during the summers of 2012–2017. In PRD, meteorological conditions contributed 83 % of the increasing O3 trends during the summers of 2015–2019 (Mousavinezhad et al., 2021). After 2019, meteorological conditions tended to improve O3 air quality (Liu et al., 2023; Wang et al., 2023). Compared to 2019, the wetter and cooler meteorological conditions in 2020 reduced O3 concentrations by 2.9 ppb in eastern China (Yin et al., 2021). However, during 2022's summer, a notable rebound in O3 levels occurred with O3 concentrations rising by 12–15 ppb in China compared to 2021, which was attributable to the extreme heatwave events (Qiao et al., 2024). With climate change, the frequency of extreme O3 pollution events is expected to increase (Gao et al., 2023; Ji et al., 2024). Given the shifted meteorological effects on O3 and climate change, it is imperative to conduct O3-Meteorology research focusing on longer time frames to gain deeper insights into the long-term changes in O3 concentrations (Wang et al., 2024a).
Studies conducted over the past six years to determine the meteorological influence on the surface O3 trend have been systematically reviewed, as documented in Table S1. The meteorological influence on surface O3 concentrations is commonly assessed by using the traditional statistical model (TSM), machine learning model (MLM), and chemical transport model (CTM), driven by reanalysis meteorological products such as the fifth-generation European Centre for Medium-Range Weather Forecasts atmospheric reanalysis of the global climate (ERA5), the Modern-Era Retrospective Analysis for Research and Applications, version 2 (MERRA2), and the National Centres for Environmental Prediction (NCEP) Final Operational Global Analysis data (FNL). Although several studies have demonstrated that meteorological impacts derived from CTM results can corroborate the results of TSM (Liu et al., 2023; Yan et al., 2024) or MLM (Ni et al., 2024; Yin et al., 2021), uncertainties in the determination of meteorological effects on surface O3 concentrations cannot be neglected. For example, Pan et al. (2023) reported that the meteorological impact on O3 trends in Beijing during 2013–2020 was +0.52 ppb yr−1, which is only half of the value estimated by Gong et al. (2022).
Uncertainties in quantifying the drivers of O3 trends can be ascribed to the discrepancies between different meteorological datasets and between different methods (Guo et al., 2021; Weng et al., 2022; Yao et al., 2024). Regarding the uncertainty caused by different meteorological datasets, the meteorologically driven annual variations of O3 concentrations from 2017–2019 identified by the MERRA2-driven TSM are not consistent with the ERA5-driven TSM during the summer of YRD (Hu et al., 2024a; Qian et al., 2022). During the summers of 2013–2019 in YRD, Li et al. (2019) reported a trend of +0.7 ppb yr−1 in meteorology-driven O3 concentrations using the MERRA2-driven TSM, while the trend of Yan et al. (2024) was −0.3 µg m−3 yr−1 using the ERA5-driven TSM. Regarding the uncertainty caused by different methods, the meteorology-driven O3 trend identified by MLM for 2019–2021 was 2.4 times larger than that identified by CTM based on the same meteorological dataset input (MERRA2) in the North China Plain (NCP) during summer (Wang et al., 2024a). In BTH, from 2021 to 2022, Luo et al. (2024) identified a negative meteorological contribution based on the ERA5-driven MLM, while Yan et al. (2024) suggested a positive contribution (+4.3 µg m−3) based on the ERA5-driven TSM during summer.
On the basis of the above-mentioned, large uncertainties caused by multi-dataset or multi-method exist in O3-Meteorology analyses. However, available intercomparisons of O3 analyses mainly focused on predicting the O3 concentrations. For example, Wang et al. (2024b) and Weng et al. (2023) compared the differences in O3 concentration prediction caused by different datasets and models, respectively. The uncertainties in quantifying the meteorological contributions to O3 trends caused by multi-dataset and multi-method remain unassessed. In addition, previous studies have predominantly focused on summer O3 pollution, although reports indicate an extension of the O3 pollution season to winter and spring across major clusters in China (Cao et al., 2024a; Li et al., 2021) and an unfavourable meteorological impact on O3 air quality in spring and winter in BTH (Luo et al., 2024). It is essential to conduct an intercomparison of meteorology-driven O3 quantification using multi-dataset and multi-method across all seasons.
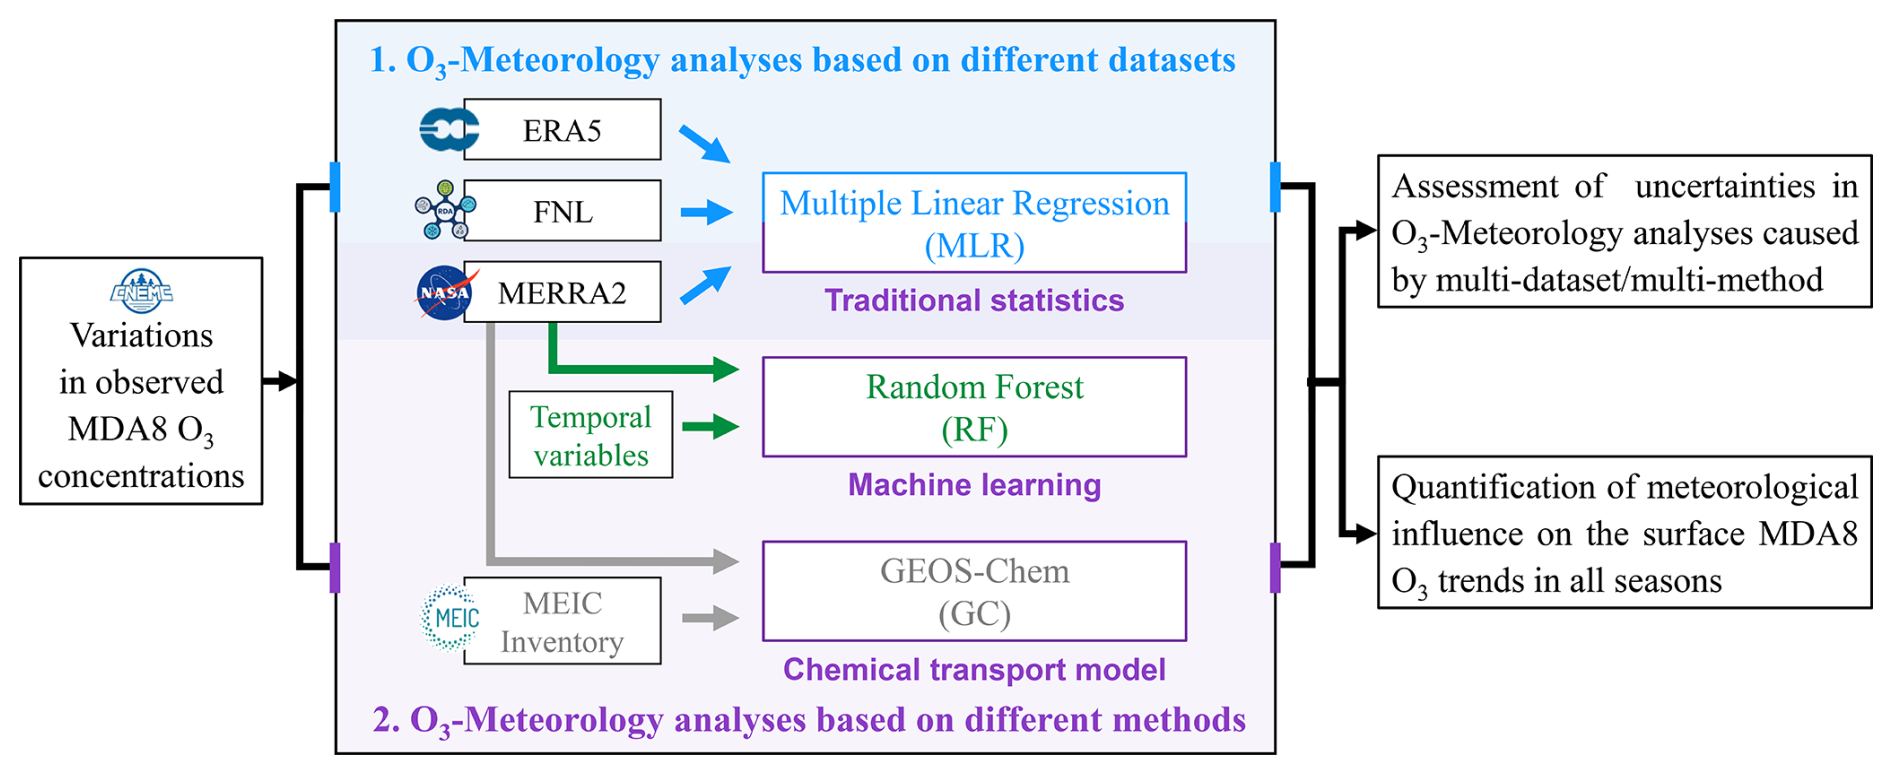
This study utilised 10-year (2013–2022) surface O3 observations in China to investigate long-term O3 trends and quantify the meteorological influence on O3 trends using diverse meteorological datasets and analytical methods. Figure 1 shows the framework, and the main objectives were: (1) to assess uncertainties in identifying the meteorological influences caused by multi-dataset. This was achieved by employing the TSM (i.e. multiple linear regression, MLR) driven by different reanalysis meteorological products (i.e. ERA5, MERRA2, and FNL); (2) to assess uncertainties in identifying meteorological effects caused by multi-method. This was achieved by establishing three models corresponding to TSM (i.e. MLR), MLM (i.e. random forest, RF), and CTM (i.e. GEOS-Chem, GC), each driven by the MERRA2 product; (3) to calculate the mean of meteorology-driven O3 trends driven by three datasets (multi-dataset mean) and three methods (multi-method mean), so as to to derive relatively robust results.
Our paper is structured as follows: Sect. 2 briefly introduces the details of surface O3 observations and different meteorological datasets, as well as the framework of three methods, namely MLR, RF, and GC. The quantification of the uncertainties in meteorology-driven O3 trends caused by multi-dataset and multi-method is presented in Sec. 3. Section 4 concludes the paper. The findings of this study provide a scientific foundation for developing regional and seasonal strategies to mitigate and manage O3 pollution in China.
2.1 Surface O3 and meteorological data sources
Hourly surface O3 observations from over 1000 state-controlled stations operated by the China National Environmental Monitoring Centre from 2013–2022 were used to analyse the long-term O3 trends across all seasons: spring (March–April–May), summer (June–July–August), autumn (September–October–November), and winter (December–January–February). The maximum daily 8 h average (MDA8) O3 was calculated as an air quality indicator after filtering out abnormal data using the z-scores method. For detailed information on data quality control, refer to He et al. (2017).
In this study, we selected three widely used reanalysis products to assess the uncertainties caused by different meteorological datasets. Variables during 2013–2022 from ERA5, MERRA2, and FNL, as detailed in Table S2, were selected as meteorological inputs for building MLR models. These reanalyses have spatial resolutions of 0.25° × 0.25°, 0.625° × 0.5°, and 1° × 1° on a global latitude-longitude grid, respectively. In Sect. 3.2, we also incorporate the NCEP FNL reanalysis product with a spatial resolution of 0.25° × 0.25° (FNL025) for the period 2016–2022 to explore the effect of spatial resolution on the analysis of uncertainties caused by multi-dataset.
2.2 Methods for obtaining long-term series and meteorological influence
2.2.1 Kolmogorov–Zurbenko (KZ) filter
The KZ filter, known for its ability to extract low frequency signals from time series data and handle missing values, has been extensively applied to analysing air quality variations (Eskridge et al., 1997; Rao and Zurbenko, 1994; Wise and Comrie, 2005). This filter is particularly useful in studying variations in air quality over time. The original time series of air pollutants or meteorological variables (X(t)) can be decomposed by the KZ filter into the following form:
In the decomposition process, X(t) represents the original daily time series, while XST(t), XSN(t), and XLT(t) denote the short-term, seasonal, and long-term components, respectively. The baseline component, XBL(t), is defined as the sum of XSN(t) and XLT(t). The KZ(p,q) filter executes q iterations with p as the moving average window length of X(t) series. Specially, XLT(t) is derived using the KZ(365,3) filter, capturing long-term changes with periods exceeding 1.7 years. XBL(t) is obtained through the KZ(15,5) filter, encompassing both seasonal and long-term components. XST(t) represents short-term fluctuations with period less than 33 days in the original time series. XSN(t) is derived as the difference between XBL(t) and XLT(t), corresponding to seasonal variation on a timescale of months. The KZ filter can fill in missing values by using iterated moving average technique. Although not all of the ozone measurement sites were active over the entire period 2013–2022, missing value problems can be handled for most stations after we conduct three iterations wit.
In this study, all statistical analyses were performed at the seasonal scale (spring: March–April–May; summer: June–July–August; autumn: September–October–November; winter: December–January–February). For each season, the KZ(365,3) filter was applied to extract the long-term trends in observed, meteorology-driven, and emission-driven MDA8 O3 concentrations (see details in Fig. S1) during 2013–2022, as detailed in Sect. 2.2.2, 2.2.3, and 2.2.4.
2.2.2 Stepwise MLR for separating meteorological influence
As vividly illustrated in Fig. S1, a data-based TSM (i.e., MLR integrating the KZ filter) was employed to separate the observed MDA8 O3 concentrations into meteorology-driven and emission-driven concentrations (Sadeghi et al., 2022; Shang et al., 2023; Zhang et al., 2022a). We initially applied the KZ filter to disassemble the MDA8 O3 time series and all meteorological variables listed in Table S2 into short-term, baseline, and long-term components at individual state-controlled stations for each season. Subsequently, a series of screening processes aligned with our previous research (Wang et al., 2024c) were executed to perform stepwise MLR on the short-term/baseline MDA8 O3 concentrations and a group of meteorological variables series, respectively. The established MLR model is presented herein:
Here, Cs,r(t) represents the MDA8 O3 concentration for season s and monitoring station r, while Meti(t) signifies the ith meteorological variable out of a total of k, and is the corresponding regression coefficient. denotes the intercept term, and ε is the residual term. After establishing MLR models for the short-term and baseline components in each season, we obtain their respective residual terms. The total residuals, which represent the sum of residuals from baseline variables and short-term variables, primarily reflect anthropogenic influences. We then applied a KZ(365,3) filter to these aggregated residuals to derive long-term emission-driven and meteorology-driven O3 variations. Finally, the meteorology-driven O3 trends and emission-driven O3 trends were obtained through Least Square Method.
The constructed MLR models driven by meteorological variables from ERA5, MERRA2, or FNL in each season will allow a comprehensive analysis of multi-dataset uncertainties. The meteorological impact on O3 trends derived from the MERRA2-driven MLR model will also be integrated into the analysis of multi-method uncertainties to improve the comparability of results.
2.2.3 Random forest (RF) for deriving meteorological influence
The application of MLM in O3 air quality research is becoming increasingly prevalent due to its superior accuracy, user-friendly nature, and capability to capture nonlinear relationships (Ni et al., 2024; Yao et al., 2024; Zhang et al., 2022b). Considering the limited influence of discrepancy in O3-Meteorology analyses stemming from different machine learning algorithms (Wang et al., 2024a), we opted to build a representative MLM known as the meteorological normalisation model based on the RF algorithm (Ding et al., 2023; Ji et al., 2024; Zhang et al., 2023), to delineate meteorology- and emission-driven O3 concentrations.
RF stands out as a tree-based ensemble learning algorithm adept at handling nonlinear issues and reducing overfitting (Breiman, 2001). An RF model was developed for each state-controlled station in each season to predict the MDA8 O3 concentration using the Python package “Sklearn-RandomForestRegressor”. The predictors included six temporal variables (year, month of a year, day of a week, day of a month, day of a year, Unix time), serving as proxies for anthropogenic emission intensity (Grange et al., 2018), alongside six MERRA2 meteorological variables as listed in Table S2 (i.e. SLP, T2max, U10, V10, RH2, PBLHday). The training dataset comprised 70 % of the data, while the remaining 30 % was reserved for model evaluation. A statistical cross-validation technique was employed to determine optimal hyperparameters for enhancing RF prediction performance (Weng et al., 2022). Coefficient of determination (R2) values were utilised to assess model performance for each station. Over 70 % of state-controlled stations showed R2≥0.5 in all seasons (Fig. S2b), which is consistent with the 0.4–0.6 range reported in comparable studies (Weng et al., 2022; Lu et al., 2024). Stations with R2<0.5 were excluded to avoid significant attribution uncertainty that could be introduced by the RF performance. To evaluate the robustness of the R2≥0.5 criterion, we performed sensitivity analyses using thresholds of R2≥0.6 and R2≥0.4, to ensure that our conclusions are not an artifact of an arbitrary cutoff (Table S3).
After establishing the RF model, both the original time variables and resampled meteorological variables were utilised as input data. For meteorological normalisation, we implemented the protocol of Vu et al. (2019). Meteorological variables were resampled by randomly selecting data from the two weeks before and after the specified date, while temporal proxies remained fixed. To derive the de-weathered MDA8 O3 concentration for a given day (e.g. 1 March 2013), the random resampling process was iterated 1000 times. The mean predicted O3 under average meteorological conditions, which refers to de-weathered O3, corresponds to the emission-driven O3 concentration. The meteorology-driven MDA8 O3 concentrations for each season were computed as the difference between observed concentrations and de-weathered concentrations. Detailed processes are shown in Fig. S2a. The KZ(365,3) filter was then applied to obtain long-term components, and meteorology-driven O3 trends were derived using Least Square Method.
2.2.4 GEOS-Chem (GC) simulation for quantifying meteorological influence
The numerical analysis of surface O3 in China was performed with the GC classic version 13.3.3 (https://github.com/geoschem/GCClassic/releases/tag/13.3.3, last access: 22 October 2025). Developed as a global 3-D model, GC incorporates a fully coupled O3–NOx–VOCs–aerosol–halogen chemical mechanism, driven by the MERRA2 meteorological input. Numerous studies have leveraged GC to simulate O3 air quality in China, demonstrating alignment between observational data and model outcomes (Dai et al., 2024; Dang et al., 2021; Li et al., 2019; Lu et al., 2019a). We employed the nested-grid GC to simulate the long-term surface O3 concentrations and to quantify the meteorology-driven MDA8 O3 trends over China. The nested-grid domain was set over China's mainland (15–55° N, 70–140° E) with a horizontal resolution of 0.5° latitude by 0.625° longitude and 47 vertical layers extending up to an altitude of 0.01 hPa. A global simulation with a horizontal resolution of 2° × 2.5° provided the chemical boundary conditions for the nested-grid simulation every 3 h. To ensure model stability and accuracy, a 6-month spin-up simulation was conducted before the commencement of the targeted 10-year period from March 2013 to February 2023.
Emissions management within GC is facilitated by the Harmonized Emissions Component, a system introduced by Lin et al. (2021b). Anthropogenic emissions are sourced from the Community Emissions Data System (CEDS) inventory globally, with specific overwriting by the Multi-resolution Emission Inventory for China (MEIC) within the Chinese region. The simulations for 2021–2022 adopt a similar approach to Zhai et al. (2021), using 2019 MEIC emissions with NOx emissions reduced by 8 %–13 % and 2017 MEIC with VOCs emissions reduced by 10 %–14 %, based on the policy released by Ministry of Ecology and Environment of the People's Republic of China. For natural emissions, biogenic VOCs, soil, and lightning NOx were calculated online in the model. Emissions from biomass burning, ships, and aircraft are sourced from the Global Fire Emissions Database, the CEDS inventory, and the 2019 Aircraft Emissions Inventory Code, respectively.
In order to assess the model's performance and to get a quantification of meteorology-driven O3 trends during the period of 2013–2022, two sets of simulations were conducted: (1) BASE: the standard simulation of O3 concentrations from 2013 to 2022, where both meteorological fields and emissions (including anthropogenic, natural, and biomass emissions) vary year by year from 2013 to 2022; (2) FixE2013: a “fixed-emission simulation” where meteorological conditions vary from 2013 to 2022 while anthropogenic emissions remain constant at 2013 levels. The FixE2013 simulation is designed to quantify the meteorological influence on O3 variations. The FixE2013 simulation is designed to obtain the MDA8 O3 concentrations driven solely by meteorological changes and further quantify the meteorological influence on O3 variations in four seasons. After applying the KZ(365,3) filter to derive the long-term meteorology-driven series, trends were calculated through Least Square Method. Figure S3 evaluates the performance of the GC simulation for 2013–2022. The GC model generally captures the monthly variability in MDA8 O3 over China and three megacity clusters, with the correlation coefficients greater than 0.80, although it always shows a high bias of surface O3 in warm seasons (Dai et al., 2024), which can be attributed to its inability to capture the complex terrain, local pollution sources and meteorological conditions, or overestimates of the correlations between the surface O3 concentration and temperature (Shen et al., 2022; Sun et al., 2021).
2.3 Assessment of uncertainties caused by multi-dataset and multi-method
In this study, the coefficient of variation (CV) is applied to assess the uncertainties in O3-Meteorology analyses caused by different meteorological datasets or methods. The CV, calculated as the ratio of the standard deviation (SD) to the mean, serves as a statistical metric commonly utilised to measure the diversity within datasets or models (Bedeian and Mossholder, 2000; Chen et al., 2019). Compared to other comparators (e.g. range, inter-quartile range, and SD), the CV is a unit-free measure that quantifies percentage variation relative to the mean and is less sensitive to outliers and heavy-tailed distributions (Högel et al., 1994; Chattamvelli and Shanmugam, 2023). In this study, higher CVs indicate lower consistency of meteorologically driven O3 trends derived from different datasets or methods. To give a more quantitative assessment, consistency levels were classified as strong and weak with CV < 0.5 and CV > 1.0, respectively (Wang et al., 2022a). Given the possibility of disparate meteorology-driven O3 trends detected by different datasets or methods, we consider the absolute value of the CV as a quantitative indicator of the uncertainties. For each season, when examining the uncertainties arising from different datasets, the CV represents the SD of trends derived from the ERA5, MERRA2, and FNL-driven MLR models divided by the mean. Similarly, in the context of multi-method uncertainties, the CV is the SD of trends identified by the MLR, RF, and GC models divided by the mean.
3.1 Observed trends in surface O3 concentration
Figure 2 shows the trends in observed MDA8 O3 concentrations over a 10-year period during four seasons. Noteworthy increases in O3 concentrations were observed at 78 %–93 % of state-controlled stations over the years, with the national trend being +1.31, +0.93, +0.79, and +0.80 ppb yr−1 in spring, summer, autumn, and winter, respectively.
The major eastern megacity clusters in China also displayed their highest MDA8 O3 increase trends in spring, with trends of +1.16 ppb yr−1 in BTH, +1.61 ppb yr−1 in YRD, and +1.48 ppb yr−1 in PRD, which has been reported in previous studies (Cao et al., 2024b; Chen et al., 2020; Wang et al., 2022b). During summer, BTH and YRD faced more severe challenges in O3 prevention and control compared to PRD, with rising MDA8 O3 trends in the former two regions being about three times higher than that in PRD (Fig. 2b).
In terms of O3 growth rates, Shanxi province and Anhui province ranked the top two provinces in China over the past decade in all seasons except for winter, consistent with Zhao et al. (2020). In spring and winter, O3 concentrations increased in all provinces, with trends of +0.39 to +2.75 ppb yr−1 and +0.42 to +1.30 ppb yr−1, respectively. Notably, Jilin province experienced an obvious improvement in O3 air quality during summer and autumn, with decreasing trends of −0.74 and −0.38 ppb yr−1, respectively, which was also confirmed by Gong et al. (2022). As mentioned in Section 1, variations in O3 concentrations are fundamentally modulated by emissions and meteorology. This section mainly documents observed O3 trends, and the quantitative contributions of emissions and meteorology to MDA8 O3 variations will be discussed in Sect. 3.2.
The annual and seasonal mean MDA8 O3 concentrations across China are detailed in Figs. S4 and S5, providing a holistic depiction of the persisting spread of O3 pollution since 2013. On a national average, the O3 air quality was worst in summer, with the average O3 levels exceeding the air quality standard Grade I limit of 50 ppb almost every year. Notably, the summer of 2019 marked a peak period for O3 pollution, with an average concentration of 59.7 ppb (Fig. S5b).
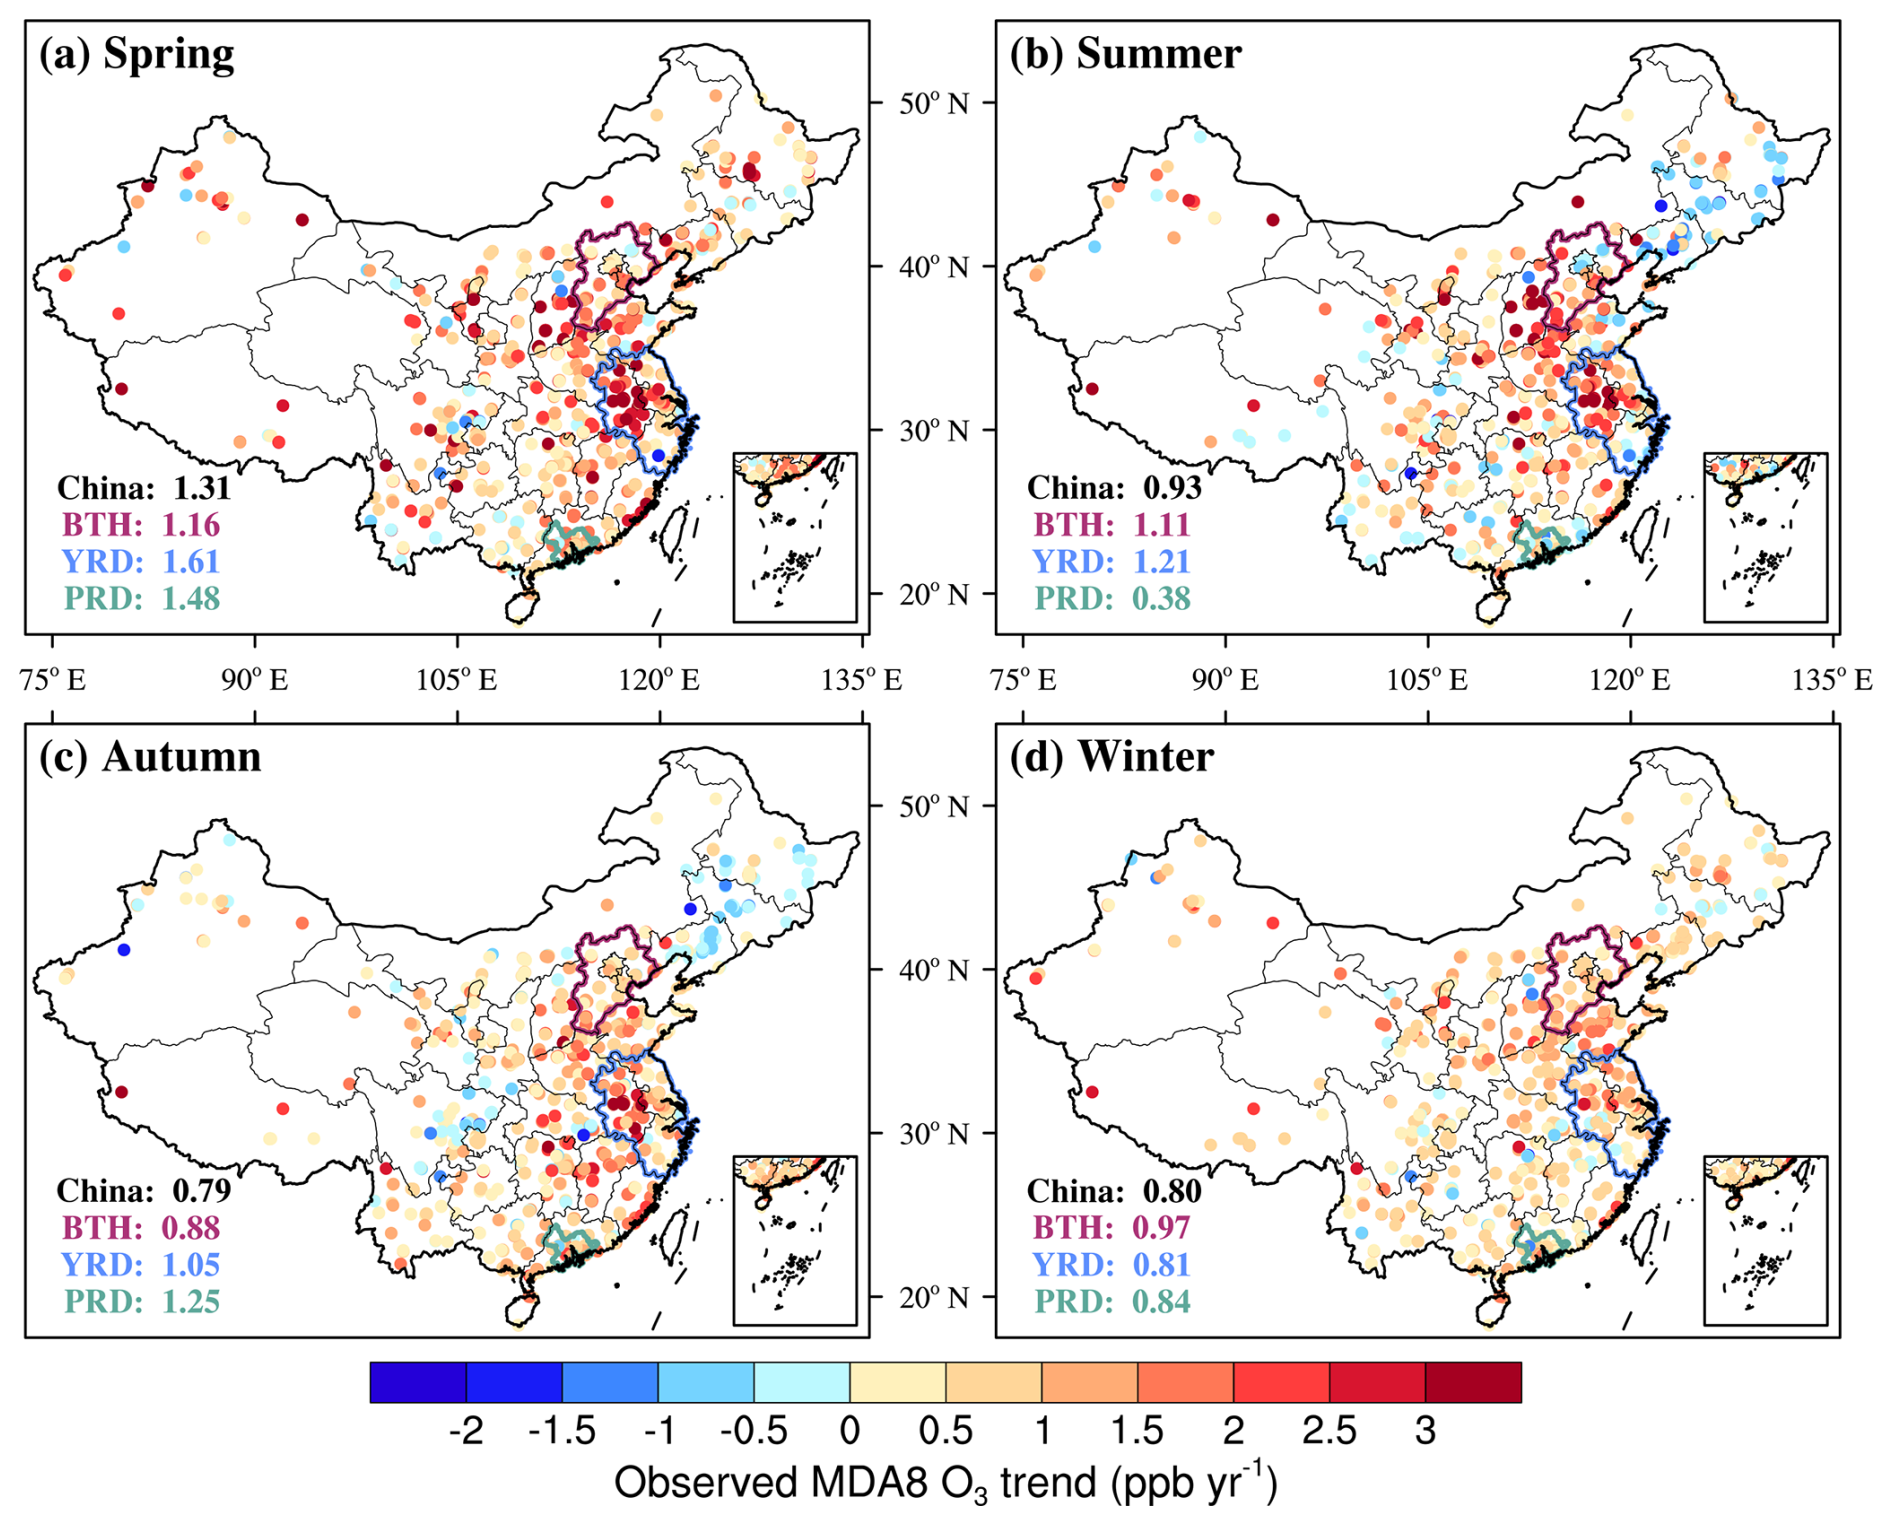
Figure 2Trends in observed MDA8 O3 concentrations in China from 2013–2022 during (a) spring, (b) summer, (c) autumn, and (d) winter. Values in black, purple, blue, and green represent the mean trends for the whole China, BTH, YRD, and PRD, respectively.
3.2 Uncertainty in meteorology-driven O3 trends caused by multi-dataset
The traditional statistical method (the MLR model), which has a relatively low computational cost but can provide valuable insights into the quantification of meteorological contributions to O3 trends, was used to investigate the uncertainties in O3-Meteorology analyses caused by different meteorological datasets. As shown in Fig. 3a, meteorological conditions contribute to an increase in MDA8 O3 concentrations across all seasons in China, with the multi-dataset mean trends ranging from +0.19 (± 0.47) ppb yr−1 to +0.55 (± 0.45) ppb yr−1. All three dataset-driven MLR models indicate that meteorology leads to the most rapid increase in MDA8 O3 concentrations in spring, with trends ranging from +0.47 (± 0.47) ppb yr−1 to +0.71 (± 0.59) ppb yr−1, and a low CV of 0.25. This suggests a high consistency among the three datasets in assessing the meteorological influence on surface O3 concentrations. During summer and autumn, meteorological influences on O3 show greater spatial heterogeneity (with higher SD) and larger variability among multi-datasets (with higher CV). Specifically in autumn, the meteorology-driven O3 trend derived from the FNL-driven MLR model is 4.1 times larger than that derived from the ERA5-driven MLR model. Lu et al. (2024) compared meteorology-driven O3 trends derived from ERA5- and MERRA2-driven MLR models during the summers of 2013–2019. Their findings revealed that ERA5-derived trends were lower than those from MERRA2 in YRD and PRD, whereas trends derived from ERA5 were comparable to those from MERRA2 in BTH. This inter-study consensus further validates the robustness of our methodological framework.
Figure 3b–d depicts the meteorological impact on the MDA8 O3 trends in the three megacity clusters (BTH, YRD, and PRD). Meteorology caused the MDA8 O3 increase in most of the megacity clusters and seasons, except for BTH during autumn. In seasons where the meteorological effects derived from the three MLR models are all positive, the multi-dataset mean trends ranged from +0.09 (± 0.38) to +0.33 (± 0.13) ppb yr−1 in BTH, +0.18 (± 0.20) to +0.68 (± 0.56) ppb yr−1 in YRD, and +0.73 (± 0.36) to +1.13 (± 0.45) ppb yr−1 in PRD. Consistent with Fig. 3a, meteorology triggered the most rapid increase in MDA8 O3 concentrations in spring across the three megacity clusters. The largest meteorological impact in BTH during spring was also revealed by Luo et al. (2024). Large CVs (> 1.0) were observed in BTH during summer and autumn. Notably, the meteorological influence calculated by the three dataset-driven MLR models even showed opposite trends in BTH during autumn, indicating challenges in assessing the meteorological impacts on surface O3 concentrations. In contrast, in YRD and PRD, the three MLR models demonstrated high consistency across almost all seasons. Although the largest CV reached 4.40 in PRD during summer, it was considered acceptable because the three MLR models indicated that meteorology had a minor influence (less than +0.1 ppb yr−1) on O3 trends.
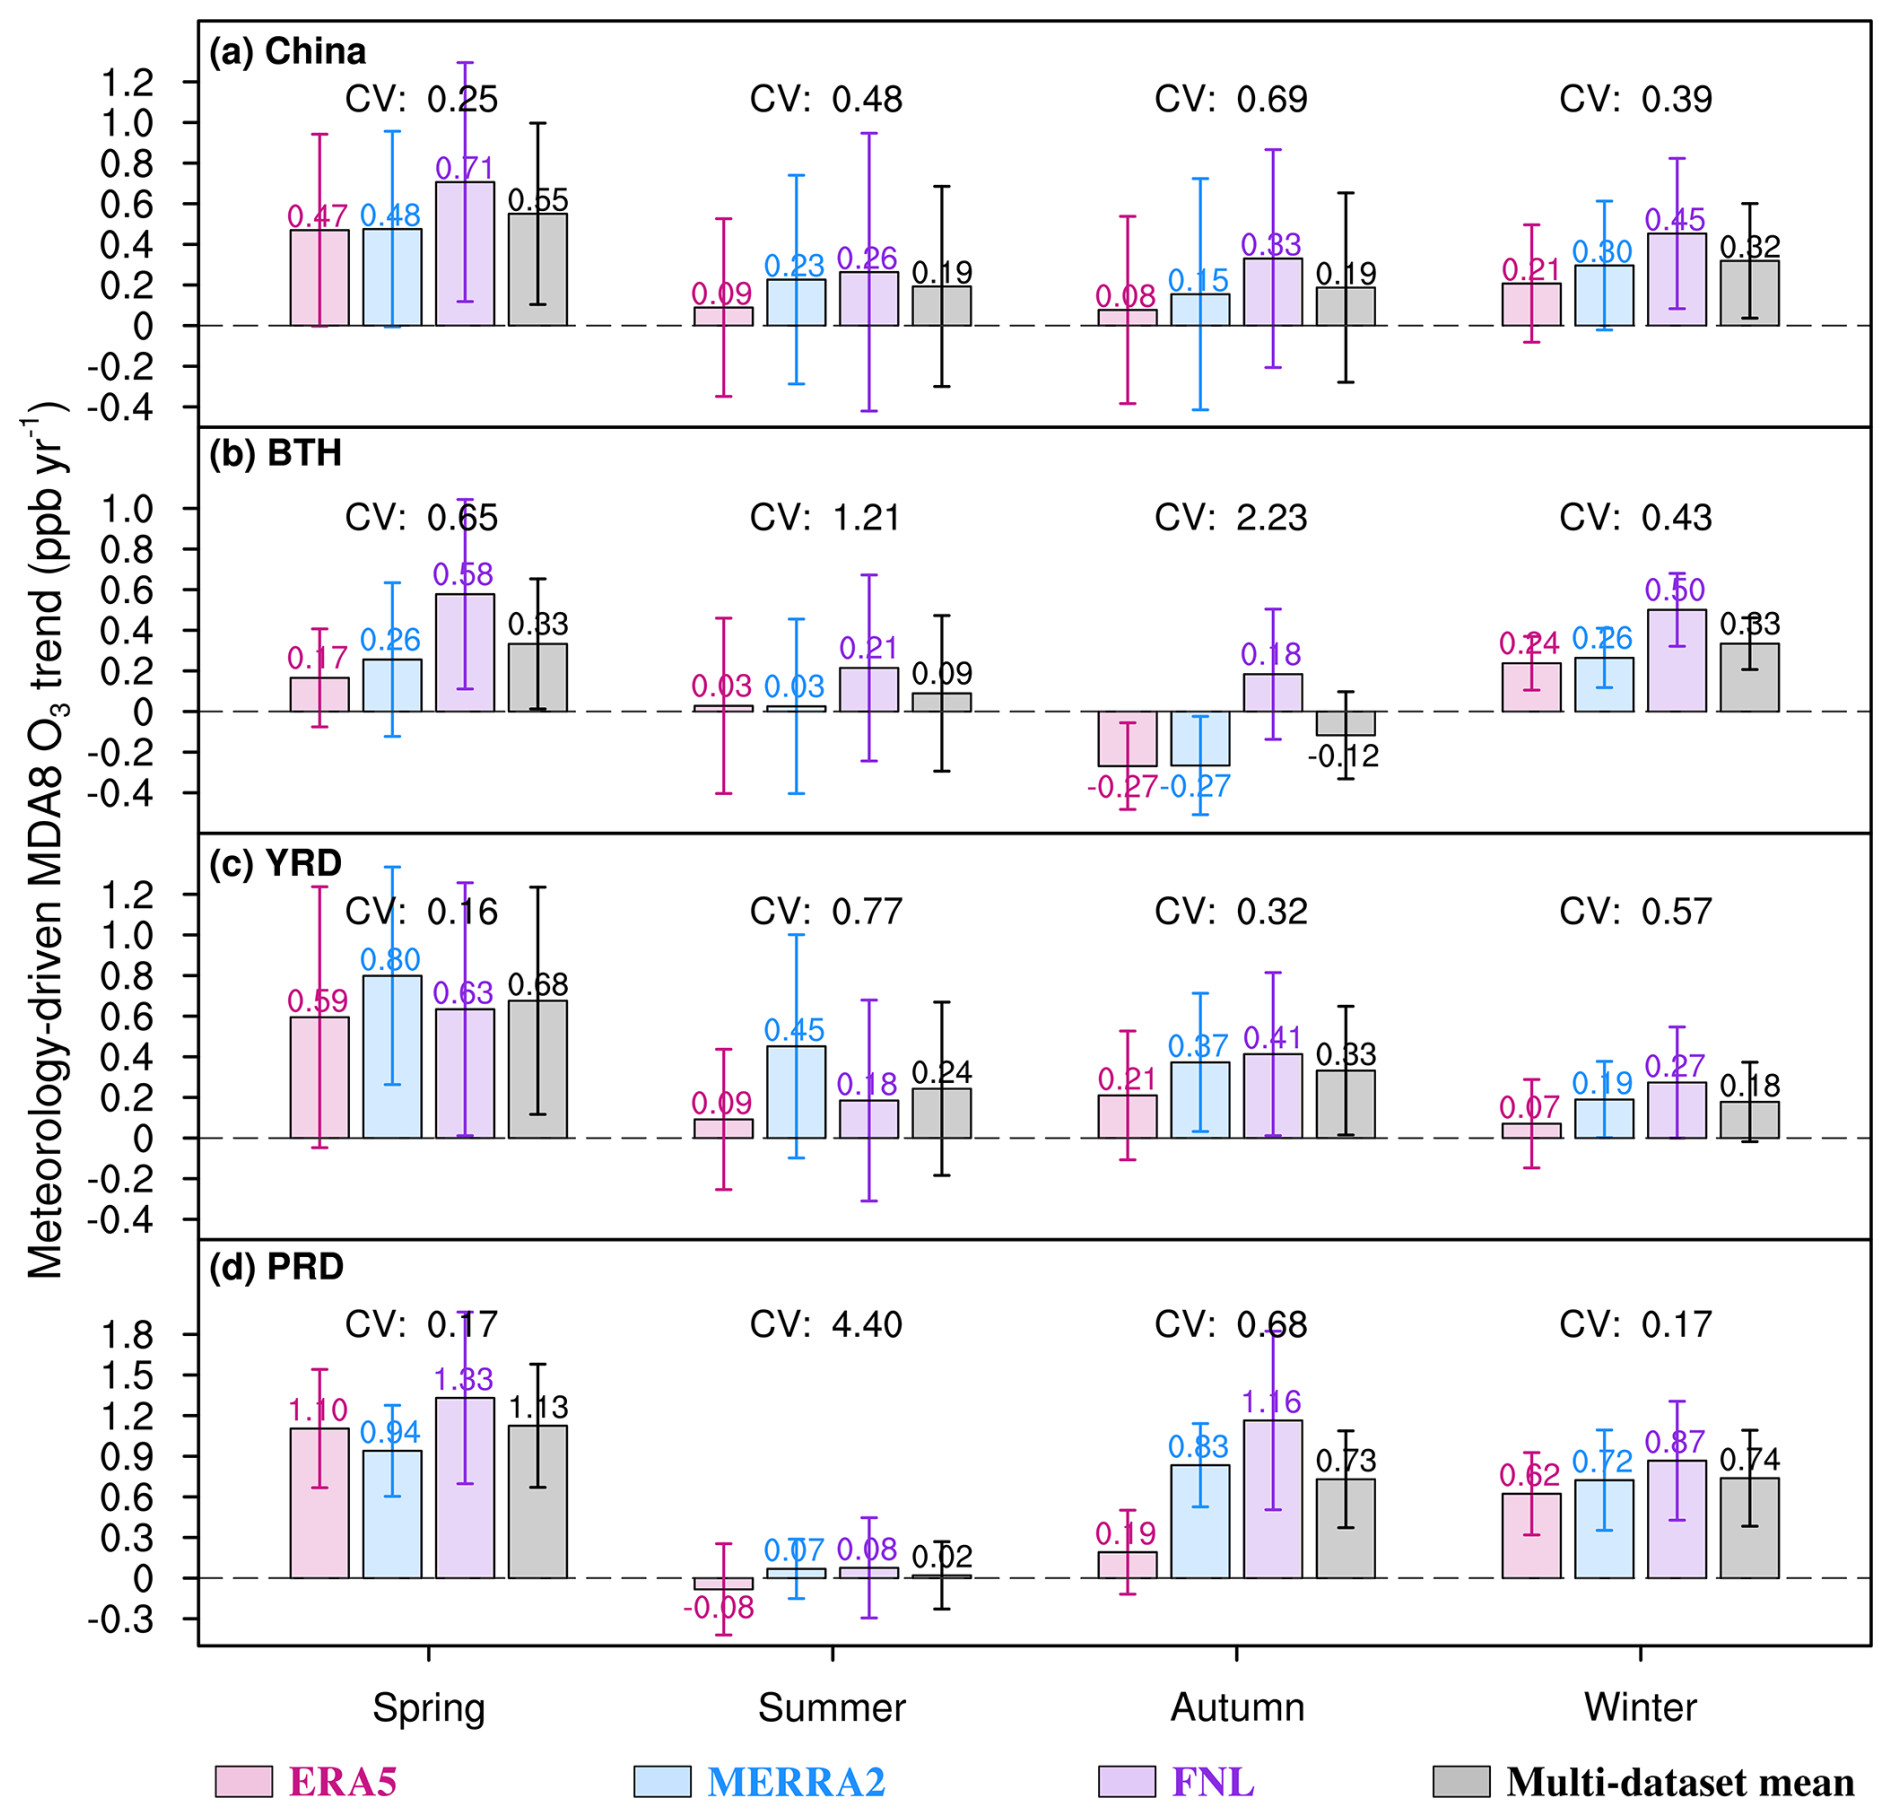
Figure 3Meteorology-driven MDA8 O3 trends in (a) the whole China, (b) BTH, (c) YRD, and (d) PRD during four seasons. Values in red, blue, and purple represent trends calculated by ERA5-, MERRA2-, and FNL-driven multiple linear regression (MLR) models, respectively. The fourth black bar represents the multi-dataset mean trend. Error bars indicate ± 1 standard deviation (SD) of site-level trends calculated from all available monitoring stations within each region. The absolute value of the coefficient of variation (CV) for each season is also shown.
From a provincial perspective in Fig. S6, we can also see that the meteorological contributions to O3 trends are positive during spring and winter. Large uncertainties in O3-Meteorology analyses were identified during summer and autumn. There were 7 and 12 provinces with controversial meteorological contributions identified by the three dataset-driven MLR models in summer and autumn, respectively.
Figure 4 displays the spatial distribution of the CV values from the perspective of state-controlled stations in four seasons. Consistent with the national and provincial perspectives, the least uncertainties in O3-Meteorology analyses were observed in spring, with CVs less than 0.5 at 45 % of stations. Obvious discrepancies in meteorology-driven O3 trends are found in summer and autumn, particularly in the NCP and northwestern China, with CVs greater than 1.0 at 33 %–40 % of the stations. In autumn, it is noteworthy that the uncertainties caused by multi-dataset are lower in the south than in the north. Previous studies that employed MLR models to predict O3 concentration also revealed that the MLR had better performance in the south than in the north (Han et al., 2020; Lu et al., 2024).
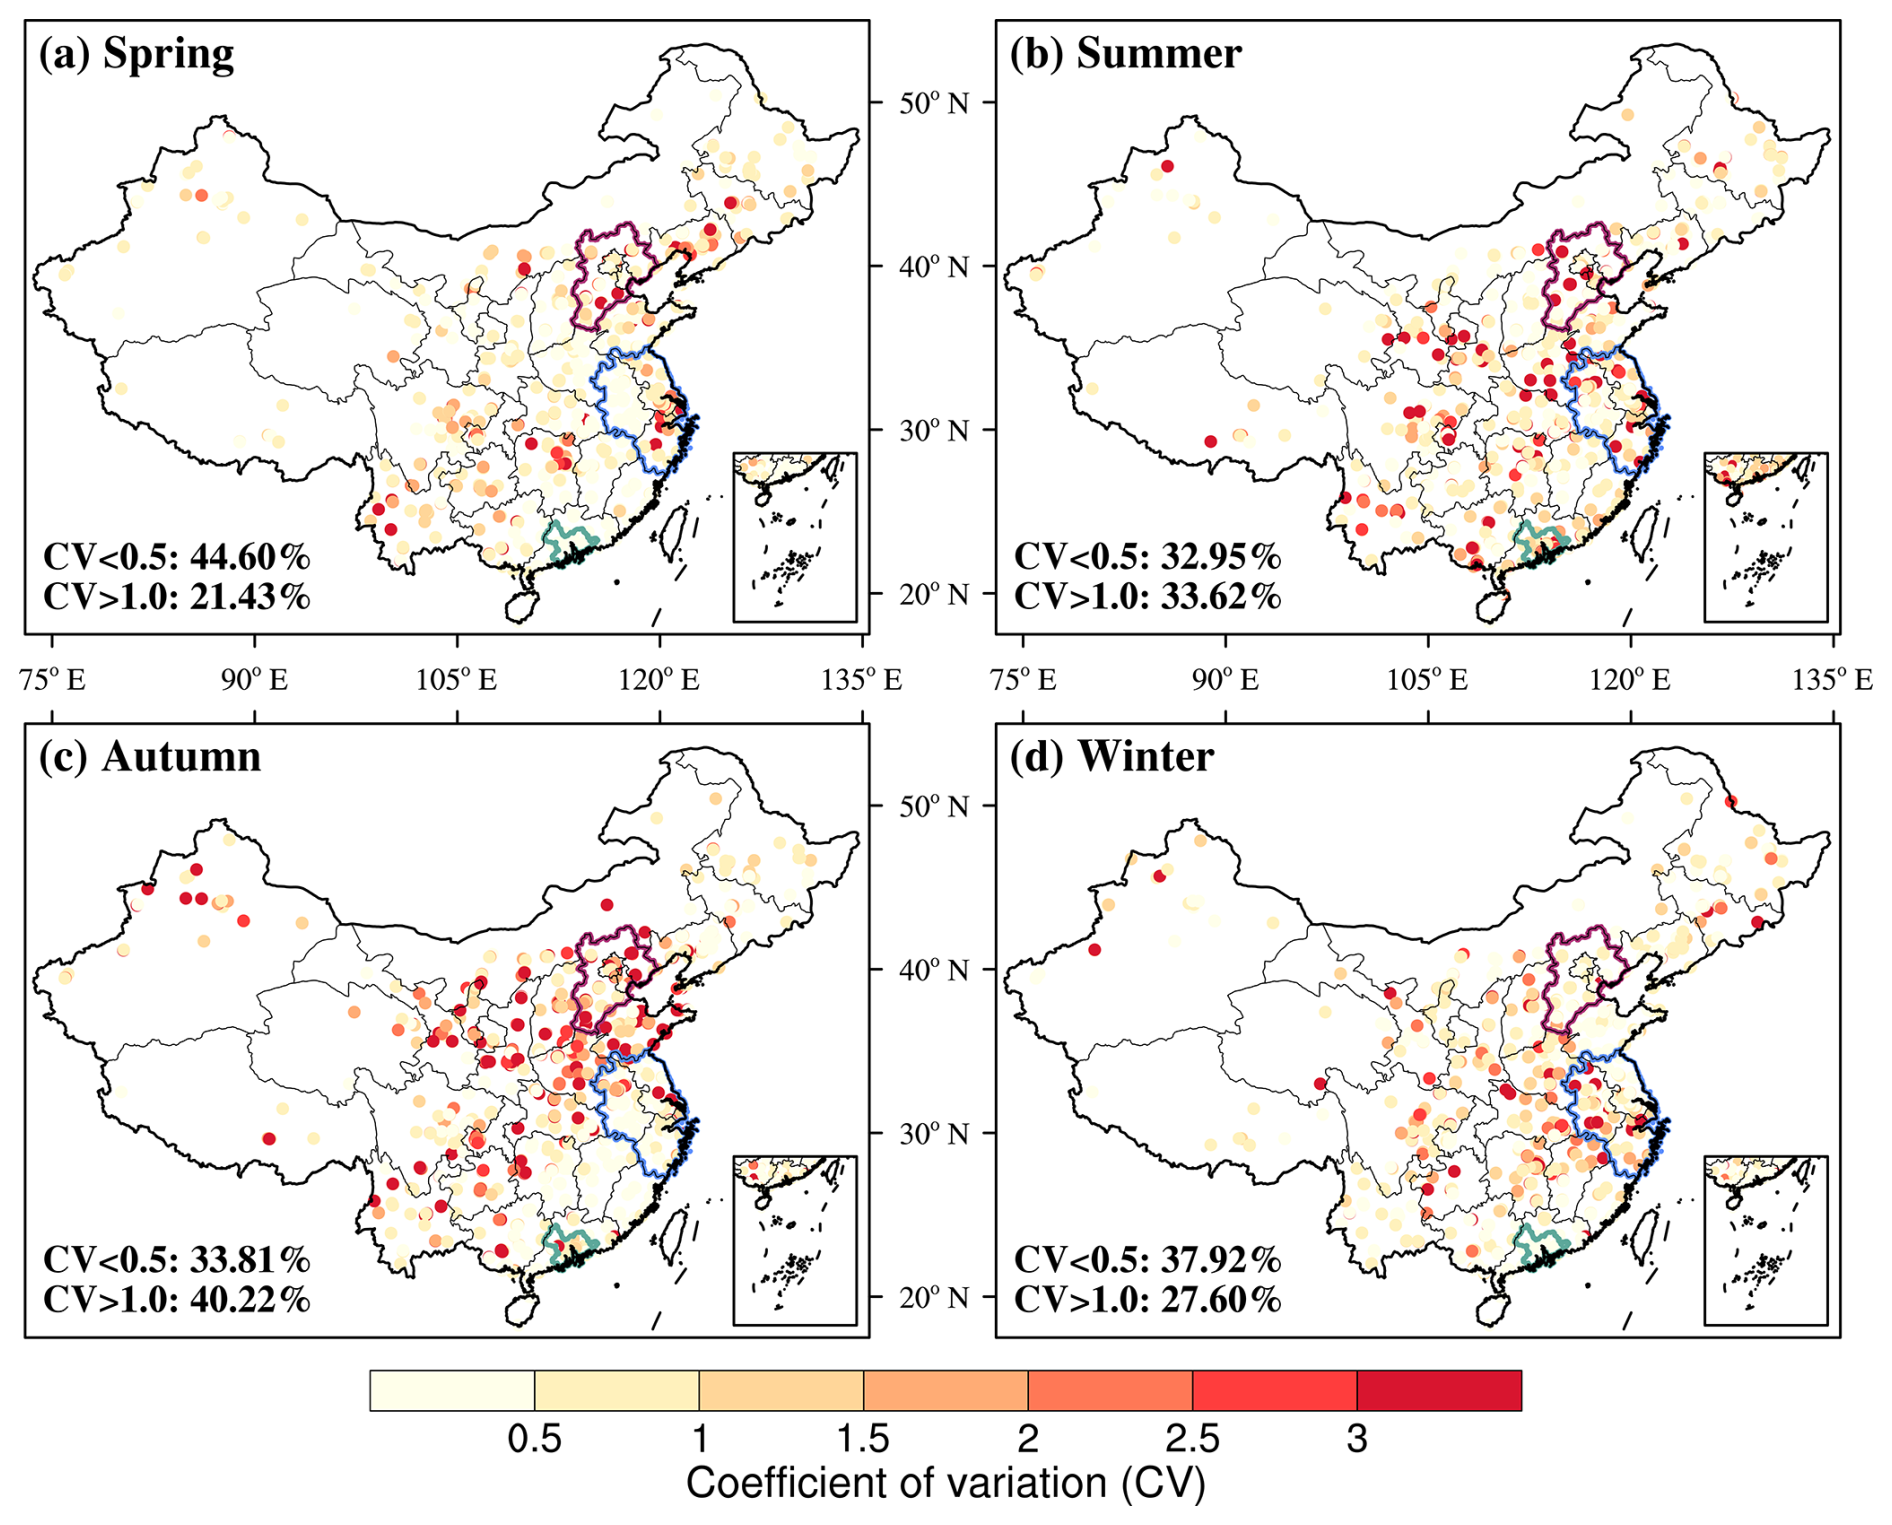
Figure 4The absolute value of the coefficient of variation (CV) for each state-controlled monitoring station in China during (a) spring, (b) summer, (c) autumn, and (d) winter. The CV is calculated by the standard deviation (SD) of the trends derived from ERA5-, MERRA2-, and FNL-driven MLR models divided by the mean. The darker colour means the larger uncertainty in quantifying the meteorological impact on observed O3 trends. The proportion of state-control stations with CV less than 0.5 and greater than 1.0 is also shown. The outline marked in purple, blue, and green represents the region of BTH, YRD, and PRD, respectively.
Based on the three dataset-driven MLR models, the meteorological and anthropogenic contributions to the MDA8 O3 trends in China during 2013–2022 were further examined. As presented in Fig. 5, both meteorological conditions and anthropogenic emissions lead to O3 increases. According to the ERA5- and MERRA2-driven MLR models, variations in anthropogenic emissions were identified as the dominant factor driving the increase in MDA8 O3 concentrations across all seasons, with anthropogenic contributions ranging from 63.2 % to 90.4 %. The results suggest that more stringent emission control policies should be implemented to counteract the adverse effects of meteorological influences on O3 concentrations.
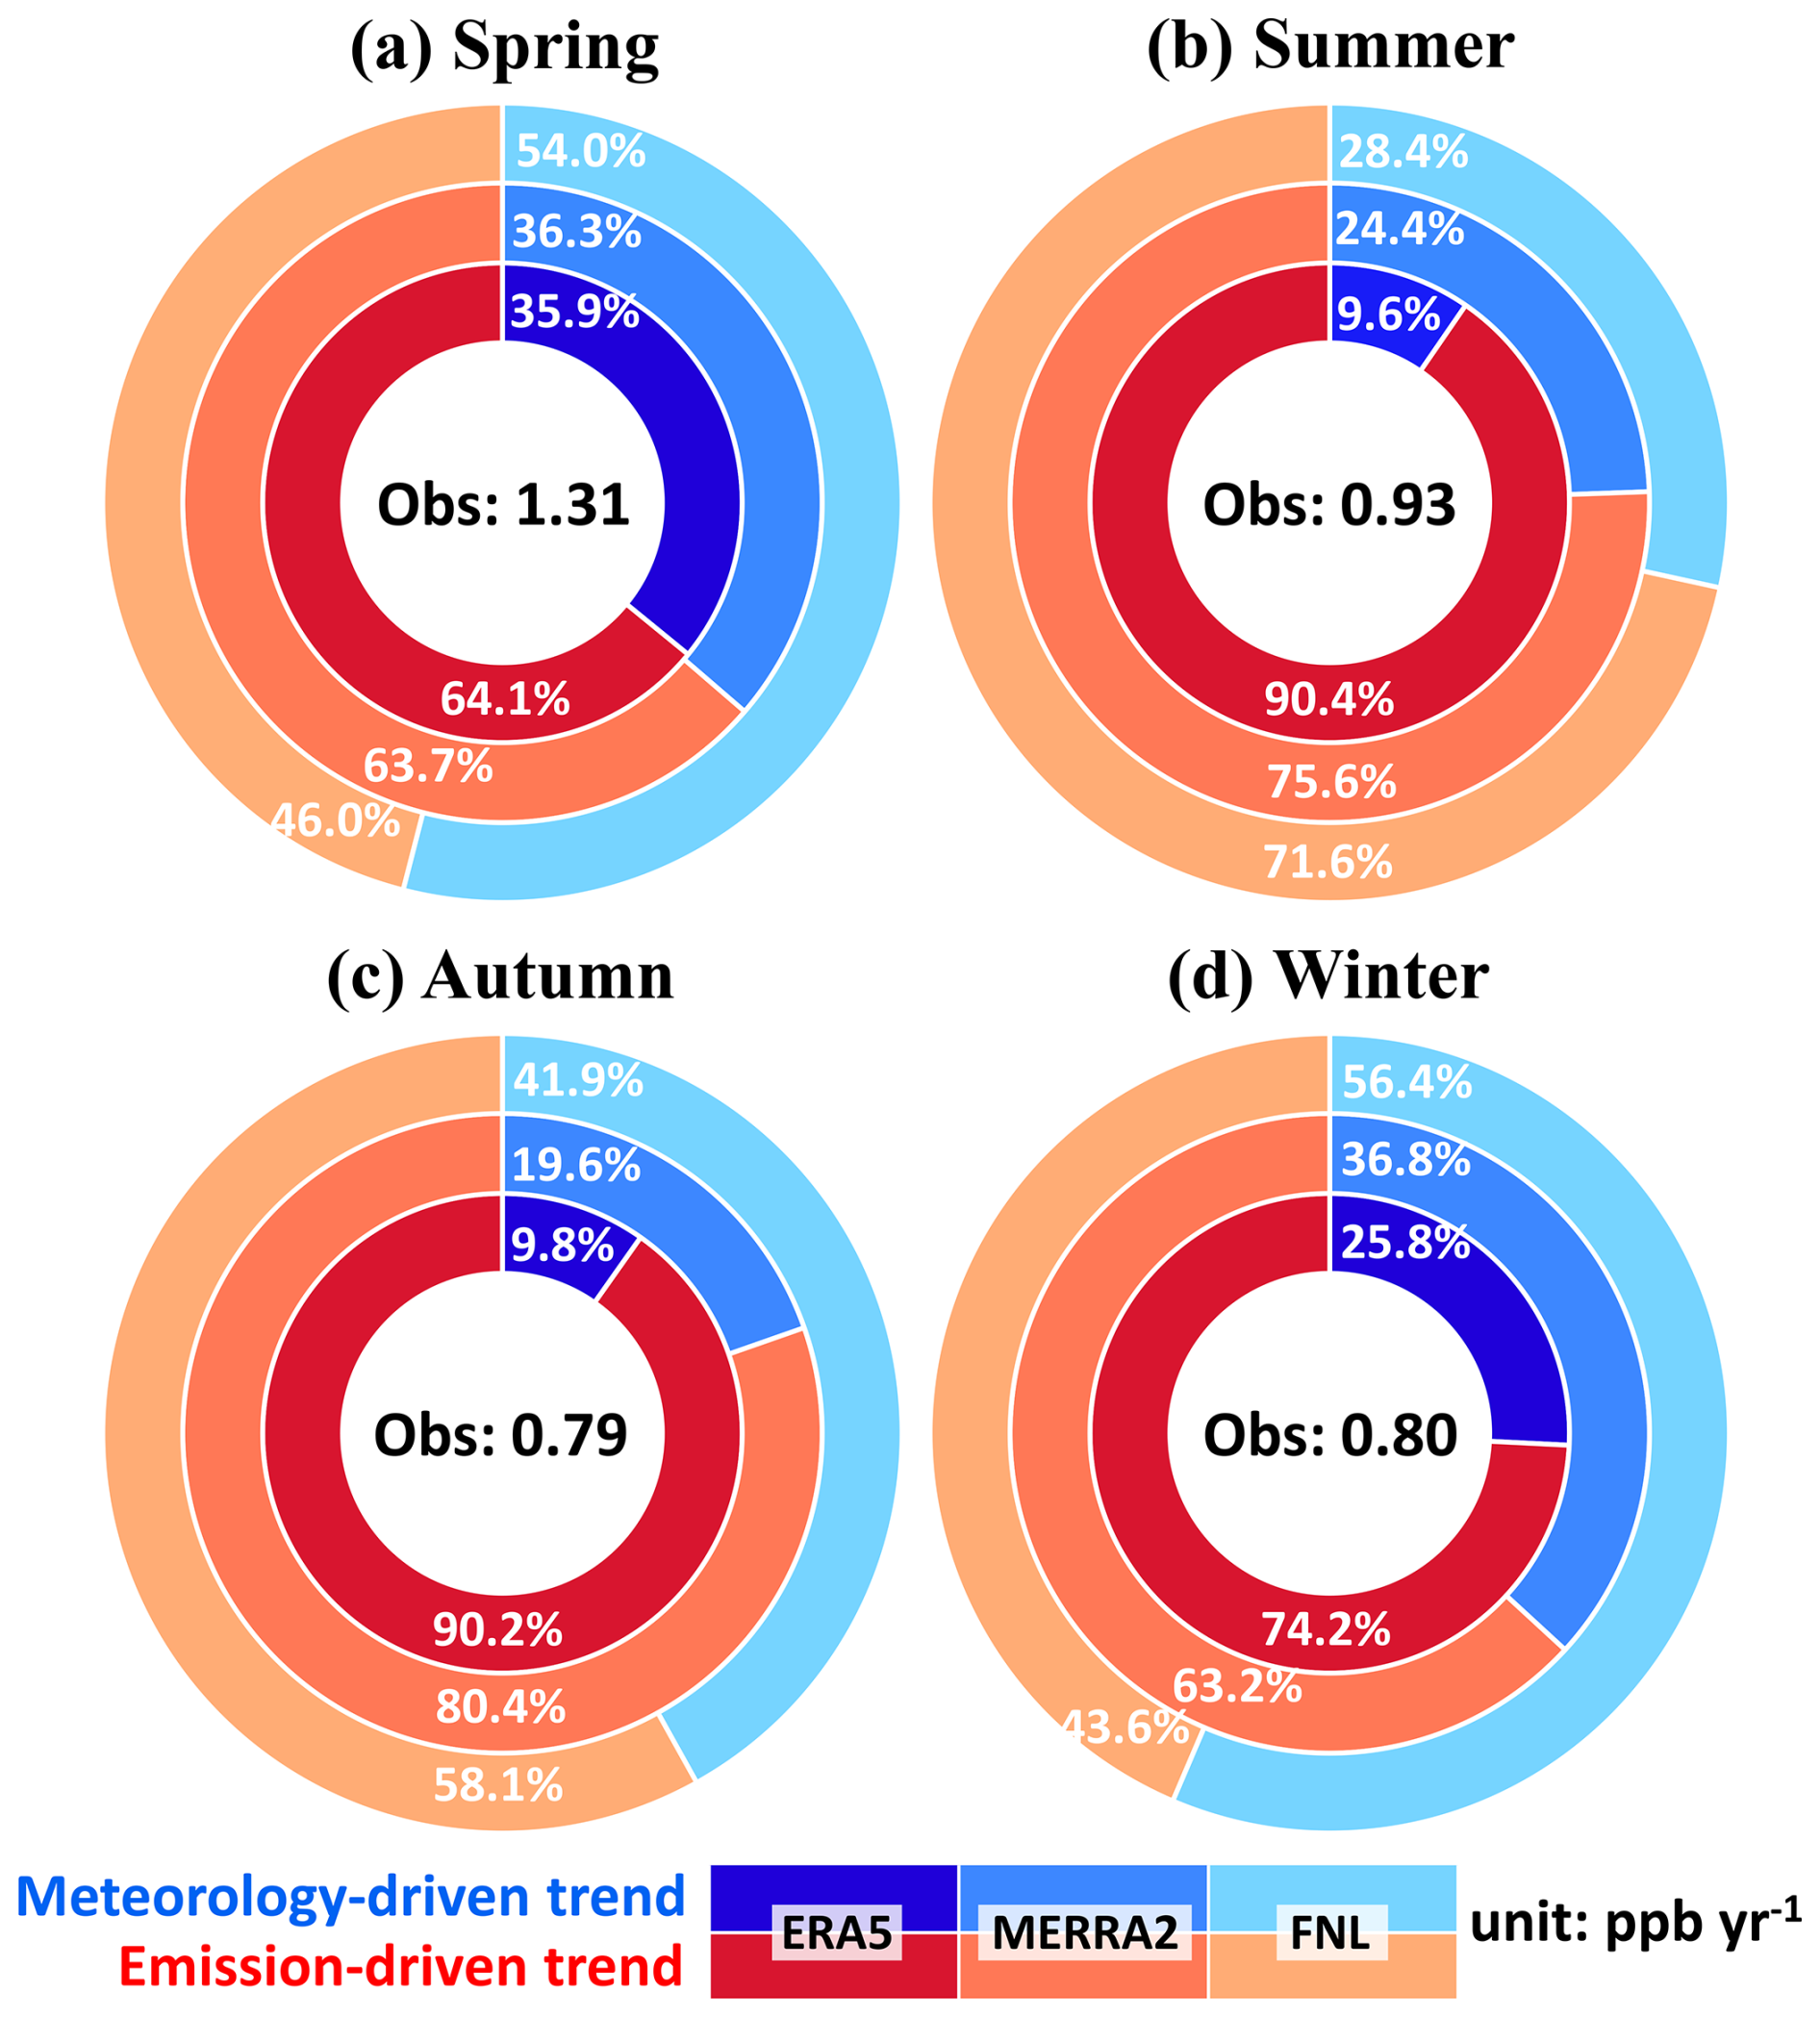
Figure 5Percentage contributions of meteorological conditions (blue) and anthropogenic emissions (red) to the trends in observed MDA8 O3 concentrations calculated by ERA5-, MERRA2-, and FNL-driven multiple linear regression (MLR) models in China during (a) spring, (b) summer, (c) autumn, and (d) winter. Values in black represent the observed MDA8 O3 trends averaged over the whole China.
It is interesting to note that the FNL-driven model almost always gave relatively larger predictions of meteorologically driven O3 trends compared to the models driven by ERA5 and MERRA2. To investigate whether this discrepancy was due to the coarser spatial resolution of the FNL dataset, a comparison was made between the FNL025-driven MLR model (0.25° × 0.25°) and the FNL-driven MLR model (1.0° × 1.0°). As depicted in Fig. S7, the deviation of the meteorology-driven trends calculated by the two MLR models was less than 0.1 in China and three megacity clusters across four seasons, indicating that different spatial resolutions have little effect on O3-Meteorology analyses. Further examination was conducted to assess the influence of meteorological variables on O3-Meteorology analyses. Table S4 lists the 10-year trends in each meteorological factor and shows a great discrepancy in the variable “PBLHday”. Zuo et al. (2023) also reported that FNL exhibited the highest uncertainty for the evaluation of PBLH compared to ERA5 and MERRA2, and that its performance may be constrained by complex underlying terrain and static instability (Guo et al., 2021). As Fig. S8 shows, constructing the FNL-driven MLR models using six meteorological variables without “PBLHday” can reduce the estimated meteorological impact by 0.08 to 0.20 ppb yr−1. To obtain a more reliable estimate, it is recommended to use MERRA2 reanalysis dataset due to its eclectic result (Fig. 3) and avoid using FNL because of the uncertainty brought by PBLH when separating meteorological and anthropogenic influences on O3 concentrations in China.
3.3 Uncertainty in meteorology-driven O3 trends caused by multi-method
This section discusses the uncertainties caused by multi-method (i.e. MLR, RF, GC), all of which are driven by the MERRA2 dataset. Figure 6 illustrates the meteorology-driven MDA8 O3 trends calculated by the MLR, RF, and GC models. For the whole of China, the large uncertainties are evident during summer, when the meteorology-driven O3 trends derived from the MLR model are notably larger than those from the RF and GC models, with a CV of 2.00 (Fig. 6a). In the other three seasons, the multi-method mean trends, ranging from +0.17 (± 0.37) to +0.26 (± 0.27) ppb yr−1, are 1.1 to 2.1 times lower than those computed by the three dataset-driven MLR models (Fig. 3a), all models converge on the conclusion that meteorological conditions contribute to the deterioration of O3 air quality. Meteorology-driven MDA8 O3 trends exhibited minor variations across different R2 thresholds (Table S3), indicating that the trends are not an artifact of an arbitrary cutoff.
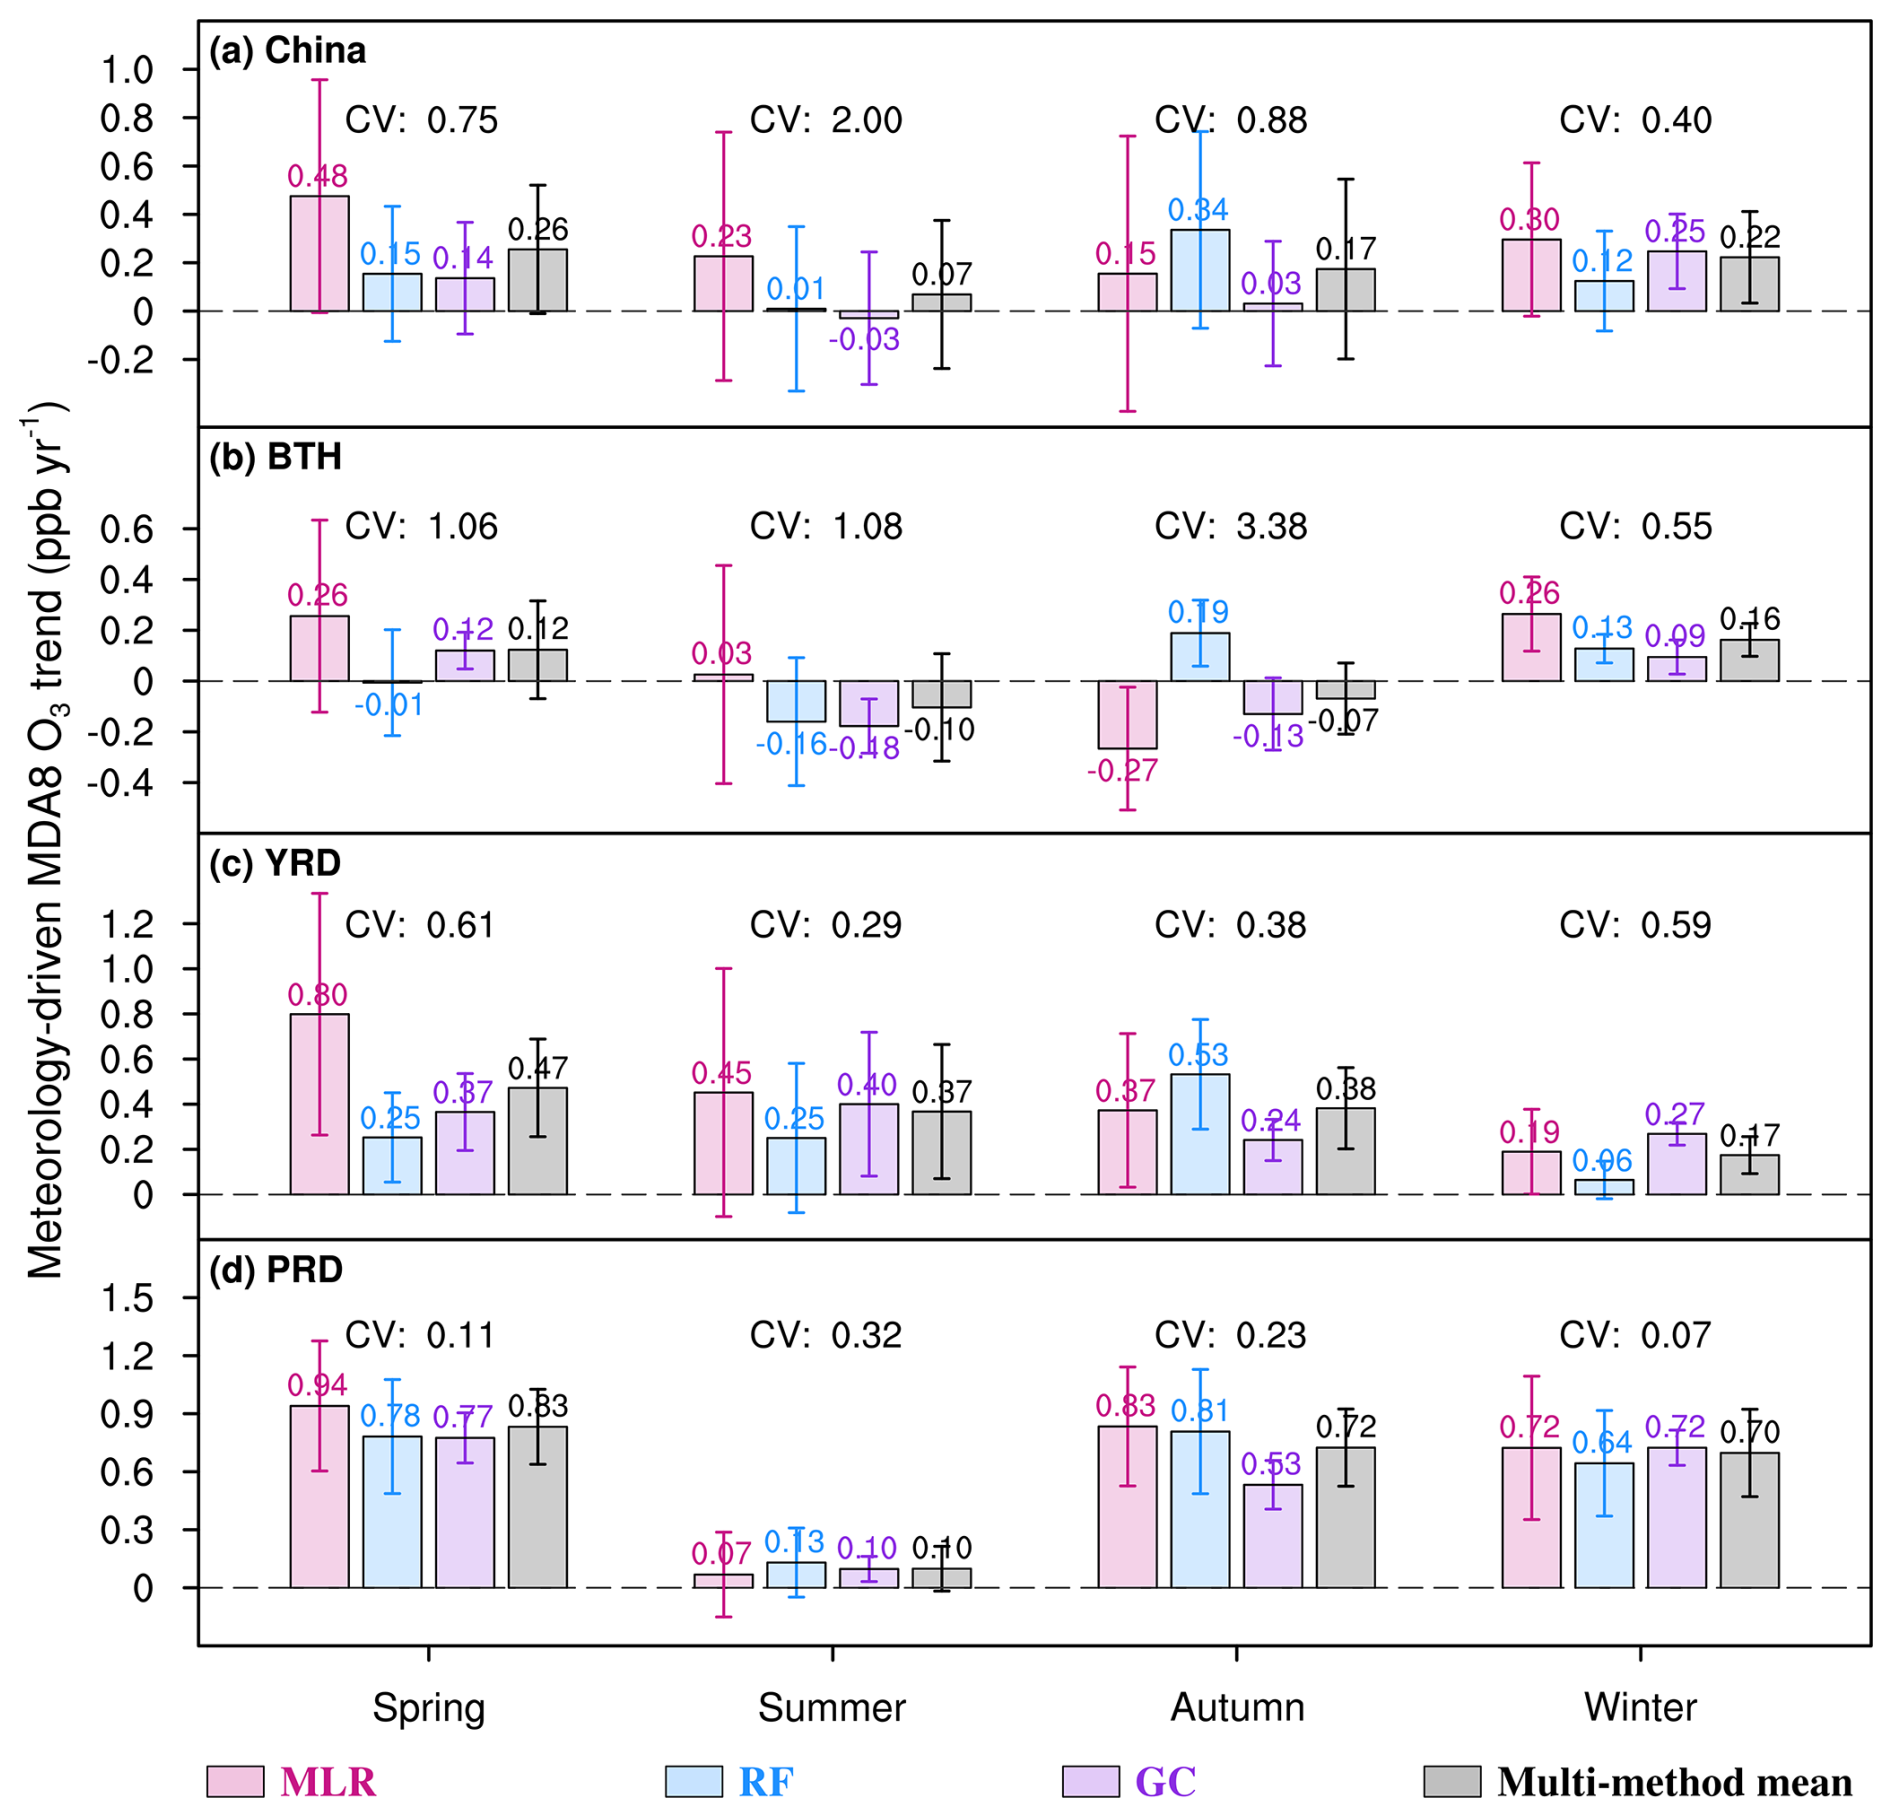
Figure 6Meteorology-driven MDA8 O3 trends in (a) the whole China, (b) BTH, (c) YRD, and (d) PRD during four seasons. Values in red, blue, and purple represent trends calculated by multiple linear regression (MLR), random forest (RF), and GEOS-Chem (GC) models, respectively. The fourth black bar represents the multi-method mean trend. Error bars indicate ± 1 standard deviation (SD) of site-level trends calculated from all available monitoring stations within each region. The absolute value of the coefficient of variation (CV) for each season is also shown.
In YRD and PRD, the three models exhibit strong agreement across all seasons, with a maximum CV of 0.61. The low uncertainties are further corroborated by consistent CV estimates derived under different RF's R2 thresholds (Table S3). Across these regions, where meteorology leads to an increase in O3 concentrations with multi-method mean trends of +0.17 (± 0.08) to +0.47 (± 0.22) ppb yr−1 in YRD and +0.10 (± 0.12) to +0.83 (± 0.19) ppb yr−1 in PRD. Notably, the most rapid meteorology-driven O3 increase is also observed in spring (Fig. 6c and d), which is consistent with Fig. 3c and d. Lu et al. (2024) also demonstrated a high degree of consistency among the MLR, ML, and GC models in PRD during summer. Specifically, all three models indicated that meteorology contributed approximately 25 % of O3 variability over the period 2013–2019. In BTH, the three models perform consistently well only in winter, with meteorology-driven O3 trends ranging from +0.09 (± 0.07) to +0.26 (± 0.15) ppb yr−1 and a CV of 0.55. It is also observed that in summer and autumn, meteorology plays a relatively small role in influencing O3 air quality despite the controversial results obtained by the three models (Fig. 6b). This finding aligns with a study focusing on the O3 air quality in BTH from 2015 to 2022 (Luo et al., 2024), which suggested that meteorological conditions tend to increase MDA8 O3 concentration by only 0.01 µg m−3 in summer and decrease MDA8 O3 concentration by 0.3 µg m−3 in autumn from 2015–2022.
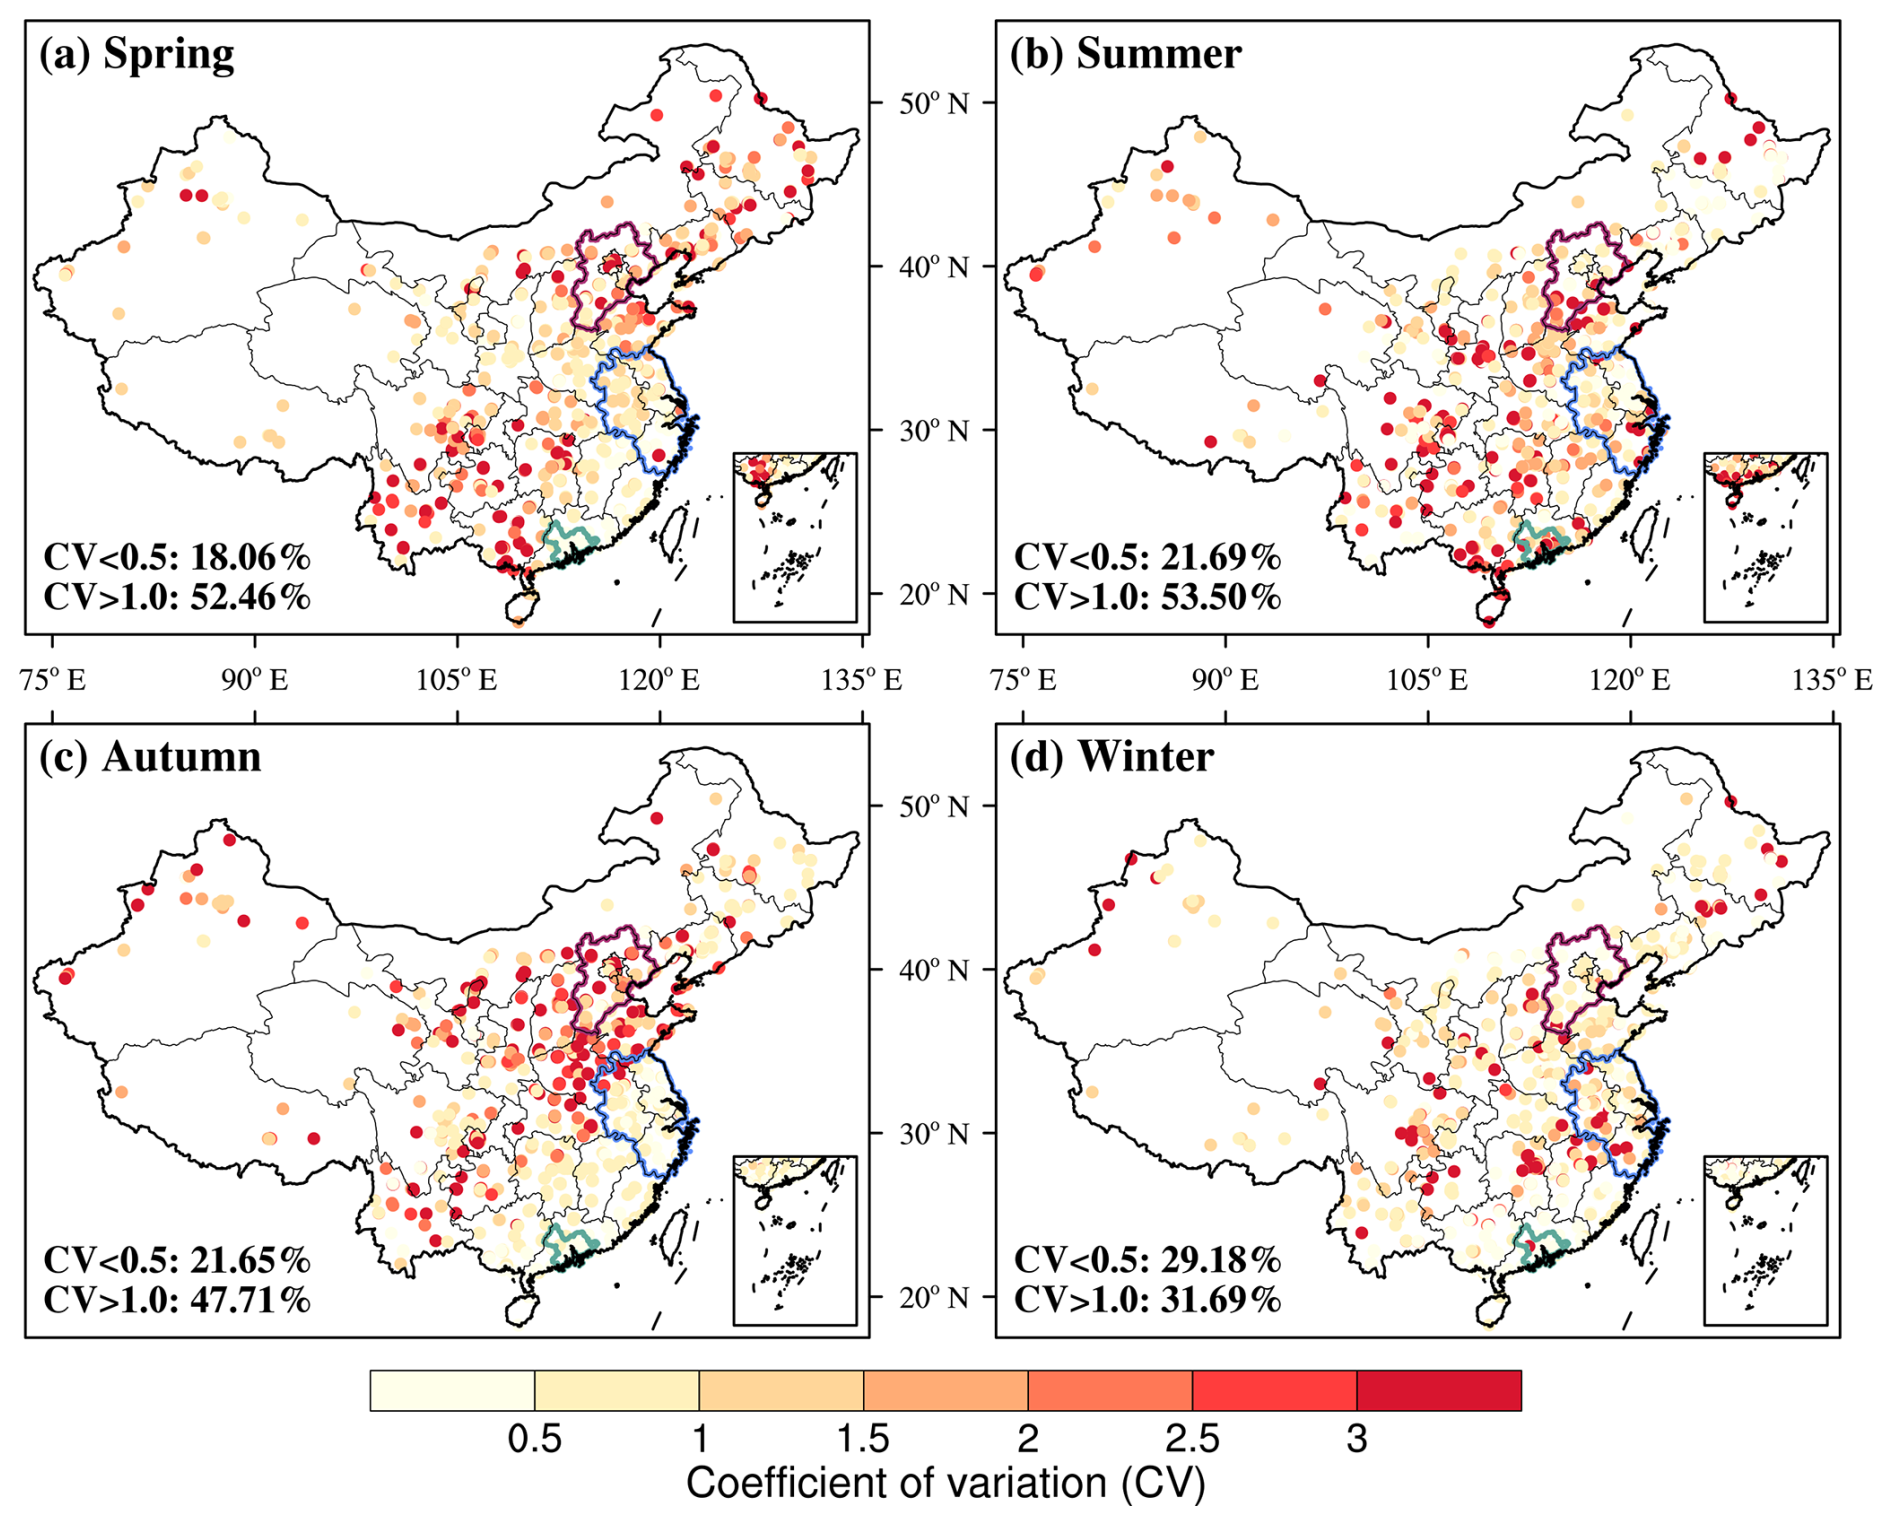
Figure 7The absolute value of the coefficient of variation (CV) for each state-controlled monitoring station in China during (a) spring, (b) summer, (c) autumn, and (d) winter. The CV is calculated by the standard deviation (SD) of the trends derived from multiple linear regression (MLR), random forest (RF), and GEOS-Chem (GC) models divided by the mean. The darker colour means the larger uncertainty in quantifying the meteorological impact on observed O3 trends. The proportion of state-control stations with CV less than 0.5 and greater than 1.0 is also presented. The outline marked in purple, blue, and green represents the region of BTH, YRD, and PRD, respectively.
In addition, Fig. 6 illustrates that the meteorology-driven O3 trends obtained from GC are relatively smaller. As shown in Fig. S3 and Table S5, this difference could partly be attributed to the higher O3 levels and lower O3 increases simulated by the GC model before 2018. The GC's systematic overestimation of O3 concentrations, as well as underestimation of O3 increases, was also reported by Lu et al. (2024), in which the GC captured 13.6 %–81.1 % of the observed O3 increases in China during the summer of 2000–2019. It is crucial to take into account the overestimation of low-level O3 observations, as noted in previous studies (Hu et al., 2024c; Mao et al., 2024). To validate this hypothesis, we compared the meteorology-driven O3 trends calculated by MLR with those calculated by GC from 2018–2022, and a higher agreement was found over 2018–2022 compared to the 2013–2022 period in Fig. S9. The trends driven by RF model are eclectic in more cases (Fig. 6) and recommended to isolate meteorological and anthropogenic drivers.
From a provincial perspective, as depicted in Fig. S10, the three models together indicate that meteorology causes an O3 increase in winter across almost all provinces except for Guizhou and Sichuan. In summer and autumn, meteorology leads to a decrease in 5 provinces, mainly in northeastern China, with trends ranging from −0.42 to −0.11 ppb yr−1. Interestingly, across all seasons, the three models introduce less uncertainty in the developed east coast regions such as Jiangsu, Fujian, and Guangdong compared to other provinces. This suggests that quantifying meteorological impact on O3 levels in these developed regions along the east coast of China is relatively reliable.
From the perspective of state-controlled stations, Fig. 7 shows the spatial distribution of the CV during four seasons. The lowest disparities in the meteorology-driven MDA8 O3 trends persist in winter, with CVs of less than 0.5 recorded at 29 % of the stations. In the other three seasons, however, significant discrepancies in meteorology-driven O3 trends are prominent, with CVs greater than 1.0 at least 48 % of the stations. Similar to Fig. 4, it is noteworthy that in autumn, the uncertainties caused by multi-method are more pronounced in the northern regions compared to the southern regions.
While this study advances understanding of meteorological contributions to O3 trends, several limitations warrant attention in future work. Though the reanalysis meteorological dataset is generated observationally, inherent constraints exist, including parameterization uncertainties affecting O3-relevant physical processes (Janjić et al., 2018; Davidson and Millstein, 2022) and resolution constraints.
Regarding analytical approaches, machine learning efficiently captures nonlinear O3-meteorology relationships without requiring explicit physicochemical parameterizations, enabling scalable multi-site analysis. However, its inability to resolve chemical mechanisms and sensitivity to predictor selection remain key constraints. Conversely, while GC mechanistically resolves chemistry-transport interactions and enables source attribution, it propagates uncertainties from emission inventories and chemical mechanisms into trend estimates.
Future studies could be improved in the following ways: First, more meteorological datasets and methods should be used to provide more robust uncertainty quantification in O3-meteorology analyses. Second, implementing clustering techniques (e.g. K-means algorithm) could identify sub-regional drivers at ecotones, enhancing spatial resolution beyond our regional framework. Finally, the Lindeman-Merenda-Gold indices can be employed to quantitatively resolve the contributions of specific meteorological variables. The mechanistic understanding of O3 drivers would be improved by integrating additional variables, such as solar radiation, soil moisture, and climate indices (e.g. El Niño-Southern Oscillation). Clustering techniques would be valuable to augment the region-based approach and would provide better understanding of the similarity between stations.
This study used the 10-year (2013–2022) surface O3 observations to clarify O3 variations during four seasons in China, and quantify the meteorological impacts on O3 trends, with a special focus on the uncertainties of meteorology-driven O3 trends. Diverse meteorological datasets (ERA5, MERRA2, FNL) and analytical methods (MLR, RF, GEOS-Chem) were employed to systematically analyse the uncertainties in meteorology-driven O3 trends caused by multi-dataset and multi-method which have not been assessed before. The coefficient of variation (CV) was adopted as a metric to assess the uncertainty. The main conclusions are as follows:
Over the past decade, increasing trends in MDA8 O3 were observed at over 78 % of state-controlled stations across all seasons, with the national trend of +1.31, +0.93, +0.79, and +0.80 ppb yr−1 in spring, summer, autumn, and winter, respectively.
We first applied the MLR model (driven by ERA5, MERRA2, and FNL, respectively), which has proven its usefulness and reliability in O3-Meteorology analyses, to assess uncertainties caused by multi-dataset. For the whole China, all three dataset-driven MLR models indicate that meteorological conditions have led to an increase in MDA8 O3 concentrations in four seasons, with multi-dataset mean trends ranging from +0.19 to +0.55 ppb yr−1. The models driven by different meteorological datasets showed a maximum meteorology-driven O3 trend of +0.55 ppb yr−1 with the highest consistency (CV = 0.25) in spring. The FNL-driven model always obtained larger meteorology-driven O3 trends compared to the models driven by ERA5 and MERRA2, which could be attributed to the inability to accurately evaluate PBLH in the FNL dataset. The dominant influence of anthropogenic emissions on O3 increase was also identified, highlighting the need for more stringent emission control policies to mitigate the adverse effects of meteorological conditions.
We further applied the MLR, RF, and GEOS-Chem models to obtain the meteorological influence on O3 trends to explore the uncertainties caused by multi-method. In China and three megacity clusters, the three methods consistently indicated positive meteorological contributions to O3 increases during spring and winter, with multi-method mean trends ranging from +0.12 to +0.83 ppb yr−1 and +0.17 to +0.70 ppb yr−1, respectively. In summer and autumn, especially in BTH, where the meteorological influence was relatively lower, three methods gave conflicting predictions of meteorological influence on O3 with CVs greater than 1.08. For the whole China, three different methods demonstrated optimal consistency in winter with a CV of 0.40 and the worst consistency in summer with a CV of 2.00. The meteorology-driven O3 trends obtained from GEOS-Chem model were almost relatively smaller than those obtained by other two methods, which could partly be attributed to the higher O3 values simulated by the GEOS-Chem model before 2018.
All analyses driven by diverse meteorological datasets and analytical methods drew a consistent finding: meteorological conditions almost contribute to O3 increase across all seasons. The uncertainties of meteorology-driven O3 trends caused by different analytical methods were larger than those caused by diverse meteorological datasets. Considering that the favourable effects of meteorology on O3 pollution tend to be weaker after 2019 and the effects of COVID-19, it is necessary to conduct research over different periods and longer periods. In addition, further research is needed to focus on the meteorological contributions to O3 trends in northern China due to larger uncertainties.
The surface O3 observations are obtained from https://quotsoft.net/air/ (last access: 22 October 2025). The ERA5, MERRA2, FNL, and FNL025 reanalysis meteorological data are taken from https://cds.climate.copernicus.eu/datasets (last access: 22 October 2025), http://geoschemdata.wustl.edu/ExtData/GEOS_0.5x0.625/MERRA2/ (last access: 22 October 2025), https://rda.ucar.edu/datasets/d083002/ (last access: 22 October 2025), and https://rda.ucar.edu/datasets/ds083-3/ (last access: 22 October 2025), respectively. The code of the GEOS-Chem (version 13.3.3) model is available at https://zenodo.org/records/5748260 (The International GEOS-Chem User Community, 2021). The MDA8 O3 observations and analytical results derived from MLR, RF, and GEOS-Chem can be obtained from https://doi.org/10.5281/zenodo.15859027 (Wang and Zhu, 2025).
The supplement related to this article is available online at https://doi.org/10.5194/acp-25-13863-2025-supplement.
JZ designed the research, and XW performed simulations and analysed the results. GJ, XC, and ZY helped with the model simulations. LC, XJ, and HL provided useful comments on the paper. XW and JZ wrote the paper with contributions from all co-authors.
The contact author has declared that none of the authors has any competing interests.
Publisher’s note: Copernicus Publications remains neutral with regard to jurisdictional claims made in the text, published maps, institutional affiliations, or any other geographical representation in this paper. While Copernicus Publications makes every effort to include appropriate place names, the final responsibility lies with the authors. Also, please note that this paper has not received English language copy-editing. Views expressed in the text are those of the authors and do not necessarily reflect the views of the publisher.
The author Xueqing Wang would like to thank Zhenze Liu from Nanjing University of Information Science and Technology, and Yongqi Zhao from Institute of Atmospheric Physics, Chinese Academy of Sciences, for their help in analysing the research results. We also thank the anonymous reviewers for their constructive suggestions that helped improve the paper.
This research has been supported by National Key Research and Development Program of China (no. 2022YFE0136100), National Nature Science Foundation of China (nos. 42293323, 42007195, 42305121), and State Environmental Protection Key Laboratory of Sources and Control of Air Pollution Complex (no. SCAPC202114).
This paper was edited by Jason West and reviewed by two anonymous referees.
Bedeian, A. G. and Mossholder, K. W.: On the use of the coefficient of variation as a measure of diversity, Organ. Res. Methods, 3, 285–297, https://doi.org/10.1177/109442810033005, 2000.
Breiman, L.: Random forests, Mach. Learn., 45, 5–32, https://doi.org/10.1023/A:1010933404324, 2001.
Cao, T., Wang, H., Li, L., Lu, X., Liu, Y., and Fan, S.: Fast spreading of surface ozone in both temporal and spatial scale in Pearl River Delta, J. Environ. Sci., 137, 540–552, https://doi.org/10.1016/j.jes.2023.02.025, 2024a.
Cao, T., Wang, H., Chen, X., Li, L., Lu, X., Lu, K., and Fan, S.: Rapid increase in spring ozone in the Pearl River Delta, China during 2013–2022, npj Clim. Atmos. Sci., 7, 309, https://doi.org/10.1038/s41612-024-00847-3, 2024b.
Chattamvelli, R. and Shanmugam, R.: Measures of Spread, in: Descriptive Statistics for Scientists and Engineers. Synthesis Lectures on Mathematics & Statistics, Springer, Cham. https://doi.org/10.1007/978-3-031-32330-0_3, 2023.
Chen, L., Gao, Y., Zhang, M., Fu, J. S., Zhu, J., Liao, H., Li, J., Huang, K., Ge, B., Wang, X., Lam, Y. F., Lin, C.-Y., Itahashi, S., Nagashima, T., Kajino, M., Yamaji, K., Wang, Z., and Kurokawa, J.: MICS-Asia III: multi-model comparison and evaluation of aerosol over East Asia, Atmos. Chem. Phys., 19, 11911–11937, https://doi.org/10.5194/acp-19-11911-2019, 2019.
Chen, L., Zhu, J., Liao, H., Yang, Y., and Yue, X.: Meteorological influences on PM2.5 and O3 trends and associated health burden since China's clean air actions, Sci. Total Environ., 744, 140837, https://doi.org/10.1016/j.scitotenv.2020.140837, 2020.
Dai, H., Liao, H., Wang, Y., and Qian, J.: Co-occurrence of ozone and PM2.5 pollution in urban/non-urban areas in eastern China from 2013 to 2020: roles of meteorology and anthropogenic emissions, Sci. Total Environ., 924, 171687, https://doi.org/10.1016/j.scitotenv.2024.171687, 2024.
Dang, R., Liao, H., and Fu, Y.: Quantifying the anthropogenic and meteorological influences on summertime surface ozone in China over 2012–2017, Sci. Total Environ., 754, 142394, https://doi.org/10.1016/j.scitotenv.2020.142394, 2021.
Davidson, M. R. and Millstein, D.: Limitations of reanalysis data for wind power applications, Wind Energy, 25, 1646–1653, https://doi.org/10.1002/we.2759, 2022.
Ding, J., Dai, Q., Fan, W., Lu, M., Zhang, Y., Han, S., and Feng, Y.: Impacts of meteorology and precursor emission change on O3 variation in Tianjin, China from 2015 to 2021, J. Environ. Sci., 126, 506–516, https://doi.org/10.1016/j.jes.2022.03.010, 2023.
Eskridge, R. E., Ku, J. Y., Rao, S. T., Porter, P. S., and Zurbenko, I. G.: Separating different scales of motion in time series of meteorological variables, Bull. Am. Meteorol. Soc., 78, 1473–1483, https://doi.org/10.1175/1520-0477(1997)078<1473:SDSOMI>2.0.CO;2, 1997.
Gao, M., Wang, F., Ding, Y., Wu, Z., Xu, Y., Lu, X., Wang, Z., Carmichael, G. R., and McElroy, M. B.: Large-scale climate patterns offer preseasonal hints on the co-occurrence of heat wave and O3 pollution in China, P. Natl. Acad. Sci. USA, 120, e2218274120, https://doi.org/10.1073/pnas.2218274120, 2023.
Gong, S., Zhang, L., Liu, C., Lu, S., Pan, W., and Zhang, Y.: Multi-scale analysis of the impacts of meteorology and emissions on PM2.5 and O3 trends at various regions in China from 2013 to 2020 2. Key weather elements and emissions, Sci. Total Environ., 824, 153847, https://doi.org/10.1016/j.scitotenv.2022.153847, 2022.
Grange, S. K., Carslaw, D. C., Lewis, A. C., Boleti, E., and Hueglin, C.: Random forest meteorological normalisation models for Swiss PM10 trend analysis, Atmos. Chem. Phys., 18, 6223–6239, https://doi.org/10.5194/acp-18-6223-2018, 2018.
Guo, J., Zhang, J., Yang, K., Liao, H., Zhang, S., Huang, K., Lv, Y., Shao, J., Yu, T., Tong, B., Li, J., Su, T., Yim, S. H. L., Stoffelen, A., Zhai, P., and Xu, X.: Investigation of near-global daytime boundary layer height using high-resolution radiosondes: first results and comparison with ERA5, MERRA-2, JRA-55, and NCEP-2 reanalyses, Atmos. Chem. Phys., 21, 17079–17097, https://doi.org/10.5194/acp-21-17079-2021, 2021.
Han, H., Liu, J., Shu, L., Wang, T., and Yuan, H.: Local and synoptic meteorological influences on daily variability in summertime surface ozone in eastern China, Atmos. Chem. Phys., 20, 203–222, https://doi.org/10.5194/acp-20-203-2020, 2020.
He, X., Leng, C., Pang, S., and Zhang, Y.: Kinetics study of heterogeneous reactions of ozone with unsaturated fatty acid single droplets using micro-FTIR spectroscopy, RSC Adv., 7, 3204–3213, https://doi.org/10.1039/C6RA25255A, 2017.
Högel, J., Schmid, W., and Gaus, W.: Robustness of the standard deviation and other measures of dispersion, Biom. J., 36, 411–427, https://doi.org/10.1002/bimj.4710360403, 1994.
Hu, F., Xie, P., Xu, J., Lv, Y., Zhang, Z., Zheng, J., and Tian, X.: Long-term trends of ozone in the Yangtze River Delta, China: spatiotemporal impacts of meteorological factors, local, and non-local emissions, J. Environ. Sci., 156, S1001074224003826, https://doi.org/10.1016/j.jes.2024.07.017, 2024a.
Hu, T., Lin, Y., Liu, R., Xu, Y., Ouyang, S., Wang, B., Zhang, Y., and Liu, S. C.: What caused large ozone variabilities in three megacity clusters in eastern China during 2015–2020?, Atmos. Chem. Phys., 24, 1607–1626, https://doi.org/10.5194/acp-24-1607-2024, 2024b.
Hu, W., Zhao, Y., Lu, N., Wang, X., Zheng, B., Henze, D. K., Zhang, L., Fu, T.-M., and Zhai, S.: Changing Responses of PM2.5 and Ozone to Source Emissions in the Yangtze River Delta Using the Adjoint Model, Environ. Sci. Technol., 58, 628–638, https://doi.org/10.1021/acs.est.3c05049, 2024c.
Janjić, T., Bormann, N., Bocquet, M., Carton, J. A., Cohn, S. E., Dance, S. L., Losa, S. N., Nichols, N. K., Potthast, R., Waller, J. A., and Weston, P.: On the representation error in data assimilation, Q. J. R. Meteorolog. Soc., 144, 1257–1278, https://doi.org/10.1002/qj.3130, 2018.
Ji, X., Chen, G., Chen, J., Xu, L., Lin, Z., Zhang, K., Fan, X., Li, M., Zhang, F., Wang, H., Huang, Z., and Hong, Y.: Meteorological impacts on the unexpected ozone pollution in coastal cities of China during the unprecedented hot summer of 2022, Sci. Total Environ., 914, 170035, https://doi.org/10.1016/j.scitotenv.2024.170035, 2024.
Li, K., Jacob, D. J., Liao, H., Shen, L., Zhang, Q., and Bates, K. H.: Anthropogenic drivers of 2013–2017 trends in summer surface ozone in China, P. Natl. Acad. Sci. USA, 116, 422–427, https://doi.org/10.1073/pnas.1812168116, 2019.
Li, K., Jacob, D. J., Shen, L., Lu, X., De Smedt, I., and Liao, H.: Increases in surface ozone pollution in China from 2013 to 2019: anthropogenic and meteorological influences, Atmos. Chem. Phys., 20, 11423–11433, https://doi.org/10.5194/acp-20-11423-2020, 2020.
Li, K., Jacob, D. J., Liao, H., Qiu, Y., Shen, L., Zhai, S., Bates, K. H., Sulprizio, M. P., Song, S., Lu, X., Zhang, Q., Zheng, B., Zhang, Y., Zhang, J., Lee, H. C., and Kuk, S. K.: Ozone pollution in the north China plain spreading into the late-winter haze season, P. Natl. Acad. Sci. USA, 118, e2015797118, https://doi.org/10.1073/pnas.2015797118, 2021.
Li, X., Yuan, B., Parrish, D. D., Chen, D., Song, Y., Yang, S., Liu, Z., and Shao, M.: Long-term trend of ozone in southern China reveals future mitigation strategy for air pollution, Atmos. Environ., 269, 118869, https://doi.org/10.1016/j.atmosenv.2021.118869, 2022.
Lin, C., Lau, A. K. H., Fung, J. C. H., Song, Y., Li, Y., Tao, M., Lu, X., Ma, J., and Lao, X. Q.: Removing the effects of meteorological factors on changes in nitrogen dioxide and ozone concentrations in China from 2013 to 2020, Sci. Total Environ., 793, 148575, https://doi.org/10.1016/j.scitotenv.2021.148575, 2021a.
Lin, H., Jacob, D. J., Lundgren, E. W., Sulprizio, M. P., Keller, C. A., Fritz, T. M., Eastham, S. D., Emmons, L. K., Campbell, P. C., Baker, B., Saylor, R. D., and Montuoro, R.: Harmonized Emissions Component (HEMCO) 3.0 as a versatile emissions component for atmospheric models: application in the GEOS-Chem, NASA GEOS, WRF-GC, CESM2, NOAA GEFS-Aerosol, and NOAA UFS models, Geosci. Model Dev., 14, 5487–5506, https://doi.org/10.5194/gmd-14-5487-2021, 2021b.
Liu, Y. and Wang, T.: Worsening urban ozone pollution in China from 2013 to 2017 – Part 1: the complex and varying roles of meteorology, Atmos. Chem. Phys., 20, 6305–6321, https://doi.org/10.5194/acp-20-6305-2020, 2020a.
Liu, Y. and Wang, T.: Worsening urban ozone pollution in China from 2013 to 2017 – Part 2: the effects of emission changes and implications for multi-pollutant control, Atmos. Chem. Phys., 20, 6323–6337, https://doi.org/10.5194/acp-20-6323-2020, 2020b.
Liu, Y., Geng, G., Cheng, J., Liu, Y., Xiao, Q., Liu, L., Shi, Q., Tong, D., He, K., and Zhang, Q.: Drivers of Increasing Ozone during the Two Phases of Clean Air Actions in China 2013–2020, Environ. Sci. Technol., 57, 8954–8964, https://doi.org/10.1021/acs.est.3c00054, 2023.
Lu, X., Zhang, L., Chen, Y., Zhou, M., Zheng, B., Li, K., Liu, Y., Lin, J., Fu, T.-M., and Zhang, Q.: Exploring 2016–2017 surface ozone pollution over China: source contributions and meteorological influences, Atmos. Chem. Phys., 19, 8339–8361, https://doi.org/10.5194/acp-19-8339-2019, 2019a.
Lu, X., Zhang, L., and Shen, L.: Meteorology and Climate Influences on Tropospheric Ozone: a Review of Natural Sources, Chemistry, and Transport Patterns, Curr. Pollut. Rep., 5, 238–260, https://doi.org/10.1007/s40726-019-00118-3, 2019b.
Lu, X., Liu, Y., Su, J., Weng, X., Ansari, T., Zhang, Y., He, G., Zhu, Y., Wang, H., Zeng, G., Li, J., He, C., Li, S., Amnuaylojaroen, T., Butler, T., Fan, Q., Fan, S., Forster, G. L., Gao, M., Hu, J., Kanaya, Y., Latif, M. T., Lu, K., Nédélec, P., Nowack, P., Sauvage, B., Xu, X., Zhang, L., Li, K., Koo, J.-H., and Nagashima, T.: Tropospheric ozone trends and attributions over East and Southeast Asia in 1995–2019: An integrated assessment using statistical methods, machine learning models, and multiple chemical transport models, EGUsphere [preprint], https://doi.org/10.5194/egusphere-2024-3702, 2024.
Luo, Z., Lu, P., Chen, Z., and Liu, R.: Ozone Concentration Estimation and Meteorological Impact Quantification in the Beijing-Tianjin-Hebei Region Based on Machine Learning Models, Earth Space Sci., 11, e2023EA003346, https://doi.org/10.1029/2023EA003346, 2024.
Lyu, X., Li, K., Guo, H., Morawska, L., Zhou, B., Zeren, Y., Jiang, F., Chen, C., Goldstein, A. H., Xu, X., Wang, T., Lu, X., Zhu, T., Querol, X., Chatani, S., Latif, M. T., Schuch, D., Sinha, V., Kumar, P., Mullins, B., Seguel, R., Shao, M., Xue, L., Wang, N., Chen, J., Gao, J., Chai, F., Simpson, I., Sinha, B., and Blake, D. R.: A synergistic ozone-climate control to address emerging ozone pollution challenges, One Earth, 6, 964–977, https://doi.org/10.1016/j.oneear.2023.07.004, 2023.
Mao, Y., Shang, Y., Liao, H., Cao, H., Qu, Z., and Henze, D. K.: Sensitivities of ozone to its precursors during heavy ozone pollution events in the Yangtze River Delta using the adjoint method, Sci. Total Environ., 925, 171585, https://doi.org/10.1016/j.scitotenv.2024.171585, 2024.
Mousavinezhad, S., Choi, Y., Pouyaei, A., Ghahremanloo, M., and Nelson, D. L.: A comprehensive investigation of surface ozone pollution in China, 2015–2019: separating the contributions from meteorology and precursor emissions, Atmos. Res., 257, 105599, https://doi.org/10.1016/j.atmosres.2021.105599, 2021.
Ni, Y., Yang, Y., Wang, H., Li, H., Li, M., Wang, P., Li, K., and Liao, H.: Contrasting changes in ozone during 2019–2021 between eastern and the other regions of China attributed to anthropogenic emissions and meteorological conditions, Sci. Total Environ., 908, 168272, https://doi.org/10.1016/j.scitotenv.2023.168272, 2024.
Pan, W., Gong, S., Lu, K., Zhang, L., Xie, S., Liu, Y., Ke, H., Zhang, X., and Zhang, Y.: Multi-scale analysis of the impacts of meteorology and emissions on PM2.5 and O3 trends at various regions in China from 2013 to 2020 3. Mechanism assessment of O3 trends by a model, Sci. Total Environ., 857, 159592, https://doi.org/10.1016/j.scitotenv.2022.159592, 2023.
Qi, G., Che, J., and Wang, Z.: Differential effects of urbanization on air pollution: evidences from six air pollutants in mainland China, Ecol. Indic., 146, 109924, https://doi.org/10.1016/j.ecolind.2023.109924, 2023.
Qian, J., Liao, H., Yang, Y., Li, K., Chen, L., and Zhu, J.: Meteorological influences on daily variation and trend of summertime surface ozone over years of 2015–2020: Quantification for cities in the Yangtze River Delta, Sci. Total Environ., 834, 155107, https://doi.org/10.1016/j.scitotenv.2022.155107, 2022.
Qiao, W., Li, K., Yang, Z., Chen, L., and Liao, H.: Implications of the extremely hot summer of 2022 on urban ozone control in China, Atmospheric and Oceanic Science Letters, 17, 100470, https://doi.org/10.1016/j.aosl.2024.100470, 2024.
Rao, S. T. and Zurbenko, I. G.: Detecting and tracking changes in ozone air quality, Air Waste, 44, 1089–1092, https://doi.org/10.1080/10473289.1994.10467303, 1994.
Ren, J., Guo, F., and Xie, S.: Diagnosing ozone–NOx–VOC sensitivity and revealing causes of ozone increases in China based on 2013–2021 satellite retrievals, Atmos. Chem. Phys., 22, 15035–15047, https://doi.org/10.5194/acp-22-15035-2022, 2022.
Sadeghi, B., Ghahremanloo, M., Mousavinezhad, S., Lops, Y., Pouyaei, A., and Choi, Y.: Contributions of meteorology to ozone variations: Application of deep learning and the Kolmogorov-Zurbenko filter, Environ. Pollut., 310, 119863, https://doi.org/10.1016/j.envpol.2022.119863, 2022.
Shang, N., Gui, K., Zhao, H., Yao, W., Zhao, H., Zhang, X., Zhang, X., Li, L., Zheng, Y., Wang, Z., Wang, Y., Che, H., and Zhang, X.: Decomposition of meteorological and anthropogenic contributions to near-surface ozone trends in Northeast China (2013–2021), Atmos. Pollut. Res., 14, 101841, https://doi.org/10.1016/j.apr.2023.101841, 2023.
Shen, F., Zhang, L., Jiang, L., Tang, M., Gai, X., Chen, M., and Ge, X.: Temporal variations of six ambient criteria air pollutants from 2015 to 2018, their spatial distributions, health risks and relationships with socioeconomic factors during 2018 in China, Environ. Int., 137, 105556, https://doi.org/10.1016/j.envint.2020.105556, 2020.
Shen, L., Liu, J., Zhao, T., Xu, X., Han, H., Wang, H., and Shu, Z.: Atmospheric transport drives regional interactions of ozone pollution in China, Sci. Total Environ., 830, 154634, https://doi.org/10.1016/j.scitotenv.2022.154634, 2022.
Sun, Y., Yin, H., Lu, X., Notholt, J., Palm, M., Liu, C., Tian, Y., and Zheng, B.: The drivers and health risks of unexpected surface ozone enhancements over the Sichuan Basin, China, in 2020, Atmos. Chem. Phys., 21, 18589–18608, https://doi.org/10.5194/acp-21-18589-2021, 2021.
The International GEOS-Chem User Community: geoschem/GCClassic: GEOS-Chem 13.3.3 (13.3.3), Zenodo [code], https://doi.org/10.5281/zenodo.5748260, 2021.
Vu, T. V., Shi, Z., Cheng, J., Zhang, Q., He, K., Wang, S., and Harrison, R. M.: Assessing the impact of clean air action on air quality trends in Beijing using a machine learning technique, Atmos. Chem. Phys., 19, 11303–11314, https://doi.org/10.5194/acp-19-11303-2019, 2019.
Wang, M., Chen, X., Jiang, Z., He, T.-L., Jones, D., Liu, J., and Shen, Y.: Meteorological and anthropogenic drivers of surface ozone change in the North China Plain in 2015–2021, Sci. Total Environ., 906, 167763, https://doi.org/10.1016/j.scitotenv.2023.167763, 2024a.
Wang, P.: China's air pollution policies: progress and challenges, Curr. Opin. Environ. Sci. Health, 19, 100227, https://doi.org/10.1016/j.coesh.2020.100227, 2021.
Wang, T., Li, N., Li, Y., Lin, H., Yao, N., Chen, X., Li Liu, D., Yu, Q., and Feng, H.: Impact of climate variability on grain yields of spring and summer maize, Comput. Electron. Agric., 199, 107101, https://doi.org/10.1016/j.compag.2022.107101, 2022a.
Wang, T., Xue, L., Brimblecombe, P., Lam, Y. F., Li, L., and Zhang, L.: Ozone pollution in China: a review of concentrations, meteorological influences, chemical precursors, and effects, Sci. Total Environ., 575, 1582–1596, https://doi.org/10.1016/j.scitotenv.2016.10.081, 2017.
Wang, W., Parrish, D. D., Wang, S., Bao, F., Ni, R., Li, X., Yang, S., Wang, H., Cheng, Y., and Su, H.: Long-term trend of ozone pollution in China during 2014–2020: distinct seasonal and spatial characteristics and ozone sensitivity, Atmos. Chem. Phys., 22, 8935–8949, https://doi.org/10.5194/acp-22-8935-2022, 2022b.
Wang, X., Jiang, L., Guo, Z., Xie, X., Li, L., Gong, K., and Hu, J.: Influence of meteorological reanalysis field on air quality modeling in the Yangtze River Delta, China, Atmos. Environ., 318, 120231, https://doi.org/10.1016/j.atmosenv.2023.120231, 2024b.
Wang, X. and Zhu, J.: Meteorological influence on surface ozone trends in China: Assessing uncertainties caused by multi-dataset and multi-method, Zenodo [data set], https://doi.org/10.5281/zenodo.16916245, 2025.
Wang, X., Zhu, J., Li, K., Chen, L., Yang, Y., Zhao, Y., Yue, X., Gu, Y., and Liao, H.: Meteorology-driven trends in PM2.5 concentrations and related health burden over India, Atmos. Res., 308, 107548, https://doi.org/10.1016/j.atmosres.2024.107548, 2024c.
Wang, Y., Zhao, Y., Liu, Y., Jiang, Y., Zheng, B., Xing, J., Liu, Y., Wang, S., and Nielsen, C. P.: Sustained emission reductions have restrained the ozone pollution over China, Nat. Geosci., 16, 967–974, https://doi.org/10.1038/s41561-023-01284-2, 2023.
Weng, X., Forster, G. L., and Nowack, P.: A machine learning approach to quantify meteorological drivers of ozone pollution in China from 2015 to 2019, Atmos. Chem. Phys., 22, 8385–8402, https://doi.org/10.5194/acp-22-8385-2022, 2022.
Weng, X., Li, J., Forster, G. L., and Nowack, P.: Large modeling uncertainty in projecting decadal surface ozone changes over city clusters of China, Geophys. Res. Lett., 50, e2023GL103241, https://doi.org/10.1029/2023GL103241, 2023.
Wise, E. K. and Comrie, A. C.: Extending the Kolmogorov–Zurbenko Filter: Application to Ozone, Particulate Matter, and Meteorological Trends, J. Air Waste Manage. Assoc., 55, 1208–1216, https://doi.org/10.1080/10473289.2005.10464718, 2005.
Yan, D., Jin, Z., Zhou, Y., Li, M., Zhang, Z., Wang, T., Zhuang, B., Li, S., and Xie, M.: Anthropogenically and meteorologically modulated summertime ozone trends and their health implications since China's clean air actions, Environ. Pollut., 343, 123234, https://doi.org/10.1016/j.envpol.2023.123234, 2024.
Yao, T., Ye, H., Wang, Y., Zhang, J., Guo, J., and Li, J.: Kolmogorov-Zurbenko filter coupled with machine learning to reveal multiple drivers of surface ozone pollution in China from 2015 to 2022, Sci. Total Environ., 949, 175093, https://doi.org/10.1016/j.scitotenv.2024.175093, 2024.
Yin, H., Lu, X., Sun, Y., Li, K., Gao, M., Zheng, B., and Liu, C.: Unprecedented decline in summertime surface ozone over eastern China in 2020 comparably attributable to anthropogenic emission reductions and meteorology, Environ. Res. Lett., 16, 124069, https://doi.org/10.1088/1748-9326/ac3e22, 2021.
Zhai, S., Jacob, D. J., Wang, X., Liu, Z., Wen, T., Shah, V., Li, K., Moch, J. M., Bates, K. H., Song, S., Shen, L., Zhang, Y., Luo, G., Yu, F., Sun, Y., Wang, L., Qi, M., Tao, J., Gui, K., Xu, H., Zhang, Q., Zhao, T., Wang, Y., Lee, H. C., Choi, H., and Liao, H.: Control of particulate nitrate air pollution in China, Nat. Geosci., 14, 389–395, https://doi.org/10.1038/s41561-021-00726-z, 2021.
Zhang, L., Wang, L., Liu, B., Tang, G., Liu, B., Li, X., Sun, Y., Li, M., Chen, X., Wang, Y., and Hu, B.: Contrasting effects of clean air actions on surface ozone concentrations in different regions over Beijing from May to September 2013–2020, Sci. Total Environ., 903, 166182, https://doi.org/10.1016/j.scitotenv.2023.166182, 2023.
Zhang, Y., Lei, R., Cui, S., Wang, H., Chen, M., and Ge, X.: Spatiotemporal trends and impact factors of PM2.5 and O3 pollution in major cities in China during 2015–2020, Chin. Sci. Bull., 67, 2029–2042, https://doi.org/10.1360/TB-2021-0767, 2022a.
Zhang, Z., Xu, B., Xu, W., Wang, F., Gao, J., Li, Y., Li, M., Feng, Y., and Shi, G.: Machine learning combined with the PMF model reveal the synergistic effects of sources and meteorological factors on PM2.5 pollution, Environ. Res., 212, 113322, https://doi.org/10.1016/j.envres.2022.113322, 2022b.
Zhao, S., Yin, D., Yu, Y., Kang, S., Qin, D., and Dong, L.: PM2.5 and O3 pollution during 2015–2019 over 367 Chinese cities: spatiotemporal variations, meteorological and topographical impacts, Environ. Pollut., 264, 114694, https://doi.org/10.1016/j.envpol.2020.114694, 2020.
Zuo, C., Chen, J., Zhang, Y., Jiang, Y., Liu, M., Liu, H., Zhao, W., and Yan, X.: Evaluation of four meteorological reanalysis datasets for satellite-based PM2.5 retrieval over China, Atmos. Environ., 305, 119795, https://doi.org/10.1016/j.atmosenv.2023.119795, 2023.