the Creative Commons Attribution 4.0 License.
the Creative Commons Attribution 4.0 License.
 | 26 Oct 2025
Long-term Trends in PM2.5 Chemical Composition and Its Impact on Aerosol Properties: Field Observations from 2007 to 2020 in Pearl River Delta, South China
Yunfeng He
Quanfu He
Yuqing Zhang
Duohong Chen
Tao Zhang
Kong Yang
Junqi Wang
Qian Cheng
Hao Jiang
Zirui Wang
Ping Liu
Xinming Wang
Michael Boy
Long-term data on PM2.5 chemical composition provide essential information for evaluating the effectiveness of air pollution control measures and understanding the evolving mechanisms of secondary species formation in the real atmosphere. This study presented field measurements of PM2.5 and its chemical composition at a regional background site in the Pearl River Delta (PRD) from 2007 to 2020. PM2.5 concentration declined significantly from 87.1 ± 15.5 to 34.0 ± 11.3 µg m−3 (−4.0 µg m−3 yr−1). The proportion of secondary species increased from 57 % to 73 % with the improvement in air quality. Among these species, sulfate (SO) showed a sharp decline, while nitrate (NO) exhibited a moderate decrease. Consequently, the proportion of NO in 2020 doubled relative to 2007. In addition, we further found that SO reduction (−10 % yr−1) lagged behind SO2 reduction (−13 % yr−1), while NO reduction (−6 % yr−1) outpaced that of NO2 (−3 % yr−1). These contrasting trends were associated with an increase in sulfur oxidation rate (SOR) and a decrease in nitrogen oxidation rate (NOR). Changes in PM2.5 chemical composition also influenced aerosol physicochemical properties, such as aerosol pH (0.04 yr−1), aerosol liquid water content (ALWC, −1.1 µg m−3 yr−1), and the light extinction coefficient (−21.44 Mm−1 yr−1). Given important roles of aerosol acidity and ALWC in the heterogeneous reactions, these changes may further inhibit the formation of secondary species in the atmosphere, particularly secondary organic aerosols.
- Article
(2822 KB) - Full-text XML
-
Supplement
(2687 KB) - BibTeX
- EndNote


Particulate matter with aerodynamic diameter less than 2.5 µm (PM2.5) is a major air pollutant with significant implications for global climate, air quality, and human health (Burnett et al., 2018; Chen et al., 2021; Ding et al., 2021; Pye et al., 2021; Vohra et al., 2022). PM2.5 comprises a complex mixture of primary and secondary components. Primary components, including primary organic aerosol (POA), elemental carbon (EC), and metal ions (e.g., K+, Ca2+, Na+, Mg2+), are mostly emitted from anthropogenic activities. Secondary components, such as secondary organic aerosols (SOA) and secondary inorganic aerosols (SIA; i.e., sulfate, nitrate, and ammonium), are formed through oxidation of gaseous pollutants (SO2, NOx, and VOCs, etc.) and partition processes. China experienced rapid economic growth and urbanization in the past decades. To address severe air pollution, the Chinese government issued the Air Pollution Prevention and Control Action Plan in 2013 (Geng et al., 2024). As a result, the chemical composition in PM2.5 over China changed significantly (Geng et al., 2019). This change has an important impact on aerosol acidity, ALWC, and light extinction (Nguyen et al., 2016; Pye et al., 2020; Liu et al., 2022).
Acidity, defined as pH, is a crucial aerosol property that affects human health, ecosystems and climate (Nenes et al., 2020; Su et al., 2020; Song et al., 2024). Low pH increases solubility of metals associated with mineral dust (Fang et al., 2017). Previous epidemiological studies revealed that exposure to acidic PM2.5 is relevant to high mortality and morbidity (Gwynn et al., 2000; Zhang et al., 2022a). Additionally, aerosol acidity and ALWC regulate the gas–particle partitioning of semi–volatile compounds, as well as chemical reaction rates in the atmosphere, highlighting their importance for the atmospheric lifetime of pollutants (Pye et al., 2020; Nenes et al., 2021). Aqueous uptake is an important formation pathway for secondary species (Yu et al., 2005; Kawamura and Bikkina, 2016; Liu et al., 2021). As an abundant medium, ALWC can enhance their formation (Carlton and Turpin, 2013; Zheng et al., 2015). By modifying particle ability to be activated into cloud condensation nuclei (CCN), ALWC can further influence the climate system (Duan et al., 2019). Furthermore, Attwood et al. (2014) reported that the changes in ALWC significantly influenced the aerosol light extinction and radiative forcing. Therefore, it is necessary to explore the trends of pH and ALWC under the changes in PM2.5 chemical composition.
Aerosol pH and ALWC are determined by the presence of acidic components (i.e., sulfate and nitrate), alkaline components (i.e., ammonium) (Seinfeld et al., 1998), and meteorological conditions, such as temperature and relative humidity (Wang et al., 2022a). However, aerosol acidity is more sensitive to dominant chemical species rather than meteorological conditions (Wu et al., 2023). According to sensitivity tests, T-H2SO4 (SO2 + SO) and T-NH3 (NH3 + NH) have the most dominant negative and positive contributions to pH variation, respectively (Wu et al., 2023). The aerosol pH exhibited noticeable spatial heterogeneity. For example, the pH values in North China (e.g., Beijing (3.0–4.9), Zhengzhou (4.5), Anyang (4.8)) (Liu et al., 2017; Wang et al., 2020) were generally higher than those in South China (e.g., Guangzhou (−0.04–0.81), Shanghai (3.06–3.30), South China Sea (1.7)) (Fu et al., 2015; Wang et al., 2022a; Zhou et al., 2022). This could be attributed to the higher fraction of sulfate observed in southern China (Geng et al., 2017; Liu et al., 2023) and the elevated ammonia emissions in northern China (Liu et al., 2023). Zhou et al. (2022) reported a downward trend of pH (from 3.33 to 3.06) at a rate of −0.24 yr−1 in the Yangtze River Delta (YRD) from 2011 to 2019. Conversely, Fu et al. (2015) reported an upward trend of pH (from −0.30 to 0.81) in the PRD during 2007–2012. However, this study did not cover the post–2013 period, a key period for air quality improvement.
Chemical composition in PM2.5 also affects atmospheric visibility through light scattering and absorption. Light scattering is dominated by hydrophilic components, such as organic mass (OM), (NH4)2SO4, and NH4NO3, while light absorption is largely driven by light–absorbing carbon (Wang et al., 2012). To estimate the light extinction coefficient (bext), the first Interagency Monitoring of Protected Visual Environments (IMPROVE) equation was developed by the U.S. National Park Service with support from the U.S. Environmental Protection Agency (EPA) (Malm et al., 1994; EPA, 2003), but this equation tended to underestimate (overestimate) the highest (lowest) bext values. Consequently, the revised IMPROVE equation was then proposed (Malm and Hand, 2007; Pitchford et al., 2007). However, the scattering/absorbing efficiency (MSE/MAE) in the revised equation is an approximation based on measurements from clean areas. In addition, the calculation of hygroscopic growth factor (f(RH)) in the revised equation depends on relative humidity (RH) and particle size distribution (or aerosols mass), but does not account for the chemical composition in aerosols, which has been shown to significantly affect f(RH) (Li et al., 2021). These simplifications could lead to large discrepancies in polluted regions. For instance, the deviations between observed and estimated bext values were reported as 15 %, 36 %, and 37 % in Xi'an, Shanghai, and Guangzhou, respectively (Jung et al., 2009; Cao et al., 2012; Cheng et al., 2015). Thus, region-specific adjustments are necessary to reflect the impact of particle composition on these parameters from site to site.
Many long-term monitoring programs have been implemented to formulate pollution control strategies and explore underlying factors of aerosol properties variation. For example, the IMPROVE program in the United States, initiated in 1985, tracks visibility trends and their driving factors (Hand et al., 2024). The Southeastern Aerosol Research and Characterization (SEARCH) network, established in 1998, provides detailed insights into aerosol chemistry and precursor gases (Blanchard et al., 2013). In Europe, the European Monitoring and Evaluation Program (EMEP) has operated since 2004 to address air pollution issues related to acidification, eutrophication, and climate impacts (EMEP, 2024). In China, long–term PM2.5 monitoring began in Hong Kong, where the Environmental Protection Department (HKEPD) initiated comprehensive chemical composition measurements in 1999. Subsequent collaborations expanded the monitoring network to encompass the Guangdong–Hong Kong–Macao Greater Bay Area in 2015 (HKEPD, 2021; Chow et al., 2022).
As one of the most outstanding areas for air pollution improvement, the PRD region first met National Ambient Air Quality Standards (AQS) for annual average PM2.5 (35 µg m−3) in 2015 (Department of Ecology and Environment of Guangdong Province, 2016). PM2.5 in the PRD (32.2–46.1 µg m−3) was significantly lower than the YRD (44.8–67.1 µg m−3), the North China Plain (NCP) (64.0–101.9 µg m−3), and other regions (45.1–65.4 µg m−3) (Zhang et al., 2019). Regarding chemical composition, nitrate was the dominant species in the YRD and the NCP. However, OM constitutes the largest fraction in the PRD, similar to other low PM2.5 areas worldwide (Zhang et al., 2007; Ming et al., 2017; Geng et al., 2019; Wang et al., 2022b; Yang et al., 2023). So far, long-term studies of PM2.5 chemical components in the PRD remain scarce. Fu et al. (2014) observed substantial reductions in organic carbon (OC) and SO, but relatively stable NO during 2007–2011, alongside increased aerosol pH and decreased light extinction (Fu et al., 2014, 2015, 2016). However, this study did not cover the post–2013 period, a key period for air quality improvement. Yan et al. (2020) conducted a meta–analysis (2004–2019), identifying three stages of decline, rise, and stabilization in the fractions of secondary species. Chow et al. (2022) reported the reduction in NO (66 %), EC (60 %), hopanes (75 %), and K+ (60 %) exceeding that of PM2.5 (40 %), confirming effective control of vehicle emissions and biomass burning in Hong Kong (2008–2017). In addition, these studies observed an unproportional relationships between SO SO2, as well as NO NO2, but the underlying reasons remain unclear. Furthermore, long-term trends of aerosol acidity, ALWC, and light extinction, which are highly dependent on PM2.5 chemical composition, were not fully investigated. These limitations underscore the need for a more comprehensive, long-term study to explore the underlying mechanisms behind these changes in the PRD.
Our study presents a comprehensive analysis of 532 quartz filter–based PM2.5 samples collected over 14 years (2007–2020, wintertime) at a regional background station. We examined the evolving PM2.5 chemical composition, focusing on both primary and secondary species. The unproportional relationships between SO SO2, as well as NO NO2 will be discussed. In addition, we also analyzed variations of aerosol pH, ALWC, and light extinction under the influence of changes in PM2.5 chemical composition.
2.1 Field sampling
The typical Asian monsoon climate influences the PRD region. In summertime, prevailing southwesterly winds bring humid and clean air mass from South China Sea or the northwestern Pacific Ocean. In contrast, during the fall and winter, prevailing northerly winds carry dry and polluted air mass from northern continent. Additionally, the region is often influenced by high–pressure ridges in the fall and winter, which results in a low boundary layer and a high frequency of inversion. These conditions facilitate the accumulation of pollutants. Consequently, PM2.5 and other pollutants show a distinct summer–winter contrast, with significantly elevated pollutant levels in fall and winter (Fu et al., 2014; Chow et al., 2022). Our field campaigns were mainly conducted from October to December.
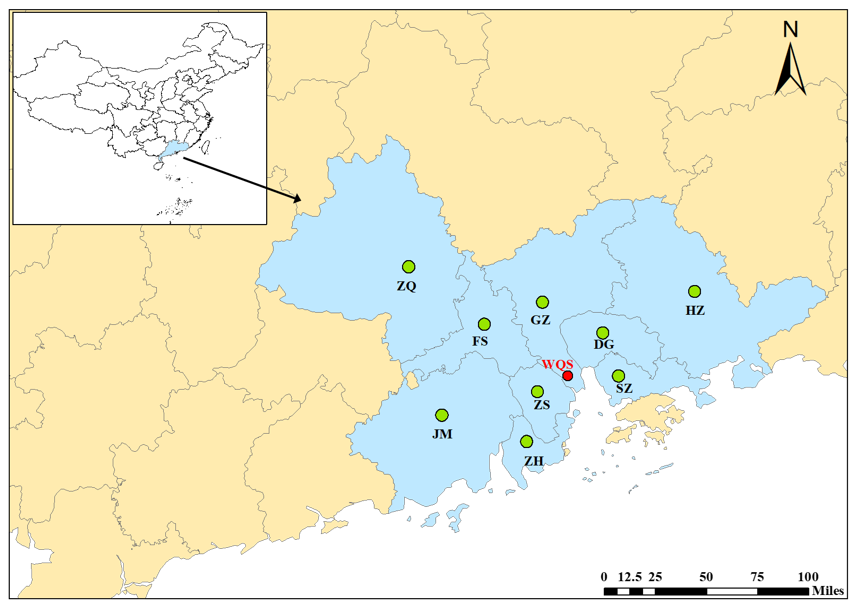
Figure 1The PRD region consists of Guangzhou (GZ), Shenzhen (SZ), Zhuhai (ZH), Dongguan (DG), Foshan (FS), Huizhou (HZ), Zhongshan (ZS), Zhaoqing (ZQ), and Jiangmen (JM). The sampling site WQS is located in the central area of this region.
The sampling site, Wanqingsha (WQS; 22.42° N, 113.32° E), is located in a rural area of Guangzhou and the center of the PRD region (Fig. 1). Local anthropogenic emissions have limited influence on this site due to low traffic flow and few factories in the surrounding area. This makes it an ideal background site for investigating regional air pollution. Twenty-four-hour sampling was conducted using a PM2.5 sampler equipped with quartz filters (20.3 cm × 25.4 cm) at a flow rate of 1.1 m3 min−1. The quartz filters were pre-baked at 450 °C for four hours prior to field sampling and stored at −20 °C after sampling until analysis. Blank samples were collected during the sampling periods. A total of 532 samples were collected and analyzed in this study. Gaseous pollutants data (SO2, NO2, NO, and O3) and meteorological parameters were obtained from an air quality monitoring station operated at WQS. The gaseous pollutant data during 2012–2013 were unavailable because the station was under maintenance.
2.2 Chemical analysis
Because the determination of OC and EC are highly sensitive to analytical conditions, different thermal-optical methods may lead to discrepancies in the OC EC measurements (Khan et al., 2012; Giannoni et al., 2016). To minimize potential measurement biases and enhance data comparability, we used the same thermal-optical carbon analyzer and followed the same analytical protocol throughout the study. Specifically, the OC and EC were determined by the thermal-optical transmittance (TOT) method (NIOSH, 1999) using an OC EC analyzer (Sunset Laboratory Inc., USA), with a punch (1.5 × 1.0 cm) of the sampled filters. The samples were analyzed by stepwise heating. First, the sample was heated sequentially to 870 °C (310 °C for 60 s, 475 °C for 60 s, 620 °C for 60 s, and 870 °C for 90 s) under a pure helium (He) atmosphere. OC was volatilized and a portion of it underwent pyrolysis, forming pyrolyzed carbon during this period. After cooling, the sample was reheated under a 2 % O2 He atmosphere up to 920 °C (625 °C for 30 s, 700 °C for 30 s, 775 °C for 30 s, 850 °C for 30 s, and 920 °C for 30 s) to oxidize EC and pyrolyzed carbon.
For the water–soluble inorganic ions, a punch (5.06 cm2) of the filters was extracted twice with 10 mL ultrapure Milli-Q water (18.2 MΩ cm per 25 °C) each for 15 min using an ultrasonic ice-water bath. The total water extracts (20 mL) were filtered through a 0.22 µm pore size filter and then stored in a pre–cleaned HDPE bottle. The cations (i.e., Na+, NH, K+, Mg2+, and Ca2+) and anions (i.e., Cl−, NO, and SO) were analyzed with an ion–chromatography system (Metrohm, 883 Basic IC plus). Due to the negative mass artifacts associated with the volatilization of ammonium nitrate, the measured concentrations of NO and NH may be underestimated (Chow et al., 2005; Yu et al., 2006). Cations were measured using a Metrohm Metrosep C4–100 column with 2 mmol L−1 sulfuric acid as the eluent. Anions were measured using a Metrohm Metrosep A sup 5–150 column equipped with a suppressor. The anion eluent was a solution of 3.2 mmol L−1 Na2CO3 and 1.0 mmol L−1 NaHCO3.
2.3 Quality assurance/quality control (QA/QC)
Prior to OC EC analysis, we calibrated the instrument using glucose standards at multiple concentrations. The instrument responses were highly linear (R2 > 0.99) and the relative errors between measured and prepared concentrations were within ±5 %. The method detection limits (MDLs) were 0.01–0.05 µg m−3 for the OC, EC, cations, and anions. Ion balance was employed as a quality control check in the anion/cation analysis. A significant linear correlation (R2=0.97) was observed between anions and cations, with a slope of 0.82 for all PM2.5 samples. This slope, being close to unity, indicated that all the significant ions were resolved.
Blank samples were analyzed in the same way as field samples. All the OC EC and cation/anion data were corrected by subtracting the field blank samples. As shown in Fig. S1 in the Supplement, all measured components exhibited minimal variability in the blank filter samples. This indicated that the influence of analytical and sampling biases related to blank subtraction and experimental procedures was limited, further supporting the reliability of the long-term trends observed in this study.
Before data analysis, all data were manually inspected and outliers (i.e., ) were removed to rule out the influence of extreme concentrations on overall trends. The change rates were calculated using the slopes derived from Theil–Sen regression and evaluated for statistical significance via the non-parametric Mann–Kendall test, providing a robust and reliable assessment of temporal variations.
2.4 Estimation of primary organic carbon (POC) and secondary organic carbon (SOC)
EC is a product of carbon fuel-based combustion processes and is exclusively associated with primary emissions, whereas OC can be formed from both direct emissions and secondary pathways. Differentiation between POC and SOC is indispensable for probing atmospheric aging processes of organic aerosols, but all available methods for estimating POC and SOC are highly uncertain. The EC–tracer method was widely used (Turpin and Huntzicker, 1991, 1995). Given that EC is emitted exclusively from primary combustion sources (e.g., fossil fuel and biomass burning), it is commonly used as a tracer for POC. Under this assumption, POC is estimated by multiplying EC by a representative primary OC EC ratio, and SOC is determined as the residual between total OC and estimated POC (Eqs. 1–2). One of the most commonly used approaches to determine (OC EC)pri is the minimum OC EC ratio approach (Castro et al., 1999), which assumes that the lowest observed OC EC value corresponds to conditions dominated by primary emissions with negligible SOC formation. In addition, Pio et al. (2011) recommended using the 5 % percentile of observed OC EC values instead, and Wu and Yu (2016) proposed minimum R squared (MRS) method to obtain (OC EC)pri.
However, a previous study revealed that EC–tracer method relied on the fixed (OC EC)pri and tended to overestimate SOC (Kim et al., 2012). Recently, Liao et al. (2023) proposed Bayesian Inference (BI) approach and suggested it more accurately estimated POC and SOC compared to the conventional method. The BI approach adopts a probabilistic framework that combines prior knowledge (in the form of prior distributions of the K values) with observational data (OC, EC, and SIA) to estimate the source contributions to OC. The BI model assumes that observed OC is a linear combination of contributions from POC and SOC tracers (e.g., EC and SO), and it uses the Markov Chain Monte Carlo (MCMC) technique to derive posterior distributions for the K values. This treatment allows the approach to update parameter estimates based on actual measurements and offers more flexibility. In this study, we used BI approach which has the convenience of relying only on the commonly available mass concentrations of EC and SO to estimate POC and SOC. They can be calculated as following:
Where KEC and are parameters calculated by BI approach in R language, the details can be found in previous research (Liao et al., 2023). The K values represent the proportionality constants that link OC to its respective tracers (e.g., KEC for EC-to-POC and for sulfate-to-SOC). The variations of K value are shown in Fig. S2.
Because SOC represents only the carbonaceous portion of the organic aerosol, while SOA includes the entire mass of organic compounds formed through secondary processes, including associated non-carbon atoms (e.g., hydrogen, oxygen, nitrogen). To better evaluate the atmospheric mass loading of organic aerosols and their mass proportions in PM2.5, it is important to convert SOC to SOA. Given intense photochemical reactions and larger fractions of aged aerosols in the PRD, a higher conversion factor of 2.4 was employed to convert SOC to SOA (Yan et al., 2020).
2.5 Prediction of aerosol acidity and ALWC
The thermodynamics model ISORROPIA-II has been widely used to calculate aerosol pH (Nenes et al., 1998; Fountoukis and Nenes, 2007; Wen et al., 2018; Zhou et al., 2022). Meteorological parameter (temperature and relative humidity), aerosol phase water-soluble ions (SO, NO, Cl−, NH, Na+, K+, Mg2+, Ca2+) and gaseous precursors (HNO3, HCl, NH3) are needed for the model execution. Given high relative humidity (RH) in the PRD region, the model was run by assuming aerosol solutions were metastable (only a liquid phase) in forward mode; previous studies suggested this would produce better performance than the stable state solution (solid + liquid) (Guo et al., 2015; Bougiatioti et al., 2016). A recent study suggested that the model was run in the forward mode but did not include gas-phase data, which may capture the general trend of aerosol acidity but underestimate pH (Fang et al., 2025).
We used the data collected in Guangzhou Institute of Geochemistry (GIG) to run the model, and the result (G1) showed there was a great agreement in gaseous ammonia between simulation and observation (Fig. S3). Due to the lack of gas-phase concentrations during our campaign period in WQS, we ran the model by performing iterations to avoid the underestimation of pH. Only aerosol phase data were used as input for the first run. Then we added the output gas-phase concentrations from the first run to the initial aerosol-phase chemical concentrations to derive total (gas and aerosol phase) concentrations, which serve as input for the second run and so on. To determine an optimal number of iterations, we ran GIG data (without gas-phase data) to compare with G1. Our result indicated four iterations generated the closest outcome to G1 when gas-phase data was unavailable (Fig. S4).
3.1 Long-term trends of PM2.5 and its chemical composition in wintertime
In response to severe particle pollution, the Chinese government issued the Air Pollution Prevention and Control Action Plan in 2013. Due to the strengthened emission controls in the PRD, primary pollutants have been reduced significantly over the past decades (Bian et al., 2019). Based on daily PM2.5 concentrations in our samples, we divided the data into five groups according to interim targets recommended by the Worle Health Organization (WHO) in 2021 (World Health Organization, 2021): IT0 (PM2.5 > 75 µg m−3), IT1 (75 µg m−3 > PM2.5 > 50 µg m−3), IT2 (50 µg m−3 > PM2.5 > 37.5 µg m−3), IT3 (37.5 µg m−3 > PM2.5 > 25 µg m−3), and IT4 (25 µg m−3 > PM2.5). The majority of samples fell into T0 and T1 categories (41 %–100 %) before 2013, while this ratio quickly decreased (8 %–60 %) during 2013–2020 (Fig. S5), indicating successful implementation of air pollution mitigation strategies after 2013.
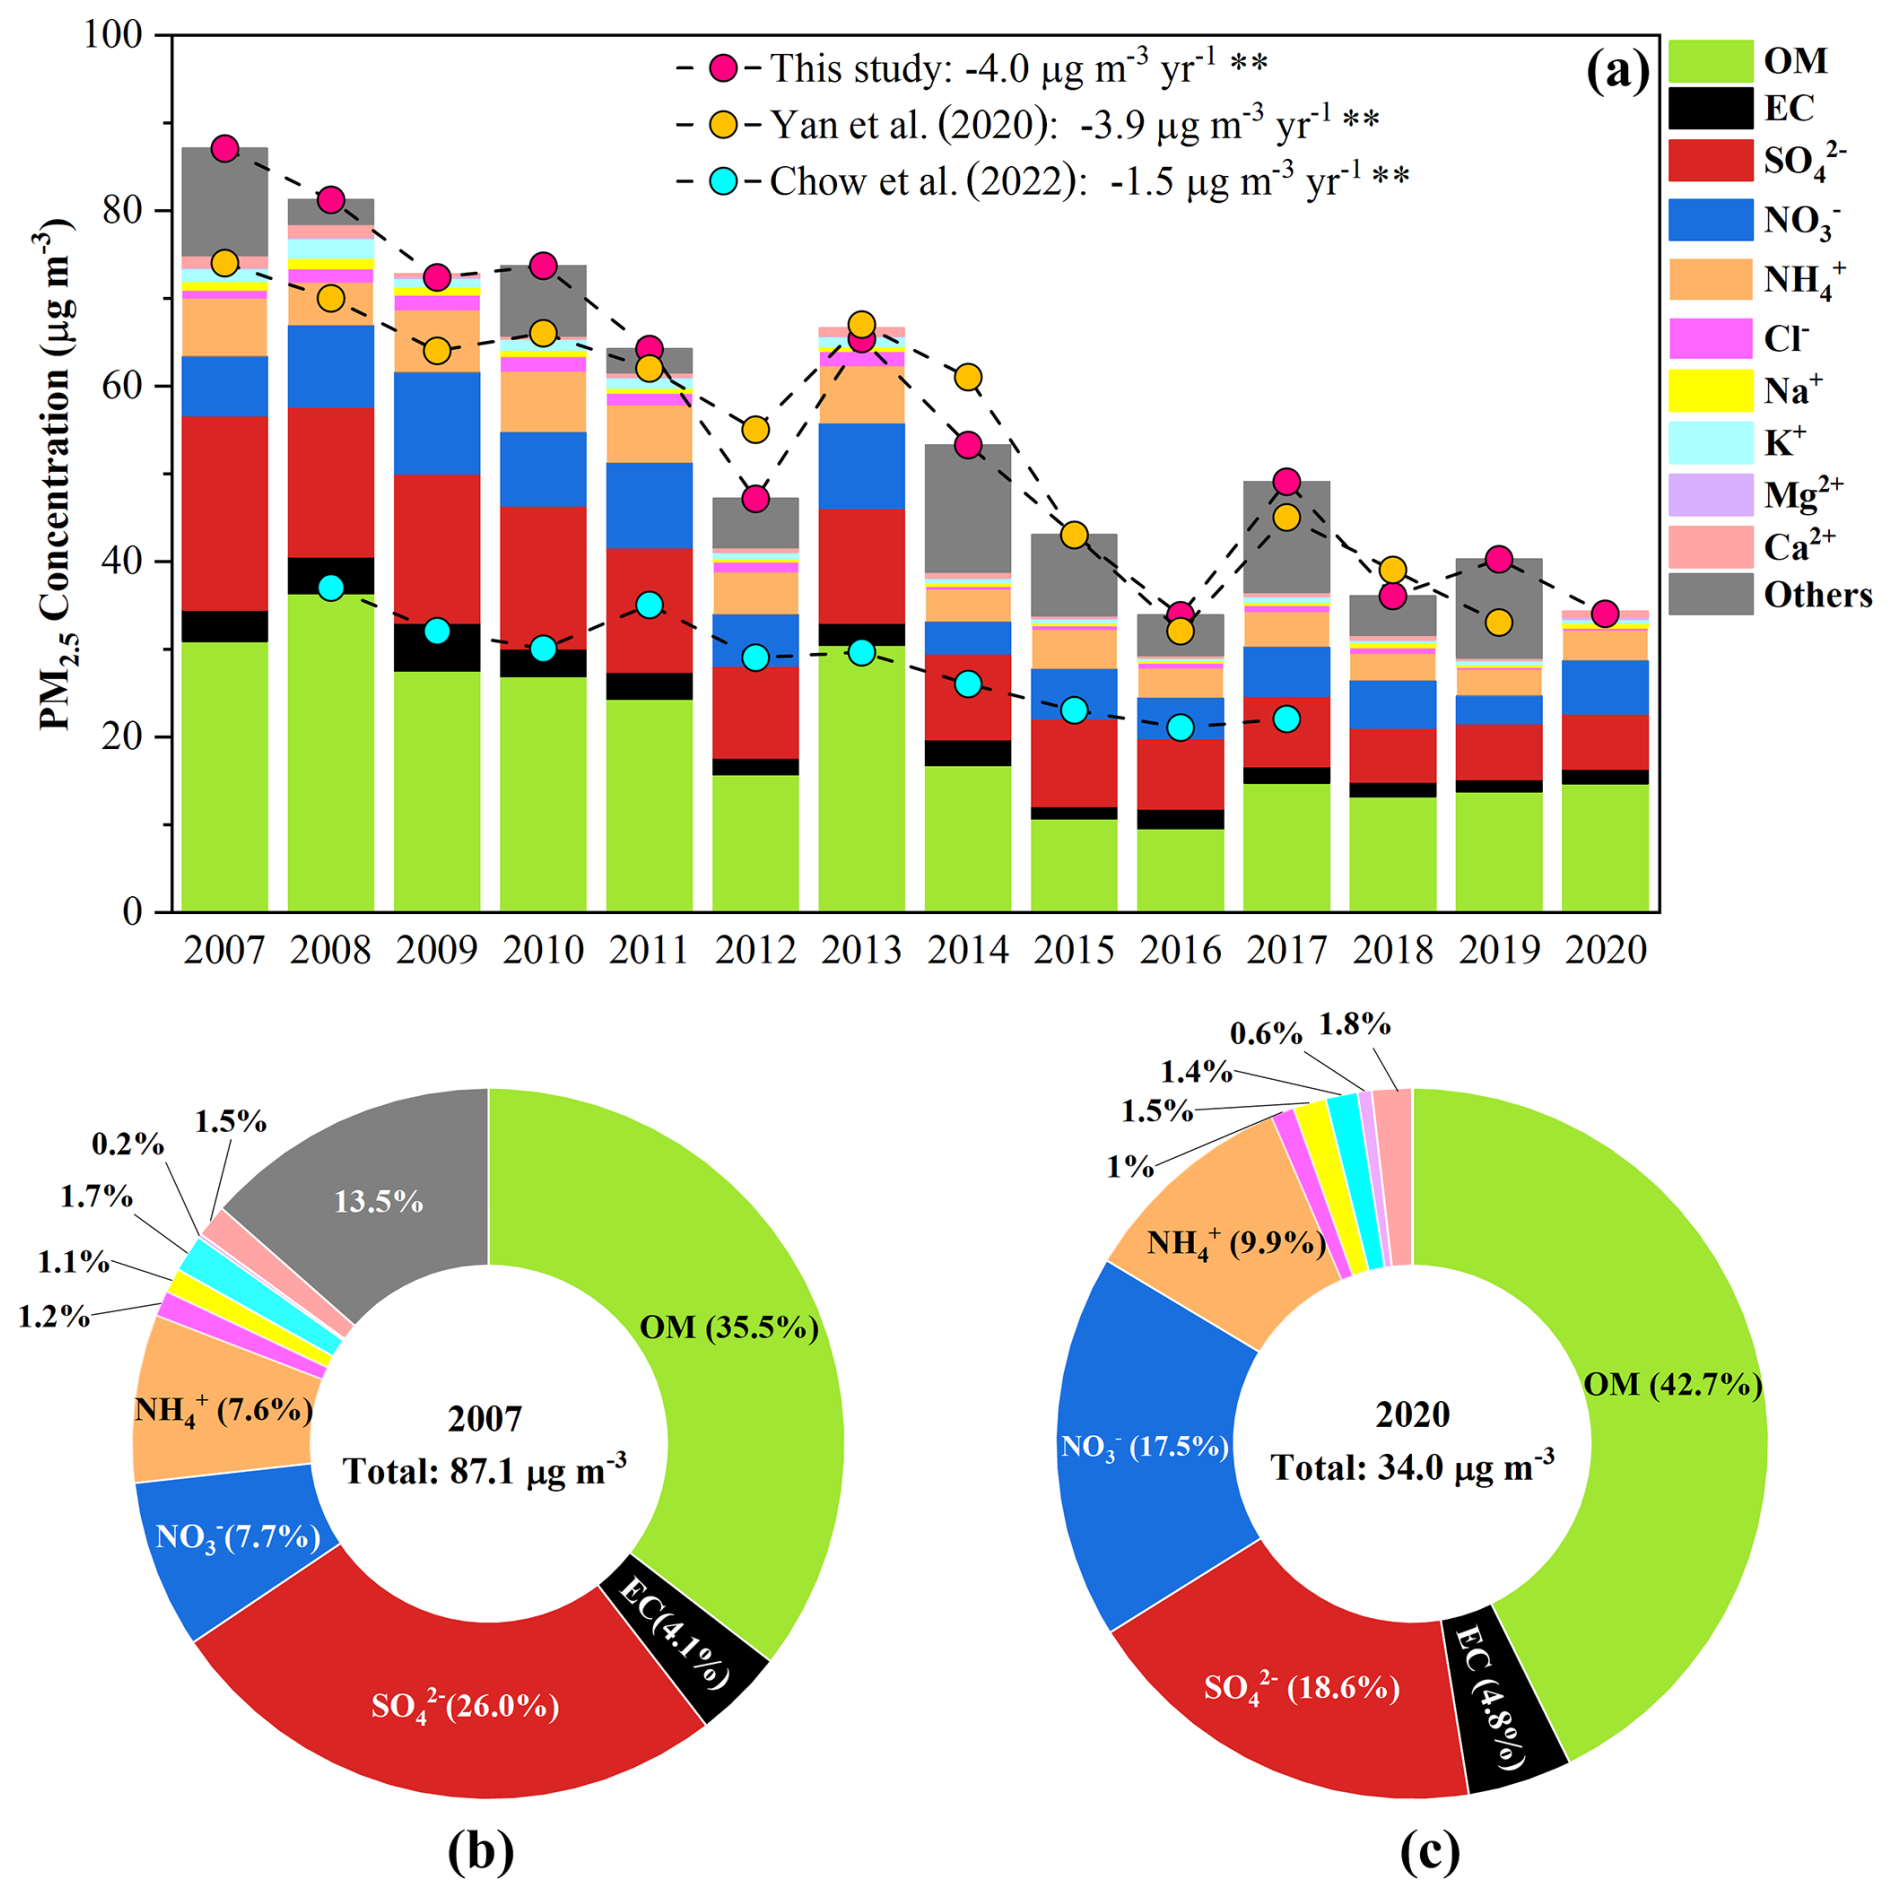
Figure 2(a) Trends of PM2.5 and its major components. Bars represent concentrations of chemical compositions and circles represent concentrations of PM2.5 in different studies. (b, c) The comparison of the mass fractions of major components in 2007 and 2022.
Annual average concentrations of PM2.5 and its chemical composition are presented in Fig. 2a and Table S1. The variations in mass fractions of these components are shown in Fig. S6. It is worth noting that the year 2020 was characterized by unprecedented emission reductions associated with COVID-19 lockdowns (Wang et al., 2021), which may have temporarily affected the trends in PM2.5 and its chemical composition. As shown in Table S2, a sensitivity analysis was conducted to evaluate the uncertainty introduced by including 2020 in the long-term trends analysis. The results suggested that this anomalous year would not introduce large bias on the overall long-term trends. From 2007 to 2020, PM2.5 concentrations exhibited a significant decline from 87.1 ± 15.5 to 34.0 ± 11.3 µg m−3, at a rate of −4.0 µg m−3 yr−1 (p < 0.01). This trend aligns with the previous results from meta–analysis (−3.9 µg m−3 yr−1) and regional simulation (−4.0 µg m−3 yr−1) in the PRD (Zhang et al., 2019; Yan et al., 2020), affirming WQS can serve as a regional background site. During this period of air quality improvement, OM (defined as OC × 1.6) (Yang et al., 2023) remained the most abundant component (25 %–47 %) in PM2.5, followed by SO (16 %–26 %), NO (7 %–18 %), NH (7 %–10 %) and EC (3 %–8 %). Other ions, such as Cl−, Na+, K+, Mg2+, and Ca2+, contributed less than 3 % each to the mass of PM2.5 (Fig. S6). In China, desulfurization regulation for power plants was enforced around 2005, resulting in a notable decline (−7 %) in the proportion of SO (Fig. 2b–c). However, the installation of denitrification devices on power plants began in late 2011 and started to take effect in 2012. With the delayed implementation of NOx emissions control measures compared to those for SO2 (Fu et al., 2014; Reuter et al., 2014; Geng et al., 2017; Qu et al., 2017), the mass fractions of NO increased by 10 %. By the end of 2020, the proportion of NO had doubled compared to 2007, approaching the level of SO. The proportion of OM also increased from 35.5 % to 42.7 %. Consequently, future air pollution control efforts need to focus on reducing OM and NO concentrations to continue improving air quality in the PRD region.
The chemical composition of PM2.5 can be categorized into primary species and secondary species. Primary species consist of POA, EC, and metal ions (e.g., Cl−, Na+, K+, Mg2+, Ca2+ etc.). Secondary species include SOA and SIA (SO, NO, and NH). Our results indicated that secondary species consistently dominated over primary species in PM2.5 composition, accounting for 54 % to 79 % of the total mass (Fig. 3a). Additionally, secondary species declined at a faster rate (−2.45 µg m−3 yr−1, p < 0.01) compared to primary species (−1.48 µg m−3 yr−1, p < 0.01), indicating reduction of secondary species had more contribution in particulate pollution mitigation. Although Yan et al. (2020) also observed a decline trend in concentrations of secondary species after 2008 in the PRD, the proportion of secondary species was stable around 80 %, which was higher than our study. This might stem from the fact that the EC–tracer method applied by the previous study would overestimate SOC, which made secondary species increase (Kim et al., 2012). Our result showed that the average concentration of SOC estimated by the BI approach was ∼ 30 % lower than that by the EC–tracer method. In addition, the correlation between oxalic acid (a typical secondary organic molecular marker) and SOC estimated by the BI approach (r = 0.62, p < 0.05) was stronger than that with SOC estimated by the EC-tracer method (r = 0.54, p < 0.05), indicating the estimation from BI approach was more reliable (Fig. S7). We calculated K values on an annual basis to estimate SOC, whereas Yan et al. (2020) used a fixed value of (OC EC)pri (the minimum value of all collected data) to estimate SOC. As a result, the proportion of secondary species in this study showed greater variability than that of Yan et al. (2020). In addition, we analyzed the proportion of secondary species under different pollution levels. Figure 3b showed that the mass fraction of secondary species increased significantly from 57 % to 73 % with the improvement of air quality (from IT0 to IT4). This meant secondary species play an increasingly prominent role under lower pollution conditions.
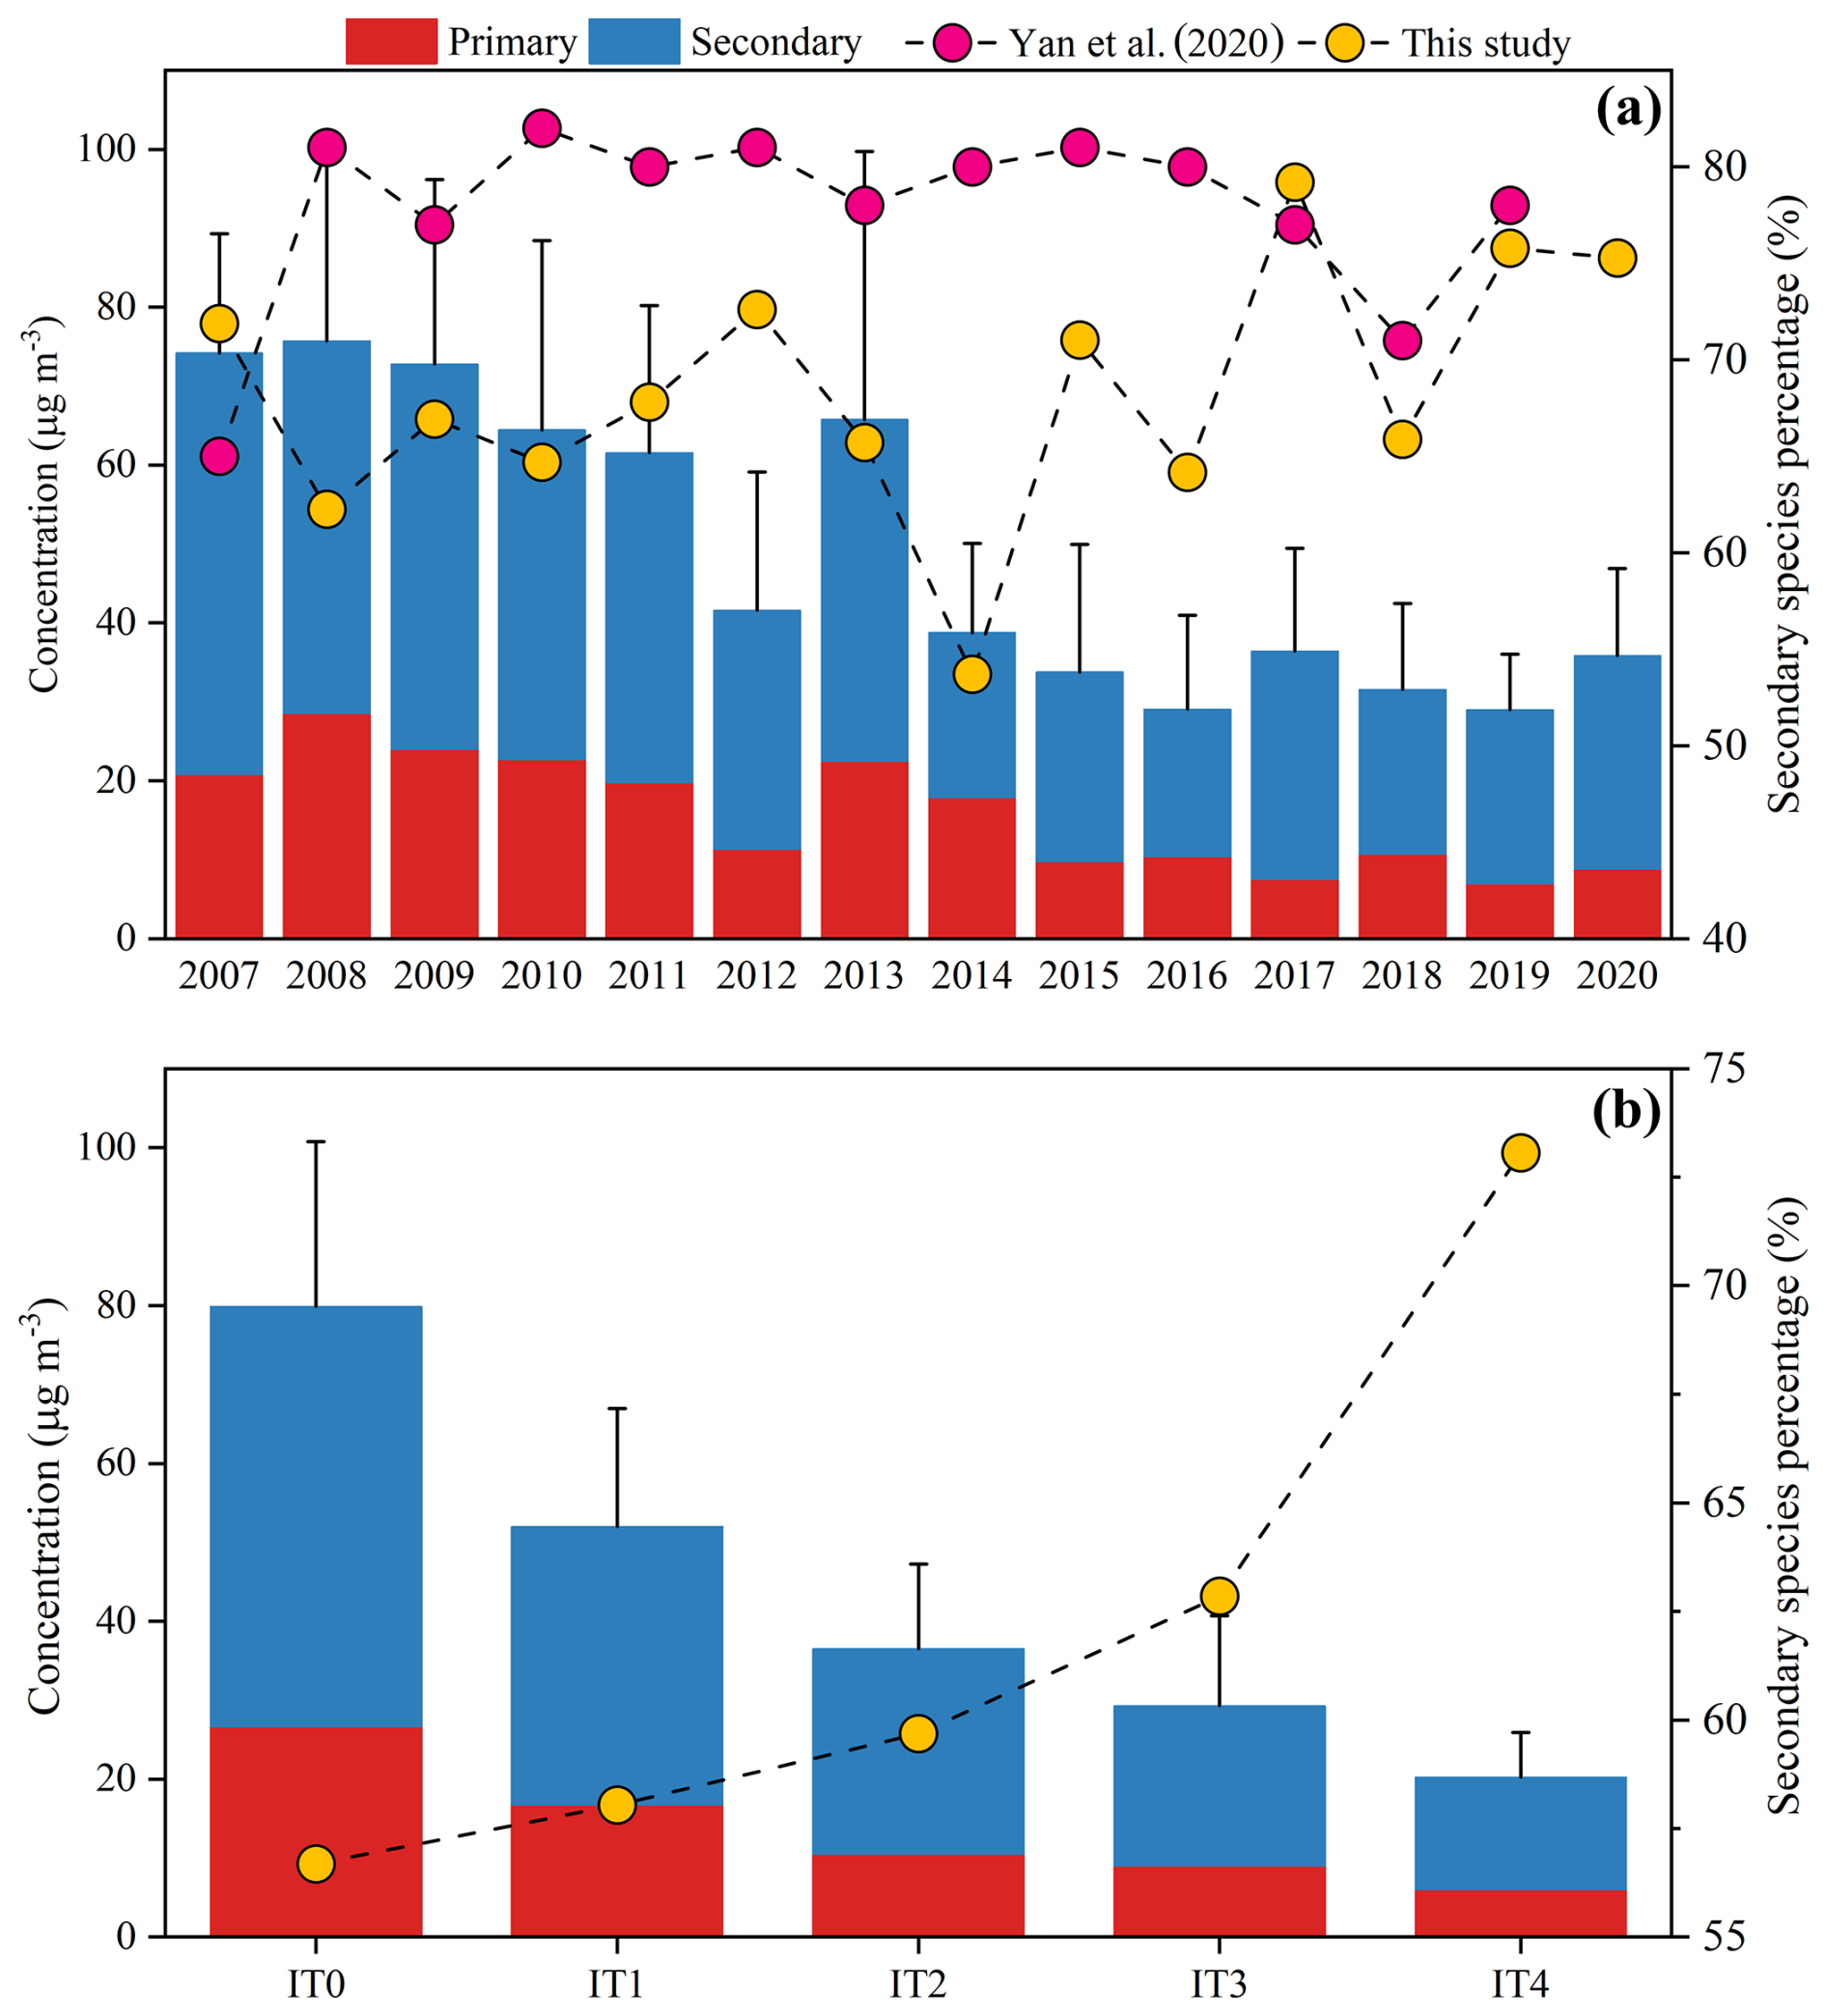
Figure 3The variations in primary and secondary species during 2007–2020 (a) and their variations under different pollutants levels (b). Bars represent concentrations of them and circles represent the mass proportion of secondary species in PM2.5. Secondary species (account for 54 %–79 %) dominated over primary species. The proportion of secondary species increased from 57 % to 73 % with improvement of air quality (From IT0 to IT4). The error bars represent the standard deviation of the total concentration, calculated as the sum of primary and secondary species.
3.2 Annual variations of primary species and secondary species in wintertime
3.2.1 Primary species
The trends of individual components in PM2.5 can be seen in Figs. S8–S9. POA exhibited the most significant decline at a rate of −0.97 µg m−3 yr−1 (−9 % yr−1, p < 0.01). EC serves as a tracer for primary combustion, K+ serves as a tracer for biomass burning, and Ca2+ could be applied to track dust-related sources (Turpin and Huntzicker, 1991; Zhu et al., 2017). Our result showed that the relative reductions in EC (−9 % yr−1), K+ (−12 % yr−1) and Ca2+ (−11 % yr−1) were greater than that of PM2.5 (−7 % yr−1), confirming that control measures for these sources had been effective. Cl− and Na+ also showed decline trends at rates of −0.10 µg m−3 yr−1 (−10 % yr−1), −0.05 µg m−3 yr−1 (−9 % yr−1), respectively (p < 0.01). Marine emission is considered the biggest source of Cl− in fine particle. However, anthropogenic sources such as coal combustion and biomass burning also had non–negligible impacts on it (Luo et al., 2019). After excluding the influence of anthropogenic sources (Section S1 and Fig. S10), Cl− showed only a slight decline (−2 % yr−1), suggesting that the contribution from marine emissions to PM2.5 remained stable in general.
3.2.2 Secondary species
SO showed a clear decrease at a rate of −1.13 µg m−3 yr−1 (−10 % yr−1, p < 0.01), whereas NO and NH showed moderate declines (−0.40 µg m−3 yr−1, −6 % yr−1; −0.31 µg m−3 yr−1, −6 % yr−1, respectively, p < 0.05). Previous studies reported that the volatilization of ammonium nitrate during sampling can cause negative mass artifacts, leading to the underestimation of both NO (8 %–16 %) (Chow et al., 2005) and NH (10 %–28 %) (Yu et al., 2006). The volatilization is highly dependent on relative humidity and temperature. However, such losses are expected to be systematic over time and therefore are unlikely to significantly affect the general trends in this study, because our measurements were conducted in the same season. Strong correlations between SO SO2, as well as between NO NO2 were observed (Fig. S11), suggesting that reductions of SO and NO were mainly driven by their gaseous precursors. With RH rising, the slopes of SO SO2, as well as NO NO2, increased, indicating enhanced conversion of primary pollutants to secondary species. The generally lower intercepts observed in the NO NO2 regression compared to those in the SO SO2 regression can be explained by the semi-volatile nature of nitrate (Yu et al., 2006). The formation of HNO3, gaseous precursor of NO, is suppressed under very low NO2 level. Therefore, the reaction in R2 tends to proceed to the left. This facilitates partitioning of NO into gas phase, leading to less accumulation of NO in particle phase. In contrast, sulfate is the least volatile among all the inorganic aerosol components (Kang et al., 2022), allowing it to be stably retained in the particle phase once formed. Notably, SO reduction (−10 % yr−1) lagged behind SO2 reduction (−13 % yr−1), while NO reduction (−6 % yr−1) outpaced that of NO2 (−3 % yr−1) (Fig. 4). Other studies have also observed these disproportionate changes, but the reasons behind remained unclear (Blanchard et al., 2013; Geng et al., 2019; Yan et al., 2020; Chow et al., 2022).
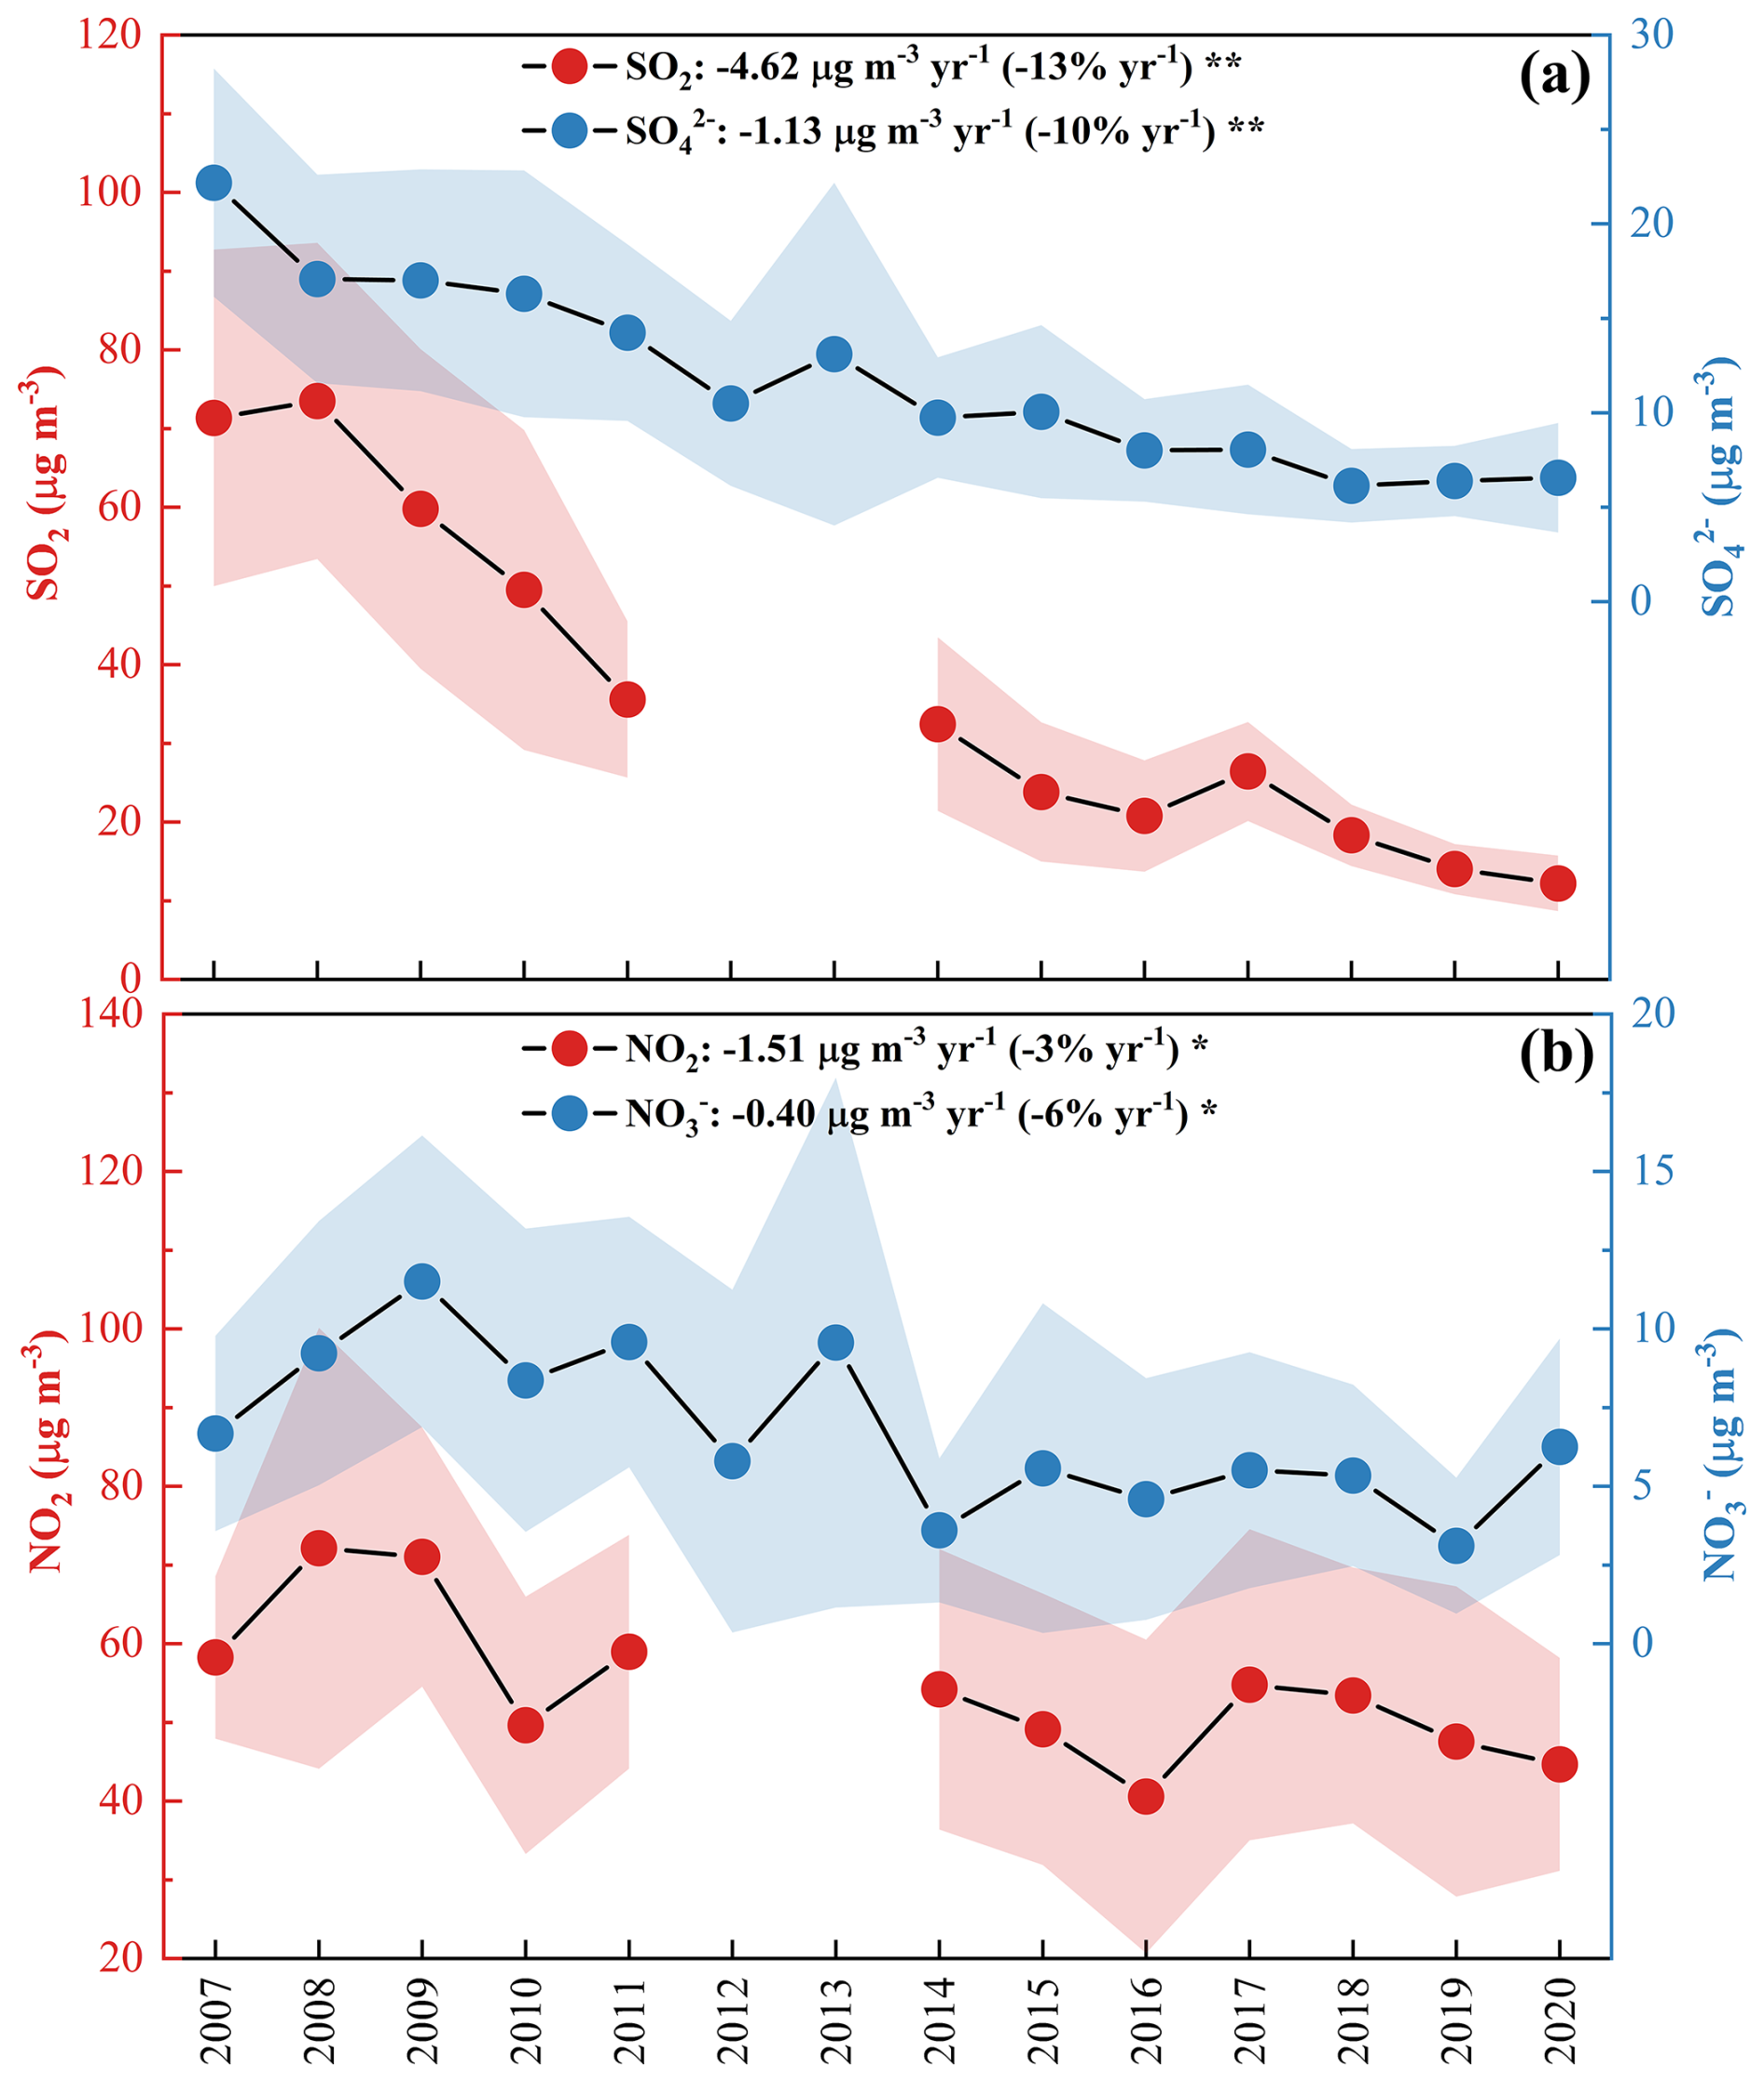
Figure 4(a) Annual variations in SO and SO2. (b) Annual variations in NO and NO2. The shaded region indicates the uncertainty bounds. One asterisk, two asterisks denote p value < 0.05, 0.01, respectively. In the PRD, SO and SO2 showed a more significant decline than NO and NO2. The reduction of SO (−10 % yr−1) was slower than SO2 (−13 % yr−1), while reduction of NO (−6 % yr−1) was faster than NO2 (−3 % yr−1).
Here, we calculated SOR and NOR (Li et al., 2023) described in Eqs. (5)–(6), where n refers to the molar concentration. The higher SOR and NOR represent more efficient conversion of gaseous species into secondary aerosols.
As shown in Fig. 5a, the SOR value in 2020 (0.26 ± 0.09) was 44 % higher than that in 2007 (0.18 ± 0.07). In general, SOR exhibited a significant upward trend during 2007–2020, increasing at a rate of 0.005 yr−1 (3 % yr−1, p < 0.05). The more efficient SO formation from SO2 oxidation slowed down the reduction of SO alongside decreasing SO2 levels. Gas–phase oxidation of SO2 followed by neutralization and aerosol phase condensation, is an important SO formation pathway (Berndt et al., 2023). Heterogeneous processes, including SO2 transfer to the aerosol phase, dissolution, and oxidation by oxidants such as H2O2 and O3, also contribute significantly in polluted regions (Wang et al., 2016; Liu et al., 2021). The solubility and effective Henry's law constant of SO2 are positively pH-dependent (Seinfeld et al., 1998). Higher pH promotes the dissolution of SO2 in water, which will enhance SO formation. ALWC plays a key role in determining the aqueous oxidation rate and mass transfer. In addition, high temperature can facilitate both gas–phase and aqueous–phase reactions. As shown in Fig. S12, there were strong positive correlations between SOR and O3 (r = 0.45), temperature (r = 0.48), as well as ALWC (r = 0.23). But there was no significant correlation between SOR and pH. A possible explanation is that hydrogen ions facilitate aqueous-phase oxidation of SO2 by H2O2, which will offset the effect of reduced SO2 solubility under low pH conditions (Liu et al., 2021). To assess the impacts of these factors on SOR and eliminate dimensional and order of magnitude effects, a normalized multiple linear regression was developed as below:
The prediction of SOR showed good agreement with the observations (Fig. S13a). The larger regression coefficients of O3 and temperature, along with their stronger correlations with SOR, suggested that the increase of SOR was mainly driven by the two factors. Our result showed that ALWC exhibited a downward trend (Fig. 6b), which exerted a negative influence on SOR. Although O3 concentration did not show an obvious trend at our measurement station (Fig. S14a), a previous study suggested that there was a rapid increase of O3 in the PRD after 2013 (Cao et al., 2024). Meanwhile, the temperature also rose slightly (p < 0.05) during the past decade (Fig. S14b). Consequently, a significant upward trend was observed in SOR.
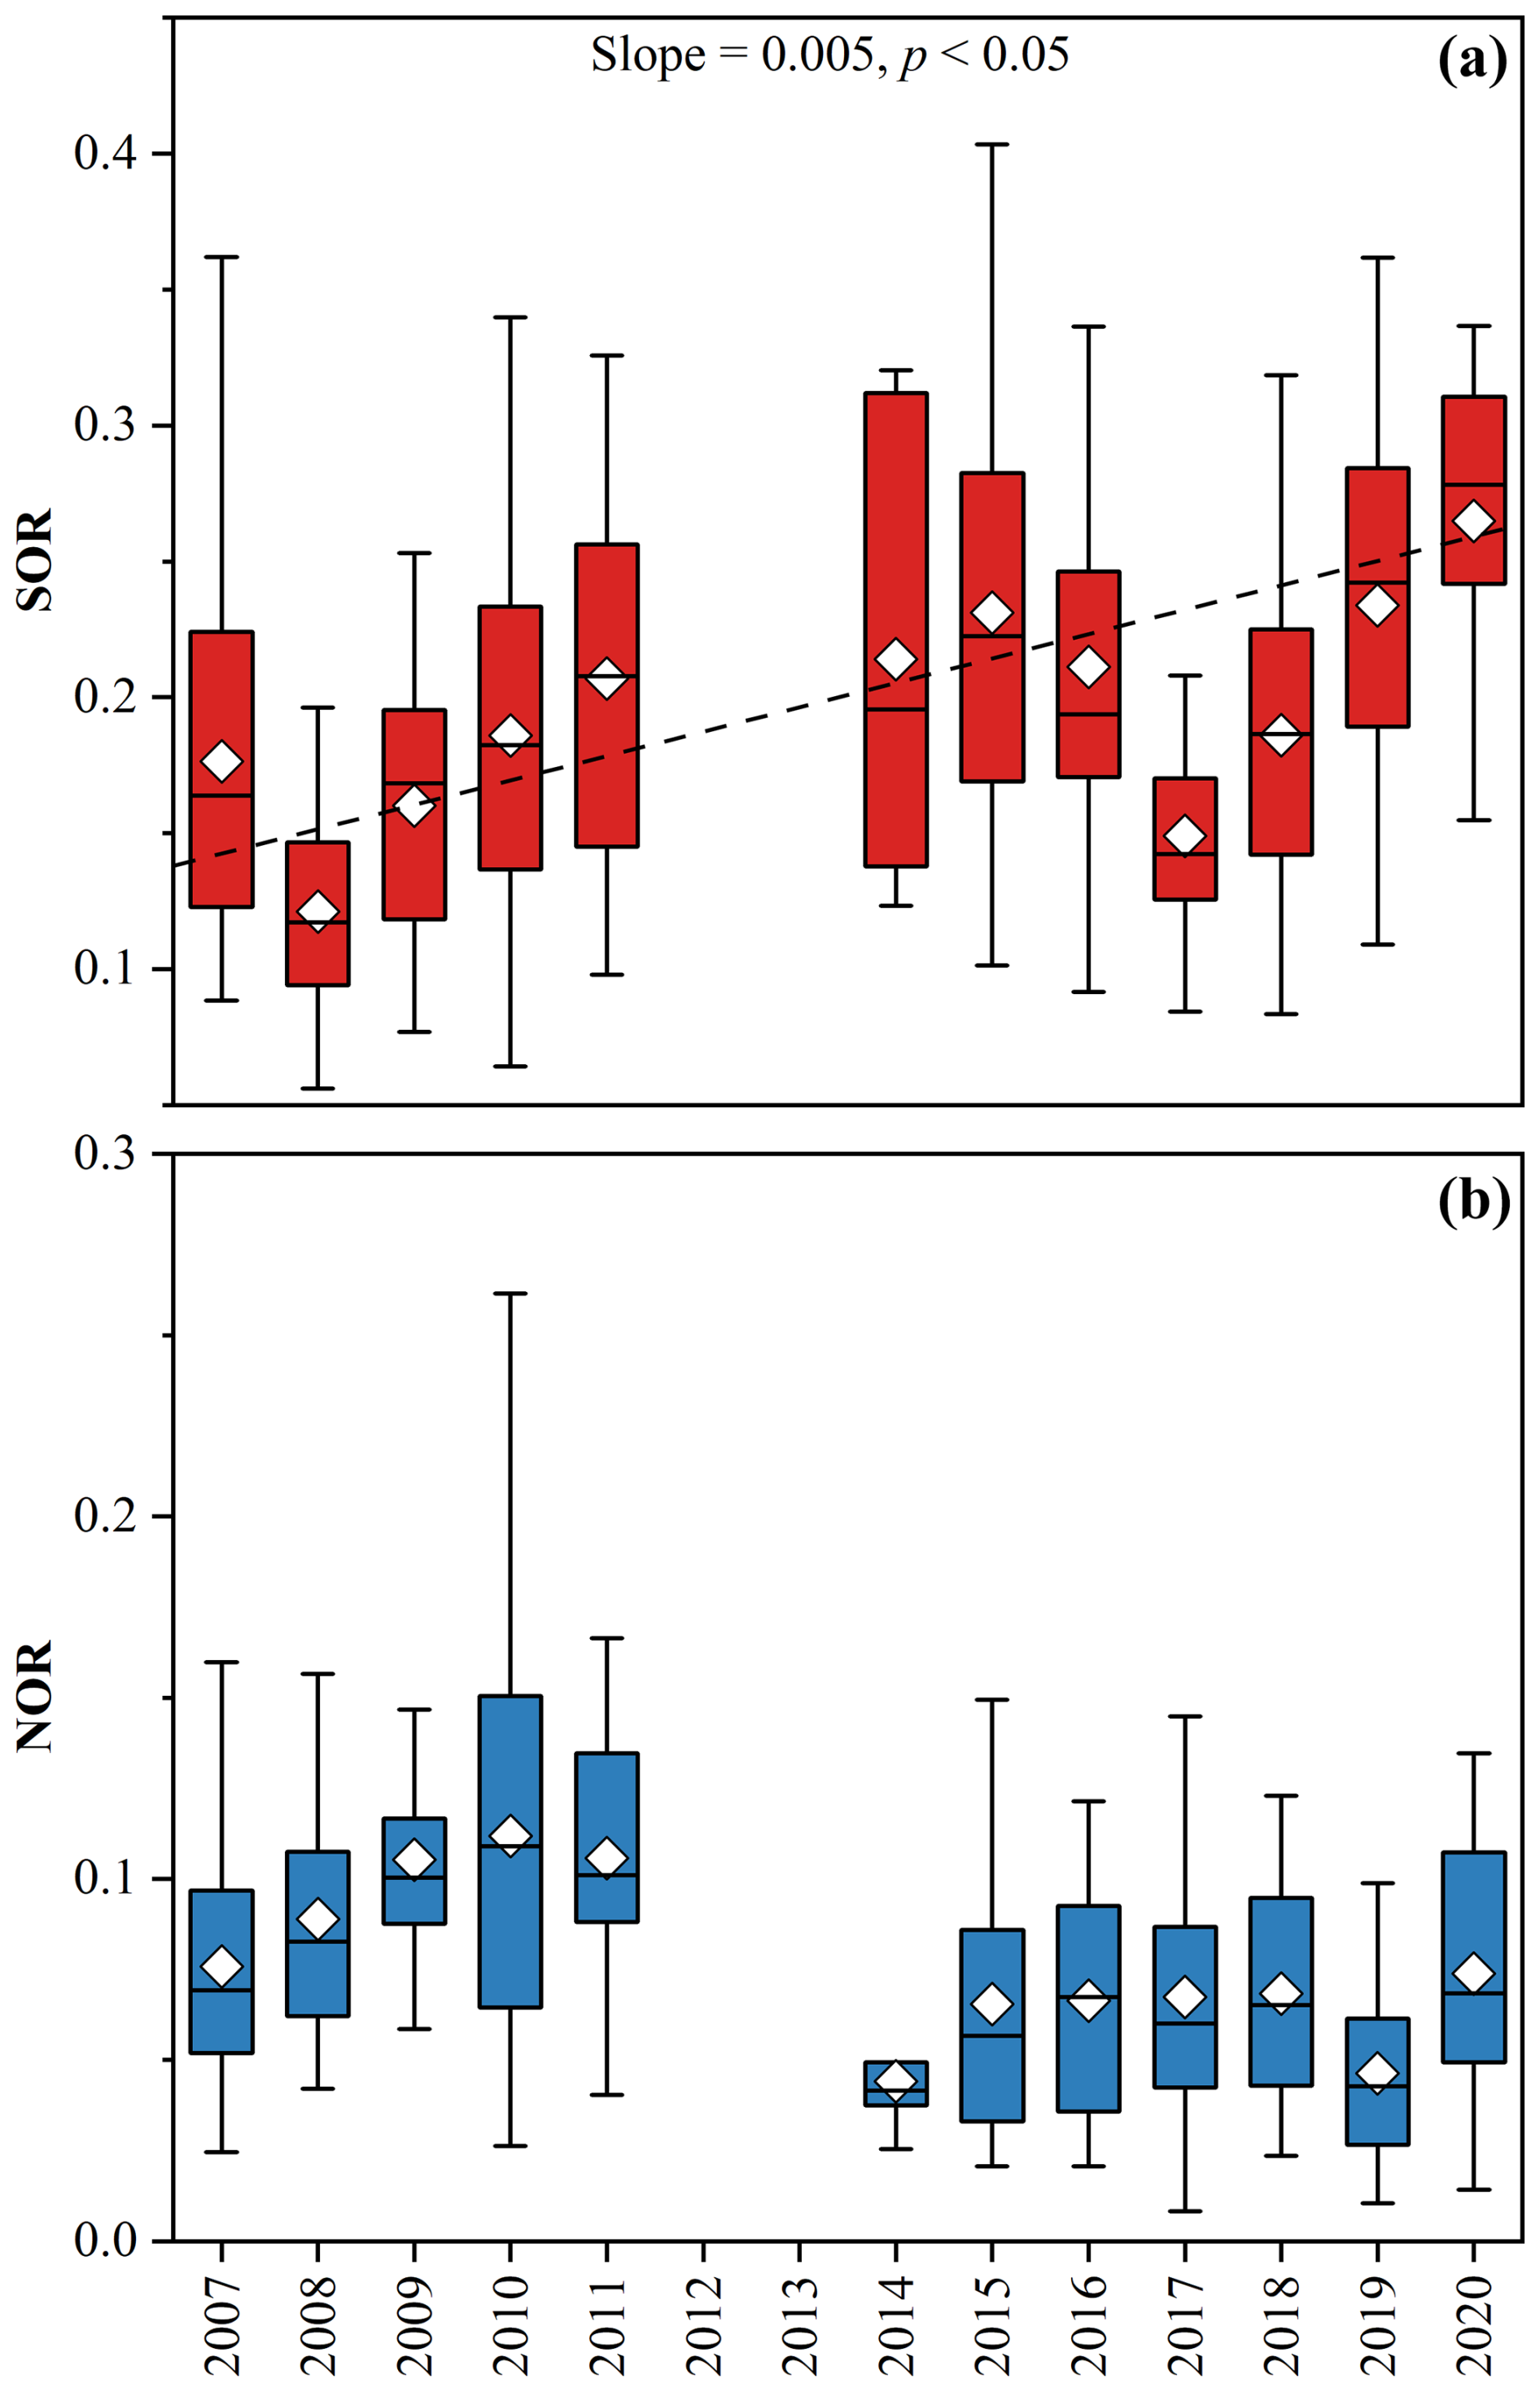
Figure 5The variations in SOR (a) and NOR (b). A dramatic increase in SOR was observed (0.005 yr−1, p < 0.05) and the SOR value in 2020 (0.26 ± 0.09) was 44 % higher than that in 2007 (0.18 ± 0.07). Although there was no significant trend in NOR, the values before 2012 were higher than those after 2013.
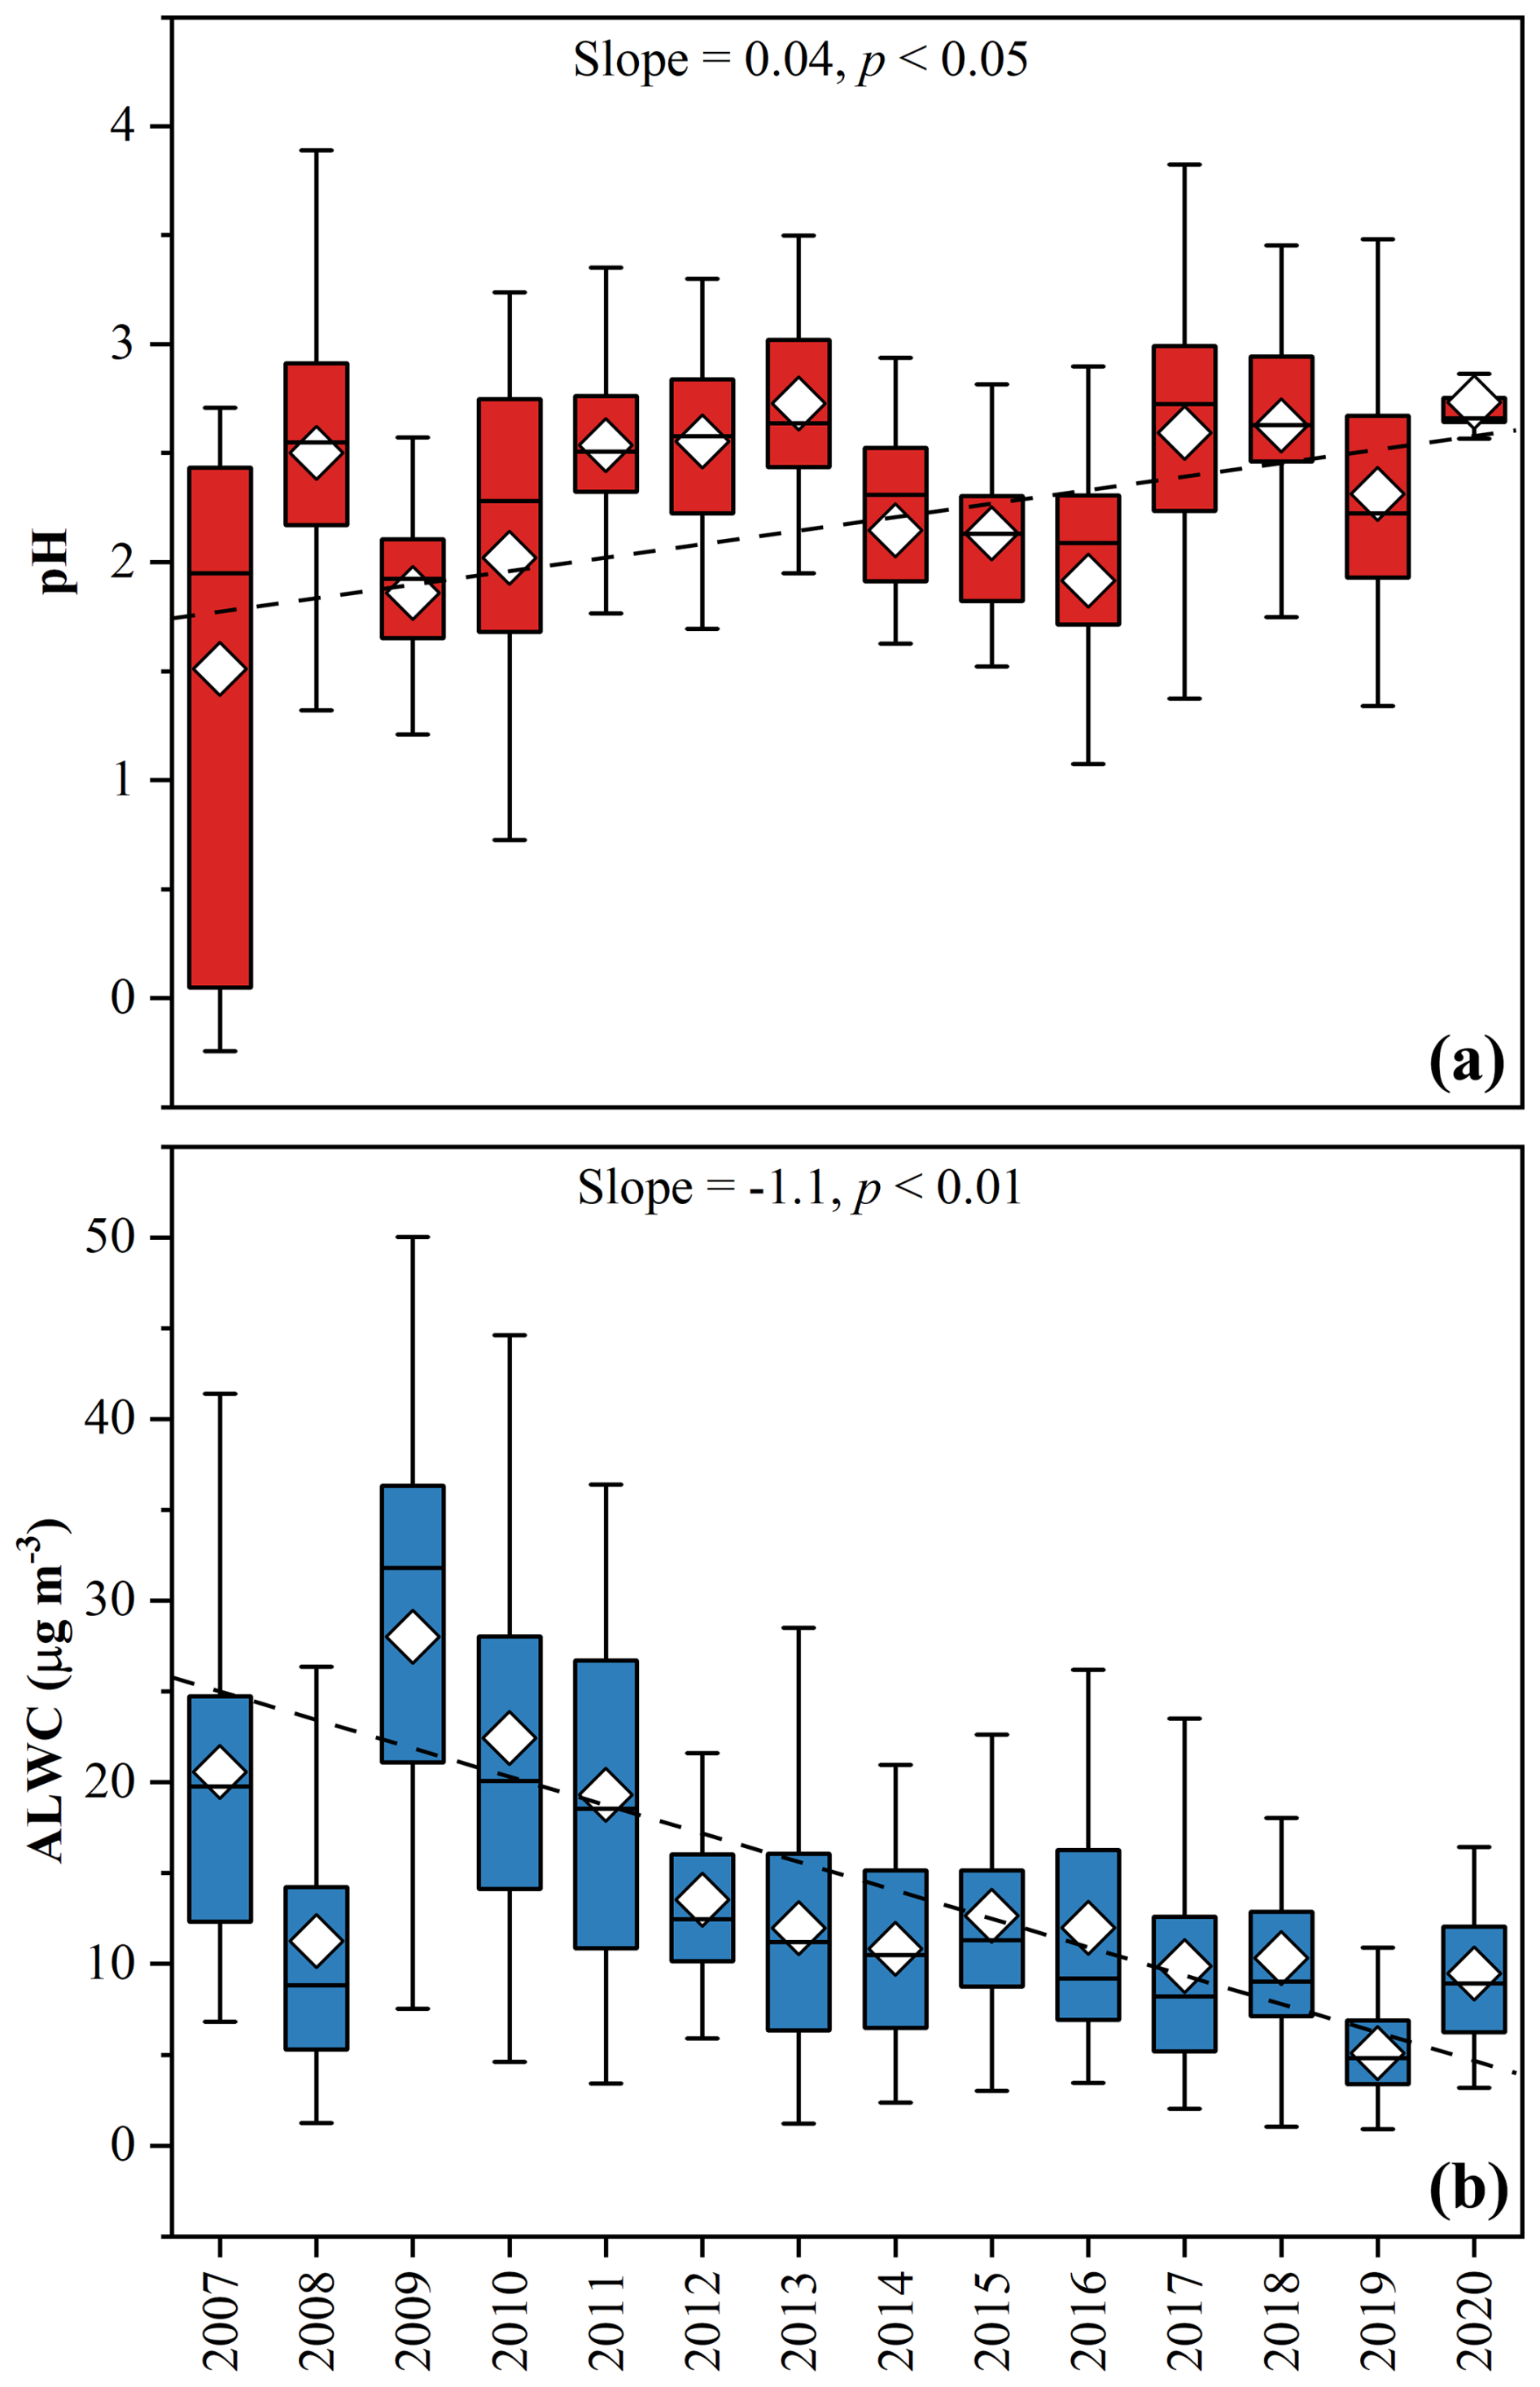
Figure 6(a) Annual average pH increased at a rate of 0.04 yr−1. (b) Annual average ALWC decreased at a rate of −1.1 µg m−3 yr−1.
NOR did not show a clear temporal trend. However, the average NOR values before 2013 (NOR > 0.07) were significantly higher than those in subsequent years (NOR < 0.07) (Fig. 5b, t-test, p < 0.01), which explained the greater reduction in NO compared to NO2. NO can be formed during both daytime and nighttime. During the day, HNO3 is produced via the gas–phase reaction between OH and NO2 and then neutralized by NH3 to produce NO (Reactions R1–R2) (Calvert and Stockwell, 1983). During nighttime, NO2 can also be oxidized by O3 to generate NO3 which further reacts with NO2 to produce N2O5. Heterogeneous uptake of N2O5 is a vital nitrate formation pathway during nighttime (Reactions R3–R5) (Finlayson-Pitts et al., 1989). Figure S15 showed that there were positive correlations between NOR and O3 (r = 0.12), pH (r = 0.25), as well as ALWC (r = 0.55). Different from SOR, higher temperature prevents N2O5 formation and promotes evaporation of HNO3 from particle phase to gas phase, resulting a negative correlation between NOR and temperature (r = −0.18). The result of normalized multiple linear regression for NOR is as below:
The prediction of NOR showed good agreement with the observations (Fig. S13b). The largest regression coefficient and the strongest correlation between ALWC and NOR suggested that the change in NOR was primarily driven by ALWC. The lower ALWC levels after 2013 (Fig. 6b) suppressed heterogeneous formation pathway of nitrate and enhanced the partitioning of nitrate from particle phase into gas phase, leading to the overall lower NOR after 2013.
The gas-particle conversion of NH3 could be affected by anions in particle–phase. Due to the decrease in 2 × n(SO) + n(NO) (Fig. S16), less NH3 was needed to neutralize H2SO4 and HNO3. This resulted in a slight decline in NH (−0.31 µg m−3 yr−1, p < 0.01), while NH3 emissions remained steady (Geng et al., 2019).
SOA is formed through the oxidation of VOCs, followed by partitioning from gas phase to particle phase. Although VOCs emission kept rising (Bian et al., 2019; Guo et al., 2024) and concentration of O3 fluctuated during the past decade, SOA declined significantly (−0.74 µg m−3 yr−1, p < 0.01). Previous studies have demonstrated that ALWC is a key factor driving the partitioning of organic compounds from the gas phase into the particle phase, thereby promoting SOA formation (Ervens et al., 2011; Carlton and Turpin, 2013; Attwood et al., 2014). Nguyen et al. (2015) observed concurrent decreasing trends in ALWC and OC in the Southeast U.S., and further suggested that anthropogenic inorganic species modulated SOA formation through ALWC effects. In addition, higher aerosol acidity has been shown to enhance SOA formation via acid-catalyzed reactions (Surratt et al., 2007). These findings indicated that the reduction in SOA during our study period aerosol could be attributed to the changes in acidity and ALWC, which will be discussed in Sect. 3.3. As SOA accounted for more than 50 % of OM, more efforts are needed to reduce it.
3.3 Impact of changes of major components on aerosol pH and ALWC
ISORROPIA II, a thermodynamic equilibrium model for the K+–Ca2+–Mg2+–NH–Na+–SO–NO–Cl−–H2O aerosol system (Fountoukis and Nenes, 2007), has been widely applied to estimate aerosol pH and ALWC. Here, we applied ISORROPIA–II to estimate aerosol pH and ALWC from 2007 to 2020. Due to the unavailability of gas–phase concentrations of HNO3, HCl, and NH3 during our campaign period, we conducted four iterations to produce the result optimally (Sect. 2.5). The annual variations in pH and ALWC are shown in Fig. 6. As discussed earlier, the reductions in acidic components (SO and NO) were greater than that in the alkaline component (NH), leading to a significant decrease in acidity. Aerosol pH increased from 1.51 ± 1.07 to 2.86 ± 0.49, at a rate of 0.04 yr−1 (p < 0.05). A sharp increase of aerosol pH occurred during 2007–2012 due to rapid decline of SO during this period. As Fu et al. (2015) did not include the gas–phase data in pH calculation, the pH values reported by them (−1.11–0.81) were significantly lower than those in this study (1.51–2.60) during the same period. The rapid reduction in hygroscopic components, especially SO, led the decline of ALWC (Attwood et al., 2014). Our results showed that ALWC decreased from 20.6 ± 10.0 to 9.5 ± 3.9 µg m−3, at a rate of −1.1 µg m−3 yr−1 (p < 0.01). Unexpectedly, low ALWC was observed in 2008 when SIA concentrations, which enhance the hygroscopicity of particulate matter, were at very high levels. It might be associated with low RH (Table S1). To eliminate the influence of changes in meteorological conditions, we used annual average temperature and RH during the entire campaign period as input to recalculate pH and ALWC. The results showed a clear enhancement of ALWC in 2008 (Fig. S17), and the upward trend in pH and downward trend in ALWC still persisted. This demonstrated the long-term trends of pH and ALWC were mainly driven by the changes in chemical composition of PM2.5. As we discussed in Sect. 3.2.2, ALWC exhibited positive correlations with SOR and NOR. This indicated a positive feedback mechanism in which the reductions in hygroscopic components (e.g., sulfate and nitrate) leaded to lower ALWC, thereby suppressing SIA formation. Many studies have demonstrated that high aerosol acidity, ALWC, and O3 will facilitate SOA formation (Ervens et al., 2011; Carlton and Turpin, 2013; Nguyen et al., 2015; Zhang et al., 2022b; Ma et al., 2024; Zhang et al., 2024). Our results also showed that SOA was positively correlated with ALWC and O3, but negatively correlated with pH (Fig. S18). In this study, SOA declined significantly while the emission of VOCs (Bian et al., 2019; Guo et al., 2024) and O3 (Cao et al., 2024) kept rising in the PRD. Consequently, the trend of SOA was mainly driven by the reductions in aerosol acidity and ALWC.
We further investigated changes in pH and ALWC under different pollution levels. As Fig. S19 presented, low pH occurred under elevated pollutant level (IT0), while pH values were close under other levels (IT1–IT4). Additionally, there was no significant difference between the recalculated pH (eliminating the influence of meteorological factors) and the original one, indicating limited impacts of variations of temperature and RH on aerosol acidity. ALWC showed a clear decline pattern with decreasing pollutant levels (IT0–IT4). A significant difference (18 %–35 %, p < 0.01) was observed between the recalculation and original results under IT2–IT4, indicating temperature and RH also exerted a significant influence on ALWC under lower pollution levels.
3.4 Impact of changes in major components on extinction coefficient
We adopted MSE/MAE suggested by Fu et al. (2016), as well as relationship between chemical composition and f(RH) suggested by Li et al. (2021), to reconstruct bext (herein called local parameter scheme) using Eqs. (9)–(12). [AS], [AN], [SS], [LAC] refer to mass concentrations (µg m−3) of NH4SO4, NH4NO3, sea salt, and EC, respectively. The details of PM2.5 reconstruction method followed the previous study (Chow et al., 2015), i.e., AS = 1.375 × SO, AN = 1.29 × NO, LAC = EC and SS = 1.8 × Cl−. RHref was threshold of high RH, 40 % was used here.
Our results showed that bext in the PRD decreased significantly at a rate of −21.44 Mm−1 yr−1 (p < 0.01), aligning with the overall decline of PM2.5 (Fig. 7). However, the highest bext was unexpectedly observed in 2009, even though PM2.5 concentration was lower than 2007 and 2008. This anomaly could result from the highest RH in 2009. As illustrated in Fig. S20, OM dominated bext (44 %–61 %), followed by (NH4)2SO4 (15 %–28 %) and NH4NO3 (6 %–13 %). The proportion of SIA (F) fluctuated during 2007–2020, which leaded to changes in f(RH) and then further influenced bext. As a result, we found that the chemical budget of bext from (NH4)2SO4 did not exhibit a continuous decline trend, while the mass concentration and proportion of SO in PM2.5 decreased significantly.
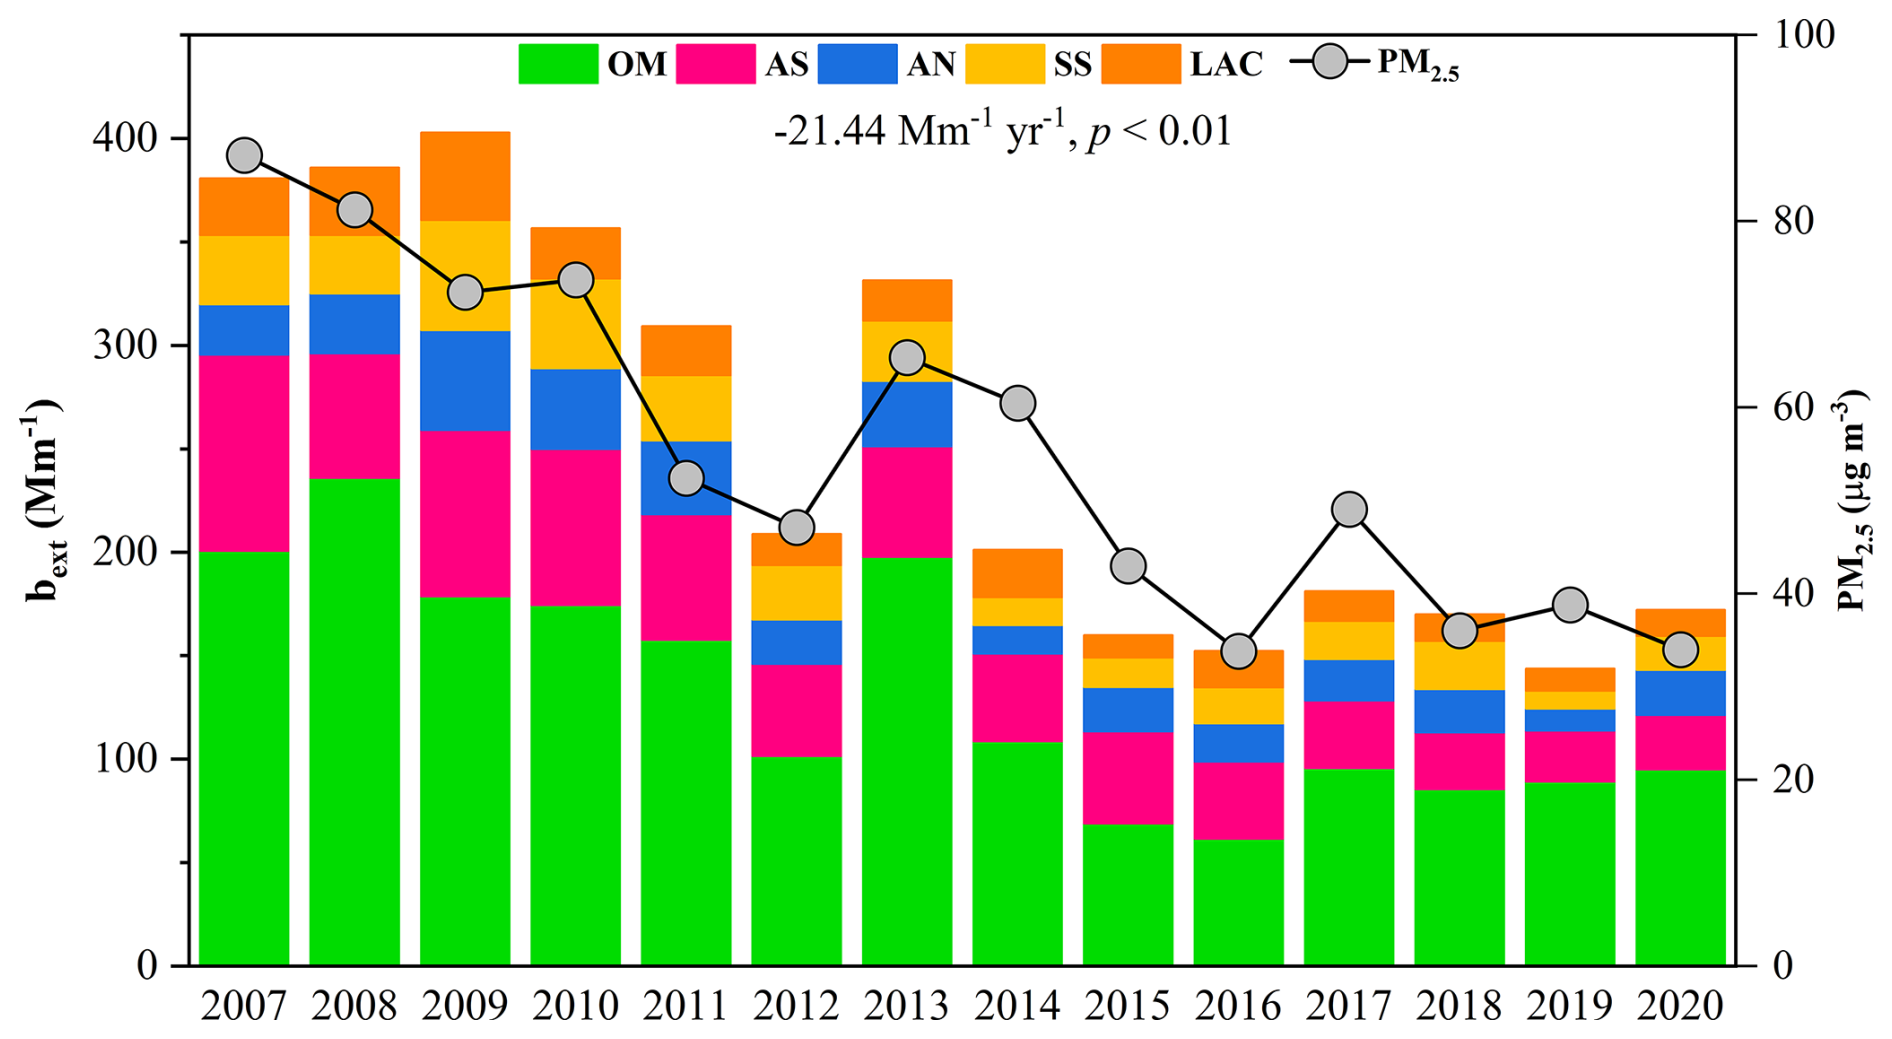
Figure 7Light extinction coefficient (bext) in WQS during 2007–2020. It declined at a rate of −21.44 Mm−1 yr−1 significantly (p < 0.01) and its trend aligned with that of PM2.5.
We also calculated bext by the revised IMPROVE equation proposed in 2007 (Malm and Hand, 2007; Pitchford et al., 2007), and compared to the local parameter scheme (Fig. S21). Generally, bext estimated by the revised IMPROVE equation (335.72 ± 219.64 Mm−1) was significantly higher than that estimated by local parameter scheme (262.67 ± 143.82 Mm−1). We further investigated this discrepancy under different pollution levels. With the improvement in air quality, the difference between the two schemes narrowed gradually (p < 0.01). Our results indicated that the revised IMPROVE equation tended to generate higher bext in elevated pollution periods. Thus, more site–specific parameters and local parameter scheme are needed in those polluted areas to predict bext more accurately.
In this study, we conducted field measurements of PM2.5 mass concentrations and its chemical composition at the PRD regional background site during 2007–2020. PM2.5 levels showed a significant decline from 87.1 ± 15.5 to 34.0 ± 11.3 µg m−3 at a rate of −4.0 µg m−3 yr−1. Secondary species (54 %–79 %) dominated over primary species, although the proportion was lower than that reported in a previous study (∼ 80 %) in the PRD. This discrepancy could be attributed to an overestimation of SOC caused by the EC-tracer method employed in the previous study. In addition, the mass fraction of secondary species increased with the improvement in air quality, suggesting greater attention should be given to them under cleaner conditions. Among primary species, POA, EC, K+ and Ca2+ exhibited significant declines. This indicated that control measures for combustion emissions, biomass burning and dust-related sources were effective. SIA displayed rapid downward trends among secondary species, particularly for SO. Due to the delayed control of NOx emissions compared to SO2, mass fractions of SO decreased from 26.0 % to 18.6 % while NO increased from 7.7 % to 17.5 %. By the end of 2020, the proportion of NO had doubled compared to 2007, approaching the level of SO. Although many previous studies have observed the disproportionate changes in SO SO2 and NO NO2, underlying causes remained unclear. In this study, we found the disproportionate reductions in SO (−10 % yr−1) compared to SO2 (−13 % yr−1), and in NO (−6 % yr−1) compared to NO2 (−3 % yr−1), which were attributed to an increase in SOR and a decrease in NOR, respectively. Correlation analysis indicated that SOR was primarily influenced by O3 and temperature, whereas NOR was driven by ALWC.
Aerosol pH and ALWC were estimated using ISORROAPIA–II. Due to the unavailability of gas–phase concentrations of HNO3, HCl, and NH3 during our campaign period, we proposed a reliable approach involving four iterative calculations to obtain optimal results. Our results showed that aerosol pH increased from 1.51 ± 1.07 to 2.86 ± 0.49 at a rate of 0.04 yr−1. Consistent with previous studies, we found that the impacts of meteorological factors on aerosol pH were limited, while the changes in PM2.5 components significantly influence aerosol pH. ALWC decreased significantly at a rate of −1.1 µg m−3 yr−1 and showed a clear decline pattern with decreasing pollutant levels. This might indicate presence of a positive feedback mechanism between ALWC and hygroscopic components. Given the critical roles of acidity and ALWC in the formation of secondary species, the reductions in acidity and ALWC caused by changes in PM2.5 major components may also suppress the formation of SOA in the atmosphere.
In addition, air visibility greatly improved with decline of PM2.5 chemical components. We used a local parameter scheme to calculate bext and demonstrated that it decreased at a rate of −21.44 Mm−1 yr−1. The revised IMRPOVE formula will generate higher bext values than local parameter scheme under high pollution conditions. Thus, more site–specific parameters and local parameter scheme are needed in polluted areas to predict bext more accurately.
This study highlights that the changes in PM2.5 chemical composition can significantly affect key aerosol physicochemical properties, such as aerosol pH, ALWC, and light extinction coefficient. The variations in aerosol pH and ALWC can, in turn, influence the formation of secondary species. Since the importance of secondary species will become more prominent with continuous air quality improvement, more efforts should focus on them in the future.
The experimental data in this study are available upon request to the corresponding author by email.
The supplement related to this article is available online at https://doi.org/10.5194/acp-25-13729-2025-supplement.
XD conceived the project and designed the study. YFH performed the data analysis and wrote the paper. YQZ, DHC, TZ, KY, JQW, QC, and HJ arranged the sample collection and assisted with the data analysis. ZRW and PL analyzed the samples. XD, QFH, XMW, and MB performed the data interpretation and edited the paper. All authors contributed to the development of the final paper.
At least one of the (co-)authors is a member of the editorial board of Atmospheric Chemistry and Physics. The peer-review process was guided by an independent editor, and the authors also have no other competing interests to declare.
Publisher's note: Copernicus Publications remains neutral with regard to jurisdictional claims made in the text, published maps, institutional affiliations, or any other geographical representation in this paper. While Copernicus Publications makes every effort to include appropriate place names, the final responsibility lies with the authors. Also, please note that this paper has not received English language copy-editing. Views expressed in the text are those of the authors and do not necessarily reflect the views of the publisher.
We thank the National Natural Science Foundation of China and the Guangdong Foundation for Program of Science and Technology Research for funding this research.
This research was funded by the National Natural Science Foundation of China (42321003, 42177090), Guangdong Foundation for Program of Science and Technology Research (2023B0303000007, 2023B1212060049, 2024A1515011181).
This paper was edited by Eleanor Browne and reviewed by two anonymous referees.
Attwood, A. R., Washenfelder, R. A., Brock, C. A., Hu, W., Baumann, K., Campuzano-Jost, P., Day, D. A., Edgerton, E. S., Murphy, D. M., Palm, B. B., McComiskey, A., Wagner, N. L., de Sá, S. S., Ortega, A., Martin, S. T., Jimenez, J. L., and Brown, S. S.: Trends in sulfate and organic aerosol mass in the Southeast U.S.: Impact on aerosol optical depth and radiative forcing, Geophys. Res. Lett., 41, 7701–7709, https://doi.org/10.1002/2014GL061669, 2014.
Berndt, T., Hoffmann, E. H., Tilgner, A., Stratmann, F., and Herrmann, H.: Direct sulfuric acid formation from the gas-phase oxidation of reduced-sulfur compounds, Nat. Commun., 14, 4849, https://doi.org/10.1038/s41467-023-40586-2, 2023.
Bian, Y., Huang, Z., Ou, J., Zhong, Z., Xu, Y., Zhang, Z., Xiao, X., Ye, X., Wu, Y., Yin, X., Li, C., Chen, L., Shao, M., and Zheng, J.: Evolution of anthropogenic air pollutant emissions in Guangdong Province, China, from 2006 to 2015, Atmos. Chem. Phys., 19, 11701–11719, https://doi.org/10.5194/acp-19-11701-2019, 2019.
Blanchard, C. L., Hidy, G. M., Tanenbaum, S., Edgerton, E. S., and Hartsell, B. E.: The Southeastern Aerosol Research and Characterization (SEARCH) study: Temporal trends in gas and PM concentrations and composition, 1999–2010, Journal of the Air & Waste Management Association, 63, 247–259, https://doi.org/10.1080/10962247.2012.748523, 2013.
Bougiatioti, A., Nikolaou, P., Stavroulas, I., Kouvarakis, G., Weber, R., Nenes, A., Kanakidou, M., and Mihalopoulos, N.: Particle water and pH in the eastern Mediterranean: source variability and implications for nutrient availability, Atmos. Chem. Phys., 16, 4579–4591, https://doi.org/10.5194/acp-16-4579-2016, 2016.
Burnett, R., Chen, H., Szyszkowicz, M., Fann, N., Hubbell, B., Pope, C. A., Apte, J. S., Brauer, M., Cohen, A., Weichenthal, S., Coggins, J., Di, Q., Brunekreef, B., Frostad, J., Lim, S. S., Kan, H. D., Walker, K. D., Thurston, G. D., Hayes, R. B., Lim, C. C., Turner, M. C., Jerrett, M., Krewski, D., Gapstur, S. M., Diver, W. R., Ostro, B., Goldberg, D., Crouse, D. L., Martin, R. V., Peters, P., Pinault, L., Tjepkema, M., Donkelaar, A., Villeneuve, P. J., Miller, A. B., Yin, P., Zhou, M. G., Wang, L. J., Janssen, N. A. H., Marra, M., Atkinson, R. W., Tsang, H., Thach, Q., Cannon, J. B., Allen, R. T., Hart, J. E., Laden, F., Cesaroni, G., Forastiere, F., Weinmayr, G., Jaensch, A., Nagel, G., Concin, H., and Spadaro, J. V.: Global estimates of mortality associated with long-term exposure to outdoor fine particulate matter, P. Natl. Acad. Sci. USA, 115, 9592–9597, https://doi.org/10.1073/pnas.1803222115, 2018.
Calvert, J. G. and Stockwell, W. R.: Acid generation in the troposphere by gas-phase chemistry, Environ. Sci. Technol., 17, 428A–443A, https://doi.org/10.1021/es00115a727, 1983.
Cao, J.-J., Wang, Q.-Y., Chow, J. C., Watson, J. G., Tie, X.-X., Shen, Z.-X., Wang, P., and An, Z.-S.: Impacts of aerosol compositions on visibility impairment in Xi'an, China, Atmos. Environ., 59, 559–566, https://doi.org/10.1016/j.atmosenv.2012.05.036, 2012.
Cao, T., Wang, H., Chen, X., Li, L., Lu, X., Lu, K., and Fan, S.: Rapid increase in spring ozone in the Pearl River Delta, China during 2013–2022, npj Clim. Atmos. Sci., 7, 309, https://doi.org/10.1038/s41612-024-00847-3, 2024.
Carlton, A. G. and Turpin, B. J.: Particle partitioning potential of organic compounds is highest in the Eastern US and driven by anthropogenic water, Atmos. Chem. Phys., 13, 10203–10214, https://doi.org/10.5194/acp-13-10203-2013, 2013.
Castro, L. M., Pio, C. A., Harrison, R. M., and Smith, D. J. T.: Carbonaceous aerosol in urban and rural European atmospheres: estimation of secondary organic carbon concentrations, Atmos. Environ., 33, 2771–2781, https://doi.org/10.1016/S1352-2310(98)00331-8, 1999.
Chen, S.-L., Chang, S.-W., Chen, Y.-J., and Chen, H.-L.: Possible warming effect of fine particulate matter in the atmosphere, Commun. Earth Environ., 2, 208, https://doi.org/10.1038/s43247-021-00278-5, 2021.
Cheng, Z., Jiang, J., Chen, C., Gao, J., Wang, S., Watson, J. G., Wang, H., Deng, J., Wang, B., Zhou, M., Chow, J. C., Pitchford, M. L., and Hao, J.: Estimation of Aerosol Mass Scattering Efficiencies under High Mass Loading: Case Study for the Megacity of Shanghai, China, Environ. Sci. Technol., 49, 831–838, https://doi.org/10.1021/es504567q, 2015.
Chow, J. C., Watson, J. G., Lowenthal, D. H., and Magliano, K. L.: Loss of PM2.5 Nitrate from Filter Samples in Central California, Journal of the Air & Waste Management Association, 55, 1158–1168, https://doi.org/10.1080/10473289.2005.10464704, 2005.
Chow, J. C., Lowenthal, D. H., Chen, L. W. A., Wang, X., and Watson, J. G.: Mass reconstruction methods for PM2.5: a review, Air Quality, Atmosphere & Health, 8, 243–263, https://doi.org/10.1007/s11869-015-0338-3, 2015.
Chow, W. S., Liao, K., Huang, X. H. H., Leung, K. F., Lau, A. K. H., and Yu, J. Z.: Measurement report: The 10-year trend of PM2.5 major components and source tracers from 2008 to 2017 in an urban site of Hong Kong, China, Atmos. Chem. Phys., 22, 11557–11577, https://doi.org/10.5194/acp-22-11557-2022, 2022.
Department of Ecology and Environment of Guangdong Province: Urban Ambient Air Quality in Guangdong Province (2015), https://gdee.gd.gov.cn/kqzl/content/post_2301048.html (last access: 13 June 2024), 2016.
Ding, K., Huang, X., Ding, A., Wang, M., Su, H., Kerminen, V.-M., Petäjä, T., Tan, Z., Wang, Z., Zhou, D., Sun, J., Liao, H., Wang, H., Carslaw, K., Wood, R., Zuidema, P., Rosenfeld, D., Kulmala, M., Fu, C., Pöschl, U., Cheng, Y., and Andreae, M. O.: Aerosol-boundary-layer-monsoon interactions amplify semi-direct effect of biomass smoke on low cloud formation in Southeast Asia, Nat. Commun., 12, 6416, https://doi.org/10.1038/s41467-021-26728-4, 2021.
Duan, J., Lyu, R., Wang, Y., Xie, X., Wu, Y., Tao, J., Cheng, T., Liu, Y., Peng, Y., Zhang, R., He, Q., Ga, W., Zhang, X., and Zhang, Q.: Particle Liquid Water Content and Aerosol Acidity Acting as Indicators of Aerosol Activation Changes in Cloud Condensation Nuclei (CCN) during Pollution Eruption in Guangzhou of South China, Aerosol Air Qual. Res., 9, 2662–2670, https://doi.org/10.4209/aaqr.2019.09.0476, 2019.
EMEP: EMEP Monitoring Program, https://emep-ccc.nilu.no/monitoring-program, last access: 3 December 2024.
EPA: Guidance for Tracking Progress Under the Regional Haze Rule, https://www.epa.gov/visibility/guidance-tracking-progress-under-regional-haze-rule (last access: 2 July 2025), 2003.
Ervens, B., Turpin, B. J., and Weber, R. J.: Secondary organic aerosol formation in cloud droplets and aqueous particles (aqSOA): a review of laboratory, field and model studies, Atmos. Chem. Phys., 11, 11069–11102, https://doi.org/10.5194/acp-11-11069-2011, 2011.
Fang, T., Guo, H. Y., Zeng, L. H., Verma, V., Nenes, A., and Weber, R. J.: Highly Acidic Ambient Particles, Soluble Metals, and Oxidative Potential: A Link between Sulfate and Aerosol Toxicity, Environ. Sci. Technol., 51, 2611–2620, https://doi.org/10.1021/acs.est.6b06151, 2017.
Fang, Z. Y., Dong, S. W., Huang, C. P., Jia, S. G., Wang, F., Liu, H. M., Meng, H., Luo, L., Chen, Y. Z., Zhang, H. H., Li, R., Zhu, Y. J., and Tang, M. J.: On using an aerosol thermodynamic model to calculate aerosol acidity of coarse particles, J. Environ. Sci., 148, 46–56, https://doi.org/10.1016/j.jes.2023.07.001, 2025.
Finlayson-Pitts, B. J., Ezell, M. J., and Pitts, J. N.: Formation of chemically active chlorine compounds by reactions of atmospheric NaCl particles with gaseous N2O5 and ClONO2, Nature, 337, 241–244, https://doi.org/10.1038/337241a0, 1989.
Fountoukis, C. and Nenes, A.: ISORROPIA II: a computationally efficient thermodynamic equilibrium model for K+–Ca2+–Mg2+––Na+–––Cl−–H2O aerosols, Atmos. Chem. Phys., 7, 4639–4659, https://doi.org/10.5194/acp-7-4639-2007, 2007.
Fu, X., Guo, H., Wang, X., Ding, X., He, Q., Liu, T., and Zhang, Z.: PM2.5 acidity at a background site in the Pearl River Delta region in fall-winter of 2007–2012, J. Hazard. Mater., 286, 484–492, https://doi.org/10.1016/j.jhazmat.2015.01.022, 2015.
Fu, X., Wang, X., Hu, Q., Li, G., Ding, X., Zhang, Y., He, Q., Liu, T., Zhang, Z., Yu, Q., Shen, R., and Bi, X.: Changes in visibility with PM2.5 composition and relative humidity at a background site in the Pearl River Delta region, J. Environ. Sci., 40, 10–19, https://doi.org/10.1016/j.jes.2015.12.001, 2016.
Fu, X. X., Wang, X. M., Guo, H., Cheung, K. L., Ding, X., Zhao, X. Y., He, Q. F., Gao, B., Zhang, Z., Liu, T. Y., and Zhang, Y. L.: Trends of ambient fine particles and major chemical components in the Pearl River Delta region: Observation at a regional background site in fall and winter, Sci. Total Environ., 497, 274–281, https://doi.org/10.1016/j.scitotenv.2014.08.008, 2014.
Geng, G., Zhang, Q., Tong, D., Li, M., Zheng, Y., Wang, S., and He, K.: Chemical composition of ambient PM2.5 over China and relationship to precursor emissions during 2005–2012, Atmos. Chem. Phys., 17, 9187–9203, https://doi.org/10.5194/acp-17-9187-2017, 2017.
Geng, G., Liu, Y., Liu, Y., Liu, S., Cheng, J., Yan, L., Wu, N., Hu, H., Tong, D., Zheng, B., Yin, Z., He, K., and Zhang, Q.: Efficacy of China's clean air actions to tackle PM2.5 pollution between 2013 and 2020, Nat. Geosci., 17, 987–994, https://doi.org/10.1038/s41561-024-01540-z, 2024.
Geng, G. N., Xiao, Q. Y., Zheng, Y. X., Tong, D., Zhang, Y. X., Zhang, X. Y., Zhang, Q., He, K. B., and Liu, Y.: Impact of China's Air Pollution Prevention and Control Action Plan on PM2.5 chemical composition over eastern China, Science China-Earth Sciences, 62, 1872–1884, https://doi.org/10.1007/s11430-018-9353-x, 2019.
Giannoni, M., Calzolai, G., Chiari, M., Cincinelli, A., Lucarelli, F., Martellini, T., and Nava, S.: A comparison between thermal-optical transmittance elemental carbon measured by different protocols in PM2.5 samples, Sci. Total Environ., 571, 195–205, https://doi.org/10.1016/j.scitotenv.2016.07.128, 2016.
Guo, H., Xu, L., Bougiatioti, A., Cerully, K. M., Capps, S. L., Hite Jr., J. R., Carlton, A. G., Lee, S.-H., Bergin, M. H., Ng, N. L., Nenes, A., and Weber, R. J.: Fine-particle water and pH in the southeastern United States, Atmos. Chem. Phys., 15, 5211–5228, https://doi.org/10.5194/acp-15-5211-2015, 2015.
Guo, Q., Wang, Y., Zheng, J., Zhu, M., Sha, Q. e., and Huang, Z.: Temporal evolution of speciated volatile organic compound (VOC) emissions from solvent use sources in the Pearl River Delta Region, China (2006–2019), Sci. Total Environ., 933, 172888, https://doi.org/10.1016/j.scitotenv.2024.172888, 2024.
Gwynn, R. C., Burnett, R. T., and Thurston, G. D.: A time-series analysis of acidic particulate matter and daily mortality and morbidity in the Buffalo, New York, region, Environ. Health Perspect., 108, 125–133, https://doi.org/10.1289/ehp.00108125, 2000.
Hand, J. L., Prenni, A. J., and Schichtel, B. A.: Trends in Seasonal Mean Speciated Aerosol Composition in Remote Areas of the United States From 2000 Through 2021, J. Geophys. Res.: Atmos., 129, e2023JD039902, https://doi.org/10.1029/2023JD039902, 2024.
HKEPD: A Concise Guide to the Air Pollution Control Ordinance, https://www.epd.gov.hk/epd/english/environmentinhk/air/guide_ref/guide_apco.html#introduction (last access: 3 December 2024), 2021.
Jung, J., Lee, H., Kim, Y. J., Liu, X., Zhang, Y., Gu, J., and Fan, S.: Aerosol chemistry and the effect of aerosol water content on visibility impairment and radiative forcing in Guangzhou during the 2006 Pearl River Delta campaign, J. Environ. Manage., 90, 3231–3244, https://doi.org/10.1016/j.jenvman.2009.04.021, 2009.
Kang, H. G., Kim, Y., Collier, S., Zhang, Q., and Kim, H.: Volatility of Springtime ambient organic aerosol derived with thermodenuder aerosol mass spectrometry in Seoul, Korea, Environ. Pollut., 304, 119203, https://doi.org/10.1016/j.envpol.2022.119203, 2022.
Kawamura, K. and Bikkina, S.: A review of dicarboxylic acids and related compounds in atmospheric aerosols: Molecular distributions, sources and transformation, Atmos. Res., 170, 140–160, https://doi.org/10.1016/j.atmosres.2015.11.018, 2016.
Khan, B., Hays, M. D., Geron, C., and Jetter, J.: Differences in the OC EC Ratios that Characterize Ambient and Source Aerosols due to Thermal-Optical Analysis, Aerosol Sci. Technol., 46, 127–137, https://doi.org/10.1080/02786826.2011.609194, 2012.
Kim, W., Lee, H., Kim, J., Jeong, U., and Kweon, J.: Estimation of seasonal diurnal variations in primary and secondary organic carbon concentrations in the urban atmosphere: EC tracer and multiple regression approaches, Atmos. Environ., 56, 101–108, https://doi.org/10.1016/j.atmosenv.2012.03.076, 2012.
Li, J., Zhang, Z., Wu, Y., Tao, J., Xia, Y., Wang, C., and Zhang, R.: Effects of chemical compositions in fine particles and their identified sources on hygroscopic growth factor during dry season in urban Guangzhou of South China, Sci. Total Environ., 801, 149749, https://doi.org/10.1016/j.scitotenv.2021.149749, 2021.
Li, Y., Lei, L., Sun, J., Gao, Y., Wang, P., Wang, S., Zhang, Z., Du, A., Li, Z., Wang, Z., Kim, J. Y., Kim, H., Zhang, H., and Sun, Y.: Significant Reductions in Secondary Aerosols after the Three-Year Action Plan in Beijing Summer, Environ. Sci. Technol., 57, 15945–15955, https://doi.org/10.1021/acs.est.3c02417, 2023.
Liao, K., Wang, Q., Wang, S., and Yu, J. Z.: Bayesian Inference Approach to Quantify Primary and Secondary Organic Carbon in Fine Particulate Matter Using Major Species Measurements, Environ. Sci. Technol., 57, 5169–5179, https://doi.org/10.1021/acs.est.2c09412, 2023.
Liu, L., Kuang, Y., Zhai, M., Xue, B., He, Y., Tao, J., Luo, B., Xu, W., Tao, J., Yin, C., Li, F., Xu, H., Deng, T., Deng, X., Tan, H., and Shao, M.: Strong light scattering of highly oxygenated organic aerosols impacts significantly on visibility degradation, Atmos. Chem. Phys., 22, 7713–7726, https://doi.org/10.5194/acp-22-7713-2022, 2022.
Liu, M., Song, Y., Zhou, T., Xu, Z., Yan, C., Zheng, M., Wu, Z., Hu, M., Wu, Y., and Zhu, T.: Fine particle pH during severe haze episodes in northern China, Geophys. Res. Lett., 44, 5213–5221, https://doi.org/10.1002/2017GL073210, 2017.
Liu, P., Chen, H., Song, Y., Xue, C., Ye, C., Zhao, X., Zhang, C., Liu, J., and Mu, Y.: Atmospheric ammonia in the rural North China Plain during wintertime: Variations, sources, and implications for HONO heterogeneous formation, Sci. Total Environ., 861, 160768, https://doi.org/10.1016/j.scitotenv.2022.160768, 2023.
Liu, T. Y., Chan, A. W. H., and Abbatt, J. P. D.: Multiphase Oxidation of Sulfur Dioxide in Aerosol Particles: Implications for Sulfate Formation in Polluted Environments, Environ. Sci. Technol., 55, 4227–4242, https://doi.org/10.1021/acs.est.0c06496, 2021.
Luo, L., Zhang, Y.-Y., Xiao, H.-Y., Xiao, H.-W., Zheng, N.-J., Zhang, Z.-Y., Xie, Y.-J., and Liu, C.: Spatial Distributions and Sources of Inorganic Chlorine in PM2.5 across China in Winter, Atmosphere, 10, 505, https://doi.org/10.3390/atmos10090505, 2019.
Ma, F., Wang, H., Ding, Y., Zhang, S., Wu, G., Li, Y., Gong, D., Ristovski, Z., He, C., and Wang, B.: Amplified Secondary Organic Aerosol Formation Induced by Anthropogenic–Biogenic Interactions in Forests Around Megacities, J. Geophys. Res.: Atmos., 129, e2024JD041679, https://doi.org/10.1029/2024JD041679, 2024.
Malm, W. C. and Hand, J. L.: An examination of the physical and optical properties of aerosols collected in the IMPROVE program, Atmos. Environ., 41, 3407–3427, https://doi.org/10.1016/j.atmosenv.2006.12.012, 2007.
Malm, W. C., Sisler, J. F., Huffman, D., Eldred, R. A., and Cahill, T. A.: Spatial and seasonal trends in particle concentration and optical extinction in the United States, J. Geophys. Res.: Atmos., 99, 1347–1370, https://doi.org/10.1029/93JD02916, 1994.
Ming, L., Jin, L., Li, J., Fu, P., Yang, W., Liu, D., Zhang, G., Wang, Z., and Li, X.: PM2.5 in the Yangtze River Delta, China: Chemical compositions, seasonal variations, and regional pollution events, Environ. Pollut., 223, 200–212, https://doi.org/10.1016/j.envpol.2017.01.013, 2017.
Nenes, A., Pandis, S. N., and Pilinis, C.: ISORROPIA: A New Thermodynamic Equilibrium Model for Multiphase Multicomponent Inorganic Aerosols, Aquat. Geochem., 4, 123–152, https://doi.org/10.1023/A:1009604003981, 1998.
Nenes, A., Pandis, S. N., Weber, R. J., and Russell, A.: Aerosol pH and liquid water content determine when particulate matter is sensitive to ammonia and nitrate availability, Atmos. Chem. Phys., 20, 3249–3258, https://doi.org/10.5194/acp-20-3249-2020, 2020.
Nenes, A., Pandis, S. N., Kanakidou, M., Russell, A. G., Song, S., Vasilakos, P., and Weber, R. J.: Aerosol acidity and liquid water content regulate the dry deposition of inorganic reactive nitrogen, Atmos. Chem. Phys., 21, 6023–6033, https://doi.org/10.5194/acp-21-6023-2021, 2021.
Nguyen, T. K. V., Capps, S. L., and Carlton, A. G.: Decreasing Aerosol Water Is Consistent with OC Trends in the Southeast U.S, Environ. Sci. Technol., 49, 7843–7850, https://doi.org/10.1021/acs.est.5b00828, 2015.
Nguyen, T. K. V., Zhang, Q., Jimenez, J. L., Pike, M., and Carlton, A. G.: Liquid Water: Ubiquitous Contributor to Aerosol Mass, Environ. Sci. Technol. Lett., 3, 257–263, https://doi.org/10.1021/acs.estlett.6b00167, 2016.
NIOSH: NIOSH Method 5040 Issue 3 (Interim): Elemental Carbon (diesel exhaust), https://hero.epa.gov/hero/index.cfm/reference/details/reference_id/156811 (last access: 14 July 2025), 1999.
Pio, C., Cerqueira, M., Harrison, R. M., Nunes, T., Mirante, F., Alves, C., Oliveira, C., Sanchez de la Campa, A., Artíñano, B., and Matos, M.: OC EC ratio observations in Europe: Re-thinking the approach for apportionment between primary and secondary organic carbon, Atmos. Environ., 45, 6121–6132, https://doi.org/10.1016/j.atmosenv.2011.08.045, 2011.
Pitchford, M., Maim, W., Schichtel, B., Kumar, N., Lowenthal, D., and Hand, J.: Revised algorithm for estimating light extinction from IMPROVE particle speciation data, Journal of the Air & Waste Management Association, 57, 1326–1336, https://doi.org/10.3155/1047-3289.57.11.1326, 2007.
Pye, H. O. T., Nenes, A., Alexander, B., Ault, A. P., Barth, M. C., Clegg, S. L., Collett Jr., J. L., Fahey, K. M., Hennigan, C. J., Herrmann, H., Kanakidou, M., Kelly, J. T., Ku, I.-T., McNeill, V. F., Riemer, N., Schaefer, T., Shi, G., Tilgner, A., Walker, J. T., Wang, T., Weber, R., Xing, J., Zaveri, R. A., and Zuend, A.: The acidity of atmospheric particles and clouds, Atmos. Chem. Phys., 20, 4809–4888, https://doi.org/10.5194/acp-20-4809-2020, 2020.
Pye, H. O. T., Ward-Caviness, C. K., Murphy, B. N., Appel, K. W., and Seltzer, K. M.: Secondary organic aerosol association with cardiorespiratory disease mortality in the United States, Nat. Commun., 12, 7215, https://doi.org/10.1038/s41467-021-27484-1, 2021.
Qu, Z., Henze, D. K., Capps, S. L., Wang, Y., Xu, X., Wang, J., and Keller, M.: Monthly top-down NOx emissions for China (2005–2012): A hybrid inversion method and trend analysis, J. Geophys. Res. Atmos., 122, 4600–4625, https://doi.org/10.1002/2016JD025852, 2017.
Reuter, M., Buchwitz, M., Hilboll, A., Richter, A., Schneising, O., Hilker, M., Heymann, J., Bovensmann, H., and Burrows, J. P.: Decreasing emissions of NOx relative to CO2 in East Asia inferred from satellite observations, Nat. Geosci., 7, 792–795, https://doi.org/10.1038/ngeo2257, 2014.
Seinfeld, J. H., Pandis, S. N., and Noone, K. J. J. P. T.: Atmospheric Chemistry and Physics: From Air Pollution to Climate Change, Phys. Today, 51, 88–90, 1998.
Song, X., Wu, D., Su, Y., Li, Y., and Li, Q.: Review of health effects driven by aerosol acidity: Occurrence and implications for air pollution control, Sci. Total Environ., 955, 176839, https://doi.org/10.1016/j.scitotenv.2024.176839, 2024.
Su, H., Cheng, Y., and Pöschl, U.: New Multiphase Chemical Processes Influencing Atmospheric Aerosols, Air Quality, and Climate in the Anthropocene, Acc. Chem. Res., 53, 2034–2043, https://doi.org/10.1021/acs.accounts.0c00246, 2020.
Surratt, J. D., Lewandowski, M., Offenberg, J. H., Jaoui, M., Kleindienst, T. E., Edney, E. O., and Seinfeld, J. H.: Effect of Acidity on Secondary Organic Aerosol Formation from Isoprene, Environ. Sci. Technol., 41, 5363–5369, https://doi.org/10.1021/es0704176, 2007.
Turpin, B. J. and Huntzicker, J. J.: Secondary formation of organic aerosol in the Los Angeles basin: A descriptive analysis of organic and elemental carbon concentrations, Atmospheric Environment. Part A. General Topics, 25, 207–215, https://doi.org/10.1016/0960-1686(91)90291-E, 1991.
Turpin, B. J. and Huntzicker, J. J.: Identification of secondary organic aerosol episodes and quantitation of primary and secondary organic aerosol concentrations during SCAQS, Atmos. Environ., 29, 3527–3544, https://doi.org/10.1016/1352-2310(94)00276-Q, 1995.
Vohra, K., Marais, E. A., Bloss, W. J., Schwartz, J., Mickley, L. J., Van Damme, M., Clarisse, L., and Coheur, P. F.: Rapid rise in premature mortality due to anthropogenic air pollution in fast-growing tropical cities from 2005 to 2018, Sci. Adv., 8, https://doi.org/10.1126/sciadv.abm4435, 2022.
Wang, G., Tao, Y., Chen, J., Liu, C., Qin, X., Li, H., Yun, L., Zhang, M., Zheng, H., Gui, H., Liu, J., Huo, J., Fu, Q., Deng, C., and Huang, K.: Quantitative Decomposition of Influencing Factors to Aerosol pH Variation over the Coasts of the South China Sea, East China Sea, and Bohai Sea, Environ. Sci. Technol. Lett., https://doi.org/10.1021/acs.estlett.2c00527, 2022a.
Wang, G. H., Zhang, R. Y., Gomez, M. E., Yang, L. X., Zamora, M. L., Hu, M., Lin, Y., Peng, J. F., Guo, S., Meng, J. J., Li, J. J., Cheng, C. L., Hu, T. F., Ren, Y. Q., Wang, Y. S., Gao, J., Cao, J. J., An, Z. S., Zhou, W. J., Li, G. H., Wang, J. Y., Tian, P. F., Marrero-Ortiz, W., Secrest, J., Du, Z. F., Zheng, J., Shang, D. J., Zeng, L. M., Shao, M., Wang, W. G., Huang, Y., Wang, Y., Zhu, Y. J., Li, Y. X., Hu, J. X., Pan, B., Cai, L., Cheng, Y. T., Ji, Y. M., Zhang, F., Rosenfeld, D., Liss, P. S., Duce, R. A., Kolb, C. E., and Molina, M. J.: Persistent sulfate formation from London Fog to Chinese haze, P. Natl. Acad. Sci. USA, 113, 13630–13635, https://doi.org/10.1073/pnas.1616540113, 2016.
Wang, J., Gao, J., Che, F., Wang, Y., Lin, P., and Zhang, Y.: Decade-long trends in chemical component properties of PM2.5 in Beijing, China (2011–2020), Sci. Total Environ., 832, 154664, https://doi.org/10.1016/j.scitotenv.2022.154664, 2022b.
Wang, N., Xu, J. W., Pei, C. L., Tang, R., Zhou, D. R., Chen, Y. N., Li, M., Deng, X. J., Deng, T., Huang, X., and Ding, A. J.: Air Quality During COVID-19 Lockdown in the Yangtze River Delta and the Pearl River Delta: Two Different Responsive Mechanisms to Emission Reductions in China, Environ. Sci. Technol., 55, 5721–5730, https://doi.org/10.1021/acs.est.0c08383, 2021.
Wang, S., Wang, L., Li, Y., Wang, C., Wang, W., Yin, S., and Zhang, R.: Effect of ammonia on fine-particle pH in agricultural regions of China: comparison between urban and rural sites, Atmos. Chem. Phys., 20, 2719–2734, https://doi.org/10.5194/acp-20-2719-2020, 2020.
Wang, X. M., Ding, X., Fu, X. X., He, Q. F., Wang, S. Y., Bernard, F., Zhao, X. Y., and Wu, D.: Aerosol scattering coefficients and major chemical compositions of fine particles observed at a rural site hit the central Pearl River Delta, South China, J. Environ. Sci., 24, 72–77, https://doi.org/10.1016/s1001-0742(11)60730-4, 2012.
Wen, L., Xue, L., Wang, X., Xu, C., Chen, T., Yang, L., Wang, T., Zhang, Q., and Wang, W.: Summertime fine particulate nitrate pollution in the North China Plain: increasing trends, formation mechanisms and implications for control policy, Atmos. Chem. Phys., 18, 11261–11275, https://doi.org/10.5194/acp-18-11261-2018, 2018.
World Health Organization: WHO Global Air Quality Guidelines in 2021, https://www.who.int/news-room/questions-and-answers/item/who-global-air-quality-guidelines (last access: 17 June 2024), 2021.
Wu, C. and Yu, J. Z.: Determination of primary combustion source organic carbon-to-elemental carbon (OC EC) ratio using ambient OC and EC measurements: secondary OC-EC correlation minimization method, Atmos. Chem. Phys., 16, 5453–5465, https://doi.org/10.5194/acp-16-5453-2016, 2016.
Wu, G., Wang, H., Zhang, C., Gong, D., Liu, X., Ristovski, Z., and Wang, B.: Anthropogenic pollutants induce enhancement of aerosol acidity at a mountainous background atmosphere in southern China, Sci. Total Environ., 903, 166192, https://doi.org/10.1016/j.scitotenv.2023.166192, 2023.
Yan, F. H., Chen, W. H., Jia, S. G., Zhong, B. Q., Yang, L. M., Mao, J. Y., Chang, M., Shao, M., Yuan, B., Situ, S., Wang, X. M., Chen, D. H., and Wang, X. M.: Stabilization for the secondary species contribution to PM2.5 in the Pearl River Delta (PRD) over the past decade, China: A meta-analysis, Atmos. Environ., 242, https://doi.org/10.1016/j.atmosenv.2020.117817, 2020.
Yang, K., Chen, D.-H., Ding, X., Li, J., Zhang, Y.-Q., Zhang, T., Wang, Q.-Y., Wang, J.-Q., Cheng, Q., Jiang, H., Liu, P., Wang, Z.-R., He, Y.-F., Zhang, G., and Wang, X.-M.: Different roles of primary and secondary sources in reducing PM2.5: Insights from molecular markers in Pearl River Delta, South China, Atmos. Environ., 294, 119487, https://doi.org/10.1016/j.atmosenv.2022.119487, 2023.
Yu, J. Z., Huang, X.-F., Xu, J., and Hu, M.: When Aerosol Sulfate Goes Up, So Does Oxalate: Implication for the Formation Mechanisms of Oxalate, Environ. Sci. Technol., 39, 128–133, https://doi.org/10.1021/es049559f, 2005.
Yu, X.-Y., Lee, T., Ayres, B., Kreidenweis, S. M., Malm, W., and Collett, J. L.: Loss of fine particle ammonium from denuded nylon filters, Atmos. Environ., 40, 4797–4807, https://doi.org/10.1016/j.atmosenv.2006.03.061, 2006.
Zhang, Q., Jimenez, J. L., Canagaratna, M. R., Allan, J. D., Coe, H., Ulbrich, I., Alfarra, M. R., Takami, A., Middlebrook, A. M., Sun, Y. L., Dzepina, K., Dunlea, E., Docherty, K., DeCarlo, P. F., Salcedo, D., Onasch, T., Jayne, J. T., Miyoshi, T., Shimono, A., Hatakeyama, S., Takegawa, N., Kondo, Y., Schneider, J., Drewnick, F., Borrmann, S., Weimer, S., Demerjian, K., Williams, P., Bower, K., Bahreini, R., Cottrell, L., Griffin, R. J., Rautiainen, J., Sun, J. Y., Zhang, Y. M., and Worsnop, D. R.: Ubiquity and dominance of oxygenated species in organic aerosols in anthropogenically-influenced Northern Hemisphere midlatitudes, Geophys. Res. Lett., 34, https://doi.org/10.1029/2007gl029979, 2007.
Zhang, Q., Zheng, Y. X., Tong, D., Shao, M., Wang, S. X., Zhang, Y. H., Xu, X. D., Wang, J. N., He, H., Liu, W. Q., Ding, Y. H., Lei, Y., Li, J. H., Wang, Z. F., Zhang, X. Y., Wang, Y. S., Cheng, J., Liu, Y., Shi, Q. R., Yan, L., Geng, G. N., Hong, C. P., Li, M., Liu, F., Zheng, B., Cao, J. J., Ding, A. J., Gao, J., Fu, Q. Y., Huo, J. T., Liu, B. X., Liu, Z. R., Yang, F. M., He, K. B., and Hao, J. M.: Drivers of improved PM2.5 air quality in China from 2013 to 2017, P. Natl. Acad. Sci. USA, 116, 24463–24469, https://doi.org/10.1073/pnas.1907956116, 2019.
Zhang, Q., Meng, X., Shi, S., Kan, L., Chen, R., and Kan, H.: Overview of particulate air pollution and human health in China: Evidence, challenges, and opportunities, The Innovation, 3, 100312, https://doi.org/10.1016/j.xinn.2022.100312, 2022a.
Zhang, S., Gong, D., Wu, G., Li, Y., Ding, Y., Wang, B., and Wang, H.: Molecular characteristics and formation mechanisms of biogenic secondary organic aerosols in the mountainous background atmosphere of southern China, Atmos. Environ., 329, 120540, https://doi.org/10.1016/j.atmosenv.2024.120540, 2024.
Zhang, Y.-Q., Ding, X., He, Q.-F., Wen, T.-X., Wang, J.-Q., Yang, K., Jiang, H., Cheng, Q., Liu, P., Wang, Z.-R., He, Y.-F., Hu, W.-W., Wang, Q.-Y., Xin, J.-Y., Wang, Y.-S., and Wang, X.-M.: Observational Insights into Isoprene Secondary Organic Aerosol Formation through the Epoxide Pathway at Three Urban Sites from Northern to Southern China, Environ. Sci. Technol., 56, 4795–4805, https://doi.org/10.1021/acs.est.1c06974, 2022b.
Zheng, B., Zhang, Q., Zhang, Y., He, K. B., Wang, K., Zheng, G. J., Duan, F. K., Ma, Y. L., and Kimoto, T.: Heterogeneous chemistry: a mechanism missing in current models to explain secondary inorganic aerosol formation during the January 2013 haze episode in North China, Atmos. Chem. Phys., 15, 2031–2049, https://doi.org/10.5194/acp-15-2031-2015, 2015.
Zhou, M., Zheng, G., Wang, H., Qiao, L., Zhu, S., Huang, D., An, J., Lou, S., Tao, S., Wang, Q., Yan, R., Ma, Y., Chen, C., Cheng, Y., Su, H., and Huang, C.: Long-term trends and drivers of aerosol pH in eastern China, Atmos. Chem. Phys., 22, 13833–13844, https://doi.org/10.5194/acp-22-13833-2022, 2022.
Zhu, C.-S., Cao, J.-J., Tsai, C.-J., Zhang, Z.-S., and Tao, J.: Biomass burning tracers in rural and urban ultrafine particles in Xi'an, China, Atmos. Pollut. Res., 8, 614–618, https://doi.org/10.1016/j.apr.2016.12.011, 2017.