the Creative Commons Attribution 4.0 License.
the Creative Commons Attribution 4.0 License.
 | 22 Oct 2025
Decadal tropospheric ozone radiative forcing estimations with offline radiative modelling and IAGOS aircraft observations
Pasquale Sellitto
Audrey Gaudel
Bastien Sauvage
We use an offline radiative transfer model driven by IAGOS aircraft observations to estimate the tropospheric ozone radiative forcing (RF) at decadal time scale (three time intervals with a common starting period in 1994–2004 and ending periods: 2011–2016, 2017–2019 and 2020–2023), over 11 selected Northern Hemispheric regions. We found a positive trend in the tropospheric ozone column (TOC) for the three time intervals, even if decadal trends are progressively reduced from 2011–2016 (ΔTOC +3.6 ± 2.0 DU, +14.8 ± 11.5 %, 2.5 ± 1.4 DU per decade) to 2017–2019 (ΔTOC +3.9 ± 3.9 DU, +17.5 ± 22.1 %, 2.0 ± 2.0 DU per decade) to 2020–2023 (ΔTOC +3.5 ± 2.8 DU, +13.8 ± 12.1 %, 1.5 ± 1.2 DU per decade). The progressively reduced average TOC decadal trends in 2020–2023 and 2017–2019, with respect to 2011–2016, originate from stagnation in ΔTOC in more recent time intervals (especially in the COVID and post-COVID crisis periods) and decreases of trends of the more radiative efficient upper tropospheric ozone. These average trend reductions are accompanied with reductions of the tropospheric ozone RF, from 2011–2016 (41.6 ± 24.0 mW m−2 per decade) to 2017–2019 (27.6 ± 36.7 mW m−2 per decade) to 2020–2023 (14.6 ± 25.6 mW m−2 per decade). The total tropospheric ozone RF sensitivity varies between 18.4 ± 7.4 mW m−2 DU−1, in 2011–2016, and 11.1 ± 10.4 mW m−2 DU−1, in 2020–2023. Our decadal RF estimates vary from being ∼ 25 %–90 % larger (2011–2016 and 2017–2019 ending periods) to ∼ 30 % smaller (2020–2023 ending period) than the most recent global average RF estimates with online modelling. Our study underlines the importance of the evolution of ozone vertical profiles for the tropospheric ozone RF.
- Article
(2075 KB) - Full-text XML
-
Supplement
(880 KB) - BibTeX
- EndNote


Tropospheric ozone is a secondary atmospheric pollutant. It is either formed through photochemical reactions, which mostly occur in the boundary layer and involve primary anthropogenic pollutants, or is transported from the stratosphere (e.g. Seinfeld and Pandis, 1997). Besides being an air pollutant, with adverse effects on human health and the biosphere (e.g. Monks et al., 2015), tropospheric ozone is a strong short-lived greenhouse gas (Skeie et al., 2020). In addition to the dominant radiative effect in the longwave (LW) spectral range, tropospheric ozone absorbs also ultraviolet and visible radiation, thus it has a radiative effect in the shortwave (SW) spectral range. Due to the progressive increase of anthropogenic emissions of tropospheric ozone precursors, such as nitrogen oxides and volatile organic compounds (VOCs), the tropospheric ozone burden increased globally of up to 50 % since early 1900s (e.g. Szopa et al., 2021). Despite ongoing regulations of the anthropogenic emissions of its precursors, the tropospheric ozone burden was found to continue increasing well into the 2010s (Gaudel et al., 2020, hereafter referred to as G20). Tropospheric ozone increases since the preindustrial era are associated with a radiative forcing (RF). With an estimated present-day global average RF between 0.35 W m−2 (uncertainty range: 0.08–0.61 W m−2) (Skeie et al., 2020) and 0.47 W m−2 (uncertainty range: 0.24–0.70 W m−2) (Forster et al., 2021) since preindustrial era, tropospheric ozone is the third most important anthropogenic climate forcing agent, after carbon dioxide and methane.
As preindustrial era ozone distributions are not available in terms of observations, long-term tropospheric ozone RF estimations are obtained with modelling tools, based on hypotheses on preindustrial emissions and ozone burdens. A significant set of ground-based, ozonesondes and satellite observations are available for more recent times, which can be used to corroborate modelling results with RF estimations at decadal time scales. Thus, tropospheric ozone profiles can be derived with ozone sondes (e.g. Wang et al., 2024) and from ground-based instruments like Fourier transform infrared spectroscopy (e.g. García et al., 2022). Global-scale ozone profiles at the decadal time scale, including tropospheric ozone, can be derived with satellites, which can subsequently be used as a source of information to estimate decadal tropospheric ozone RF. Ziemke et al. (2019) have shown, using satellite data over the period 1979–2016, that the tropospheric ozone column increased of up to 3 DU per decade, or more, even if with large regional inhomogeneities, which translates in a significant RF. More recently, Pope et al. (2024) have estimated the tropospheric ozone radiative effect with satellite data over the period 2008–2017 and shown negligible trends resulting in a very limited decadal RF, in more recent periods. Another source of vertical-resolved ozone observations is the IAGOS (In-Service Aircraft for a Global Observing System) database (Petzold et al., 2015), which is based on ozone measurements by analysers operating on a large number of commercial aircraft flights worldwide. The observations-based RF estimations associated with decadal trends of tropospheric ozone need a radiative transfer tool to connect these trends to their radiative impacts. This can be provided by offline radiative transfer models or, more easily, pre-constructed radiative forcing kernels (e.g. Maycock et al., 2021). While this latter approach can be easier to implement, full ad-hoc radiative transfer calculations assure more flexible RF estimations, and are able e.g. to catch the detailed impacts of background atmosphere and of specific vertical shape of the tropospheric ozone profiles.
In this paper, we first formalise a general approach for offline tropospheric ozone RF estimations associated with observed ozone trends, and then we apply this approach to tropospheric ozone trends of the IAGOS database at the 11 regions defined by G20. In G20, we also presented RF for tropospheric ozone trends based on IAGOS observations, using a column conversion factor as a basic radiative forcing kernel. The present paper builds upon G20 but extends it in two main aspects: (1) full radiative calculations, considering ozone's vertical distribution, are used to obtain the decadal tropospheric ozone RF in the same period as G20 (1994–2004 versus 2011–2016), and (2) additional ozone trends and RF estimations are obtained by prolonging the analysis to two later periods: 2017–2019 and 2020–2023. Point 1 allows the specific attribution of the RF to specific vertical shape variabilities above the 11 regions (e.g. different trends in the upper and lower troposphere, UT and LT), and the differential study of the SW and LW impacts. Point 2 allows the monitoring of the trends and RF impacts at the latest period before (period 2017–2019) and after the COVID crisis (period 2020–2023). The COVID crisis had a specific impact on ozone precursors emission and ozone trends (e.g. Chang et al., 2022).
This paper is structured as follows. In Sect. 2 the data and methods used in this work are introduced, including the offline radiative transfer modelling framework. In Sect. 3 results are presented and discussed. In Sect. 4 conclusions are drawn.
2.1 Offline radiative transfer modelling
The overall idea behind this work is to use an observational description of the decadal trends of tropospheric ozone as input of accurate radiative transfer calculations with a line-by-line offline radiative transfer model (RTM). Similar methodologies have been used in the past for aerosol studies (e.g. Sellitto et al., 2022, 2023) and deviate from the past radiative-kernel-based tropospheric ozone RF estimations. This approach allows the realistic description of the horizontal (regional) and vertical distribution of radiative forcing agents and their temporal evolution, through observations, and avoid the use of approximations of the radiative transfer problem through column parameterisations (like done by G20), or vertically-resolved radiative kernels (like done e.g. by Skeie et al., 2020; Pope et al., 2024).
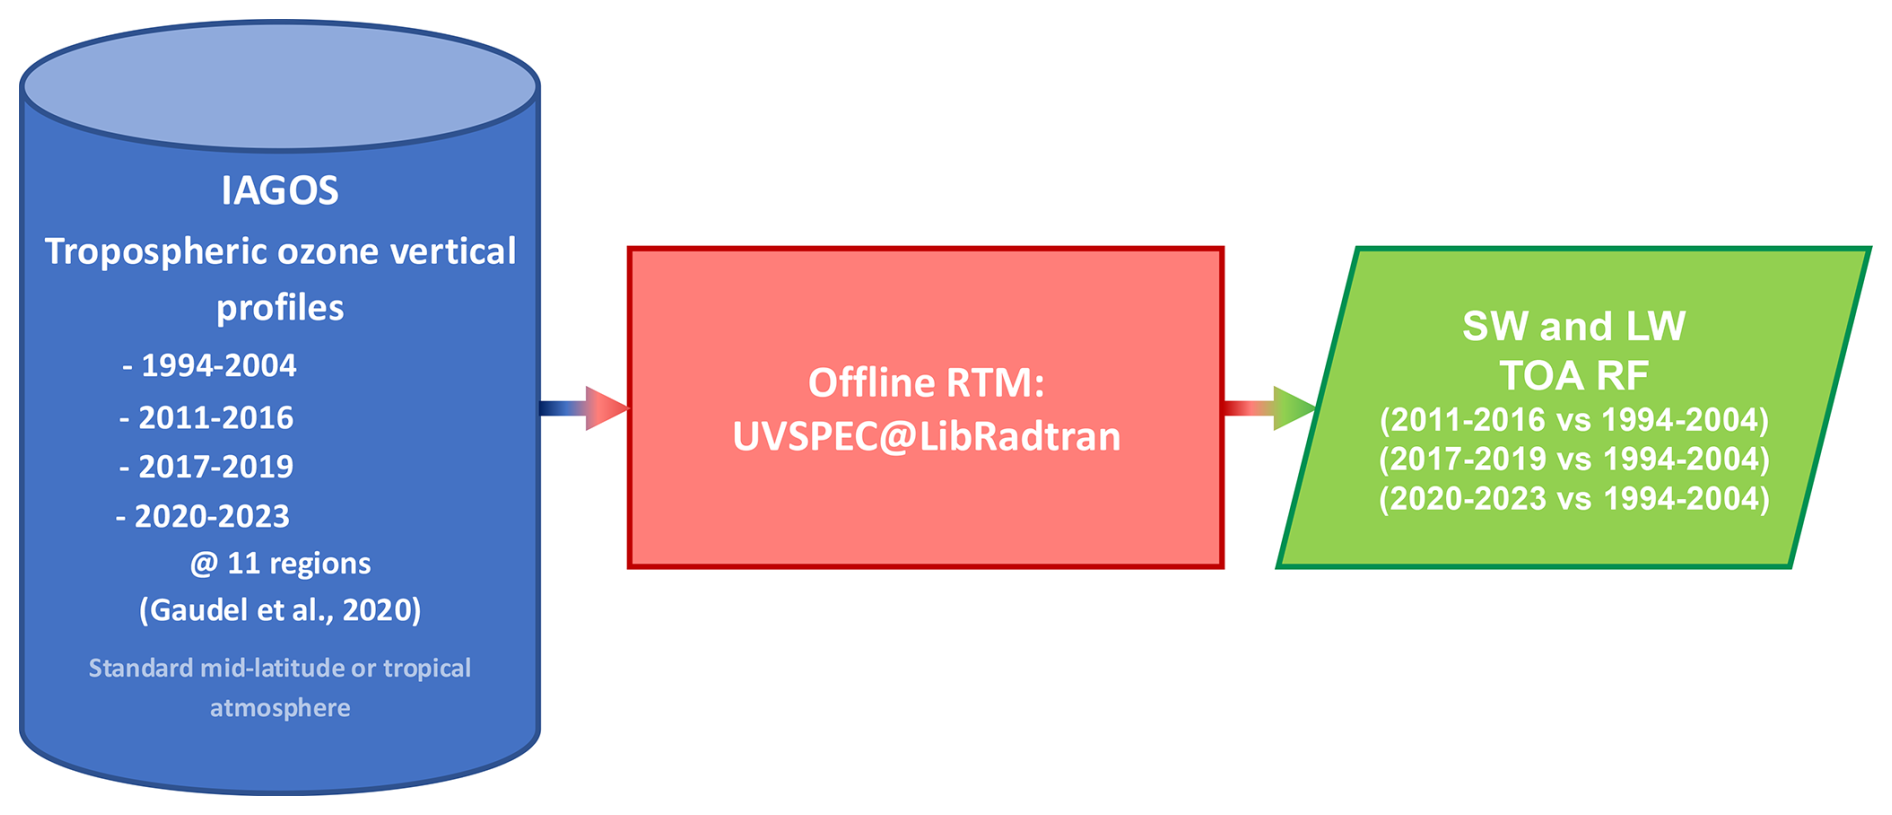
The overall scheme of the offline RTM calculations used in this paper is shown in Fig. 1. Tropospheric ozone vertical profiles are taken from the IAGOS data base and averaged over four periods, 1994–2004, 2011–2016, 2017–2019 and 2020–2023, and the 11 regions defined by G20. Based on their latitude ranges, these average profiles are put in standard mid-latitude or tropical atmospheres taken from the AFGL (Air Force Geophysics Laboratory) data (Anderson et al., 1986). Clear sky conditions and a standard aerosol profile are used for all cases. These atmospheric states are used as inputs to the UVSPEC (UltraViolet SPECtrum) radiative transfer model in its libRadtran (library for Radiative transfer) implementation (Emde et al., 2016), operating at both the SW and LW spectral ranges. Spectra are simulated between 0.3 and 3.0 µm, for the SW range, and from 3.0 to 100.0 µm, for the LW range. We estimate the decadal tropospheric ozone instantaneous RF by comparing the radiative flux outputs at top of the atmosphere (TOA) using the 2011–2016 with respect to using the 1994–2004 tropospheric ozone average profiles, at all regions. This compares with the time frames of G20. Additional RF estimates are obtained by comparing 2017–2019 and 2020–2023, and 1994–2004 averages.
2.2 IAGOS data
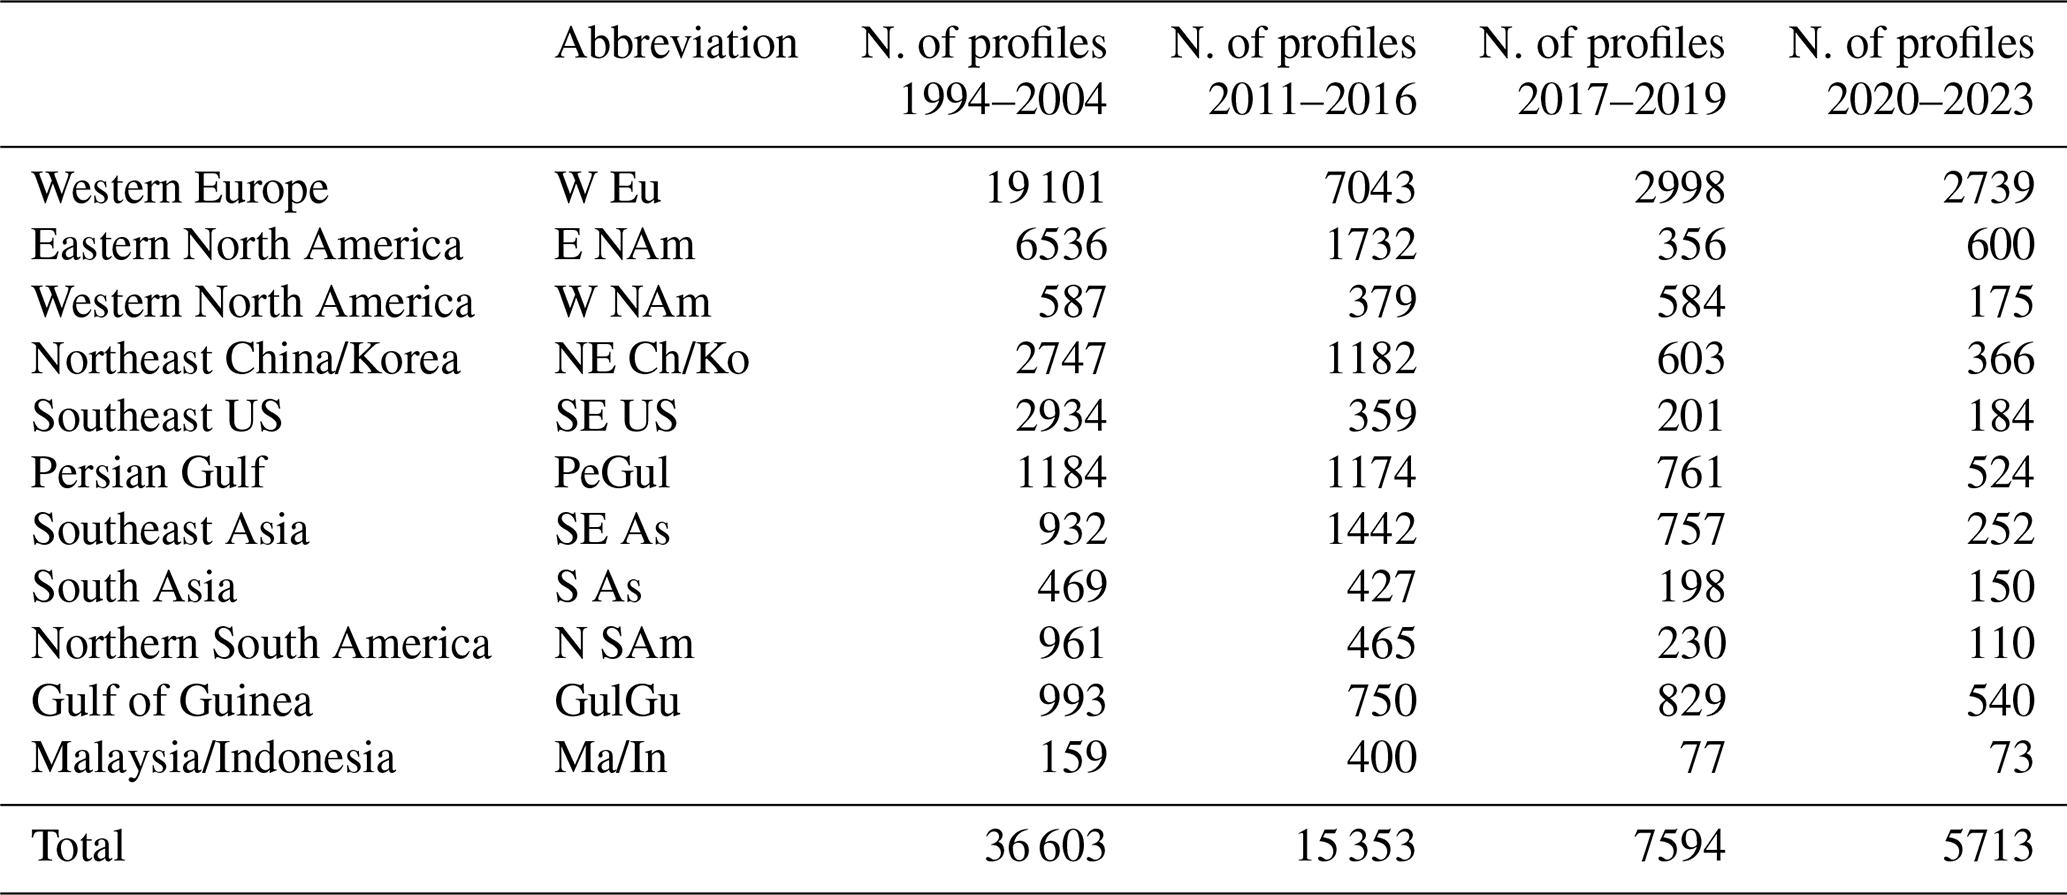
The European research infrastructure, In-service Aircraft for a Global Observing System (IAGOS, https://www.iagos.org/, last access November 2024), provides in situ measurements of chemical species on board several commercial flights. Its predecessors, MOZAIC (Measurement of Ozone and Water Vapor by Airbus In-Service Aircraft: Marenco et al., 1998) and CARIBIC (Civil Aircraft for the Regular Investigation of the Atmosphere Based on an Instrument Container: e.g. Brenninkmeijer et al., 1999), relied on the same principle. The IAGOS infrastructure has been collecting high-quality continuous ozone concentration profiles up to about 12 km (∼ 180 hPa) or less aboard commercial aircraft since 1994 (Blot et al., 2021). Ozone is measured using a UV analyser (Thermo Scientific, model 49) with a total uncertainty of ±2 nmol mol−1 ± 2 % (Nédélec et al., 2015). For this study, we cluster the ozone profiles above 11 regions (listed here from north to south): Western Europe, Eastern North America, Western North America, Northeast China/Korea, Southeast US, Persian Gulf, Southeast Asia, South Asia (formerly known as India, e.g. in G20), Northern South America, Gulf of Guinea, Malaysia/Indonesia. The 50 hPa vertical resolution of the profiles is homogenised across the dataset. As done in G20, in this study, stratospheric fresh air masses characterized by ozone mixing ratio of 125 ppbv and above have been filtered out. Table 1 summarises the number of ozone profiles per region and for the four time-intervals used in the present study. The maps of the flight tracks and the histograms of the number of observations per month, for each region and each time period, are shown in Figs. S1 and S2 in the Supplement, respectively. The density of the sampling in each region vary in terms of the number of flights depending on the time period (see Table 1) but the spatial (Fig. S1) and annual (Fig. S2) coverage is similar for the 11 regions, except for some regions for the time period 2020–2023. Notably, some discrepancies in spatiotemporal sampling, in comparison with the other time periods, are found for 2020–2023, which may introduce additional uncertainties in the final radiative forcing calculation. Most changes are for Western North America, Northern South America, Southeast Asia and Malaysia/Indonesia regions. In addition, Malaysia/Indonesia has significantly less profiles available than the other regions. Thus, the analyses for these regions in 2023 should be taken with caution. Based on the IAGOS vertical concentration profiles, partial ozone columns have additionally been calculated to investigate impacts of the tropospheric ozone variability at specific altitude ranges on the RF. In particular, lower tropospheric (LT), upper tropospheric (UT) and tropospheric (T) ozone columns have been obtained by integrating the concentration profiles from surface to 6 km, from 6 to 11 km and from surface to 11 km, respectively. We decided to keep the vertical intervals constant at all latitude ranges, despite the varying troposphere depth and tropopause height, so to keep the analysis and the interpretation of results simple.
Table 1Number of IAGOS profiles per region for the four time-intervals used in this study. The regions follow the same definition as in G20.
3.1 Tropospheric ozone decadal changes
Figure 2 shows average tropospheric ozone concentration profiles in the different regions addressed in this study, in the time-periods 1994–2004, 2011–2016, 2017–2019 and 2020–2023. The average LT, UT and T ozone columns (LTOC, UTOC and TOC), associated with these regions and time-intervals (corresponding with Fig. 2 profiles) are shown in Fig. 3, and the percent differences of the average 2011–2016 (Fig. 4a), 2017–2019 (Fig. 4b) and 2020–2023 (Fig. 4c) with respect to the average columns 1994–2004 are shown in Fig. 4. Global average values of LTOC, UTOC and TOC variations (ΔLTOC, ΔUTOC and ΔTOC, as absolute and percent values) are reported in Table 2.
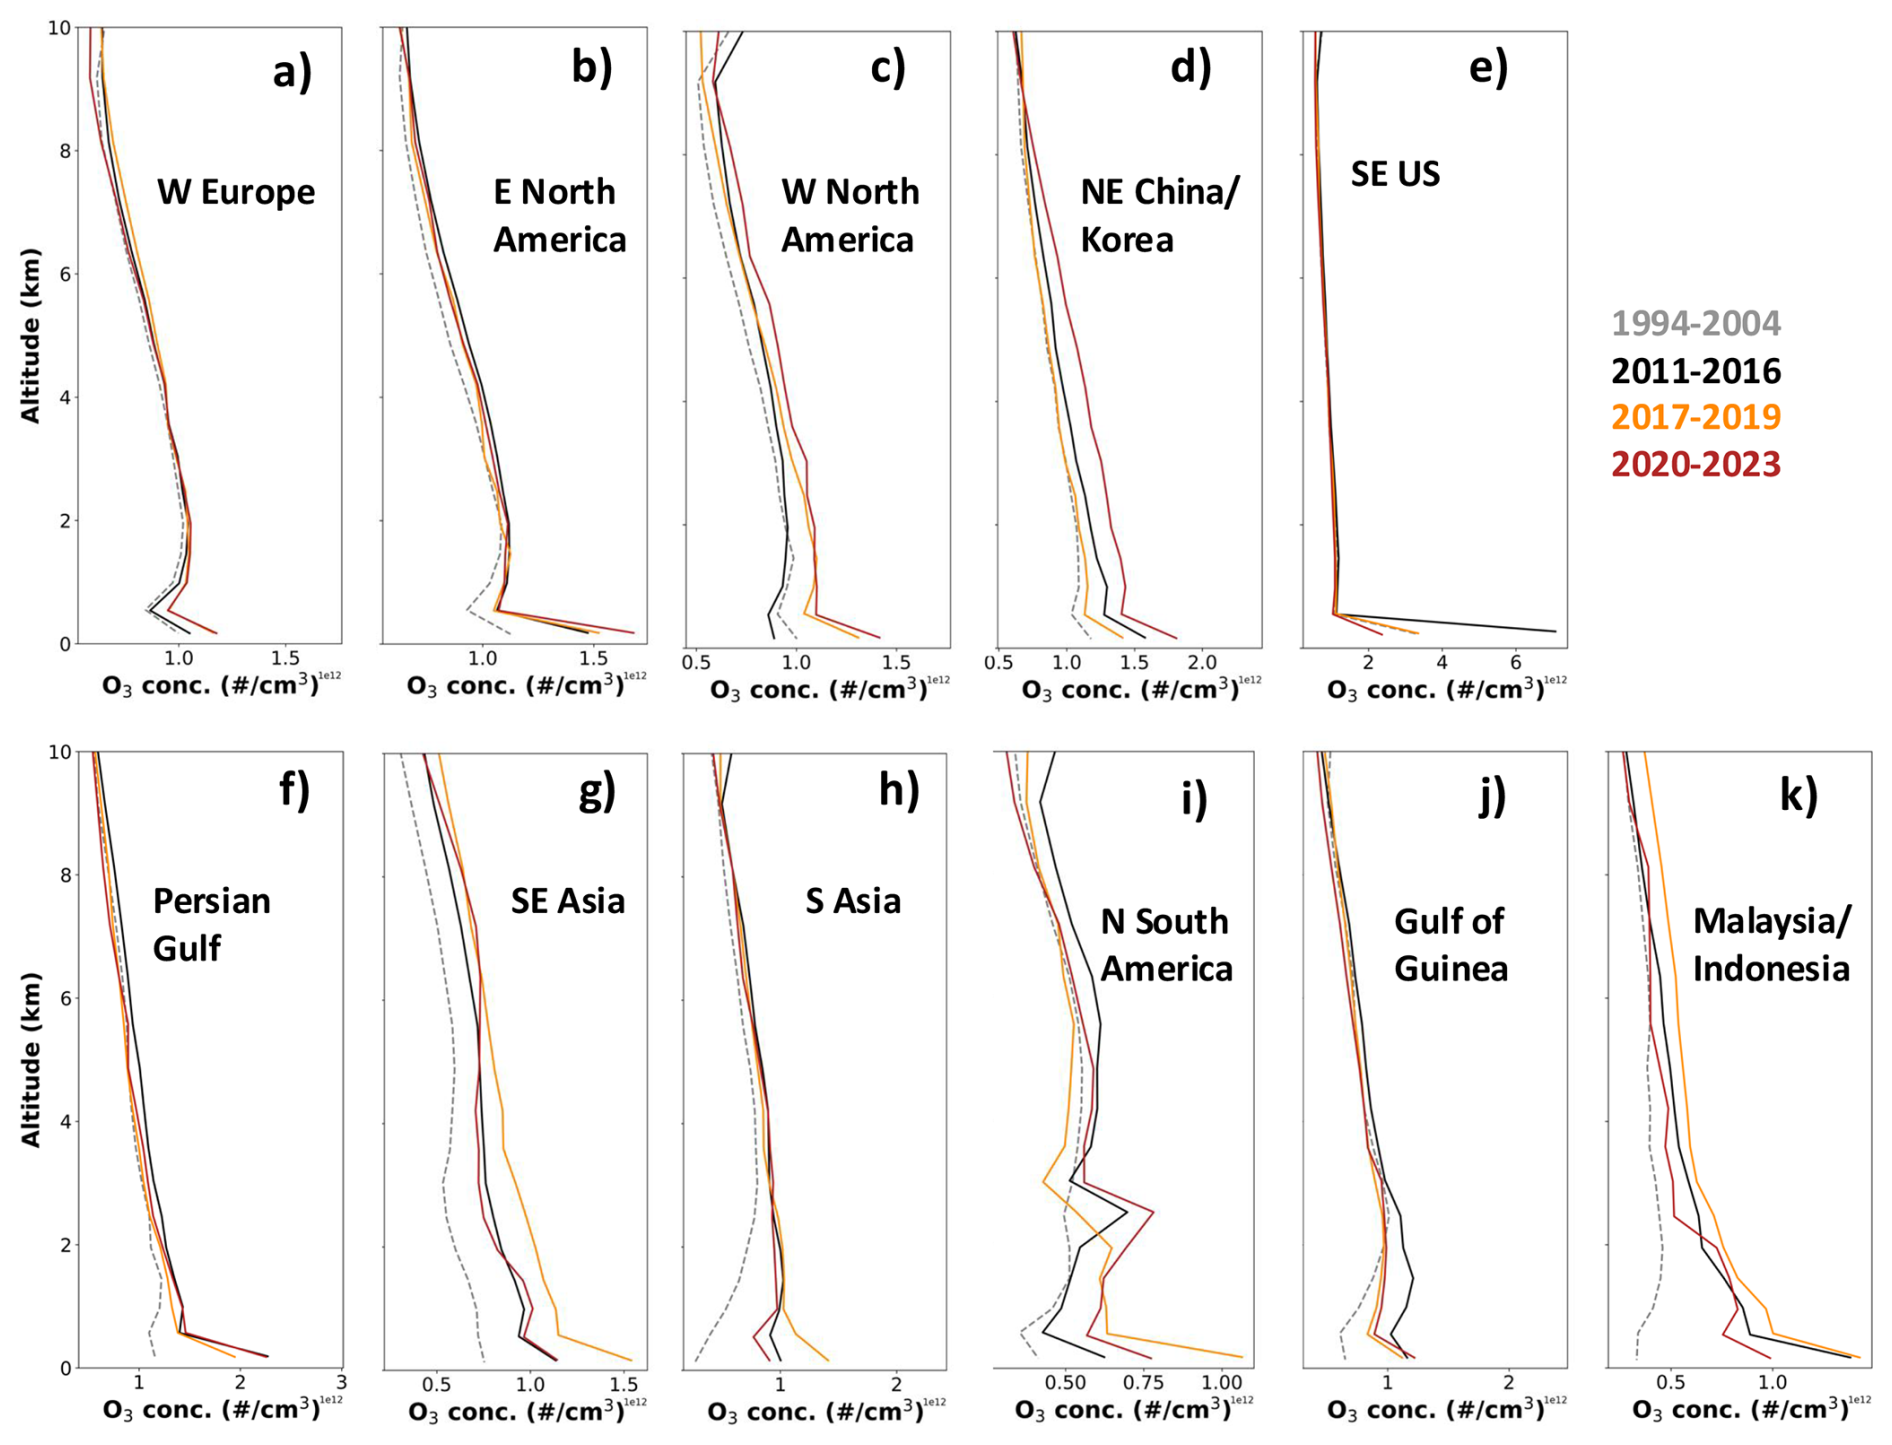
Figure 2Ozone concentration profiles in the 11 regions listed in Table 1, averaged over the periods 1994–2004 (grey lines), 2011–2016 (black lines), 2017–2019 (orange lines) and 2020–2023 (dark red lines).
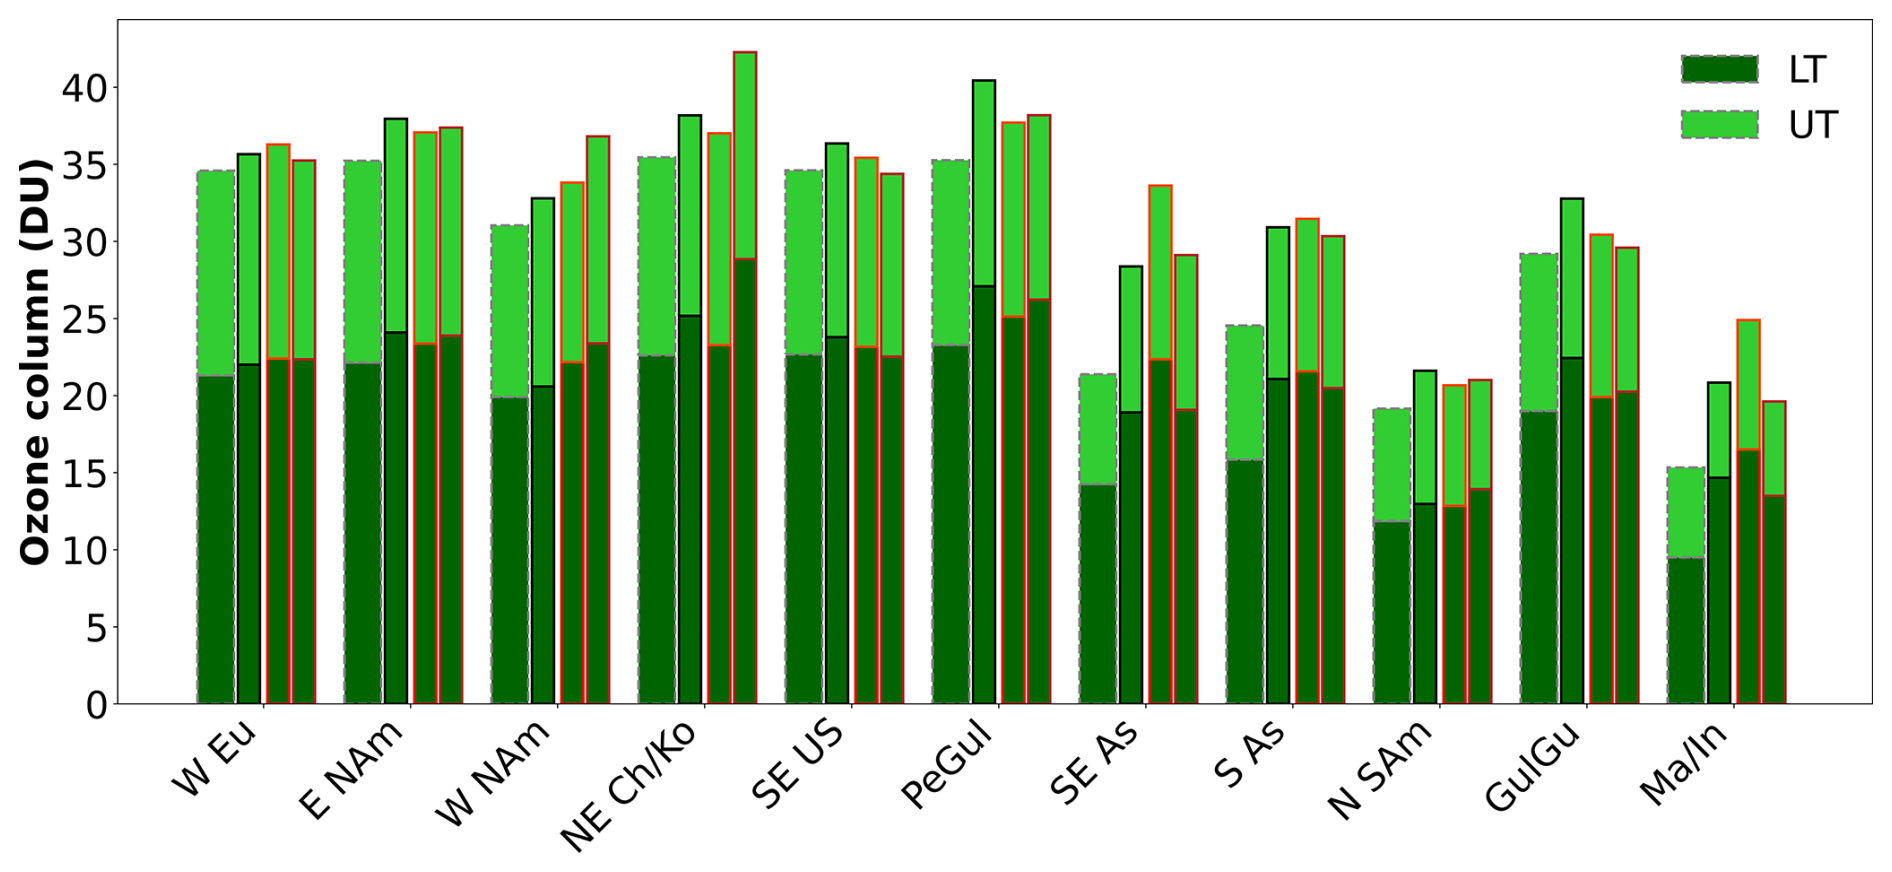
Figure 3Average LT (dark green bars) and UT ozone columns (stacked light green bars) in the periods 1994–2004 (large bars on the left with dashed grey borders), 2011–2016 (bars with black borders), 2017–2019 (bars with orange borders) and 2020–2023 (bars with dark red border) for each of the 11 regions listed in Table 1.
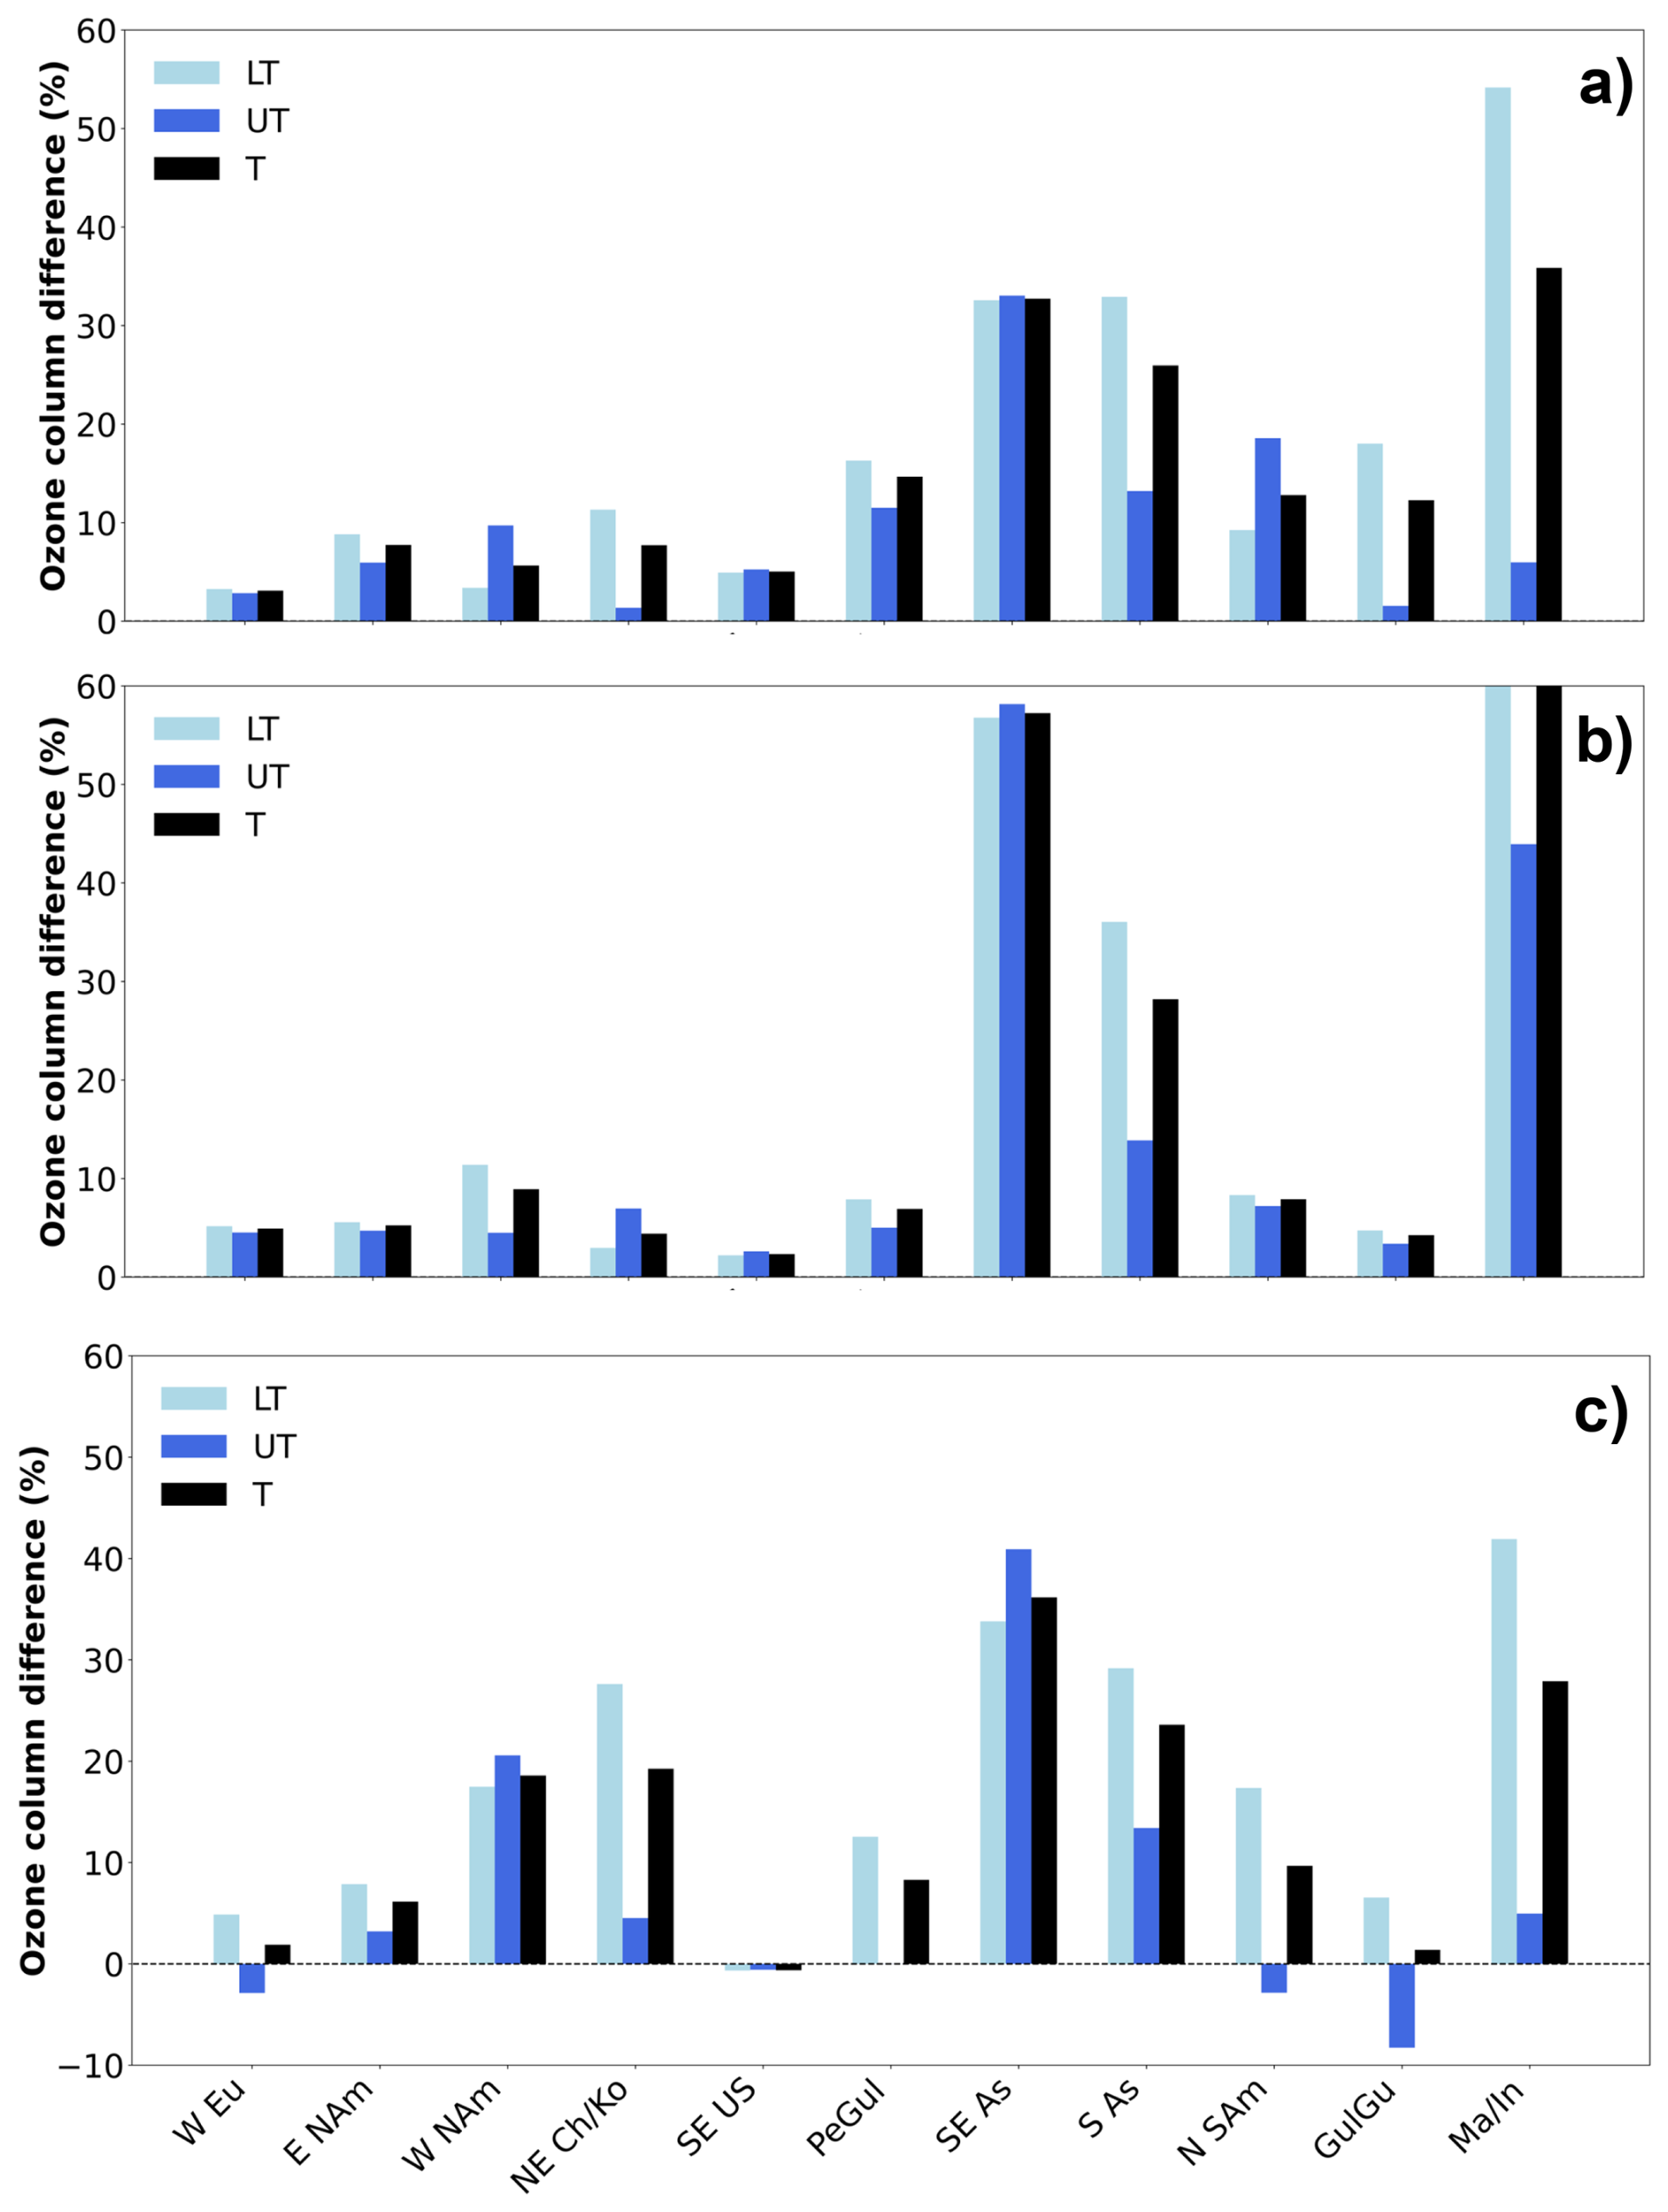
Figure 4LT (sky blue bars), UT (blue bars) and total tropospheric ozone percent difference (black bars), for each of the 11 regions listed in Table 1, for the periods 2011–2016 (a), 2017–2019 (b) and 2020–2023 (c) with respect to the period 1994–2004.
Table 2Average total ozone column (ΔTOC), lower tropospheric column (ΔLTOC) and upper tropospheric column (ΔUTOC) difference (in DU and percent), for the periods 2011–2016 (upper column), 2017–2019 (central column) and 2020–2023 (lower column) with respect to the period 1994–2004. The decadal trends of the total ozone column (ΔTOC trend, in DU per decade and in % per decade) are also reported for the three periods.
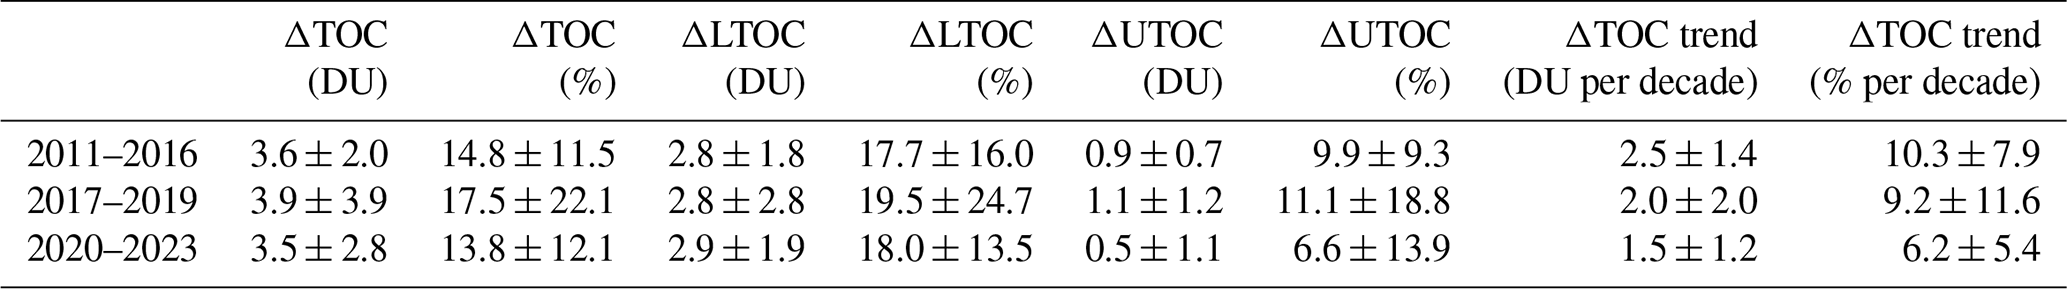
Consistently with G20, as a general trend, TOC increased worldwide by +3.6 ± 2.0 DU (+14.8 ± 11.5 %), in 2011–2016 with respect to IAGOS averages in 1994–2004 (see Table 2). The increasing trend is more pronounced for LTOC (+2.8 ± 1.8 DU, +17.7 ± 16.0 %), than UTOC (+0.9 ± 0.7 DU, +9.9 ± 9.3 %). The increasing trend for TOC is approximately the same for the estimations in 2017–2019 (+3.9 ± 3.9 DU, +17.5 ± 22.1 %) and 2020–2023 (+3.5 ± 2.8 DU, +13.8 ± 12.1 %) with respect to 1994–2004. Nevertheless, due to increasingly longer time intervals, the decadal trends are progressively decreasing. For the three ending periods, 2011–2016, 2017–2019 and 2020–2023, the decadal trends are +2.5 ± 1.4 DU per decade (+10.3 ± 7.9 % per decade), +2.0 ± 2.0 DU per decade (+9.2 ± 11.6 % per decade) and +1.5 ± 1.2 DU per decade (+6.2 ± 5.4 % per decade), respectively. On average, while UTOC increases are confirmed in 2017–2019 (+1.1 ± 1.2 DU, +11.1 ± 18.8 %), this is not the case for 2020–2023 when a general reduction of UTOC trends is found (+0.5 ± 1.1 DU, +6.6 ± 13.9 %). While the specific reasons for this reduction in UTOC trends are not explicitly addressed in this study, a possible cause of this might be attributed to the general reductions in the background tropospheric ozone due to the effects of the COVID crisis (e.g. Steinbrecht et al., 2021, Cuesta et al., 2022). For LTOC, no significant difference is found in the variation for the three ending periods with respect to 1994–2004. The effect of the implementation of emission reduction policies for ozone precursors, such as nitrogen dioxide, carbon monoxide and VOCs, on the surface and tropospheric columns ozone was recently discussed (Elshorbany et al., 2024).
To summarise, our results seem to point at a general global stagnation of the TOC increase, with progressively decreasing decadal trends, which is further enhanced after the COVID (period 2020–2023), associated with a decrease in the background UTOC.
Looking at specific regions, the largest slowdown of the TOC decadal increases seen when we compare the end time-periods 2011–2016, 2017–2019 and 2020–2023 is observed in both tropical (Persian Gulf and the Gulf of Guinea) and midlatitudes regions (Western Europe and Southeast US). For these four regions, the TOC reductions in 2020–2023 are accompanied with a switch from positive to negative trends in UTOC. In the Northern South America region, the UTOC trend also switched from positive to negative in 2020–2023, while a relatively strong increase in LTOC trend kept the TOC trends positive, in this period. The more pronounced reduction in the UTOC trends in 2020–2023 is observed in the Gulf of Guinea (UTOC −8.3 % in 2020–2023, while consistently positive in 2011–2016 and 2017–2019). In these cases, the reduction in UTOC is observed at most altitudes starting from about 6 km altitude, and sometimes propagating to the lower altitudes in the lower troposphere (see, e.g., Fig. 2f and j). This general reduction in the UTOC variability on 2020–2023, with respect to previous time intervals, is not verified at a few station, namely Western North America (UTOC trends vary from +9.7 %, in 2011–2016, to +4.5 %, in 2017–2019, to +20.6 %, in 2020–2023) and Southeast Asia (UTOC trends vary from +33.0 %, in 2011–2016, to +58.2 %, in 2017–2019, to +40.9 %, in 2020–2023). For the LTOC trends, more regional variability is found. While some stagnation of the trends are found at some midlatitude stations (Western Europe, Eastern North America and Southeast US, with a small negative trend in 2020–2023 for this latter), other midlatitudes or tropical stations (Northeast China/Korea and Northern South America) still show elevated and increasing trends in 2020–2023, with respect to previous time periods. While in some cases (e.g. Northeast China/Korea, Fig. 2d) the tropospheric ozone increase are distributed in a wide altitude range, more vertically-localised LTOC increases at lower altitudes are visible for Northern South America (Fig. 2i).
3.2 Radiative forcing
Figure 5 shows our offline radiative calculation of the RF associated with the trends in TOC discussed in Sect. 3.1, for the 11 regions. Averages over the 11 regions are summarised in Table 3. The SW and LW components of the tropospheric ozone RF are shown separately, and the RF for the trends calculated using 2011–2016, 2017–2019 and 2020–2023 ending periods, with respect to 1994–2004, are shown in the figures. The average total (SW + LW) decadal tropospheric ozone RF is 60.3 ± 34.9 mW m−2, for the 2011–2016 period, 52.5 ± 69.8 mW m−2, for the 2017–2019 period and 32.8 ± 57.5 mW m−2, for the 2020–2023 period. Our results for 2011–2016 are comparable with the RF estimations of G20 for the same regions and period (average over the 11 regions ∼ 80 mW m−2 in G20). Considering the different temporal interval for the three trends estimations (14.5 years, for 2011–2016 average, 19 years, for 2017–2019 average and 22.5 years for 2020–2023 average), this corresponds to progressively decreasing RF per decade, i.e. 41.6 ± 24.0 mW m−2 per decade, for 2011–2016, 27.6 ± 36.7 mW m−2 per decade, for 2017–2019, and 14.6 ± 25.6 mW m−2 per decade, for 2020–2023 (see Table 3). Thus, the decadal tropospheric ozone RF is significantly reduced from 2011–2016 to 2020–2023, with this latter about one third the values estimated using the 2011–2016 ending period. This can be readily linked to both the stagnation in the TOC trends and the vertical region where the larger reductions in trends are coming from. As discussed in Sect. 3.1, in general, the reductions in positive trends in 2017–2019, and even more in 2020–2023, with respect to 2011–2016 are mainly linked to a decrease in the UTOC positive trends, while the LTOC trends stayed approximately constant (see Table 2). This effect is particularly strong in the COVID and post-COVID crisis period. The instantaneous TOA RF due to tropospheric ozone is much more sensitive to the ozone changes in the UT than in the LT (e.g. Worden et al., 2011). As an example, in Southeast Asia, the TOC positive trend stays approximately the same in 2011–2016 and 2020–2023, with respect to 1994–2004, mostly linked to a redistribution of trends for LTOC, which is decreasing, and UTOC, which is increasing. The associated tropospheric ozone RF increases in 2020–2023 with respect to 2011–2016. On the contrary, in Northeast China/Korea the TOC positive trends increased driven by LTOC trends, with UTOC not varying significantly, leading to a very small variability of the RF. These examples suggest that local emission reduction for ozone precursors, leading to decreases in ozone levels at lower altitudes, while beneficial for air quality, health and the biosphere, might not lead to a clear decrease in short-term radiative impacts, hence climate. The effect of the reduction of RF associated with a reduction in UTOC trends can be see e.g. in Northern South America. In this region, the TOC positive trends stay approximately the same for the three time periods, while the UTOC positive trends progressively reduce, leading to a progressively decreasing RF from 2011–2016 to 2020–2023. Another important result of our tropospheric ozone RF estimates is that the regional variability of our decadal trends is increasing, possibly due to the large variability of LTOC and UTOC trends in the different regions.
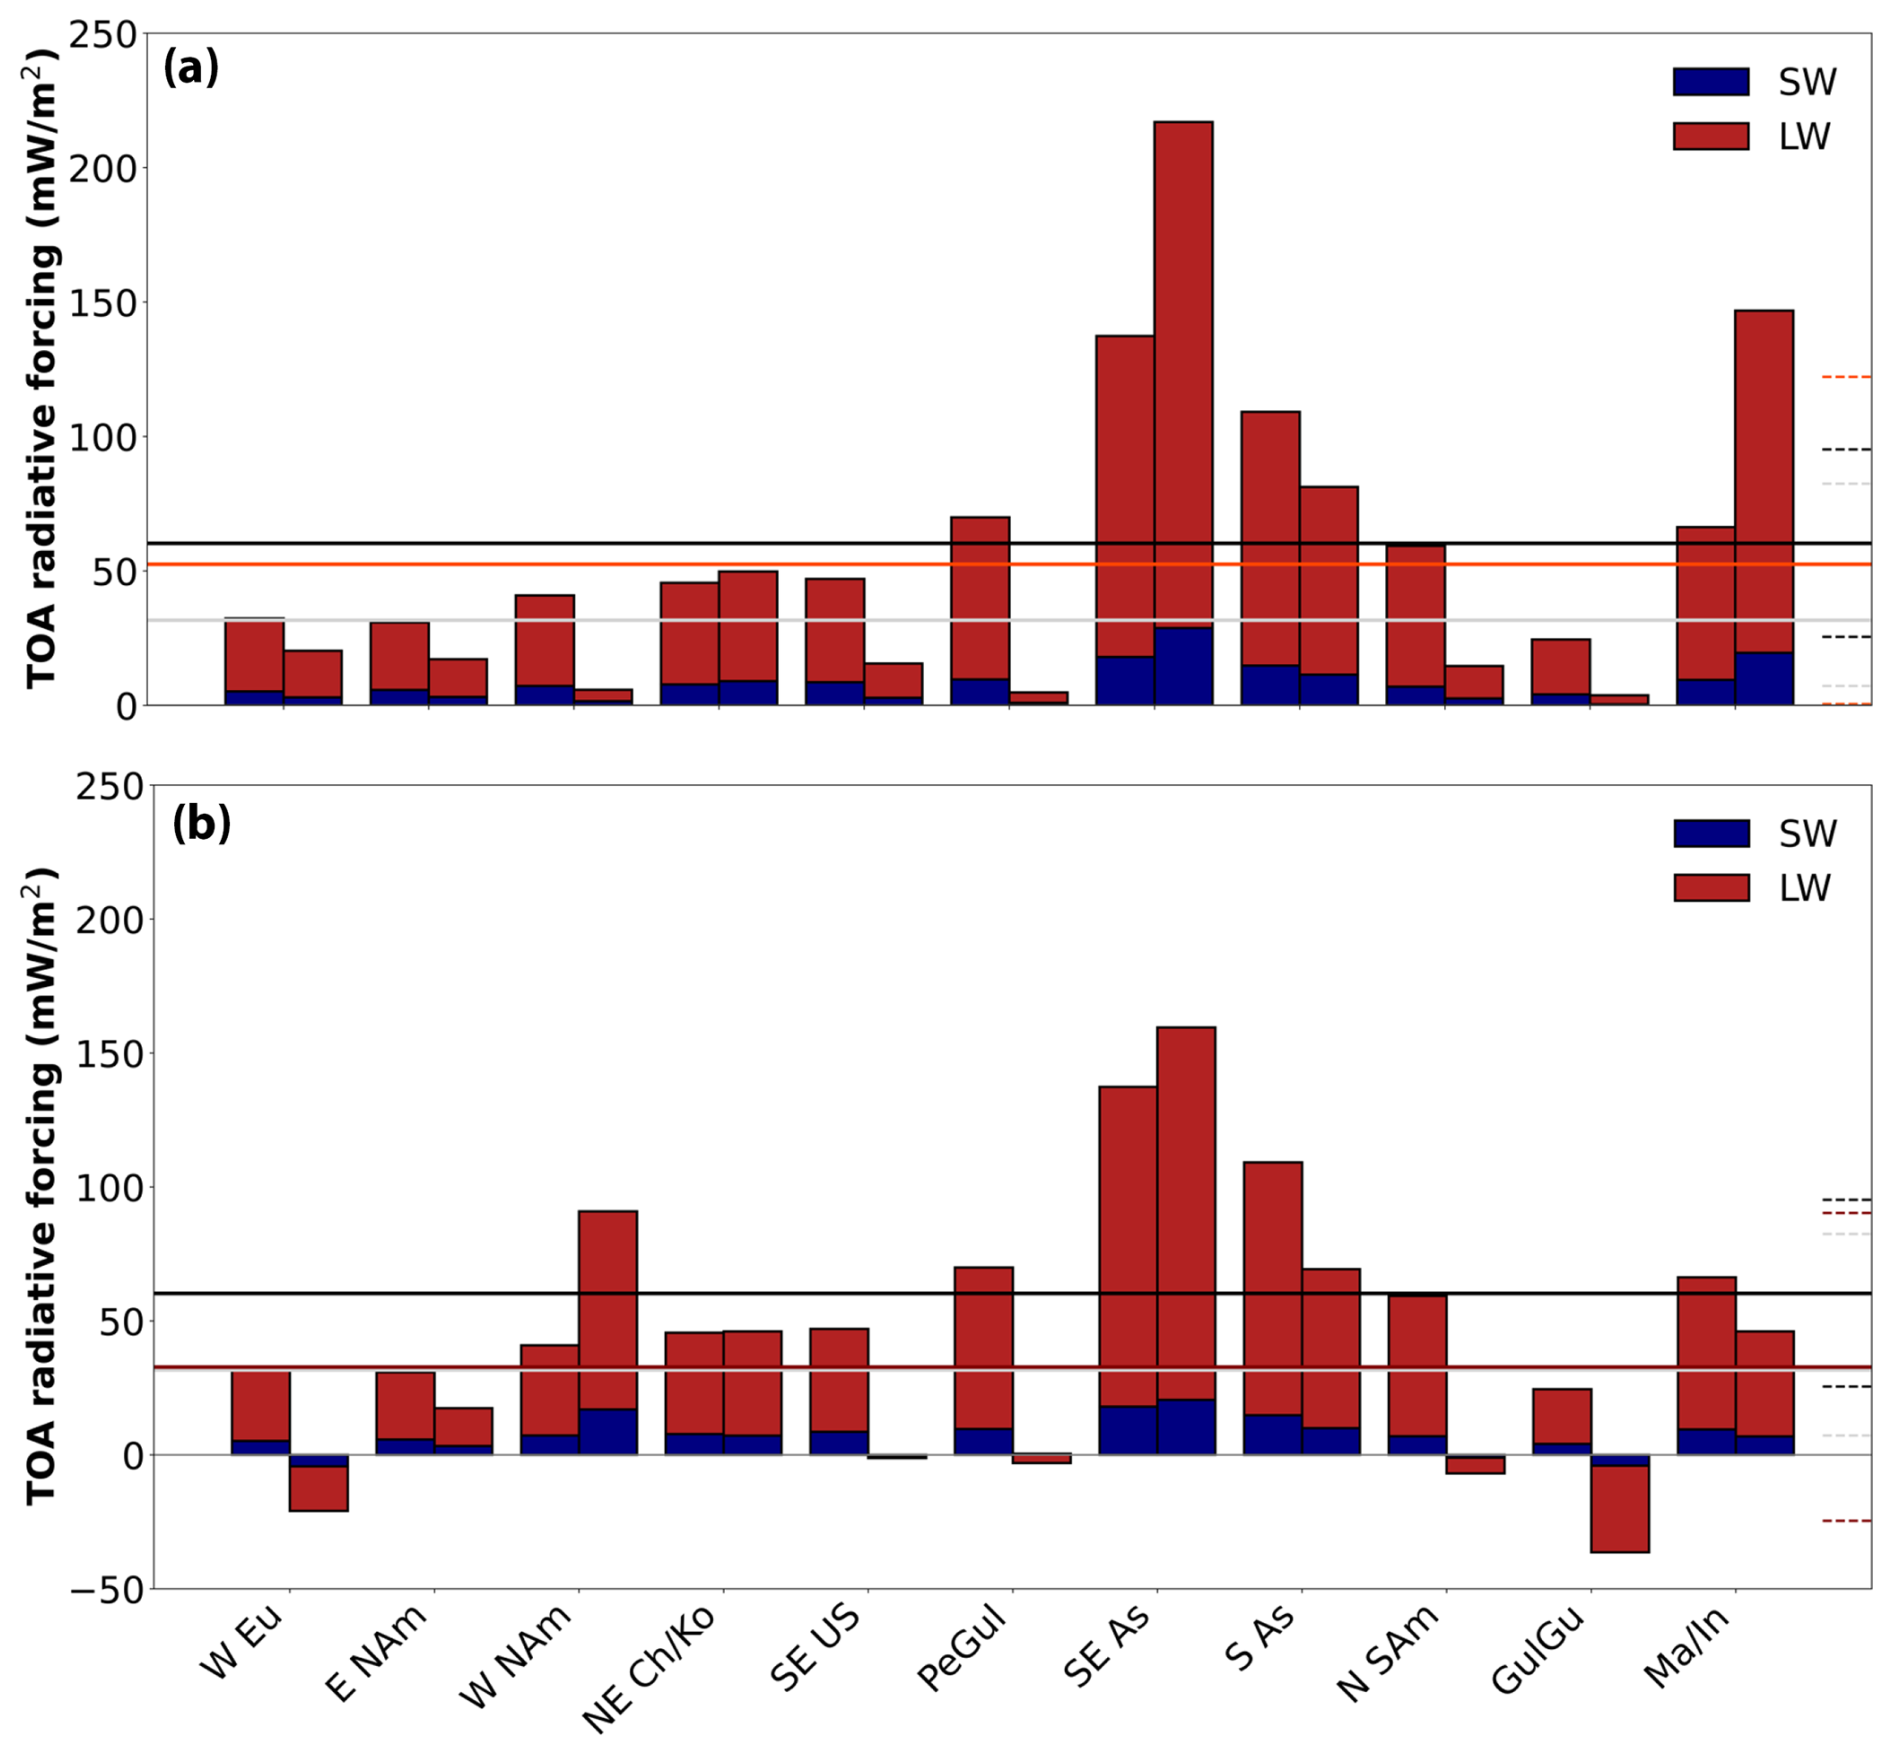
Figure 5SW (blue bars) and LW (stacked red bars) tropospheric ozone instantaneous RF, for each of the 11 regions listed in Table 1, for the periods 2011–2016 (bars on the left in panels (a) and (b)), 2017–2019 (bars on the right in panel (a)) and 2020–2023 (bars on the right in panel (b)), with respect to the period 1994–2004. Horizontal lines represent the overall 2011–2016 (solid black line in panels (a) and (b)), 2017–2019 (solid red line in panel (a)) and 2020–2023 (solid dark red line in panel (b)) averages, and the global average RF of Skeie et al. (2020) scaled to 14.5 years (solid grey line). Horizontal dotted lines represent the uncertainty range of respective solid lines.
Table 3SW, LW and total tropospheric ozone RF, for the periods 2011–2016 (upper column), 2017–2019 (central column) and 2020–2023 (lower column) with respect to the period 1994–2004. The decadal tropospheric ozone RF are also reported (Total RF per decade).
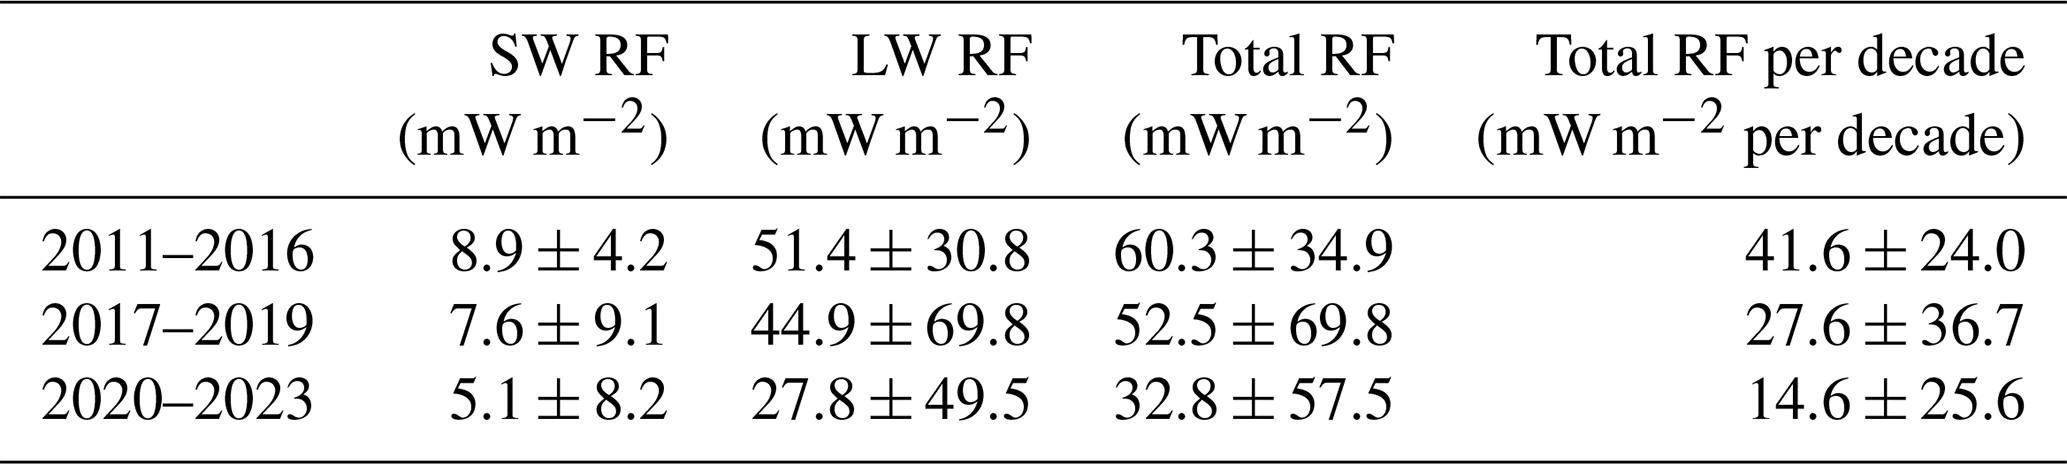
Our average estimates cannot be directly compared with online model global average tropospheric ozone RF estimates but can still be used as a reference where IAGOS observations are available (thus mostly the Northern Hemisphere). The most recent global tropospheric ozone RF estimate available is the one provided by Skeie et al. (2020). They provided an estimate of 0.35 W m−2 (with an uncertainty range of 0.08–0.91 W m−2), for a time-interval of 160 years since the pre-industrial era, which translates to 31.7 (7.3–82.5) mW m−2, for an equal period of 14.5 years as our 2011–2016 estimates, and 21.9 (5.0–56.9) mW m−2 per decade. This is very similar to the previous estimate of 24 ± 12 mW m−2 per decade, obtained by Myhre et al. (2017) and used as reference in G20. Our average values are ∼ 90 % and ∼ 25 % larger, for our estimation for ending periods 2011–2016 and 2017–2019, and ∼ 30 % smaller, for our estimation for ending period 2020–2023, than previous global average estimates with online models. It is important to stress that the estimations for Skeie et al. (2020) are global average values, while our study is limited to the Northern Hemisphere and the tropics, which can produce biases in this inter-comparison.
Table 4LW to SW tropospheric ozone RF ratio for 2011–2016, 2017–2019 and 2020–2023, with respect to 1994–2004, calculated for all regions, and extra-tropical and tropical regions.
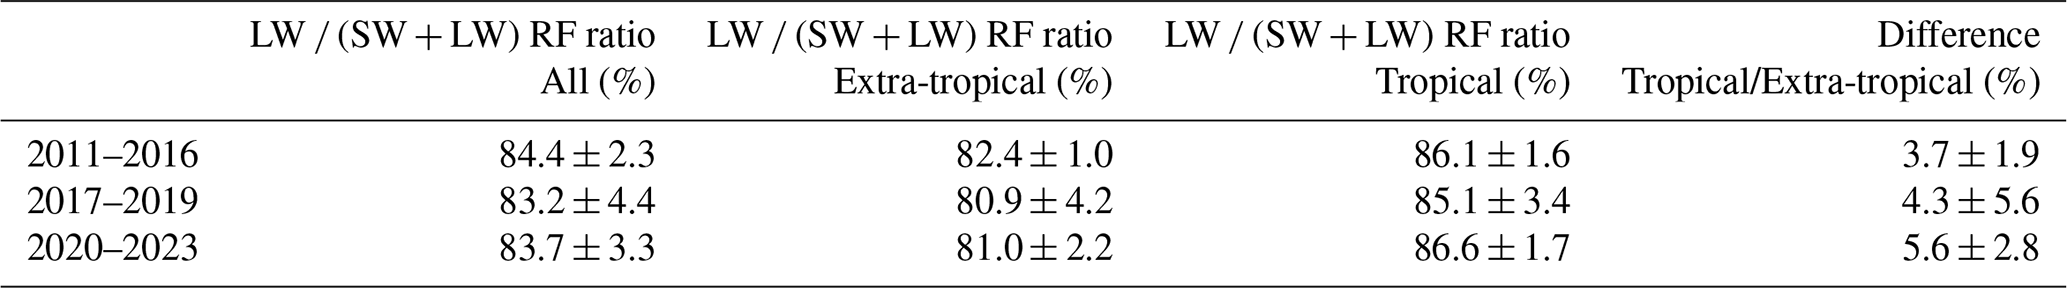
Our detailed radiative calculations allow the estimation of the separate SW and LW tropospheric ozone RF and their ratio, associated with different vertical distributions of ozone concentration and their decadal trends. Table 3 summarises the SW and LW RF for our estimations and Table 4 the ratio of the LW to total (SW + LW) RF. The LW contribution to total tropospheric ozone RF is ∼ 84 ± 2 % (max: 88 %, min: 81 %), in 2011–2016, ∼ 83 ± 4 % (max: 89 %, min: 79 %), in 2017–2019 and ∼ 84 ± 3 % (max: 89 %, min: 79 %), in 2020–2023. As also observed by Doniki et al. (2015) and Gaudel et al. (2024), the LW radiative effect of tropospheric ozone is larger in the tropics than extra-tropics, by ∼ 4 %, in 2011–2016, by ∼ 4 %, in 2017–2019 and by ∼ 6 %, in 2020–2023.
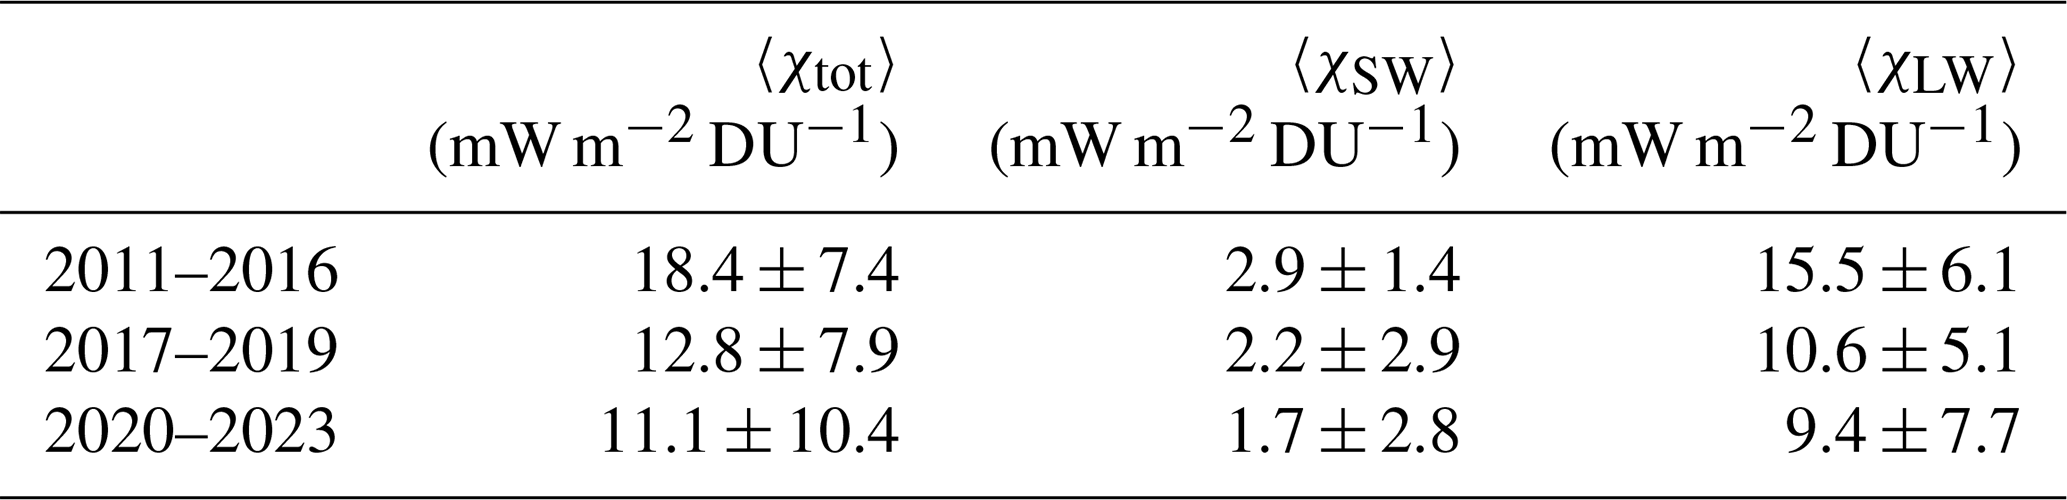
We also calculated the RF sensitivity to TOC trends, in both the SW and LW, as well as for total SW + LW RF, as described in Eqs. (1)–(3). The average RF sensitivities, over the 11 stations, for the three ending periods, are summarised in Table 5. Our results show a significant change in sensitivity between the three ending periods, with average total (SW + LW) RF sensitivities of 18.4 ± 7.4 mW m−2 DU−1, in 2011–2016, 12.8 ± 7.9 mW m−2 DU−1, in 2017–2019 and 11.1 ± 10.4 mW m−2 DU−1, in 2020–2023. The smaller RF sensitivity χtot for 2020–2023 and 2017–2019 than 2011–2016 is likely associated with the observed changes in vertical distribution and their decadal trends, i.e. progressively relatively less UT and stagnant LT ozone levels in later periods than 2011–2016. As a matter of fact the RF sensitivity χtot depends strongly on the vertical profile of the tropospheric ozone distributions and trends. Our results for χtot are consistent with Northern Hemispheric values obtained by Pope et al. (2024) (this parameter is called tropospheric ozone normalised radiative effect, NRE, see Figure 1 therein), which found a χtot ∼ 20 mW m−2 DU−1 at those latitudes with three satellite products.
Table 5Average RF sensitivity to tropospheric ozone column change for SW (χSW), LW (χLW) and both (χtot).
In this paper, we have used the LibRadtran/UVSPEC offline radiative transfer model to estimate decadal tropospheric ozone instantaneous RF of tropospheric ozone trends, based on an observational description from IAGOS aircraft measurements. Based on previous work of G20, these decadal RF are estimated over 11 regions, covering northern-hemispheric mid-latitudes and tropics. Three time intervals are considered for the decadal trends in this work: 2011–2016 versus 1994–2004 averages (as in G20), 2017–2019 versus 1994–2004 averages and 2020–2023 versus 1994–2004 averages. As in G20, we have found a systematic global average positive trend, in the Tropospheric Ozone Column (TOC), Lower Tropospheric Ozone Column (LTOC) and Upper Tropospheric Ozone Column (UTOC), for the decadal ozone trends estimated in 2011–2016 versus 1994–2004. We found that the decadal TOC trends calculated later periods stay approximately the same with respect to the 2011–2016 trends, with a ΔTOC of +3.5 ± 2.8 DU (+13.8 ± 12.1 %), in 2020–2023, +3.9 ± 3.9 DU (+17.5 ± 22.1 %), in 2017–2019, and +3.6 ± 2.0 DU (+14.8 ± 11.5 %), in 2011–2016. Due to the increasingly longer time intervals, the stagnation of the ΔTOC produced and increasingly smaller decadal trends in TOC: DU per decade ( % per decade), in 2011–2016, DU per decade ( % per decade), in 2017–2019, and DU per decade ( % per decade), in 2020–2023. Besides the stagnation of the ΔTOC across the three ending periods, this progressive trend decrease seems to be driven by a general decrease of UTOC at all regions. This effect is accentuated during the COVID and post-COVID crisis period (2020–2023). We found that the decrease in TOC decadal trends and the specific reduction in UTOC are accompanied with a reduction of the decadal radiative forcing (RF) due to tropospheric ozone from 2011–2016 (60.3 ± 34.9 mW m−2, 41.6 ± 24.0 mW m−2 per decade) to 2017–2019 (52.5 ± 69.8 mW m−2, 27.6 ± 36.7 mW m−2 per decade) to 2020–2023 (32.8 ± 57.5 mW m−2, 14.6 ± 25.6 mW m−2 per decade). This is linked to the much larger sensitivity of the tropospheric ozone RF to the UTOC. We estimated such sensitivity through the χtot parameter, which is defined as the decadal tropospheric ozone RF per unit variation in TOC in a given time interval. The χtot parameter varied between 18.4 ± 7.4 W m−2 DU−1, in 2011–2016, and 11.1 ± 10.4 W m−2 DU−1, in 2020–2023, likely associated with the UTOC decrease and the LTOC stagnation between 2020–2023 and 2011–2016. Our average estimates over the 11 regions are ∼ 25 %–90 % larger (2011–2016 and 2017–2019) to ∼ 30 % smaller (2020–2023) than previous global average estimates with online models, such as the latest estimate of Skeie et al. (2020) (21.9 mW m−2 per decade, on average). The longwave (LW) contribution to total shortwave and longwave (SW + LW) RF is ∼ 83 %–85 %, with ∼ 4 %–6 % larger values in the tropics than in the extra-tropics.
The IAGOS data are available from the IAGOS data portal (https://doi.org/10.25326/20; IAGOS data portal, 2019); the time series data are accessible at https://doi.org/10.25326/06 (Boulanger et al., 2018).
The supplement related to this article is available online at https://doi.org/10.5194/acp-25-13299-2025-supplement.
PS designed the study and realised the offline RF estimations. AG and BS provided the input IAGOS data. All authors participated to the discussion of the results. PS wrote the manuscript and all authors contributed to its revision and editing.
The contact author has declared that none of the authors has any competing interests.
Publisher's note: Copernicus Publications remains neutral with regard to jurisdictional claims made in the text, published maps, institutional affiliations, or any other geographical representation in this paper. While Copernicus Publications makes every effort to include appropriate place names, the final responsibility lies with the authors. Views expressed in the text are those of the authors and do not necessarily reflect the views of the publisher.
This article is part of the special issue “Tropospheric Ozone Assessment Report Phase II (TOAR-II) Community Special Issue (ACP/AMT/BG/ESSD/GMD inter-journal SI)”. It is a result of the Tropospheric Ozone Assessment Report, Phase II (TOAR-II, 2020–2024).
The authors acknowledge the support of the European Commission, Airbus and the airlines (Lufthansa, Air France, Austrian Airlines, Air Namibia, Cathay Pacific, Iberia and China Airlines so far) who have carried the IAGOSCore equipment and performed the maintenance since 1994. In its last 10 years of operation, IAGOS-Core has been funded by INSU– CNRS (France), Météo-France, Université Paul Sabatier (Toulouse, France) and Forschungszentrum Jülich (FZJ, Jülich, Germany). IAGOS has been additionally funded by the EC projects IAGOS-DS and IAGOS-ERI. The IAGOS-Core and the IAGOS-CARIBIC database are supported by AERIS.
This research has been supported by the Centre National d'Etudes Spatiales (TOTICE). Audrey Gaudel's contribution was supported by the NOAA cooperative agreement with CIRES (grant nos. NA17OAR4320101 and NA22OAR4320151).
This paper was edited by Andreas Petzold and reviewed by Roeland Van Malderen and one anonymous referee.
Anderson, G. P., Clough, S. A., Kneizys, F. X., Chetwynd, J. H., and Shettle, E. P.: AFGL atmospheric constituent profiles (0–120 km), https://apps.dtic.mil/sti/pdfs/ADA175173.pdf (last access: 15 October 2025), 1986.
Blot, R., Nedelec, P., Boulanger, D., Wolff, P., Sauvage, B., Cousin, J.-M., Athier, G., Zahn, A., Obersteiner, F., Scharffe, D., Petetin, H., Bennouna, Y., Clark, H., and Thouret, V.: Internal consistency of the IAGOS ozone and carbon monoxide measurements for the last 25 years, Atmos. Meas. Tech., 14, 3935–3951, https://doi.org/10.5194/amt-14-3935-2021, 2021.
Boulanger, D., Blot, R., Bundke, U., Gerbig, C., Hermann, M., Nédélec, P., Rohs, S., and Ziereis, H.: IAGOS time series, AERIS [data set], https://doi.org/10.25326/06, 2018.
Brenninkmeijer, C. A. M., Crutzen, P. J., Fischer, H., Güsten, H., Hans, W., Heinrich, G., Heintzenberg, J., Hermann, M., Immelmann, T., Kersting, D., Maiss, M., Nolle, M., Pitscheider, A., Pohlkamp, H., Scharffe, D., Specht, K., and Wiedensohler, A.: CARIBIC – Civil Aircraft for Global Measurement of Trace Gases and Aerosols in the Tropopause Region, J. Atmos. Oceanic Technol., 16, 1373–1383, https://doi.org/10.1175/1520-0426(1999)016<1373:CCAFGM>2.0.CO;2, 1999.
Chang, K. L., Cooper, O. R., Gaudel, A., Allaart, M., Ancellet, G., Clark, H., Godin-Beekmann, S., Leblanc, T., Van Malderen, R., Nédélec, P., Petropavlovskikh, I., Steinbrecht, W., Stübi, R., Tarasick, D. W., and Torres, O.: Impact of the COVID-19 economic downturn on tropospheric ozone trends: An uncertainty weighted data synthesis for quantifying regional anomalies above western North America and Europe, AGU Advances, 3, e2021AV000542, https://doi.org/10.1029/2021AV000542, 2022.
Cuesta, J., Costantino, L., Beekmann, M., Siour, G., Menut, L., Bessagnet, B., Landi, T. C., Dufour, G., and Eremenko, M.: Ozone pollution during the COVID-19 lockdown in the spring of 2020 over Europe, analysed from satellite observations, in situ measurements, and models, Atmos. Chem. Phys., 22, 4471–4489, https://doi.org/10.5194/acp-22-4471-2022, 2022.
Doniki, S., Hurtmans, D., Clarisse, L., Clerbaux, C., Worden, H. M., Bowman, K. W., and Coheur, P.-F.: Instantaneous longwave radiative impact of ozone: an application on IASI/MetOp observations, Atmos. Chem. Phys., 15, 12971–12987, https://doi.org/10.5194/acp-15-12971-2015, 2015.
Elshorbany, Y., Ziemke, J. R., Strode, S., Petetin, H., Miyazaki, K., De Smedt, I., Pickering, K., Seguel, R. J., Worden, H., Emmerichs, T., Taraborrelli, D., Cazorla, M., Fadnavis, S., Buchholz, R. R., Gaubert, B., Rojas, N. Y., Nogueira, T., Salameh, T., and Huang, M.: Tropospheric ozone precursors: global and regional distributions, trends, and variability, Atmos. Chem. Phys., 24, 12225–12257, https://doi.org/10.5194/acp-24-12225-2024, 2024.
Emde, C., Buras-Schnell, R., Kylling, A., Mayer, B., Gasteiger, J., Hamann, U., Kylling, J., Richter, B., Pause, C., Dowling, T., and Bugliaro, L.: The libRadtran software package for radiative transfer calculations (version 2.0.1), Geosci. Model Dev., 9, 1647–1672, https://doi.org/10.5194/gmd-9-1647-2016, 2016.
Forster, P., Storelvmo, T., Armour, K., Collins, W., Dufresne, J.- L., Frame, D., Lunt, D. J., Mauritsen, T., Palmer, M. D., Watanabe, M., Wild, M., and Zhang, H.: The Earth's Energy Budget, Climate Feedbacks, and Climate Sensitivity, in: Climate Change 2021: The Physical Science Basis, Contribution of Working Group I to the Sixth Assessment Report of the Intergovernmental Panel on Climate Change, edited by: Masson-Delmotte, V., Zhai, P., Pirani, A., Connors, S. L., Péan, C., Berger, S., Caud, N., Chen, Y., Goldfarb, L., Gomis, M. I., Huang, M., Leitzell, K., Lonnoy, E., Matthews, J. B. R., Maycock, T. K., Waterfield, T., Yelekçi, O., Yu, R., and Zhou, B., Cambridge University Press, Cambridge, United Kingdom and New York, NY, USA, 923–1054, https://doi.org/10.1017/9781009157896.009, 2021.
Gaudel, A., Cooper, O. R., Chang, K.-L., Bourgeois, I., Ziemke, J. R., Strode, S. A., Oman, L. D., Sellitto, P., Nédélec, P., Blot, R., Thouret, V., and Granier, C.: Aircraft observations since the 1990s reveal increases of tropospheric ozone at multiple locations across the Northern Hemisphere, Sci. Adv., 6, eaba8272, https://doi.org/10.1126/sciadv.aba8272, 2020.
García, O. E., Sanromá, E., Schneider, M., Hase, F., León-Luis, S. F., Blumenstock, T., Sepúlveda, E., Redondas, A., Carreño, V., Torres, C., and Prats, N.: Improved ozone monitoring by ground-based FTIR spectrometry, Atmos. Meas. Tech., 15, 2557–2577, https://doi.org/10.5194/amt-15-2557-2022, 2022.
Gaudel, A., Bourgeois, I., Li, M., Chang, K.-L., Ziemke, J., Sauvage, B., Stauffer, R. M., Thompson, A. M., Kollonige, D. E., Smith, N., Hubert, D., Keppens, A., Cuesta, J., Heue, K.-P., Veefkind, P., Aikin, K., Peischl, J., Thompson, C. R., Ryerson, T. B., Frost, G. J., McDonald, B. C., and Cooper, O. R.: Tropical tropospheric ozone distribution and trends from in situ and satellite data, Atmos. Chem. Phys., 24, 9975–10000, https://doi.org/10.5194/acp-24-9975-2024, 2024.
IAGOS data portal, AERIS [data set], https://doi.org/10.25326/20, 2019.
Marenco, A., Thouret, V., Nédélec, P., Smit, H., Helten, M., Kley, D., Karcher, F., Simon, P., Law, K., Pyle, J., Poschmann, G., Von Wrede, R., Hume, C., and Cook, T.: Measurement of ozone and water vapor by Airbus in-service aircraft: The MOZAIC airborne program, an overview, J. Geophys. Res., 103, 25631–25642, https://doi.org/10.1029/98JD00977, 1998.
Maycock, A. C., Smith, C. J., Rap, A., and Rutherford, O.: On the Structure of Instantaneous Radiative Forcing Kernels for Greenhouse Gases, J. Atmos. Sci., 78, 949–965, https://doi.org/10.1175/JAS-D-19-0267.1, 2021.
Monks, P. S., Archibald, A. T., Colette, A., Cooper, O., Coyle, M., Derwent, R., Fowler, D., Granier, C., Law, K. S., Mills, G. E., Stevenson, D. S., Tarasova, O., Thouret, V., von Schneidemesser, E., Sommariva, R., Wild, O., and Williams, M. L.: Tropospheric ozone and its precursors from the urban to the global scale from air quality to short-lived climate forcer, Atmos. Chem. Phys., 15, 8889–8973, https://doi.org/10.5194/acp-15-8889-2015, 2015.
Myhre, G., Aas, W., Cherian, R., Collins, W., Faluvegi, G., Flanner, M., Forster, P., Hodnebrog, Ø., Klimont, Z., Lund, M. T., Mülmenstädt, J., Lund Myhre, C., Olivié, D., Prather, M., Quaas, J., Samset, B. H., Schnell, J. L., Schulz, M., Shindell, D., Skeie, R. B., Takemura, T., and Tsyro, S.: Multi-model simulations of aerosol and ozone radiative forcing due to anthropogenic emission changes during the period 1990–2015, Atmos. Chem. Phys., 17, 2709–2720, https://doi.org/10.5194/acp-17-2709-2017, 2017.
Nédélec, P., Blot, R., Boulanger, D., Athier, G., Cousin, J. M., Gautron, B., Petzold, A., Volz-Thomas, A., and Thouret, V.: Instrumentation on commercial aircraft for monitoring the atmospheric composition on a global scale: the IAGOS system, technical overview of ozone and carbon monoxide measurements, Tellus B: Chemical and Physical Meteorology, 67, 27791, https://doi.org/10.3402/tellusb.v67.27791, 2015.
Petzold, A., Thouret, V., Gerbig, C., Zahn, A., Brenninkmeijer, C. A. M., Gallagher, M., Hermann, M., Pontaud, M., Ziereis, H., Boulanger, D., Marshall, J., Nédélec, P., Smit, H. G. J., Friess, U., Flaud, J.-M., Wahner, A., Cammas, J.-P., and Volz-Thomas, A.: IAGOS Team, Global-scale atmosphere monitoring by in-service aircraft – Current achievements and future prospects of the European Research Infrastructure IAGOS, Tellus B, 67, 28452, https://doi.org/10.3402/tellusb.v67.28452, 2015.
Pope, R. J., Rap, A., Pimlott, M. A., Barret, B., Le Flochmoen, E., Kerridge, B. J., Siddans, R., Latter, B. G., Ventress, L. J., Boynard, A., Retscher, C., Feng, W., Rigby, R., Dhomse, S. S., Wespes, C., and Chipperfield, M. P.: Quantifying the tropospheric ozone radiative effect and its temporal evolution in the satellite era, Atmos. Chem. Phys., 24, 3613–3626, https://doi.org/10.5194/acp-24-3613-2024, 2024.
Seinfeld, J. H. and Pandis, S. N.: Atmospheric Chemistry and Physics, from Air Pollution to Climate Change, John Wiley & Sons Inc., Toronto, Canada, ISBN 978-1-118-94740-1, 1997.
Sellitto, P., Belhadji, R., Kloss, C., and Legras, B.: Radiative impacts of the Australian bushfires 2019–2020 – Part 1: Large-scale radiative forcing, Atmos. Chem. Phys., 22, 9299–9311, https://doi.org/10.5194/acp-22-9299-2022, 2022.
Sellitto, P., Belhadji, R., Cuesta, J., Podglajen, A., and Legras, B.: Radiative impacts of the Australian bushfires 2019–2020 – Part 2: Large-scale and in-vortex radiative heating, Atmos. Chem. Phys., 23, 15523–15535, https://doi.org/10.5194/acp-23-15523-2023, 2023.
Skeie, R. B., Myhre, G., Hodnebrog, Ø., Cameron-Smith, P. J., Deushi, M., Hegglin, M. I., Horowitz, L. W., Kramer, R. J. Michou, M., Mills, M. J., Olivié, D. J. L., O' Connor, F. M., Paynter, D., Samset, B. H., Sellar, A., Shindell, D., Takemura, T., Tilmes, S., and Wu, T.: Historical total ozone radiative forcing derived from CMIP6 simulations, npj Clim Atmos Sci 3, 32, https://doi.org/10.1038/s41612-020-00131-0, 2020.
Steinbrecht, W., Kubistin, D., Plass-Dülmer, C., Davies, J., Tarasick, D. W., von der Gathen, P., Deckelmann, H., Jepsen, N., Kivi, R., Lyall, N., Palm, M., Notholt, J., Kois, B., Oelsner, P., Allaart, M., Piters, A., Gill, M., Van Malderen, R., Delcloo, A. W., Sussmann, R., Mahieu, E., Servais, C., Romanens, G., Stübi, R., Ancellet, G., Godin-Beekmann, S., Yamanouchi, S., Strong, K., Johnson, B., Cullis, P., Petropavlovskikh, I., Hannigan, J. W., Hernandez, J. -L., Diaz Rodriguez, A., Nakano, T., Chouza, F., Leblanc, T., Torres, C., Garcia, O., Röhling, A. N., Schneider, M., Blumenstock, T., Tully, M., Paton-Walsh, C., Jones, N., Querel, R., Strahan, S., Stauffer, R. M., Thompson, A. M., Inness, A., Engelen, R., Chang, K. -L., and Cooper, O. R.: COVID-19 crisis reduces free tropospheric ozone across the Northern Hemisphere, Geophysical Research Letters, 48, e2020GL091987, https://doi.org/10.1029/2020GL091987, 2021.
Szopa, S., Naik, V., Adhikary, B., Artaxo, P., Berntsen, T., Collins, W. D., Fuzzi, S., Gallardo, L., Kiendler-Scharr, A., Klimont, Z., Liao, H., Unger, N., and Zanis, P.: Short-Lived Climate Forcers. In Climate Change 2021: The Physical Science Basis. Contribution of Working Group I to the Sixth Assessment Report of the Intergovernmental Panel on Climate Change, edited by: Masson-Delmotte, V., Zhai, P., Pirani, A., Connors, S. L., Péan, C., Berger, S., Caud, N., Chen, Y., Goldfarb, L., Gomis, M. I., Huang, M., Leitzell, K., Lonnoy, E., Matthews, J. B. R., Maycock, T. K., Waterfield, T., Yelekçi, O., Yu, R., and Zhou, B., Cambridge University Press, Cambridge, United Kingdom and New York, NY, USA, 817–922, https://doi.org/10.1017/9781009157896.008, 2021.
Wang, H., Tarasick, D. W., Liu, J., Smit, H. G. J., Van Malderen, R., Shen, L., Blot, R., and Zhao, T.: Consistency evaluation of tropospheric ozone from ozonesonde and IAGOS (In-service Aircraft for a Global Observing System) observations: vertical distribution, ozonesonde types, and station–airport distance, Atmos. Chem. Phys., 24, 11927–11942, https://doi.org/10.5194/acp-24-11927-2024, 2024.
Worden, H. M., Bowman, K. W., Kulawik, S. S., and Aghedo, A. M.: Sensitivity of outgoing longwave radiative flux to the global vertical distribution of ozone characterized by instantaneous radiative kernels from Aura-TES, J. Geophys. Res., 116, D14115, https://doi.org/10.1029/2010JD015101, 2011.
Ziemke, J. R., Oman, L. D., Strode, S. A., Douglass, A. R., Olsen, M. A., McPeters, R. D., Bhartia, P. K., Froidevaux, L., Labow, G. J., Witte, J. C., Thompson, A. M., Haffner, D. P., Kramarova, N. A., Frith, S. M., Huang, L.-K., Jaross, G. R., Seftor, C. J., Deland, M. T., and Taylor, S. L.: Trends in global tropospheric ozone inferred from a composite record of TOMS/OMI/MLS/OMPS satellite measurements and the MERRA-2 GMI simulation , Atmos. Chem. Phys., 19, 3257–3269, https://doi.org/10.5194/acp-19-3257-2019, 2019.