the Creative Commons Attribution 4.0 License.
the Creative Commons Attribution 4.0 License.
 | 01 Oct 2025
Fertilization-driven pulses of atmospheric nitrogen dioxide complicate air pollution in early spring over the North China Plain
Tian Feng
Guohui Li
Shuyu Zhao
Naifang Bei
Xin Long
Yuepeng Pan
Yu Song
Ruonan Wang
Xuexi Tie
Luisa T. Molina
Atmospheric nitrogen dioxide (NO2) has shown periodic conspicuous pulses in the tropospheric column in March over the North China Plain during the past two decades. However, these repetitive pulses have never been reported, and their underlying causes remain unclear. Here, we present robust evidence to demonstrate that agricultural fertilization drives the early spring NO2 column increase. The fertilization-driven soil NOx (= NO+NO2) emissions, comparable to anthropogenic sources, exert complicated influences on regional air quality. They significantly reduce nocturnal and diurnal O3 concentrations in agricultural areas in early spring, distinct from the scenarios in summer, but increase fine particulate matter (PM2.5) concentrations via strongly enhancing nitrate aerosol formation. The impact also extends to urban areas, approximately half that of agricultural areas. These findings have increasing implications for coordinated control of PM2.5 and O3 under global warming. We thus suggest that reducing NOx emissions in croplands is essential to achieve better air quality in agricultural countries and regions.
- Article
(10837 KB) - Full-text XML
-
Supplement
(11162 KB) - BibTeX
- EndNote


Nitrogen oxide (NOx = nitric oxide (NO) + nitrogen dioxide (NO2)) is a major air pollutant in the troposphere and a key precursor to ozone (O3) and fine particulate matter (PM2.5) due to its photochemical properties (Seinfeld and Pandis, 2006; Zhang et al., 2015). It is also a short-lived climate forcer regulated by both China and the United States (IPCC, 2023). Understanding the NOx budget is crucial for addressing these issues. Globally, atmospheric NOx is mainly produced by fossil fuel combustion (Crippa et al., 2023; Janssens-Maenhout et al., 2015; Yan et al., 2005), with smaller contributions from wildfires and lightning (Bauwens et al., 2020; Murray et al., 2012). Additionally, soil generates substantial NOx through nitrification and denitrification processes (Bouwman et al., 2002; Cárdenas et al., 1993; Davidson, 1992; Yan et al., 2005), particularly after the rewetting of dry soils (Galbally and Roy, 1978; Huber et al., 2020; Yienger and Levy, 1995). On a regional scale, soil NOx emissions may even exceed those from fossil fuel sources in summer (Almaraz et al., 2018; Sha et al., 2021). Model- and satellite-based studies estimate that global annual soil NO emissions, with the largest contributor being cultivated croplands, range from 9 to 27 Tg N (Hudman et al., 2012; Steinkamp and Lawrence, 2011; Vinken et al., 2014; Yan et al., 2005), accounting for about 15 % of total NOx emissions (Hudman et al., 2012). This wide range is due to the complex response of soil NOx emissions to driving factors like fertilization, temperature, and soil moisture (Huber et al., 2020; Oikawa et al., 2015), making accurate estimation challenging.
The emission rates from fertilized croplands are 1 to 2 orders of magnitude higher than those from nearby grasslands and forest soils (Almaraz et al., 2018; Anderson and Levine, 1987; Guo et al., 2020; Yienger and Levy, 1995). Recent studies show significant NOx emissions from croplands post-fertilization, exceeding pre-fertilization rates by an order of magnitude (Almaraz et al., 2018; Hickman et al., 2017; Laville et al., 2011; Liu et al., 2005; Oikawa et al., 2015; Zhao et al., 2015). Despite this robust evidence of strong NOx emissions from agricultural fertilization, the lack of extensive in situ measurements hinders accurate estimation of these emissions and their environmental impacts. Additionally, the effect of agricultural fertilization on air quality has not received sufficient global attention, although some pioneering studies have pointed out the implications for air quality since the 1990s (Davidson et al., 1998; Hall et al., 1996). In recent years, studies have reported that agricultural soil emissions significantly increase atmospheric NOx levels (Almaraz et al., 2018; Hickman et al., 2017; Huang et al., 2018; Oikawa et al., 2015) and enhance O3 formation in summer in California (Oikawa et al., 2015) or during the growing season of crops in sub-Saharan Africa (Hickman et al., 2017; Huang et al., 2018).
The North China Plain (NCP) is one of the major grain-producing regions in China. Winter wheat–maize double cropping is a typical rotation system mainly practiced in this region (Liu et al., 2003; Zhu et al., 1994). China has been the world's largest consumer of N fertilizer since 2000 (Liu et al., 2013), with annual usage peaking at approximately 31.2 Tg N in 2014 (Yu et al., 2022). About half of this fertilizer is lost to the environment (Liu et al., 2013), indicating a significant potential source for NOx emissions from China's croplands. The agricultural management in the NCP has been known for incorporating high fertilization rates with excessive N fertilization (Sun et al., 2022; Vitousek et al., 2009; Zhao et al., 2006). Thus, this region is the largest consumer of agricultural fertilizer N in China (Yu et al., 2022) and has shown substantial soil NOx emissions (Liu et al., 2010; Tang et al., 2020; Zhang et al., 2011). The emissions significantly increase ambient NOx levels and enhance O3 formation in summer (Huang et al., 2023; Lu et al., 2021; Wang et al., 2022a). These concerns typically focus on the warm season when higher temperatures favor NOx emissions from soils. However, frequent agricultural activities and N-fertilizer use also occur during transitional seasons, and how periodic agricultural fertilization affects soil NOx emission and regional air quality remains unclear.
In this study, we present a pulse of atmospheric NO2 column in early spring during the past two decades over the NCP. However, this phenomenon has not been previously reported in this region. Combining agricultural fertilization records, surface NO2 and NH3 observations, long-term satellite observations of NO2 and NH3, and a flexible scheme of soil NOx emission, we successfully explain the underlying cause for the NO2 column peaks using a regional atmospheric transport model online coupled with chemistry and further assess the impacts of the pulsing NOx emission on regional air quality.
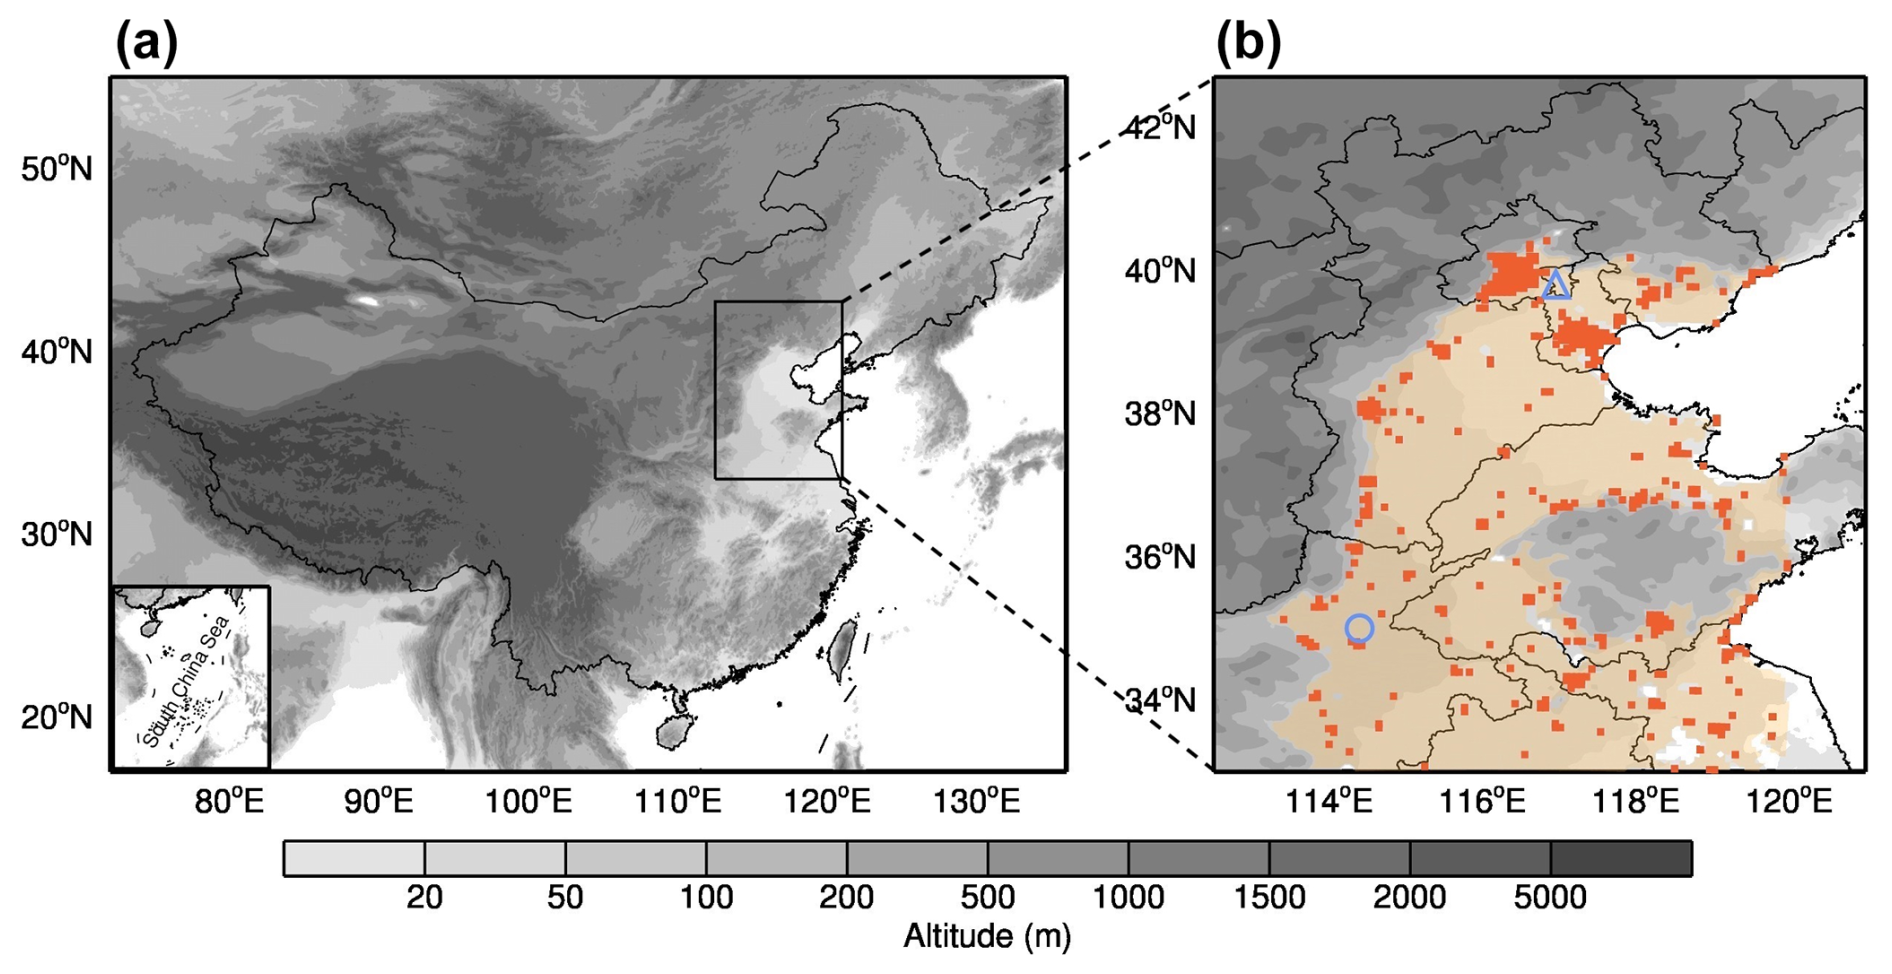
Figure 1Domain overview. (a) Geographic location of the NCP, which is predominantly characterized by plains at an elevation of less than 100 m and is known for being a major agricultural zone. (b) Extensive cultivated croplands are distributed in the NCP, marked by the orange shading, while urban areas are marked by red shading. The graphic markers denote locations of field observation sites, among which the blue circle represents the Fengqiu cropland ecological station, Chinese Academy of Sciences, with a long-term record of agricultural fertilization, and the triangle represents the rural Xianghe station with ambient NH3 measurements. The agricultural areas in orange within the NCP are defined as croplands at an altitude of less than 100 m, and the urban areas in red are defined as built-up areas within the NCP. Publisher's remark: please note that the above figure contains disputed territories.
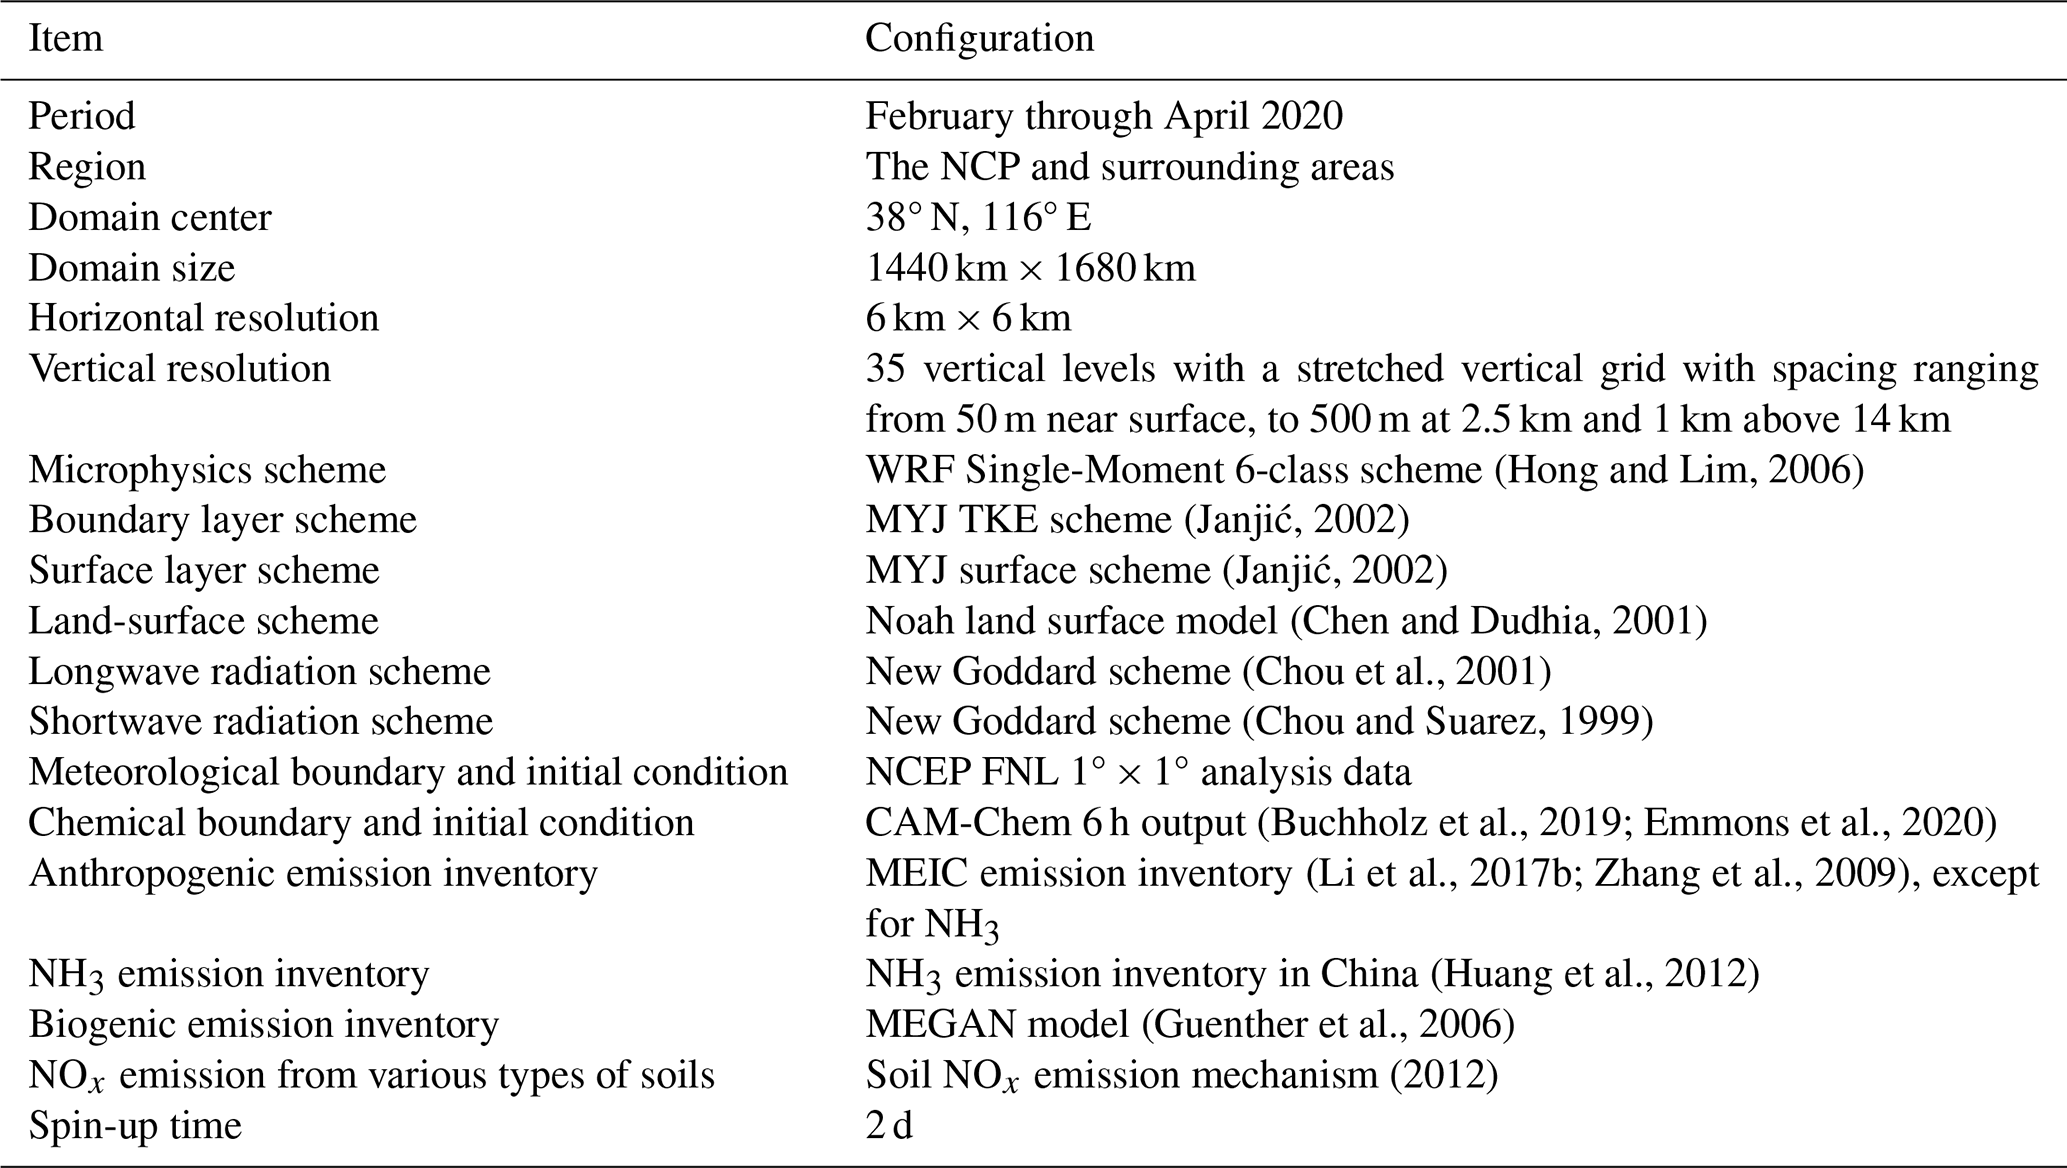
Table 1Model configuration for the simulation domain, meteorological schemes, initial and boundary conditions, and emission inventories.
2.1 Model and configurations
The Weather Research and Forecasting model fully coupled with atmospheric chemistry (WRF-Chem, version 3.6.1) that we used is a modified model by Li et al. (2011a, b, 2012, 2010) and Feng et al. (2021), in which we implement the BDSNP mechanism by Hudman et al. (2012) to calculate soil NOx emissions related to agricultural fertilization and their influences on regional air quality in the NCP. The model is configured with grid spacing of 6 km × 6 km (240 × 280 grid cells) with the center at 38° N, 116° E (Fig. 1). Thirty-five vertical levels are employed in the stretched vertical grid with spacing ranging from 50 m near the surface to 500 m at 2.5 km and 1 km above 14 km. Meteorological initial and boundary conditions use the National Centers for Environmental Prediction (NCEP) FNL 1° × 1° analysis data, and the chemical initial and boundary conditions are interpolated from the CAM-Chem 6 h output (Buchholz et al., 2019; Emmons et al., 2020). The non-soil emission inventory is developed by Zhang et al. (2009), and the biogenic emissions are calculated online using the Model of Emissions of Gases and Aerosol from Nature (MEGAN) model (Guenther et al., 2006). Specifically, monthly ammonia (NH3) emissions are incorporated from a high-resolution NH3 emission inventory developed by Huang et al. (2012), which includes emissions from fertilizer application, livestock, and other sources. The model spin-up time is 2 d (Table 1).
2.2 Soil NOX emission scheme
We implement a soil NOx emission scheme, the Berkeley–Dalhousie Soil NO Parameterization (BDSNP) by Hudman et al. (2012), into the WRF-Chem model. The scheme comprehensively considers various factors, including available soil nitrogen content (Navail, ng N m−2) from fertilizer application and nitrogen deposition, in which the soil NOx emission (Esoil, ) is a function of Navail, climate, and edaphic conditions:
where Navail is available soil nitrogen mass, and () represents the biome-dependent emission factor. f(T) (dimensionless) and g(θ) (dimensionless) are parameters regulated by soil temperature and moisture, respectively. P(ldry) (dimensionless) denotes the pulsed soil emission from wetting of dry soils. The product of f(T) and g(θ) is calculated as follows:
where T ( 30 °C) is soil temperature and θ (, dimensionless) is water-filled pore space, defined as the ratio of the volumetric soil moisture content to the porosity. According to laboratory and field measurements (Hudman et al., 2012), the constants a and b are determined so that g(θ) maximizes when θ = 0.2 for arid soils and θ = 0.3 elsewhere.
The pulsing term P(ldry), following Yan et al. (2005), describes the magnitude of the peak flux relative to the pre-wetting flux, which is parameterized as:
where ldry (hours) represents the length of the antecedent dry period, and c (c = 0.068 h−1) is a constant rate denoting the rise/fall time of the pulse. Fertilizer application data are interpolated from the global gridded chemical fertilizer and manure application inventory at 0.5° × 0.5° (Potter et al., 2010; Yan et al., 2005). The chemical and manure fertilizers are obtained from the International Fertilizer Association (IFA) and the Food and Agriculture Organization of the United Nations (FAO). The Chinese chemical fertilizer application (straight N application) from IFA is about 19.6 Tg N a−1 for 2000, quite close to the amount of 19.9 Tg N a−1 for 2020 from the China Statistical Yearbook (https://www.stats.gov.cn/sj/ndsj/2021/indexch.htm, last access: 10 September 2025). More details of the scheme are found in related studies elsewhere (Hudman et al., 2012; Lu et al., 2021). It should be noted that we use the default BDSNP fertilizer and global emission assumptions, and these assumptions (primarily the split and not applying the topdressing in a single application) may not accurately reflect the fertilizer applications in China. The BDSNP tuning, which was done for the year 2000 agricultural emissions estimated by Stehfest and Bouwman (2006), is close to recent estimates of global emissions, possibly on the high side (Gong et al., 2025; Wang et al., 2022b).
2.3 Emission inventories
We employ two emission inventories in this study: the Hemispheric Transport of Air Pollution Version 3 (HTAP v3, 2005–2018) emission inventory, which includes soil and non-soil emissions (Li et al., 2017a), and the Multi-resolution Emission Inventory for China (MEIC v1.3, 2007–2018), which has no soil emissions (Li et al., 2017a). In the HTAP inventory, the non-soil emission inventory includes energy, industry, ground transport, residential, waste, shipping, and aviation sources, with a spatial resolution of 0.1° × 0.1° and a temporal resolution of one month. Agricultural emissions are involved in the latest HTAP v3 inventory, which includes soil NOx emissions (Crippa et al., 2023). Nevertheless, the soil emissions in this inventory are calculated using the traditional “bottom-up” method (Kurokawa and Ohara, 2020), rather than estimated by a process-based emission module. The monthly MEIC emission inventory, with a spatial resolution of 0.25° × 0.25°, is incorporated in parallel with the HTAP emission inventory. Here, we focus on NOx and NH3 emissions from croplands with fertilization and adopt the NH3 emission inventory by Huang et al. (2012) because it explicitly distinguishes NH3 produced by agricultural fertilization from other NH3 sources.
2.4 Air pollutant measurements
Satellite-derived tropospheric NO2 columns are from Ozone Monitoring Instrument (OMI) hosted by the Aura satellite, which was launched by the National Aeronautics and Space Administration (NASA). The Level-3 product, where pixel-level data of good quality are binned and “averaged” into 0.25° × 0.25° grids, was retrieved and analyzed in the present study. The satellite operates in a sun-synchronous polar orbit and has a local overpass time of around 13:45 LT (local time) in North China. The dataset is for all atmospheric conditions and for sky conditions with cloud fraction less than 30 % (https://cmr.earthdata.nasa.gov/search/concepts/C1266136111-GES_DISC.html, last access: 10 September 2025). The dataset has a spatial resolution of 13 km × 24 km, with a temporal coverage of 2005–2022 (Lamsal et al., 2021). Note that the number of pixels included in NO2 retrievals changes over time because of the increase in the number of pixels affected by the row anomaly issue, making the data unsuitable for trend analysis and possibly introducing uncertainty in seasonal averages. The Level-2 product of NH3 columns is employed, which is provided by the Space Administration and the Infrared Atmospheric Sounding Interferometer (IASI) hosted on the MetOp series of satellites. The satellite also operates in a sun-synchronous polar orbit and has a local overpass time of around 09:30 am and 09:30 pm in North China (twice a day). We construct a 0.25° × 0.25° mesh grid and calculate the average of the NH3 columns from IASI within each grid cell (Clarisse et al., 2023). Low-quality satellite data are filtered out due to the interference of clouds. To cover all the domain (Fig. 1), the data used in this study are averaged into 7 d mean datasets of NO2 and NH3 columns with a non-overlapping 7 d window during 2007–2021. The data are interpolated into the model grids using bilinear interpolation.
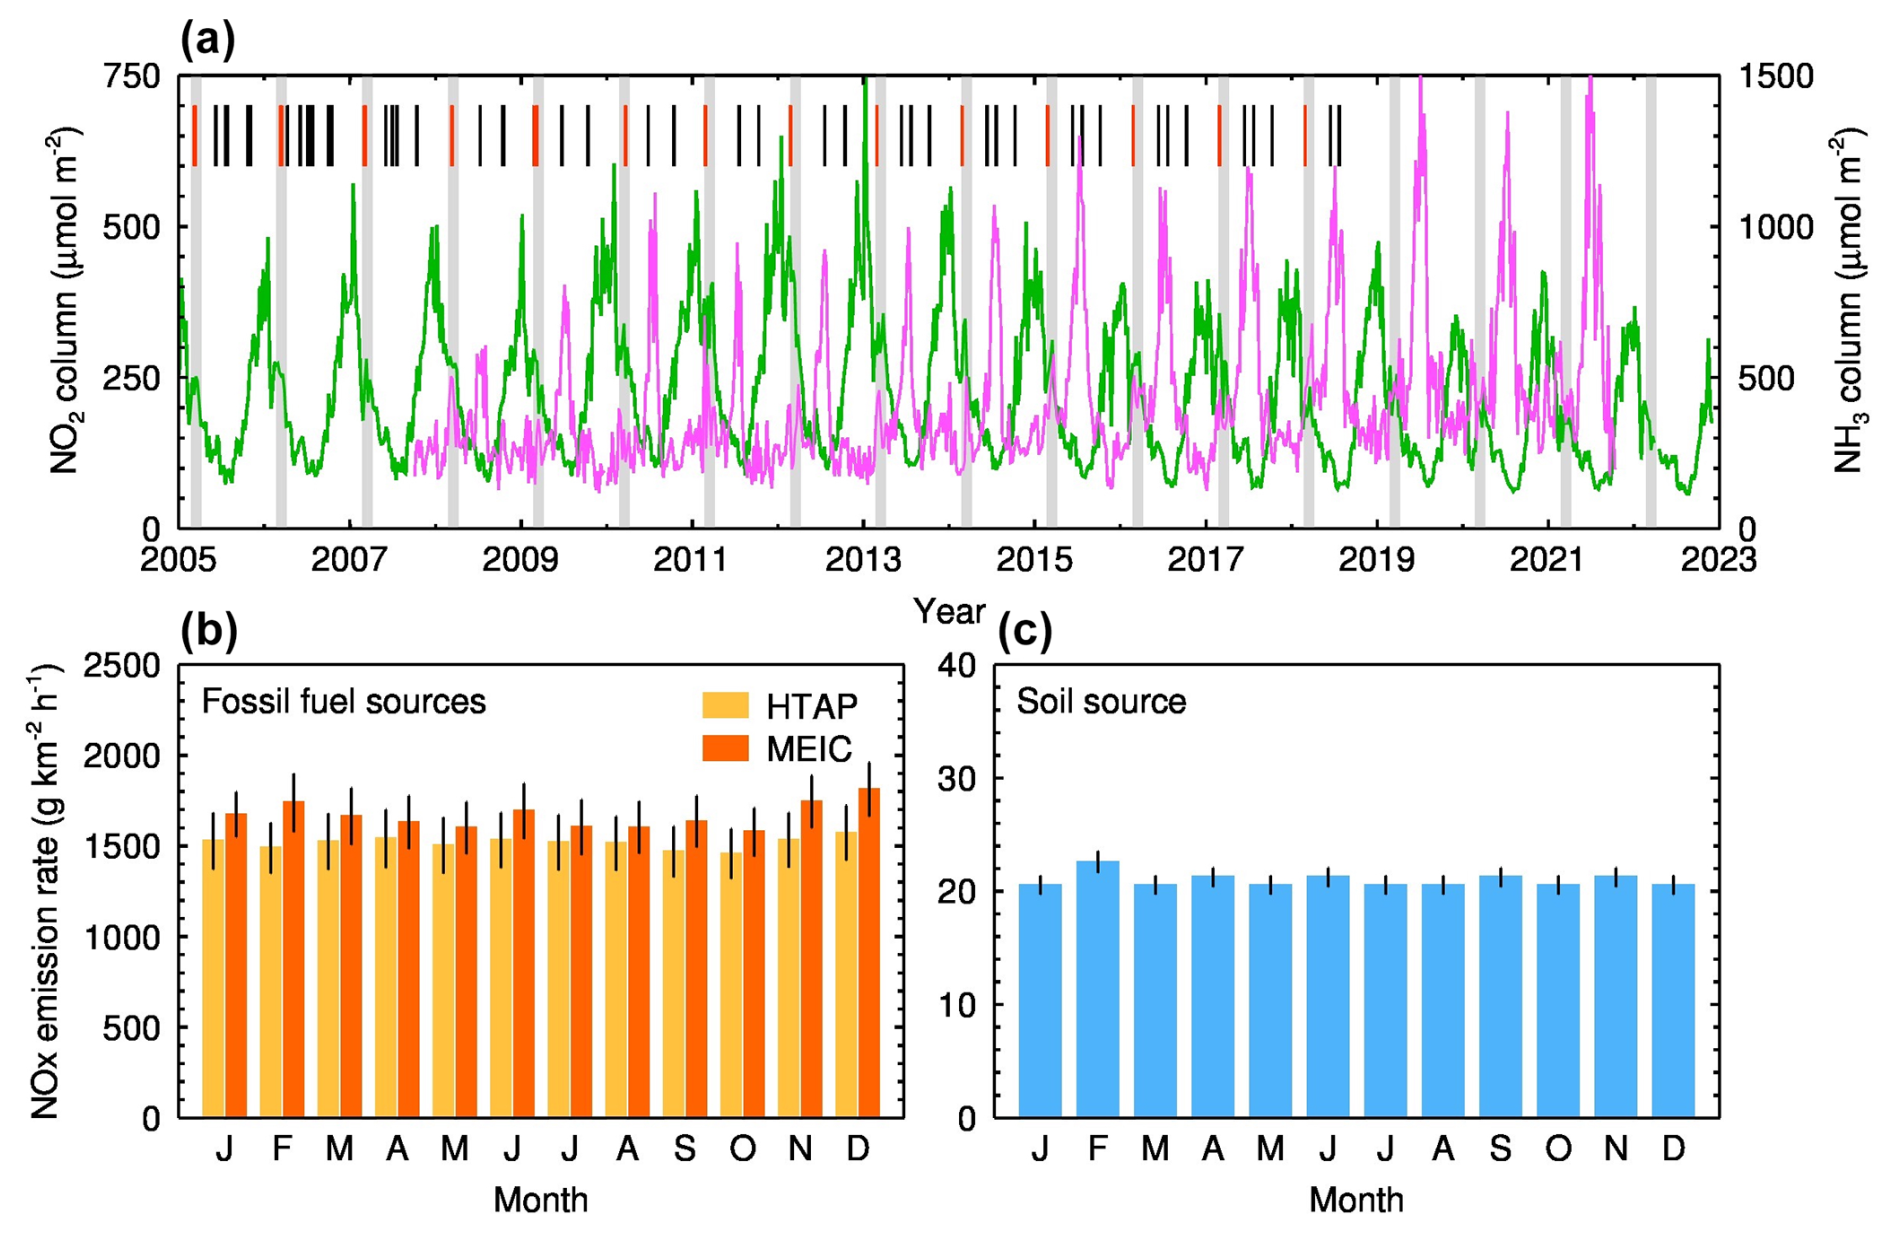
Figure 2NO2 column pulses in March, NH3 column variation, and NOx emissions from fossil fuel and soil sources over the NCP. (a) Long-term variation of the 7 d mean tropospheric NO2 column observed by OMI during 2005–2022 (green) and NH3 column retrieved from IASI during 2007–2022 (pink). Intersections of the gray bars and the green lines denote that a sub-peak of the NO2 column occurred in each March, and the short bars represent the timing record for agricultural fertilization at the Fengqiu station in the NCP, with the red ones indicating the fertilization period in early spring. (b) Monthly mean NOx emission rates with ± 1σ standard deviation (SD) in two sets of anthropogenic emission inventories, the HTAP v3 (2005–2018, orange) and MEIC v1.3 (2008–2017, red). (c) Same as (b), but for NOX emission rates from soils in the HTAP v3 inventory (2005–2018).
Ambient surface NO2, O3, and PM2.5 mass concentrations at 141 sites in the NCP are obtained from the China National Environmental Monitoring Centre (CNEMC, Fig. S1 in the Supplement). These in situ measurements are performed by the Thermo Scientific™ ambient particulate monitor and gas analyzers, in which NO2 and O3 are measured by the Model 42i Chemiluminescence NO–NO2–NOx Analyzer and the Model 49i UV Photometric Ozone Analyzer, respectively. PM2.5 is measured by the Model 5030 Synchronized Hybrid Ambient, Real-time Particulate (SHARP) Monitor, which uses proprietary digital filtering to continuously calibrate mass to obtain an accurate, precise, and real-time mass concentration. The sampling time is 1 min for these monitoring devices. Agricultural NH3 concentration is monitored by a Picarro analyzer based on the principle of cavity ring-down spectroscopy (CRDS) at the rural Xianghe station (Fig. 1), with a sampling frequency of 1 Hz. Hourly data are derived by averaging the high-frequency measurements.
3.1 Satellite-retrieved NO2 column pulses
During the past two decades, 7 d mean tropospheric column of NO2 measured by the Ozone Monitoring Instrument (OMI) in the NCP exhibits a significant temporal variation, with the magnitude varying from less than 100 µmol m−2 to more than 680 µmol m−2 (Fig. 2a). The annual cycle is highly prominent and its seasonal variation is remarkable, with significantly higher levels in cold seasons than those in warm seasons. Throughout the year, the pattern of the NO2 column looks like a rhinoceros horn, which is characterized by a major peak in winter and multiple noticeable sub-peaks in other seasons. These sub-peaks often occur at fixed times, such as in March, June, and October, the most noticeable of which is in March, with the highest magnitude (Figs. 2a and S1). We examine the monthly variation in anthropogenic NOx emission rates over the NCP in global and regional emission inventories and find that the monthly variation is more evident in the regional emission inventory, with a significantly higher emission than that in the global emission inventory. Nevertheless, neither of them reveals any discernible sub-peaks of NOx emission rates from fossil fuel combustion to coincide with the sub-peaks of the NO2 column (Fig. 2b).
As for soil NOx emissions, they are absent in the regional emission inventory, while in the global emission inventory, soil NOx emissions fluctuate slightly on a monthly scale, far less than those from fossil fuel combustion, constituting less than 2 % of the total (Fig. 2c). Similar to NOx emissions from fossil fuel combustion, there are no evident sub-peaks of soil NOx emission to keep pace with the atmospheric NO2 column. Soil NOx emissions are at an even lower level in March, significantly less than emissions in adjacent months. Therefore, the known emission inventory fails to explain the occurrence of these sub-peaks. On the other hand, we compute a pollution accumulation index (PAI, Sect. S1 in the Supplement), the product of boundary layer height and wind speed, to semi-quantitatively assess the influence of atmospheric dispersion conditions on the NO2 column. The NO2 column seems to be somewhat dependent on the PAI, yet the noticeable discrepancies between the timing of the sub-peaks and the PAI are insufficient to account for the occurrence of each sub-peak (Fig. S3). Additionally, it is observed that the daily soil temperature was consistently higher than 0 °C during March 2020 and in the 10 days before (Fig. S4). Therefore, the sub-peak of the NO2 column is not expected to originate from soil thaw either.
3.2 Linkage between NO2 column pulses and agricultural fertilization
What causes these regular NO2 sub-peaks that have occurred over the NCP during the past two decades? Measurements on ammonia (NH3) columns also present similar pulses to those of NO2 column during the same period, in spite of some differences in the long-term trend (Fig. 2a). Although the main peaks of NH3 column occur in June, the sub-peaks of NH3 column in March may provide favorable evidence that these NO2 column sub-peaks are connected to agricultural activities because atmospheric NH3 largely originates from fertilizer application in agriculture (Crippa et al., 2023; Huang et al., 2012; Li et al., 2017a). We note that the two time series do not have similar seasonal dynamics, which may raise some questions about whether the March NO2 peaks represent fertilizer pulses. This discrepancy could be due to several factors: (1) contributions from fossil fuel-derived NOx, (2) elevated background soil NOx emissions during the “spring thaw” period, (3) differences in fertilizer type, as fertilizers vary in their potential for ammonia volatilization, and (4) variation in application methods, e.g., banding or deep soil placement vs. broadcasting, especially when the latter is done without incorporation.
Another key evidence is that the occurrence of each sub-peak of the NO2 column is highly consistent with the record of agricultural fertilization at the Fengqiu cropland ecological station in the NCP during the past decades (Figs. 1b, 2a, and S1). The wheat–maize double-cropping system is predominant in the NCP, where the agricultural activities are strongly dependent on the lunar calendar. For winter wheat, the planting date ranges from early to mid-October (after maize harvest). Fertilization is generally divided into three stages: (1) pre-planting during late September–early October; (2) jointing stage during mid-March–early April; (3) grain filling during late April for high-yield fields. The planting date of summer maize ranges from early to mid-June (after wheat harvest), and the stages of fertilization include: (1) at planting during early June; (2) V6–V8 stage during early July; (3) tasseling stage during late July for high-yield fields. The agricultural fertilization is closely associated with three solar terms, i.e., Waking of Insects in March (the 3rd solar term), Grain in Beard in June (the 9th solar term), and Cold Dew in October (the 17th solar term). During these pulses of the NO2 column, we found that the pulse in March is more pronounced than those in June and October, because March is the season for large-scale cultivation in the NCP, accompanied by more land preparation and fertilization. Therefore, we hypothesize that the NO2 column pulse in March is possibly caused by fertilized croplands that accelerate NOx emissions from agricultural soils. Field campaigns have measured a high NO emission rate of 266.3 in croplands after fertilization and irrigation in autumn in eastern China (Tang et al., 2020; Tian et al., 2020) and also in other regions (Hickman et al., 2017; Huang et al., 2018; Huber et al., 2020), suggesting that agricultural fertilization is likely a significant source of atmospheric NOx in major agricultural countries like China.
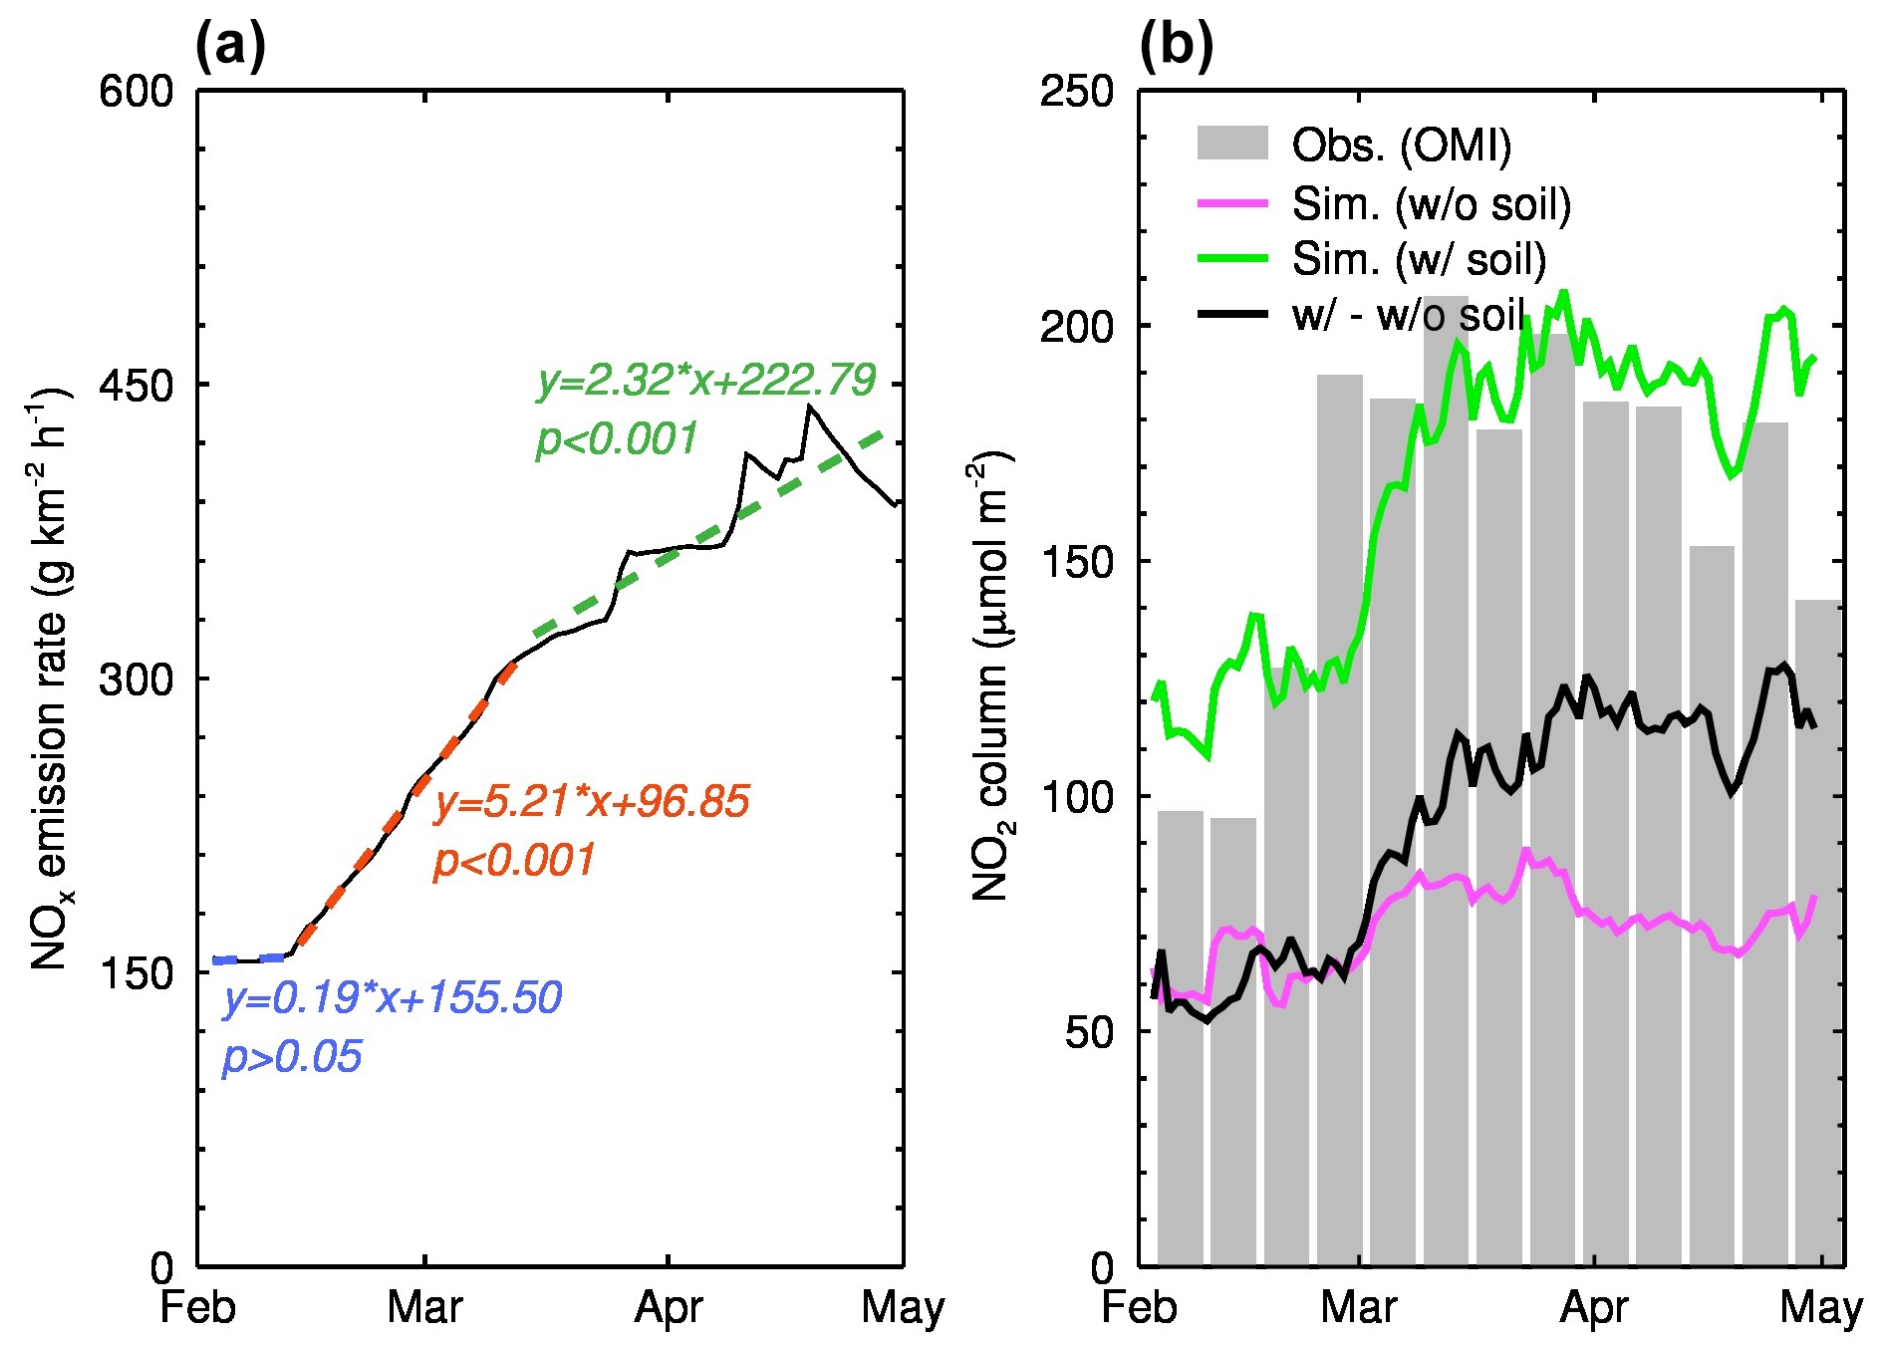
Figure 3NOx emissions from agricultural fertilization and resultant NO2 column during February–April 2020 over the NCP. (a) Calculated NOx emission rate from croplands with N-fertilizer application in the model. The black curve represents daily variation in the NOx emission rate around the fertilization, and the blue, red, and green dashed lines correspond to the trends of NOx emission rates in croplands during the pre-fertilization, fertilization, and post-fertilization periods, respectively. (b) Observed and simulated NO2 column. The gray histogram represents the NO2 column observed by satellite (OMI). The green and pink lines represent the simulated NO2 column with and without soil NOx emissions, and the black line shows the difference between them. The model well replicates the rapid increase in the observed NO2 column by considering soil NOx emissions from agricultural fertilization.
3.3 Soil NOx emission mechanism
To examine the role of soil NOx emissions from agricultural fertilization in the pulses of the atmospheric NO2 column, we introduce a flexible soil NOx emission module and NH3 emission into the WRF-Chem model and perform two simulation experiments that include and exclude soil emissions, respectively (Table 1). Noticeably, there is an acceleration in the release of soil NOx, and the daily mean emission rate increases from 155.6 to 438.3 during the simulation period (Fig. 3a). In particular, the NOx emission rate during the post-fertilization phase is significantly higher than that of other phases, consistent with the accelerated soil NOx release observed in agricultural areas in California after fertilization (Oikawa et al., 2015). On average, the simulated NOx emission rate in March is 312.9 , between the measured 113.6 in November in eastern China (Tang et al., 2020) and 988.2 in September in California (Oikawa et al., 2015), suggesting the rationality of the soil NOx emission mechanism in the model. We should also note that the BDSNP scheme would be heavily biased toward having a fertilizer-induced emission peak only at planting/green-up.
We evaluate the model performance against the satellite-derived NO2 column. Consequently, the modified model perfectly replicates the sudden increase in NO2 column linked to agricultural fertilization, while the conventional WRF-Chem model fails to capture the observed NO2 column pulse in March due to the lack of the adopted soil NOx emission mechanism (Fig. 3b). For example, when soil NOx emission caused by agricultural fertilization is considered, the simulated NO2 column rapidly increases to the peak in March, matching well with the satellite observation. However, without the contribution of agricultural fertilization, the NO2 column seems to exhibit a weak upward trend but not a significant one. Comparing these two scenarios, a substantial NOx emission from N-fertilizer input in croplands leads to an increase in the NO2 column by 1 to 1.5 times.
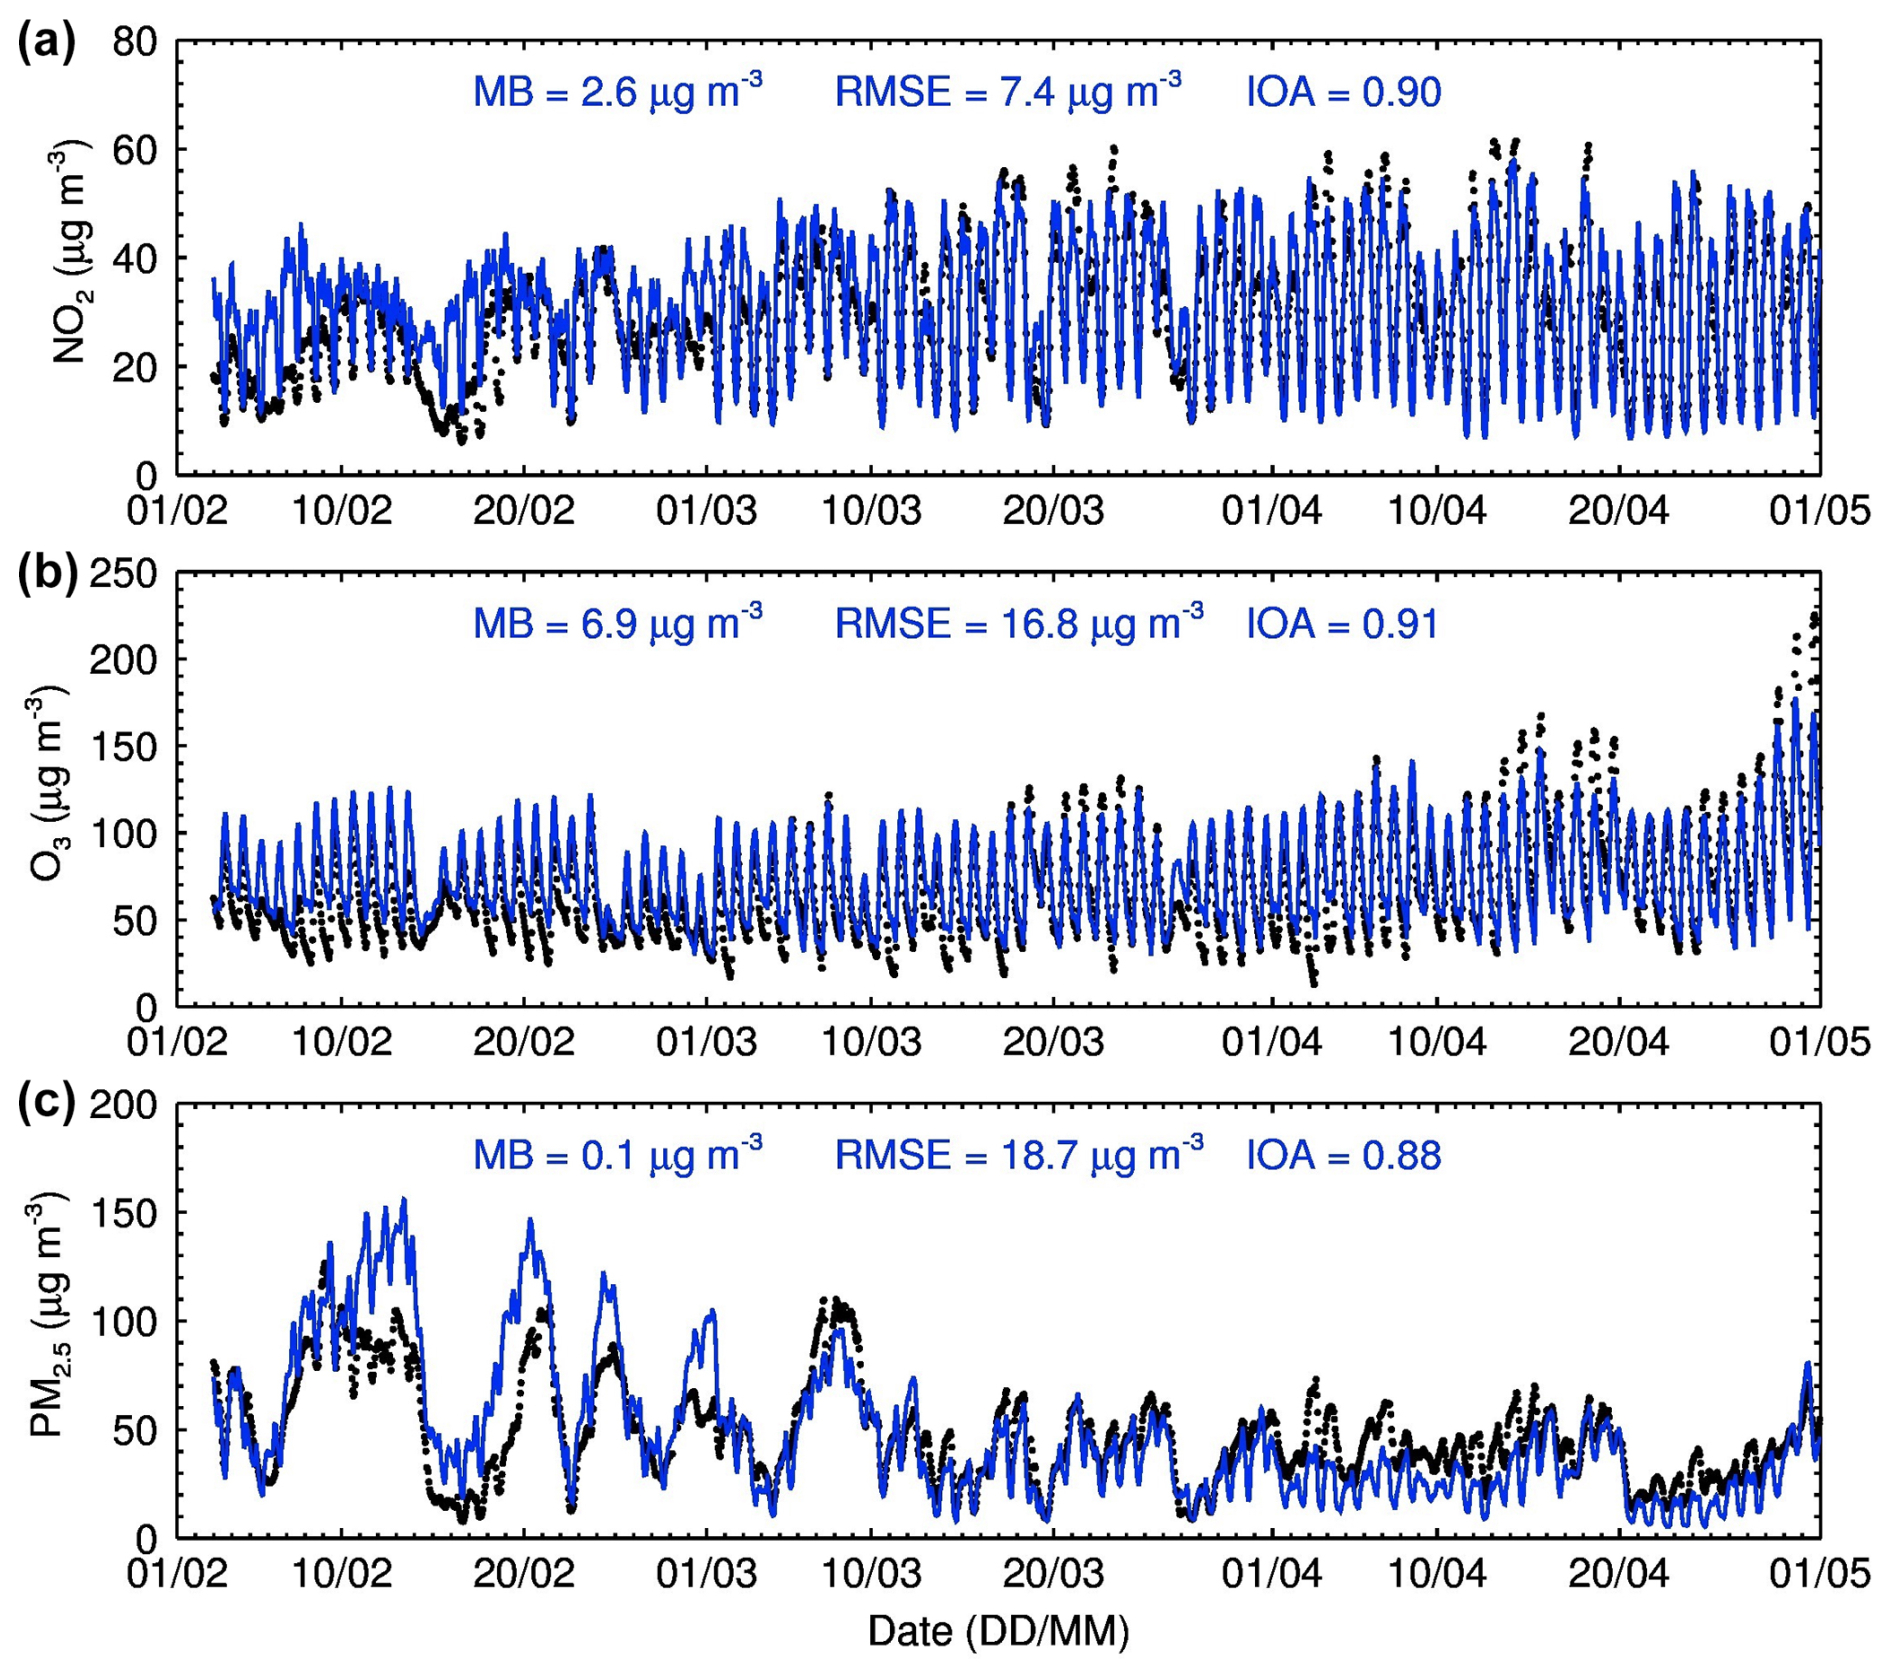
Figure 4Simulated vs. measured surface pollutants averaged over the monitoring sites of the NCP (Fig. S1) during February–April 2020. (a–c) Temporal variations in surface NO2 (a), O3 (b), and PM2.5 (c) mass concentrations. The blue curves denote the model calculations, and the black dots denote in situ measurements. Model biases are shown in the central upper position of each figure.
We also validate the modified model performance on temporal variations of routine surface pollutant measurements (NO2, O3, and PM2.5) associated with NOx emissions at the CNEMC sites throughout the simulation period (Fig. 4). Although there are some discrepancies between the simulations and observations, e.g., overestimates occur in mid-February for NO2 and PM2.5 levels, the model generally reproduces hourly variations in each pollutant reasonably well. The indices of agreement (IOAs, Sect. S2) between the simulated and observed near-surface concentrations of NO2, O3, and PM2.5 are 0.90, 0.91, and 0.88, respectively, and the normalized mean biases (NMBs) for these pollutants are within 10 %.
We still cannot ignore the discrepancies between the model results and observations. These biases may largely originate from the soil NOx emission mechanism. The fertilization dates in the BDSNP mechanism are determined by the beginning and end of the growing season, which are derived from the MODIS Land Cover Dynamics product (MCD12Q2) averaged over the years from 2001 to 2004 (Hudman et al., 2012). This may be quite different from practices in 2020, the year we simulated in this study. We use the default assumption in the mechanism that 75 % of fertilizer is added on the green-up day, with the remaining 25 % applied constantly throughout the rest of the season (Hudman et al., 2012). We should note that the treatment is an estimate for local farming practice in Mexico in 1994 (Matson et al., 1998), which probably introduces biases in other regions. Typical practice would place more fertilizer during topdressing and less at planting. For example, a split was used by GGCMI, the largest global crop modeling exercise (Jägermeyr et al., 2021), and a split was used for maize production in Northeast China (Zheng et al., 2023). It is also worth noting that the BDSNP mechanism treats topdressing as a series of applications spread out over several weeks or months rather than as a single event, which could further influence the modeling results. Despite the uncertainties, all of these significant improvements in the modified model we used suggest that soil NOx emission from agricultural fertilization would exert a crucial influence on regional air quality.
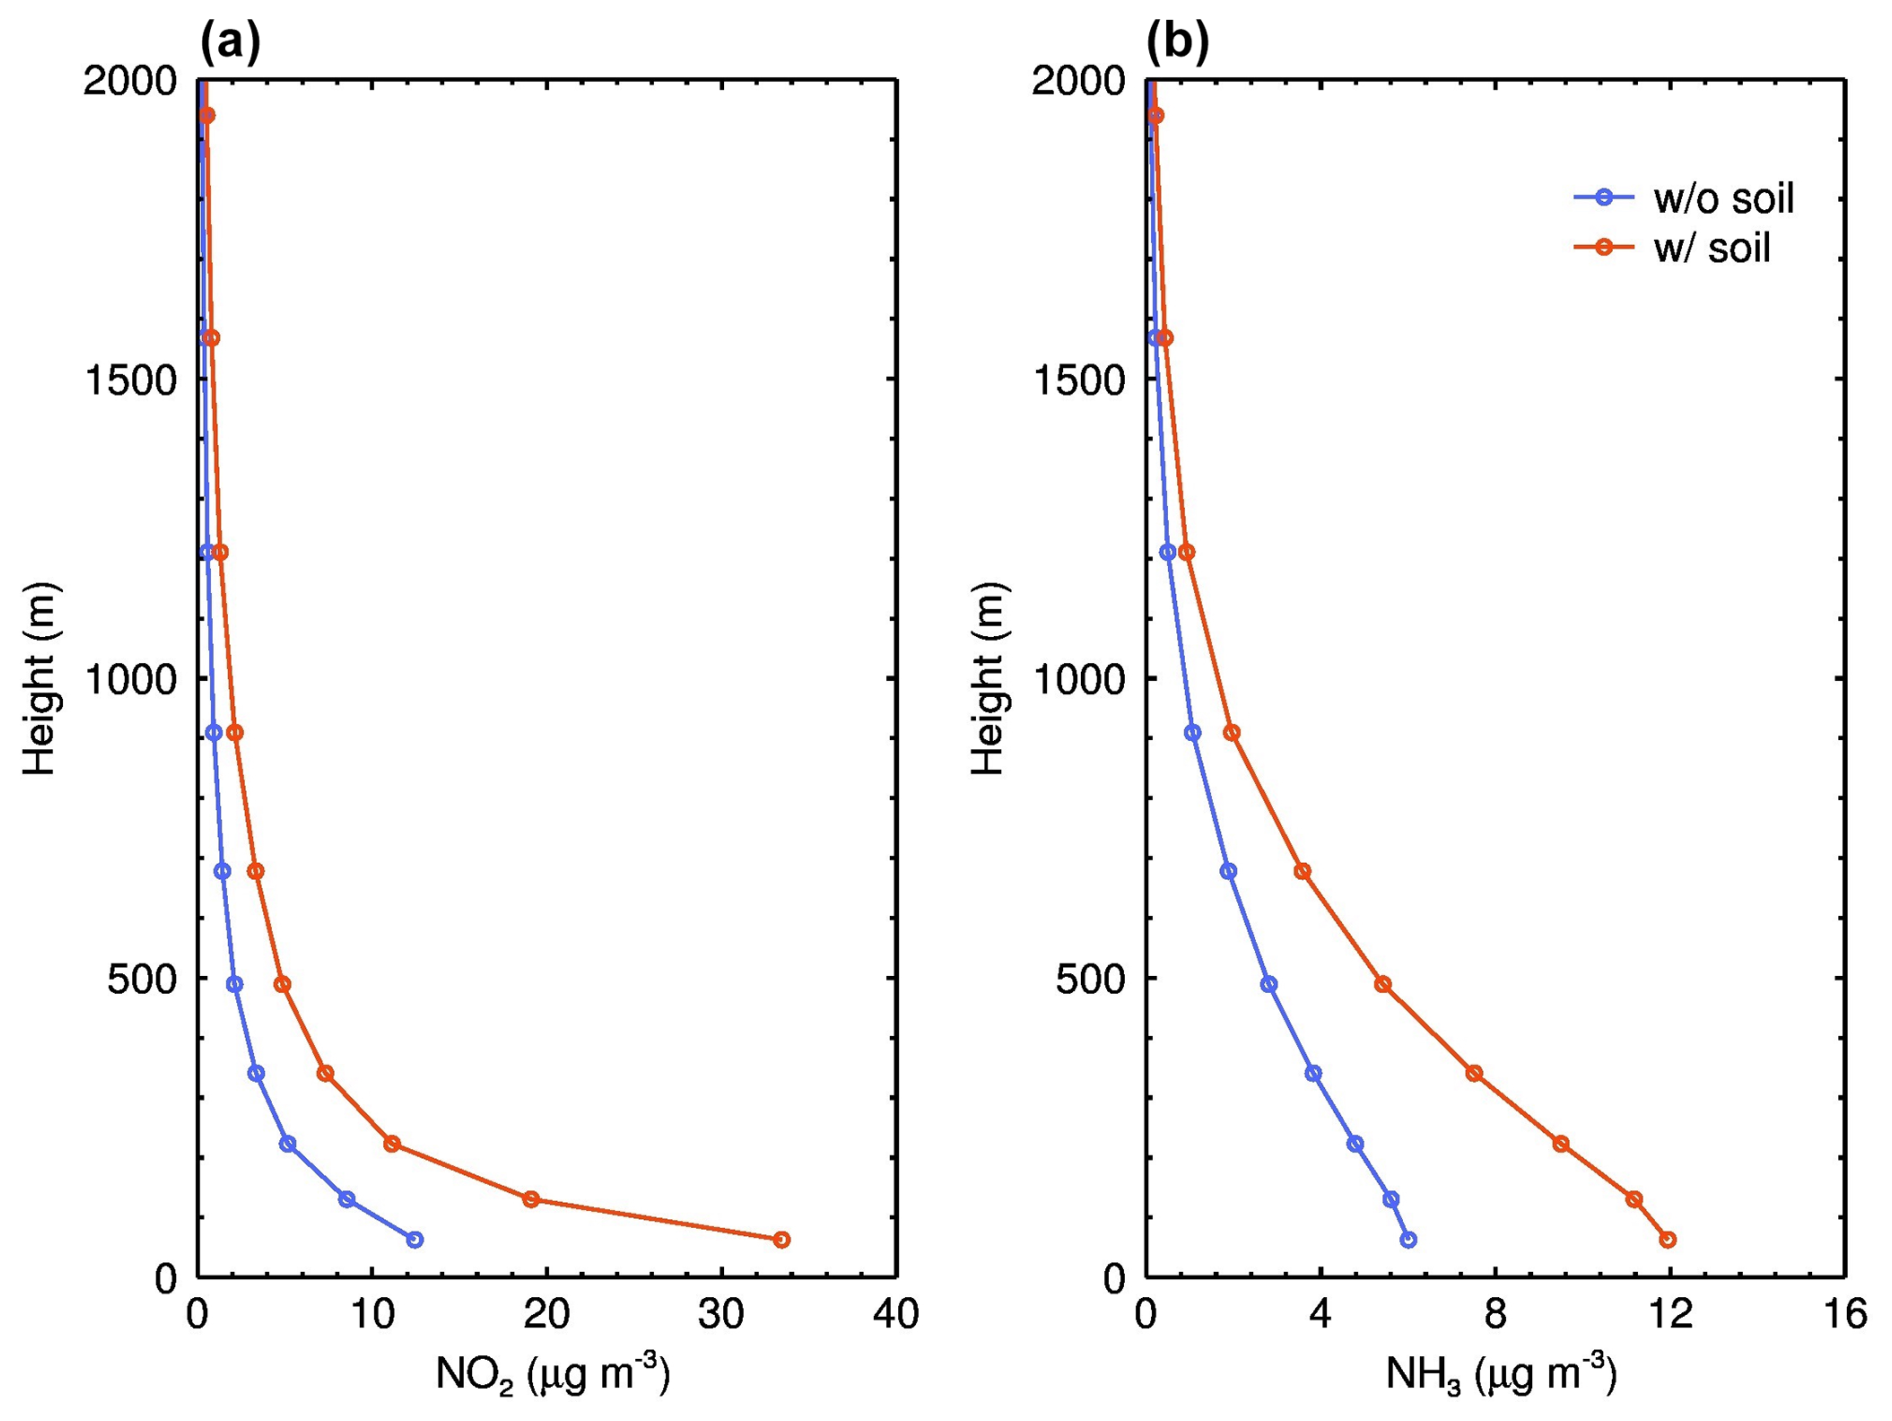
Figure 5Vertical profiles for impacts of soil emissions on gas pollutants during March 2020 over the NCP. (a) Difference in NO2 concentration with and without the influence of soil NOx emission from agricultural fertilization at various heights in the near-surface layers. (b) Similar to (a), but for NH3 concentration.
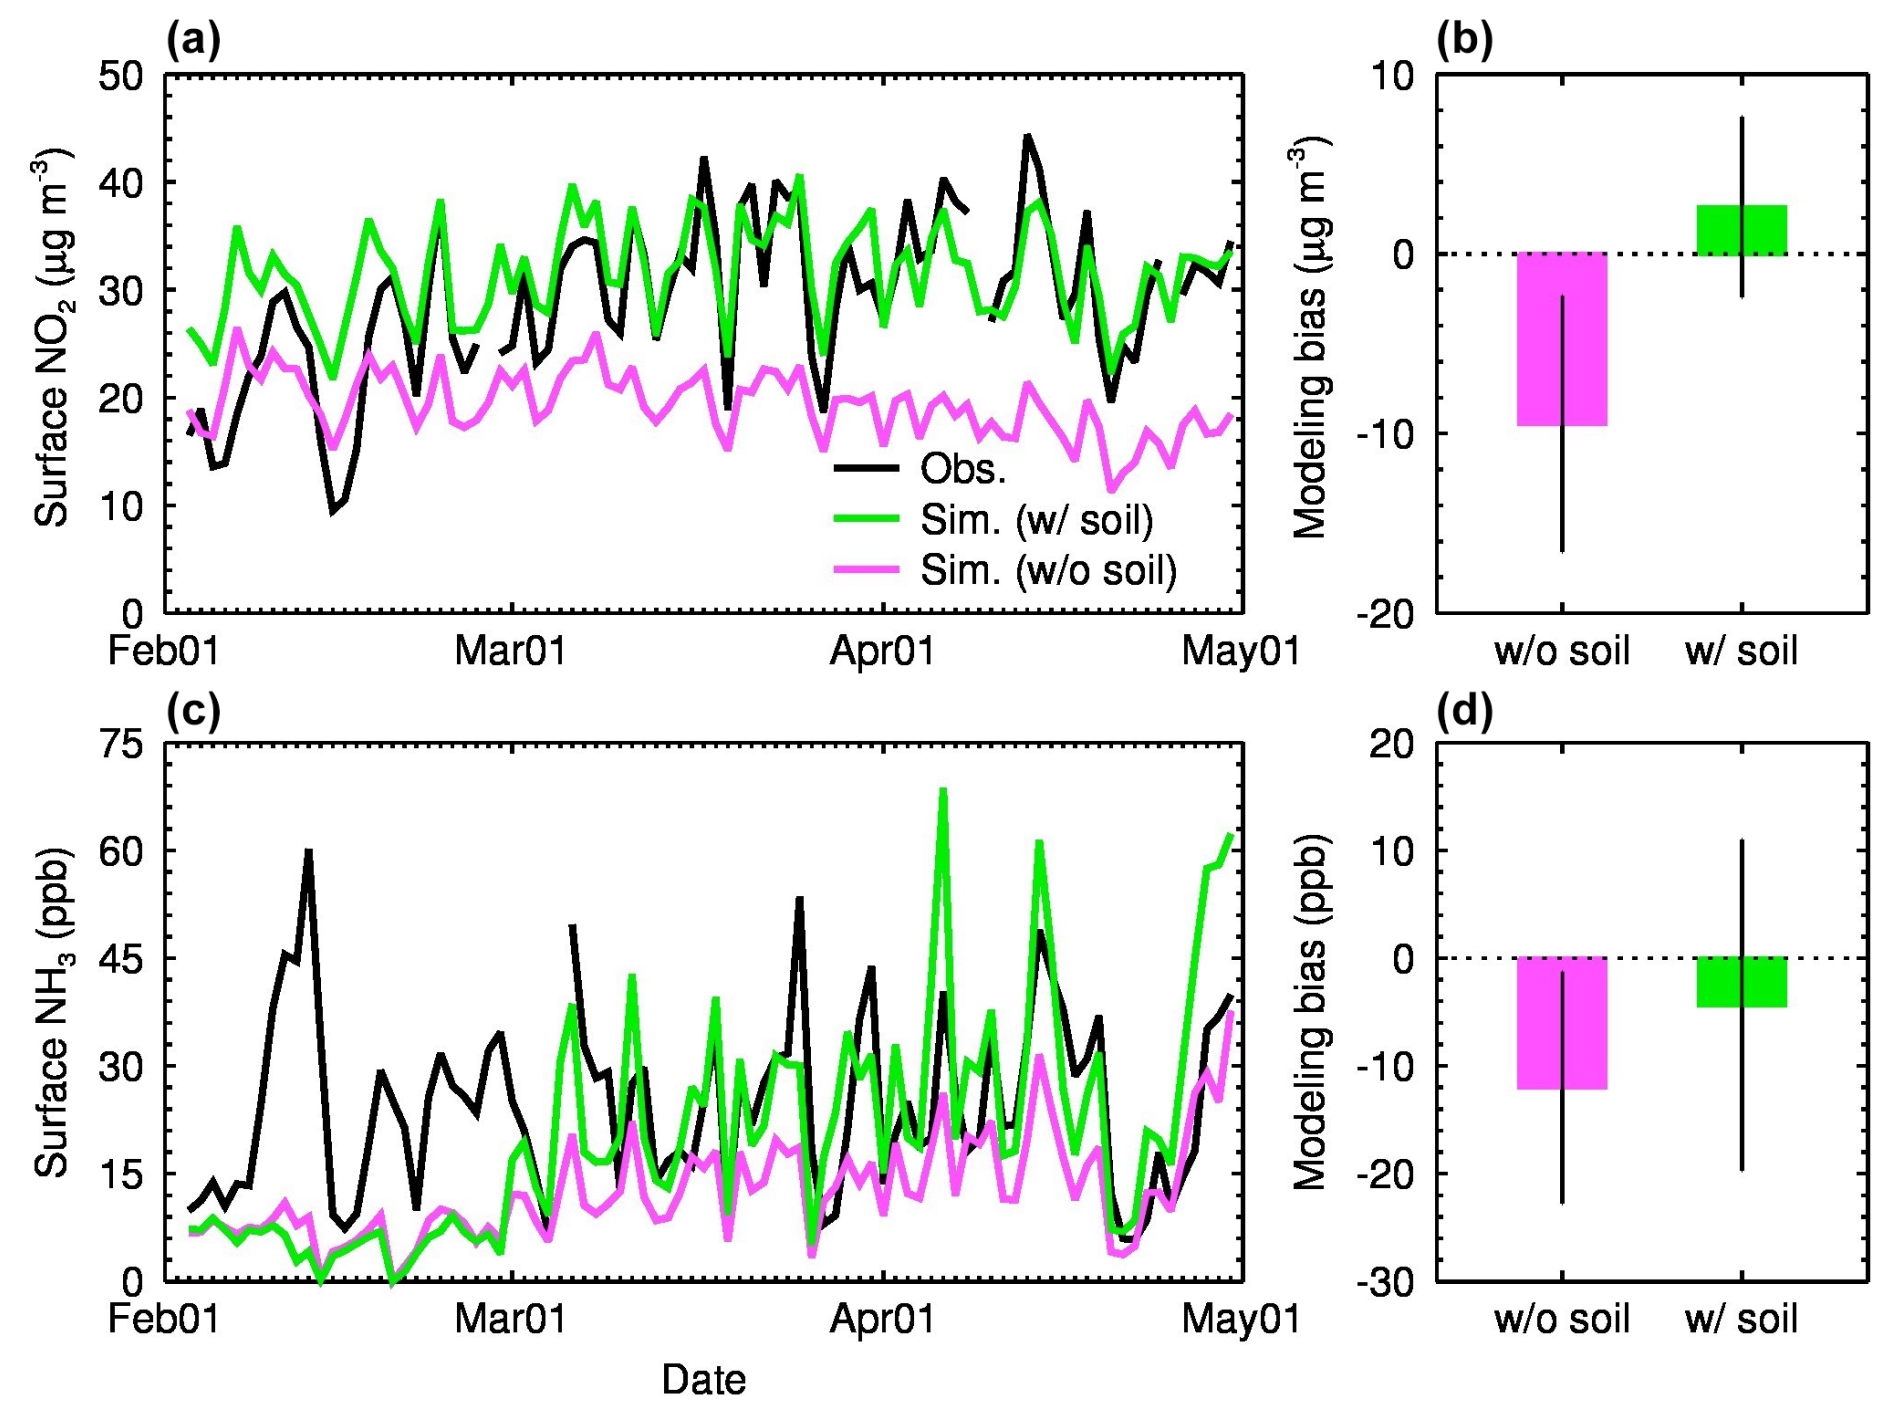
Figure 6Contribution of soil emissions from agricultural fertilization to surface NO2 and NH3 during February through April 2020 over the NCP. (a, b) Change in surface NO2 concentration with (green) and without (pink) soil NOx emissions from agricultural fertilization, and the black line in (a) represents the observed surface NO2 concentration. (c, d) Same as (a, b), but for NH3. The error bar in (b) and (d) denotes ± 1σ. NO2 observations are averaged over the 141 monitoring stations in the study area from the CNEMC network. NH3 observations are from the rural Xianghe station (Fig. 1). According to in situ measurements of NO2 and NH3, the units for NO2 and NH3 concentrations are µg m−3 and ppb, respectively.
Furthermore, we examine the ability of the model to simulate the ground-level NO2 mass concentration and NH3 volume concentration when soil NOx rapidly releases after fertilization. The reason is that the influences of soil emissions on atmospheric NO2 and NH3 concentrations are confined to the near-surface layers below 1 km, and the influences diminish rapidly as altitude increases (Fig. 5). This indicates that the impact of the soil emissions is primarily concentrated near the ground surface. With soil emissions included or not in the model, we compare the simulated NO2 and NH3 concentrations with near-surface observations (Fig. 6a and b). When there are no soil NOx emissions from agricultural fertilization, the simulated NO2 concentration is significantly lower than the observed concentration by 9.4 µg m−3 during February through April 2020. While considering these emissions, the mean bias (MB, Sect. S2) between the simulation and the observation decreases to 2.6 µg m−3, and the IOA also increases from 0.48 to 0.78. Similarly, the simulated NH3 concentration is in good agreement with the observed concentration when the soil NH3 emission related to agricultural fertilization is involved, e.g., the MB decreases from −12.0 to −4.4 ppb, and the IOA increases from 0.56 to 0.64 (Fig. 6c and d). It is important to acknowledge the limitation posed by the absence of direct comparisons with flux measurements of NOx emissions from soils, due to the unavailability of such data. The simulated NOx emission flux from the BDSNP scheme cannot be well examined, which may introduce uncertainties to the predicted emission rates and mixing ratios in the atmosphere.
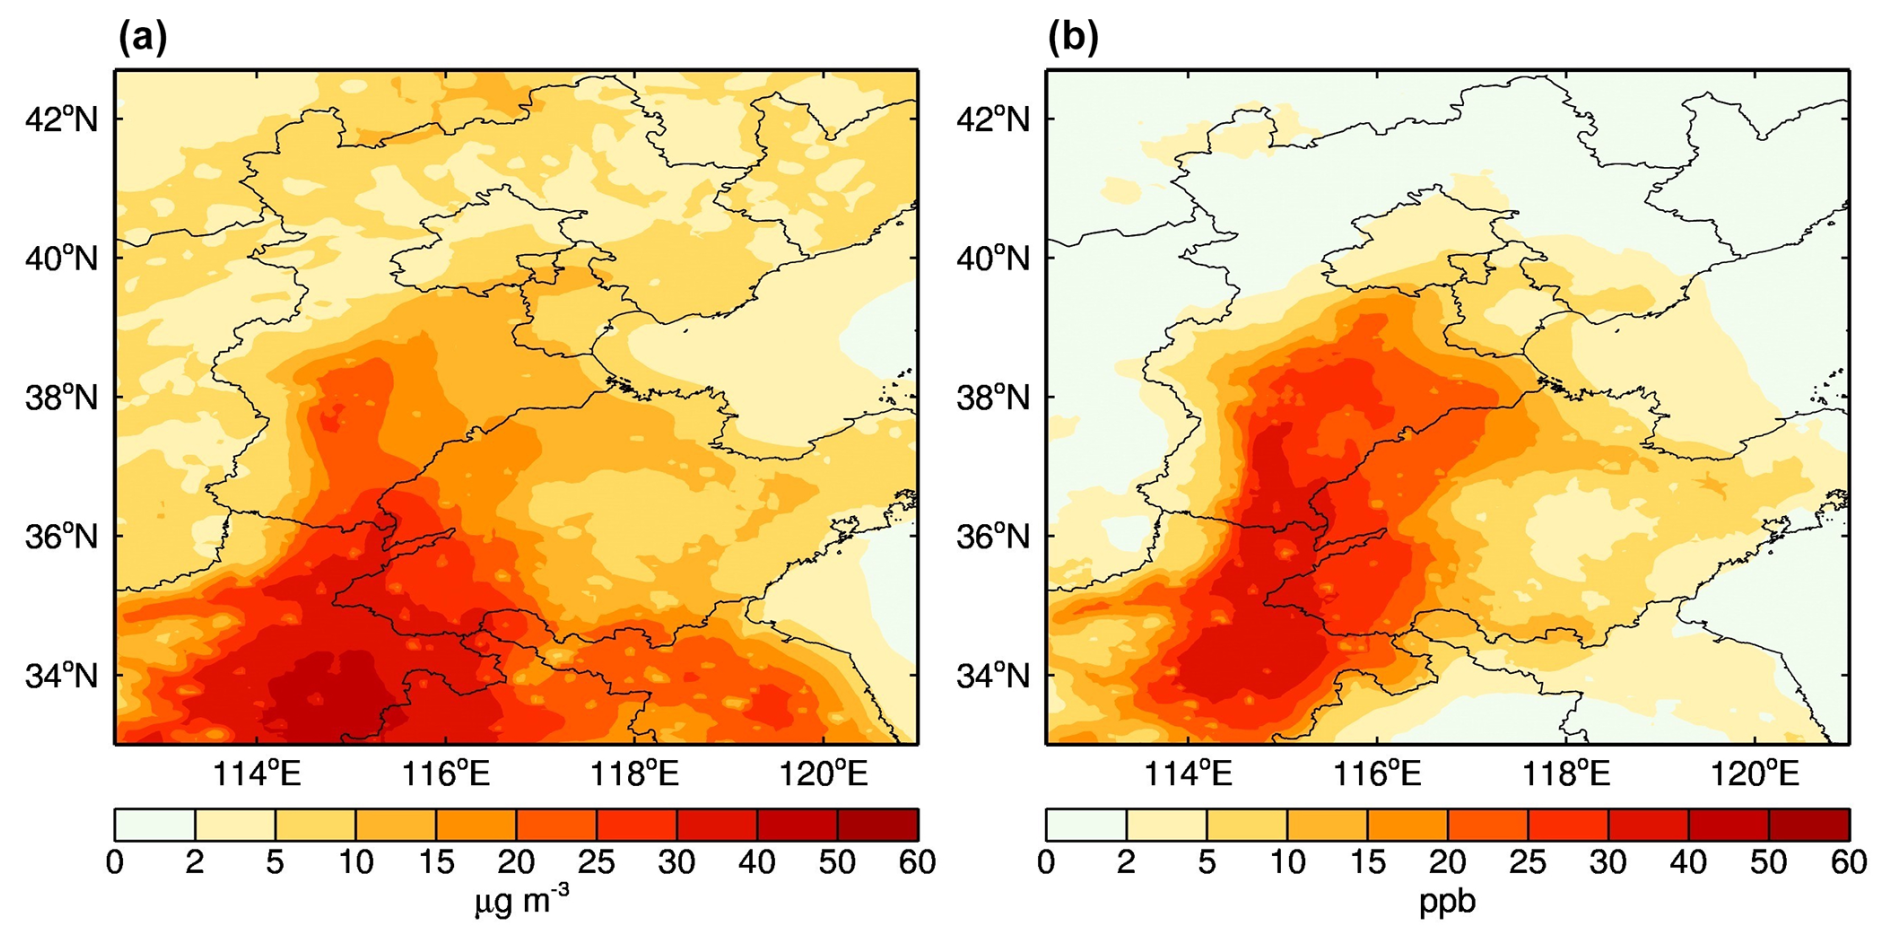
Figure 7Direct impacts of soil emissions from agricultural fertilization on (a) surface NO2 and (b) NH3 during March 2020 over the NCP. (a, b) Spatial distributions of changes in surface NO2 and NH3 concentrations due to fertilization-related soil emissions. According to in situ measurements of NO2 and NH3, the units for NO2 and NH3 concentrations are µg m−3 and ppb, respectively.
3.4 Significance of soil NOx emissions from agricultural fertilization for air quality
We perform a model experiment that excludes the soil sources of NOx and NH3 in the study domain to examine the impacts of soil emissions on regional air quality. The model results are compared to the benchmark scenario with soil sources involved to examine these impacts. Agricultural fertilization directly leads to substantial increases in atmospheric NOx and NH3 concentrations. According to the spatial correlation between land use and NO2 concentration, NO2 concentrations increase by more than 15 µg m−3 over agricultural areas, with the maximal increments occurring in the densely cultivated southern region of the NCP, exceeding 40 µg m−3 (Figs. 1b and 7a). While in urban areas, the increase in NO2 concentration is mostly below 10 µg m−3, significantly lower than that in agricultural areas. This indicates that the influence of local emissions originating from agricultural fertilization on air quality primarily concentrates in agricultural areas. Nonetheless, the influence extends to surrounding areas through atmospheric transport, leading to an inhomogeneous increase of NO2 concentrations across the NCP. The spatial distribution of the increased NH3 concentration is highly similar to that of the increased NO2 concentration, but some differences exist in the southeast of the NCP. It should be noted that NH3 emission in the model is from Huang et al. (2012), a separate monthly emission inventory. The emission rates of NH3 in the southeast of the NCP are lower than those of NO from the BDSNP scheme. This indicates nonnegligible discrepancies in the derived emissions between these two approaches, which deserve more in-depth studies.
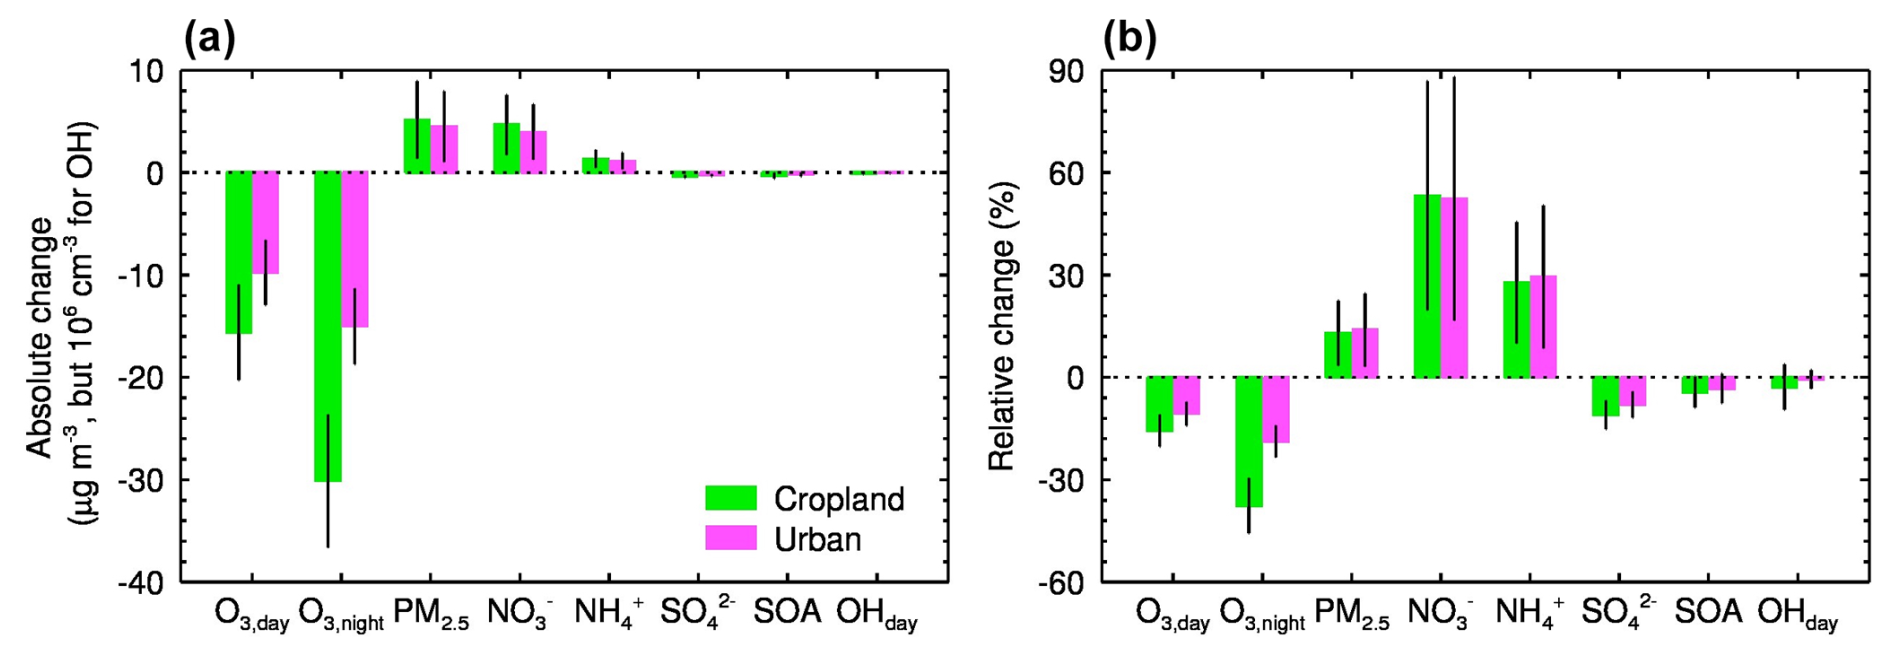
Figure 8Complex impacts of agricultural fertilization on O3, PM2.5, and OH during March 2020 over the NCP. (a) Changes in mass concentrations of O3, PM2.5, aerosol constituents, i.e., nitrate, ammonium, sulfate, and secondary organics, and OH radical due to soil NOx emission from agricultural fertilization in agricultural (green) and urban (pink) areas. The error bar denotes ± 1σ. (b) Same as (a), but for percentage changes.
A substantial amount of reactive nitrogen from agricultural fertilization suddenly enters the atmosphere and further affects air quality via photochemical reactions and aerosol chemical transformations profoundly (Seinfeld and Pandis, 2006; Wu et al., 2020). Our results reveal that the NOx emission induced by N fertilization significantly suppresses the early spring O3 production in the NCP, which varies remarkably with the land use, approximately twice as strong in agricultural areas as in urban areas. For instance, in agricultural areas, the emission in croplands reduces nocturnal and diurnal O3 by 30.1 ± 6.5 µg m−3 (37.5 ± 8.1 %) and 15.0 ± 3.7 µg m−3 (18.7 ± 4.6 %), respectively, while in urban areas, the corresponding O3 reductions are 15.6 ± 4.7 µg m−3 (15.6 ± 4.7 %) and 9.7 ± 3.2 µg m−3 (10.6 ± 3.4 %), respectively (Fig. 8). Based on the diurnal cycle of the change in O3 concentrations (Δ[O3]), we also find that the nighttime O3 reduction is much higher than the daytime reduction (Fig. 9). The Δ[O3] caused by agricultural fertilization is linearly and negatively correlated with the change in NO2 concentration (Δ[NO2]) (Fig. 10a–d), and the negative correlation is more pronounced at night (r < −0.99 and p < 0.001 for both the agricultural and the urban areas, Fig. 10a and b). This suggests that the O3 concentration strongly depends on the change in NOx levels in the NCP during early spring. Continuous agricultural NOx (mainly NO) emissions inhibit the O3 formation, which indicates that the NOx abundance is excessive for O3 formation over the NCP. Huang et al. (2023) similarly reported that variations in O3 concentrations were inversely related to the changes in soil NOx emissions in the NCP. Lu et al. (2021) also reported a NOx-saturated O3 formation regime in the NCP. On the other hand, a negative correlation between Δ[NO2] and the change in daytime OH radical (Δ[OH]day) suggests that the Δ[NO2] also moderately regulates Δ[OH]day (r = −0.50 for agricultural areas and r = −0.43 for urban areas, p < 0.001, Fig. 10e and f) through decreasing O3 levels and reactions of NO2 with OH radical. Both OH radical and O3 are critical oxidants in the atmosphere, and the decrease caused by the excessive NOx emission from agricultural fertilization weakens atmospheric oxidizing capacity (AOC) (Feng et al., 2021). The decreased AOC can further slow down the oxidation processes in homogeneous and heterogeneous reactions, which is unfavorable for the formation of secondary aerosols. We note that soil nitrous acid (HONO) emissions, which are not included in these modeling experiments, can also perturb atmospheric chemistry and the AOC (Feng et al., 2022; Tan et al., 2023) via the provision of NO and OH through photolysis. The emission rate of HONO from soil is much less than that of NOx in the NCP (Tan et al., 2023), which increases daytime O3 and OH concentrations slightly during summer (Feng et al., 2022; Tan et al., 2023). However, the influence in springtime still remains to be elucidated.
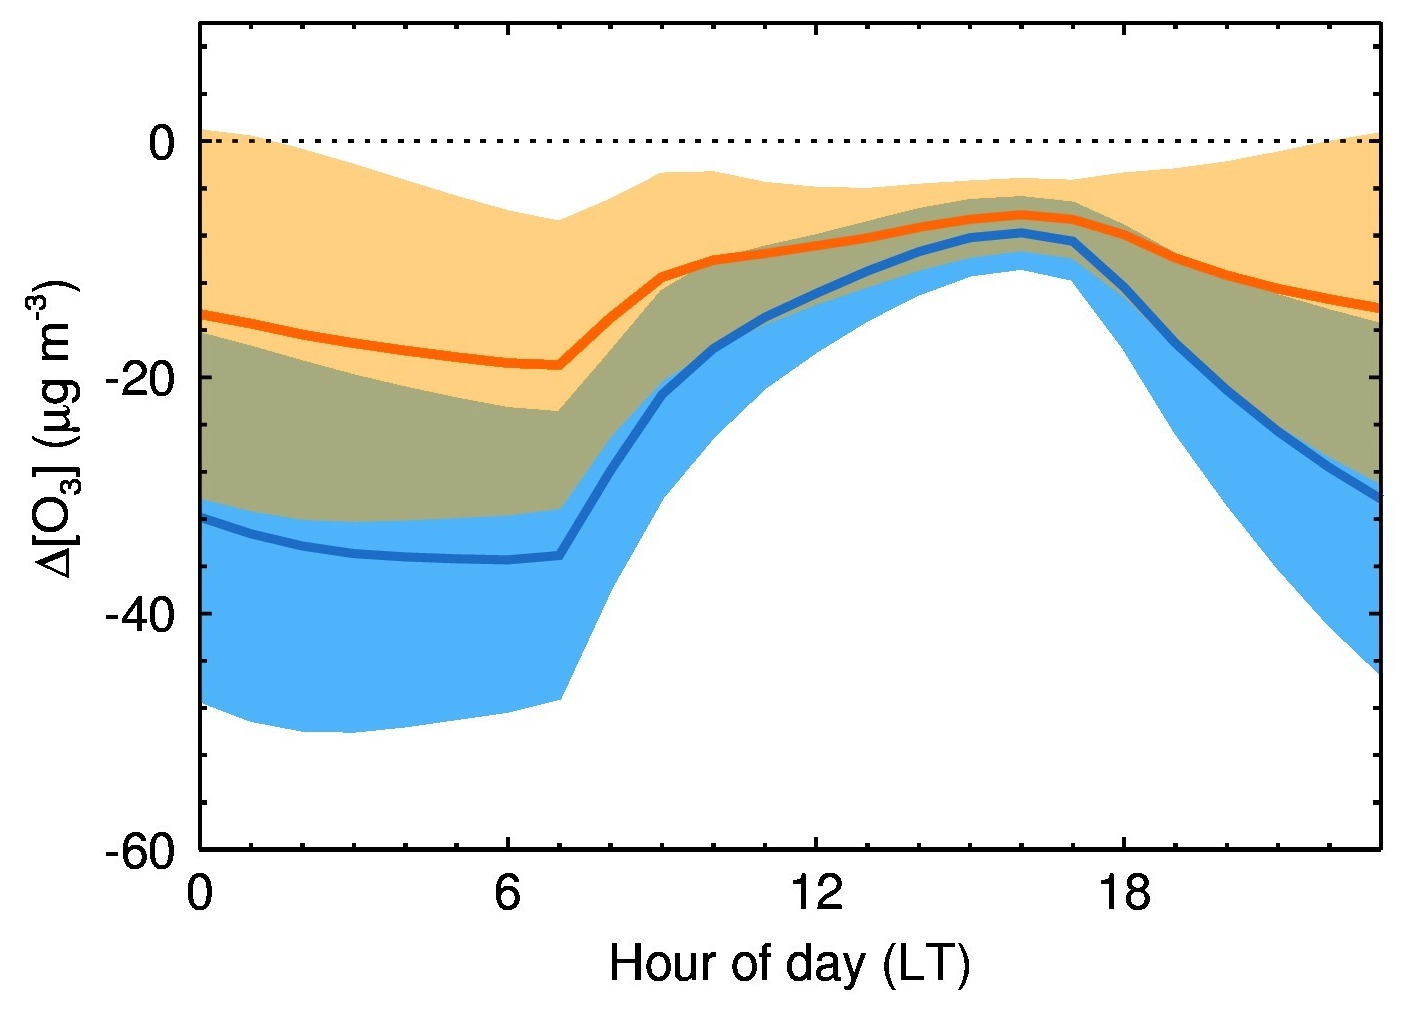
Figure 9Secondary impact of soil NOx emissions from agricultural fertilization on surface O3 during March 2020 over the NCP. Diurnal cycles of changes in surface O3 concentrations due to fertilization-related soil emissions over croplands (blue) and urban areas (orange) in the NCP. The blue and orange shadings show ± 1σ of the data.
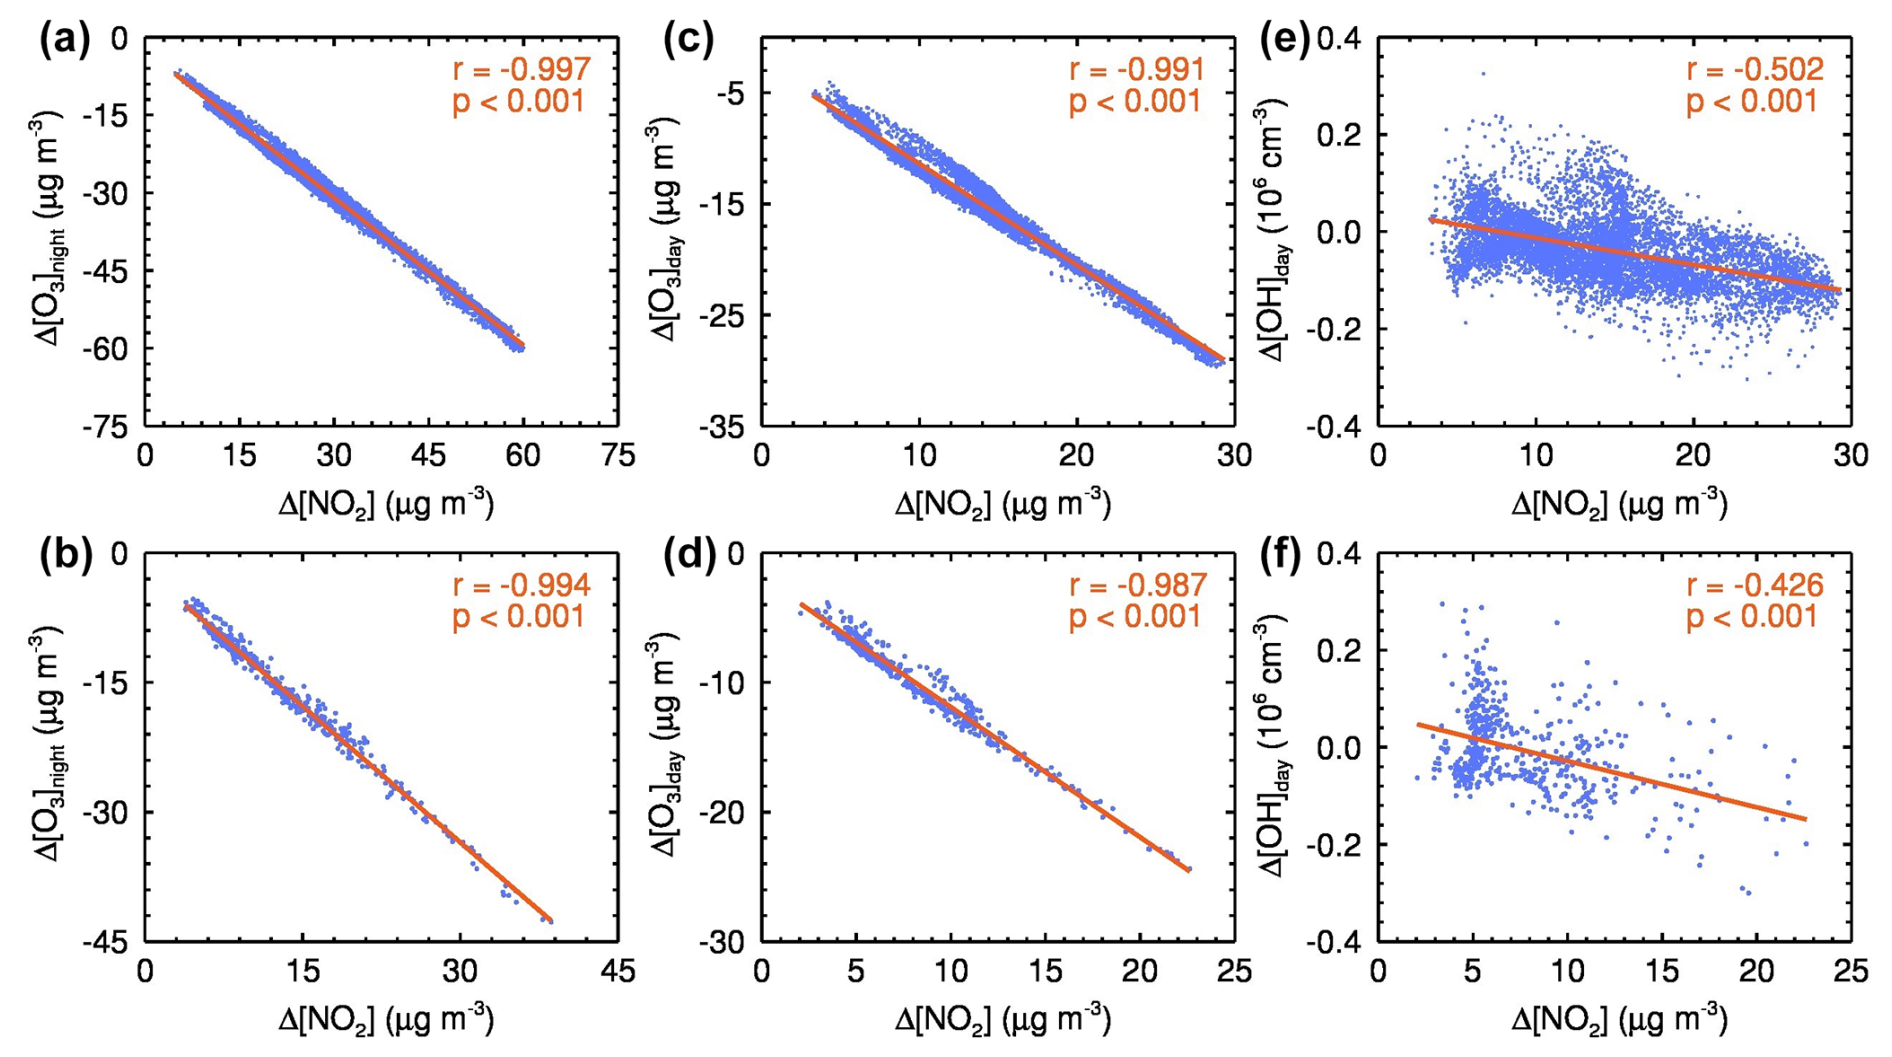
Figure 10Changes in surface NO2 and related photochemical products. (a–f) Correlation between Δ[NO2] and Δ[O3] or Δ[OH] during March 2020 over the NCP. (a–d) Change in O3 concentration is strongly dependent on the change in NO2 concentration due to agricultural fertilization in both agricultural (a, c) and urban (b, d) areas, and the dependence is more pronounced at night, i.e., correlation coefficient r = −0.997 (r = −0.994) at night and r = −0.991 (r = −0.987) during the day in agricultural (urban) areas. (e, f) Change in daytime OH radical is also significantly influenced by the change in NO2 concentration in both agricultural (e) and urban (f) areas.
Interestingly, these findings regarding the impacts of soil NOx emission on O3 formation in spring are different from previous studies that revealed that agricultural NOx emissions enhance the O3 formation in summer over the NCP (Tan et al., 2023; Wang et al., 2022a) and Northeast China (Shen et al., 2023) and in the Imperial Valley, California (Oikawa et al., 2015). Similar scenarios are also reported during the growing season of crops in sub-Saharan Africa (Hickman et al., 2017; Huang et al., 2018). This is largely attributed to the sensitivity of O3 to its precursors. During early spring, a large amount of agricultural NOx (mainly NO) emission causes a NO titration effect during daytime, decreasing O3 concentrations, when O3 chemistry is under the VOC-sensitive (NOx-saturated) or the transitional regimes (Fig. S6) (Sillman, 1995). In contrast, O3 formation chemistry in summer shifts from VOC-sensitive to NOx-sensitive (Sha et al., 2021; Wang et al., 2022a). In this scenario, O3 production is primarily controlled by NOx emissions, meaning that the O3 concentration increases with rising NOx levels. This seasonal difference in O3 sensitivity to its precursors highlights a seasonally dependent response of O3 production to agricultural fertilization.
We also quantify the impact of agricultural fertilization on PM2.5 concentrations. The NCP is characterized by an excess of NH3, in which nitrate formation is highly sensitive to NO2 concentration and AOC due to NO2 oxidation to via gas-phase and heterogeneous reactions (Feng et al., 2018; Fu et al., 2020; Liu et al., 2019; Wen et al., 2018). As atmospheric NO2 and NH3 concentrations rapidly increase due to emissions from fertilized croplands, nitrate aerosol in agricultural (urban) areas rises by 4.7 (4.0) µg m−3, corresponding to the increased percentage of 53.2 % (52.3 %), while ammonium aerosol rises by 1.3 (1.1) µg m−3 in agricultural (urban) areas, with an increased percentage of 27.7 % (29.4 %) (Fig. 8). However, sulfate aerosol shows a slight decrease in both agricultural and urban areas (Fig. 8a). The reason is that extra NOx emissions from agricultural fertilization enhance nitrate formation but lower AOC, which hinders sulfate formation. Similar to sulfate aerosol, secondary organic aerosol (SOA) also has a slight reduction (Fig. 8a). The formation of SOA greatly depends on the AOC level, so decreased AOC due to NOx emission from agricultural fertilization does not favor the conversion of organic precursors, such as VOCs and semi-volatile primary organic aerosols, into SOA.
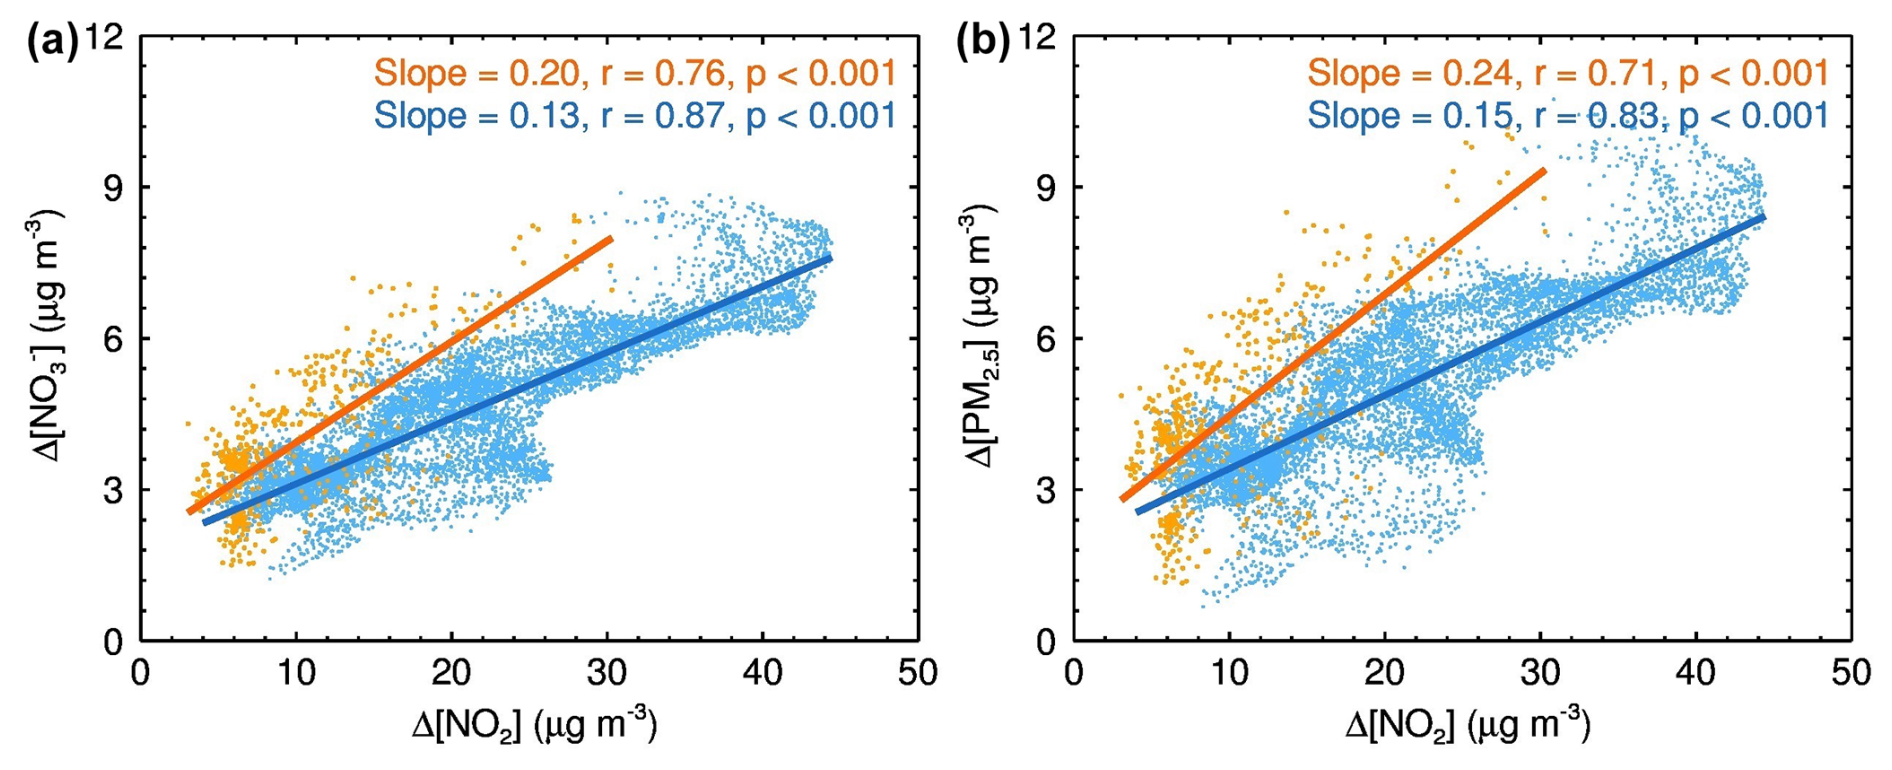
Figure 11Simulated changes in surface NO2 and related aerosol-chemistry products during March 2020 over the NCP. (a) Comparison of NO2 conversion to nitrate aerosol () formation between agricultural and urban areas, i.e., = 0.20 in urban areas and = 0.13 in agricultural areas, indicates that the change in nitrate in urban areas is more sensitive to the change in NO2 concentration and that NO2 conversion to is more efficient. (b) NO2 conversion to PM2.5 formation is similar to (a), because nitrate aerosol is the most affected among the various aerosol constituents. The blue and orange colors correspond to the agricultural and urban areas, respectively.
In general, due to the NOx emission from agricultural fertilization, PM2.5 concentration increases by 5.1 (4.5) µg m−3 (Fig. 8a), corresponding to a percentage change of 12.9 % (13.9 %) over agricultural (urban) areas in the NCP (Fig. 8b). There is no significant difference in PM2.5 increments between agricultural and urban areas. Nitrate aerosol is primarily responsible for the increased PM2.5, accounting for 92.2 % in agricultural areas and 88.9 % in urban areas. Our results also indicate that changes in PM2.5 and nitrate in urban areas are more sensitive to the change in NO2 concentration. For instance, the ratios of nitrate change to NO2 change ( = 0.20) and PM2.5 change to NO2 change ( = 0.24) in urban areas are both higher than those in agricultural areas ( = 0.13 and = 0.15, Fig. 11a and b), indicating that the conversion of NO2 to nitrate aerosol is more efficient in urban areas. Consequently, the increased percentages of PM2.5 and ammonium aerosol in urban areas are higher than those in agricultural areas (Fig. 8b). Additionally, the ongoing stringent control measures on emission sources significantly reduce anthropogenic emissions in urban areas. Thus, the impact of agricultural fertilization on urban air quality is becoming more pronounced (Fig. S7). Since soil NOx emission is sensitive to soil temperature, as global warming is ongoing, routine events like agricultural fertilization will continue to have amplified impact on air quality with the joint help of atmospheric dispersion/transport and chemical transformation processes (Bennetzen et al., 2016; Ma et al., 2022; Tubiello et al., 2013). These impacts are not confined to agricultural areas alone but extend to surrounding cities.
The impact of soil NOx emissions from agricultural fertilization on the atmospheric environment remains unclear worldwide (Guo et al., 2020; Huang et al., 2018; Sha et al., 2021; Shen et al., 2023). In particular, this issue has not yet received enough attention in China, where substantial N fertilizers are consumed year by year due to extensive agricultural cultivation areas (Sun et al., 2022; Vitousek et al., 2009; Zhao et al., 2006). Our results indicate that agricultural fertilization is highly responsible for the periodic pulse of the atmospheric NO2 column in the NCP over the past two decades. A two-decade record of fertilization events at a research station and model results both provide evidence consistent with a cause-and-effect relationship. For example, the fertilization timing is found to match well with the occurrence of satellite-derived NO2 column pulse in the region. Moreover, the model reasonably captures the regular sub-peak of the NO2 column in March by introducing an independent module that specifically describes soil NOx emissions from agricultural fertilization.
These additional NOx emissions released by croplands directly lead to an elevated level of surface NOx concentration. Consequently, the increased atmospheric NOx concentration significantly inhibits O3 production in early spring, distinct from the impacts in summer (Sha et al., 2021; Wang et al., 2022a), but enhances nitrate formation. For example, soil emissions linked to agricultural fertilization dramatically reduce nighttime O3 concentrations by 30.1 and 15.0 µg m−3 in croplands and urban areas, respectively. During daytime, the decreased O3 concentrations are 15.6 and 9.7 µg m−3, respectively. In contrast, soil emissions elevate ambient PM2.5 concentrations by more than 4.5 µg m−3, accounting for 12 % of the PM2.5 mass over the NCP in March 2020. The opposite effects are challenging for China to improve air quality, because China is the world's largest consumer of food, and food production strongly depends on N-fertilizer input. As the emission from fossil fuel combustion has been gradually decreasing, emissions from agricultural fertilization have increasing implications for air quality. We thus highlight that reducing NOx emissions from agricultural fertilization is of great importance to air quality improvement. In China, the excessive use of N fertilizer still remains severe (Sun et al., 2022; Vitousek et al., 2009; Zhao et al., 2006), though a lot of efforts have been taken to increase the N-fertilizer efficiency and to reduce N losses from fertilizer (Li et al., 2018; Qiao et al., 2022; Yan et al., 2008). Fortunately, the consumption of N fertilizer reached its peak in 2014 in China and has been decreasing since then (Yu et al., 2022). Policymakers should manage to further reduce emissions from N-fertilizer application; for example, improving N-fertilizer efficiency and developing alternative fertilizers friendly to the environment are highly necessary. These measures will greatly minimize the adverse effects of agricultural fertilization on air quality, human health, and the ecological environment. Nevertheless, one should be aware of the limitation in the present case study that there are only three months of simulation as the basis for all of the insights into the soil NOx emission and its influences on atmospheric chemistry and composition. More studies in terms of soil NOx emissions, particularly during springtime, are in need to validate and generalize our model results.
We should not ignore the uncertainties regarding the BDSNP scheme. The default split in fertilizer application may not be widely suitable for the globe. Using a split, as is commonly used in crop modeling (Jägermeyr et al., 2021), or a split, as has been reported to be common in Northeast China (Zheng et al., 2023), would be expected to result in differences in the magnitude and timing of emissions compared to the default scheme. Among other impacts, there is no canopy interception of emitted soil NOx at planting, which would result in substantially larger emissions to the atmosphere under the default split than in a split. In addition, because BDSNP applies the 25 % topdressing application evenly over the growing season following the 75 % basal application, it is less likely to produce sizable pulses of emissions. Because fertilizer applications are kept constant and global fertilizer emissions are constrained to 1.8 Tg N, the BDSNP mechanism is unable to reproduce historical trends or capture significant interannual variability in emissions.
The discrepancies between NO2 and NH3 column densities suggest substantial differences in the soil emission mechanisms of NOx and NH3, especially after fertilization. Future studies could incorporate a dynamic bidirectional NH3 scheme alongside the BDSNP scheme to further investigate the nature of fertilizer-induced emission pulses.
The OMI satellite data are from the NASA Goddard Space Flight Center, Goddard Earth Sciences Data and Information Services Center (GES DISC) (https://doi.org/10.5067/MEASURES/MINDS/DATA304), and the IASI satellite observations are from the IASI Portal (https://iasi.aeris-data.fr/nh3_iasi_a_arch, last access: 10 September 2025). The real-time hourly air pollutant measurements including NO2, O3, and PM2.5 are released by the Ministry of Ecology and Environment, China and can be accessed on the website https://pan.baidu.com/share/init?surl=gj9rHC6Qe67IGEwx_DRyIw?pwd=nrbe, last access: 10 September 2025. The MEIC Group and the EDGAR Team for the MEIC and HTAP emission inventories are available at http://meicmodel.org.cn/?page_id=560 (last access: 10 September 2025) and https://edgar.jrc.ec.europa.eu/dataset_htap_v3 (last access: 10 September 2025), respectively.
The supplement related to this article is available online at https://doi.org/10.5194/acp-25-11703-2025-supplement.
TF and GL conceptualized the ideas, verified the conclusions, and revised the paper. TF conducted research, designed the experiments, carried out the methodology, performed the simulation, processed the data, prepared the data visualization, and prepared the paper, with contributions from all authors. SZ and NB provided the treatment of meteorological data, analyzed the study data, validated the model performance, and reviewed the paper. XL, YP, YS, and RW provided the observation data and emission inventories and reviewed the paper. XT and LM provided critical reviews in the pre-publication stage.
The contact author has declared that none of the authors has any competing interests.
Publisher's note: Copernicus Publications remains neutral with regard to jurisdictional claims made in the text, published maps, institutional affiliations, or any other geographical representation in this paper. While Copernicus Publications makes every effort to include appropriate place names, the final responsibility lies with the authors.
We thank the two anonymous reviewers for their insightful comments, which have greatly improved the quality of this paper.
This research has been supported by the National Natural Science Foundation of China (grant nos. 42371080 and 42371093), the Natural Science Foundation of Shaanxi Province (grant no. 2017JM4023), the Natural Science Foundation of Ningbo Municipality (2023J208), the Science and Technology Innovation 2025 Major Project of Ningbo Municipality (grant nos. 2022Z139, 2023Z189, and 2022Z032), and the K. C. Wong Magna Fund in Ningbo University.
This paper was edited by Kostas Tsigaridis and reviewed by two anonymous referees.
Almaraz, M., Bai, E., Wang, C., Trousdell, J., Conley, S., Faloona, I., and Houlton, B. Z.: Agriculture is a major source of NOx pollution in California, Sci. Adv., 4, eaao3477, https://doi.org/10.1126/sciadv.aao3477, 2018.
Anderson, I. C. and Levine, J. S.: Simultaneous field measurements of biogenic emissions of nitric oxide and nitrous oxide, J. Geophys. Res., 92, 965–976, https://doi.org/10.1029/JD092iD01p00965, 1987.
Bauwens, M., Compernolle, S., Stavrakou, T., Müller, J. F., van Gent, J., Eskes, H., Levelt, P. F., van der A, R., Veefkind, J. P., Vlietinck, J., Yu, H., and Zehner, C.: Impact of Coronavirus Outbreak on NO2 Pollution Assessed Using TROPOMI and OMI Observations, Geophys. Res. Lett., 47, e87978, https://doi.org/10.1029/2020GL087978, 2020.
Bennetzen, E. H., Smith, P., and Porter, J. R.: Decoupling of greenhouse gas emissions from global agricultural production: 1970–2050, Glob. Change Biol., 22, 763–781, https://doi.org/10.1111/gcb.13120, 2016.
Bouwman, A. F., Boumans, L. J. M., and Batjes, N. H.: Modeling global annual N2O and NO emissions from fertilized fields, Global Biogeochem. Cy., 16, 28-1–28-9, https://doi.org/10.1029/2001GB001812, 2002.
Buchholz, R. R., Emmons, L. K., Tilmes, S., and The CESM Development Team: CESM2.1/CAM-chem Instantaneous Output for Boundary Conditions, UCARNCAR – Atmospheric Chemistry Observations and Modeling Laboratory, https://doi.org/10.5065/NMP7-EP60, 2019.
Cárdenas, L., Rondón, A., Johansson, C., and Sanhueza, E.: Effects of soil moisture, temperature, and inorganic nitrogen on nitric oxide emissions from acidic tropical savannah soils, J. Geophys. Res., 98, 14783–14790, https://doi.org/10.1029/93JD01020, 1993.
Chen, F. and Dudhia, J.: Coupling an advanced land surface-hydrology model with the Penn State-NCAR MM5 modeling system. Part II: Preliminary model validation, Mon. Weather Rev., 129, 569–585, https://doi.org/10.1175/1520-0493(2001)129<0569:caalsh>2.0.co;2, 2001.
Chou, M.-D. and Suarez, M. J.: A solar radiation parameterization for atmospheric studies, edited by: Suarez, M. J., Goddard Space Flight Center, Greenbelt, NASA/TM-1999-10460, 15, 1–51, 1999.
Chou, M.-D., Suarez, M. J., Liang, X.-Z., and Yan, M. M. H.: A thermal infrared radiation parameterization for atmospheric studies, edited by: Suarez, M. J., Goddard Space Flight Center, Greenbelt, NASA/TM-2001-104606, 19, 1–68, 2001.
Clarisse, L., Franco, B., Van Damme, M., Di Gioacchino, T., Hadji-Lazaro, J., Whitburn, S., Noppen, L., Hurtmans, D., Clerbaux, C., and Coheur, P.: The IASI NH3 version 4 product: averaging kernels and improved consistency, Atmos. Meas. Tech., 16, 5009–5028, https://doi.org/10.5194/amt-16-5009-2023, 2023.
Crippa, M., Guizzardi, D., Butler, T., Keating, T., Wu, R., Kaminski, J., Kuenen, J., Kurokawa, J., Chatani, S., Morikawa, T., Pouliot, G., Racine, J., Moran, M. D., Klimont, Z., Manseau, P. M., Mashayekhi, R., Henderson, B. H., Smith, S. J., Suchyta, H., Muntean, M., Solazzo, E., Banja, M., Schaaf, E., Pagani, F., Woo, J.-H., Kim, J., Monforti-Ferrario, F., Pisoni, E., Zhang, J., Niemi, D., Sassi, M., Ansari, T., and Foley, K.: The HTAP_v3 emission mosaic: merging regional and global monthly emissions (2000–2018) to support air quality modelling and policies, Earth Syst. Sci. Data, 15, 2667–2694, https://doi.org/10.5194/essd-15-2667-2023, 2023.
Davidson, E. A.: Sources of nitric oxide and nitrous oxide following wetting of dry soil, Soil Sci. Soc. Am. J., 56, 95–102, https://doi.org/10.2136/sssaj1992.03615995005600010015x, 1992.
Davidson, E. A., Potter, C. S., Schlesinger, P., and Klooster, S. A.: Model estimates of regional nitric oxide emissions from soils of the southeastern United States, Ecol. Appl., 8, 748–759, https://doi.org/10.1890/1051-0761(1998)008[0748:MEORNO]2.0.CO;2, 1998.
Emmons, L. K., Schwantes, R. H., Orlando, J. J., Tyndall, G., Kinnison, D., Lamarque, J.-F., Marsh, D., Mills, M. J., Tilmes, S., Bardeen, C., Buchholz, R. R., Conley, A., Gettelman, A., Garcia, R., Simpson, I., Blake, D. R., Meinardi, S., and Pétron, G.: The Chemistry Mechanism in the Community Earth System Model Version 2 (CESM2), J. Adv. Model. Earth Sy., 12, e2019MS001882, https://doi.org/10.1029/2019MS001882, 2020.
Feng, T., Bei, N., Zhao, S., Wu, J., Li, X., Zhang, T., Cao, J., Zhou, W., and Li, G.: Wintertime nitrate formation during haze days in the Guanzhong basin, China: A case study, Environ. Pollut., 243, 1057–1067, https://doi.org/10.1016/j.envpol.2018.09.069, 2018.
Feng, T., Zhao, S., Hu, B., Bei, N., Zhang, X., Wu, J., Li, X., Liu, L., Wang, R., Tie, X., and Li, G.: Assessment of Atmospheric Oxidizing Capacity Over the Beijing-Tianjin-Hebei (BTH) Area, China, J. Geophys. Res.-Atmos., 126, e2020JD033834, https://doi.org/10.1029/2020JD033834, 2021.
Feng, T., Zhao, S., Liu, L., Long, X., Gao, C., and Wu, N.: Nitrous acid emission from soil bacteria and related environmental effect over the North China Plain, Chemosphere, 287, 132034, https://doi.org/10.1016/j.chemosphere.2021.132034, 2022.
Fu, X., Wang, T., Gao, J., Wang, P., Liu, Y., Wang, S., Zhao, B., and Xue, L.: Persistent Heavy Winter Nitrate Pollution Driven by Increased Photochemical Oxidants in Northern China, Environ. Sci. Technol., 54, 3881–3889, https://doi.org/10.1021/acs.est.9b07248, 2020.
Galbally, I. E. and Roy, C. R.: Loss of fixed nitrogen from soils by nitric oxide exhalation, Nature, 275, 734–735, https://doi.org/10.1038/275734a0, 1978.
Gong, C., Wang, Y., Tian, H., Kou-Giesbrecht, S., Vuichard, N., and Zaehle, S.: Uncertainties in fertilizer-induced emissions of soil nitrogen oxide and the associated impacts on ground-level ozone and methane, EGUsphere [preprint], https://doi.org/10.5194/egusphere-2025-1416, 2025.
Guenther, A., Karl, T., Harley, P., Wiedinmyer, C., Palmer, P. I., and Geron, C.: Estimates of global terrestrial isoprene emissions using MEGAN (Model of Emissions of Gases and Aerosols from Nature), Atmos. Chem. Phys., 6, 3181–3210, https://doi.org/10.5194/acp-6-3181-2006, 2006.
Guo, L., Chen, J., Luo, D., Liu, S., Lee, H. J., Motallebi, N., Fong, A., Deng, J., Rasool, Q. Z., Avise, J. C., Kuwayama, T., Croes, B. E., and FitzGibbon, M.: Assessment of Nitrogen Oxide Emissions and San Joaquin Valley PM2.5 Impacts From Soils in California, J. Geophys. Res.-Atmos., 125, e2020JD033304, https://doi.org/10.1029/2020JD033304, 2020.
Hall, S. J., Matson, P. A., and Roth, P. M.: NOx EMISSIONS FROM SOIL: Implications for Air Quality Modeling in Agricultural Regions, Annu. Rev. Energ. Env., 21, 311–346, https://doi.org/10.1146/annurev.energy.21.1.311, 1996.
Hickman, J. E., Huang, Y., Wu, S., Diru, W., Groffman, P. M., Tully, K. L., and Palm, C. A.: Nonlinear response of nitric oxide fluxes to fertilizer inputs and the impacts of agricultural intensification on tropospheric ozone pollution in Kenya, Glob. Change Biol., 23, 3193–3204, https://doi.org/10.1111/gcb.13644, 2017.
Hong, S. Y. and Lim, J.: The WRF single-moment 6-class microphysics scheme (WSM6), Asia-Pac. J. Atmos. Sci., 42, 129–151, 2006.
Huang, L., Fang, J., Liao, J., Yarwood, G., Chen, H., Wang, Y., and Li, L.: Insights into soil NO emissions and the contribution to surface ozone formation in China, Atmos. Chem. Phys., 23, 14919–14932, https://doi.org/10.5194/acp-23-14919-2023, 2023.
Huang, X., Song, Y., Li, M., Li, J., Huo, Q., Cai, X., Zhu, T., Hu, M., and Zhang, H.: A high-resolution ammonia emission inventory in China, Global Biogeochem. Cy., 26, GB1030, https://doi.org/10.1029/2011GB004161, 2012.
Huang, Y., Hickman, J. E., and Wu, S.: Impacts of enhanced fertilizer applications on tropospheric ozone and crop damage over sub-Saharan Africa, Atmos. Environ., 180, 117–125, https://doi.org/10.1016/j.atmosenv.2018.02.040, 2018.
Huber, D. E., Steiner, A. L., and Kort, E. A.: Daily Cropland Soil NOx Emissions Identified by TROPOMI and SMAP, Geophys. Res. Lett., 47, e89949, https://doi.org/10.1029/2020GL089949, 2020.
Hudman, R. C., Moore, N. E., Mebust, A. K., Martin, R. V., Russell, A. R., Valin, L. C., and Cohen, R. C.: Steps towards a mechanistic model of global soil nitric oxide emissions: implementation and space based-constraints, Atmos. Chem. Phys., 12, 7779–7795, https://doi.org/10.5194/acp-12-7779-2012, 2012.
IPCC: Short-lived Climate Forcers, in: Climate Change 2021 – The Physical Science Basis: Working Group I Contribution to the Sixth Assessment Report of the Intergovernmental Panel on Climate Change, Cambridge University Press, Cambridge, pp. 817–922, 2023.
Janjić, Z. I.: Nonsingular implementation of the Mellor–Yamada level 2.5 scheme in the NCEP Meso model, National Centers for Environmental Prediction, Prince George's County, Office Note #437, 1-61, 2002.
Janssens-Maenhout, G., Crippa, M., Guizzardi, D., Dentener, F., Muntean, M., Pouliot, G., Keating, T., Zhang, Q., Kurokawa, J., Wankmüller, R., Denier van der Gon, H., Kuenen, J. J. P., Klimont, Z., Frost, G., Darras, S., Koffi, B., and Li, M.: HTAP_v2.2: a mosaic of regional and global emission grid maps for 2008 and 2010 to study hemispheric transport of air pollution, Atmos. Chem. Phys., 15, 11411–11432, https://doi.org/10.5194/acp-15-11411-2015, 2015.
Jägermeyr, J., Müller, C., Ruane, A. C., Elliott, J., Balkovic, J., Castillo, O., Faye, B., Foster, I., Folberth, C., Franke, J. A., Fuchs, K., Guarin, J. R., Heinke, J., Hoogenboom, G., Iizumi, T., Jain, A. K., Kelly, D., Khabarov, N., Lange, S., Lin, T.-S., Liu, W., Mialyk, O., Minoli, S., Moyer, E. J., Okada, M., Phillips, M., Porter, C., Rabin, S. S., Scheer, C., Schneider, J. M., Schyns, J. F., Skalsky, R., Smerald, A., Stella, T., Stephens, H., Webber, H., Zabel, F., and Rosenzweig, C.: Climate impacts on global agriculture emerge earlier in new generation of climate and crop models, Nature Food, 2, 873–885, 2021.
Kurokawa, J. and Ohara, T.: Long-term historical trends in air pollutant emissions in Asia: Regional Emission inventory in ASia (REAS) version 3, Atmos. Chem. Phys., 20, 12761–12793, https://doi.org/10.5194/acp-20-12761-2020, 2020.
Lamsal, L. N., Krotkov, N. A., Vasilkov, A., Marchenko, S., Qin, W., Yang, E.-S., Fasnacht, Z., Joiner, J., Choi, S., Haffner, D., Swartz, W. H., Fisher, B., and Bucsela, E.: Ozone Monitoring Instrument (OMI) Aura nitrogen dioxide standard product version 4.0 with improved surface and cloud treatments, Atmos. Meas. Tech., 14, 455–479, https://doi.org/10.5194/amt-14-455-2021, 2021.
Lamsal, L. N., Krotkov, N. A., Marchenko, S. V., Joiner, J., Oman, L., Vasilkov, A., Fisher, B., Qin, W., Yang, E.-S., Fasnacht, Z., Choi, S., Leonard, P., and Haffner, D.: OMI/Aura NO2 Tropospheric, Stratospheric & Total Columns MINDS Daily L3 Global Gridded 0.25 degree x 0.25 degree, NASA Goddard Space Flight Center, Goddard Earth Sciences Data and Information Services Center (GES DISC) [data set], https://doi.org/10.5067/MEASURES/MINDS/DATA304, 2022.
Laville, P., Lehuger, S., Loubet, B., Chaumartin, F., and Cellier, P.: Effect of management, climate and soil conditions on N20 and NO emissions from an arable crop rotation using high temporal resolution measurements, Agr. Forest Meteorol., 151, 228–240, https://doi.org/10.1016/j.agrformet.2010.10.008, 2011.
Li, G., Lei, W., Zavala, M., Volkamer, R., Dusanter, S., Stevens, P., and Molina, L. T.: Impacts of HONO sources on the photochemistry in Mexico City during the MCMA-2006/MILAGO Campaign, Atmos. Chem. Phys., 10, 6551–6567, https://doi.org/10.5194/acp-10-6551-2010, 2010.
Li, G., Bei, N., Tie, X., and Molina, L. T.: Aerosol effects on the photochemistry in Mexico City during MCMA-2006/MILAGRO campaign, Atmos. Chem. Phys., 11, 5169–5182, https://doi.org/10.5194/acp-11-5169-2011, 2011a.
Li, G., Zavala, M., Lei, W., Tsimpidi, A. P., Karydis, V. A., Pandis, S. N., Canagaratna, M. R., and Molina, L. T.: Simulations of organic aerosol concentrations in Mexico City using the WRF-CHEM model during the MCMA-2006/MILAGRO campaign, Atmos. Chem. Phys., 11, 3789–3809, https://doi.org/10.5194/acp-11-3789-2011, 2011b.
Li, G., Lei, W., Bei, N., and Molina, L. T.: Contribution of garbage burning to chloride and PM2.5 in Mexico City, Atmos. Chem. Phys., 12, 8751–8761, https://doi.org/10.5194/acp-12-8751-2012, 2012.
Li, M., Liu, H., Geng, G., Hong, C., Liu, F., Song, Y., Tong, D., Zheng, B., Cui, H., Man, H., Zhang, Q., and He, K.: Anthropogenic emission inventories in China: A review, Natl. Sci. Rev., 4, 834–866, https://doi.org/10.1093/nsr/nwx150, 2017a.
Li, M., Zhang, Q., Kurokawa, J.-I., Woo, J.-H., He, K., Lu, Z., Ohara, T., Song, Y., Streets, D. G., Carmichael, G. R., Cheng, Y., Hong, C., Huo, H., Jiang, X., Kang, S., Liu, F., Su, H., and Zheng, B.: MIX: a mosaic Asian anthropogenic emission inventory under the international collaboration framework of the MICS-Asia and HTAP, Atmos. Chem. Phys., 17, 935–963, https://doi.org/10.5194/acp-17-935-2017, 2017b.
Li, T., Zhang, W., Yin, J., Chadwick, D., Norse, D., Lu, Y., Liu, X., Chen, X., Zhang, F., Powlson, D., and Dou, Z.: Enhanced-efficiency fertilizers are not a panacea for resolving the nitrogen problem, Glob. Change Biol., 24, e511–e521, https://doi.org/10.1111/gcb.13918, 2018.
Liu, C., Zheng, X., Zhou, Z., Han, S., Wang, Y., Wang, K., Liang, W., Li, M., Chen, D., and Yang, Z.: Nitrous oxide and nitric oxide emissions from an irrigated cotton field in Northern China, Plant Soil, 332, 123–134, https://doi.org/10.1007/s11104-009-0278-5, 2010.
Liu, L., Wu, J., Liu, S., Li, X., Zhou, J., Feng, T., Qian, Y., Cao, J., Tie, X., and Li, G.: Effects of organic coating on the nitrate formation by suppressing the N2O5 heterogeneous hydrolysis: a case study during wintertime in Beijing–Tianjin–Hebei (BTH), Atmos. Chem. Phys., 19, 8189–8207, https://doi.org/10.5194/acp-19-8189-2019, 2019.
Liu, X., Ju, X., Zhang, F., Pan, J., and Christie, P.: Nitrogen dynamics and budgets in a winter wheat–maize cropping system in the North China Plain, Field Crop. Res., 83, 111–124, https://doi.org/10.1016/S0378-4290(03)00068-6, 2003.
Liu, X., Zhang, Y., Han, W., Tang, A., Shen, J., Cui, Z., Vitousek, P., Erisman, J. W., Goulding, K., Christie, P., Fangmeier, A., and Zhang, F.: Enhanced nitrogen deposition over China, Nature, 494, 459–462, https://doi.org/10.1038/nature11917, 2013.
Liu, X. J., Mosier, A. R., Halvorson, A. D., and Zhang, F. S.: Tillage and Nitrogen Application Effects on Nitrous and Nitric Oxide Emissions from Irrigated Corn Fields, Plant Soil, 276, 235–249, https://doi.org/10.1007/s11104-005-4894-4, 2005.
Lu, X., Ye, X., Zhou, M., Zhao, Y., Weng, H., Kong, H., Li, K., Gao, M., Zheng, B., Lin, J., Zhou, F., Zhang, Q., Wu, D., Zhang, L., and Zhang, Y.: The underappreciated role of agricultural soil nitrogen oxide emissions in ozone pollution regulation in North China, Nat. Commun., 12, 5021–9, https://doi.org/10.1038/s41467-021-25147-9, 2021.
Ma, R., Yu, K., Xiao, S., Liu, S., Ciais, P., and Zou, J.: Data-driven estimates of fertilizer-induced soil NH3, NO and N2O emissions from croplands in China and their climate change impacts, Glob. Change Biol., 28, 1008–1022, https://doi.org/10.1111/gcb.15975, 2022.
Matson, P. A., Naylor, R., and Ortiz-Monasterio, I.: Integration of Environmental, Agronomic, and Economic Aspects of Fertilizer Management, Science, 280, 112–115, https://doi.org/10.1126/science.280.5360.112, 1998.
Murray, L. T., Jacob, D. J., Logan, J. A., Hudman, R. C., and Koshak, W. J.: Optimized regional and interannual variability of lightning in a global chemical transport model constrained by LIS/OTD satellite data, J. Geophys. Res.-Atmos., 117, D20307, https://doi.org/10.1029/2012JD017934, 2012.
Oikawa, P. Y., Ge, C., Wang, J., Eberwein, J. R., Liang, L. L., Allsman, L. A., Grantz, D. A., and Jenerette, G. D.: Unusually high soil nitrogen oxide emissions influence air quality in a high-temperature agricultural region, Nat. Commun., 6, 8753, https://doi.org/10.1038/ncomms9753, 2015.
Potter, P., Ramankutty, N., Bennett, E. M., and Donner, S. D.: Characterizing the Spatial Patterns of Global Fertilizer Application and Manure Production, Earth Interact., 14, 1–22, https://doi.org/10.1175/2009EI288.1, 2010.
Qiao, J., Wang, J., Zhao, D., Zhou, W., Schwenke, G., Yan, T., and Liu, D. L.: Optimizing N fertilizer rates sustained rice yields, improved N use efficiency, and decreased N losses via runoff from rice-wheat cropping systems, Agriculture, Ecosystems & Environment, 324, 107724, https://doi.org/10.1016/j.agee.2021.107724, 2022.
Seinfeld, J. H. and Pandis, S. N.: Atmospheric Chemistry and Physics – From Air Pollution to Climate Change, 2nd edn., John Wiley & Sons, New Jersey, ISBN 13 978-0-471-72018-8, 2006.
Sha, T., Ma, X., Zhang, H., Janechek, N., Wang, Y., Wang, Y., Castro García, L., Jenerette, G. D., and Wang, J.: Impacts of Soil NOx Emission on O3 Air Quality in Rural California, Environ. Sci. Technol., 55, 7113–7122, https://doi.org/10.1021/acs.est.0c06834, 2021.
Shen, Y., Xiao, Z., Wang, Y., Xiao, W., Yao, L., and Zhou, C.: Impacts of Agricultural Soil NOx Emissions on O3 Over Mainland China, J. Geophys. Res.-Atmos., 128, e2022JD037986, https://doi.org/10.1029/2022JD037986, 2023.
Sillman, S.: The use of NOy , H2O2, and HNO3 as indicators for ozone-NOx-hydrocarbon sensitivity in urban locations, J. Geophys. Res.-Atmos., 100, 14175–14188, https://doi.org/10.1029/94JD02953, 1995.
Stehfest, E. and Bouwman, L.: N2O and NO emission from agricultural fields and soils under natural vegetation: summarizing available measurement data and modeling of global annual emissions, Nutrient Cycling in Agroecosystems, 74, 207–228, https://doi.org/10.1007/s10705-006-9000-7, 2006.
Steinkamp, J. and Lawrence, M. G.: Improvement and evaluation of simulated global biogenic soil NO emissions in an AC-GCM, Atmos. Chem. Phys., 11, 6063–6082, https://doi.org/10.5194/acp-11-6063-2011, 2011.
Sun, X., Ritzema, H., Huang, X., Bai, X., and Hellegers, P.: Assessment of farmers' water and fertilizer practices and perceptions in the North China Plain, Irrig. Drain., 71, 980–996, https://doi.org/10.1002/ird.2719, 2022.
Tan, W., Wang, H., Su, J., Sun, R., He, C., Lu, X., Lin, J., Xue, C., Wang, H., Liu, Y., Liu, L., Zhang, L., Wu, D., Mu, Y., and Fan, S.: Soil Emissions of Reactive Nitrogen Accelerate Summertime Surface Ozone Increases in the North China Plain, Environ. Sci. Technol., 57, 12782–12793, https://doi.org/10.1021/acs.est.3c01823, 2023.
Tang, K., Qin, M., Fang, W., Duan, J., Meng, F., Ye, K., Zhang, H., Xie, P., Liu, J., Liu, W., Feng, Y., Huang, Y., and Ni, T.: An automated dynamic chamber system for exchange flux measurement of reactive nitrogen oxides (HONO and NOx) in farmland ecosystems of the Huaihe River Basin, China, Sci. Total Environ., 745, 140867, https://doi.org/10.1016/j.scitotenv.2020.140867, 2020.
Tian, D., Zhang, Y., Mu, Y., Liu, J., and He, K.: Effect of N fertilizer types on N2O and NO emissions under drip fertigation from an agricultural field in the North China Plain, Sci. Total Environ., 715, 136903, https://doi.org/10.1016/j.scitotenv.2020.136903, 2020.
Tubiello, F. N., Salvatore, M., Rossi, S., Ferrara, A., Fitton, N., and Smith, P.: The FAOSTAT database of greenhouse gas emissions from agriculture, Environ. Res. Lett., 8, 015009, https://doi.org/10.1088/1748-9326/8/1/015009, 2013.
Vinken, G. C. M., Boersma, K. F., Maasakkers, J. D., Adon, M., and Martin, R. V.: Worldwide biogenic soil NOx emissions inferred from OMI NO2 observations, Atmos. Chem. Phys., 14, 10363–10381, https://doi.org/10.5194/acp-14-10363-2014, 2014.
Vitousek, P. M., Naylor, R., Crews, T., David, M. B., Drinkwater, L. E., Holland, E., Johnes, P. J., Katzenberger, J., Martinelli, L. A., Matson, P. A., Nziguheba, G., Ojima, D., Palm, C. A., Robertson, G. P., Sanchez, P. A., Townsend, A. R., and Zhang, F. S.: Nutrient Imbalances in Agricultural Development, Science, 324, 1519–1520, https://doi.org/10.1126/science.1170261, 2009.
Wang, R., Bei, N., Wu, J., Li, X., Liu, S., Yu, J., Jiang, Q., Tie, X., and Li, G.: Cropland nitrogen dioxide emissions and effects on the ozone pollution in the North China plain, Environ. Pollut., 294, 118617, https://doi.org/10.1016/j.envpol.2021.118617, 2022a.
Wang, Y., Yao, Z., Zheng, X., Subramaniam, L., and Butterbach-Bahl, K.: A synthesis of nitric oxide emissions across global fertilized croplands from crop-specific emission factors, Glob. Change Biol., 28, 4395–4408, https://doi.org/10.1111/gcb.16193, 2022b.
Wen, L., Xue, L., Wang, X., Xu, C., Chen, T., Yang, L., Wang, T., Zhang, Q., and Wang, W.: Summertime fine particulate nitrate pollution in the North China Plain: increasing trends, formation mechanisms and implications for control policy, Atmos. Chem. Phys., 18, 11261–11275, https://doi.org/10.5194/acp-18-11261-2018, 2018.
Wu, J., Bei, N., Hu, B., Liu, S., Wang, Y., Shen, Z., Li, X., Liu, L., Wang, R., Liu, Z., Cao, J., Tie, X., Molina, L. T., and Li, G.: Aerosol–photolysis interaction reduces particulate matter during wintertime haze events, P. Natl. Acad. Sci. USA, 117, 9755–9761, https://doi.org/10.1073/pnas.1916775117, 2020.
Yan, X., Ohara, T., and Akimoto, H.: Statistical modeling of global soil NOx emissions, Global Biogeochem. Cy., 19, GB3019, https://doi.org/10.1029/2004GB002276, 2005.
Yan, X., Jin, J.-Y., He, P., and Liang, M.-Z.: Recent Advances on the Technologies to Increase Fertilizer Use Efficiency, Agr. Sci. China, 7, 469–479, https://doi.org/10.1016/S1671-2927(08)60091-7, 2008.
Yienger, J. J. and Levy, H.: Empirical model of global soil-biogenic NOx emissions, J. Geophys. Res.-Atmos., 100, 11447–11464, https://doi.org/10.1029/95JD00370, 1995.
Yu, Z., Liu, J., and Kattel, G.: Historical nitrogen fertilizer use in China from 1952 to 2018, Earth Syst. Sci. Data, 14, 5179–5194, https://doi.org/10.5194/essd-14-5179-2022, 2022.
Zhang, Q., Streets, D. G., Carmichael, G. R., He, K. B., Huo, H., Kannari, A., Klimont, Z., Park, I. S., Reddy, S., Fu, J. S., Chen, D., Duan, L., Lei, Y., Wang, L. T., and Yao, Z. L.: Asian emissions in 2006 for the NASA INTEX-B mission, Atmos. Chem. Phys., 9, 5131–5153, https://doi.org/10.5194/acp-9-5131-2009, 2009.
Zhang, R., Wang, G., Guo, S., Zamora, M. L., Ying, Q., Lin, Y., Wang, W., Hu, M., and Wang, Y.: Formation of urban fine particulate matter, Chem. Rev., 115, 3803–3855, https://doi.org/10.1021/acs.chemrev.5b00067, 2015.
Zhang, Y., Liu, J., Mu, Y., Pei, S., Lun, X., and Chai, F.: Emissions of nitrous oxide, nitrogen oxides and ammonia from a maize field in the North China Plain, Atmos. Environ., 45, 2956–2961, https://doi.org/10.1016/j.atmosenv.2010.10.052, 2011.
Zhao, M., Tian, Y., Zhang, M., Yao, Y., Ao, Y., Bin Yin and Zhu, Z.: Nonlinear response of nitric oxide emissions to a nitrogen application gradient: A case study during the wheat season in a Chinese rice-wheat rotation system, Atmos. Environ., 102, 200–208, https://doi.org/10.1016/j.atmosenv.2014.11.052, 2015.
Zhao, R.-F., Chen, X.-P., Zhang, F.-S., Zhang, H., Schroder, J., and Römheld, V.: Fertilization and Nitrogen Balance in a Wheat–Maize Rotation System in North China, Agron. J., 98, 938–945, https://doi.org/10.2134/agronj2005.0157, 2006.
Zheng, Y., Ji, J. and Liu, S.: Effect of topdressing time on spring maize yield and nitrogen utilization in black soil of northeast China, Sci. Rep.-UK, 13, 11841–10, https://doi.org/10.1038/s41598-023-38724-3, 2023.
Zhu, Z., Stewart, B. A., and Fu, X.: Double cropping wheat and corn in a sub-humid region of China, Field Crop. Res., 36, 175–183, https://doi.org/10.1016/0378-4290(94)90109-0, 1994.