the Creative Commons Attribution 4.0 License.
the Creative Commons Attribution 4.0 License.
 | 26 Sep 2025
Isotopic signatures of methane emission from oil and natural gas plants in southwestern China
Dingxi Chen
Yi Liu
Zetong Niu
Ao Wang
Pius Otwil
Yuanyuan Huang
Zhongcong Sun
Xiaobing Pang
Liyang Zhan
Current evaluation of methane (CH4) emissions to the atmosphere from global oil and gas (ONG) sector is subject to considerable uncertainty. Particularly for China, few measurements have been conducted, making it difficult to quantify emissions and conduct mitigation measures. Recently, the isotopic composition of CH4 (δ13C) has been used for evaluating the contributions of fossil fuel sources to global budgets, providing a more effective approach across both regional and global scales. Here, we present a field study of CH4 mixing ratios and δ13C based on UAV sampling and ground monitoring across 11 ONG sites located in southwestern China. We found that the values of δ13C-CH4 provide a solid basis for identifying the CH4 leakage and characterizing source distributions at the ONG site-levels, despite that the meteorological and site conditions as well as the surrounding environment could exert influence on the signal strengths. With the Keeling plot approach, we determined that the mean δ13C source isotopic signatures of CH4 emission from these ONG sites were −25.66 ‰, heavier than previously found for other sites globally. This also indicates that they were mainly thermogenic sources. Finally, by incorporating the updated source isotopic signatures determined for China, we conducted a back-of-envelope assessment to qualitatively infer the global CH4 emission from the fossil fuel sources. The result suggests an overestimation of global CH4 emission from the fossil fuel inventory by 2.86 Tg CH4 yr−1, and an underestimation from the microbial sources. This study highlights the necessity of determining CH4 isotopes on ONG site-levels, providing an indirect but important reference to quantifying CH4 inventories among global industrial sectors.
- Article
(2936 KB) - Full-text XML
-
Supplement
(2943 KB) - BibTeX
- EndNote


Methane (CH4) is a major greenhouse gas (GHG) in the atmosphere, with a global warming potential 82.5 times greater than carbon dioxide (CO2) over a 20-year timeline, and 29.8 times greater over a 100-year period (Intergovernmental Panel on Climate Change, 2021). The mixing ratios of CH4 in the atmosphere has increased by 150 % since the industrial revolution, primarily driven by human activities (Hmiel et al., 2020; Tian et al., 2016; Skeie et al., 2023; Saunois et al., 2025; Nisbet et al., 2025). However, for the past decades, the major paradox of the CH4 research community lie within the nonlinear trend of CH4 mixing ratios in the global atmosphere (Schwietzke et al., 2016; Montzka et al., 2011). Debates have been raised regarding the contribution sources of CH4 (the drivers of the atmospheric CH4 growth) and the high uncertainty of sector-wise CH4 emission inventories (Rice et al., 2016; Tibrewal et al., 2024; Saunois et al., 2025; Nisbet et al., 2025; Michel et al., 2024; Zhao et al., 2025). Therefore, the identification of CH4 sources and the quantification of their contributions are essential for solving such puzzle.
The oil and natural gas (ONG) industry is one of the major contributors to anthropogenic CH4 emissions accounting for approximately 15 % of global emissions (Lauvaux et al., 2022). China's ONG industry emerges as potent CH4 emission sources, which are estimated to contribute 3216.61 Gg in 2024 (International Energy Agency, 2024). However, national-scale estimates remain highly variable and uncertain (Zhang et al., 2014; Sun et al., 2022), largely due to limited observation and poor estimation based on generalized emission factors. Further, the evaluation of CH4 emission from ONG activities in China is complexed by other strong anthropogenic sources such as agricultural production (e.g., ruminants, rice paddies), wetlands, landfills, and wastewater (Skeie et al., 2023).
Since conventional measurements of CH4 mixing ratios cannot differentiate among various emission sources, recent studies have applied stable isotope tools for source attribution, based on the distinct isotopic signatures (e.g., δ13C-CH4) of microbial and thermogenic CH4 (Suzuki, 2021; Peng et al., 2024; Leitner et al., 2020; Dlugokencky et al., 2011). For example, by analyzing the atmospheric δ13C-CH4 data, Basu et al. (2022) found that microbial sources accounted for 85 % of the growth in methane emissions between 2007 and 2016. Another isotope work indicates that CH4 emissions from the fossil fuel sector remained largely unchanged at the 1980s and 1990s levels, but increased significantly between 2000 and 2009 (Rice et al., 2016). Therefore, isotopic measurements from the atmosphere provide important benchmarks for validating CH4 contributions from particular sources, and could assist in evaluate CH4 emission budgets (Michel et al., 2024; Kuhlmann et al., 2025).
For ONG sources, global observations of CH4 isotopic signatures have not yet reached agreement, resulting in large deviations in estimating the source contributions and emission trends (Schwietzke et al., 2016). While the isotope measurement of the background atmosphere sheds light to the global mean source signatures, local measurements of the ground or the lower atmosphere could be more direct in reflecting specific sources such as ONG production or processing. One study has estimated CH4 emissions from the abandoned ONG wells in the United States, indicating a major contribution from the coalbed and natural gas sources (Townsend-Small et al., 2016). Another research conducted the CH4 isotopic measurements in the atmosphere over the ONG fields in Romania, confirming the signature from the ONG sources despite a large variation range for δ13C (Menoud et al., 2022). A recent study revealed that the isotopic characteristics of CH4 enable differentiation of ONG sources by region and depth, reflecting both the spatial and vertical variability of fossil fuel extraction (Ars et al., 2024). Several researchers used mobile monitoring in Kuwait and identified distinct isotopic signatures from microbial, ONG, and vehicular sources, finding that microbial emissions were the predominant contributor while ONG sources played a relatively minor role (Al-Shalan et al., 2022).
Recent advancements in UAV technology have facilitated novel approaches to monitor and quantify CH4 emissions, particularly in industrial sites with limited access (Shaw et al., 2021). UAV-based active AirCore systems enable high-resolution sampling and quantification of CH4 emissions from point sources such as mine ventilation shafts (Andersen et al., 2023). Combined with inverse Gaussian and mass balance approaches, this method allows effective upscaling to regional emission estimates and has shown high accuracy in the Upper Silesian Coal Basin (R2 = 0.7–0.9). So far, few studies have deployed the UAV method for isotopic determination of methane from ONG site-level (Leitner et al., 2023), and there is a knowledge gap of CH4 isotopic measurement at the site level considering various factors such as source types (Zhang and Zhu, 2008; Schoell, 1980), processing (e.g., purification or production of light hydrocarbon), meteorological condition, sampling method, size of the site and so on (Liu et al., 2019).
Therefore, to address the CH4 isotope signatures from Chinese ONG plants and to examine the potential of UAV-based sampling methods, we conducted a field sampling campaign in Sichuan Province, SW China, covering 11 production/processing sites. Vertical profiles (50–300 m) of the air above ONG plants as well as the ground air had been sampled for CH4 isotopic analyses, in order to provide semi-quantitative understanding of the emission source distributions and to reveal the isotope signatures from local Chinese ONG production and processing activities.
2.1 Study sites
The study area is located in Sichuan Basin, Southwest China, where about 19 % of the country's total natural gas reserves have been discovered (The People's Government of Sichuan Province, 2025). Until 2022, the region has about 77 000 km gas pipelines. Between 2013 and 2023, natural gas production in this region increased from 21.31 × 10⁹ to 59.48 × 10⁹ m3 (Sichuan Provincial Bureau of Statistics, 2025), with an average annual growth rate of about 11 %. In 2020, ONG production in Sichuan accounted for 24 % of China's total ONG production.
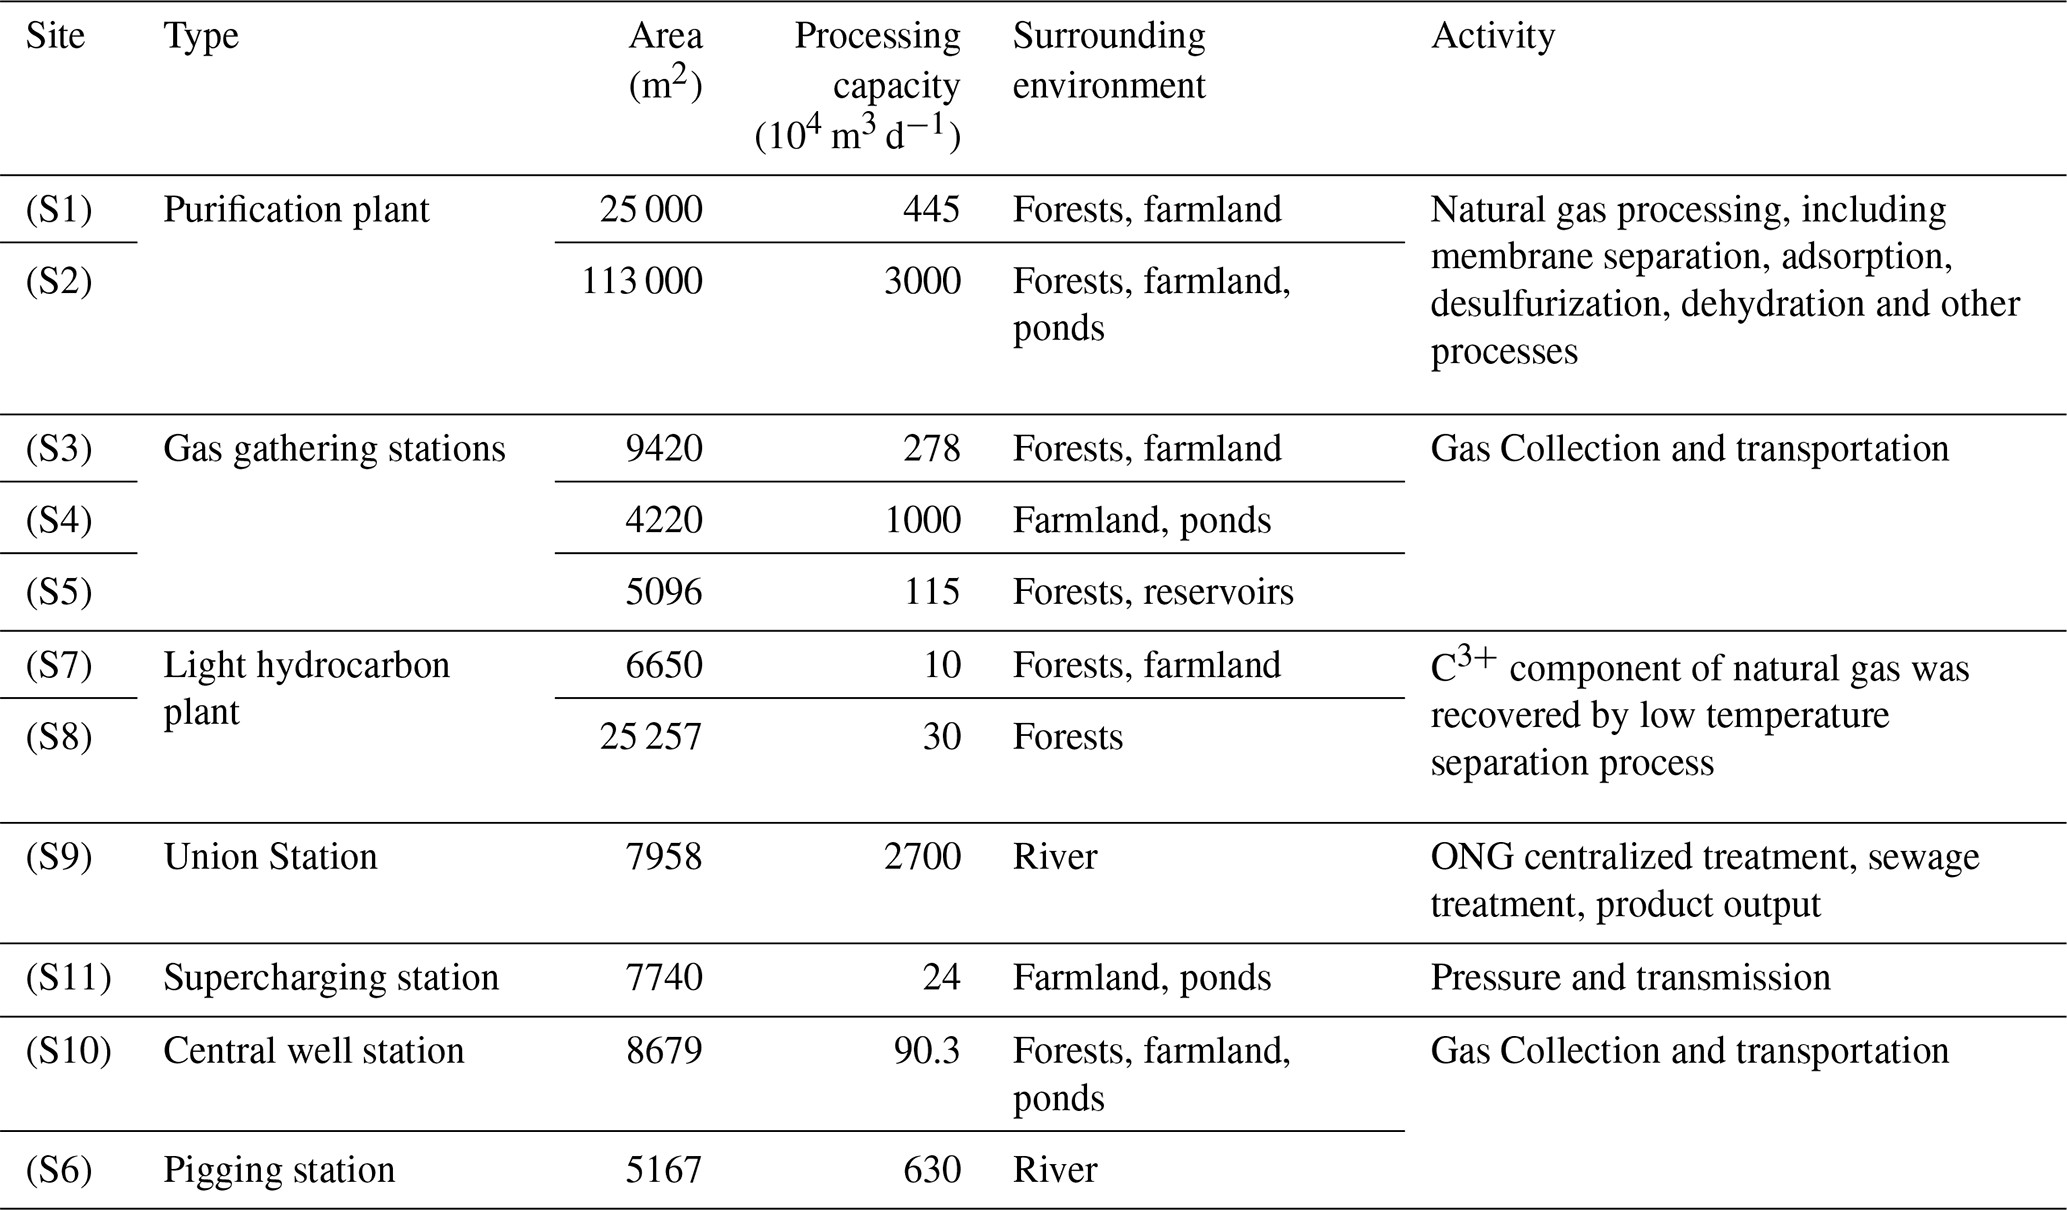
We monitored CH4 mixing ratios and sampled air for isotope measurements across 11 ONG processing or transportation stations in the central Sichuan Basin. The study region is characterized by a humid subtropical climate, with consistently warm and humid conditions throughout the year. The areas of these stations vary from 2000 to 300 000 m2, while the production activities also vary, including natural gas purification plants, gas gathering stations, light hydrocarbon plants, pigging stations, pressurization stations, etc. (Table 1). Most ONG sites are located in remote areas, where the surrounding environment is farmland (paddy fields), bodies of water, forests, and scattered residences, with no large-scale cattle farms, pig manure sites, or landfill sites nearby. In addition, during our observational campaign, no biomass or coal burning was spotted in the surroundings. For the reasons of privacy and confidentiality, the accurate locations and contours of the ONG stations cannot be disclosed in this paper.
Table 1Background information of the studied production/processing sites for oil and natural gas.
2.2 Sampling methods
From 13 to 19 April 2023, we monitored and collected samples at 11 ONG production stations in the central Sichuan Basin, obtaining a total of 74 air samples, including 28 from ground and 46 from air overhead. Ground air samples were collected at heights ranging from 0.5 to 2 m above the group. Sampling locations were chosen in open areas of each station, including areas near pipelines and production equipment. The criteria for selecting the open-ground area includes: no significant elevation in CH4 concentration compared to the ambient background (Chen et al., 2024), as measured by a portable TDLAS methane analyzer; a minimum distance of 20 m from any facility; and the absence of visible pipelines or valves. Sampling in the area of pipelines and production equipment was performed at locations that showed abnormal mixing ratios after ground monitoring; sampling was performed in the central area if no apparent CH4 emission was detected. For large sites (> 10 000 m2), multiple sampling points were established, while for small sites (< 10 000 m2), 1–2 sampling points were established in facility areas, and the sampling time for each sample was about 45–50 s.
Air sampling was performed by an Unmanned Aerial Vehicle (UAV) equipped with an automatic sampling pump (Fig. 1). The UAV model was a DJI-T10 (upgraded version), and the sampling pump model was KVP04-1.1-12V (1.25 L min−1). Taking into account the altitude ranges in previous studies (Kim et al., 2025; Han et al., 2024; Chen et al., 2024; Liu et al., 2021; Liu, 2018; Ali et al., 2017) and the drone's battery life, the monitoring altitudes were defined at 50, 100, 200 and 300 m, respectively. Initially, a ground sampling spot was identified, typically within the pipeline vicinity of the plant. Subsequently, a UAV equipped with an automatic sampling pump and air collection bags were lifted to 300 m above the ground sampling site. The UAV then sequentially descended to altitudes of 200, 100, and 50 m, respectively, dedicating 45 to 60 s at each elevation for collecting air samples. This systematic approach ensures a comprehensive and stratified sampling strategy, facilitating the assessment of atmospheric constituents at varying heights.
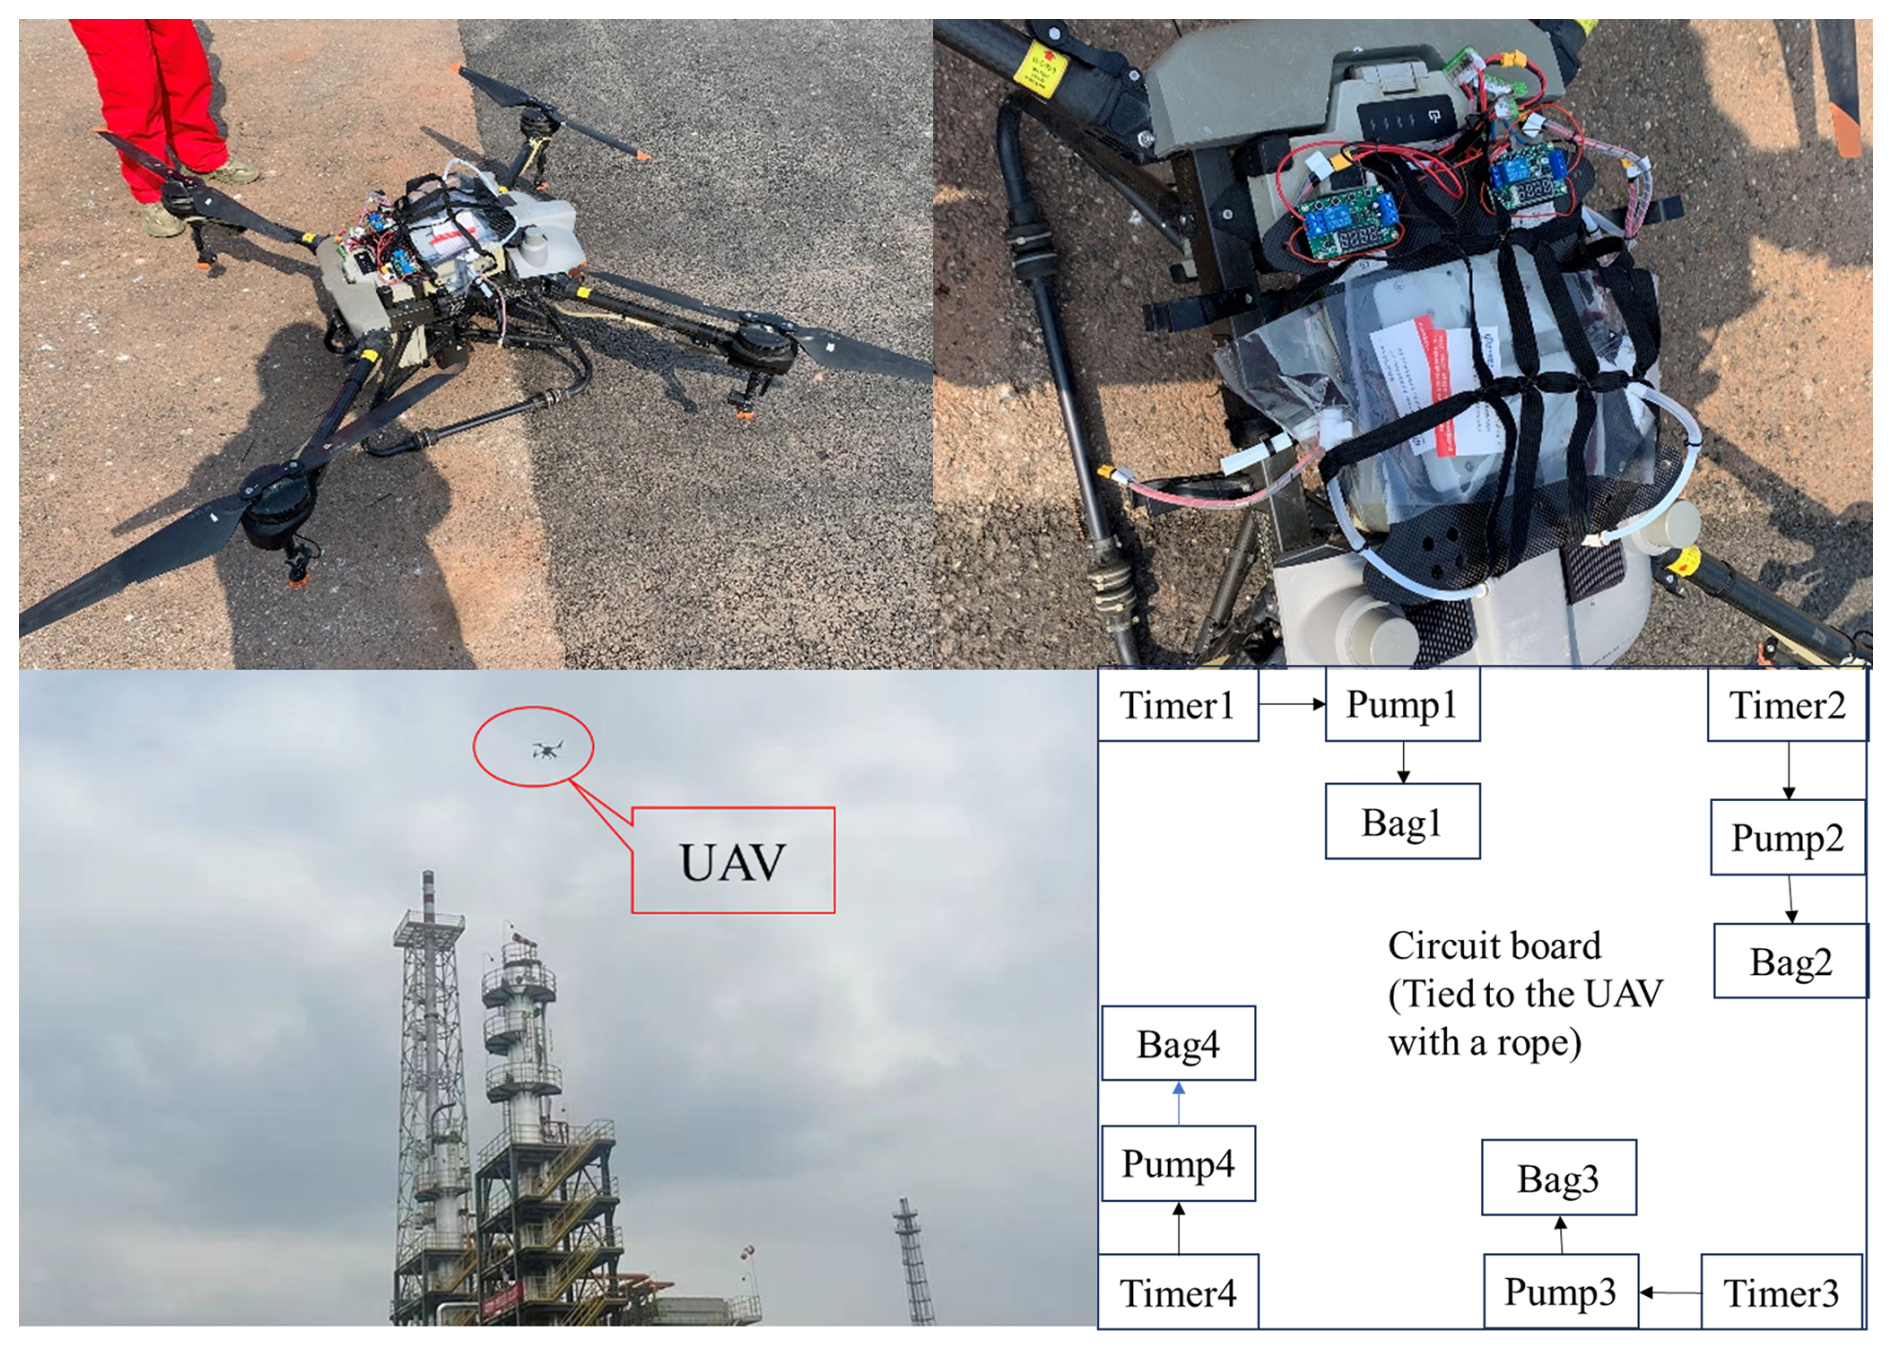
Figure 1Site demonstration of the UAV automatic sampling system and the schematic diagram of the sampling device.
The volume of each air sample was approximately 1 L, stored in HOONPO Teflon gas bags (1 or 2 L). Air was sampled at varying altitudes from all sites except for S1, which was sampled specifically at 50 and 100 m. Our sampling was conducted in the daytime between 11:00 a.m. and 02:00 p.m.(UTC+8). Air sampling and UAV cruising were synchronized. For comparison, we had sampled a production well with significant emissions (built in the 1980s), which was short of maintenance for long. This was meant for directly exploring source signals (2 samples from the leakage point of the well, and one sample the open area of the site). In addition, we sampled (2 from the riverbank, 2 from the park) ambient air near an urban park and an urban river to analyze the ambient CH4 mixing ratios and isotope values. The sample list and results are provided in Table S1 (Supplement).
The influence of meteorological conditions on the CH4 mixing ratios and isotopes at the ONG plants was also considered. Therefore, a portable meteorological station was deployed at each station during the sampling periods. It was equipped with a three-dimensional ultrasonic wind speed and direction sensor (model: M307200), which recorded the wind speed (horizontal and vertical) and direction (horizontal and vertical) near the ground (3 to 10 m according to field conditions). The sampling frequency was 32 Hz with a resolution of 0.1 m s−1 for wind speed and 0.1° for wind direction, and the precision of wind direction and speed is 2° and 0.2 m s−1, respectively. We also obtained air pressure, solar radiation, temperature, and relative humidity from weather station.
2.3 Measurement methods
Gas samples were analyzed within one month after on-site sampling. Picarro G2132-i was used to detect the isotope and mixing ratio of CH4, which is based on Cavity Ring-Down Spectroscopy (CRDS). This system (in similar models) has been previously used by other studies of in situ CH4 source characterization (Rella et al., 2015; Geum et al., 2024). For each sample measurement, the total analysis time is over 180 s through the Picarro G2132-i instrument, and the average of the last 120 s of CH4 isotope and mixing ratio data was integrated and exported for raw sample data. We used two international primary standards (VPDB-referenced; Std1 and Std2, −68.6 ‰ and −40.0 ‰, respectively) and one secondary standard (Hstd, −46.89 ‰), all of which had been cross-calibrated (more details could be found in the Supplement, Sect. 3). During each measurement sequence (Supplement, Fig. S1), all three standards were measured together with the samples (five samples per sequence). Std1 was used for calibration and for correcting sequence-related drift, Std2 served as a quality control check, and Hstd was used to constrain long-term drift. All measurements were completed within one week after sampling. In addition, repeated measurements of the same isotope standard (Std1) over a year have demonstrated the excellent stability of the instrument (Supplement, Fig. S2). The δ13C detection precision (1σ, 1 h window) of the instrument is as follows: when the mixing ratio of CH4 is greater than 1.8 ppm, the precision of 5 min mean value is better than 0.8 ‰, when the mixing ratio of CH4 exceeds 10 ppm, the precision is better than 0.4 ‰.
2.4 Calculation of source isotopic signatures
Based on the sample detection data, the Keeling plot method was used to determine the CH4 source (Keeling, 1958; Pataki et al., 2003) for each field station, the source isotopic signatures were obtained using a linear regression method based on the least squares approach (France et al., 2016; Akritas and Bershady, 1996). As shown in Eq. (1):
Where δ(a), δ(b), and δ(s) represent the δ13C values of the sample, the background air and the average source, respectively. [CH4(a)] and [CH4(b)] represent the CH4 mole fractions of the sample and the background air, respectively. The intercept (δ(s)) of the fit line is the isotope value of the CH4 source present in the mixed sample. In linear regression, and δ(a) represent independent (x-axis) and dependent (y-axis) variables, respectively. This method is suitable for carbon dioxide, methane (Thom et al., 1993), water vapor (Moreira et al., 1997), and other gases, but each gas has its specific considerations (Pataki et al., 2003). The gas samples from each station were collected within 30 min, during which the atmospheric background values (isotope and mole fraction of CH4) did not change, fulfilling the application conditions of this method (Lu et al., 2021).
2.5 HYSPLIT model
The Hybrid Single-Particle Lagrange Integrated Trajectory (HYSPLIT) model developed by the National Oceanic and Atmospheric Administration (NOAA) Air Resources Laboratory, is a widely used public platform for different atmospheric scales and supports online modules (Pereira et al., 2019). The model has been used to calculate the air mass transfer trajectories at different altitudes (Shan et al., 2009; McGowan and Clark, 2008; Stein et al., 2015). In the air above ONG plants, ground-based metrological station cannot capture the dynamics of wind directions and speeds. Thus, we deployed the HYSPLIT model to analyze the influence of meteorological conditions on CH4 mixing ratios and isotopes particularly for the UAV-based sampling and measurements. The time resolution of the model could reach 1 h and the height resolution was 1 m. In this study, 24 h backward trajectories were calculated at each site for five altitudes: ground level, 50, 100, 200, and 300 m. The input data included the longitude and latitude of the site from field measurements and sampling time, while the output information were wind direction and speed at different heights. Additionally, we evaluated the stability indexes based on the HYSPLIT model outputs. It shows that the Pasquill stability classes during UAV sampling were mostly C in our sampling campaigns (Slightly unstable conditions).
2.6 Source partitioning with end-member mixing method
End-member mixing method is a common method for identifying major sources and quantifying contributions of multiple sources (Bugaets et al., 2023; Barthold et al., 2011). The end-member mixing model is conducted with the mass balance of air mixing as well as composition of the tracers, based the following assumptions: (1) the ambient atmospheric constituents are constant, (2) the tracer is conservative, (3) and the source mixing ratios differ from the background. Here, we used CH4 mixing ratios and isotopes as tracers to investigate the contribution of atmospheric background, open surface area, and facility area to the sampled air above various ONG plants.
2.7 Statistics
Data analysis and graphing were performed using Origin 2024 software for Windows. Linear fitting was based on the principle of the least square method, indicating the 0.95 confidence intervals. A value of P<0.05 was considered significant for statistical analysis, and the fitting results are expressed as fitting mean and standard deviation. Maximum, minimum, mean, median, outliers, and 25 %–75 % range values were also analyzed and reported in the figures or tables.
3.1 Variations of CH4 mixing ratios and isotopes across ONG plants
The CH4 mixing ratios and δ13C-CH4 values from the studied 11 ONG sites ranged from 1.88 to 3.66 ppm and from −48.14 ‰ to −30.41 ‰, respectively (Supplement, Table S1). The maximum and minimum values of CH4 isotopes were observed at sites S2 and S6 (100 m), respectively. The variation of the CH4 mixing ratios and isotopic values at stations S2, S4, and S7 is significantly greater than that observed at other stations (Fig. 2). The results of direct emissions from the production well were ‰ and 118.98±0.52 ppm, respectively. By comparison, the CH4 isotope and mixing ratio of the urban samples were ‰ and 2.04±0.07 ppm, respectively.
More specifically, in the near-ground air, we found higher CH4 mixing ratios and isotopic values in areas close to production equipment than those in the open areas (Fig. 2), although the mixing ratios and isotopic values at S6 and S9 were very similar to the atmospheric background. Overall, the CH4 isotopic values observed from the ground air at the field stations ranged from −47.68 ‰ to −16.19 ‰ ( ‰ on average), while the isotopic values from the air over plants were more constrained in a small range of −48.14 ‰ to −44.11 ‰.
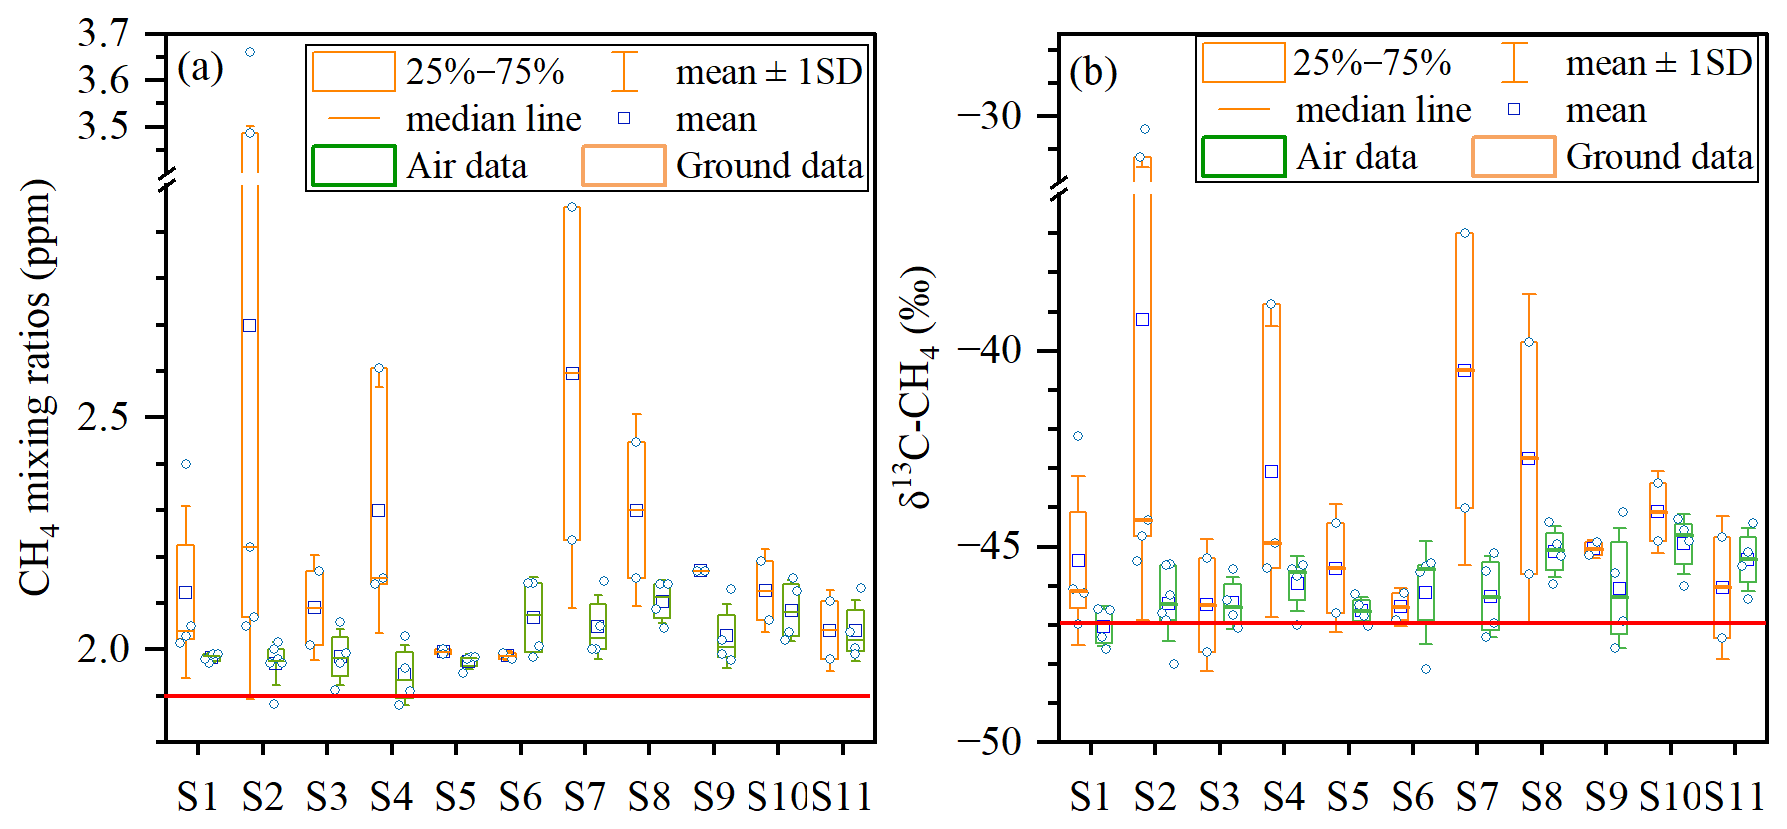
Figure 2Box whisker plots of CH4 mixing ratios (a) and isotopic values (b) for air sampled near the plant ground (Ground data) and air sampled above the plants (mean, median, 25 %–75 % range, and 1 SD are indicated in the figures; the red lines refer to CH4 mixing ratios (a, 1.9 ppm) and isotopic values (b, −47 ‰) from the atmospheric background.
3.2 Vertical profiles of CH4 mixing ratios and isotopes and source partitioning
The vertical distribution of the CH4 mixing ratios and isotopes differed from site to site. For instance, the mean CH4 mixing ratios were higher at 100 m or above than at 50 m, yet the isotopic values (δ13C) were somewhat lower (Fig. 3). From the perspective of each ONG site, the patterns were similar yet more complex (Supplement, Fig. S3). Some stations exhibited consistent trends (S1, S3, S6, S7, S9, S11), while others displayed different trends (S2, S4, S5, S8, S10). For instance, the CH4 mixing ratio and isotopic values at 100 and 200 m altitude of station S8 were inversely proportional. As the altitude increased from the ground to 300 m, the CH4 isotopic values of stations S4 and S1 exhibited a decline, ranging from −45.47 ‰ to −47.00 ‰ (ground to 300 m) and from −42.17 ‰ to −47.12 ‰ (ground to 100 m), respectively (Supplement, Fig. S3). The CH4 isotopic values of stations S6 initially decreased with increasing altitude and subsequently increased, reaching a minimum at 100 m altitude (−48.14 ‰). The variation of the CH4 isotope vertical profile at station S8 was analogous to that observed at sites S6, with the exception that the CH4 isotopic minimum value reached −45.95 ‰ at 200 m altitude. The variation of CH4 isotopic values with altitude at station S9 was complex, exhibiting a decrease followed by an increase, which then decreased again, reaching minimum and maximum values at 50 m (−47.60 ‰) and 200 m (−44.11 ‰), respectively.
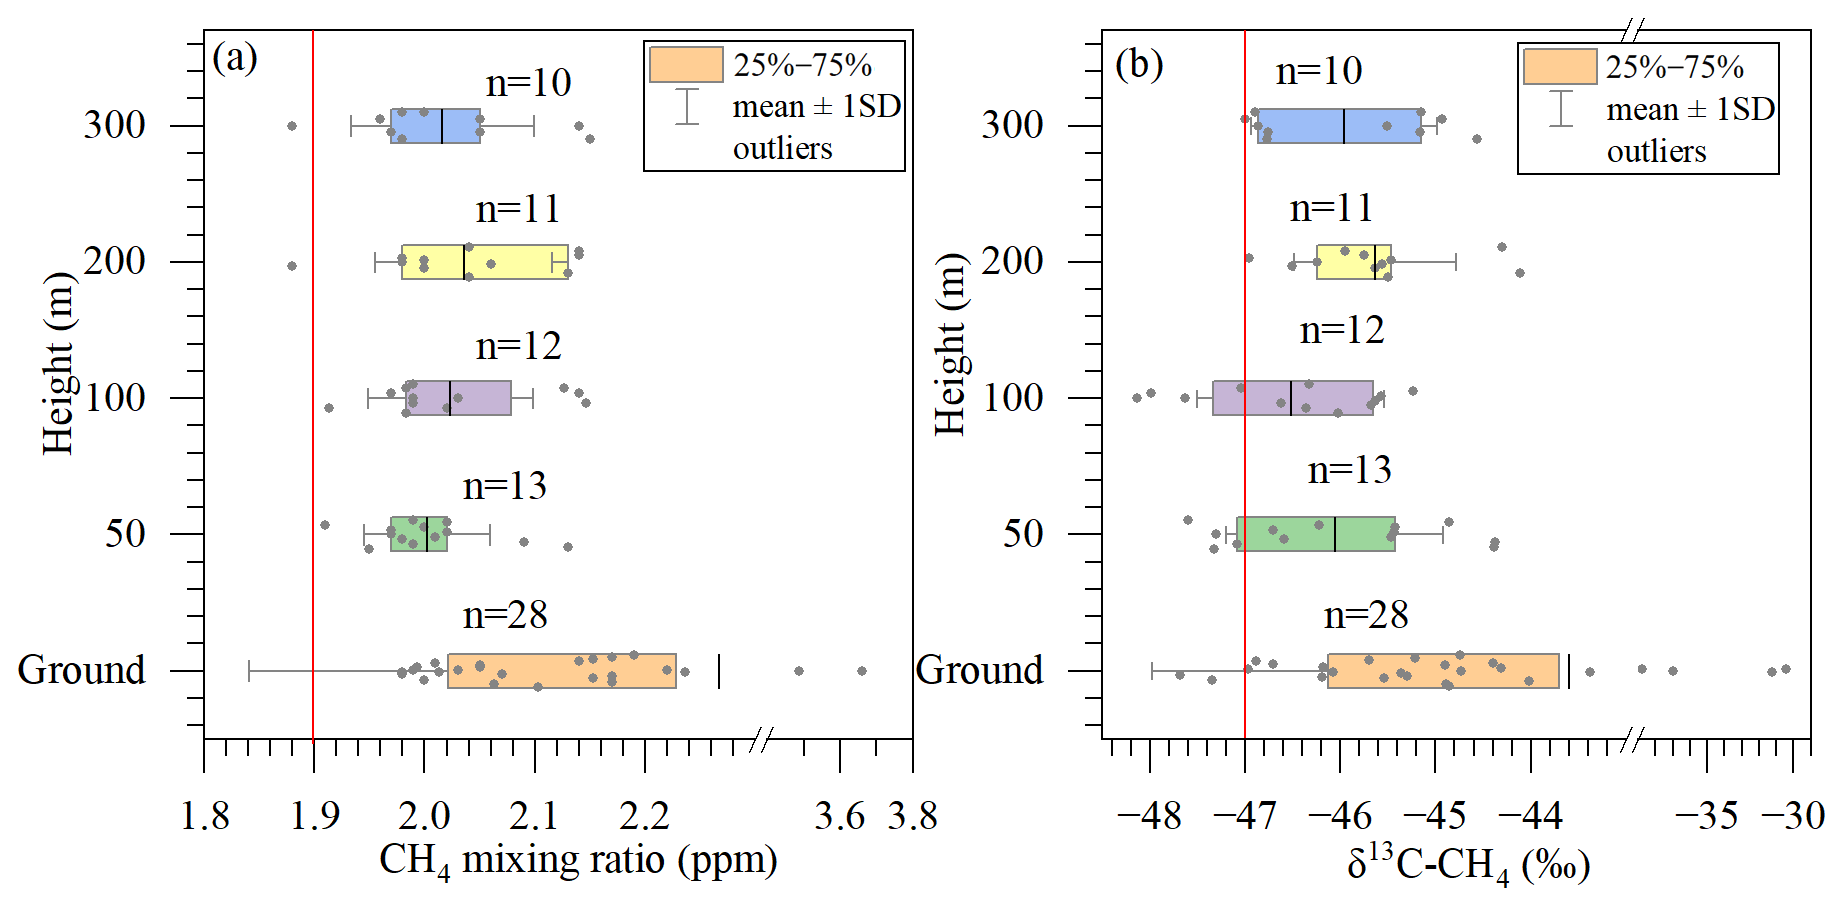
Figure 3Box whisker plots showing the variations of CH4 mixing ratios (a) and isotopic values (b) at different heights (from ground to 300 m at all sites); include mean, 25 %–75 % range, and 1 SD; “n” represents the number of samples. The red lines refer to CH4 mixing ratios (a, 1.9 ppm) and isotopic values (b, −47 ‰) from the atmospheric background.
3.3 Source partitioning for CH4 emission from the ONG plants
The end-member mixing method is a commonly employed technique for calculating isotope mixing by various sources of GHGs (Bugaets et al., 2023). In this study, we determined the contribution fractions of CH4 from the atmospheric background, surface, and facility areas to the air over the sites (more details could be found in Supplement: Sect. 1 and Table S4). The results indicate that atmospheric background is the predominant source of methane, with larger contribution compared with those determined for ground and facility area (Fig. 4). Nevertheless, at altitudes of 100 m, the ground and facility-derived contributions became slightly more important, indicating that these two altitudes may be more representative of the whole-plant emission signals. In particular, at higher altitudes, the signal of CH4 emissions from ONG plants below may be dampened by mixing of background air or even biological sources in the vicinity of the sites. Despite so, we didn't find any strong emission signals from surrounding environment outside the regions of the ONG plants (no apparent elevation of CH4 mixing ratios along the vertical profile in the atmosphere).
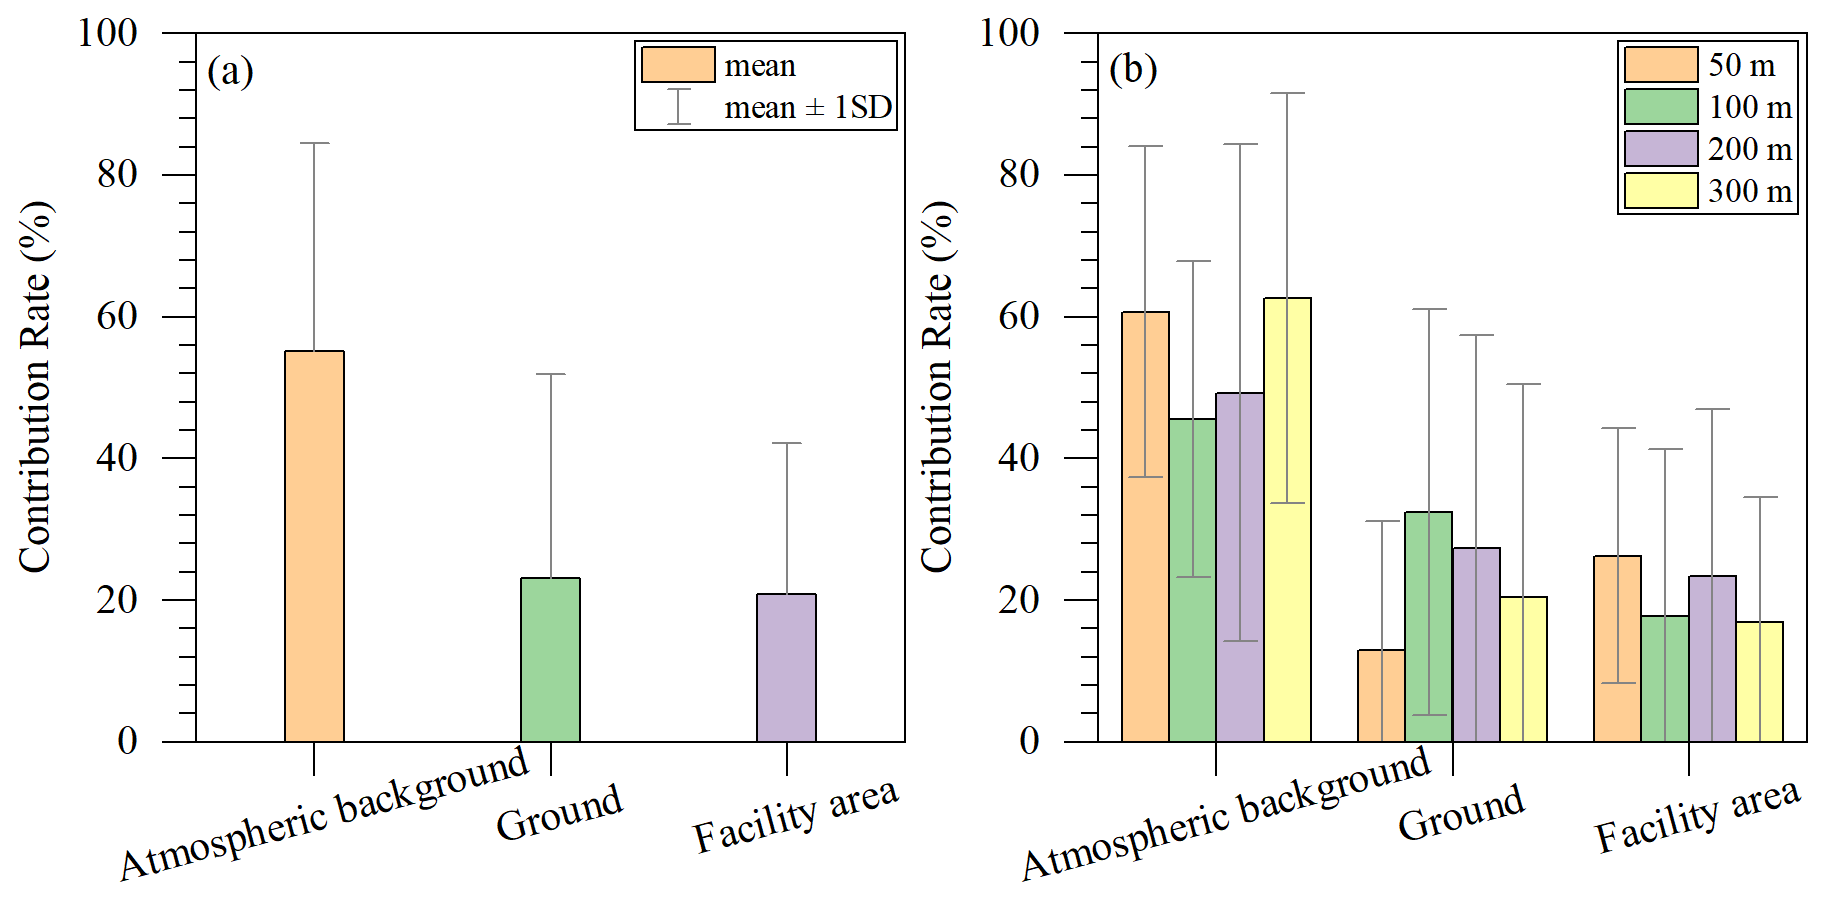
Figure 4The fractional contributions from ambient background, surface, and facility areas contribute to the air sampling above ONG plants. (a) the proportion of contributions to all heights of all stations with 1 SD; (b) the proportion of contributions to different heights with standard error.
3.4 Characteristics of source isotopes
The Keeling plot method was employed to determine the isotopic signatures (δ13C) of CH4 sources at each station, as presented in Fig. 5. The range of the CH4 source isotopic signatures varied from ‰ to ‰ (mean value of −25.66 ‰), indicating that they were mainly thermogenic sources (associated with oil production) (Menoud et al., 2022; Sherwood Lollar et al., 2002). Globally, the range of CH4 isotopic values from fossil fuels is −75 ‰ to −25 ‰ (Defratyka et al., 2021). Our results mostly align with this large range, but were at the higher end.
The source isotopic signature for station S5 was ‰, which was lower than the atmospheric background value. However, the data fitting for this station was poor, indicating large uncertainty (R2=0.08). On the other hand, the direct measurements of emission from wells indicated that source 13C signature was ‰, which is close to the result of the ground-air sample collected at the site ( ‰) (Supplement, Table S1). We conducted continuous monitoring of the natural gas production wells where elevated methane mixing ratios were consistently observed. Given that the sampling was carried out in close proximity to the leakage sources (wells) surrounded by high safety walls, we believe that the derived isotopic signatures could represent the emission source from ONG plants rather than being affected by the surrounding environment.
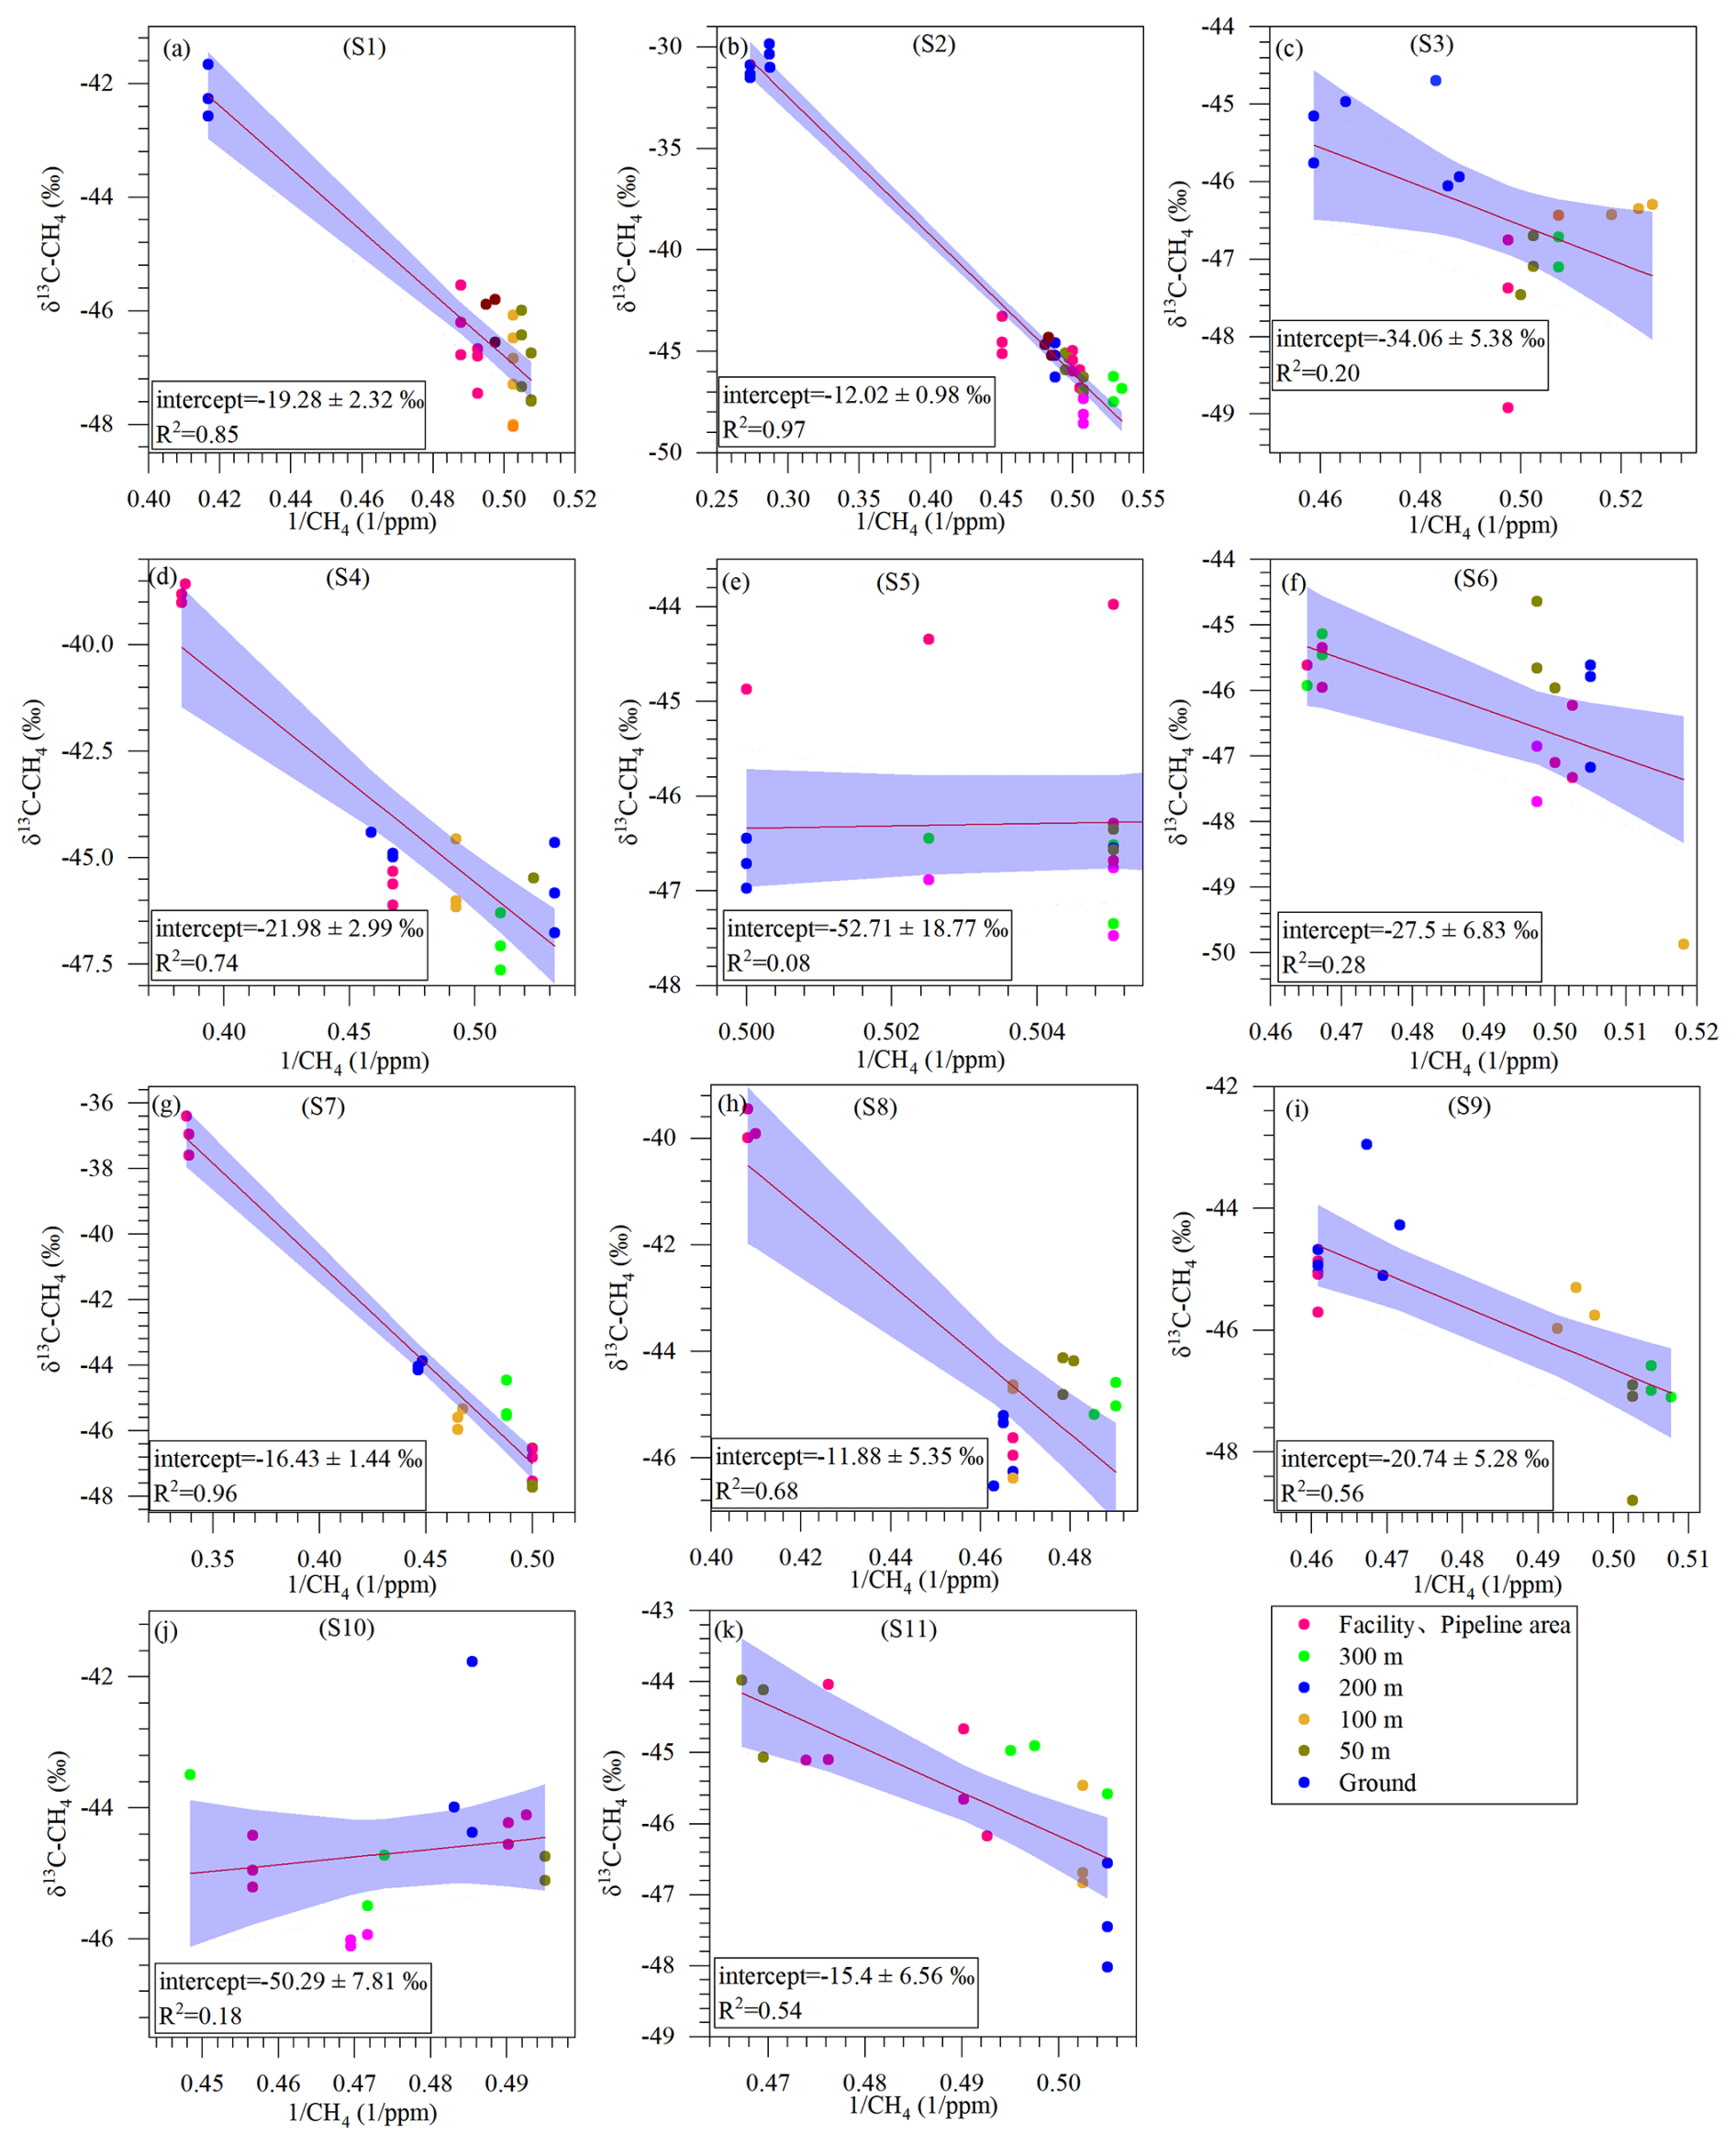
Figure 5The CH4 source isotopic signatures of 11 field stations determined based on the Keeling plot method. The blue area represents the 95 % confidence interval, and the red line is the result of linear regression posterior mean fit; The samples in different positions are distinguished by different colors. The intercept and R2 are given, which means the source isotope signal value and the fitting degree, respectively. Linear regression was performed using the least squares method.
4.1 CH4 emission signals as revealed by the isotopic measurements from both ground and atmosphere
During our sampling campaign, the mean δ13C-CH4 at most ONG plants was higher than the atmospheric background ( ‰) (Tyler, 1986), although several sites (S1, S3, and S5) had values close to the atmospheric background. In the meanwhile, the average values of CH4 mixing ratios were significantly higher than the atmospheric background (1.9 ppm) at all sites (Skeie et al., 2023). This supports apparent CH4 leakage from most sites during our study. Further, as referred to the Keeling plot approach, the correlation between CH4 mixing ratios and isotopes at the ONG sites was significant (R2=0.91) (Fig. 5). Besides, the ground exhibited an even stronger correlation (R2=0.95) than the air (R2=0.31) (Supplement, Fig. S4). These findings indicated that the CH4 sources at these ONG plants were generally consistent, reflecting single-source contribution. The δ13C source isotopic signatures from each site may vary, but the major range was consistent with the fossil-fuel sources (Defratyka et al., 2021). In addition, an investigation of the potential sources of CH4 in the vicinity of the ONG sites revealed that the primary source of CH4 at the station was from ONG, with other sources exerting less impact (Table 1).
Further, the variations of δ13C-CH4 across sites may reflect the influence from sources and local facilities. As shown in Fig. 5, the source isotopic signatures determined with the Keeling plot method were distinctively higher in the purification and production sites (S1–S2 and S7–S8) than in the gas gathering and transport lines (S3–S6) (Fig. 5). Studies have indicated that infrastructure, including components such as dehydrators, valves, compressors, and pipelines, represents a significant source of CH4 emissions from the ONG system. Infrastructure is particularly vulnerable to CH4 leakage due to corrosion and wear (Anifowose et al., 2014; Fernandez et al., 2005; Burnham et al., 2012; Anifowose and Odubela, 2015).
On the other hand, sampling locations appear to influence the observational results, particularly when comparing measurements near ground with those made in the air above (Figs. 2 and 3). We discovered that a majority of the ONG production stations exhibited both higher δ13C and CH4 mixing ratios in the ground measurement than in the air at 50–200 m aboveground (Fig. 3). This suggests that ground-based measurements are likely to exert more significant source signals when CH4 leakage occurs nearby. However, this may only apply to small ONG sites. Alternatively, measurements of air above the plants could provide information on the site-level emission, of which 100 m (on average) seems to perform best in representing emission signals as confirmed by the end-member analyses (Fig. 4) according to the local settings. By contrast, the mixing ratios and δ13C of CH4 at S6 were lower in the near-ground air than in the air overhead. This discrepancy may be attributed to the uncertainty associated with the small plant size (5167 m2 with a processing capacity of 630 × 104 m3 d−1) and thus large impact from surrounding environment sources of CH4 in the air. Therefore, the surrounding emission sources, together with the meteorological conditions, are likely to exert an impact on the UAV-based measurements considering local conditions of the ONG plants.
4.2 Factors of drone-based isotope measurements in the atmosphere
As shown in Figs. 2, 3 and 4, a wide range was found for the CH4 mixing ratios and isotopic values determined at the studied ONG plants, with particular variabilities observed at varying altitudes above ground. This could be attributed to a number of factors, including the presence of other CH4 sources in the vicinity and the influence of meteorological conditions (Kavitha and Nair, 2016). Around all ONG sites, the dominant land-use types are rural roads and scattered paddy fields, through which small ditches or streams flow. No livestock farm or landfill was observed in these areas, and no biomass burning was observed during our sampling period (April), which aligns with the legal prohibition of such activities in China. Taking this evidence into consideration, we can rule out the possibility of significant contributions from biological sources from the surrounding environment. The dampened signals of both CH4 mixing ratios and isotopes in the air-borne measurements may be partly due to convection with air carrying biological sources outside the range of the ONG plants, but the overall strength is small as confirmed with the Keeling plots (Fig. 5). Further, at station S6 where the 200–300 m-measurement exhibited high CH4 levels, we also found higher δ13C, which does not support the importance of biological sources which is usually characterized with lower δ13C (Fisher et al., 2011, 2017).
Importantly, our UAV sampling points were mostly located near the center or at least away from the edges of the ONG sites, which are significantly larger in area compared to the scattered paddy fields nearby. The Pasquill stability class during the sampling indicated slightly unstable atmospheric conditions, suggesting predominant vertical mixing over horizontal transport. This enhances the reliability of isotopic measurements in reflecting methane emissions from the station itself, with the ONG site being the primary source influencing the isotopic signatures. Furthermore, in a parallel study conducted by our team in the same region (Chen et al., 2024), several ambient air samples were collected for δ13C-CH4 analysis near paddy fields (1.5 m above the surface, 10–20 m from field boundaries). The isotopic values (δ13C-CH4 = ‰; unpublished data) were quite close to the global background, indicating minimal influence from the paddy fields. This could be attributed to the relatively low methane emissions during the sampling period, as April is typically dry in the Sichuan region.
The influence of meteorological conditions is significant and complex, and challenging to analyze. Wind direction and speed in the air above plants were obtained using the HYSPLIT model (Supplement, Table S3), and the results for near-ground air were cross-validated with those obtained from the meteorological station (Supplement, Fig. S5). The correlation analysis between wind speed and CH4 isotope results revealed an exponential relationship with a R2 value of 0.33 (Supplement, Fig. S6). This indicates that as wind speed increases, the impact of CH4 diffusion and dilution becomes more significant. Wind direction plays a role in the uncertainty of CH4 distribution, as it has a significant influence on CH4 transport near the surface, resulting in a non-uniform distribution of CH4 and typically higher mixing ratios downwind from the emission source. Furthermore, upwind CH4 sources can have a notable impact on CH4 levels over the station. The utilization of HYSPLIT model serves a crucial function in this regard (Supplement, Fig. S7 for a detailed example of S7 site).
Moreover, the local conditions of the ONG plants are among the primary determining factors of the air-borne measurements, encompassing factors such as the size of the sites, the treatment processes employed, the processing capacity, and the timing and location of sampling. Typically, a larger site size is likely to produce greater signals of CH4 in the atmosphere above head and to be less affected by other biological sources from surrounding environment (Omara et al., 2016). A clear positive correlation was observed between the site area and the isotope results for site areas below 10 000 m2 (Supplement, Fig. S8). This is interesting and probably also reasonable, as extra-large industrial sites may encompass more complexed influence from both meteorological conditions and ground source distributions. Besides, the intermittent nature of emissions from the site facilities introduces an element of uncertainty with regard to the sampling time and locations (Omara et al., 2016). Overall, by conducting a simple Principal Component Analysis (PCA), we identified a weak relationship among wind direction, wind speed and isotopes, and a strong correlation between the size and capacity of the sites with CH4 isotopes (Supplement, Fig. S9). This means that, during our sampling campaign, ONG plant-related factors are the major players in determining the measured CH4 isotope results.
4.3 Global source isotopic signatures of ONG-derived CH4
While no studies have specifically focused on the isotopic characteristics of CH4 leakage from ONG plants in the Sichuan region of China, several studies have investigated the characteristics of CH4 isotopes in Chinese ONG production regions, across the Sichuan Basin, Xinjiang, Northeastern China, and the Ordos Basin (Cai et al., 2013; Huang et al., 2017; Wang et al., 2018; Zhang et al., 2018; Zou et al., 2007; Zhu et al., 2014; Liu et al., 2019; Dai et al., 1985, 1992). The reported values of CH4 isotopes cover a wide range from −54.9 ‰ to −17.4 ‰ (Supplement, Table S2). The difference in 13C-CH4 reflects the origin of natural gas such as biogenic and abiogenic gases (Sherwood Lollar et al., 2002; Dai et al., 2005), of which biogenic gases include coal- and oil-type gases, respectively. The Sichuan Basin in our study has a complex geological environment and many gas-production layers, such as Cambrian, Ordovician, Carboniferous, Jurassic and so on (Zhang et al., 2018; Cai et al., 2013); also, CH4 from different geological layers can have variable isotopic characteristics. In comparison with the findings of other researchers on CH4 isotopes in the Sichuan Basin (Supplement, Table S2), our results of 13C-CH4 isotope signatures spanned more widely and appeared to be generally heavier (Fig. 5).
Among the global observations, Menoud et al. (2022) examined isotopic signatures of CH4 from an ONG extraction plant in Romania. Their methodology aligns closely with ours, and their findings indicate a range of δ13C values from ‰ to ‰ (Menoud et al., 2022). In Kuwait, methane from the southern Burgan field had a δ13C-CH4 of ‰, and the signals were slighter lower by measuring downwind of coastal refineries ( ‰) (Al-Shalan et al., 2022). A study on CH4 isotopes in the Western Canadian Sedimentary Basin showed that the δ13C signatures of CH4 from ONG sources ranged between −71 ‰ and −29.3 ‰, and the isotopic composition was primarily controlled by geological structure rather than the type of hydrocarbon (e.g., ONG sources) (Ars et al., 2024). In an Arctic study, Fisher et al. (Fisher et al., 2011) found that CH4 in the Arctic atmosphere during summer is mainly of microbial origin, whereas in spring and winter, the dominant source is likely CH4 emissions from natural gas fields, with a source δ13C-CH4 signature of ‰. In the UK, δ13C–CH4 signatures from ONG sources were well constrained, showing consistent values of approximately ‰, reflecting homogenized North Sea gas (Zazzeri et al., 2015). Compared with those previous work on ONG-related CH4 sources, our results overlap with the wide ranges as reported; the overall mean values are heavier and well above the global mean of fossil fuel CH4 isotope ( ‰) (Michel et al., 2024). This discrepancy can be attributed to a number of factors, including thermogenic origin, geographical differences (Menoud et al., 2022), the treatment processing of natural gas, and likely uncertainty due to limited sample size.
The methane isotopic signatures observed in this study were compared with those reported from major ONG production regions worldwide (Fig. 6). The δ13C of CH4 was found to be lighter in the United States and Canada, but heavier in China. Regional variations in δ13C values were observed, even within the same region (e.g. in China). Our results exhibited a significantly heavier δ13C than those of other studies. This is most likely to be attributed to differences in the origin of CH4 (Zhang and Zhu, 2008; Wang et al., 2018; Defratyka et al., 2021; Schoell, 1980), as we have excluded the possibility of strong influence from biological sources or biomass burning in the surrounding environment as discussed above.
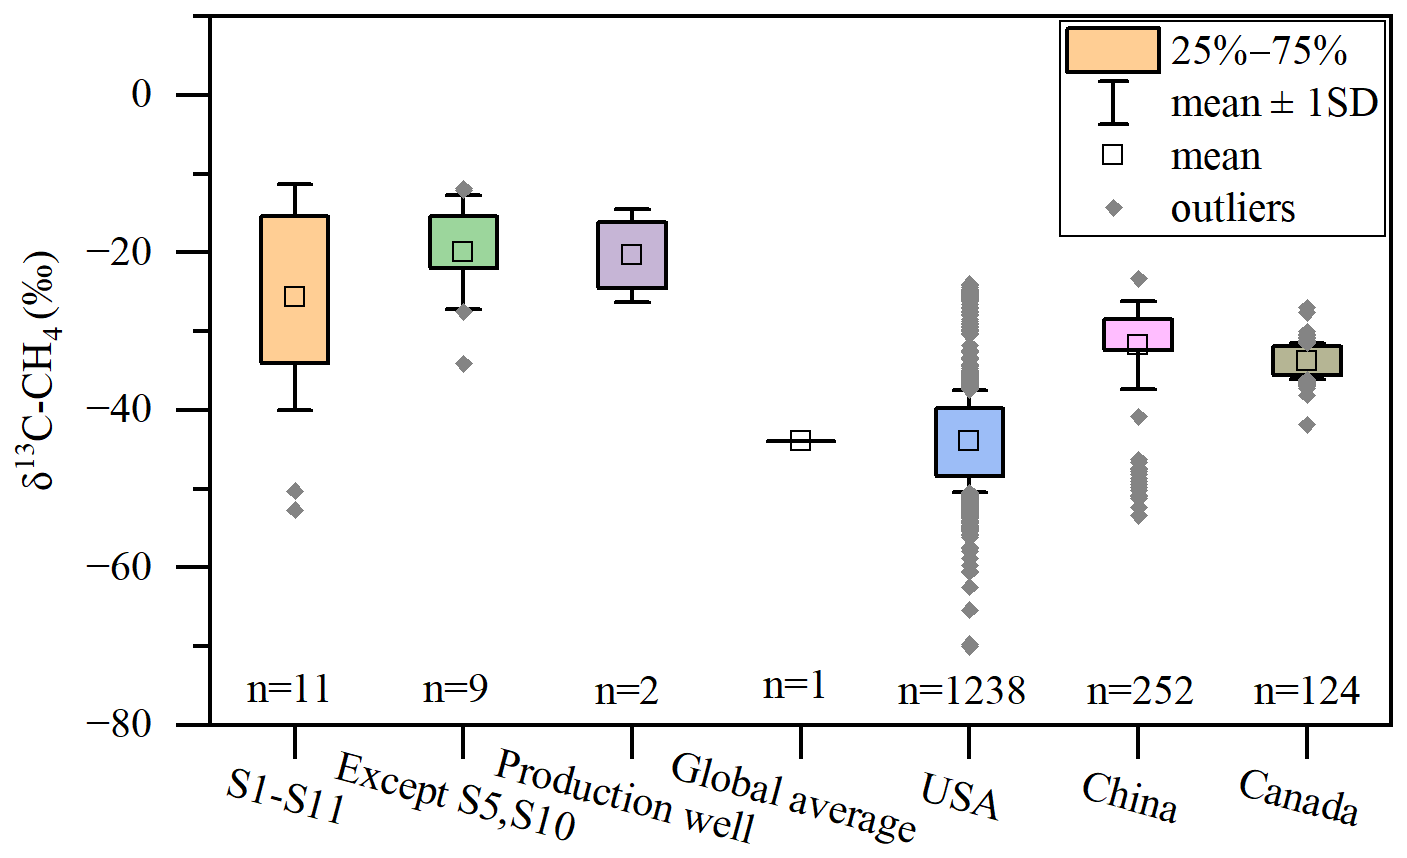
Figure 6Comparison of CH4 isotopic signatures in oil and natural gas production regions across major hydrocarbon-producing countries; data from both literature and this study are included. The number of data points is shown at the bottom of the box chart, and carry on the error analysis. “n” represents the number of data points.
The δ13C of CH4 represents a valuable indicator for constraining and estimating CH4 emissions particularly from anthropogenic sources of the globe (Milkov et al., 2020). As a sum-up, the mean δ13C signatures of CH4 sources as indicated from measurements of atmospheric background integrated the collective contributions from various sources of CH4. Hence, with the updated isotopic signatures for specific sources such as ONG industry, the previous conclusions on global contribution/flux of CH4 from ONG industry may need to be revised (Schwietzke et al., 2016). In comparison with previous studies, the δ13C values from ONG industry in our work (−25.66 ‰, mean values of the 11 stations) are higher, especially different from the global flux-weighted averaged by Schwietzke et al. (Schwietzke et al., 2016). By incorporation of flux contribution from Chinese ONG industry, isotope signatures as well as global datasets utilized in the previous work (Schwietzke et al., 2016), we conducted a sensitivity analysis, examining the effect on diverse source contributions (in flux) when updated the δ13C-CH4 from Chinese ONG industry (Supplement, Sect. 2).
Our finding suggests that, the updated 13C isotope signature based on field observation from China would elevate global fossil fuel-derived CH4 isotopes signature by about 0.46 ‰; as a consequence, the new result would lead to a smaller contribution from global ONG industry (corresponds to an overestimation of emissions by 2.86 Tg CH4 yr−1) but a larger contribution from microbial sources. This finding is consistent with some recent research findings, such as Chandra et al. (2024), who reported that CH4 emissions decreased in fossil fuel sources, while increasing in microbial sources during 1990–2020. In Australia, CH4 emissions from agricultural ponds, which are microbial in origin, have been underestimated in national greenhouse gas inventories, indicating that actual CH4 emissions may be higher than officially reported (Malerba et al., 2022).
4.4 Feasibility and limitations
Atmosphere CH4 isotopic research has shown its power in distinguishing between microbial and fossil sources of global atmospheric CH4 trends (Basu et al., 2022; Bruhwiler et al., 2017). However, due to scarcity of observational evidence of various CH4 source signatures, large uncertainties still exist for such estimations. The objective of our research was to distinguish sources of CH4 as well as to indicate CH4 leakage strength at site-level, providing basic but convincing information for constraining CH4 leakage. With both ground- and air-based approaches, our study has demonstrated the feasibility of our sampling method and research design in studying the characteristics of CH4 sources and their influencing factors at ONG stations in SW China. Nevertheless, it is necessary to point out, that the impact of meteorological conditions and site conditions on the dampening/masking of CH4 isotope signatures in the atmosphere cannot be neglected, particularly considering the limited sampling sizes during our campaign. Therefore, the reconciliation between ground-based and atmospheric measurements as well as source partitioning remain to be further validated, given more sampling coverage both spatially and temporally. In addition, more sampling at different locations or different ONG plants would be greatly beneficial to better confirm the CH4 source isotope signature from fossil fuel industry in China.
Recently, the debates on the global atmospheric trends of CH4 levels and the driving sources are continuing (Saunois et al., 2025; Kirschke et al., 2013; Rice et al., 2016; Tibrewal et al., 2024). Overall, the decline of global mean CH4 isotopic signals seems to slightly speed up in recent years, likely supporting the importance of microbial emissions (Fisher et al., 2017). The atmospheric chemists have recently clarified the important link of air pollutants with atmospheric CH4 sink strengths, further complicating the story. For the ONG industry, previous studies have reported improvements in technology, equipment, and management practices which will assist in reducing CH4 leakage (US Environmental Protection Agency, 2012). Therefore, the contribution from ONG sources to the global CH4 budget is likely to decline. With more field observation and more up-to-date database being established, we would be able to pursue a more realistic evaluation of ONG-contributed CH4 emission inventory, providing guidance on further mitigation measures.
In this study, we examined the δ13C isotopic characteristics of air samples collected from ONG stations in the central Sichuan Basin, China. The CH4 isotopes were measured near the ground and in the air along a vertical profiles of altitudes. By comparing isotopic results across sites and among sampling locations, we found that source distributions by industrial facilities as well as processing capacity/site sizes act as the major driving factors of CH4 mixing ratios and isotopic signals, while the influence from meteorological conditions and other sources from the surrounding environment may exert less impact. Based on the Keeling plot method, we determined that the source δ13C signature of CH4 from the ONG sites ranged was −25.66 ‰, indicating a heavy δ13C of fossil fuel. In comparison with the CH4 isotopic values from the global ONG sources, our study reported generally heavier isotopic signatures. By updating the isotope signatures of Chinese ONG with our observation, we conducted a weighted calculation of flux and isotope for the global CH4 budget, suggesting that the global CH4 emissions from microbial sources may be underestimated, while those from fossil fuel sources may be overestimated. Overall, our study confirms the effectiveness of isotope method in distinguishing industrial CH4 sources and sheds light to the global estimation of CH4 budgets utilizing the isotope geochemistry approach.
All the data published in this work could be accessed upon request from the corresponding author.
The supplement related to this article is available online at https://doi.org/10.5194/acp-25-11407-2025-supplement.
DC and YL conceptualized the study, with guidance from LY, DC and YL conducted the field observation and sample analysis, with the help from ZN, AW and XP. YH contributed data for the global literature analysis. DC, YL and LY wrote the manuscript together. All coauthors reviewed and contributed to the revision and finalization of the manuscript.
The contact author has declared that none of the authors has any competing interests.
Publisher's note: Copernicus Publications remains neutral with regard to jurisdictional claims made in the text, published maps, institutional affiliations, or any other geographical representation in this paper. While Copernicus Publications makes every effort to include appropriate place names, the final responsibility lies with the authors. Also, please note that this paper has not received English language copy-editing.
This article is part of the special issue “Greenhouse gas monitoring in the Asia–Pacific region (ACP/AMT/GMD inter-journal SI)”. It is a result of the 4th China Greenhouse Gas Monitoring Symposium, Nanjing, China, 2–3 November 2024.
The authors gratefully acknowledge the editor and three referees for their constructive comments. The authors are grateful for the kind support from staff members in ONG plants from SW China.
This research has been supported by the Scientific Research Start-up Funds (QD2022010C) and the Crossdisciplinary Research and Innovation Fund Research Plan (Grant No. JC2022010) from Tsinghua Shenzhen International Graduate School. Longfei Yu thanks for the support from the Tianchi Talent Programme of Xinjiang Uygur Autonomous Region.
This paper was edited by Eliza Harris and reviewed by three anonymous referees.
Akritas, M. G. and Bershady, M. A.: Linear Regression for Astronomical Data with Measurement Errors and Intrinsic Scatter, The Astrophysical Journal, 470, 177901, https://doi.org/10.48550/arXiv.astro-ph/9605002, 1996.
Ali, H., Odeh, M., Odeh, A., Abou-ElNour, A. A., and Tarique, M.: Unmanned Aerial Vehicular System for Greenhouse Gas Measurement and Automatic Landing, Netw. Protoc. Algorithms, 9, 56–76, https://doi.org/10.5296/npa.v9i3-4.12319, 2017.
Al-Shalan, A., Lowry, D., Fisher, R. E., Nisbet, E. G., Zazzeri, G., Al-Sarawi, M., and France, J. L.: Methane emissions in Kuwait: Plume identification, isotopic characterisation and inventory verification, Atmospheric Environment, 268, 118763, https://doi.org/10.1016/j.atmosenv.2021.118763, 2022.
Andersen, T., Zhao, Z., de Vries, M., Necki, J., Swolkien, J., Menoud, M., Röckmann, T., Roiger, A., Fix, A., Peters, W., and Chen, H.: Local-to-regional methane emissions from the Upper Silesian Coal Basin (USCB) quantified using UAV-based atmospheric measurements, Atmos. Chem. Phys., 23, 5191–5216, https://doi.org/10.5194/acp-23-5191-2023, 2023.
Anifowose, B. and Odubela, M.: Methane emissions from oil and gas transport facilities – exploring innovative ways to mitigate environmental consequences, Journal of Cleaner Production, 92, 121–133, https://doi.org/10.1016/j.jclepro.2014.12.066, 2015.
Anifowose, B., Lawler, D., van der Horst, D., and Chapman, L.: Evaluating interdiction of oil pipelines at river crossings using Environmental Impact Assessments, Area, 46, 4–17, https://doi.org/10.1111/area.12065, 2014.
Ars, S., Arismendi, G. G., Muehlenbachs, K., Worthy, D. E. J., and Vogel, F.: Using in situ measurements of δ13C in methane to investigate methane emissions from the western Canada sedimentary basin, Atmospheric Environment: X, 23, 100286, https://doi.org/10.1016/j.aeaoa.2024.100286, 2024.
Barthold, F. K., Tyralla, C., Schneider, K., Vaché, K. B., Frede, H.-G., and Breuer, L.: How many tracers do we need for end member mixing analysis (EMMA)? A sensitivity analysis, Water Resources Research, 47, https://doi.org/10.1029/2011WR010604, 2011.
Basu, S., Lan, X., Dlugokencky, E., Michel, S., Schwietzke, S., Miller, J. B., Bruhwiler, L., Oh, Y., Tans, P. P., Apadula, F., Gatti, L. V., Jordan, A., Necki, J., Sasakawa, M., Morimoto, S., Di Iorio, T., Lee, H., Arduini, J., and Manca, G.: Estimating emissions of methane consistent with atmospheric measurements of methane and δ13C of methane, Atmos. Chem. Phys., 22, 15351–15377, https://doi.org/10.5194/acp-22-15351-2022, 2022.
Bruhwiler, L. M., Basu, S., Bergamaschi, P., Bousquet, P., Dlugokencky, E., Houweling, S., Ishizawa, M., Kim, H.-S., Locatelli, R., Maksyutov, S., Montzka, S., Pandey, S., Patra, P. K., Petron, G., Saunois, M., Sweeney, C., Schwietzke, S., Tans, P., and Weatherhead, E. C.: U.S. CH4 emissions from oil and gas production: Have recent large increases been detected?, Journal of Geophysical Research: Atmospheres, 122, 4070-4083, https://doi.org/10.1002/2016JD026157, 2017.
Bugaets, A., Gartsman, B., Gubareva, T., Lupakov, S., Kalugin, A., Shamov, V., and Gonchukov, L.: Comparing the Runoff Decompositions of Small Experimental Catchments: End-Member Mixing Analysis (EMMA) vs. Hydrological Modelling, Water, 15, 752, https://doi.org/10.3390/w15040752, 2023.
Burnham, A., Han, J., Clark, C. E., Wang, M., Dunn, J. B., and Palou-Rivera, I.: Life-cycle greenhouse gas emissions of shale gas, natural gas, coal, and petroleum, Environmental science & technology, 46, 619–627, https://doi.org/10.1021/es201942m, 2012.
Cai, C., Zhang, C., He, H., and Tang, Y.: Carbon isotope fractionation during methane-dominated TSR in East Sichuan Basin gasfields, China: A review, Marine and Petroleum Geology, 48, 100–110, https://doi.org/10.1016/j.marpetgeo.2013.08.006, 2013.
Chandra, N., Patra, P. K., Fujita, R., Höglund-Isaksson, L., Umezawa, T., Goto, D., Morimoto, S., Vaughn, B. H., and Röckmann, T.: Methane emissions decreased in fossil fuel exploitation and sustainably increased in microbial source sectors during 1990–2020, Communications Earth & Environment, 5, 147, https://doi.org/10.1038/s43247-024-01286-x, 2024.
Chen, L., Pang, X., Wu, Z., Huang, R., Hu, J., Liu, Y., Zhou, L., Zhou, J., and Wang, Z.: Unmanned aerial vehicles equipped with sensor packages to study spatiotemporal variations of air pollutants in industry parks, Philosophical Transactions of the Royal Society A: Mathematical, Physical and Engineering Sciences, 382, 20230314, https://doi.org/10.1098/rsta.2023.0314, 2024.
Dai, J., Qi, H., and Song, Y.: Primary discussion of some parameters for identification of coal-and oil-type gases, Acta Petrolei Sinica, 6, 31–38, 1985 (in Chinese with English Abstract).
Dai, J., Pei, X., and Qi, H.: Natural Gas Geology of China, Beijing: Petroleum Industry Press, 1, 42–46, 1992 (in Chinese with English Abstract).
Dai, J., Yang, S., Chen, H., and Shen, X.: Geochemistry and occurrence of inorganic gas accumulations in Chinese sedimentary basins, Organic Geochemistry, 36, 1664–1688, https://doi.org/10.1016/j.orggeochem.2005.08.007, 2005.
Defratyka, S. M., Paris, J.-D., Yver-Kwok, C., Fernandez, J. M., Korben, P., and Bousquet, P.: Mapping Urban Methane Sources in Paris, France, Environmental Science & Technology, 55, 8583–8591, https://doi.org/10.1021/acs.est.1c00859, 2021.
Dlugokencky, E. J., Nisbet, E. G., Fisher, R., and Lowry, D.: Global atmospheric methane: budget, changes and dangers, Philosophical Transactions of the Royal Society A: Mathematical, Physical and Engineering Sciences, 369, 2058–2072, https://doi.org/10.1098/rsta.2010.0341, 2011.
Fernandez, R., Petrusak, R., Robinson, D., and Zavadil, D.: Cost-Effective Methane Emissions Reductions for Small and Midsize Natural Gas Producers, Journal of Petroleum Technology, 57, 34–42, https://doi.org/10.2118/0605-0034-JPT, 2005.
Fisher, R. E., Sriskantharajah, S., Lowry, D., Lanoisellé, M., Fowler, C. M. R., James, R. H., Hermansen, O., Lund Myhre, C., Stohl, A., Greinert, J., Nisbet-Jones, P. B. R., Mienert, J., and Nisbet, E. G.: Arctic methane sources: Isotopic evidence for atmospheric inputs, Geophysical Research Letters, 38, https://doi.org/10.1029/2011GL049319, 2011.
Fisher, R. E., France, J. L., Lowry, D., Lanoisellé, M., Brownlow, R., Pyle, J. A., Cain, M., Warwick, N., Skiba, U. M., Drewer, J., Dinsmore, K. J., Leeson, S. R., Bauguitte, S. J.-B., Wellpott, A., O'Shea, S. J., Allen, G., Gallagher, M. W., Pitt, J., Percival, C. J., Bower, K., George, C., Hayman, G. D., Aalto, T., Lohila, A., Aurela, M., Laurila, T., Crill, P. M., McCalley, C. K., and Nisbet, E. G.: Measurement of the 13C isotopic signature of methane emissions from northern European wetlands, Global Biogeochemical Cycles, 31, 605–623, https://doi.org/10.1002/2016GB005504, 2017.
France, J. L., Cain, M., Fisher, R. E., Lowry, D., Allen, G., O'Shea, S. J., Illingworth, S., Pyle, J., Warwick, N., Jones, B. T., Gallagher, M. W., Bower, K., Le Breton, M., Percival, C., Muller, J., Welpott, A., Bauguitte, S., George, C., Hayman, G. D., Manning, A. J., Myhre, C. L., Lanoisellé, M., and Nisbet, E. G.: Measurements of δ13C in CH4 and using particle dispersion modeling to characterize sources of Arctic methane within an air mass, Journal of Geophysical Research: Atmospheres, 121, 14257–14270, https://doi.org/10.1002/2016JD026006, 2016.
Geum, S., Park, H., Choi, H., Kim, Y., Lee, H., Joo, S., Oh, Y.-S., Michel, S. E., and Park, S.: Identifying emission sources of CH4 in East Asia based on in-situ observations of atmospheric δ13C-CH4 and C2H6, Science of The Total Environment, 908, 168433, https://doi.org/10.1016/j.scitotenv.2023.168433, 2024.
Han, T., Xie, C., Yang, Y., Zhang, Y., Huang, Y., Liu, Y., Chen, K., Sun, H., Zhou, J., Liu, C., Guo, J., Wu, Z., and Li, S.-M.: Spatial mapping of greenhouse gases using a UAV monitoring platform over a megacity in China, Science of The Total Environment, 951, 175428, https://doi.org/10.1016/j.scitotenv.2024.175428, 2024.
Hmiel, B., Petrenko, V. V., Dyonisius, M. N., Buizert, C., Smith, A. M., Place, P. F., Harth, C., Beaudette, R., Hua, Q., Yang, B., Vimont, I., Michel, S. E., Severinghaus, J. P., Etheridge, D., Bromley, T., Schmitt, J., Faïn, X., Weiss, R. F., and Dlugokencky, E.: Preindustrial 14CH4 indicates greater anthropogenic fossil CH4 emissions, Nature, 578, 409–412, https://doi.org/10.1038/s41586-020-1991-8, 2020.
Huang, S., Feng, Z., Gu, T., Gong, D., Peng, W., and Yuan, M.: Multiple origins of the Paleogene natural gases and effects of secondary alteration in Liaohe Basin, northeast China: Insights from the molecular and stable isotopic compositions, International Journal of Coal Geology, 172, 134–148, https://doi.org/10.1016/j.coal.2017.01.009, 2017.
Intergovernmental Panel on Climate Change: Climate Chang 2021 The Physical Science Basis, Cambridge University Press, Cambridge, United Kingdom and New York, NY, USA, 1017, 2021.
International Energy Agency: Global Methane Tracker, https://www.iea.org/reports/global-methane-tracker-2024 (last access: 12 June 2025), 2024.
Kavitha, M. and Nair, P. R.: Non-homogeneous vertical distribution of methane over Indian region using surface, aircraft and satellite based data, Atmospheric Environment, 141, 174–185, https://doi.org/10.1016/j.atmosenv.2016.06.068, 2016.
Keeling, C. D.: The concentration and isotopic abundances of atmospheric carbon dioxide in rural areas, Geochimica et Cosmochimica Acta, 13, 322–334, https://doi.org/10.1016/0016-7037(58)90033-4, 1958.
Kim, H., Kim, K. T., Jeong, S., Lee, Y. S., Zhao, X., and Kim, J. Y.: Enhancing Uncrewed Aerial Vehicle Techniques for Monitoring Greenhouse Gas Plumes at Point Sources, Atmospheric Environment, 342, 120924, https://doi.org/10.1016/j.atmosenv.2024.120924, 2025.
Kirschke, S., Bousquet, P., Ciais, P., Saunois, M., Canadell, J. G., Dlugokencky, E. J., Bergamaschi, P., Bergmann, D., Blake, D. R., Bruhwiler, L., Cameron-Smith, P., Castaldi, S., Chevallier, F., Feng, L., Fraser, A., Heimann, M., Hodson, E. L., Houweling, S., Josse, B., Fraser, P. J., Krummel, P. B., Lamarque, J.-F., Langenfelds, R. L., Le Quéré, C., Naik, V., O'Doherty, S., Palmer, P. I., Pison, I., Plummer, D., Poulter, B., Prinn, R. G., Rigby, M., Ringeval, B., Santini, M., Schmidt, M., Shindell, D. T., Simpson, I. J., Spahni, R., Steele, L. P., Strode, S. A., Sudo, K., Szopa, S., van der Werf, G. R., Voulgarakis, A., van Weele, M., Weiss, R. F., Williams, J. E., and Zeng, G.: Three decades of global methane sources and sinks, Nature Geoscience, 6, 813–823, https://doi.org/10.1038/ngeo1955, 2013.
Kuhlmann, G., Stavropoulou, F., Schwietzke, S., Zavala-Araiza, D., Thorpe, A., Hueni, A., Emmenegger, L., Calcan, A., Röckmann, T., and Brunner, D.: Evidence of successful methane mitigation in one of Europe's most important oil production region, Atmos. Chem. Phys., 25, 5371–5385, https://doi.org/10.5194/acp-25-5371-2025, 2025.
Lauvaux, T., Giron, C., Mazzolini, M., d'Aspremont, A., Duren, R., Cusworth, D., Shindell, D., and Ciais, P.: Global assessment of oil and gas methane ultra-emitters, Science, 375, 557–561, https://doi.org/10.1126/science.abj4351, 2022.
Leitner, S., Hood-Nowotny, R., and Watzinger, A.: Successive and automated stable isotope analysis of CO2, CH4 and N2O paving the way for unmanned aerial vehicle-based sampling, Rapid Communications in Mass Spectrometry, 34, e8929, https://doi.org/10.1002/rcm.8929, 2020.
Leitner, S., Feichtinger, W., Mayer, S., Mayer, F., Krompetz, D., Hood-Nowotny, R., and Watzinger, A.: UAV-based sampling systems to analyse greenhouse gases and volatile organic compounds encompassing compound-specific stable isotope analysis, Atmos. Meas. Tech., 16, 513–527, https://doi.org/10.5194/amt-16-513-2023, 2023.
Liu, Q., Wu, X., Wang, X., Jin, Z., Zhu, D., Meng, Q., Huang, S., Liu, J., and Fu, Q.: Carbon and hydrogen isotopes of methane, ethane, and propane: A review of genetic identification of natural gas, Earth-Science Reviews, 190, 247–272, https://doi.org/10.1016/j.earscirev.2018.11.017, 2019.
Liu, S.: Development of a UAV-based system to monitor air quality over an oil field, Graduate Theses & Non-Theses, Montana Technological University, 187, 2018.
Liu, S., Yang, X., and Zhou, X.: Development of a low-cost UAV-based system for CH4 monitoring over oil fields, Environmental Technology, 42, 3154–3163, https://doi.org/10.1080/09593330.2020.1724199, 2021.
Lu, X., Harris, S. J., Fisher, R. E., France, J. L., Nisbet, E. G., Lowry, D., Röckmann, T., van der Veen, C., Menoud, M., Schwietzke, S., and Kelly, B. F. J.: Isotopic signatures of major methane sources in the coal seam gas fields and adjacent agricultural districts, Queensland, Australia, Atmos. Chem. Phys., 21, 10527–10555, https://doi.org/10.5194/acp-21-10527-2021, 2021.
Malerba, M. E., de Kluyver, T., Wright, N., Schuster, L., and Macreadie, P. I.: Methane emissions from agricultural ponds are underestimated in national greenhouse gas inventories, Communications Earth & Environment, 3, 306, https://doi.org/10.1038/s43247-022-00638-9, 2022.
McGowan, H. and Clark, A.: Identification of dust transport pathways from Lake Eyre, Australia using Hysplit, Atmospheric Environment, 42, 6915–6925, https://doi.org/10.1016/j.atmosenv.2008.05.053, 2008.
Menoud, M., van der Veen, C., Maazallahi, H., Hensen, A., Velzeboer, I., van den Bulk, P., Delre, A., Korben, P., Schwietzke, S., Ardelean, M., Calcan, A., Etiope, G., Baciu, C., Scheutz, C., Schmidt, M., and Röckmann, T.: CH4 isotopic signatures of emissions from oil and gas extraction sites in Romania, Elementa: Science of the Anthropocene, 10, https://doi.org/10.1525/elementa.2021.00092, 2022.
Michel, S. E., Lan, X., Miller, J., Tans, P., Clark, J. R., Schaefer, H., Sperlich, P., Brailsford, G., Morimoto, S., Moossen, H., and Li, J.: Rapid shift in methane carbon isotopes suggests microbial emissions drove record high atmospheric methane growth in 2020–2022, Proceedings of the National Academy of Sciences, 121, e2411212121, https://doi.org/10.1073/pnas.2411212121, 2024.
Milkov, A. V., Schwietzke, S., Allen, G., Sherwood, O. A., and Etiope, G.: Using global isotopic data to constrain the role of shale gas production in recent increases in atmospheric methane, Scientific Reports, 10, 4199, https://doi.org/10.1038/s41598-020-61035-w, 2020.
Montzka, S. A., Dlugokencky, E. J., and Butler, J. H.: Non-CO2 greenhouse gases and climate change, Nature, 476, 43–50, https://doi.org/10.1038/nature10322, 2011.
Moreira, M., Sternberg, L., Martinelli, L., Victoria, R., Barbosa, E., Bonates, L., and Nepstad, D.: Contribution of transpiration to forest ambient vapour based on isotopic measurements, Global Change Biology, 3, 439–450, https://doi.org/10.1046/j.1365-2486.1997.00082.x, 1997.
Nisbet, E. G., Manning, M. R., Lowry, D., Fisher, R. E., Lan, X., Michel, S. E., France, J. L., Nisbet, R. E. R., Bakkaloglu, S., Leitner, S. M., Brooke, C., Röckmann, T., Allen, G., Denier van der Gon, H. A. C., Merbold, L., Scheutz, C., Woolley Maisch, C., Nisbet-Jones, P. B. R., Alshalan, A., Fernandez, J. M., and Dlugokencky, E. J.: Practical paths towards quantifying and mitigating agricultural methane emissions, Proceedings of the Royal Society A: Mathematical, Physical and Engineering Sciences, 481, 20240390, https://doi.org/10.1098/rspa.2024.0390, 2025.
Omara, M., Sullivan, M. R., Li, X., Subramanian, R., Robinson, A. L., and Presto, A. A.: Methane emissions from conventional and unconventional natural gas production sites in the Marcellus Shale Basin, Environmental science & technology, 50, 2099–2107, https://doi.org/10.1021/acs.est.5b05503, 2016.
Pataki, D. E., Ehleringer, J. R., Flanagan, L. B., Yakir, D., Bowling, D. R., Still, C. J., Buchmann, N., Kaplan, J. O., and Berry, J. A.: The application and interpretation of Keeling plots in terrestrial carbon cycle research, Global Biogeochemical Cycles, 17, https://doi.org/10.1029/2001GB001850, 2003.
Peng, L., Ti, C., Yin, B., Dong, W., Li, M., Tao, L., and Yan, X.: Traceability of atmospheric ammonia in a suburban area of the Beijing-Tianjin-Hebei region, Science of The Total Environment, 907, 167935, https://doi.org/10.1016/j.scitotenv.2023.167935, 2024.
The People's Government of Sichuan Province: Energy Resources, https://www.sc.gov.cn/10462/10778/10876/2021/1/4/abbdfe3e4cb943d885236f623361caf7.shtml#:~:text=%E6%B2%B9%E6%B0%94%E8%B5%84%E6%BA%90%E4%BB%A5%E5%A4%A9%E7%84%B6%E6%B0%94,%E5%8C%BA%E3%80%81%E5%B7%9D%E4%B8%9C%E5%8C%97%E7%89%87%E5%8C%BA%E3%80%82 (last access: 12 June 2025), 2025.
Pereira, A. P. M. F., Rodrigues, L. A. d. C., Santos, E. A. d., Cardoso, T. A. d. O., and Cohen, S. C.: CBRN events management and the use of the Hysplit model: an integrative literature review, Saúde em Debate, 43, 925–938, https://doi.org/10.1590/0103-1104201912221, 2019.
Rella, C. W., Hoffnagle, J., He, Y., and Tajima, S.: Local- and regional-scale measurements of CH4, δ13CH4, and C2H6 in the Uintah Basin using a mobile stable isotope analyzer, Atmos. Meas. Tech., 8, 4539–4559, https://doi.org/10.5194/amt-8-4539-2015, 2015.
Rice, A. L., Butenhoff, C. L., Teama, D. G., Röger, F. H., Khalil, M. A. K., and Rasmussen, R. A.: Atmospheric methane isotopic record favors fossil sources flat in 1980s and 1990s with recent increase, Proceedings of the National Academy of Sciences, 113, 10791–10796, https://doi.org/10.1073/pnas.1522923113, 2016.
Saunois, M., Martinez, A., Poulter, B., Zhang, Z., Raymond, P. A., Regnier, P., Canadell, J. G., Jackson, R. B., Patra, P. K., Bousquet, P., Ciais, P., Dlugokencky, E. J., Lan, X., Allen, G. H., Bastviken, D., Beerling, D. J., Belikov, D. A., Blake, D. R., Castaldi, S., Crippa, M., Deemer, B. R., Dennison, F., Etiope, G., Gedney, N., Höglund-Isaksson, L., Holgerson, M. A., Hopcroft, P. O., Hugelius, G., Ito, A., Jain, A. K., Janardanan, R., Johnson, M. S., Kleinen, T., Krummel, P. B., Lauerwald, R., Li, T., Liu, X., McDonald, K. C., Melton, J. R., Mühle, J., Müller, J., Murguia-Flores, F., Niwa, Y., Noce, S., Pan, S., Parker, R. J., Peng, C., Ramonet, M., Riley, W. J., Rocher-Ros, G., Rosentreter, J. A., Sasakawa, M., Segers, A., Smith, S. J., Stanley, E. H., Thanwerdas, J., Tian, H., Tsuruta, A., Tubiello, F. N., Weber, T. S., van der Werf, G. R., Worthy, D. E. J., Xi, Y., Yoshida, Y., Zhang, W., Zheng, B., Zhu, Q., Zhu, Q., and Zhuang, Q.: Global Methane Budget 2000–2020, Earth Syst. Sci. Data, 17, 1873–1958, https://doi.org/10.5194/essd-17-1873-2025, 2025.
Schoell, M.: The hydrogen and carbon isotopic composition of methane from natural gases of various origins, Geochimica et Cosmochimica Acta, 44, 649–661, https://doi.org/10.1016/0016-7037(80)90155-6, 1980.
Schwietzke, S., Sherwood, O. A., Bruhwiler, L. M. P., Miller, J. B., Etiope, G., Dlugokencky, E. J., Michel, S. E., Arling, V. A., Vaughn, B. H., White, J. W. C., and Tans, P. P.: Upward revision of global fossil fuel methane emissions based on isotope database, Nature, 538, 88–91, https://doi.org/10.1038/nature19797, 2016.
Shan, W., Yin, Y., Lu, H., and Liang, S.: A meteorological analysis of ozone episodes using HYSPLIT model and surface data, Atmospheric Research, 93, 767–776, https://doi.org/10.1016/j.atmosres.2009.03.007, 2009.
Shaw, J. T., Shah, A., Yong, H., and Allen, G.: Methods for quantifying methane emissions using unmanned aerial vehicles: A review, Philosophical Transactions of the Royal Society A, 379, 20200450, https://doi.org/10.1098/rsta.2020.0450, 2021.
Sherwood Lollar, B., Westgate, T., Ward, J., Slater, G., and Lacrampe-Couloume, G.: Abiogenic formation of alkanes in the Earth's crust as a minor source for global hydrocarbon reservoirs, Nature, 416, 522–524, https://doi.org/10.1038/416522a, 2002.
Sichuan Provincial Bureau of Statistics: National data, https://tjj.sc.gov.cn/scstjj/c111701/common_list.shtml (last access: 12 June 2025), 2025.
Skeie, R. B., Hodnebrog, Ø., and Myhre, G.: Trends in atmospheric methane concentrations since 1990 were driven and modified by anthropogenic emissions, Communications Earth & Environment, 4, 317, https://doi.org/10.1038/s43247-023-00969-1, 2023.
Stein, A. F., Draxler, R. R., Rolph, G. D., Stunder, B. J. B., Cohen, M. D., and Ngan, F.: NOAA's HYSPLIT Atmospheric Transport and Dispersion Modeling System, Bulletin of the American Meteorological Society, 96, 2059-2077, https://doi.org/10.1175/BAMS-D-14-00110.1, 2015.
Sun, S., Ma, L., and Li, Z.: A Source-Level Estimation and Uncertainty Analysis of Methane Emission in China's Oil and Natural Gas Sector, Energies, 15, 3684, https://doi.org/10.3390/en15103684, 2022.
Suzuki, Y.: Achieving food authenticity and traceability using an analytical method focusing on stable isotope analysis, Analytical Sciences, 37, 189–199, https://doi.org/10.2116/analsci.20SAR14, 2021.
Thom, M., Bösinger, R., Schmidt, M., and Levin, I.: The regional budget of atmospheric methane of a highly populated area, Chemosphere, 26, 143–160, https://doi.org/10.1016/0045-6535(93)90418-5, 1993.
Tian, H., Lu, C., Ciais, P., Michalak, A. M., Canadell, J. G., Saikawa, E., Huntzinger, D. N., Gurney, K. R., Sitch, S., Zhang, B., Yang, J., Bousquet, P., Bruhwiler, L., Chen, G., Dlugokencky, E., Friedlingstein, P., Melillo, J., Pan, S., Poulter, B., Prinn, R., Saunois, M., Schwalm, C. R., and Wofsy, S. C.: The terrestrial biosphere as a net source of greenhouse gases to the atmosphere, Nature, 531, 225–228, https://doi.org/10.1038/nature16946, 2016.
Tibrewal, K., Ciais, P., Saunois, M., Martinez, A., Lin, X., Thanwerdas, J., Deng, Z., Chevallier, F., Giron, C., and Albergel, C.: Assessment of methane emissions from oil, gas and coal sectors across inventories and atmospheric inversions, Communications Earth & Environment, 5, 26, https://doi.org/10.1038/s43247-023-01190-w, 2024.
Townsend-Small, A., Ferrara, T. W., Lyon, D. R., Fries, A. E., and Lamb, B. K.: Emissions of coalbed and natural gas methane from abandoned oil and gas wells in the United States, Geophysical Research Letters, 43, 2283–2290, https://doi.org/10.1002/2015GL067623, 2016.
Tyler, S. C.: Stable carbon isotope ratios in atmospheric methane and some of its sources, Journal of Geophysical Research: Atmospheres, 91, 13232–13238, https://doi.org/10.1029/JD091iD12p13232, 1986.
US Environmental Protection Agency: Summary Report: Global Anthropogenic Non-CO2 Greenhouse Gas Emissions: 1990–2030: https://nepis.epa.gov/Exe/ZyPDF.cgi/P100FE8H.PDF?Dockey=P100FE8H.PDF (last access: 12 June 2025), 2012.
Wang, Y., Chen, J., Pang, X., Zhang, B., Chen, Z., Zhang, G., Luo, G., and He, L.: Origin of deep sour natural gas in the Ordovician carbonate reservoir of the Tazhong Uplift, Tarim Basin, northwest China: Insights from gas geochemistry and formation water, Marine and Petroleum Geology, 91, 532–549, https://doi.org/10.1016/j.marpetgeo.2018.01.029, 2018.
Zazzeri, G., Lowry, D., Fisher, R. E., France, J. L., Lanoisellé, M., and Nisbet, E. G.: Plume mapping and isotopic characterisation of anthropogenic methane sources, Atmospheric Environment, 110, 151–162, https://doi.org/10.1016/j.atmosenv.2015.03.029, 2015.
Zhang, B., Chen, G. Q., Li, J. S., and Tao, L.: Methane emissions of energy activities in China 1980–2007, Renewable and Sustainable Energy Reviews, 29, 11–21, https://doi.org/10.1016/j.rser.2013.08.060, 2014.
Zhang, S. and Zhu, G.: Natural gas origins of large and medium-scale gas fields in China sedimentary basins, Science in China Series D: Earth Sciences, 51, 1–13, https://doi.org/10.1007/s11430-008-5013-1, 2008.
Zhang, S., He, K., Hu, G., Mi, J., Ma, Q., Liu, K., and Tang, Y.: Unique chemical and isotopic characteristics and origins of natural gases in the Paleozoic marine formations in the Sichuan Basin, SW China: Isotope fractionation of deep and high mature carbonate reservoir gases, Marine and Petroleum Geology, 89, 68–82, https://doi.org/10.1016/j.marpetgeo.2017.02.010, 2018.
Zhao, Y., Zheng, B., Saunois, M., Ciais, P., Hegglin, M. I., Lu, S., Li, Y., and Bousquet, P.: Air pollution modulates trends and variability of the global methane budget, Nature, 642, 369–375, https://doi.org/10.1038/s41586-025-09004-z, 2025.
Zhu, G., Wang, Z., Dai, J., and Su, J.: Natural gas constituent and carbon isotopic composition in petroliferous basins, China, Journal of Asian Earth Sciences, 80, 1–17, https://doi.org/10.1016/j.jseaes.2013.10.007, 2014.
Zou, Y.-R., Cai, Y., Zhang, C., Zhang, X., and Peng, P. A.: Variations of natural gas carbon isotope-type curves and their interpretation – A case study, Organic Geochemistry, 38, 1398–1415, https://doi.org/10.1016/j.orggeochem.2007.03.002, 2007.