the Creative Commons Attribution 4.0 License.
the Creative Commons Attribution 4.0 License.
 | 25 Sep 2025
Warm-phase microphysical evolution in large-eddy simulations of tropical cumulus congestus: evaluating drop size distribution evolution using polarimetry retrievals, in situ measurements, and a thermal-based framework
McKenna W. Stanford
Ann M. Fridlind
Andrew S. Ackerman
Bastiaan van Diedenhoven
Qian Xiao
Jian Wang
Toshihisa Matsui
Daniel Hernandez-Deckers
Paul Lawson
Owing to uncertainties in convective microphysics processes, improving parameterizations in Earth system models (ESMs) can benefit from observationally constrained cases suitable for scaling between cloud-resolving models and ESMs. We propose a benchmark large-eddy simulation (LES) cumulus congestus case study from the NASA Cloud, Aerosol, and Monsoon Processes Philippines Experiment (CAMP2Ex) for evaluating and improving ESMs in single-column model (SCM) mode. We seek observational constraints using novel polarimetric retrievals and in situ cloud microphysics measurements. Simulations using bulk and bin microphysics initialized with observed aerosol profiles are compared to cloud-top retrievals of cloud droplet effective radius (Reff), effective variance (νeff), and number concentration (Nd) from the airborne Research Scanning Polarimeter (RSP). Both schemes reproduce characteristics of cloud-top Nd and Reff that increase and decrease with altitude, respectively. Cloud-top Nd is low-biased relative to RSP retrievals in both schemes, potentially due to limitations in both simulations and retrieval assumptions. Cloud-top Reff is low-biased in the bulk scheme but reasonably reproduced by the bin scheme. Profiles of Nd and Reff are sensitive to the collision–coalescence process and the vertical variation in aerosol size distribution. Comparison of simulated and in situ droplet size distributions (DSDs) shows that, to first order, integrated moments are always sensitive to sizes µm and can also be sensitive to larger sizes if the DSDs are sufficiently broad, with implications for the assumed maximum observed size retrieved by the RSP. The bin scheme captures the observed extended tail of the DSD, while the bulk scheme is unable to due to parametric constraints. Differences in expected relationships between in situ measurements of cloud cores and cloud-top retrievals by RSP demonstrate difficulty in constraining well the case presented herein. Finally, a thermal-tracking framework demonstrates that the dilution of Nd throughout a thermal's lifetime is heavily determined by collision–coalescence and the height-varying aerosol distribution and that, in the absence of these, the impact of entrainment on diluting Nd is largely offset by secondary activation. Implications for evaluating warm-phase convective microphysics schemes in ESMs and translating results for use on global, space-based polarimetry platforms are discussed.
- Article
(12319 KB) - Full-text XML
- BibTeX
- EndNote


Cumulus congestus clouds play an important role in the global water and energy budget. In the tropics, they represent the intermediate mode of the trimodal tropical convection distribution in between shallow trade-wind cumuli and deep convection (Johnson et al., 1999). Definitions vary in the literature, but cumulus congestus generally have cloud-top heights (CTHs) between 4 and 8 km that either are stabilized at around the 0 °C level (so-called “terminal congestus”) or penetrate the 0 °C level with sustained vertical growth (“transient congestus”). Wall et al. (2013) showed, using 5 years of CloudSat profiles, that congestus contribute up to 12 % of the total cloud population in the tropics and up to 18 % of all clouds with tops lower than 8 km over regions such as the Amazon, central Africa, and the maritime continent. During the Tropical Ocean Global Atmosphere Coupled Ocean Atmosphere Response Experiment (TOGA-COARE) field campaign (Webster and Lukas, 1992) conducted over the western Pacific warm pool, Johnson et al. (1999) concluded that 57 % of precipitating convective clouds were identified as congestus and contributed to 28 % of total convective rainfall. Transient congestus, which were shown to account for ∼30 %–40 % of congestus clouds observed by CloudSat by Luo et al. (2009), are also important for promoting growth to deeper convective clouds (Kuang and Bretherton, 2006; Waite and Khouider, 2010; Hohenegger and Stevens, 2013). Understanding their dynamical and microphysical evolution is therefore crucial for developing cumulus and convection parameterizations for large-scale models that account for their contributions to global precipitation and role in redistributing heat, momentum, aerosol, and moisture throughout the troposphere.
Mechanistically, congestus dynamics and microphysics are intricately linked. Cumulus clouds are composed of numerous thermals with relatively short lifetimes (3–5 min; Hernandez-Deckers and Sherwood, 2016, 2018; Matsui et al., 2024) that successively rise to the thermodynamic neutral buoyancy level, unless their ascent is precluded by the effects of dry-air entrainment. Supersaturation in these thermals acts as the primary source of condensation. However, thermals generate toroidal circulations that enhance cloud dilution on the inflow branch via entrainment of relatively dry environmental air, therefore additionally acting to evaporate condensate (e.g., Lasher-Trapp et al., 2005; Moser and Lasher-Trapp, 2017; Morrison et al., 2020; Peters et al., 2020; Pardo et al., 2020). Chandrakar et al. (2021) used a detailed Lagrangian microphysics model to simulate relatively shallow cumulus (CTHs<5 km) and found that entrainment of aerosols by thermal circulations also played a significant role in secondary activation (activation of cloud droplets above the cloud base). Entrainment and secondary activation are two mechanisms that contribute to the broadening of drop size distributions (DSDs) with altitude as a thermal rises, in addition to the collision–coalescence process and condensational growth. DSD broadening with height has been evaluated extensively in large-eddy simulation (LES) of cumulus (e.g., Lasher-Trapp et al., 2005; Cooper, 1989; Grabowski and Abade, 2017; Morrison et al., 2018; Chandrakar et al., 2021), is supported by theory (Cooper, 1989), and has been documented observationally in cumulus clouds (Warner, 1969; Manton, 1979; Lawson et al., 2015, 2017, 2022). Broadening mechanisms additionally impact ice production through ice multiplication processes. Laboratory studies of secondary ice production by a drop-shattering process indicate more numerous tiny splinters emitted during multiplication and more frequent fragmentation with increased size of the frozen drop (e.g., Phillips et al., 2018; Lauber et al., 2018). Because DSD broadening is generally coincident with the production of larger drop sizes that reach the drizzle size regime, the initiation of ice multiplication once the drops are lofted may be dependent on the efficiency of the broadening mechanism. Indeed, Lawson et al. (2015, 2017, 2022) showed observational evidence of fractured frozen drops and spicules, which are indicative of a drop-shattering event (Keinert et al., 2020), in aircraft measurements of tropical cumulus congestus where DSD broadening with height was also observed. On the other hand, copious ice production was not observed in a high-based congestus case sampled over the United Arab Emirates (UAE) shown in Morrison et al. (2022) where DSDs never showed substantial precipitation-sized drops.
In this work we evaluate the microphysical evolution of a tropical cumulus congestus case study using LES and available observational constraints. Here we focus only on the liquid phase and the DSD evolution using a thermal-based framework. Future work will build on this foundation, extending evaluation to the ice phase and exploring the role of ice multiplication. The selected case was observed during the NASA Cloud, Aerosol, and Monsoon Processes Philippines Experiment (CAMP2Ex) aircraft-based field campaign (Reid et al., 2023) and is representative of a field of cumulus congestus with growing tops that eventually realize an organized structure with cloud tops reaching °C. Simulations are performed using both bulk and bin microphysics schemes and are constrained in a number of ways. First, observed aerosol particle size distributions (PSDs) are used as input to represent trimodal, lognormal distributions that vary with height. Second, large-scale thermodynamic and vertical motion conditions are harvested from a nested mesoscale simulation. Third, cloud-top drop number concentration (Nd), effective radius (Reff), and effective variance (νeff, a measure of the DSD spectral width) are constrained to the extent possible using retrievals from the airborne Research Scanning Polarimeter (RSP; Cairns et al., 1999) and in situ microphysics measurements. The multi-angle, multi-wavelength RSP measures total and polarized reflectance at the cloud top and allows retrieval of Reff and νeff using the sharply defined cloud bow at scattering angles in the rainbow region of the visible spectrum. The retrieval of both Reff and νeff gives sufficient information about the DSD to retrieve Nd with relatively few assumptions (Sinclair et al., 2019), which diverges from bi-spectral approaches where νeff is considered a constant. Importantly, more RSP retrievals were available during the CAMP2Ex campaign than in any prior campaign. To this end, we evaluate the utility of spatiotemporally expansive RSP retrievals to supplement in situ aircraft transects in representing the warm-phase microphysical evolution of congestus, which to our knowledge is the first such study to do so. Using airborne polarimetry retrievals for model evaluation is particularly relevant with the recent successful launch of the Plankton, Aerosol, Cloud, Ocean Ecosystem (PACE) satellite (Werdell et al., 2019), which includes two multi-angle polarimeters that have significantly coarser footprints relative to the airborne platform. Understanding the capabilities and limitations of these instruments will be crucial for extrapolating airborne platforms and high-resolution models to space-based platforms and global models. Finally, we incorporate a thermal-tracking framework at high temporal frequency (Hernandez-Deckers and Sherwood, 2016, 2018) to isolate microphysical processes occurring within thermals and their contribution and control over the evolving DSD.
Cloud-top Nd and Reff retrievals and in situ DSD measurements during this CAMP2Ex case study indicate agreement with past studies in which DSDs broaden with altitude, Nd decreases with height, and Reff increases with height. Sensitivity tests focus on two processes that exert potentially leading controls on such basic and widely observed profile features: (1) the efficiency of collision–coalescence and its parameterization in different warm-rain formulations and (2) the height variation of aerosol PSDs. The thermal-tracking framework then examines the role of entrainment and mixing in modulating these profiles. Morrison et al. (2022) similarly evaluated bin microphysics LES of a high-based congestus case from the UAE and compared it to in situ aircraft observations. They also examined the effects on DSD evolution of collision–coalescence and entrainment processes, as well as secondary activation, aerosol loading, and giant cloud condensation nuclei (CCN). Their simulations indicated that warm-rain generation was more controlled by the sub-cloud aerosol distributions than by activation of entrained aerosol and that dilution effects on warm-rain formation was limited under such conditions. Notably, the case they studied lacked development of large precipitation-sized drops, whereas here we investigate a case that produced substantial precipitation-sized drops. Chandrakar et al. (2024) also analyzed a CAMP2Ex congestus case using Lagrangian particle-based microphysics and found the inclusion of turbulent enhancement of collision–coalescence to be essential in representing DSD broadening and precipitation formation, with little influence of giant CCN. Herein we also consider the turbulent enhancement of collision–coalescence in the bin microphysics scheme but omit giant CCN in part for lack of observational constraints on the vertical profile and lack of evidence that they are a dominant control on profile features.
An additional key component of this work is to develop an LES case study for evaluating physics schemes in single-column model (SCM) versions of large-scale models, for example as has been demonstrated for subtropical marine stratocumulus-to-cumulus transitions (Sandu and Stevens, 2011; Neggers, 2015; Neggers et al., 2017), Arctic mixed-phase boundary-layer clouds (Klein et al., 2009; Fridlind and Ackerman, 2017), and the currently ongoing cold-air outbreak LES–SCM intercomparison project (Juliano et al., 2022). While LES intercomparison projects have been successfully carried out for case studies of shallow trade cumulus (Siebesma et al., 2003), precipitating trade cumulus (VanZanten et al., 2011), continental cumulus (Vogelmann et al., 2015; Endo et al., 2015; Lin et al., 2015), and tropical deep convection (Fridlind et al., 2012; Varble et al., 2011), considerably less attention has been paid to the congestus regime until recently. For example, a precipitating cumulus congestus case from the CAMP2Ex campaign was presented for LES and cloud-resolving model intercomparison studies at the 11th International Cloud Modeling Workshop (ICMW) in Seoul, South Korea, in 2024. However, a key difference between the ICMW setup and that presented herein is the former's use of spatially patterned surface heat fluxes as a convective forcing mechanism, which is not straightforward to replicate in typical SCM setups. In serving as an LES benchmark case for SCM simulations, we mean to indicate that (1) the meteorological and aerosol setup is suitable for initializing and forcing the two model types identically, (2) the simulated conditions reproduce basic cloud macroscopic features observed (e.g., cloud-top height), and (3) the degree to which simulations statistically reproduce various measurements of cloud microphysical features has been established to the degree that this is possible (e.g., Reff). To this end, we provide observational constraints on the profiles of environmental aerosol, thermodynamics and large-scale vertical motion, and statistically robust polarimetric retrievals that supplement sparse in situ measurements of warm-cloud microphysics. Finally, using the thermal-based framework, we investigate implications for developing convective microphysics in large-scale models that utilize spectral convection parameterizations with varying entrainment rates.
The remainder of the article is structured as follows. Observations including environmental aerosol and in situ cloud measurements, RSP retrievals, and a description of the case study are provided in Sect. 2. The LES setup and experimental design are given in Sect. 3, and results are presented in Sect. 4. Finally, a discussion of using this case as a benchmark for tropical congestus SCM studies, potential implications for convective microphysics parameterization development, and translation to space-based polarimetry platforms is provided in Sect. 5, followed by conclusions in Sect. 6.
Observations were obtained during the National Aeronautics and Space Administration (NASA) Cloud, Aerosol, and Monsoon Processes Philippines Experiment (CAMP2Ex; Reid et al., 2023). CAMP2Ex was an aircraft-based field campaign held from 25 August–5 October 2019 and based out of the Clark International Airport, the Philippines. Aircraft included NASA's P-3B and the Stratton Park Engineering Company's (SPEC) Learjet 35, which carried out 17 and 13 science flights, respectively. The goal of CAMP2Ex was to characterize the interaction of clouds, aerosol, and radiation in the monsoon system of Southeast Asia's maritime continent. Flights sampled a range of cloud conditions from shallow cumulus to deep convective systems. Here, we focus on a cumulus congestus event that occurred on 25 September 2019.
2.1 Aerosols: Fast Integrated Mobility Spectrometer (FIMS)
Aerosol size distributions with electrical mobility diameter (diameter derived from measuring the electrical mobility of a particle and thus the drag force that is a function of the particle shape and orientation) ranging from 10 to 600 nm were measured at 1 Hz resolution by the Fast Integrated Mobility Spectrometer (FIMS; Wang et al., 2017b, a, 2018; Kulkarni and Wang, 2006) on board the NASA P-3B aircraft. FIMS operates by simultaneously detecting particles of different sizes based on the displacement of charged particles in an electric field. Calibration was performed before and after the CAMP2Ex campaign. Calibrations of sizing accuracy and detection efficiency followed the procedure described in Wang et al. (2017a). Aerosol PSDs ranging from 10 to 600 nm were derived in 30 size bins with a bin width (Δlog 10Dp) equal to 0.061, where Dp is the single particle diameter, using the inversion technique of Wang et al. (2018).
Aerosol representation in our numerical simulations follows the methodology of Fridlind et al. (2017). Out-of-cloud FIMS measurements were composited over altitude ranges (Fig. 1b and c) and fitted to a distribution by minimizing the sum of squared residuals as follows:
where Fi is the fitted concentration and Obsi is the FIMS concentration for size bin i. Three lognormal modes are then derived with a lognormal distribution for each mode represented by
where Dg is the geometric mean particle diameter and σg is the geometric standard deviation. Aerosol number concentrations (Na) vary with height at 0.5 km increments (Fig. 1a), while Dg and σg are held constant with height. Dg and σg of the three modes were derived from fitting the average PSD of 0–3 km to a trimodal distribution by optimizing the residual defined in Eq. (1). The realized trimodal Dg values are 27, 62, and 153 nm, which roughly correspond to nucleation, Aitken, and accumulation modes, respectively. The hygroscopicity parameter (κ) is derived from time-averaged aerosol mass spectrometer (AMS) measurements for this research flight. Since the AMS does not provide size-resolved chemical composition, κ is assumed constant for all three modes. However, ongoing work to derive size-resolved κ based on CCN measurements suggests little variability in κ with supersaturation (i.e., size). We assume that aerosols consist of only (NH4)2SO4, with the inorganic component with κ=0.53 and an organic species with κ=0.1 (Petters and Kreidenweis, 2007). The mass fractions of both components are converted to volume fractions using densities of 1.77 g cm−3 for (NH4)2SO4 and 1.4 g cm−3 for average organic components (Hallquist et al., 2009). Consequently, the AMS-based κ using Eq. (7) of Petters and Kreidenweis (2007) is 0.4. This derivation assumes that aerosols are internally mixed. Characterizing the aerosol mixing state was not possible during CAMP2Ex. However, back trajectories for this flight show fetches exclusively over open ocean, suggesting that the aerosols were minimally influenced by pollution sources (e.g., biomass burning smoke and anthropogenic sources from the metro Manila region). Furthermore, Xu et al. (2021) suggest that the internal mixing assumption in clean marine aerosol environments did not induce any significant error in a CCN closure study.
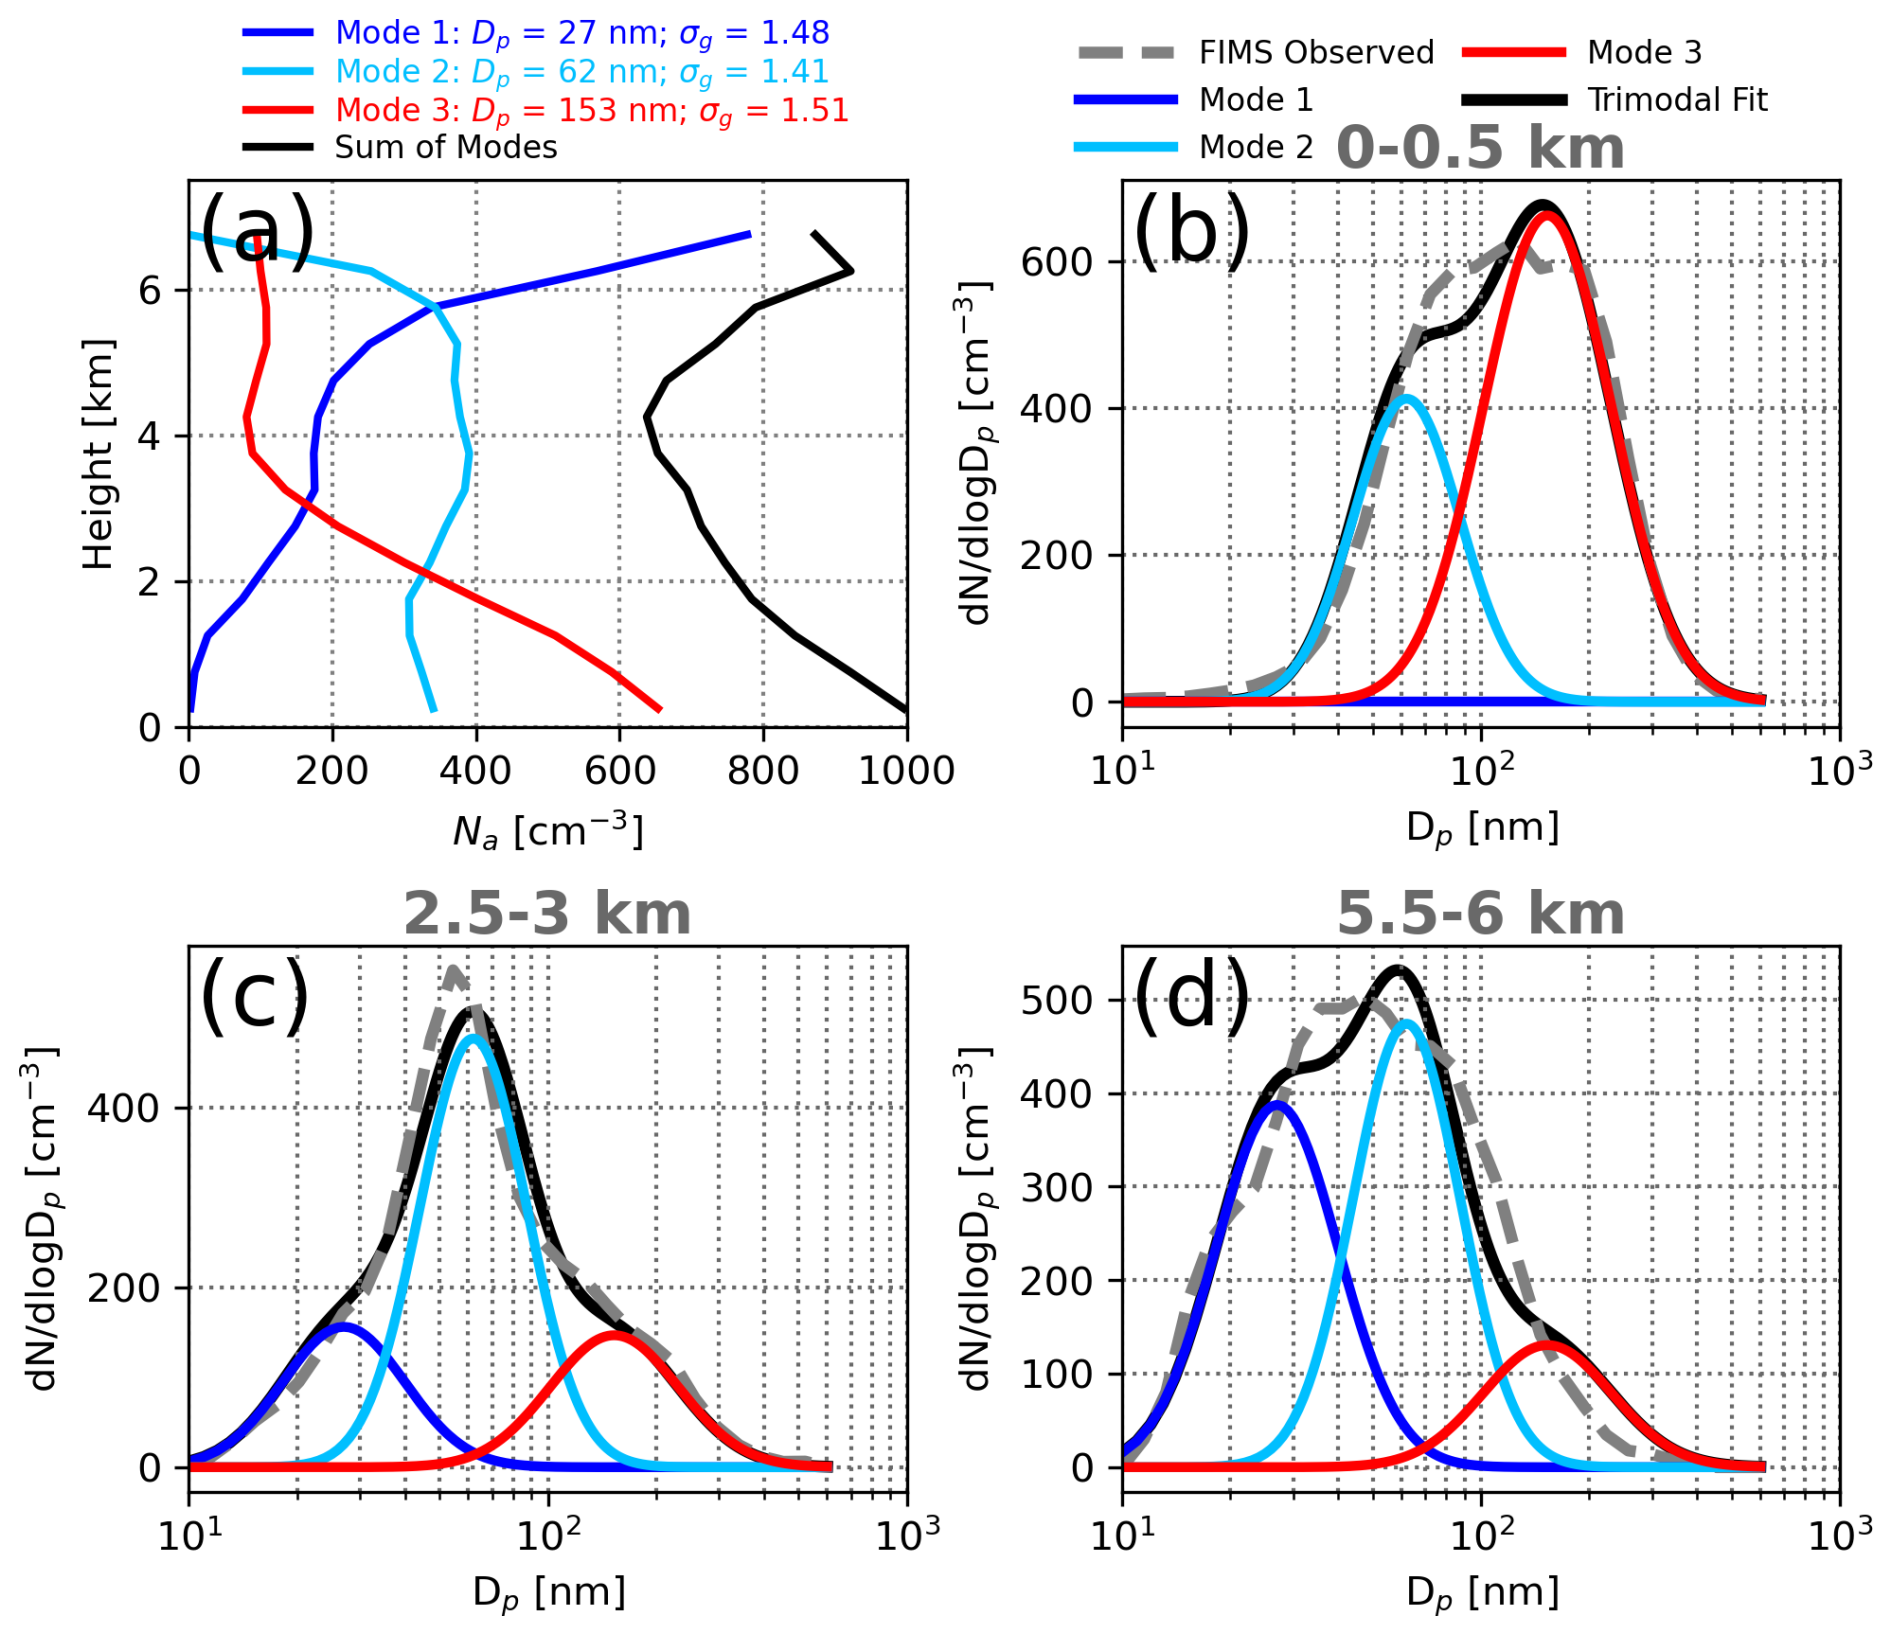
Figure 1(a) Profiles of aerosol number concentration (Na) for three lognormal modes with height-invariant geometric mean particle diameter (Dp) and geometric standard deviation (σg) listed above the panel. (b–d) Lognormal aerosol size distributions measured by the Fast Integrated Mobility Spectrometer (FIMS, dashed gray), the three derived modes (blue, light blue, and red), and the trimodal fit for all modes (black) for three example altitude ranges that span sub-cloud to upper entrainment environments (0–0.5 km, 2.5–3 km, and 5.5–6 km).
2.2 Clouds: Research Scanning Polarimeter (RSP) retrievals
Retrievals of cloud-top Nd, Reff, and νeff are performed using the airborne Research Scanning Polarimeter (RSP; Cairns et al., 1999). The RSP makes total intensity and polarimetric measurements in nine spectral bands in the visible/near infrared and shortwave infrared. On board the P-3B aircraft, the RSP scans a given point on a cloud from multiple viewing angles (Alexandrov et al., 2012a). The CTH is retrieved using a multi-angle parallax method (Sinclair et al., 2017). Single-scattered light between scattering angles of 135° and 165° describes the sharply defined cloud bow in polarized reflectance that is used to retrieve the cloud-top Reff and νeff of the DSD (Alexandrov et al., 2012a). Cloud optical depth is retrieved from near-nadir reflectance measurements at a wavelength of 865 nm. Further details of RSP retrievals are provided by, e.g., Sinclair et al. (2017, 2020, 2021).
The analytical expression for Reff is defined following Hansen and Travis (1974) as
where r is drop radius, is the number of particles per unit volume between radii of r and r+dr, r1 and r2 are the upper and lower size limits of a give size distribution, respectively, and is the nth moment of the DSD. The effective variance is defined as
and is a dimensionless measure of the width of the size distribution. Droplet number concentrations at the cloud top are derived from the RSP-retrieved Reff and νeff following, e.g., Grosvenor et al. (2018) and Sinclair et al. (2019), as follows:
where fad is the subadiabatic factor, τc is the cloud optical depth, cw is the adiabatic condensation rate (e.g., Brenguier et al., 2000; Painemal and Zuidema, 2011), Qext is a unitless extinction efficiency factor, ρw is the bulk density of liquid water (1000 kg m−3), and k is a parameter that relates νeff to Reff following
where Rv is the volume-mean droplet radius (Grosvenor et al., 2018). The k parameter has historically been used by the satellite community and is considered constant for bi-spectral retrievals, though the parameter's natural variability has been documented via aircraft observations (e.g., Painemal and Zuidema, 2011). This illustrates a distinct advantage of the polarimeter's ability to retrieve νeff and subsequently implement the k parameter into Eq. (5). Here, k, Reff, and τc are retrieved by the RSP, Qext is assumed to be 2 for Mie scattering, cw is calculated via dropsondes from the CAMP2Ex flight and decreases with altitude, and fad is assumed to be 0.8 following in situ profiles from the NASA North Atlantic Aerosols and Marine Ecosystems Study (Behrenfeld et al., 2019; Alexandrov et al., 2018). Grosvenor et al. (2018) conclude that different observations suggest an fad of 0.66 ± 0.22, which encompasses the value chosen here. However, since Nd scales with , using 0.66 versus 0.8 would decrease Nd by only a factor of 0.9. RSP retrievals are considered to represent ∼1 optical depth below the cloud top (Miller et al., 2018; Alexandrov et al., 2018). Importantly, RSP retrievals are inherently truncated at a size limit that is dependent on the size distribution being observed (see Fig. 6 in Reid et al., 2023). Here, we assume this lower size limit be a diameter (radius) of 200 (100) µm. Using in situ cloud microphysics (discussed next), we explore the implications of using RSP retrievals at this limit and discuss relevant sensitivities.
2.3 Clouds: in situ cloud microphysics measurements
In situ cloud probes are used to evaluate DSD characteristics within cloud cores. Probes were instrumented on both aircraft, but only Learjet measurements are used herein. These include the fast forward scattering spectrometer probe (FFSSP; O'Connor et al., 2008; Lawson et al., 2017), the Nevzorov liquid and total water content device (Korolev et al., 1998), the 10 µm channel 2D-stereo (2D-S) optical array probe (Lawson et al., 2006), and the high-volume precipitation spectrometer probe (HVPS; Lawson et al., 1998). In situ probes are used to evaluate similarities with RSP retrievals and to provide continuous size distributions that extend beyond the limits of the RSP. Further discussion of combining these instruments to produce continuous size distributions is provided in Appendix D.
2.4 Case description
The event on 25 September 2019 corresponded to Research Flight 14 (RF14) for the P-3B and RF12 for the SPEC Learjet from ∼03:00 to 09:00 UTC. The 0 °C level during this case was ∼5 km above ground level (km a.g.l.). The P-3B aircraft initially sampled cumulus clusters with CTHs ∼4–5 km, as demonstrated in Fig. 2, which shows a 30 km overpass of a cumulus congestus cluster during this case along with time–height cross sections of radar reflectivity from the W-band 3rd Generation Airborne Precipitation Radar (APR3) and a time series of RSP-retrieved cloud-top Nd, Reff, and νeff. Cloud-top heights over ocean were likely limited by a prominent dry layer at ∼4–4.5 km a.g.l. where a dew point depression of ∼20 °C was evident in dropsondes (see Fig. 3b). However, the strength of imposed large-scale vertical motion additionally modulated maximum CTHs in simulations, which is connected to the thermodynamic profile by shifting the vertical structure of relative humidity.
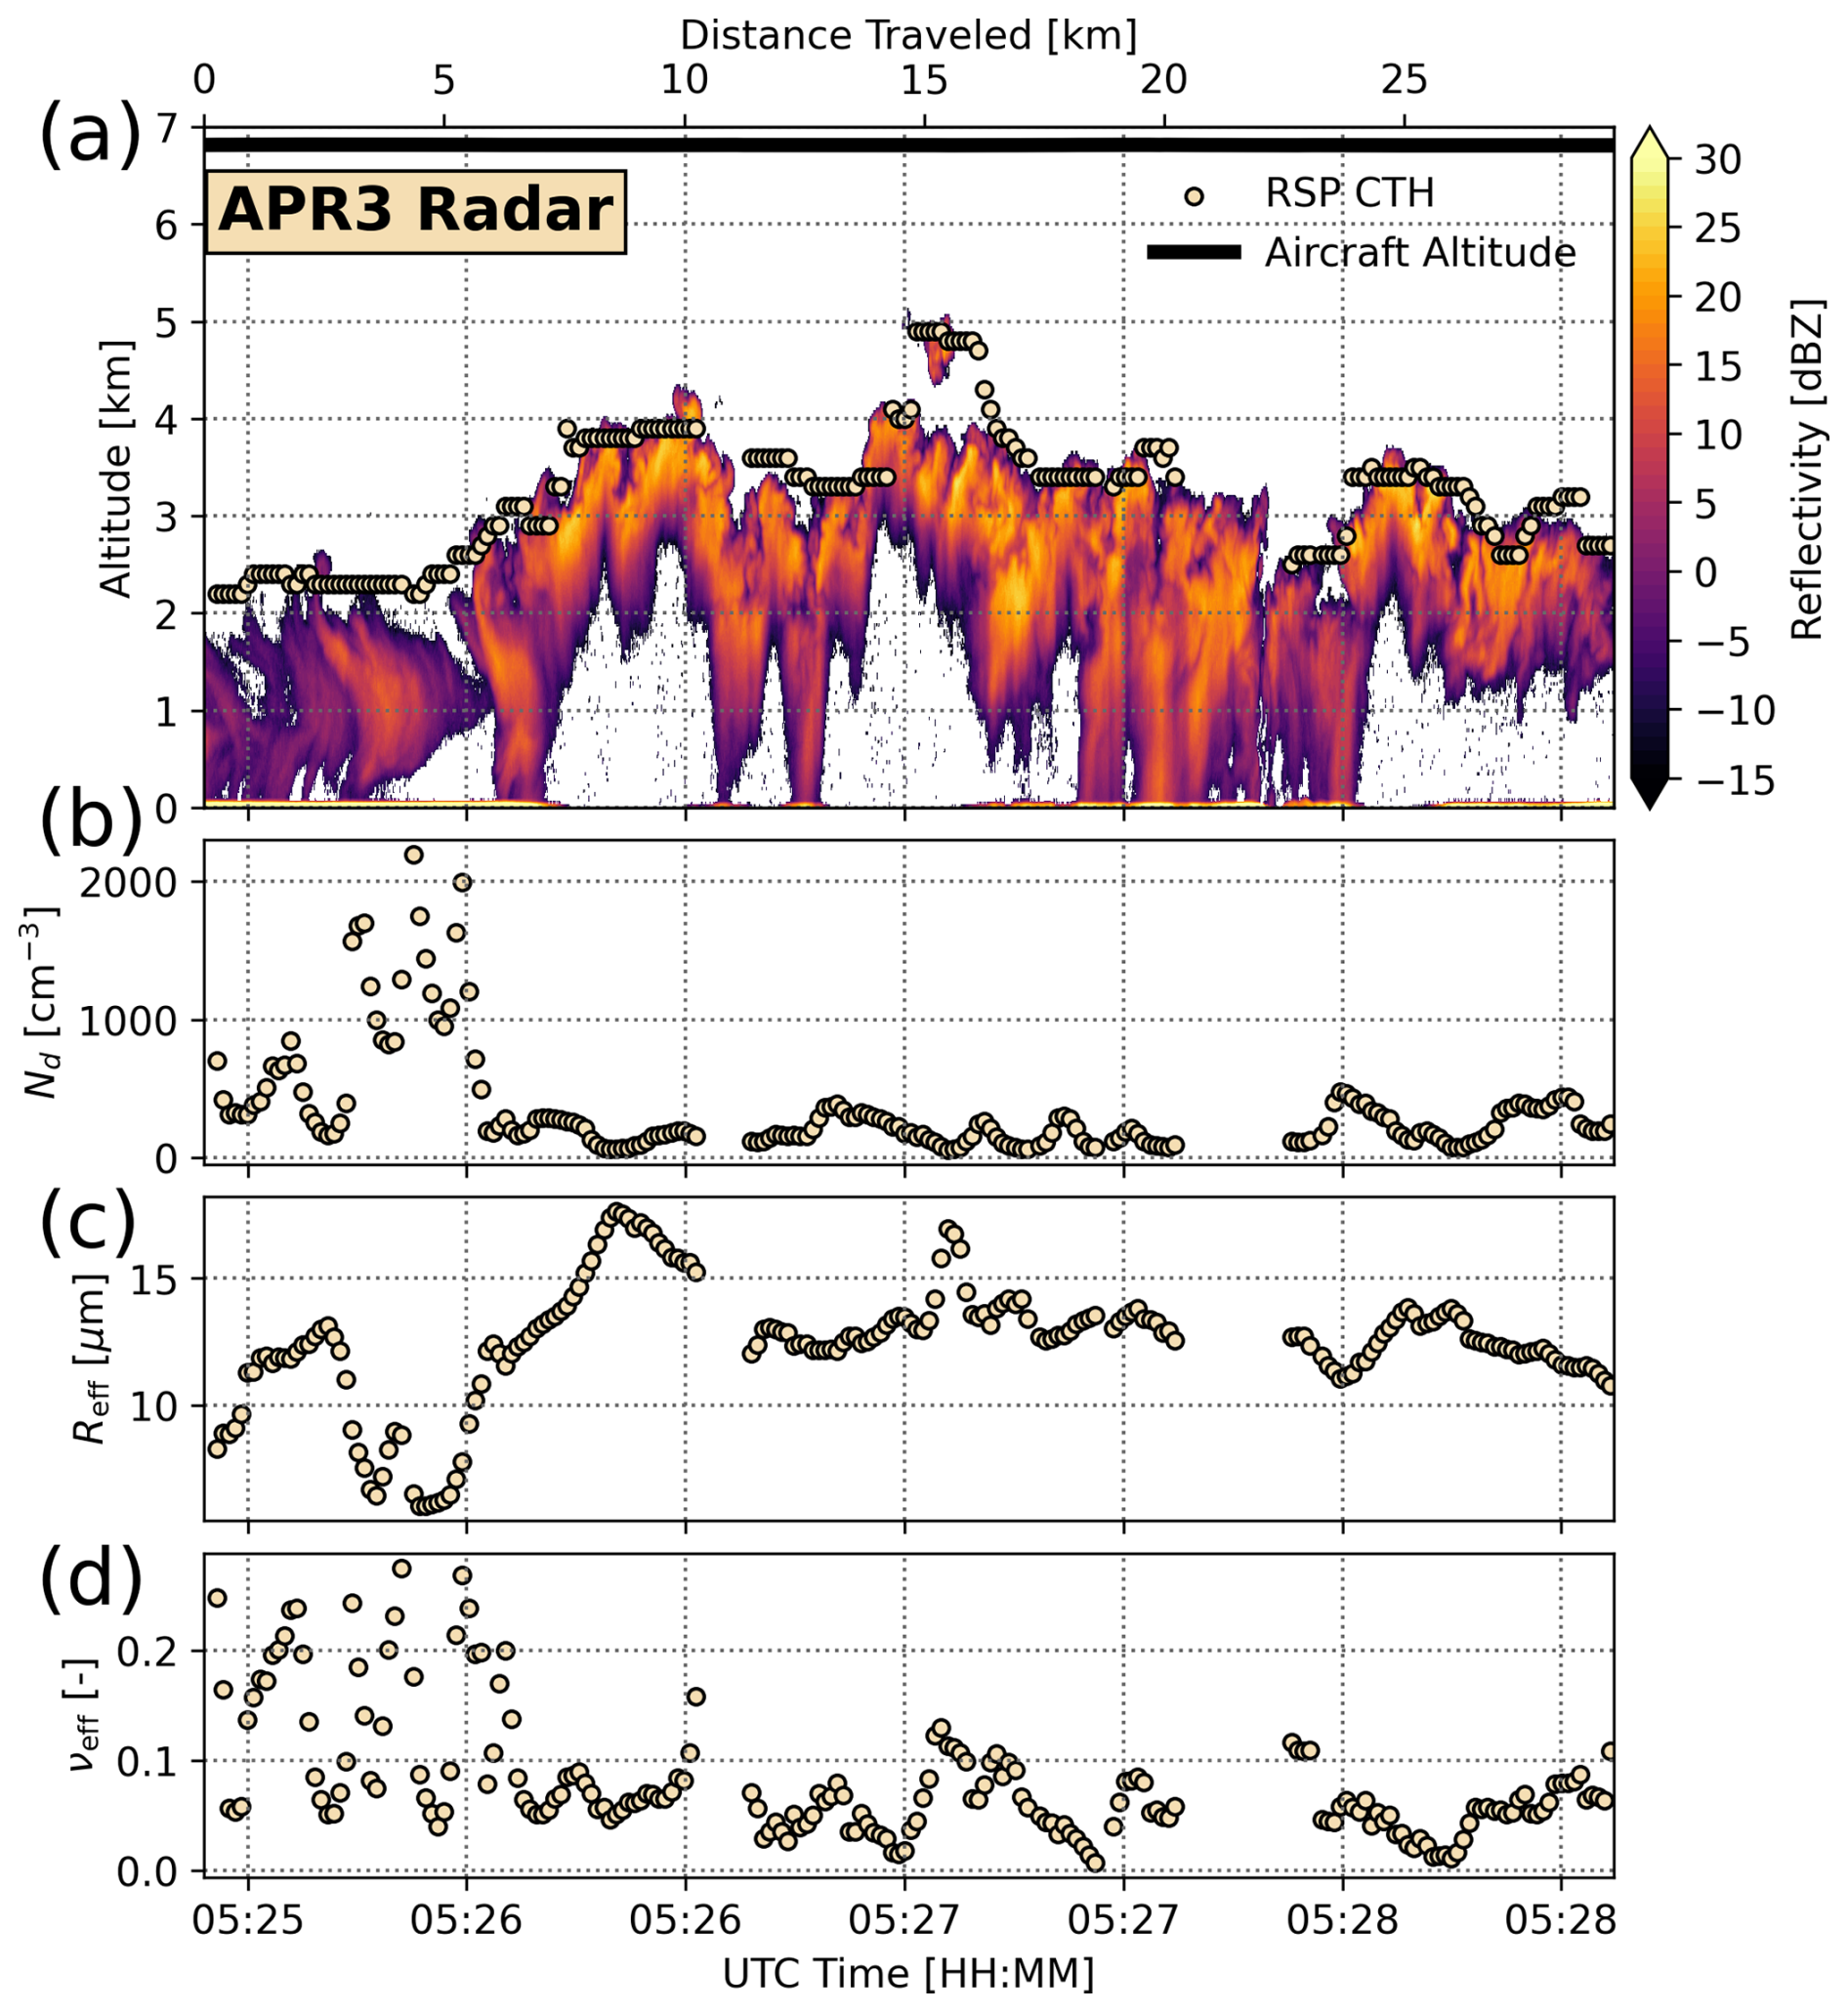
Figure 2Time series of (a) profiles of W-band radar reflectivity from the 3rd Generation Airborne Precipitation Radar (APR3) and CTHs retrieved from the Research Scanning Polarimeter (RSP), (b) the RSP-retrieved cloud-top drop number concentration (Nd), (c) effective radius (Reff), and (d) effective variance (νeff).
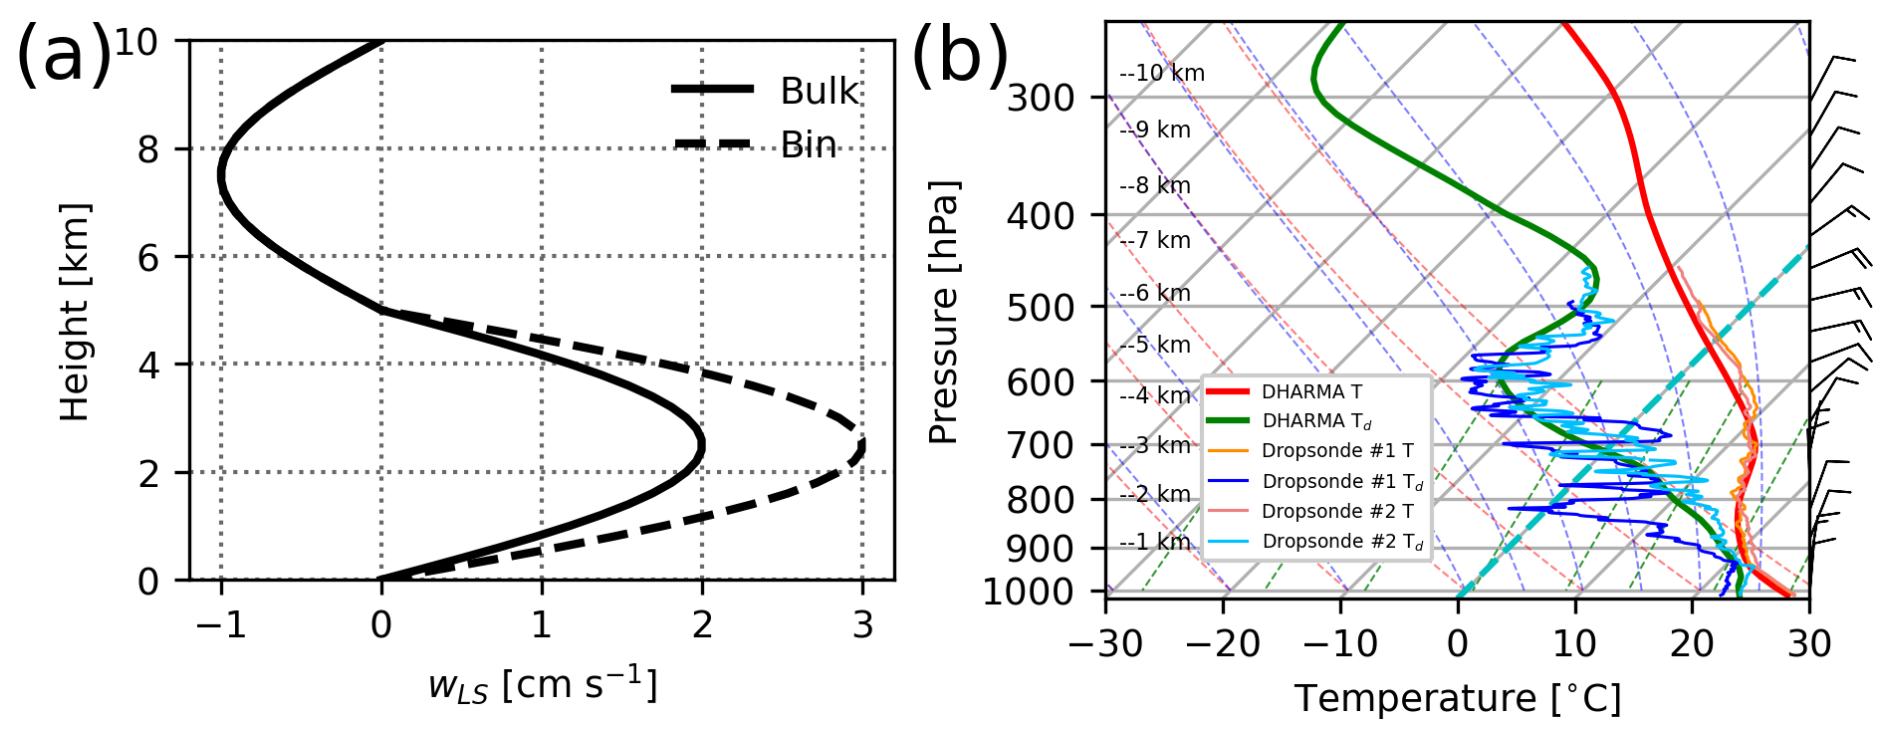
Figure 3Profiles of (a) large-scale vertical motion (wLS) for bulk (solid line) and bin (dashed line) microphysics runs and (b) thermodynamic profiles shown in a skew T–logP diagram from the NU-WRF-derived sounding used to initialize the LES and two dropsondes released in the ambient (#1) and near-convection (#2) environments by the P-3B aircraft, as included in the legend.
The P-3B mostly sampled at a cruising altitude of ∼7 km a.g.l. The overpass shown in Fig. 2 was over ocean and during the earlier portion of the flight. During the latter portion of the flight (after ∼06:00 UTC), the P-3B sampled a more vigorous cluster of convection near the southern end of Catanduanes Island (see location in Fig. 4). Continental surface fluxes and enhanced terrain (up to ∼1.5 km above sea level) from the island along with continued moistening from the cloud system situated to the north of the island (not shown) are presumed to have invigorated convection. Importantly, sampling of clouds over Catanduanes Island by the P-3B was mostly in situ, which since the RSP requires the plane to fly above the cloud top, means the RSP was unable to sample the tops of the most vigorous clouds. Therefore, forthcoming RSP retrievals are shown mostly for cumulus congestus clusters over ocean with CTHs warmer than 0 °C before the aircraft sampled the more vigorous convection over the island.
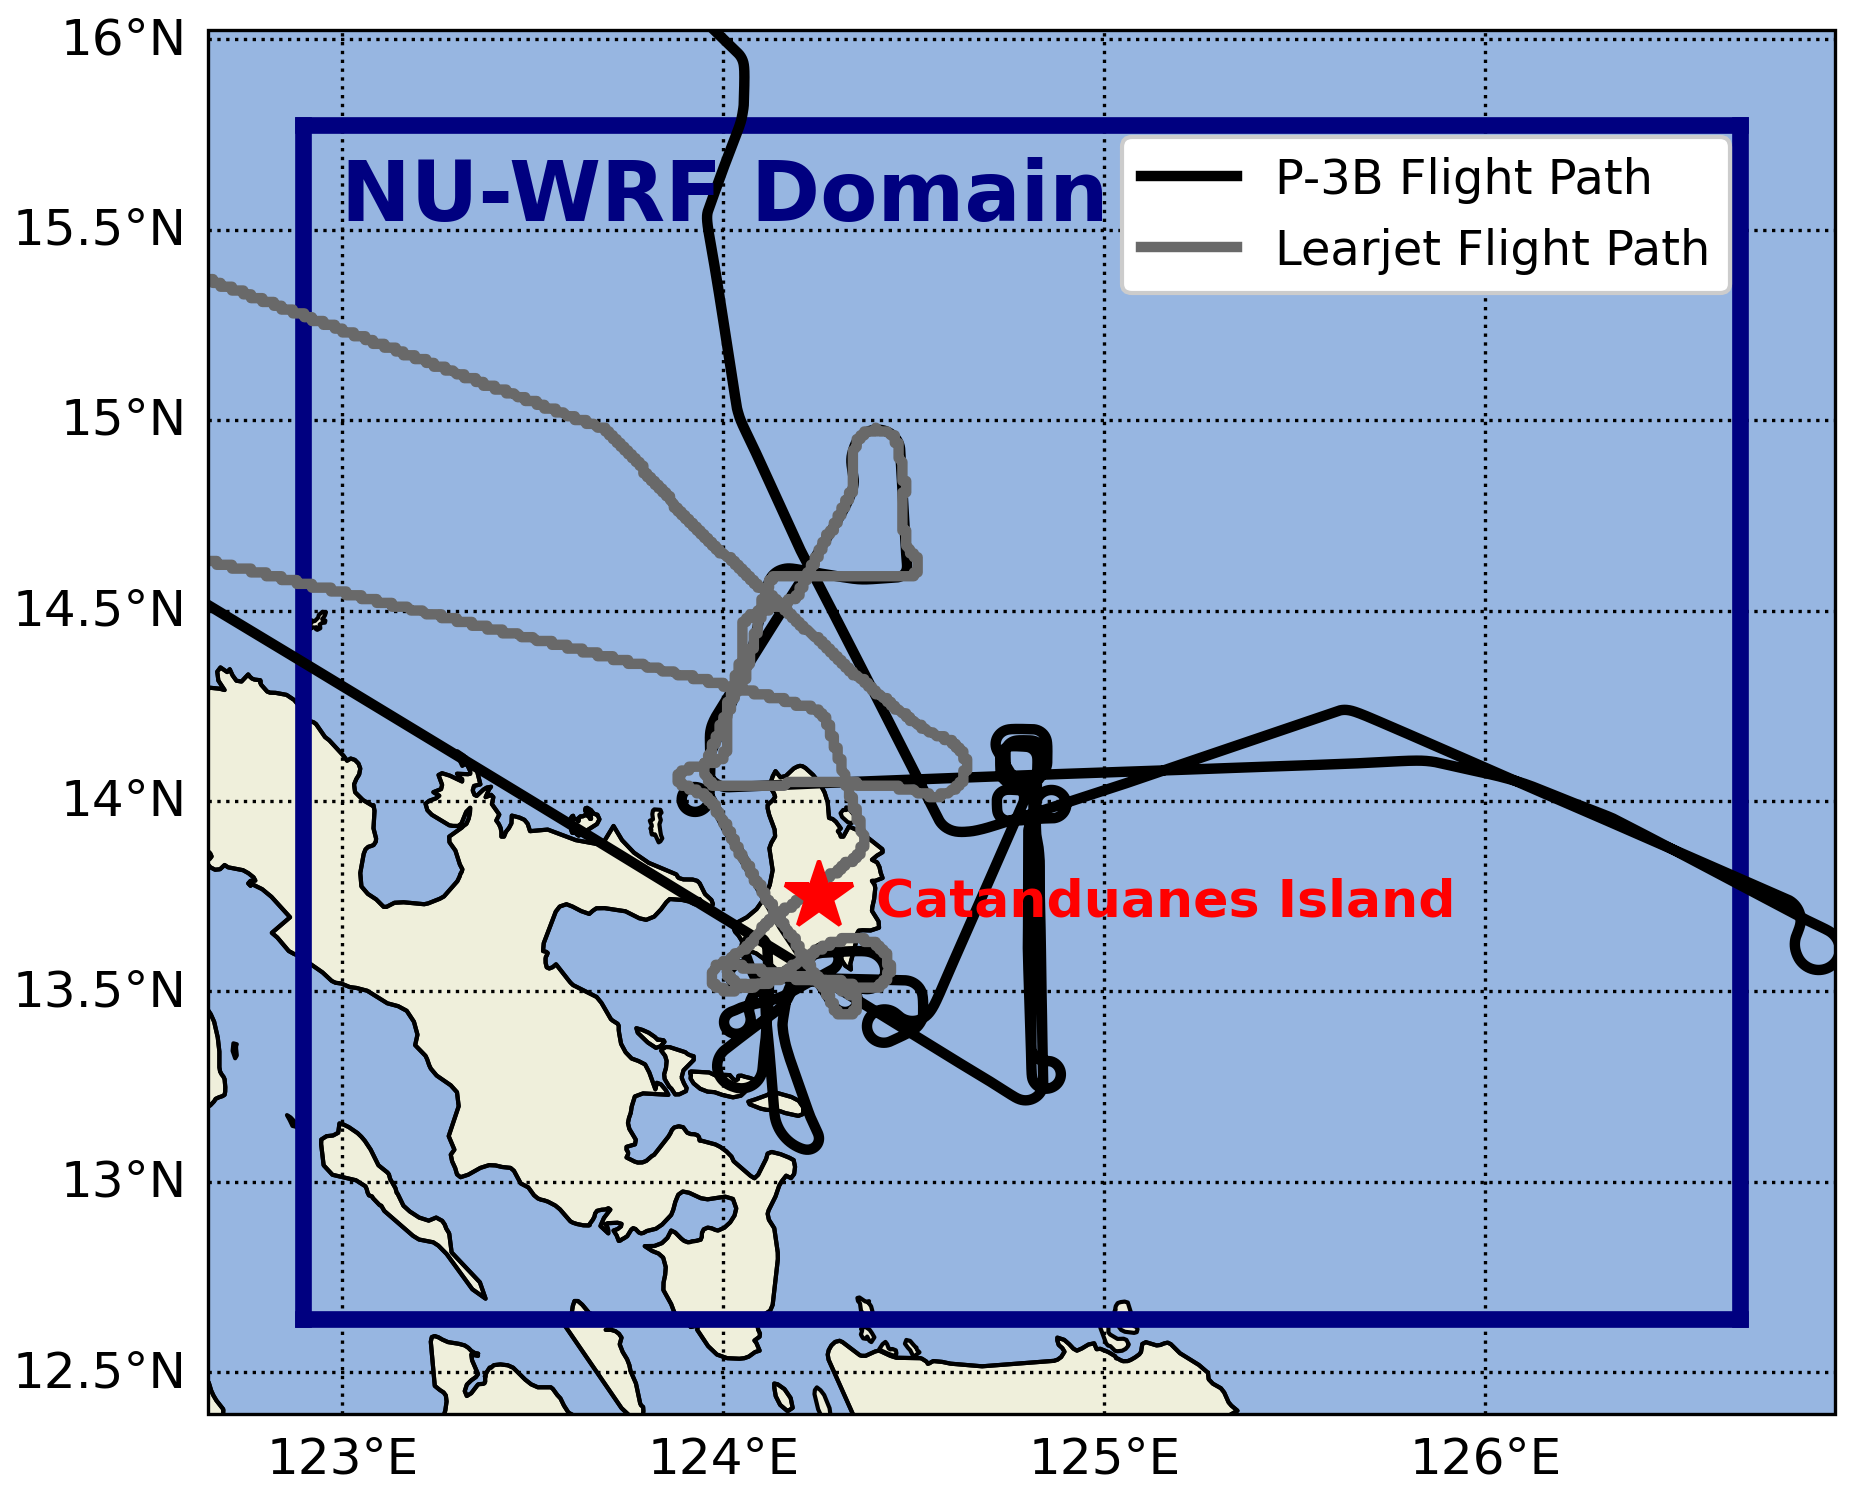
Figure 4Inner NU-WRF domain used for harvesting large-scale vertical motion and thermodynamics to initialize the DHARMA simulations (blue box) and flight paths of the SPEC Learjet and the NASA P-3B aircraft.
The Learjet also performed a number of cloud penetrations prior to 06:00 UTC, after which it continuously sampled in-cloud transects at higher altitudes over the southern portion of Catanduanes Island (Fig. 4). While sampling the island convection, the Learjet indeed sampled CTHs reaching up to 7 km a.g.l., where ice formation proceeded. In situ images from a cloud particle imager (CPI; Lawson et al., 2001; Woods et al., 2018) showed indications of ice multiplication by means of fractured drops and spicules. Ice multiplication for this event, including the development of a drop-shattering parameterization based on laboratory data, is explored in a subsequent study.
Here we describe the LES model setup and experimental design. The LES is initialized with horizontally uniform thermodynamic and large-scale vertical motion (wLS) profiles. While thermodynamic profiles can be obtained from dropsondes, aircraft, and/or radiosondes released nearby, wLS is more difficult to quantify observationally. Prior work indicated the importance of including wLS as LES forcing in order to realize observed conditions. In the absence of observational data, we use mesoscale simulations by the NASA Unified Weather Research and Forecasting (NU-WRF; Peters-Lidard et al., 2015) model to estimate thermodynamic and dynamic forcing.
3.1 Harvesting thermodynamic and dynamic forcing from WRF
Specific details of the NU-WRF simulation setup are provided in Appendix A, and only a brief description is provided here. We employ a nested setup with an outer domain with a horizontal mesh of 3 km and an inner domain with a horizontal mesh of 600 m. The inner 600 m mesh domain, shown in Fig. 4, encompasses the relevant portions of the P-3B and SPEC Learjet flights. Thermodynamic profiles (temperature and humidity) are averaged over this domain and shown in Fig. 3b. Two dropsondes from the flight are also shown in Fig. 3b, where dropsonde #1 was released in an ambient environment far from active convection and dropsonde #2 was released in an ambient but near-convection environment. Regardless, both dropsondes agree well with the profile derived from the NU-WRF domain average.
Various sectors of the domain shown in Fig. 4 were evaluated to derive wLS. While there was considerable variability across the domain and time, spatial and temporal averaging (across hours that corresponded to flight times, ∼03:00–09:00 UTC) yielded a characteristic profile that is shown in Fig. 3a, with positive vertical motion in the lowest 5 km and subsidence between 5 and 10 km. The subsidence between 5 and 10 km conceptually seems consistent with the extreme dry layer represented in the sounding at ∼5 km. As a result, we proceed with the idealized wLS profile provided in Fig. 3a. For bin microphysics simulations, a slightly larger maximum wLS value was required in the lower dipole to produce a similar onset and evolution of precipitation compared to the simulations using the bulk scheme (see Fig. 6). We note that while we do not consider these wLS profiles to be very well-constrained with respect to observations, we do consider them to be plausible and sufficient for representing the large-scale vertical motion in the presented simulations. Furthermore, because a foundational objective of this study is to establish a cumulus congestus case study that can be evaluated in SCM simulations for convective microphysics development and evaluation in large-scale models, it is pertinent to provide a measure of wLS to also force the SCM. Appendix B provides further details of the importance of including wLS to force the LES dynamic conditions.
3.2 Large-eddy simulations
Large-eddy simulations are performed using the Distributed Hydrodynamic Aerosol and Radiative Modeling for Atmospheres (DHARMA; Stevens and Bretherton, 1996; Stevens et al., 2002; Ackerman et al., 2000) model with doubly periodic boundary conditions and a horizontal mesh at 100 m. The domain size is 19.2 km×19.2 km and spans 20 km vertically. Vertical grid spacing increases linearly from ∼20–100 m in the lowest 1 km, is constant at 100 m between 1 and 15 km, and coarsens above 15 km. A larger domain size of 38.4 km×38.4 km did not qualitatively change results shown here. A dynamic Smagorinsky turbulence model from Kirkpatrick et al. (2006) is used for parameterizing subgrid fluxes, and ocean surface fluxes follow the bulk aerodynamic formula of Zeng et al. (1998). Radiation is neglected for simplicity because the impacts of radiative heating and cooling on microphysical processes are considered to be second-order relative to congestus dynamics. Simulations are integrated for 12 h and use a dynamics time step of 1 s. Although ice particles were identified at temperatures below 0 °C when the aircraft sampled invigorated convection over the southern portion of Catanduanes Island, we neglect ice here to narrow the focus on warm-phase microphysical processes. The inclusion of ice will be discussed in a follow-up study, but sensitivity tests including ice indicate this does not significantly affect the warm-phase microphysical evolution described here. Simulations are performed using both bulk and bin (size-resolved) microphysics schemes. An overview of all sensitivity experiments is provided in Table 1.
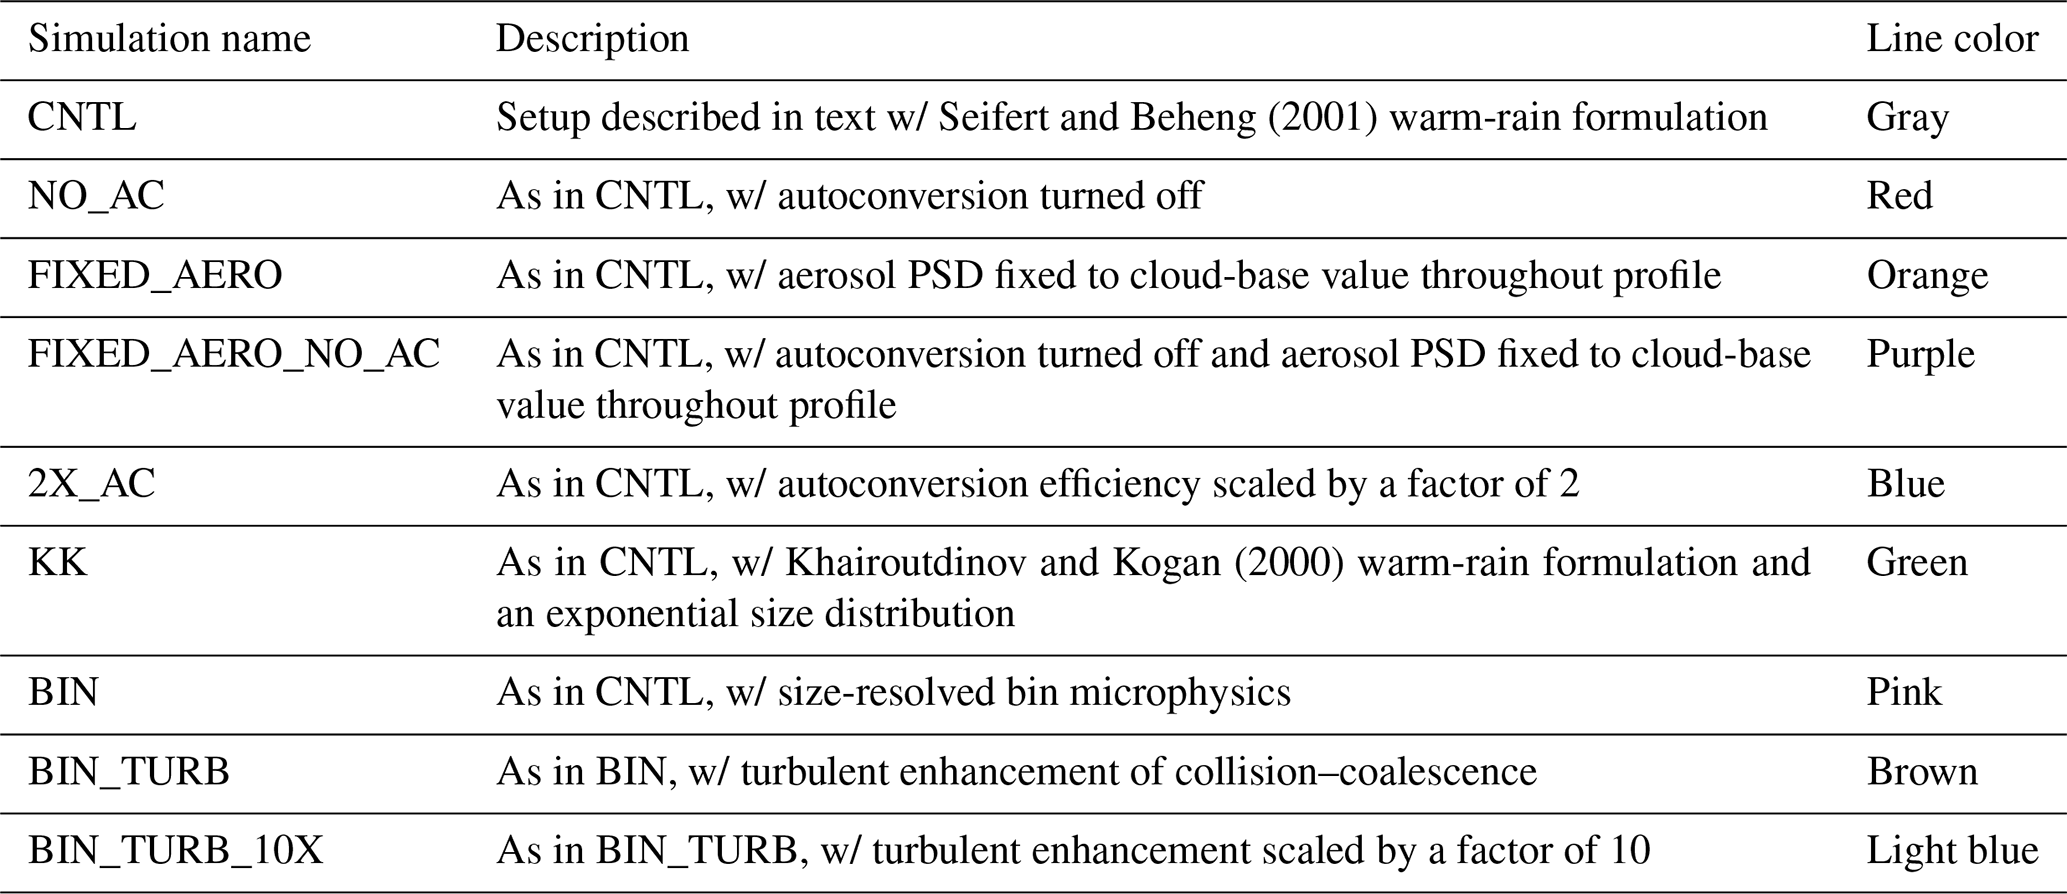
Seifert and Beheng (2001)Khairoutdinov and Kogan (2000)Table 1Simulation details. Line colors devoted to each simulation in forthcoming plots are given in the rightmost column.
3.2.1 Bulk microphysics
Bulk microphysics follow a substantially modified version of the two-moment scheme of Morrison et al. (2005, 2009) using only cloud and rain hydrometeor species, with the addition of three aerosol modes. The control simulation (CNTL) and all but one sensitivity simulation use the droplet autoconversion and self-collection parameterization of Seifert and Beheng (2001). Rain accretion, self-collection, breakup, and fall speed follow Seifert (2008), and the gamma size distribution for rain uses a shape parameter of 3. Sensitivity to the warm-rain formulation is tested using the Khairoutdinov and Kogan (2000) scheme for autoconversion and accretion and employing an exponential size distribution to emulate the parameterization most commonly employed in bulk microphysics models (experiment named KK). Aerosol is activated using Köhler theory following Abdul-Razzak and Ghan (2000) for multiple aerosol modes. This method derives a maximum supersaturation (equal to the critical supersaturation of the smallest activated particles) as a function of dimensionless parameters that include solute effects, curvature effects, and PSD lognormal distribution properties. Here, we use a prognostic supersaturation value after microphysical relaxation that follows from Morrison and Grabowski (2008a). The number concentrations of activated and unactivated aerosol are tracked throughout model integration. The sensitivity of Nd and Reff profile modulation to collision–coalescence is examined by turning off autoconversion as the lower extreme (experiment named NO_AC) and by scaling the autoconversion efficiency by a factor of 2 as an upper extreme (experiment named 2X_AC). The impact of the height-resolved aerosol PSD is explored by fixing each mode of the trimodal, lognormal size distributions to the cloud-base value, therefore making the profile constant with height as a number mixing ratio (experiment named FIXED_AERO). The combined sensitivity to autoconversion, collision–coalescence, and the height-resolved aerosol PSD is then explored in the FIXED_AERO_NO_AC experiment. Finally, a resolution sensitivity test is performed with the same physics as CNTL but with a horizontal mesh at 50 m that is discussed in Appendix C.
3.2.2 Bin microphysics
The bin microphysics scheme is based on the Community Aerosol-Radiation-Microphysics Application (CARMA) code (Ackerman et al., 1995; Jensen et al., 1998). Prognostic species include bin-wise unactivated aerosol number, liquid drop number, and aerosol core mass in liquid drops. Core mass is tracked in a droplet size bin by solving a continuity equation for the total dissolved aerosol mass, enabling calculation of the mean solute effect on droplet growth rate in a manner that conserves total solute mass. For each species, we use a geometric mass grid with a constant ratio of masses between two adjacent bins. The mass ratio (ℳ) is defined as , where mi is the drop mass in the ith bin and s is a bin width parameter such that drop mass is doubled every s bins. For liquid drops, ℳ=1.65 (s∼1.384), and for aerosols ℳ=1.35 (s∼2.309). For spherical particles, the corresponding geometric size grid is , where ri is the radius of the ith bin. For aerosols, the mass in the smallest bin corresponds to a diameter of ∼10 nm and the largest bin corresponds to a diameter of ∼1.5 µm. For liquid drops, the size bins range from 2 µm to 7.78 mm in diameter. Lee et al. (2021) evaluated the impacts of numerical broadening in CARMA using the geometric grid compared to a hybrid grid that transitions from linear to geometric bin spacing, with the linear grid intended to limit numerical broadening caused by solving condensation. In parcel simulations, Lee et al. (2021) found that the introduction of turbulent-induced collision enhancement (discussed below) limited the effects of numerical broadening from condensation alone and reduced differences between the two grid choices relative to the absence of turbulent enhancement. In LES of a drizzling marine stratocumulus case study, they also found that the hybrid grid led to smaller drops and delayed onset of surface precipitation, which agreed slightly better with radar observations of DSD moments but overall differences between simulations were small relative to differences with observations. For simplicity, we retain the geometric grid here, which appears reasonably resolved in comparison with observations (see Fig. 10).
Specific details of microphysical processes including condensation, evaporation, and sedimentation are given in Ackerman et al. (1995). As in the bulk simulations, we initialize with a height-varying trimodal aerosol distribution (Fig. 1) with a hygroscopicity parameter of 0.4 for all bins. Activation of unactivated aerosol within a bin occurs when supersaturation exceeds the critical supersaturation calculated using the Köhler equilibrium relations. Upon activation, aerosol number is added to the smallest droplet size bin and aerosol mass is transferred to the corresponding droplet core mass bin. Collision–coalescence is performed using the exponential collection scheme of Bott (2000) to solve the stochastic collection equation with collision efficiencies from Hall (1980). Raindrop breakup follows from Hall (1980) and Low and List (1982). Complete evaporation occurs when the average volume of dissolved aerosol in a droplet bin exceeds the droplet volume. The corresponding droplet core mass concentration is then added back to the aerosol size distribution in a manner that conserves volume and number. Whereas this single-moment bin scheme is superior to the bulk scheme in conservation of aerosol mass and number, the bulk scheme use of prognostic number concentration in three aerosol modes with fixed modal parameters errs on the side of preserving aerosol dispersion. The baseline bin microphysics simulation is named BIN. We perform two additional sensitivity experiments to explore the role of turbulent enhancement of collision–coalescence. In the first experiment (BIN_TURB), the theoretical turbulent collision kernel from Ayala et al. (2008) is incorporated following the implementation described by Lee et al. (2021), which uses the explicitly calculated turbulent kinetic energy dissipation rate (ϵ) from the subgrid-scale (SGS) diffusion scheme and the collision efficiency enhancement from Wang and Grabowski (2009). Chen et al. (2018) found in large-eddy simulations of an Arctic mixed-phase cloud that the modeled turbulent broadening was narrower than in observations of Doppler spectral width. They calculated that the total dissipation rate (i.e., numerical plus SGS) was a factor of 6 larger than the SGS dissipation rate and agreed better with observations. Moreover, Chen et al. (2018) revisited the study of Rémillard et al. (2017), who simulated a drizzling marine stratocumulus case and determined that DHARMA's total dissipation rate was ∼3 times larger than the SGS dissipation rate, demonstrating that the magnitude of the ratio between the total and SGS dissipation rate is strongly case-dependent. Here, following the Chen et al. (2018) approach, we determined that the total mean dissipation rate is ∼10 times larger than that computed by the SGS scheme, indicating that the more turbulent cloud environment simulated herein experiences substantially greater turbulent broadening than that calculated by the SGS scheme. Therefore, in a second experiment, ϵ is scaled by a factor of 10 (BIN_TURB_10X), which conceptually can be considered the most appropriate parameterization using the bin scheme with turbulent enhancement included.
3.3 Thermal identification and tracking framework
To investigate the role of entrainment in modulating profiles of Nd and to facilitate interpretation of cloud droplet production and evolution within their source elements (i.e., cumulus thermals), a thermal identification and tracking framework is employed. The algorithm used is described in Hernandez-Deckers and Sherwood (2016), based on an early version by Sherwood et al. (2013), and has been used in several recent studies to investigate the interacting roles of microphysics, aerosols, and convective dynamics (e.g., Hernandez-Deckers and Sherwood, 2018; Hernandez-Deckers et al., 2022; Matsui et al., 2024). A thorough description of the algorithm is provided in Hernandez-Deckers et al. (2022) and Matsui et al. (2024), so only a brief description is provided here. Rising volumes of cloudy air, above a minimum vertical velocity (w) threshold (1 m s−1) and condensate threshold (0.01 g kg−1), are tracked at high temporal frequency (1 min). The minimum lifetime for thermals identified in this study is 3 min. Composite thermal statistics are centered around a thermal's maximum ascent rate (which differs from the maximum w due to inhomogeneity across the thermal's width resulting from toroidal circulations). The algorithm assumes a spherical shape, which Hernandez-Deckers and Sherwood (2016) showed to be a valid approximation compared to more plume-like structures. In transient convection simulations, Sherwood et al. (2013) and Hernandez-Deckers and Sherwood (2016) showed that thermals are generally short-lived (∼4–5 min) and rather small (relative to the horizontal mesh we use), which is consistent with thermals detected in the current study (not shown).
4.1 Observed profiles of Nd, Reff, and νeff
Cloud-top Nd, Reff, and νeff retrieved by the RSP are composited over temperatures warmer than 0 °C and sorted as a function of CTH (Fig. 5). In situ data from the Learjet FFSSP are also shown in Fig. 5 for points with liquid water content (LWC) >0.1 g m−3. For the in situ data, Reff and νeff are calculated using Eqs. (3) and (4), respectively, where the upper integration limit is the upper size threshold of the FFSSP (r=25 µm).
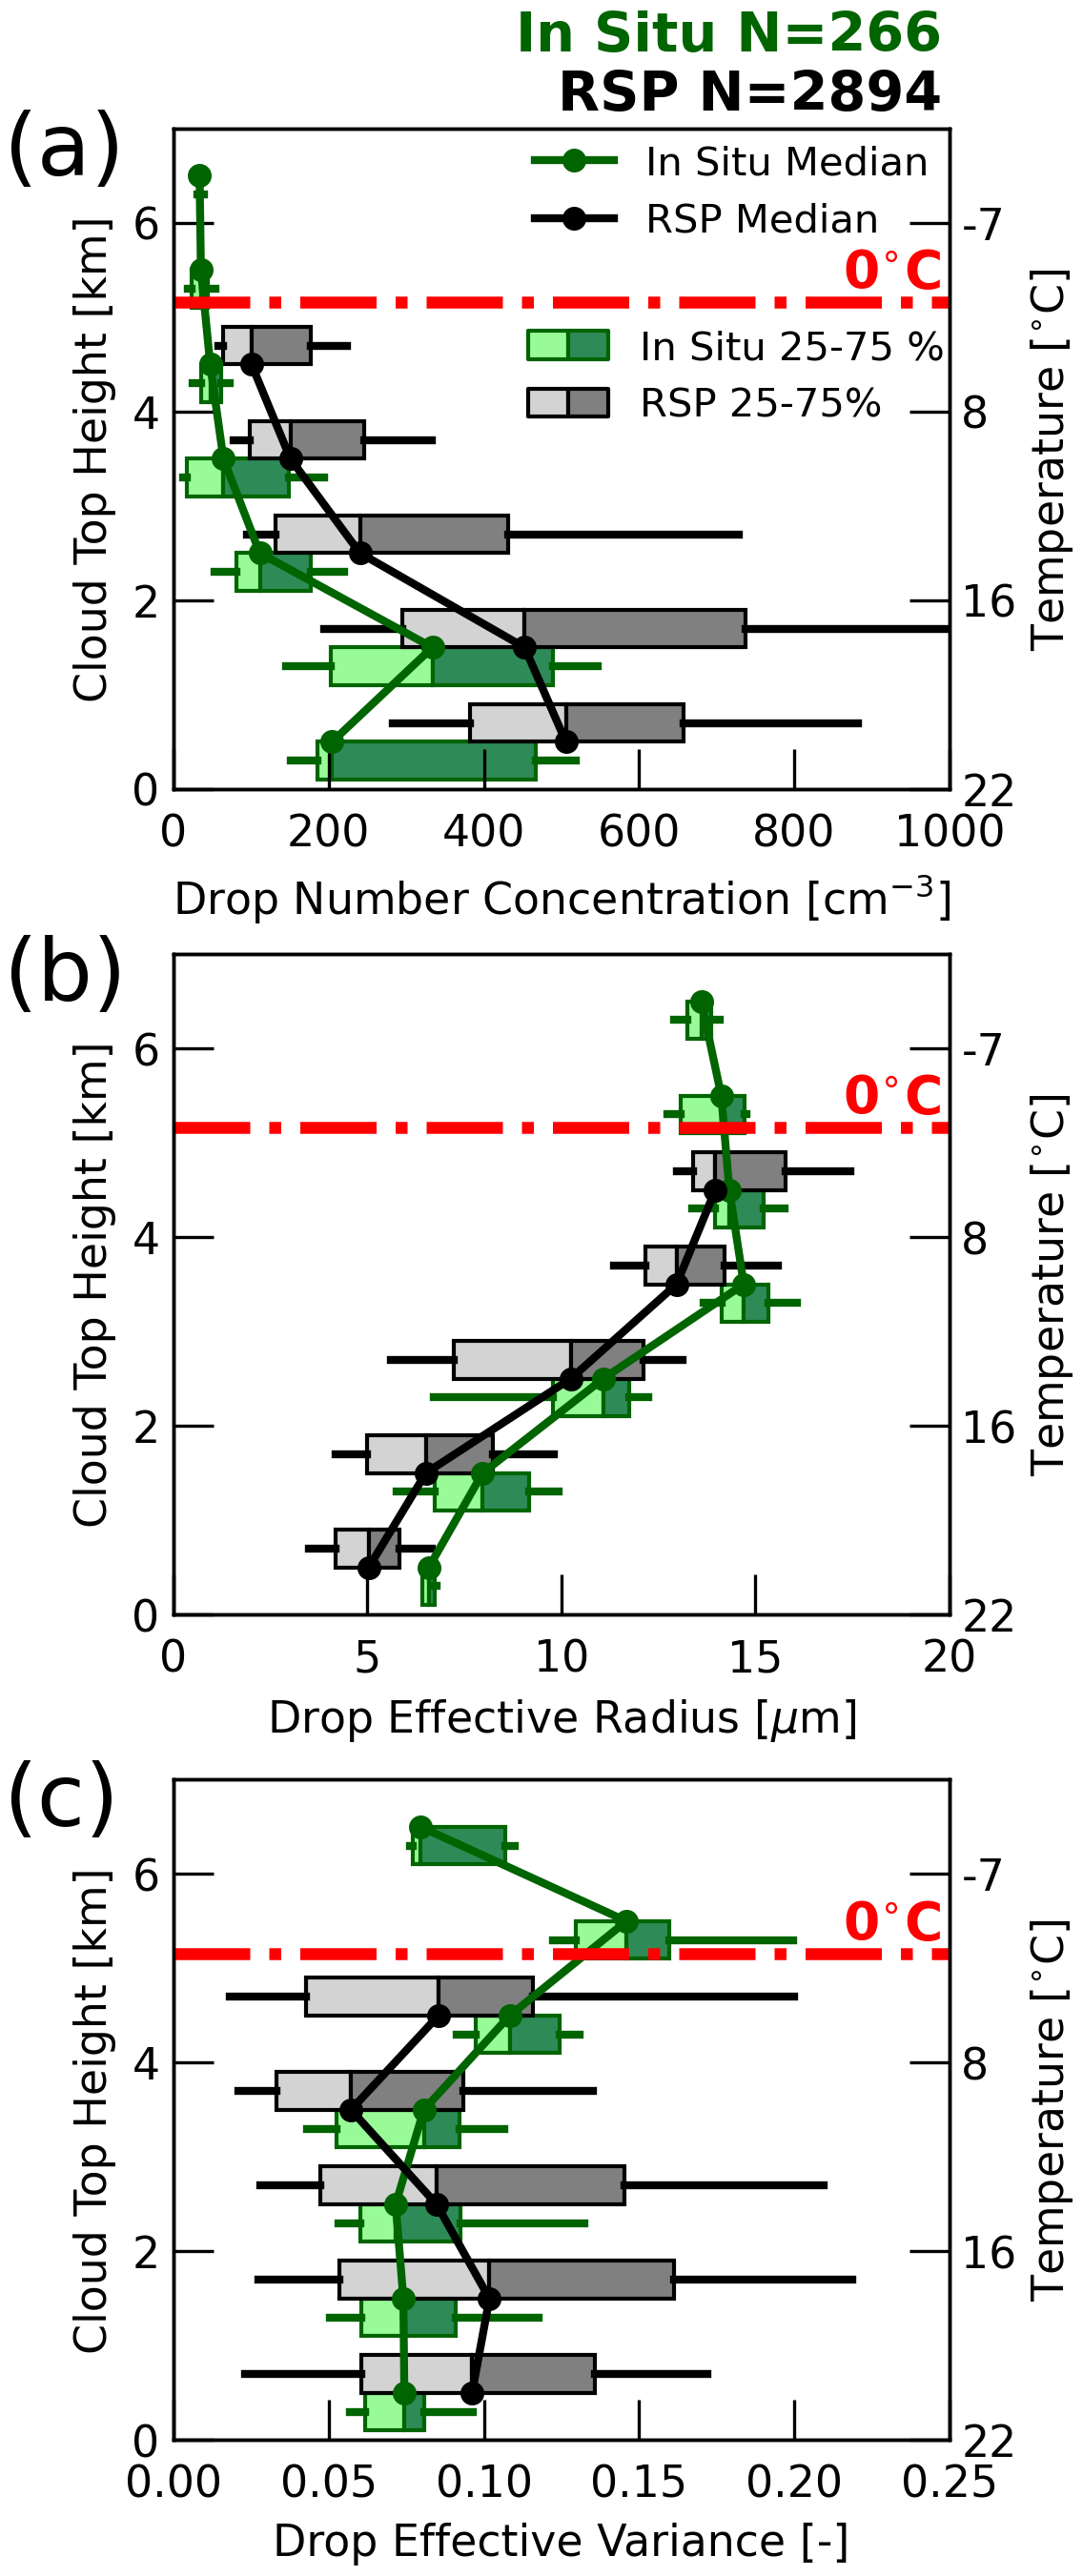
Figure 5Profiles of drop (a) number concentration (Nd), (b) effective radius (Reff), and (c) effective variance (νeff) as a function of cloud-top height (CTH) bins (bin width = 1 km) from the RSP (gray shades) and as a function of in situ altitude bins from the FFSSP (green shades). Boxes show the interquartile range, and whiskers show the 10th and 90th percentiles. The RSP and in situ data are offset from the center of the 1 km bins with RSP on top and in situ on bottom. Circle markers with lines indicate the median and are placed at the center of the height bin for both instruments.
Median cloud-top Nd decreases from ∼500 cm−3 for CTHs between 0 and 1 km a.g.l. to ∼100 cm−3 for CTHs between 4 and 5 km a.g.l. (Fig. 5a). Cloud-top Reff follows an inverse relationship with Nd, increasing from ∼5 µm for CTHs below 1 km a.g.l. to ∼15 µm for CTHs between 4 and 5 km a.g.l. Notably, Reff values of up to 15 µm are conceptually aligned with the onset of precipitation at around this altitude (Rosenfeld and Gutman, 1994; Gerber, 1996; Andreae et al., 2004; Freud and Rosenfeld, 2012). Active precipitation in this case is consistent with the radar reflectivity transect shown in Fig. 2a with relatively high reflectivity values (>20 dBZ) near the cloud top and vertically continuous radar echoes reaching the surface. Median cloud-top νeff increases with increasing CTH in the lowest 2 km, decreases between 2 and 4 km, and increases above 4 km. Finer CTH binning (not shown) indicates a robust increase with CTH above 4 km, implying a broadening of the DSD at altitudes where precipitation starts to form.
In situ data from the FFSSP show smaller Nd relative to RSP for each altitude bin, while FFSSP Reff is slightly larger than the RSP. Below 3 km, FFSSP νeff is constant (∼0.075) and smaller than the RSP but shows a more substantial increase with increasing height at higher altitudes, which is indicative of DSD broadening captured by the in situ measurements. We note that the largest size bin for the FFSSP is 25 µm in radius, while we are here assuming that the RSP DSD is truncated at a radius of 100 µm. While it is possible to merge the FFSSP DSD with the 2D-S10 to get an extended distribution, doing so requires robust statistical averaging for stitching the DSDs together. Here, we chose to retain the 1 Hz native resolution of the FFSSP. This is justified with the knowledge that (1) Nd would be largely insensitive to the inclusion of larger particles, (2) Reff would only increase by including an instrument with larger size bins, and (3) the in situ Reff is already larger than the RSP. We also note that using a smaller LWC threshold of 0.01 g m3 decreases the in situ Nd, shifting it further from the RSP. Despite magnitudinal differences, both instruments show similar trends with increasing CTH.
Discrepancies between RSP and in situ measurements may be due to several factors. At the foundation, RSP retrieves cloud-top quantities, while in situ measurements in this case include regions in or near the cloud core. The expectation is that Nd should be higher in cloud cores than at the cloud top, but the opposite is seen here for reasons that are not readily apparent. For Nd, the RSP retrieval may be limited by assumptions in Eq. (5), which is derived from an adiabatic cloud model (e.g., Grosvenor et al., 2018). This method assumes that Nd is constant with height for a given cloud profile and that LWC increases linearly with height as a constant fraction of its adiabatic value (fad). The presented RSP-retrieved Nd assumes fad=0.8, which may be too high for these cumulus clouds, which are subject to substantial entrainment. However, fad can also be highly variable in addition to its uncertainty. A lower value of fad would decrease Nd, which scales with the square root of fad. Moreover, errors in Reff propagate to errors in Nd that scale with the power of . Therefore, slightly lower RSP Reff relative to in situ is conceptually consistent with higher RSP Nd. The in situ measurements, on the other hand, are likely significantly undersampled due to a small number of subjective cloud transects in highly variable cloud environments, and they may contain poorly quantified instrumental biases of their own. Nonetheless, we accept these uncertainties here to explore the ability for simulations to produce profiles of Nd and Reff that bound the RSP retrievals and in situ measurements.
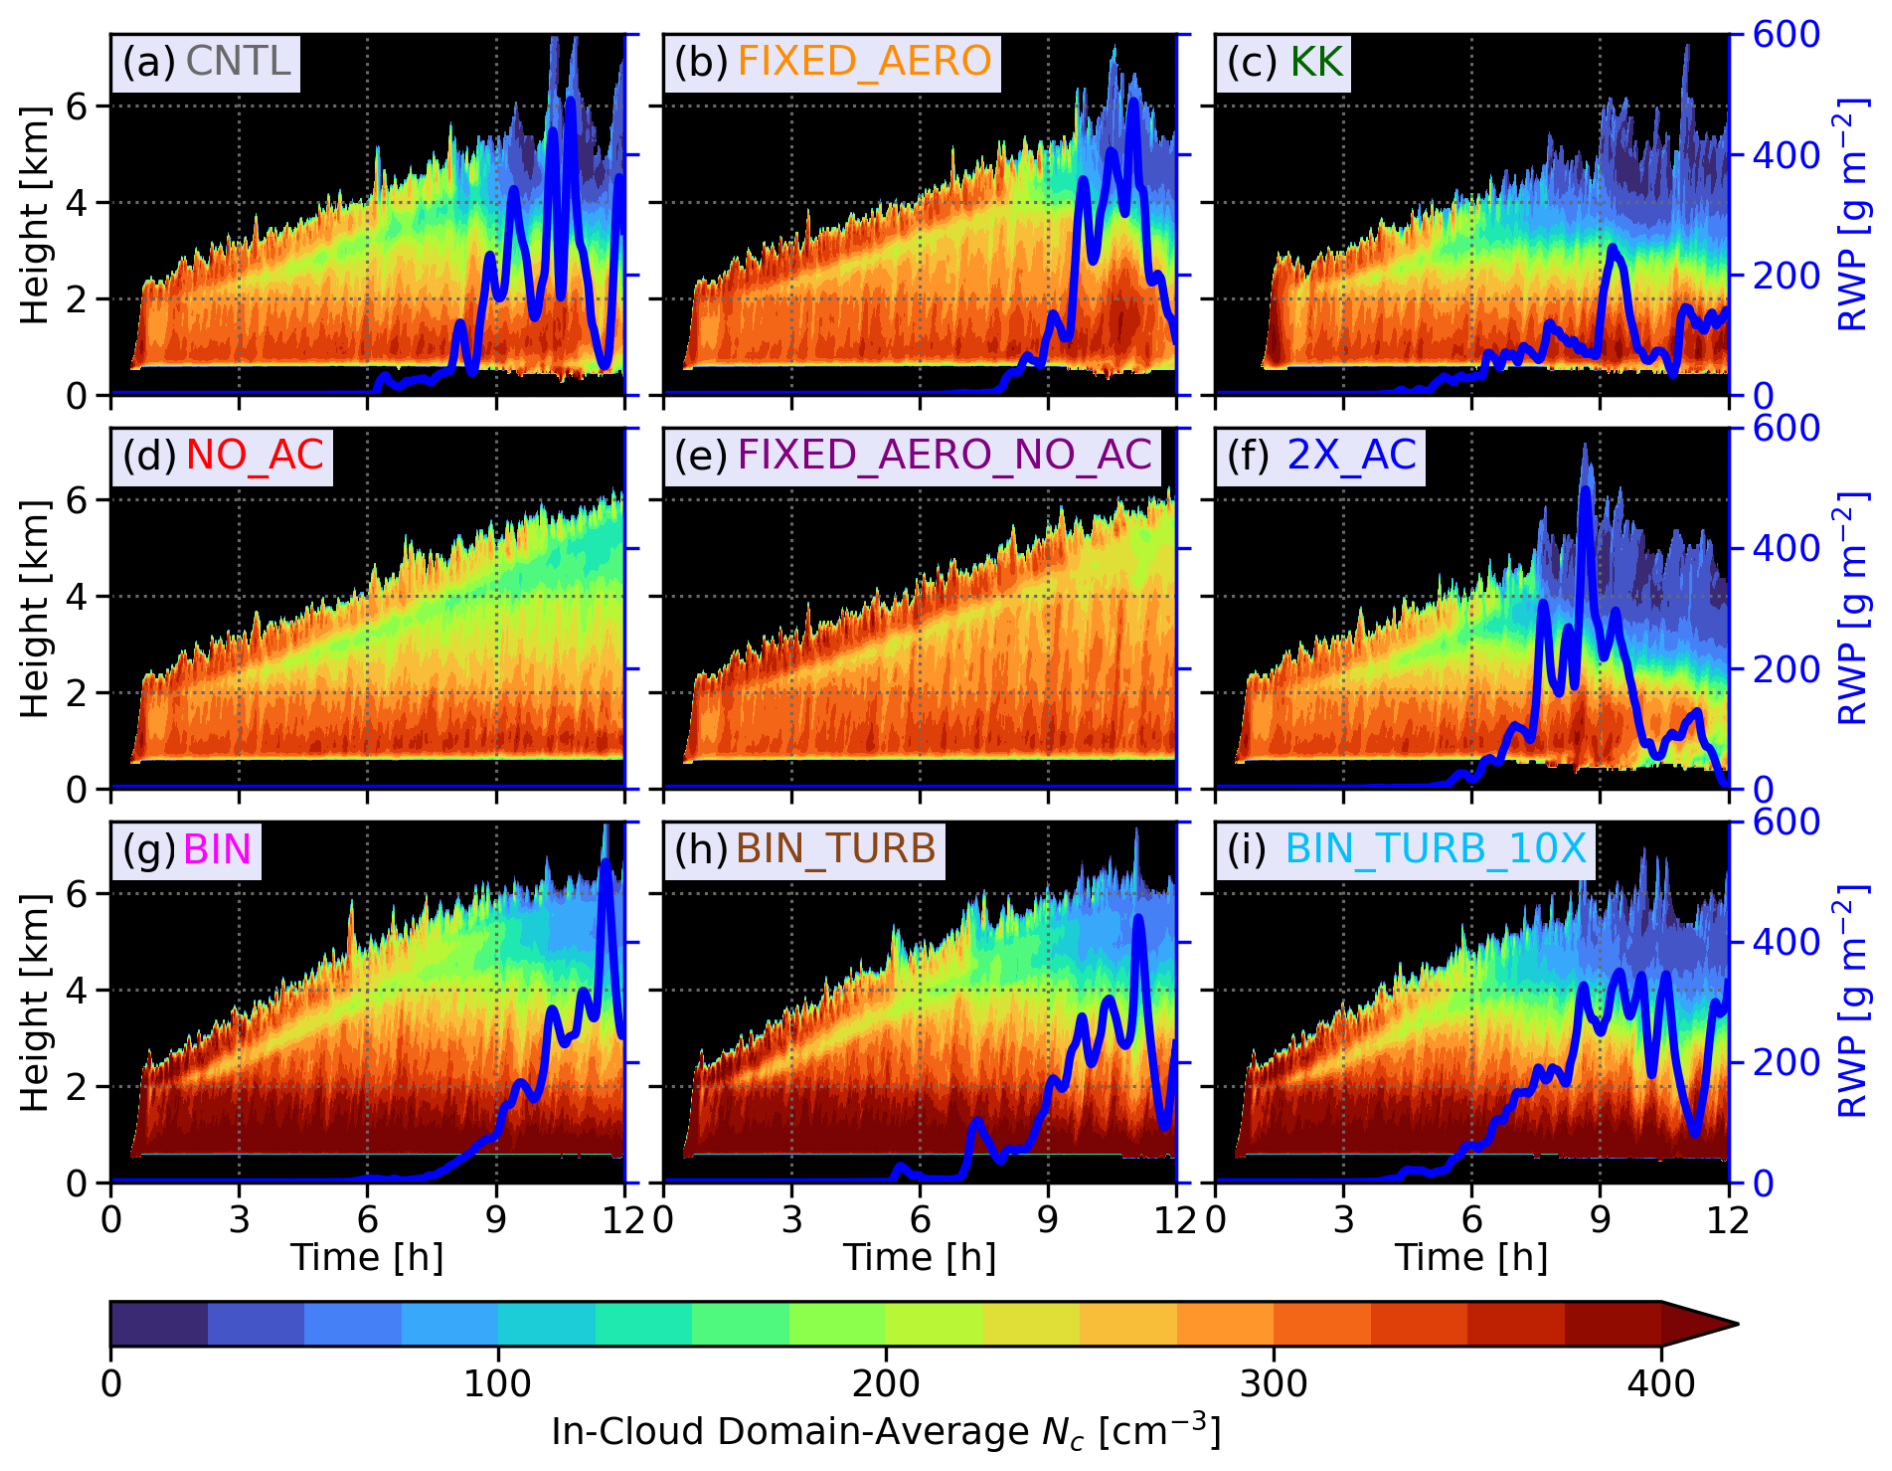
Figure 6Time–height series of in-cloud domain average cloud droplet number concentration (Nc) for the (a) CNTL, (b) FIXED_AERO, (c) KK, (d) NO_AC, (e) FIXED_AERO_NO_AC, (f) 2X_AC, (g) BIN, (h) BIN_TURB, and (i) BIN_TURB_10X simulations. Blue lines (right ordinates) show the rain water path (RWP) time series.
4.2 Simulated cloud-system evolution
We represent the simulated cloud-system evolution via time–height series of domain-averaged in-cloud cloud droplet number concentrations (Nc; Fig. 6), which exclude the rain species in order to better emphasize the evolution of cloud droplets only. Clouds are initiated within the first 30 min and maintain a cloud-base height (CBH) of ∼0.5 km a.g.l. throughout the entirety of the simulation. Cloud tops grow monotonically from ∼2 km initially to ∼6 km at ∼10 h for CNTL. Time series of rain water path (RWP) are also shown in Fig. 6, where rain onset occurs at ∼6 h in CNTL. As discussed later, the simulated system is composed of numerous thermals that successively reach higher altitudes. After the onset of precipitation in CNTL, cold pools form such that the system begins to cluster with relatively more vigorous convection (not shown).
Cloud droplet number concentrations decrease with height in CNTL from ∼400 cm−3 near the cloud base down to under 50 cm−3 near the cloud top in the last 3 h. In comparison, Nc in NO_AC (i.e., no rain formation, Fig. 6d) decreases with height to ∼150 cm−3 near the end of the simulation, indicating the role of collision–coalescence in scavenging Nc in CNTL. The FIXED_AERO simulation (Fig. 6b) realizes higher Nc throughout the entire profile, which results mainly from the third and largest mode of the trimodal Na distribution (Fig. 1). The largest mode is activated most frequently (not shown), and by forcing a constant profile with a value equal to that at the cloud base (∼650 cm−3; Fig. 1a) instead of decreasing with altitude, entrainment of these aerosols at high altitudes induces more secondary activation. This also acts to slightly delay higher RWPs relative to CNTL and leads to slightly weaker Nc scavenging. The FIXED_AERO_NO_AC simulation (Fig. 6d) represents the most extreme difference relative to CNTL, with Nc only decreasing by ∼150–200 cm−3 between the cloud base and cloud top near the end of the simulation, and even more modest decreases at times prior to this. The KK simulation experiences an earlier onset of precipitation that realizes significantly reduced Nc by hour 12 (Fig. 6d). The KK scheme has a more aggressive accretion process than the Seifert and Beheng (2001) scheme (Stevens and Seifert, 2008), and this experiment uses an exponential size distribution (as opposed to a gamma distribution with a shape parameter of 3 as in all other experiments). The combination of these parameter choices leads to reduced RWP relative to CNTL and larger surface precipitation rates (not shown). Likewise, precipitation onset occurs earlier in 2X_AC (Fig. 6f) when autoconversion is scaled higher, which leads to the most significant scavenging of Nc by precipitation and a sharper decay of the system.
For the purpose of discussing system evolution using the bin scheme in comparison to the bulk scheme, liquid water in the bin scheme is arbitrarily separated using a radius threshold of 25 µm to categorize it as cloud and rain species. However, we note that further analysis herein will make no such separation (unless otherwise stated). There are notable differences between the BIN experiment (Fig. 6g) and CNTL. Cloud droplet number concentrations are higher in BIN throughout the entire profile, indicating more efficient aerosol activation in BIN relative to CNTL. Turbulent enhancement of collision–coalescence (BIN_TURB; Fig. 6h) results in slightly earlier precipitation onset that decreases Nc slightly above 4 km near the end of the simulation. Scaling turbulent enhancement by a factor of 10 (BIN_TURB_10X; Fig. 6i) enhances precipitation further and scavenges smaller drops more efficiently.
4.3 Comparison of simulations and RSP retrievals
Simulated CTH is calculated by integrating optical depth (τ) from the top of the domain downward until it exceeds a threshold value of 1 (to match the assumed τ threshold of RSP), where τ(z) is calculated following, for example, Hansen and Travis (1974) and Stephens (1978):
where βext is the extinction coefficient, Qext is the dimensionless extinction efficiency (assumed to be 2), and dz is the height difference across a given level. For the bulk scheme, (also used for Reff and νeff) is reconstructed using the gamma distribution parameters and includes contributions from both cloud and rain species. The range of drop radii is chosen to correspond to the 50 bins used by the bin scheme (see Sect. 3.2.2). Drop number concentration is the sum of the cloud and rain species in the bulk scheme. Effective radius and variance are calculated following Eqs. (3) and (4), respectively, and are integrated to an upper size limit of r=100 µm – the assumed size threshold for the RSP. Implications for this truncation size are discussed below.
Cloud-top Nd, Reff, and νeff are then calculated using an extinction weighting following
where Reff in Eq. (9) is the local grid point value integrated to a size limit of r=100 µm. Equations (8)–(10) represent the weighting between diffuse cloud top and a typical step increase in optical depth across the layer we define explicitly as the cloud top (i.e., when accumulated τ exceeds a value of 1 from the domain top), which is consistent with the assumed RSP retrievals (e.g., Alexandrov et al., 2012a).
Profile distributions of cloud-top Nd, Reff, and νeff for the CNTL and BIN_TURB_10X simulations are shown in Fig. 7. The latter is chosen as it represents the most appropriate implementation of turbulence-enhanced collision–coalescence with the DHARMA model; it also exhibits the most efficient precipitation formation among the three bin experiments. Cloud-top statistics are accumulated across the last 3 h of the simulation to capture the effect of precipitation that was active in the observed system (see Fig. 2a) and to roughly represent flight timing that corresponds to initialization time of the NU-WRF mesoscale simulation used for DHARMA initial conditions. Median observed in situ values are also shown as green lines, along with simulated “in situ” values in orange (i.e., conditioned only on “cloudy” grid points where LWC>0.1 g m−3, the same as for the FFSSP). For the bulk scheme, these simulated “in situ” values include only the cloud species in order to mimic observed subjective sampling of cloud cores (i.e., minimizing influence from rain-dominant grid points). Similarly for the bin scheme, these lines represent only cloudy grid points where the total liquid drop number concentration exceeds 1 cm−3 (based on the minimum Nd measured by the FFSSP).
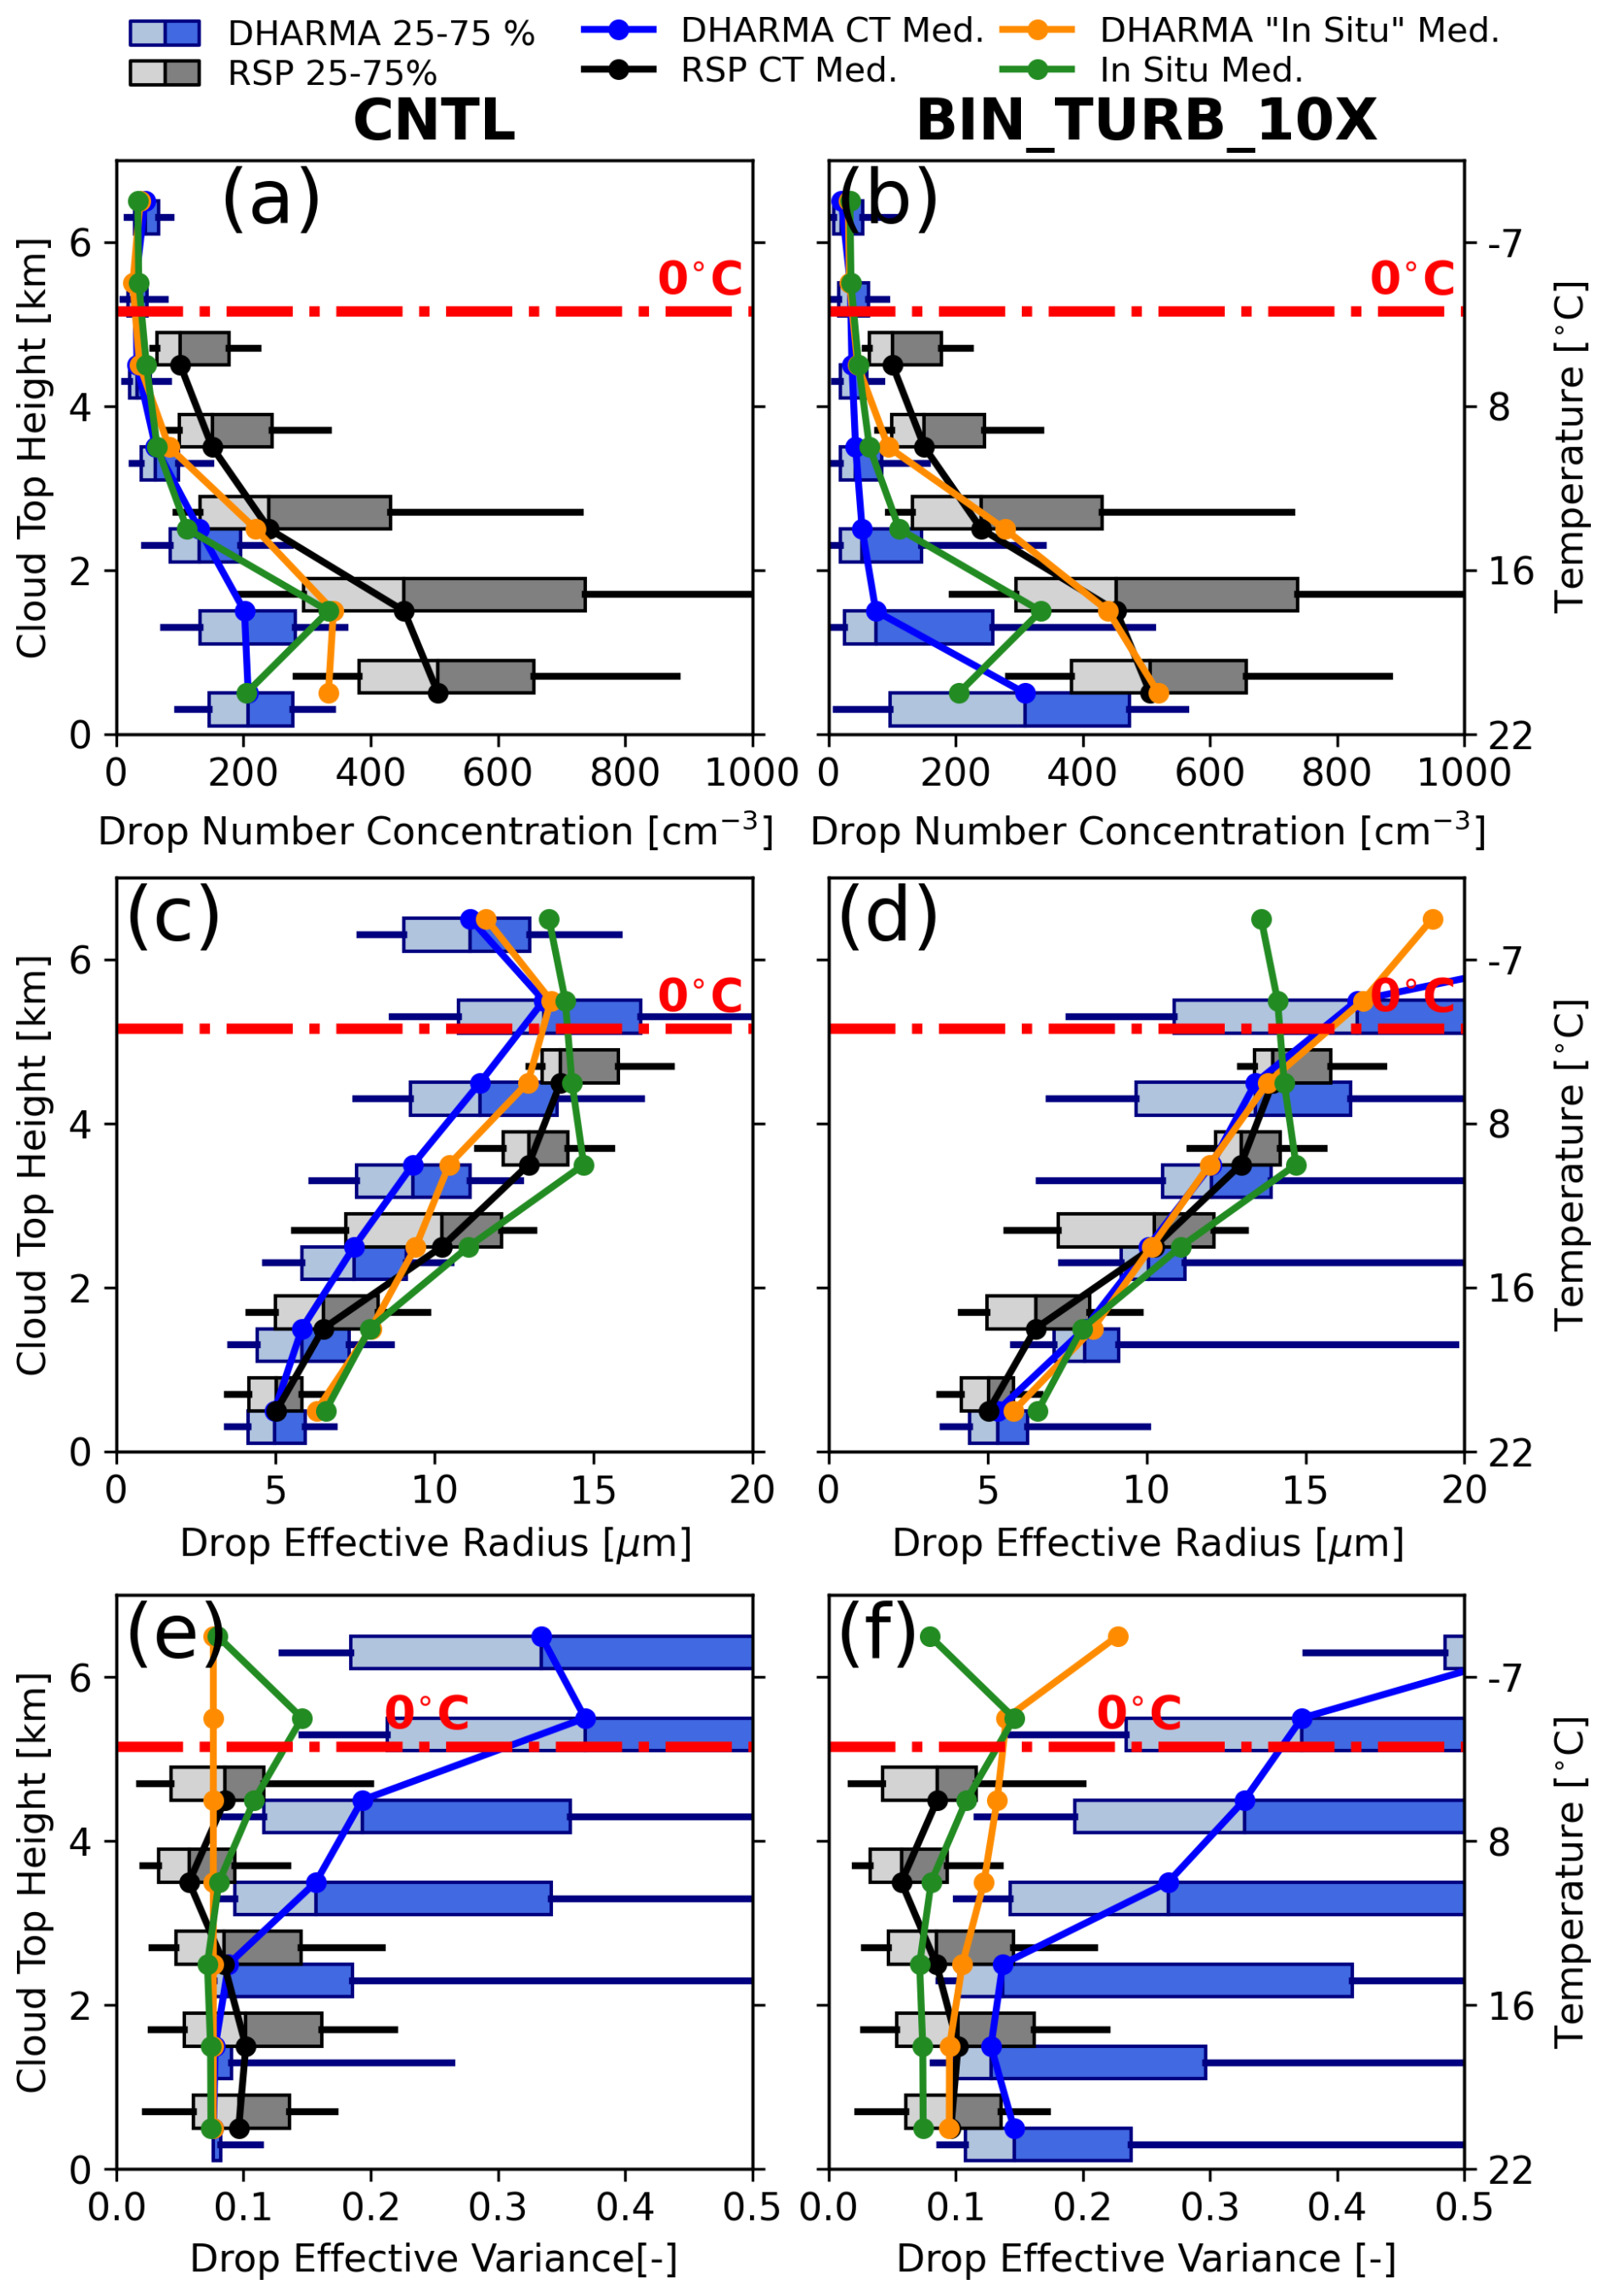
Figure 7Profiles of cloud-top (a, b) drop number concentration, (c, d) effective radius, and (e, f) effective variance for the CNTL simulation (a, c, e) and the BIN_TURB_10X simulation (b, d, f) as a function of cloud-top height. Green lines show the median values from FFSSP in situ measurements. Orange lines show the simulated median “in situ” values (conditioned only on cloudy grid points). For cloud-top quantities (with robust observational samples), boxes show the interquartile range and whiskers show the 10th and 90th percentiles. Distributions from simulations are across the entire domain for the last 3 h of the simulation. The height bin width is 1 km with the RSP and simulations offset relative to the mid-bin for visibility.
For both CNTL and BIN_TURB_10X, simulated cloud-top Nd (Fig. 7a and b) decreases monotonically with increasing CTH qualitatively similarly to RSP, but values are significantly lower than retrieved ones. Consistent with the expectation for Nd to be higher in cloud cores than at the cloud top, simulated “in situ” median Nd is higher than simulated cloud-top Nd by up to a factor of ∼2 for CNTL and by up to a factor of 8 for some mid-level altitude bins in BIN_TURB_10X, converging together with “in situ” measurements only at the highest altitudes where core regions are not far from cloud tops.
Simulated cloud-top Reff agrees better with observations in general (Fig. 7c and d). Cloud-top Reff in CNTL is slightly smaller than RSP retrievals at most altitudes, whereas BIN_TURB_10X generally agrees well with RSP medians at all altitudes, and both schemes appropriately increase cloud-top Reff with increasing CTH. Simulated “in situ” Reff in CNTL is larger than cloud-top Reff and also agrees fairly well with FFSSP Reff. These results imply that cloud-top Reff is better constrained by RSP than Nd for the case studied here.
Finally, cloud-top νeff becomes much larger with increasing height above 3 km in both simulations compared to RSP (Fig. 7e and f), which agrees both qualitatively and quantitatively with the profiles shown by Alexandrov et al. (2020, their Fig. 6). By contrast, CNTL produces a constant profile for simulated “in situ” νeff (cloud species only) ∼0.075, which is structurally required using a constant shape parameter in the bulk scheme (i.e., any variability in cloud-top νeff from the prescribed cloud-species value arises due to the coexistence of cloud and rain species in contributing grid cells, which occurs often near the cloud top). For BIN_TURB_10X, “in situ” νeff increases slightly with altitude, as seen in FFSSP observations, but is offset a bit more, indicating DSDs that are broader than observed. “In situ” νeff in BIN_TURB_10X is still smaller than the cloud-top values since this profile conditions grid points to omit precipitation-dominant grid cells, which was not a condition for cloud-top sampling. Overall, the differences between simulated cloud-top and “in situ” νeff imply that cloud-top identification using Eq. (10) is rather sensitive to drops in the precipitation size range, even at and near the cloud top and to a greater degree at the highest altitudes where both Nd and Reff appear reasonably well reproduced. Indeed, decreasing the size cutoff for cloud-top distributions in Eqs. (8)–(10) from r=100 to 50 µm significantly decreased the cloud-top νeff values for both CNTL and BIN_TURB_10X but did not have a large impact on cloud-top Nd and Reff (not shown).
Taking the results shown in Fig. 7 as a whole, differences between “in situ” and cloud-top sampling of Nd and νeff emerge from this work as a factor that is beyond our scope to resolve. Simulation numerical deficiencies could be to blame, but previous work remains limited to date. For example, finite vertical grid spacing (100 m) may not capture a realistic transition of DSDs from the cloud core to cloud top (e.g., Sato et al., 2018). However, we did not see any gross overestimation of Reff compared with either in situ observations or cloud-top retrievals (Sato et al., 2018; cf. their Fig. 11). Related to this, numerical diffusion due to vertical advection and spurious evaporation of cloud droplets near cloud edges in these Eulerian schemes may be a source for low-biased cloud-top Nd, as documented by Chandrakar et al. (2022), especially for the bin scheme. However, that study did not include a cloud-top sampling approach; at the highest altitudes (which are near cloud tops by definition), bin Nd and Lagrangian Nd largely converge (Chandrakar et al., 2022; cf. their Fig. 12). Another plausible explanation for the substantially larger cloud-top νeff in simulations at higher altitudes may be related to the model's enforced assumption of homogeneous mixing at subgrid scales, whereby droplet number is preserved during entrainment (Andrejczuk et al., 2009). This may allow a broader range of relevant droplet sizes – including large, slowly evaporating ones – to persist near the cloud top, leading to artificially broad DSDs within the RSP's sensitive size range (Pinsky et al., 2016). Ultimately, comparison of retrieval-dependent cloud-top sampling (comparable to RSP and PACE measurements) and in-cloud sampling across bulk, bin, and Lagrangian schemes in a future model intercomparison study such as the ICMW CAMP2Ex case would be helpful to establish the roles of microphysics and dynamics schemes from both structural and numerical standpoints. We note that results could also depend on the case setup insofar as it captures the progressive life cycles of multiple cumulus towers and their decaying outflow, reflected in the RSP retrieval statistics here. In CNTL, a doubling of domain size did not produce quantitatively different results (not shown), suggesting that the frequency of cold-pool collisions driving low-level updrafts and cloud-base activation is not likely a limitation in the current setup. On the other hand, the larger differences between “in situ” and cloud-top Nd and νeff simulated in BIN_TURB_10X versus CNTL at some elevations could be attributable to scheme-dependent structural differences in the outflow and decay of early cumulus towers that failed to reach the highest altitudes. We finally note potential limitations on the observational side, whether it be a breakdown in assumptions of the RSP-retrieved Nd, sparse in situ samplings, or both, as discussed in Sect. 4.1.
Median profiles of cloud-top Nd, Reff, and νeff for all simulations are shown in Fig. 8, with the inclusion of Nd in units of the number mixing ratio (kg−1) in Fig. 8b and f. This air-density-dependent conversion is performed to control for the impacts of dilution by expansion, which was shown by Morrison et al. (2022) to account for 41 % of Nd reduction between 4 and 9 km in a high-based congestus simulation. In doing so, we isolate the relative impacts on Nd via collision–coalescence and aerosol profile representation using the sensitivity experiments, with any remaining changes in the profile attributed to dilution by entrainment or, conversely, subsequent activation of cloud droplets above the cloud base. For the bulk simulations (Fig. 8b), cloud-top Nd follows an intuitive pattern. The 2X_AC and KK simulations produce a sharper reduction of Nd with height due to more aggressive precipitation formation. Conversely, the NO_AC simulation produces a much more gradual decrease due to no precipitation, while FIXED_AERO produces a shallower slope due to less efficient precipitation owing to entrainment of greater concentrations of larger (more readily activated) aerosols at higher altitudes. At the extreme end, the FIXED_AERO_NO_AC profile shows no significant reduction of Nd at all and an increase with height above 3.5 km on a mass mixing ratio basis. There is a ubiquitous low bias of simulated cloud-top Nd relative to RSP, as discussed above, including at the highest elevations where CNTL and BIN_TURB_10X cloud-top Nd converge to both observed and simulated “in situ” Nd. Profiles of cloud-top Reff (Fig. 8c) for the sensitivity simulations generally follow an inverse relationship from Nd relative to CNTL. That is, KK and 2X_AC produce larger Reff, while NO_AC, FIXED_AERO, and FIXED_AERO_NO_AC produce smaller Reff compared to CNTL. For cloud-top νeff, the three simulations without autoconversion produce a constant vertical profile because they are limited to the cloud species' fixed shape parameter, while the simulations with more aggressive precipitation formation produce larger νeff. All of the bin simulations produce lower cloud-top Nd compared to RSP but similar cloud-top Reff, with BIN_TURB_10X agreeing best, consistent with Chandrakar et al. (2024) demonstrating the importance of turbulence broadening in congestus simulations. Finally, cloud-top νeff is high-biased in all bin simulations relative to RSP. In the next section, we utilize full in situ size distributions to further evaluate the results shown here.
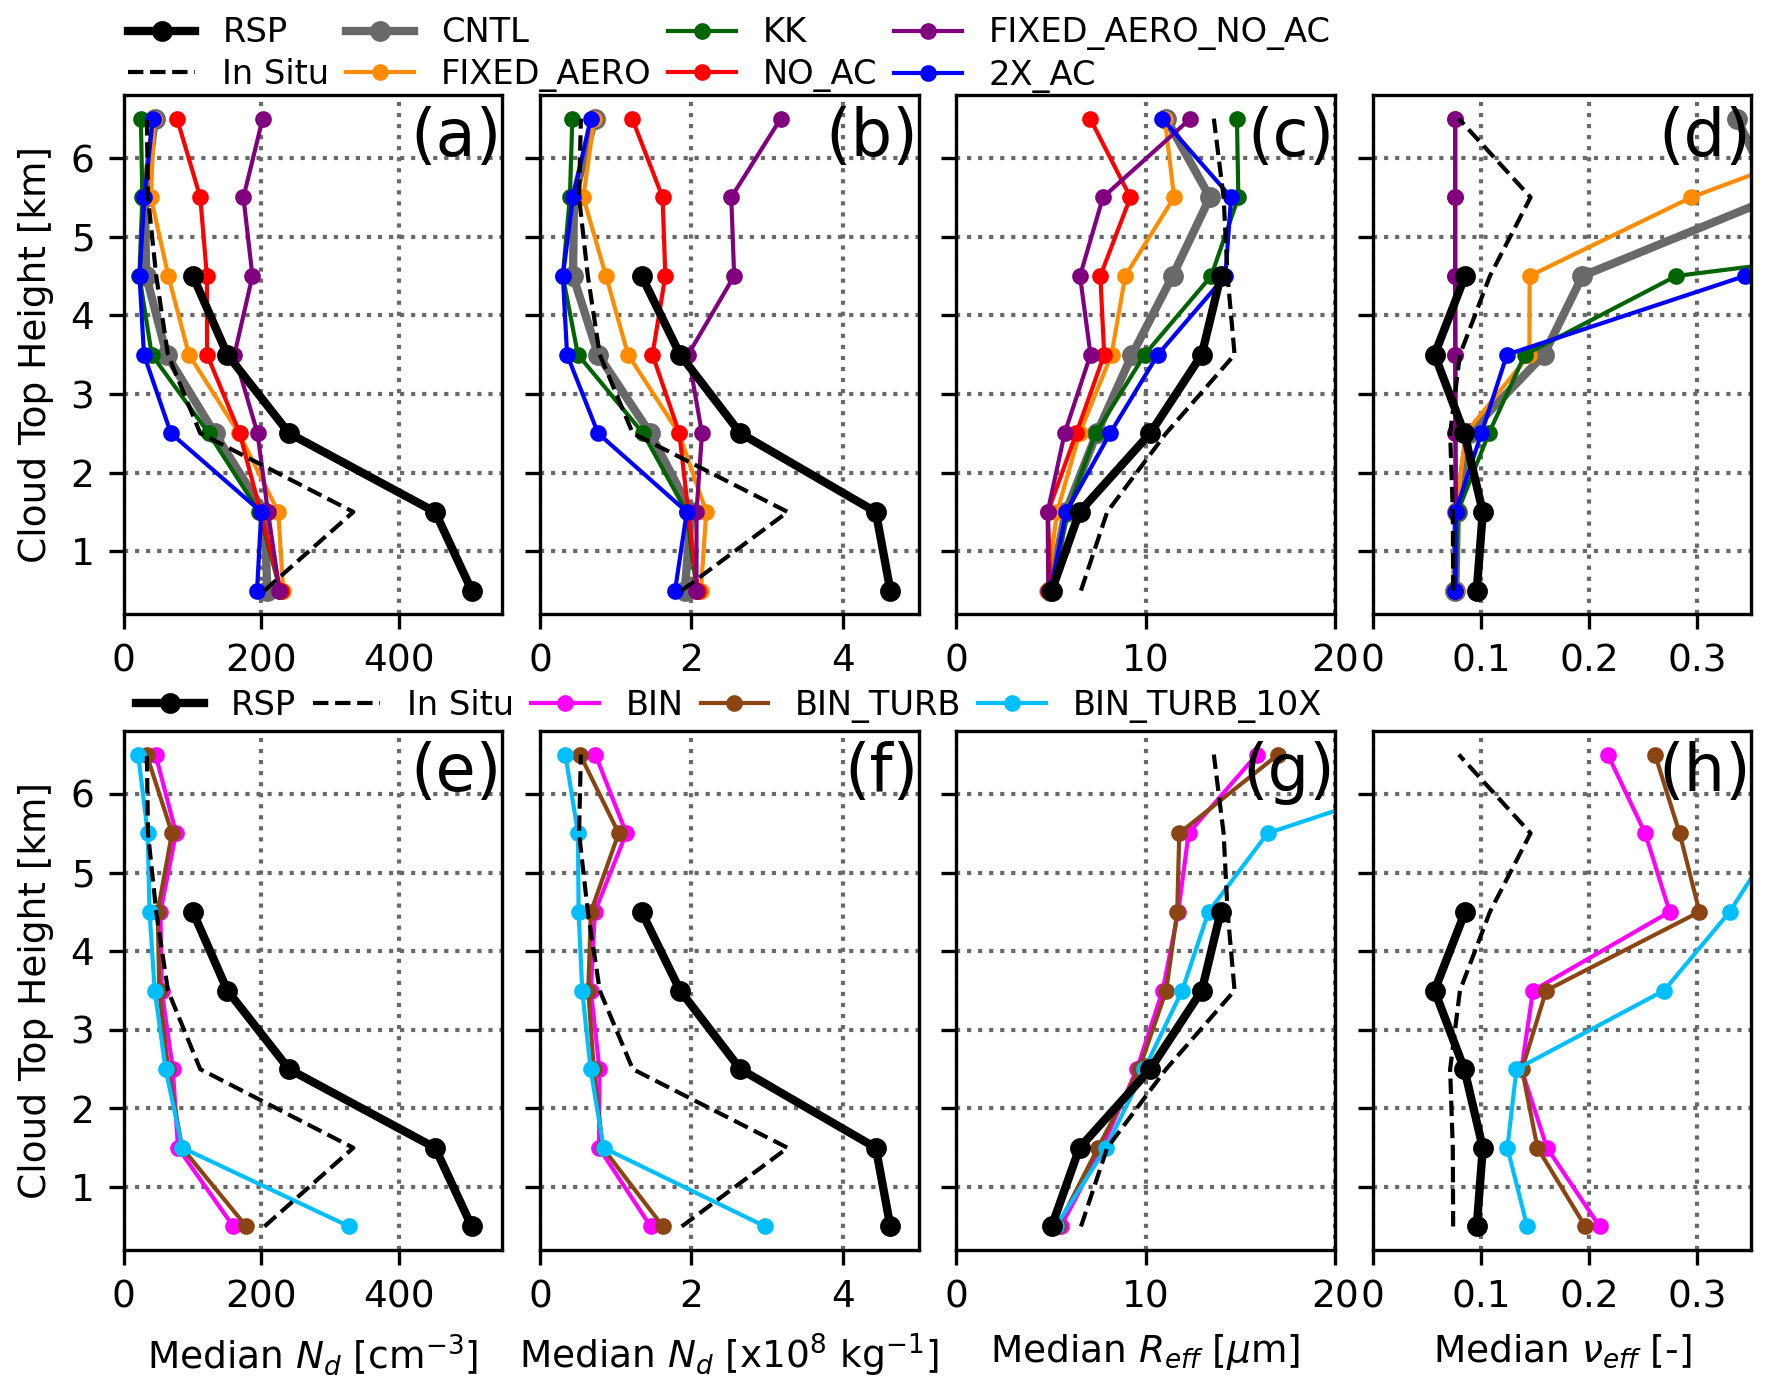
Figure 8Profiles of median (a, e) Nd in units of cm−3, (b, f) Nd in units of kg−1, (c, g) Reff, and (d, h) νeff as a function of cloud-top height for the RSP (solid black) and FFSSP in situ measurements (dashed black), showing bulk simulations (a–d) and bin simulations (e–h).
4.4 Comparison of simulated and in situ DSDs
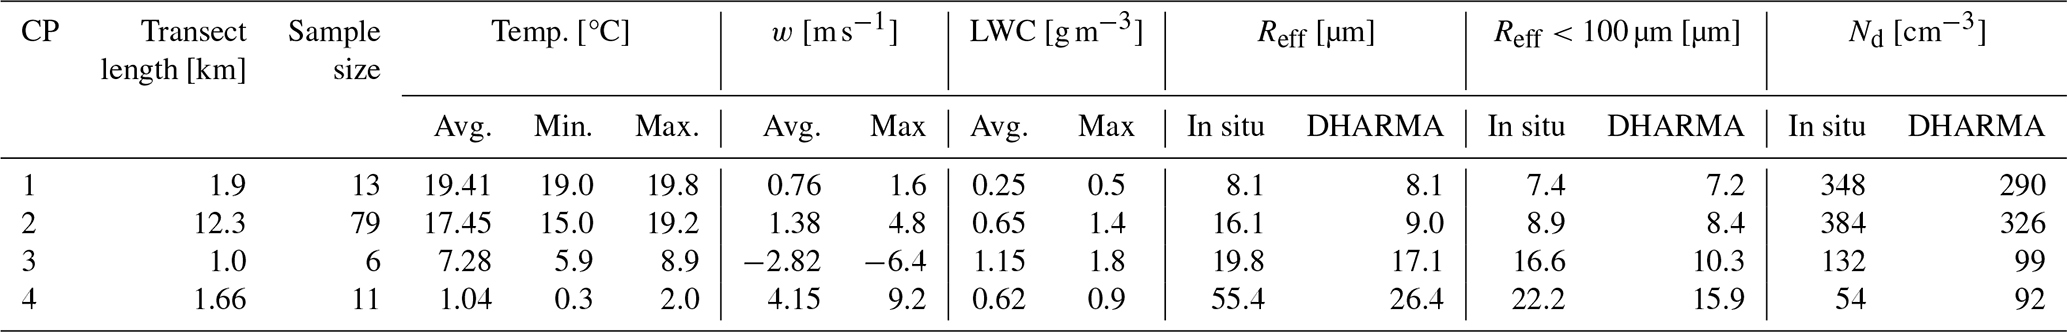
In situ DSDs are analyzed using a methodology that composites instrument measurements of particle size across contiguous horizontal transects with LWC exceeding 0.1 g m−3, measured by the Nevzorov hot-wire probe, referred to as “cloud passes”. Cloud passes were chosen to span a temperature range from the cloud base to the 0 °C level with transects long enough to obtain robust sample sizes. A thermodynamic, kinematic, and microphysical summary of the four selected cloud passes is given in Table 2. The first cloud pass (hereafter CP) was performed in a relatively weak updraft a few hundred meters above the cloud base at 19.41 °C with a transect length of ∼2 km. The second CP was a long ascent (∼12 km horizontally) through a moderate updraft cluster that spanned a temperature range from 15–19 °C (mean temperature of 17.45 °C). The third CP at 7.28 °C was performed ∼300 m below the cloud top in a downdraft with a 1 km long transect. Finally, the fourth CP was performed in a relatively strong updraft (maximum vertical velocity, w, of 9.2 m s−1) at 1.04 °C with a transect length of ∼1.5 km. Composite DSDs are constructed by stitching together the FFSSP, 2D-S10, and HVPS probes following the methodology outlined in Appendix D. For each size bin of a given instrument, the composite DSD is averaged across each 1 Hz sample within the CP before stitching. This methodology yields four continuous size distributions in varying thermodynamic and kinematic environments that are used as an observational target for the simulations. Each in situ sample should be considered representative of one single CP realization from the simulations, and thus the goal herein is to test whether a given observed CP DSD falls within the range of potentially encountered CP DSDs. Uncertainties associated with performing composite DSDs are further discussed in Appendix D.
Table 2Thermodynamic, kinematic, and microphysical description of four selected cloud passes used to construct composite drop size distributions (DSDs). Cloud passes are defined as contiguous segments with LWC>0.1 g m−3. Values listed for DHARMA are for the CNTL simulation and are from the mean DSD conditioned on average vertical velocity (see text). νeff is discussed in the text because of its sensitivity to size thresholding. The maximum vertical velocity for CP 3 is the minimum downdraft speed. Individual DSDs from each instrument and a related discussion are provided in Appendix D.
For simulations, we focus only on CNTL and BIN_TURB_10X. Simulated CPs are identified at the temperature level of each observed CP using the same LWC thresholding and are selected between hours 9–12. For each cloud pass, the continuous size distribution (including both cloud and rain species for CNTL) is averaged across all grid points within the CP to yield a single sample. Drop size distributions are dynamically constrained by conditioning CPs, where the average CP w is within 50 % of the observed average CP w. Tests were performed with no conditioning and with conditioning on maximum CP w, yielding negligible qualitative differences but a narrowing of the simulated CP DSD range, which motivated including the dynamical condition. Drop size distributions for CNTL are shown in Fig. 9a–d (mean DSD in red, individual CP DSDs in transparent black) along with observed DSDs (light blue). The CNTL simulation produces the two prominent size modes at ∼10 µm (so-called “cloud” mode) and ∼0.4–0.5 mm (“rain” mode) with varying degrees of accuracy. The most obvious discrepancy evident in all CNTL CP samples is their more pronounced bimodality and a relative dearth of Nd in the size range between ∼50–200 µm (which may be considered a “drizzle” mode), which would be difficult to reproduce in CNTL given the structural separation of two species in the bulk scheme. At the warmer temperatures, the peak of the mean cloud-mode Nd is consistently smaller than observed. Overall, the CNTL simulation appropriately captures the observed broadening of the DSD with decreasing temperature (increasing height) demonstrated in Reid et al. (2023).
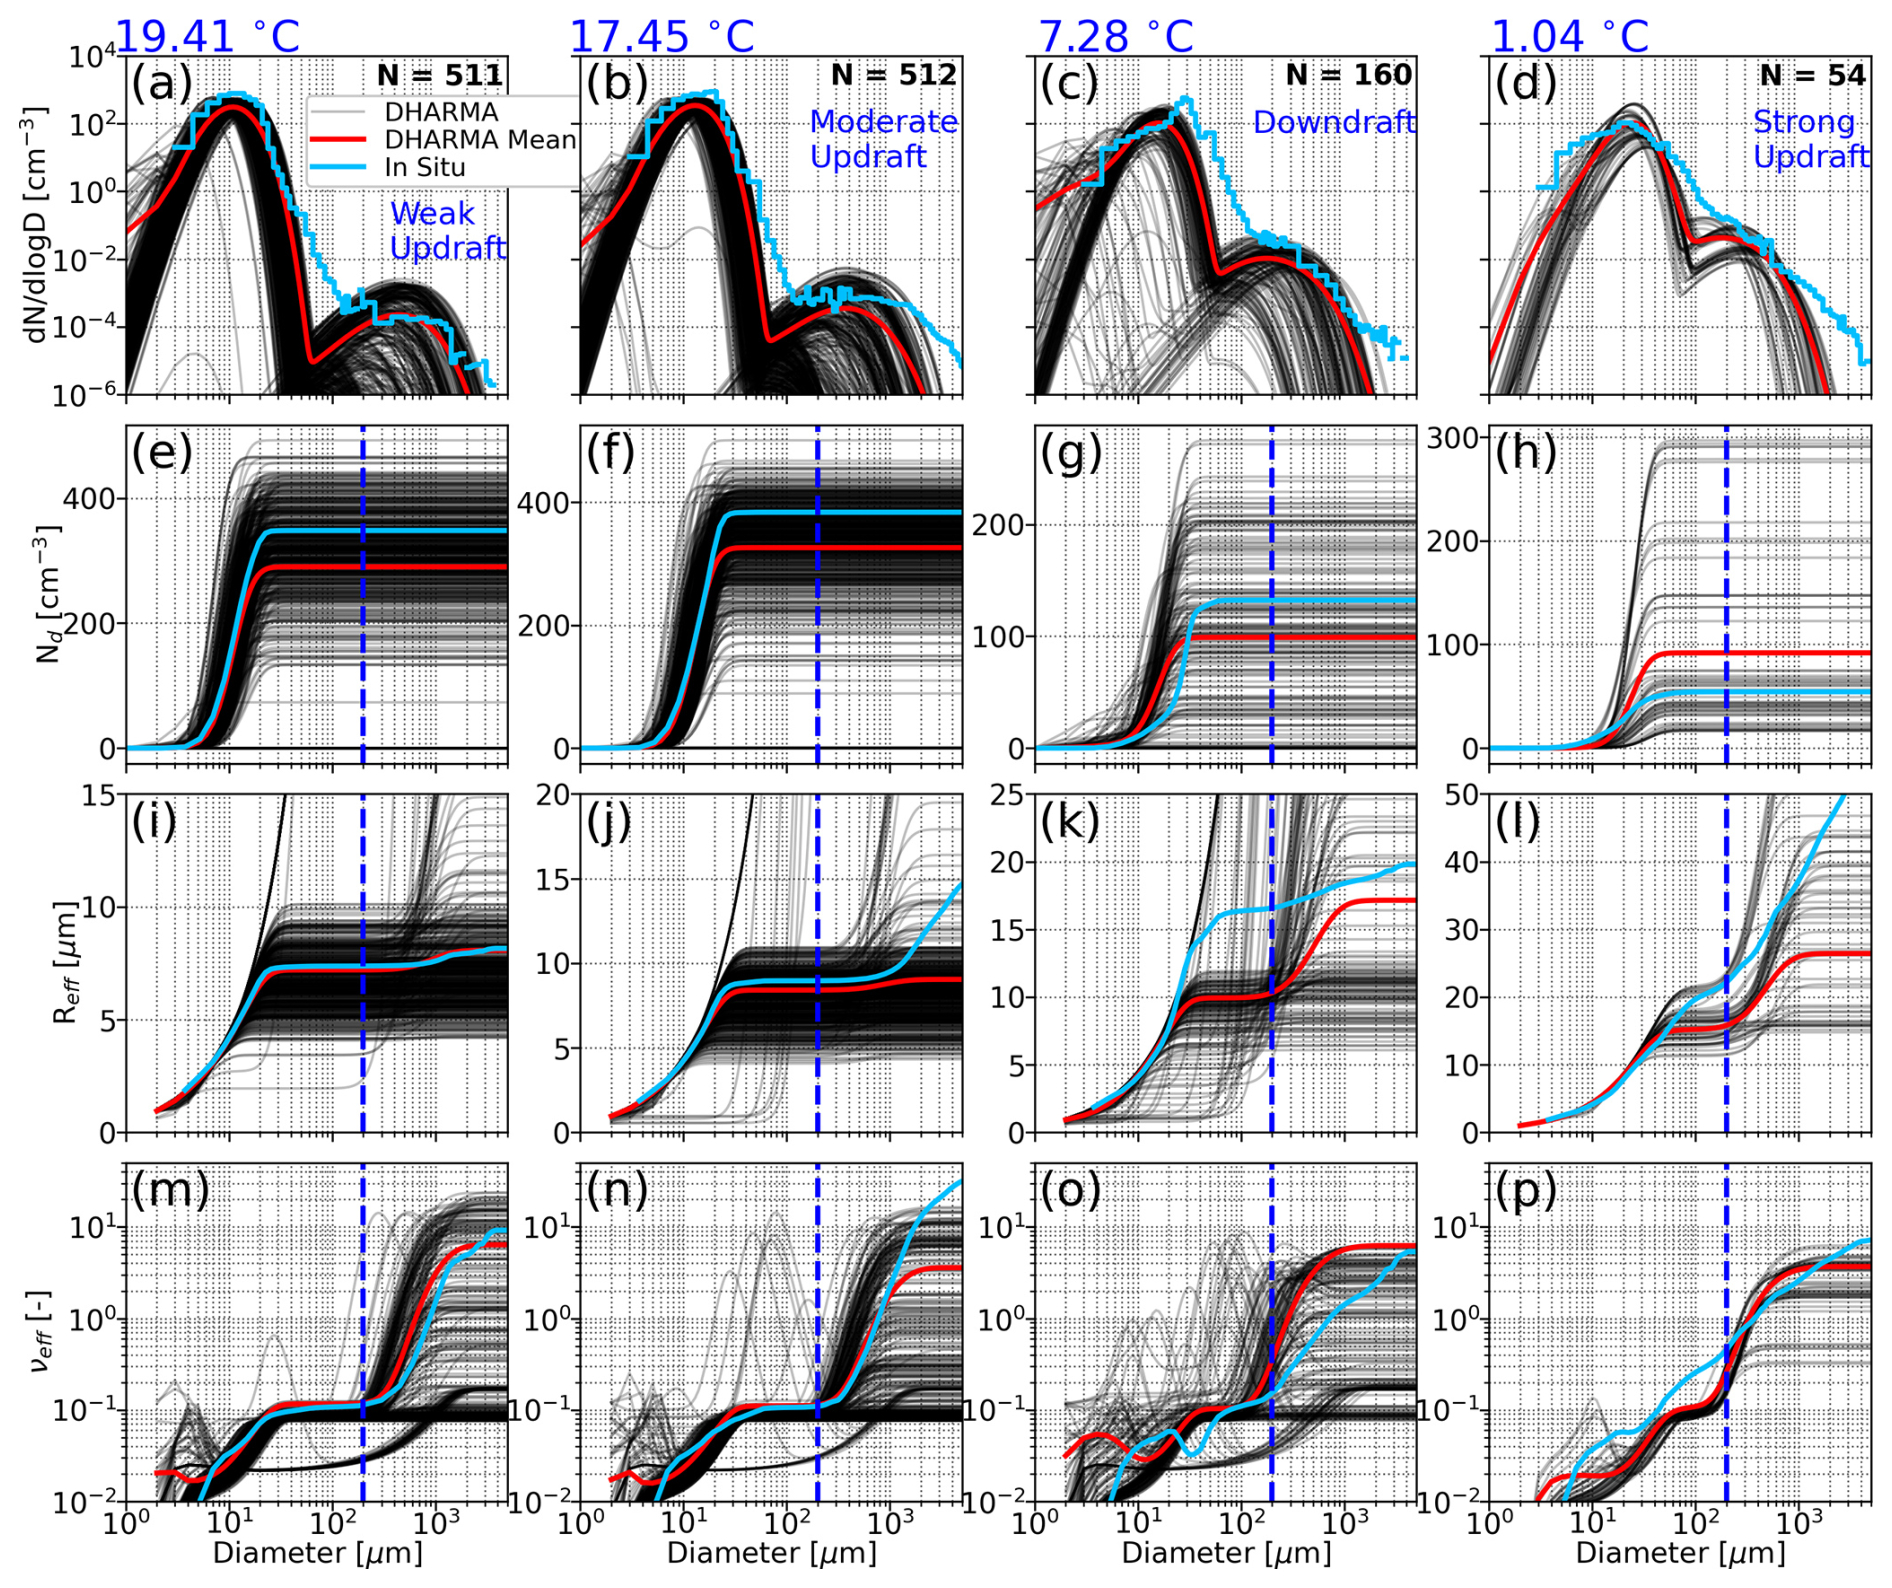
Figure 9Drop size distributions (DSDs) from the Learjet (light blue), individual cloud passes from CNTL (black), and the mean DSD from CNTL (red) for cloud passes identified at temperatures of (a) 19.41 °C, (b) 17.45 °C, (c) 7.28 °C, and (d) 1.04 °C. Simulated cloud passes are conditioned to be within 50 % of the observed cloud-pass-average vertical velocity. Sample sizes represent the number of simulated cloud passes for a given temperature level. Cumulative integrations are shown for (e–h) Nd, (i–l) Reff, and (m–p) νeff. The vertical dashed blue line indicates the assumed threshold for RSP retrievals.
To better interpret how DSD structure impacts computations of Nd, Reff, and νeff, the cumulative integration of these quantities is shown for each cloud pass in the bottom three rows of Fig. 9. A vertical dashed line is placed at a diameter of 200 µm to visualize the assumed size threshold for cloud-top retrievals. For all temperatures besides the coldest, the mean simulated DSD produces smaller Nd than observed (Fig. 9e–g), consistent with cloud-top comparisons in Fig. 7a, while the individual DSDs encompass the observed DSD. At the coldest temperature, the mean simulated cumulatively integrated Nd is smaller than observed, but the mean is skewed, evident by the individual DSDs clustering around the observed DSD. In both simulations and observations, the cumulatively integrated Nd is very sensitive to a narrow diameter range that increases from ∼5–20 µm at the warmest temperature to ∼10–40 µm for the coldest, broadest DSD, becoming completely saturated at larger sizes.
The mean cumulatively integrated Reff is captured very well by CNTL for the two warmest temperatures (Fig. 9i and j) but is lower than observed for the colder temperatures, which is consistent with cloud-top comparisons (Fig. 7c). The individual DSDs again bound the observed DSD, albeit without ever reproducing the observed pattern of increase with diameter at the colder temperatures. Cumulatively integrated Reff relevant to cloud-top sampling is most sensitive to a diameter range between the lower size limit and ∼30 µm for the two warmer temperatures. The relatively broader simulated DSDs at colder temperatures show a sensitivity for the “cloud mode” up to ∼50 µm, with an additional abrupt increase for sizes larger than 200 µm as the precipitation mode grows. Interestingly, there is little size contribution to Reff within the dearth of Nd in the drizzle size range (50–200 µm) even for the observed DSD, implying that except for the coldest temperature, the source size region for biases in Reff relative to RSP originates largely within the cloud mode. Therefore, while Nd is always insensitive to truncation at the size threshold for RSP retrievals in this case, integrated Reff can be sensitive to the truncation threshold when the DSDs are sufficiently broad.
Finally, cumulatively integrated νeff is shown in Fig. 9m–p. At the warmer temperatures, νeff exhibits distinct plateaus representing the cloud and rain modes, with the value of the cloud mode closely matching the observed value that is also bounded well by the cluster of individual simulated samples. This is consistent with the good agreement between observed and simulated “in situ” profiles in Fig. 7. At colder temperatures, νeff does not present clearly as two distinct modes, values at the assumed RSP threshold represent a continuous increase with size, and νeff appears sensitive to the presence of the drizzle/rain mode. This is consistent with the cloud-top profiles shown in Fig. 7 and implies that cloud-top representations of νeff that are comparable to RSP are sensitive to the structure of the individual underlying DSDs if they contain drizzle mode drops.
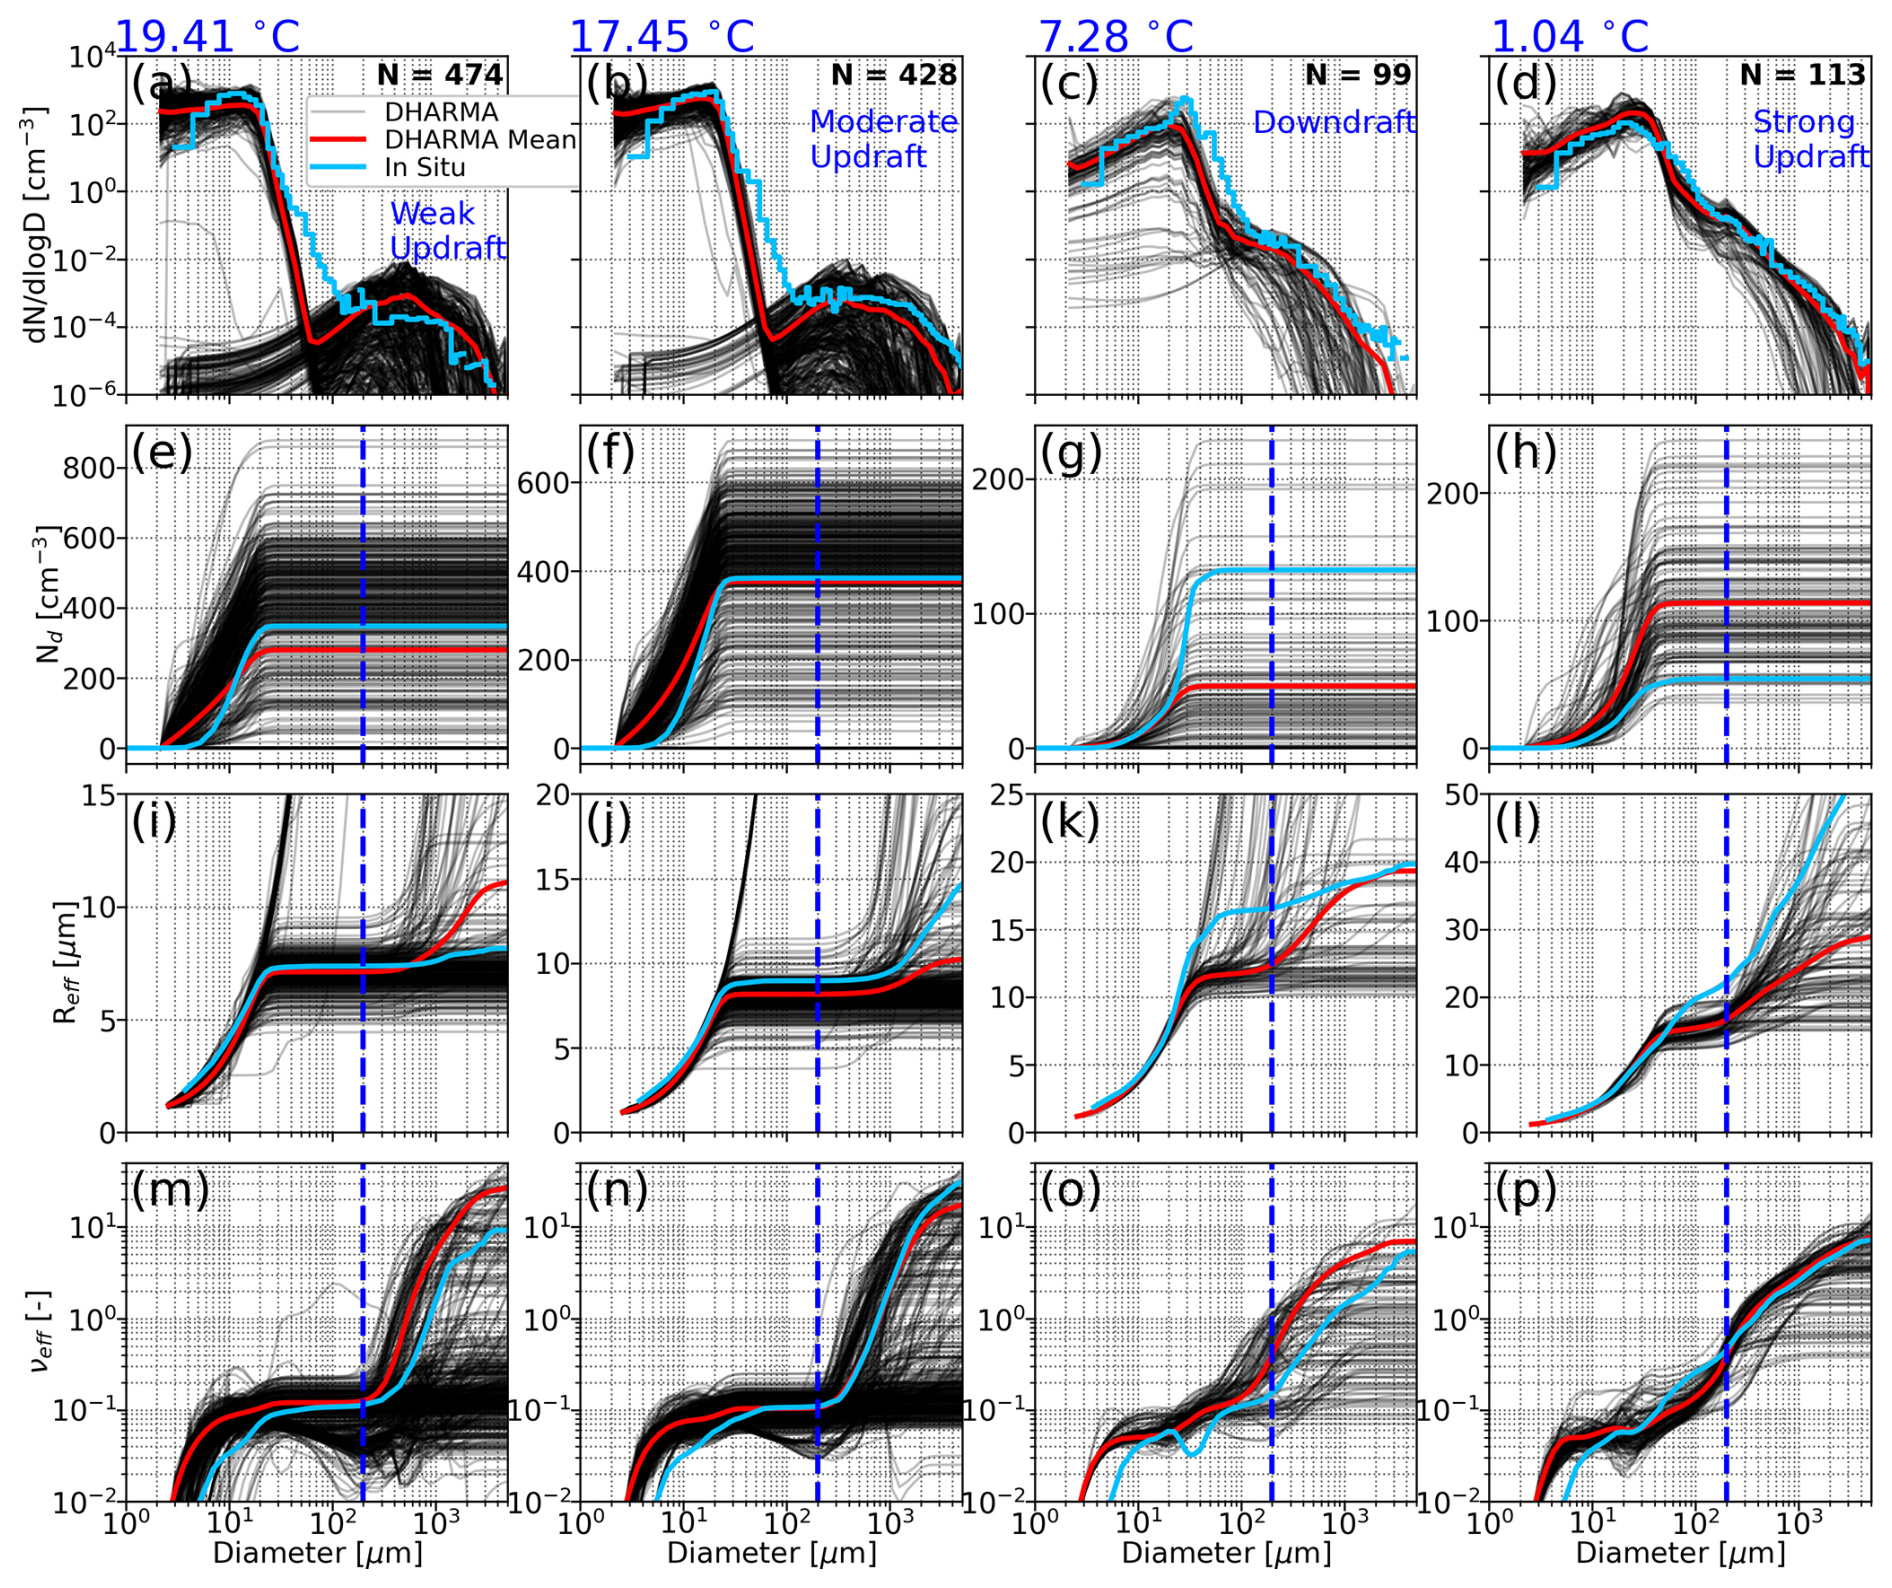
An identical CP analysis is performed for the BIN_TURB_10X simulation (Fig. 10). The bin-scheme DSDs are distinctly more bimodal at warmer temperatures compared to the in situ DSDs, which is quite similar to the bulk scheme DSDs. A persistent bias across all temperature levels is the bin scheme producing a larger number of cloud droplets smaller than ∼10 µm, particularly at warmer temperatures. We note that this extension towards the smallest size bins is also visible in Lagrangian particle-based simulations of a CAMP2Ex case in Chandrakar et al. (2024) (see their Fig. 3). At the coldest temperature (Fig. 10d), the bin scheme notably produces a more continuous transition from smaller to larger sizes, as in observations, due to the scheme's freedom from parametric constraints. The cumulatively integrated Nd for the bin scheme captures the enhanced influence of sizes below 10 µm for the warmest temperatures and is saturated at sizes ∼20–30 µm, as in the bulk scheme and observations. Cumulatively integrated Reff agrees very well with in situ DSDs at warmer temperatures and better represents observed Reff than the bulk scheme at colder temperatures, consistent with cloud-top comparisons. As with the bulk scheme, cumulatively integrated Reff is largely insensitive to the drizzle mode except for the coldest and broadest DSDs. Finally, cumulatively integrated νeff shows that the cloud-mode portion of the DSDs for all temperatures tends to be broader than observed, which is consistent with the broad, flattened peak in all the DSDs for diameters <10 µm and with the simulated “in situ” profiles shown in Fig. 7f. Similarly to the bulk scheme, νeff at the two colder temperatures is very sensitive to the size thresholding for which νeff is calculated, where the assumed RSP threshold exists at the point of steady increase in νeff with size. Similarly to the cloud-top distributions in Fig. 7f, the bin scheme clearly represents an increase in νeff with altitude, reflecting DSD broadening due to collision–coalescence. Overall, in situ DSD evaluation shows that biases in Nd, Reff, and νeff all originate at rather small sizes below 30 µm, while Reff and νeff can be sensitive to larger sizes if the DSD is sufficiently broad. Potential numerical and structural issues with each scheme, along with size thresholds determining what is observed by the RSP, can contribute to biases of all three variables at the cloud top.
4.5 Thermal-based evaluation
We next present a more objective, process-based investigation of DSD evolution at the source of cloud droplet production – cumulus thermals (hereafter referred to simply as thermals; Hernandez-Deckers et al., 2022; Matsui et al., 2024). While thermal microphysics properties can represent either in-cloud or cloud-top microphysics depending on the locations and life cycle stages, their successive evolution can provide a source mechanism for droplet activation and the drizzle process, eventually characterizing cloud-top microphysics in convective clouds. Thermals are identified and tracked between hours 9–12 of the simulation for the CNTL and FIXED_AERO_NO_AC simulations only using 1 min simulation output, with the latter simulation chosen to control for the effects of the height-resolved aerosol PSD and collision–coalescence on modulating the Nd profile. The CNTL simulation yielded 278 thermals, while the FIXED_AERO_NO_AC simulation yielded 349 thermals. The mode of the thermal lifetime is 3 min, which is the minimum lifetime for a thermal to be considered valid, with a near-exponential decrease in thermal lifetime at larger values (not shown), which indicates that the majority of detected thermals are rather short-lived and is consistent with results from Hernandez-Deckers and Sherwood (2016, 2018). Thermals are composited in time relative to their maximum ascent rates (defined as time t=0) and are normalized by their radii (R). The evolution of composite thermals for the CNTL simulation in the X–Z plane between times min and min (i.e., 3 time steps prior to and after the central maximum ascent rate) is shown in Fig. 11. Of all thermals for each simulation, at least ∼20 % are represented at times min and min (or in other words, at least 20 % of thermals last 7 min or longer). The evolution of thermals in Fig. 11 is displayed by variables of vertical velocity (w), supersaturation (S), cloud water mass mixing ratio (qc), cloud water number mixing ratio (Nc; independent of the rain species), and rain water mass mixing ratio (qr).
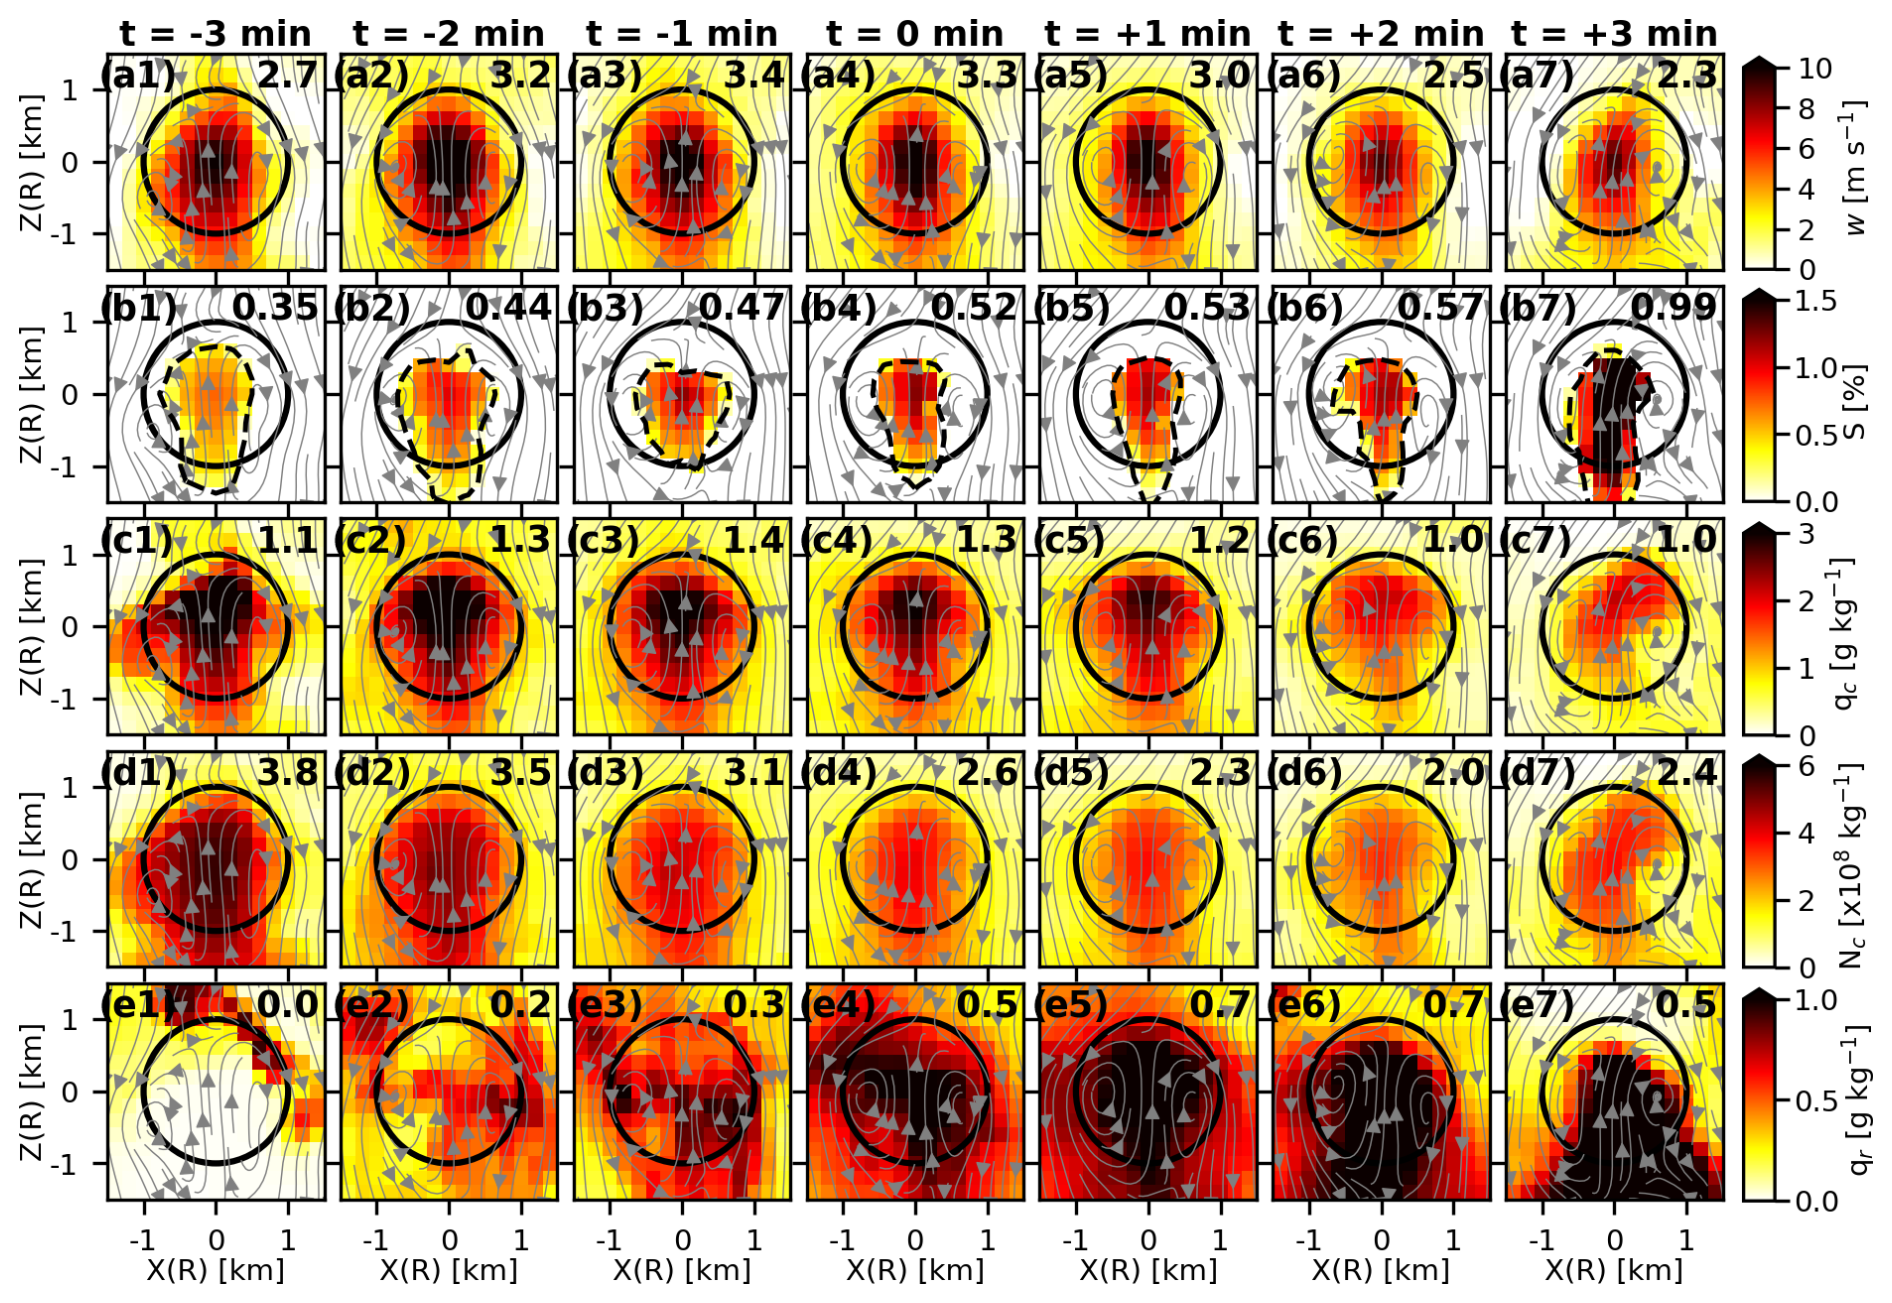
Figure 11Composite thermal evolution (left to right) for the CNTL simulation from 3 min prior to maximum ascent rate ( min, leftmost column) to 3 min after maximum ascent rate ( min, rightmost column), where maximum ascent rate is centered at t=0 min. Composites are normalized by thermal radius (R) and are displayed in the X–Z plane. Variables are distributed by rows: (a) vertical velocity (w), (b) supersaturation (S), (c) cloud water mass mixing ratio (qc), (d) cloud water number concentration mixing ratio (Nc), and (e) rain mass mixing ratio (qr). Gray streamlines are perturbation flow, and the black ring represents a normalized R=1. Values in the top-right corner of each panel are thermal-averaged values for a given time step. The dashed line in supersaturation panels indicates the contour where S=0.
Thermals in CNTL realize central w of at least 10 m s−1 (Fig. 11a1–a7) and continuous supersaturations at the center of the thermal throughout their lifetimes (Fig. 11b1–b7). The evolution of cloud water mass (qc) shows relatively large cloud water contents near the beginning of the thermal lifetime, while near the end ( min, Fig. 11c7), there is a shearing of maximum regions of qc towards the right side of the thermal. Consistent with the cloud-top evaluation, Nc decreases during thermal-centered evolution (Fig. 11d1–d7) and Reff increases (not shown). Supersaturations persist at the thermal center (Fig. 11b1–b7) and actually increase near the end of the thermal lifetime. The evolution of qr (Fig. 11e1–e7) shows that rain is largely absent in the initial time step and reaches a maximum at min, with a structure indicating significant unloading of rain.
The same thermal evolution is shown for the FIXED_AERO_NO_AC simulation in Fig. 12 but excluding qr evolution since autoconversion is neglected. Notably, vertical velocities and supersaturations are weaker in this simulation (Fig. 12a1–a7 and b1–b7, respectively). The Nc evolution (Fig. 12d1–d7) shows a negligible change in Nc throughout the thermal's lifetime, with the clearest difference being the shift in the axis of maximum Nc due to shear.
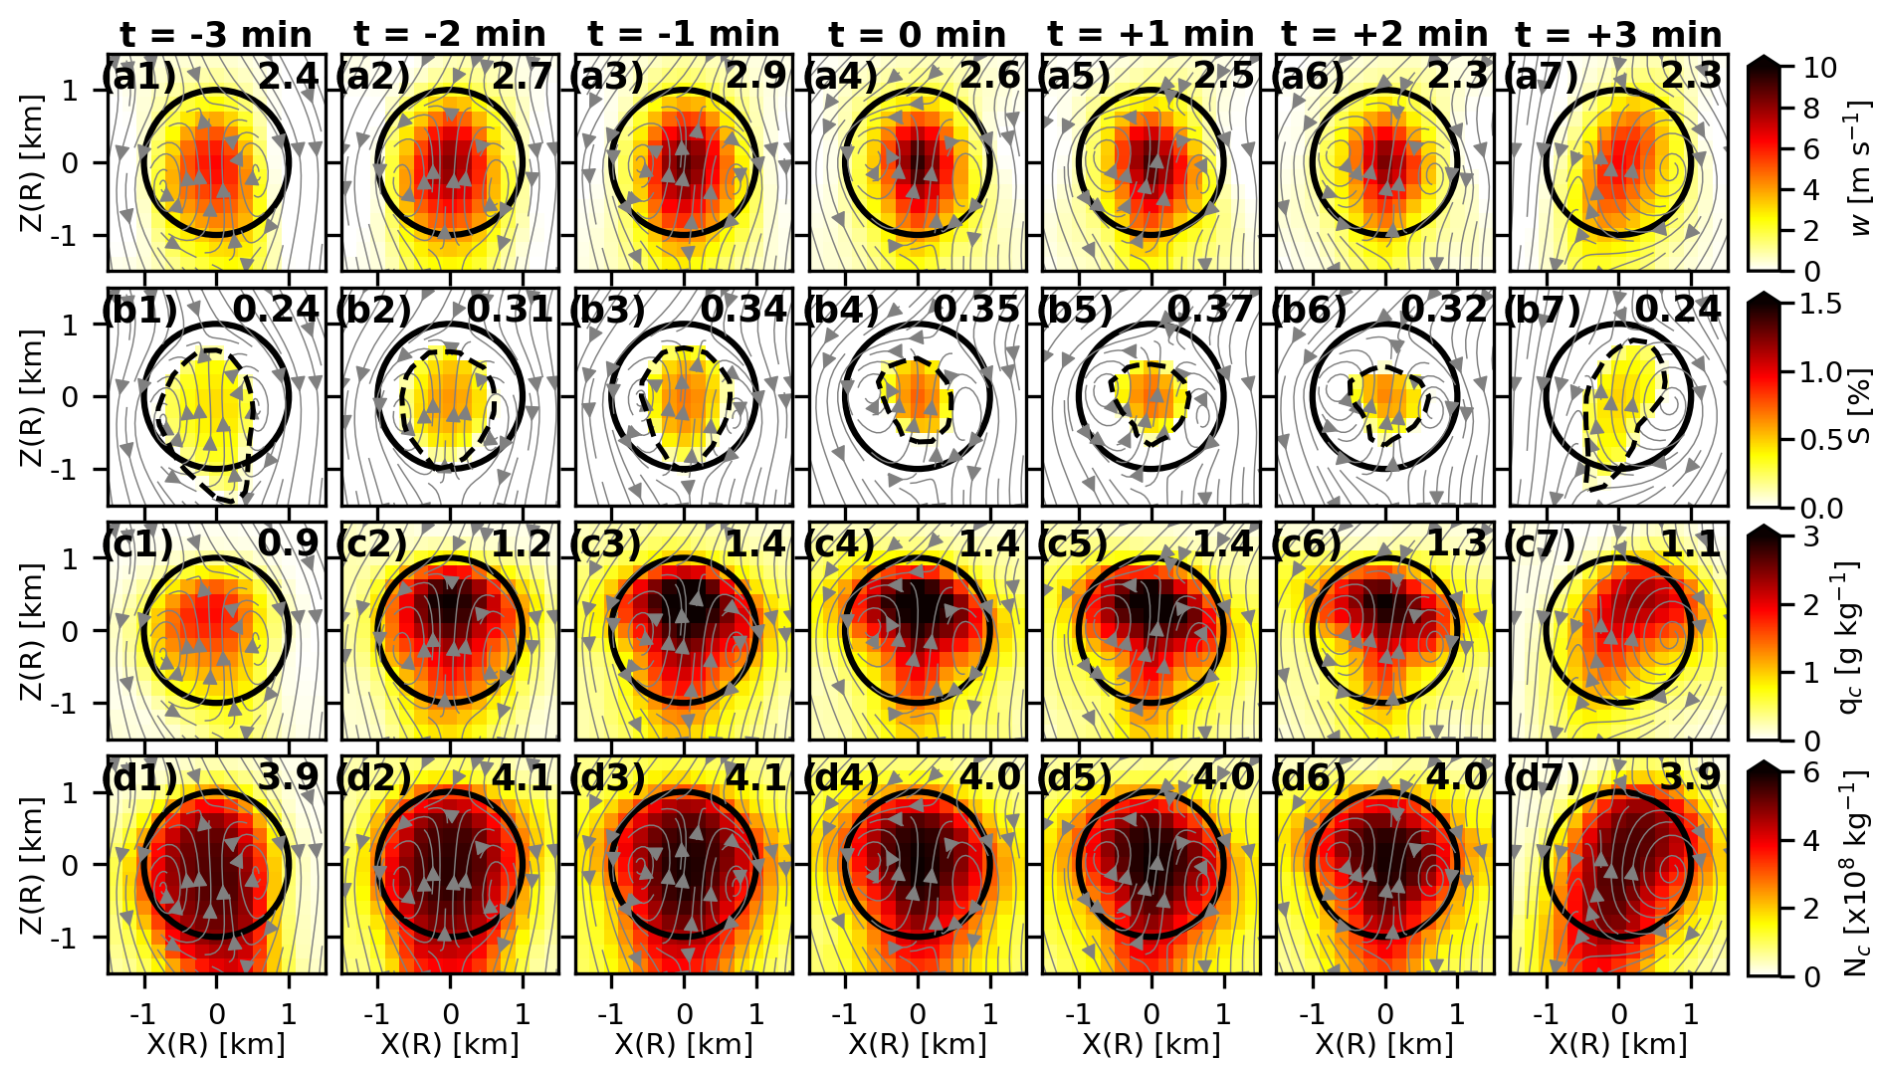
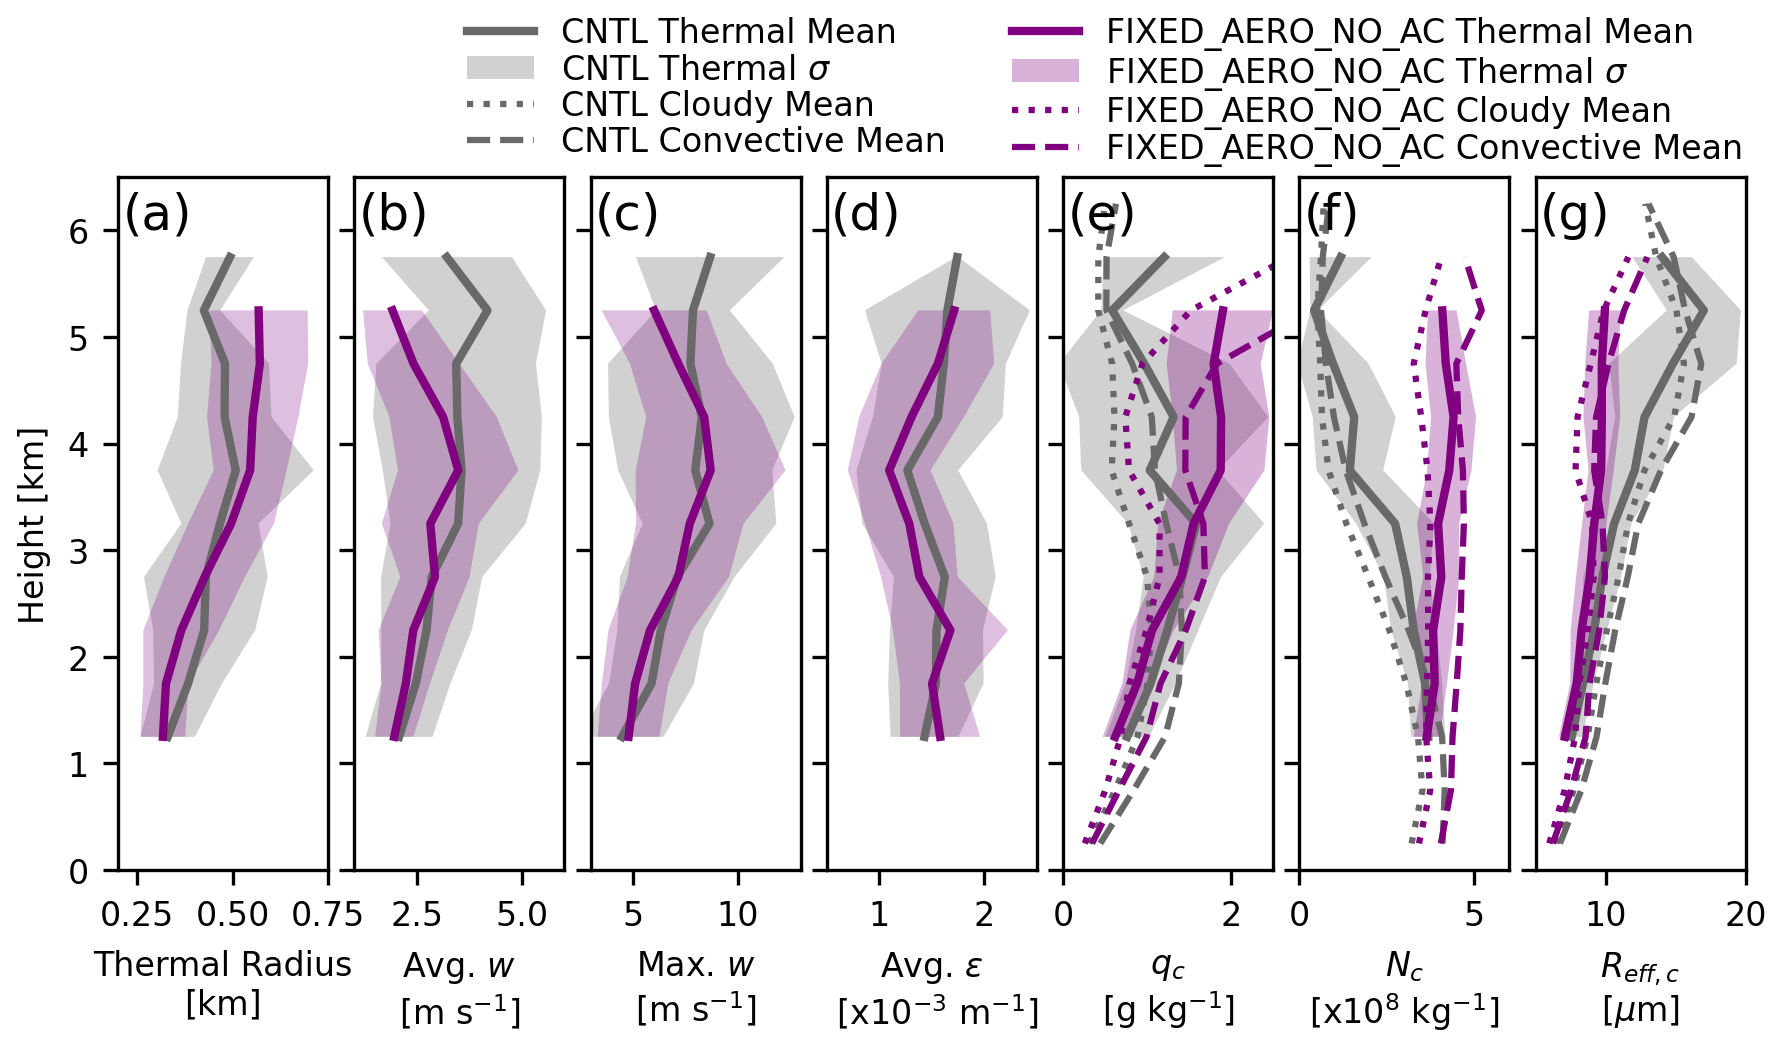
Figure 13Profiles of thermal-averaged (a) radius (R), (b) average vertical velocity (w), (c) maximum w, (d) average fractional entrainment rate (ε), (e) cloud water mass mixing ratio (qc), (f) cloud water number mixing ratio (Nc), and (g) cloud water effective radius (Reff,c). Profiles are constructed by 0.5 km bins. In (e)–(g), domain averages for cloudy grid points (qc>0.01 g kg−1) are shown as dotted lines and domain averages for convective cloudy grid points (qc>0.01 g kg−1 and w>1 m s−1) are shown as dashed lines. Shaded regions show the standard deviation from the mean.
These thermal evolutions imply that by controlling for the height-resolved aerosol profile as well as the impact of collision–coalescence on Nc throughout a thermal's lifetime, the thermal-averaged Nc is largely uniform during ascent. However, entrainment is expected to be active in this environment, so why does Nc appear to remain constant? This is investigated via vertical profiles of averaged thermal characteristics (Fig. 13) and thermal characteristics as a function of average fractional entrainment rate (ε, Fig. 14; see Hernandez-Deckers and Sherwood, 2016, for a description of how this is explicitly calculated). The CNTL and FIXED_AERO_NO_AC simulations produce similar thermal radii between ∼400–600 m (Fig. 13a). Both simulations also show similar ε, which is expected, since ε tends to be inversely proportional to the radius (Hernandez-Deckers and Sherwood, 2018). At higher altitudes, FIXED_AERO_NO_AC produces weaker average and maximum w (Fig. 13b and c), which is likely a combination of condensate loading in CNTL and the lack of cold-pool development in FIXED_AERO_NO_AC preventing clustering and organization that is realized in CNTL. Profiles of thermal-averaged qc, Nc, and Reff,c are shown in Fig. 13e–g, along with profile averages of cloudy grid points (LWC>0.01 g m−3) and convective cloudy grid points (LWC>0.01 g m−3 and w>1 m s−1) independent of the thermal framework. No matter the definition, Fig. 13f shows that Nc in FIXED_AERO_NO_AC is consistently constant with height, which is similar to the relatively constant cloud-top Nd profile presented in Fig. 8b. This suggests that in the absence of a height-varying aerosol profile and collision–coalescence, the impact of entrainment on reducing Nc is offset by secondary droplet activation along cloud edges (i.e., entrainment of aerosols along the inflow branch of toroidal circulations) – a process which has been shown to be a relevant aerosol activation mechanism in prior studies (Morrison et al., 2022; Chandrakar et al., 2021).
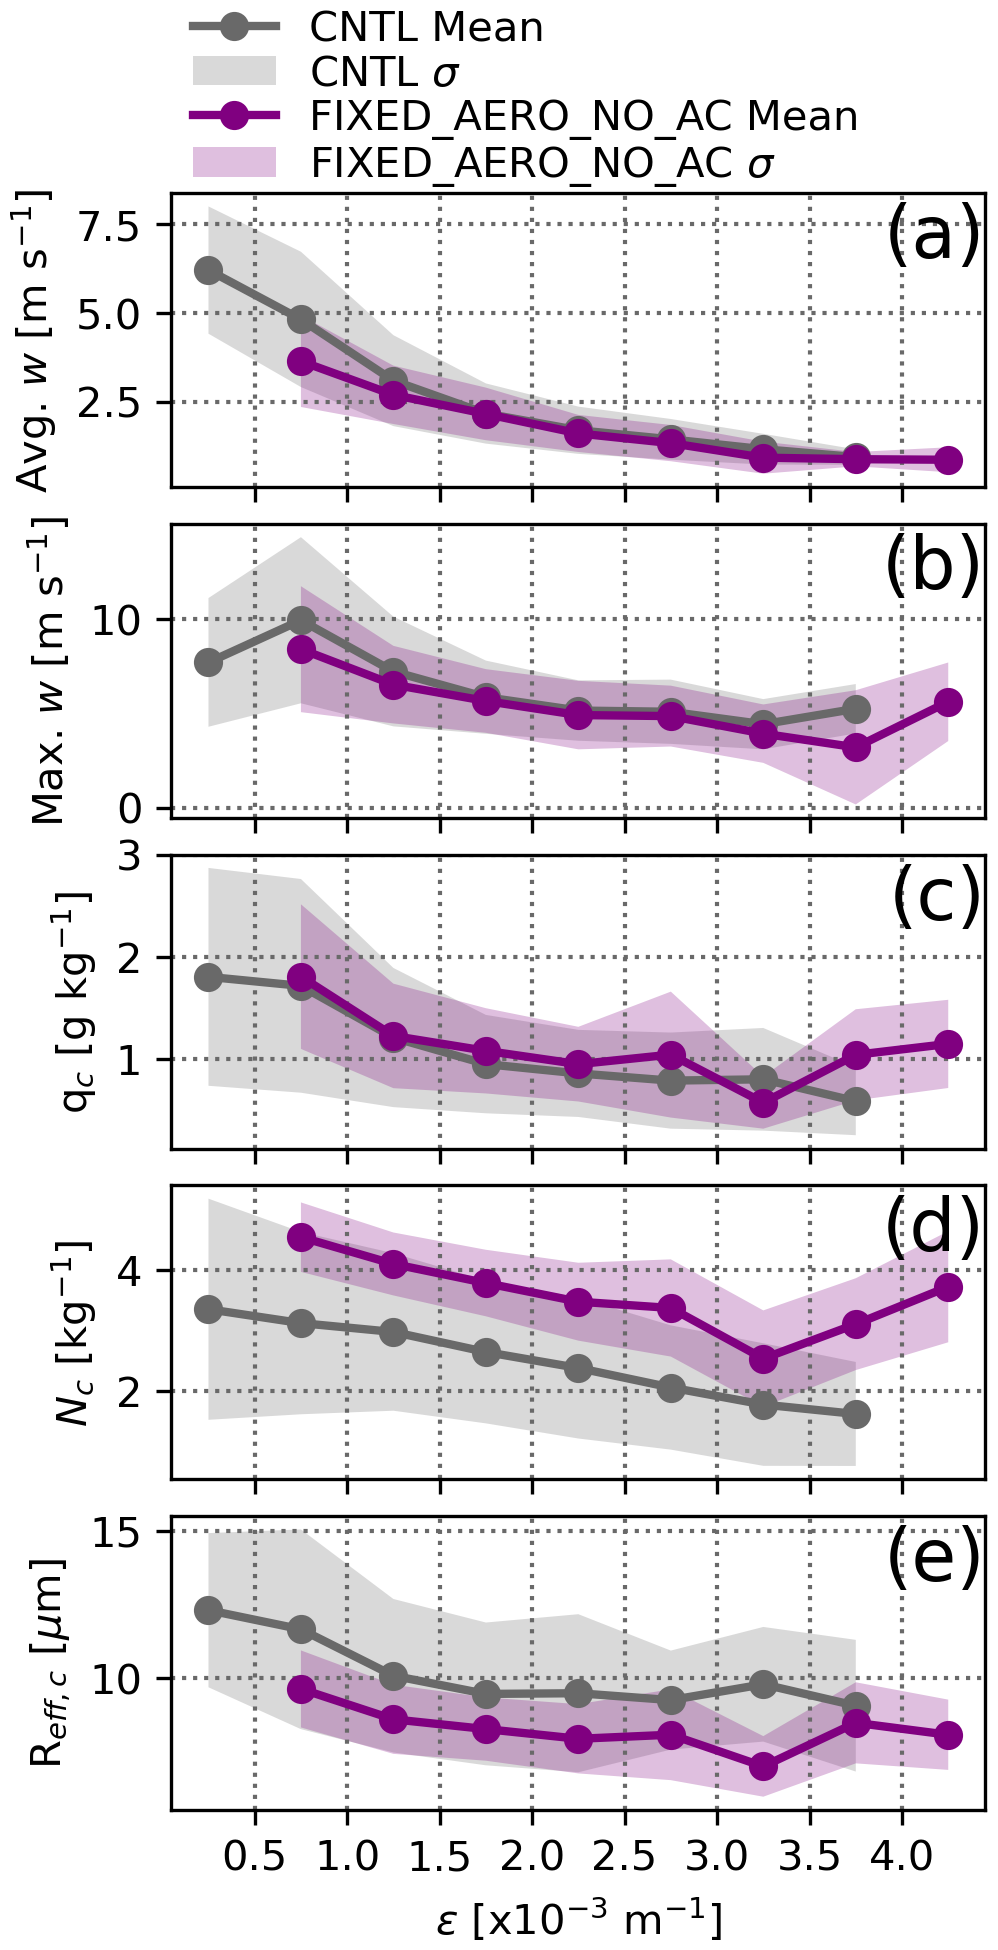
Figure 14Thermal average properties as a function of fractional entrainment rate (ε). ε bin widths are m−1. Shaded regions show the standard deviation from the mean, and at least 5 thermals are required for a given ε bin.
Distributing thermal characteristics as a function of ε (Fig. 14) shows that all variables generally decrease with increasing ε except for the strongest ε bins, further implying that the effects of entrainment on diluting Nc in the profiles shown in Fig. 13 are offset by secondary activation. The increase in qc and Nc for FIXED_AERO_NO_AC for the strongest ε may be due to substantial entrainment of aerosol, though the robustness of this signal should be evaluated in more detail in future work. Interestingly, Reff also decreases with increasing ε, consistent with a dominant effect of higher qc where entrainment is weakest diluting substantially at higher rates.
The influence of entrainment on microphysical properties in Figs. 13 and 14 has implications for the development of convective microphysics schemes in large-scale models. In bulk mass-flux-based convection parameterizations (e.g., Tiedtke, 1989; Gregory and Rowntree, 1990; Bechtold et al., 2008), entrainment is calculated for a single plume where a cloud ensemble is considered to be impacted equally by a given entrainment profile (e.g., Fig. 13). In spectral parameterizations (e.g., Arakawa and Schubert, 1974; Lin and Arakawa, 1997) that represent a variety of cloud types, each cloud type can experience varying degrees of entrainment (e.g., Fig. 14). Therefore, it is plausible to utilize a thermal-tracking framework with explicitly calculated entrainment as a means for linking convective microphysics to a given model's convection parameterization, which is discussed more in the following section.
5.1 Choosing a benchmark LES cumulus congestus case for ESM evaluation and improvement
Neggers (2015) showed in an intercomparison of simulated marine stratocumulus-to-cumulus transitions that SCMs can provide a unique fingerprint of their Earth system model (ESM) counterparts. For that cloud regime, such a conclusion suggests that the model state, whether it be SCM or ESM, was dominated by the boundary-layer behavior (or “fast physics” relative to the large-scale flow). In a similar manner, the case study presented herein can be used to investigate convective microphysics in ESMs that are driven by the convection scheme, whether diagnostically (see Elsaesser et al., 2017) or prognostically (see Song and Zhang, 2011). In this framework, simple tests regarding the structural implementation of convective microphysics may be explored to determine the leading factors of microphysical shortcomings in the congestus regime. Appropriate thermodynamic forcing, large-scale vertical motion conditions, and aerosol input for this case are provided as supplements for such testing in high-resolution models and SCMs. Furthermore, additional CAMP2Ex cases may be constructed with different aerosol loading and varying convective structures (e.g., Chandrakar et al., 2024). Indeed, Reid et al. (2023, see their Fig. 6f) show the vast range of aerosol conditions measured during CAMP2Ex. Moreover, the role of entrainment in modulating microphysical parameters (see Sect. 4.5) can be linked to spectral convection parameterizations. As a simple example, the National Aeronautics and Space Administration (NASA) Goddard Institute for Space Studies (GISS) ModelE3 (GISS-ModelE3; Cesana et al., 2019, 2021) convection parameterization uses a two-plume model, with one weakly entraining plume and the other strongly entraining, which is not currently aerosol-aware. Thermal-based analysis such as that presented here can estimate the impact of entrainment for each plume on diluting Nd in the associated convective microphysics scheme, in addition to providing an observation-constrained foundation for adding aerosol-aware physics. Of course, results are expected to be case- and regime-specific, and scheme development is expected to be conducted with a range of diverse cases and regimes.
5.2 Translation for space-based platforms and global simulations
The Hyper-angular Rainbow Polarimeter (HARP-2; Martins et al., 2018) on PACE provides the opportunity to evaluate global distributions of cloud-top microphysical characteristics, extending beyond bi-spectral retrievals such as those provided by the Moderate Resolution Imaging Spectroradiometer (MODIS) on the Aqua and Terra satellites. Fu et al. (2022) performed an intercomparison of cloud-top Reff during CAMP2Ex between MODIS, in situ measurements, and RSP retrievals using both the polarimetric method (as used herein) and its alternative bi-spectral method. They found a persistent high bias in Reff using bi-spectral methods by 4–7 µm in the median and demonstrated that cloud heterogeneity and 3D radiative transfer effects were at the source of the high-biased bi-spectral Reff retrieval. Potential biases in Reff can have important implications for evaluating ESMs that ubiquitously employ bulk microphysics schemes. For example, Reff is used directly as input to space-based lidar simulators for calculating the particle backscatter coefficient (Chepfer et al., 2008; Cesana et al., 2021). Moreover, the direct use of Reff in ESM radiation schemes will propagate error for comparison with satellite retrievals. Furthermore, just like RSP, HARP-2 has the potential to infer full drop size distributions (without assuming a gamma shape) using the rainbow Fourier transform algorithm (Alexandrov et al., 2012b; Reid et al., 2023; Sinclair et al., 2021), which may provide more detailed information similar to that obtained from the in situ DSDs in this study. In addition to polarimetric cloud retrievals, PACE also provides detailed polarimetric aerosol retrievals (Hasekamp et al., 2019; Gao et al., 2023), which opens up the opportunity to study congestus development globally as a function of aerosol loading and type. We note, however, that the polarimeters on PACE will provide retrievals on a spatial scale of about 5.2 km×5.2 km, which is more than an order of magnitude coarser than the RSP observations used in this study. Understanding of the effect of increased footprint size could be advanced using forward simulation approaches and model output from case studies such as this. On a related note, there is considerable room for improvement in adjusting the comparison of simulated microphysics with polarimetry platforms. For example, Sect. 4.4 demonstrates the sensitivity of Reff and νeff to size thresholding assumed for the RSP, and we assumed a τ threshold of 1 to define the cloud top. However, the size threshold observed by the RSP is likely dependent on the DSD being observed and its extinction characteristics. Simulators for airborne or spaceborne polarimeters should thus explore methods to determine the relevant (and potentially modular) size thresholds at which extinction saturates the retrieval.
We present analyses of a tropical cumulus congestus case study based on large-eddy simulations with observed trimodal aerosol size distribution profiles as input, evaluated against airborne polarimetric retrievals and in situ cloud microphysics measurements. Novel retrievals from the Research Scanning Polarimeter (RSP) provided a statistically robust continuous profile of cloud-top effective radius (Reff) and effective variance (νeff), which, used together, allowed the derivation of cloud-top drop number concentration (Nd). Simulations were performed using both bulk and bin microphysics schemes, and the sensitivity of drop size distribution (DSD) evolution to the collision–coalescence process and the height-resolved aerosol profile was quantified. A thermal-tracking analysis framework was then used to objectively describe the microphysical evolution at the source of cloud droplet production and quantify the effects of dilution via entrainment. The primary conclusions are summarized as follows:
-
Polarimetric retrievals and in situ measurements of Nd and Reff both indicate characteristic profiles of decreasing Nd and increasing Reff with increasing cloud-top height (CTH). By contrast, cloud-top νeff retrievals exhibit a weak minimum near 4 km, whereas in situ measurements indicate monotonically increasing values up to the melting level.
-
Both bulk and bin schemes reproduce a decrease in Nd and increase in Reff with increasing CTH. Whereas Reff as a function of height is also quite well reproduced by both schemes, cloud-top Nd is consistently lower than retrieved, “in situ” Nd is consistently higher than measured, and the observational data products do not exhibit the expected relationship (in situ values greater than cloud-top values) that is seen in the simulations. In the bulk scheme, median “in situ” νeff is uniform with height at a value similar to RSP retrievals following the fixed droplet spectral width in that scheme; in the bin scheme, greater structural freedom enables an increase with height similar to that observed in situ, albeit with a consistent high bias. Differences throughout are likely attributable in some part to both uncertainties in the observational data products and potential numerical and structural issues in the simulations.
-
Neglecting collision–coalescence in a sensitivity experiment increases median cloud-top Nd from the control experiment by nearly a factor of 3 at circa 5 km, indicating a powerful control on the observed profile of Nd.
-
Neglecting the height variation of aerosol increases median cloud-top Nd by up to a factor of 2 at CTHs of circa 5 km, reflecting the role of thermal entrainment transiting aerosol gradients aloft.
-
Neglecting both collision–coalescence and the height variation of aerosol produces a cloud-top Nd profile (per kg) that is nearly constant with height below circa 3.5 km and increases with height thereafter, indicating that entrainment alone cannot drive the observed trend.
-
Comparison with in situ cloud pass DSDs shows that both schemes can generally bracket the observed DSDs, which should be considered only a sparse sample of possible realized DSDs. Compared to in situ DSDs, the bulk scheme cannot capture the observed tail of the distribution, whereas the bin scheme effectively captures the continuum of particle sizes across the drop and drizzle modes (a feature that will be an important foundation for examining ice formation in follow-on work).
-
Juxtaposing the cumulatively integrated Nd, Reff, and νeff dependence on the DSD shape indicates that all integrated moments are, to first order, significantly sensitive to sizes <30 µm. The latter two moments, especially νeff, can also be sensitive to larger sizes if the DSD is sufficiently broad.
-
Comparing simulated DSDs at the cloud top with RSP retrievals can be sensitive to the assumed truncation size, especially for νeff, and differences between RSP and in situ measurements highlight limitations in strongly constraining the case studied here.
-
A thermal-tracking analysis framework demonstrates that neglecting both collision–coalescence and the height variation of aerosol leads to a nearly constant profile of thermal-averaged Nd (per kg) regardless of sampling approach, suggesting that the influence of entrainment on diluting thermal Nd is almost exactly balanced by secondary activation in the absence of aerosol loss processes in this case.
The case study presented here offers a benchmark framework for ESM simulations of tropical cumulus congestus, which are lacking relative to other convective modes that have been the focus of informative LES–SCM intercomparison projects (e.g., Siebesma et al., 2003; Sandu and Stevens, 2011; Neggers, 2015; Neggers et al., 2017; Vogelmann et al., 2015; Endo et al., 2015; Lin et al., 2015). Such a task is aided by supplying large-scale thermodynamics and vertical motion derived from mesoscale simulations of the presented case study as well as trimodal, lognormal aerosol distribution profiles, the combination of which can be identically used to drive SCM versions of ESMs. Use of this case as an observationally evaluated benchmark can contribute to informing development of convective microphysics schemes in large-scale models that currently exist in highly variable states of sophistication. This framework also lends itself to informing future global analysis of warm-phase microphysics evolution via the recently successfully launched spaceborne polarimeters on the PACE satellite. In follow-on work with LES, this case offers a natural transition to the evaluation of ice-phase microphysics in tropical congestus, where establishing the realism of simulated drizzle-containing DSDs (e.g., Fig. 10c and d) is an important foundation for simulating secondary ice formation.
A mesoscale simulation used for harvesting large-scale thermodynamic conditions and vertical motion for LES initialization is performed using the NASA Unified Weather Research and Forecasting (NU-WRF; Peters-Lidard et al., 2015) model with the v3.9.1.1 WRF dynamical core. The NU-WRF simulation was initialized with the National Centers for Environmental Prediction (NCEP) Global Data Assimilation System (GDAS) FNL (Final) operational global analysis and forecast dataset with a spatial resolution of 0.25°×0.25° and a temporal resolution of 6 h (National Centers for Environmental Prediction National Weather Service NOAA U. S. Department of Commerce, 2015). The simulation was integrated for 21 h from 12:00 UTC on 24 September 2019 through 09:00 UTC on 25 September. We use a one-way nested grid with an outer domain size of 2400 km×2400 km, a horizontal grid spacing (Δh) of 3 km, and an inner domain size of 480 km×480 km with Δh=600 m. The outer and inner domains use a time step of 9 and 1.5 s, respectively, and each has 151 stretched vertical levels. We employ the National Severe Storms Laboratory (NSSL) microphysics scheme (Ziegler, 1985; Mansell et al., 2010; Mansell and Ziegler, 2013) with 6 double-moment hydrometeor species including cloud water, rain, cloud ice, snow, graupel, and hail. Trimodal, lognormal aerosol profiles are treated as described for the DHARMA simulations with activation following Abdul-Razzak and Ghan (2000) using the minimum supersaturation from Morrison and Grabowski (2008b). Other physics include the 2017 Goddard radiation package (Matsui et al., 2020), the Noah-MP land surface model (LSM; Niu et al., 2011; Yang et al., 2011), the Mellor–Yamada–Nakanishi–Niino (MYNN) 2.5 level turbulent kinetic energy (TKE) planetary boundary layer (PBL) scheme (Nakanishi and Niino, 2009), and the 2D horizontal Smagorinsky scheme for horizontal subgrid-scale diffusion (Skamarock et al., 2008).
Large-scale vertical motion (wLS) was evaluated by averaging vertical velocity across various subdomains of the NU-WRF simulation on a 600 m horizontal mesh (domain shown in Fig. 4). While wLS was rather variable across the domain and time, a characteristic profile of ascent below ∼5 km and subsidence above was apparent when averaging over a time period of 6 h, which corresponded to flight timing (∼03:00–09:00 UTC). The magnitude of ascent in the lower troposphere ultimately modulated the acceleration of growing CTH throughout simulation integration, but a maximum of 2 cm s−1 is consistent with subdomain averages. The idealized profile shown in Fig. 4a proved sufficient and appropriate for realizing a simulation similar to the observed system evolution, as determined by the timing of CTH growth from the simulation initialization. As stated in the main text, we do not consider this profile to be well-constrained but rather plausible, and we note that derivations of wLS are essential to appropriately represent the dynamical evolution of at least the congestus case studied here. Indeed, Fig. B1 shows the evolution of domain-mean LWC for the CNTL simulation and a simulation with no imposed wLS. In the simulation without imposed wLS (Fig. B1b), cloud tops initially grow to ∼2 km and stagnate to a maximum of only ∼2.5 km at the end of the simulation. Therefore, imposed wLS is essential to realize a simulation similar to the observed system.
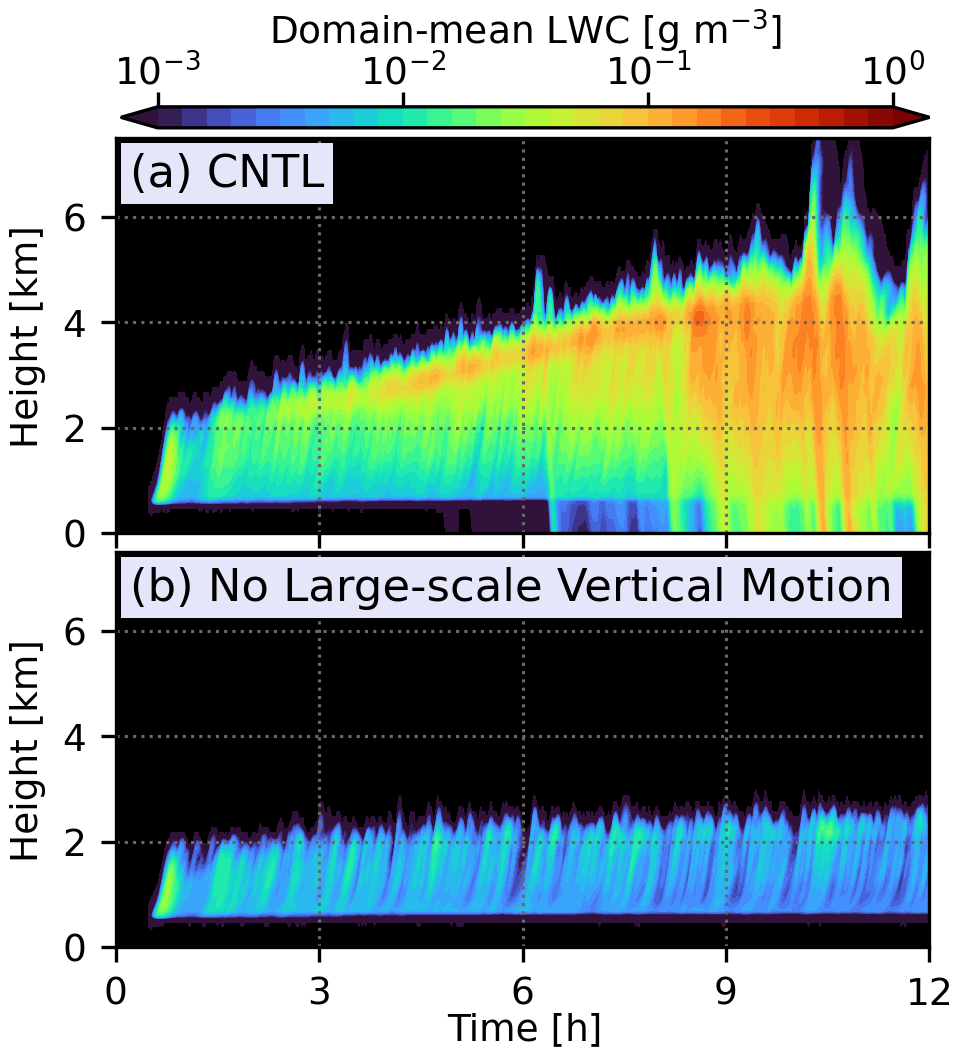
Figure B1Time–height series of domain-mean liquid water content (LWC) for (a) the CNTL simulation and (b) a simulation with the same physics as CNTL but without imposed large-scale vertical motion.
Resolution sensitivity was investigated by performing a simulation with identical physics to the CNTL simulation (which uses a horizontal mesh of 100 m) but with a horizontal mesh of 50 m. Time–height series of domain-maximum w, domain-mean LWC, and in-cloud domain-mean cloud-species number concentration (Nc) are shown in Fig. C1. Differences between the two resolutions are negligible for each property for the purposes of this study. Cloud-top Reff and Nd were also evaluated relative to RSP (not shown), and the 50 m simulation was found to be indistinguishable from CNTL. This test demonstrates microphysical convergence for the CNTL simulation presented herein.
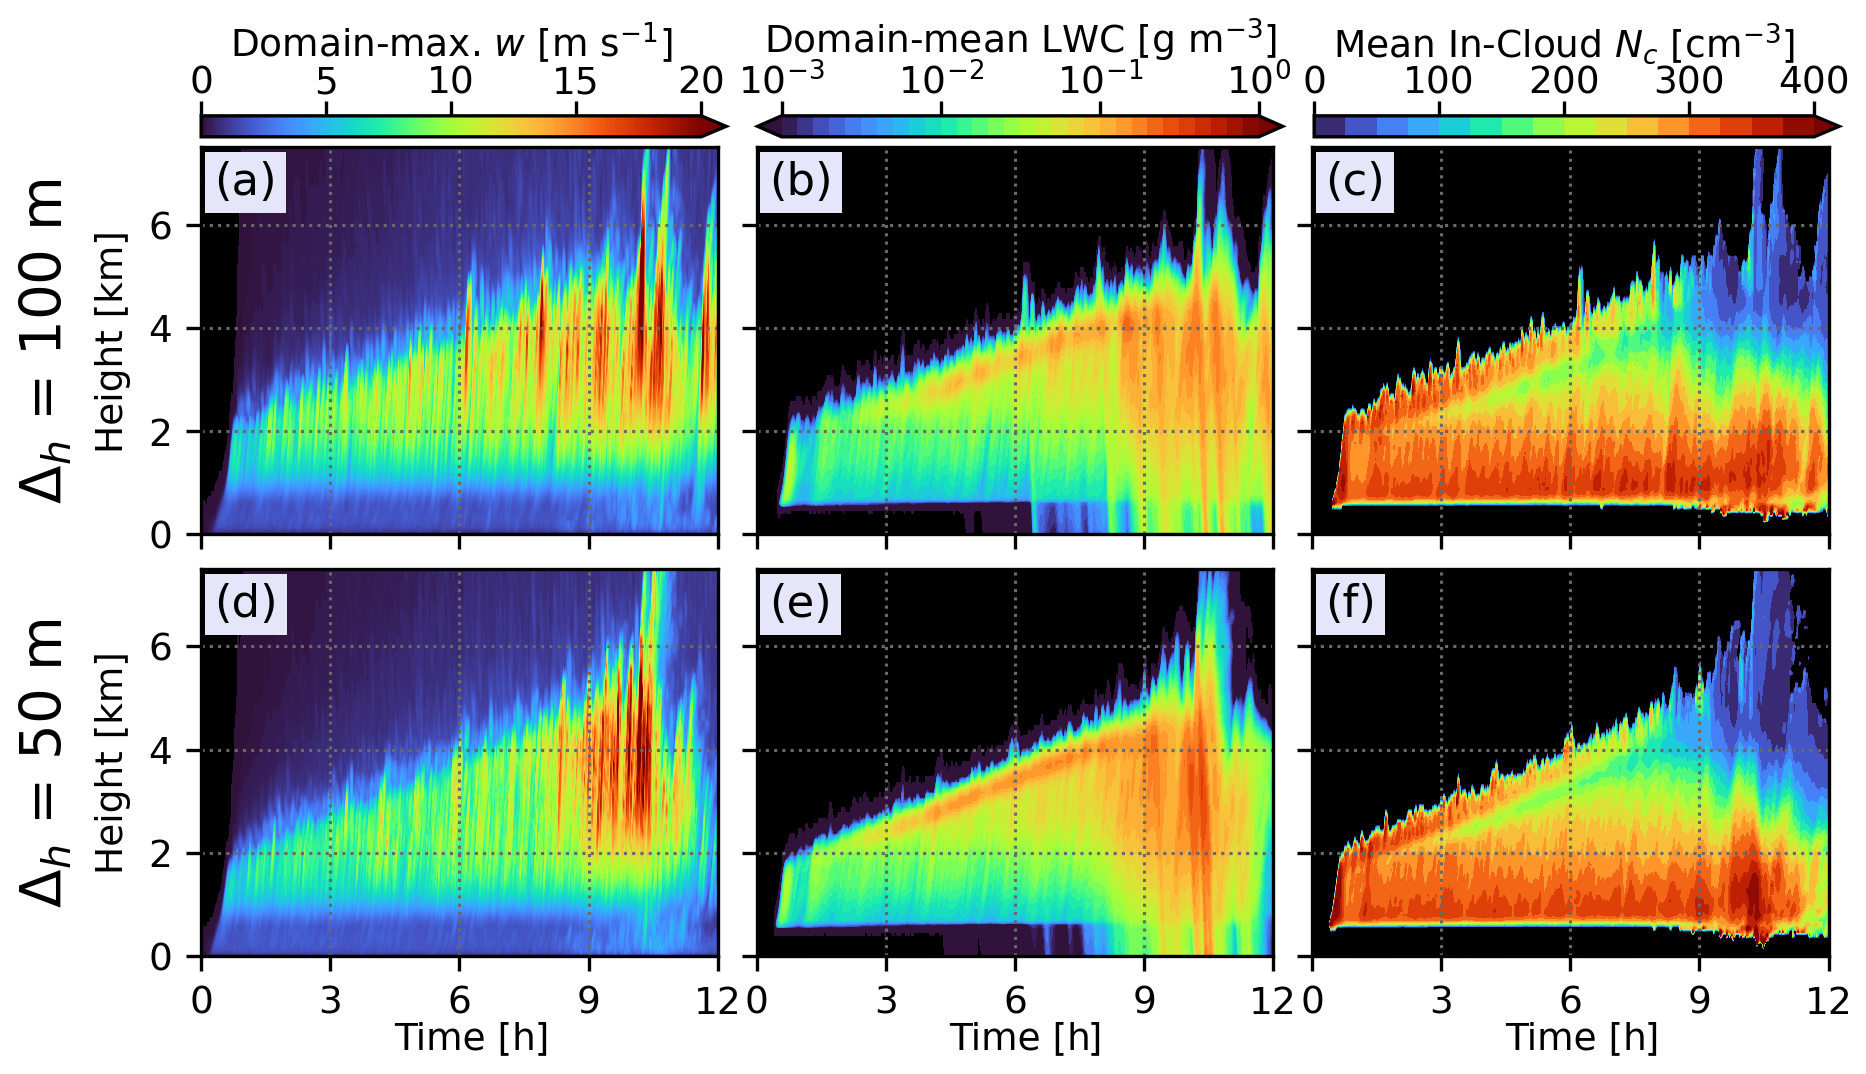
Figure C1Time height series of (a, d) domain-maximum vertical velocity (w), (b, e) domain-mean liquid water content (LWC), and (c, f) in-cloud domain-mean cloud-species droplet number concentration (Nc) for the CNTL simulation with a horizontal mesh of 100 m (a–c) and a simulation with a horizontal mesh of 50 m (d–f).
Composite observed in situ size distributions are constructed by stitching together instruments in various size ranges. These include the fast forward scattering spectrometer probe (FFSSP; 2–50 µm with bin width ranging from 1.5 to 4 µm), the 10 µm 2D-S (stereo) optical array spectrometer (2D-S10; 10 µm–3 mm with bin width ranging from 10 to 200 µm), and the high-volume precipitation spectrometer (HVPS; 150 µm–4.5 mm with bin width ranging from 150 µm to 3 mm). The size thresholds used to stitch the individual instrument DSDs are chosen based on convergence of overlapping size ranges between the instruments for a given statistical sample. As shown in Fig. D1, there is some uncertainty between overlapping sizes of the smallest size bins for a given instrument and the largest size bins for another instrument. This partially emerges due to resolution and detection limitations at the smallest size bins where, for the 2D-S10, the bin size approaches the pixel-scale resolution limit. However, convergence is realized at the upper limit of the FFSSP (50 µm) such that a continuous distribution emerges at the statistically appropriate overlapping sizes. Furthermore, the size threshold is not consistent between different cloud passes and instead depends on the samples measured by the instrument. For example, the size threshold for stitching the 2D-S10 and HVPS is chosen at 250 µm for the 19.41 °C cloud pass (Fig. D1a) but at 550 µm for the 1.04 °C cloud pass (Fig. D1d). Ultimately, the selected cloud passes and size thresholds used to create composite DSDs are chosen to create the most realistic transition between instrument size regions while retaining physical characteristics of the DSD shape.
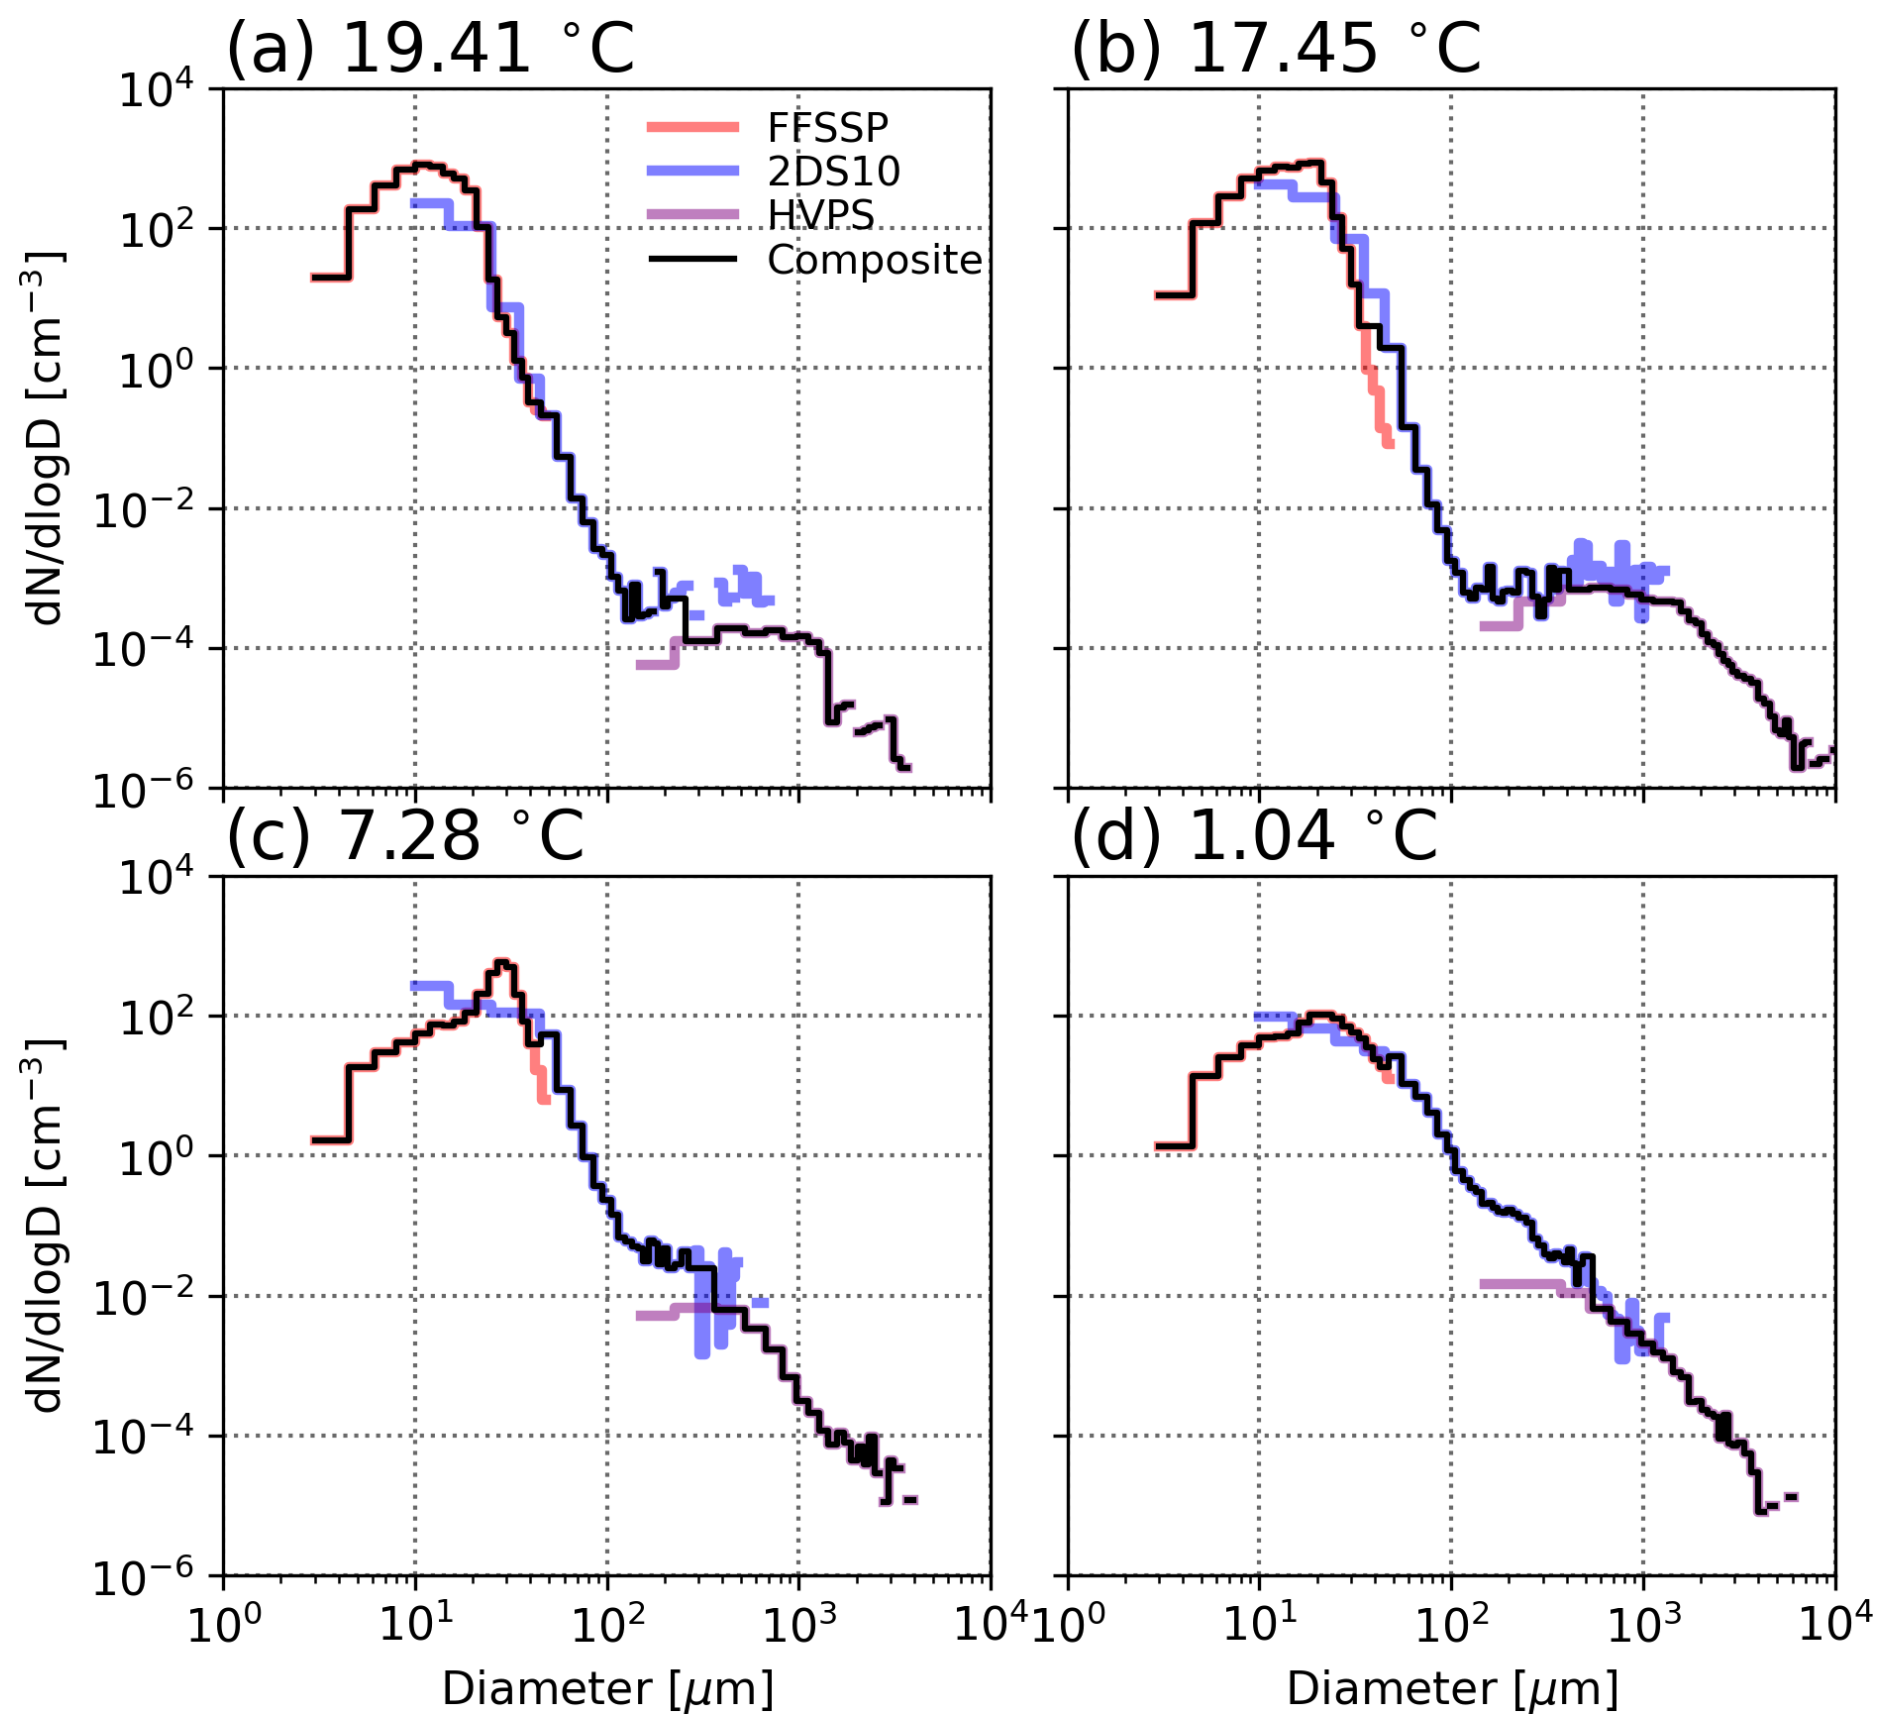
Figure D1Observed drop size distributions (DSDs) for the 4 selected temperature levels discussed in the text. Size distributions from individual instruments are shown as colored lines, and the composite DSDs from stitching together instruments are shown as black lines.
Python plotting scripts used to make all the figures can be found on the NASA Center for Climate Simulation (NCCS) data portal – https://portal.nccs.nasa.gov/datashare/giss-camp2ex/ (NASA Center for Climate Simulation, 2025) – and at the following DOI: https://doi.org/10.5281/zenodo.15901072 (Stanford, 2025). DHARMA source code is maintained at NASA GISS and can be made available upon request. The NASA-Unified WRF (NU-WRF) is maintained at the NASA Goddard Space Flight Center (GSFC) and is available for public use upon request (https://nuwrf.gsfc.nasa.gov/, NASA NU-WRF, 2025).
The NASA Center for Climate Simulation (NCCS) data portal (https://portal.nccs.nasa.gov/datashare/giss-camp2ex/, NASA Center for Climate Simulation, 2025) archives the following data: 3D output from the CNTL and BIN_TURB_10X simulations (other simulations can be made available upon request), input aerosol profiles and distribution parameters, thermodynamic and large-scale vertical motion forcing files, NU-WRF namelists needed for reproduction of the mesoscale simulation, files containing time–height series of domain-mean variables for all simulations presented herein, and thermal data files. These files (sans 3D output) are also available at the following DOI for permanent storage: https://doi.org/10.5281/zenodo.15901072 (Stanford, 2025). Aircraft data from the Research Scanning Polarimeter (RSP), 3rd Generation Advanced Precipitation Radar (APR-3), in situ cloud probes, and Fast Integrated Mobility Spectrometer (FIMS) are available on the CAMP2Ex data repository (https://www-air.larc.nasa.gov/cgi-bin/ArcView/camp2ex, NASA Suborbital Science Data for Atmospheric Composition, 2024).
MWS and AMF conceptualized the study. MWS prepared simulations with the help of ASA and AMF (DHARMA) and TM (NU-WRF). Aerosol input data were prepared by QX and JW. Thermal-tracking code and guidance were provided by DHD. BvD prepared RSP data and guided interpretation. PL prepared in situ cloud probe data and guided use. MWS performed formal analysis and was the primary author of the manuscript. All authors contributed to editing the final manuscript.
At least one of the (co-)authors is a member of the editorial board of Atmospheric Chemistry and Physics. The peer-review process was guided by an independent editor, and the authors also have no other competing interests to declare.
Publisher's note: Copernicus Publications remains neutral with regard to jurisdictional claims made in the text, published maps, institutional affiliations, or any other geographical representation in this paper. While Copernicus Publications makes every effort to include appropriate place names, the final responsibility lies with the authors.
This article is part of the special issue “Cloud, Aerosol and Monsoon Processes Philippines Experiment (CAMP2Ex) (ACP/AMT inter-journal SI)”. It is not associated with a conference.
Computing support to perform simulations was provided the by NASA Center for Climate Simulations. This work was part of the NASA CAMP2Ex campaign (https://doi.org/10.5067/Suborbital/CAMP2EX2018/DATA001). We thank Gregory Elsaesser and Kuniaki Inoue for their helpful discussions on convective parameterization, convective microphysics structure, and development pathways. Pacific Northwest National Laboratory is operated by Battelle for the 644 US Department of Energy under Contract DE-AC05-76RLO1830.
This work was supported by the NASA Atmospheric Composition Campaign Data Analysis and Modeling Program and the NASA Modeling, Analysis, and Prediction Program.
This paper was edited by Raphaela Vogel and reviewed by three anonymous referees.
Abdul-Razzak, H. and Ghan, S. J.: A parameterization of aerosol activation 2. Multiple aerosol types, J. Geophys. Res.-Atmos., 105, 6837–6844, https://doi.org/10.1029/1999JD901161, 2000. a, b
Ackerman, A. S., Hobbs, P. V., and Toon, O. B.: A Model for Particle Microphysics, Turbulent Mixing, and Radiative Transfer in the Stratocumulus-Topped Marine Boundary Layer and Comparisons with Measurements, J. Atmos. Sci., 52, 1204–1236, https://doi.org/10.1175/1520-0469(1995)052<1204:AMFPMT>2.0.CO;2, 1995. a, b
Ackerman, A. S., Toon, O. B., Stevens, D. E., Heymsfield, A. J., Ramanathan, V., and Welton, E. J.: Reduction of Tropical Cloudiness by Soot, Science, 288, 1042–1047, https://doi.org/10.1126/SCIENCE.288.5468.1042, 2000. a
Alexandrov, M. D., Cairns, B., Emde, C., Ackerman, A. S., and van Diedenhoven, B.: Accuracy assessments of cloud droplet size retrievals from polarized reflectance measurements by the research scanning polarimeter, Remote Sens. Environ., 125, 92–111, https://doi.org/10.1016/J.RSE.2012.07.012, 2012a. a, b, c
Alexandrov, M. D., Cairns, B., and Mishchenko, M. I.: Rainbow Fourier transform, J. Quant. Spectrosc. Ra., 113, 2521–2535, https://doi.org/10.1016/J.JQSRT.2012.03.025, 2012b. a
Alexandrov, M. D., Cairns, B., Sinclair, K., Wasilewski, A. P., Ziemba, L., Crosbie, E., Moore, R., Hair, J., Scarino, A. J., Hu, Y., Stamnes, S., Shook, M. A., and Chen, G.: Retrievals of cloud droplet size from the research scanning polarimeter data: Validation using in situ measurements, Remote Sens. Environ., 210, 76–95, https://doi.org/10.1016/J.RSE.2018.03.005, 2018. a, b
Alexandrov, M. D., Miller, D. J., Rajapakshe, C., Fridlind, A., van Diedenhoven, B., Cairns, B., Ackerman, A. S., and Zhang, Z.: Vertical profiles of droplet size distributions derived from cloud-side observations by the research scanning polarimeter: Tests on simulated data, Atmos. Res., 239, 104924, https://doi.org/10.1016/J.ATMOSRES.2020.104924, 2020. a
Andreae, M. O., Rosenfeld, D., Artaxo, P., Costa, A. A., Frank, G. P., Longo, K. M., and Silva-Dias, M. A.: Smoking Rain Clouds over the Amazon, Science, 303, 1337–1342, https://doi.org/10.1126/science.1092779, 2004. a
Andrejczuk, M., Grabowski, W. W., Malinowski, S. P., and Smolarkiewicz, P. K.: Numerical Simulation of Cloud–Clear Air Interfacial Mixing: Homogeneous versus Inhomogeneous Mixing, J. Atmos. Sci., 66, 2493–2500, https://doi.org/10.1175/2009JAS2956.1, 2009. a
Arakawa, A. and Schubert, W. H.: Interaction of a Cumulus Cloud Ensemble with the Large-Scale Environment, Part I, J. Atmos. Sci., 31, 674–701, https://doi.org/10.1175/1520-0469(1974)031<0674:IOACCE>2.0.CO;2, 1974. a
Ayala, O., Rosa, B., and Wang, L. P.: Effects of turbulence on the geometric collision rate of sedimenting droplets. Part 2. Theory and parameterization, New J. Phys., 10, 075016, https://doi.org/10.1088/1367-2630/10/7/075016, 2008. a
Bechtold, P., Köhler, M., Jung, T., Doblas-Reyes, F., Leutbecher, M., Rodwell, M. J., Vitart, F., and Balsamo, G.: Advances in simulating atmospheric variability with the ECMWF model: From synoptic to decadal time-scales, Q. J. Roy. Meteor. Soc., 134, 1337–1351, https://doi.org/10.1002/QJ.289, 2008. a
Behrenfeld, M. J., Moore, R. H., Hostetler, C. A., Graff, J., Gaube, P., Russell, L. M., Chen, G., Doney, S. C., Giovannoni, S., Liu, H., Proctor, C., Bolaños, L. M., Baetge, N., Davie-Martin, C., Westberry, T. K., Bates, T. S., Bell, T. G., Bidle, K. D., Boss, E. S., Brooks, S. D., Cairns, B., Carlson, C., Halsey, K., Harvey, E. L., Hu, C., Karp-Boss, L., Kleb, M., Menden-Deuer, S., Morison, F., Quinn, P. K., Scarino, A. J., Anderson, B., Chowdhary, J., Crosbie, E., Ferrare, R., Hair, J. W., Hu, Y., Janz, S., Redemann, J., Saltzman, E., Shook, M., Siegel, D. A., Wisthaler, A., Martin, M. Y., and Ziemba, L.: The North Atlantic Aerosol and Marine Ecosystem Study (NAAMES): Science motive and mission overview, Frontiers in Marine Science, 6, 424783, https://doi.org/10.3389/fmars.2019.00122, 2019. a
Bott, A.: A Flux Method for the Numerical Solution of the Stochastic Collection Equation: Extension to Two-Dimensional Particle Distributions, J. Atmos. Sci., 57, 284–294, https://doi.org/10.1175/1520-0469(2000)057<0284:AFMFTN>2.0.CO;2, 2000. a
Brenguier, J.-L., Pawlowska, H., Schüller, L., Preusker, R., Fischer, J., Fouquart, Y., Brenguier, J.-L., Pawlowska, H., Schüller, L., Preusker, R., Fischer, J., and Fouquart, Y.: Radiative Properties of Boundary Layer Clouds: Droplet Effective Radius versus Number Concentration, J. Atmos. Sci., 57, 803–821, https://doi.org/10.1175/1520-0469(2000)057<0803:RPOBLC>2.0.CO;2, 2000. a
Cairns, B., Russell, E. E., and Travis, L. D.: Research Scanning Polarimeter: calibration and ground-based measurements, in: Proceedings Volume 3754, Polarization: Measurement, Analysis, and Remote Sensing II, SPIE's International Symposium on Optical Science, Engineering, and Instrumentation, Denver, Colorado, USA, 25 October 1999, 3754, 186–196, https://doi.org/10.1117/12.366329, 1999. a, b
Cesana, G., Del Genio, A. D., Ackerman, A. S., Kelley, M., Elsaesser, G., Fridlind, A. M., Cheng, Y., and Yao, M.-S.: Evaluating models' response of tropical low clouds to SST forcings using CALIPSO observations, Atmos. Chem. Phys., 19, 2813–2832, https://doi.org/10.5194/acp-19-2813-2019, 2019. a
Cesana, G. V., Ackerman, A. S., Fridlind, A. M., Silber, I., and Kelley, M.: Snow Reconciles Observed and Simulated Phase Partitioning and Increases Cloud Feedback, Geophys. Res. Lett., 48, e2021GL094876, https://doi.org/10.1029/2021GL094876, 2021. a, b
Chandrakar, K. K., Grabowski, W. W., Morrison, H., and Bryan, G. H.: Impact of Entrainment Mixing and Turbulent Fluctuations on Droplet Size Distributions in a Cumulus Cloud: An Investigation Using Lagrangian Microphysics with a Subgrid-Scale Model, J. Atmos. Sci., 78, 2983–3005, https://doi.org/10.1175/JAS-D-20-0281.1, 2021. a, b, c
Chandrakar, K. K., Morrison, H., Grabowski, W. W., and Bryan, G. H.: Comparison of Lagrangian Superdroplet and Eulerian Double-Moment Spectral Microphysics Schemes in Large-Eddy Simulations of an Isolated Cumulus Congestus Cloud, J. Atmos. Sci., 79, 1887–1910, https://doi.org/10.1175/JAS-D-21-0138.1, 2022. a, b
Chandrakar, K. K., Morrison, H., Grabowski, W. W., and Lawson, R. P.: Are turbulence effects on droplet collision–coalescence a key to understanding observed rain formation in clouds?, P. Natl. Acad. Sci. USA, 121, e2319664121, https://doi.org/10.1073/pnas.2319664121, 2024. a, b, c, d
Chen, Y. S., Verlinde, J., Clothiaux, E. E., Ackerman, A. S., Fridlind, A. M., Chamecki, M., Kollias, P., Kirkpatrick, M. P., Chen, B. C., Yu, G., and Avramov, A.: On the Forward Modeling of Radar Doppler Spectrum Width From LES: Implications for Model Evaluation, J. Geophys. Res.-Atmos., 123, 7444–7461, https://doi.org/10.1029/2017JD028104, 2018. a, b, c
Chepfer, H., Bony, S., Winker, D., Chiriaco, M., Dufresne, J. L., and Sèze, G.: Use of CALIPSO lidar observations to evaluate the cloudiness simulated by a climate model, Geophys. Res. Lett., 35, L15704, https://doi.org/10.1029/2008GL034207, 2008. a
Cooper, W. A.: Effects of Variable Droplet Growth Histories on Droplet Size Distributions. Part I: Theory, J. Atmos. Sci., 46, 1301–1311, https://doi.org/10.1175/1520-0469(1989)046<1301:EOVDGH>2.0.CO;2, 1989. a, b
Elsaesser, G. S., Del Genio, A. D., Jiang, J. H., and van Lier-Walqui, M.: An Improved Convective Ice Parameterization for the NASA GISS Global Climate Model and Impacts on Cloud Ice Simulation, J. Climate, 30, 317–336, https://doi.org/10.1175/JCLI-D-16-0346.1, 2017. a
Endo, S., Fridlind, A. M., Lin, W., Vogelmann, A. M., Toto, T., Ackerman, A., McFarquhar, G. M., Jackson, R. C., Jonsson, H. H., and Liu, Y.: RACORO continental boundary layer cloud investigations: 2. Large-eddy simulations of cumulus clouds and evaluation with in situ and ground-based observations, J. Geophys. Res.-Atmos., 120, 5993–6014, https://doi.org/10.1002/2014JD022525, 2015. a, b
Freud, E. and Rosenfeld, D.: Linear relation between convective cloud drop number concentration and depth for rain initiation, J. Geophys. Res.-Atmos., 117, D02207, https://doi.org/10.1029/2011JD016457, 2012. a
Fridlind, A. M. and Ackerman, A. S.: Chapter 7 – Simulations of Arctic Mixed-Phase Boundary Layer Clouds: Advances in Understanding and Outstanding Questions, in: Mixed-Phase Clouds, edited by: Constantin, A., Elsevier, 153–183, https://doi.org/10.1016/B978-0-12-810549-8.00007-6, 2017. a
Fridlind, A. M., Ackerman, A. S., Chaboureau, J. P., Fan, J., Grabowski, W. W., Hill, A. A., Jones, T. R., Khaiyer, M. M., Liu, G., Minnis, P., Morrison, H., Nguyen, L., Park, S., Petch, J. C., Pinty, J. P., Schumacher, C., Shipway, B. J., Varble, A. C., Wu, X., Xie, S., and Zhang, M.: A comparison of TWP-ICE observational data with cloud-resolving model results, J. Geophys. Res.-Atmos., 117, 5204, https://doi.org/10.1029/2011JD016595, 2012. a
Fridlind, A. M., Li, X., Wu, D., van Lier-Walqui, M., Ackerman, A. S., Tao, W.-K., McFarquhar, G. M., Wu, W., Dong, X., Wang, J., Ryzhkov, A., Zhang, P., Poellot, M. R., Neumann, A., and Tomlinson, J. M.: Derivation of aerosol profiles for MC3E convection studies and use in simulations of the 20 May squall line case, Atmos. Chem. Phys., 17, 5947–5972, https://doi.org/10.5194/acp-17-5947-2017, 2017. a
Fu, D., Di Girolamo, L., Rauber, R. M., McFarquhar, G. M., Nesbitt, S. W., Loveridge, J., Hong, Y., van Diedenhoven, B., Cairns, B., Alexandrov, M. D., Lawson, P., Woods, S., Tanelli, S., Schmidt, S., Hostetler, C., and Scarino, A. J.: An evaluation of the liquid cloud droplet effective radius derived from MODIS, airborne remote sensing, and in situ measurements from CAMP2Ex, Atmos. Chem. Phys., 22, 8259–8285, https://doi.org/10.5194/acp-22-8259-2022, 2022. a
Gao, M., Franz, B. A., Zhai, P.-W., Knobelspiesse, K., Sayer, A. M., Xu, X., Martins, J. V., Cairns, B., Castellanos, P., Fu, G., Hannadige, N., Hasekamp, O., Hu, Y., Ibrahim, A., Patt, F., Puthukkudy, A., and Werdell, P. J.: Simultaneous retrieval of aerosol and ocean properties from PACE HARP2 with uncertainty assessment using cascading neural network radiative transfer models, Atmos. Meas. Tech., 16, 5863–5881, https://doi.org/10.5194/amt-16-5863-2023, 2023. a
Gerber, H.: Microphysics of Marine Stratocumulus Clouds with Two Drizzle Modes, J. Atmos. Sci., 53, 1649–1662, https://doi.org/10.1175/1520-0469(1996)053<1649:MOMSCW>2.0.CO;2, 1996. a
Grabowski, W. W. and Abade, G. C.: Broadening of Cloud Droplet Spectra through Eddy Hopping: Turbulent Adiabatic Parcel Simulations, J. Atmos. Sci., 74, 1485–1493, https://doi.org/10.1175/JAS-D-17-0043.1, 2017. a
Gregory, D. and Rowntree, P. R.: A Mass Flux Convection Scheme with Representation of Cloud Ensemble Characteristics and Stability-Dependent Closure, Mon. Weather Rev., 118, 1483–1506, https://doi.org/10.1175/1520-0493(1990)118<1483:AMFCSW>2.0.CO;2, 1990. a
Grosvenor, D. P., Sourdeval, O., Zuidema, P., Ackerman, A., Alexandrov, M. D., Bennartz, R., Boers, R., Cairns, B., Chiu, J. C., Christensen, M., Deneke, H., Diamond, M., Feingold, G., Fridlind, A., Hünerbein, A., Knist, C., Kollias, P., Marshak, A., McCoy, D., Merk, D., Painemal, D., Rausch, J., Rosenfeld, D., Russchenberg, H., Seifert, P., Sinclair, K., Stier, P., van Diedenhoven, B., Wendisch, M., Werner, F., Wood, R., Zhang, Z., and Quaas, J.: Remote Sensing of Droplet Number Concentration in Warm Clouds: A Review of the Current State of Knowledge and Perspectives, Rev. Geophys., 56, 409–453, https://doi.org/10.1029/2017RG000593, 2018. a, b, c, d
Hall, D.: A detailed microphysical model within a two-dimensional dynamic framework: Model description and preliminary results, J. Atmos. Sci., 37, 2486–2507, https://doi.org/10.1175/1520-0469(1980)037<2486:ADMMWA>2.0.CO;2, 1980. a, b
Hallquist, M., Wenger, J. C., Baltensperger, U., Rudich, Y., Simpson, D., Claeys, M., Dommen, J., Donahue, N. M., George, C., Goldstein, A. H., Hamilton, J. F., Herrmann, H., Hoffmann, T., Iinuma, Y., Jang, M., Jenkin, M. E., Jimenez, J. L., Kiendler-Scharr, A., Maenhaut, W., McFiggans, G., Mentel, Th. F., Monod, A., Prévôt, A. S. H., Seinfeld, J. H., Surratt, J. D., Szmigielski, R., and Wildt, J.: The formation, properties and impact of secondary organic aerosol: current and emerging issues, Atmos. Chem. Phys., 9, 5155–5236, https://doi.org/10.5194/acp-9-5155-2009, 2009. a
Hansen, J. E. and Travis, L. D.: Light scattering in planetary atmospheres, Space Sci. Rev., 16, 527–610, https://doi.org/10.1007/BF00168069, 1974. a, b
Hasekamp, O. P., Fu, G., Rusli, S. P., Wu, L., Di Noia, A., Brugh, J. A. D., Landgraf, J., Martijn Smit, J., Rietjens, J., and van Amerongen, A.: Aerosol measurements by SPEXone on the NASA PACE mission: expected retrieval capabilities, J. Quant. Spectrosc. Ra., 227, 170–184, https://doi.org/10.1016/J.JQSRT.2019.02.006, 2019. a
Hernandez-Deckers, D. and Sherwood, S. C.: A Numerical Investigation of Cumulus Thermals, J. Atmos. Sci., 73, 4117–4136, https://doi.org/10.1175/JAS-D-15-0385.1, 2016. a, b, c, d, e, f, g
Hernandez-Deckers, D. and Sherwood, S. C.: On the Role of Entrainment in the Fate of Cumulus Thermals, J. Atmos. Sci., 75, 3911–3924, https://doi.org/10.1175/JAS-D-18-0077.1, 2018. a, b, c, d, e
Hernandez-Deckers, D., Matsui, T., and Fridlind, A. M.: Updraft dynamics and microphysics: on the added value of the cumulus thermal reference frame in simulations of aerosol–deep convection interactions, Atmos. Chem. Phys., 22, 711–724, https://doi.org/10.5194/acp-22-711-2022, 2022. a, b, c
Hohenegger, C. and Stevens, B.: Preconditioning Deep Convection with Cumulus Congestus, J. Atmos. Sci., 70, 448–464, https://doi.org/10.1175/JAS-D-12-089.1, 2013. a
Jensen, E. J., Toon, O. B., Tabazadeh, A., Sachse, G. W., Anderson, B. E., Chan, K. R., Twohy, C. W., Gandrud, B., Aulenbach, S. M., Heymsfield, A., Hallett, J., and Gary, B.: Ice nucleation processes in upper tropospheric wave-clouds observed during SUCCESS, Geophys. Res. Lett., 25, 1363–1366, https://doi.org/10.1029/98GL00299, 1998. a
Johnson, R. H., Rickenbach, T. M., Rutledge, S. A., Ciesielski, P. E., and Schubert, W. H.: Trimodal Characteristics of Tropical Convection, J. Climate, 12, 2397–2418, https://doi.org/10.1175/1520-0442(1999)012<2397:TCOTC>2.0.CO;2, 1999. a, b
Juliano, T. W., Tornow, F., Fridlind, A. M., Ackerman, A. S., Geerts, B., Kosović, B., Ovchinnikov, M., Wu, P., and Xue, L.: Evaluating simulated convective clouds during Arctic cold-air outbreaks: A model intercomparison study based on COMBLE, [White Paper], https://www.gewexevents.org/wp-content/uploads/COMBLE_white_paper.pdf (last access: 31 July 2024), 2022. a
Keinert, A., Spannagel, D., Leisner, T., and Kiselev, A.: Secondary Ice Production upon Freezing of Freely Falling Drizzle Droplets, J. Atmos. Sci., 77, 2959–2967, https://doi.org/10.1175/JAS-D-20-0081.1, 2020. a
Khairoutdinov, M. and Kogan, Y.: A New Cloud Physics Parameterization in a Large-Eddy Simulation Model of Marine Stratocumulus, Mon. Weather Rev., 128, 229–243, https://doi.org/10.1175/1520-0493(2000)128<0229:ANCPPI>2.0.CO;2, 2000. a, b
Kirkpatrick, M. P., Ackerman, A. S., Stevens, D. E., and Mansour, N. N.: On the Application of the Dynamic Smagorinsky Model to Large-Eddy Simulations of the Cloud-Topped Atmospheric Boundary Layer, J. Atmos. Sci., 63, 526–546, https://doi.org/10.1175/JAS3651.1, 2006. a
Klein, S. A., McCoy, R. B., Morrison, H., Ackerman, A. S., Avramov, A., de Boer, G., Chen, M., Cole, J. N., del Genio, A. D., Falk, M., Foster, M. J., Fridlind, A., Golaz, J. C., Hashino, T., Harrington, J. Y., Hoose, C., Khairoutdinov, M. F., Larson, V. E., Liu, X., Luo, Y., McFarquhar, G. M., Menon, S., Neggers, R. A., Park, S., Poellot, M. R., Schmidt, J. M., Sednev, I., Shipway, B. J., Shupe, M. D., Spangenberg, D. A., Sud, Y. C., Turner, D. D., Veron, D. E., von Salzen, K., Walker, G. K., Wang, Z., Wolf, A. B., Xie, S., Xu, K. M., Yang, F., and Zhang, G.: Intercomparison of model simulations of mixed-phase clouds observed during the ARM Mixed-Phase Arctic Cloud Experiment. I: single-layer cloud, Q. J. Roy. Meteor. Soc., 135, 979–1002, https://doi.org/10.1002/QJ.416, 2009. a
Korolev, A. V., Strapp, J. W., Isaac, G. A., and Nevzorov, A. N.: The Nevzorov Airborne Hot-Wire LWC–TWC Probe: Principle of Operation and Performance Characteristics, J. Atmos. Ocean. Tech., 15, 1495–1510, https://doi.org/10.1175/1520-0426(1998)015<1495:TNAHWL>2.0.CO;2, 1998. a
Kuang, Z. and Bretherton, C. S.: A Mass-Flux Scheme View of a High-Resolution Simulation of a Transition from Shallow to Deep Cumulus Convection, J. Atmos. Sci., 63, 1895–1909, https://doi.org/10.1175/JAS3723.1, 2006. a
Kulkarni, P. and Wang, J.: New fast integrated mobility spectrometer for real-time measurement of aerosol size distribution – I: Concept and theory, J. Aerosol Sci., 37, 1303–1325, https://doi.org/10.1016/J.JAEROSCI.2006.01.005, 2006. a
Lasher-Trapp, S. G., Cooper, W. A., and Blyth, A. M.: Broadening of droplet size distributions from entrainment and mixing in a cumulus cloud, Q. J. Roy. Meteor. Soc., 131, 195–220, https://doi.org/10.1256/QJ.03.199, 2005. a, b
Lauber, A., Kiselev, A., Pander, T., Handmann, P., and Leisner, T.: Secondary ice formation during freezing of levitated droplets, J. Atmos. Sci., 75, 2815–2826, https://doi.org/10.1175/JAS-D-18-0052.1, 2018. a
Lawson, P., Gurganus, C., Woods, S., and Bruintjes, R.: Aircraft observations of cumulus microphysics ranging from the tropics to midlatitudes: Implications for a “new” secondary ice process, J. Atmos. Sci., 74, 2899–2920, https://doi.org/10.1175/JAS-D-17-0033.1, 2017. a, b, c
Lawson, P. R., Woods, S., and Morrison, H.: The Microphysics of Ice and Precipitation Development in Tropical Cumulus Clouds, J. Atmos. Sci., 72, 2429–2445, https://doi.org/10.1175/JAS-D-14-0274.1, 2015. a, b
Lawson, R. P., Stewart, R. E., and Angus, L. J.: Observations and Numerical Simulations of the Origin and Development of Very Large Snowflakes, J. Atmos. Sci., 55, 3209–3229, https://doi.org/10.1175/1520-0469(1998)055<3209:OANSOT>2.0.CO;2, 1998. a
Lawson, R. P., Baker, B. A., Schmitt, C. G., and Jensen, T. L.: An overview of microphysical properties of Arctic clouds observed in May and July 1998 during FIRE ACE, J. Geophys. Res.-Atmos., 106, 14989–15014, https://doi.org/10.1029/2000JD900789, 2001. a
Lawson, R. P., O'Connor, D., Zmarzly, P., Weaver, K., Baker, B., Mo, Q., and Jonsson, H.: The 2D-S (Stereo) Probe: Design and Preliminary Tests of a New Airborne, High-Speed, High-Resolution Particle Imaging Probe, J. Atmos. Ocean. Tech., 23, 1462–1477, https://doi.org/10.1175/JTECH1927.1, 2006. a
Lawson, R. P., Bruintjes, R., Woods, S., and Gurganus, C.: Coalescence and Secondary Ice Development in Cumulus Congestus Clouds, J. Atmos. Sci., 79, 953–972, https://doi.org/10.1175/JAS-D-21-0188.1, 2022. a, b
Lee, H., Fridland, A. M., and Ackerman, A. S.: An Evaluation of Size-Resolved Cloud Microphysics Scheme Numerics for Use with Radar Observations. Part II: Condensation and Evaporation, J. Atmos. Sci., 78, 1629–1645, https://doi.org/10.1175/JAS-D-20-0213.1, 2021. a, b, c
Lin, C. and Arakawa, A.: The Macroscopic Entrainment Processes of Simulated Cumulus Ensemble. Part II: Testing the Entraining-Plume Model, J. Atmos. Sci., 54, 1044–1053, https://doi.org/10.1175/1520-0469(1997)054<1044:TMEPOS>2.0.CO;2, 1997. a
Lin, W., Liu, Y., Vogelmann, A. M., Fridlind, A., Endo, S., Song, H., Feng, S., Toto, T., Li, Z., and Zhang, M.: RACORO continental boundary layer cloud investigations: 3. Separation of parameterization biases single-column model CAM5 simulations of shallow cumulus, J. Geophys. Res.-Atmos., 120, 6015–6033, https://doi.org/10.1002/2014JD022524, 2015. a, b
Low, T. B. and List, R.: Collision, Coalescence and Breakup of Raindrops. Part II: Parameterization of Fragment Size Distributions, J. Atmos. Sci., 39, 1607–1619, https://doi.org/10.1175/1520-0469(1982)039<1607:CCABOR>2.0.CO;2, 1982. a
Luo, Z., Liu, G. Y., Stephens, G. L., and Johnson, R. H.: Terminal versus transient cumulus congestus: A CloudSat perspective, Geophys. Res. Lett., 36, L05808, https://doi.org/10.1029/2008GL036927, 2009. a
Mansell, E. R. and Ziegler, C. L.: Aerosol Effects on Simulated Storm Electrification and Precipitation in a Two-Moment Bulk Microphysics Model, J. Atmos. Sci., 70, 2032–2050, https://doi.org/10.1175/JAS-D-12-0264.1, 2013. a
Mansell, E. R., Ziegler, C. L., and Bruning, E. C.: Simulated Electrification of a Small Thunderstorm with Two-Moment Bulk Microphysics, J. Atmos. Sci., 67, 171–194, https://doi.org/10.1175/2009JAS2965.1, 2010. a
Manton, M. J.: On the broadening of a droplet distribution by turbulence near cloud base, Q. J. Roy. Meteor. Soc., 105, 899–914, https://doi.org/10.1002/QJ.49710544613, 1979. a
Martins, J. V., Fernandez-Borda, R., McBride, B., Remer, L., and Barbosa, H. M.: The harp hyperangular imaging polarimeter and the need for small satellite payloads with high science payoff for earth science remote sensing, International Geoscience and Remote Sensing Symposium (IGARSS), 22–27 July 2018, Valencia, Spain, 6304–6307, https://doi.org/10.1109/IGARSS.2018.8518823, 2018. a
Matsui, T., Zhang, S. Q., Lang, S. E., Tao, W. K., Ichoku, C., and Peters-Lidard, C. D.: Impact of radiation frequency, precipitation radiative forcing, and radiation column aggregation on convection-permitting West African monsoon simulations, Clim. Dynam., 55, 193–213, https://doi.org/10.1007/s00382-018-4187-2, 2020. a
Matsui, T., Hernandez-Deckers, D., Giangrande, S. E., Biscaro, T. S., Fridlind, A., and Braun, S.: A thermal-driven graupel generation process to explain dry-season convective vigor over the Amazon, Atmos. Chem. Phys., 24, 10793–10814, https://doi.org/10.5194/acp-24-10793-2024, 2024. a, b, c, d
Miller, D. J., Zhang, Z., Platnick, S., Ackerman, A. S., Werner, F., Cornet, C., and Knobelspiesse, K.: Comparisons of bispectral and polarimetric retrievals of marine boundary layer cloud microphysics: case studies using a LES–satellite retrieval simulator, Atmos. Meas. Tech., 11, 3689–3715, https://doi.org/10.5194/amt-11-3689-2018, 2018. a
Morrison, H. and Grabowski, W. W.: A Novel Approach for Representing Ice Microphysics in Models: Description and Tests Using a Kinematic Framework, J. Atmos. Sci., 65, 1528–1548, https://doi.org/10.1175/2007JAS2491.1, 2008a. a
Morrison, H. and Grabowski, W. W.: Modeling Supersaturation and Subgrid-Scale Mixing with Two-Moment Bulk Warm Microphysics, J. Atmos. Sci., 65, 792–812, https://doi.org/10.1175/2007JAS2374.1, 2008b. a
Morrison, H., Curry, J. A., and Khvorostyanov, V. I.: A New Double-Moment Microphysics Parameterization for Application in Cloud and Climate Models. Part I: Description, J. Atmos. Sci., 62, 1665–1677, https://doi.org/10.1175/JAS3446.1, 2005. a
Morrison, H., Thompson, G., and Tatarskii, V.: Impact of Cloud Microphysics on the Development of Trailing Stratiform Precipitation in a Simulated Squall Line: Comparison of One- and Two-Moment Schemes, Mon. Weather Rev., 137, 991–1007, https://doi.org/10.1175/2008MWR2556.1, 2009. a
Morrison, H., Witte, M., Bryan, G. H., Harrington, J. Y., and Lebo, Z. J.: Broadening of Modeled Cloud Droplet Spectra Using Bin Microphysics in an Eulerian Spatial Domain, J. Atmos. Sci., 75, 4005–4030, https://doi.org/10.1175/JAS-D-18-0055.1, 2018. a
Morrison, H., Peters, J. M., Varble, A. C., Hannah, W. M., and Giangrande, S. E.: Thermal Chains and Entrainment in Cumulus Updrafts. Part I: Theoretical Description, J. Atmos. Sci., 77, 3637–3660, https://doi.org/10.1175/JAS-D-19-0243.1, 2020. a
Morrison, H., Lawson, P., and Chandrakar, K. K.: Observed and Bin Model Simulated Evolution of Drop Size Distributions in High-Based Cumulus Congestus Over the United Arab Emirates, J. Geophys. Res.-Atmos., 127, e2021JD035711, https://doi.org/10.1029/2021JD035711, 2022. a, b, c, d
Moser, D. H. and Lasher-Trapp, S.: The Influence of Successive Thermals on Entrainment and Dilution in a Simulated Cumulus Congestus, J. Atmos. Sci., 74, 375–392, https://doi.org/10.1175/JAS-D-16-0144.1, 2017. a
Nakanishi, M. and Niino, H.: Development of an Improved Turbulence Closure Model for the Atmospheric Boundary Layer, J. Meteorol. Soc. Jpn. Ser. II, 87, 895–912, https://doi.org/10.2151/JMSJ.87.895, 2009. a
NASA Center for Climate Simulation: giss-camp2ex, https://portal.nccs.nasa.gov/datashare/giss-camp2ex/, last access: 15 July 2025. a, b
National Centers for Environmental Prediction National Weather Service NOAA U. S. Department of Commerce: NCEP GDAS/FNL 0.25 Degree Global Tropospheric Analyses and Forecast Grids, https://doi.org/10.5065/D65Q4T4Z, 2015. a
NASA NU-WRF: https://nuwrf.gsfc.nasa.gov (last access: 31 July 2024), 2025. a
NASA Suborbital Science Data for Atmospheric Composition: https://www-air.larc.nasa.gov/cgi-bin/ArcView/camp2ex, last access: 31 July 2024. a
Neggers, R. A.: Attributing the behavior of low-level clouds in large-scale models to subgrid-scale parameterizations, J. Adv. Model. Earth Sy., 7, 2029–2043, https://doi.org/10.1002/2015MS000503, 2015. a, b, c
Neggers, R. A., Ackerman, A. S., Angevine, W. M., Bazile, E., Beau, I., Blossey, P. N., Boutle, I. A., de Bruijn, C., Cheng, A., van der Dussen, J., Fletcher, J., Dal Gesso, S., Jam, A., Kawai, H., Cheedela, S. K., Larson, V. E., Lefebvre, M. P., Lock, A. P., Meyer, N. R., de Roode, S. R., de Rooy, W., Sandu, I., Xiao, H., and Xu, K. M.: Single-Column Model Simulations of Subtropical Marine Boundary-Layer Cloud Transitions Under Weakening Inversions, J. Adv. Model. Earth Sy., 9, 2385–2412, https://doi.org/10.1002/2017MS001064, 2017. a, b
Niu, G. Y., Yang, Z. L., Mitchell, K. E., Chen, F., Ek, M. B., Barlage, M., Kumar, A., Manning, K., Niyogi, D., Rosero, E., Tewari, M., and Xia, Y.: The community Noah land surface model with multiparameterization options (Noah-MP): 1. Model description and evaluation with local-scale measurements, J. Geophys. Res.-Atmos., 116, 12109, https://doi.org/10.1029/2010JD015139, 2011. a
O'Connor, D., Baker, B., and Lawson, R. P.: Upgrades to the FSSP-100 Electronics, in: Int. Conf. on Clouds and Precipitation, Cancun, Mexico, IAMAS, 7–11 July 2008, http://cabernet.atmosfcu.unam.mx/ICCP-2008/abstracts/Program_on_line/Poster_13/O-Connor_extended.pdf (last access: 31 July 2024), 2008. a
Painemal, D. and Zuidema, P.: Assessment of MODIS cloud effective radius and optical thickness retrievals over the Southeast Pacific with VOCALS-REx in situ measurements, J. Geophys. Res.-Atmos., 116, 24206, https://doi.org/10.1029/2011JD016155, 2011. a, b
Pardo, L. H., Morrison, H., Machado, L. A., Harrington, J. Y., and Lebo, Z. J.: Drop Size Distribution Broadening Mechanisms in a Bin Microphysics Eulerian Model, J. Atmos. Sci., 77, 3249–3273, https://doi.org/10.1175/JAS-D-20-0099.1, 2020. a
Peters, J. M., Morrison, H., Varble, A. C., Hannah, W. M., and Giangrande, S. E.: Thermal Chains and Entrainment in Cumulus Updrafts. Part II: Analysis of Idealized Simulations, J. Atmos. Sci., 77, 3661–3681, https://doi.org/10.1175/JAS-D-19-0244.1, 2020. a
Peters-Lidard, C. D., Kemp, E. M., Matsui, T., Santanello, J. A., Kumar, S. V., Jacob, J. P., Clune, T., Tao, W. K., Chin, M., Hou, A., Case, J. L., Kim, D., Kim, K. M., Lau, W., Liu, Y., Shi, J., Starr, D., Tan, Q., Tao, Z., Zaitchik, B. F., Zavodsky, B., Zhang, S. Q., and Zupanski, M.: Integrated modeling of aerosol, cloud, precipitation and land processes at satellite-resolved scales, Environ. Modell. Softw., 67, 149–159, https://doi.org/10.1016/J.ENVSOFT.2015.01.007, 2015. a, b
Petters, M. D. and Kreidenweis, S. M.: A single parameter representation of hygroscopic growth and cloud condensation nucleus activity, Atmos. Chem. Phys., 7, 1961–1971, https://doi.org/10.5194/acp-7-1961-2007, 2007. a, b
Phillips, V. T., Patade, S., Gutierrez, J., and Bansemer, A.: Secondary Ice Production by Fragmentation of Freezing Drops: Formulation and Theory, J. Atmos. Sci., 75, 3031–3070, https://doi.org/10.1175/JAS-D-17-0190.1, 2018. a
Pinsky, M., Khain, A., Korolev, A., and Magaritz-Ronen, L.: Theoretical investigation of mixing in warm clouds – Part 2: Homogeneous mixing, Atmos. Chem. Phys., 16, 9255–9272, https://doi.org/10.5194/acp-16-9255-2016, 2016. a
Reid, J. S., Maring, H. B., Narisma, G. T., van den Heever, S., Di Girolamo, L., Ferrare, R., Lawson, P., Mace, G. G., Simpas, J. B., Tanelli, S., Ziemba, L., van Diedenhoven, B., Bruintjes, R., Bucholtz, A., Cairns, B., Cambaliza, M. O., Chen, G., Diskin, G. S., Flynn, J. H., Hostetler, C. A., Holz, R. E., Lang, T. J., Schmidt, K. S., Smith, G., Sorooshian, A., Thompson, E. J., Thornhill, K. L., Trepte, C., Wang, J., Woods, S., Yoon, S., Alexandrov, M., Alvarez, S., Amiot, C. G., Bennett, J. R., Brooks, M., Burton, S. P., Cayanan, E., Chen, H., Collow, A., Crosbie, E., DaSilva, A., DiGangi, J. P., Flagg, D. D., Freeman, S. W., Fu, D., Fukada, E., Hilario, M. R. A., Hong, Y., Hristova-Veleva, S. M., Kuehn, R., Kowch, R. S., Leung, G. R., Loveridge, J., Meyer, K., Miller, R. M., Montes, M. J., Moum, J. N., Nenes, T., Nesbitt, S. W., Norgren, M., Nowottnick, E. P., Rauber, R. M., Reid, E. A., Rutledge, S., Schlosser, J. S., Sekiyama, T. T., Shook, M. A., Sokolowsky, G. A., Stamnes, S. A., Tanaka, T. Y., Wasilewski, A., Xian, P., Xiao, Q., Xu, Z., and Zavaleta, J.: The coupling between tropical meteorology, aerosol lifecycle, convection, and radiation, during the Cloud, Aerosol and Monsoon Processes Philippines Experiment (CAMP2Ex), B. Am. Meteorol. Soc., 104, E1179–E1205, https://doi.org/10.1175/BAMS-D-21-0285.1, 2023. a, b, c, d, e, f
Rémillard, J., Fridlind, A. M., Ackerman, A. S., Tselioudis, G., Kollias, P., Mechem, D. B., Chandler, H. E., Luke, E., Wood, R., Witte, M. K., Chuang, P. Y., and Ayers, J. K.: Use of Cloud Radar Doppler Spectra to Evaluate Stratocumulus Drizzle Size Distributions in Large-Eddy Simulations with Size-Resolved Microphysics, J. Appl. Meteorol. Clim., 56, 3263–3283, https://doi.org/10.1175/JAMC-D-17-0100.1, 2017. a
Rosenfeld, D. and Gutman, G.: Retrieving microphysical properties near the tops of potential rain clouds by multispectral analysis of AVHRR data, Atmos. Res., 34, 259–283, https://doi.org/10.1016/0169-8095(94)90096-5, 1994. a
Sandu, I. and Stevens, B.: On the Factors Modulating the Stratocumulus to Cumulus Transitions, J. Atmos. Sci., 68, 1865–1881, https://doi.org/10.1175/2011JAS3614.1, 2011. a, b
Sato, Y., Shima, S. I., and Tomita, H.: Numerical Convergence of Shallow Convection Cloud Field Simulations: Comparison Between Double-Moment Eulerian and Particle-Based Lagrangian Microphysics Coupled to the Same Dynamical Core, J. Adv. Model. Earth Sy., 10, 1495–1512, https://doi.org/10.1029/2018MS001285, 2018. a, b
Seifert, A.: On the Parameterization of Evaporation of Raindrops as Simulated by a One-Dimensional Rainshaft Model, J. Atmos. Sci., 65, 3608–3619, https://doi.org/10.1175/2008JAS2586.1, 2008. a
Seifert, A. and Beheng, K. D.: A double-moment parameterization for simulating autoconversion, accretion and selfcollection, Atmos. Res., 59–60, 265–281, https://doi.org/10.1016/S0169-8095(01)00126-0, 2001. a, b, c
Sherwood, S. C., Hernández-Deckers, D., Colin, M., and Robinson, F.: Slippery Thermals and the Cumulus Entrainment Paradox, J. Atmos. Sci., 70, 2426–2442, https://doi.org/10.1175/JAS-D-12-0220.1, 2013. a, b
Siebesma, A. P., Bretherton, C. S., Brown, A., Chlond, A., Cuxart, J., Duynkerke, P. G., Jiang, H., Khairoutdinov, M., Lewellen, D., Moeng, C.-H., Sanchez, E., Stevens, B., and Stevens, D. E.: A Large Eddy Simulation Intercomparison Study of Shallow Cumulus Convection, J. Atmos. Sci., 60, 1201–1219, https://doi.org/10.1175/1520-0469(2003)60<1201:ALESIS>2.0.CO;2, 2003. a, b
Sinclair, K., van Diedenhoven, B., Cairns, B., Yorks, J., Wasilewski, A., and McGill, M.: Remote sensing of multiple cloud layer heights using multi-angular measurements, Atmos. Meas. Tech., 10, 2361–2375, https://doi.org/10.5194/amt-10-2361-2017, 2017. a, b
Sinclair, K., van Diedenhoven, B., Cairns, B., Alexandrov, M., Moore, R., Crosbie, E., and Ziemba, L.: Polarimetric retrievals of cloud droplet number concentrations, Remote Sens. Environ., 228, 227–240, https://doi.org/10.1016/J.RSE.2019.04.008, 2019. a, b
Sinclair, K., van Diedenhoven, B., Cairns, B., Alexandrov, M., Moore, R., Ziemba, L. D., and Crosbie, E.: Observations of Aerosol-Cloud Interactions During the North Atlantic Aerosol and Marine Ecosystem Study, Geophys. Res. Lett., 47, e2019GL085851, https://doi.org/10.1029/2019GL085851, 2020. a
Sinclair, K., van Diedenhoven, B., Cairns, B., Alexandrov, M., Dzambo, A. M., and L'Ecuyer, T.: Inference of Precipitation in Warm Stratiform Clouds Using Remotely Sensed Observations of the Cloud Top Droplet Size Distribution, Geophys. Res. Lett., 48, e2021GL092547, https://doi.org/10.1029/2021GL092547, 2021. a, b
Skamarock, W. C., Klemp, J. B., Dudhia, J., Gill, D. O., Barker, D. M., Duda, M. G., Huang, X.-Y., Wang, W., and Powers, J. G.: A Description of the Advanced Research WRF Version 3, NCAR Tech. Note NCAR/TN-475+STR, 1–113, https://doi.org/10.5065/D68S4MVH, 2008. a
Song, X. and Zhang, G. J.: Microphysics parameterization for convective clouds in a global climate model: Description and single-column model tests, J. Geophys. Res.-Atmos., 116, 2201, https://doi.org/10.1029/2010JD014833, 2011. a
Stanford, M. W.: stanford_acp_camp2ex_LES_RSP_DSD, Zenodo [code], https://doi.org/10.5281/zenodo.15901072, 2025. a, b
Stephens, G. L.: Radiation Profiles in Extended Water Clouds. II: Parameterization Schemes, J. Atmos. Sci., 35, 2123–2132, https://doi.org/10.1175/1520-0469(1978)035<2123:RPIEWC>2.0.CO;2, 1978. a
Stevens, B. and Seifert, A.: Understanding macrophysical outcomes of microphysical choices in simulations of shallow cumulus convection, J. Meteorol. Soc. Jpn. Ser. II, 86A, 143–162, https://doi.org/10.2151/JMSJ.86A.143, 2008. a
Stevens, D. E. and Bretherton, S.: A Forward-in-Time Advection Scheme and Adaptive Multilevel Flow Solver for Nearly Incompressible Atmospheric Flow, J. Comput. Phys., 129, 284–295, https://doi.org/10.1006/JCPH.1996.0250, 1996. a
Stevens, D. E., Ackerman, A. S., and Bretherton, C. S.: Effects of Domain Size and Numerical Resolution on the Simulation of Shallow Cumulus Convection, J. Atmos. Sci., 59, 3285–3301, https://doi.org/10.1175/1520-0469(2002)059<3285:EODSAN>2.0.CO;2, 2002. a
Tiedtke, M.: A Comprehensive Mass Flux Scheme for Cumulus Parameterization in Large-Scale Models, Mon. Weather Rev., 117, 1779–1800, https://doi.org/10.1175/1520-0493(1989)117<1779:ACMFSF>2.0.CO;2, 1989. a
VanZanten, M. C., Stevens, B., Nuijens, L., Siebesma, A. P., Ackerman, A. S., Burnet, F., Cheng, A., Couvreux, F., Jiang, H., Khairoutdinov, M., Kogan, Y., Lewellen, D. C., Mechem, D., Nakamura, K., Noda, A., Shipway, B. J., Slawinska, J., Wang, S., and Wyszogrodzki, A.: Controls on precipitation and cloudiness in simulations of trade-wind cumulus as observed during RICO, J. Adv. Model. Earth Sy., 3, M06001, https://doi.org/10.1029/2011MS000056, 2011. a
Varble, A., Fridlind, A. M., Zipser, E. J., Ackerman, A. S., Chaboureau, J.-P., Fan, J., Hill, A., Mcfarlane, S. A., Pinty, J.-P., Shipway, B., Varble, C., Fridlind, A. M., Zipser, E. J., Ackerman, A. S., Chaboureau, J.-P., Fan, J., Hill, A., Mcfarlane, S. A., Pinty, J.-P., and Shipway, B.: Evaluation of cloud-resolving model intercomparison simulations using TWP-ICE observations: Precipitation and cloud structure, J. Geophys. Res.-Atmos., 116, 12206, https://doi.org/10.1029/2010JD015180, 2011. a
Vogelmann, A. M., Fridlind, A. M., Toto, T., Endo, S., Lin, W., Wang, J., Feng, S., Zhang, Y., Turner, D. D., Liu, Y., Li, Z., Xie, S., Ackerman, A. S., Zhang, M., and Khairoutdinov, M.: RACORO continental boundary layer cloud investigations: 1. Case study development and ensemble large-scale forcings, J. Geophys. Res.-Atmos., 120, 5962–5992, https://doi.org/10.1002/2014JD022713, 2015. a, b
Waite, M. L. and Khouider, B.: The Deepening of Tropical Convection by Congestus Preconditioning, J. Atmos. Sci., 67, 2601–2615, https://doi.org/10.1175/2010JAS3357.1, 2010. a
Wall, C., Liu, C., and Zipser, E.: A climatology of tropical congestus using CloudSat, J. Geophys. Res.-Atmos., 118, 6478–6492, https://doi.org/10.1002/JGRD.50455, 2013. a
Wang, J., Pikridas, M., Pinterich, T., Spielman, S. R., Tsang, T., McMahon, A., and Smith, S.: A Fast Integrated Mobility Spectrometer for rapid measurement of sub-micrometer aerosol size distribution, Part II: Experimental characterization, J. Aerosol Sci., 113, 119–129, https://doi.org/10.1016/J.JAEROSCI.2017.05.001, 2017a. a, b
Wang, J., Pikridas, M., Spielman, S. R., and Pinterich, T.: A fast integrated mobility spectrometer for rapid measurement of sub-micrometer aerosol size distribution, Part I: Design and model evaluation, J. Aerosol Sci., 108, 44–55, https://doi.org/10.1016/J.JAEROSCI.2017.02.012, 2017b. a
Wang, L. P. and Grabowski, W. W.: The role of air turbulence in warm rain initiation, Atmos. Sci. Lett., 10, 1–8, https://doi.org/10.1002/ASL.210, 2009. a
Wang, Y., Pinterich, T., and Wang, J.: Rapid measurement of sub-micrometer aerosol size distribution using a fast integrated mobility spectrometer, J. Aerosol Sci., 121, 12–20, https://doi.org/10.1016/J.JAEROSCI.2018.03.006, 2018. a, b
Warner, J.: The Microstructure of Cumulus Cloud. Part I. General Features of the Droplet Spectrum, J. Atmos. Sci., 26, 1049–1059, https://doi.org/10.1175/1520-0469(1969)026<1049:TMOCCP>2.0.CO;2, 1969. a
Webster, P. J. and Lukas, R.: TOGA COARE: The Coupled Ocean–Atmosphere Response Experiment, B. Am. Meteorol. Soc., 73, 1377–1416, https://doi.org/10.1175/1520-0477(1992)073<1377:TCTCOR>2.0.CO;2, 1992. a
Werdell, P. J., Behrenfeld, M. J., Bontempi, P. S., Boss, E., Cairns, B., Davis, G. T., Franz, B. A., Gliese, U. B., Gorman, E. T., Hasekamp, O., Knobelspiesse, K. D., Mannino, A., Martins, J. V., McClain, C., Meister, G., and Remer, L. A.: The plankton, aerosol, cloud, ocean ecosystem mission status, science, advances, B. Am. Meteorol. Soc., 100, 1775–1794, https://doi.org/10.1175/BAMS-D-18-0056.1, 2019. a
Woods, S., Lawson, R. P., Jensen, E., Bui, T. P., Thornberry, T., Rollins, A., Pfister, L., and Avery, M.: Microphysical Properties of Tropical Tropopause Layer Cirrus, J. Geophys. Res.-Atmos., 123, 6053–6069, https://doi.org/10.1029/2017JD028068, 2018. a
Xu, W., Fossum, K. N., Ovadnevaite, J., Lin, C., Huang, R.-J., O'Dowd, C., and Ceburnis, D.: The impact of aerosol size-dependent hygroscopicity and mixing state on the cloud condensation nuclei potential over the north-east Atlantic, Atmos. Chem. Phys., 21, 8655–8675, https://doi.org/10.5194/acp-21-8655-2021, 2021. a
Yang, Z. L., Niu, G. Y., Mitchell, K. E., Chen, F., Ek, M. B., Barlage, M., Longuevergne, L., Manning, K., Niyogi, D., Tewari, M., and Xia, Y.: The community Noah land surface model with multiparameterization options (Noah-MP): 2. Evaluation over global river basins, J. Geophys. Res.-Atmos., 116, 12110, https://doi.org/10.1029/2010JD015140, 2011. a
Zeng, X., Zhao, M., and Dickinson, R. E.: Intercomparison of Bulk Aerodynamic Algorithms for the Computation of Sea Surface Fluxes Using TOGA COARE and TAO Data, J. Climate, 11, 2628–2644, https://doi.org/10.1175/1520-0442(1998)011<2628:IOBAAF>2.0.CO;2, 1998. a
Ziegler, C. L.: Retrieval of Thermal and Microphysical Variables in Observed Convective Storms. Part 1: Model Development and Preliminary Testing, J. Atmos. Sci., 42, 1487–1509, https://doi.org/10.1175/1520-0469(1985)042<1487:ROTAMV>2.0.CO;2, 1985. a
- Abstract
- Introduction
- Observations
- Model setup and experimental design
- Results
- Discussion
- Conclusions
- Appendix A: NU-WRF simulation setup
- Appendix B: Deriving large-scale vertical motion
- Appendix C: Resolution sensitivity test
- Appendix D: Composite in situ DSDs
- Code availability
- Data availability
- Author contributions
- Competing interests
- Disclaimer
- Special issue statement
- Acknowledgements
- Financial support
- Review statement
- References