the Creative Commons Attribution 4.0 License.
the Creative Commons Attribution 4.0 License.
 | 24 Sep 2025
Observed relationship between drop size distribution including a breakup signature and environmental properties near Kumagaya in eastern Japan
The drop size distribution (DSD) is an important property for characterising precipitation processes that sometimes lead to more intense rainfall in different climate regions. Previous studies have shown that a stationary distribution with a breakup signature can be obtained not only with ground-based disdrometers but also with remote sensing instruments such as vertically pointing radars and/or wind profilers. However, these observations do not explain how the underlying microphysical processes within convective clouds that generate more rain occur and how the environmental conditions affect these processes. This study aims to investigate the environmental conditions for the development of convective clouds having a breakup signature on a ground-based observation near Kumagaya in eastern Japan. In situ observations and operational C-band polarimetric weather radar data are used to extract the convective clouds by applying a cell-tracking algorithm, and upper-air sounding data are used to diagnose their environmental conditions. The larger diameter of the DSD is likely to be associated with higher instability, whilst the larger liquid water content is likely to be associated with the higher moisture contents in the lower layer under the weaker vertical shear condition. Convective clouds that generate more rain should have a similar three-dimensional structure within them when the DSD has a breakup signature at ground level under a humid environment. These characteristics can be diagnosed as the microphysical processes of converting from cloud drops to raindrops and/or coalescing cloud drops and raindrops.
- Article
(7764 KB) - Full-text XML
- BibTeX
- EndNote


Cloud and precipitation processes have long been responsible for driving the global water cycle on a cumulonimbus scale, but they also influence the weather and climate on Earth. These processes in cloud microphysics can be divided into two categories: warm rain, which forms beneath the melting layer, and cold rain, which possesses a phase change and contains solid particles above the melting layer (e.g., Glickman, 2000; McFarquhar, 2022). It has been noted that the physical processes of oceanic warm rain (continental cold rain) tend to be dominant at low (mid) latitudes (e.g., Dolan et al., 2018). In particular, drop size distributions (DSDs) with multiple peaks have been obtained numerically as an equilibrium distribution with a breakup signature (e.g., Testik and Barros, 2007; McFarquhar, 2010, for review), which is rarely observed on the ground (McFarquhar et al., 1996; D'Adderio et al., 2018; Unuma et al., 2025) but may be frequently observed during heavy rain events (Garcia-Garcia and Gonzalez, 2000; Unuma, 2024). The equilibrium distribution has been attributed to a balance between collisional coalescence and collisional breakup of raindrops (e.g., Low and List, 1982), making a DSD bimodal (McFarquhar, 2004; Straub et al., 2010), which is envisaged to obtain in the warm rain process. Instrumental constraints have been limited to ground-based in situ observations of such DSD, and thus remote sensing technologies have been used to estimate the characteristics of the DSD in the aloft.
The estimation of the vertical distribution of the DSDs during heavy rainfall has relied chiefly on changes in the Doppler spectra of vertically pointing radars and low-level wind profiler observations at different wavelengths. For example, Wakasugi et al. (1986) developed a method to estimate the vertical profiles of DSDs based on Doppler spectra from a VHF-band (46.5 MHz) Doppler radar; they found that the DSDs tended to be bimodal during heavy rainfall. Similarly, Gossard et al. (1990) showed that vertical changes in drop size produce a multiple-peaked DSD due to vertical changes in number concentration towards the ground level below the melting layer. Fabry et al. (1993) used X-band (9368.5 MHz) single polarisation radar and calculated Doppler spectra to investigate the vertical characteristics of the DSD. Kobayashi and Adachi (2001) used UHF-band (404 MHz) wind profilers to investigate the vertical variation of the DSD and found that the breakup signature could be observed through vertical changes in the DSD below the melting layer. Another interpretation provided by Zawadzki et al. (2001) is that one of the bimodal peaks of a DSD was attributed to ice crystals that formed near the melting layer. A more comprehensive analysis was carried out by Radhakrishna and Rao (2009), who examined vertical observations of multiple-peaked DSDs using L-band (1357.5 MHz) wind profiler. They found that multiple-peaked DSDs occurred at any height regardless of the type of convection and that there was no significant difference in the frequency of occurrence due to warm and cold rain processes, suggesting that variety of microphysical processes may influence vertical variations in DSDs. It is, therefore, essential to understand the vertical profile of DSDs to discuss cloud microphysical processes in more detail.
The development of polarimetric weather radar and its operational availability has led to a gradual improvement in the method for estimating DSD parameters (e.g., Seliga and Bringi, 1976; Gorgucci et al., 2000; Testud et al., 2001; Zhang et al., 2001; Thurai et al., 2008), which enhanced to see how the DSDs behave within heavy rain producing convective systems. Ding et al. (2023) showed that bimodal DSDs were observed during the strongest rainfall observations in ZhengZhou, China and that the warm rain process mainly dominated in this event. Jung and Jou (2023) showed that the spatial characteristics of collisional breakup appeared near the ground during the heaviest rainfall in northern Taiwan. Unuma et al. (2023) showed that temporal changes in ground-level DSDs could be captured as changes in vertical DSDs near Kumagaya in eastern Japan. These studies imply that estimating DSD parameters using polarimetric weather radar is expected to provide an understanding of spatial and temporal DSD structures, including dominant cloud microphysical processes. However, the estimation of the DSD requires the use of either the aforementioned Doppler spectra (e.g., Wakasugi et al., 1986; Radhakrishna and Rao, 2009) or multiple functions to fit the DSD data to obtain appropriate shape properties (e.g., Okazaki et al., 2023).
A smaller tail slope is another known characteristic of DSDs that has approached a stationary distribution (Willis and Tattelman, 1989; Hu and Srivastava, 1995). The fact that this has not been given much attention is because it is thought to be a sampling error for larger drop sizes (e.g., > 3 mm in diameter) on a Joss Waldvogel impact-type disdrometer (Sheppard, 1990). However, this problem has been eliminated as the instrumental performance of the disdrometer has improved, and similar trends have been demonstrated in a few recent decades. For example, Friedrich et al. (2013) investigated several convective events observed during the second Verification of the Origins of Rotation in Tornadoes Experiment (VORTEX2) in the United States Great Plain region. They found that a first-generation OTT Particle Size Velocity (Parsivel) showed Λ values close to 2 mm−1 when the stronger storm passed over the ground-based observation site. More recently, Unuma (2024) showed that an equilibrium shape of the DSD with a signal of collisional breakup of raindrops was captured during the onset of precipitating systems that resulted in heavy rainfall and that the value of Λ was close to 2 mm−1 using OTT-Parsivel2 in the western part of Japan. Furthermore, Unuma et al. (2025), using OTT-Parsivel data from an analysis of approximately 10 years of DSD data installed at Kumagaya in the eastern part of Japan, showed that statistically, the stronger rainfall intensity, the smaller value Λ (i.e., within the range from 0 to 2 mm−1) and the more likely it is to observe multiple-peaked DSDs. Therefore, the value of Λ is expected to capture one of the characteristics of the DSD that have approached a stationary distribution which may frequently observed in heavy rain events (Garcia-Garcia and Gonzalez, 2000; Unuma, 2024). In addition, recent studies show that such characteristics seem important for the convective systems producing heavy rain (Ding et al., 2023; Jung and Jou, 2023; Unuma et al., 2023). However, a few studies statistically investigate the microphysical characteristics within convective clouds or their environments for development.
Most earlier studies have investigated the characteristics of precipitating systems or convective clouds that produce heavy rain using the distribution of the reflectivity factor obtained from ground-based weather radar data or the characteristics of the rainfall intensity obtained from rain gauge data. For example, Schumacher and Johnson (2008) investigated the characteristics of mesoscale convective systems that produced heavy rainfall in the United States and found that the vertical profile of horizontal winds differed depending on the morphology of the precipitating system. They also found that the mesoscale convective systems were in warm advection fields at their onset. Meng et al. (2013) also investigated the characteristics of mesoscale convective systems in China and showed that the environment for the development of the systems was moist and had weaker vertical shear conditions. In Japan, Unuma and Takemi (2016) and Kato (2020) demonstrated that heavy rainfall commonly occurs under humid environmental conditions. The moist environment is considered an essential condition for precipitating systems that produce heavy rain over Japan. In particular, Unuma and Takemi (2016) focused on slower-moving precipitating systems in Japan and found that the stronger mean precipitation intensity with the smaller convective area was observed under the weaker environmental vertical shear. Furthermore, the system-scale mean precipitation intensity is proportional to the environmental temperature lapse rate, whilst the maximum precipitation intensity is inversely proportional under the higher convective available potential energy (CAPE) environment (Takemi, 2010). These characteristics should be investigated separately between individual convection and its organised system.
On convective cloud perspectives, Feng et al. (2022) examined the characteristics of individual convective clouds using data from the Cloud, Aerosol, and Complex Terrain Interactions (CACTI) observation campaign over central Argentina. They found that the maximum reflectivity factor was larger when the area of individual convective clouds was larger. Furthermore, Chudler et al. (2022) showed that the upstream and downstream sides of convective clouds observed during the Propagation of Intra-Seasonal Tropical Oscillation (PISTON) field campaign over the western North Pacific have distinct characteristics based on a polarimetric radar analysis. The characteristics of the precipitating system or the individual convective clouds within it are not adequately described by a precipitation intensity value alone, as suggested by Unuma and Takemi (2021). In addition, the deeper convection is not proportional to the stronger precipitation (Hamada et al., 2015), suggesting that spatial characterisation of the internal structure of the precipitating system, particularly individual convective behaviours, is an essential element in understanding the precipitating systems that produce heavy rainfall.
Although earlier studies have focused on the relationships between rainfall intensities and environmental parameters, some impacts of environmental conditions on DSD parameters have recently been investigated. Saha et al. (2022) found that for convective clouds that occurred during the pre-monsoon season in India, the larger the mass-weighted volume diameter (Dm), the higher CAPE environment. Can these characteristics be observed in Japan? One possibility is that Takemi (2014) compared a numerical experiment in which a mid-latitude type of vertical profile was prepared with a tropical type in terms of a similar CAPE value, which showed the convective characteristics under humid conditions identical to those in the tropics. In Japan, heavy rainfall may occur under a humid environment from low to mid-level troposphere during the warm season (e.g., from May to October) (Unuma and Takemi, 2016; Hamada and Takayabu, 2018). The environmental condition in Japan could be similar to that in the tropics, especially with cloud microphysical interpretations. Therefore, by investigating the characteristics of DSD within convective clouds and their relationship with the surrounding atmosphere, it is possible to bridge the gap between the cloud microphysical properties within convective clouds that cause heavy rain and the mesoscale environments.
Whilst heavy rainfalls occasionally occur in the eastern Japan (e.g., Kawabata et al., 2011; Nomura and Takemi, 2011; Seino et al., 2018), previous studies have not examined convective systems in this region from the perspective of this study, particularly concerning raindrop breakup signatures near the ground. Considering that, the eastern part of Japan was selected as the target area for this study.
This study aims to investigate the possible microphysical processes of the convective clouds that produce heavy rain having a raindrop breakup signature on the ground in relation to environmental conditions in the eastern Japan. Section 2 describes data and methodology used in this study. The main results are described in Sect. 3, split into different subsections: Sect. 3.1 gives an overview of the tracked convective clouds obtained in this study, Sect. 3.2 shows the vertical structure of the systems, as well as the horizontal structure of the systems in Sect. 3.3, and the environmental conditions for the development of the convective systems in Sect. 3.4, respectively. In Sect. 4, possible cloud microphysical processes and environmental conditions were discussed to identify a signal of heavy rain producing convective systems. Finally, the main results are summarised in Sect. 5.
The data used were a first-generation OTT-Parsivel disdrometer (Löffler-Mang and Joss, 2000), an operational C-band polarimetric weather radar (e.g., Unuma et al., 2023), and Meisei iMS-100 upper-air sounding (e.g., Hoshino et al., 2022), whose locations are displayed in Fig. 1. The following subsections describe in more detail the datasets and the analysis procedures used to identify the target convective clouds and investigate the environmental properties of their development in this study.
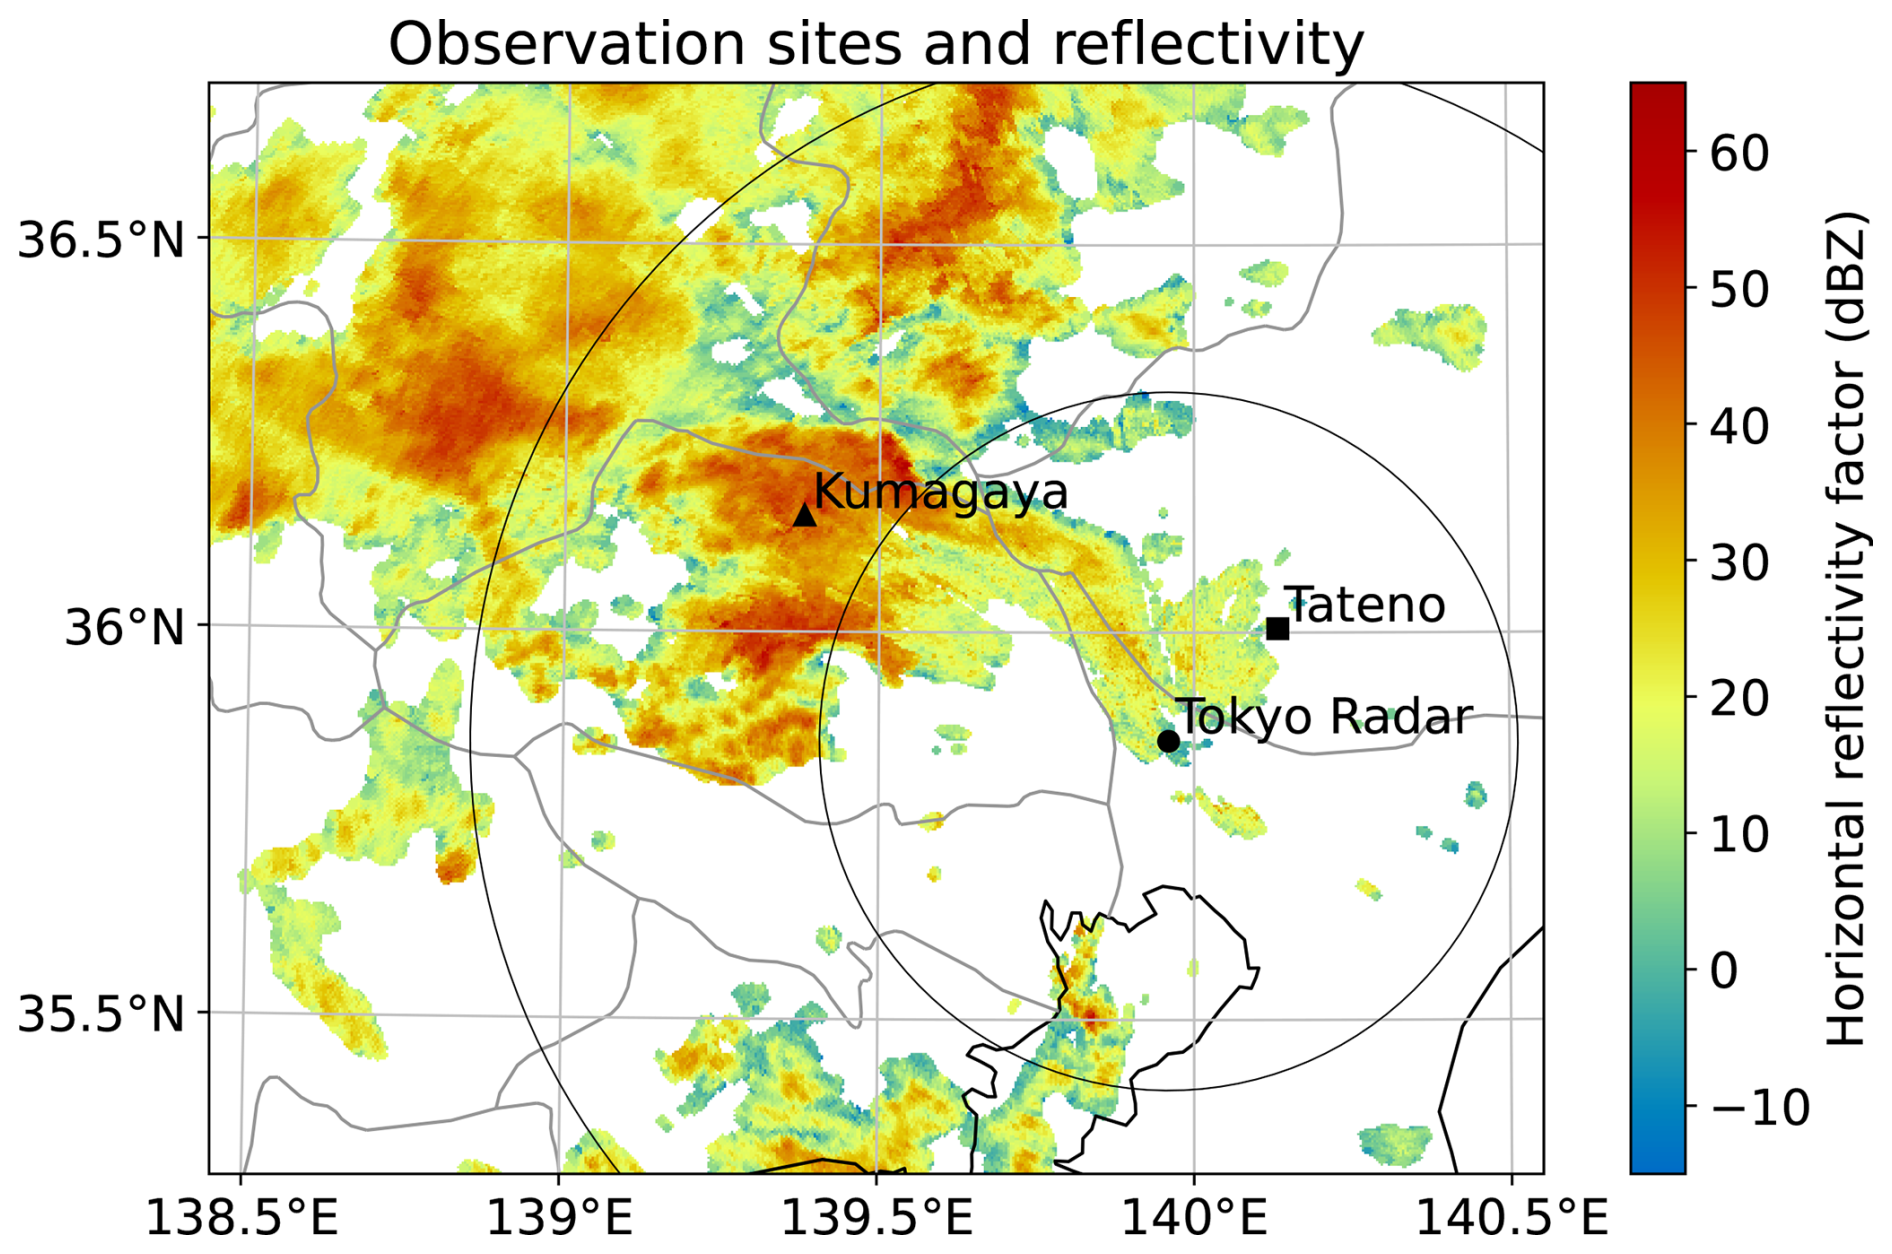
Figure 1Horizontal reflectivity factor (dBZ) from the 0.3° plan position indicator (PPI) scan at 09:22 UTC 12 July 2022 conducted by the C-band polarimetric weather radar at Tokyo site (black-filled circle). Range rings (grey circles) are displayed with 50 km intervals. The locations of the disdrometer site at Kumagaya (black-filled triangle) and the upper-air sounding site at Tateno (black-filled square) are plotted.
2.1 Ground-based optical disdrometer observation
The disdrometer installed at the Kumagaya Local Meteorological Office, Japan Meteorological Agency (JMA) where located in eastern Japan was used in this study. The DSD data were processed as in Unuma et al. (2025). Here, the procedures were described briefly as follows. A first-generation laser-optical (650 nm wavelength) OTT-Parsivel measures the drop size and fall velocity of precipitation particles. The original data n(D) are measured within a laser beam sheet with 32 drop-size classes (Di) and 32 fall-velocity classes (Vj(Di)). The drop diameters range from 0.2 to 25 mm in i direction and velocities range from 0.2 to 20 m s−1 in j direction, respectively. The laser beam sheet of OTT-Parsivel is 180 mm long, 30 mm wide, and 1 mm tick. The effective sampling area S (m−2) is expressed as 0.180 × (0.030 − L/2), where L is a size parameter depending on the drop size. The two smallest drop size classes were not used in this study due to their low signal-to-noise ratios (Tokay et al., 2013). Observed drop size classes were converted into the equivalent volume diameter (De; mm) according to Adachi et al. (2013) (hereafter, De is represented simply as D). The time interval of the disdrometer data (Δt) was 1 min.
Four DSD parameters, i.e., the mass-weighted volume diameter (Dm; mm), the generalised intercept parameter (Nw; mm−1 m−3), the liquid water content (LWC; g m−3), and the slope parameter (Λ; mm−1), were calculated assuming the modified gamma or the exponential distributions using a momentum technique (Hardin and Guy, 2017) as following procedures. The modified gamma function N(D)mod is expressed as follows;
where Nw and f(μ) are defined as
and
Here, μ is a shape parameter, ρw is the density of water (g m−3), and Γ is the Gamma function. LWC and Dm are obtained from the following equations;
and
where ΔDi is the drop-size spread (mm) in equivalent volume diameters. Median volume diameter D0 (mm) is defined by
Rainfall intensity R (mm h−1) is calculated from the observed DSD data with the following equation:
When the R calculation, the data within ±50 % of the raindrop-fall velocity formula of Atlas et al. (1973) are used. The exponential function N(D)exp is defined as follows;
where the intercept parameter (N0; mm−1 m−3) and Λ are obtained by the moment relation method of Zhang et al. (2008).
2.2 C-band polarimetric weather radar observation
The C-band (5357.5 MHz) polarimetric weather radar at the Tokyo site operated by JMA was used. The volume scan data, including 13 elevation angles of plan position indicator (PPI) scans from 0.0 to 25.0 ° par 5 min, were used. Rainfall attenuation correction was performed using the Z-PHI method (Testud et al., 2000; Gu et al., 2011) for horizontal reflectivity factor (ZH; dBZ) and differential reflectivity (ZDR; dB). This study used the constant altitude plan position indicator (CAPPI) data, which is converted from the original PPI data, using Helmus and Collis (2016) method with a resolution of 500 m horizontally and vertically. Figure 2 shows a scan strategy of Tokyo Radar for the direction to the disdrometer site, which obtained by using Heistermann et al. (2013). The highest angle over the disdrometer site (∼ 60 km range from the Tokyo radar) is about 14 km, so that the maximum height of convective clouds to be identified in the following subsection is less than 14 km, which is a limitation to detect convective clouds in this study.
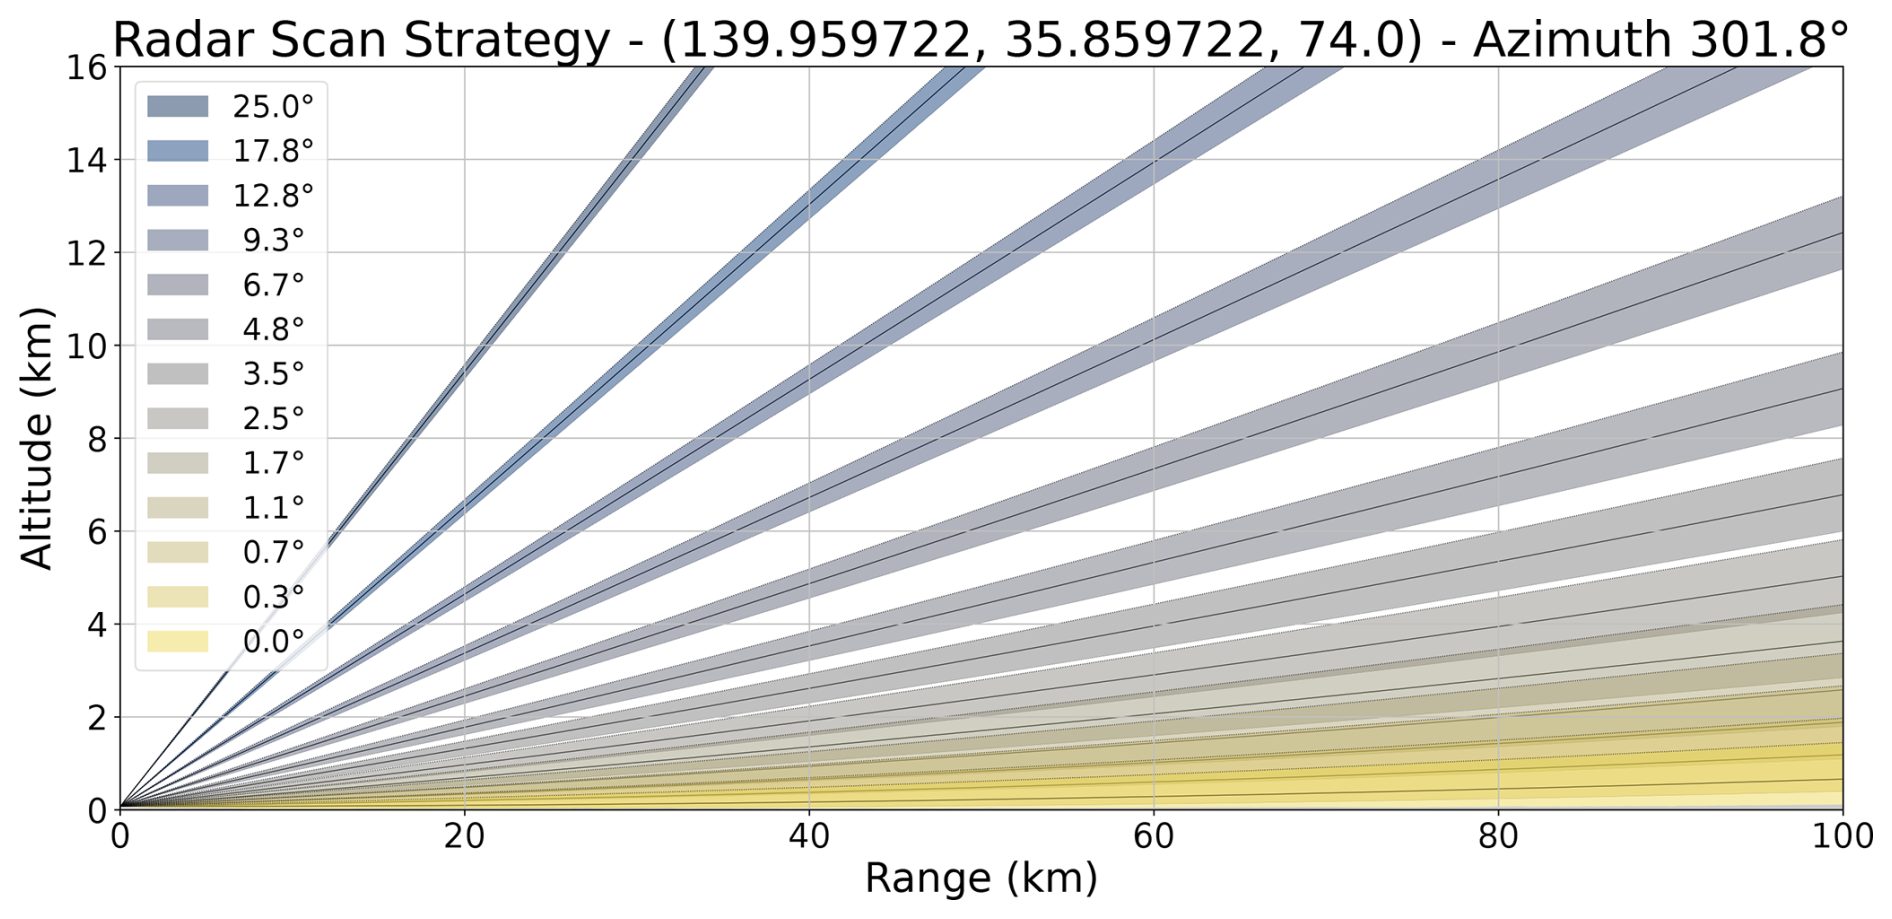
Figure 2Radar scan strategy at Tokyo Radar with the azimuthal angle of 301.8° which directs to the disdrometer site at Kumagaya as shown in Fig. 1.
The DSD parameters were estimated using the methods of Gorgucci et al. (2000) and Gorgucci and Baldini (2009) for the median volume diameter (D0; mm), Nw, LWC and Λ, respectively as in Unuma et al. (2023). On this method, β (mm−1) need to be calculated as follows;
where coefficients of a, b, c, and κ are 2.55, 0.355, 0.439, and 0.8 based on Gorgucci and Baldini (2009)'s Table 1. The units of KDP, ZH, ZDR are ° km−1, dBZ, dB, respectively. Then, D0, Nw, and LWC were calculated as following equations;
and
where coefficients are based on Gorgucci et al. (2000, 2002). Λ (mm−1) is calculated with . These DSD parameters were calculated only if the conditions of ZH > 35 dBZ, ZDR > 0.2 dB, and KDP > 0.3 ° km−1 are satisfied simultaneously. Figure 3 shows the retrieved DSD parameters against the ground-based disdrometer observation. The elevation angle of the radar data compared with the ground-based disdrometer data is 1.1°, whose height is approximately 1.5 km above the ground. Overall, the retrieved DSD parameters are good agreement with the observation (e.g., higher correlation coefficient with p-value < 0.05) except LWC probably due to relatively higher variance. Observational errors caused by such as radar calibration, range/azimuth resolution limitations, wet antenna radome, low signal-to-noise ratio, and nonuniform beam filling may affect the DSD parameter retrievals, which are potential uncertainties of the radar-based retrievals used in this study. The uncertainty in retrieving the DSD parameters may also influence the relationships between environmental conditions and the DSD parameters, potentially resulting in lower correlation coefficients between them.
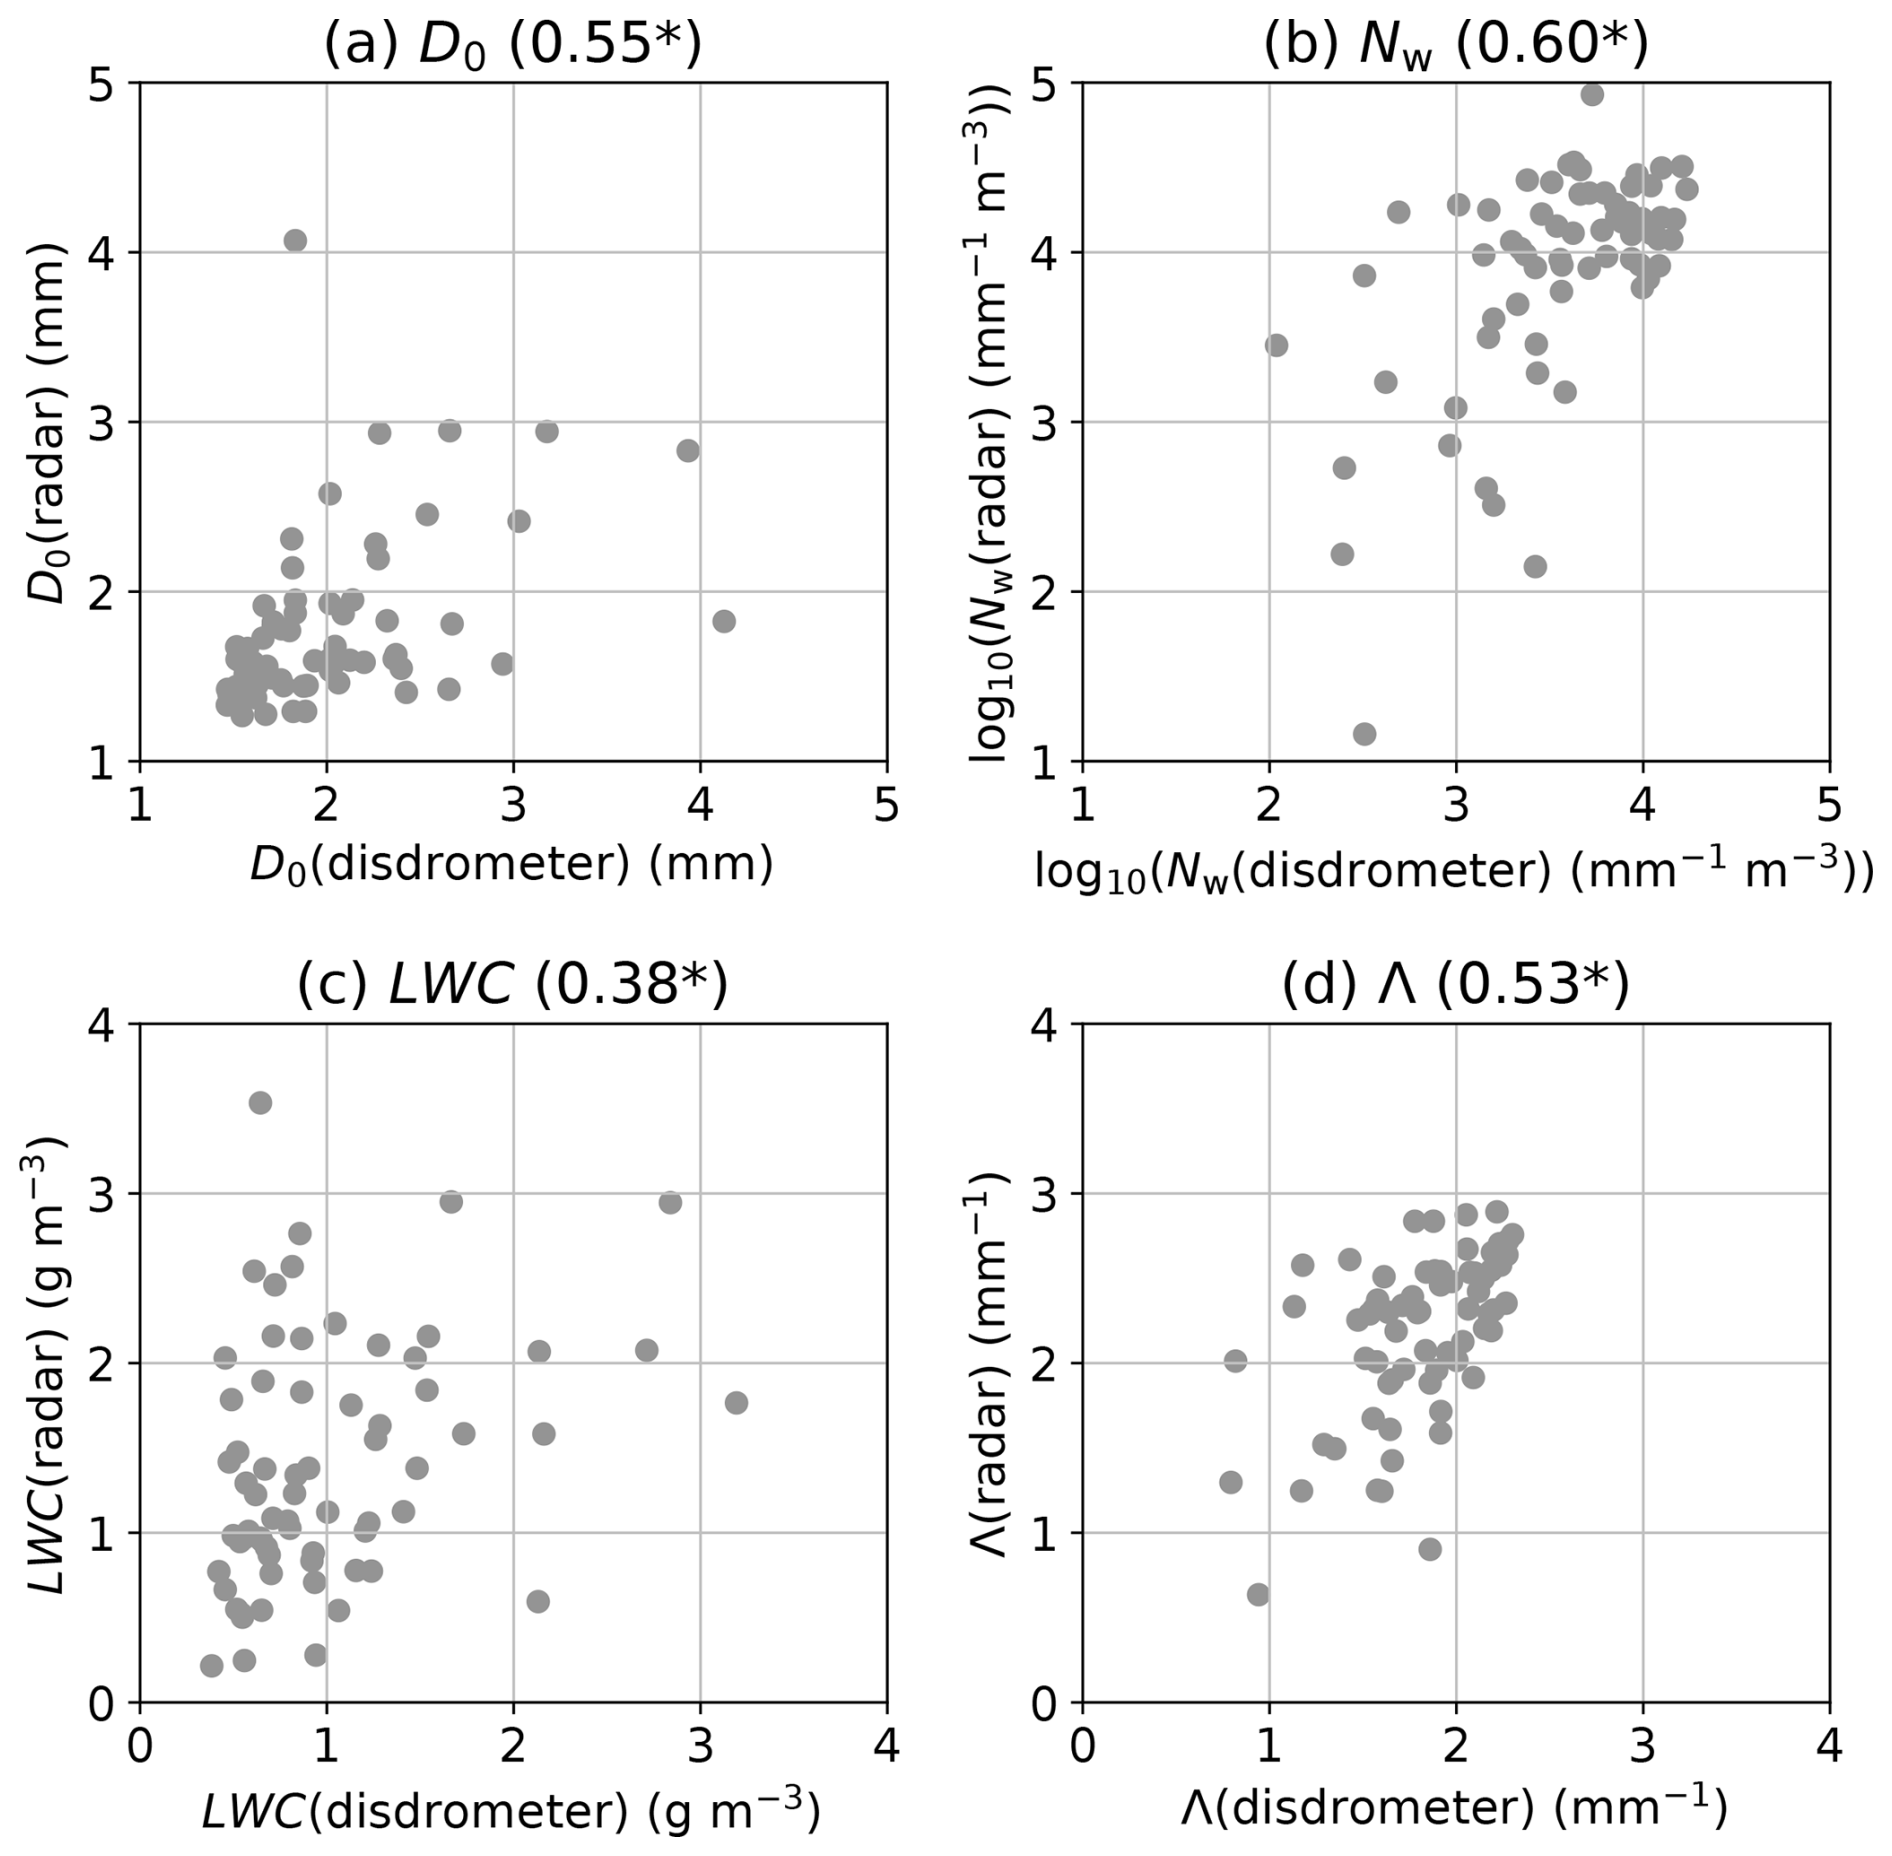
Figure 3The scatter diagram of the drop size distribution parameters of median volume diameter (D0; mm), generalised intercept parameter (Nw; mm−1 m−3), liquid water content (LWC; g m−3), and slope parameter (Λ; mm−1) retrieved from Tokyo radar data against the disdrometer data at Kumagaya. Correlation coefficient values are displayed each panel and an asterisk * is added if the p-value for the correlation coefficient is less than 0.05.
2.3 Identification and tracking of convective clouds
Individual convective clouds were detected and tracked using tobac algorithm version 1.5.3 (Sokolowsky et al., 2024). In recent years, this algorithm has been able to use not only remote sensing data, including weather radar data, but also the numerical model data as input data (e.g., Raut et al., 2021; Oue et al., 2022; Gupta et al., 2024; Jones et al., 2024). In particular, since major version 1.5, objects can be tracked in three dimensions (especially including the vertical direction), an implementation that provides a more realistic view of convective behaviour. Thus, this functionality was used and applied to the ground-based polarimetric radar data in this study. tobac defines the peak positions in the region above/below a threshold value at each time step as a “feature”. The area covered over the feature is determined as a “segmentation” using a water shedding algorithm (Carpenter et al., 2006; van der Walt et al., 2014), whose boundaries were determined horizontally and vertically. A set of features is tracked over time using the method of Crocker and Grier (1996) and defined as a “cell” or its group as a “track”, which was also determined with three dimensions. In this study, cells were used for the analysis to focus on the individual characteristics of convective clouds that have caused heavy rainfall at ground level. The lifetime of the cell was defined as the time from the first detection time to the last time step, and the cells with at least three time steps were analysed to exclude suspicious data (e.g., Unuma and Takemi, 2016). Area and volume of a cell were calculated within the boundaries determined by the segmentation process (i.e., Λ < 3.0 mm−1) as described the following sentences.
In this study, Λ is used as a variable for the feature detection; this is because a smaller value of Λ is more likely to represent an equilibrium shape of DSD (Willis and Tattelman, 1989; Hu and Srivastava, 1995). The threshold value Λ varies dynamically in the range of 1.5 to 3.0 mm−1, based on the statistical analysis of Unuma et al. (2025). The analysis period is from 09:00 UTC 1 January 2021 to 23:59 UTC 31 December 2023. In these periods, the data, including the ground-based disdrometer, C-band polarimetric radar, and upper-air sounding, were available to use simultaneously with sufficient data quality. An example of the feature, segmentation, and cell is displayed in Fig. 4. The crosses and numbers show the point of feature detection at the specific time and the IDs. Shades and contours show Λ and areas of the segmentation. The blue solid line indicates that the trajectory of a cell is especially related to cell #292 for Λ and #307 for ZH. Regarding feature detection, only #142 is detected by ZH (Fig. 4b), but in the case of Λ, multiple convective clouds were identified, such as #17, #21, #31, #136, #142, #152, #153, and #321 (Fig. 4a). Additionally, regarding the tracking cells, even in the same convective cloud, splits are likely to occur on ZH tracking (Fig. 4b's blue line), but in the case of Λ, it seems to be tracked as the same convective cloud in time series (Fig. 4a's blue line). Also, the initially detected time corresponds to early stage of a convective cloud in both cases. As mentioned in Sect. 1, a smaller value of Λ indicates an increase in the frequency of larger raindrops, i.e. a broadening of the tail slope, which may be important for increasing in R as an integral value of DSD (e.g., Unuma et al., 2025). Lower values of Λ obtained from the DSD parameters indicate a medium size of raindrops (approximately 1–2 mm in diameter) alongside a higher concentration of smaller raindrops (around 0.5 mm in diameter) in the size distribution. This scenario may be observed in areas with weaker ZH value but stronger (R). Considering that, the Λ tracking is potential to detect stronger R area within convective cloud compared to the ZH tracking.
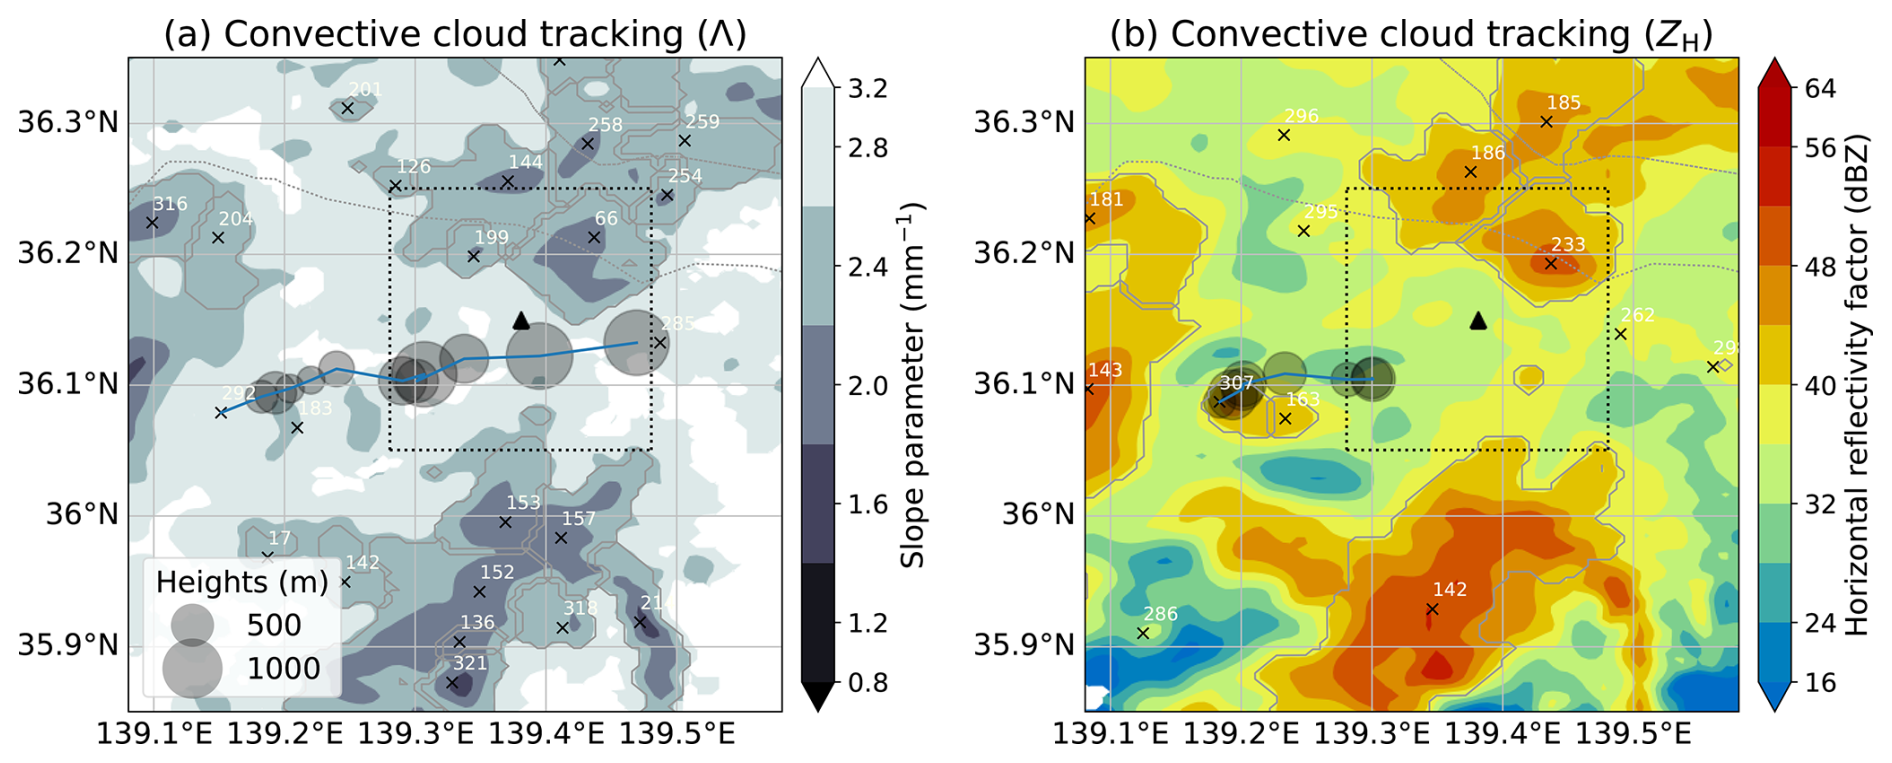
Figure 4An example of detecting and tracking convective clouds using tobac algorithm. (a) Colour shades indicate that the slope parameter (Λ; mm−1) of the DSD parameters retrieved from the polarimetric radar variables, the crosses show the location when the feature detected in the algorithm, and the blue line displays that a trajectory of an identified cell #292. The heights of feature detection are represented with black circles. The triangle shows the location of the disdrometer site used in this study. The target area of approximately 10 km square centred on the disdrometer site is displayed with dotted square. (b) the same as (a), but identified with horizontal reflectivity factor (ZH; dBZ) and a corresponding cell #307.
2.4 Target events
DSDs approaching an equilibrium shape, accompanied by collisional breakups, were detected by the ground-based disdrometers within the analysis period (D'Adderio et al., 2015). In this algorithm, over 5 bins from smaller (i.e., 1.0 mm) to larger diameters, the linear best fit of the considered 2 min averaged DSD is calculated. Starting points are considered from 1.0 to 1.6 mm with 0.2 mm-diameter spreads, and then four linear relationships are calculated. The maximum slope among the four relationships is defined as the highest slope (HS; mm−2 m−3). In a case where HS > 0 is identified as a DSD approaching an equilibrium shape with a raindrop breakup signature, its date and time are identified as in D'Adderio et al. (2015).
Convective clouds were detected and tracked by tobac using CAPPI data obtained from the polarimetric radar. Here, “feature” refers to a detected object within the analysis domain at each time step, and “cell” refers to the set of features in the time direction. “Target event” refers to those “cells” that are the subject of this study. The CAPPI data is used to track convective clouds within ±12 time steps centred at the time when HS > 0 was detected on the ground-based disdrometer. Of the convective clouds detected and tracked, those that passed within an area of approximately 10 km square centred on the disdrometer location were selected as shown in the dotted square of Fig. 4. This restriction was to determine the convective clouds of observed DSD events with HS > 0 condition at the ground-based disdrometer. The 354 extracted target events were analysed in this study.
Here, the number of extracted cells was 52 757 when using the reflectivity factor value to detect convective clouds instead of the slope parameter (23 167). Also, the number of target events was 708, which is double compared to the number of target events extracted using the slope parameter. The target events were not necessarily extracted for the reflectivity factor detection in the tobac algorithm, i.e., splitting cell as shown in Fig. 4, and believing that the more specific target events with the stationary distribution could be extracted using the slope parameter, at least in this study.
To see what kinds of precipitation type on the target events is observed in this study, the precipitation type is diagnosed using the weather code obtained from the Parsivel observation. Ninety seven percent of the precipitation type was classified as RA+ (i.e., Strong rain), with the remaining three percent was classified as RASN+ (i.e., Strong Rain, drizzle with snow). The characteristics of the DSD observed at the ground-based disdrometer depending on R are also shown in Fig. 5. As R increases, the overall number concentration increases, and the distribution approaches an exponential distribution (e.g., Eq. 8). On the other hand, when R is weaker than 30 mm h−1, there is a tendency for the frequency of the diameter in the 1–3 mm range to increase, which is one of the unique characteristics observed in the present study.
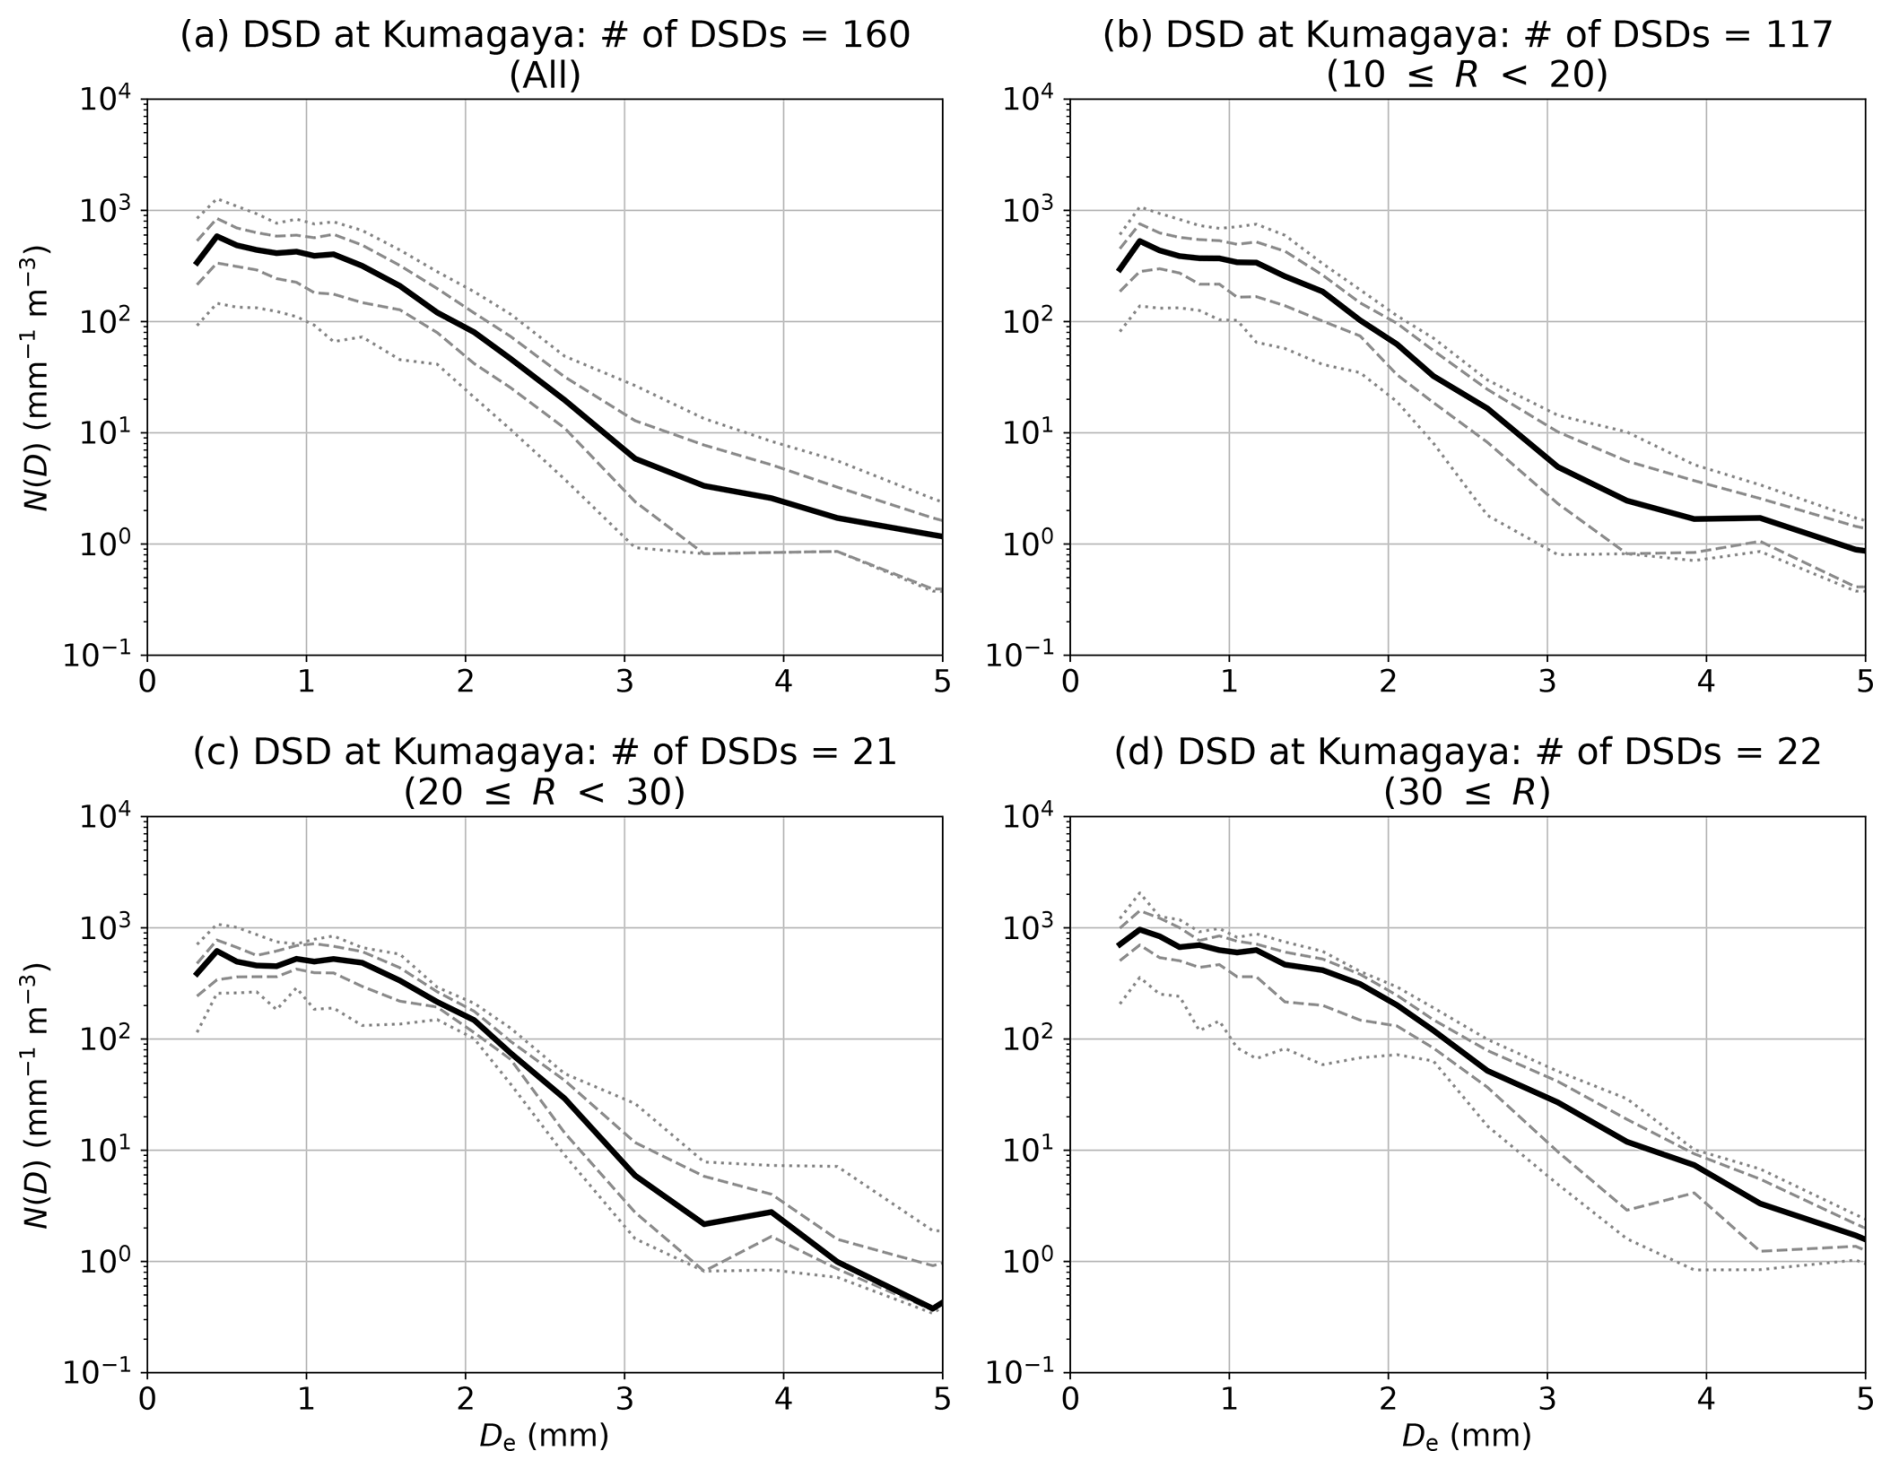
Figure 5Drop size distribution N(D) depending on rainfall intensities (R; mm h−1): (a) all data, (b) 10 20, (c) 20 30, and (d) 30 ≥R, respectively. De is the equivalent volume diameter. The black solid line shows median values, the grey dashed lines display the 25th and 75th percentile values, and the grey dotted lines donate the 10th and 90th percentile values, respectively.
The monthly and hourly occurrence of the extracted convective clouds at the time when HS > 0 was observed at the disdrometer site were further investigated (Fig. 6). The convective clouds observed dominantly with ten or more observations between June to September, whilst the frequency is lower in January–May and October–December than in the other months. Regarding the observation time, the most frequent time was around 09:00 UTC, with approximately ten cases in the preceding and following periods. The frequencies of 00:00–03:00 and 20:00–22:00 UTC periods were approximately five cases, respectively, which were subsequent peaks.
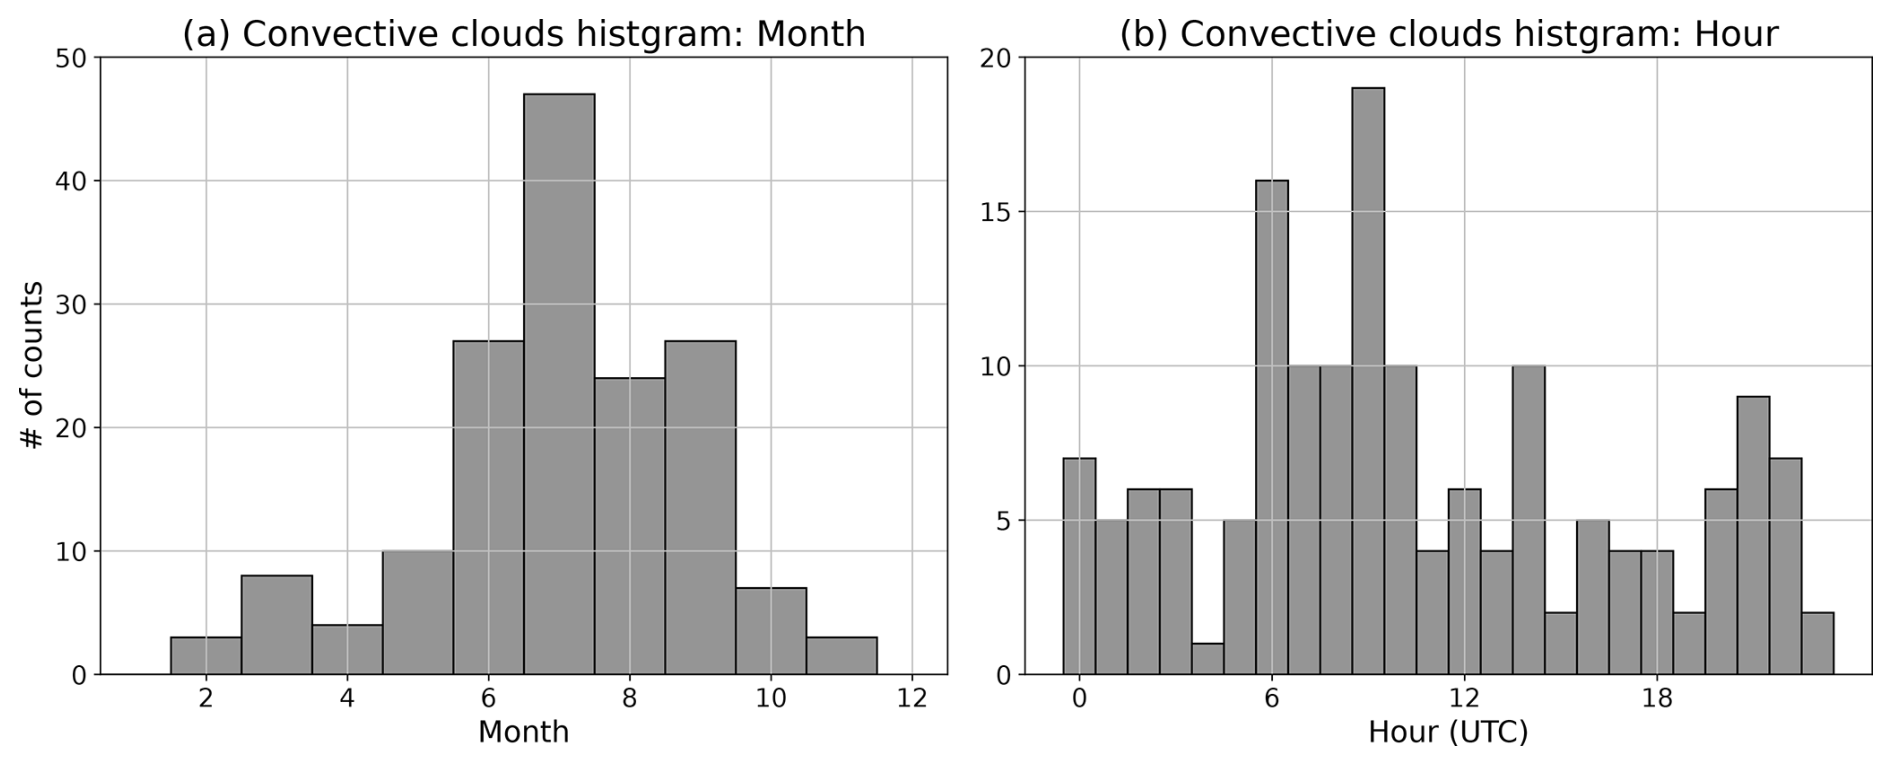
Figure 6Frequency distributions of the extracted convective clouds are classified into (a) month and (b) hour. The date and time are obtained from the disdrometer data with the condition of HS > 0.
2.5 Environmental parameters for the development of convective clouds
To investigate the environmental conditions before the development of convective clouds, the upper-air sounding data at Tateno, located in the eastern part of Japan and the closest site to both the ground-based disdrometer and the polarimetric radar, were used. The observation frequency is twice daily, at 00:00 and 12:00 UTC, respectively. The representative environmental field is the time before the first detection of convective clouds by the tobac algorithm according to the analysis of Unuma and Takemi (2016). As a result, the number of samples representing the environmental conditions of the extracted convective clouds is reduced depending on the number of upper-air sounding data, which is one of the limitations of using observational data. It is crucial to investigate the environmental conditions in nature using observational data as much as possible, and thus, this study conducted analyses and discussions to the best of our ability, considering the constraints imposed by the available observations. The environmental parameters used in this study were as follows: Convective available potential energy (CAPE; J kg−1, Bryan, 2008), precipitable water (PW; mm, Salby, 1996), K index (KI; K, George, 1960), temperature lapse rate (TLR; K km−1, Takemi, 2007a, b), vertical shear of the environmental wind averaged at the heights of 0–3 km (MS03; × 10−4 s−1, Rasmussen and Blanchard, 1998), and environmental helicity at the heights of 0–3 km (EH03; m2 s−2, Davies-Jones, 1984), respectively. In the calculation of CAPE, the air parcel of the mixed layer, which is averaged from the ground to a height of 500 m, was adiabatically lifted. If no level of free convection was found, the CAPE value is set to an undefined value and is not used in the analysis. Since the KI is a parameter that reflects the temperature lapse rate and the amount of water vapour at certain heights, the amount of precipitation (i.e., PW) and the temperature lapse rate at 850 and 500 hPa (i.e., TLR) were examined to confirm the effects of both. Because the vertical shear of the environmental winds has a significant effect on the vertical structure of the DSD (e.g. Kumjian et al., 2014), the vertical shear of both wind speed and direction were examined.
3.1 Statistics of extracted convective cloud's properties
Overall characteristics of the extracted convective clouds are described in this subsection. Figure 7 shows the frequency distribution of the lifetime of the extracted convective clouds in this study. The frequencies decrease rapidly with increasing its lifetime. The mean and median value of the lifetime were 30.7 and 25.0 min, respectively. The frequency distribution of the volume (blue) and the area at 2 km height (orange) of the extracted convective clouds is shown in Fig. 8. The convective clouds with larger volumes (> 1000 km3) represent 1.6 % of the total; most of the convective clouds have smaller volumes (< 1000 km3). Similarly, the smaller (< 100 km2) convective area at 2 km height is 88.7 % of the total and the larger (> 100 km2) convective area is less frequent. Figure 9a shows that the geographical locations of the extracted convective clouds. The convective clouds predominantly originated in the western or southwestern part of the disdrometer site. Subsequently, they dissipated in the eastern or northeastern part of the site, suggesting that the extracted convective clouds predominantly exhibited eastward or northeastward motion as they traversed the disdrometer site. Most of the convective clouds initiated close to the site (< 10 km). Conversely, several instances of convective clouds were initiated at a distance from the site (> 20 km) and had a longer lifetime than the others. In these cases, even if a DSD with the signal of HS > 0 on the ground is present, it is possible to ascertain the stage of the convective cloud when it passes over the disdrometer site. Thus, the time of maximum volume of Λ in each convective cloud was focused on (Fig. 9b) and showed that the frequencies were higher near the disdrometer site and at locations far (∼ 10 km) from the disdrometer site. This means that the convective clouds are not always mature when they pass over the disdrometer site. In other words, the convective clouds were detected with a lower slope parameter value in the DSD parameters as described in Sect. 2.3, DSDs are expected to have a breakup signature within the convective clouds before passing over the ground-based disdrometer site. Therefore, vertical structures within the convective clouds were investigated in the next subsection.
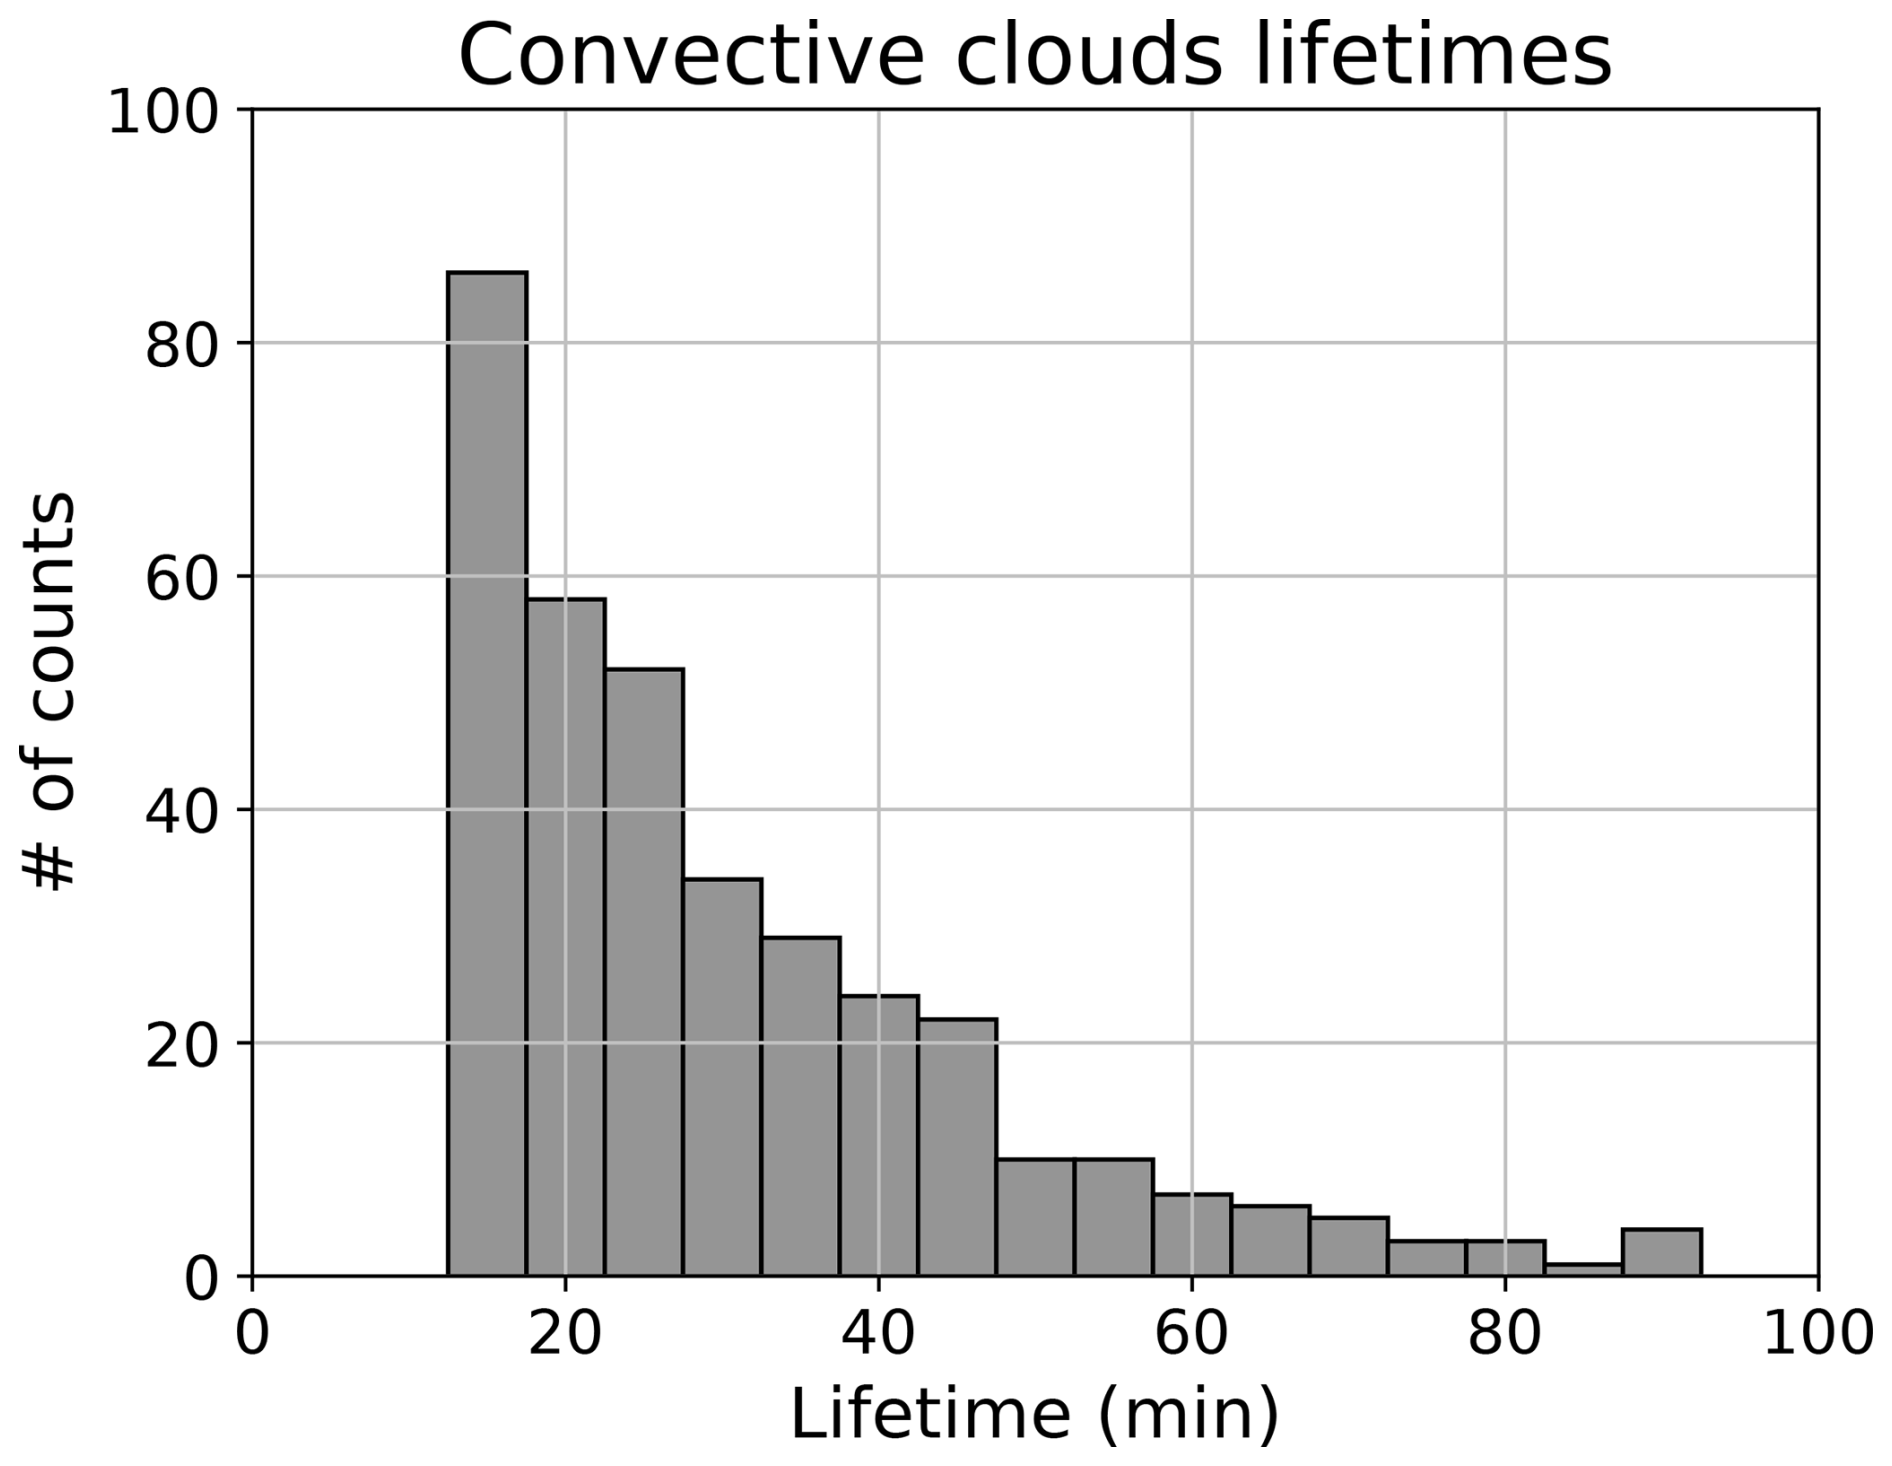
Figure 7Number of the extracted convective clouds versus their lifetime, counted at 5 min interval.
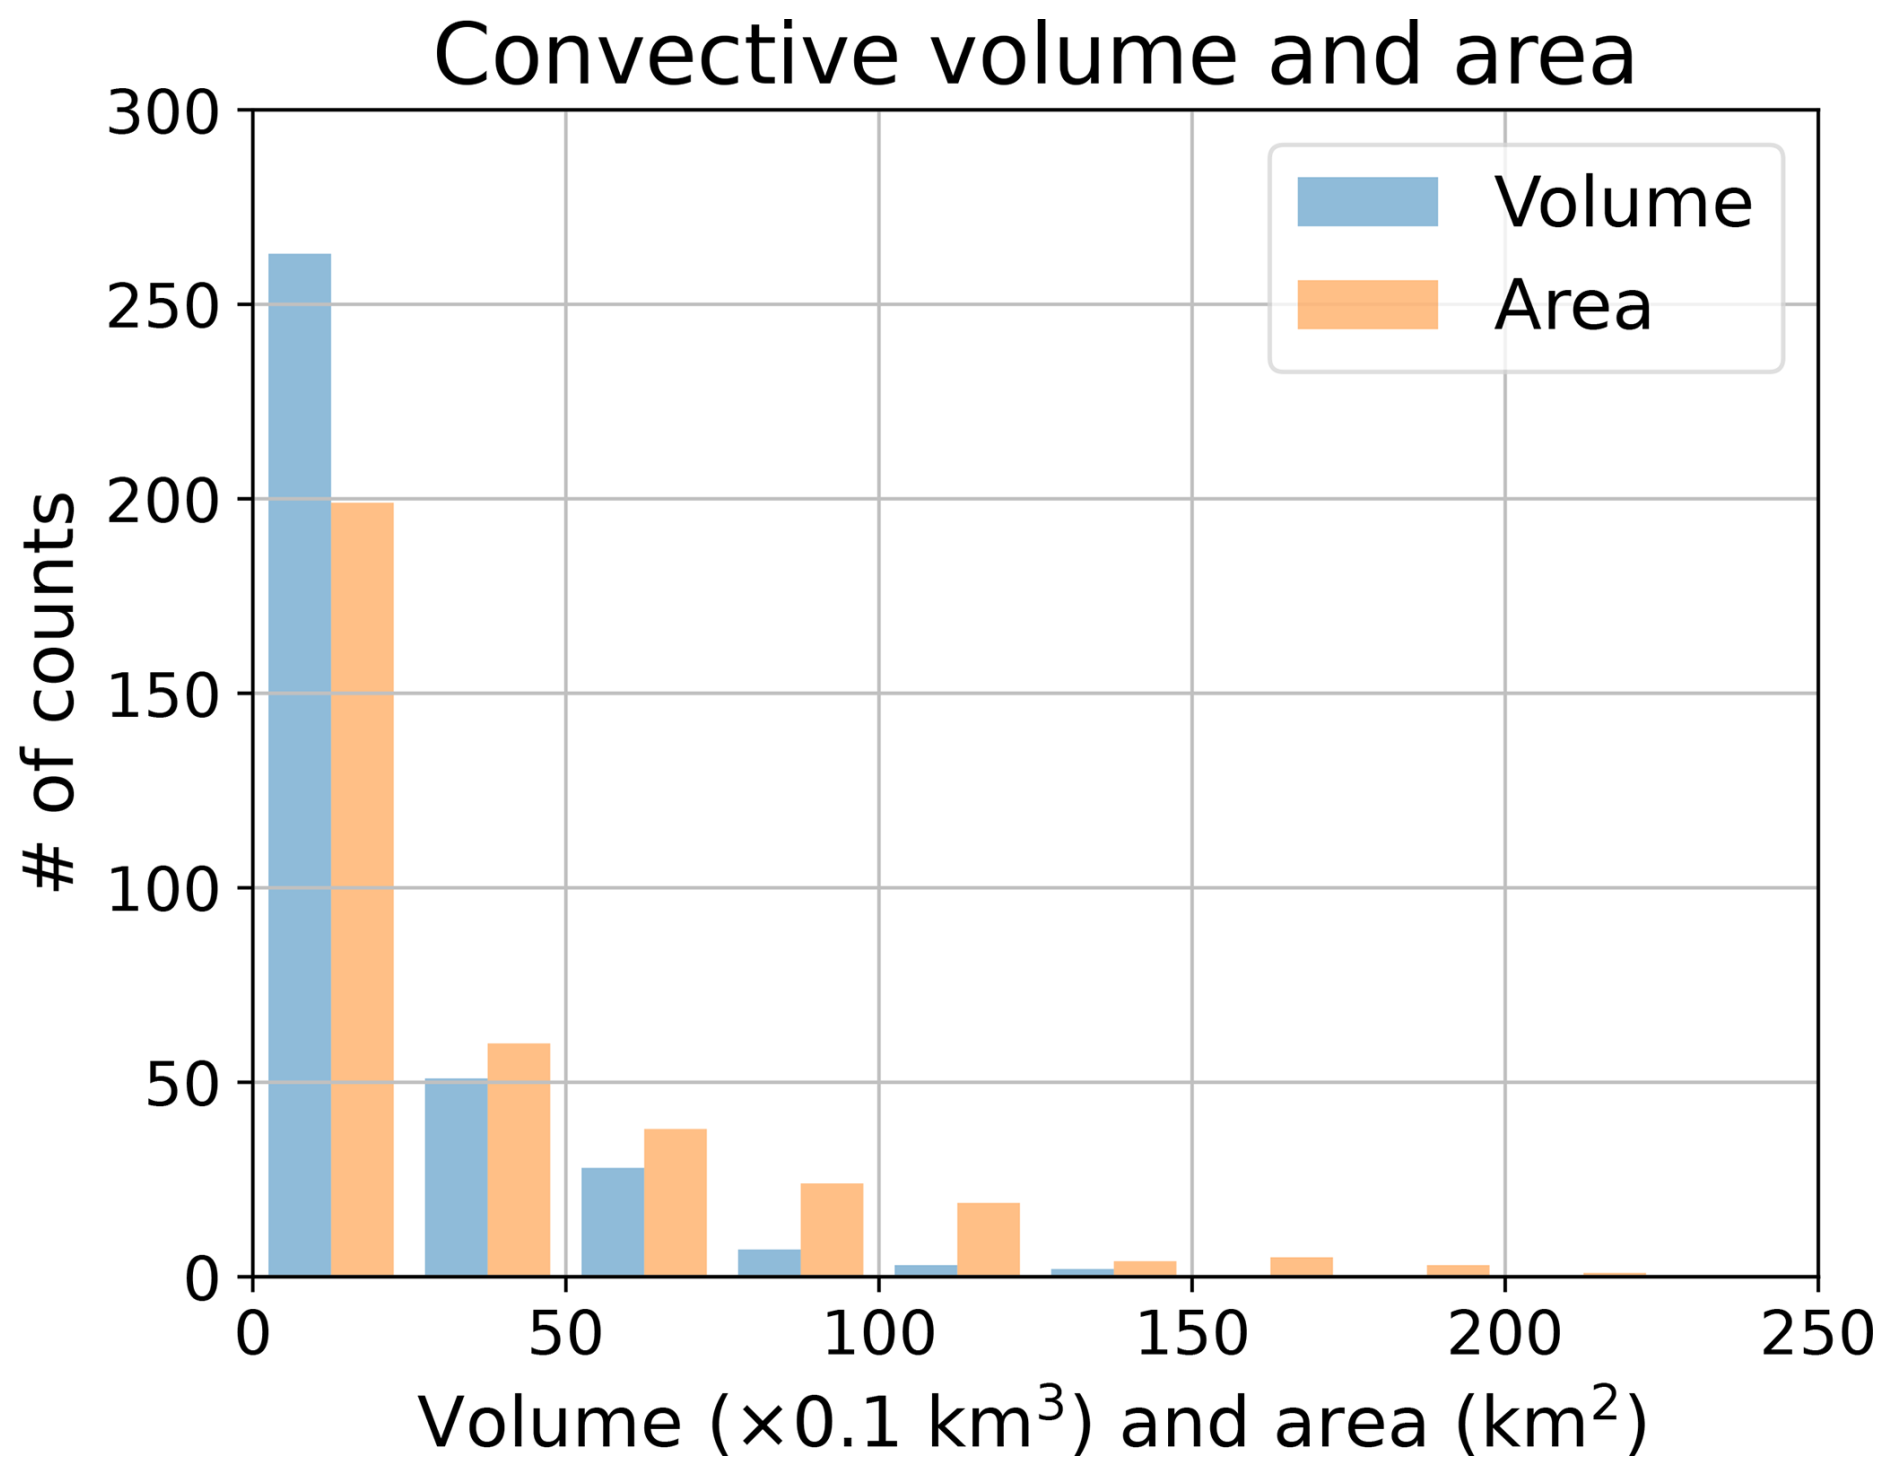
Figure 8The same as Fig. 7, but versus their volume (blue) and their horizontal area at the 2 km height (orange), counted at 250 km3 and 25 km2 interval, respectively.
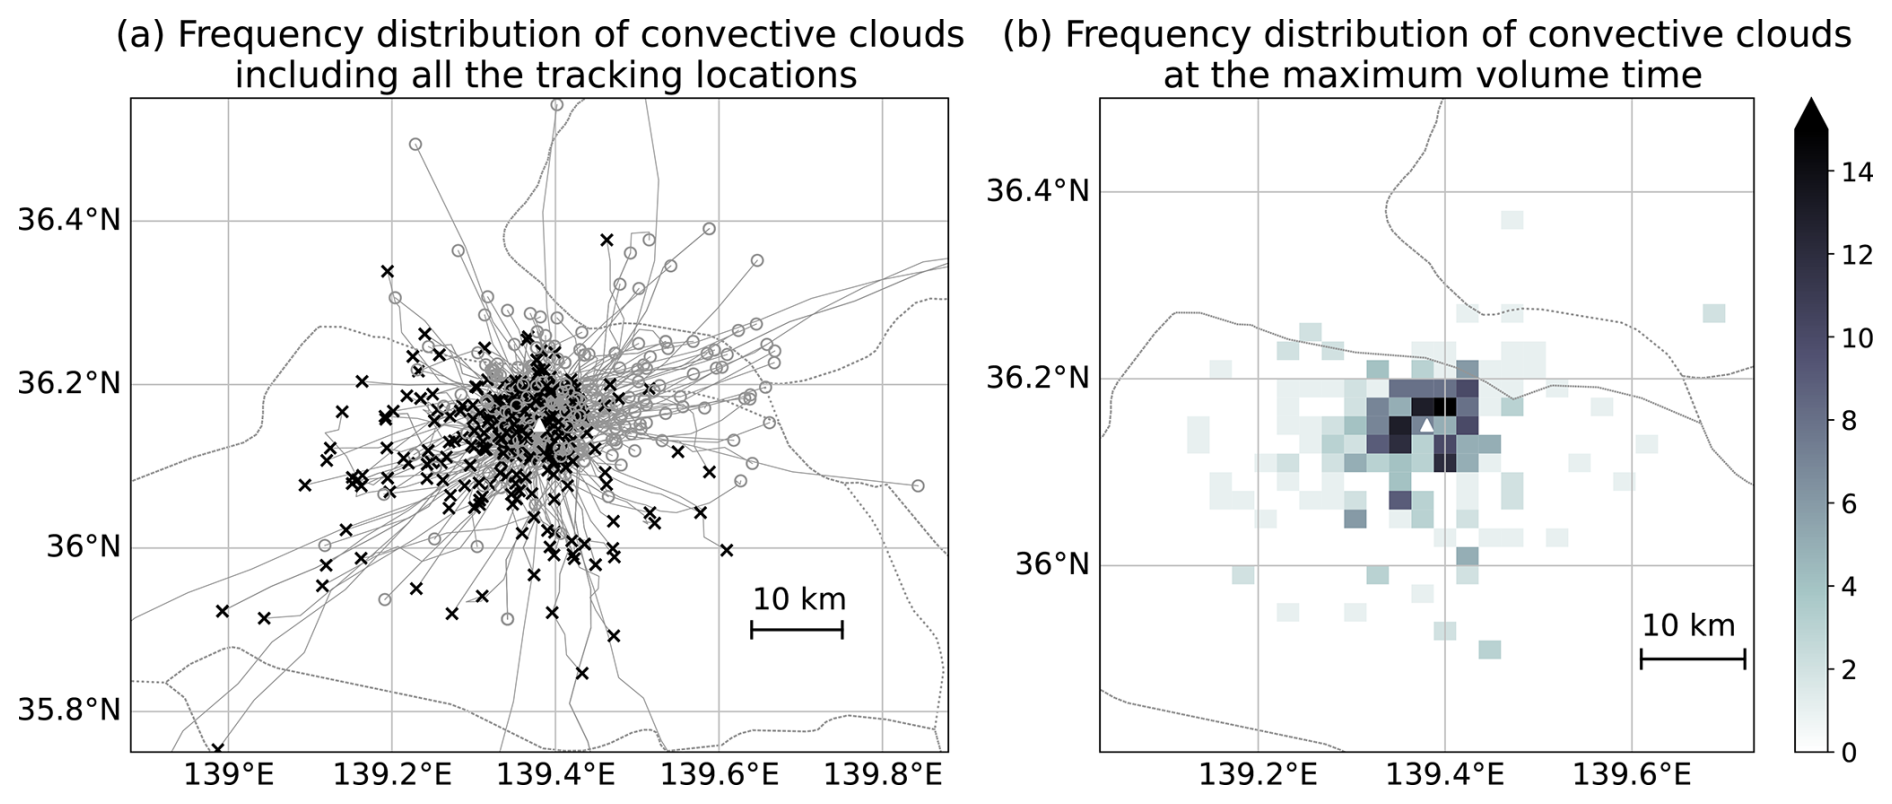
Figure 9(a) Frequency distribution of the extracted convective clouds with their trajectories. The black crosses and grey circles indicate the start and end points of the extracted convective clouds, respectively. (b) The two-dimensional histogram of the extracted convective clouds at the maximum volume time. The triangle displayed in each panel shows the location of the disdrometer site used in this study.
3.2 Vertical profiles of the DSD parameters within convective clouds
Vertical profiles of DSD parameters at the maximum volume time are displayed in Fig. 10. Each profile was extracted from the feature detection points of the convective clouds. D0 shows a tendency to increase in value at the heights of 2–4 km towards the ground with a peak median/maximum value of ∼ 1.9/> 2.1 mm and to decrease in value below 2 km, whilst Nw shows the opposite trend to D0 with a peak minimum/median value of ∼ 103.5/∼ 103.7 mm−1 m−3 (black lines in Fig. 10a, b). The LWC gradually increases with descending height, with a peak median value of ∼ 1.3 g m−3 and is nearly constant below the 2 km height (black lines in Fig. 10c). Λ tends to decrease in value at the heights of 2–4 km towards the ground with a peak median value of ∼ 2.1 mm−1 and to increase in value below 2 km height (black lines in Fig. 10d). Similar profiles were examined at the first detected time of convective clouds; the vertical changes in D0, Nw, and Λ show the same trend as the maximum volume time, except LWC, which tends to increase towards the ground (grey lines in Fig. 10). In addition, each value in D0 and LWC (Nw and Λ) tends to be larger (smaller) at the time of volume maximum than at the initial time of detection at heights above 2 km. Whilst the trend of the values is quite similar, at the time of between maximum volume and initial detection of convective clouds, the absolute values between them are largely different, that is, the values at the time of maximum volume are more likely to be larger in D0 and LWC (smaller in Nw and Λ) than those at the initial time of detection as the convections evolve.
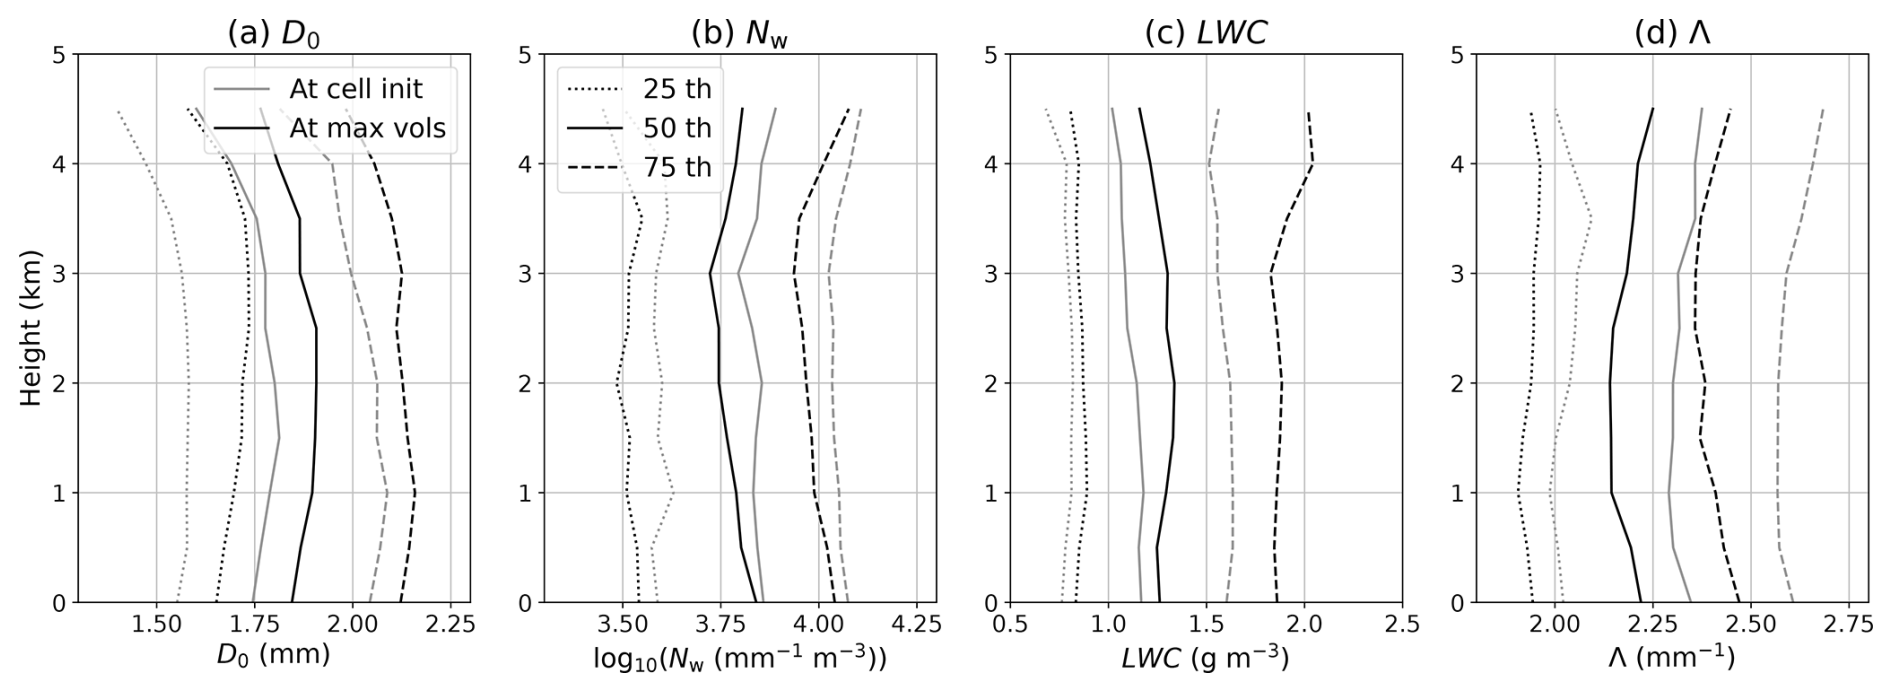
Figure 10The vertical profiles of the DSD parameters at the centre of the extracted convective clouds: (a) the median volume diameter (D0; mm), (b) the generalised intercept parameter (Nw; mm−1 m−3) in log10 scale, (c) the liquid water content (LWC; g m−3), and (d) the slope parameter (Λ; mm−1). The time at the initial detection of convective clouds and at the maximum volume are displayed as black and grey colours, respectively. Dotted, solid, and broken lines indicate 25th, 50th, and 75th percentiles, respectively.
3.3 Horizontal views of convective clouds
Characteristics of the horizontal distribution of the DSD parameters at the 2 km height are shown in Fig. 11 to see how the horizontal structure of the DSD inside and outside features of the convective clouds. The reason why the 2 km height is selected is that the vertical trends of the DSD parameters were gradually changed at the height (Fig. 10). In the composite distribution of convective clouds at the maximum volume time, the distribution is concentrated near the convective centre or slightly broadened from southwest to northeast direction in D0 (∼ 2.0 mm), Nw (∼ 103.7 mm−1 m−3), and Λ (∼ 2.1 mm−1), except for LWC (Fig. 11a–d). The distribution of LWC is quite broader than the others. These distributions could be affected by the standard deviation of the values, as there were notable differences in the horizontal distribution, with a region of larger values to the western or southwestern parts of the convective centre. The standard deviation of each value shown as solid lines in each panel of Fig. 11 is likely to be higher over the western and southwestern parts of the convective cores in D0 (∼ 0.6 mm), Nw (∼ 100.4 mm−1 m−3), and Λ (∼ 0.35 mm−1) are similar to those of the median values, whereas that of LWC is likely to be higher (∼ 1.2 g m−3) over the western and northwestern parts of the convective centre.
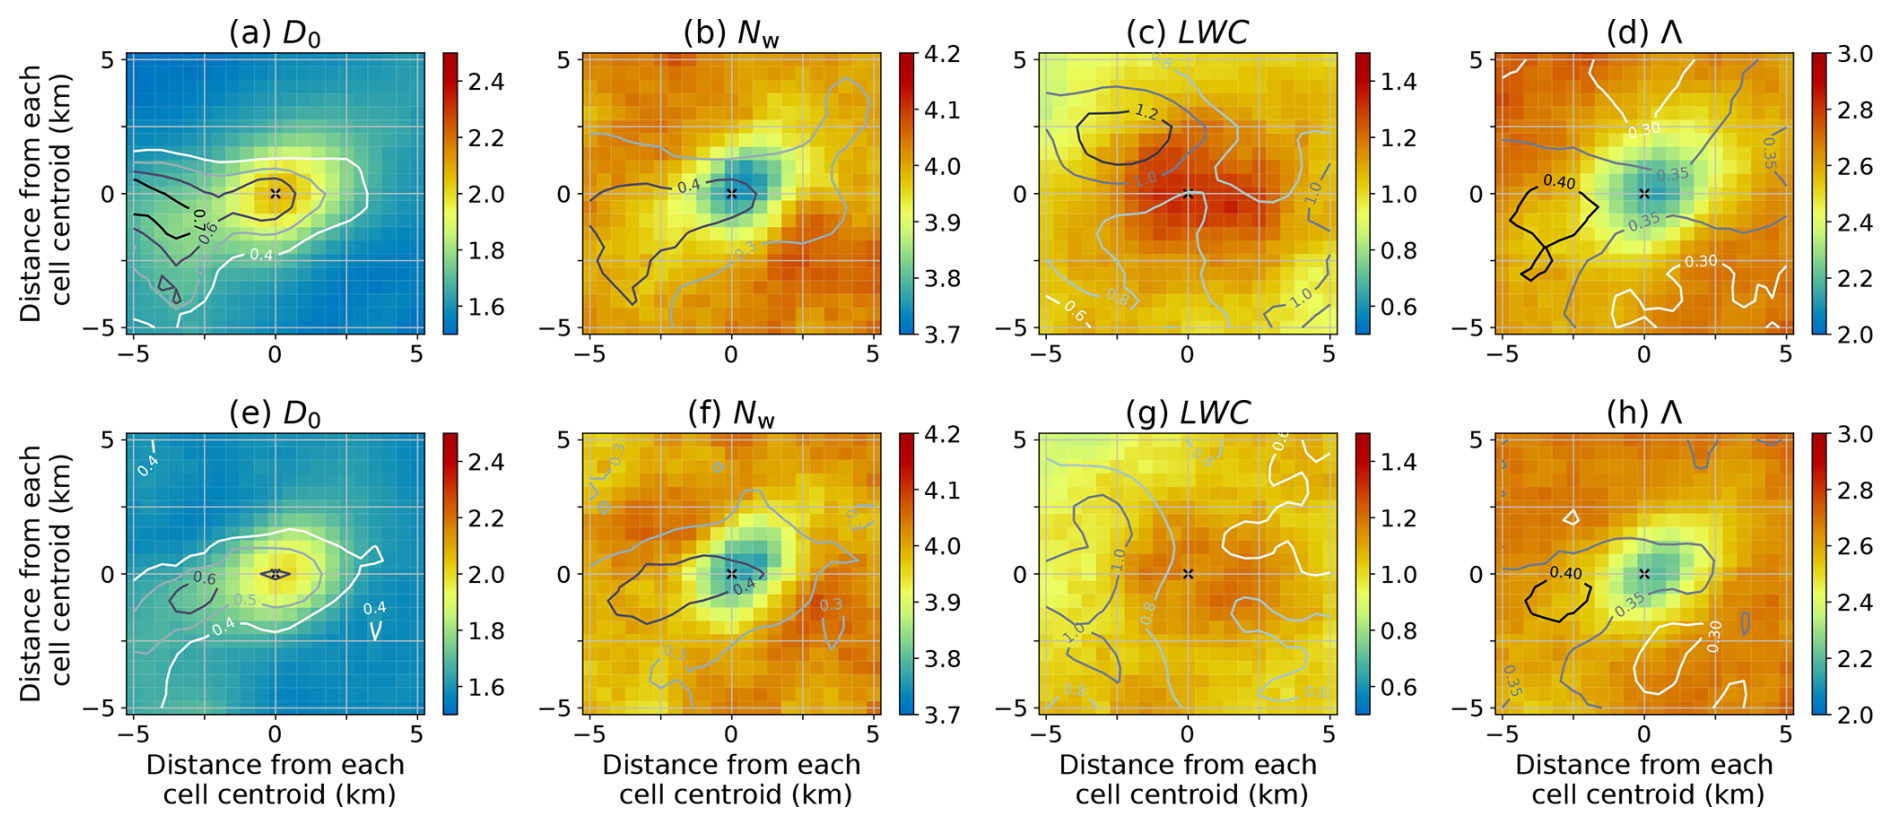
Figure 11Composite horizontal view of convective clouds at the maximum volume (upper row) and at the initially detected time (lower row): (a, e) the median volume diameter (D0; mm), (b, f) the generalised intercept parameter (Nw; mm−1 m−3) in log10 scale, (c, g) the liquid water content (LWC; g m−3) and (d, h) the slope parameter (Λ; mm−1). Colour shades and lines show that the values of median and standard deviation, respectively. The coordinate system is centred at each feature detection point of the extracted convective clouds.
The horizontal views are also shown in Fig. 11e–h, but at the time of first feature detection. The peak value is slightly smaller than that at the maximum volume time, but the horizontal distribution patterns are similar to those at the maximum volume time, as shown in Fig. 11a–d. Most notably, the value of LWC at the maximum volume time is quite larger than that at the initial detection time. The values for D0 are generally smaller (∼ 1.8 mm) at the initial detection time than at the maximum volume time, and the standard deviation values are also slightly smaller (∼ 0.5 mm). The variation in the distribution also tends to be smaller at the initial time than at the maximum time. The values of Nw are generally larger than those of the maximum volume time, and the standard deviation values are similar (∼ 0.4 mm−1 m−3). The distribution variation at the initial time tends to be smaller than that at the maximum volume time, and the distribution variation appears to be reduced in the west or southwest direction. The LWC values are generally smaller than at the maximum volume time, and the standard deviation values are also generally smaller. The distribution variation tends to be larger over the whole analysis area, and when compared to the maximum volume time, it tends to be larger on the western side of the convective cloud. The value of Λ is generally larger than at maximum time, and the standard deviation becomes more scattered around the centre of the convective cloud or to the westward and southwestward. These features are probably related to the convective cell's shape and direction of movement.
3.4 Environmental conditions for the development of the extracted convective clouds
As mentioned in Sect. 1, the DSDs within a convective cloud might be regulated by the surrounding environmental conditions. Here, the relationships between the DSD parameters at 2 km height and CAPE were investigated (Fig. 12). D0 is positively correlated with CAPE (Fig. 12a), whilst Λ is negatively correlated with CAPE (Fig. 12d), whose p-values are less than 0.05. The variability of the scatter points in Nw and LWC is relatively higher than in D0 and Λ, which are reflected to no apparent relations on Nw and LWC with CAPE value (p-value > 0.05). These results are mostly consistent with the results of the convective events during the pre-monsoon season in India (Saha et al., 2022). Also, previous studies have shown that CAPE is positively correlated with precipitation intensity for the slower-moving precipitating systems (Unuma and Takemi, 2016), whilst the environmental conditions for the development of convective systems in Japan were not clearly represented as in Kato (2020). Since CAPE reflects the degree of static stability, including moisture content as an environmental condition in thermodynamic profiles, the parameters KI and TLR were investigated to separate the effects between them.
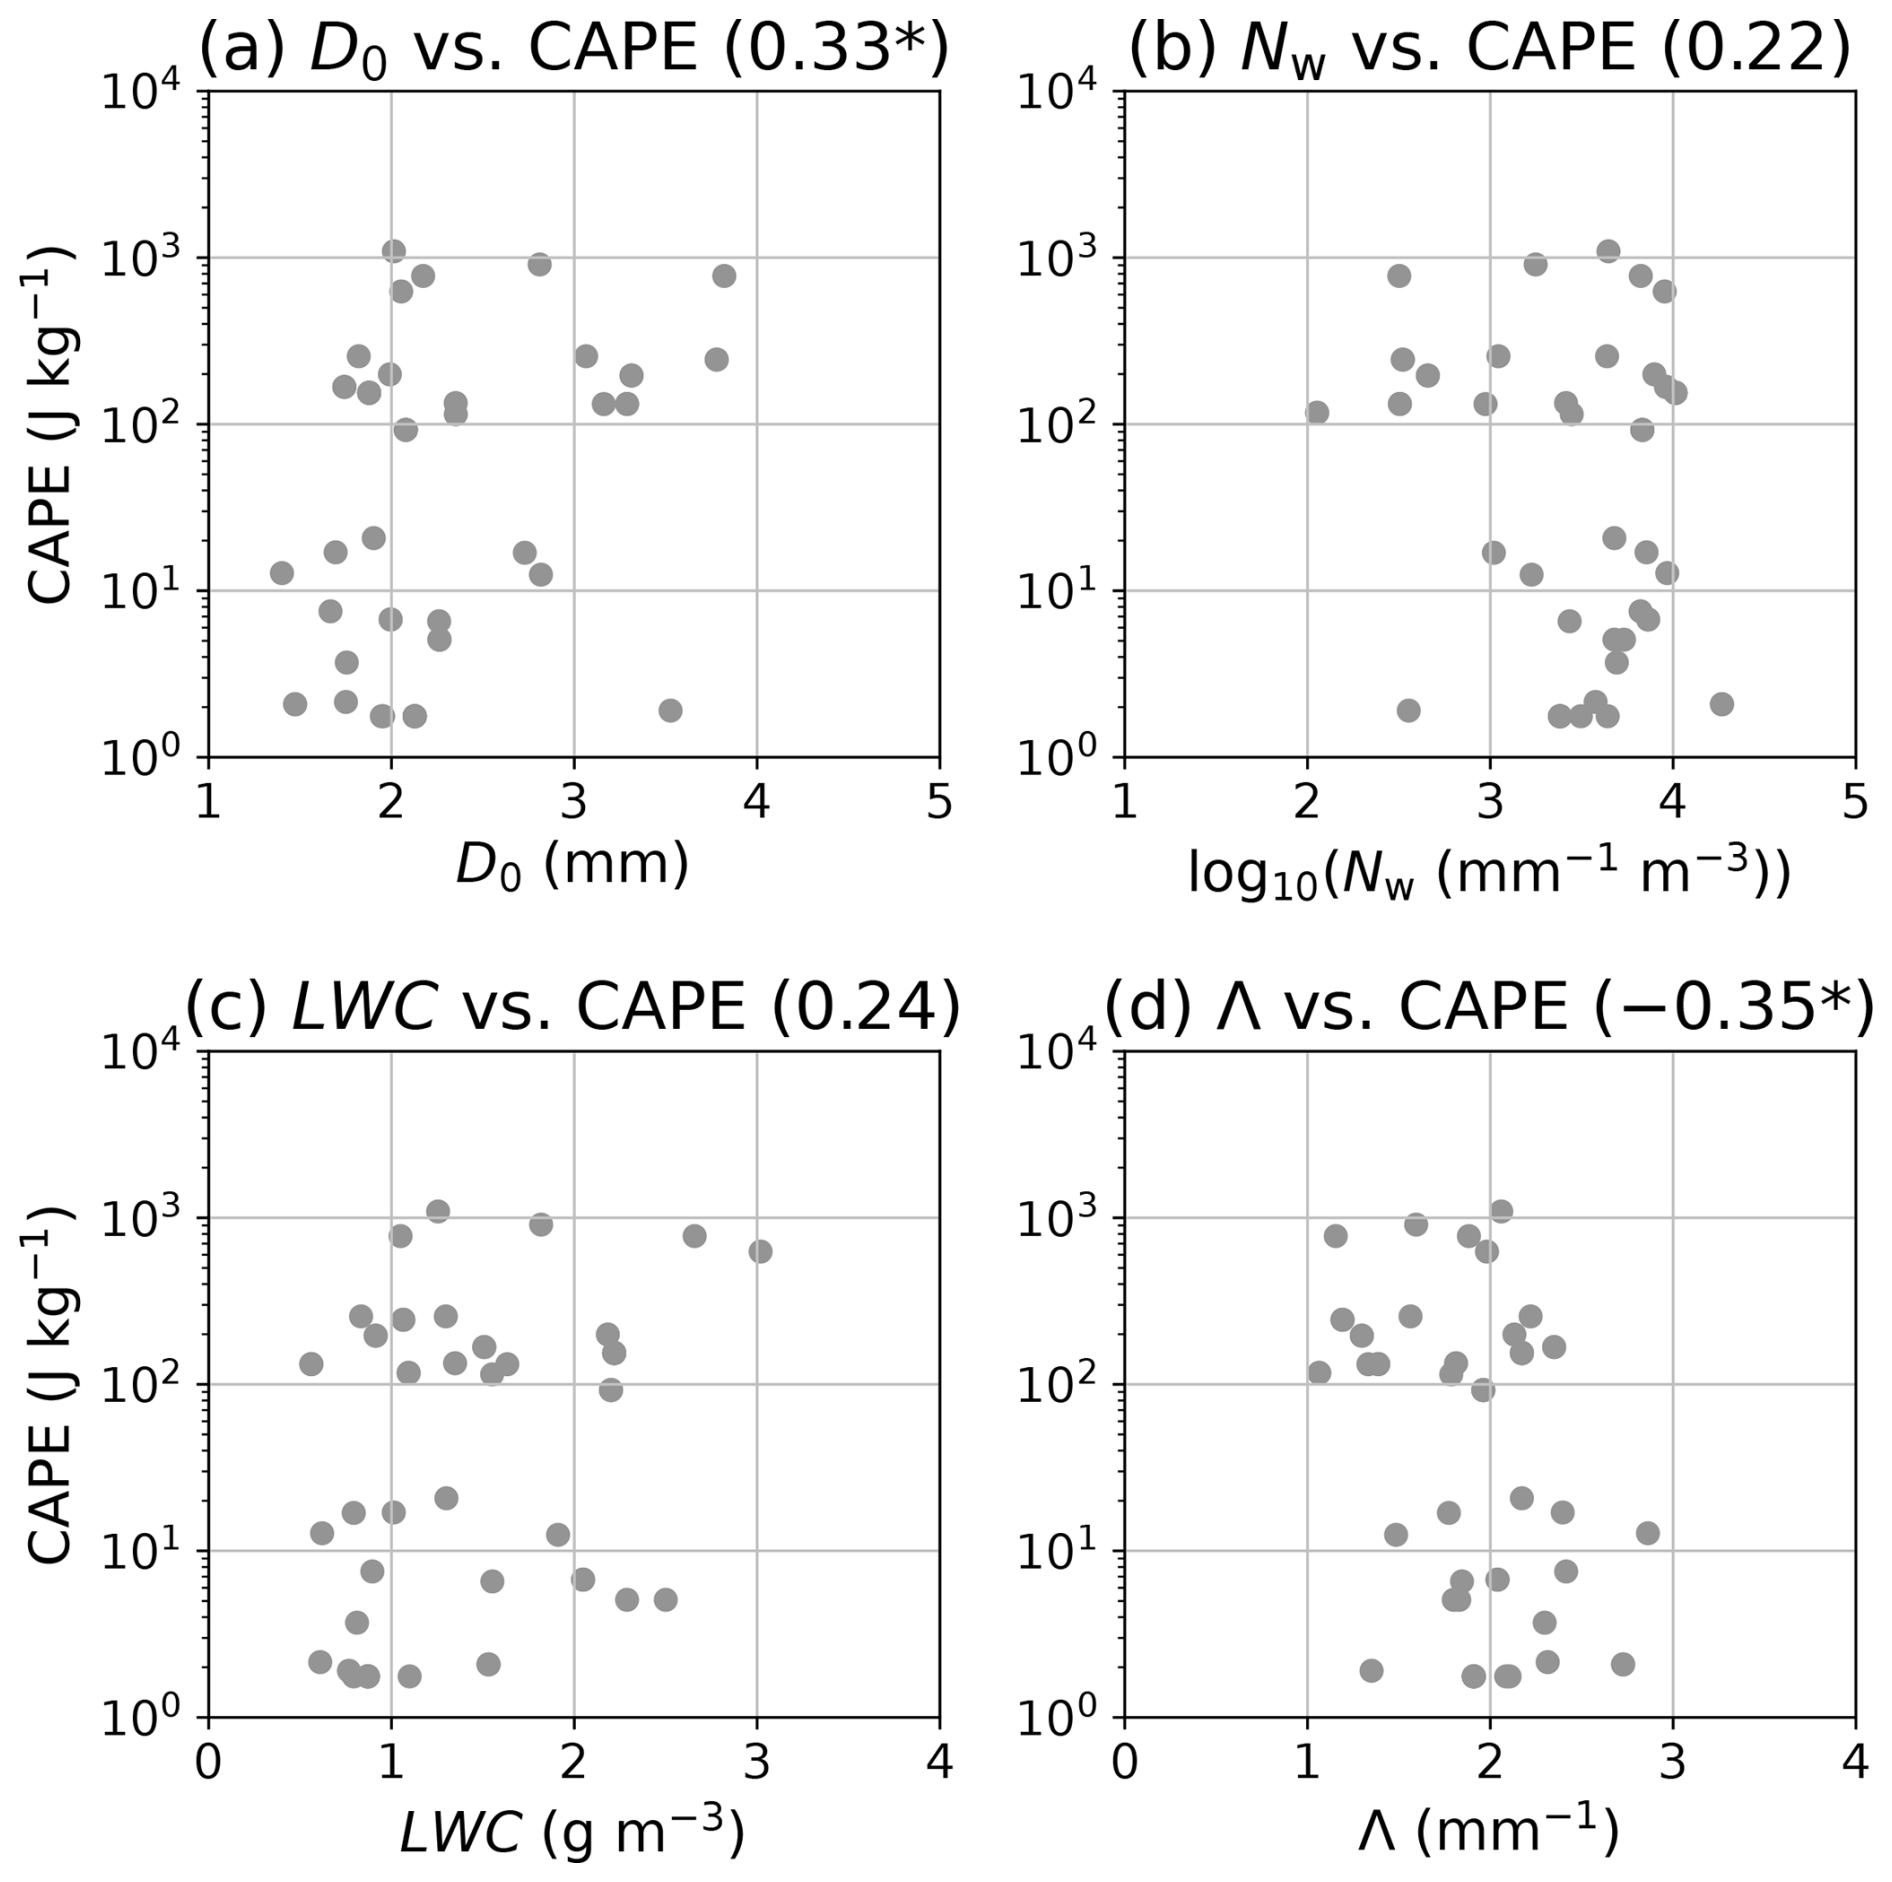
Figure 12Scatter plots between (a) the median volume diameter (D0; mm), (b) the generalised intercept parameter (Nw; mm−1 m−3) in log10 scale, (c) the liquid water content (LWC; g m−3), and (d) the slope parameter (Λ; mm−1) and convective available potential energy (CAPE; J kg−1). The correlation coefficient between the parameters is shown in each panel and an asterisk * is added if the p-value for the correlation coefficient is less than 0.05.
Figure 13 shows relationships between D0 and KI, D0 and TLR, D0 and PW, and LWC and PW integrating 1–2 km height (PW12), respectively. Note that the height of the DSD parameters selected in Fig. 13 is near the ground because the higher correlation coefficient values is obtained than the other analysis height. The larger D0 seems to be related to the larger KI (Fig. 13a), but the correlation coefficient is much smaller. D0 is proportional to TLR (Fig. 13b) and shows positive correlations between D0 and TLR with p-value < 0.05. D0 is negatively correlated with PW (Fig. 13c), whilst the relationships between them were weaker than TLR due to the higher variance of the distribution. The larger value of LWC seems to be related to the larger value of PW12 (Fig. 13d), whose relationship is statistically significant (p-value < 0.05). D0 is sensitive to environmental instability (e.g., TLR) but is not sensitive to PW, which probably due to selecting breakup signature on the ground in the present study (Sect. 2.4). Actually, the number concentration of the diameter < 3 mm is dominant for the case of R < 30 mm h−1 as shown in Fig. 5b and c). LWC seems to be sensitive to environmental moisture content, which is probably linked to stronger R on the ground (e.g., Jung and Jou, 2023; Unuma, 2024) and will be discussed in Sect. 4.2.
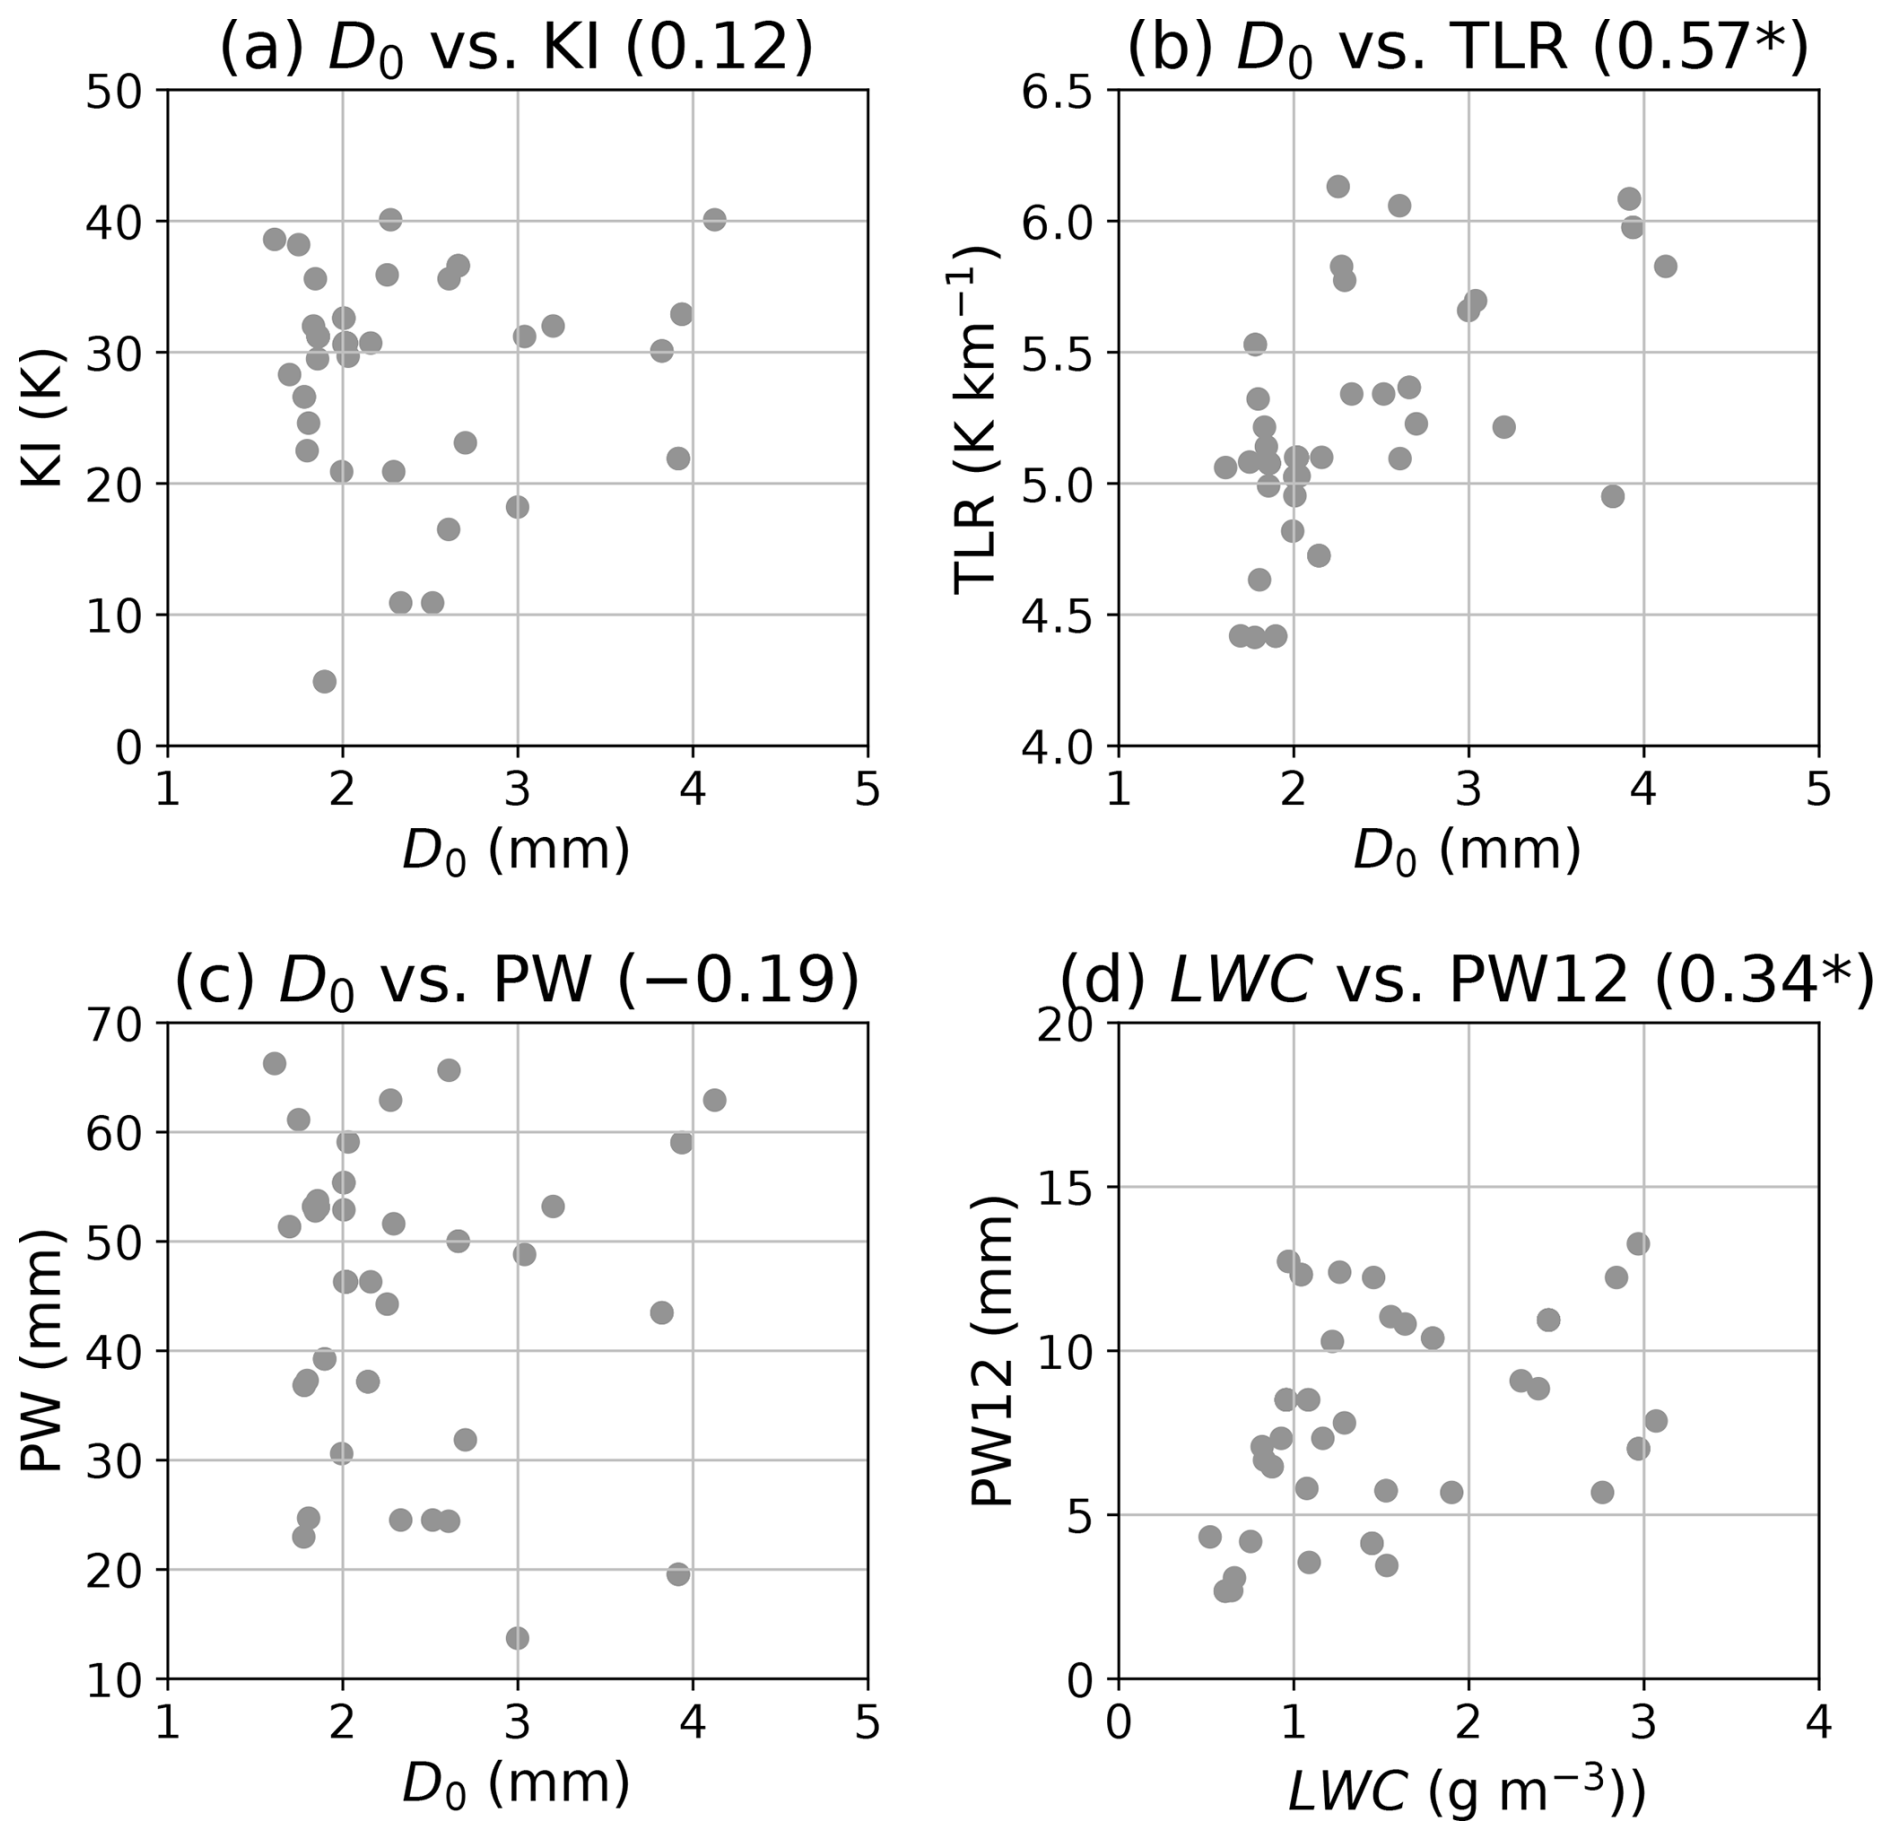
Figure 13The same as Fig. 12, but between (a) the median volume diameter (D0; mm) and K Index (KI; K), (b) D0 and temperature lapse rate (TLR; K km−1), (c) D0 and precipitable water (PW; mm), and (d) the liquid water content (LWC; g m−3) and PW integrating 1–2 km height (PW12).
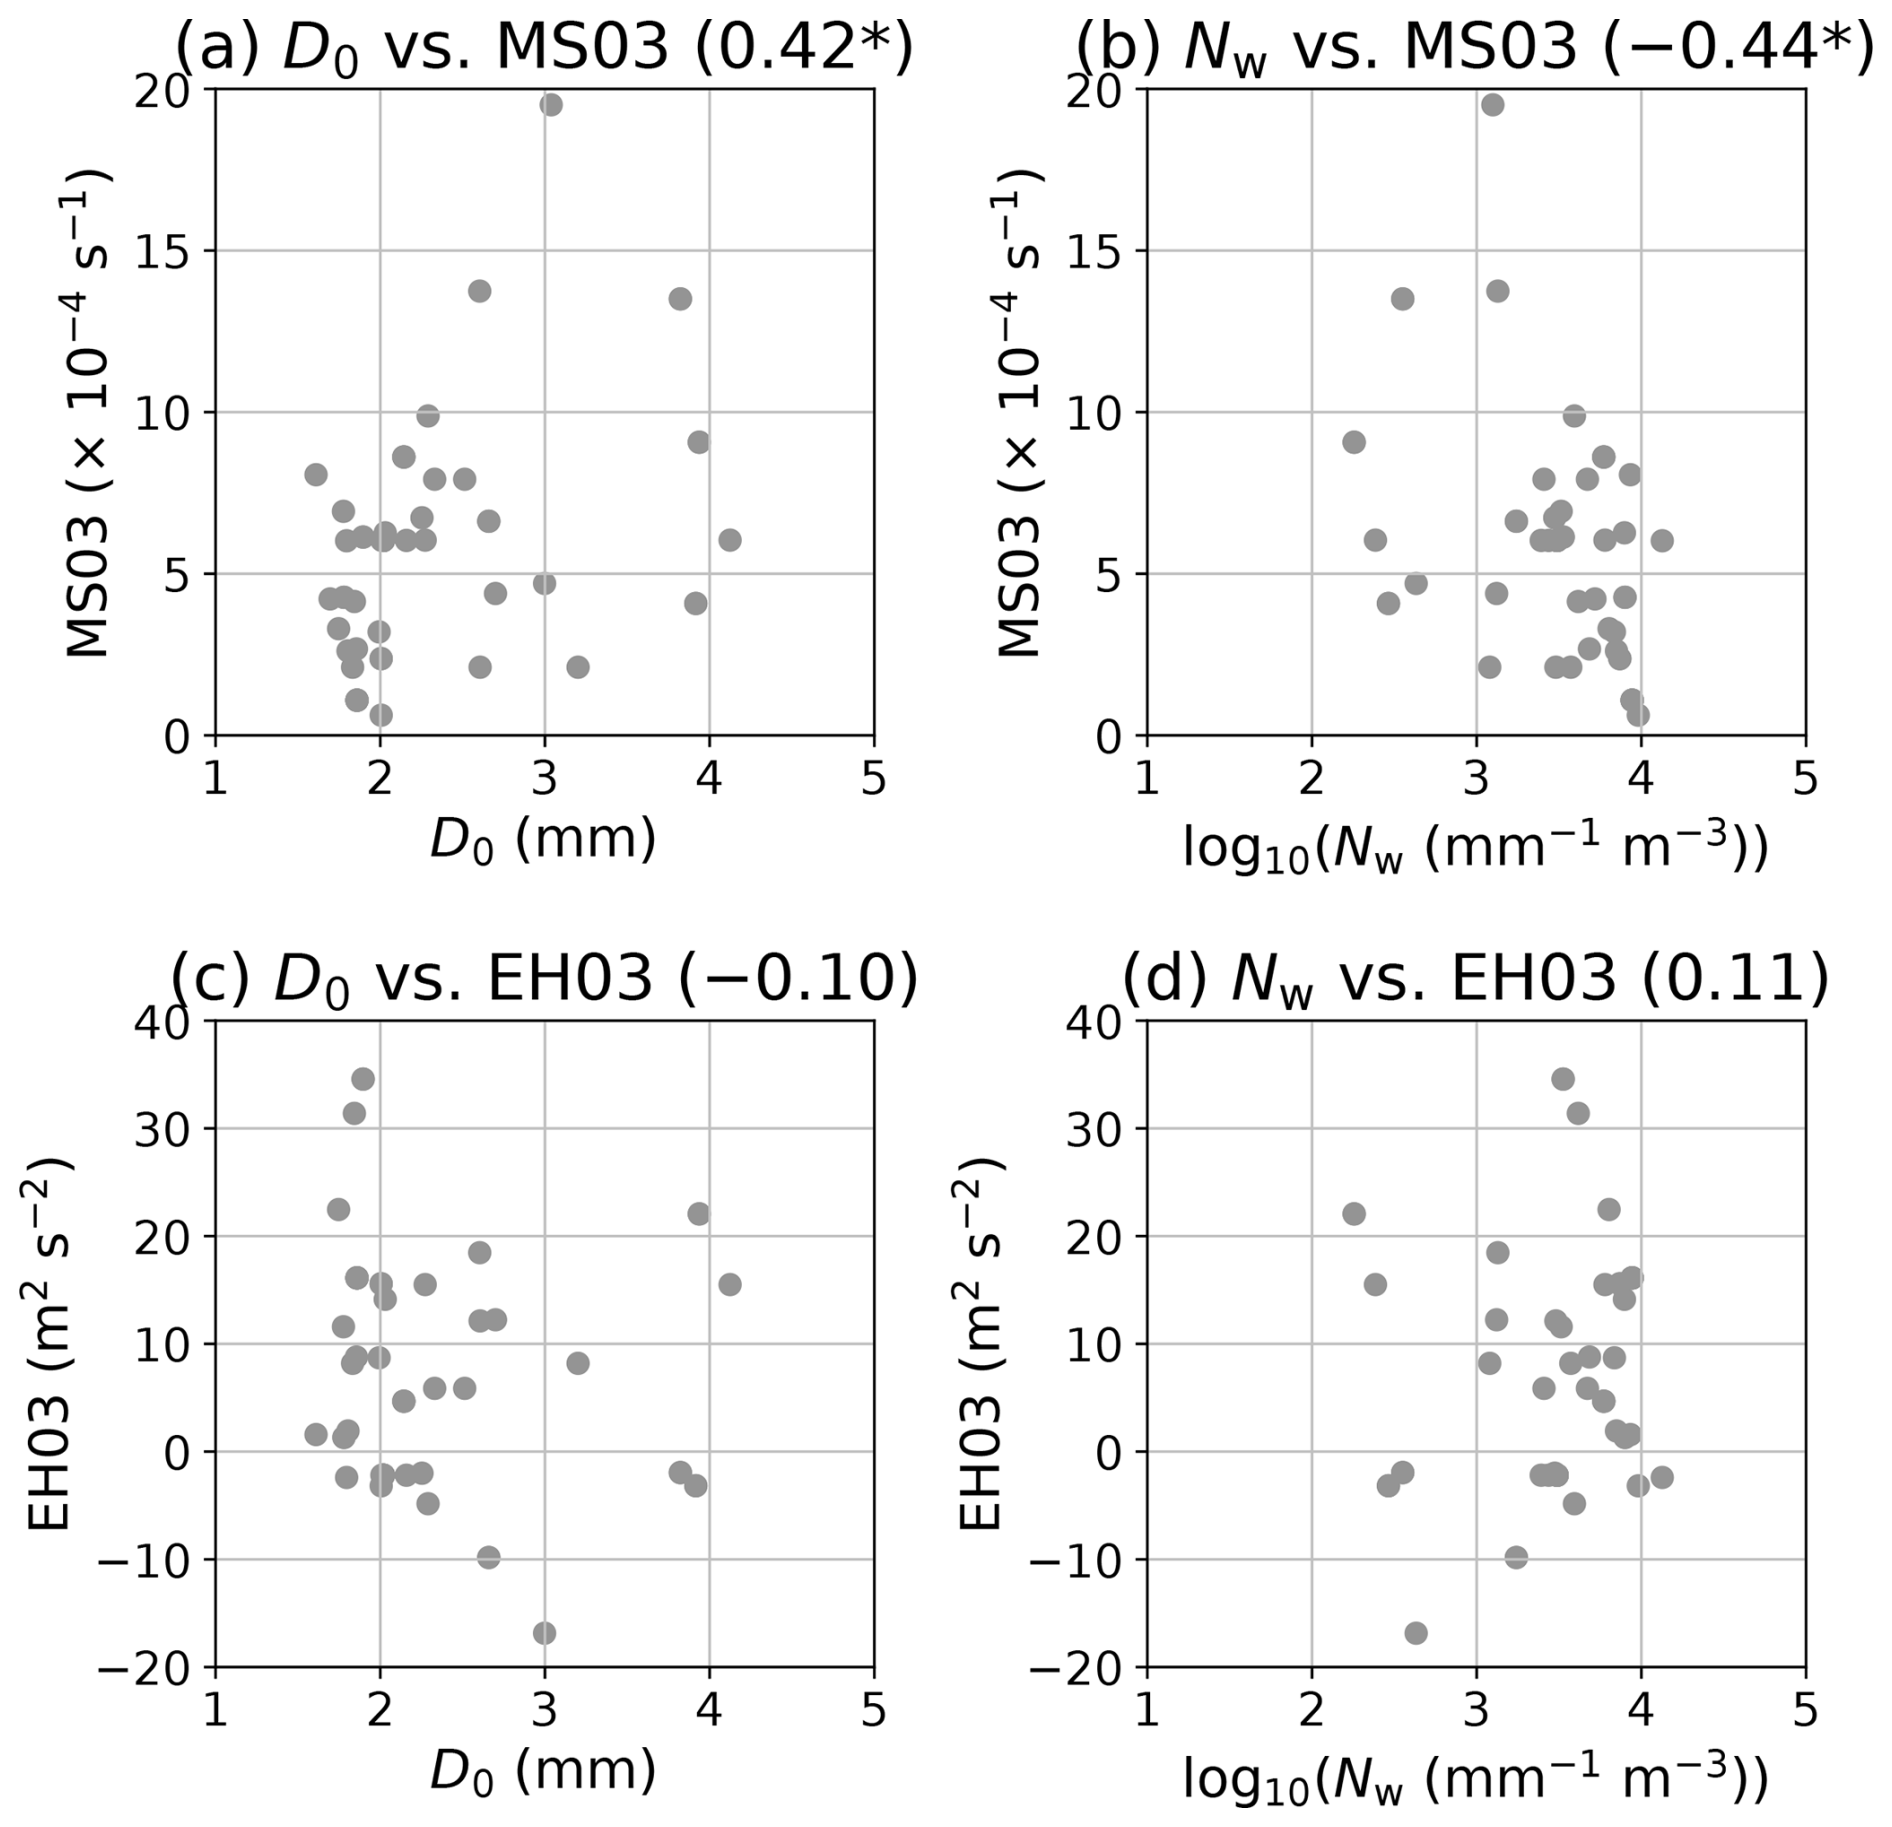
The relationships between the environmental vertical shear of the horizontal winds and the DSD parameters were further investigated (Fig. 14), as the DSDs tend to be affected by the environmental vertical shear as described in Sect. 1. The value of D0 is likely to be large when the value of MS03 is large (Fig. 14a), whilst the value of Nw is likely to be small (Fig. 14b). These results suggest that larger raindrops with lower number concentration are more likely to be generated under the stronger vertical shear, which is mainly consistent with the result of Kumjian et al. (2014). The relationships between the environmental directional shear of horizontal winds and the DSD parameters were also investigated. The D0 value tends to be smaller when the EH03 value is larger (Fig. 14c), whilst the Nw value tends to be larger when the EH03 value is larger (Fig. 14d). These trends are different from those in MS03 but are not statistically significant (p-value > 0.05). These results indicate that the broader DSD will likely form when the vertical shear is smaller. The broader shape of the DSD is directly reflected in the stronger R (e.g., Oue et al., 2010). Thus, the results obtained are in addition to those investigated by Unuma and Takemi (2016), which clearly show the factors contributing to R in terms of DSD parameters and environmental parameters. These relationships will be discussed later in Sect. 4.2.
4.1 Vertical and horizontal structures of the detected convective clouds with the slope parameter
The vertical structures of D0 and Nw are similar between the initial time of detection and the time of maximum volume (Fig. 9). In order to quantify this similarity, a statistical test is performed on the differences in mean values vertical changes between times at 2–4 and 0–2 km height. The null hypothesis for the statistical test is “there is no difference in the mean vertical change between the specified heights between times”. The data were independent between the time points, and Student's t-test, which does not assume a normal distribution, showed that the p-values were sufficiently larger (> 0.05) than the 95 % confidence interval. This result means there is no significant difference between the times as the null hypothesis cannot be rejected. Therefore, there is no significant difference in the vertical structures of D0 and Nw between the initial detection time and the maximum volume time. In other words, it is possible that a vertical profile similar to the structure that produces the most intense rainfall can be observed for a time before convection produces the most intense rainfall.
Janapati et al. (2023) showed that the vertical profiles of the DSD parameters over Taiwan using the Global Precipitation Measurement mission Dual-Frequency Precipitation Radar were quite similar to our results in their convective events. However, the inflection height in their study was slightly higher than in this study, probably due to the different melting layer heights. Despite the melting layer height difference between Taiwan and the eastern part of Japan, a typical dominant process should be collisional coalescence in the convective regime. In addition, the collisional breakup of raindrops, as is shown by Jung and Jou (2023); Unuma (2024), is likely to be an important signature for the heavy/extreme rainfall near the ground in Asian countries with very humid conditions.
Regarding the horizontal distribution characteristics, although there are no apparent differences in structure near the centre of the convective clouds as described above, the characteristics with large dispersion were obtained towards the southwestern or western parts of the convective cloud centre. These were also observed in the early stages of convective detection, albeit with more minor differences in their values. Chudler et al. (2022) showed from polarimetric radar observations of the convective clouds in the tropics during the PISTON field campaign that when composited with convective clouds moving in the same direction, there are characteristics with larger ZDR and smaller co-polar correlation coefficients (ρhv) shift in the upstream direction. These characteristics can be interpreted as the presence of larger raindrops within the tropical convective clouds.
Figure 15 shows the radar variables at the maximum volume time, as shown in Fig. 11. The distribution is characterised by lower ρhv (Fig. 15d) and higher variability of ZDR (Fig. 15b) over the southwestern part of the convective cloud centre. In contrast, ZH and specific differential phase (KDP) values are distributed concentric or oval-shape, but with relatively larger standard deviation values (Fig. 15a and c). These characteristics are likely to have a similar structure to the results obtained by Chudler et al. (2022). It may also relate to be size sorting signal (e.g., McFarquhar and List, 1991; Kollias et al., 2001; Kumjian et al., 2014). The larger raindrops (e.g., > 4 mm in diameter) may not exist in this study, probably due to an active breakup process near the ground level (Fig. 10a and b). Although the ZDR signals are minor in this study, one of the largest variabilities is seen in the KDP, which is mainly related to the LWC in the DSD parameters and rainfall intensity. The water vapour-related environmental conditions should control KDP among the polarimetric variables and LWC among the DSD parameters, which will be discussed in the following subsection.
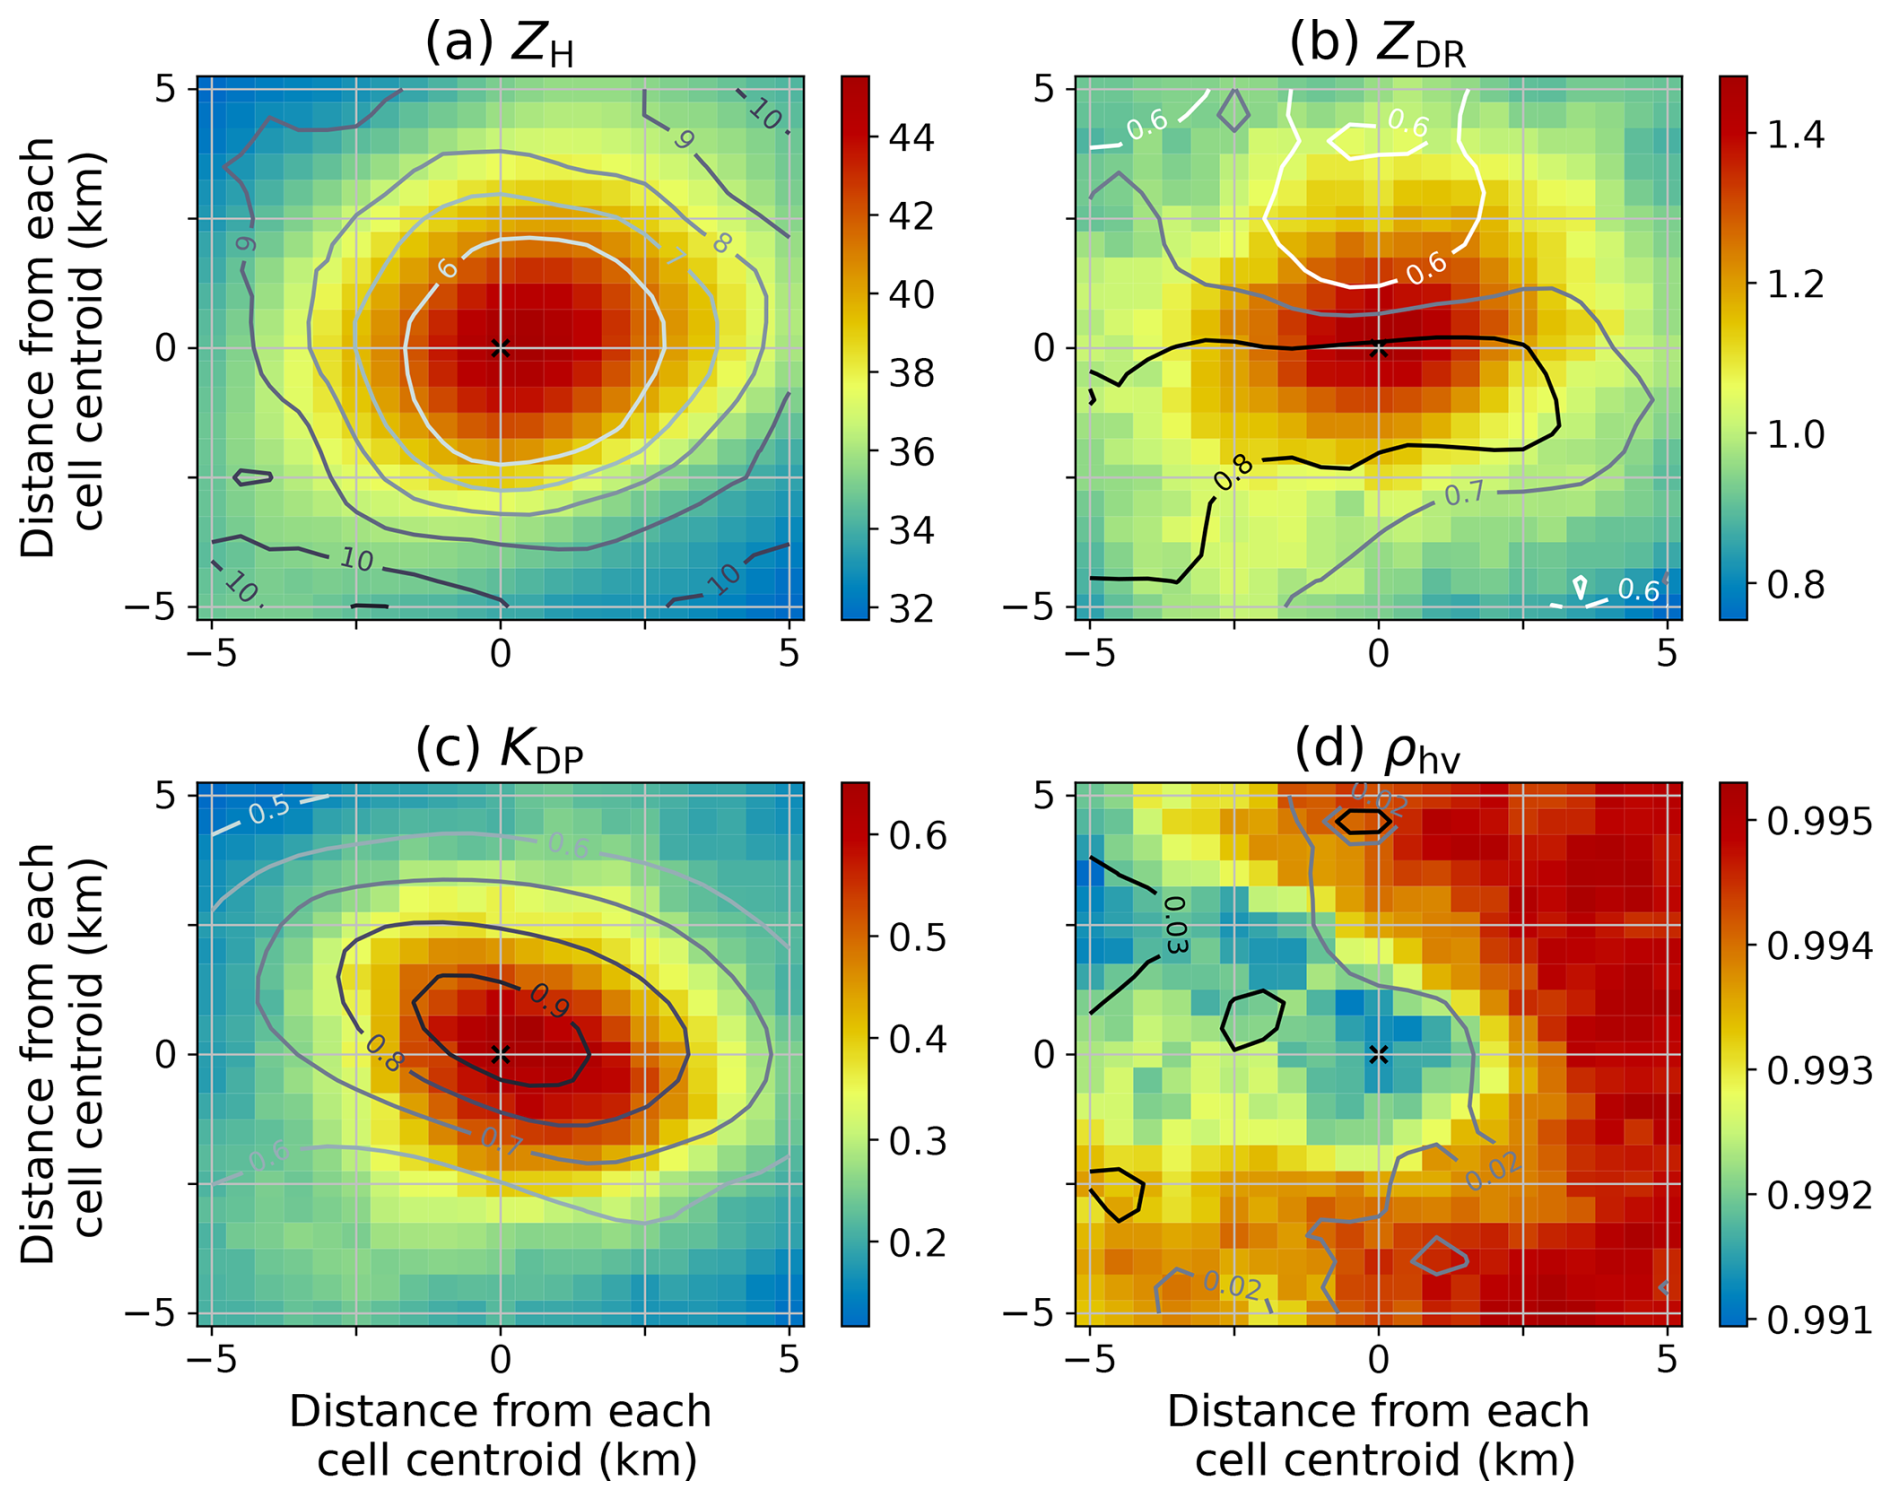
Figure 15Composite horizontal view of convective clouds at the maximum volume as well as Fig. 11: (a) horizontal reflectivity factor (ZH; dBZ), (b) differential reflectivity (ZDR; dB), (c) specific differential phase (KDP; ° km−1), and (d) co-polar correlation coefficients (ρhv; unit less). Colour shades and lines show that the values of median and standard deviation, respectively.
4.2 Relationships between environmental parameters and DSD parameters
Environmental properties such as kinetic and thermodynamic components may affect the DSD parameters through a proxy of convective clouds. Saha et al. (2022) investigated the relationship between the DSD parameters and environmental parameters and found that larger CAPE is positively correlated with larger Dm during the pre-monsoon season in India. A similar trend is found in the present study (Fig. 12). Since KI is also positively correlated with D0, whether the contribution due to water vapour content or instability was investigated. It is found that the contribution from the instability, i.e., the temperature lapse rate, is higher. In other words, the DSD parameters, i.e., the median volume diameter, are slightly affected by the static stability of the environmental field (Fig. 13b). When the instability indices such as CAPE and TLR are high, D0 tends to be large, and Λ tends to be small (Figs. 12 and 13); that is, a broader shape of the DSD is likely to be formed concerning the gamma DSD with shape parameter μ is larger than zero value. Here, the three-parameter gamma distribution N(D)gam is defined as following;
This form is quite similar to N(D)exp in Eq. (8) but with the shape parameter μ. If μ is negative, the smaller value of μ results in smaller value of Λ due to its shape is to be concave. As shown in Fig. 5, almost all of the observed DSD shape is convex, envisaging μ is larger than zero in the present study. On the other hand, the weaker vertical shear affects the liquid water content within the convective clouds (Fig. 14d). This is probably related to the higher precipitation intensity under the weaker vertical shear condition (Unuma and Takemi, 2016; Unuma, 2024). Unuma and Takemi (2016) extracted the quasi-stationary convective systems and divided them into those with the faster- and slower-moving systems, and compared their characteristics. As a result, the slower-moving convective systems tended to occur under the weaker vertical shear environment compared to the faster-moving systems. In addition, precipitation intensity tended to be stronger and its area tended to be smaller in the cases of slower-moving systems, which may be one of the reasons for the resulting larger rainfall amount because the systems remain to be located nearly same location.
In terms of microphysical perspectives, collisional coalescence between raindrops tends to occur under the stronger vertical shear environment, which promotes to producing larger (> 2 mm diameter) raindrops. At the same time, smaller raindrops are likely to evaporate more easily under the stronger vertical shear. On the contrary, the probability of collisional coalescence between raindrops and that of evaporation are decreases under the weaker vertical shear environment. In such cases, smaller (< 2 mm diameter) raindrops are more likely to form, contributing to higher number concentrations. In fact, the number concentration of raindrops with the diameters of ∼ 1–2 mm was high regardless of R, as observed in the ground-based DSD observation (Fig. 5).
The amount of water vapour in the surrounding atmosphere may increases LWC for the DSD parameters, as shown in Fig. 13d, and the intensity of precipitation in the DSD that has approached an equilibrium shape can be more sensitive to the amount of water vapour. The amount of water vapour, which is regulated by the vertical profile of water vapour, has mainly been presented as an indicator of the degree of vertical development of convection in the tropics (e.g., Brown and Zhang, 1997; Johnson et al., 1999; Derbyshire et al., 2004; Takemi et al., 2004; Waite and Khouider, 2010; Takemi, 2015). The importance of such vertical profile for the occurrence and development of convection has also been demonstrated in Japan (Unuma and Takemi, 2016; Hamada and Takayabu, 2018). From a cloud microphysical process perspective, it is suggested that the higher environmental water vapour could be attributed to the larger amount of rainfall through the higher number concentration of cloud drops and/or raindrops.
It has been known that the evaporation of raindrops rarely occurs under very humid conditions, and the DSD becomes a broader shape (e.g., Hu and Srivastava, 1995; Chandrasekar et al., 2023). Previous studies have suggested that accretion, i.e., a coalescence process between cloud drops and raindrops (Kessler, 1969), is important for the formation of larger raindrops (Beard et al., 1986; Rauber et al., 1991; Testik, 2009) and may make the DSD broad. Recently, Wang et al. (2018) and Zheng et al. (2021) have attempted to separate dominant cloud microphysical processes using polarimetric radars and the DSD parameters. Their results infer that a possible cloud microphysical process within the convective clouds could be diagnosed under the Rayleigh-Gans approximation in this study.
The two dimensional histograms of ΔLWC and ΔD0 as their vertical changes from 4 to 2 km and from 2 to 0 km are shown in Fig. 16. Here, the present analysis used D0 instead of ZDR (Wang et al., 2018) since the polarimetric variables are closely related to DSDs (e.g., Bringi and Chandrasekar, 2001; Bringi et al., 2023), and thus the DSD parameters could be more directly interpreted as cloud microphysical properties (e.g., Rosenfeld and Ulbrich, 2003). The distribution in Fig. 16a is mainly (38 %) distributed in the first quadrant (ΔLWC > 0 and ΔD0 > 0), whilst that in Fig. 16b is mainly (37 %) distributed in the fourth quadrant (ΔLWC > 0 and ΔD0 < 0) and is mainly concentrated in the origin. Figure 16c and d show that ΔNw is larger (smaller) than 0 when ΔD0 is smaller (larger) than 0, meaning that ΔNw is likely to be inversely proportional to ΔD0, as shown in Fig. 10. These results suggest that the first quadrant represents that accretion and coalescence processes are dominant at the heights of 2–4 km, whilst the fourth quadrant represents autoconversion (i.e., conversion from cloud drops to raindrops) and breakup processes are dominant at the heights of 0–2 km.
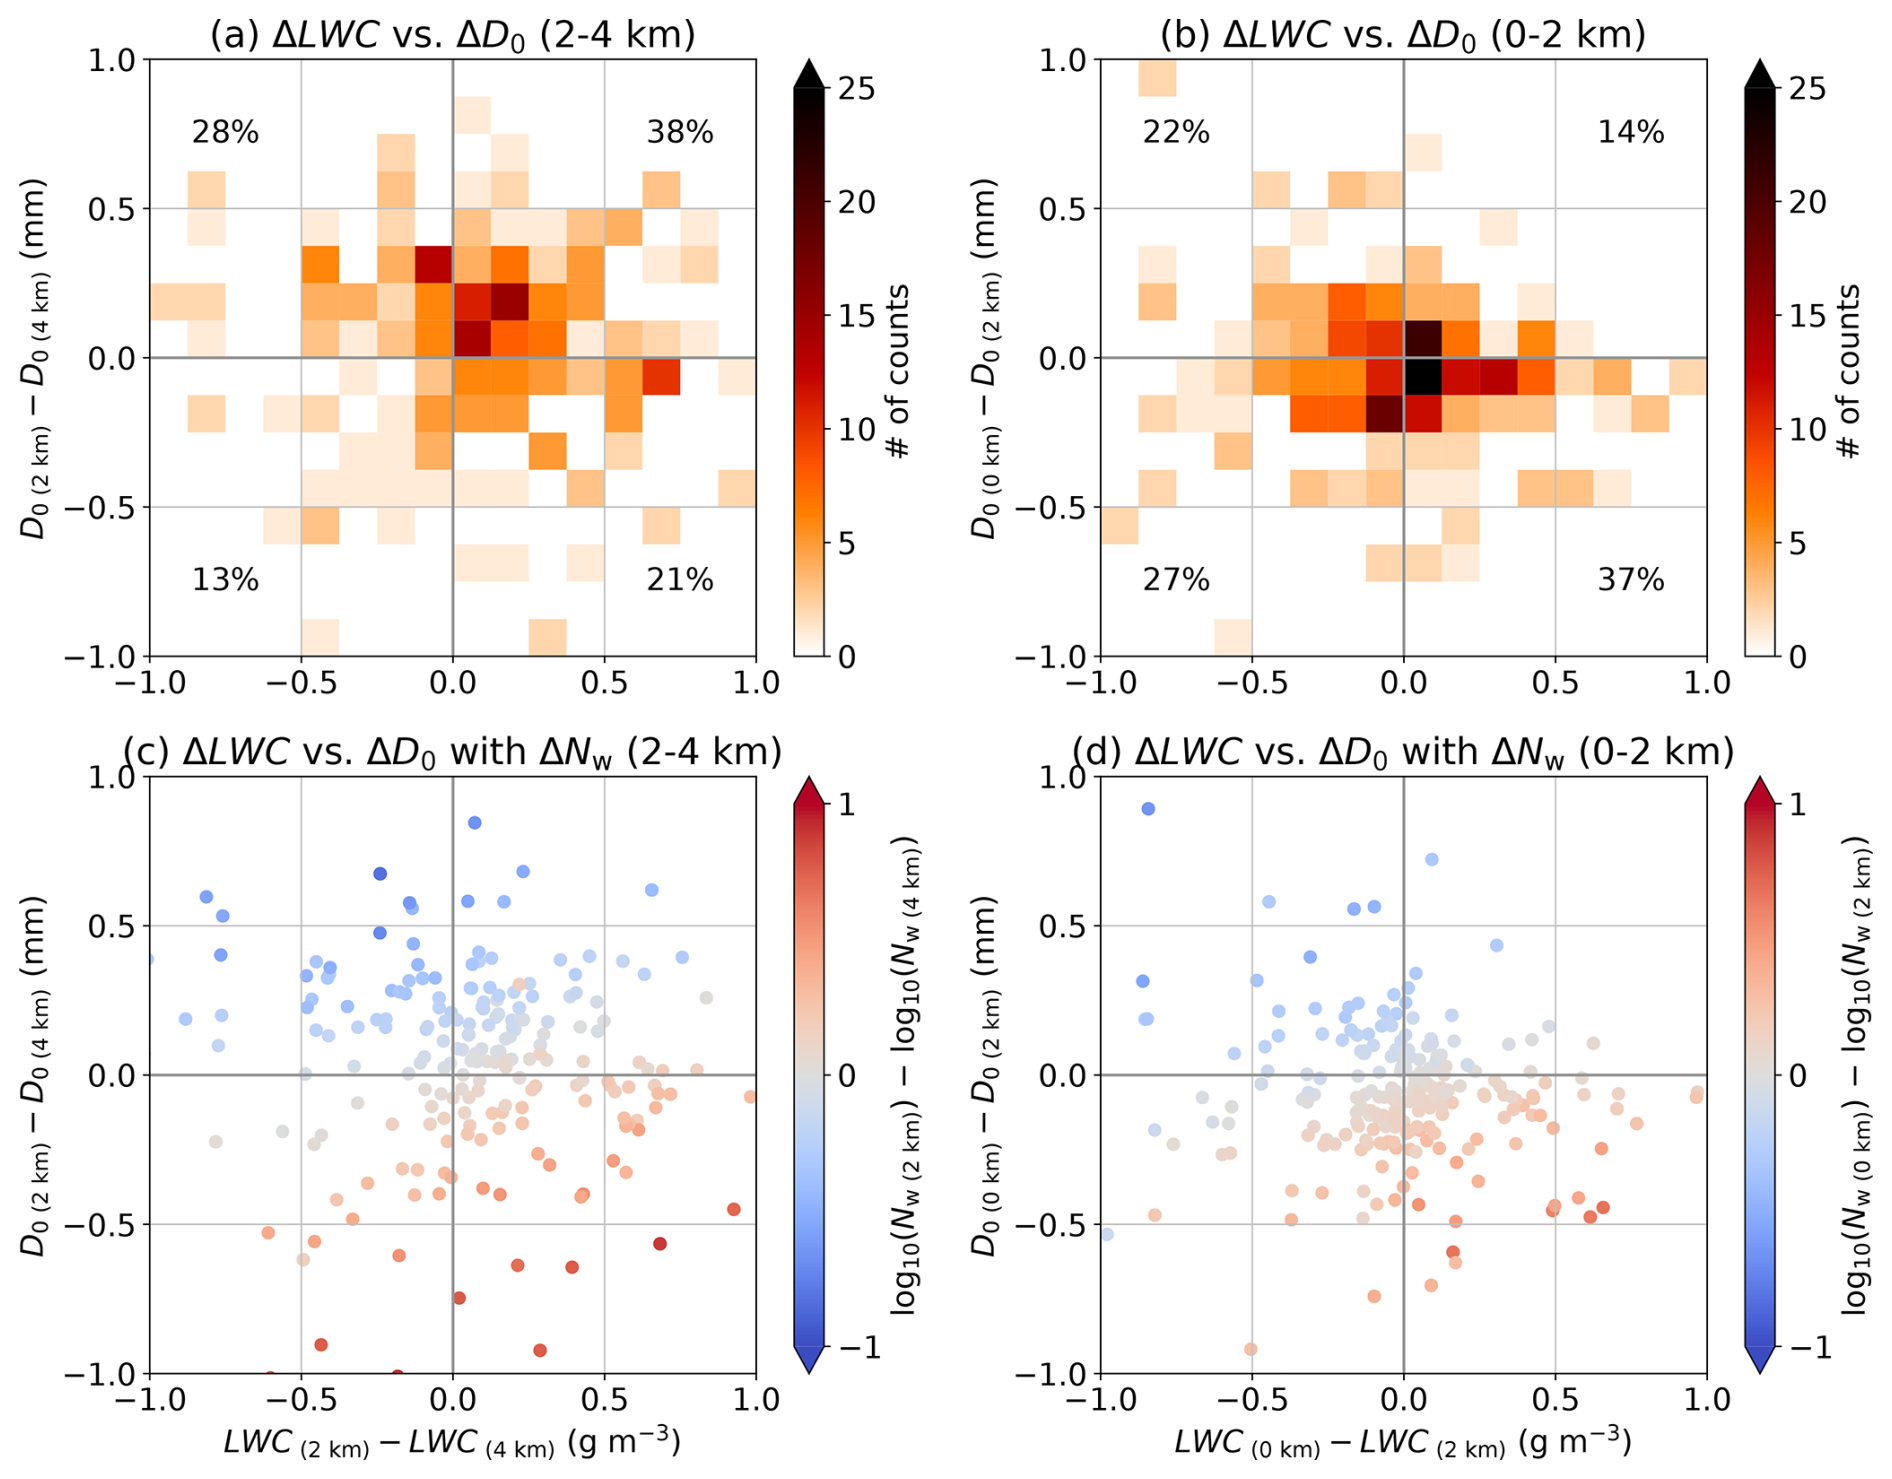
Figure 16The two dimensional histograms of the difference in the specific height of the liquid water content (ΔLWC; g m−3) and that of the median volume diameter (ΔD0; mm) (a) from 4 to 2 km heights and (b) from 2 to 0 km heights using the profiles of Fig. 10 on the maximum volume, respectively. The percentage frequency of occurrence in each quadrant is also shown. (c) and (d) are same as (a) and (b), but the scatter plot as a function of the generalised intercept parameter (ΔNw; mm−1 m−3) in log10 scale.
These characteristics can also be explained regarding vertical shear, as shown in Fig. 14. Unuma and Takemi (2016) showed that, slower-moving precipitating systems can produce stronger precipitation intensity when vertical shear is weak. As mentioned above, the processes of accretion and autoconversion are predominant in the humid environment (Fig. 16). These processes are also likely to be enhanced with the appropriate vertical circulation (Rauber et al., 1991), suggesting that moderate vertical shear causes mixing within convective clouds, thereby increasing the likelihood of interaction between cloud drops and raindrops more likely to occur as a potential microphysical process within the convective clouds that are mainly associated with heavy rainfall on the ground.
In terms of vertical velocities within the convective clouds, most of the convective clouds in this study developed under relatively weak vertical wind shear conditions (i.e., < 1.0 × 10⁻³ s−1) as shown in Fig. 14. Previous studies have examined the condition through numerical experiments involving organised convective systems under various vertical wind shear and thermodynamic environments (e.g., Takemi, 2010, 2014). The findings of this study resemble those of previous studies conducted under the weak vertical shear conditions (Takemi, 2014), suggesting that the vertical velocities within convective clouds are expected to be weak, as observed in tropical regions. From a microphysical perspective, there is a predominant higher number concentration of raindrops measuring 1–2 mm in diameter (Fig. 5), which differs from the exponential distribution often seen, rather than simply resulting in larger raindrop sizes. This scenario contrasts sharply with environmental conditions like squall lines or supercells, which experience strong vertical wind shear and, consequently, strong vertical velocities (e.g., Rotunno et al., 1988; Kumjian et al., 2014). These characteristics warrant further investigation using a numerical model that incorporates the observed relationships discussed in this study, which remains as a future work.
The findings obtained from this study examined the dominant processes occurring within the targeted convective clouds. However, the analysis of vertical distribution characteristics showed that different cloud microphysical processes take place at various heights (Fig. 10). These factors interact in complex ways, resulting in significant dispersion in the scatter plots (Figs. 12–14). This dispersion may reduce a correlation coefficient, indicating that simple linear relationships between the DSD parameters and the environmental parameters may not be sufficient for interpretation in some cases. Naka and Takemi (2025) investigated the relationships between accumulated rainfall values and environmental parameters over Japan, including the possibility of multicollinearity. They found that there is multicollinearity between the water vapour-related environmental parameters (i.e., PW and Relative humidity). Therefore, incorporating the influence of various cloud microphysical processes that can coincide within convective clouds and the effects of multicollinearity should be clarified in a future study.
This study statistically investigates DSD's characteristics within convective clouds using data from a ground-based optical disdrometer and a C-band polarimetric weather radar. Most convective clouds have a lifetime of less than 60 min, an area of less than 100 km2, and a volume of less than 1000 km3, respectively. The convective clouds are observed to move primarily eastward or north-eastward. Coalescence and accretion signals occur at 2–4 km height within the convective clouds, whilst breakup and autoconversion signals are simultaneously observed to occur at 0–2 km height. These microphysical characteristics are found to be related to environmental parameters. Specifically, larger drop sizes are associated with higher instability, whilst number concentration is linked to higher water vapour. These factors influence the precipitation intensity regarding the DSD parameters when a DSD approaches a stationary distribution. The findings of this study indicate that the DSD approaching a stationary shape can be identified even from the DSD parameters retrieved from the C-band polarimetric radar variables.
In previous studies, convective clouds were identified based on the reflectivity factor, making it challenging to comprehend the underlying microphysical processes, particularly in the context of heavy rainfall. Nevertheless, the slope parameter, one of the DSD parameters used in this study to diagnose an equilibrium distribution, allows a more direct understanding of the characteristics of heavy rainfall and the inherent microphysical processes occurring when a DSD approaches an equilibrium shape. The findings of this study are consistent with the established relationship between the DSD parameters and the environmental parameters in the previous study. Notably, the larger drop sizes tend to be observed with larger temperature lapse rates and stronger vertical wind shear. In contrast, the liquid water content is sensitive to vertical wind shear and environmental moisture. Although Japan belongs to the mid-latitude climate region, precipitation may exhibit characteristics similar to those in the tropics under humid conditions, which is expanded with the results of this study. The larger amount of rainfall, accompanied by interactions between cloud drops and raindrops, may occur under weaker vertical shear and humid environments in Japan.
As the present study is limited to the cases where the DSDs approach an equilibrium shape on the ground, it is necessary to extend the scope of analysis to investigate whether the same diagnosis can be made in the future at locations where ground-based observations are unavailable. The characteristics of a DSD and associated microphysical characteristics observed during heavy rainfall can be captured from polarimetric weather radar at a single point and in three-dimensional space. Furthermore, applying the same analysis method could expand this study to different regions and climatic zones.
The PyDSD is available on GitHub at https://github.com/josephhardinee/PyDSD/ (Hardin and Guy, 2017). The Py-ART is available on GitHub at https://github.com/ARM-DOE/pyart/ (Helmus and Collis, 2016). The ωradlib is available on GitHub at https://github.com/wradlib/wradlib/ (Heistermann et al., 2013). The tobac v1.5.3 package is available on GitHub at https://github.com/tobac-project/tobac (Sokolowsky et al., 2024). The fortran subroutine to calculate CAPE is available at https://www2.mmm.ucar.edu/people/bryan/Code/getcape.F (last access: 16 January 2025, Bryan, 2008). The data used in this study are available upon request from the corresponding author except the upper-air sounding data which is downloaded from http://weather.uwyo.edu/upperair/sounding.shtml (last access: 16 January 2025, University of Wyoming Department of Atmospheric Science, 2025).
The author has declared that there are no competing interests.
Publisher’s note: Copernicus Publications remains neutral with regard to jurisdictional claims made in the text, published maps, institutional affiliations, or any other geographical representation in this paper. While Copernicus Publications makes every effort to include appropriate place names, the final responsibility lies with the authors. Also, please note that this paper has not received English language copy-editing. Views expressed in the text are those of the authors and do not necessarily reflect the views of the publisher.
The author wishes to thank two anonymous referees, as well as the editor in charge, for their insightful comments and valuable feedback, which significantly improved the original manuscript's quality. The author would also like to especially acknowledge Hiroshi Yamauchi, Akihiro Hashimoto, Akihito Umehara, and Teruyuki Kato (Meteorological Research Institute, Japan Meteorological Agency) for fruitful discussions in the early stage of this study.
This research has been supported by the Japan Society for the Promotion of Science (grant no. JP24K17126).
This paper was edited by Thijs Heus and reviewed by two anonymous referees.
Adachi, A., Kobayashi, T., Yamauchi, H., and Onogi, S.: Detection of potentially hazardous convective clouds with a dual-polarized C-band radar, Atmos. Meas. Tech., 6, 2741–2760, https://doi.org/10.5194/amt-6-2741-2013, 2013. a
Atlas, D., Srivastava, R. C., and Sekhon, R. S.: Doppler radar characteristics of precipitation at vertical incidence, Rev. Geophys., 11, 1–35, https://doi.org/10.1029/RG011i001p00001, 1973. a
Beard, K. V., Johnson, D. B., and Baumgardner, D.: Aircraft observations of large raindrops in warm, shallow, convective clouds, Geophys. Res. Lett., 13, 991–994, https://doi.org/10.1029/GL013i010p00991, 1986. a
Bringi, V. N. and Chandrasekar, V.: Polarimetric Doppler Weather Radar: Principles and Applications, Cambridge University Press, ISBN 978-0511541094, https://doi.org/10.1017/CBO9780511541094, 2001. a
Bringi, V. N., Mishra, K. V., and Thurai, M.: Advances in Weather Radar, Vol. 2, The Institution of Engineering and Technology, ISBN 978-1839536243, https://doi.org/10.1049/SBRA557G, 2023. a
Brown, R. G. and Zhang, C.: Variability of midtropospheric moisture and its effect on cloud-top height distribution during TOGA COARE, J. Atmos. Sci., 54, 2760–2774, https://doi.org/10.1175/1520-0469(1997)054<2760:VOMMAI>2.0.CO;2, 1997. a
Bryan, G. H.: Fortran subroutine to calculate CAPE [code], https://www2.mmm.ucar.edu/people/bryan/Code/getcape.F (last access: 19 September 2025), 2008. a, b
Carpenter, A. E., Jones, T. R., Lamprecht, M. R., Clarke, C., Kang, I. H., Friman, O., Guertin, D. A., Chang, J. H., Lindquist, R. A., Moffat, J., Golland, P., and Sabatini, D. M.: CellProfiler: image analysis software for identifying and quantifying cell phenotypes, Genome Biology, 7, https://doi.org/10.1186/gb-2006-7-10-r100, 2006. a
Chandrasekar, V., Beauchamp, R. M., and Bechini, R.: Introduction to Dual Polarization Weather Radar: Fundamentals, Applications, and Networks, Cambridge University Press, ISBN 978-1108772266, https://doi.org/10.1017/9781108772266, 2023. a
Chudler, K., Rutledge, S. A., and Dolan, B.: Unique radar observations of large raindrops in tropical warm rain during PISTON, Mon. Weather Rev., 150, 2719–2736, https://doi.org/10.1175/MWR-D-21-0298.1, 2022. a, b, c
Crocker, J. C. and Grier, D. G.: Methods of digital video microscopy for colloidal studies, Journal of Colloid and Interface Science, 179, 298–310, https://doi.org/10.1006/jcis.1996.0217, 1996. a
D'Adderio, L. P., Porcù, F., and Tokay, A.: Identification and analysis of collisional breakup in natural rain, J. Atmos. Sci., 72, 3404–3416, https://doi.org/10.1175/JAS-D-14-0304.1, 2015. a, b
D'Adderio, L. P., Porcù, F., and Tokay, A.: Evolution of drop size distribution in natural rain, Atmos. Res., 200, 70–76, https://doi.org/10.1016/j.atmosres.2017.10.003, 2018. a
Davies-Jones, R.: Streamwise vorticity: The origin of updraft rotation in supercell storms, J. Atmos. Sci., 41, 2991–3006, https://doi.org/10.1175/1520-0469(1984)041<2991:SVTOOU>2.0.CO;2, 1984. a
Derbyshire, S. H., Beau, I., Bechtold, P., Grandpeix, J.-Y., Piriou, J.-M., Redelsperger, J.-L., and Soares, P. M. M.: Sensitivity of moist convection to environmental humidity, Q. J. Roy. Meteor. Soc., 130, 3055–3079, https://doi.org/10.1256/qj.03.130, 2004. a
Ding, J., Tian, W., Xiao, H., Cheng, B., Liu, L., Sha, X., Song, C., Sun, Y., and Shu, W.: Raindrop size distribution and microphysical features of the extremely severe rainstorm on 20 July 2021 in Zhengzhou, China, Atmos. Res., 289, 106739, https://doi.org/10.1016/j.atmosres.2023.106739, 2023. a, b
Dolan, B., Fuchs, B., Rutledge, S. A., Barnes, E. A., and Thompson, E. J.: Primary modes of global drop size distributions, J. Atmos. Sci., 75, 1453–1476, https://doi.org/10.1175/JAS-D-17-0242.1, 2018. a
Fabry, F., Zawadzki, I., and Cohn, S.: The influence of stratiform precipitation on shallow convective rain: A case study, Mon. Weather Rev., 121, 3312–3325, https://doi.org/10.1175/1520-0493(1993)121<3312:TIOSPO>2.0.CO;2, 1993. a
Feng, Z., Varble, A., Hardin, J., Marquis, J., Hunzinger, A., Zhang, Z., and Thieman, M.: Deep convection initiation, growth, and environments in the complex terrain of Central Argentina during CACTI, Mon. Weather Rev., 150, 1135–1155, https://doi.org/10.1175/MWR-D-21-0237.1, 2022. a
Friedrich, K., Kalina, E. A., Masters, F. J., and Lopez, C. R.: Drop-size distributions in thunderstorms measured by optical disdrometers during VORTEX2, Mon. Weather Rev., 141, 1182–1203, https://doi.org/10.1175/MWR-D-12-00116.1, 2013. a
Garcia-Garcia, F. and Gonzalez, J. E.: Raindrop spectra observations from convective showers in the valley of Mexico, Proc. 13th Int. Conf. on Clouds and Precipitation, 398–401, https://www.iamas.org/iccp/wp-content/uploads/sites/3/2021/01/13th-International-Conference-on-Clouds-and-Precipitation-Proceedings-Vol-1.pdf (last access: 19 September 2025), 2000. a, b
George, J. J.: Weather Forecasting for Aeronautics, New York and London Academic Press, https://doi.org/10.1016/C2013-0-12567-6, 1960. a
Glickman, T. S.: Glossary of Meteorology, American Meteorological Society, 2nd edn., ISBN 978-1878220349, 2000. a
Gorgucci, E. and Baldini, L.: An examination of the validity of the mean raindrop-shape model for dual-polarization radar rainfall retrievals, IEEE Trans. Geosci. Remote Sens., 47, 2752–2761, https://doi.org/10.1109/TGRS.2009.2017936, 2009. a, b
Gorgucci, E., Scarchilli, G., Chandrasekar, V., and Bringi, V. N.: Measurement of mean raindrop shape from polarimetric radar observations, J. Atmos. Sci., 57, 3406–3413, https://doi.org/10.1175/1520-0469(2000)057<3406:MOMRSF>2.0.CO;2, 2000. a, b, c
Gorgucci, E., Chandrasekar, V., and Bringi, V. N.: Drop size distribution retrieval from polarimetric radar measurements, Proc. Second European Conf. on Radar Meteorology, 134–139, https://www.copernicus.org/erad/online/erad-134.pdf (last access: 18 November 2023), 2002. a
Gossard, E. E., Strauch, R. O., and Rogers, R. R.: Evolution of dropsize distributions in liquid precipitation observed by ground-based Doppler radar, J. Atmos. Ocean. Technol., 7, 815–828, https://doi.org/10.1175/1520-0426(1990)007<0815:EODDIL>2.0.CO;2, 1990. a
Gu, J.-Y., Ryzhkov, A., Zhang, P., Neilley, P., Knight, M., Wolf, B., and Lee, D.-I.: Polarimetric attenuation correction in heavy rain at C band, J. Appl. Meteorol. Clim., 50, 39–58, https://doi.org/10.1175/2010JAMC2258.1, 2011. a
Gupta, S., Wang, D., Giangrande, S. E., Biscaro, T. S., and Jensen, M. P.: Lifecycle of updrafts and mass flux in isolated deep convection over the Amazon rainforest: insights from cell tracking, Atmos. Chem. Phys., 24, 4487–4510, https://doi.org/10.5194/acp-24-4487-2024, 2024. a
Hamada, A. and Takayabu, Y. N.: Large-scale environmental conditions related to midsummer extreme rainfall events around Japan in the TRMM region, J. Climate, 31, 6933–6945, https://doi.org/10.1175/JCLI-D-17-0632.1, 2018. a, b
Hamada, A., Takayabu, Y. N., Liu, C., and Zipser, E. J.: Weak linkage between the heaviest rainfall and tallest storms, Nature Comm., 6, https://doi.org/10.1038/ncomms7213, 2015. a
Hardin, J. and Guy, N.: PyDisdrometer v1.0, Zenodo [code], https://doi.org/10.5281/zenodo.9991, 2017. a, b
Heistermann, M., Jacobi, S., and Pfaff, T.: Technical Note: An open source library for processing weather radar data (wradlib), Hydrol. Earth Syst. Sci., 17, 863–871, https://doi.org/10.5194/hess-17-863-2013, 2013. a, b
Helmus, J. J. and Collis, S. M.: The Python ARM Radar Toolkit (Py-ART), a library for working with weather radar data in the Python programming language, J. Open Res. Softw., https://doi.org/10.5334/jors.119, 2016. a, b
Hoshino, S., Sugidachi, T., Shimizu, K., Kobayashi, E., Fujiwara, M., and Iwabuchi, M.: Comparison of GRUAN data products for Meisei iMS-100 and Vaisala RS92 radiosondes at Tateno, Japan, Atmos. Meas. Tech., 15, 5917–5948, https://doi.org/10.5194/amt-15-5917-2022, 2022. a
Hu, Z. and Srivastava, R. C.: Evolution of raindrop size distribution by coalescence, breakup, and evaporation: Theory and observations, J. Atmos. Sci., 52, 1761–1783, https://doi.org/10.1175/1520-0469(1995)052<1761:EORSDB>2.0.CO;2, 1995. a, b, c
Janapati, J., Seela, B. K., and Lin, P.-L.: Regional discrepancies in the microphysical attributes of summer season rainfall over Taiwan using GPM DPR, Sci. Rep., 13, 12118, https://doi.org/10.1038/s41598-023-38245-z, 2023. a
Johnson, R. H., Rickenbach, T. M., Rutledge, S. A., Ciesielski, P. E., and Schubert, W. H.: Trimodal characteristics of tropical convection, J. Climate, 12, 2397–2418, https://doi.org/10.1175/1520-0442(1999)012<2397:TCOTC>2.0.CO;2, 1999. a
Jones, W. K., Stengel, M., and Stier, P.: A Lagrangian perspective on the lifecycle and cloud radiative effect of deep convective clouds over Africa, Atmos. Chem. Phys., 24, 5165–5180, https://doi.org/10.5194/acp-24-5165-2024, 2024. a
Jung, C.-J. and Jou, B. J.-D.: Bulk microphysical characteristics of a heavy-rain complex thunderstorm system in the Taipei Basin, Mon. Weather Rev., 151, 877–896, https://doi.org/10.1175/MWR-D-22-0078.1, 2023. a, b, c, d
Kato, T.: Quasi-stationary band-shaped precipitation systems, named “Senjo-Kousuitai”, causing localized heavy rainfall in Japan, J. Meteorol. Soc. Japan, 98, 485–509, https://doi.org/10.2151/jmsj.2020-029, 2020. a, b
Kawabata, T., Kuroda, T., Seko, H., and Saito, K.: A cloud-resolving 4DVAR assimilation experiment for a local heavy rainfall event in the Tokyo metropolitan area, Mon. Weather Rev., 139, 1911–1931, https://doi.org/10.1175/2011MWR3428.1, 2011. a
Kessler, E.: On the Distribution and Continuity of Water Substance in Atmospheric Circulations, Meteor. Monogr., 10, 1–84, https://doi.org/10.1007/978-1-935704-36-2_1, 1969. a
Kobayashi, T. and Adachi, A.: Measurements of raindrop breakup by using UHF wind profilers, Geophys. Res. Lett., 28, 4071–4074, https://doi.org/10.1029/2001GL013254, 2001. a
Kollias, P., Albrecht, B. A., and Marks Jr., F. D.: Raindrop sorting induced by vertical drafts in convective clouds, Geophys. Res. Lett., 28, 2787–2790, https://doi.org/10.1029/2001GL013131, 2001. a
Kumjian, M. R., Khain, A. P., Benmoshe, N., Ilotoviz, E., Ryzhkov, A. V., and Phillips, V. T. J.: The anatomy and physics of ZDR columns: Investigating a polarimetric radar signature with a spectral bin microphysical model, J. Appl. Meteorol. Clim., 53, 1820–1843, https://doi.org/10.1175/JAMC-D-13-0354.1, 2014. a, b, c, d
Löffler-Mang, M. and Joss, J.: An optical disdrometer for measuring size and velocity of hydrometeors, J. Atmos. Ocean. Technol., 17, 130–139, https://doi.org/10.1175/1520-0426(2000)017<0130:AODFMS>2.0.CO;2, 2000. a
Low, T. B. and List, R.: Collision, coalescence and breakup of raindrops. Part I: Experimentally established coalescence efficiencies and fragment size distributions in breakup, J. Atmos. Sci., 39, 1591–1606, https://doi.org/10.1175/1520-0469(1982)039<1591:CCABOR>2.0.CO;2, 1982. a
McFarquhar, G. M.: A new representation of collision-induced breakup of raindrops and its implications for the shapes of raindrop size distributions, J. Atmos. Sci., 61, 777–794, https://doi.org/10.1175/1520-0469(2004)061<0777:ANROCB>2.0.CO;2, 2004. a
McFarquhar, G. M.: Raindrop Size Distribution and Evolution, in: Rainfall: State of the Science, edited by: Testik, F. Y. and Gebremichael, M., American Geophysical Union, 49–60, https://doi.org/10.1029/2010GM000971, 2010. a
McFarquhar, G. M.: Rainfall microphysics, in: Rainfall, edited by: Morbidelli, R., Elsevier, 26 pp., https://doi.org/10.1016/B978-0-12-822544-8.00009-3, 2022. a
McFarquhar, G. M. and List, R.: The evolution of three-peak raindrop size distributions in one-dimensional shaft models. Part II: Multiple pulse rain, J. Atmos. Sci., 48, 1587–1595, https://doi.org/10.1175/1520-0469(1991)048<1587:TEOTPR>2.0.CO;2, 1991. a
McFarquhar, G. M., List, R., Hudak, D. R., Nissen, R. P., Dobbie, J. S., Tung, N. P., and Kang, T. S.: Flux measurements of pulsating rain with a disdrometer and doppler radar during Phase II of the Joint Tropical Rain Experiment in Malaysia, J. Appl. Meteorol. Clim., 35, 859–874, https://doi.org/10.1175/1520-0450(1996)035<0859:FMOPRW>2.0.CO;2, 1996. a
Meng, Z., Yan, D., and Zhang, Y.: General features of squall lines in East China, Mon. Weather Rev., 141, 1629–1647, https://doi.org/10.1175/MWR-D-12-00208.1, 2013. a
Naka, N. and Takemi, T.: Classifying Moist Unstable States for the Occurrence of Precipitation During the Summer Season in Japan, Int. J. Climatol., p. e8890, https://doi.org/10.1002/joc.8890, 2025. a
Nomura, S. and Takemi, T.: Environmental stability for afternoon rain events in the Kanto plain in summer, Sci. Online Lett. Atmos., 7, 9–12, https://doi.org/10.2151/sola.2011-003, 2011. a
Okazaki, M., Oishi, S., Awata, Y., Yanase, T., and Takemi, T.: An analytical representation of raindrop size distribution in a mixed convective and stratiform precipitating system as revealed by field observations, Atmos. Sci. Lett., 24, e1155, https://doi.org/10.1002/asl.1155, 2023. a
Oue, M., Uyeda, H., and Shusse, Y.: Two types of precipitation particle distribution in convective cells accompanying a Baiu frontal rainband around Okinawa Island, Japan, J. Geophys. Res.-Atmos, 115, https://doi.org/10.1029/2009JD011957, 2010. a
Oue, M., Saleeby, S. M., Marinescu, P. J., Kollias, P., and van den Heever, S. C.: Optimizing radar scan strategies for tracking isolated deep convection using observing system simulation experiments, Atmos. Meas. Tech., 15, 4931–4950, https://doi.org/10.5194/amt-15-4931-2022, 2022. a
Radhakrishna, B. and Rao, T. N.: Statistical characteristics of multipeak raindrop size distributions at the surface and aloft in different rain regimes, Mon. Weather Rev., 137, 3501–3518, https://doi.org/10.1175/2009MWR2967.1, 2009. a, b
Rasmussen, E. N. and Blanchard, D. O.: A baseline climatology of sounding-derived supercell and tornado forecast parameters, Weather Forecast., 13, 1148–1164, https://doi.org/10.1175/1520-0434(1998)013<1148:ABCOSD>2.0.CO;2, 1998. a
Rauber, R. M., Beard, K. V., and Andrews, B. M.: A mechanism for giant raindrop formation in warm, shallow convective clouds, J. Atmos. Sci., 48, 1791–1797, https://doi.org/10.1175/1520-0469(1991)048<1791:AMFGRF>2.0.CO;2, 1991. a, b
Raut, B. A., Konwar, M., Murugavel, P., Kadge, D., Gurnule, D., Sayyed, I., Todekar, K., Malap, N., Bankar, S., and Prabhakaran, T.: Microphysical origin of raindrop size distributions during the Indian Monsoon, Geophys. Res. Lett., 48, e2021GL093581, https://doi.org/10.1029/2021GL093581, 2021. a
Rosenfeld, D. and Ulbrich, C. W.: Cloud Microphysical Properties, Processes, and Rainfall Estimation Opportunities, Meteor. Monogr., 30, 237–258, https://doi.org/10.1175/0065-9401(2003)030<0237:CMPPAR>2.0.CO;2, 2003. a
Rotunno, R., Klemp, J. B., and Weisman, M. L.: A theory for strong, long-lived squall lines, J. Atmos. Sci., 45, 463–485, https://doi.org/10.1175/1520-0469(1988)045<0463:ATFSLL>2.0.CO;2, 1988. a
Saha, P., Rakshit, G., and Maitra, A.: Dependence of rain drop size distribution parameters on atmospheric instability over a tropical location near the land-sea boundary, Radio Sci., 57, e2021RS007374, https://doi.org/10.1029/2021rs007374, 2022. a, b, c
Salby, M. L.: Transformations of moist air, in: Fundamentals of atmospheric physics, vol. 61 of International Geophysics, Academic Press, 117–142, https://doi.org/10.1016/S0074-6142(96)80042-8, 1996. a
Schumacher, R. S. and Johnson, R. H.: Mesoscale processes contributing to extreme rainfall in a midlatitude warm-season flash flood, Mon. Weather Rev., 136, 3964–3986, https://doi.org/10.1175/2008MWR2471.1, 2008. a
Seino, N., Oda, R., Sugawara, H., and Aoyagi, T.: Observations and simulations of the mesoscale environment in TOMACS urban heavy rain events, J. Meteorol. Soc. Japan, 96A, 221–245, https://doi.org/10.2151/jmsj.2018-029, 2018. a
Seliga, T. A. and Bringi, V. N.: Potential use of radar differential reflectivity measurements at orthogonal polarizations for measuring precipitation, J. Appl. Meteorol. Clim., 15, 69–76, https://doi.org/10.1175/1520-0450(1976)015<0069:PUORDR>2.0.CO;2, 1976. a
Sheppard, B. E.: Effect of irregularities in the diameter classification of raindrops by the Joss-Waldvogel disdrometer, J. Atmos. Ocean. Technol., 7, 180–183, https://doi.org/10.1175/1520-0426(1990)007<0180:EOIITD>2.0.CO;2, 1990. a
Sokolowsky, G. A., Freeman, S. W., Jones, W. K., Kukulies, J., Senf, F., Marinescu, P. J., Heikenfeld, M., Brunner, K. N., Bruning, E. C., Collis, S. M., Jackson, R. C., Leung, G. R., Pfeifer, N., Raut, B. A., Saleeby, S. M., Stier, P., and van den Heever, S. C.: tobac v1.5: introducing fast 3D tracking, splits and mergers, and other enhancements for identifying and analysing meteorological phenomena, Geosci. Model Dev., 17, 5309–5330, https://doi.org/10.5194/gmd-17-5309-2024, 2024. a, b
Straub, W., Beheng, K. D., Seifert, A., Schlottke, J., and Weigand, B.: Numerical investigation of collision-induced breakup of raindrops. Part II: Parameterizations of coalescence efficiencies and fragment size distributions, J. Atmos. Sci., 67, 576–588, https://doi.org/10.1175/2009JAS3175.1, 2010. a
Takemi, T.: A sensitivity of squall-line intensity to environmental static stability under various shear and moisture conditions, Atmos. Res., 84, 374–389, https://doi.org/10.1016/j.atmosres.2006.10.001, 2007a. a
Takemi, T.: Environmental stability control of the intensity of squall lines under low-level shear conditions, J. Geophys. Res.-Atmos, 112, https://doi.org/10.1029/2007JD008793, 2007b. a
Takemi, T.: Dependence of the precipitation intensity in mesoscale convective systems to temperature lapse rate, Atmos. Res., 96, 273–285, https://doi.org/10.1016/j.atmosres.2009.09.002, 2010. a, b
Takemi, T.: Convection and precipitation under various stability and shear conditions: Squall lines in tropical versus midlatitude environment, Atmos. Res., 142, 111–123, https://doi.org/10.1016/j.atmosres.2013.07.010, 2014. a, b, c
Takemi, T.: Relationship between cumulus activity and environmental moisture during the CINDY2011/DYNAMO field experiment as revealed from convection-resolving simulations, J. Meteorol. Soc. Japan, 93A, 41–58, https://doi.org/10.2151/jmsj.2015-035, 2015. a
Takemi, T., Hirayama, O., and Liu, C.: Factors responsible for the vertical development of tropical oceanic cumulus convection, Geophys. Res. Lett., 31, https://doi.org/10.1029/2004GL020225, 2004. a
Testik, F. Y.: Outcome regimes of binary raindrop collisions, Atmos. Res., 94, 389–399, https://doi.org/10.1016/j.atmosres.2009.06.017, 2009. a
Testik, F. Y. and Barros, A. P.: Toward elucidating the microstructure of warm rainfall: A survey, Rev. Geophys., 45, https://doi.org/10.1029/2005RG000182, 2007. a
Testud, J., Bouar, E. L., Obligis, E., and Ali-Mehenni, M.: The rain profiling algorithm applied to polarimetric weather radar, J. Atmos. Ocean. Technol., 17, 332–356, https://doi.org/10.1175/1520-0426(2000)017<0332:TRPAAT>2.0.CO;2, 2000. a
Testud, J., Oury, S., Black, R. A., Amayenc, P., and Dou, X.: The concept of “Normalized” distribution to describe raindrop spectra: A tool for cloud physics and cloud remote sensing, J. Appl. Meteorol., 40, 1118–1140, https://doi.org/10.1175/1520-0450(2001)040<1118:TCONDT>2.0.CO;2, 2001. a
Thurai, M., Hudak, D., and Bringi, V. N.: On the possible use of copolar correlation coefficient for improving the drop size distribution estimates at C band, J. Atmos. Ocean. Technol., 25, 1873–1880, https://doi.org/10.1175/2008JTECHA1077.1, 2008. a
Tokay, A., Petersen, W. A., Gatlin, P., and Wingo, M.: Comparison of raindrop size distribution measurements by collocated disdrometers, J. Atmos. Ocean. Technol., 30, 1672–1690, https://doi.org/10.1175/JTECH-D-12-00163.1, 2013. a
Unuma, T.: Three-dimensional structure of an equilibrium drop size distribution within a convective system in Japan, Sci. Online Lett. Atmos., 20, 47–54, https://doi.org/10.2151/sola.2024-007, 2024. a, b, c, d, e, f
Unuma, T. and Takemi, T.: Characteristics and environmental conditions of quasi-stationary convective clusters during the warm season in Japan, Q. J. Roy. Meteor. Soc., 142, 1232–1249, https://doi.org/10.1002/qj.2726, 2016. a, b, c, d, e, f, g, h, i, j, k
Unuma, T. and Takemi, T.: Rainfall characteristics and their environmental conditions during the heavy rainfall events over Japan in July of 2017 and 2018, J. Meteorol. Soc. Japan, 99, 165–180, https://doi.org/10.2151/jmsj.2021-009, 2021. a
Unuma, T., Yamauchi, H., Umehara, A., and Kato, T.: An equilibrium raindrop size distribution associated with a heavy-rain-producing convective system in Japan, Sci. Online Lett. Atmos., 19, 150–156, https://doi.org/10.2151/sola.2023-020, 2023. a, b, c, d
Unuma, T., Yamauchi, H., Kato, T., Umehara, A., Hashimoto, A., Adachi, A., and Nagumo, N.: Characteristics of raindrop size distribution using 10-year disdrometer data in eastern Japan, J. Meteorol. Soc. Japan, 103, 219–232, https://doi.org/10.2151/jmsj.2025-011, 2025. a, b, c, d, e
van der Walt, S., Schönberger, J. L., Nunez-Iglesias, J., Boulogne, F., Warner, J. D., Yager, N., Gouillart, E., Yu, T., and the scikit-image contributors: scikit-image: image processing in Python, PeerJ, 2, e453, https://doi.org/10.7717/peerj.453, 2014. a
Waite, M. L. and Khouider, B.: The deepening of tropical convection by congestus preconditioning, J. Atmos. Sci., 67, 2601–2615, https://doi.org/10.1175/2010JAS3357.1, 2010. a
Wakasugi, K., Mizutani, A., Matsuo, M., Fukao, S., and Kato, S.: A direct method for deriving drop-size distribution and vertical air velocities from VHF Doppler radar spectra, J. Atmos. Ocean. Technol., 3, 623–629, https://doi.org/10.1175/1520-0426(1986)003<0623:ADMFDD>2.0.CO;2, 1986. a, b
Wang, M., Zhao, K., Lee, W.-C., and Zhang, F.: Microphysical and kinematic structure of convective-scale elements in the inner rainband of Typhoon Matmo (2014) after landfall, J. Geopys. Res.-Atmos., 123, 6549–6564, https://doi.org/10.1029/2018JD028578, 2018. a, b
Willis, P. T. and Tattelman, P.: Drop-size distributions associated with intense rainfall, J. Appl. Meteorol. Clim., 28, 3–15, https://doi.org/10.1175/1520-0450(1989)028<0003:DSDAWI>2.0.CO;2, 1989. a, b
Zawadzki, I., Fabry, F., and Szyrmer, W.: Observations of supercooled water and secondary ice generation by a vertically pointing X-band Doppler radar, Atmos. Res., 59-60, 343–359, https://doi.org/10.1016/S0169-8095(01)00124-7, 2001. a
Zhang, G., Vivekanandan, J., and Brandes, E.: A method for estimating rain rate and drop size distribution from polarimetric radar measurements, IEEE Trans. Geosci. Remote Sens., 39, 830–841, https://doi.org/10.1109/36.917906, 2001. a
Zhang, G., Xue, M., Cao, Q., and Dawson, D.: Diagnosing the intercept parameter for exponential raindrop size distribution based on video disdrometer observations: Model development, J. Appl. Meteorol. Clim., 47, 2983–2992, https://doi.org/10.1175/2008JAMC1876.1, 2008. a
Zheng, H., Zhang, Y., Zhang, L., Lei, H., and Wu, Z.: Precipitation microphysical processes in the inner rainband of tropical cyclone Kajiki (2019) over the South China Sea revealed by polarimetric radar, Adv. Atmos. Sci., 38, 65–80, https://doi.org/10.1007/s00376-020-0179-3, 2021. a