the Creative Commons Attribution 4.0 License.
the Creative Commons Attribution 4.0 License.
 | 03 Sep 2024
Measurement report: Characteristics of airborne black-carbon-containing particles during the 2021 summer COVID-19 lockdown in a typical Yangtze River Delta city, China
Yuan Dai
Junfeng Wang
Houjun Wang
Shijie Cui
Yunjiang Zhang
Haiwei Li
Yun Wu
Ming Wang
Eleonora Aruffo
Black-carbon-containing (BCc) particles are ubiquitous in ambient air, significantly contributing to particulate matter (PM) pollution. The unexpected outbreak of the COVID-19 pandemic in the summer of 2021 prompted a localized and prolonged lockdown in Yangzhou, situated in the Yangtze River Delta, China. This lockdown led to significant alteration of local anthropogenic emissions, while neighboring cities continued regular operations, providing a unique opportunity for the investigation of BCc particle characteristics influenced by varying emission conditions. Single-particle aerosol mass spectrometer (SPA-MS) analysis revealed a notable decrease in the proportion of freshly emitted BCc particles during the lockdown (LD) period. However, PM2.5 concentrations remained relatively unchanged, with an observed increase in the proportion of aged BCc particles during LD compared to the period before the lockdown (BLD). The study also underscores the significant role of regional transport in PM2.5 pollution during the campaign. Moreover, reactive trace gases (e.g., NOx, SO2, and volatile organic compounds – VOCs) could form thick coatings on pre-existing particles, likely via enhanced heterogeneous hydrolysis under high relative humidity (RH), resulting in significant BCc particle growth (∼ 600 nm), as well as PM2.5 concentration, during LD. Our study highlights that short-term, strict local emission controls may not effectively reduce PM pollution due to the complex production and transmission characteristics of BCc particles and the nonlinear responses of PM2.5 to its precursors. Achieving further effective PM2.5 reduction mandates a focus on nuanced control of BCc particles and necessitates a comprehensive and extensive approach with a regionally coordinated and balanced control strategy through joint regulation.
- Article
(6196 KB) - Full-text XML
-
Supplement
(3527 KB) - BibTeX
- EndNote


China has implemented long-term clean air measures to cut down anthropogenic emissions and improve air quality (Ge et al., 2021), resulting in a nationwide reduction of the average fine particulate matter (PM2.5, aerodynamic diameter ≤ 2.5 µm) level from 50 µg m−3 in 2015 to 30 µg m−3 in 2020 (Zhou et al., 2022). However, this PM2.5 concentration remains significantly higher than the new World Health Organization (WHO) guideline value of 5 µg m−3 (WHO, 2021; WHO Global Air Quality Guidelines). Black carbon (BC) is a ubiquitous component of aerosols, typically constituting a small proportion (5 %–10 %) of PM2.5 in the atmosphere (L. Chen et al., 2020b). However, freshly emitted BC evolves into BC-containing (BCc) particles by undergoing atmospheric aging, contributing to a rise in the total mass of PM2.5 through processes of coating or embedding by other materials (Bond and Bergstrom, 2006; Peng et al., 2016). The number and mass fraction of BCc particles can exceed 60 % and 50 % of PM2.5, respectively, emphasizing the significant role of BC in elevating the mass concentration of particulate matter (PM) (Sun et al., 2022a; Xie et al., 2020; L. Chen et al., 2020).
The atmospheric aging of BCc particles involves intricate chemical and physical transformations that influence their mixing state, morphology, hygroscopicity, and optical properties, all of which have profound implications for climate and human health (Bond et al., 2013; Ramanathan and Carmichael, 2008). For example, freshly emitted BC particles are initially hydrophobic but possess a porous surface structure that facilitates internal or external mixing with co-emitted primary organic–inorganic and secondary materials that are associated with BC (Cheng et al., 2012; J. Li et al., 2020). On the other hand, BCc particles undergo continual aging processes, including the condensation of low-volatility vapors (Li et al., 2022), coagulation with pre-existing aerosols (Kondo et al., 2011), and heterogeneous oxidation by gaseous pollutants (Zhang et al., 2024). This alteration may affect the coating thickness, morphology, size distribution, and hygroscopicity of BCc particles, thereby impacting their climate forcing as well as atmospheric lifetime (Luo et al., 2022; Taylor et al., 2014). High loading of atmospheric BCc particles could also depress the development of the planetary boundary layer and exacerbate PM pollution episodes (Huang et al., 2018). BCc particle characteristics are influenced by various combustion sources and emission conditions, including local industrial burning, vehicle exhausts, residential coal burning, and biomass burning (L. Li et al., 2020; Sedlacek et al., 2022; Zhang et al., 2018), as well as long-range transport from other regions (Adachi et al., 2014; J. Zhang et al., 2021). Those diverse conditions complicate the development of parameterizations of BCc particle properties as well as the understanding of complex emission sources, aging processes, and physical properties of BCc particles, hampering the effectiveness of air quality remediation (Cappa et al., 2019; Kahnert, 2010; Sun et al., 2022b).
Studies on the effects of large-scale and short-term stringent emission control events on air quality in China have been widely deployed, e.g., the 2008 Beijing Olympic Games (Wang et al., 2010; Zhou et al., 2010), the 2015 Asia-Pacific Economic Cooperation (APEC) (Tang et al., 2015), the 2014 Nanjing Youth Olympic Games (Wang et al., 2022), and the national COVID-19 lockdown in 2020 winter (Huang et al., 2021; Le et al., 2020; L. Li et al., 2020; Wang et al., 2020). Previous studies extensively investigated air pollutant variations during the COVID-19 lockdown in the winter of 2020 across different regions of the world. Stringent restrictions on industrial and vehicular activities resulted in significant reductions in gaseous pollutants and particulate matter, not only in megacities (H. Chen et al., 2020; Jeong et al., 2022; Sun et al., 2020) but also in middle-sized cities (Clemente et al., 2022; H. Wang et al., 2021; Xu et al., 2020) and rural areas (Cui et al., 2021, 2020; Jain et al., 2021). Compared to the decreasing trends observed in most cities worldwide, the level of PM2.5 in Shanghai (Chang et al., 2020), Hohhot (Zhou et al., 2022), and the northeastern North China Plain (Nie et al., 2021) increased unexpectedly. These observations reveal the complex aerosol chemistry of PM2.5 comprising primary and secondary components. The reduction of primary pollutants during lockdown resulted in a shift towards a higher proportion of secondary aerosols, including inorganic and organic species, exhibiting a nonlinear response to emission changes (Y. Zhang et al., 2021). Furthermore, some studies suggested that the increase in secondary aerosols during lockdown was due to enhanced atmospheric oxidative capacity resulting from the rise in ozone levels (Wang et al., 2021), unfavorable meteorological conditions (Chien et al., 2022; Sulaymon et al., 2021a), and changes in local and regional emission sources (Feng et al., 2022). However, most previous studies focused on lockdown events during the cold seasons, and studies on summer lockdown events in China were very limited.
Yangzhou is located in the central region of the Yangtze River Delta (YRD), at the junction of the Yangtze River and the Beijing–Hangzhou Grand Canal, which serves as a prominent economic city, industrially intensive area, and highly active inland shipping node in eastern China. Due to complex emissions and feedback with the East Asian monsoons (Ding et al., 2019), this region is susceptible to anthropogenic aerosols, especially BCc particles originating from the chemical industry, steelmaking, coal-fired power plants, petrochemical enterprises, and transportation. Extensive studies have investigated the responses of atmospheric pollutants to emission changes during the COVID-19 lockdown measures in the YRD (Chen et al., 2021; L. Li et al., 2020; Qin et al., 2021; K. Zhang et al., 2022). However, the key chemical and physical processes specifically responsible for the BCc particles in this region are still unclear. During the summer of 2021, Yangzhou experienced a resurgence of COVID-19 with over 500 confirmed cases. In response, stringent public health measures were imposed from 29 July to 10 September, including the closure of public transport and suspension of non-essential industrial plants, restaurants, shopping malls, and entertainment clubs. People were also mandated to quarantine at home. Consequently, Yangzhou experienced a significant decline in transportation and industrial energy consumption, dropping by nearly 46 % and 25 %, respectively, compared to the same period in 2020 (https://www.yangzhou.gov.cn/, last access: 20 August 2024), implying a substantial reduction in human activity and primary emissions. Unlike the nationwide COVID-19 lockdown in China during the cold season of 2020 (Le et al., 2020; Sulaymon et al., 2021b), the summer lockdown in Yangzhou was more localized but protracted, significantly altering local anthropogenic emissions while neighboring cities maintained regular operations, which provides a unique opportunity to explore and compare the diverse mixing states and the aging process of BCc particles in different anthropogenic emission conditions in summer. Here we report the chemical compositions and aging characteristics of airborne BCc particles in the YRD. Our investigation involved a combination of ground measurements, spaceborne observations, and mass spectrometric analysis conducted during the COVID-19 lockdown in the summer of 2021 in Yangzhou. Additionally, we employed potential source contribution function (PSCF) analysis to investigate the air pollution patterns in the YRD.
2.1 Sampling site and instruments
The in situ online measurements were conducted at a rooftop laboratory 20 m above ground located in a national air quality monitoring station, Yangzhou Environmental Monitoring Center (32.41° N, 119.40° E), Yangzhou, China (Fig. 1). This sampling site is a typical urban site surrounded by residential areas, arterial roads, parks, restaurants, and shopping centers. In this study, the measurement period was divided into three phases: before the lockdown period (BLD: 30 June to 28 July 2021), the lockdown period (LD: 29 July to 9 September 2021), and after the lockdown period (ALD: 10 September to 7 October 2021) (Fig. 2).
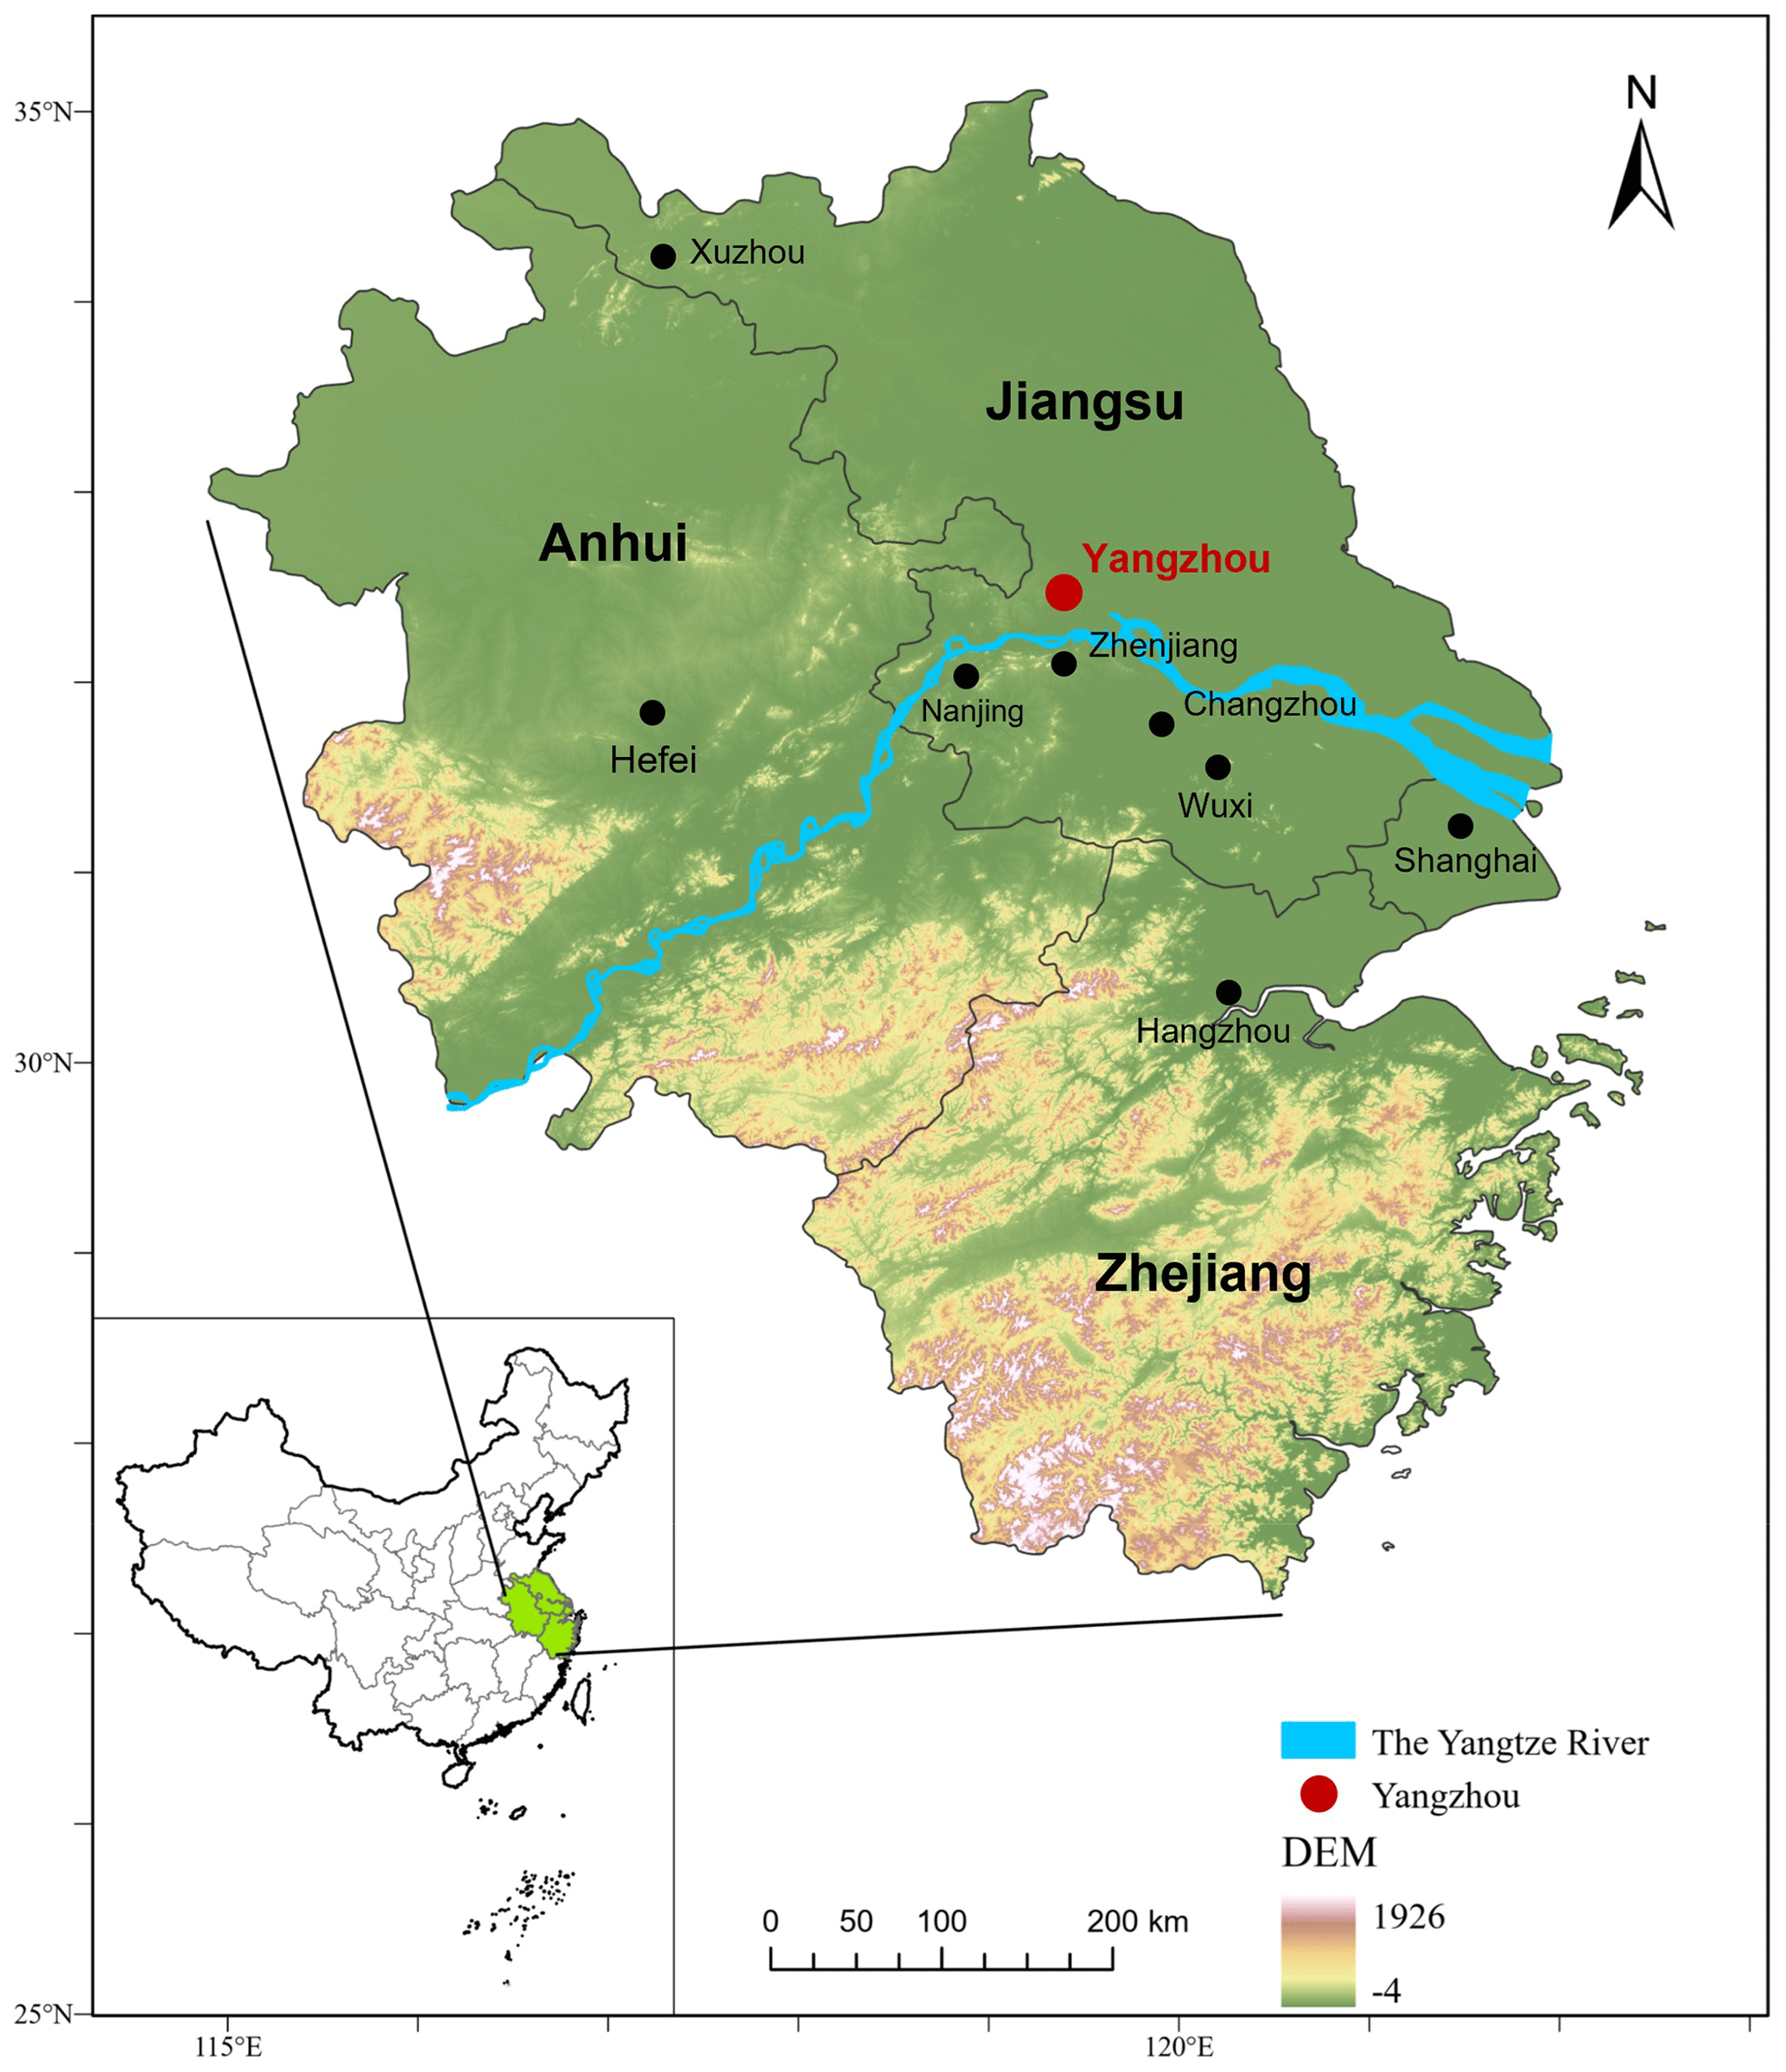
Figure 1Geographical overview of the Yangtze River Delta (YRD) region in China, depicting the major cities within the YRD and the sampling site located in Yangzhou. The color gradient from green to white indicates varying altitudes across the region (maps were generated using ArcGIS Pro).
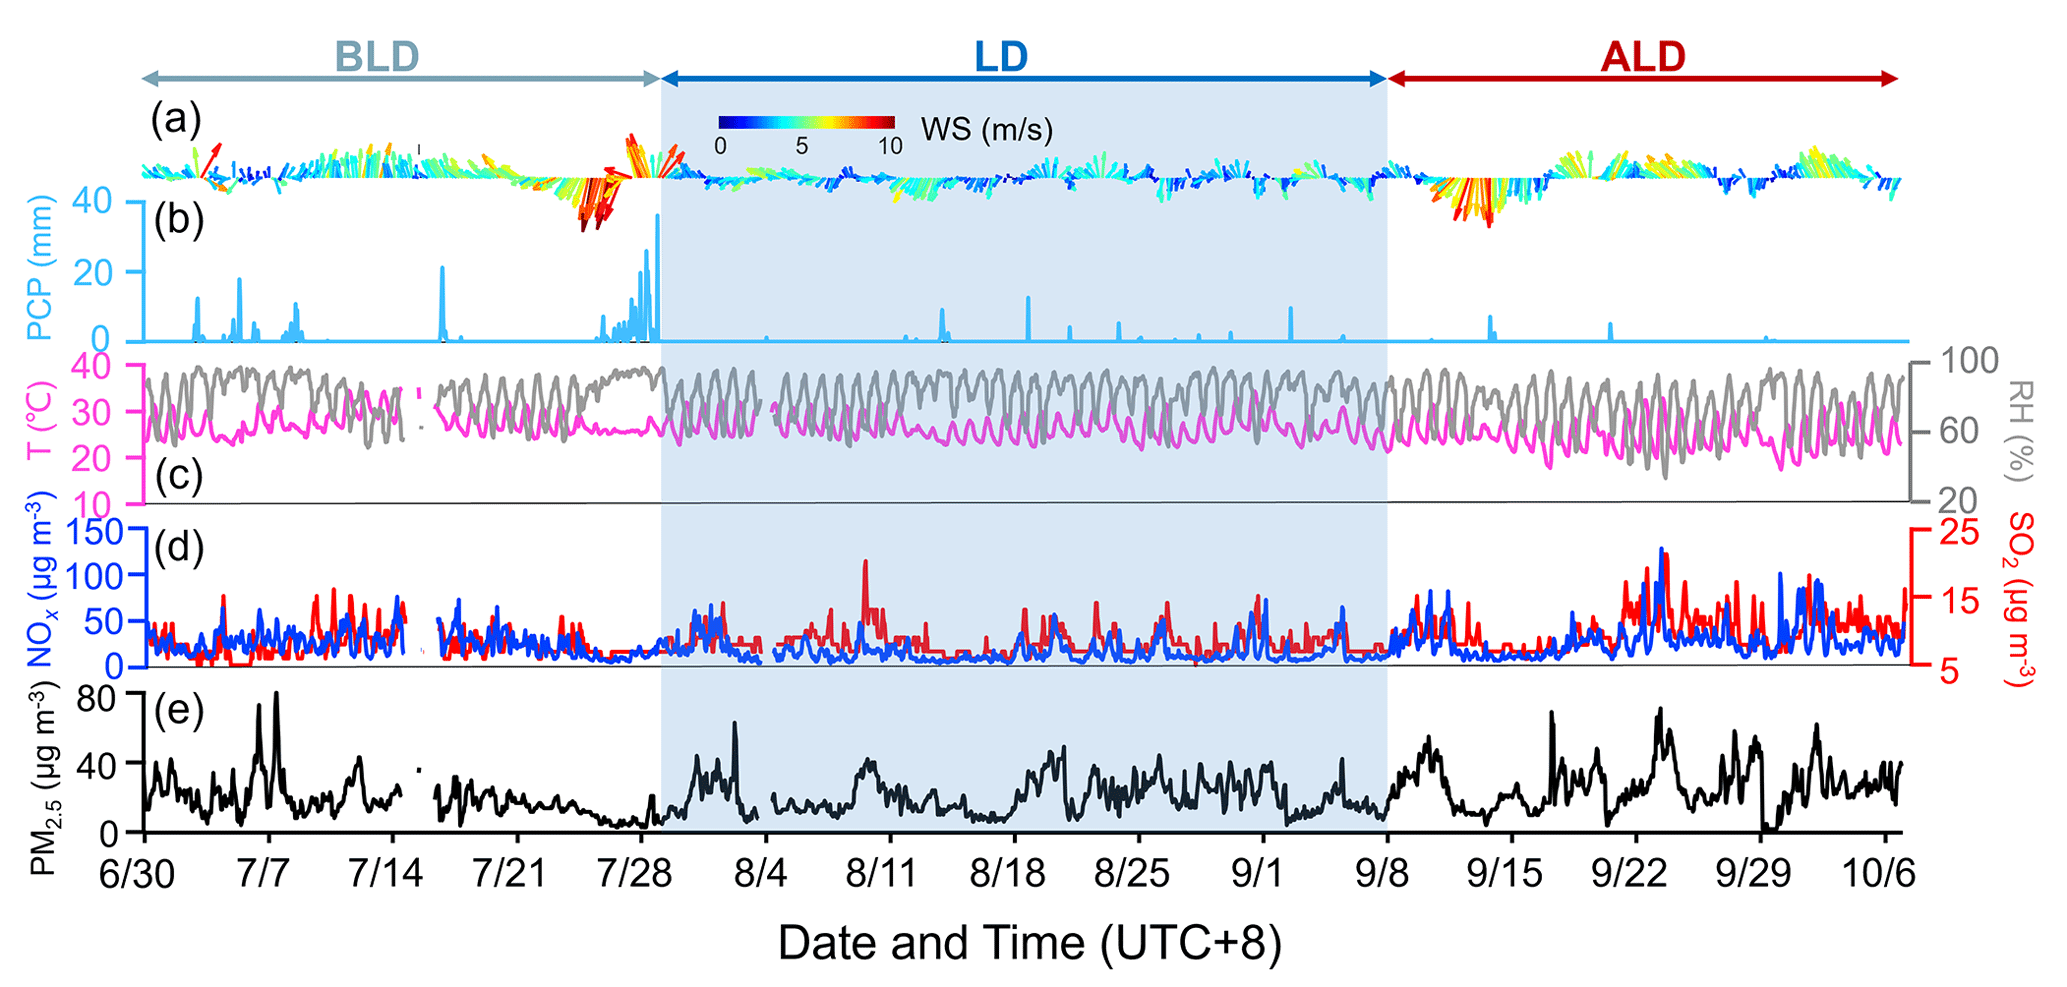
Figure 2Temporal variations of (a) wind direction (WD) and wind speed (WS), (b) precipitation (PCP), (c) temperature (T) and relative humidity (RH), (d) concentrations of NOx and SO2, and (e) mass loading of PM2.5. The gray, blue, and red arrow ranges denote the periods before lockdown (BLD), during lockdown (LD), and after lockdown (ALD).
A single-particle aerosol mass spectrometer (SPA-MS, Hexin Analytical Instrument Co., Ltd., China) was deployed during the field campaign to obtain the chemical composition, size distribution, and mixing state of individual PM2.5 particles. A cyclone with a 2.5 µm cut point (model URG-2000-30ED) and a Nafion dryer are equipped in front of the sampling inlet. Individual particles are introduced into the SPA-MS through a critical orifice at a flow rate of 3 L min−1. The vacuum aerodynamic diameters (Dva) are determined using the velocities derived from two continuous laser beams (diode Nd:YAG, 532 nm) spaced 6 cm apart. Subsequently, these particles are desorbed and ionized by a downstream pulsed laser (266 nm), and ion fragments are generated and measured by a Z-shaped bipolar time-of-flight mass spectrometer. A more detailed description of SPA-MS can be found in previous studies (Li et al., 2011).
PM2.5 mass concentration was measured by a particulate matter monitor (XHPM2000E, Xianhe, China). Nitrogen oxide (), SO2, and ozone (O3) concentrations were detected with a set of Thermo Fisher Scientific instruments (models 42i, 43i, and 49i). The concentrations of 103 volatile organic compounds (VOCs) in ambient air, comprising 57 ozone precursors (PAMS), 12 aldehydes and ketones, and 34 toxic organics (TO15), were continuously monitored at hourly intervals using an online device (TH-300B, Tianhong, China). Meteorological parameters, including ambient temperature (T), relative humidity (RH), wind direction (WD), and wind speed (WS), were observed synchronously using an automatic weather instrument (WXT530, Vaisala, Finland). Precipitation (PCP) data were obtained from the Yangzhou Meteorological Bureau. All online data presented in this paper were hourly-averaged at local time (Beijing time, UTC+8).
2.2 Data analysis
2.2.1 Satellite product
In this study, we utilized the Copernicus Atmosphere Monitoring Service (CAMS) Global Near-Real-Time dataset (available at https://developers.google.com/earth-engine/datasets/catalog/ECMWF_CAMS_NRT, last access: 20 August 2024), acquired from the European Centre for Medium-Range Weather Forecasts (ECMWF), to analyze the distribution of total surface column concentrations of NO2, SO2, and surface PM2.5 mass. CAMS offers the capacity to continuously monitor the composition of the Earth's atmosphere at global and regional scales since 2016, with a spatial resolution of 44 528 m (Benedetti et al., 2009; Morcrette et al., 2009). The details of the bands of the dataset used in this study are shown in Table S2 in the Supplement. We calculated and plotted the averaged two-dimensional data from the ECMWF, CAMS, and NRT for NO2, SO2, and PM2.5 during BLD and LD over the region of interest (17.93–54.74° N, 71.21–142.23° E) using Google Earth Engine (Gorelick et al., 2017). The integration of remote sensing measurements has provided a more comprehensive understanding of the sources and distributions of particle matter and gaseous pollutants, facilitating the evaluation of the impact of human activities on air quality.
2.2.2 Geographic source analysis
The potential source contribution function (PSCF) analysis, based on the Hybrid Single-Particle Lagrangian Integrated Trajectory (HYSPLIT) model, can be employed to identify regional sources of air pollutants. Before conducting the PSCF analysis, 36 h of air mass backward trajectories with 1 h resolution at 500 m above ground level were calculated using wind data from the Global Data Assimilation System (GDAS) provided by the National Oceanic and Atmospheric Administration (NOAA) (Wang et al., 2009). The open-source software MeteoInfo (Wang, 2014) was utilized for the PSCF analysis. The whole study area (110.1–133.4° E and 21.3–39.9° N) covered by the trajectories was divided into thousands of cells with a spatial resolution of 0.1°×0.1°. The PSCF was simulated according to the following equation:
where PSCFij is the conditional probability that the grid cell (i,j) was a source of the species found in high concentration (Hopke et al., 1993), nij is the number of all trajectories passing through this grid cell, and mij is the number of trajectories. In this study, the pollution criterion values for different BCc particle types were set as the 75th percentile of hourly average number fractions, respectively. To further improve the accuracy of the PSCF analysis and minimize analytical uncertainties, the weighted PSCF (WPSCF) functions as shown in Eqs. (2)–(3) were applied (Polissar et al., 1999). The weight (Wij) for each grid cell was determined based on the number of trajectory end points (nij) as follows.
Here, nave is the average number of trajectory end points of each grid.
2.2.3 SPA-MS data analysis
In total, 1 649 574 particles were analyzed during the entire observation period. The size and chemical composition of single particles were analyzed using the Computational Continuation Core (COCO V1.4) toolkit in MATLAB 2022 (The MathWorks, Inc.). Our focus was on BCc particles, which were identified based on the relative peak area (RPA) of carbon ion clusters (, n = 1, 2, 3, …), with a threshold of 0.05 (Y. Zhang et al., 2021). An adaptive-resonance-theory-based neural network algorithm (ART-2a) was applied to classify the measured individual particles based on the presence and intensity of ion peaks, with a vigilance factor of 0.75, a learning rate of 0.05, and 20 iterations (Song et al., 1999).
3.1 Field observations
Figure 2 presents the temporal variations of meteorological parameters as well as PM2.5, NOx, and SO2 concentrations. Notably, significant reductions in PM2.5, NOx, and SO2 were observed at the end of BLD due to a high-precipitation event, with peak hourly precipitation reaching 37 mm, and the data collected during this event were excluded from the analysis. During BLD, the mean temperature (T) was 28 ± 3 °C and the total precipitation was 221 mm, with an average relative humidity (RH) of 83 ± 12 %. The prevailing winds originated from the south and southeast, with a mean wind speed (WS) of 3.3 ± 1.2 m s−1. In comparison, LD shows a decline in temperature to 27 ± 2 °C and WS to 2.3 ± 1.0 m s−1 but an increase in RH to 87 ± 11 % and a reduction in total precipitation to 86 mm. Figure S2b and c in the Supplement present uniform distributions of RH and boundary layer height (BLH) across the YRD during LD. These regional meteorological conditions and the effective removal of the pollutants accumulated at the end of BLD facilitated the investigation of BCc particle regional transport in the YRD. During ALD, the temperature declined further to 25 ± 3 °C, WS increased to 3.3 ± 1.5 m s−1, and total precipitation dropped to 27 mm with a lower RH of 77 ± 14 %.
During LD, strict measures resulted in notably lower surface concentrations, NOx (16.8 µg m−3), and total volatile organic compounds (TVOCs) (55.9 µg m−3) compared to BLD and ALD. Conversely, the surface O3 concentration showed an increase of 18.4 µg m−3 (28 %) during LD relative to BLD. The reduction of fresh NO emissions alleviating O3 titration (Steinfeld, 1998) could be an explanation. Analysis from Fig. S3 indicates that the O3 level is higher than those of neighboring cities in the YRD, suggesting higher local atmospheric oxidation capacity during LD. However, the average concentrations of PM2.5 (20.6 vs. 20.3 µg m−3), SO2 (9.1 vs. 9.2 µg m−3), and CO (0.61 vs. 0.62 mg m−3) were comparable during both BLD and LD (Fig. 3). After LD, social activities gradually resumed in Yangzhou, leading to an apparent increase in all observed pollutants during the ALD period. For instance, there were relative increases of 66 % for NOx, 19 % for SO2, 36 % for TVOCs, 14 % for O3, 32 % for PM2.5, and 16 % for CO from LD to ALD, respectively (Fig. 3).
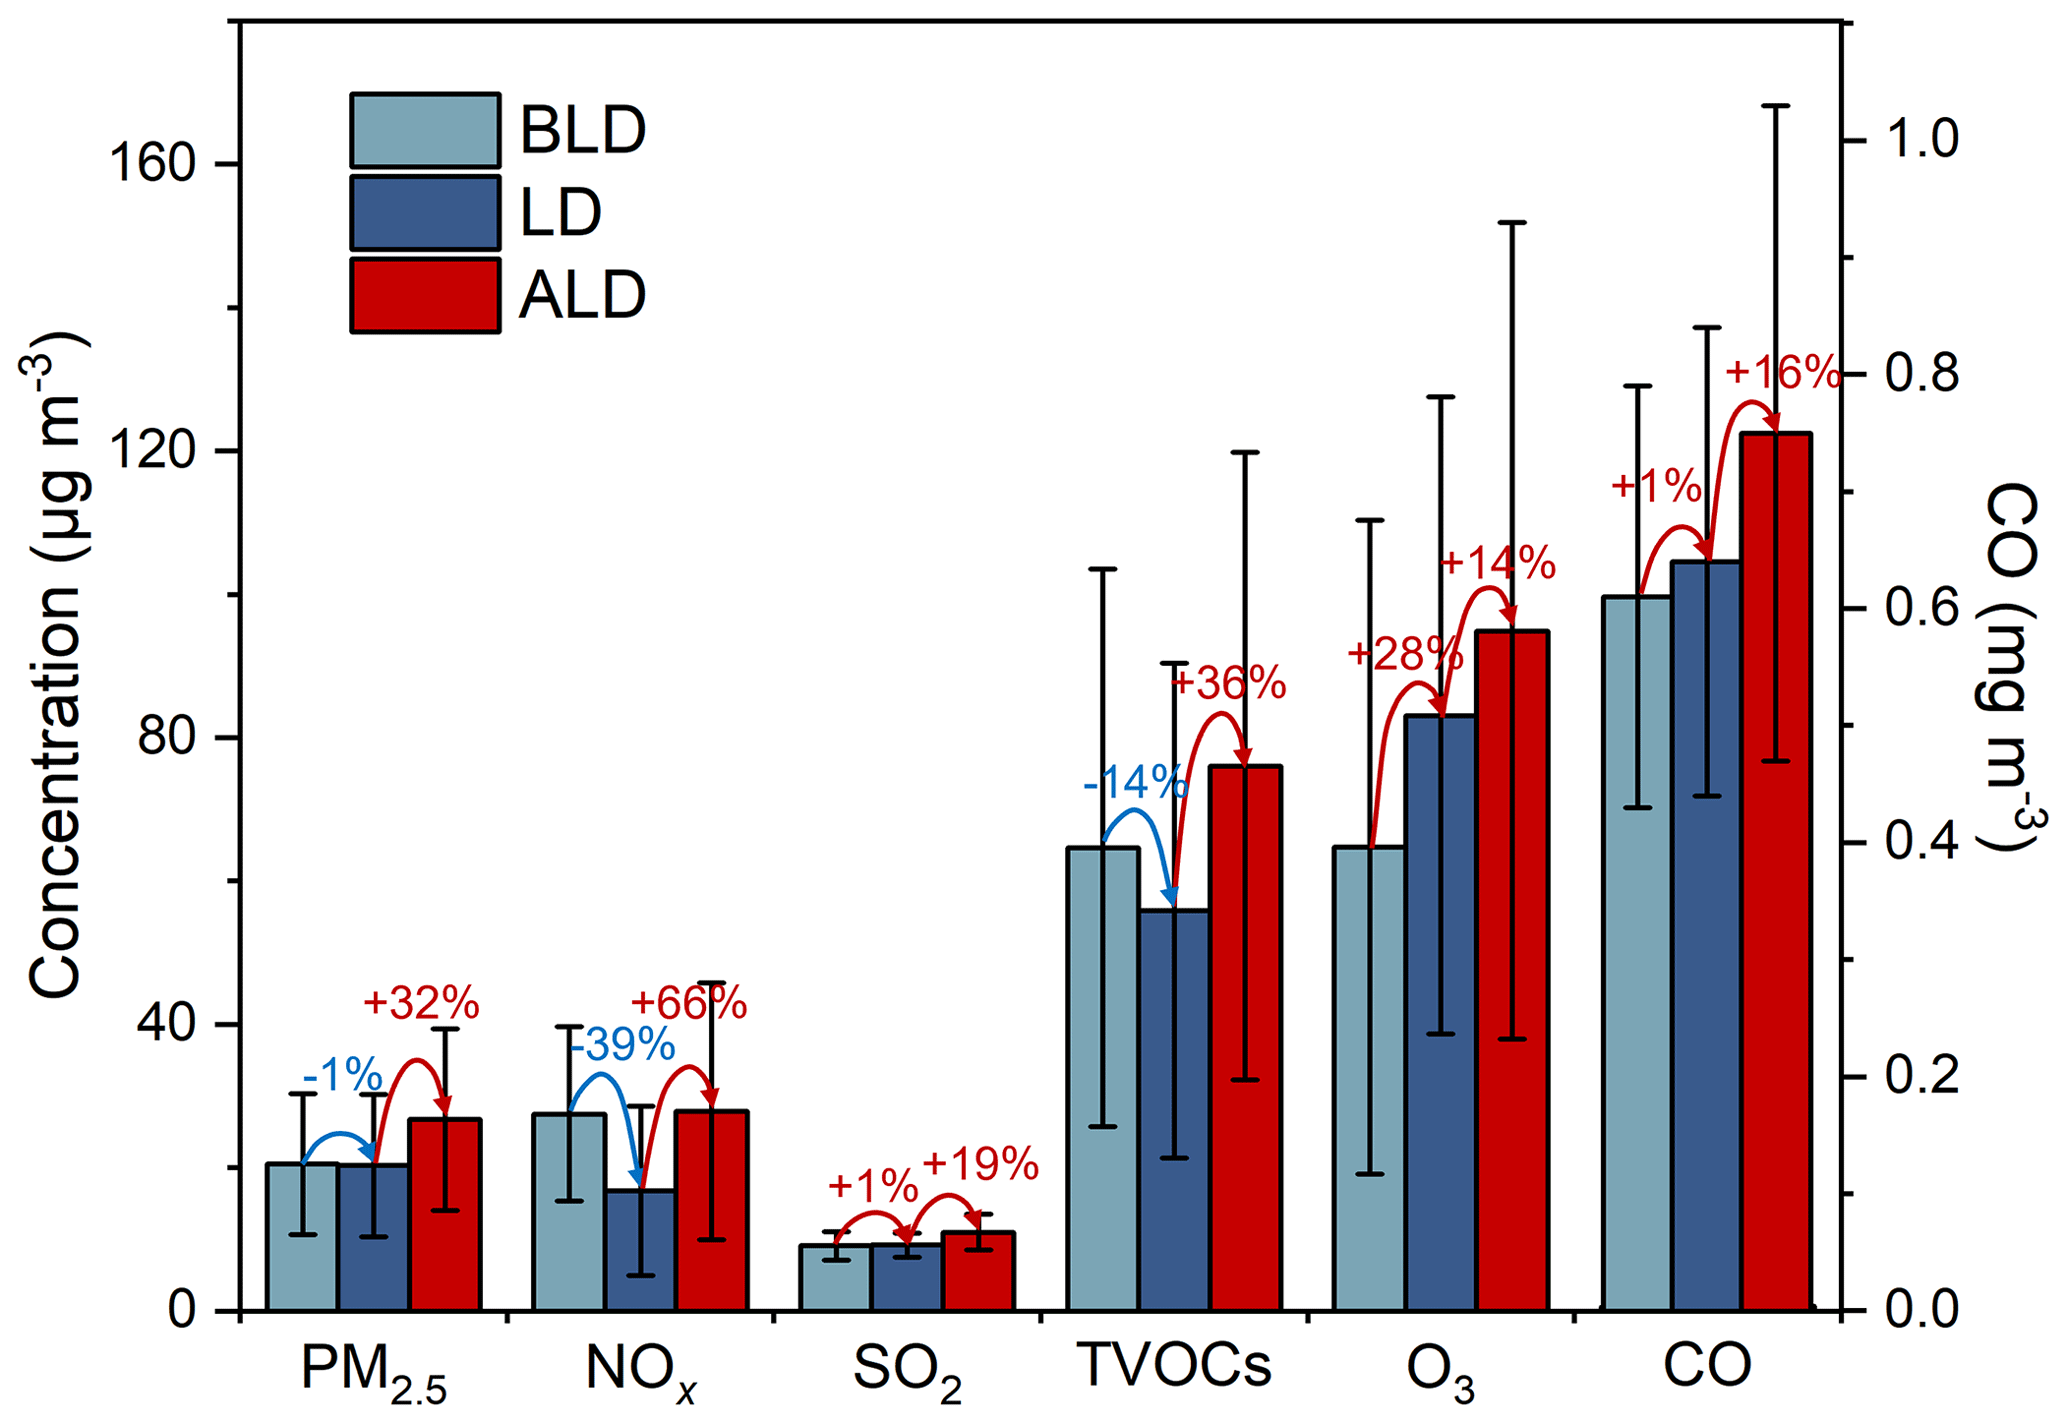
Figure 3Ground-based observations of PM2.5, NOx, SO2, O3, CO, and TVOC concentrations in Yangzhou. The figure compares the averages during the BLD (gray), LD (blue), and ALD (red) periods. Error bars indicate SDs over different lockdown periods.
Satellite-retrieved PM2.5, NO2, and SO2 data over the entire region of eastern China were also investigated, and results show that these pollutants were predominantly concentrated in Shanghai and its neighboring cities, including Yangzhou, during both BLD and LD (Fig. S4). Figure 4 presents regional fractional changes in mean PM2.5, NO2, and SO2 concentrations from the BLD to LD periods in the YRD, all showing an increase of 29 %, 6 %, and 14 %, respectively. In comparison, Yangzhou experienced lower increases in these air pollutants, with slight changes of 6 %, −18 %, and −4 % for PM2.5, NO2, and SO2, respectively. The implication is that, even though local primary emissions, such as NO2 and SO2, were reduced substantially during LD, they still could be affected by regional transport. Furthermore, as depicted in Fig. S3, the concentrations of NO2 in major cities of the YRD were more than twice as high as in Yangzhou during LD, confirming relatively lower local primary emissions due to the stringent lockdown. However, the higher level of SO2 in Yangzhou during LD may be attributed to the nearby power stations along the Yangtze River, which were not impacted by the lockdown measures.
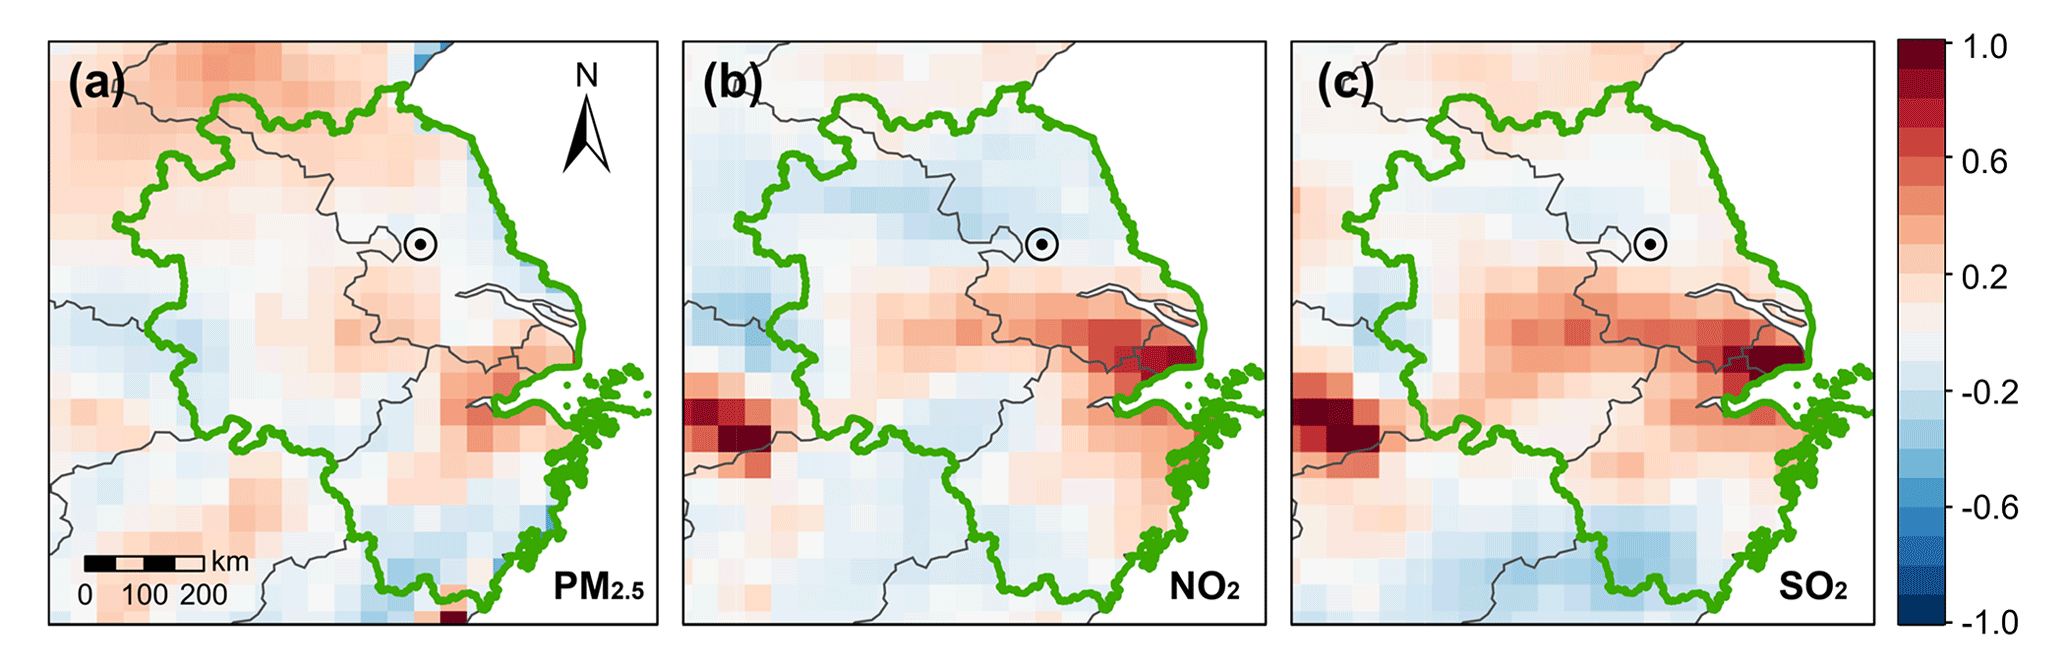
Figure 4The fractional changes (i.e., ) in (a) PM2.5, (b) NO2, and (c) SO2 between BLD and LD periods based on spaceborne measurement. The circle symbols in the maps indicate the location of Yangzhou, and the green region represents the YRD.
3.2 Chemical composition and size distribution of individual BCc particles
Based on the SPA-MS analysis, a total of 1 068 362 BCc particles were collected during the whole study period. The BCc particles accounted for 59 %, 69 %, and 57 % of the total number of measured particles in the BLD, LD, and ALD periods, respectively. Figure 5 shows the normalized average mass spectra of BCc particles during the three periods. Ion height in each spectrum reflects the number fraction of detected BCc particles containing the corresponding ion relative to the total number of BCc particles, while colors represent peak area ranges of detected ions. BCc particles in BLD, LD, and ALD show similar mass spectra at , with common peaks including carbon ion clusters (, n = 1–7) at 27 [C2H3]+, 37 [C3H]+, 43 [C2H3O]+, 51 [C4H3]+, 63 [C5H3]+, 46 [NO2]−, 62 [NO3]−, and 97 [HSO4]−. However, the abundance of large carbon ions (, n > 7) in both BLD and ALD periods was 1.5 times higher than that in the LD. Previous studies have indicated that high-mass carbon ions may be linked to traffic emissions, particularly those from diesel trucks (Xie et al., 2020; Liu et al., 2019), and the observed reduction in such ions during LD suggests a decrease in local vehicle emissions. This trend is also consistent with the changes observed in aromatic compounds, e.g., 119 [C9H11]+.
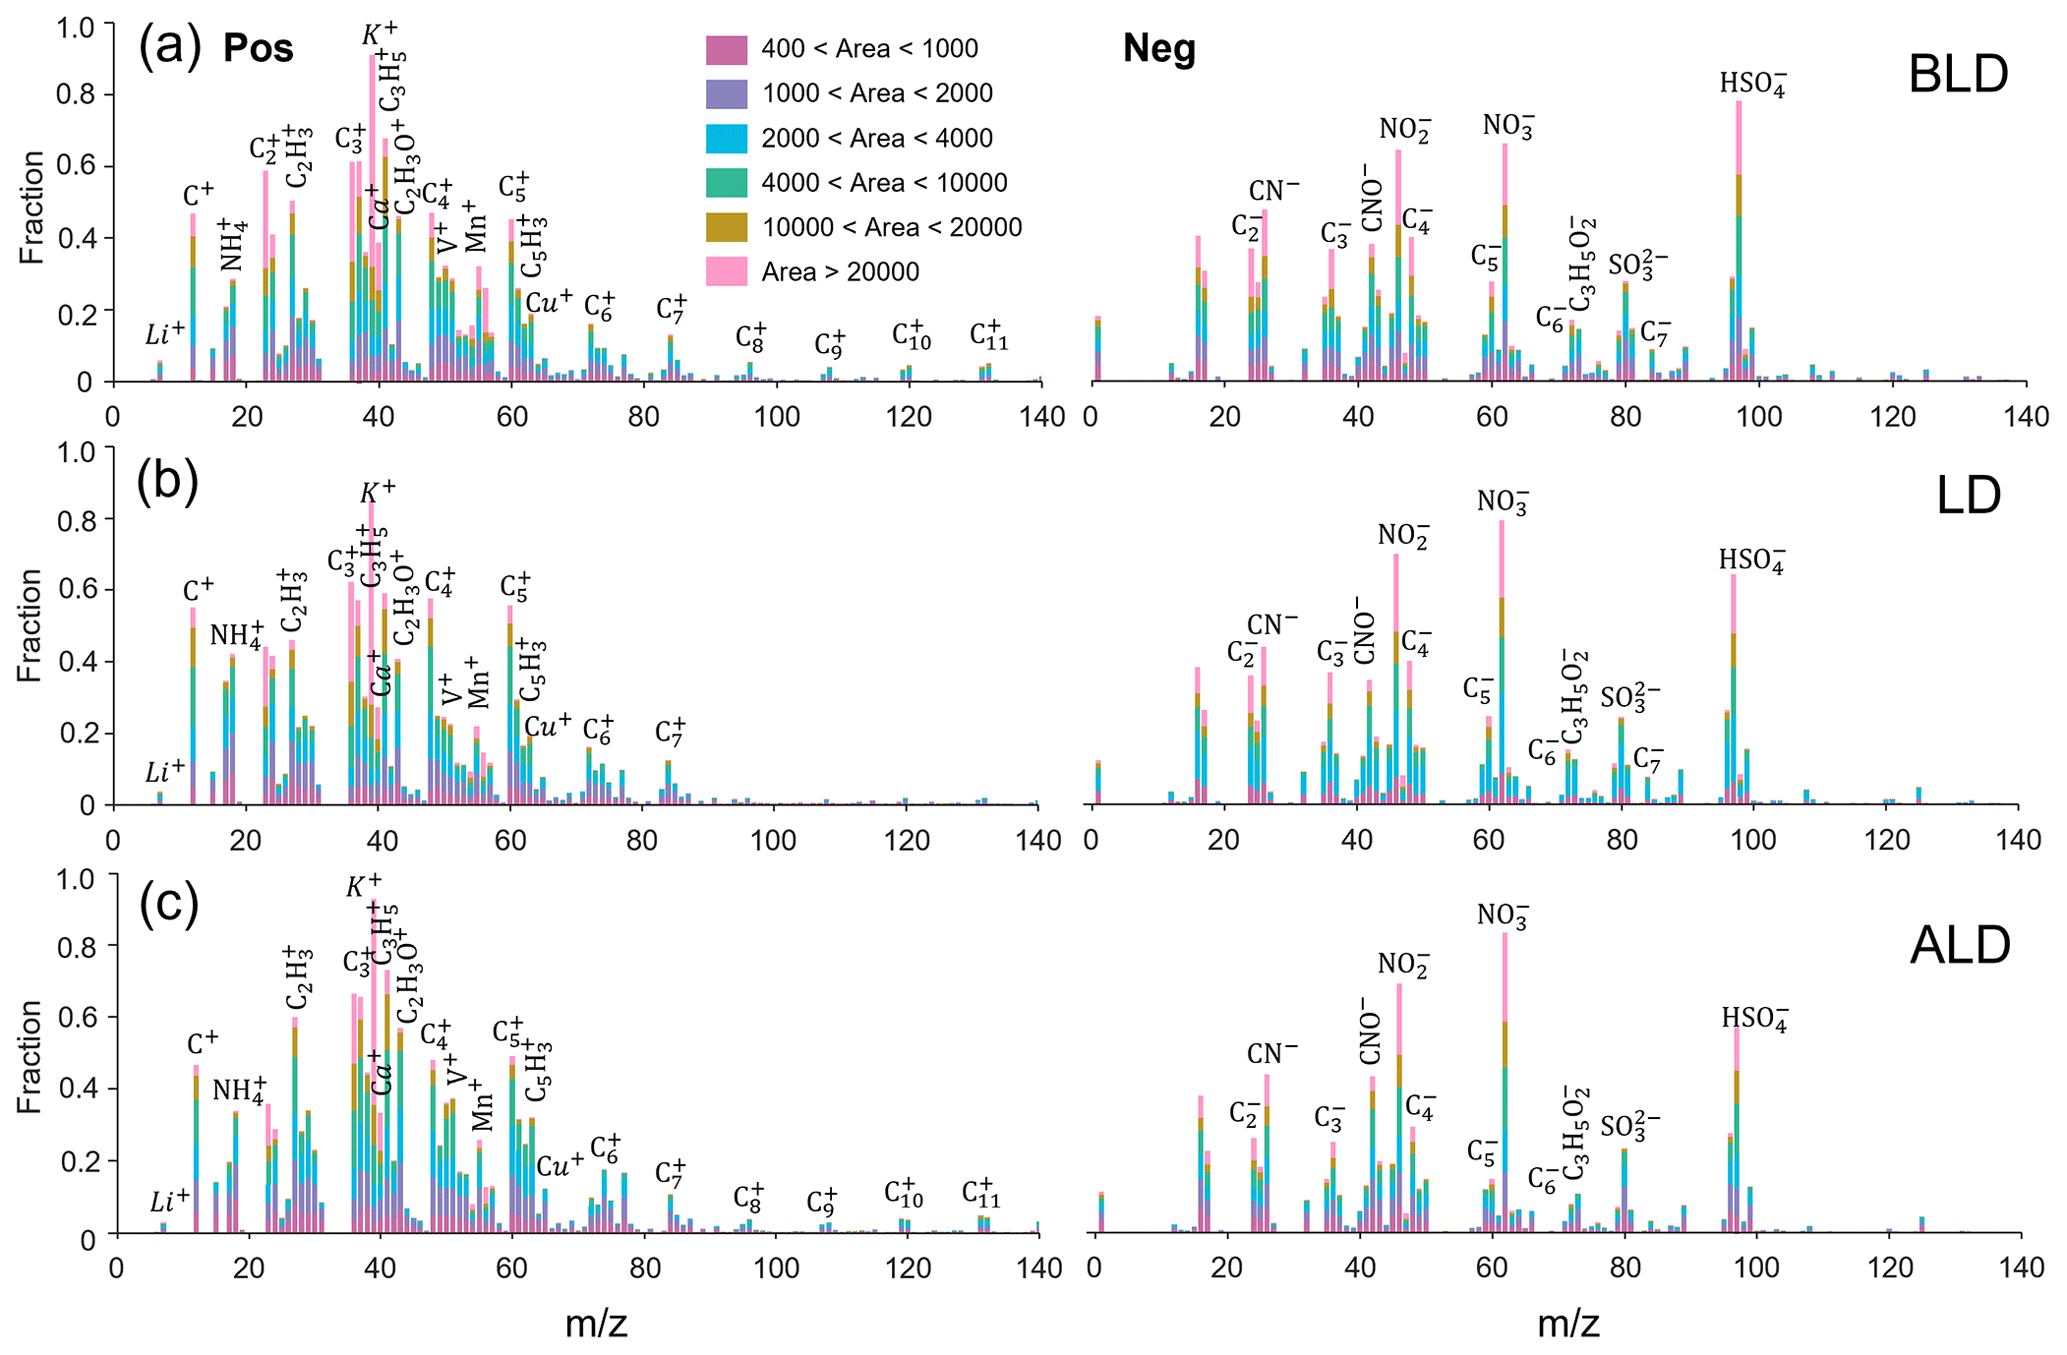
Figure 5The average positive and negative mass spectra of BCc particles (a) before the lockdown period (BLD), (b) during the lockdown period (LD), and (c) after the lockdown period (ALD).
Further, BCc particles were classified into 12 types based on the differences in chemical features and temporal variations, as shown in Table S1. Fresh BC particles (BC-fresh) are those freshly emitted without undergoing significant atmospheric processing (Ding et al., 2021). Five types of BC-fresh particles were identified according to their ion markers: (i) BC-pure is dominated by carbon clusters () with minor ion signals of inorganic species, such as 46 [NO2]− and 97 [HSO4]− from nitrate and sulfate, respectively (Xie et al., 2020). (ii) BCc particles from biomass burning (BB) are characterized by ion signals at 39 [K]+, 45 [CHO2]−, 59 [C2H3O2]−, and 73 [C3H5O2]−, with a relative peak area (RPA) more than 0.5 (Silva et al., 1999). (iii) Coal combustion (CC) BCc particles typically include small carbon clusters (, n = 1–4), metal elements (e.g., 7 [Li]+, 23 [Na]+, 27 [Al]+, 56 [Fe]+, and 63 [Cu]+, as well as 206, 207, and 208 [Pb]+), and organic carbon (38 [C3H2]+, 43 [C2H3O]+) peaks in the positive mass spectrum, while the strong signals of secondary inorganic species (46 [NO2]−, 43 [AlO]−, 62 [NO3]−, 80 [SO3]−, 97 [HSO4]−) in the negative ion mode suggest that CC particles were long-distance-transported or more processed (Zhang et al., 2022; Zhang et al., 2009). (iv) Particles from vehicle emission (VE) are characterized by the presence of ion signals at 40 [Ca]+, 51 [V]+, 55 [Mn]+, 67 [VO]+, 46 [NO2]−, 62 [NO3]−, and 79 [PO3]−, as well as high loadings of organic carbon (41 [C3H5]+, 43 [C2H3O]+) and carbon cluster (, n = 1–4) ion peaks (Yang et al., 2017). (v) BCc particles that are internally mixed with more than one type (BB, CC, and VE) are categorized as mixed type (Sun et al., 2022a).
Aged BC particles, denoted as BC-aged, undergo a series of chemical reactions and physical transformations. These processes typically lead to changes in their morphology, hygroscopicity, and optical properties as they are coated with other materials (He et al., 2015). Six types of BCc particles are classified as BC-aged and are further grouped into BCOC and BC-SNA, depending on whether they contain mainly organic carbon (OC) or sulfate, nitrate, and ammonium (SNA). First, BCOC types indicate BC-aged particles that are internally mixed with OC. These particles are characterized by the presence of carbon clusters () and ions (n = 1–6, m = 1–3) in positive mass spectra (Xie et al., 2020). On the other hand, BC-aged particles that do not mix with OC are named BC-SNA, indicating mixing with secondary inorganic species. Additionally, BCOC particles with negative mass spectra dominated by nitrate ions (46 [NO2]− and 62 [NO3]−) or sulfate ions (97 [HSO4]−) are referred to as BCOC-N or BCOC-S, respectively; otherwise, BCOC particles showing similar peak areas of nitrate and sulfate are named BCOC-SN. The BC-SNA particles are further categorized as BC-N, BC-S, and BC-SN based on similar principles. Note that the remaining particles that cannot be classified into either BC-fresh or BC-aged are denoted as BC-other. More details on BCc particle types are shown in Table S1 and Fig. S1.
During BLD, the average number fraction of BC-fresh particles was 36 % with sizes mainly concentrated at 500 nm, similar to the mode size of BC-aged particles of 520 nm (Fig. 6). The predominant BCc particle types during BLD were BCOC-S and BC-S (24 % and 12 % by number), likely because sulfate was removed less efficiently than organic matter (OM) and NO3 by heavy precipitation, especially during the warm seasons (Isokääntä et al., 2022). As shown in Fig. 6c and d, the peak size of BC-SNA was larger than that of BCOC in all periods, indicating that organic-coated BCc particles generally had a relatively thin coating compared to those coated by secondary inorganic species, which is consistent with previous studies (Sun et al., 2016; Wang et al., 2019).
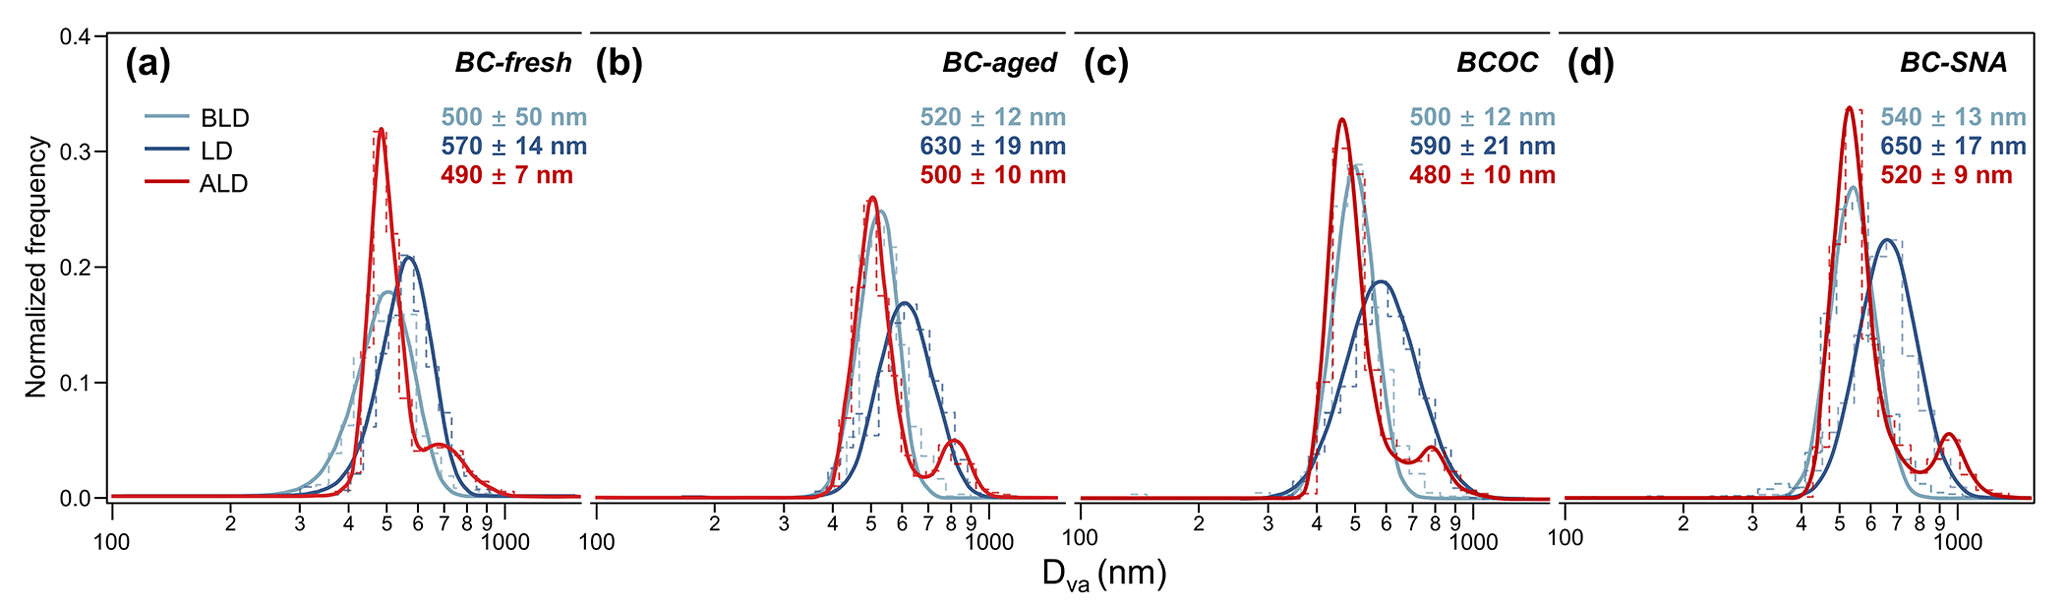
Figure 6Size distribution of different types of BCc particles during different periods in Yangzhou. (a) BC-fresh particles, (b) BC-aged particles, (c) BCOC particles, and (d) BC-SNA particles. The lognormal distribution was used to fit the unimodal size distribution, and the Lorentz distribution was used to fit the bimodal size distribution. The corresponding mode sizes (with the standard deviations) are also shown.
During the transition from BLD to LD, heavy and continuous precipitation occurred from 25 to 28 July (the eve of lockdown), resulting in the removal of a majority of pollutants (PM2.5: 4 µg m−3, O3: 35 µg m−3, NOx: 8 µg m−3). Following this environmental clearance, strict lockdown measures were implemented, resulting in a drastic reduction in primary emissions. As a result, the number fraction of BC-fresh particles significantly decreased from 37 % to 28 % and that of VE-type particles dropped from 12 % to 3 % (by number). Expectedly, with the decrease in NOx, an obvious enhancement of O3 was observed during LD (Fig. 3). According to previous studies (Huang et al., 2021; Laughner et al., 2021), a large reduction of NOx may promote the formation of O3 under a VOC-limited regime and enhance the oxidation capacity of the local atmosphere, which may have promoted the number fraction of BC-aged particles to increase from 64 % in the BLD to 72 % in LD (Fig. 7a), indicating that the lockdown could have accelerated aging of BCc particles through complicated chemical reactions and/or physical coagulation. Additionally, the most abundant type of BCc particle changed from BCOC-S (24 % by number) in the BLD to BC-N (25 %) in LD (Fig. 7a), suggesting different BCc particle formation pathways. Despite the abrupt reductions of NOx (−39 %) due to the city lockdown, it is important to note that the concentration of PM2.5 only slightly decreased during LD (−1 %), highlighting the nonlinear relationship between primary emissions and PM2.5 levels.
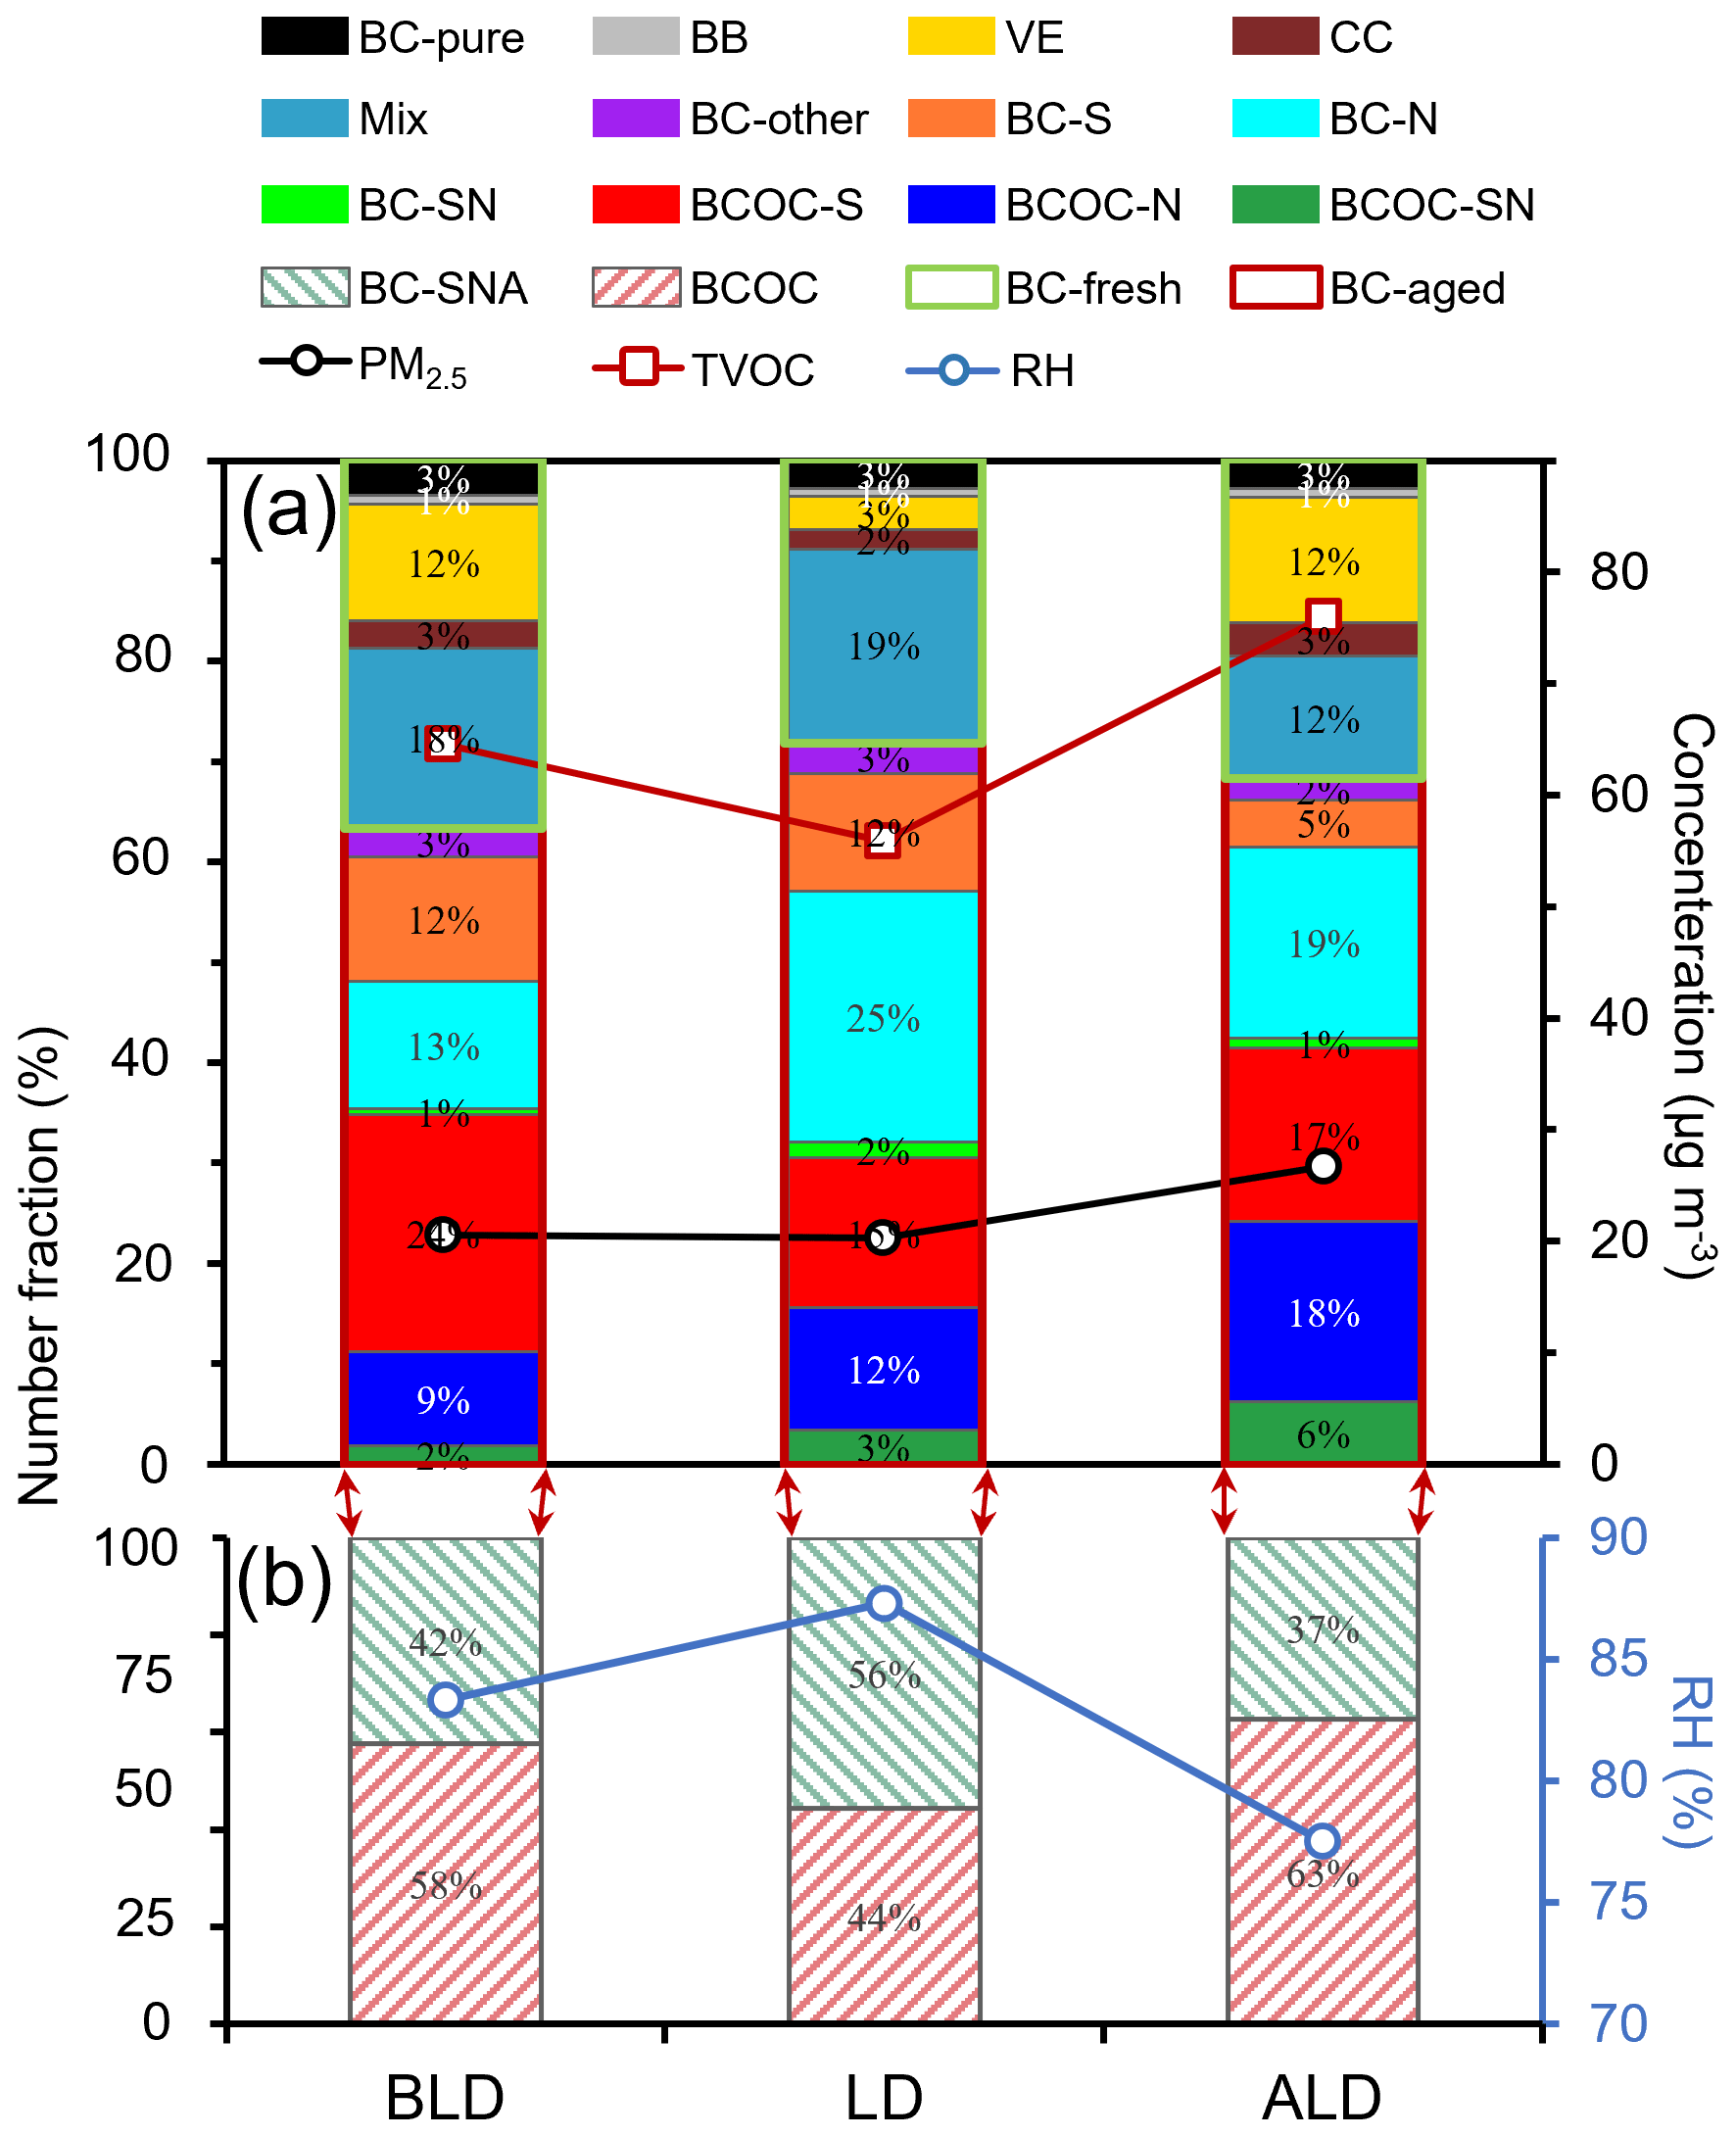
Figure 7Number fractions of BCc particles. (a) The number fractions of different BCc particles along with the concentrations of PM2.5 and total volatile organic compounds (TVOCs). (b) The number fractions of different types of BC-aged particles along with relative humidity (RH).
During ALD (PM2.5: 26.7 µg m−3, NOx: 27.9 µg m−3, TVOCs: 76.0 µg m−3), the number fraction of BC-fresh particles rose from 28 % (LD) to 31 % (ALD), while the fraction of VE particles also increased from 3 % (LD) to 12 % (ALD) (Fig. 7a), coinciding with a 16 % rise in CO concentration. This suggests a shift in combustion practices and fuel usage patterns as economic activities resumed. The increased CO level, a known marker for combustion-related emissions, align with the resurgence of vehicle emissions and other activities that emit BC and CO concurrently (Wang et al., 2015; Zhou et al., 2009). Notably, the size distributions of BC-fresh and BC-aged particles presented relatively small peaks at 690 and 820 nm during ALD, in addition to the prominent peaks at 490 and 500 nm, which were different from those in the BLD and LD periods. These small peaks were relatively close to the dominant sizes of BC-fresh and BC-aged particles during LD (Fig. 6). This result suggests a substantial number of BCc particles with small sizes (around 500 nm) after the lockdown was lifted in Yangzhou owing to the sudden enhancement of primary emissions; on the other hand, particles with large diameters (>690 nm) may have formed due to the participation of more trace reactive gases (e.g., NOx, SO2, and VOCs) in continuous aging reactions, resulting in thicker coatings on the surface of pre-existing particles and therefore a more clear separation of two mode sizes during the ALD period than during the other two periods. This hypothesis is also supported by the increased number fraction of BCOC-SN during the ALD period (Fig. 7a). Similar findings have been reported in the North China Plain (NCP) and the YRD during cold seasons, where thicker coatings on secondary aerosols were also observed under lower RH (<70 %) (Y. Zhang et al., 2021). This might be due to the fact that particles with more organics and nitrate can result in earlier deliquescence and provide aqueous surfaces that facilitate the heterogeneous formation of secondary species under relatively low RH (Y. Zhang et al., 2021). Among the three periods, the difference between the mode sizes of BC-aged and BC-fresh particles was the smallest (10 nm) during the ALD period (Fig. 6a and b). This size reduction can be attributed to the increased BCOC and hydrophobic primary particles after lockdown (Fig. 7). This is because the internally mixed BCOC and hydrophobic primary particles may constrain further growth of secondary BC-SNA particles (Liu et al., 2016; Zhang et al., 2018), thereby leading to smaller-sized BC-aged particles. Moreover, the differences in BCc particle mode sizes between ALD and BLD periods also reveal an interesting fact: the lockdown effect may not only affect air quality during lockdown but can also influence the air quality even after lockdown, as the resumed emissions after lockdown may be subjected to different chemistry from that before lockdown.
Throughout the entire observation, the changes in the number fraction of BC-SNA exhibited consistency with the variations in RH (Fig. 7b), indicating that BC tends to mix with ammonium sulfate and ammonium nitrate under high RH conditions. Meanwhile, the number fraction of BCOC shows similar patterns as TVOCs, suggesting that high TVOC levels may facilitate the coating of organics on BC cores under low RH conditions. Figure 8 displays the number fraction of BCc particle types as a function of PM2.5. Overall, as PM2.5 levels increased, the number fraction of BC-aged particles also increased, while the proportion of BC-fresh particles decreased during BLD and LD, indicating a clear transition from BC-fresh particles to more aged ones, in line with the average size distribution during ALD having a small peak at 900 nm. Specifically, the increase in PM2.5 was driven by BCOC-S during BLD (Fig. 8a), whereas BC-N played a vital role in the PM2.5 increase during LD (Fig. 8b). Interestingly, the concentration of NOx, the primary precursor of BC-N, decreased by 31 % and 41 % during LD compared to BLD and ALD, respectively (Fig. 3), indicating a strong nonlinear response of nitrate in BCc particles to NOx, likely due to much faster conversion of NOx to nitrate upon enhanced atmospheric oxidation capacity; additionally, the high proportion of BC-N during LD might be attributed to regional transport, similar to that in Shanghai during 2020 winter lockdown (Chang et al., 2020).
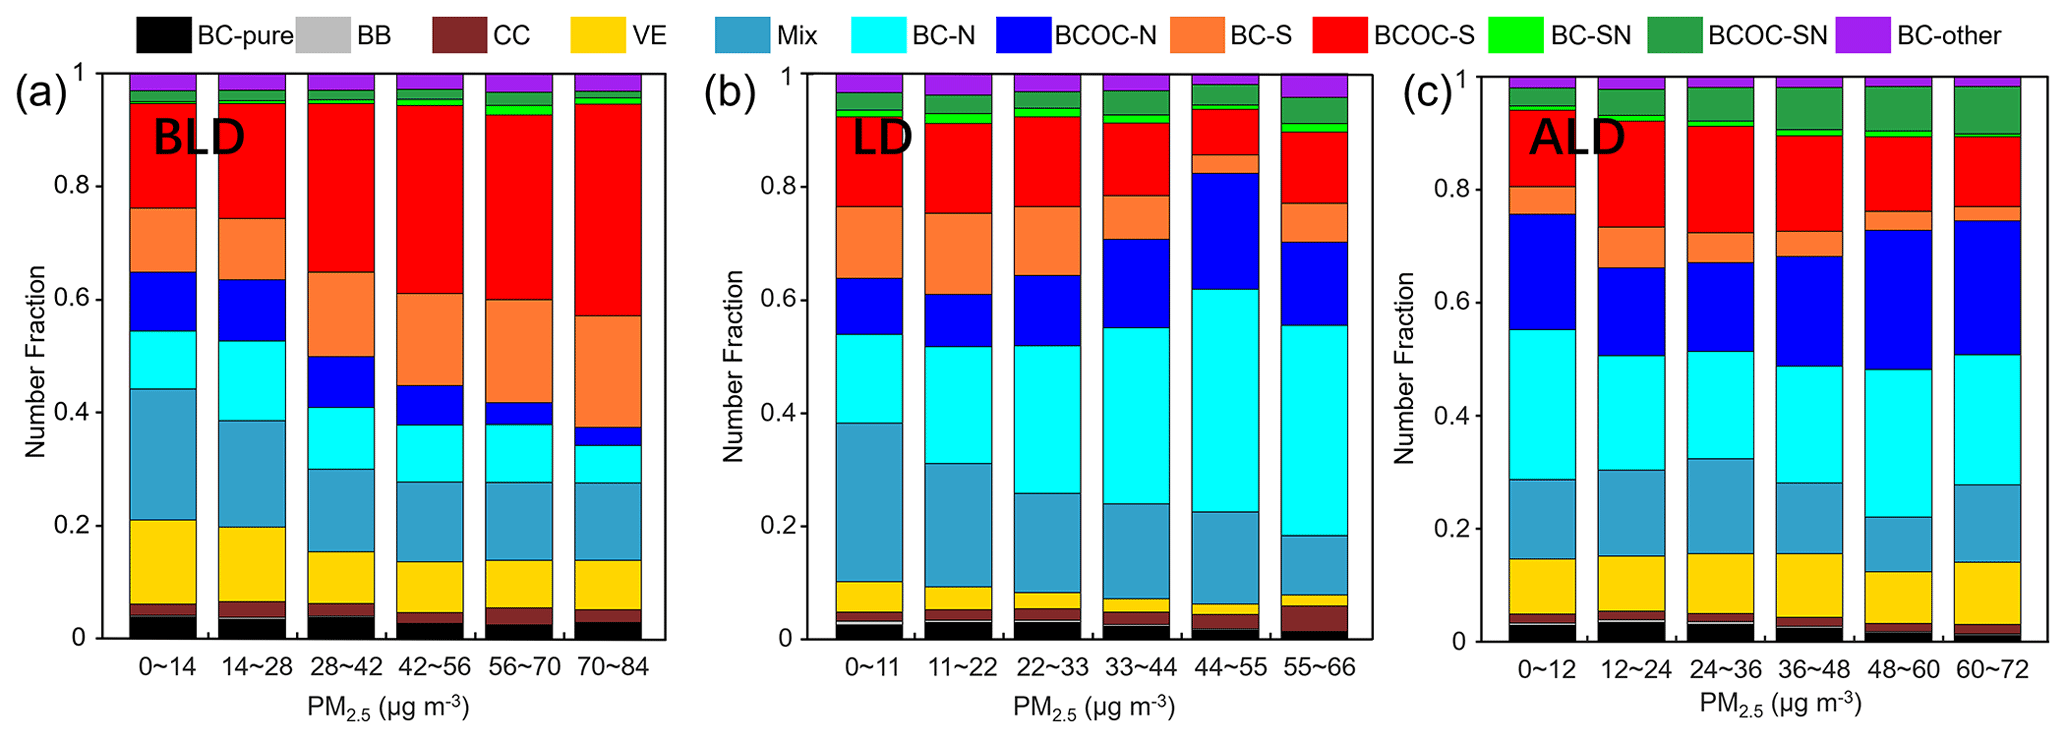
Figure 8Variations of number fractions of BCc particle types with PM2.5 mass concentrations during (a) BLD, (b) LD, and (c) ALD.
3.3 Chemical aging of BCc particles
As shown in Fig. 5, in the average positive mass spectra of total BCc particles, the peak areas of , OM, and metals contributed to more than 95 % of the total, while nitrate and sulfate peak areas accounted for more than 90 % of the negative mass spectral signal. To better elucidate the aging processes of BCc particles during different lockdown periods, we summed the carbon cluster (n = 1–5, accounting for more than 99 % of Cn) peak areas to represent BC and the total peak area of sulfate, nitrate, and ammonium (SNA) to represent the second inorganic components coated on BC. Additionally, we defined the sum of positive peak areas, excluding and metals, as OC to represent the OM coated on BC. These peak areas encompassed almost all the coating materials, except for metals, of BCc particles. The changes in the mixing state and morphology of BCc particles can provide insights into their aging characteristics, as reported previously (Kandler et al., 2018; Moffet et al., 2013). In this study, we use and ratios to describe different types of chemical components coated on BC-fresh, and we use the ratio of the mode size of BC-aged (Daged) to that of contemporaneous BC-fresh (Dfresh) to represent the aging degree of BCc particles.
Figure 9 illustrates the diurnal variations of the and ratios along with the size distribution of BCc particles during different periods. We observed that both and increased during nighttime and decreased during daytime. These variations show prominent enhancements of nocturnal OM and SNA, which could be attributed to accelerated gas-to-particle partitioning and nocturnal secondary formation of organic–inorganic components under high relative humidity (RH>85 %) in a relatively stagnant air mass (WS < 3 m s−1) (Fig. S5). It is worth noting that from BLD to LD and ALD, the intensity of diurnal variations of and obviously increased. This discrepancy can be attributed to several factors. (i) During BLD, frequent precipitation effectively scavenged the particles (Isokääntä et al., 2022). (ii) In contrast, stronger solar radiation and higher O3 concentration during LD promoted photochemical formation of OC and SNA. (iii) After lockdown, more precursors due to increased local emissions may have led to more production of secondary components than during BLD as explained earlier. These results indicate that the aging process and mixing state of BCc particles depend strongly on meteorological conditions as well as emission sources in urban cities.
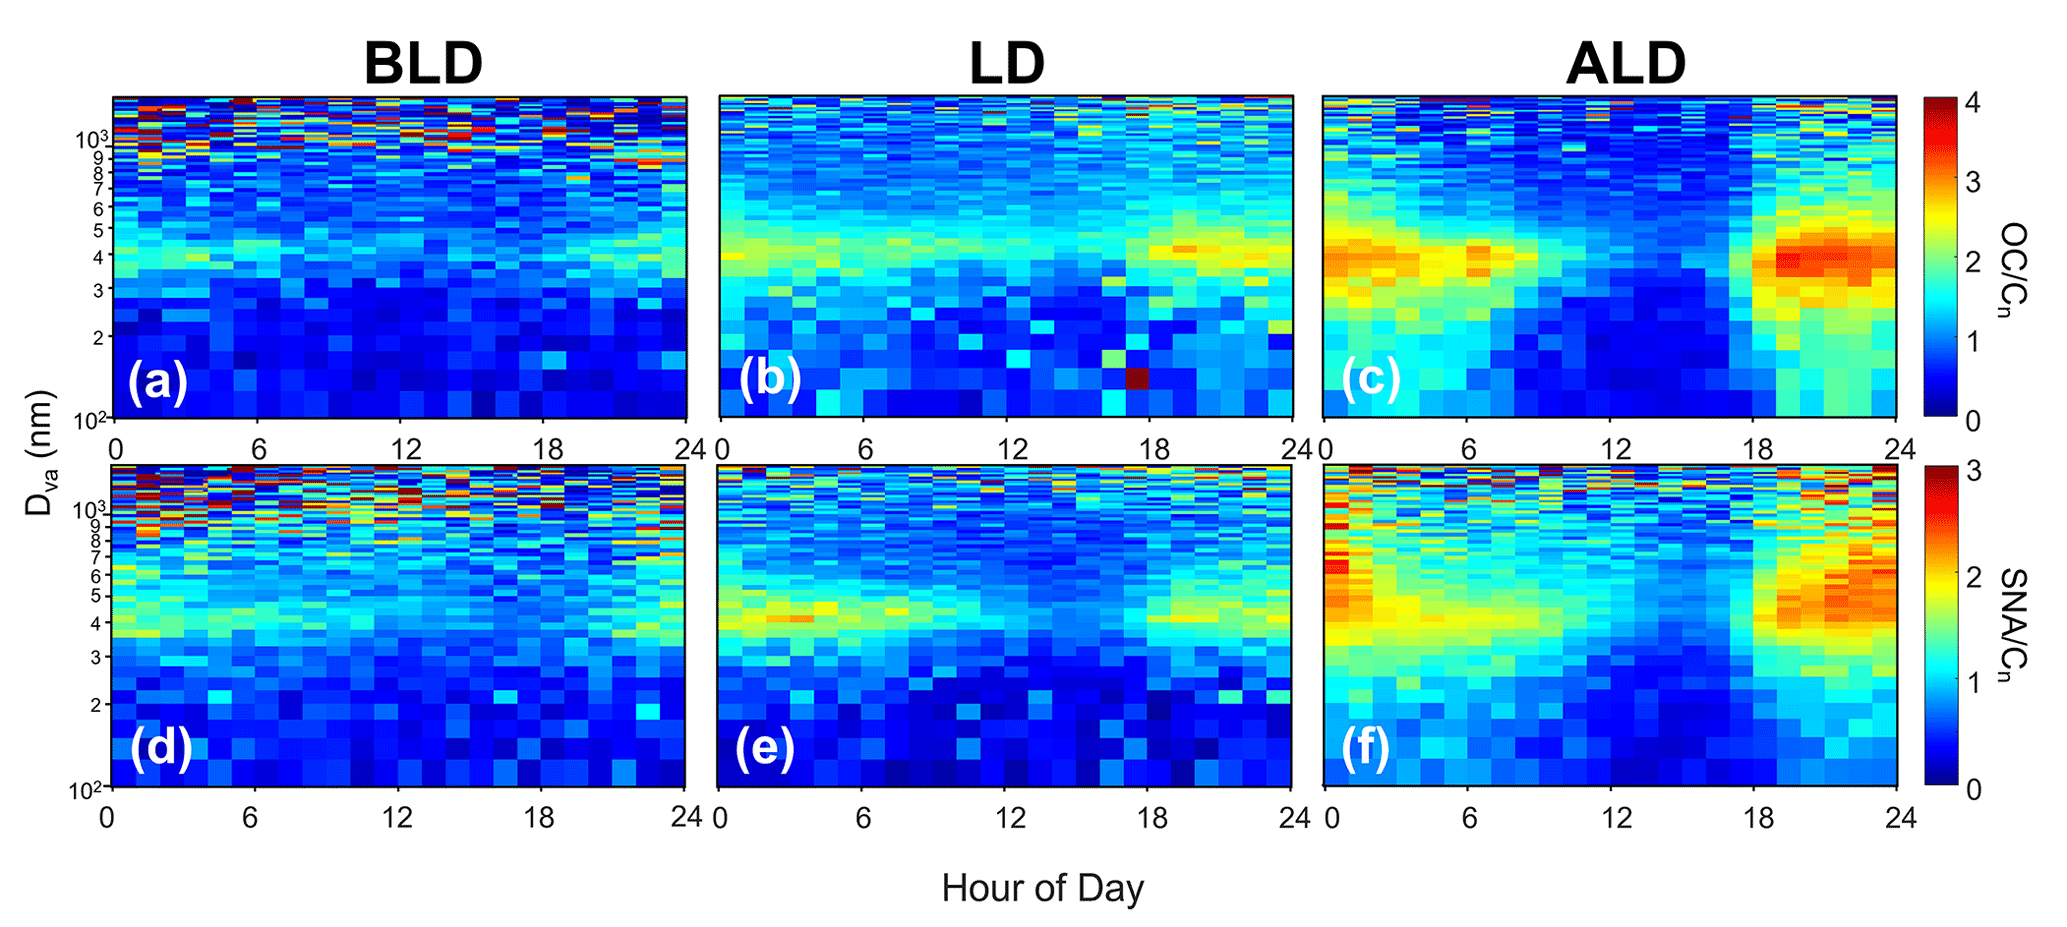
Figure 9Diurnal variations of the ratios of OC Cn and SNA Cn with a size distribution of BCc particles during (a, d) BLD, (b, e) LD, and (c, f) ALD.
As shown in Fig. 9, BCc particles with ∼ 400 nm Dva exhibited significant diurnal fluctuations in the and ratios during LD. There is a noticeable increase in the proportion of BC-SNA particles during nighttime when RH is relatively high. These observations suggest that nighttime heterogeneous hydrolysis may be considered a key mechanism responsible for the formation of BCOC and BC-SNA particles. According to Jacobson (2002), coagulation can be significant between particles with sizes < 100 nm and > 1 µm but insignificant for particles > 300 nm when the total particle number concentration is higher than 104 cm−3. During LD, the and ratios of BCc particles with ∼ 400 nm Dva exhibited pronounced diurnal variations (Fig. 9) and the number fraction of BC-SNA obviously increased. Despite the difference between Dva and physical diameter, such results imply that chemical reactions should be considered the major pathway for BCOC and BC-SNA particles ∼ 400 nm Dva, while the large-sized BC-aged particles (> 1 µm) may be partially from physical coagulation. The more significant diurnal fluctuations in the and ratios of BCc particles during the ALD period, compared to the LD period, can be attributed to increased primary emissions from resumed society activities, more complex atmospheric chemistry involving reactive gases, and the reinstatement of typical diurnal emission patterns, with higher nighttime RH further enhancing secondary aerosol formation.
According to Surdu et al. (2023), condensation involves the direct deposition of gas-phase molecules onto the surface of particles, driven by the difference between the condensable gas concentration (Cg) and its equilibrium particle-phase concentration (Ceq), which is negatively affected by RH. In our study, the average RH was relatively high during all three periods (> 75 %), but the condensable vapor concentration decreased during the lockdown period due to strict lockdown measures, making the difference between Cg and Ceq smaller during LD compared to the other two periods. Additionally, we observed a larger mode peak (600 nm, Dva) and higher ratios (1.11) compared to BLD (510 nm, 1.03) and ALD (500 nm, 1.02) (Fig. 6). Therefore, we conclude that condensation was likely inhibited during the LD period. Instead, the conditions likely favored aqueous-phase and heterogeneous reactions, which played a more important role in the evident growth of BCc particles, converting partially coated particles into fully thickly coated BCc particles during the LD period.
3.4 Source apportionment of BCc particles during lockdown
In addition to local emissions, regional transport plays a significant role in influencing pollutant levels. The emergent lockdown in Yangzhou led to strict limitations on local emissions, while surrounding cities were still running as usual. This is supported by Fig. S6, which illustrates the PM2.5 concentrations in Yangzhou and five other surrounding YRD cities (e.g., Nanjing, Zhenjiang, Changzhou, Taizhou, and Chuzhou) during the campaign. High correlations between PM2.5 concentrations in Yangzhou and the other five cities were observed across all different periods (Fig. S6). These findings underscore the importance of regional transport for PM2.5 pollution during the campaign, providing a unique opportunity to investigate the transmission and source characteristics of BCc particles in the YRD during summer. Herein, PSCF analysis was applied to qualitatively simulate the source probability distributions of the specific BCc particle types (BC-fresh, BC-aged, BCOC, and BC-SNA) during LD.
As shown in Fig. 10, the hotspots of potential sources for the four particle types exhibited strong agreement with each other and primarily concentrated in the southeast of Yangzhou, especially along the coast of the Yangtze River, with the WPSCF greater than 0.6. These hotspot areas also encompassed chemical enterprises, power plants, petrochemical industrial parks, and the Yangtze River in the YRD. This evidence suggests that the region of southeast Yangzhou and lower reaches of the Yangtze River were major source areas for regionally transported BCc particles in Yangzhou during lockdown.
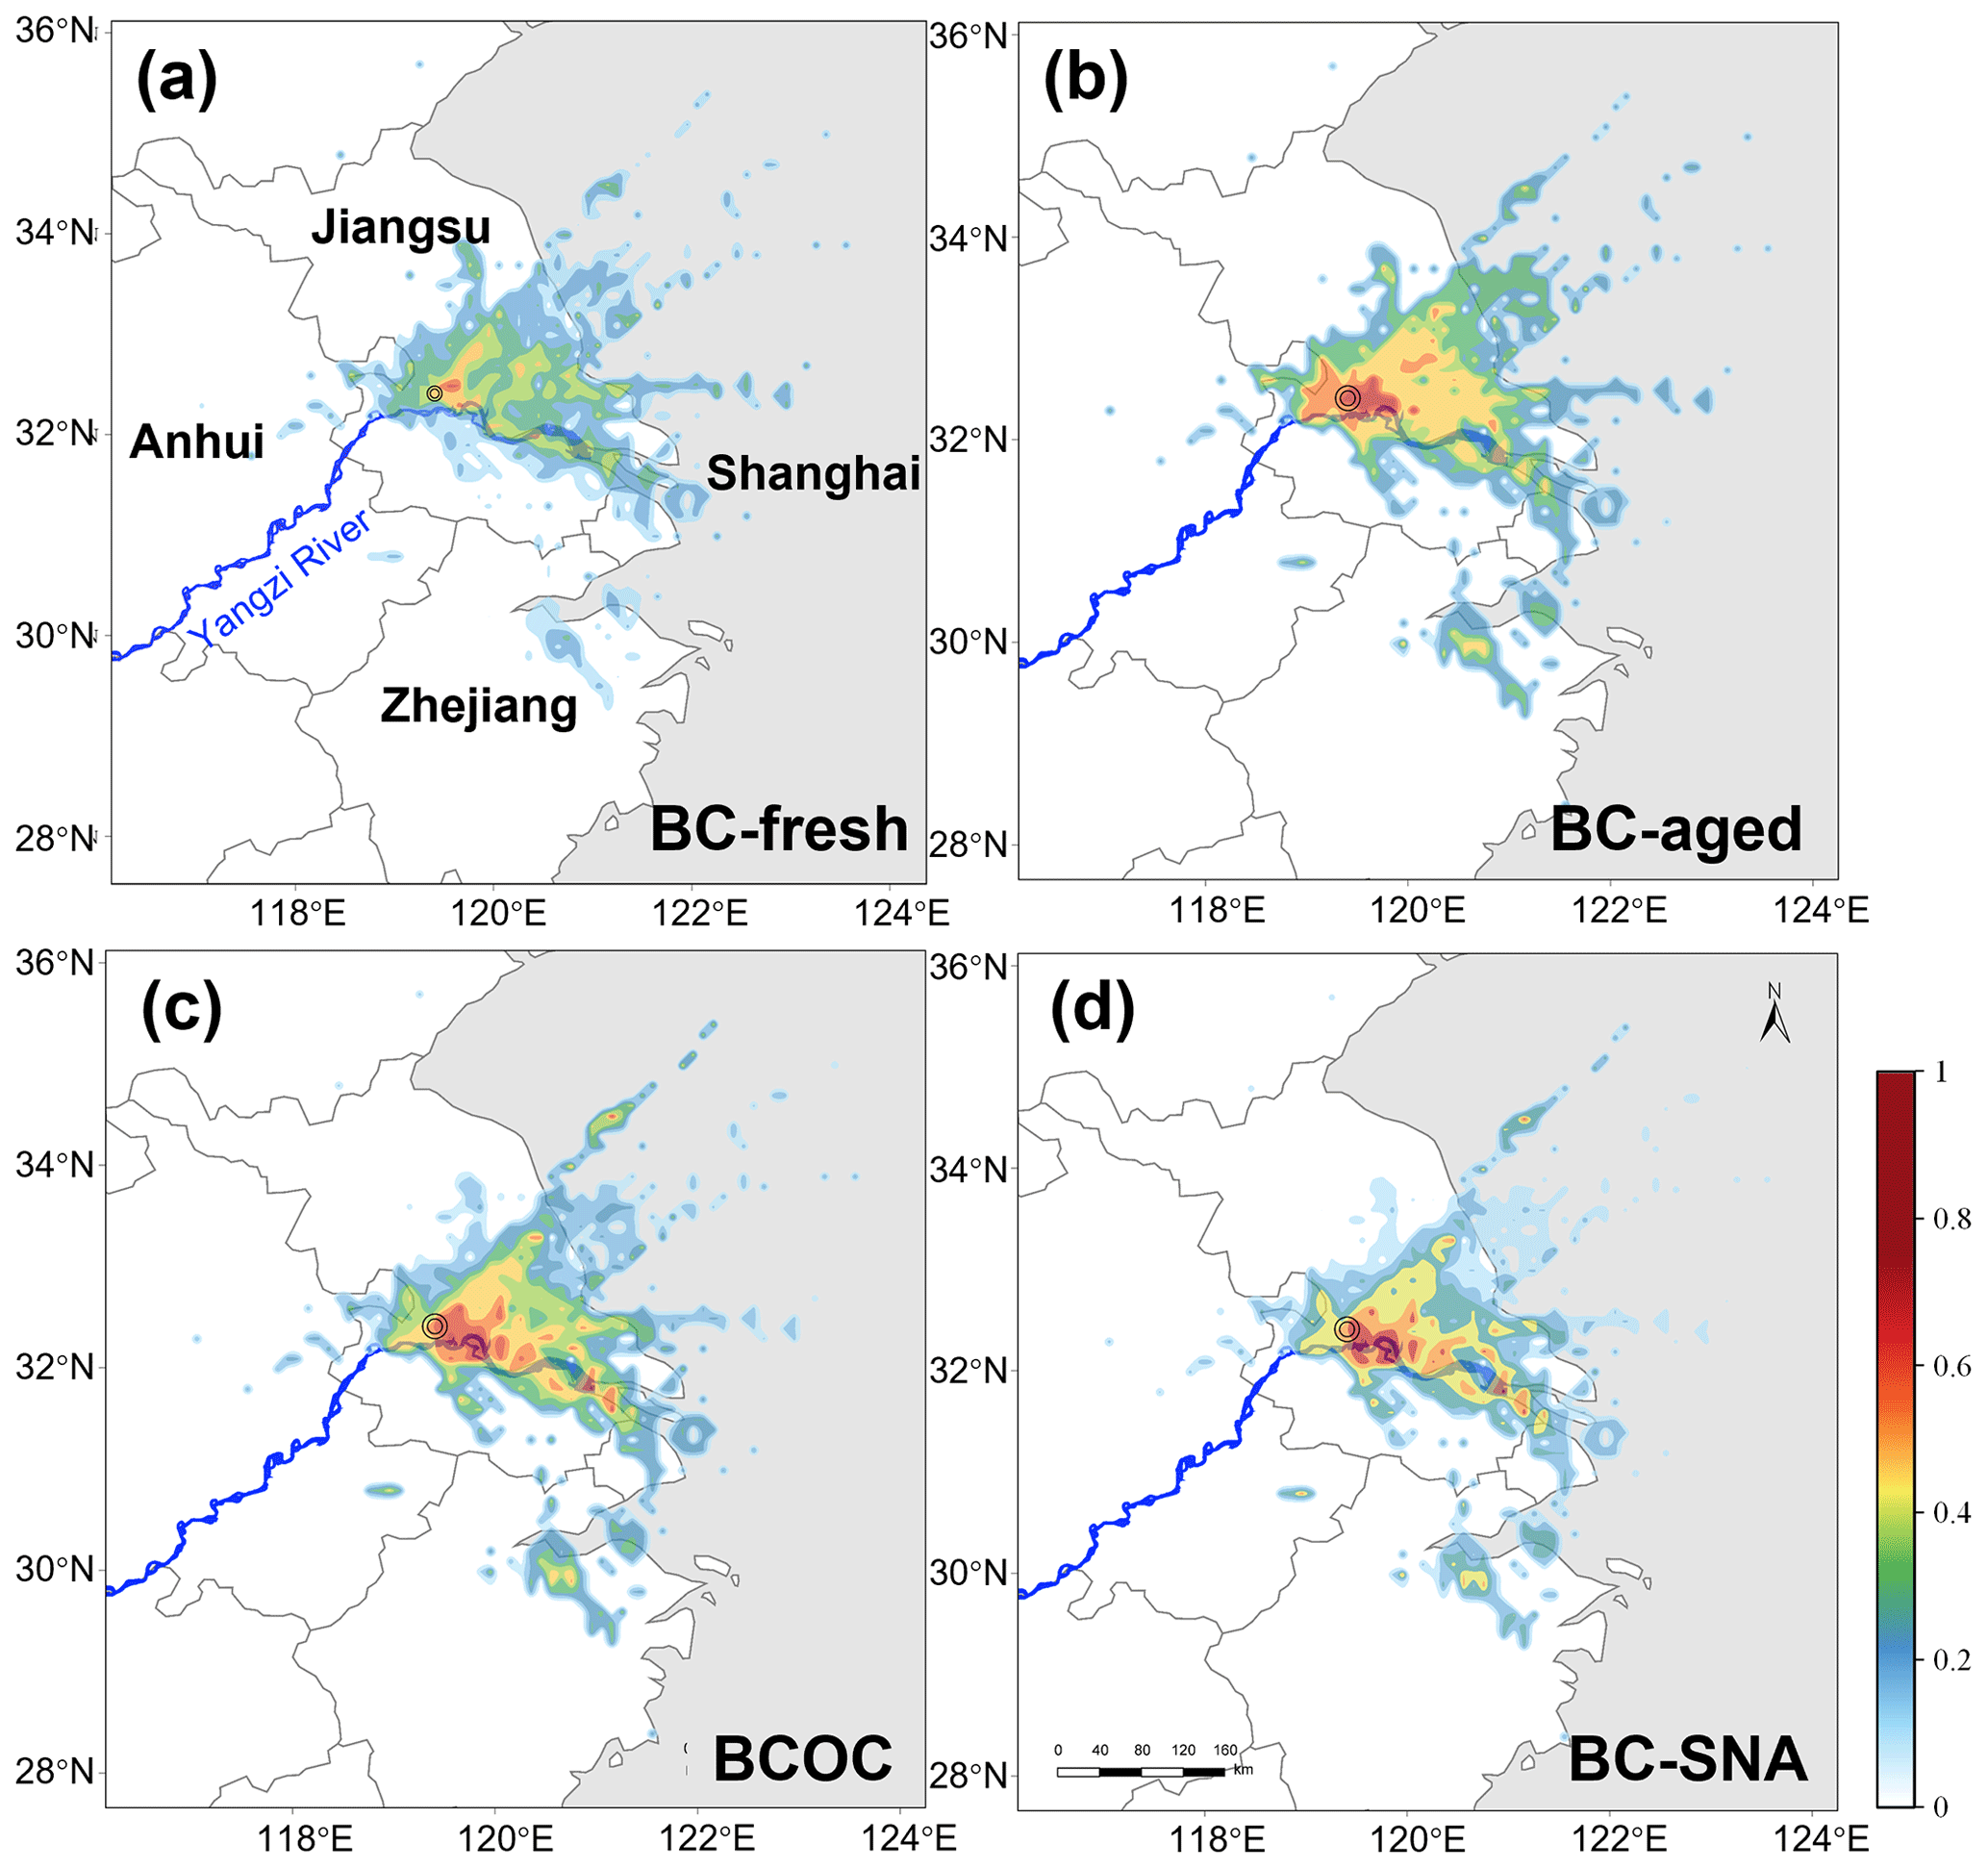
Figure 10The PSCF maps for different BCc particles during LD. (a) BC-fresh. (b) BC-aged. (c) BCOC. (d) BC-SNA.
Additionally, Luo et al. (2023) reported that regional transport of pollutants can occur near the surface from upwind areas when the wind speed (WS) exceeds 2 m s−1. Figure S5b shows that the mean daytime WS was 3 m s−1, indicating that both BC-fresh and BC-aged particles, along with trace gases (e.g., SO2, NOx, and VOCs), originating from the hotspot areas, could be effectively transported to Yangzhou. Additionally, the average size of BCc particles remained around 600 nm during daytime (Fig. S5c), suggesting that BCc particles could undergo continual aging reactions under relatively lower RH but produce relatively thinly coated BCc particles with smaller sizes than those at nighttime (average size of 650 nm). The mean nocturnal WS decreased to 2 m s−1, indicating that the regional atmosphere became stagnant (Fig. S5a and b). As mentioned earlier and underscored here again, this stagnant and humid atmospheric condition may promote aqueous or heterogeneous reactions, likely further leading to the production of more thickly coated BCc particles than daytime ones.
During the summer of 2021, the COVID-19 lockdown imposed in Yangzhou resulted in a significant decrease in anthropogenic emissions from traffic and manufacturing sectors. To examine the effects of this lockdown, we utilized spaceborne observations, ground-based measurements, and particularly SPA-MS analysis to explore the variations, aging characteristics, and sources of BCc particles in the YRD. We showed that the strict emission controls effectively reduced local gaseous pollutants. However, the decline in NOx (−39 %) and TVOC (−14 %) levels might, on the other hand, have resulted in increased O3 (28 %), leading to a rise in BC-aged particles and only a slight reduction in PM2.5 levels during the lockdown. Our results revealed a strong nonlinear response of PM2.5 and O3 to gaseous precursors.
The SPA-MS analysis results further demonstrate significant enhancement of OM and SNA coating species on BC-fresh particles owing to gas-to-particle partitioning and nocturnal multiphase chemistry. Consequently, we observed a higher fraction of BC-aged particles (73 %) during the lockdown due to enhanced oxidizing capacity and high relative humidity (RH > 85 %). The BC-fresh particles tended to mix with SNA under high RH conditions, while high TVOC levels were accompanied by BCOC formation. However, BCOC particles generally exhibited smaller sizes compared to BC-SNA particles. Moreover, we propose that aqueous or heterogeneous reactions might be important to generate BCOC and BC-SNA particles, especially ones with 400 nm Dva, while coagulation might play a more prominent role in larger BC-aged particles. The aging process during LD promoted the conversion of partly coated particles to totally coated ones, with larger diameters (600 nm) and thicker coatings.
It should be noted that the observed average PM2.5 concentration during the lockdown in Yangzhou was 20 µg m−3, which still significantly exceeds the WHO's air quality guideline of 5 µg m−3. Our research underscores the crucial role of BCc particles, which constitute a significant portion of PM2.5, in particulate matter pollution. These particles originate from diverse combustion sources and their behavior is intricately influenced by complex chemistry, regional transport, and meteorological factors. Mere reductions in local primary emissions from traffic and manufacturing sectors exhibit limited efficacy in air quality improvement. Therefore, effective air quality remediation strategies necessitate nuanced control of BCc particles alongside broader emission reduction efforts. We suggest a more comprehensive regulation of precursor gases from multiple sectors, a wide-ranging joint regulation approach, and proper consideration of the chemistry to develop an effective strategy for air quality improvement.
The data supporting the findings of this study are available at the Figshare digital repository (https://doi.org/10.6084/m9.figshare.24427795, Dai, 2023).
The supplement related to this article is available online at: https://doi.org/10.5194/acp-24-9733-2024-supplement.
XG, JW, and YD designed the research. YD, HW, and SC conducted the field measurements. YD, HW, JW, and SC analyzed the data. XG, JW, HL, YW, YZ, and EA reviewed the paper and provided useful suggestions. YD, JW, and XG wrote the first draft of the paper. All authors were involved in the discussion of the results.
The contact author has declared that none of the authors has any competing interests.
Publisher's note: Copernicus Publications remains neutral with regard to jurisdictional claims made in the text, published maps, institutional affiliations, or any other geographical representation in this paper. While Copernicus Publications makes every effort to include appropriate place names, the final responsibility lies with the authors.
This research has been supported by the National Natural Science Foundation of China (grant nos. 42377100, 22276099, and 42021004) and the Guangxi Science and Technology Program under grant no. AB24010074.
This paper was edited by Dantong Liu and reviewed by three anonymous referees.
Adachi, K., Zaizen, Y., Kajino, M., and Igarashi, Y.: Mixing state of regionally transported soot particles and the coating effect on their size and shape at a mountain site in Japan, J. Geophys. Res.-Atmos., 119, 5386–5396, https://doi.org/10.1002/2013JD020880, 2014.
Benedetti, A., Morcrette, J.-J., Boucher, O., Dethof, A., Engelen, R. J., Fisher, M., Flentje, H., Huneeus, N., Jones, L., Kaiser, J. W., Kinne, S., Mangold, A., Razinger, M., Simmons, A. J., and Suttie, M.: Aerosol analysis and forecast in the European Centre for Medium-Range Weather Forecasts Integrated Forecast System: 2. Data assimilation, J. Geophys. Res.-Atmos., 114, D13205, https://doi.org/10.1029/2008JD011115, 2009.
Bond, T. C. and Bergstrom, R. W.: Light Absorption by Carbonaceous Particles: An Investigative Review, Aerosol Sci. Tech., 40, 27–67, https://doi.org/10.1080/02786820500421521, 2006.
Bond, T. C., Doherty, S., Fahey, D. W., Forster, P., Berntsen, T., DeAngelo, B., Flanner, M., Ghan, S., Kärcher, B., Koch, D., Kinne, S., Kondo, Y., Quinn, P. K., Sarofim, M., Schultz, M., Michael, S., Venkataraman, C., Zhang, H., Zhang, S., and Zender, C. S.: Bounding the role of black carbon in the climate system: A Scientific assessment, J. Geophys. Res.-Atmos., 118, 5380–5552, https://doi.org/10.1002/jgrd.50171, 2013.
Cappa, C. D., Zhang, X., Russell, L. M., Collier, S., Lee, A. K. Y., Chen, C.-L., Betha, R., Chen, S., Liu, J., Price, D. J., Sanchez, K. J., McMeeking, G. R., Williams, L. R., Onasch, T. B., Worsnop, D. R., Abbatt, J., and Zhang, Q.: Light Absorption by Ambient Black and Brown Carbon and its Dependence on Black Carbon Coating State for Two California, USA, Cities in Winter and Summer, J. Geophys. Res.-Atmos., 124, 1550–1577, https://doi.org/10.1029/2018JD029501, 2019.
Chang, Y., Huang, R., Ge, X., Huang, X., Hu, J., Duan, Y., Zou, Z., Liu, X., and Lehmann, M. F.: Puzzling Haze Events in China During the Coronavirus (COVID-19) Shutdown, Geophys. Res. Lett., 47, e2020GL088533, https://doi.org/10.1029/2020GL088533, 2020.
Chen, H., Huo, J., Fu, Q., Duan, Y., Xiao, H., and Chen, J.: Impact of quarantine measures on chemical compositions of PM2.5 during the COVID-19 epidemic in Shanghai, China, Sci. Total Environ., 743, 140758, https://doi.org/10.1016/j.scitotenv.2020.140758, 2020.
Chen, L., Zhang, F., Yan, P., Wang, X., Sun, L., Li, Y., Zhang, X., Sun, Y., and Li, Z.: The large proportion of black carbon (BC)-containing aerosols in the urban atmosphere, Environ. Pollut., 263, 114507, https://doi.org/10.1016/j.envpol.2020.114507, 2020.
Chen, L., Qi, X., Nie, W., Wang, J., Xu, Z., Wang, T., Liu, Y., Shen, Y., Xu, Z., Kokkonen, T., Chi, X., Aalto, P., Paasonen, P., Kerminen, V.-M., Petäjä, T., Kulmala, M., and Ding, A.: Cluster Analysis of Submicron Particle Number Size Distributions at the SORPES Station in the Yangtze River Delta of East China, J. Geophys. Res.-Atmos., 126, e2020JD034004, https://doi.org/10.1029/2020JD034004, 2021.
Cheng, Y. F., Su, H., Rose, D., Gunthe, S. S., Berghof, M., Wehner, B., Achtert, P., Nowak, A., Takegawa, N., Kondo, Y., Shiraiwa, M., Gong, Y. G., Shao, M., Hu, M., Zhu, T., Zhang, Y. H., Carmichael, G. R., Wiedensohler, A., Andreae, M. O., and Pöschl, U.: Size-resolved measurement of the mixing state of soot in the megacity Beijing, China: diurnal cycle, aging and parameterization, Atmos. Chem. Phys., 12, 4477–4491, https://doi.org/10.5194/acp-12-4477-2012, 2012.
Chien, L.-C., Chen, L.-W. A., and Lin, R.-T.: Lagged meteorological impacts on COVID-19 incidence among high-risk counties in the United States – a spatiotemporal analysis, J. Expo. Sci. Env. Epid., 32, 774–781, https://doi.org/10.1038/s41370-021-00356-y, 2022.
Clemente, Á., Yubero, E., Nicolás, J. F., Caballero, S., Crespo, J., and Galindo, N.: Changes in the concentration and composition of urban aerosols during the COVID-19 lockdown, Environ. Res., 203, 111788, https://doi.org/10.1016/j.envres.2021.111788, 2022.
Cui, S., Xian, J., Shen, F., Zhang, L., Deng, B., Zhang, Y., and Ge, X.: One-Year Real-Time Measurement of Black Carbon in the Rural Area of Qingdao, Northeastern China: Seasonal Variations, Meteorological Effects, and the COVID-19 Case Analysis, Atmosphere, 12, 394, https://doi.org/10.3390/atmos12030394, 2021.
Cui, Y., Ji, D., Maenhaut, W., Gao, W., Zhang, R., and Wang, Y.: Levels and sources of hourly PM2.5-related elements during the control period of the COVID-19 pandemic at a rural site between Beijing and Tianjin, Sci. Total Environ., 744, 140840, https://doi.org/10.1016/j.scitotenv.2020.140840, 2020.
Dai, Y.: Data of BCc particles during the 2021 summer COVID-19 lockdown in YZ, figshare [data set], https://doi.org/10.6084/m9.figshare.24427795.v3, 2023.
Ding, A., Huang, X., Nie, W., Chi, X., Xu, Z., Zheng, L., Xu, Z., Xie, Y., Qi, X., Shen, Y., Sun, P., Wang, J., Wang, L., Sun, J., Yang, X.-Q., Qin, W., Zhang, X., Cheng, W., Liu, W., Pan, L., and Fu, C.: Significant reduction of PM2.5 in eastern China due to regional-scale emission control: evidence from SORPES in 2011–2018, Atmos. Chem. Phys., 19, 11791–11801, https://doi.org/10.5194/acp-19-11791-2019, 2019.
Ding, S., Liu, D., Hu, K., Zhao, D., Tian, P., Wang, F., Li, R., Chen, Y., He, H., Huang, M., and Ding, D.: Optical and hygroscopic properties of black carbon influenced by particle microphysics at the top of the anthropogenically polluted boundary layer, Atmos. Chem. Phys., 21, 681–694, https://doi.org/10.5194/acp-21-681-2021, 2021.
Feng, Z., Zheng, F., Liu, Y., Fan, X., Yan, C., Zhang, Y., Daellenbach, K. R., Bianchi, F., Petäjä, T., Kulmala, M., and Bao, X.: Evolution of organic carbon during COVID-19 lockdown period: Possible contribution of nocturnal chemistry, Sci. Total Environ., 808, 152191, https://doi.org/10.1016/j.scitotenv.2021.152191, 2022.
Ge, B., Xu, D., Wild, O., Yao, X., Wang, J., Chen, X., Tan, Q., Pan, X., and Wang, Z.: Inter-annual variations of wet deposition in Beijing from 2014–2017: implications of below-cloud scavenging of inorganic aerosols, Atmos. Chem. Phys., 21, 9441–9454, https://doi.org/10.5194/acp-21-9441-2021, 2021.
Gorelick, N., Hancher, M., Dixon, M., Ilyushchenko, S., Thau, D., and Moore, R.: Google Earth Engine: Planetary-scale geospatial analysis for everyone, Remote Sens. Environ., 202, 18–27, https://doi.org/10.1016/j.rse.2017.06.031, 2017.
He, C., Liou, K.-N., Takano, Y., Zhang, R., Levy Zamora, M., Yang, P., Li, Q., and Leung, L. R.: Variation of the radiative properties during black carbon aging: theoretical and experimental intercomparison, Atmos. Chem. Phys., 15, 11967–11980, https://doi.org/10.5194/acp-15-11967-2015, 2015.
Hopke, P. K., Gao, N., and Cheng, M.-D.: Combining chemical and meteorological data to infer source areas of airborne pollutants, Chemometr. Intell. Lab., 19, 187–199, https://doi.org/10.1016/0169-7439(93)80103-O, 1993.
Huang, X., Wang, Z., and Ding, A.: Impact of Aerosol-PBL Interaction on Haze Pollution: Multiyear Observational Evidences in North China, Geophys. Res. Lett., 45, 8596–8603, https://doi.org/10.1029/2018GL079239, 2018.
Huang, X., Ding, A., Gao, J., Zheng, B., Zhou, D., Qi, X., Tang, R., Wang, J., Ren, C., Nie, W., Chi, X., Xu, Z., Chen, L., Li, Y., Che, F., Pang, N., Wang, H., Tong, D., Qin, W., Cheng, W., Liu, W., Fu, Q., Liu, B., Chai, F., Davis, S. J., Zhang, Q., and He, K.: Enhanced secondary pollution offset reduction of primary emissions during COVID-19 lockdown in China, Natl. Sci. Rev., 8, nwaa137, https://doi.org/10.1093/nsr/nwaa137, 2021.
Isokääntä, S., Kim, P., Mikkonen, S., Kühn, T., Kokkola, H., Yli-Juuti, T., Heikkinen, L., Luoma, K., Petäjä, T., Kipling, Z., Partridge, D., and Virtanen, A.: The effect of clouds and precipitation on the aerosol concentrations and composition in a boreal forest environment, Atmos. Chem. Phys., 22, 11823–11843, https://doi.org/10.5194/acp-22-11823-2022, 2022.
Jacobson, M. Z.: Analysis of aerosol interactions with numerical techniques for solving coagulation, nucleation, condensation, dissolution, and reversible chemistry among multiple size distributions, J. Geophys. Res.-Atmos., 107, AAC 2-1–AAC 2-23, https://doi.org/10.1029/2001JD002044, 2002.
Jain, C. D., Madhavan, B. L., Singh, V., Prasad, P., Sai Krishnaveni, A., Ravi Kiran, V., and Venkat Ratnam, M.: Phase-wise analysis of the COVID-19 lockdown impact on aerosol, radiation and trace gases and associated chemistry in a tropical rural environment, Environ. Res., 194, 110665, https://doi.org/10.1016/j.envres.2020.110665, 2021.
Jeong, C.-H., Yousif, M., and Evans, G. J.: Impact of the COVID-19 lockdown on the chemical composition and sources of urban PM2.5, Environ. Pollut., 292, 118417, https://doi.org/10.1016/j.envpol.2021.118417, 2022.
Kahnert, M.: On the Discrepancy between Modeled and Measured Mass Absorption Cross Sections of Light Absorbing Carbon Aerosols, Aerosol Sci. Tech., 44, 453–460, https://doi.org/10.1080/02786821003733834, 2010.
Kandler, K., Schneiders, K., Ebert, M., Hartmann, M., Weinbruch, S., Prass, M., and Pöhlker, C.: Composition and mixing state of atmospheric aerosols determined by electron microscopy: method development and application to aged Saharan dust deposition in the Caribbean boundary layer, Atmos. Chem. Phys., 18, 13429–13455, https://doi.org/10.5194/acp-18-13429-2018, 2018.
Kondo, Y., Matsui, H., Moteki, N., Sahu, L., Takegawa, N., Kajino, M., Zhao, Y., Cubison, M. J., Jimenez, J. L., Vay, S., Diskin, G. S., Anderson, B., Wisthaler, A., Mikoviny, T., Fuelberg, H. E., Blake, D. R., Huey, G., Weinheimer, A. J., Knapp, D. J., and Brune, W. H.: Emissions of black carbon, organic, and inorganic aerosols from biomass burning in North America and Asia in 2008, J. Geophys. Res.-Atmos., 116, D08204, https://doi.org/10.1029/2010JD015152, 2011.
Laughner, J. L., Neu, J. L., Schimel, D., Wennberg, P. O., Barsanti, K., Bowman, K. W., Chatterjee, A., Croes, B. E., Fitzmaurice, H. L., Henze, D. K., Kim, J., Kort, E. A., Liu, Z., Miyazaki, K., Turner, A. J., Anenberg, S., Avise, J., Cao, H., Crisp, D., de Gouw, J., Eldering, A., Fyfe, J. C., Goldberg, D. L., Gurney, K. R., Hasheminassab, S., Hopkins, F., Ivey, C. E., Jones, D. B. A., Liu, J., Lovenduski, N. S., Martin, R. V., McKinley, G. A., Ott, L., Poulter, B., Ru, M., Sander, S. P., Swart, N., Yung, Y. L., and Zeng, Z.-C.: Societal shifts due to COVID-19 reveal large-scale complexities and feedbacks between atmospheric chemistry and climate change, P. Natl. Acad. Sci. USA, 118, e2109481118, https://doi.org/10.1073/pnas.2109481118, 2021.
Le, T., Wang, Y., Liu, L., Yang, J., Yung, Y. L., Li, G., and Seinfeld, J. H.: Unexpected air pollution with marked emission reductions during the COVID-19 outbreak in China, Science, 369, 702–706, https://doi.org/10.1126/science.abb7431, 2020.
Li, J., Jiang, L., Chen, C., Liu, D., Du, S., Zhang, Y., Yang, Y., and Tang, L.: Characteristics and Sources of Black Carbon Aerosol in a Mega-City in the Western Yangtze River Delta, China, Atmosphere, 11, 315, https://doi.org/10.3390/atmos11040315, 2020.
Li, K., Wang, X., Lu, X., Chen, H., and Yang, X.: Effects of Volatile Components on Mixing State and Size Distribution of Individual Black Carbon Aerosols, Aerosol Air Qual. Res., 22, 210400, https://doi.org/10.4209/aaqr.210400, 2022.
Li, L., Huang, Z., Dong, J., Li, M., Gao, W., Nian, H., Fu, Z., Zhang, G., Bi, X., Cheng, P., and Zhou, Z.: Real time bipolar time-of-flight mass spectrometer for analyzing single aerosol particles, Int. J. Mass Spectrom., 303, 118–124, https://doi.org/10.1016/j.ijms.2011.01.017, 2011.
Li, L., Li, Q., Huang, L., Wang, Q., Zhu, A., Xu, J., Liu, Z., Li, H., Shi, L., Li, R., Azari, M., Wang, Y., Zhang, X., Liu, Z., Zhu, Y., Zhang, K., Xue, S., Ooi, M. C. G., Zhang, D., and Chan, A.: Air quality changes during the COVID-19 lockdown over the Yangtze River Delta Region: An insight into the impact of human activity pattern changes on air pollution variation, Sci. Total Environ., 732, 139282, https://doi.org/10.1016/j.scitotenv.2020.139282, 2020.
Liu, D., Joshi, R., Wang, J., Yu, C., Allan, J. D., Coe, H., Flynn, M. J., Xie, C., Lee, J., Squires, F., Kotthaus, S., Grimmond, S., Ge, X., Sun, Y., and Fu, P.: Contrasting physical properties of black carbon in urban Beijing between winter and summer, Atmos. Chem. Phys., 19, 6749–6769, https://doi.org/10.5194/acp-19-6749-2019, 2019.
Liu, Q., Jing, B., Peng, C., Tong, S., Wang, W., and Ge, M.: Hygroscopicity of internally mixed multi-component aerosol particles of atmospheric relevance, Atmos. Environ., 125, 69–77, https://doi.org/10.1016/j.atmosenv.2015.11.003, 2016.
Luo, J., Li, Z., Zhang, C., Zhang, Q., Zhang, Y., Zhang, Y., Curci, G., and Chakrabarty, R. K.: Regional impacts of black carbon morphologies on shortwave aerosol–radiation interactions: a comparative study between the US and China, Atmos. Chem. Phys., 22, 7647–7666, https://doi.org/10.5194/acp-22-7647-2022, 2022.
Luo, L., Bai, X., Lv, Y., Liu, S., Guo, Z., Liu, W., Hao, Y., Sun, Y., Hao, J., Zhang, K., Zhao, H., Lin, S., Zhao, S., Xiao, Y., Yang, J., and Tian, H.: Exploring the driving factors of haze events in Beijing during Chinese New Year holidays in 2020 and 2021 under the influence of COVID-19 pandemic, Sci. Total Environ., 859, 160172, https://doi.org/10.1016/j.scitotenv.2022.160172, 2023.
Moffet, R. C., Rödel, T. C., Kelly, S. T., Yu, X. Y., Carroll, G. T., Fast, J., Zaveri, R. A., Laskin, A., and Gilles, M. K.: Spectro-microscopic measurements of carbonaceous aerosol aging in Central California, Atmos. Chem. Phys., 13, 10445–10459, https://doi.org/10.5194/acp-13-10445-2013, 2013.
Morcrette, J.-J., Boucher, O., Jones, L., Salmond, D., Bechtold, P., Beljaars, A., Benedetti, A., Bonet, A., Kaiser, J. W., Razinger, M., Schulz, M., Serrar, S., Simmons, A. J., Sofiev, M., Suttie, M., Tompkins, A. M., and Untch, A.: Aerosol analysis and forecast in the European Centre for Medium-Range Weather Forecasts Integrated Forecast System: Forward modeling, J. Geophys. Res.-Atmos., 114, D06206, https://doi.org/10.1029/2008JD011235, 2009.
Nie, D., Shen, F., Wang, J., Ma, X., Li, Z., Ge, P., Ou, Y., Jiang, Y., Chen, M., Chen, M., Wang, T., and Ge, X.: Changes of air quality and its associated health and economic burden in 31 provincial capital cities in China during COVID-19 pandemic, Atmos. Res., 249, 105328, https://doi.org/10.1016/j.atmosres.2020.105328, 2021.
Peng, J., Hu, M., Guo, S., Du, Z., Zheng, J., Shang, D., Levy Zamora, M., Zeng, L., Shao, M., Wu, Y.-S., Zheng, J., Wang, Y., Glen, C. R., Collins, D. R., Molina, M. J., and Zhang, R.: Markedly enhanced absorption and direct radiative forcing of black carbon under polluted urban environments, P. Natl. Acad. Sci. USA, 113, 4266–4271, https://doi.org/10.1073/pnas.1602310113, 2016.
Polissar, A. V., Hopke, P. K., Paatero, P., Kaufmann, Y. J., Hall, D. K., Bodhaine, B. A., Dutton, E. G., and Harris, J. M.: The aerosol at Barrow, Alaska: long-term trends and source locations, Atmos. Environ., 33, 2441–2458, https://doi.org/10.1016/S1352-2310(98)00423-3, 1999.
Qin, M., Hu, A., Mao, J., Li, X., Sheng, L., Sun, J., Li, J., Wang, X., Zhang, Y., and Hu, J.: PM2.5 and O3 relationships affected by the atmospheric oxidizing capacity in the Yangtze River Delta, China, Sci. Total Environ., 810, 152268, https://doi.org/10.1016/j.scitotenv.2021.152268, 2021.
Ramanathan, V. and Carmichael, G.: Global and regional climate changes due to black carbon, Nat. Geosci., 1, 221–227, https://doi.org/10.1038/ngeo156, 2008.
Sedlacek, A. J., Lewis, E. R., Onasch, T. B., Zuidema, P., Redemann, J., Jaffe, D., and Kleinman, L. I.: Using the Black Carbon Particle Mixing State to Characterize the Lifecycle of Biomass Burning Aerosols, Environ. Sci. Technol., 56, 14315–14325, https://doi.org/10.1021/acs.est.2c03851, 2022.
Silva, P. J., Liu, D.-Y., Noble, C. A., and Prather, K. A.: Size and Chemical Characterization of Individual Particles Resulting from Biomass Burning of Local Southern California Species, Environ. Sci. Technol., 33, 3068–3076, https://doi.org/10.1021/es980544p, 1999.
Song, X.-H., Hopke, P. K., Fergenson, D. P., and Prather, K. A.: Classification of Single Particles Analyzed by ATOFMS Using an Artificial Neural Network, ART-2A, Anal. Chem., 71, 860–865, https://doi.org/10.1021/ac9809682, 1999.
Steinfeld, J. I.: Atmospheric Chemistry and Physics: From Air Pollution to Climate Change, Environment: Science and Policy for Sustainable Development, 40, p. 26, https://doi.org/10.1080/00139157.1999.10544295, 1998.
Sulaymon, I. D., Zhang, Y., Hopke, P. K., Hu, J., Zhang, Y., Li, L., Mei, X., Gong, K., Shi, Z., Zhao, B., and Zhao, F.: Persistent high PM2.5 pollution driven by unfavorable meteorological conditions during the COVID-19 lockdown period in the Beijing-Tianjin-Hebei region, China, Environ. Res., 198, 111186, https://doi.org/10.1016/j.envres.2021.111186, 2021a.
Sulaymon, I. D., Zhang, Y., Hopke, P. K., Zhang, Y., Hua, J., and Mei, X.: COVID-19 pandemic in Wuhan: Ambient air quality and the relationships between criteria air pollutants and meteorological variables before, during, and after lockdown, Atmos. Res., 250, 105362, https://doi.org/10.1016/j.atmosres.2020.105362, 2021b.
Sun, J., Sun, Y., Xie, C., Xu, W., Chen, C., Wang, Z., Li, L., Du, X., Huang, F., Li, Y., Li, Z., Pan, X., Ma, N., Xu, W., Fu, P., and Wang, Z.: The chemical composition and mixing state of BC-containing particles and the implications on light absorption enhancement, Atmos. Chem. Phys., 22, 7619–7630, https://doi.org/10.5194/acp-22-7619-2022, 2022a.
Sun, J., Wang, Z., Zhou, W., Xie, C., Wu, C., Chen, C., Han, T., Wang, Q., Li, Z., Li, J., Fu, P., Wang, Z., and Sun, Y.: Measurement report: Long-term changes in black carbon and aerosol optical properties from 2012 to 2020 in Beijing, China, Atmos. Chem. Phys., 22, 561–575, https://doi.org/10.5194/acp-22-561-2022, 2022b.
Sun, Y., Du, W., Fu, P., Wang, Q., Li, J., Ge, X., Zhang, Q., Zhu, C., Ren, L., Xu, W., Zhao, J., Han, T., Worsnop, D. R., and Wang, Z.: Primary and secondary aerosols in Beijing in winter: sources, variations and processes, Atmos. Chem. Phys., 16, 8309–8329, https://doi.org/10.5194/acp-16-8309-2016, 2016.
Sun, Y., Lei, L., Zhou, W., Chen, C., He, Y., Sun, J., Li, Z., Xu, W., Wang, Q., Ji, D., Fu, P., Wang, Z., and Worsnop, D. R.: A chemical cocktail during the COVID-19 outbreak in Beijing, China: Insights from six-year aerosol particle composition measurements during the Chinese New Year holiday, Sci. Total Environ., 742, 140739, https://doi.org/10.1016/j.scitotenv.2020.140739, 2020.
Surdu, M., Lamkaddam, H., Wang, D. S., Bell, D. M., Xiao, M., Lee, C. P., Li, D., Caudillo, L., Marie, G., Scholz, W., Wang, M., Lopez, B., Piedehierro, A. A., Ataei, F., Baalbaki, R., Bertozzi, B., Bogert, P., Brasseur, Z., Dada, L., Duplissy, J., Finkenzeller, H., He, X.-C., Höhler, K., Korhonen, K., Krechmer, J. E., Lehtipalo, K., Mahfouz, N. G. A., Manninen, H. E., Marten, R., Massabò, D., Mauldin, R., Petäjä, T., Pfeifer, J., Philippov, M., Rörup, B., Simon, M., Shen, J., Umo, N. S., Vogel, F., Weber, S. K., Zauner-Wieczorek, M., Volkamer, R., Saathoff, H., Möhler, O., Kirkby, J., Worsnop, D. R., Kulmala, M., Stratmann, F., Hansel, A., Curtius, J., Welti, A., Riva, M., Donahue, N. M., Baltensperger, U., and El Haddad, I.: Molecular Understanding of the Enhancement in Organic Aerosol Mass at High Relative Humidity, Environ. Sci. Technol., 57, 2297–2309, https://doi.org/10.1021/acs.est.2c04587, 2023.
Tang, G., Zhu, X., Hu, B., Xin, J., Wang, L., Münkel, C., Mao, G., and Wang, Y.: Impact of emission controls on air quality in Beijing during APEC 2014: lidar ceilometer observations, Atmos. Chem. Phys., 15, 12667–12680, https://doi.org/10.5194/acp-15-12667-2015, 2015.
Taylor, J. W., Allan, J. D., Allen, G., Coe, H., Williams, P. I., Flynn, M. J., Le Breton, M., Muller, J. B. A., Percival, C. J., Oram, D., Forster, G., Lee, J. D., Rickard, A. R., Parrington, M., and Palmer, P. I.: Size-dependent wet removal of black carbon in Canadian biomass burning plumes, Atmos. Chem. Phys., 14, 13755–13771, https://doi.org/10.5194/acp-14-13755-2014, 2014.
Wang, H., Miao, Q., Shen, L., Yang, Q., Wu, Y., and Wei, H.: Air pollutant variations in Suzhou during the 2019 novel coronavirus (COVID-19) lockdown of 2020: High time-resolution measurements of aerosol chemical compositions and source apportionment, Environ. Pollut., 271, 116298, https://doi.org/10.1016/j.envpol.2020.116298, 2021.
Wang, J., Liu, D., Ge, X., Wu, Y., Shen, F., Chen, M., Zhao, J., Xie, C., Wang, Q., Xu, W., Zhang, J., Hu, J., Allan, J., Joshi, R., Fu, P., Coe, H., and Sun, Y.: Characterization of black carbon-containing fine particles in Beijing during wintertime, Atmos. Chem. Phys., 19, 447–458, https://doi.org/10.5194/acp-19-447-2019, 2019.
Wang, J., Ge, X., Sonya, C., Ye, J., Lei, Y., Chen, M., and Zhang, Q.: Influence of regional emission controls on the chemical composition, sources, and size distributions of submicron aerosols: Insights from the 2014 Nanjing Youth Olympic Games, Sci. Total Environ., 807, 150869, https://doi.org/10.1016/j.scitotenv.2021.150869, 2022.
Wang, P., Chen, K., Zhu, S., Wang, P., and Zhang, H.: Severe air pollution events not avoided by reduced anthropogenic activities during COVID-19 outbreak, Resour. Conserv. Recy., 158, 104814, https://doi.org/10.1016/j.resconrec.2020.104814, 2020.
Wang, Q., Liu, S., Zhou, Y., Cao, J., Han, Y., Ni, H., Zhang, N., and Huang, R.: Characteristics of Black Carbon Aerosol during the Chinese Lunar Year and Weekdays in Xi'an, China, Atmosphere, 6, 195–208, https://doi.org/10.3390/atmos6020195, 2015.
Wang, S., Zhao, M., Xing, J., Wu, Y., Zhou, Y., Lei, Y., He, K., Fu, L., and Hao, J.: Quantifying the Air Pollutants Emission Reduction during the 2008 Olympic Games in Beijing, Environ. Sci. Technol., 44, 2490–2496, https://doi.org/10.1021/es9028167, 2010.
Wang, Y., Zhu, S., Ma, J., Shen, J., Wang, P., Wang, P., and Zhang, H.: Enhanced atmospheric oxidation capacity and associated ozone increases during COVID-19 lockdown in the Yangtze River Delta, Sci. Total Environ., 768, 144796, https://doi.org/10.1016/j.scitotenv.2020.144796, 2021.
Wang, Y. Q.: MeteoInfo: GIS software for meteorological data visualization and analysis, Meteorol. Appl., 21, 360–368, https://doi.org/10.1002/met.1345, 2014.
Wang, Y. Q., Zhang, X. Y., and Draxler, R. R.: TrajStat: GIS-based software that uses various trajectory statistical analysis methods to identify potential sources from long-term air pollution measurement data, Environ. Modell. Softw., 24, 938–939, https://doi.org/10.1016/j.envsoft.2009.01.004, 2009.
WHO: WHO global air quality guidelines: particulate matter (PM2.5 and PM10), ozone, nitrogen dioxide, sulfur dioxide and carbon, World Health Organization, https://iris.who.int/handle/10665/345329 (last access: 27 August 2024), 2021.
Xie, C., He, Y., Lei, L., Zhou, W., Liu, J., Wang, Q., Xu, W., Qiu, Y., Zhao, J., Sun, J., Li, L., Li, M., Zhou, Z., Fu, P., Wang, Z., and Sun, Y.: Contrasting mixing state of black carbon-containing particles in summer and winter in Beijing, Environ. Pollut., 263, 114455, https://doi.org/10.1016/j.envpol.2020.114455, 2020.
Xu, J., Ge, X., Zhang, X., Zhao, W., Zhang, R., and Zhang, Y.: COVID-19 Impact on the Concentration and Composition of Submicron Particulate Matter in a Typical City of Northwest China, Geophys. Res. Lett., 47, e2020GL089035, https://doi.org/10.1029/2020GL089035, 2020.
Yang, J., Ma, S., Gao, B., Li, X., Zhang, Y., Cai, J., Li, M., Yao, L., Huang, B., and Zheng, M.: Single particle mass spectral signatures from vehicle exhaust particles and the source apportionment of on-line PM2.5 by single particle aerosol mass spectrometry, Sci. Total Environ., 593–594, 310–318, https://doi.org/10.1016/j.scitotenv.2017.03.099, 2017.
Zhang, G., Fu, Y., Peng, X., Sun, W., Shi, Z., Song, W., Hu, W., Chen, D., Lian, X., Li, L., Tang, M., Wang, X., and Bi, X.: Black Carbon Involved Photochemistry Enhances the Formation of Sulfate in the Ambient Atmosphere: Evidence From In Situ Individual Particle Investigation, J. Geophys. Res.-Atmos., 126, e2021JD035226, https://doi.org/10.1029/2021JD035226, 2021.
Zhang, J., Yuan, Q., Liu, L., Wang, Y., Zhang, Y., Xu, L., Pang, Y., Zhu, Y., Niu, H., Shao, L., Yang, S., Liu, H., Pan, X., Shi, Z., Hu, M., Fu, P., and Li, W.: Trans-Regional Transport of Haze Particles From the North China Plain to Yangtze River Delta During Winter, J. Geophys. Res.-Atmos., 126, e2020JD033778, https://doi.org/10.1029/2020JD033778, 2021.
Zhang, J., Li, H., Chen, L., Huang, X., Zhang, W., and Zhao, R.: Particle composition, sources and evolution during the COVID-19 lockdown period in Chengdu, southwest China: Insights from single particle aerosol mass spectrometer data, Atmos. Environ., 268, 118844, https://doi.org/10.1016/j.atmosenv.2021.118844, 2022.
Zhang, K., Liu, Z., Zhang, X., Li, Q., Jensen, A., Tan, W., Huang, L., Wang, Y., de Gouw, J., and Li, L.: Insights into the significant increase in ozone during COVID-19 in a typical urban city of China, Atmos. Chem. Phys., 22, 4853–4866, https://doi.org/10.5194/acp-22-4853-2022, 2022.
Zhang Y., Wang X., Chen H., Yang X., Chen J., and Alien J. O.: Source Apportionment Of Lead-containing Aerosol Particles In Shanghai Using Single Particle Mass Spectrometry, Chemosphere, 74, 501–507, 2009.
Zhang, Y., Yuan, Q., Huang, D., Kong, S., Zhang, J., Wang, X., Lu, C., Shi, Z., Zhang, X., Sun, Y., Wang, Z., Shao, L., Zhu, J., and Li, W.: Direct Observations of Fine Primary Particles From Residential Coal Burning: Insights Into Their Morphology, Composition, and Hygroscopicity, J. Geophys. Res.-Atmos., 123, 12964–12979, https://doi.org/10.1029/2018JD028988, 2018.
Zhang, Y., Liu, X., Zhang, L., Tang, A., Goulding, K., and Collett, J. L.: Evolution of secondary inorganic aerosols amidst improving PM2.5 air quality in the North China plain, Environ. Pollut., 281, 117027, https://doi.org/10.1016/j.envpol.2021.117027, 2021.
Zhang, Z., Li, H., Ho, W., Cui, L., Men, Q., Cao, L., Zhang, Y., Wang, J., Huang, C., Lee, S., Huang, Y., Chen, M., and Ge, X.: Critical Roles of Surface-Enhanced Heterogeneous Oxidation of SO2 in Haze Chemistry: Review of Extended Pathways for Complex Air Pollution, Curr. Pollution Rep., 10, 70–86, https://doi.org/10.1007/s40726-023-00287-2, 2024.
Zhou, H., Liu, T., Sun, B., Tian, Y., Zhou, X., Hao, F., Chun, X., Wan, Z., Liu, P., Wang, J., and Du, D.: Chemical characteristics and sources of PM2.5 in Hohhot, a semi-arid city in northern China: insight from the COVID-19 lockdown, Atmos. Chem. Phys., 22, 12153–12166, https://doi.org/10.5194/acp-22-12153-2022, 2022.
Zhou, X., Gao, J., Wang, T., Wu, W., and Wang, W.: Measurement of black carbon aerosols near two Chinese megacities and the implications for improving emission inventories, Atmos. Environ., 43, 3918–3924, https://doi.org/10.1016/j.atmosenv.2009.04.062, 2009.
Zhou, Y., Wu, Y., Yang, L., Fu, L., He, K., Wang, S., Hao, J., Chen, J., and Li, C.: The impact of transportation control measures on emission reductions during the 2008 Olympic Games in Beijing, China, Atmos. Environ., 44, 285–293, https://doi.org/10.1016/j.atmosenv.2009.10.040, 2010.