the Creative Commons Attribution 4.0 License.
the Creative Commons Attribution 4.0 License.
 | 28 Aug 2024
Atmospheric NH3 in urban Beijing: long-term variations and implications for secondary inorganic aerosol control
Xiaoyi Zhang
Xiaobin Xu
Zhiqiang Ma
Jun Jin
Lingyan Wu
Yangmei Zhang
Ammonia (NH3) has major effects on the environment and climate. In situ measurements of NH3 concentrations taken between June 2009 and July 2020 at an urban site in Beijing were analyzed to study its long-term behavior, responses to meteorological conditions, and influences on the formation of secondary inorganic aerosols (SIAs). The 11-year average NH3 mixing ratio was 26.9±19.3 ppb (median 23.5 ppb). The annual average NH3 mixing ratio increased from 2009 to 2017 by 50 % and then decreased by 49 % from 2017 to 2020. Notably, the long-term trend for NH3 at the ground level did not align with the trends derived from satellite observations and emission estimates. The NH3 concentration exhibited a stronger correlation with the daily variation in water vapor (H2O) concentration than with air temperature. Thermodynamic modeling revealed the nonlinear response of SIAs to NH3, with increased sensitivity when its concentration was reduced to 40 % of the initial level. Although reducing NH3 concentrations can improve air quality during winter, controlling acid gas concentrations has a greater effect than controlling NH3 concentrations on reducing SIA concentrations, until NH3 and acidic gas concentrations are reduced below 80 % of their current levels. Nevertheless, the increased mass proportion of ammonium salts in SIAs during the observation period indicates that future control measures for NH3 concentrations may need to be prioritized in Beijing.
- Article
(2393 KB) - Full-text XML
-
Supplement
(5828 KB) - BibTeX
- EndNote


Excessive input of anthropogenic nitrogen into the environment can directly harm ecosystems and influence climate change (Charlson et al., 1991; Reay et al., 2008; Shadman et al., 2016). As the most abundant alkaline trace gas in the atmosphere (Meng et al., 2017), NH3 interacts with the oxidized products of atmospheric acidic gases to form secondary aerosols, which considerably affect the radiative balance of the atmosphere and air quality (Fuzzi et al., 2015). Over the years, China has been committed to controlling air pollution and has effectively managed the emissions of primary pollutants such as sulfur dioxide (SO2) and nitrogen oxide (NOx). However, particulate matter 2.5 (PM2.5, particulate matter with a diameter less than 2.5 µm in size) pollution is still a severe problem. Existing studies on controlling SO2 and NOx emissions indicate that controlling NH3 emissions is the most economically effective way to reduce PM2.5 concentrations (Gu et al., 2021; Pinder et al., 2008; Xie et al., 2022). However, the effectiveness of NH3 reduction varies by region (M. Liu et al., 2019; Karydis et al., 2021), and there is still a debate regarding the efficacy of NH3 reduction measures (Guo et al., 2018; Meng et al., 2022; Wei and Mohamed Tahrin, 2023).
Anthropogenic sources are the primary contributors to atmospheric NH3 emissions (Olivier et al., 1998). In China, agricultural sources dominate, accounting for approximately 80 % of total emissions (Zhou et al., 2015). However, the contribution of non-agricultural sources in urban areas is considered significant. Studies indicate that over 30 % of NH3 emissions observed in urban areas can be attributed to traffic (Elser et al., 2018; Gu et al., 2022a; Walters et al., 2022). Nevertheless, some research suggests that biogenic sources (primarily green spaces) predominate in urban areas and account for approximately 60 % of emissions (Teng et al., 2017), while the contribution from traffic sources is negligible (Yao et al., 2013). The complexity of urban NH3 sources results in intricate variability in its atmospheric characteristics.
Long-term observations are important for analyzing the environmental impacts and control strategies of atmospheric NH3. In Europe (Horváth and Sutton, 1998; Sutton et al., 2001; Horvath et al., 2009; den Bril et al., 2011; Lolkema et al., 2015; Tang et al., 2018), North America (Butler et al., 2016; Yao and Zhang, 2019; Yamanouchi et al., 2021), and Asia (Yamamoto et al., 1995, 1988; Saraswati et al., 2017), studies have been conducted on NH3 variations over a period of 5 years or more. In most of these regions, NH3 concentrations have either remained stable or exhibited an increasing trend. Satellite observations have detected rising global atmospheric NH3 concentrations, influenced by reductions in acidic gas emissions, temperature increases, and the rising use of chemical fertilizers (Warner et al., 2017). In China, according to the monitoring results from the Nationwide Nitrogen Deposition Monitoring Network (NNDMN), NH3 concentrations at 12 urban sites and 43 rural sites increased by approximately 80 % from 2011 to 2018 (Wen et al., 2020). Satellite data analysis by Dong et al. (2023) indicated a significant increase (∼ 32 %) in NH3 vertical column densities in China from 2008 to 2019. In the North China Plain, a hotspot for global NH3 emissions, Luo et al. (2020) found a rapid increase in urban NH3 concentration from 2011 to 2018. Wen et al. (2024) found a 26 % decrease in Beijing NH3 concentrations from August 2005 to August 2020 and a 50 % increase from January 2005 to January 2020. To date, long-term ground-based observations of atmospheric NH3 at high temporal resolution are relatively rare in China, and the contrasting trends between NH3 emissions and satellite- and in situ-measured concentrations in urban areas have not been fully explored.
The present study examined high-temporal-resolution NH3 observations at the surface in urban Beijing from 2009 to 2020. Using data from emission inventories, satellite observations, meteorological elements, concentrations of various types of atmospheric pollutants, and particle ion composition, the present study aimed to obtain the characteristics of long-term variations in NH3, influencing factors, and the contributions of NH3 to particle formation in the atmosphere of Beijing. Analyzing long-term NH3 observations helps to understand how changes in NH3 concentrations have affected atmospheric pollution in the past. This knowledge is crucial for predicting future atmospheric pollution and formulating effective environmental policies. Furthermore, it provides a scientific basis and reference for developing future NH3 control strategies.
2.1 Data
Between June 2009 and July 2020, data on continuous online measurements of NH3 concentrations were collected in Haidian District, Beijing (39°95′ N, 116°32′ E; Fig. S1 in the Supplement). From June 2009 to September 2017, data were collected from an observational site located on the third floor of a building within the premises of the China Meteorological Administration (CMA). Subsequently, the observation site was relocated to the 14th floor of the Science and Technology Building of Minzu University of China (MUC), which is less than 1 km away from the previous location, located just across the road from it. The ground-floor elevations of both buildings are 56 m above sea level, and the observation heights above the ground are 10 m on the 3rd floor and 56 m on the 14th floor. Both observation sites are surrounded mostly by urban roads, office spaces, residential areas, and parks, and no large-scale industrial sources of NH3 were located near the site at the time of study.
Beginning in June 2009, NH3 concentration monitoring was conducted using an EC9842 NOx NH3 analyzer (Ecotech, Australia). Starting in April 2015, additional NH3 measurements were simultaneously taken using an NH3 Economical Ammonia Analyzer (EAA; Los Gatos Research, USA). From May 2016 onward, only the NH3 EAA was used. The EC9842 NOx/NH3 analyzer employs gas-phase chemiluminescence to continuously analyze NH3, NOx, and Nx concentrations; its detection limit is less than 2 ppb and data record time is 1 min. The instrument was subject to weekly zero and span checks to identify potential analyzer faults and response drift. Multipoint calibrations were typically performed every month, and data were corrected on the basis of the multipoint calibrations. The NH3 EAA features a low detection limit of less than 0.2 ppb and a maximum drift of 0.2 ppb within 24 h, with a time resolution of 50 s, and it utilizes off-axis integrated cavity output spectroscopy technology. At the CMA site, the air had been drained into an air-conditioned room with a 4.5 m long Teflon line, and the inlet height was 1.8 m above the rooftop (about 12 m above ground level). At the MUC site, air was introduced from outside the sealed window through a borehole, with the air inlet extending 20–30 cm outside the window. Since the site is on the 14th floor, the air outside the building flows smoothly. To maintain data comparability, NH3 standard gases, which had been traceable to a uniform standard, were used as measurement references. The comparison result of the two instruments can be found in Zhang et al. (2021), in which the two instruments exhibited a considerable correlation, with a correlation coefficient of 0.949 (n=5316, p<0.01) and slope s of 0.999±0.005.
During data analysis, minute-level data were converted into hourly average data. Throughout the observation period, a total of 40 692 and 46 917 valid hourly average data points were obtained from the EC9842 and EAA instruments, respectively, resulting in a total of 13 420 datasets being obtained simultaneously through measurements on the two instruments. These two sets of results exhibited a significant correlation (N=13 420, slope = 1.09, R=0.95, p<0.05), and the parallel observations from the two analyzers were generally consistent (Fig. S2). The NH3 observation data were finalized by averaging the synchronized data.
Furthermore, NH3 satellite observation data were obtained through the Metop-A satellite's Infrared Atmospheric Sounding Interferometer (IASI) remote sensing product. These data had a spatial resolution of 12×12 km2 and were collected monthly (Van Damme et al., 2017). In the present study, daytime satellite NH3 data from June 2009 to April 2020 were used. The average NH3 satellite observation results for Beijing were calculated using data for the region spanning 36.5 to 42.5° N in latitude and 113.5 to 118.5° E in longitude. The trend for satellite observation values obtained at the grid point at the location of the monitoring station closely matched the trend for the average observation values collected for this region (Fig. S3). NH3 emission inventory data for Beijing (from June 2009 to December 2017) are presented in Fig. S4, comparing NH3 emissions from Beijing and its surrounding areas (Huang et al., 2012; Kang et al., 2016). Meteorological data collected between June 2009 and February 2012 were obtained from the Beijing Capital International Airport station. From March 2012 to April 2020, meteorological data were sourced from the Haidian Meteorological Station. The temperature and relative humidity data acquired from the two stations exhibited a high level of correlation (Fig. S5). Absolute humidity was calculated using the acquired temperature and relative humidity data. Data for other pollutants such as PM2.5, SO2, and NO2 were acquired from the Wanliu Monitoring Station in Haidian District, Beijing. These monitoring data were collected between 2 April 2014 and 11 July 2020. Figure S6 provides additional details of these data.
In the present study, offline sampling of PM2.5 was conducted on the rooftop of the School of Pharmacy at Minzu University in China. Atmospheric samples were collected twice daily, specifically from 06:00 to 17:00 (all times are given in local time throughout the paper; daytime sampling) and from 18:00 to 05:00 on the following day (nighttime sampling). The sampling periods were from 8 to 21 September 2018 (autumn), 6 to 21 November 2018 (autumn), 1 to 21 January 2019 (winter), 3 to 21 March 2019 (spring), 8 to 15 May 2019 (spring), and 8 to 21 June 2019 (summer). The collected PM2.5 samples on filters were subsequently sent to the Chinese Academy of Meteorological Sciences for chemical analysis of ion components (Na+, SO, NH, NO, Cl−, Ca2+, K+, and Mg2+), from which 184 datasets were obtained. Additionally, data from the study by Hu et al. (2014) that spanned 5 May to 30 November 2009 and data from the study of Wu et al. (2019) that spanned 15 to 23 December 2016 were used in the present study as references for monitoring PM2.5 components within the premises of the China Meteorological Administration.
2.2 Data analysis methods
2.2.1 Long-term trend analysis
Long-term trends of atmospheric NH3 were obtained using ensemble empirical mode decomposition (EEMD) (Wu and Huang, 2009). This method adaptively decomposes a signal into a series of intrinsic modal functions (IMFs) from high to low frequencies. It separates oscillation or trend components of varying scales from the original signal. EEMD integrates the advantages of wavelet analysis and augments the empirical mode decomposition (EMD) method by introducing white noise. This enhancement effectively mitigates the mode mixing problem inherent in the EMD method. EEMD demonstrates greater stability in decomposing nonlinear and non-stationary data series, enabling the accurate extraction of genuine signal variations (Qian et al., 2011). Currently, EEMD has been used in studies on air-quality trend analysis (Yao and Zhang, 2016; Fu et al., 2020; Wang et al., 2022; Wang and Zhang, 2023). In the present study, the EEMD was performed using the Rlibeemd package of the R programming language (Luukko et al., 2016).
2.2.2 Thermodynamic modeling
The ISORROPIA II model is mainly used to simulate the physical state and concentration of inorganic components of the aerosol system at thermodynamic equilibrium. A distinct advantage of the ISORROPIA II model over other thermodynamic models is the inclusion of the K+, Ca2+, and Mg2+ ions in the calculations, and taking these components into account significantly improves the accuracy of the model simulations (Allen et al., 2015). Additionally, the high precision and computational efficiency of the ISORROPIA II model have been widely demonstrated (Fountoukis and Nenes, 2007). To assess the sensitivity of sulfate, nitrate, and ammonium (SNA) to changes in precursor concentrations, the present study employed the ISORROPIA II thermodynamic equilibrium, version 2.3 (http://isorropia.epfl.ch, last access: 8 April 2023). The model was run in “forward + metastable” mode, taking inputs such as temperature (in kelvins), relative humidity (up to 1), and concentrations of particulate components (SO, Cl HCl, NO HNO3, NH NH3, Na+, K+, Ca2+, and Mg2+) expressed in µg m−3 for calculations.
3.1 Long-term variations in NH3
From June 2009 to July 2020, the hourly average mixing ratio of atmospheric NH3 in Beijing was 26.9±19.3 ppb (median 23.5 ppb). Table S1 summarizes results from various NH3 monitoring studies conducted in urban areas. The results of the present study are basically consistent with the annual NH3 mixing ratio averages that have been observed in urban Beijing by other researchers through optical instruments (Gu et al., 2022a, 2022b; Pu et al., 2020; Sun et al., 2023; Wang et al., 2019). As a densely populated country with intensive agricultural activities, China contains several areas that are major global hotspots for atmospheric NH3 concentration (L. Liu et al., 2019; Van Damme et al., 2018). The monitoring results of the present study indicate that the overall NH3 mixing ratio in Beijing is lower than that in Delhi (Saraswati et al., 2019; Singh and Kulshrestha, 2014) but considerably higher than those in other developed cities such as New York, Toronto, and Rome (Chatain et al., 2022; Nguyen et al., 2021; Park et al., 2021; Perrino et al., 2002; Phan et al., 2013; Zbieranowski and Aherne, 2012; Zhou et al., 2019). Even within China, the NH3 mixing ratio in Beijing is higher relative to that in Shanghai, which is also a megacity (i.e., the NH3 mixing ratio in Shanghai is less than one-third of that in Beijing), and only a few cities in northern China have mixing ratios comparable to that in Beijing (Cao et al., 2009; Chang et al., 2019; Huang et al., 2021; Pan et al., 2018). The primary reasons for this phenomenon are the frequent agricultural activities and the presence of highly alkaline soils in the North China Plain, where Beijing is located (Ju et al., 2009).
Due to significant data gaps from January 2013 to June 2013 and from May 2017 to August 2017, the period from 2009 to 2020 was divided into three segments for linear regression analysis (Fig. S7). From June 2009 to January 2013, the observed hourly average atmospheric NH3 mixing ratio showed a decreasing trend (, p<0.05, slope = −0.01); from June 2013 to May 2017, the NH3 mixing ratio increased (R=0.04, p<0.05, slope = 0.22×10⁻²); and from September 2017 to July 2020, the NH3 concentration exhibited a decreasing trend again (, p<0.05, slope = ). Similarly to in situ observations, the satellite observations of NH3 concentration showed a decreasing trend from June 2009 to January 2013 (, p<0.05, slope = ) and an increasing trend from June 2013 to May 2017 (R=0.12, p<0.05, slope = ) but differed from in situ atmospheric NH3 trends as it continued to rise from September 2017 to July 2020 (R=0.23, p<0.05, slope = ).
To further analyze the long-term trends of the atmospheric NH3 concentration, the present study referred to the findings of Vu et al. (2019) and used meteorological factors to construct a random forest model for imputing missing values. The computed time series for the atmospheric NH3 concentration is presented in Fig. S8. The complete dataset obtained through EEMD was used to characterize the changes in atmospheric NH3 concentrations in Beijing (Fig. 1). The NH3 mixing ratio initially exhibited a slight decrease but started to increase in 2012 and peaked in 2017, subsequently declining. From 2009 to 2017, the NH3 mixing ratio increased by 50 %, but by 2020, the NH3 mixing ratio had decreased by 49 % from its peak in 2017. A comparison of monthly average NH3 concentrations obtained from satellite observations revealed that prior to 2018, the trend for the surface NH3 mixing ratio was similar to that observed by satellites, exhibiting a decline followed by an increase in atmospheric NH3 concentrations. However, starting in 2018, these two trends diverged, with satellite observations indicating a continued increase in NH3 concentrations, while the surface NH3 mixing ratio exhibited a decreasing trend. The monitoring results of this study were compared with NH3 monthly concentrations observed by NNDMN in Beijing from April 2011 to December 2015 (Xu et al., 2019) and from January 2005 to August 2020 (Wen et al., 2024) (Fig. S9). From April 2011 to December 2015, both the NH3 mixing ratio observed in this study (R=0.27, p<0.05) and the satellite-observed concentrations (R=0.28, p<0.05) exhibited increasing trends, while the NNDMN station did not show a significant trend (R=0.16, p>0.05). The NNDMN station observations from January 2009 to August 2020 were significantly correlated with this study's observations (RAug=0.66, p<0.05; RJan=0.65, p<0.05), but neither the present study's observations nor the NNDMN observations were significantly correlated with satellite-observed NH3 concentrations. Satellite observations showed a strong correlation between NH3 concentrations in the Beijing urban area and the Beijing–Tianjin–Hebei region (Fig. S3). However, measurements by Zhang et al. (2020) at five stations in Beijing indicated that four stations had lower NH3 concentrations in 2017 (winter) than in 2020 (winter + spring), while one station had higher concentrations in 2017 than in 2020, indicating variability in observation results even within the same city. Due to the short atmospheric lifetime, low transport altitude, high dry deposition rate, limited transport distance, and abundance of atmospheric NH3, its complex temporal and spatial characteristics contribute to the complexity of NH3 variations (Asman and van Jaarsveld, 1992; Nair and Yu, 2020). Satellite observations are limited by the observation height and spatial resolution, which may mask variations in local surface NH3 concentrations. Additionally, differences between the present study's observations and satellite observations may also be due to changes in the monitoring location and observation height in September 2017. However, tower observations conducted by the Institute of Atmospheric Physics, Chinese Academy of Sciences (6.7 km from the present study's site), in the urban area showed only slight variations within a 300 m altitude range (Wang et al., 2019; Zhang et al., 2019). Therefore, the change in observation altitude may have had a limited impact on the change in NH3 mixing ratio trends after 2017.
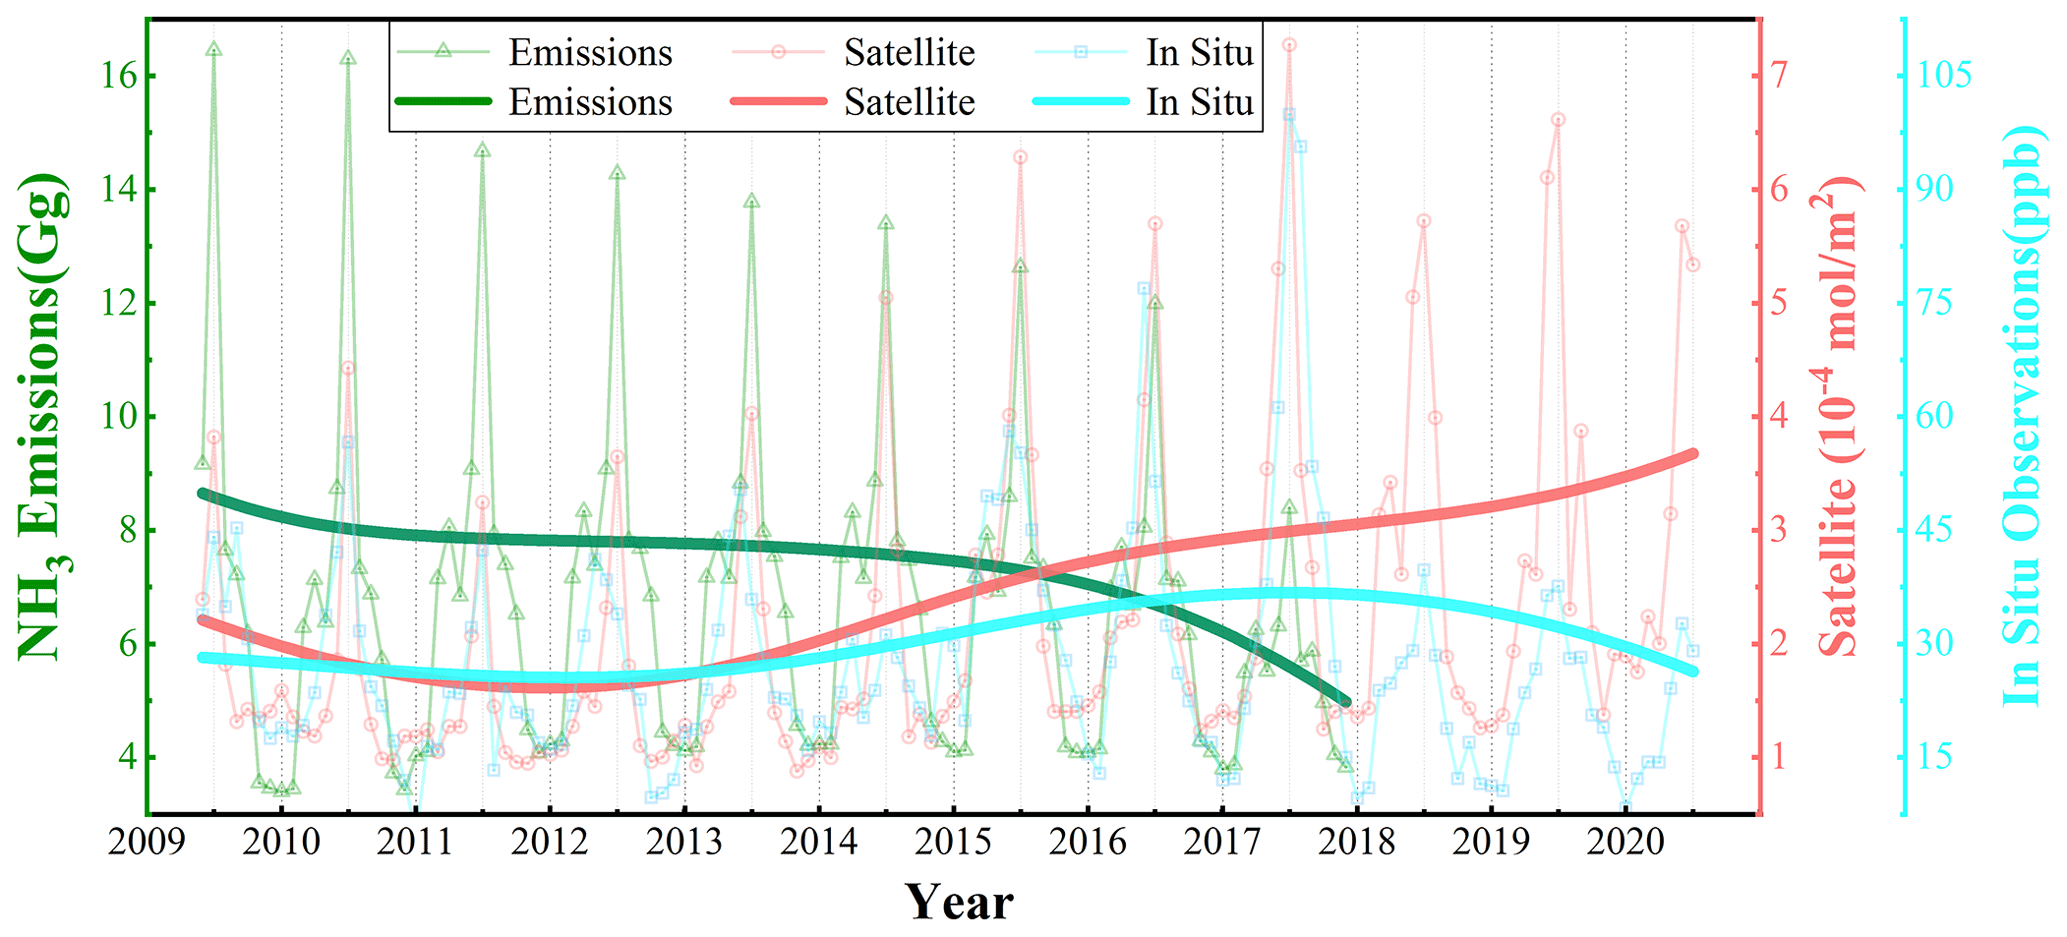
Figure 1Monthly averages of surface observations and satellite inversions of NH3 concentrations and total NH3 emissions in Beijing from June 2009 to July 2020 (fine light line) and trends pertaining to changes (thick solid line).
3.2 Influences on variation characteristics of NH3
NH3 emissions directly affect the variations in atmospheric NH3 concentrations. The emission inventory data (Fig. 1) indicate that NH3 emissions in Beijing remained stable from 2009 to 2014, peaking in 2012. After 2014, NH3 emissions in Beijing rapidly decreased, declining by 25 % from 2014 to 2017. However, during this period of declining emissions, the NH3 mixing ratio in Beijing exhibited an increasing trend. Similar phenomena have been reported by studies conducted outside of China. For instance, in Scotland, NH3 emissions decreased by approximately 15 % from 1990 to 2003, whereas atmospheric NH3 concentrations increased (Friedman and Schwartz, 2011). In Hungary, NH3 emissions were estimated to have decreased by 50 % from 1983 to 1993; however, NH3 concentrations exhibited a slight upward trend during this monitoring period (Horvath et al., 2009). A possible reason for these differences between NH3 emissions and concentrations could be the significant reduction in the concentrations of SO2 and NOx, which reduced the amount of atmospheric NH3 neutralized by acid gases (Fu et al., 2017; Lachatre et al., 2019; Liu et al., 2018; Yu et al., 2018). Over the past 2 decades, Beijing has implemented a series of strict measures to control air pollution and has achieved considerable success (United Nations Environment Programme, 2019). The concentrations of SO2, NO2, CO, PM10, and PM2.5 in Beijing all exhibited decreasing trends; in particular, the concentration of SO2 decreased by 88 % from 2009 to 2020 (Fig. 2).
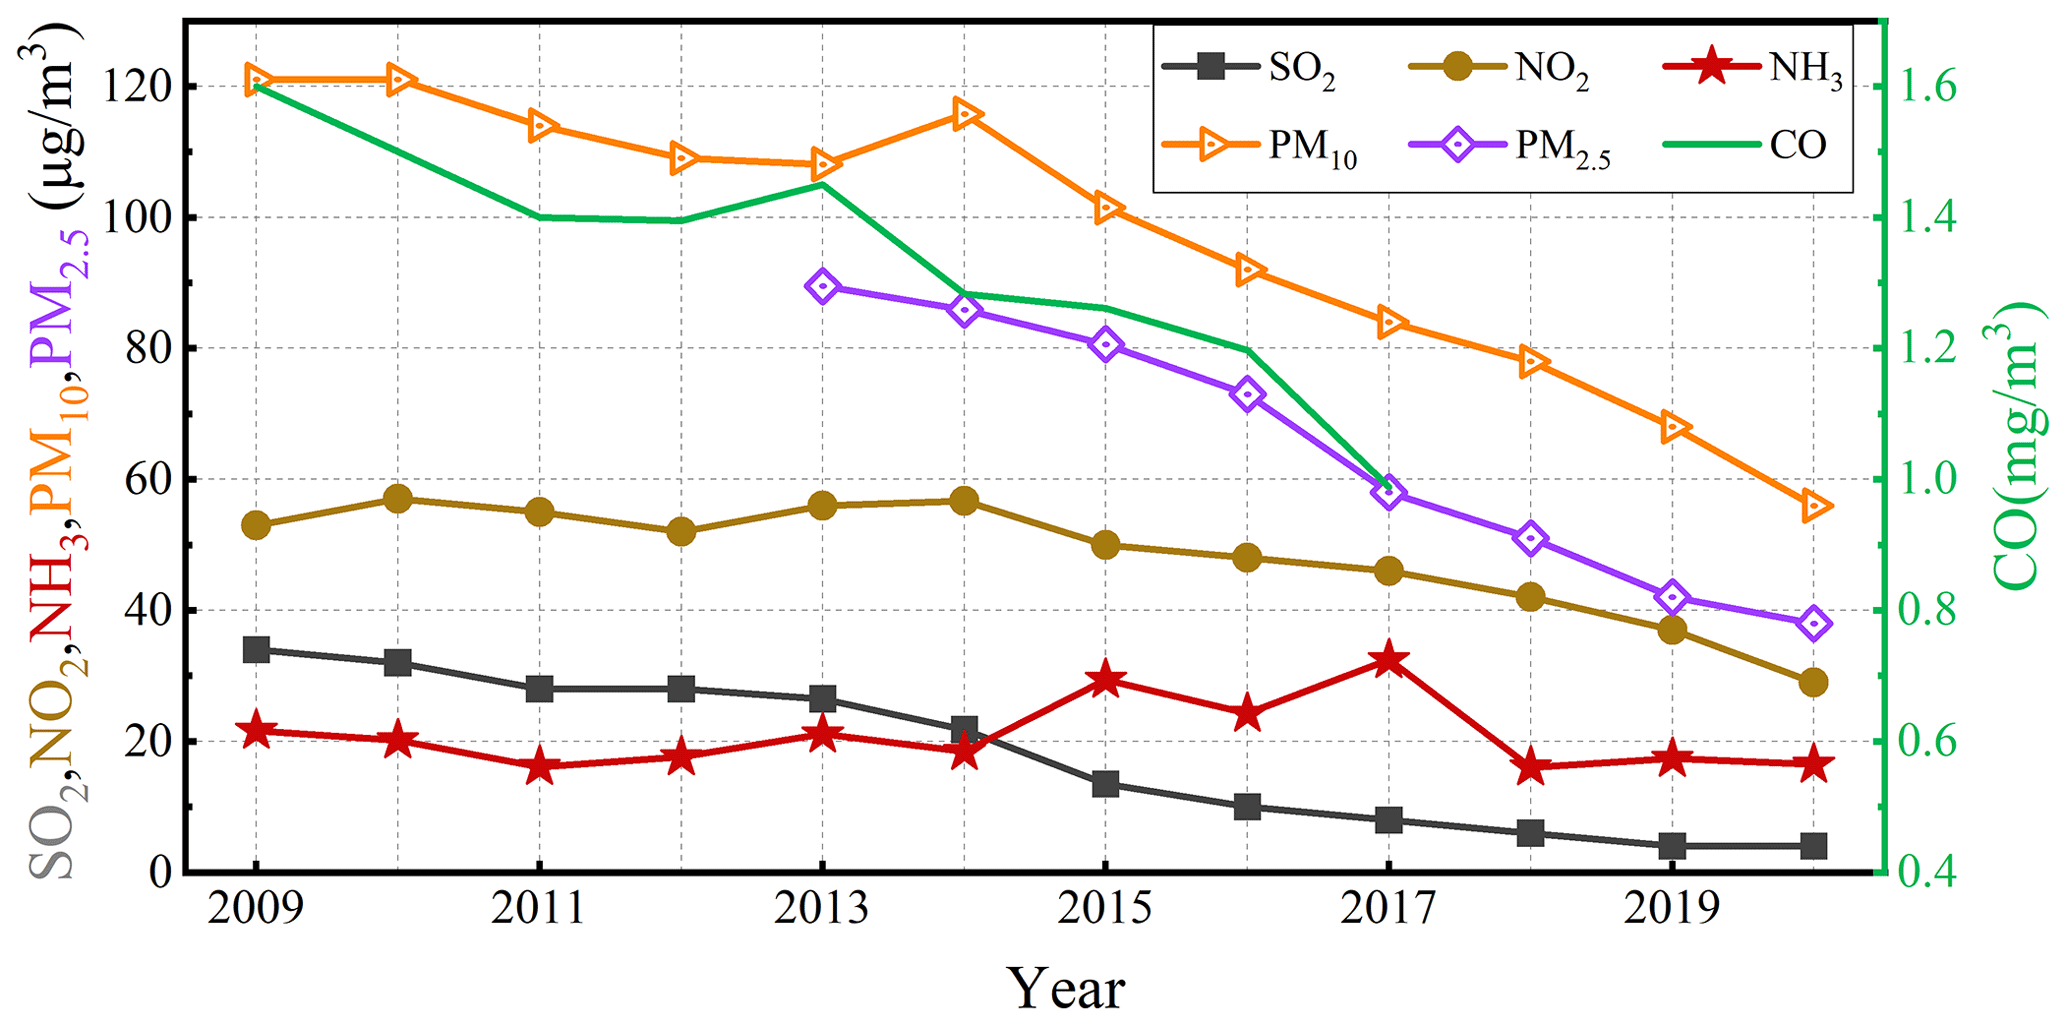
Figure 2Annual average concentrations of atmospheric NH3 and five other air pollutants in Beijing. The measurement unit is mg m−3 for CO concentration and µg m−3 for all other pollutants (air pollutant data were retrieved from the Beijing Environmental Bulletin website: http://sthjj.beijing.gov.cn/bjhrb/index/xxgk69/sthjlyzwg/1718880/1718881/1718882/, last access: 8 April 2023).
To discuss the influence of chemical loss on the annual increase in NH3 concentrations, the present study referred to research by Yao and Zhang (2019), assuming that NH is uniformly distributed in the urban area of Beijing and that changes in NH concentrations directly affect atmospheric NH3 concentrations on a 1:1 basis. By calculating the change in NH concentration relative to the baseline year, we adjust the atmospheric NH3 concentrations. The present study set 2009 as the baseline year, using the annual average NH concentration observed by Cheng (2021) in the urban area of Beijing to calculate the adjusted NH3 concentrations from 2009 to 2017. The calculations show (Fig. S10) that, overall, the original NH3 concentration in 2017 was 50 % higher than in 2009 and the adjusted NH3 concentration was 46 % higher. Therefore, changes in chemical losses have a limited impact on the increased trend of NH3 concentrations, and the discrepancy between NH3 concentrations and emission trends may be due to imperfections in the emission inventory.
Various meteorological factors can influence the atmospheric NH3 concentration. Among the factors identified, temperature has been reported to be positively correlated with NH3 concentration. An increase in temperature can increase soil NH3 emissions, leading to the equilibrium shift of particulate NH4NO3 toward gaseous NH3, which increases NH3 concentration (Behera et al., 2013; Li et al., 2014). During the observation period, the temperature in Beijing followed the seasonal sequence of summer (being the warmest) followed by spring, autumn, and winter, and the rankings of NH3 mixing ratios across the seasons were consistent with the trend. Other studies conducted in temperate regions of the Northern Hemisphere have reported similar findings (Liu et al., 2021; Shon et al., 2012; Wang et al., 2018). The interannual trends for temperature and NH3 mixing ratios across multiple seasons (Fig. 3) revealed that temperature remained stable in summer and autumn over the years; when calculated in kelvins, the average seasonal temperatures exhibited interannual variation coefficients of 0.42 % in spring, 0.15 % in summer, 0.17 % in autumn, and 0.51 % in winter. For the two seasons of summer and autumn, no significant correlation was identified between the annual average NH3 mixing ratio and the variations in temperature over the years. After 2014, the annual average temperature in spring remained stable, whereas the NH3 mixing ratio gradually decreased, possibly because of a reduction in agricultural activities. A weak positive correlation was identified between the annual average NH3 mixing ratio and temperature only in winter, and the significant increase in winter temperature from 2013 to 2014 could have led to the high NH3 mixing ratios in the winter of 2014.
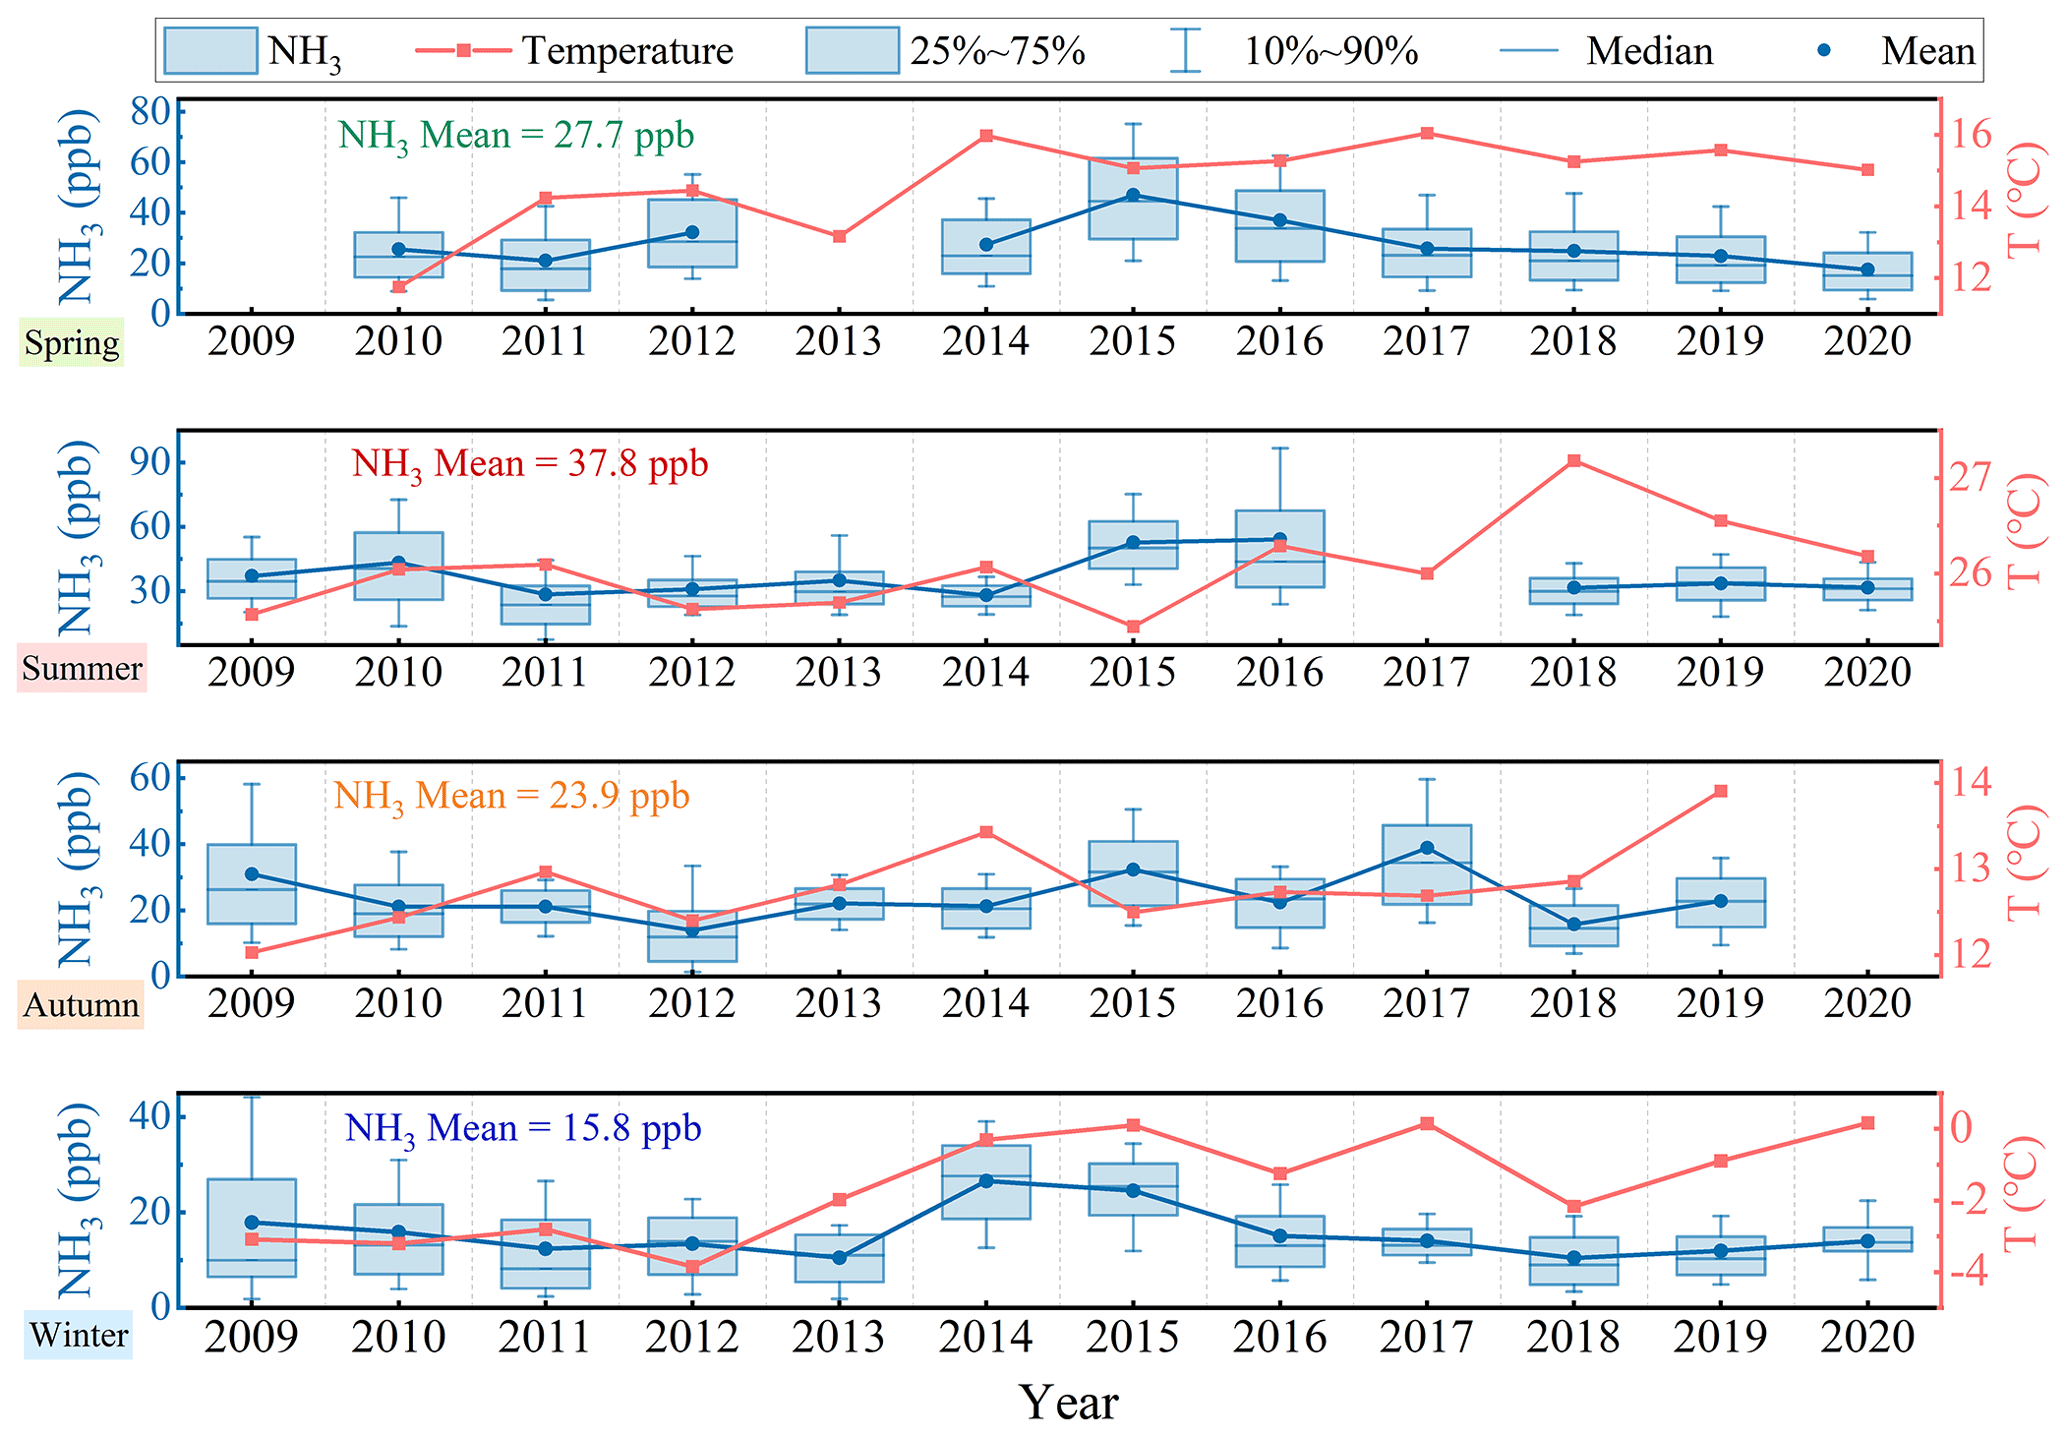
Figure 3Interannual variations in the mean NH3 mixing ratio and mean temperature in Beijing for each season.
Our investigation examined the correlations among daily temperature, absolute humidity, and diurnal fluctuations in atmospheric NH3 concentrations throughout an observation period of 4058 d (screening criteria for effective dates: p<0.05 and ≥18 effective hours per day; the p values were adjusted using the Benjamini–Hochberg method; Benjamini and Hochberg, 1995). We observed that temperature exhibited both positive (45 %) and negative (55 %) correlations with the NH3 mixing ratio, with these two categories each accounting for nearly half of the valid observation days. However, on most days (i.e., 93 % of the valid observation days), absolute humidity was positively correlated with the NH3 mixing ratio (Fig. S11). Overall, the average daily variations in NH3 mixing ratios in Beijing in spring, summer, and autumn indicated a significant negative correlation with the temperature (, , , p<0.01). The NH3 mixing ratio was positively correlated with absolute humidity (Rspring=0.80, Rsummer=0.50, Rautumn=0.67, Rwinter=0.49, p<0.01).
Several studies have suggested that temperature plays a pivotal role in driving diurnal variations in atmospheric NH3 concentrations (Clarisse et al., 2021; Langford et al., 1992). However, the present study shows that NH3 concentrations are significantly influenced by temperature across seasonal changes (Fig. 3); in terms of diurnal patterns, the days showing positive and negative correlations between NH3 concentrations and temperature each constitute nearly half of the effective observation days (Fig. S11). The mean diurnal variations in different seasons typically exhibit lower concentrations during the day and are higher at night in spring, summer, and autumn (Fig. S12). This difference suggests that correlations observed on a seasonal (climatic scale) tend to obscure lower-frequency data relationships, with daily variations in NH3 concentrations being more influenced by the transition from day to night (meteorological or weather scale). This highlights the complex factors affecting NH3 concentrations in the urban areas of Beijing and underscores the importance of high temporal resolution in observations. Several studies have noted a reduction in NH3 concentrations during daylight hours (Buijsman et al., 1998; Sharma et al., 2014; Gu et al., 2022b; Lan et al., 2021). Increased temperatures during the day promote the volatilization of NH3, but lower daytime concentrations may result from higher wind speeds and more favorable mixing conditions, whereas at night, NH3 tends to accumulate within a shallower boundary layer (Buijsman et al., 1998). The diurnal variation in the boundary layer height in Beijing exhibits a single-peak pattern, rising rapidly from 06:00 to 08:00, reaching its peak between 14:00 and 15:00, then declining sharply, and stabilizing after 18:00 to 20:00 (Fig. S12). During the daytime, NH3 concentrations are influenced by a combination of temperature (which promotes emissions) and changes in the boundary layer height (which causes dilution), with the valley value of NH3 concentrations lagging behind the peak times of boundary layer height and temperature. Moreover, during spring, summer, and autumn, the continuous decline in NH3 concentrations during the daytime indicates that vertical mixing transport has a limited impact on atmospheric NH3 in the urban areas of Beijing. In winter, the evaporation of dew or frost in the early morning leads to a rapid increase in H2O and NH3 concentrations (Wentworth et al., 2016), while the effects of afternoon temperature and vertical mixing dilution are comparable, keeping NH3 concentrations relatively stable.
Several studies have reported a high correlation between the NH3 mixing ratio and humidity. Previous research has shown that NH3 can be significantly affected only by sharp changes in humidity, and a new balance requires tens of minutes to be re-established. Averaging minute-level data over 1 h can smooth the effects caused by variations in humidity. Notably, parallel observations in urban and suburban Beijing found that a positive correlation between daily NH3 and H2O concentration variations was only significant in urban areas (Lan et al., 2021). Gu et al. (2022b) reported that daily variations in NH3 concentrations in urban Beijing, as measured by the Picarro ammonia analyzer and ChemComb, were consistent. These results suggest that atmospheric NH3 cannot be explained solely by the influence of H2O effects on the instruments. Additionally, Sun et al. (2023) discovered a positive correlation between atmospheric NH3 concentrations and relative humidity (RH) in Beijing and a negative correlation in Shanghai. In rural northern China, He et al. (2020) also observed a strong correlation between NH3 and RH, which they attributed to dew evaporation. At present, the relationship between the NH3 mixing ratio and the water vapor concentration requires further clarification.
In summary, the results suggest that temperature plays a pivotal role in driving the seasonal variations in atmospheric NH3 concentrations throughout a given year. However, in the long term, the influence of temperature and other meteorological factors may be masked. Regarding diurnal variations, our analysis revealed that a single-day increase in temperature did not consistently lead to a direct elevation in atmospheric NH3 mixing ratios on most days. Conversely, atmospheric water vapor mixing ratios exhibited a consistently positive correlation with NH3 mixing ratios throughout the day. Notably, the day-to-day variations in meteorological factors remained consistent across the years, whereas the variation in diurnal NH3 differed across different years and seasons (Fig. S13). Therefore, the conclusion is that diurnal fluctuations in the atmospheric NH3 concentration are not solely determined by meteorological factors. In recent years, scholars have been increasingly studying the contribution of traffic sources to urban NH3 concentrations. Gu et al. (2022b) confirmed that vehicle exhaust emissions during winter in Beijing lead to the occurrence of morning peaks in NH3 concentrations. Nonetheless, our results indicated that atmospheric NH3 concentrations did not consistently peak in the morning throughout the observation period, even when high concentrations of traffic emissions were present. Furthermore, the morning peaks for atmospheric NH3 concentrations tended to occur earlier relative to those for CO, which are influenced by traffic emissions (Fig. S13).
Studies have comprehensively explored the influence of wind direction and wind speed on the pollutant mixing ratios in Beijing, and they have reported that southerly (S) winds transport a high concentration of pollutants to Beijing, leading to the accumulation of NH3 in the city. Conversely, the winds from the north by west (NW) facilitate the dispersion and dilution of atmospheric NH3 in Beijing (Lin et al., 2011; Meng et al., 2017). Figure S14 presents the wind rose diagrams for atmospheric NH3 concentrations in various seasons and at various wind speeds. Under near-calm wind conditions (wind speed (ws) ≤1.5 m s−1), the prevailing winds across all seasons were predominantly in the northeast and east-northeast directions, and NH3 mixing ratios did not vary significantly because of the wind direction, indicating that local emissions had the most pronounced effect on atmospheric NH3 concentrations. At low wind speeds (1.6 m s−1 ≤ ws ≤ 3.3 m s−1), the predominant wind direction varied across seasons, with southwesterly winds prevailing in spring and summer and northerly winds dominating in autumn and winter. At higher wind speeds (ws > 3.4 m s−1), the predominant wind direction was NW in spring, autumn, and winter but southerly in summer. In general, changes in the prevailing wind direction did not significantly influence NH3 mixing ratios across various wind sectors. However, in specific wind sectors, such as the west by south (WS) sector in spring, the east by south (ES) sector in summer and autumn, and the south by east (SE) sector in winter, higher wind speeds tended to lead to lower NH3 mixing ratios (Fig. S15). Notably, the decline in NH3 mixing ratios was more pronounced in wind sectors affected by NW winds, indicating that strong winds, particularly those from the NW direction, had a significant cleansing effect on NH3 in Beijing. Conversely, southerly winds, and sometimes specific wind directions, contributed to NH3 accumulation.
3.3 Influence of NH3 on secondary inorganic aerosol formation
The present study investigated the role of atmospheric NH3 in the formation of secondary inorganic aerosols (SIAs) in Beijing by analyzing the relationship between NH3 and SNA concentrations during the observation period. According to the study of Wei et al. (2023) conducted between 2013 and 2020, the SNA concentrations in Beijing exhibited a significant downward trend. However, the proportion of SNA in PM2.5 (mass concentration) did not change substantially during this period. Table S2 lists the proportions of various SNA components in PM2.5 (mass concentration) recorded in urban areas of Beijing for the years 2009, 2016, 2018, and 2019. In the summer and autumn of 2009, SO accounted for more than 50 % of SNA content, considerably exceeding the concentrations of NO and NH. However, by 2016, except for the summer season when SO was still the predominant component, NO became the dominant component of the SNA mass concentration. Over time, the proportion of NH in the SNA mass concentration increased across multiple seasons. Wen et al. (2024) and Cheng (2021) have also observed this phenomenon in urban Beijing. These findings indicate the necessity of controlling NH3 and NOx concentrations to mitigate future PM2.5 pollution.
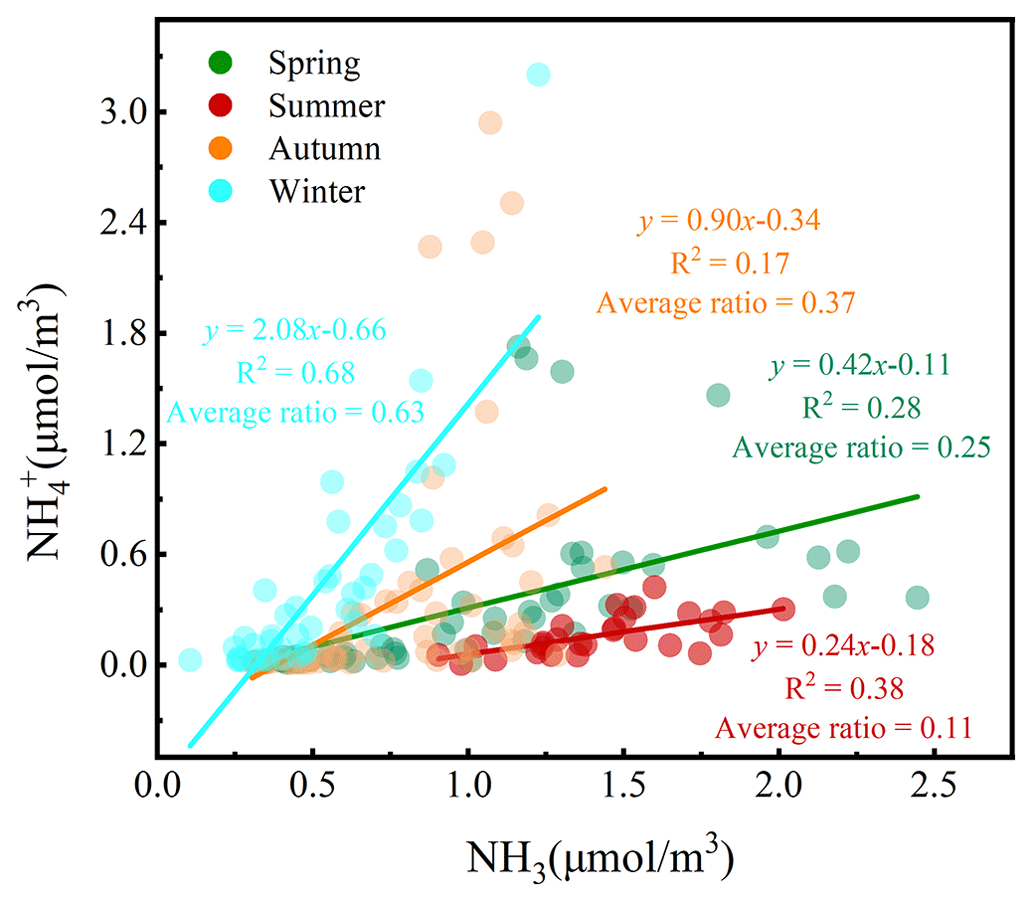
Figure 4 depicts the relationship of NH in fine particulates to atmospheric NH3. Overall, a positive correlation was identified between NH and NH3, indicating that variations in the concentration of the precursor gas NH3 influenced the formation of NH. An increase in the NH3 concentration led to a higher concentration of NH in fine particulate matter, and this effect was most pronounced in winter, during which the correlation between NH and NH3 was the strongest (R2=0.68, p<0.01) and the average molar concentration ratio of NH to NH3 was the highest. The seasonal differences in the response of aerosol NH to atmospheric NH3 may mainly be caused by variations in meteorological conditions, in addition to those in precursor gases of SNA. For example, low temperature and high humidity promote the conversion of gaseous NH3 to particulate NH (Wang et al., 2015). Thus, winter meteorological conditions may increase the formation of NH in fine particulate matter, exacerbating fine particulate pollution and haze formation.
To gain further insights, the ISORROPIA II thermodynamic equilibrium model was employed to simulate and analyze the sensitivity of SNA in PM2.5 to changes in precursor concentrations in each season. Concentrations of SO + H2SO4 (TS), HNO3 + NO (TN), and NH3 + NH (TA) were increased or reduced by up to 20 %, and the changes in simulated concentrations relative to the baseline (without perturbation) were calculated. The simulation results revealed a strong correlation between the simulated and observed NH3 concentrations (Rspring=0.89, Rsummer=1.00, Rautumn=0.97, Rwinter=0.98, p<0.01), indicating the reliability of the above observation-based results. The simulation results (Table S3) indicated that NH was the component least sensitive to changes in the TA concentration in spring, autumn, and winter, suggesting that atmospheric NH3 was not the limiting reactant for the generation of (NH4)2SO4 and NH4NO3 in these seasons during the observation period. The responses of NH to changes in TA and TN concentrations were less apparent in summer because NH was mainly bound to SO rather than to NO during this hot season, in which the high temperature was unfavorable for the generation and retention of NH4NO3. Furthermore, the increase in TS had an over-proportional or nearly (winter) proportional perturbation effect on NH, indicating the presence of sufficient NH3 in the atmosphere of Beijing throughout the year. Su et al. (2021) have also suggested that the acidic components in the atmosphere in Beijing were sufficiently neutralized. Therefore, a relatively small reduction (20 %) in NH3 abundance seems not to be able to significantly lower the SNA levels in Beijing.
When NH3 was abundant, the sensitivity of SNA content to changes in TA within the ±20 % range was low (within ±2 %, Table S3). Under such conditions, changes in TS and TN concentrations had much larger perturbation effects on SNA concentrations. However, the winter SNA concentrations mostly responded linearly to changes in TS and TN concentrations but nonlinearly to changes in the TA ones (Fig. 5). If the TA concentrations, which were more pronounced in 2019, were reduced by 60 %, the rate of decrease in SNA content would have accelerated considerably. By contrast, the effect of changes in the TS concentration decreased after its reduction of over 40 %. In a previous study based on nationwide measurements and simulation, Meng et al. (2022) suggested that SNA content in China can be more effectively controlled by reducing the concentrations of acidic gases (SO2 and NOx) in the atmosphere than by reducing the concentration of NH3 by the same percentage. Additionally, Zheng et al. (2022) discovered that the joint control of SO2 and NOx emissions is still the preferred method for reducing SNA concentrations in central China, except when acidic gas emissions are well controlled and the environmental chemical balance tends to favor the effective control of NH3. Therefore, under the current atmospheric conditions, controlling acidic gas emissions is still a priority for reducing the PM2.5 concentration in Beijing. Nevertheless, the cost of emissions reduction also increases with the progress of controlling SO2 and NOx emissions. Although they provide similar abatement benefits, the cost of reducing NH3 is only 10% of that required to reduce NOx (Gu et al., 2021). Thus, reducing NH3 emissions should be prioritized as a means of improving future air quality in Beijing.
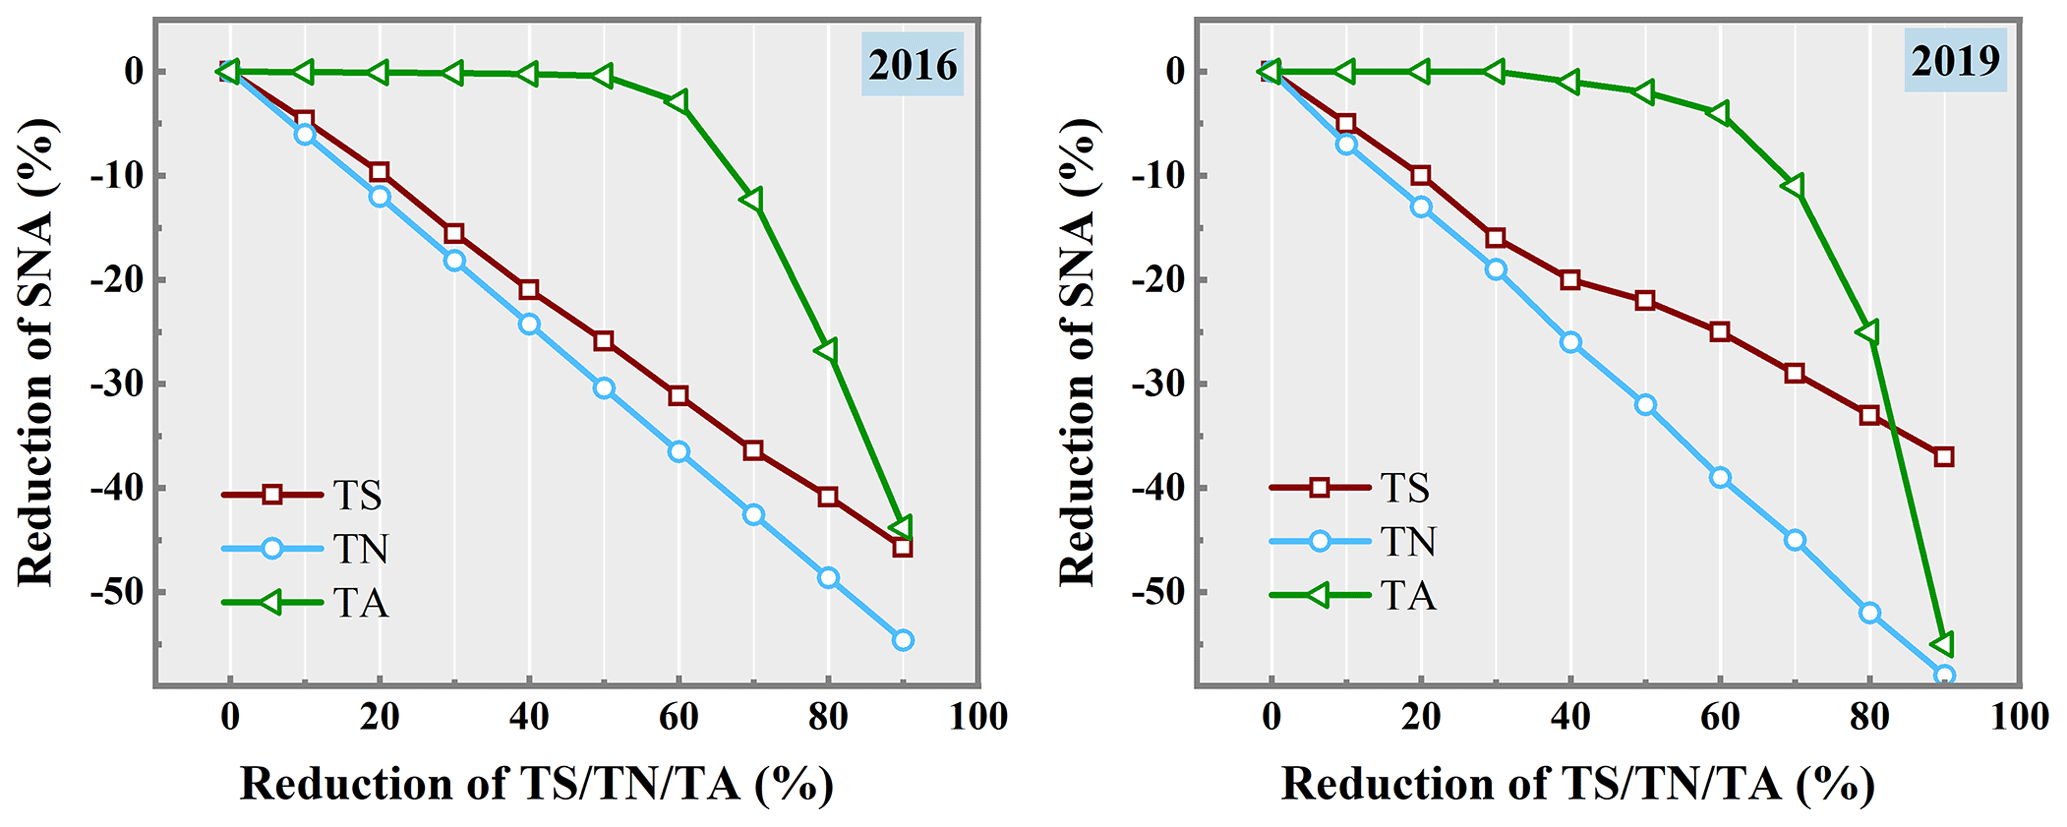
Figure 5ISORROPIA predictions of the percentage reduction in SNA mass concentration based on winter observations (charts display the percentage reduction in SNA plotted against the percentage reduction in TS, TN, and TA concentrations).
Over the 11 years analyzed, the NH3 concentration in urban Beijing initially increased by 50 % in the first 8 years but subsequently decreased by 49 % in the following 3 years. In particular, the annual average concentration of NH3 in 2020 was 24 % lower than that in 2009. The trend for NH3 mixing ratios did not align with those for annual NH3 emissions and the increasing trend indicated by satellite-based NH3 monitoring data. These discrepancies highlight the complexity of NH3 sources and removal processes in urban areas, which implies there are further challenges in performing atmospheric NH3-related modeling and implementing future emission reduction strategies.
The long-term trend in NH3 in urban Beijing was not significantly influenced by meteorological factors such as temperature. However, the seasonal variations in NH3 mixing ratios were strongly influenced by temperature, with higher temperatures corresponding to higher NH3 mixing ratios during warmer seasons. Regarding daily variations, NH3 mixing ratios exhibited both positive and negative correlations with temperature but consistently exhibited a positive correlation with absolute humidity on most days. Across the observation years, the daily variations in NH3 concentrations did not exhibit a consistent pattern across different seasons. In some cases, the patterns were even entirely opposite. By contrast, various meteorological factors and the daily variation patterns of other common air pollutants were mostly consistent across different years and seasons. Consequently, the factors influencing atmospheric NH3 concentrations appeared to be more complex compared with those influencing other common air pollutants.
The concentrations of various PM2.5 ion components in Beijing for the years 2009, 2016, 2018, and 2019 indicate that, apart from during the summer season, the SNA content in Beijing was mainly dominated by sulfate (nearly 50 %). Furthermore, the proportion of ammonium in SNA content increased over time. An analysis of the neutralization levels of major acidic gases and a modeling analysis of perturbation indicated that an excessive concentration of NH3 was maintained throughout the year in Beijing. The findings of the present study suggest that, even though the concentrations of SO2 and NOx in Beijing have decreased substantially over the past 2 decades, SIA formation is more sensitive to acid gases than to NH3. Therefore, reducing acidic gas emissions is still a primary focus for controlling fine-particulate-matter pollution in Beijing. Given that the trends in urban atmospheric NH3 concentrations do not align with emissions trends, clarifying the relationship between them and identifying the sources of NH3 in Beijing will play a crucial role in effectively reducing atmospheric NH3 concentrations in the city.
In the present study, atmospheric NH3 concentrations in urban Beijing were continuously monitored over a long period with high temporal resolution. However, it should be noted that there are potential limitations of surface monitoring in representing urban or regional trends due to the uneven distribution of atmospheric NH3 sources and the lack of vertical information. Similarly, with monitoring at a single site, it is necessary to verify whether the response measures are broadly applicable across the entire Beijing urban area. This will require further observational research on atmospheric NH3 in urban Beijing in the future. In addition, existing studies have demonstrated that emission inventories have underestimated atmospheric NH3 emissions in the Beijing urban area (Xu et al., 2023), and the assessment results have varied across emission inventories (Chen et al., 2023). Additionally, given the limited research years of current emission inventories, the observed differences between long-term trends in monitored NH3 concentrations and NH3 emissions require continued attention in the future.
For access to datasets, please contact Weili Lin (linwl@muc.edu.cn).
The supplement related to this article is available online at: https://doi.org/10.5194/acp-24-9355-2024-supplement.
ZL, WL, and XX designed the research, interpreted the data, and wrote the manuscript; ZL, WL, XZ, and ZM conducted the NH3 measurements; and and JJ, YZ, and LW contributed the ion component in the PM2.5 data. The manuscript was written through the contributions of all authors. All authors have given approval to the final version of the paper.
The contact author has declared that none of the authors has any competing interests.
Publisher's note: Copernicus Publications remains neutral with regard to jurisdictional claims made in the text, published maps, institutional affiliations, or any other geographical representation in this paper. While Copernicus Publications makes every effort to include appropriate place names, the final responsibility lies with the authors.
The authors are grateful for the assistance of colleagues for sample collection.
This work was supported by the National Natural Science Foundation of China (grant nos. 91744206, 42175128), the Beijing Municipal Science and Technology Commission (grant no. Z181100005418016), and the CAMS technology and development fund project (grant no. 2022KJ005).
This paper was edited by Leiming Zhang and reviewed by two anonymous referees.
Allen, H. M., Draper, D. C., Ayres, B. R., Ault, A., Bondy, A., Takahama, S., Modini, R. L., Baumann, K., Edgerton, E., Knote, C., Laskin, A., Wang, B., and Fry, J. L.: Influence of crustal dust and sea spray supermicron particle concentrations and acidity on inorganic NO aerosol during the 2013 Southern Oxidant and Aerosol Study, Atmos. Chem. Phys., 15, 10669–10685, https://doi.org/10.5194/acp-15-10669-2015, 2015.
Asman, W. A. H. and van Jaarsveld, H. A.: A variable-resolution transport model applied for NHχ in Europe, Atmos. Environ. Part A, 26, 445–464, https://doi.org/10.1016/0960-1686(92)90329-J, 1992.
Behera, S. N., Sharma, M., Aneja, V. P., and Balasubramanian, R.: Ammonia in the atmosphere: a review on emission sources, atmospheric chemistry and deposition on terrestrial bodies, Environ. Sci. Pollut. R., 20, 8092–8131, https://doi.org/10.1007/s11356-013-2051-9, 2013.
Benjamini, Y. and Hochberg, Y.: Controlling the False Discovery Rate: A Practical and Powerful Approach to Multiple Testing, J. Roy. Stat. Soc. B, 57, 289–300, https://doi.org/10.1111/j.2517-6161.1995.tb02031.x, 1995.
Buijsman, E., Aben, J. M. M., Van Elzakker, B. G., and Mennen, M. G.: An automatic atmospheric ammonia network in the Netherlands set-up and results, Atmos. Environ., 32, 317–324, https://doi.org/10.1016/S1352-2310(97)00233-1, 1998.
Butler, T., Vermeylen, F., Lehmann, C. M., Likens, G. E., and Puchalski, M.: Increasing ammonia concentration trends in large regions of the USA derived from the NADP/AMoN network, Atmos. Environ., 146, 132–140, https://doi.org/10.1016/j.atmosenv.2016.06.033, 2016.
Cao, J.-J., Zhang, T., Chow, J. C., Watson, J. G., Wu, F., and Li, H.: Characterization of Atmospheric Ammonia over Xi'an, China, Aerosol Air Qual. Res., 9, 277–289, https://doi.org/10.4209/aaqr.2008.10.0043, 2009.
Chang, Y., Zou, Z., Zhang, Y., Deng, C., Hu, J., Shi, Z., Dore, A. J., and Collett, J. L.: Assessing Contributions of Agricultural and Nonagricultural Emissions to Atmospheric Ammonia in a Chinese Megacity, Environ. Sci. Technol., 53, 1822–1833, https://doi.org/10.1021/acs.est.8b05984, 2019.
Charlson, R. J., Langner, J., Rodhe, H., Leovy, C. B., and Warren, S. G.: Perturbation of the northern hemisphere radiative balance by backscattering from anthropogenic sulfate aerosols, Tellus A, 43, 152–163, https://doi.org/10.3402/tellusa.v43i4.11944, 1991.
Chatain, M., Chretien, E., Crunaire, S., and Jantzem, E.: Road Traffic and Its Influence on Urban Ammonia Concentrations (France), Atmosphere-Basel, 13, 1032, https://doi.org/10.3390/atmos13071032, 2022.
Chen, J., Cheng, M., Krol, M., de Vries, W., Zhu, Q., Liu, X., Zhang, F., and Xu, W.: Trends in anthropogenic ammonia emissions in China since 1980: A review of approaches and estimations, Front. Environ. Sci., 11, 1133753, https://doi.org/10.3389/fenvs.2023.1133753, 2023.
Chen, S., Cheng, M., Guo, Z., Xu, W., Du, X., and Li, Y.: Enhanced atmospheric ammonia (NH3) pollution in China from 2008 to 2016: Evidence from a combination of observations and emissions, Environ. Pollut., 263, 114421, https://doi.org/10.1016/j.envpol.2020.114421, 2020.
Cheng, M.: Long-term Trends in the Concentration of Water-Soluble Inorganic Salts in Beijing's Atmosphere and Their Response to Policy, PhD, Lanzhou University, https://doi.org/10.27204/d.cnki.glzhu.2021.000098, 2021 (Chinese).
Clarisse, L., Damme, M., Hurtmans, D., Franco, B., Clerbaux, C., and Coheur, P.: The Diel Cycle of NH3 Observed From the FY-4A Geostationary Interferometric Infrared Sounder (GIIRS), Geophys. Res. Lett., 48, e2021GL093010, https://doi.org/10.1029/2021gl093010, 2021.
den Bril, B. V., Meremans, D., and Roekens, E.: A Monitoring Network on Acidification in Flanders, Belgium, The Sci. World J., 11, 2358–2363, https://doi.org/10.1100/2011/897308, 2011.
Dong, J., Li, B., Li, Y., Zhou, R., Gan, C., Zhao, Y., Liu, R., Yang, Y., Wang, T., and Liao, H.: Atmospheric ammonia in China: Long-term spatiotemporal variation, urban-rural gradient, and influencing factors, Sci. Total Environ., 883, 163733, https://doi.org/10.1016/j.scitotenv.2023.163733, 2023.
Elser, M., El-Haddad, I., Maasikmets, M., Bozzetti, C., Wolf, R., Ciarelli, G., Slowik, J. G., Richter, R., Teinemaa, E., Hüglin, C., Baltensperger, U., and Prévôt, A. S. H.: High contributions of vehicular emissions to ammonia in three European cities derived from mobile measurements, Atmos. Environ., 175, 210–220, https://doi.org/10.1016/j.atmosenv.2017.11.030, 2018.
Fountoukis, C. and Nenes, A.: ISORROPIA II: a computationally efficient thermodynamic equilibrium model for K+–Ca2+–Mg2+–NH–Na+–SO–NO–Cl−–H2O aerosols, Atmos. Chem. Phys., 7, 4639–4659, https://doi.org/10.5194/acp-7-4639-2007, 2007.
Friedman, M. and Schwartz, A. J.: Monetary Trends in the United States and the United Kingdom: Their Relations to Income, Prices, and Interest Rates, University of Chicago Press, Chicago, IL, 696 pp., ISBN 978-0-226-26425-7, 2011.
Fu, H., Zhang, Y., Liao, C., Mao, L., Wang, Z., and Hong, N.: Investigating PM2.5 responses to other air pollutants and meteorological factors across multiple temporal scales, Sci. Rep.-UK, 10, 1–10, https://doi.org/10.1038/s41598-020-72722-z, 2020.
Fu, X., Wang, S., Xing, J., Zhang, X., Wang, T., and Hao, J.: Increasing Ammonia Concentrations Reduce the Effectiveness of Particle Pollution Control Achieved via SO2 and NOX Emissions Reduction in East China, Environ. Sci. Tech. Lett., 4, 221–227, https://doi.org/10.1021/acs.estlett.7b00143, 2017.
Fuzzi, S., Baltensperger, U., Carslaw, K., Decesari, S., Denier van der Gon, H., Facchini, M. C., Fowler, D., Koren, I., Langford, B., Lohmann, U., Nemitz, E., Pandis, S., Riipinen, I., Rudich, Y., Schaap, M., Slowik, J. G., Spracklen, D. V., Vignati, E., Wild, M., Williams, M., and Gilardoni, S.: Particulate matter, air quality and climate: lessons learned and future needs, Atmos. Chem. Phys., 15, 8217–8299, https://doi.org/10.5194/acp-15-8217-2015, 2015.
Gu, B., Zhang, L., Van Dingenen, R., Vieno, M., Van Grinsven, H. J., Zhang, X., Zhang, S., Chen, Y., Wang, S., Ren, C., Rao, S., Holland, M., Winiwarter, W., Chen, D., Xu, J., and Sutton, M. A.: Abating ammonia is more cost-effective than nitrogen oxides for mitigating PM2.5 air pollution, Science, 374, 758–762, https://doi.org/10.1126/science.abf8623, 2021.
Gu, M., Pan, Y., Sun, Q., Walters, W. W., Song, L., and Fang, Y.: Is fertilization the dominant source of ammonia in the urban atmosphere?, Sci. Total Environ., 838, 155890, https://doi.org/10.1016/j.scitotenv.2022.155890, 2022a.
Gu, M., Pan, Y., Walters, W. W., Sun, Q., Song, L., Wang, Y., Xue, Y., and Fang, Y.: Vehicular Emissions Enhanced Ammonia Concentrations in Winter Mornings: Insights from Diurnal Nitrogen Isotopic Signatures, Environ. Sci. Technol., 56, 1578–1585, https://doi.org/10.1021/acs.est.1c05884, 2022b.
Guo, H., Otjes, R., Schlag, P., Kiendler-Scharr, A., Nenes, A., and Weber, R. J.: Effectiveness of ammonia reduction on control of fine particle nitrate, Atmos. Chem. Phys., 18, 12241–12256, https://doi.org/10.5194/acp-18-12241-2018, 2018.
He, Y., Pan, Y., Zhang, G., Ji, D., Tian, S., Xu, X., Zhang, R., and Wang, Y.: Tracking ammonia morning peak, sources and transport with 1 Hz measurements at a rural site in North China Plain, Atmos. Environ., 235, 117630, https://doi.org/10.1016/j.atmosenv.2020.117630, 2020.
Horvath, L., Fagerli, H., and Sutton, M. A.: Long-Term Record (1981–2005) of Ammonia and Ammonium Concentrations at K-Puszta Hungary and the Effect of Sulphur Dioxide Emission Change on Measured and Modelled Concentrations, in: Atmospheric Ammonia: Detecting emission changes and environmental impacts, edited by: Sutton, M. A., Reis, S., and Baker, S. M. H., Springer Netherlands, Dordrecht, 181–185, https://doi.org/10.1007/978-1-4020-9121-6_12, 2009.
Horváth, L. and Sutton, M. A.: Long-term record of ammonia and ammonium concentrations at K-puszta, Hungary, Atmos. Environ., 32, 339–344, https://doi.org/10.1016/S1352-2310(97)00046-0, 1998.
Hu, G., Zhang, Y., Sun, J., Zhang, L., Shen, X., Lin, W., and Yang, Y.: Variability, formation and acidity of water-soluble ions in PM2.5 in Beijing based on the semi-continuous observations, Atmos. Res., 145–146, 1–11, https://doi.org/10.1016/j.atmosres.2014.03.014, 2014.
Huang, X., Song, Y., Li, M., Li, J., Huo, Q., Cai, X., Zhu, T., Hu, M., and Zhang, H.: A high-resolution ammonia emission inventory in China, Global Biogeochem Cy., 26, GB1030, https://doi.org/10.1029/2011gb004161, 2012.
Huang, X., Zhang, J., Zhang, W., Tang, G., and Wang, Y.: Atmospheric ammonia and its effect on PM2.5 pollution in urban Chengdu, Sichuan Basin, China, Environ. Pollut., 291, 118195, https://doi.org/10.1016/j.envpol.2021.118195, 2021.
Ju, X., Xing, G., Chen, X., Zhang, S., Zhang, L., Liu, X., Cui, Z., Yin, B., Christie, P., Zhu, Z., and Zhang, F.: Reducing environmental risk by improving N management in intensive Chinese agricultural systems, P. Natl. Acad. Sci. USA, 106, 3041–3046, https://doi.org/10.1073/pnas.0813417106, 2009.
Kang, Y., Liu, M., Song, Y., Huang, X., Yao, H., Cai, X., Zhang, H., Kang, L., Liu, X., Yan, X., He, H., Zhang, Q., Shao, M., and Zhu, T.: High-resolution ammonia emissions inventories in China from 1980 to 2012, Atmos. Chem. Phys., 16, 2043–2058, https://doi.org/10.5194/acp-16-2043-2016, 2016.
Karydis, V. A., Tsimpidi, A. P., Pozzer, A., and Lelieveld, J.: How alkaline compounds control atmospheric aerosol particle acidity, Atmos. Chem. Phys., 21, 14983–15001, https://doi.org/10.5194/acp-21-14983-2021, 2021.
Lachatre, M., Fortems-Cheiney, A., Foret, G., Siour, G., Dufour, G., Clarisse, L., Clerbaux, C., Coheur, P.-F., Van Damme, M., and Beekmann, M.: The unintended consequence of SO2 and NO2 regulations over China: increase of ammonia levels and impact on PM2.5 concentrations, Atmos. Chem. Phys., 19, 6701–6716, https://doi.org/10.5194/acp-19-6701-2019, 2019.
Lan, Z., Lin, W., Pu, W., and Ma, Z.: Measurement report: Exploring NH3 behavior in urban and suburban Beijing: comparison and implications, Atmos. Chem. Phys., 21, 4561–4573, https://doi.org/10.5194/acp-21-4561-2021, 2021.
Langford, A. O., Fehsenfeld, F. C., Zachariassen, J., and Schimel, D. S.: Gaseous ammonia fluxes and background concentrations in terrestrial ecosystems of the United States, Global Biogeochem. Cy., 6, 459–483, https://doi.org/10.1029/92gb02123, 1992.
Li, Y., Schwandner, F. M., Sewell, H. J., Zivkovich, A., Tigges, M., Raja, S., Holcomb, S., Molenar, J. V., Sherman, L., Archuleta, C., Lee, T., and Collett, J. L.: Observations of ammonia, nitric acid, and fine particles in a rural gas production region, Atmos. Environ., 83, 80–89, https://doi.org/10.1016/j.atmosenv.2013.10.007, 2014.
Lin, W., Xu, X., Ge, B., and Liu, X.: Gaseous pollutants in Beijing urban area during the heating period 2007–2008: variability, sources, meteorological, and chemical impacts, Atmos. Chem. Phys., 11, 8157–8170, https://doi.org/10.5194/acp-11-8157-2011, 2011.
Liu, L., Zhang, X., Wong, A. Y. H., Xu, W., Liu, X., Li, Y., Mi, H., Lu, X., Zhao, L., Wang, Z., Wu, X., and Wei, J.: Estimating global surface ammonia concentrations inferred from satellite retrievals, Atmos. Chem. Phys., 19, 12051–12066, https://doi.org/10.5194/acp-19-12051-2019, 2019.
Liu, M., Huang, X., Song, Y., Tang, J., Cao, J., Zhang, X., Zhang, Q., Wang, S., Xu, T., Kang, L., Cai, X., Zhang, H., Yang, F., Wang, H., Yu, J. Z., Lau, A. K. H., He, L., Huang, X., Duan, L., Ding, A., Xue, L., Gao, J., Liu, B., and Zhu, T.: Ammonia emission control in China would mitigate haze pollution and nitrogen deposition, but worsen acid rain, P. Natl. Acad. Sci. USA, 116, 7760–7765, https://doi.org/10.1073/pnas.1814880116, 2019.
Liu, M., Huang, X., Song, Y., Xu, T., Wang, S., Wu, Z., Hu, M., Zhang, L., Zhang, Q., Pan, Y., Liu, X., and Zhu, T.: Rapid SO2 emission reductions significantly increase tropospheric ammonia concentrations over the North China Plain, Atmos. Chem. Phys., 18, 17933–17943, https://doi.org/10.5194/acp-18-17933-2018, 2018.
Liu, X., Pu, W., Ma, Z., Lin, W., Han, T., Li, Y., Zhou, L., and Shi, Q.: Study on the temporal and spatial variation of atmospheric ammonia in Beijing (China), China Environ. Sci., 41, 3473–3483, https://doi.org/10.19674/j.cnki.issn1000-6923.20210426.001, 2021.
Lolkema, D. E., Noordijk, H., Stolk, A. P., Hoogerbrugge, R., van Zanten, M. C., and van Pul, W. A. J.: The Measuring Ammonia in Nature (MAN) network in the Netherlands, Biogeosciences, 12, 5133–5142, https://doi.org/10.5194/bg-12-5133-2015, 2015.
Luo, X., Liu, X., Pan, Y., Wen, Z., Xu, W., Zhang, L., Kou, C., Lv, J., and Goulding, K.: Atmospheric reactive nitrogen concentration and deposition trends from 2011 to 2018 at an urban site in north China, Atmos. Environ., 224, 117298, https://doi.org/10.1016/j.atmosenv.2020.117298, 2020.
Luukko, P. J. J., Helske, J., and Räsänen, E.: Introducing libeemd: a program package for performing the ensemble empirical mode decomposition, Computation. Stat., 31, 545–557, https://doi.org/10.1007/s00180-015-0603-9, 2016.
Meng, F., Zhang, Y., Kang, J., Heal, M. R., Reis, S., Wang, M., Liu, L., Wang, K., Yu, S., Li, P., Wei, J., Hou, Y., Zhang, Y., Liu, X., Cui, Z., Xu, W., and Zhang, F.: Trends in secondary inorganic aerosol pollution in China and its responses to emission controls of precursors in wintertime, Atmos. Chem. Phys., 22, 6291–6308, https://doi.org/10.5194/acp-22-6291-2022, 2022.
Meng, Z., Lin, W., Zhang, R., Han, Z., and Jia, X.: Summertime ambient ammonia and its effects on ammonium aerosol in urban Beijing, China, Sci. Total Environ., 579, 1521–1530, https://doi.org/10.1016/j.scitotenv.2016.11.159, 2017.
Nair, A. A. and Yu, F.: Quantification of Atmospheric Ammonia Concentrations: A Review of Its Measurement and Modeling, Atmos.-Basel, 11, 1092, https://doi.org/10.3390/atmos11101092, 2020.
Nguyen, D. V., Sato, H., Hamada, H., Yamaguchi, S., Hiraki, T., Nakatsubo, R., Murano, K., and Aikawa, M.: Symbolic seasonal variation newly found in atmospheric ammonia concentration in urban area of Japan, Atmos. Environ., 244, 117943, https://doi.org/10.1016/j.atmosenv.2020.117943, 2021.
Olivier, J. G. J., Bouwman, A. F., Van der Hoek, K. W., and Berdowski, J. J. M.: Global air emission inventories for anthropogenic sources of NOx, NH3 and N2O in 1990, Environ. Pollut., 102, 135–148, https://doi.org/10.1016/S0269-7491(98)80026-2, 1998.
Pan, Y., Tian, S., Zhao, Y., Zhang, L., Zhu, X., Gao, J., Huang, W., Zhou, Y., Song, Y., Zhang, Q., and Wang, Y.: Identifying Ammonia Hotspots in China Using a National Observation Network, Environ Sci Technol, 52, 3926–3934, https://doi.org/10.1021/acs.est.7b05235, 2018.
Park, J., Kim, E., Oh, S., Kim, H., Kim, S., Kim, Y. P., and Song, M.: Contributions of Ammonia to High Concentrations of PM2.5 in an Urban Area, Atmos.-Basel, 12, 1676, https://doi.org/10.3390/atmos12121676, 2021.
Perrino, C., Catrambone, M., Di Menno Di Bucchianico, A., and Allegrini, I.: Gaseous ammonia in the urban area of Rome, Italy and its relationship with traffic emissions, Atmos. Environ., 36, 5385–5394, https://doi.org/10.1016/s1352-2310(02)00469-7, 2002.
Phan, N.-T., Kim, K.-H., Shon, Z.-H., Jeon, E.-C., Jung, K., and Kim, N.-J.: Analysis of ammonia variation in the urban atmosphere, Atmos. Environ., 65, 177–185, https://doi.org/10.1016/j.atmosenv.2012.10.049, 2013.
Pinder, R. W., Gilliland, A. B., and Dennis, R. L.: Environmental impact of atmospheric NH3 emissions under present and future conditions in the eastern United States, Geophys. Res. Lett., 35, L12808, https://doi.org/10.1029/2008gl033732, 2008.
Pu, W., Ma, Z., Collett Jr, J. L., Guo, H., Lin, W., Cheng, Y., Quan, W., Li, Y., Dong, F., and He, D.: Regional transport and urban emissions are important ammonia contributors in Beijing, China, Environ. Pollut., 265, 115062, https://doi.org/10.1016/j.envpol.2020.115062, 2020.
Qian, C., Fu, C., and Wu, Z.: Changes in the Amplitude of the Temperature Annual Cycle in China and Their Implication for Climate Change Research, J. Climate, 24, 5292–5302, https://doi.org/10.1175/JCLI-D-11-00006.1, 2011.
Reay, D. S., Dentener, F., Smith, P., Grace, J., and Feely, R. A.: Global nitrogen deposition and carbon sinks, Nat. Geosci., 1, 430–437, https://doi.org/10.1038/ngeo230, 2008.
Saraswati, George, M. P., Sharma, S. K., Mandal, T. K., and Kotnala, R. K.: Simultaneous Measurements of Ambient NH3 and Its Relationship with Other Trace Gases, PM2.5 and Meteorological Parameters over Delhi, India, MAPAN, 34, 55–69, https://doi.org/10.1007/s12647-018-0286-0, 2019.
Saraswati, Sharma, S. K., and Mandal, T. K.: Five-year measurements of ambient ammonia and its relationships with other trace gases at an urban site of Delhi, India, Meteorol. Atmos. Phys., 130, 241–257, https://doi.org/10.1007/s00703-017-0512-2, 2017.
Shadman, S., Rose, C., and Yalin, A. P.: Open-path cavity ring-down spectroscopy sensor for atmospheric ammonia, Appl. Phys. B, 122, 194, https://doi.org/10.1007/s00340-016-6461-5, 2016.
Sharma, S. K., Mandal, T. K., Sharma, C., Kuniyal, J. C., Joshi, R., Dhyani, P. P., Rohtash, Sen, A., Ghayas, H., Gupta, N. C., Sharma, P., Saxena, M., Sharma, A., Arya, B. C., and Kumar, A.: Measurements of Particulate (PM2.5), BC and Trace Gases Over the Northwestern Himalayan Region of India, MAPAN, 29, 243–253, https://doi.org/10.1007/s12647-014-0104-2, 2014.
Shon, Z.-H., Kim, K.-H., Song, S.-K., Jung, K., Kim, N.-J., and Lee, J.-B.: Relationship between water-soluble ions in PM2.5 and their precursor gases in Seoul megacity, Atmos. Environ., 59, 540–550, https://doi.org/10.1016/j.atmosenv.2012.04.033, 2012.
Singh, S. and Kulshrestha, U. C.: Rural versus urban gaseous inorganic reactive nitrogen in the Indo-Gangetic plains (IGP) of India, Environ. Res. Lett., 9, 125004, https://doi.org/10.1088/1748-9326/9/12/125004, 2014.
Su, J., Zhao, P., Ding, J., Du, X., and Dou, Y.: Insights into measurements of water-soluble ions in PM2.5 and their gaseous precursors in Beijing, J. Environ. Sci., 102, 123–137, https://doi.org/10.1016/j.jes.2020.08.031, 2021.
Sun, Q., Gu, M., Wu, D., Yang, T., Wang, H., and Pan, Y.: Concurrent measurements of atmospheric ammonia concentrations in the megacities of Beijing and Shanghai by using cavity ring-down spectroscopy, Atmos. Environ., 307, 119848, https://doi.org/10.1016/j.atmosenv.2023.119848, 2023.
Sutton, M. A., Tang, Y. S., Dragosits, U., Fournier, N., Dore, A. J., Smith, R. I., Weston, K. J., and Fowler, D.: A spatial analysis of atmospheric ammonia and ammonium in the U.K, Scientific World Journal, 1 Suppl 2, 275–286, https://doi.org/10.1100/tsw.2001.313, 2001.
Tang, Y. S., Braban, C. F., Dragosits, U., Dore, A. J., Simmons, I., van Dijk, N., Poskitt, J., Dos Santos Pereira, G., Keenan, P. O., Conolly, C., Vincent, K., Smith, R. I., Heal, M. R., and Sutton, M. A.: Drivers for spatial, temporal and long-term trends in atmospheric ammonia and ammonium in the UK, Atmos. Chem. Phys., 18, 705–733, https://doi.org/10.5194/acp-18-705-2018, 2018.
Teng, X., Hu, Q., Zhang, L., Qi, J., Shi, J., Xie, H., Gao, H., and Yao, X.: Identification of Major Sources of Atmospheric NH3 in an Urban Environment in Northern China During Wintertime, Environ. Sci. Technol., 51, 6839–6848, https://doi.org/10.1021/acs.est.7b00328, 2017.
United Nations Environment Programme: A review of 20 Years' Air Pollution Control in Beijing, http://www.unep.org/resources/report/review-20-years-air-pollution-control-beijing (last access: 20 June 2023), 2019.
Van Damme, M., Clarisse, L., Whitburn, S., Hadji-Lazaro, J., Hurtmans, D., Clerbaux, C., and Coheur, P.-F.: Industrial and agricultural ammonia point sources exposed, Nature, 564, 99–103, https://doi.org/10.1038/s41586-018-0747-1, 2018.
Van Damme, M., Whitburn, S., Clarisse, L., Clerbaux, C., Hurtmans, D., and Coheur, P.-F.: Version 2 of the IASI NH3 neural network retrieval algorithm: near-real-time and reanalysed datasets, Atmos. Meas. Tech., 10, 4905–4914, https://doi.org/10.5194/amt-10-4905-2017, 2017.
Vu, T. V., Shi, Z., Cheng, J., Zhang, Q., He, K., Wang, S., and Harrison, R. M.: Assessing the impact of clean air action on air quality trends in Beijing using a machine learning technique, Atmos. Chem. Phys., 19, 11303–11314, https://doi.org/10.5194/acp-19-11303-2019, 2019.
Walters, W. W., Karod, M., Willcocks, E., Baek, B. H., Blum, D. E., and Hastings, M. G.: Quantifying the importance of vehicle ammonia emissions in an urban area of northeastern USA utilizing nitrogen isotopes, Atmos. Chem. Phys., 22, 13431–13448, https://doi.org/10.5194/acp-22-13431-2022, 2022.
Wang, H. and Zhang, L.: Trends of inorganic sulfur and nitrogen species at an urban site in western Canada (2004–2018), Environ. Pollut., 333, 122079, https://doi.org/10.1016/j.envpol.2023.122079, 2023.
Wang, H., Zhang, L., Yao, X., Cheng, I., and Dabek-Zlotorzynska, E.: Identification of decadal trends and associated causes for organic and elemental carbon in PM2.5 at Canadian urban sites, Environ. Int., 159, 107031, https://doi.org/10.1016/j.envint.2021.107031, 2022.
Wang, Q., Zhang, Q., Ma, Z., Ge, B., Xie, C., Zhou, W., Zhao, J., Xu, W., Du, W., Fu, P., Lee, J., Nemitz, E., Cowan, N., Mullinger, N., Cheng, X., Zhou, L., Yue, S., Wang, Z., and Sun, Y.: Temporal characteristics and vertical distribution of atmospheric ammonia and ammonium in winter in Beijing, Sci. Total Environ., 681, 226–234, https://doi.org/10.1016/j.scitotenv.2019.05.137, 2019.
Wang, R., Ye, X., Liu, Y., Li, H., Yang, X., Chen, J., Gao, W., and Yin, Z.: Characteristics of atmospheric ammonia and its relationship with vehicle emissions in a megacity in China, Atmos. Environ., 182, 97–104, https://doi.org/10.1016/j.atmosenv.2018.03.047, 2018.
Wang, S., Nan, J., Shi, C., Fu, Q., Gao, S., Wang, D., Cui, H., Saiz-Lopez, A., and Zhou, B.: Atmospheric ammonia and its impacts on regional air quality over the megacity of Shanghai, China, Sci. Rep.-UK, 5, 15842, https://doi.org/10.1038/srep15842, 2015.
Warner, J. X., Dickerson, R. R., Wei, Z., Strow, L. L., Wang, Y., and Liang, Q.: Increased atmospheric ammonia over the world's major agricultural areas detected from space, Geophys. Res. Lett., 44, 2875–2884, https://doi.org/10.1002/2016gl072305, 2017.
Wei, J., Li, Z., Chen, X., Li, C., Sun, Y., Wang, J., Lyapustin, A., Brasseur, G. P., Jiang, M., Sun, L., Wang, T., Jung, C. H., Qiu, B., Fang, C., Liu, X., Hao, J., Wang, Y., Zhan, M., Song, X., and Liu, Y.: Separating Daily 1 km PM2.5 Inorganic Chemical Composition in China since 2000 via Deep Learning Integrating Ground, Satellite, and Model Data, Environ. Sci. Technol., 57, 13025–13035, https://doi.org/10.1021/acs.est.3c00272, 2023.
Wei, Z. and Mohamed Tahrin, N.: Impact of Gaseous Pollutants Reduction on Fine Particulate Matter and Its Secondary Inorganic Aerosols in Beijing–Tianjin–Hebei Region, Atmosphere, 14, 1027, https://doi.org/10.3390/atmos14061027, 2023.
Wen, Z., Xu, W., Li, Q., Han, M., Tang, A., Zhang, Y., Luo, X., Shen, J., Wang, W., Li, K., Pan, Y., Zhang, L., Li, W., Collett, J. L., Zhong, B., Wang, X., Goulding, K., Zhang, F., and Liu, X.: Changes of nitrogen deposition in China from 1980 to 2018, Environ Int, 144, 106022, https://doi.org/10.1016/j.envint.2020.106022, 2020.
Wen, Z., Ma, X., Xu, W., Si, R., Liu, L., Ma, M., Zhao, Y., Tang, A., Zhang, Y., Wang, K., Zhang, Y., Shen, J., Zhang, L., Zhao, Y., Zhang, F., Goulding, K., and Liu, X.: Combined short-term and long-term emission controls improve air quality sustainably in China, Nat. Commun., 15, 5169, https://doi.org/10.1038/s41467-024-49539-9, 2024.
Wentworth, G. R., Murphy, J. G., Benedict, K. B., Bangs, E. J., and Collett Jr., J. L.: The role of dew as a night-time reservoir and morning source for atmospheric ammonia, Atmos. Chem. Phys., 16, 7435–7449, https://doi.org/10.5194/acp-16-7435-2016, 2016.
Wu, L., Sun, J., Zhang, X., Zhang, Y., Wang, Y., Zhong, J., and Yang, Y.: Aqueous-phase reactions occurred in the PM2.5 cumulative explosive growth during the heavy pollution episode (HPE) in 2016 Beijing wintertime, Tellus B, 71, 1620079, https://doi.org/10.1080/16000889.2019.1620079, 2019.
Wu, Z. and Huang, N. E.: Ensemble empirical mode decomposition: a noise-assisted data analysis method, Adv. Adapt. Data Anal., 01, 1–41, https://doi.org/10.1142/S1793536909000047, 2009.
Xie, X., Hu, J., Qin, M., Guo, S., Hu, M., Wang, H., Lou, S., Li, J., Sun, J., Li, X., Sheng, L., Zhu, J., Chen, G., Yin, J., Fu, W., Huang, C., and Zhang, Y.: Modeling particulate nitrate in China: Current findings and future directions, Environ. Int., 166, 107369, https://doi.org/10.1016/j.envint.2022.107369, 2022.
Xu, J., Lu, M., Guo, Y., Zhang, L., Chen, Y., Liu, Z., Zhou, M., Lin, W., Pu, W., Ma, Z., Song, Y., Pan, Y., Liu, L., and Ji, D.: Summertime Urban Ammonia Emissions May Be Substantially Underestimated in Beijing, China, Environ. Sci. Technol., 57, 13124–13135, https://doi.org/10.1021/acs.est.3c05266, 2023.
Xu, W., Zhang, L., and Liu, X.: A database of atmospheric nitrogen concentration and deposition from the nationwide monitoring network in China, Sci. Data, 6, 51, https://doi.org/10.1038/s41597-019-0061-2, 2019.
Yamamoto, N., Kabeya, N., Onodera, M., Takahahi, S., Komori, Y., Nakazuka, E., and Shirai, T.: Seasonal variation of atmospheric ammonia and particulate ammonium concentrations in the urban atmosphere of yokohama over a 5-year period, Atmos. Environ., 22, 2621–2623, https://doi.org/10.1016/0004-6981(88)90498-2, 1988.
Yamamoto, N., Nishiura, H., Honjo, T., Ishikawa, Y., and Suzuki, K.: A long-term study of atmospheric ammonia and particulate ammonium concentrations in Yokohama, Japan, Atmos. Environ., 29, 97–103, https://doi.org/10.1016/1352-2310(94)00226-b, 1995.
Yamanouchi, S., Viatte, C., Strong, K., Lutsch, E., Jones, D. B. A., Clerbaux, C., Van Damme, M., Clarisse, L., and Coheur, P.-F.: Multiscale observations of NH3 around Toronto, Canada, Atmos. Meas. Tech., 14, 905–921, https://doi.org/10.5194/amt-14-905-2021, 2021.
Yao, X. and Zhang, L.: Trends in atmospheric ammonia at urban, rural, and remote sites across North America, Atmos. Chem. Phys., 16, 11465–11475, https://doi.org/10.5194/acp-16-11465-2016, 2016.
Yao, X. and Zhang, L.: Causes of Large Increases in Atmospheric Ammonia in the Last Decade across North America, ACS Omega, 4, 22133–22142, https://doi.org/10.1021/acsomega.9b03284, 2019.
Yao, X., Hu, Q., Zhang, L., Evans, G. J., Godri, K. J., and Ng, A. C.: Is vehicular emission a significant contributor to ammonia in the urban atmosphere?, Atmos. Environ., 80, 499–506, https://doi.org/10.1016/j.atmosenv.2013.08.028, 2013.
Yu, F., Nair, A. A., and Luo, G.: Long-Term Trend of Gaseous Ammonia Over the United States: Modeling and Comparison With Observations, J. Geophys. Res.-Atmos., 123, 8315–8325, https://doi.org/10.1029/2018JD028412, 2018.
Zbieranowski, A. L. and Aherne, J.: Ambient concentrations of atmospheric ammonia, nitrogen dioxide and nitric acid across a rural–urban–agricultural transect in southern Ontario, Canada, Atmos. Environ., 62, 481–491, https://doi.org/10.1016/j.atmosenv.2012.08.040, 2012.
Zhang, X., Lin, W., Ma, Z., and Xu, X.: Indoor NH3 variation and its relationship with outdoor NH3 in urban Beijing, Indoor Air, 31, 2130–2141, https://doi.org/10.1111/ina.12907, 2021.
Zhang, Y., Benedict, K. B., Tang, A., Sun, Y., Fang, Y., and Liu, X.: Persistent Nonagricultural and Periodic Agricultural Emissions Dominate Sources of Ammonia in Urban Beijing: Evidence from 15N Stable Isotope in Vertical Profiles, Environ. Sci. Technol., 54, 102–109, https://doi.org/10.1021/acs.est.9b05741, 2019.
Zhang, Y., Liu, X., Fang, Y., Liu, D., Tang, A., and Collett, J. L.: Atmospheric Ammonia in Beijing during the COVID-19 Outbreak: Concentrations, Sources, and Implications, Environ. Sci. Technol. Lett., 8, 32–38, https://doi.org/10.1021/acs.estlett.0c00756, 2020.
Zheng, M., Wang, Y., Yuan, L., Chen, N., and Kong, S.: Ambient observations indicating an increasing effectiveness of ammonia control in wintertime PM2.5 reduction in Central China, Sci. Total Environ., 824, 153708, https://doi.org/10.1016/j.scitotenv.2022.153708, 2022.
Zhou, C., Zhou, H., Holsen, T. M., Hopke, P. K., Edgerton, E. S., and Schwab, J. J.: Ambient Ammonia Concentrations Across New York State, J. Geophys. Res.-Atmos., 124, 8287–8302, https://doi.org/10.1029/2019jd030380, 2019.
Zhou, Y., Shuiyuan Cheng, Lang, J., Chen, D., Zhao, B., Liu, C., Xu, R., and Li, T.: A comprehensive ammonia emission inventory with high-resolution and its evaluation in the Beijing–Tianjin–Hebei (BTH) region, China, Atmos. Environ., 106, 305–317, https://doi.org/10.1016/j.atmosenv.2015.01.069, 2015.