the Creative Commons Attribution 4.0 License.
the Creative Commons Attribution 4.0 License.
 | 22 Aug 2024
Markedly different impacts of primary emissions and secondary aerosol formation on aerosol mixing states revealed by simultaneous measurements of CCNC, H(/V)TDMA, and SP2
Jiangchuan Tao
Biao Luo
Weiqi Xu
Gang Zhao
Hanbin Xu
Biao Xue
Miaomiao Zhai
Wanyun Xu
Huarong Zhao
Sanxue Ren
Guangsheng Zhou
Li Liu
This study compares aerosol mixing-state parameters obtained via simultaneous measurements using DMA–CCNC, H(/V)TDMA, and DMA–SP2, shedding light on the impacts of primary aerosol emissions and secondary aerosol (SA) formation. The analysis reveals significant variations in mixing-state parameters among different techniques, with VTDMA and DMA–SP2 indicating that non-volatile particles mainly stem from black carbon (BC)-containing aerosols, while a substantial proportion of nearly hydrophobic aerosols originates from fossil fuel combustion and biomass-burning emissions. Synthesizing the results, some nearly hydrophobic BC-free particles were found to be cloud condensation nuclei (CCN)-inactive under the measured supersaturated conditions, likely from fossil fuel combustion emissions, while others were CCN-active, linked to biomass-burning emissions. Moreover, BC-containing aerosols emitted from fossil fuel combustion exhibit more external mixing with other aerosol components compared to those from biomass burning. Secondary nitrate and organic aerosol formation significantly affect aerosol mixing states, enhancing aerosol hygroscopicity and volatility while reducing heterogeneity among techniques. The study also highlights distinct physical properties of two resolved secondary organic aerosol factors, hinting at their formation through different mechanisms. These findings underscore the importance of comparing aerosol mixing states from different techniques as a tool for understanding aerosol physical properties from different sources and their responses to SA formation, as well as aiding in the exploration of SA formation mechanisms.
- Article
(1849 KB) - Full-text XML
-
Supplement
(1262 KB) - BibTeX
- EndNote


The aerosol mixing state is a crucial physicochemical property of aerosol particles (Riemer et al., 2019), exerting a significant impact on their optical properties and cloud condensation nuclei (CCN) activity, thus affecting their impact on the climate and environment (Fierce et al., 2017; Riemer et al., 2019; Stevens et al., 2022). For example, variations in the mixing state of black carbon (BC) particles can significantly alter their absorption and radiative effects (Bond et al., 2013; Lack et al., 2012; Zhao et al., 2019; Moffet et al., 2016; Matsui et al., 2018; Peng et al., 2016). Using simple internal mixing-state assumptions for aerosol chemical components to estimate CCN number concentrations can lead to substantial overestimations (up to 30 %; Deng et al., 2013; Farmer et al., 2015; Ren et al., 2018; Ching et al., 2017, 2019; Tao et al., 2021). The aerosol mixing state varies widely due to complex emissions and atmospheric transformations, leading to significant uncertainties in estimating the effects of aerosols based on simplified mixing-state assumptions (Ervens, 2015; Wang et al., 2022; Fu et al., 2022).
The aerosol mixing state describes the mixture of aerosol chemical components within each particle and the distribution of these particles in the aerosol population. This property can be directly measured using single-particle chemical composition techniques (Fierce et al., 2017; Riemer et al., 2019), such as the single-particle soot photometer (SP2), which measures refractory black carbon (rBC) mass concentrations and the mixing state of rBC with other aerosol components, or single-particle chemical composition measurement techniques (e.g., single-particle aerosol mass spectrometer, SP-AMS) that have been developed in recent years (Lee et al., 2019; Riemer et al., 2019, and references therein). Alternatively, the aerosol mixing state can be inferred from indirect measurements of aerosol properties, such as size-resolved aerosol CCN activity (measured by coupling a differential mobility analyzer, DMA, and a CCN counter, CCNC), size-resolved aerosol hygroscopicity distributions, or volatility distributions (measured by a humidified/volatility tandem differential mobility analyzer, H(/V)TDMA).
However, each technique yields information on aerosol mixing states based on different aerosol microphysical properties, thus obtaining aerosol mixing states that are different but linked to one another. For instance, while both CCN activity and hygroscopic growth measurements are associated with aerosol hygroscopicity, an intercomparison between CCNC and HTDMA measurements has prompted investigations into aerosol hygroscopicity variations under different saturation conditions (Su et al., 2010; Jurányi et al., 2013; Lance et al., 2013; Kawana et al., 2016; Tao et al., 2020; Jiang et al., 2021). Although the SP2 and VTDMA techniques depend on the evaporation of non-refractory compositions, only rBC remains in the SP2 measurements. In contrast, non-refractory composition evaporation depends on the thermodynamic temperature in the VTDMA measurements. Thus, measurements of an SP2 are highly correlated to those of a VTDMA at high temperatures (200–300 °C), with their differences reflecting variations in aerosol density, shape, or volatility (Philippin et al., 2004; Wehner et al., 2009; Adachi et al., 2018, 2019; Wang et al., 2022). HTDMA and VTDMA can be combined to study the influence of the aerosol mixing state on hygroscopicity and volatility (Zhang et al., 2016; Cai et al., 2017; Wang et al., 2017). Strong correlations were found between the hydrophobic and non-volatile particles, suggesting that they might have similar chemical compositions (Zhang et al., 2016). In addition, some studies have shown that, except for BC, low-volatility particles correlate well with CCN-inactive particles based on VTDMA and CCNC measurements (Kuwata et al., 2007; Kuwata and Kondo, 2008; Rose et al., 2011; Cheng et al., 2012). Therefore, intercomparisons between mixing-state parameters measured by distinct techniques provide a better characterization of the aerosol mixing state and provide insight into aerosol physiochemical properties. Previous studies have mainly compared two types of aerosol mixing-state measurements and lacked a comprehensive comparative analysis among SP2, DMA-CCN, and H(/V)TDMA measurements, hindering the wide application of derived aerosol mixing states obtained by individual techniques.
The mixing state of primary aerosols can vary greatly, depending on their type and emission conditions (Cheng et al., 2012; Wang et al., 2017, 2022; Ting et al., 2018; D. Liu et al., 2021), and can be significantly altered during aging processes or secondary formation (Wehner et al., 2009; Cheng et al., 2012; Wang et al., 2022; Tomlin et al., 2021; Lata et al., 2021). Primary aerosol emissions, such as biomass burning, fossil fuel combustion, and cooking, tend to contribute to weak hygroscopicity (Herich et al., 2008, 2009; Wang et al., 2020; Kim et al., 2020) and low-volatility aerosols (Hong et al., 2017; Saha et al., 2018). The formation of secondary aerosols (SAs), including the aging of BC-containing particles and primary organic aerosols, mainly contributes to aerosols with strong CCN activity (Mei et al., 2013; Ma et al., 2016; Tao et al., 2021) and high hygroscopicity (Chen et al., 2018; Kim et al., 2020; Wang et al., 2020). It is important to study the impact of specific primary aerosol emissions and SA formation on aerosol mixing states and the influence of aerosol mixing-state parameters derived from different techniques to enhance our understanding of the mixing state of aerosols from different emission sources and improve their characterization in models.
The North China Plain (NCP) is among the most polluted regions in China with various primary emission sources and strong SA formations that play critical roles in air pollution (Xu et al., 2011; Tao et al., 2012; Liu et al., 2015). The complex mixing state of aerosols in the NCP contributes to uncertainties in evaluating their climate and environmental effects (Zhuang et al., 2013; Nordmann et al., 2014; Zhang et al., 2016; Tao et al., 2020; Shi et al., 2022), particularly regarding BC particles (Wu et al., 2017; Liu et al., 2019; Zhao et al., 2019; Wang et al., 2011; Zheng et al., 2019). Meteorological conditions can greatly affect SA formation in the NCP and can be significantly exacerbated during severe pollution events. SA formation under low-relative-humidity (RH) conditions, mainly through the condensation of gaseous-phase oxidation products, would change to that mainly occurring in the aqueous phase under high-RH conditions (Kuang et al., 2020). Because SAs formed through different mechanisms have different chemical compositions and add mass to different aerosol populations, SA formation under different meteorological conditions can affect the aerosol mixing states differently (Tao et al., 2021). This study obtained the aerosol mixing state through concurrent measurements of the CCN activity, hygroscopicity, volatility, and BC particles at a regional site in the NCP using CCNC, HTDMA, VTDMA, and SP2 instruments. This provides a unique opportunity to perform a comprehensive intercomparison of the aerosol mixing states among different techniques to gain insight into the impact of primary aerosol emissions and SA formation on the observed aerosol mixing states.
2.1 Campaign information and instrument setup
From 16 October to 16 November 2021, aerosol mixing states were continuously and concurrently monitored using different techniques at the Gucheng site in Dingxing County, Hebei Province, China, as part of a campaign to investigate AQueous Secondary aerOsol Formation in Fogs and Aerosols and their Radiative effects in the NCP (AQ-SOFAR). The observation site, located at 39°09′ N, 115°44′ E, is an Ecological and Agricultural Meteorology Station of the Chinese Academy of Meteorological Sciences, situated between the megacities of Beijing (approximately 100 km away) and Baoding (approximately 40 km away) and surrounded by farmlands and small towns. This site provides a representative view of the background atmospheric pollution conditions in the NCP (Kuang et al., 2020; Li et al., 2021).
Different measurement techniques were used to simultaneously obtain the aerosol mixing state through CCN activity, hygroscopicity, volatility, and BC particle observations. In addition to aerosol mixing-state measurements, the AQ-SOFAR campaign includes measurements of the aerosol number size distribution, chemical composition, aerosol scattering, and absorption properties. Aerosol number size distributions in the diameter range of 13 nm–4 µm were measured by the scanning mobility particle sizer (13–550 nm) and the aerodynamic aerosol classifier (100 nm–4 µm), and they are merged by assuming an aerosol density of 1.6 g cm−3. The total BC mass concentrations were determined using an Aethalometer (Magee, AE33; Drinovec et al., 2015); more information on the correction of absorption measurements and mass concentration calculations is available in Luo et al. (2022). All aerosol measurement instruments were housed in a temperature-controlled container at 24 °C. The inlet was switched among three impactors: TSPs (total suspended particles), PM2.5 (particulate matter with an aerodynamic diameter smaller than 2.5 µm), and PM1 (particulate matter with an aerodynamic diameter of less than 1 µm). Inlet changes among impactors affect dry-state aerosol sampling owing to ambient aerosols being enlarged through aerosol hygroscopic growth or activation. However, the aerosol mixing-state and aerosol chemical composition measurements were made on submicron aerosols, and the inlet change almost did not affect those measurements under conditions of RH that was less than 90 %. The sampled aerosol was dried by two parallelly assembled Nafion dryers with a length of 1.2 m. Two Nafion dryers used because of the high RH and sample flow rate (∼ 16 L min−1) during the campaign to ensure drying efficiency. The flow rate is carefully adjusted in the inlet in order to ensure accurate aerosol particle size cutoff. In addition, during autumn and winter in the NCP, ambient air temperature (< 20 °C and sometimes < 0 °C) can be significantly lower than the room temperature (∼ 24 °C). Therefore, this dryer system can maintain the RH of the sampled aerosols to below 20 %. Meteorological data such as temperature, pressure, wind speed, wind direction, and RH were obtained from an automatic weather station operated by the station.
The chemical composition of the submicron aerosols was analyzed using a high-resolution time-of-flight aerosol mass spectrometer (HR-ToF-AMS). The ionization efficiency (IE) was calibrated using 300 nm diameter pure NH4NO3 particles and following the standard protocols outlined in Jayne et al. (2000) in the middle of the campaign, with the relative ionization efficiency (RIE) of ammonium determined to be 5.26. The RIE of sulfate was 1.28, using pure (NH4)2SO4 particles, and the default RIEs of 1.4 for organic aerosols, 1.1 for nitrates, and 1.3 for chloride were used as the organic aerosols. The composition-dependent collection efficiency reported by Middlebrook et al. (2012) was used. Elemental ratios were derived using the “Improved-Ambient (I-A)” method as described in Canagaratna et al. (2015), including hydrogen-to-carbon (H C), oxygen-to-carbon (O C), and organic-mass-to-organic-carbon (OM OC) ratios. Two primary organic aerosol (POA) and two oxygenated organic aerosol (OOA) factors were identified by high-resolution positive matrix factorization (HR-PMF; Ulbrich et al., 2009; Paatero and Tapper, 1994). This study used the summation of the two OOA factors to represent secondary organic aerosols (SOAs). The mass spectra of the organic aerosol (OA) factors and their correlations with external species are shown in Figs. S1 and S2 in the Supplement. The biomass-burning organic aerosol (BBOA) spectrum was characterized by abundant fragments of 60 (mainly C2H4O) and 73 (mainly C3H5O) with two indicators of biomass burning (Mohr et al., 2009). BBOA correlated well with C2H4O (R2 = 0.91) and C3H5O (R2 = 0.90). Consistent with previous studies in Beijing (Xu et al., 2019), the PMF analysis revealed a mixed factor named fossil fuel organic aerosol (FFOA) which comprises traffic emissions and coal combustion and is characterized by a typical hydrocarbon ion series. FFOA had a relatively high f44 (0.083) value, which was likely due to aging during regional transportation, similar to the results observed in the winter of 2016 in Beijing (Xu et al., 2019) and coal combustion organic aerosols in Gucheng (Chen et al., 2022). Secondary organic aerosol formation from volatile organic compound precursors could occur in different formation pathways, such as aqueous-phase, heterogeneous, or gas-phase reactions. It might also be oxidized under different conditions, such as oxidation under different nitrogen oxide conditions with different oxidation capacities and oxidants. The two resolved OOA factors displayed different spectral patterns, correlations with tracers, and diurnal variations, suggesting that they resulted from different chemical processes. However, their formation mechanisms remain to be explored in future studies. In general, the OOA factor 1 (OOA1) has higher (3.9) and O C (0.91) ratios than OOA factor 2 (OOA2) with 2.1 and 0.78, respectively. The mass fraction (MF) of each chemical composition is calculated as the bulk mass fraction of each chemical composition in non-refractory PM1 (NR-PM1).
This study did not consider losses in the inlet line and sampling systems for the following reasons: (1) investigated mixing-state parameters are represented by number fractions (NFs) of different diameters which are much less affected by losses in sampling systems compared with absolute number concentrations, and (2) good consistency was achieved between measurements of particle number size distributions (PNSDs) and mass concentrations measured by AMS. The average ratio between volume concentration derived from AMS and rBC measurements (densities of compounds are the same as Kuang et al., 2021) and the volume concentration derived from PNSD measurements was 0.79 (R = 0.97; as shown in Fig. S3), consistent with previous reports as AMS cannot detect aerosol components such as dust (Kuang et al., 2021).
2.2 Aerosol mixing-state measurement techniques
2.2.1 DMA–CCNC measurements
The CCN activity of the particles under supersaturated conditions was measured using a DMA–CCNC system, which consisted of a differential mobility analyzer (DMA; model 3081; TSI, Inc., MN, USA), condensation particle counter (CPC; model 3756; TSI, Inc., MN, USA), and continuous-flow CCNC (model CCN100; Droplet Measurement Technologies LLC, USA). The system was operated in size-scanning mode and provided the size-resolved particle activation ratio (SPAR) by combining CPC and CCNC measurements at different particle sizes. To compare the instruments, three supersaturations (SSs) of 0.08 %, 0.14 %, and 0.22 % were applied in a single cycle of approximately 15 min. CCN measurements under these three SSs revealed that the CCN activity of aerosols resides in the accumulation mode with an aerosol diameter range of approximately 100–200 nm, which is close to the diameters of the H(/V)TDMA measurements. Higher SSs would reveal CCN activities of smaller aerosol particles (< 100 nm) where the DMA–SP2 measurement is unavailable. The sample and sheath flow rates of DMA were set at 1 and 5 L min−1, respectively, resulting in a measured particle diameter range of 9–500 nm, with a running time of 5 min per cycle. Supersaturation in the CCNC was calibrated with monodisperse ammonium sulfate particles (Rose et al., 2008) before and after the campaign. The flow rates were also calibrated before and after the campaign and checked daily to minimize uncertainties in droplet counting and supersaturation formed in the column (Roberts and Nenes, 2005; Lance et al., 2006). SPAR deviations due to multiple-charge particles were corrected using a modified algorithm based on Hagen and Alofs (1983) and Deng et al. (2011). Further details regarding this system can be found in Ma et al. (2016) and Tao et al. (2021).
2.2.2 H(/V)TDMA measurements
The mixing state of the aerosols in terms of hygroscopicity and volatility was measured using a hygroscopicity/volatility tandem differential mobility analyzer (H(/V)TDMA; Tan et al., 2013). The H(/V)TDMA consisted of two DMA (model 3081 L; TSI Inc.), with the first DMA (DMA1) selecting dried particles without conditioning (RH ∼ 15 %) and the second DMA (DMA2) selecting conditioned particles. H(/V)TDMA can operate in either the H or V mode and is controlled by a three-way solenoid valve. A Nafion humidifier was used in the H mode to condition the selected dry particles to 90 % RH equilibrium. The number–size distribution of humidified particles (Dp) was measured using DMA2 and CPC (model 3772, TSI Inc.). The RH-dependent hygroscopic growth factor (GF) at a specific diameter (Dd) was calculated as follows:
where Dp(RH) is the size of particles undergoing humidification. Four dry electrical mobility diameters (50, 100, 150, and 200 nm) were measured in this mode. The instrument was regularly calibrated using standard polystyrene latex (PSL) spheres and ammonium sulfate particles.
In the V mode, a heated tube evaporated the volatile coatings from the previously selected dry particles. Six temperature settings were used for the heated tube, ranging from 25–200 °C. The number–size distributions of the heated particles were measured using DMA2 and CPC. In addition to the four particle sizes measured in the H mode, three additional particle sizes (250, 300, and 350 nm) were measured in the V mode (residence time inside the heated tube was about 1.6 s; Hong et al., 2017). The temperature-dependent shrinkage factor (SF), which is the ratio of the heated particle size to dry particle size without heating (Dd), is defined as
where Dp(T) denotes the particle diameter during heating. A complete cycle of H-mode measurements under one RH condition and V-mode measurements at six temperatures took approximately 3 h. The probability density function (PDF) of the GF (or SF) was calculated from the measured density function using the inversion algorithm described by Stolzenburg and McMurry (2008).
2.2.3 DMA–SP2 measurements
The size-resolved BC mixing states were measured using an SP2 (Droplet Measurement Technologies LLC, USA) after the DMA (model 3081, TSI, USA). The DMA selected aerosols of various dry particle sizes which were then introduced into SP2. The DMA–SP2 setup was able to measure the mixing states of aerosols with diameters (detection limit of approximately 80 nm based on the calibration) of 100, 120, 160, 200, 235, 270, 300, 335, 370, 400, 435, 470, 500, 535, 570, 600, 635, 670, and 700 nm within 20 min when it was not placed after a denuder–bypass switch system (during the following time periods on 13–24 October at 09:00 LT (local time; all instances of time in the text are given in local time) and from 09:00 on 5 November to 09:00 on 8 November). However, it only measured mixing states at diameters of 120, 160, 200, 250, 300, 400, and 500 nm when it was placed after a thermodenuder–bypass switch system (during the following time periods at 11:00 on 24 October to 08:00 on 5 November and at 09:00 on 8 November to 18:00 on 17 November). Because the HTDMA and VTDMA measurements were conducted solely by a single H(/V)TDMA system operating in different modes, the time needed for a single-particle size measurement of HTDMA and VTDMA was much longer than that of the DMA–SP2 system. Thus, for the same measurement cycle (2 h), more particle sizes were selected in the DMA–SP2 system to acquire the BC mass concentration and mixing state at larger diameters than HTDMA and VTDMA.
The SP2 chamber had a continuous Nd:YAG laser beam with a wavelength of 1064 nm. The BC-containing particles passing through the laser beam become incandescent by absorbing radiation. The mass concentration of the BC was calculated by measuring the intensity of the emitted incandescent light. The sheath flow sample flow ratio was maintained at 10 for the DMA to reduce the width of the diameter distribution of the selected monodisperse aerosols. Additionally, the flow rate of the SP2 was changed from 0.1 to 0.12 L min−1 starting on 22 October (in the specification of SP2, the allowed flow rate range was 0.03–0.18 L min−1). SP2 was calibrated using quadag soot particles, as reported by Gysel et al. (2011). Further details regarding the calibrations are provided in Sect. S1 in the Supplement.
2.3 Derivations of mixing-state parameters
2.3.1 Fitting SPAR curves measured by the DMA–CCNC system
The SPAR curves were parameterized using a sigmoidal function with three parameters. As shown in Fig. S4, a sigmoidal curve generally characterized the measured SPAR. This parameterization assumes that the aerosol is an external mixture of CCN-active hydrophilic and CCN-inactive hydrophobic particles (Rose et al., 2010). The formula used to parameterize the SPAR (Ra(Dd)) for a specific SS is as follows (Rose et al., 2008):
where erf denotes the error function. The maximum activation fraction (MAF) is an asymptote of the measured SPAR curve for large particles, as shown in Fig. S4, representing the number fraction of CCN relative to the total number of particles. Da is the midpoint activation diameter, is linked to the hygroscopicity of the CCN, and indicates the diameter at which the SPAR equals half of the MAF value. σ is the standard deviation of the cumulative Gaussian distribution function and characterizes the heterogeneity of CCN hygroscopicity. In Fig. S4, σ indicates the slope of the steep increase in the SPAR curves when the diameter is close to Da. Generally, hydrophilic particles larger than Da can become CCN. Therefore, these three parameters can be used to characterize the hygroscopicity of these hydrophilic particles. This study did not consider the impact of nearly hydrophobic particles on SPAR, as deviations from this parameterization scheme due to this impact were negligible at low SSs, as stated in Tao et al. (2020).
2.3.2 Classification of particle type based on hygroscopicity or volatility
In this study, ambient aerosol particles were classified into two groups based on their hygroscopicity (hydrophobic and hydrophilic) and two groups based on their volatility (non-volatile and volatile) based on the measurements from H(/V)TDMA (Wehner et al., 2009; Liu et al., 2011; Zhang et al., 2016). Each group can be defined using the critical values of GF or SF as follows: hydrophobic population, where GF < GFC; hydrophilic population, where GF ≥ GFC; non-volatile population, where SF ≥ SFC; and volatile population, where SF < SFC.
The critical values of GF (GFC) and SF (SFC) in H(/V)TDMA depend on the particle size and working conditions, such as relative humidity and heating temperature. During this campaign, the SFC was set to 0.85 for all seven measured particle sizes at a temperature of 200 °C. The GFC for the four measured particle sizes of 50, 100, 150, and 200 nm were 1.1, 1.15, 1.175, and 1.2, respectively, and the corresponding hygroscopicity parameter, κ, was approximately 0.07. These values of GFC and SFC divide the probability density functions (PDFs) of SF and GF into two modes, as shown in Fig. 2c, consistent with prior NCP studies (Liu et al., 2011; Zhang et al., 2016), and may be different from those GFC and SFC in other studies because of the difference in aerosol microphysical properties. The NF for the hydrophilic group (NFH) and volatile group (NFV) can be calculated as follows:
where GFPDF and SFPDF are the PDFs of GF and SF, respectively, as derived from H(/V)TDMA measurements.
2.3.3 Classification of particle type based on DMA–SP2 measurements
BC-containing particles can be categorized into two groups based on coating thickness, namely bare-BC/thinly coated BC particles and thickly coated BC particles. For the measurement of coated-BC particles at SP2, the incandescence signal is generally detected later than the scattering signal, and the time difference between the occurrence of the peaks of the incandescence and scattering signals is defined as the lag time (Moteki and Kondo, 2007; Sedlacek et al., 2012; Subramanian et al., 2010). The coating thickness of BC-containing particles in the SP2 measurement can be indicated by the lag time (Moteki and Kondo, 2007; Schwarz et al., 2006; Sedlacek et al., 2012; Subramanian et al., 2010; Metcalf et al., 2012), which has exhibited a clear two-mode distribution in previous studies (Zhang et al., 2018a; Zhao et al., 2022). A critical lag time threshold can be used to differentiate between the different types of BC-containing particles and calculate the NF of bare- and coated-BC particles in the total identified particles. In this study, a two-mode distribution of the lag time (Δt) was observed, and a critical value of 0.8 µs was used to classify the BC-containing particles into thinly coated (or bare-) BC (Δt < 0.8 µs) and thickly coated BC (Δt ≥ 0.8 µs). The definitions of all abbreviations are listed in Appendix A.
3.1 Campaign overview
The time series of the meteorological parameters, aerosol mixing-state measurements using different techniques, and mass concentrations of the aerosol chemical components are shown in Fig. 1. In detail, the measurements of aerosol mixing states include SPAR at an SS of 0.08 % by DMA–CCNC, GFPDF (PDF of GF) at 200 nm by HTDMA, SFPDF (PDF of SF) at 200 nm and 200 °C by VTDMA, and lag time PDF of 200 nm BC-containing particles by DMA–SP2. The secondary inorganic aerosol (SIA), SOA, POA, and BC mass concentrations are shown in Fig. 1b. Three periods with significantly different aerosol pollution conditions were identified during the campaign. As shown in Fig. 1b, before 23 October (moderately polluted period), the accumulation of aerosols led to SIA mass concentrations < 20 µg m−3. In contrast, the highest mass concentrations of SOA, POA, and BC all reached 10 µg m−3. The mass concentrations of different aerosol components increased significantly from 23 October to 6 November (heavily polluted period with an average non-refractory PM1 mass concentration of 49.5 ± 22.5 µg m−3) and decreased to much lower levels after 6 November (clean period with a non-refractory PM1 mass concentration of 5.1 ± 3.3 µg m−3). Two particle groups were identified concerning the CCN activity, hygroscopicity, volatility, and coating thickness, as demonstrated by the SPAR, GFPDF, SFPDF, and lag time PDF of BC-containing particles. Significant variations in the aerosol mixing states were also observed during the three periods with different pollution conditions, as demonstrated by the variations in SFPDF measured by VTDMA. For example, the SF of the non-volatile particle group decreased during the heavily polluted period. Aerosol mixing states may have changed because of various transformations in existing aerosol particles and distinct secondary formation processes under different pollution conditions (Kuang et al., 2020; Tao et al., 2021; Shi et al., 2022; Yang et al., 2022). Diurnal variations in the mass concentrations of different aerosol chemical components and mixing states can be observed in the variations in the SPAR measurements, as previously observed in this region (Liu et al., 2011; Ma et al., 2012; Kuang et al., 2015; Tao et al., 2020).
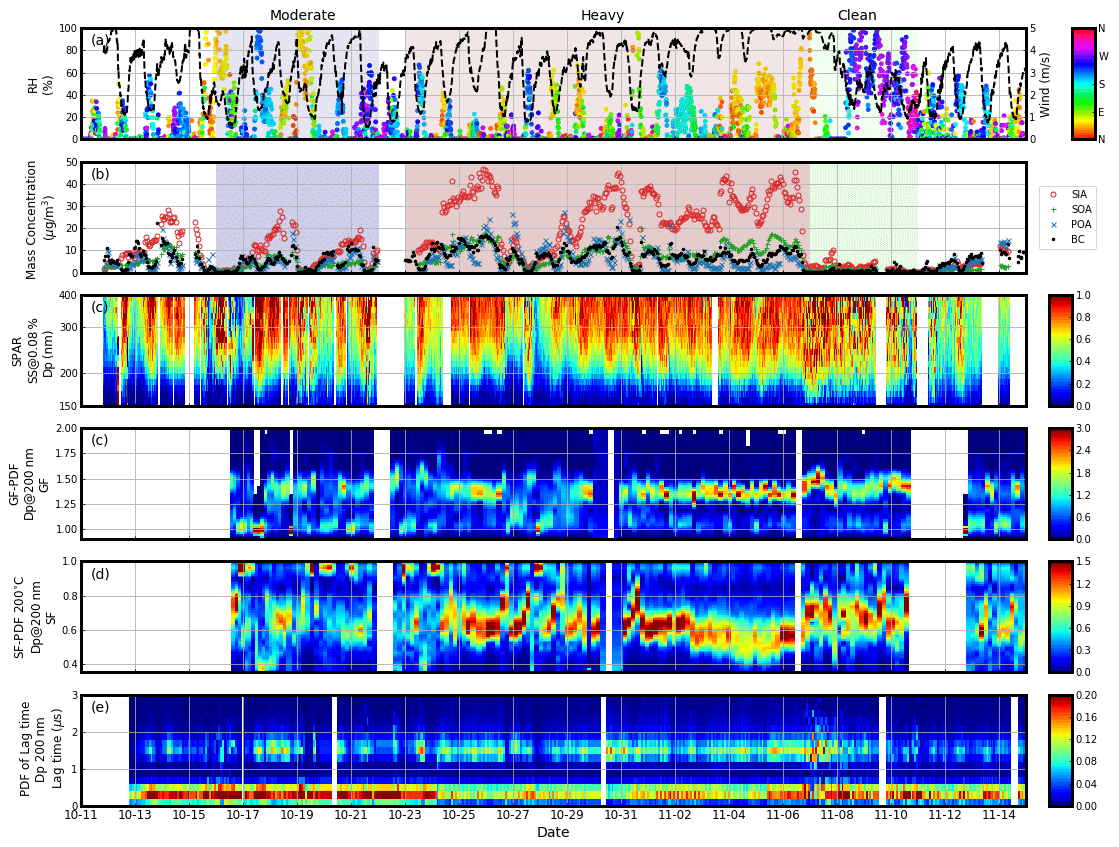
Figure 1Overview of the measurements during the campaign. (a) Meteorological parameters including wind speed (dots) and relative humidity (RH; black line), with the colors of the dots representing the wind direction. (b) Mass concentrations of aerosol chemical components including secondary inorganic aerosols (SIAs; red circle), secondary organic aerosols (SOAs; green plus), primary organic aerosols (POAs; blue cross) and black carbon (BC; black dots). (c) Size-resolved particle activation ratio (SPAR) under the supersaturation (SS) of 0.08 % observed by the DMA–CCNC, with warmer colors corresponding to higher values. (d) Probability density function (PDF) of the growth factor (GFPDF) at 200 nm observed by the HTDMA. (e) PDF of shrinkage factor (SFPDF) at 200 nm and 200 °C observed by the VTDMA. (f) PDF of lag time at 200 nm observed by DMA–SP2. The shaded blue, red, and green periods represent the three periods with moderate pollution, heavy pollution, and clean conditions, respectively.
Figure 2 shows the campaign-averaged SPAR at the three SSs, PDF of the lag time of BC-containing particles, GFPDF, and SFPDF at 200 °C for different particle sizes. The sigmoidal SPAR curves were characterized by a rapid increase, followed by a gradual increase to unit 1, similar to the measured SPAR curves previously observed in this region (Deng et al., 2011; Zhang et al., 2014; Ma et al., 2016; Tao et al., 2018). At lower SSs, the particle size required for CCN activation was larger; thus, rapid increases in the SPAR curves occurred at larger particle sizes, as expected. In addition, the maximum activation ratio of the SPAR curves decreases as fewer particles are CCN-active under low SSs. For the three measured SSs, the particle sizes where SPAR equals approximately 0.5 are approximately 90, 120, and 180 nm for the three SSs of 0.08 %, 0.14 %, and 0.22 %, respectively, consistent with the average Da (see Eq. 7) values of the campaign. The NF of CCN-active particles in large-diameter ranges (which varies with SS and, for example, is greater than 200 nm for 0.08 %) can be indicated by the gradual increase in the SPAR curves and quantified by the fitting parameter, MAF (see Eq. 7). The PDFs of the lag time, GF, and SF were all characterized by a bimodal distribution, which indicates two particle groups of BC-containing particles with different coating thicknesses, hygroscopicity, and volatility. The variations in the aerosol mixing states were further analyzed based on the measured mixing-state parameters.
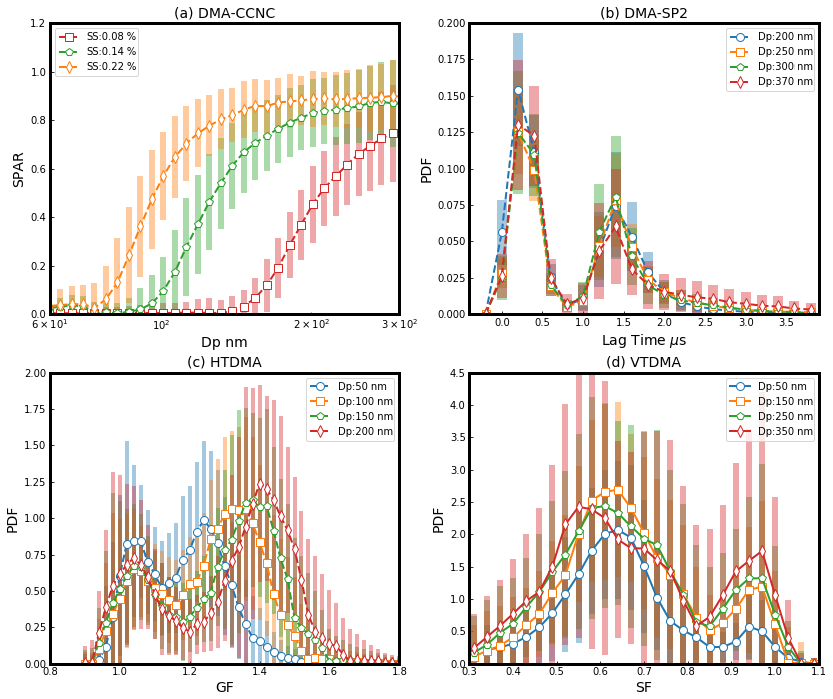
Figure 2The campaign averages. (a) Size-resolved particle activation ratio (SPAR) curves measured by DMA–CCNC at the three supersaturations (SSs; represented by different colors and markers). (b) Probability density function (PDF) of lag time measured by DMA–SP2 at four particle sizes (represented by different colors and markers). (c) PDF of growth factor (GF) measured by HTDMA at four particle sizes (represented by different colors and markers). (d) PDF of shrinkage factor (SF) measured by VTDMA under the temperature of 200 °C at five particle sizes (represented by different colors and markers). The shaded areas indicate the standard deviations.
3.2 Intercomparisons among aerosol mixing-state parameters derived using four techniques
The size-dependent characteristics of the aerosol mixing-state parameters derived from the measurements of the four techniques and the MFs of different aerosol chemical components during the three pollution periods are shown in Fig. 3. In general, the size-dependent characteristics of MAF, NFH, NFV, and NFnoBC were similar, suggesting that they were likely dominated by the same particle group, namely BC-free particles. This particle group had the highest number fraction (> 0.7) during the heavily polluted period and the lowest number fraction (down to 0.5) during the clean period, with the fraction decreasing with increasing particle size. This suggests that primary emissions tend to have higher number fractions of BC-containing particles in larger diameter ranges; for example, the number fraction of BC-containing particles increases from ∼ 0.1 to ∼ 0.4 as the particle size increases from 200 to 500 nm during the clean period. Because the bulk aerosol MF is mostly contributed by particles > 300 nm, there may have been more hydrophilic, volatile, CCN-active, and BC-free particles with larger sizes (> 300 nm) during the heavily polluted period owing to strong SA formation in larger diameter ranges (Kuang et al., 2020), resulting in a higher NF of these particles compared to the clean period. As for RexBC, which is defined as the number concentration ratio of externally mixed BC particles in the total BC-containing particles, the small size dependence of RexBC during the moderately polluted period might have been associated with stronger primary emissions, while the decrease in RexBC with increasing particle diameter in the polluted period confirmed that SA formation is more efficient for particles with larger diameters.
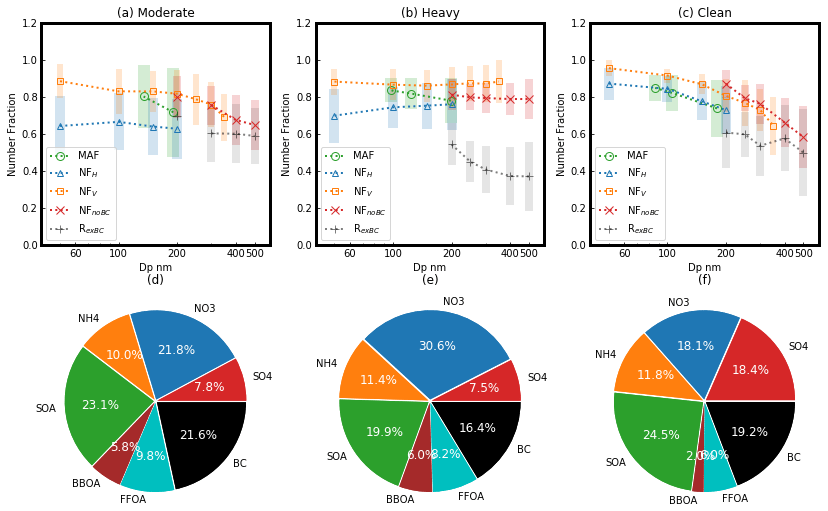
Figure 3(a–c) Size dependence of MAF (green circle), NFH (blue triangle), NFV (yellow square), NFnoBC (red cross), and RexBC (black cross) during the three periods. MAF is the maximum activation fraction, an asymptote of the measured size-resolved particle activation ratio (SPAR) curve at a large particle size. NFH is the number fraction of hydrophilic aerosol whose hygroscopicity parameter is higher than ∼ 0.07. NFV is the number fraction of volatile aerosol whose shrink factor at 200 °C is lower than 0.85. NFnoBC is the number fraction of black carbon (BC)-free particles. RexBC is the number fraction of externally mixed BC particles in the total BC-containing particles. (d–f) Corresponding mass fractions (MFs) of aerosol chemical components (identified by colors) during the three periods, including secondary organic aerosols (SOAs), biomass-burning organic aerosol (BBOA), fossil fuel organic aerosols (FFOAs), and inorganic ions including sulfate (SO4), nitrate (NO3), and ammonium (NH4).
As for the difference among the aerosol mixing-state parameters, NFV and NFnoBC agreed with each other with a < 0.1 difference, and both were higher than NFH by at least 0.1 in the moderately polluted period. Compared with NFnoBC, NFV was higher during the heavily polluted period when the nitrate mass fraction was the highest (∼ 30 %). The SOA mass fraction was the lowest (∼ 7 %) among all three periods, suggesting that some BC-containing particles in this period were also identified as volatile, consistent with the fact that the formation of semi-volatile nitrate in BC-containing particles increases their volatility. However, during the clean period, NFV was even lower than NFnoBC, suggesting that some BC-free particles were characterized as low-volatility, and non-negligible number fractions of BC-free particles dominated these less volatile aerosol components which were likely less volatile organic aerosols (not likely contributed by BC-containing particles with a BC smaller than the SP2 detection limit because this type of volatile BC-containing particle has an SF lower than 0.4 (= 80 nm/200 nm), which is substantially lower than the threshold SF of 0.85 for the NFV calculation). In addition, the MAF values generally agreed with NFH during the clean period. However, they were larger than NFH during the moderately and heavily polluted periods (by ∼ 0.2) when the POA/SOA mass fractions were higher (∼ 40 % vs. ∼ 35 %). POA generally has a lower hygroscopicity than SOA. The critical κ of hydrophilic mode aerosols was 0.07, suggesting that a higher number fraction of aerosols had κ below 0.07 (i.e., hydrophobic mode aerosols in this study) during the moderately polluted period. However, under supersaturated conditions, they demonstrate enhanced hygroscopicity by becoming CCN-active. NFH was consistently lower than NFV and NFnoBC (the average difference between NFH and NFnoBC was approximately 0.2). As mentioned above, NFH was also lower than MAF during moderately polluted periods, and there may be a significant number fraction of volatile BC-free particles with hygroscopicity lower than the critical κ value of 0.07; however, they were still CCN-active and therefore not fully hydrophobic.
The diurnal variations in MAF, NFH, NFV, and NFnoBC, along with the MFs of the aerosol chemical components during the three periods, are shown in Fig. 4. Except for a particle size of 50 nm, the diurnal variations in these four mixing-state parameters were generally similar for all measured sizes. The different diurnal variations at a particle size of 50 nm may be due to the different effects of emissions and aging processes on the different aerosol modes, as particles < 100 nm mainly reside in the Aitken mode, while particles > 100 nm mainly reside in the accumulation mode (Wang et al., 2022). For particles > 100 nm (Figs. 4 and S5), there was a maximum in the afternoon for MAF, NFH, NFV, and NFnoBC, indicating a peak during this time due to an increase in SA compositions, such as nitrate and SOA, and a decrease in POA and BC. Diurnal variations in the aerosol mixing-state parameters and chemical compositions were more pronounced during the moderately polluted period. During heavily polluted periods, the diurnal variation was least pronounced for NFV and most pronounced for NFH. In the clean-air period, there was another maximum at midnight for MAF and NFnoBC, which may be attributed to the diurnal variations in SA compositions, such as sulfate and SOA, and the decrease in BC and FFOAs. The average size dependence of the aerosol mixing-state parameters over different time ranges during a heavily polluted period is shown in Fig. S6. It can be seen that the differences among the four parameters were the least from 12:00 to 18:00, with the most SOA and the least POA. This is consistent with the results shown in Fig. 3, where the difference between the MAF and NFH decreased when the POA mass fractions were the smallest. RexBC tended to be lower during the daytime, and its diurnal variation was more significant for larger particle sizes. In general, the diurnal variations for RexBC were opposite to those of NFnoBC and agreed better with those of the primary aerosol MFs. This is because BC particles originate from primary emissions and are mainly mixed externally. After aging in the atmosphere, BC particles can be coated by SAs, resulting in more coated BC particles and fewer externally mixed BC particles. As SAs tend to form on larger particles, the diurnal variations in SA formation may significantly affect the RexBC of larger particle sizes.
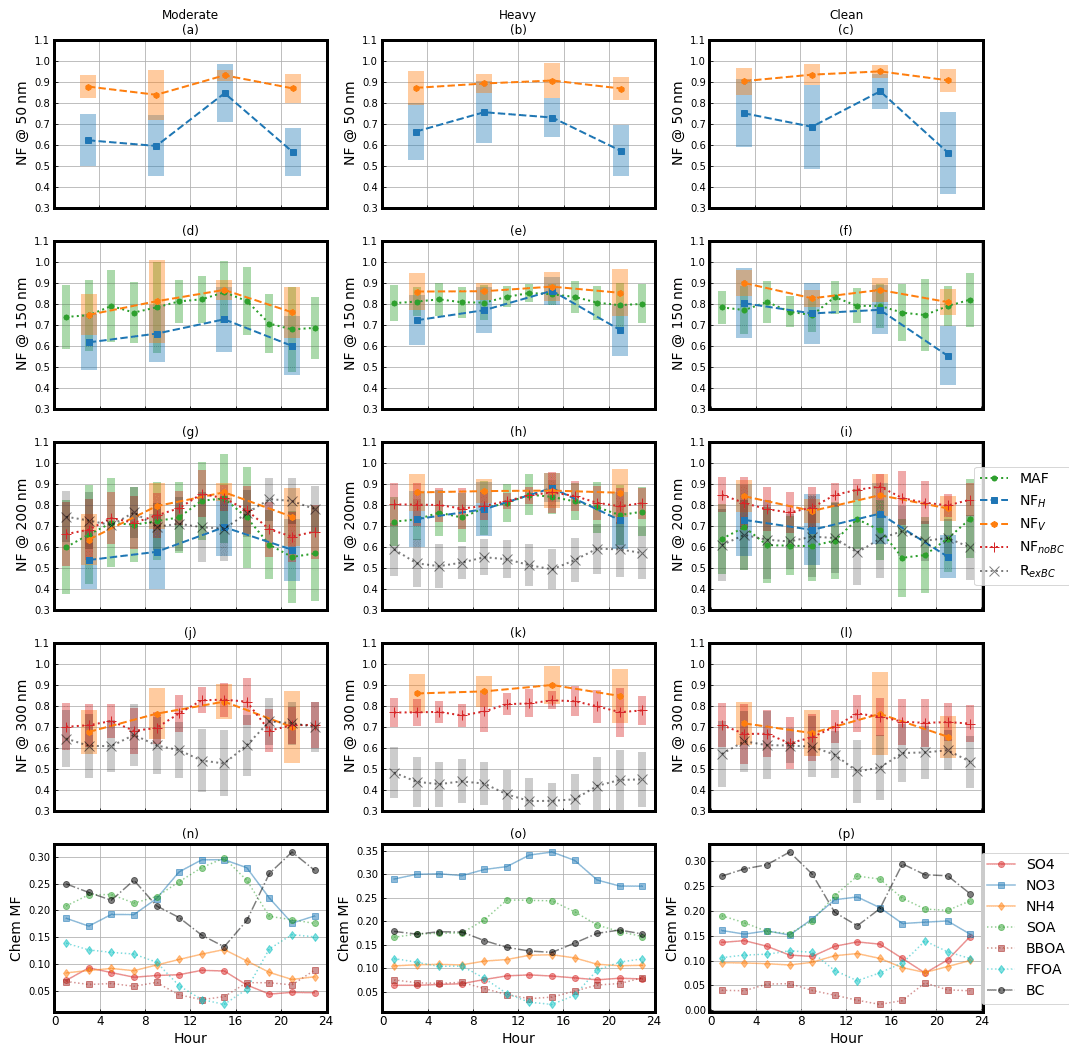
Figure 4(a–l) Diurnal variations in the aerosol mixing-state parameters (identified by color and marker) at different particle sizes (50, 150, 200, and 300 nm) during the three periods. The shaded areas indicate the standard deviations. (m–o) Diurnal variations in the mass fractions (MFs) of aerosol chemical components, including secondary organic aerosols (SOAs), biomass-burning organic aerosol (BBOA), fossil fuel organic aerosols (FFOAs), and inorganic ions including sulfate (SO4), nitrate (NO3), and ammonium (NH4) (identified by color and marker) during the three periods.
As summarized in Table S1 in the Supplement, the comparison among MAF, NFH, NFV, and NFnoBC was conducted based on their correlations with different particle sizes. Note that the MAF at SSs of 0.08 %, 0.14 %, and 0.22 % was used for comparison at 200, 150, and 100 nm particle sizes. This is because the diameter range of rapid increases in the SPAR curves is determined by aerosol hygroscopicity in this particle size range. The midpoints of the rapidly increasing diameter ranges of the SPAR curves at SSs of 0.08 %, 0.14 %, and 0.22 % were approximately 180, 120, and 90 nm, respectively (as shown in Fig. 2). In general, there were moderate correlations (r = ∼ 0.5) between MAF, NFH, and NFV, suggesting that a similar particle group contributed to the dominance of CCN-active, hygroscopic, and volatile aerosols (Zhang et al., 2016). The agreement between MAF and NFV was slightly higher than that between MAF and NFH or between NFH and NFV. In detail, compared to the other two, the agreement between MAF and NFV has a similar correlation coefficient (r ∼ 0.65) and a smaller systematic difference (slope and intercept were much closer to 1 and 0, respectively). This is consistent with the previous finding that a substantial number fraction of volatile but less hygroscopic aerosols is CCN-active. For smaller particle sizes, the correlation became weaker (r = ∼ 0.4), whereas the degree of reduction was the lowest for the correlation between MAF and NFV (r ∼ 0.529).
3.3 Impacts of primary aerosol emissions on aerosol mixing-state and parameter intercomparisons
Figure 5 presents the correlation between each aerosol mixing-state parameter at 200 nm and the MF of each primary organic aerosol composition during the three periods. The four mixing-state parameters (MAF, NFH, NFV, and NFnoBC) were negatively correlated with MFFFOA and MFBBOA. However, the anticorrelation with MFFFOA (−0.45 to −0.74) was much stronger than MFBBOA (−0.10 to −0.45). Biomass-burning emissions and fossil fuel emissions are the two major sources of BC in the NCP (Yang et al., 2022), and NFnoBC was negatively correlated with MFFFOA (r = −0.49) and weakly correlated (r = −0.18) with MFBBOA, suggesting that fossil fuel emissions were likely the dominant source of BC during this field campaign. The negative correlation between MAF and MFFFOA was weaker than that of NFnoBC with MFFFOA (−0.62 vs. −0.49). In particular, at the same MFFFOA, the MAF was lower than NFnoBC, demonstrating that some BC-free particles were CCN-inactive and were likely mainly composed of organic aerosols from fossil fuel combustion emissions. The negative correlation between NFV and MFFFOA was slightly weaker than between NFnoBC and MFFFOA (−0.56 vs. −0.49). At the same MFFFOA, NFnoBC was close to NFV, and considering that BC-containing particles were dominated by thinly coated BC most of the time (Fig. 5), this demonstrates that the non-volatile population identified by VTDMA was mainly contributed by BC-containing particles. NFH had the lowest negative correlation with MFFFOA (r = −0.74), demonstrating significant contributions from fossil fuel emissions to nearly hydrophobic aerosol populations. At the same MFFFOA, for example, when conditions of MFFFOA > 0.1 were met, NFH (< 0.7) demonstrated a noticeable decrease compared to NFnoBC (> 0.7), and NFH showed a negative correlation with both MFBBOA and MFFFOA, suggesting that a substantial portion of nearly hydrophobic particles originated from FFOA- or BBOA-dominant rather than BC-containing particles. Additionally, markedly different correlations were observed between MAF and MFFFOA (r = −0.62) and between MAF and MFBBOA (r = −0.2), implying that nearly hydrophobic but CCN-active aerosols likely originated from biomass burning. The correlations between the ratio of thinly coated BC in the total BC-containing particles (RexBC) and the MFs of BBOA and FFOA are shown in Fig. 6. Weak correlations (r < 0.3) between RexBC and MFBBOA and MFFFOA were observed. However, RexBC tended to increase with MFFFOA, suggesting that BC-containing particles emitted from fossil fuel combustion tended to be more externally mixed with other aerosol components than those emitted from biomass burning, which is consistent with the results of previous studies (Schwarz et al., 2008; Laborde et al., 2013; Liu et al., 2017; Y. Zhang et al., 2020). These results demonstrate remarkably different mixing states and the physicochemical properties of fossil fuel combustion and biomass-burning aerosols.
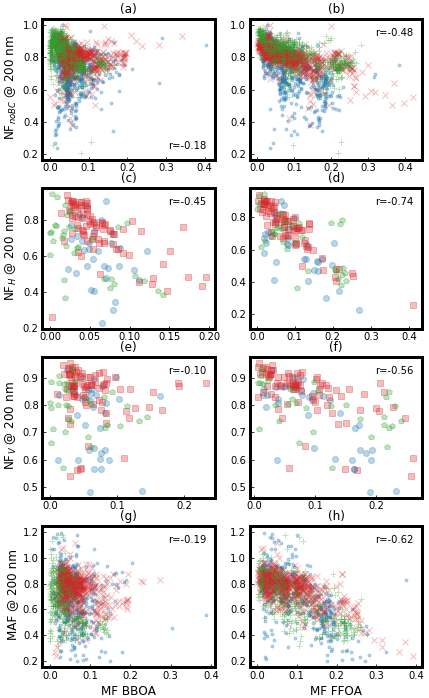
Figure 5The correlations between aerosol mixing-state parameters and mass fractions (MFs) of biomass-burning organic aerosol (BBOA) and fossil fuel organic aerosols (FFOAs) during different periods (moderately polluted period: – blue dot or circle; heavily polluted period – red cross or square; clean period – green plus or pentagon), with r representing the correlation coefficient.
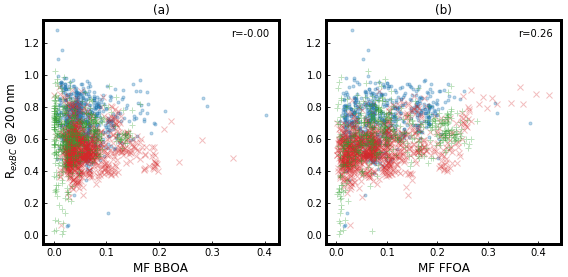
Figure 6The correlations between the ratio of externally mixed black carbon (BC) in total BC particles (RexBC) and mass fractions (MFs) of biomass-burning organic aerosol (BBOA) and fossil fuel organic aerosols (FFOAs) during different periods (moderately polluted period – blue dot; heavily polluted period – red cross; clean period – green plus), with r representing correlation coefficient.
The impact of primary emissions on the differences among the four aerosol mixing-state parameters at a particle size of 200 nm was analyzed and is shown in Fig. 7. The difference between NFnoBC and NFH (NFnoBC − NFH) was significantly positively correlated with MFFFOA and MFBBOA (r > 0.5), suggesting that a substantial proportion of POA resided in BC-free particles and was volatile but contributed substantially to nearly hydrophobic aerosols, as did the differences between NFV and NFH (NFV − NFH). The MFs of BBOA and FFOAs were poorly correlated with the differences between the MAF and NFV (MAF − NFV), MAF and NFnoBC (MAF − NFnoBC), and NFV and NFnoBC (NFV − NFnoBC) (Fig. S7). The difference between MAF and NFH was positively correlated with MFBBOA, further suggesting that BBOA contributed to nearly hydrophobic aerosols under subsaturated conditions; however, their hygroscopicity was enhanced, and they became CCN-active under supersaturated conditions. The enhanced hygroscopicity of BBOA under supersaturated conditions may be attributed to (1) the surface tension being lowered by surface-active organic solutes (Hodas et al., 2016; Ruehl et al., 2016), (2) liquid–liquid phase separation (Ovadnevaite et al., 2017; Liu et al., 2018), (3) the dissolution of sparingly soluble compounds at higher saturated conditions (Wex et al., 2009; Dusek et al., 2011), and (4) highly viscous organic aerosol which takes up water by surface water adsorption under sub-saturated conditions and by absorption of water under supersaturated conditions (Pajunoja et al., 2015). The correlations between the mixing-state parameters and primary aerosol composition during the campaign and different pollution periods are summarized in Fig. S7.
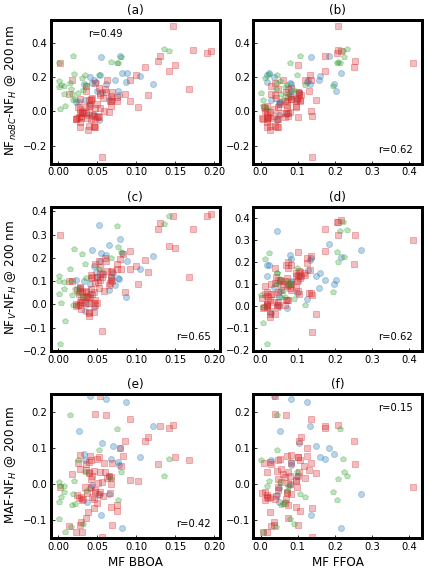
Figure 7The correlations between the differences among the four aerosol mixing-state parameters at particle size 200 nm and mass fractions (MFs) of biomass-burning organic aerosol (BBOA) and fossil fuel organic aerosols (FFOAs) during different periods (moderately polluted period – blue circle; heavily polluted period – red square; clean period – green pentagon), with r representing correlation coefficient.
In general, both field and laboratory studies have shown that primary organic aerosols from the combustion of biomass and fossil fuels are less hygroscopic. In the laboratory experiment, it is found that organic aerosols produced by fossil fuels have very low hygroscopicity, significantly less than 0.1 (Vu et al., 2015, 2017; Fofie et al., 2018; Zhang et al., 2018b; Mukherjee et al., 2021). Observations have also found that the organic aerosols associated with fossil fuel combustion have low hygroscopicity which may be due to the poorly water soluble substances in FFOAs (Qiu et al., 2019; Li et al., 2021). The aerosol composition produced by biomass burning is complex, with a large number of organic aerosols (BBOAs) and inorganic components being produced at the initial stage, making important contributions to CCN (Spracklen et al., 2011; Bougiatioti et al., 2016; Pöhlker et al., 2018). These primary organic aerosols (i.e., BBOA) are generally semi-volatile (May et al., 2013) and less hygroscopic (Engelhart et al., 2012; Hennigan et al., 2012); this has a negative contribution to the overall hygroscopicity (Bougiatioti et al., 2016; Kuang et al., 2020, 2021; Cai et al., 2022), resulting in weaker overall aerosol hygroscopicity in the initial stage of the biomass burning (Engelhart et al., 2012; Hennigan et al., 2012; Pöhlker et al., 2018). However, laboratory experiments found that BBOAs may contain organic substances with different hygroscopicity under different saturation ratios (Malek et al., 2022) and lead to the increased hygroscopicity and enhanced CCN activity of BBOAs under supersaturation conditions (Hersey et al., 2013). Our results generally agree with previous studies and provide evidence of the enhanced CCN activity of BBOA under supersaturation conditions in field campaigns. Furthermore, the different impacts of aerosols emitted from biomass burning and fossil fuel combustion on CCN are directly observed in this campaign using the newly developed advanced aerosol–cloud sampling system which show that biomass-burning aerosols are efficient CCN even under low supersaturations (< 0.05 %); however, aerosols from fossil fuel combustion can only activate at higher supersaturations (> 0.14 %). These results suggest simultaneous measurements of aerosol GF distributions, SPAR curves, and BC mixing states, and their comparisons could provide novel insights into different synergistic hygroscopic, volatile, and activation properties of aerosols from different sources in the atmosphere.
3.4 Impacts of SA formation on aerosol mixing-state and parameter intercomparisons
The correlations between the aerosol mixing-state parameters at 200 nm and the MF of each SA component are presented in Fig. 8 for three periods, and the entire campaign is presented. The analysis is conducted at only 200 nm, where all four aerosol mixing-state parameters were measured to compare the four aerosol mixing-state parameters and their relationships with aerosol chemical components simultaneously. Generally, MAF, NFH, NFV, and NFnoBC exhibited strong positive correlations with MF (r > 0.5). This is likely because ammonium was mainly formed through neutralizing sulfuric and nitric acids with ammonia; therefore, variations in ammonium better represent the overall secondary inorganic aerosol formation. As shown in Fig. 3, the secondary inorganic aerosol components dominated SA (the mass ratio between SIA and SA is approximately 70 %), indicating that SA formation was primarily composed of secondary inorganic aerosol formation, which explains the weaker correlation with SOA (r = ∼ 0.3), as shown in Fig. 8.
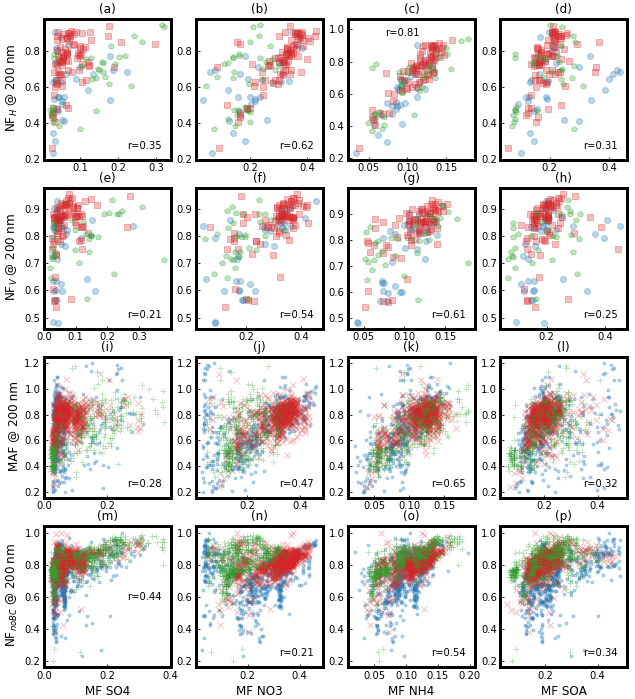
Figure 8The correlation between the four aerosol mixing-state parameters and the mass fraction (MF) of secondary aerosol (SA) components during different periods (moderately polluted period – blue dot or circle; heavily polluted period – red cross or square; clean period – green plus or pentagon), with r representing correlation coefficient. SA components include secondary organic aerosols (SOAs), sulfate (SO4), nitrate (NO3), and ammonium (NH4).
During the clean-air period when the MFs of SOA and sulfate were both above 15 %, all four parameters had a strong positive correlation with MF and MFSOA (r > 0.5), suggesting that when a clean background air mass with higher mass fractions of sulfate and SOA prevailed, the local primary emissions that contributed substantially to BC-containing and less hygroscopic POA aerosols became less significant. The positive correlations between the MAF and SA components have been extensively discussed by Tao et al. (2021), who found that SA formation enhances the hygroscopicity of nearly hydrophobic aerosols, thereby increasing CCN activity. This also explains the strong correlation between the NFH or MAF and ammonium formation. The strong positive correlations between NFV and SA formation (r = ∼ 0.6) are consistent with the fact that nitrate dominates SA formation during this campaign and is semi-volatile. For the first time, strong positive correlations between NFnoBC and SA formation were observed (r = 0.6). NFnoBC depends primarily on the relative variation between BC-containing and BC-free particles. The increase in NFnoBC at 200 nm as a function of the SA MF suggests that SAs migrated the higher mass fraction of BC-free particles with particle sizes smaller than 200 nm to particle sizes of 200 nm, suggesting that SAs tended to form more quickly on BC-free particles than on BC-containing particles with BC higher than SP2 detection limit. Recent studies reported that catalyst or photochemical reactions on BC particles can contribute the formation of secondary aerosols (F. Zhang et al., 2020, 2021). Our results may indicate that SA formation on BC particles might not be a significant pathway that contributes substantially to haze formation, and the underlying mechanisms need to be further resolved.
The effects of SA formation on the differences between the four aerosol mixing-state parameters were studied and are illustrated in Fig. 9. The two OOA factors (OOA1 and OOA2) were formed through different chemical pathways. The difference between NFnoBC and NFH (NFnoBC − NFH) showed a strong negative correlation with MF and MF (mainly −0.6), as did the differences between NFV and NFH (NFV − NFH). Ammonium nitrate is a pure-scattering, semi-volatile component with strong hygroscopicity, and the increase in its mass fraction can enhance both aerosol volatility and hygroscopicity, therefore resulting in a smaller difference among NFnoBC, NFH, and NFV.
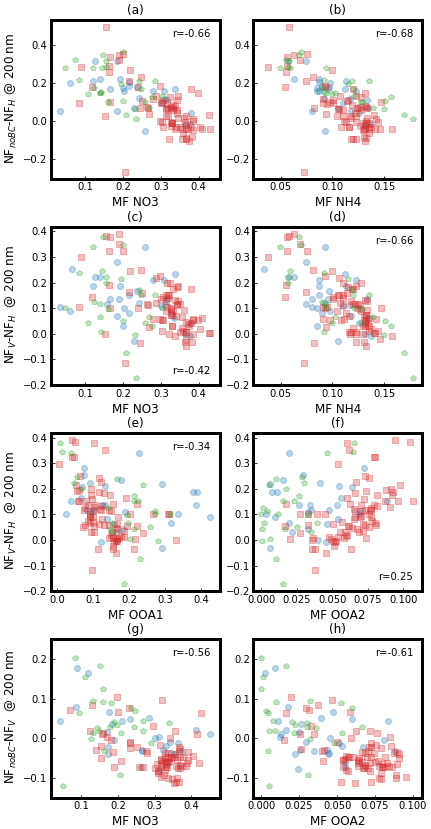
Figure 9The correlation between the differences among the four aerosol mixing-state parameters and the mass fraction (MF) of secondary aerosol (SA) chemical components during different periods. OOA1 and OOA2 are two secondary organic aerosol (SOA) factors resolved from aerosol mass spectrometer (AMS) measurements using the positive matrix factorization (PMF) technique. Moderately polluted period – blue circle; heavily polluted period – red square; clean period – green pentagon.
Furthermore, the difference between NFV and NFH showed a positive correlation with MFOOA2 and a negative correlation with MFOOA1, indicating the different volatility and hygroscopicity of the two SOA factors. The differences between NFV and NFH concerning the MF of OOA1 and OOA2 are shown in Fig. 9e and f, respectively. As previously noted, NFV was generally higher than NFH, and the difference between the two decreased with increasing MFOOA1, which was generally smaller than 0.3. This suggests that the formation of OOA1 enhances the hygroscopicity of volatile particles, which aligns with the highest oxidation state of OOA1 (higher O C but lower H C compared to OOA2) and has a significant and overall positive impact on aerosol hygroscopicity (Cerully et al., 2015; Thalman et al., 2017; Zhang et al., 2023). A positive correlation was observed between NFV and MFOOA2 (r = ∼ 0.25).
In contrast, the correlation between NFH and MFOOA2 was weak (R was close to 0), implying that OOA2 might be semi-volatile but only weakly hygroscopic, which could contribute to NFV being higher than NFH as OOA2 increases. The difference between NFnoBC and NFV (NFnoBC − NFV) was negatively correlated with MF, which is consistent with the semi-volatile nature of nitrate. The negative correlation between NFnoBC − NFV and MFOOA2 indicates that the difference is smaller when there is more OOA2, implying that OOA2 is also a semi-volatile compound and is likely formed mainly on BC-free particles (particles with BC mass lower than detection limit are not excluded). The correlations between the differences between NFV − MAF and NFnoBC − MAF and the MF of each SA composition were very weak. The impacts of SA formation on BC mixing states are shown in Fig. S8. In general, the NF of thinly coated BC has a negative correlation with SIA and a weak association with SOA, suggesting that SIA formation mainly enhances the thickness of the BC coating. The correlations between the mixing-state parameters and SA composition during the campaign and different pollution periods are summarized in Fig. S9. Our results on OOA agree with previous studies in which OOA is reported to be volatile (Kim et al., 2020; Cai et al., 2022) but can have a positive or negative impact on hygroscopicity, depending on its oxidation level (Kim et al., 2020; Kuang et al., 2021; Cai et al., 2022).
In addition to changes in the MFs of SA compositions, the accumulation of SA pollution may provide insights into the impact of SA formation on aerosol mixing states. As shown in Fig. 10a, during the heavily polluted periods, there were two distinct pollution accumulation processes from 23 to 27 October and from 28 to 31 October, respectively. During the pollution accumulation process, the mass concentration of SAs increased approximately 3-fold, indicating the rapid formation of secondary compositions and a significant increase in the NR-PM1 mass concentration. Figure 10b and c illustrate that this increase in SAs significantly enlarged the value of aerosol mixing-state parameters, including MAF, NFV, NFH, and NFnoBC, which increased from approximately 0.5 to 0.8 with evident diurnal variations. This highlights the impact of SA formation on the aerosol mixing states and the importance of studying the pollution accumulation processes of SAs. The enhancements in the different aerosol mixing-state parameters during the pollution accumulation process were not uniform. MAF and NFH initially exhibited lower values than NFV and NFnoBC; however, their later enhancement was stronger than that of NFnoBC. Figure 10d and e show the difference between NFnoBC and NFV at 200 and 300 nm as a function of SA mass concentrations during these two pollution periods, which clearly shows how, during SA formation, NFV became higher than NFnoBC while NFV remained close to the NF of thickly coated BC-containing particles (NFCBC) plus NFnoBC (NFCBC + NFCBC). These results suggest that SA formation increases the volatility of BC-free and BC-containing particles, leading to an increased NFV compared with NFnoBC. Almost all BC-free particles and some BC-containing particles become volatile during the accumulation of pollution.
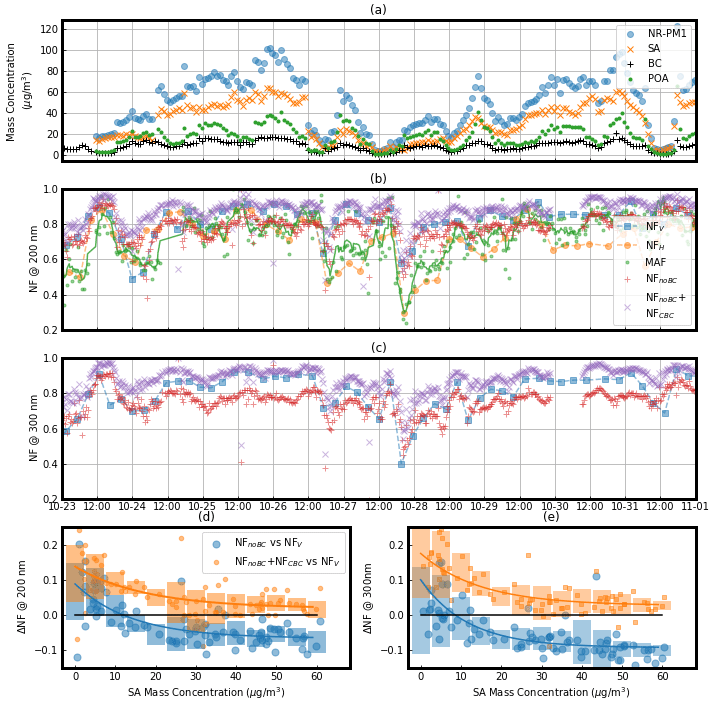
Figure 10Variations in different aerosol mixing-state parameters during the pollution accumulation process. (a) The time series of mass concentrations of non-refractory PM1 (NR-PM1), secondary aerosols (SAs) (including inorganic ions and secondary organic aerosols, SOA), primary organic aerosols (POAs), and black carbon (BC) (identified by colors and markers). (b, c) The variations in the different aerosol mixing-state parameters (identified by colors and markers) at particle sizes of 200 nm (b) and 300 nm (c). (d, e) The variations in the difference between NFV and NFnoBC (NFV − NFnoBC; blue large circle) and the difference between NFV and NFnoBC + NFCBC (NFV − (NFnoBC + NFCBC; yellow small circle) with the mass concentration of SA at particle sizes of 200 nm (d) and 300 nm (e) NFCBC is the Number fraction of thickly coated black carbon (BC) particles.
The aerosol mixing state is one of the most important physicochemical properties of aerosol particles and significantly affects their optical properties and the CCN activity of aerosol particles. The aerosol mixing states vary significantly with complex aerosol emissions and atmospheric transformations. In this study, aerosol mixing states derived from CCN activity, hygroscopicity, volatility, and BC particle observations, along with their relationship to primary aerosol emissions and SA formation, were systematically analyzed based on simultaneous measurements of CCNC, H(/V)TDMA, and SP2. Statistical analysis demonstrated that the NFs of CCN-active, hygroscopic, and volatile particles were generally positively correlated and mainly contributed by BC-free particles. Therefore, four mixing-state parameters were all negatively correlated to either the MFs of BBOA or FFOAs because fossil fuel combustion and biomass burning were the two major sources of BC-containing particles during this field campaign. However, the differences between these mixing-state parameters varied significantly under different conditions and have shed new insights into aerosol physical and chemical properties – and even secondary aerosol formation mechanisms.
Fossil fuel combustion and biomass-burning emissions represent two major primary sources of global aerosol burden and are dominant primary aerosol sources in this campaign. It is known that the chemical compositions of both these primary sources are dominated by organics and BC. However, the intercomparison results among instruments revealed significant differences in the physical and chemical properties of aerosols emitted from these two sources. The combination of HTDMA, DMA–SP2, and aerosol source apportionment confirmed that substantial portions of BC-free aerosols from both biomass burning and fossil fuel combustion are nearly hydrophobic under sub-saturated conditions. Additionally, BC from fossil fuel combustion tends to be more externally mixed with other aerosol compositions than those from biomass burning. However, additional insights from DMA–CCNC measurements revealed that substantial portions of BC-free aerosols, nearly hydrophobic from biomass burning, could serve as CCN, while a substantial portion of those from fossil fuel combustion could not. Previous studies have confirmed the hygroscopicity difference in the aerosols from biomass burning under sub- and supersaturated conditions in laboratory settings; however, such differences have rarely been confirmed in field measurements. Moreover, comparisons between sub- and supersaturated conditions for aerosols from fossil fuel combustion have rarely been undertaken, even in laboratory studies. This finding is quite important because the ability of primary organic aerosols from biomass burning and fossil fuel combustion is often treated the same way in models (P. Liu et al., 2021; Pöhlker et al., 2023).
Secondary aerosol formation substantially alters the aerosol mixing state. The different variations in mixing-state parameters can also help reveal mechanisms of secondary aerosol formation. For example, the two resolved SOA factors exhibited different impacts on the differences between NFV and NFH (NFV − NFH), and their correlations with NFV and NFH revealed that OOA1 was more hygroscopic but less volatile, suggesting distinct formation mechanisms for these two OOA factors. Further analysis might help link SOA formation mechanisms to aerosol physical properties, which is important for connecting aerosol chemistry to aerosol climate effects determined by aerosol physicochemical properties. Additionally, variations in size-resolved NFnoBC revealed that secondary organic and inorganic aerosol formations led to the migration of BC-free particles towards larger diameters more quickly than that of BC-containing particles. This phenomenon is more likely to occur when aqueous pathways dominate secondary aerosol formation because BC-containing particles generally exhibit weak hygroscopicity and do not favor aqueous processes.
The findings of this study highlight the markedly different effects of primary emissions and SA formation on aerosol mixing states and suggest that comparisons of aerosol mixing states obtained using various techniques are useful for gaining insights into the hygroscopicity, volatility, and CCN activity of different aerosols. The following recommendations are listed for future studies based on the findings of this study: (1) when exploring the impact of aerosol emissions and secondary aerosol formation on aerosol hygroscopicity under sub- and supersaturated conditions, we recommend employing simultaneous DMA–SP2 measurements to better represent BC characteristics. (2) Simultaneous DMA–CCNC, H(/V)TDMA, and DMA–SP2 measurements could enhance studies on secondary aerosol formation mechanisms. Conversely, if formation mechanisms and pathways are clear, then these measurements could elucidate how secondary aerosol formation impacts aerosol physical properties from different aspects. (3) Caution is advised in the application of aerosol mixing-state parameters from H(/V)TDMA when conducting aerosol optical property investigations because the suitability of the H(/V)TDMA-derived mixing-state parameters for representing BC mixing states is largely dependent on the composition and mass of the secondary aerosols, and DMA–SP2 measurements are recommended for this purpose.
| Abbreviation | Full name and/or definition |
| BBOA | Biomass-burning organic aerosol – characterized by obvious 60 (mainly C2H4O) and 73 (mainly C3H5O), which are two indicators of biomass burning |
| Da | Midpoint activation diameter – linked to the hygroscopicity of CCN |
| Dd | Particle diameter under dry conditions without humidification or heating |
| Dp | Particle diameter after humidification or heating |
| FFOA | Fossil fuel organic aerosol (FFOA) is comprised of traffic emissions and coal combustion and characterized by a typical hydrocarbon ion series with a relatively high f44 value |
| GF | Growth factor – the ratio between particles with and without humidification and linked to aerosol hygroscopicity |
| κ | Hygroscopicity parameter |
| MF | Mass fraction |
| MAF | Maximum activation fraction – an asymptote of the measured SPAR curve at large particle sizes and represents the number fraction of CCN to total particles |
| NFH | Number fraction of hydrophilic aerosol whose hygroscopicity parameter is > 0.07 at particle sizes of 50, 100, 150, and 200 nm |
| NFV | Number fraction of volatile aerosol whose shrinkage factor at 200 °C is < 0.85 at particle sizes of 50, 100, 150, and 200 nm |
| NFnoBC | Number fraction of black carbon (BC)-free particles at particle sizes of 200, 250, 300, and 370 nm |
| NFCBC | Number fraction of thickly coated BC particles at particle sizes of 200, 250, 300, and 370 nm |
| NFA − NFB (NFnoBC − NFH, NFV − NFH, NFnoBC − NFV, NFV − MAF, NFnoBC − MAF) | The difference between the number fraction of A and B at particle sizes of 200 nm |
| OOA1 and OOA2 | Two OOA factors resolved from the PMF analysis |
| Probability distribution function | |
| PM2.5 | Particulate matter with an aerodynamic diameter < 2.5 µm |
| PM1 | Particulate matter with an aerodynamic diameter < 1 µm |
| POA | Primary organic aerosol – summation of BBOA and FFOA |
| RexBC | The number concentration ratio of externally mixed BC particles in the total BC-containing particles – externally mixed BC particles are defined as bare/thinly coated BC-containing particles at particle sizes of 200, 250, 300, and 370 nm |
| SA | Secondary aerosol, including nitrate, sulfate, ammonium, and the two OOA factors |
| SF | Shrinkage factor – the ratio between particles with and without heating and is linked to aerosol volatility |
| SIA | Secondary inorganic aerosol, including nitrate, sulfate, and ammonium |
| SOA | Secondary organic aerosol, including the two OOA factors |
| SPAR | Size-resolved particle activation ratio – size-dependent CCN activity under a specific SS |
The data used in this study are available from the corresponding authors, Ye Kuang (kuangye@jnu.edu.cn) and Li Liu (liul@gd121.cn), upon request.
The supplement related to this article is available online at: https://doi.org/10.5194/acp-24-9131-2024-supplement.
YK and WaX planned this campaign, and YK designed the aerosol experiments and conceived this research, together with JT. JT wrote the paper and performed measurements of CCNC. BL performed measurements of SP2 and analyzed SP2 datasets with the help of GaZ. WeX and YS performed AMS measurements. LL performed H(/V)TDMA measurements and conducted post-data processing, as well as some data analysis. BX, HX, MZ, HZ, and SR participated in this campaign and helped with instrument maintenance. GaZ provided full support for the campaign. All authors contributed to the discussions and revisions of this paper.
The contact author has declared that none of the authors has any competing interests.
Publisher's note: Copernicus Publications remains neutral with regard to jurisdictional claims made in the text, published maps, institutional affiliations, or any other geographical representation in this paper. While Copernicus Publications makes every effort to include appropriate place names, the final responsibility lies with the authors.
We would like to express our deepest gratitude to Wusan Zhou, the cook of this site, for his unwavering support during the challenging times of this campaign. His culinary talents not only nourished us physically but also provided moments of joy and comfort, making the difficult days more bearable. His dedication and delicious meals were a source of strength for the entire team, for which we are truly thankful.
This research has been supported by the National Natural Science Foundation of China (grant nos. 42175083, 42175127, and 42275066), the Guangzhou Science and Information Technology Bureau Project (grant no. 2023A04J0941), the Guangdong Provincial Key Research and Development Program (grant no. 2020B1111360003), and the Science and Technology Innovation Team Plan of Guangdong Meteorological Bureau (grant no. GRMCTD202003).
This paper was edited by Urs Baltensperger and reviewed by two anonymous referees.
Adachi, K., Sedlacek, A. J., Kleinman, L., Chand, D., Hubbe, J. M., and Buseck, P. R.: Volume changes upon heating of aerosol particles from biomass burning using transmission electron microscopy, Aerosol Sci. Tech., 52, 46–56, https://doi.org/10.1080/02786826.2017.1373181, 2018.
Adachi, K., Sedlacek, A. J., Kleinman, L., Springston, S. R., Wang, J., Chand, D., Hubbe, J. M., Shilling, J. E., Onasch, T. B., Kinase, T., Sakata, K., Takahashi, Y., and Buseck, P. R.: Spherical tarball particles form through rapid chemical and physical changes of organic matter in biomass-burning smoke, P. Natl. Acad. Sci. USA, 116, 19336–19341, https://doi.org/10.1073/pnas.1900129116, 2019.
Bond, T. C., Doherty, S. J., Fahey, D. W., Forster, P. M., Berntsen, T., DeAngelo, B. J., Flanner, M. G., Ghan, S., Kaercher, B., Koch, D., Kinne, S., Kondo, Y., Quinn, P. K., Sarofim, M. C., Schultz, M. G., Schulz, M., Venkataraman, C., Zhang, H., Zhang, S., Bellouin, N., Guttikunda, S. K., Hopke, P. K., Jacobson, M. Z., Kaiser, J. W., Klimont, Z., Lohmann, U., Schwarz, J. P., Shindell, D., Storelvmo, T., Warren, S. G., and Zender, C. S.: Bounding the role of black carbon in the climate system: A scientific assessment, J. Geophys. Res.-Atmos., 118, 5380–5552, https://doi.org/10.1002/jgrd.50171, 2013.
Bougiatioti, A., Bezantakos, S., Stavroulas, I., Kalivitis, N., Kokkalis, P., Biskos, G., Mihalopoulos, N., Papayannis, A., and Nenes, A.: Biomass-burning impact on CCN number, hygroscopicity and cloud formation during summertime in the eastern Mediterranean, Atmos. Chem. Phys., 16, 7389–7409, https://doi.org/10.5194/acp-16-7389-2016, 2016.
Cai, M., Tan, H., Chan, C. K., Mochida, M., Hatakeyama, S., Kondo, Y., Schurman, M. I., Xu, H., Li, F., Shimada, K., Li, L., Deng, Y., Yai, H., Matsuki, A., Qin, Y., and Zhao, J.: Comparison of Aerosol Hygroscopcity, Volatility, and Chemical Composition between a Suburban Site in the Pearl River Delta Region and a Marine Site in Okinawa, Aerosol Air Qual. Res., 17, 3194–3208, https://doi.org/10.4209/aaqr.2017.01.0020, 2017.
Cai, M., Huang, S., Liang, B., Sun, Q., Liu, L., Yuan, B., Shao, M., Hu, W., Chen, W., Song, Q., Li, W., Peng, Y., Wang, Z., Chen, D., Tan, H., Xu, H., Li, F., Deng, X., Deng, T., Sun, J., and Zhao, J.: Measurement report: Distinct size dependence and diurnal variation in organic aerosol hygroscopicity, volatility, and cloud condensation nuclei activity at a rural site in the Pearl River Delta (PRD) region, China, Atmos. Chem. Phys., 22, 8117–8136, https://doi.org/10.5194/acp-22-8117-2022, 2022.
Canagaratna, M. R., Jimenez, J. L., Kroll, J. H., Chen, Q., Kessler, S. H., Massoli, P., Hildebrandt Ruiz, L., Fortner, E., Williams, L. R., Wilson, K. R., Surratt, J. D., Donahue, N. M., Jayne, J. T., and Worsnop, D. R.: Elemental ratio measurements of organic compounds using aerosol mass spectrometry: characterization, improved calibration, and implications, Atmos. Chem. Phys., 15, 253–272, https://doi.org/10.5194/acp-15-253-2015, 2015.
Cerully, K. M., Bougiatioti, A., Hite Jr., J. R., Guo, H., Xu, L., Ng, N. L., Weber, R., and Nenes, A.: On the link between hygroscopicity, volatility, and oxidation state of ambient and water-soluble aerosols in the southeastern United States, Atmos. Chem. Phys., 15, 8679–8694, https://doi.org/10.5194/acp-15-8679-2015, 2015.
Chen, C., Qiu, Y., Xu, W., He, Y., Li, Z., Sun, J., Ma, N., Xu, W., Pan, X., Fu, P., Wang, Z., and Sun, Y.: Primary Emissions and Secondary Aerosol Processing During Wintertime in Rural Area of North China Plain, J. Geophys. Res.-Atmos., 127, e2021JD035430, https://doi.org/10.1029/2021JD035430, 2022.
Chen, J., Budisulistiorini, S. H., Miyakawa, T., Komazaki, Y., and Kuwata, M.: Secondary aerosol formation promotes water uptake by organic-rich wildfire haze particles in equatorial Asia, Atmos. Chem. Phys., 18, 7781–7798, https://doi.org/10.5194/acp-18-7781-2018, 2018.
Cheng, Y. F., Su, H., Rose, D., Gunthe, S. S., Berghof, M., Wehner, B., Achtert, P., Nowak, A., Takegawa, N., Kondo, Y., Shiraiwa, M., Gong, Y. G., Shao, M., Hu, M., Zhu, T., Zhang, Y. H., Carmichael, G. R., Wiedensohler, A., Andreae, M. O., and Pöschl, U.: Size-resolved measurement of the mixing state of soot in the megacity Beijing, China: diurnal cycle, aging and parameterization, Atmos. Chem. Phys., 12, 4477–4491, https://doi.org/10.5194/acp-12-4477-2012, 2012.
Ching, J., Fast, J., West, M., and Riemer, N.: Metrics to quantify the importance of mixing state for CCN activity, Atmos. Chem. Phys., 17, 7445–7458, https://doi.org/10.5194/acp-17-7445-2017, 2017.
Ching, J., Adachi, K., Zaizen, Y., Igarashi, Y., and Kajino, M.: Aerosol mixing state revealed by transmission electron microscopy pertaining to cloud formation and human airway deposition, npj Climate and Atmospheric Science, 2, 22, https://doi.org/10.1038/s41612-019-0081-9, 2019.
Deng, Z. Z., Zhao, C. S., Ma, N., Liu, P. F., Ran, L., Xu, W. Y., Chen, J., Liang, Z., Liang, S., Huang, M. Y., Ma, X. C., Zhang, Q., Quan, J. N., Yan, P., Henning, S., Mildenberger, K., Sommerhage, E., Schäfer, M., Stratmann, F., and Wiedensohler, A.: Size-resolved and bulk activation properties of aerosols in the North China Plain, Atmos. Chem. Phys., 11, 3835–3846, https://doi.org/10.5194/acp-11-3835-2011, 2011.
Deng, Z. Z., Zhao, C. S., Ma, N., Ran, L., Zhou, G. Q., Lu, D. R., and Zhou, X. J.: An examination of parameterizations for the CCN number concentration based on in situ measurements of aerosol activation properties in the North China Plain, Atmos. Chem. Phys., 13, 6227–6237, https://doi.org/10.5194/acp-13-6227-2013, 2013.
Dusek, U., Frank, G. P., Massling, A., Zeromskiene, K., Iinuma, Y., Schmid, O., Helas, G., Hennig, T., Wiedensohler, A., and Andreae, M. O.: Water uptake by biomass burning aerosol at sub- and supersaturated conditions: closure studies and implications for the role of organics, Atmos. Chem. Phys., 11, 9519–9532, https://doi.org/10.5194/acp-11-9519-2011, 2011.
Drinovec, L., Močnik, G., Zotter, P., Prévôt, A. S. H., Ruckstuhl, C., Coz, E., Rupakheti, M., Sciare, J., Müller, T., Wiedensohler, A., and Hansen, A. D. A.: The ”dual-spot” Aethalometer: an improved measurement of aerosol black carbon with real-time loading compensation, Atmos. Meas. Tech., 8, 1965–1979, https://doi.org/10.5194/amt-8-1965-2015, 2015.
Engelhart, G. J., Hennigan, C. J., Miracolo, M. A., Robinson, A. L., and Pandis, S. N.: Cloud condensation nuclei activity of fresh primary and aged biomass burning aerosol, Atmos. Chem. Phys., 12, 7285–7293, https://doi.org/10.5194/acp-12-7285-2012, 2012.
Ervens, B.: Modeling the Processing of Aerosol and Trace Gases in Clouds and Fogs, Chem. Rev., 115, 4157–4198, https://doi.org/10.1021/cr5005887, 2015.
Farmer, D. K., Cappa, C. D., and Kreidenweis, S. M.: Atmospheric Processes and Their Controlling Influence on Cloud Condensation Nuclei Activity, Chem. Rev., 115, 4199–4217, https://doi.org/10.1021/cr5006292, 2015.
Fierce, L., Riemer, N., and Bond, T. C.: Toward Reduced Representation of Mixing State for Simulating Aerosol Effects on Climate, B. Am. Meteorol. Soc., 98, 971–980, https://doi.org/10.1175/BAMS-D-16-0028.1, 2017.
Fofie, E. A., Donahue, N. M., and Asa-Awuku, A.: Cloud condensation nuclei activity and droplet formation of primary and secondary organic aerosol mixtures, Aerosol Sci. Tech., 52, 242–251, https://doi.org/10.1080/02786826.2017.1392480, 2018.
Fu, Y., Peng, X., Sun, W., Hu, X., Wang, D., Yang, Y., Guo, Z., Wang, Y., Zhang, G., Zhu, J., Ou, J., Shi, Z., Wang, X., and Bi, X.: Impact of Cloud Process in the Mixing State and Microphysical Properties of Soot Particles: Implications in Light Absorption Enhancement, J. Geophys. Res.-Atmos., 127, e2022JD037169, https://doi.org/10.1029/2022JD037169, 2022.
Gysel, M., Laborde, M., Olfert, J. S., Subramanian, R., and Gröhn, A. J.: Effective density of Aquadag and fullerene soot black carbon reference materials used for SP2 calibration, Atmos. Meas. Tech., 4, 2851–2858, https://doi.org/10.5194/amt-4-2851-2011, 2011.
Hagen, D. E. and Alofs, D. J.: Linear Inversion Method to Obtain Aerosol Size Distributions from Measurements with a Differential Mobility Analyzer, Aerosol Sci. Tech., 2, 465–475, https://doi.org/10.1080/02786828308958650, 1983.
Hennigan, C. J., Westervelt, D. M., Riipinen, I., Engelhart, G. J., Lee, T., Collett Jr., J. L., Pandis, S. N., Adams, P. J., and Robinson, A. L.: New particle formation and growth in biomass burning plumes: An important source of cloud condensation nuclei, Geophys. Res. Lett., 39, L09805, https://doi.org/10.1029/2012GL050930, 2012.
Herich, H., Kammermann, L., Gysel, M., Weingartner, E., Baltensperger, U., Lohmann, U., and Cziczo, D. J.: In situ determination of atmospheric aerosol composition as a function of hygroscopic growth, J. Geophys. Res.-Atmos., 113, D16213, https://doi.org/10.1029/2008JD009954, 2008.
Herich, H., Kammermann, L., Friedman, B., Gross, D. S., Weingartner, E., Lohmann, U., Spichtinger, P., Gysel, M., Baltensperger, U., and Cziczo, D. J.: Subarctic atmospheric aerosol composition: 2. Hygroscopic growth properties, J. Geophys. Res.-Atmos., 114, D13204, https://doi.org/10.1029/2008JD011574, 2009.
Hersey, S. P., Craven, J. S., Metcalf, A. R., Lin, J., Lathem, T., Suski, K. J., Cahill, J. F., Duong, H. T., Sorooshian, A., Jonsson, H. H., Shiraiwa, M., Zuend, A., Nenes, A., Prather, K. A., Flagan, R. C., and Seinfeld, J. H.: Composition and hygroscopicity of the Los Angeles Aerosol: CalNex, J. Geophys. Res.-Atmos., 118, 3016–3036, https://doi.org/10.1002/jgrd.50307, 2013.
Hodas, N., Zuend, A., Schilling, K., Berkemeier, T., Shiraiwa, M., Flagan, R. C., and Seinfeld, J. H.: Discontinuities in hygroscopic growth below and above water saturation for laboratory surrogates of oligomers in organic atmospheric aerosols, Atmos. Chem. Phys., 16, 12767–12792, https://doi.org/10.5194/acp-16-12767-2016, 2016.
Hong, J., Äijälä, M., Häme, S. A. K., Hao, L., Duplissy, J., Heikkinen, L. M., Nie, W., Mikkilä, J., Kulmala, M., Prisle, N. L., Virtanen, A., Ehn, M., Paasonen, P., Worsnop, D. R., Riipinen, I., Petäjä, T., and Kerminen, V.-M.: Estimates of the organic aerosol volatility in a boreal forest using two independent methods, Atmos. Chem. Phys., 17, 4387–4399, https://doi.org/10.5194/acp-17-4387-2017, 2017.
Jayne, J. T., Leard, D. C., Zhang, X., Davidovits, P., Smith, K. A., Kolb, C. E., and Worsnop, D. R.: Development of an Aerosol Mass Spectrometer for Size and Composition Analysis of Submicron Particles, Aerosol Sci. Tech., 33, 49–70, https://doi.org/10.1080/027868200410840, 2000.
Jiang, X., Tao, J., Kuang, Y., Hong, J., and Ma, N.: Mathematical derivation and physical interpretation of particle size-resolved activation ratio based on particle hygroscopicity distribution: Application on global characterization of CCN activity, Atmos. Environ., 246, 118137, https://doi.org/10.1016/j.atmosenv.2020.118137, 2021.
Jurányi, Z., Tritscher, T., Gysel, M., Laborde, M., Gomes, L., Roberts, G., Baltensperger, U., and Weingartner, E.: Hygroscopic mixing state of urban aerosol derived from size-resolved cloud condensation nuclei measurements during the MEGAPOLI campaign in Paris, Atmos. Chem. Phys., 13, 6431–6446, https://doi.org/10.5194/acp-13-6431-2013, 2013.
Kawana, K., Nakayama, T., and Mochida, M.: Hygroscopicity and CCN activity of atmospheric aerosol particles and their relation to organics: Characteristics of urban aerosols in Nagoya, Japan, J. Geophys. Res.-Atmos., 121, 4100–4121, https://doi.org/10.1002/2015jd023213, 2016.
Kim, N., Yum, S. S., Park, M., Park, J. S., Shin, H. J., and Ahn, J. Y.: Hygroscopicity of urban aerosols and its link to size-resolved chemical composition during spring and summer in Seoul, Korea, Atmos. Chem. Phys., 20, 11245–11262, https://doi.org/10.5194/acp-20-11245-2020, 2020.
Kuang, Y., Zhao, C. S., Tao, J. C., and Ma, N.: Diurnal variations of aerosol optical properties in the North China Plain and their influences on the estimates of direct aerosol radiative effect, Atmos. Chem. Phys., 15, 5761–5772, https://doi.org/10.5194/acp-15-5761-2015, 2015.
Kuang, Y., He, Y., Xu, W., Yuan, B., Zhang, G., Ma, Z., Wu, C., Wang, C., Wang, S., Zhang, S., Tao, J., Ma, N., Su, H., Cheng, Y., Shao, M., and Sun, Y.: Photochemical Aqueous-Phase Reactions Induce Rapid Daytime Formation of Oxygenated Organic Aerosol on the North China Plain, Environ. Sci. Technol., 54, 3849–3860, https://doi.org/10.1021/acs.est.9b06836, 2020.
Kuang, Y., Huang, S., Xue, B., Luo, B., Song, Q., Chen, W., Hu, W., Li, W., Zhao, P., Cai, M., Peng, Y., Qi, J., Li, T., Wang, S., Chen, D., Yue, D., Yuan, B., and Shao, M.: Contrasting effects of secondary organic aerosol formations on organic aerosol hygroscopicity, Atmos. Chem. Phys., 21, 10375–10391, https://doi.org/10.5194/acp-21-10375-2021, 2021.
Kuwata, M. and Kondo, Y.: Dependence of size-resolved CCN spectra on the mixing state of nonvolatile cores observed in Tokyo, J. Geophys. Res.-Atmos., 113, D19202, https://doi.org/10.1029/2007JD009761, 2008.
Kuwata, M., Kondo, Y., Mochida, M., Takegawa, N., and Kawamura, K.: Dependence of CCN activity of less volatile particles on the amount of coating observed in Tokyo, J. Geophys. Res.-Atmos., 112, D11207, https://doi.org/10.1029/2006JD007758, 2007.
Laborde, M., Crippa, M., Tritscher, T., Jurányi, Z., Decarlo, P. F., Temime-Roussel, B., Marchand, N., Eckhardt, S., Stohl, A., Baltensperger, U., Prévôt, A. S. H., Weingartner, E., and Gysel, M.: Black carbon physical properties and mixing state in the European megacity Paris, Atmos. Chem. Phys., 13, 5831–5856, https://doi.org/10.5194/acp-13-5831-2013, 2013.
Lack, D. A., Langridge, J. M., Bahreini, R., Cappa, C. D., Middlebrook, A. M., and Schwarz, J. P.: Brown carbon and internal mixing in biomass burning particles, P. Natl. Acad. Sci. USA, 109, 14802–14807, https://doi.org/10.1073/pnas.1206575109, 2012.
Lance, S., Nenes, A., Medina, J., and Smith, J. N.: Mapping the operation of the DMT continuous flow CCN counter, Aerosol Sci. Tech. 40, 242–254, 2006.
Lance, S., Raatikainen, T., Onasch, T. B., Worsnop, D. R., Yu, X.-Y., Alexander, M. L., Stolzenburg, M. R., McMurry, P. H., Smith, J. N., and Nenes, A.: Aerosol mixing state, hygroscopic growth and cloud activation efficiency during MIRAGE 2006, Atmos. Chem. Phys., 13, 5049–5062, https://doi.org/10.5194/acp-13-5049-2013, 2013.
Lata, N. N., Zhang, B., Schum, S., Mazzoleni, L., Brimberry, R., Marcus, M. A., Cantrell, W. H., Fialho, P., Mazzoleni, C., and China, S.: Aerosol Composition, Mixing State, and Phase State of Free Tropospheric Particles and Their Role in Ice Cloud Formation, ACS Earth Space Chem., 5, 3499–3510, https://doi.org/10.1021/acsearthspacechem.1c00315, 2021.
Lee, A. K. Y., Rivellini, L.-H., Chen, C.-L., Liu, J., Price, D. J., Betha, R., Russell, L. M., Zhang, X., and Cappa, C. D.: Influences of Primary Emission and Secondary Coating Formation on the Particle Diversity and Mixing State of Black Carbon Particles, Environ. Sci. Technol., 53, 9429–9438, https://doi.org/10.1021/acs.est.9b03064, 2019.
Li, G., Su, H., Ma, N., Tao, J., Kuang, Y., Wang, Q., Hong, J., Zhang, Y., Kuhn, U., and Zhang, S.: Multiphase chemistry experiment in Fogs and Aerosols in the North China Plain (McFAN): integrated analysis and intensive winter campaign 2018, Faraday Discuss., 226, 207–222, 2021.
Liu, D., Whitehead, J., Alfarra, M. R., Reyes-Villegas, E., Spracklen, D. V., Reddington, C. L., Kong, S., Williams, P. I., Ting, Y.-C., Haslett, S., Taylor, J. W., Flynn, M. J., Morgan, W. T., McFiggans, G., Coe, H., and Allan, J. D.: Black-carbon absorption enhancement in the atmosphere determined by particle mixing state, Nat. Geosci., 10, 184–188, 2017.
Liu, D., Joshi, R., Wang, J., Yu, C., Allan, J. D., Coe, H., Flynn, M. J., Xie, C., Lee, J., Squires, F., Kotthaus, S., Grimmond, S., Ge, X., Sun, Y., and Fu, P.: Contrasting physical properties of black carbon in urban Beijing between winter and summer, Atmos. Chem. Phys., 19, 6749–6769, https://doi.org/10.5194/acp-19-6749-2019, 2019.
Liu, D., Li, S., Hu, D., Kong, S., Cheng, Y., Wu, Y., Ding, S., Hu, K., Zheng, S., Yan, Q., Zheng, H., Zhao, D., Tian, P., Ye, J., Huang, M., and Ding, D.: Evolution of Aerosol Optical Properties from Wood Smoke in Real Atmosphere Influenced by Burning Phase and Solar Radiation, Environ. Sci. Technol., 55, 5677–5688, https://doi.org/10.1021/acs.est.0c07569, 2021.
Liu, P., Song, M., Zhao, T., Gunthe, S. S., Ham, S., He, Y., Qin, Y. M., Gong, Z., Amorim, J. C., Bertram, A. K., and Martin, S. T.: Resolving the mechanisms of hygroscopic growth and cloud condensation nuclei activity for organic particulate matter, Nat. Commun., 9, 4076, https://doi.org/10.1038/s41467-018-06622-2, 2018.
Liu, P., Kaplan, J. O., Mickley, L. J., Li, Y., Chellman, N. J., Arienzo, M. M., Kodros, J. K., Pierce, J. R., Sigl, M., Freitag, J., Mulvaney, R., Curran, M. A. J., and McConnell, J. R.: Improved estimates of preindustrial biomass burning reduce the magnitude of aerosol climate forcing in the Southern Hemisphere, Science Advances, 7, eabc1379, https://doi.org/10.1126/sciadv.abc1379, 2021.
Liu, K., Zhang, C., Cheng, Y., Liu, C., Zhang, H., Zhang, G., Sun, X., and Mu, Y.: Serious BTEX pollution in rural area of the North China Plain during winter season, J. Environ. Sci., 30, 186–190, https://doi.org/10.1016/j.jes.2014.05.056, 2015.
Liu, P. F., Zhao, C. S., Göbel, T., Hallbauer, E., Nowak, A., Ran, L., Xu, W. Y., Deng, Z. Z., Ma, N., Mildenberger, K., Henning, S., Stratmann, F., and Wiedensohler, A.: Hygroscopic properties of aerosol particles at high relative humidity and their diurnal variations in the North China Plain, Atmos. Chem. Phys., 11, 3479–3494, https://doi.org/10.5194/acp-11-3479-2011, 2011.
Luo, B., Kuang, Y., Huang, S., Song, Q., Hu, W., Li, W., Peng, Y., Chen, D., Yue, D., Yuan, B., and Shao, M.: Parameterizations of size distribution and refractive index of biomass burning organic aerosol with black carbon content, Atmos. Chem. Phys., 22, 12401–12415, https://doi.org/10.5194/acp-22-12401-2022, 2022.
Ma, N., Zhao, C. S., Müller, T., Cheng, Y. F., Liu, P. F., Deng, Z. Z., Xu, W. Y., Ran, L., Nekat, B., van Pinxteren, D., Gnauk, T., Müller, K., Herrmann, H., Yan, P., Zhou, X. J., and Wiedensohler, A.: A new method to determine the mixing state of light absorbing carbonaceous using the measured aerosol optical properties and number size distributions, Atmos. Chem. Phys., 12, 2381–2397, https://doi.org/10.5194/acp-12-2381-2012, 2012.
Ma, N., Zhao, C., Tao, J., Wu, Z., Kecorius, S., Wang, Z., Größ, J., Liu, H., Bian, Y., Kuang, Y., Teich, M., Spindler, G., Müller, K., van Pinxteren, D., Herrmann, H., Hu, M., and Wiedensohler, A.: Variation of CCN activity during new particle formation events in the North China Plain, Atmos. Chem. Phys., 16, 8593–8607, https://doi.org/10.5194/acp-16-8593-2016, 2016.
Malek, K. A., Gohil, K., Al-Abadleh, H. A., and Asa-Awuku, A. A.: Hygroscopicity of polycatechol and polyguaiacol secondary organic aerosol in sub- and supersaturated water vapor environments, Environmental Science: Atmospheres, 2, 24–33, https://doi.org/10.1039/d1ea00063b, 2022.
Matsui, H., Hamilton, D. S., and Mahowald, N. M.: Black carbon radiative effects highly sensitive to emitted particle size when resolving mixing-state diversity, Nat. Commun., 9, 3446, https://doi.org/10.1038/s41467-018-05635-1, 2018.
May, A. A., Levin, E. J. T., Hennigan, C. J., Riipinen, I., Lee, T., Collett Jr., J. L., Jimenez, J. L., Kreidenweis, S. M., and Robinson, A. L.: Gas-particle partitioning of primary organic aerosol emissions: 3. Biomass burning, J. Geophys. Res.-Atmos., 118, 11327–11338, https://doi.org/10.1002/jgrd.50828, 2013.
Mei, F., Hayes, P. L., Ortega, A., Taylor, J. W., Allan, J. D., Gilman, J., Kuster, W., de Gouw, J., Jimenez, J. L., and Wang, J.: Droplet activation properties of organic aerosols observed at an urban site during CalNex-LA, J. Geophys. Res.-Atmos., 118, 2903–2917, https://doi.org/10.1002/jgrd.50285, 2013.
Metcalf, A. R., Craven, J. S., Ensberg, J. J., Brioude, J., Angevine, W., Sorooshian, A., Duong, H. T., Jonsson, H. H., Flagan, R. C., and Seinfeld, J. H.: Black carbon aerosol over the Los Angeles Basin during CalNex, J. Geophys. Res.-Atmos., 117, D00V13, https://doi.org/10.1029/2011JD017255, 2012.
Middlebrook, A. M., Bahreini, R., Jimenez, J. L., and Canagaratna, M. R.: Evaluation of Composition-Dependent Collection Efficiencies for the Aerodyne Aerosol Mass Spectrometer using Field Data, Aerosol Sci. Tech., 46, 258–271, https://doi.org/10.1080/02786826.2011.620041, 2012.
Moffet, R. C., O'Brien, R. E., Alpert, P. A., Kelly, S. T., Pham, D. Q., Gilles, M. K., Knopf, D. A., and Laskin, A.: Morphology and mixing of black carbon particles collected in central California during the CARES field study, Atmos. Chem. Phys., 16, 14515–14525, https://doi.org/10.5194/acp-16-14515-2016, 2016.
Mohr, C., Huffman, J. A., Cubison, M. J., Aiken, A. C., Docherty, K. S., Kimmel, J. R., Ulbrich, I. M., Hannigan, M., and Jimenez, J. L.: Characterization of Primary Organic Aerosol Emissions from Meat Cooking, Trash Burning, and Motor Vehicles with High-Resolution Aerosol Mass Spectrometry and Comparison with Ambient and Chamber Observations, Environ. Sci. Technol., 43, 2443–2449, https://doi.org/10.1021/es8011518, 2009.
Moteki, N. and Kondo, Y.: Effects of Mixing State on Black Carbon Measurements by Laser-Induced Incandescence, Aerosol Sci. Tech., 41, 398–417, https://doi.org/10.1080/02786820701199728, 2007.
Mukherjee, S., Anil Kumar, V., Patil, R. D., Meena, G. S., Buchunde, P., Waghmare, V., Deshmukh, S., Dhavale, V., Ray, A., Panicker, A. S., Sonbawne, S. M., Safai, P. D., and Pandithurai, G.: Investigation of physico-chemical characteristics and associated CCN activation for different combustion sources through Chamber experiment approach, Atmos. Environ., 266, 118726, https://doi.org/10.1016/j.atmosenv.2021.118726, 2021.
Nordmann, S., Cheng, Y. F., Carmichael, G. R., Yu, M., Denier van der Gon, H. A. C., Zhang, Q., Saide, P. E., Pöschl, U., Su, H., Birmili, W., and Wiedensohler, A.: Atmospheric black carbon and warming effects influenced by the source and absorption enhancement in central Europe, Atmos. Chem. Phys., 14, 12683–12699, https://doi.org/10.5194/acp-14-12683-2014, 2014.
Ovadnevaite, J., Zuend, A., Laaksonen, A., Sanchez, K. J., Roberts, G., Ceburnis, D., Decesari, S., Rinaldi, M., Hodas, N., Facchini, M. C., Seinfeld, J. H., and O'Dowd, C.: Surface tension prevails over solute effect in organic-influenced cloud droplet activation, Nature, 546, 637–641, https://doi.org/10.1038/nature22806, 2017.
Paatero, P. and Tapper, U.: Positive matrix factorization: A non-negative factor model with optimal utilization of error estimates of data values, Environmetrics, 5, 111–126, https://doi.org/10.1002/env.3170050203, 1994.
Pajunoja, A., Lambe, A. T., Hakala, J., Rastak, N., Cummings, M. J., Brogan, J. F., Hao, L., Paramonov, M., Hong, J., Prisle, N. L., Malila, J., Romakkaniemi, S., Lehtinen, K. E. J., Laaksonen, A., Kulmala, M., Massoli, P., Onasch, T. B., Donahue, N. M., Riipinen, I., Davidovits, P., Worsnop, D. R., Petäjä, T., and Virtanen, A.:, 2015. Adsorptive uptake of water by semisolid secondary organic aerosols, Geophys. Res. Lett., 42, 3063–3068, https://doi.org/10.1002/2015GL063142, 2015.
Peng, J., Hu, M., Guo, S., Du, Z., Zheng, J., Shang, D., Levy Zamora, M., Zeng, L., Shao, M., Wu, Y.-S., Zheng, J., Wang, Y., Glen, C. R., Collins, D. R., Molina, M. J., and Zhang, R.: Markedly enhanced absorption and direct radiative forcing of black carbon under polluted urban environments, P. Natl. Acad. Sci. USA, 113, 4266–4271, https://doi.org/10.1073/pnas.1602310113, 2016.
Pöhlker, M. L., Ditas, F., Saturno, J., Klimach, T., Hrabě de Angelis, I., Araùjo, A. C., Brito, J., Carbone, S., Cheng, Y., Chi, X., Ditz, R., Gunthe, S. S., Holanda, B. A., Kandler, K., Kesselmeier, J., Könemann, T., Krüger, O. O., Lavrič, J. V., Martin, S. T., Mikhailov, E., Moran-Zuloaga, D., Rizzo, L. V., Rose, D., Su, H., Thalman, R., Walter, D., Wang, J., Wolff, S., Barbosa, H. M. J., Artaxo, P., Andreae, M. O., Pöschl, U., and Pöhlker, C.: Long-term observations of cloud condensation nuclei over the Amazon rain forest – Part 2: Variability and characteristics of biomass burning, long-range transport, and pristine rain forest aerosols, Atmos. Chem. Phys., 18, 10289–10331, https://doi.org/10.5194/acp-18-10289-2018, 2018.
Pöhlker, M. L., Pöhlker, C., Quaas, J., Mülmenstädt, J., Pozzer, A., Andreae, M. O., Artaxo, P., Block, K., Coe, H., Ervens, B., Gallimore, P., Gaston, C. J., Gunthe, S. S., Henning, S., Herrmann, H., Krüger, O. O., McFiggans, G., Poulain, L., Raj, S. S., Reyes-Villegas, E., Royer, H. M., Walter, D., Wang, Y., and Pöschl, U.: Global organic and inorganic aerosol hygroscopicity and its effect on radiative forcing, Nat. Commun., 14, 6139, https://doi.org/10.1038/s41467-023-41695-8, 2023.
Philippin, S., Wiedensohler, A., and Stratmann, F.: Measurements of non-volatile fractions of pollution aerosols with an eight-tube volatility tandem differential mobility analyzer (VTDMA-8), J. Aerosol Sci., 35, 185–203, https://doi.org/10.1016/j.jaerosci.2003.07.004, 2004.
Qiu, Y., Xie, Q., Wang, J., Xu, W., Li, L., Wang, Q., Zhao, J., Chen, Y., Chen, Y., Wu, Y., Du, W., Zhou, W., Lee, J., Zhao, C., Ge, X., Fu, P., Wang, Z., Worsnop, D. R., and Sun, Y.: Vertical Characterization and Source Apportionment of Water-Soluble Organic Aerosol with High-resolution Aerosol Mass Spectrometry in Beijing, China, ACS Earth Space Chem., 3, 273–284, https://doi.org/10.1021/acsearthspacechem.8b00155, 2019.
Ren, J., Zhang, F., Wang, Y., Collins, D., Fan, X., Jin, X., Xu, W., Sun, Y., Cribb, M., and Li, Z.: Using different assumptions of aerosol mixing state and chemical composition to predict CCN concentrations based on field measurements in urban Beijing, Atmos. Chem. Phys., 18, 6907–6921, https://doi.org/10.5194/acp-18-6907-2018, 2018.
Riemer, N., Ault, A. P., West, M., Craig, R. L., and Curtis, J. H.: Aerosol Mixing State: Measurements, Modeling, and Impacts, Rev. Geophys., 57, 187–249, https://doi.org/10.1029/2018RG000615, 2019.
Roberts, G. C. and Nenes, A.: A continuous-flow streamwise thermal-gradient CCN chamber for atmospheric measurements, Aerosol Sci. Tech., 39, 206–221, 2005.
Rose, D., Gunthe, S. S., Mikhailov, E., Frank, G. P., Dusek, U., Andreae, M. O., and Pöschl, U.: Calibration and measurement uncertainties of a continuous-flow cloud condensation nuclei counter (DMT-CCNC): CCN activation of ammonium sulfate and sodium chloride aerosol particles in theory and experiment, Atmos. Chem. Phys., 8, 1153–1179, https://doi.org/10.5194/acp-8-1153-2008, 2008.
Rose, D., Nowak, A., Achtert, P., Wiedensohler, A., Hu, M., Shao, M., Zhang, Y., Andreae, M. O., and Pöschl, U.: Cloud condensation nuclei in polluted air and biomass burning smoke near the mega-city Guangzhou, China – Part 1: Size-resolved measurements and implications for the modeling of aerosol particle hygroscopicity and CCN activity, Atmos. Chem. Phys., 10, 3365–3383, https://doi.org/10.5194/acp-10-3365-2010, 2010.
Rose, D., Gunthe, S. S., Su, H., Garland, R. M., Yang, H., Berghof, M., Cheng, Y. F., Wehner, B., Achtert, P., Nowak, A., Wiedensohler, A., Takegawa, N., Kondo, Y., Hu, M., Zhang, Y., Andreae, M. O., and Pöschl, U.: Cloud condensation nuclei in polluted air and biomass burning smoke near the mega-city Guangzhou, China – Part 2: Size-resolved aerosol chemical composition, diurnal cycles, and externally mixed weakly CCN-active soot particles, Atmos. Chem. Phys., 11, 2817–2836, https://doi.org/10.5194/acp-11-2817-2011, 2011.
Ruehl, C. R., Davies, J. F., and Wilson, K. R.: An interfacial mechanism for cloud droplet formation on organic aerosols, Science, 351, 1447–1450, 2016.
Saha, P. K., Khlystov, A., and Grieshop, A. P.: Downwind evolution of the volatility and mixing state of near-road aerosols near a US interstate highway, Atmos. Chem. Phys., 18, 2139–2154, https://doi.org/10.5194/acp-18-2139-2018, 2018.
Schwarz, J. P., Gao, R. S., Fahey, D. W., Thomson, D. S., Watts, L. A., Wilson, J. C., Reeves, J. M., Darbeheshti, M., Baumgardner, D. G., Kok, G. L., Chung, S. H., Schulz, M., Hendricks, J., Lauer, A., Kärcher, B., Slowik, J. G., Rosenlof, K. H., Thompson, T. L., Langford, A. O., Loewenstein, M., and Aikin, K. C.: Single-particle measurements of midlatitude black carbon and light-scattering aerosols from the boundary layer to the lower stratosphere, J. Geophys. Res.-Atmos., 111, D16207, https://doi.org/10.1029/2006JD007076, 2006.
Schwarz, J. P., Gao, R. S., Spackman, J. R., Watts, L. A., Thomson, D. S., Fahey, D. W., Ryerson, T. B., Peischl, J., Holloway, J. S., Trainer, M., Frost, G. J., Baynard, T., Lack, D. A., de Gouw, J. A., Warneke, C., and Del Negro, L. A.: Measurement of the mixing state, mass, and optical size of individual black carbon particles in urban and biomass burning emissions, Geophys. Res. Lett., 35, L13810, https://doi.org/10.1029/2008GL033968, 2008.
Sedlacek III, A. J., Lewis, E. R., Kleinman, L., Xu, J., and Zhang, Q.: Determination of and evidence for non-core-shell structure of particles containing black carbon using the Single-Particle Soot Photometer (SP2), Geophys. Res. Lett., 39, L06802, https://doi.org/10.1029/2012GL050905, 2012.
Shi, J., Hong, J., Ma, N., Luo, Q., He, Y., Xu, H., Tan, H., Wang, Q., Tao, J., Zhou, Y., Han, S., Peng, L., Xie, L., Zhou, G., Xu, W., Sun, Y., Cheng, Y., and Su, H.: Measurement report: On the difference in aerosol hygroscopicity between high and low relative humidity conditions in the North China Plain, Atmos. Chem. Phys., 22, 4599–4613, https://doi.org/10.5194/acp-22-4599-2022, 2022.
Spracklen, D. V., Carslaw, K. S., Pöschl, U., Rap, A., and Forster, P. M.: Global cloud condensation nuclei influenced by carbonaceous combustion aerosol, Atmos. Chem. Phys., 11, 9067–9087, https://doi.org/10.5194/acp-11-9067-2011, 2011.
Stevens, R., Ryjkov, A., Majdzadeh, M., and Dastoor, A.: An improved representation of aerosol mixing state for air quality–weather interactions, Atmos. Chem. Phys., 22, 13527–13549, https://doi.org/10.5194/acp-22-13527-2022, 2022.
Stolzenburg, M. R. and McMurry, P. H.: Equations governing single and tandem DMA configurations and a new lognormal approximation to the transfer function, Aerosol Sci. Tech., 42, 421–432, 2008.
Su, H., Rose, D., Cheng, Y. F., Gunthe, S. S., Massling, A., Stock, M., Wiedensohler, A., Andreae, M. O., and Pöschl, U.: Hygroscopicity distribution concept for measurement data analysis and modeling of aerosol particle mixing state with regard to hygroscopic growth and CCN activation, Atmos. Chem. Phys., 10, 7489–7503, https://doi.org/10.5194/acp-10-7489-2010, 2010.
Subramanian, R., Kok, G. L., Baumgardner, D., Clarke, A., Shinozuka, Y., Campos, T. L., Heizer, C. G., Stephens, B. B., de Foy, B., Voss, P. B., and Zaveri, R. A.: Black carbon over Mexico: the effect of atmospheric transport on mixing state, mass absorption cross-section, and BC CO ratios, Atmos. Chem. Phys., 10, 219–237, https://doi.org/10.5194/acp-10-219-2010, 2010.
Tan, H., Xu, H., Wan, Q., Li, F., Deng, X., Chan, P. W., Xia, D., and Yin, Y.: Design and Application of an Unattended Multifunctional H-TDMA System, J. Atmos. Ocean. Tech., 30, 1136–1148, https://doi.org/10.1175/JTECH-D-12-00129.1, 2013.
Tao, J., Zhao, C., Nan, M., and Ye, K.: Consistency and applicability of parameterization schemes for the size-resolved aerosol activation ratio based on field measurements in the North China Plain, Atmos. Environ., 173, 316–324, 2018.
Tao, J., Kuang, Y., Ma, N., Zheng, Y., Wiedensohler, A., and Zhao, C.: An improved parameterization scheme for size-resolved particle activation ratio and its application on comparison study of particle hygroscopicity measurements between HTDMA and DMA-CCNC, Atmos. Environ., 226, 117403, https://doi.org/10.1016/j.atmosenv.2020.117403, 2020.
Tao, J., Kuang, Y., Ma, N., Hong, J., Sun, Y., Xu, W., Zhang, Y., He, Y., Luo, Q., Xie, L., Su, H., and Cheng, Y.: Secondary aerosol formation alters CCN activity in the North China Plain, Atmos. Chem. Phys., 21, 7409–7427, https://doi.org/10.5194/acp-21-7409-2021, 2021.
Tao, M., Chen, L., Su, L., and Tao, J.: Satellite observation of regional haze pollution over the North China Plain, J. Geophys. Res.-Atmos., 117, D12203, https://doi.org/10.1029/2012JD017915, 2012.
Thalman, R., de Sá, S. S., Palm, B. B., Barbosa, H. M. J., Pöhlker, M. L., Alexander, M. L., Brito, J., Carbone, S., Castillo, P., Day, D. A., Kuang, C., Manzi, A., Ng, N. L., Sedlacek III, A. J., Souza, R., Springston, S., Watson, T., Pöhlker, C., Pöschl, U., Andreae, M. O., Artaxo, P., Jimenez, J. L., Martin, S. T., and Wang, J.: CCN activity and organic hygroscopicity of aerosols downwind of an urban region in central Amazonia: seasonal and diel variations and impact of anthropogenic emissions, Atmos. Chem. Phys., 17, 11779–11801, https://doi.org/10.5194/acp-17-11779-2017, 2017.
Ting, Y., Mitchell, E. J. S., Allan, J. D., Liu, D., Spracklen, D. V., Williams, A., Jones, J. M., Lea-Langton, A. R., McFiggans, G., and Coe, H.: Mixing State of Carbonaceous Aerosols of Primary Emissions from “Improved” African Cookstoves, Environ. Sci. Technol., 52, 10134–10143, https://doi.org/10.1021/acs.est.8b00456, 2018.
Tomlin, J. M., Jankowski, K. A., Veghte, D. P., China, S., Wang, P., Fraund, M., Weis, J., Zheng, G., Wang, Y., Rivera-Adorno, F., Raveh-Rubin, S., Knopf, D. A., Wang, J., Gilles, M. K., Moffet, R. C., and Laskin, A.: Impact of dry intrusion events on the composition and mixing state of particles during the winter Aerosol and Cloud Experiment in the Eastern North Atlantic (ACE-ENA), Atmos. Chem. Phys., 21, 18123–18146, https://doi.org/10.5194/acp-21-18123-2021, 2021.
Ulbrich, I. M., Canagaratna, M. R., Zhang, Q., Worsnop, D. R., and Jimenez, J. L.: Interpretation of organic components from Positive Matrix Factorization of aerosol mass spectrometric data, Atmos. Chem. Phys., 9, 2891–2918, https://doi.org/10.5194/acp-9-2891-2009, 2009.
Vu, D., Short, D., Karavalakis, G., Durbin, T. D., and Asa-Awuku, A.: Integrating Cloud Condensation Nuclei Predictions with Fast Time Resolved Aerosol Instrumentation to Determine the Hygroscopic Properties of Emissions Over Transient Drive Cycles, Aerosol Sci. Tech., 49, 1149–1159, https://doi.org/10.1080/02786826.2015.1105358, 2015.
Vu, D., Short, D., Karavalakis, G., Durbin, T. D., and Asa-Awuku, A.: Will Aerosol Hygroscopicity Change with Biodiesel, Renewable Diesel Fuels and Emission Control Technologies?, Environ. Sci. Technol., 51, 1580–1586, https://doi.org/10.1021/acs.est.6b03908, 2017.
Wang, X., Ye, X., Chen, J., Wang, X., Yang, X., Fu, T.-M., Zhu, L., and Liu, C.: Direct links between hygroscopicity and mixing state of ambient aerosols: estimating particle hygroscopicity from their single-particle mass spectra, Atmos. Chem. Phys., 20, 6273–6290, https://doi.org/10.5194/acp-20-6273-2020, 2020.
Wang, Y., Wang, X., Kondo, Y., Kajino, M., Munger, J. W., and Hao, J.: Black carbon and its correlation with trace gases at a rural site in Beijing: Top-down constraints from ambient measurements on bottom-up emissions, J. Geophys. Res.-Atmos., 116, D24304, https://doi.org/10.1029/2011JD016575, 2011.
Wang, Y., Zhang, F., Li, Z., Tan, H., Xu, H., Ren, J., Zhao, J., Du, W., and Sun, Y.: Enhanced hydrophobicity and volatility of submicron aerosols under severe emission control conditions in Beijing, Atmos. Chem. Phys., 17, 5239–5251, https://doi.org/10.5194/acp-17-5239-2017, 2017.
Wang, Y., Hu, R., Wang, Q., Li, Z., Cribb, M., Sun, Y., Song, X., Shang, Y., Wu, Y., Huang, X., and Wang, Y.: Different effects of anthropogenic emissions and aging processes on the mixing state of soot particles in the nucleation and accumulation modes, Atmos. Chem. Phys., 22, 14133–14146, https://doi.org/10.5194/acp-22-14133-2022, 2022.
Wehner, B., Berghof, M., Cheng, Y. F., Achtert, P., Birmili, W., Nowak, A., Wiedensohler, A., Garland, R. M., Pöschl, U., Hu, M., and Zhu, T.: Mixing state of nonvolatile aerosol particle fractions and comparison with light absorption in the polluted Beijing region, J. Geophys. Res.-Atmos., 114, D00G17, https://doi.org/10.1029/2008JD010923, 2009.
Wex, H., Petters, M. D., Carrico, C. M., Hallbauer, E., Massling, A., McMeeking, G. R., Poulain, L., Wu, Z., Kreidenweis, S. M., and Stratmann, F.: Towards closing the gap between hygroscopic growth and activation for secondary organic aerosol: Part 1 – Evidence from measurements, Atmos. Chem. Phys., 9, 3987–3997, https://doi.org/10.5194/acp-9-3987-2009, 2009.
Wu, Y., Wang, X., Tao, J., Huang, R., Tian, P., Cao, J., Zhang, L., Ho, K.-F., Han, Z., and Zhang, R.: Size distribution and source of black carbon aerosol in urban Beijing during winter haze episodes, Atmos. Chem. Phys., 17, 7965–7975, https://doi.org/10.5194/acp-17-7965-2017, 2017.
Xu, W., Sun, Y., Wang, Q., Zhao, J., Wang, J., Ge, X., Xie, C., Zhou, W., Du, W., Li, J., Fu, P., Wang, Z., Worsnop, D. R., and Coe, H.: Changes in Aerosol Chemistry From 2014 to 2016 in Winter in Beijing: Insights From High-Resolution Aerosol Mass Spectrometry, J. Geophys. Res.-Atmos., 124, 1132–1147, https://doi.org/10.1029/2018JD029245, 2019.
Xu, W. Y., Zhao, C. S., Ran, L., Deng, Z. Z., Liu, P. F., Ma, N., Lin, W. L., Xu, X. B., Yan, P., He, X., Yu, J., Liang, W. D., and Chen, L. L.: Characteristics of pollutants and their correlation to meteorological conditions at a suburban site in the North China Plain, Atmos. Chem. Phys., 11, 4353–4369, https://doi.org/10.5194/acp-11-4353-2011, 2011.
Yang, Z., Ma, N., Wang, Q., Li, G., Pan, X., Dong, W., Zhu, S., Zhang, S., Gao, W., He, Y., Xie, L., Zhang, Y., Kuhn, U., Xu, W., Kuang, Y., Tao, J., Hong, J., Zhou, G., Sun, Y., Su, H., and Cheng, Y.: Characteristics and source apportionment of black carbon aerosol in the North China Plain, Atmos. Res., 276, 106246, https://doi.org/10.1016/j.atmosres.2022.106246, 2022.
Zhang, F., Li, Y., Li, Z., Sun, L., Li, R., Zhao, C., Wang, P., Sun, Y., Liu, X., Li, J., Li, P., Ren, G., and Fan, T.: Aerosol hygroscopicity and cloud condensation nuclei activity during the AC3Exp campaign: implications for cloud condensation nuclei parameterization, Atmos. Chem. Phys., 14, 13423–13437, https://doi.org/10.5194/acp-14-13423-2014, 2014.
Zhang, F., Wang, Y., Peng, J., Chen, L., Sun, Y., Duan, L., Ge, X., Li, Y., Zhao, J., Liu, C., Zhang, X., Zhang, G., Pan, Y., Wang, Y., Zhang, A. L., Ji, Y., Wang, G., Hu, M., Molina, M. J., and Zhang, R.: An unexpected catalyst dominates formation and radiative forcing of regional haze, P. Natl. Acad. Sci. USA, 117, 3960–3966, https://doi.org/10.1073/pnas.1919343117, 2020.
Zhang, G., Fu, Y., Peng, X., Sun, W., Shi, Z., Song, W., Hu, W., Chen, D., Lian, X., Li, L., Tang, M., Wang, X., and Bi, X.: Black Carbon Involved Photochemistry Enhances the Formation of Sulfate in the Ambient Atmosphere: Evidence From In Situ Individual Particle Investigation, J. Geophys. Res.-Atmos., 126, e2021JD035226, https://doi.org/10.1029/2021JD035226, 2021.
Zhang, S., Shen, X., Sun, J., Zhang, Y., Zhang, X., Xia, C., Hu, X., Zhong, J., Wang, J., and Liu, S.: Atmospheric Particle Hygroscopicity and the Influence by Oxidation State of Organic Aerosols in Urban Beijing, J. Environ. Sci., 124, 544–556, https://doi.org/10.1016/j.jes.2021.11.019, 2023.
Zhang, S. L., Ma, N., Kecorius, S., Wang, P. C., Hu, M., Wang, Z. B., Größ, J., Wu, Z. J., and Wiedensohler, A.: Mixing state of atmospheric particles over the North China Plain, Atmos. Environ., 125, 152–164, 2016.
Zhang, Y., Su, H., Ma, N., Li, G., Kecorius, S., Wang, Z., Hu, M., Zhu, T., He, K., Wiedensohler, A., Zhang, Q., and Cheng, Y.: Sizing of Ambient Particles From a Single-Particle Soot Photometer Measurement to Retrieve Mixing State of Black Carbon at a Regional Site of the North China Plain, J. Geophys. Res.-Atmos., 123, 12778–12795, https://doi.org/10.1029/2018JD028810, 2018a.
Zhang, Y., Yuan, Q., Huang, D., Kong, S., Zhang, J., Wang, X., Lu, C., Shi, Z., Zhang, X., Sun, Y., Wang, Z., Shao, L., Zhu, J., and Li, W.: Direct Observations of Fine Primary Particles From Residential Coal Burning: Insights Into Their Morphology, Composition, and Hygroscopicity, J. Geophys. Res.-Atmos., 123, 12964–12979, https://doi.org/10.1029/2018JD028988, 2018b.
Zhang, Y., Zhang, Q., Yao, Z., and Li, H.: Particle Size and Mixing State of Freshly Emitted Black Carbon from Different Combustion Sources in China, Environ. Sci. Technol., 54, 7766–7774, https://doi.org/10.1021/acs.est.9b07373, 2020.
Zhao, G., Tao, J., Kuang, Y., Shen, C., Yu, Y., and Zhao, C.: Role of black carbon mass size distribution in the direct aerosol radiative forcing, Atmos. Chem. Phys., 19, 13175–13188, https://doi.org/10.5194/acp-19-13175-2019, 2019.
Zhao, G., Tan, T., Hu, S., Du, Z., Shang, D., Wu, Z., Guo, S., Zheng, J., Zhu, W., Li, M., Zeng, L., and Hu, M.: Mixing state of black carbon at different atmospheres in north and southwest China, Atmos. Chem. Phys., 22, 10861–10873, https://doi.org/10.5194/acp-22-10861-2022, 2022.
Zheng, H., Kong, S., Wu, F., Cheng, Y., Niu, Z., Zheng, S., Yang, G., Yao, L., Yan, Q., Wu, J., Zheng, M., Chen, N., Xu, K., Yan, Y., Liu, D., Zhao, D., Zhao, T., Bai, Y., Li, S., and Qi, S.: Intra-regional transport of black carbon between the south edge of the North China Plain and central China during winter haze episodes, Atmos. Chem. Phys., 19, 4499–4516, https://doi.org/10.5194/acp-19-4499-2019, 2019.
Zhuang, B. L., Li, S., Wang, T. J., Deng, J. J., Xie, M., Yin, C. Q., and Zhu, J. L.: Direct radiative forcing and climate effects of anthropogenic aerosols with different mixing states over China, Atmos. Environ., 79, 349–361, https://doi.org/10.1016/j.atmosenv.2013.07.004, 2013.