the Creative Commons Attribution 4.0 License.
the Creative Commons Attribution 4.0 License.
 | 05 Aug 2024
The emission, transport, and impacts of the extreme Saharan dust storm of 2015
Brian Harr
Qinjian Jin
Each summer, the Saharan Air Layer (SAL) transports massive amounts of mineral dust across the Atlantic Ocean, affecting weather, climate, and public health over large areas. Despite the considerable impacts of African dust, the causes and impacts of extreme trans-Atlantic African dust events are not fully understood. The “Godzilla” trans-Atlantic dust event of 2020 has been extensively studied, but little is known about other similar events. Here, we examine the June 2015 event, the second strongest trans-Atlantic African dust event that occurred during the summers from 2003–2022. This event was characterized by moderately high dust emissions over western North Africa and an extremely high aerosol optical depth (AOD) over the tropical North Atlantic. The high dust loading over the Atlantic is associated with atmospheric circulation extremes similar to the Godzilla event. Both the African easterly jet (AEJ) and Caribbean low-level jet (CLLJ) have greatly intensified, along with a westward extension of the North Atlantic subtropical high (NASH), all of which favor the westward transport of African dust. The enhanced dust emissions are related to anomalously strong surface winds in dust source regions and reduced vegetation density and soil moisture across the northern Sahel.
The dust plume reduced net surface shortwave radiation over the eastern tropical North Atlantic by about 25 W m−2 but increased net longwave flux by about 3 W m−2. In contrast to the Godzilla event, the 2015 event had minor air quality impacts on the US, partially due to the extremely intensified CLLJ that dispersed the dust plume towards the Pacific.
- Article
(15947 KB) - Full-text XML
-
Supplement
(2733 KB) - BibTeX
- EndNote


North Africa is the world's largest source of dust, emitting about 400–2200 Tg of mineral dust each year (e.g., Goudie and Middleton, 2001; Huneeus et al., 2011; Wu et al., 2020; Kok et al., 2021). African dust aerosols can affect the Earth's radiation budget (e.g., Prospero and Lamb, 2003; Li et al., 2004; Engelstaedter et al., 2006; Schepanski, 2018; Francis et al., 2022), modify cloud properties by serving as cloud condensation nuclei and ice nuclei (Levin et al., 1996; Rosenfeld et al., 2001; Goudie and Middleton, 2001; DeMott et al., 2003; Prenni et al., 2009), and couple with global biogeochemical cycles by depositing vital mineral nutrients over land and ocean (Okin et al., 2004; Bristow et al., 2010; Kumar et al., 2014; Yu et al., 2015b; Jickells et al., 2016; Villar-Argaiz et al., 2018). Climate change is expected to have major impacts on North Africa (Prospero et al., 2021), making it more pressing for us to understand the spatiotemporal variability in African dust and its associated impacts.
Each boreal summer, a large amount of African dust is transported westward to the Atlantic Ocean. The thick, warm, and dry African dust plumes, namely the Saharan Air Layer (SAL; Carlson and Prospero, 1972; Prospero and Carlson, 1972; Karyampudi and Carlson, 1988; Kanitz et al., 2014), often propagate across the tropical North Atlantic to the Caribbean Basin and the southeastern US, affecting weather and climate systems along their transport pathways (e.g., Karyampudi and Carlson, 1988; Dunion and Velden, 2004; Jenkins et al., 2008; Strong et al., 2018). While much research seeks to understand the conditions associated with African dust emissions and westward transport and aims to quantitatively characterize the trans-Atlantic African dust plumes (Prospero and Lamb, 2003; Kaufman et al., 2005; Engelstaedter et al., 2006; Kalashnikova and Kahn, 2008; Knippertz and Todd, 2012; Fiedler et al., 2015; Yu et al., 2015b, 2019), only a small body of research is dedicated to examining extreme trans-Atlantic dust events that occur in summertime, i.e., events with extremely high dust loading over the tropical North Atlantic (Huang et al., 2010; Francis et al., 2020; Yu et al., 2021; Pu and Jin, 2021). The record-breaking trans-Atlantic African dust event of June 2020 – namely, the “Godzilla” dust storm – is the strongest trans-Atlantic dust event that has occurred in summertime since 2003 (Yu et al., 2021; Pu and Jin, 2021) and has been extensively studied (Francis et al., 2020; Yu et al., 2021; Pu and Jin, 2021; Francis et al., 2022; Scott et al., 2022; Asutosh et al., 2022; Mehra et al., 2023). It has been found that the event is associated with both enhanced dust emissions over North Africa and intensified westward transport of dust related to circulation extremes (Yu et al., 2021; Pu and Jin, 2021). However, little is known about other similar extreme trans-Atlantic African dust events that have occurred in summer. It is not clear what the major causes of the extremely high loading of African dust over the tropical North Atlantic are – i.e., whether mechanisms found in the 2020 event also apply to other events, resulting in similar radiation and air quality impacts.
To address some of these questions, we examine the trans-Atlantic African dust storm that occurred in June 2015, which was the second strongest aerosol extreme event over the tropical North Atlantic in boreal summer during 2003–2020 (Pu and Jin, 2021). We examine the characteristics, mechanisms, and radiative and air quality impacts of this event using multiple satellite products (e.g., the Moderate Resolution Imaging Spectroradiometer (MODIS), the Visible Infrared Imaging Radiometer Suite (VIIRS), the Cloud-Aerosol Lidar with Orthogonal Polarization (CALIOP), and the Clouds and the Earth’s Radiant Energy System (CERES)), ground observations (e.g., the Aerosol Robotic Network (AERONET)), and reanalysis data (fifth generation of ECMWF reanalysis – ERA5). The following section reviews previous studies of summertime trans-Atlantic African dust events. Section 3 introduces the data and methodology used in this study, while Sect. 4 presents a detailed analysis of the June 2015 event and compares it with the 2020 Godzilla dust event. Section 5 discusses limitations and uncertainties, and Sect. 6 summarizes our major findings.
During summertime, due to strong surface heating in the Sahara and dry convection (Fontaine et al., 2002), a deep, dry, well-mixed dust layer, i.e., the SAL, forms over North Africa (Carlson and Prospero, 1972; Prospero et al., 2002; Barkan et al., 2004; Braun, 2010; Pan et al., 2011; Dunion, 2011; Adams et al., 2012). The top layer of the SAL can reach heights of 5–6 km, while its base is often about 0.9–1.8 km above the surface (e.g., Prospero and Carlson, 1972; Dunion and Velden, 2004; Adams et al., 2012). Early observational studies documented that SALs often move westward from North Africa to Barbados in the Caribbean (Prospero and Carlson, 1970; Prospero et al., 1970). It is estimated that at least 72 Tg a−1 of African dust leaves the African west coast at 15° W in summer, with about 18 Tg a−1 reaching 75° W in the Caribbean (Yu et al., 2015a).
The westward transport of the SAL in boreal summer has long been related to certain meteorological factors, such as the African easterly jet (AEJ) and African easterly wave (AEW) (Burpee, 1972; Fontaine et al., 2002; Jones et al., 2003; Engelstaedter and Washington, 2007). In addition, many other factors that either influence dust emissions in North Africa or affect atmospheric circulation over the tropical North Atlantic have been related to variations in the westward transport of African dust in summer, e.g., El Niño–Southern Oscillation (ENSO) events (Prospero and Lamb, 2003; Li et al., 2021; Yin et al., 2022), Atlantic sea surface temperatures (Wang et al., 2012), and local vegetation coverage (Moulin and Chiapello, 2004; Yu et al., 2015a). These factors modulate dust emissions and near-surface dust concentrations, while the North Atlantic subtropical high (NASH; Doherty et al., 2008; Chen et al., 2018) and the North Atlantic Oscillation (NAO; Moulin et al., 1997) affect dust transport over the tropical North Atlantic.
While the above studies extensively examined the features and propagations of SALs in summer, only a few studies have focused on extreme trans-Atlantic African dust events that have led to high dust loading over the tropical North Atlantic and the Caribbean Basin. For instance, Petit et al. (2005) examined the extreme trans-Atlantic dust event that occurred in June 1994. The dust plume originated near the salt pan of Taoudenni in northern Mali (Fig. S1a in the Supplement), where strong surface winds and convection associated with a depression lifted dust to about 5 km. The dust plume then gradually descended as it traversed the Atlantic within the easterly trades to the eastern Caribbean Basin.
Huang et al. (2010) conducted a comprehensive study of major trans-Atlantic African dust outbreaks from 2003 to 2007. Dust outbreaks were defined as instances where regionally averaged daily MODIS AOD (aerosol optical depth) exceeded the climatological mean by 1 standard deviation over the eastern tropical North Atlantic. Their findings painted a detailed picture of dust transport from central West Africa to the Caribbean Basin, documenting the westward transport pathways of dust, the speed and altitude of dust layers, and their connection with dry-air outbreaks. While Huang et al. (2010) were among the first to systemically study severe trans-Atlantic dust outbreaks, they did not examine the large-scale-circulation conditions supporting the long-range transport of African dust plumes or the local land surface conditions associated with dust emissions.
The formation of the recent extreme trans-Atlantic Saharan dust event (i.e., the Godzilla dust event), which occurred in June 2020, has been related to both enhanced local emissions that are associated with increased surface winds, reduced vegetation coverage (Pu and Jin, 2021), and strong haboobs (Yu et al., 2021) and large-scale circulations that favor the westward transport of African dust (Francis et al., 2020; Yu et al., 2021; Pu and Jin, 2021). Pu and Jin (2021) pointed out that atmospheric circulation extremes played important roles in this event. While the extremely enhanced AEJ advected huge amounts of dust to the eastern tropical North Atlantic, the westward extension of the NASH and the greatly intensified Caribbean low-level jet (CLLJ) further steered the dust plume westward and northward towards the US. Here, we will examine whether similar atmospheric circulation patterns and land surface conditions occurred during the June 2015 event and whether circulation extremes also contributed to the high dust loading over the Atlantic.
We will also examine the impacts of the extreme trans-Atlantic dust event that occurred in June 2015. Dust aerosols are known to absorb and scatter incoming shortwave and outgoing longwave radiation and emit longwave radiation, affecting the regional and global radiative balance (Claquin et al., 2003; Xu et al., 2017). The sign and magnitude of the radiative forcing of dust strongly depend on the physical and optical properties of dust aerosols, their chemical and mineral compositions, and spatial distributions (Goudie and Middleton, 2001; Meloni et al., 2005; Reddy et al., 2013; Mahowald et al., 2014; Kok et al., 2023). The radiative effects of African dust have long been examined through satellite products (e.g., Yu et al., 2006; Brindley and Russell, 2009; Song et al., 2018), field campaigns (e.g., Carlson and Caverly, 1977; Haywood et al., 2001, 2003; Highwood et al., 2003; Slingo et al., 2006), and modeling studies (e.g., Tegen and Lacis, 1996; Myhre et al., 2003; Tegen et al., 2010; Hansell et al., 2010). The high dust loading, long duration, and large affected areas of extreme trans-Atlantic dust events provide great examples for revisiting the radiative impacts of African dust. Francis et al. (2022) found that the Godzilla dust plume of 2020 led to a 190 W m−2 drop in downward shortwave radiation flux and a 23 W m−2 rise in downward longwave flux at the surface of the eastern tropical Atlantic on 18 June 2020. Mehra et al. (2023) showed that the Godzilla dust plume also significantly affected radiative balance in the US, resulting in atmospheric heating amounting to 5–12 W m−2. Here, we will explore the perturbation of the June 2015 African dust plume on both surface and top-of-the-atmosphere (TOA) radiative budgets.
Severe dust storms with elevated concentrations of dust particles can have adverse impacts on public health and transportation (e.g., Shinn et al., 2003; Goudie, 2014; Urrutia-Pereira et al., 2021). Trans-Atlantic African dust has been found to affect air quality over both the Caribbean Basin and the southern US (Prospero, 1999; Chen et al., 2018; Prospero et al., 2021). For instance, Saharan dust has been found to be related to high rates of asthma in the Caribbean (Gyan et al., 2005; Akpinar-Elci et al., 2015) and can transport fungi and bacteria from Africa to the Caribbean (Prospero et al., 2005; Waters et al., 2020). Over coastal Texas, African dust contributed to approximately 8 % of PM2.5 (particulate matter with an aerodynamic diameter < 2.5 µm) concentrations in summer and up to 48 % of PM2.5 concentrations during an African dust outbreak in August 2014 (Bozlaker et al., 2019). During the Godzilla event of 2020, PM2.5 levels over a large area of the southern US exceeded the Environmental Protection Agency (EPA) guideline, and the Air Quality Index (AQI) reached orange levels (unhealthy for sensitive groups) and red levels (unhealthy for the general public) in more than 11 states (Pu and Jin, 2021; Yu et al., 2021). The extent to which the extreme 2015 trans-Atlantic dust event affected the air quality in the US will be examined in this study.
3.1 Data
We use satellite retrievals of AOD, radiative fluxes, vegetation coverage, and precipitation, as well as circulation variables and soil moisture from reanalysis and ground observations of AOD and air quality variables, to examine the characteristics, mechanisms, and impacts of the extreme dust plume that occurred in 2015.
3.1.1 MODIS and VIIRS AOD
AOD is a column-integrated measure of aerosol extinction. Here, we use daily and monthly AOD from the Moderate Resolution Imaging Spectroradiometer (MODIS) (version 6.1; Sayer et al., 2019) aboard both the Terra and Aqua satellites. Monthly level-3 AOD data from 2003 to 2022 have a spatial resolution of 1.0° × 1.0°, while daily level-2 data from 2015 are regridded to a 0.1° × 0.1° grid to characterize features of the dust plume. Monthly and daily MODIS AOD is generated by averaging Terra- and Aqua-MODIS AOD.
Daily AOD from the Visible Infrared Imaging Radiometer Suite (VIIRS; Hsu et al., 2019) onboard the Suomi National Polar-orbiting Partnership (Suomi NPP) satellite is used to complement MODIS AOD. Daily VIIRS AOD is also gridded to a 0.1° × 0.1° resolution and averaged with daily MODIS AOD from June 2015 to increase the spatial coverage of the data to better demonstrate the propagation of the African dust plume. Both MODIS and VIIRS AOD agree well with the Aerosol Robotic Network (AERONET; Holben et al., 1998, 2001) ground observations (Liu et al., 2014; Sayer et al., 2019; Hsu et al., 2019), with root mean square errors of 0.115, 0.121, and 0.122 for Aqua MODIS, Terra MODIS, and VIIRS, respectively (Hsu et al., 2019). The high spatial resolutions, near-global coverage, and relatively small errors in MODIS and VIIRS AOD make them very suitable for examining the long-range transport of extreme African dust plumes.
3.1.2 CALIOP aerosol profiles
The Cloud-Aerosol Lidar with Orthogonal Polarization (CALIOP) is a two-wavelength lidar instrument aboard the Cloud-Aerosol Lidar and Infrared Pathfinder Satellite Observations (CALIPSO) satellite. CALIOP measures backscattered radiances attenuated by aerosols and clouds and retrieves the microphysical and optical properties of aerosols. The record began in June 2006 and has been shown to provide quality data about aerosol size, aerosol type, and different shapes of cloud particles (Winker et al., 2007). We used daily 532 nm total-attenuated-backscatter data (level 1) and depolarization ratio data (δ; level 2) from June 2015 to examine the vertical profiles of the dust plume. Note that CALIOP data are missing for the period 19–28 June 2015. The instrumental sources of depolarization bias are small (Winker et al., 2004), with a typical uncertainty (median values) of about 0.18 for aerosol profile products at nighttime (CALIPSO User Guide, 2018), while the biases in nighttime-attenuated-backscatter data at 532 nm in version 4 amount to about 1.6 % ± 2.4 % when compared to collocated measurements from the Langley Research Center's airborne High Spectral Resolution Lidar (Kar et al., 2018). Since the depolarization ratio can help separate spherical and nonspherical hydrometeors (Sassen, 1991), we use δ ≥ 0.2 to separate (nonspherical) dust from other aerosols (Li et al., 2010; Kim et al., 2018; Pu and Ginoux, 2018a; Pu and Jin, 2021).
3.1.3 Spinning Enhanced Visible and Infrared Imager (SEVIRI) dust red–green–blue (RGB)
Dust red–green–blue (RGB) composite satellite images have been widely used as a qualitative method to study the spatiotemporal formation and evolution of dust plumes (e.g., Schepanski et al., 2007; Marsham et al., 2008; Martínez et al., 2009; Roberts et al., 2018; Caton Harrison et al., 2021). Dust aerosols are detected based on spectral variations in emissivity at infrared (IR) wavelengths ranging from 8 to 12 µm (Ackerman, 1997; Lensky and Rosenfeld, 2008). Here, the dust RGB images from the Spinning Enhanced Visible and Infrared Imager (SEVIRI) onboard the geostationary Meteosat Second Generation (MSG) satellite (Schmetz et al., 2002), positioned at 0° longitude (i.e., Meteosat-10), are used to understand dust emissions from the extreme event that occurred in June 2015. The SEVIRI instrument observes the Earth system at 12 wavelengths ranging from 0.4 to 13.4 µm with a 15 min repeat cycle and a spatial resolution of 3 km at nadir for the IR channels. The SEVIRI dust RGB images are composed of brightness temperatures (BTs) and BT difference (BTD) at 8.7, 10.8, and 12.0 µm (Schepanski et al., 2007; Ashpole and Washington, 2012). The dust RGB bands are defined as follows: the BTD between 12.0–10.8 µm is red, the BTD between 10.8–8.7 µm is green, and the BT at 10.8 µm is blue. The dust plumes appear as pink in the dust RGB images. IR dust detection is affected by several factors, such as the vertical temperature gradient in the lower atmosphere, water vapor content, dust mineralogy, dust altitudes, and characteristics of the land surface (Brindley et al., 2012; Banks et al., 2018, 2019). Here, the high-temporal-resolution dust RGB images complement daily MODIS and VIIRS AOD to show the development of the dust plume over North Africa.
3.1.4 MODIS normalized difference vegetation index (NDVI)
We also use the monthly and 16 d Terra-MODIS normalized difference vegetation index (NDVI; Didan et al., 2015; version 6.1) to examine the connection between dust emissions and vegetation coverage. The level-3 data are interpolated to a 0.25° × 0.25° grid, and the 16 d products are linearly interpolated to daily values. The uncertainty in the data is about ±0.025 (MODIS Land General Accuracy Statement, 2023), which is much smaller than that for the anomalies in the Sahel, as noted in this study.
3.1.5 Integrated Multi-Satellite Retrievals for Global Precipitation Measurement (IMERG)
The Global Precipitation Measurement (GPM) mission utilizes the Integrated Multi-Satellite Retrievals for GPM (IMERG) algorithm to combine all available passive-microwave (PMW) and IR-precipitation estimates from low-Earth-orbit and geosynchronous-Earth-orbit satellites. These estimates are then validated and corrected for bias using monthly gauge analysis from the Global Precipitation Climatology Centre (GPCC) (Huffman et al., 2019). IMERG is an improvement over the previous Tropical Rainfall Measuring Mission (TRMM), with reduced misdetection of precipitation and better performance in capturing heavy and light precipitation (Wang et al., 2021) and subdaily rainfall (Freitas et al., 2020); however, it still exhibits large overestimations of duration and underestimations of precipitation intensity (Freitas et al., 2020). We use IMERG Final Run (IMERG-F) for the period 2000–2019 (0.1° by 0.1°) as it is the most accurate, gauge-adjusted, and research-ready IMERG product (Wang et al., 2017, 2021; Beck et al., 2021). The half-hourly data are resampled to daily averages to examine the potential influence of precipitation on the formation and transport of the extreme African dust plume.
3.1.6 CERES radiative fluxes
We use daily and monthly radiation flux data from the CERES (Clouds and the Earth's Radiant Energy System) products (Doelling et al., 2016) on a 1° × 1° grid to study the radiative impacts of the extreme 2015 dust plume. The CERES instruments are onboard both the Terra and Aqua satellites and measure shortwave (SW) radiation between 0.3 and 5 µm, total radiation between 0.3 and 200 µm, and window wavelengths between 8 and 12 µm (Wielicki et al., 1996). The dataset includes observed top-of-the-atmosphere (TOA) fluxes and computed surface and in-atmosphere fluxes using the Langley Fu–Liou radiative-transfer model; MODIS-derived and geostationary-satellite-derived cloud properties; atmospheric data from the Goddard Earth Observing System (GEOS) model; and aerosol properties from the Model for Atmospheric Transport and Chemistry (MATCH), which assimilates MODIS AOD (Rutan et al., 2015). Note that current CERES products have a net imbalance of +4.5 W m−2 at the TOA (Johnson et al., 2016; Kato et al., 2018; Loeb et al., 2018). In comparison with surface observations at buoy sites, CERES surface fluxes show mean biases of 4.9 W m−2 for downward SW fluxes and 1.1 W m−2 for downward longwave (LW) fluxes in monthly data (CERES Surface Flux Accuracy and Validation, 2021). The larger differences between the CERES and buoy data over the tropical Atlantic Ocean are attributed to the transported African dust that has accumulated on buoys (Foltz et al., 2013). Due to their high spatial coverage, CERES products have been widely used to study the radiative effect of dust (e.g., Song et al., 2018; Francis et al., 2022).
3.1.7 AERONET AOD
The AERONET program (Holben et al., 1998) provides quality-assured cloud-screened measurements (level 2.0) of aerosol optical properties from sun photometer records. The recorded AOD has high accuracy, with an uncertainty level of 0.01–0.02 (depending on the wavelength) (Holben et al., 2001; Giles et al., 2019). Here, version 3.0 AOD at wavelengths between 440 and 870 nm and Ångström exponents across dual wavelengths of 440–675, 440–870, and 500–870 nm, with temporal resolutions varying from about 3 to 30 min (depending on the station) over western North Africa, the tropical North Atlantic, and the Caribbean Basin in June 2015, are used. AOD at 550 nm is converted using the method detailed by Pu et al. (2020). Stations that recorded fewer than 10 d of data and had mean AOD values below 0.2 from 11–25 June 2015 are not included in the analysis. The results from 14 stations are presented and compared with the MODIS and VIIRS AODs.
3.1.8 EPA station data
Daily air quality data on PM2.5 and the Air Quality Index (AQI) from the US Environmental Protection Agency's (EPA) Air Quality System (AQS) stations are used to examine the influence of the June 2015 African dust plume on air quality in the US. The AQI reflects the health effect of major air pollutants, with values of 0–50 indicating good air quality (green), values of 51–100 indicating moderate conditions (yellow), values of 101–150 indicating unhealthy conditions for sensitive groups (orange), and values of 151–200 indicating unhealthy conditions (red).
3.1.9 Aerosol products from the Modern-Era Retrospective Analysis for Research and Applications, Version 2 (MERRA-2)
The second version of the Modern-Era Retrospective Analysis for Research and Applications (MERRA-2; Gelaro et al., 2017) provides data on dust optical depth (DOD) (0.5° × 0.625°; hourly data; GMAO, 2015) starting from 1980. MERRA-2 is the first long-term global reanalysis that incorporates satellite observations of aerosols (Gelaro et al., 2017). MERRA-2 assimilates aerosol products from MODIS, the Multi-angle Imaging SpectroRadiometer (MISR), and the Advanced Very High Resolution Radiometer (AVHRR), as well as ground observations from AERONET sun photometers (Gelaro et al., 2017; Buchard et al., 2017). MERRA-2 demonstrates considerable skill in its aerosol products and shows improvement over its predecessor (Gelaro et al., 2017; Randles et al., 2017; Buchard et al., 2017). Its DOD product effectively captures spatial and temporal variations in DOD over North Africa on a seasonal timescale compared to infrared satellite retrievals; however, it does not account for a large portion of day–night differences in dust as nighttime observations are currently not assimilated to the product (Tindan et al., 2023). The hourly MERRA-2 DOD data are averaged to daily values to complement MODIS and VIIRS AODs.
3.1.10 ERA5 meteorological and surface variables
Version 5 of the ECMWF (European Centre for Medium-Range Weather Forecasts) reanalysis (ERA5) (Hersbach et al., 2020) is the fifth generation of the ECMWF reanalysis products. Monthly and hourly variables, such as surface winds and geopotential height at 925, 850, and 600 hPa (at a resolution of 0.25° × 0.25°; Hersbach et al., 2023a, b), are used to understand the circulation features associated with dust emissions and long-range transport.
Hourly and monthly volumetric soil water content of the top layer (i.e., 0–7 cm), with a spatial resolution of 0.1° × 0.1° (Hersbach et al., 2023c, d), is used to examine land surface conditions associated with dust emissions. Daily values are averaged from hourly data. ERA5 is the first ECMWF reanalysis to incorporate soil moisture retrievals from C-band scatterometer instruments onboard European Remote Sensing satellites 1 and 2 (ERS-1 and ERS-2) and Meteorological Operational satellites A and B (MetOp-A and MetOp-B) (Piles et al., 2019; Hersbach et al., 2020; Agutu et al., 2021). Although the soil moisture product of ERA5 does not incorporate ground-based observations and lacks sufficient spin-up time for accurately representing deep-soil moisture, ERA5 soil moisture estimates demonstrate high skill with regard to shallow-soil moisture in regions where gauge measurements are lacking, such as western Africa (Brocca et al., 2020; Beck et al., 2021).
3.2 Jet indices
Both the African easterly jet (AEJ) and the Caribbean low-level jet (CLLJ) have been found to affect the westward propagation of African dust plumes (Prospero and Carlson, 1981; Pu and Jin, 2021). These extremely enhanced easterly jets also contributed to the development of the Godzilla dust event in June 2020 (Pu and Jin, 2021). Here, we examine how these jets may have affected the formation of the extreme African dust plume in 2015. We use jet indices to quantify the magnitude of each jet, calculated by averaging the easterly wind speed over the jet's climatological location, similar to regions selected in prior papers (Cook, 1999; Wang, 2007; Leroux and Hall, 2009; Martin and Schumacher, 2011). Following Pu and Jin (2021), the CLLJ index is calculated by averaging 925 hPa easterly wind speed from ERA5 between 11–17° N and 70–80° W, and the AEJ index is calculated by averaging 600 hPa easterly wind speed from ERA5 between 10–15° N and 30° E–10° W.
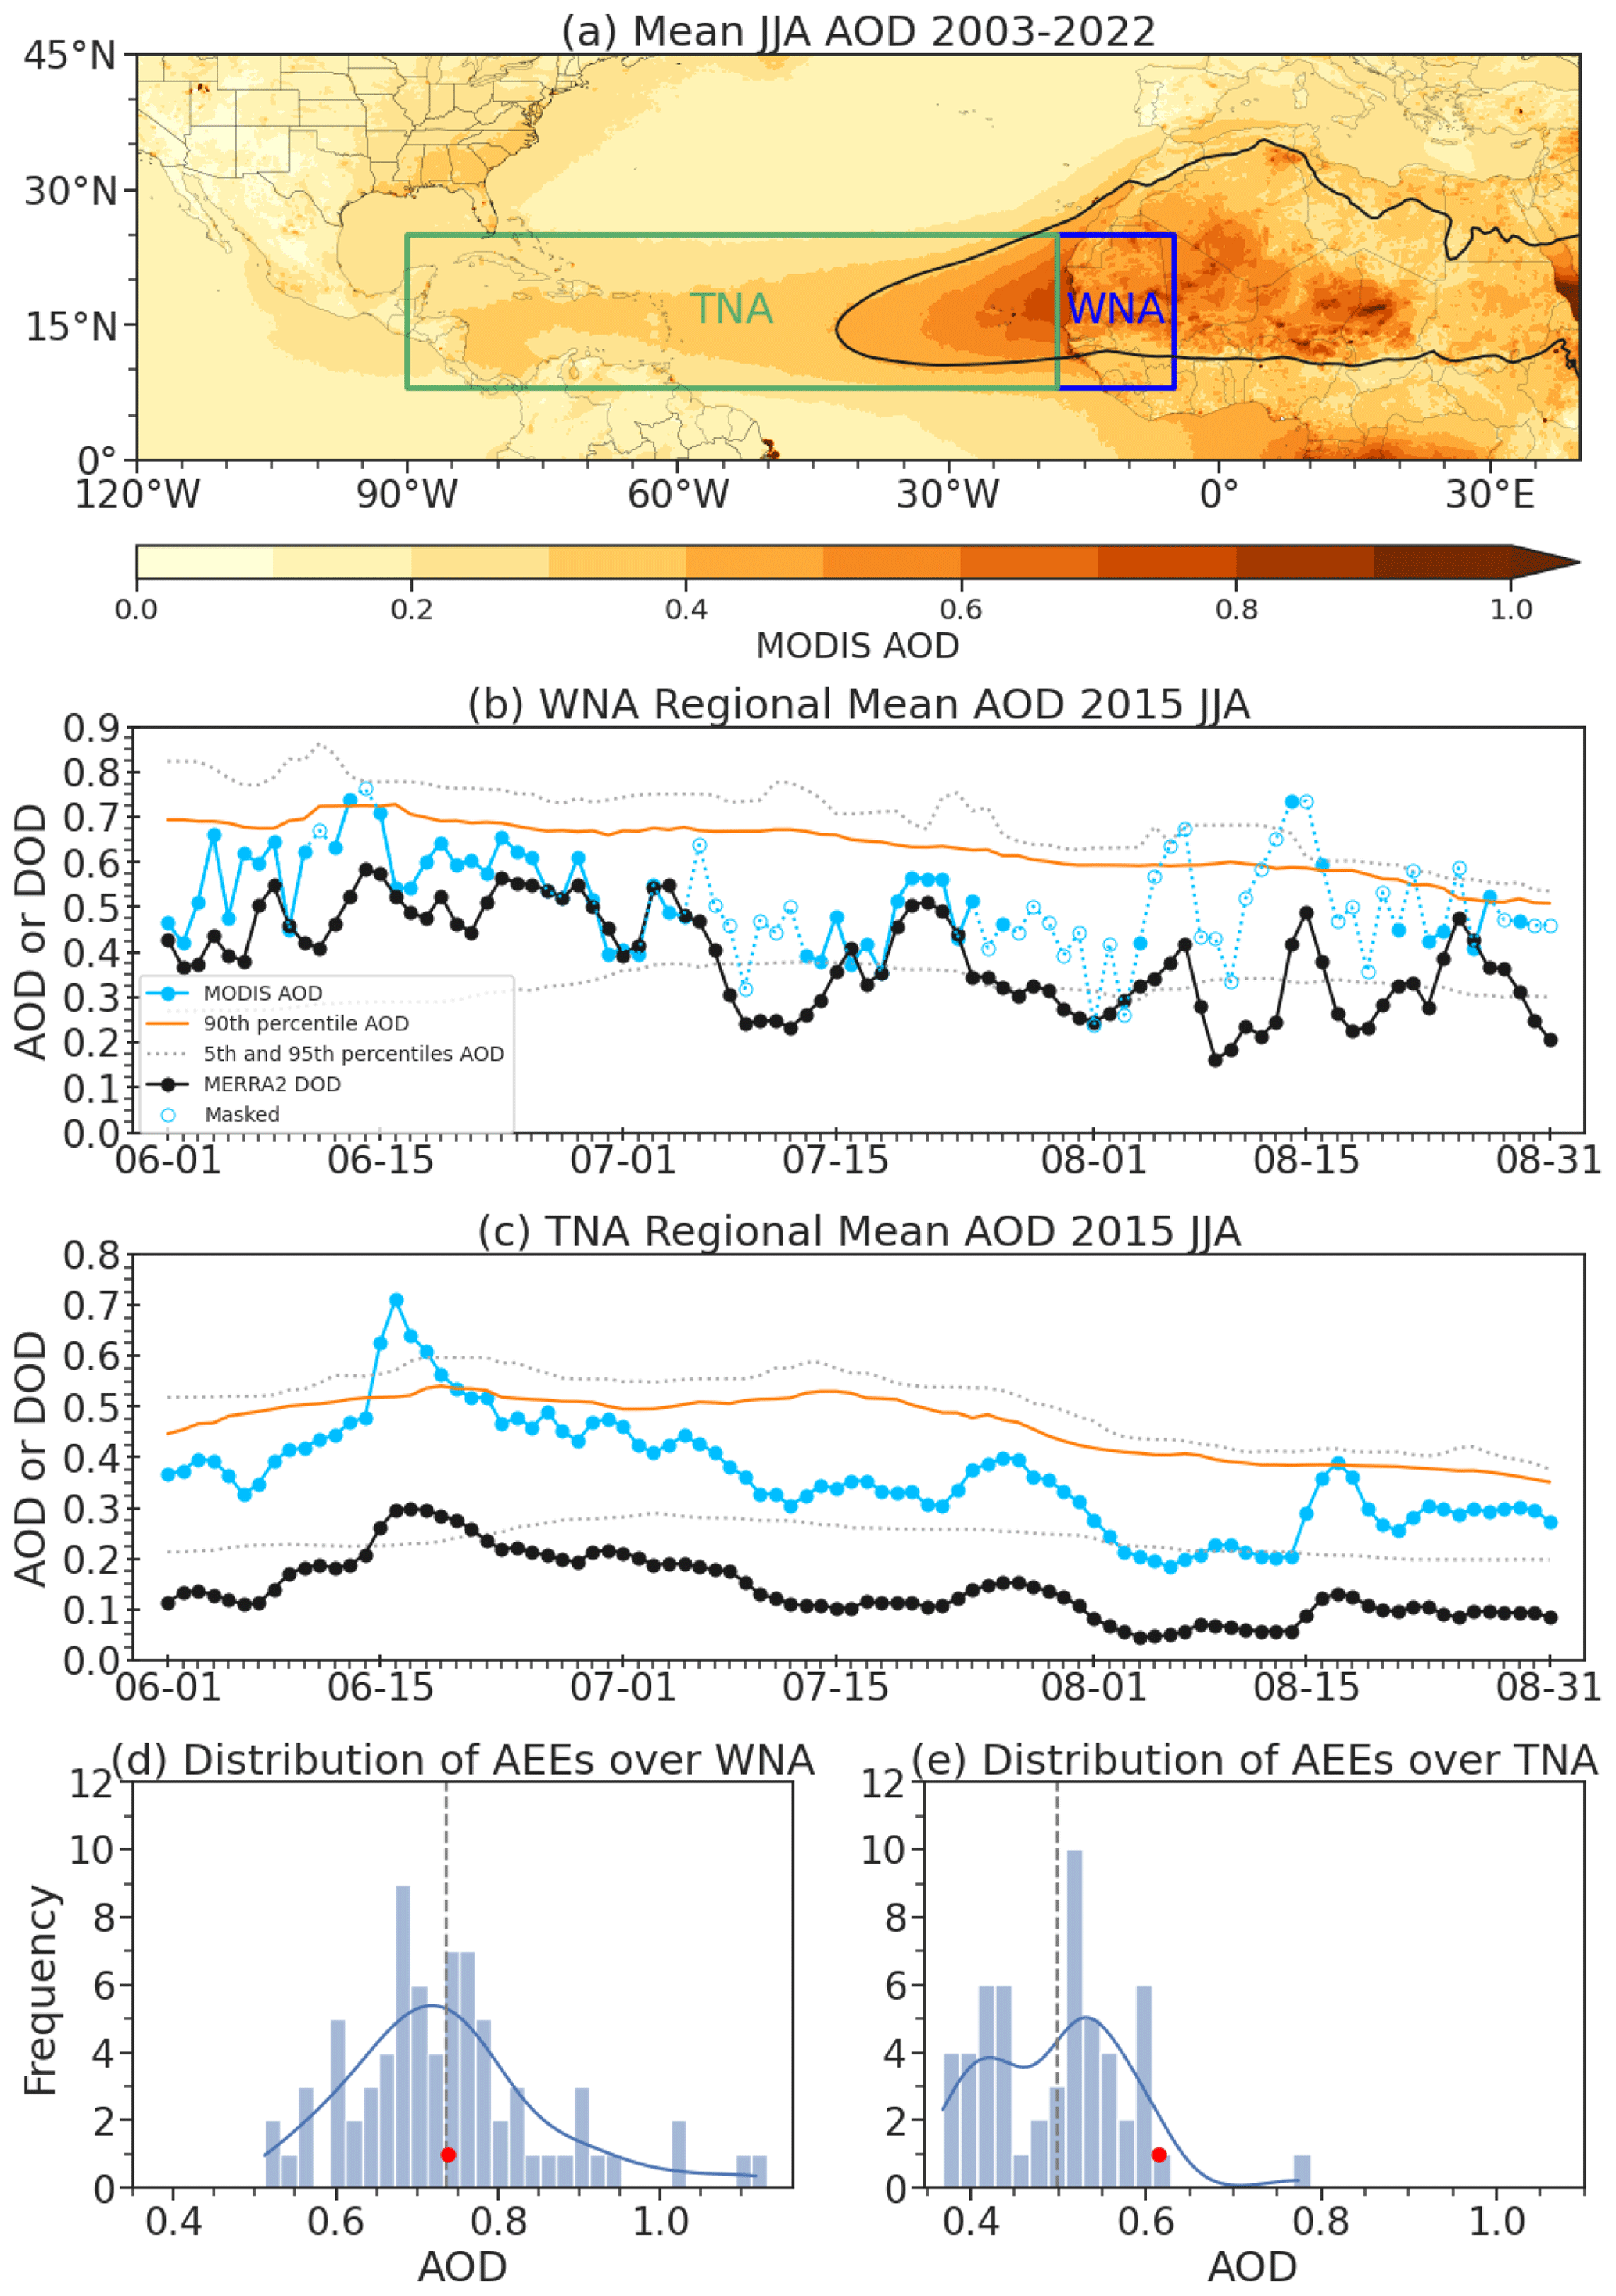
Figure 1(a) Climatology of MODIS AOD during June–August (JJA) from 2003 to 2022. Regions with MERRA-2 DOD greater than 0.3 are contoured in black. The averaging area over the tropical North Atlantic (TNA; 8–25° N, 18–90° W) and western North Africa (WNA; 8–25° N, 18–5° W) regions are marked by a green box and a blue box, respectively. The regional mean of daily MODIS AOD (blue) and MERRA-2 DOD (black) for JJA 2015 across (b) western North Africa and (c) the tropical North Atlantic. The 90th percentile of daily MODIS AOD for JJA (2003–2022) is shown in orange, and the dotted grey lines represent the 5th and 95th percentiles of AOD. Filled (empty) circles represent days where the percentage of missing values is less than (more than) 30 % within the regional boxes. Distribution of aerosol extreme events (AEEs) from 2003–2022 over (d) WNA and (e) the TNA. The red dots mark the values of the June 2015 event, and the vertical dashed lines denote the means of the AEEs over WNA and the TNA.
3.3 Identify extreme trans-Atlantic dust events
We first use aerosol extreme events (AEEs; Pu and Jin, 2021) to identify high-dust-loading days across the tropical North Atlantic and western North Africa. An AEE is defined as when the regional mean of daily MODIS AOD is above the 90th percentile of daily AOD centered on a 15 d window for the period 2003–2022 in boreal summer (June–August). The duration of an AEE is defined as the number of consecutive days (≥ 1) that meet the criteria, while the magnitude of an AEE is calculated by averaging AOD data for this event. Following Pu and Jin (2021), we calculated the AEEs that occurred over the tropical North Atlantic (8–25° N, 18–90° W; see location in Fig. 1a) and the dust source region in western North Africa (8–25° N, 18–5° W; see Fig. 1a) during JJA from 2003–2022. During boreal summer, peak dust activities are mainly located in western North Africa, extending from the Mauritanian coast to the Mali–Mauritania border and the Mali–Algeria border (Goudie and Middleton, 2001; Prospero et al., 2002; Engelstaedter et al., 2006; Engelstaedter and Washington, 2007). The averaging regions largely capture the westward transport pathway of African dust in summer, and the resultant AEEs for the period 2003–2022 are very similar to those reported by Pu and Jin (2021; their Fig. 2). Over the tropical North Atlantic region, the AEE of June 2020 has the highest magnitude of AOD on record, with a duration of 12 d (not shown), and the June 2015 event has the second highest magnitude, with a duration of 6 d (Fig. 1c). Over the dust source region in western North Africa, a 1 d AEE on 13 June is found, with a moderately high AOD of 0.74 (Fig. 1b), weaker than the June 2020 event (a 6 d AEE with an AOD of 0.90) and slightly above the mean of AEEs over western North Africa (0.73; Fig. 1d). Note that the MODIS AOD from the study region contains missing values; this is largely due to cloud screening, which may affect the calculation of AEEs. Here, only days where the percentage of missing AOD values in the averaging areas is less than 30 % are used for AEE calculations, and this criterion mainly affects the AEEs over land (Fig. 1b). Slightly increasing or reducing the missing-value threshold (e.g., to 20 % or 40 %) does not change the AEE days over the ocean.
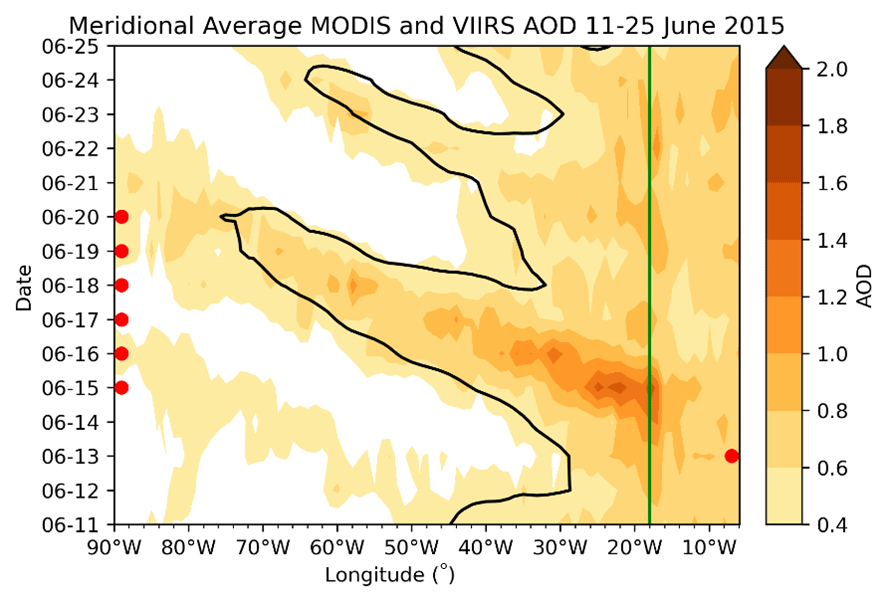
Figure 2Hovmöller plot of meridionally averaged MODIS and VIIRS AODs from 8–25° N across the tropical North Atlantic for the period 11–15 June 2015. Only AOD values above 0.4 are shown. The black contour denotes the areas where MERRA-2 DOD is greater than 0.3. The green line denotes 18° W and represents the dividing line between the averaging boxes shown in Fig. 1. The red dots mark the dates of AEEs over the tropical North Atlantic (left) and western North Africa (right).
While AEEs capture the maximum AOD during the event (Fig. 1b–c), a trans-Atlantic event usually lasts more than a week as it takes about 7 d for African dust to reach the Caribbean and 10–12 d for it to reach the continental US (Ott et al., 1991; Haarig et al., 2017; Chen et al., 2018). Thus, we also use a Hovmöller diagram illustrating AOD over the tropical North Atlantic that shows the westward propagation of the dust plume (Fig. 2) and a plot depicting daily AOD (Fig. 3) to identify the start and end dates of the event. We found that the extreme dust event started around 12 June and ended around 23 June 2015.
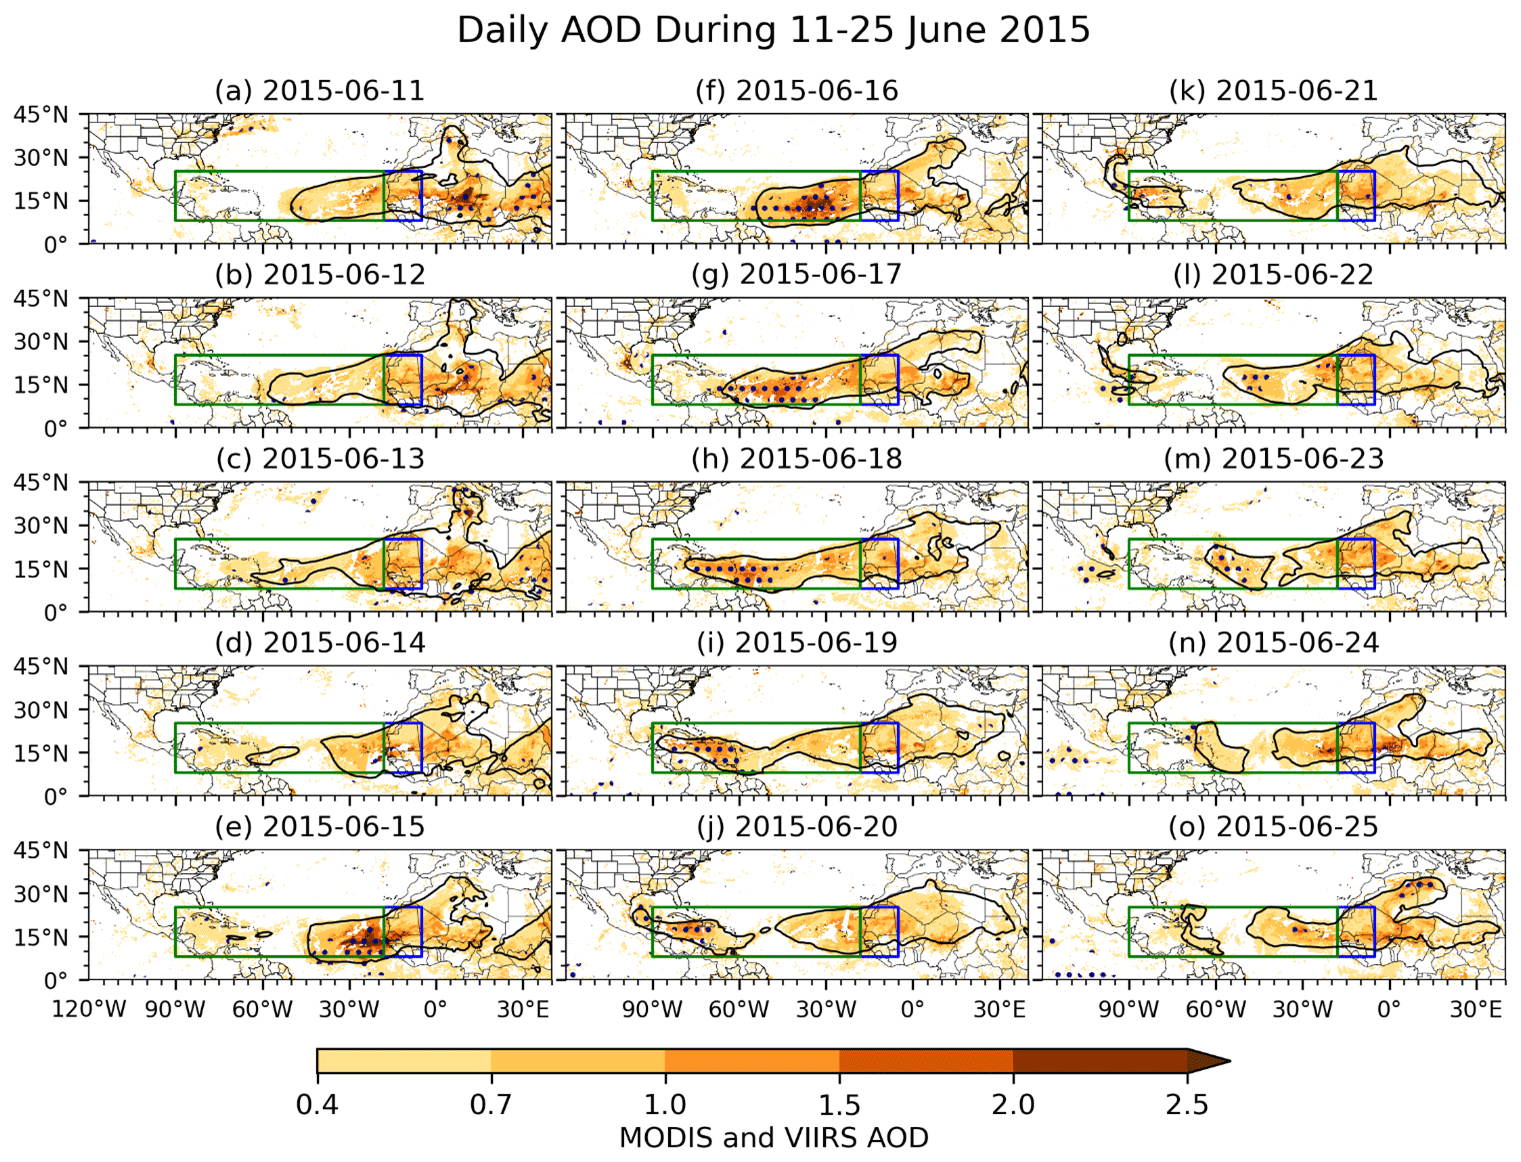
Figure 3Combined MODIS and VIIRS AOD from 11 to 25 June 2015. Only AOD values above 0.4 are shown. Black contours denote the boundary where MERRA-2 DOD exceeds 0.3. Navy dots represent regions where MODIS AOD exceeds the 95th percentile (with reference to daily MODIS AOD for JJA from 2003 to 2022 at each grid point). The green and blue boxes correspond to the averaging areas over the tropical North Atlantic and western North Africa, respectively.
4.1 Features of the extreme trans-Atlantic dust event of June 2015
Figure 3 shows the daily mean AOD averaged between MODIS and VIIRS from 11 to 25 June 2015. The extreme dust event began around 12 June, and on 12–13 June, AOD reached the 95th percentile over the western Guinea coast. On 14 June, AOD exceeded 2.0 over the borders of Mauritania, Mali, and Senegal (Fig. 3b–d). The plume was then rapidly advected out of the source region and into the tropical North Atlantic on 15 June. AOD over the west coast of North Africa and tropical North Atlantic reached 4.95 (Fig. 3e). During its westward transport, large portions of the plume showed AOD values above the 95th percentile during JJA from 2003–2022 and above the 99th percentile in certain regions over the tropical North Atlantic (Fig. S2). The dust plume arrived at the Caribbean Sea around 17 June (Fig. 3g) and passed through the region and began to split around 21 June (Fig. 3k). The northern branch of the plume was advected northward and dispersed across the Gulf region and the southern central and eastern US, while the southern branch of the plume traveled across the Guatemala Basin to the eastern tropical Pacific Ocean (Fig. 3l–o). The plume was still quite strong even after it passed over the Pacific, with daily AOD values exceeding the 99th percentile (Fig. S2m–o). Previous studies found that the westward movement of African dust in summer can reach as far as 100° W (e.g., Vuolo et al., 2009; Adams et al., 2012). In this extreme event, the African dust plume traveled as far as 120° W and beyond (Fig. 3l–o).
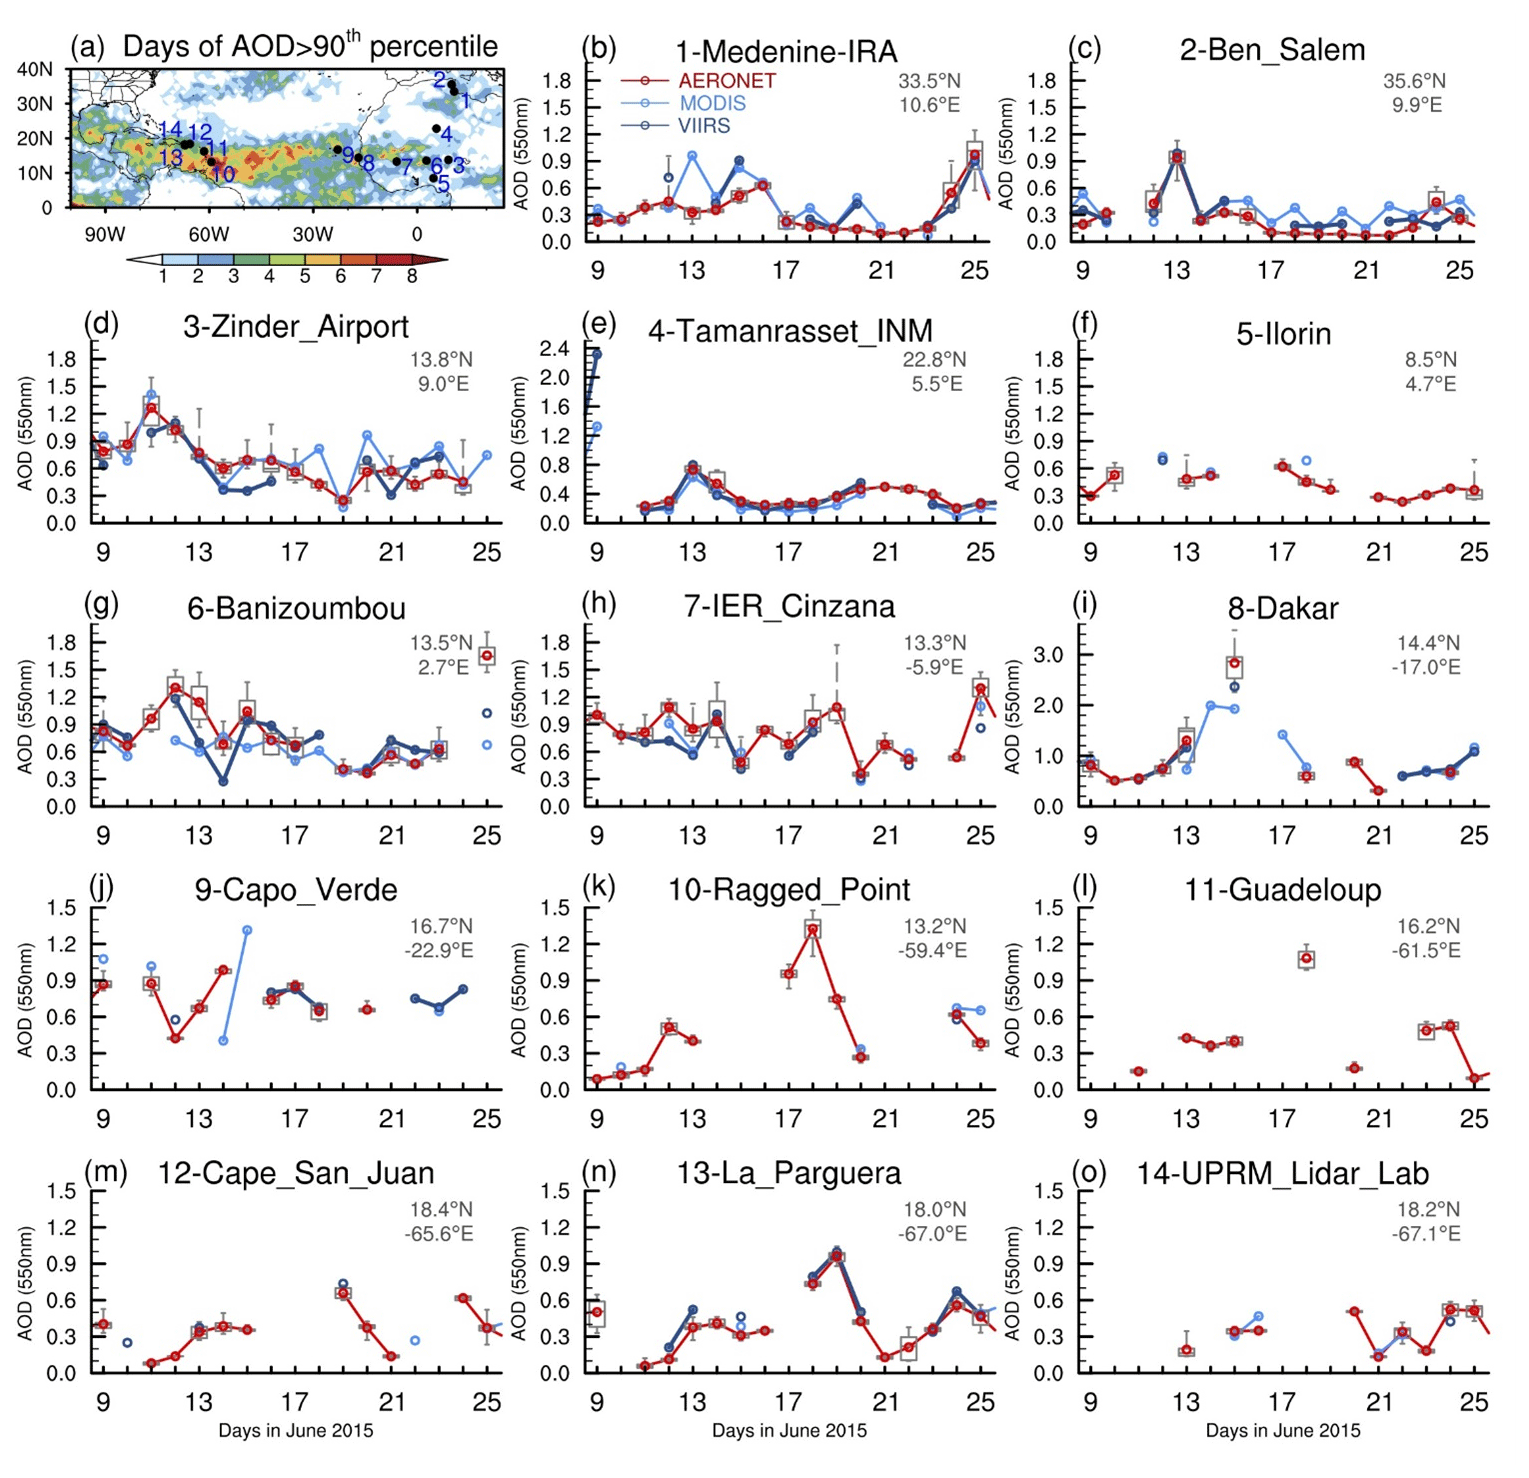
Figure 4(a) Number of days when daily MODIS AOD exceeded the 90th percentile of daily values for JJA (2003–2022) from 12–24 June 2015. The locations of 14 AERONET stations are shown in black. (b–o) Daily AOD values from AERONET (red), MODIS (light blue), and VIIRS (dark blue) from 9–25 June 2015. Subdaily values of AERONET AOD are shown in the grey box, with the upper, lower, and middle bars showing the 25th and 75th percentiles and the median of the data. The whiskers extend from the minimum to the maximum. The red circles denote the daily mean of AERONET AOD values. The latitude and longitude of each AERONET site is shown in the top-right corner of each panel.
Figure 4a shows the number of days during this event when MODIS AOD exceeded the 90th percentile of daily values for JJA from 2003–2022, along with the locations of AERONET stations. Over the tropical North Atlantic, large areas experienced extremely high dust loading for 2–6 d. The evolution of AERONET AOD records (Fig. 4b–o) largely resembles satellite AOD records (Fig. 3). For sites across North Africa, AOD values slightly increased before or around 13 June 2015, with magnitudes mostly below 1.6, consistent with the findings shown in Fig. 1 that indicate that the dust emissions over land were enhanced but not extremely high. Over the coastal region, the daily maximum AOD at the Dakar site reached 3.5 on 15 June (Fig. 4i) as the dust plume propagated towards the ocean (Fig. 2e). MODIS and VIIRS AOD showed a similar peak around 15 June at the Dakar and Capo Verde sites but with a weaker magnitude (Fig. 4i–j). When the dust plume reached the Caribbean Basin, AERONET AOD increased to 1.5 at the Ragged Point site on 18 June and 1.0 at the La Parguera site on 19 June. In comparison to AERONET records from the Godzilla event (Yu et al., 2021), daily mean AOD values were about 0.7 lower over the African coastal region and eastern tropical Atlantic (Dakar site vs. Capo Verde site) and about 0.3–0.8 lower over the Caribbean Basin at the Ragged Point, Guadeloupe, and La Parguera sites.
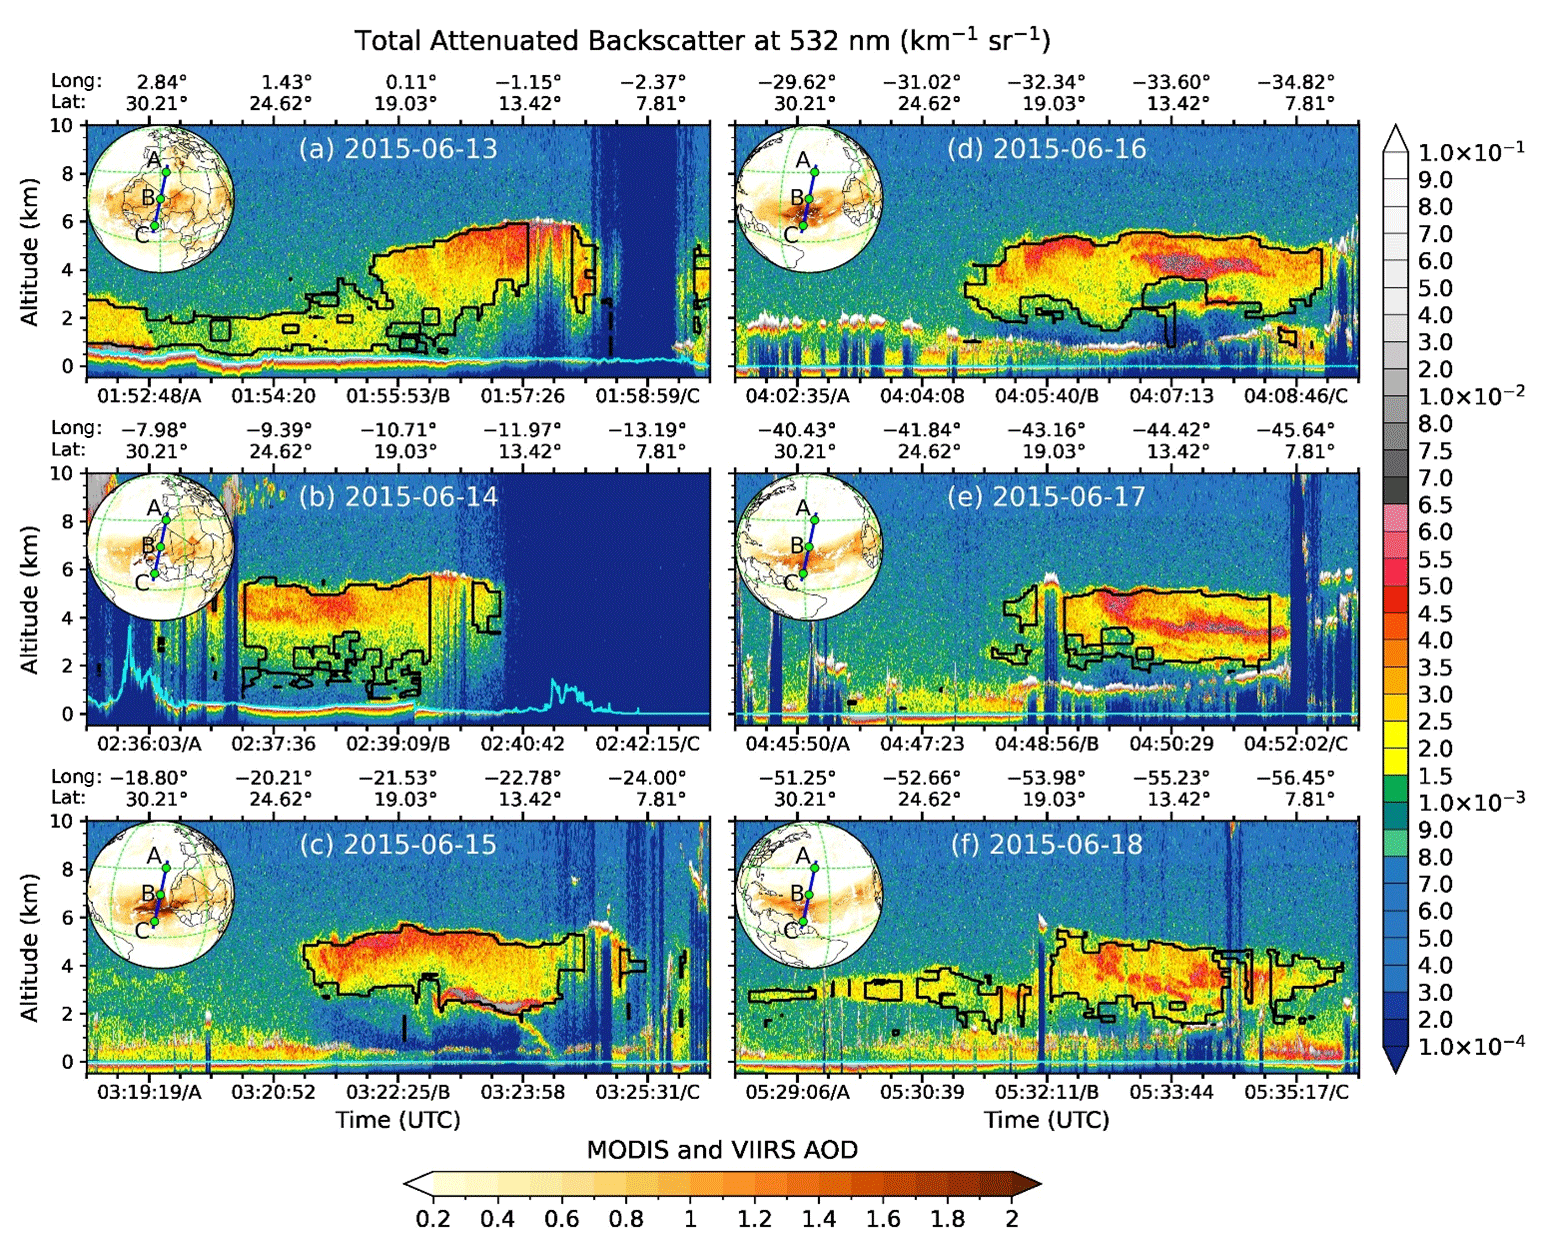
Figure 5532 nm CALIOP-derived total-attenuated-backscatter data (km−1 sr−1) for 13–18 June 2015. The satellite tracks (blue lines) are each displayed in the inset in the upper-left corner of each panel. The sampling points (A–C) correspond to the x axis of the cross section, and the brown shading indicates MODIS–VIIRS-averaged AOD. The black contours denote dust aerosols (depolarization ratio ≥ 0.2). Surface elevation is indicated by the cyan lines.
CALIOP-derived total-attenuated-backscatter data illustrate the vertical profiles of the dust plume (Fig. 5). The plume was more compact and reached a greater vertical extent (from 1.5 to 6 km) at its origin over western North Africa during 13–14 June 2015 (e.g., between sampling points B and C in Fig. 5a and b). The high plume top over the source region is consistent with findings from a previous study by Petit et al. (2005), who suggested that a minimum dust layer altitude of 3 km off the west coast of North Africa is necessary for African dust plumes to fully traverse the Atlantic and reach the Caribbean as dust plumes descend during westward transport. This descent is a balance between the convection in the underlying marine layer and the subsidence of anticyclonic air from the NASH (Petit et al., 2005). As the plume traveled westward over the tropical North Atlantic, it slowly subsided and weakened, consistent with previous studies (Braun, 2010; Adams et al., 2012; Groß et al., 2015; Weinzierl et al., 2017). However, the rate of descent was somewhat slower than 500 m d−1 during the June 2020 event (Yu et al., 2021). By 18 June, the plume over the western tropical North Atlantic was primarily found between 2 and 5 km (Fig. 5f). Due to missing CALIOP data from 19 to 28 June 2015, it is not entirely clear whether the descending rate increased as the plume propagated across the Caribbean Basin.
4.2 Circulation conditions associated with the extreme 2015 dust event
In this section, we will examine the large-scale circulation patterns associated with the westward transport of the extreme African dust plume. Over western North Africa and the eastern North Atlantic, the AEJ centered around 600 hPa plays an important role in transporting African dust westward (Prospero and Carlson, 1981; Jones et al., 2003; Schepanski et al., 2017; Yu et al., 2021), with a stronger jet associated with higher AOD found over the tropical North Atlantic (Pu and Jin, 2021). Figure 6 shows anomalies in the 3 d averages of zonal wind speed at 600 hPa from around the onset of the event (11–13 June 2015) to the time when the dust plume reached the Caribbean Basin (17–19 June 2015). The black contour indicates the climatological location of the jet, and the hatched area denotes regions where zonal wind speed is above the 95th percentile for June from 1979–2022 in the ERA5 reanalysis. From 11–13 June, the easterly wind anomalies were located between 0 and 17° N over the jet core region and the Guinea coast. The jet continued to intensify from 14–19 June, advecting the dust plume westward to the central tropical North Atlantic (Fig. 6b and c). The magnitude of the AEJ right before and at the beginning of the event (11–16 June) was 16.8 m s−1, which makes it the fourth strongest for that week from 1979 to 2022 (Fig. S3a), greatly favoring the export and westward transport of African dust.
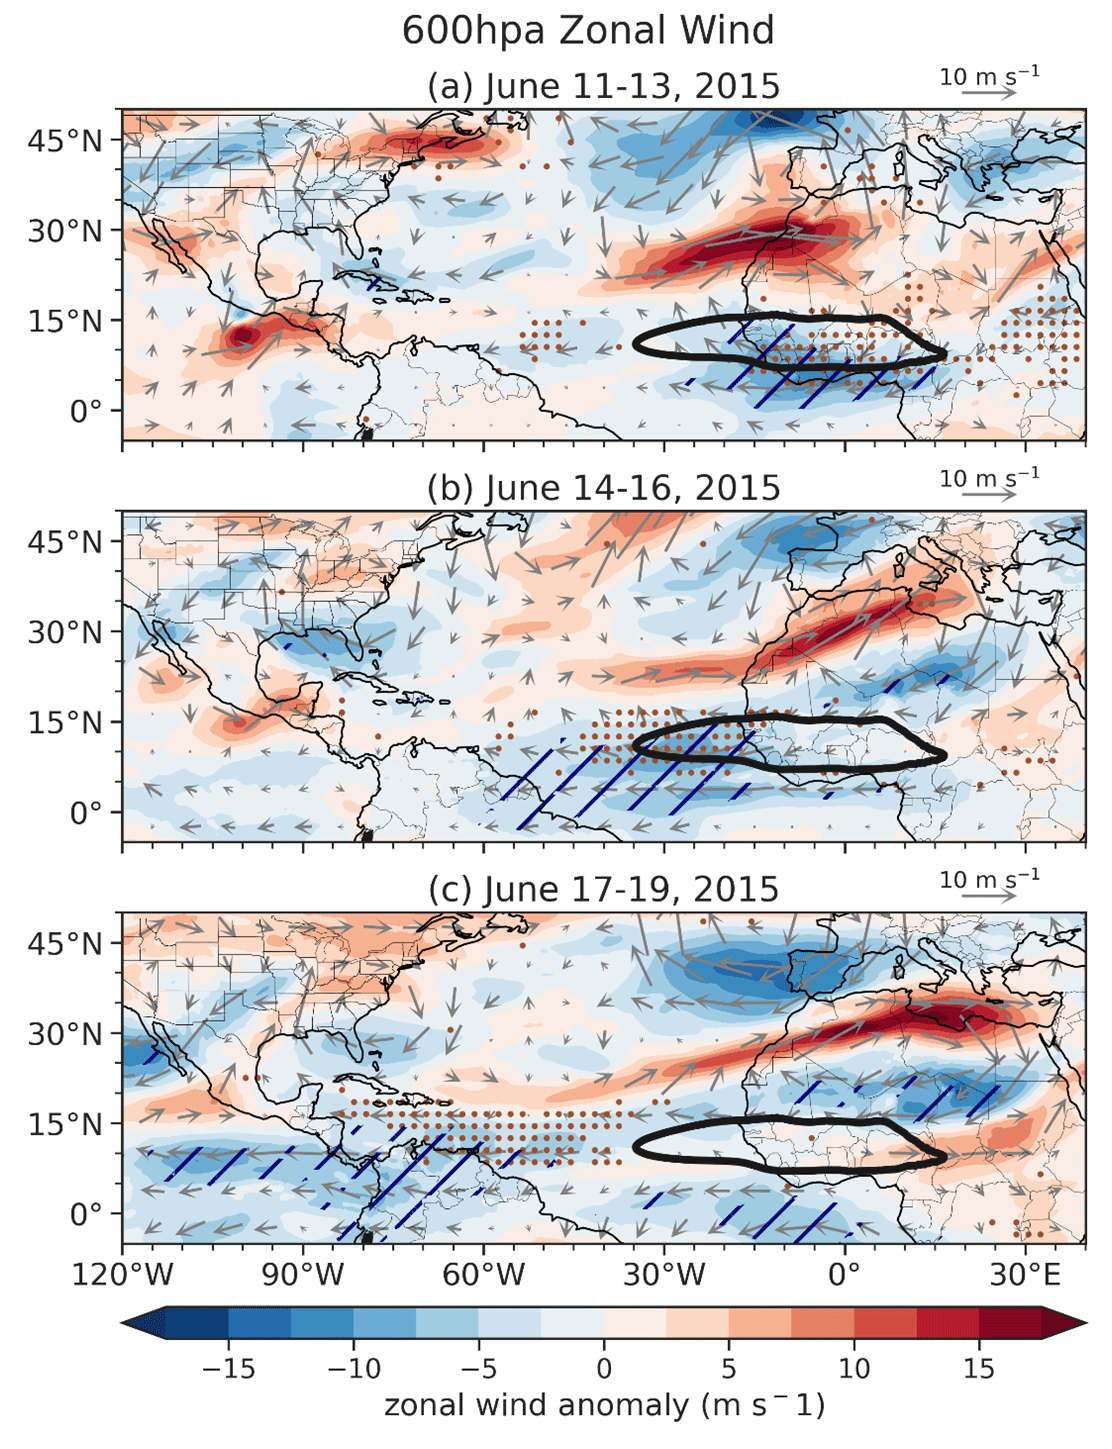
Figure 6Anomalies in the 3 d mean of 600 hPa winds (vectors; m s−1) and zonal wind speed (shading; m s−1) from 11 to 19 June 2015 with reference to the June climatology from 1979–2022. Black contours show the climatological location of the African easterly jet (AEJ), denoted by a zonal wind speed of −11 m s−1. Hatches represent regions where easterly wind speeds exceed the 95th percentile (with reference to the absolute magnitude of the 3 d mean of zonal wind speed for June from 1979 to 2022 at each grid point). Dots represent regions where MODIS AOD exceeds the 95th percentile (with reference to daily AOD for JJA from 2003 to 2022 at each grid point) and exceeds 0.6.
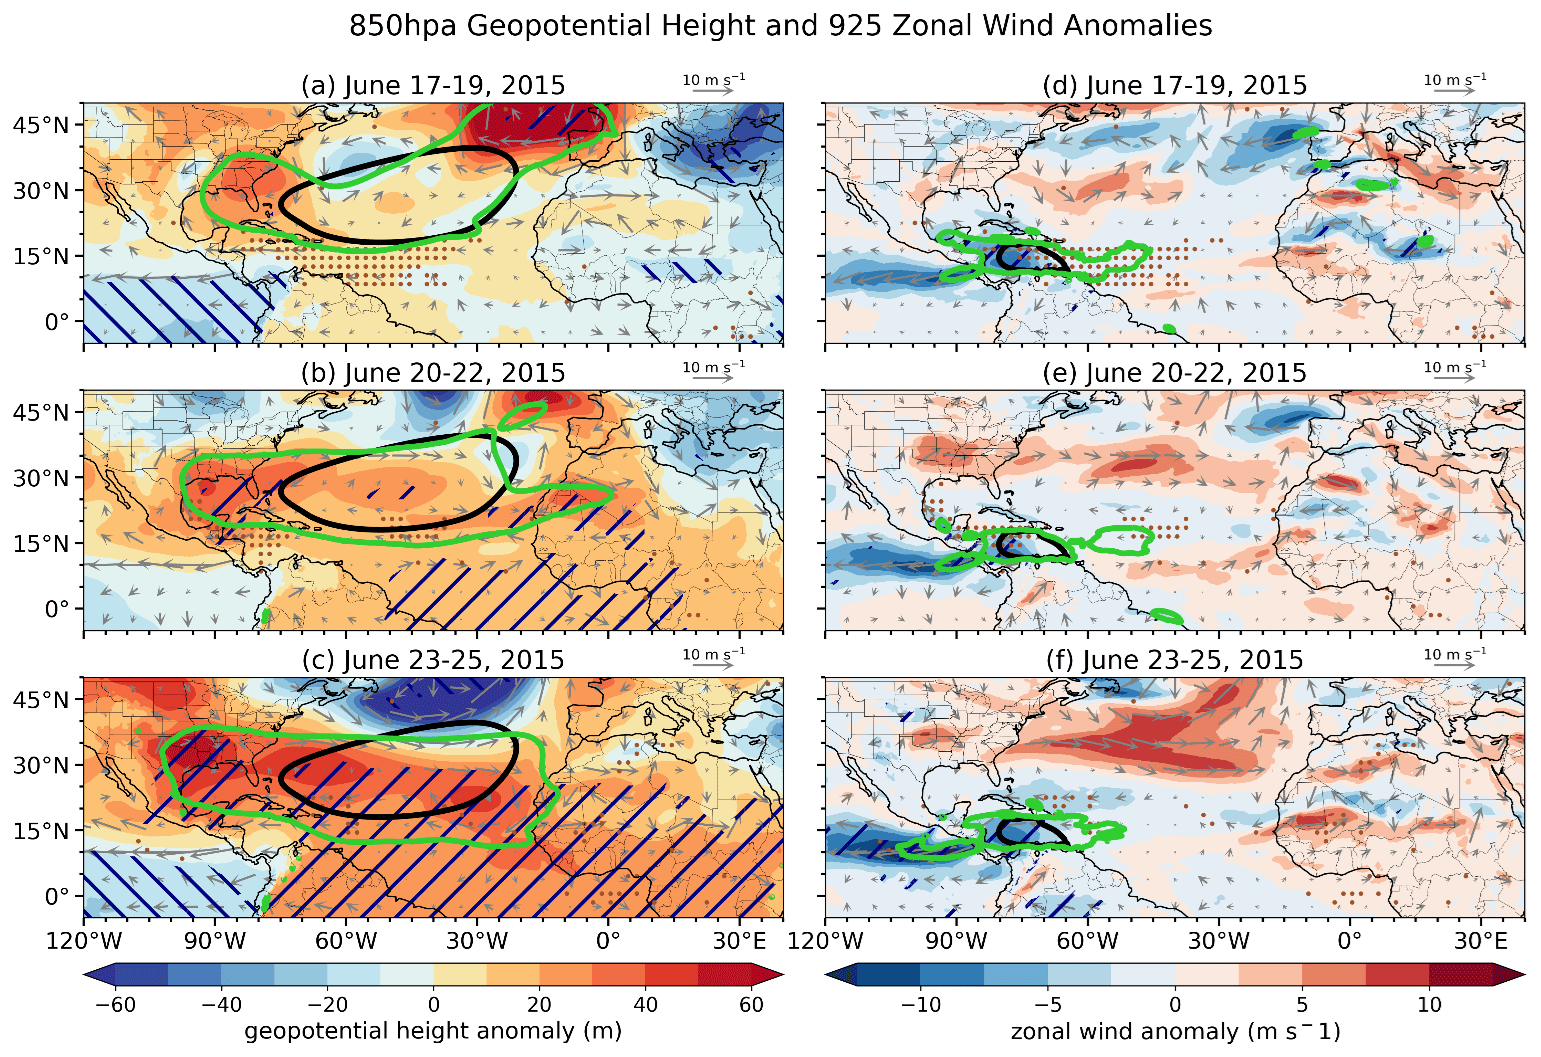
Figure 7(a–c) Anomalies in the 3 d mean of 850 hPa geopotential height (shading; gpm) and winds (vectors; m s−1) with reference to the June climatology from 1979–2022. Black contours show the climatological location of the North Atlantic subtropical high (NASH), denoted by the 1560 gpm contour (following Li et al., 2011), and green contours mark the 3 d mean location of the NASH. Hatches represent the highest (≥ 95th; backward) and lowest (≤ 5th; forward) percentiles of geopotential height (with reference to the 3 d mean values for June from 1979–2022 at each grid point). (d–f) Anomalies in the 3 d mean of 925 hPa winds (vector; m s−1) and zonal wind speed (shading; m s−1) with reference to the June climatology from 1979–2022. Black contours show the climatological location of the Caribbean low-level jet (CLLJ), denoted by the zonal wind speed contour of −11 m s−1, and green contours mark the 3 d mean location of the CLLJ. Hatches represent regions where easterly wind speed exceeds the 95th percentile (with reference to the absolute magnitude of 3 d zonal wind for June from 1979–2022 at each grid point). In all panels, dots represent MODIS AOD that exceeds the 95th percentile (with reference to the 3 d mean of AOD for JJA from 2003 to 2022 at each grid point) and exceeds 0.6.
As the dust plume propagated to the central–western tropical North Atlantic, the anticyclonic flow of the NASH further facilitated its westward transport. Figure 7a–c show 3 d averages of the geopotential height and wind anomalies at 850 hPa. The NASH extended westward from its climatological location towards the Gulf of Mexico and the southeastern US from 17 to 25 June 2015. The related easterly and southerly wind anomalies further steered the dust plume towards the continental US. The westward extension of the NASH, along with the reduced height over the tropical eastern Pacific, further increased the meridional pressure gradient over the Caribbean Basin and strengthened the CLLJ at 925 hPa (Fig. 7d–f). In fact, the magnitude of the CLLJ during 17–22 June (18.3 m s−1) was the strongest for that period from 1979 to 2022 in the ERA5 reanalysis (Fig. S3b). The high magnitude of the jet is consistent with the extremely enhanced geopotential heights to the north of the Caribbean Basin and the reduced heights to the south (hatched regions in Fig. 7a–c). The greatly strengthened CLLJ facilitated the westward transport of African dust across the Caribbean Basin. The extreme easterly jet further advected part of the plume into the eastern Pacific, while the remainder of the plume was carried northward to the US by the anticyclonic flow (Fig. 7e–f).
Overall, the circulation patterns observed during the June 2015 event are largely consistent with the findings of Pu and Jin (2021), who showed that the enhanced AEJ and CLLJ, along with the westward extension of the NASH, all contribute to the long-range transport of African dust to the tropical North Atlantic and the Caribbean Basin. The extremely high magnitudes of the AEJ and CLLJ in this event also suggest that circulation extremes played important roles in the formation of high dust loading over the ocean. One unique feature of the June 2015 event was the extremely strong CLLJ that transported a portion of the dust plume to the eastern Pacific, meaning fewer dust particles were advected to the US.
4.3 Anomalous dust emissions
As shown in Fig. 1b, the extreme trans-Atlantic dust event is associated with a 1 d AEE that occurred on 13 June over western North Africa, indicating enhanced dust emissions over source regions at the beginning of the event. To understand the factors that contributed to increased dust emissions, we first examine local surface wind speed, which has long been related to dust emissions in North Africa (e.g., Gillette et al., 1980; Helgren and Prospero, 1987; Engelstaedter and Washington, 2007; Cowie et al., 2015; Evan et al., 2016). Figure 8 shows 3 d averages of 10m surface wind anomalies from 11–16 June 2015 and the ranking of the top five strongest surface wind speeds during these days from 1979–2022 over North Africa. Surface wind speeds are greatly intensified over eastern Mali to the Mali–Algeria border, western Algeria, and southern Egypt to north Sudan (Figs. 8a and b and S1a). In summertime, the magnitude of the surface wind speed ranked the highest or among the top five in active dust source regions in central to eastern Mali (Fig. 8c) and Mauritania (Fig. 8d). High-percentile AOD (grey dots) is largely located downstream of regions with extreme surface winds.
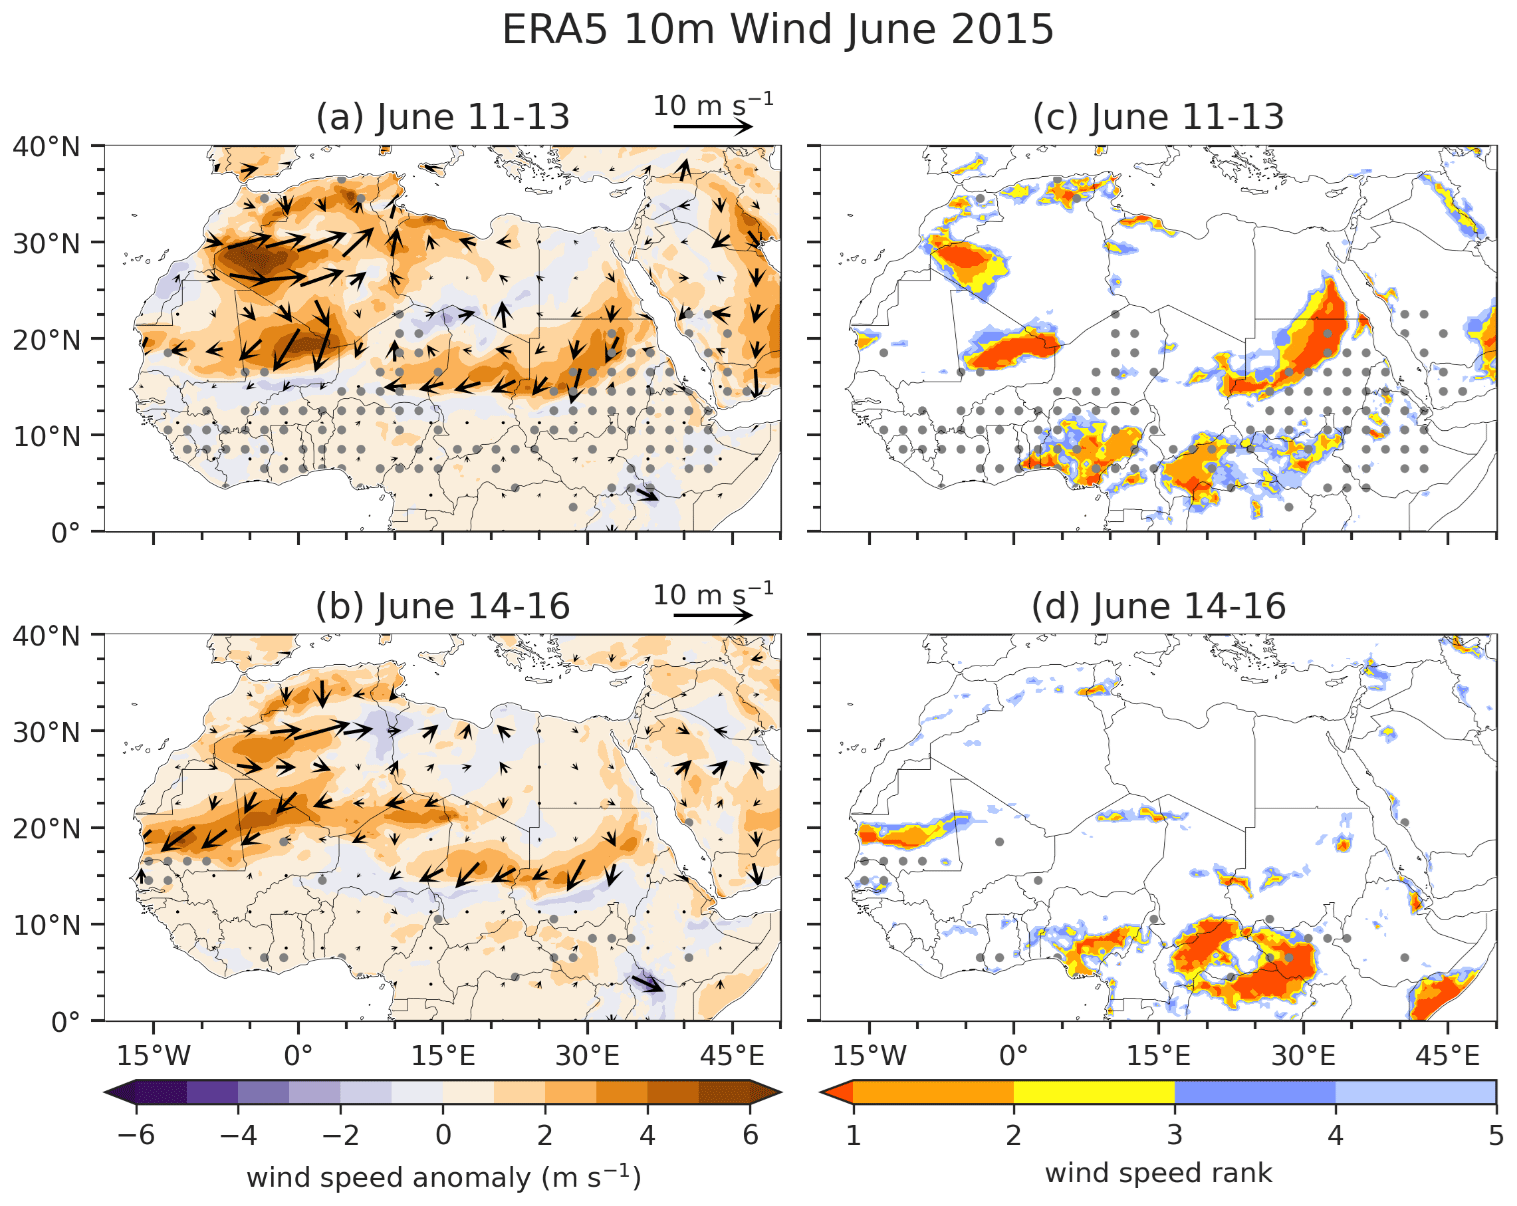
Figure 8(a, b) Anomalies in 10 m winds (vectors; m s−1) and wind speeds (shading; m s−1) averaged over 11–13 and 14–16 June 2015 (with reference to the June climatology from 1979–2022). (c, d) Ranking of daily surface wind speed averaged over 11–13 and 14–16 June 2015, with reference to the corresponding 3 d averages over 1979–2022 (44 years). Only wind speeds ranked 1–5 (i.e., the top five strongest) are shown. Areas where MODIS AOD exceeds the 95th percentile (with reference to the 3 d mean of AOD for JJA from 2003 to 2022 at each grid point) and exceeds 0.6 are marked with grey dots.
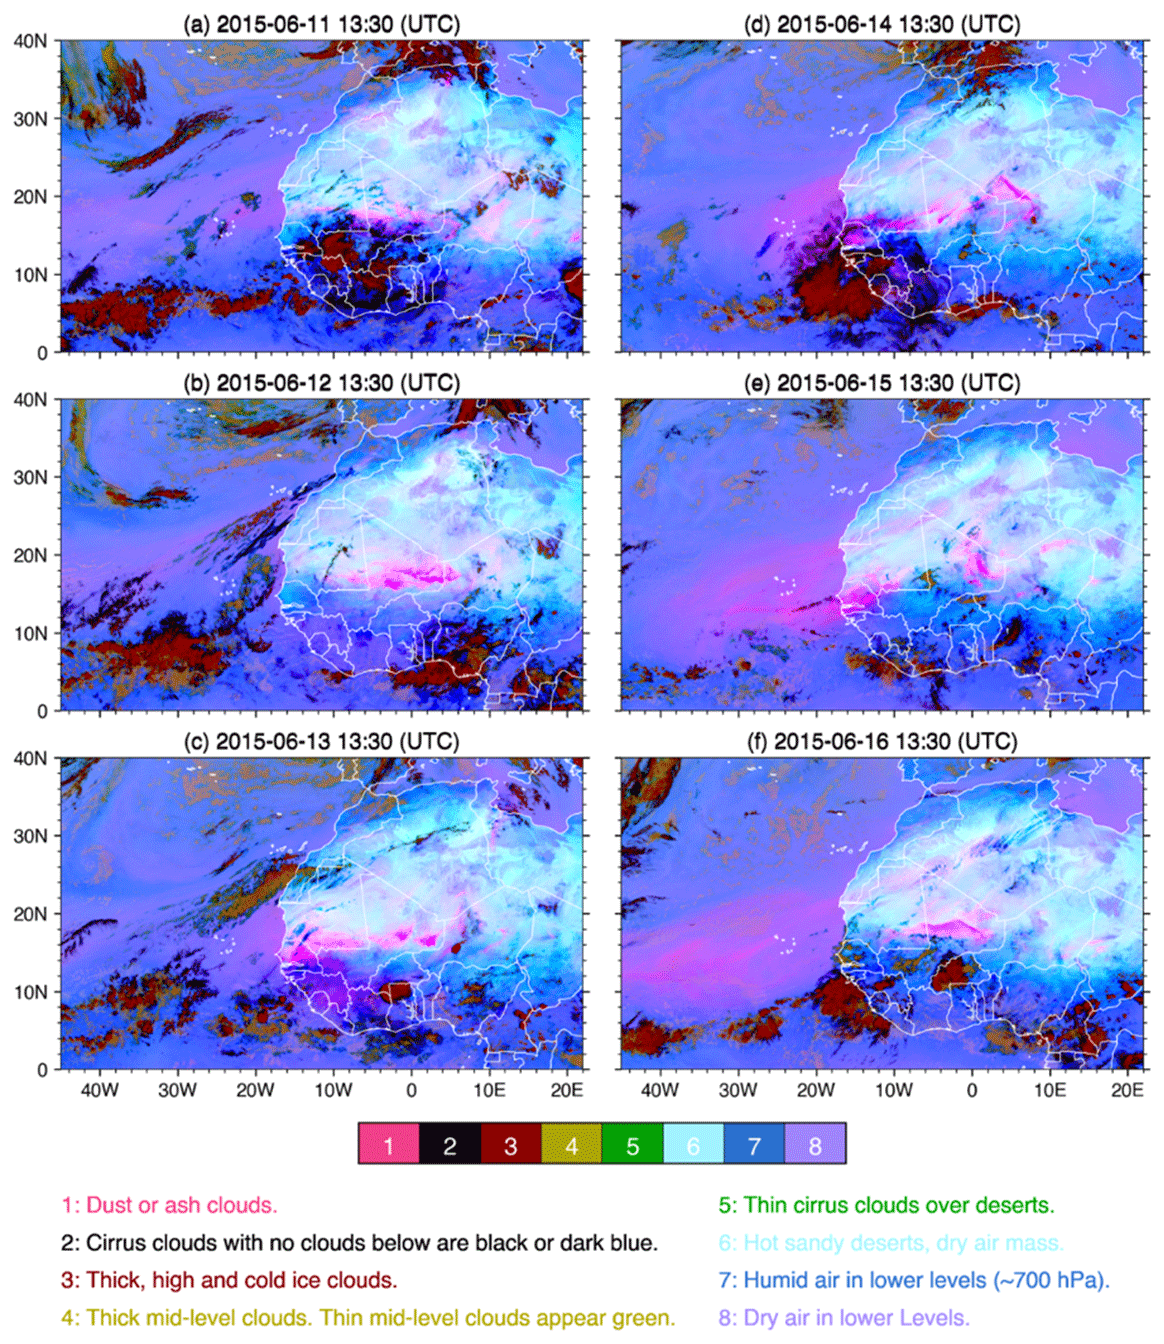
Figure 9(a–f) Dust RGB images from the SEVIRI instrument taken at 13:30 UTC from 11 to 16 June 2015. Dust plumes are denoted by pink shading (color 1), while deep convection is shown in dark red (color 3). Cirrus clouds, mid-level clouds, thin cirrus clouds, hot sandy desert, low-level humid air, and low-level dry air are shown in black, dark gold, green, light cyan, blue, and purple, respectively.
The anomalously strong surface-wind-induced dust emissions are also captured by the SEVIRI dust RGB images (Fig. 9). While the dust emissions in Mali (pink) on 11 June 2015 were likely affected by the outflow of downdrafts generated by mesoscale convective systems (MCSs) over southern to central Mali and Burkina Faso (dark red; Fig. 9a), the enhanced dust emissions over central Mali, the Mali–Algeria–Niger border, and Mauritania during 12–16 June (Fig. 9b–f) are largely collocated with the strong surface wind anomalies (Fig. 8c and d). On 14 June, a coastal MCS also contributed to the enhancement of dust emissions in Mauritania (Fig. 9d).
In addition to increased surface wind speeds, certain land surface conditions, such as dry soil caused by a precipitation deficit and reduced vegetation coverage, also favor dust emissions (Gillette et al., 1980; Engelstaedter et al., 2006; Cowie et al., 2014; Kim et al., 2017; Pu and Ginoux, 2018b). Figure 10 shows 3 d averages of soil moisture anomalies from ERA5 and NDVI anomalies from MODIS across North Africa. Soil moisture decreased over large areas in the Sahara and Sahel. In the southern Sahel, soil moisture anomalies reached −0.1 m3 m−3 (about −40 %), falling below the 5th percentile for June from 2003–2022 (Fig. 10a and b), likely as a result of decreased rainfall (Fig. S4). Note that the precipitation reduction over the tropical North Atlantic (Fig. S4) also helped maintain the high dust loading over the ocean by minimizing the scavenging of fine-dust aerosols over the southern part of the dust plume around 5–10° N. Vegetation decay occurred in nearly all the same areas where soil moisture was greatly reduced, reaching the lower 5th percentile (Fig. 10c and d), and even the lower 1st percentile in some areas (not shown), favoring wind erosion in the region.
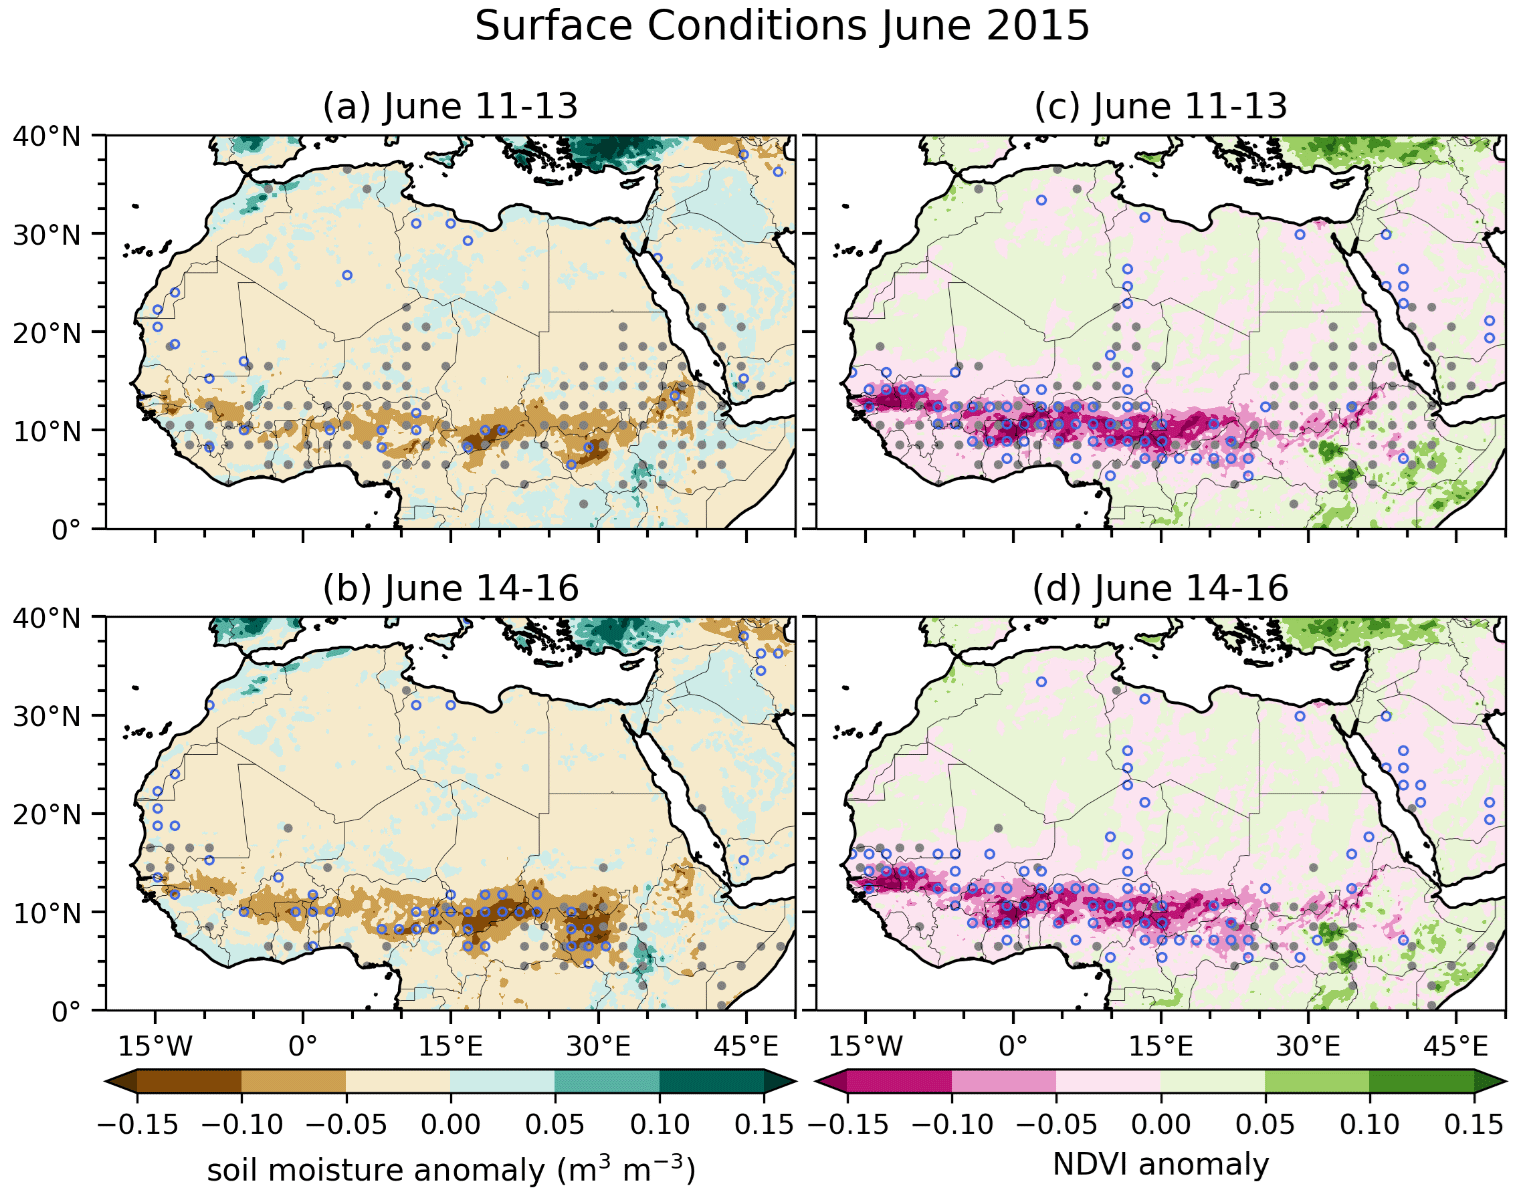
Figure 10(a, b) Anomalies in the ERA5 reanalysis of the first layer (top 7 cm) of the volumetric soil water (m3 m−3), with reference to the June climatology from 1979–2022, averaged over 11–13 June and 14–16 June 2015. Blue circles represent soil water below the 5th percentile (with respect to the 3 d means for June from 2003–2022 at each grid point). (c, d) Anomalies in the MODIS NDVI (with reference to the June climatology from 2003–2022) averaged over 11–13 and 14–16 June 2015. Blue circles represent an NDVI below the 5th percentile (with respect to the 3 d means for JJA from 2003–2022 at each grid point). Grey dots represent regions where MODIS AOD exceeds the 95th percentile (with reference to the 3 d mean of MODIS AOD for JJA from 2003 to 2022 at each grid point) and exceed 0.6.
A multiple-linear-regression model has been used to quantify the relative contributions of land surface variables (i.e., surface wind speed, precipitation, and NDVI) to dust emissions over western North Africa during the Godzilla dust event of June 2020 (Pu and Jin, 2021). Here, we tested the same approach but instead used data on monthly surface wind speeds and top-layer soil moisture from ERA5 and the NDVI from MODIS as explanatory variables. Similar to the findings of Pu and Jin (2021), these variables can capture 64 % of the variations in AOD over western North Africa during June from 2003–2022 and can largely reproduce the spatial pattern of AOD anomalies from the 2020 event (with pattern correlation of 0.86), although AOD magnitude is underestimated. However, we found that the statistical model cannot effectively reproduce the AOD anomalies from the June 2015 event (showing a pattern correlation of 0.21). A few factors may contribute to this discrepancy. The much shorter duration (i.e., 1 d) and weaker magnitude of the extreme dust event over western North Africa during the 2015 event may be harder to capture compared to those of the stronger aerosol extreme event that lasted 6 d during the 2020 event. Mechanisms that affect dust emissions on shorter timescales (e.g., from subhourly to daily timescales) and smaller spatial scales (e.g., gusts generated by downdrafts from mesoscale convective storms) are not included in the multiple-linear-regression model. Nonlinear interactions and feedback among explanatory variables are also not included. In addition, biases in explanatory variables, e.g., surface winds in North Africa that are often underestimated in reanalyses (Largeron et al., 2015), could also affect the results. Fully quantifying the contribution of each influencing factor to the formation of the trans-Atlantic dust event would require modeling studies with sensitivity tests, which is beyond the scope of this study and will be examined in the future.
4.4 Impacts of the extreme 2015 trans-Atlantic dust event
4.4.1 Radiation impacts
The perturbation of the extreme African dust plume that occurred in June 2015 on radiative fluxes at the TOA and the surface is examined using daily clear-sky data from CERES. Figure 11a shows anomalies in the regional mean shortwave (SW) and longwave (LW) fluxes over the eastern tropical North Atlantic (8–25° N, 18–42° W), along with MODIS AOD values for June 2015. At the surface, when regional mean AOD reached a maximum of 1.1 on 16 June, the reduction in SW flux also reached a peak at about −25.5 W m−2, while LW flux exhibited a weak warming anomaly of about 3.5 W m−2, associated with scattered and emitted LW radiation by the warm SAL. Consistent with previous studies (e.g., Tegen et al., 1996), changes in radiative fluxes at the TOA were much smaller than those at the surface, with LW warming amounting to about 1.0 W m−2 and SW cooling to −3.1 W m−2, although no clear maxima were found when AOD peaked. Both the sign and magnitude are consistent with previous studies on the TOA radiative effects of African dust over the Atlantic (e.g., Yu et al., 2006; Yorks et al., 2009). The SW cooling at the TOA is associated with an increase in reflected solar flux due to the bright dust layer above the dark-ocean surface, while LW warming is often related to the absorption of outgoing LWs by the dust layer, which may also be affected by the moisture content in the atmosphere.
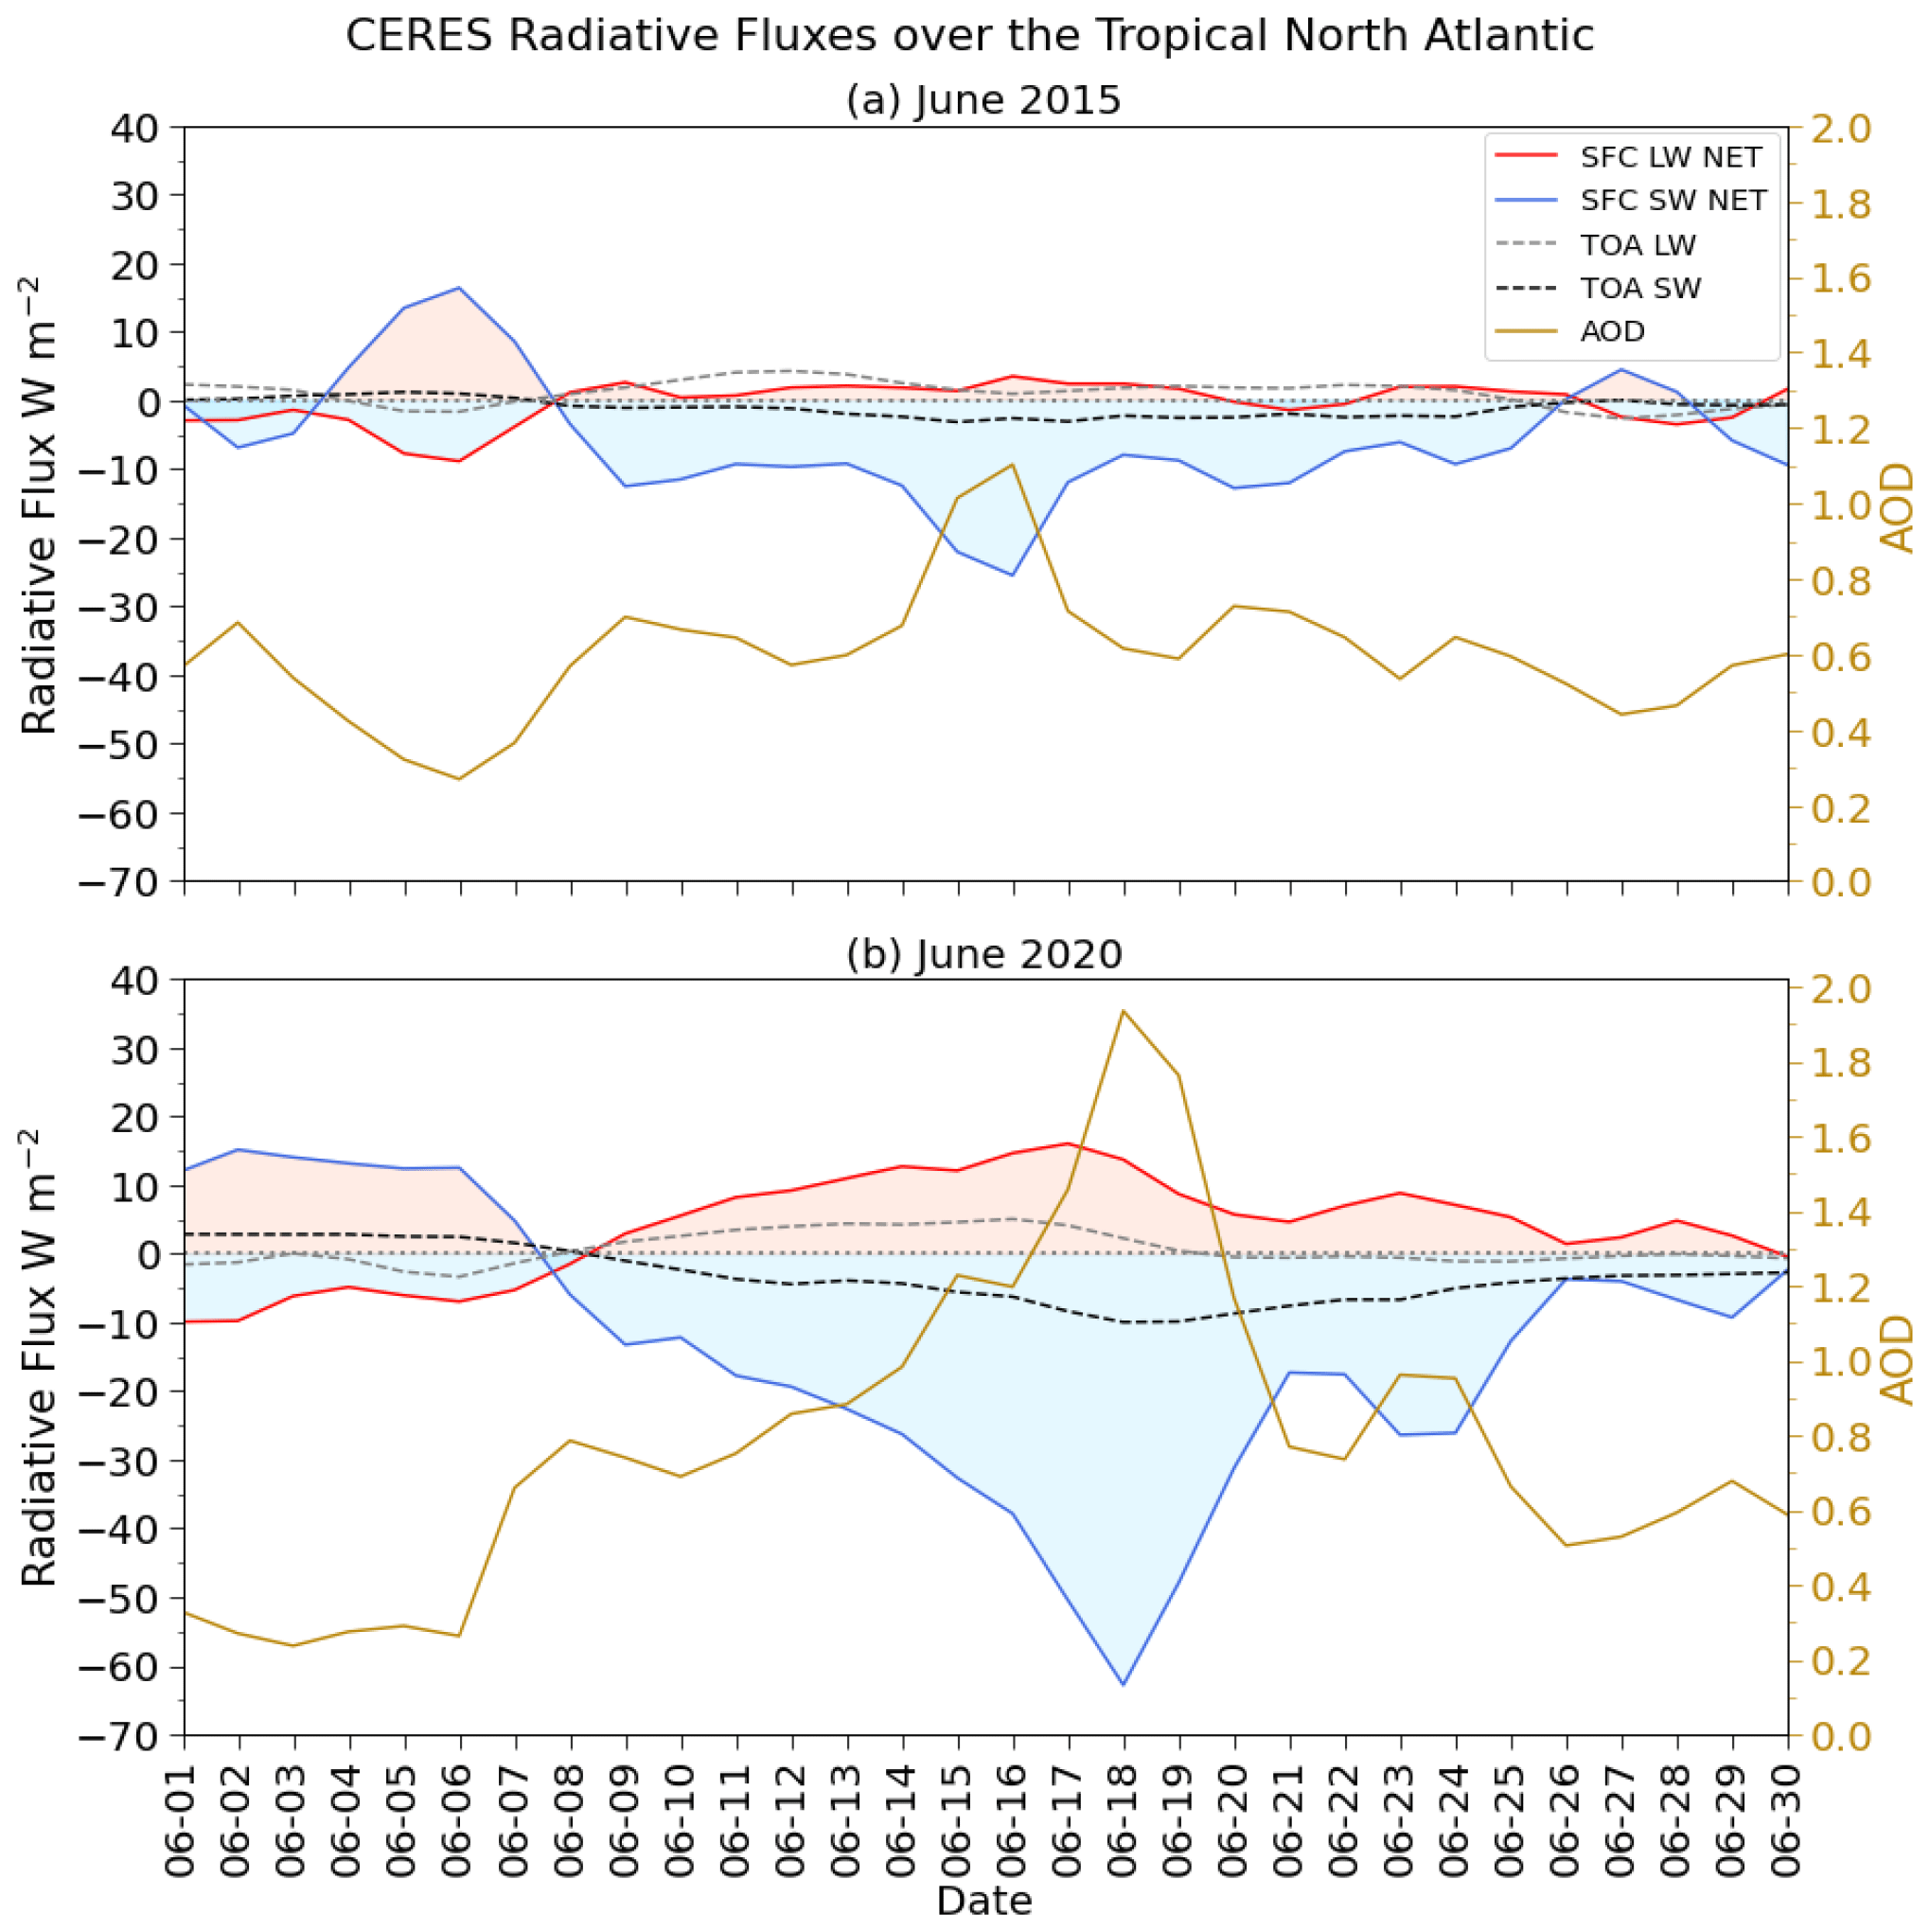
Figure 11Time series of CERES clear-sky radiative fluxes (W m−2) and MODIS AOD values for (a) June 2015 and (b) June 2020, averaged over the eastern tropical North Atlantic between 8–25° N and 18–42° W. Anomalies (with reference to the June climatology from 2003–2022) of net shortwave (SW) and longwave (LW) fluxes at the surface are shown as solid blue lines and solid red lines, respectively. Reflected SW and outgoing LW fluxes at the top of the atmosphere (TOA) are shown as dashed black lines and dashed grey lines, respectively. Positive (negative) values indicate downward (upward) fluxes. Red (blue) shading denotes the warming (cooling) effect at the surface. AOD is shown in gold on the right-hand y axis.
Figure 11b shows the radiative fluxes of the June 2020 event for comparison. With a more intense dust plume and a higher AOD of up to 1.9 on 18 June 2020, surface SW flux reached −62.8 W m−2, more than 2 times the perturbation observed during the June 2015 event. The corresponding surface LW flux perturbation is also about 2 times stronger. Also, unlike during the June 2015 event, the TOA SW flux showed a minimum (−9.9 W m−2) when AOD reached its maximum, while the TOA LW-warming effect peaked a slightly before the AOD maximum. The net surface LW and SW flux values shown here are comparable to the changes in surface radiative fluxes over the eastern Atlantic found by Francis et al. (2022; their Fig. 4).
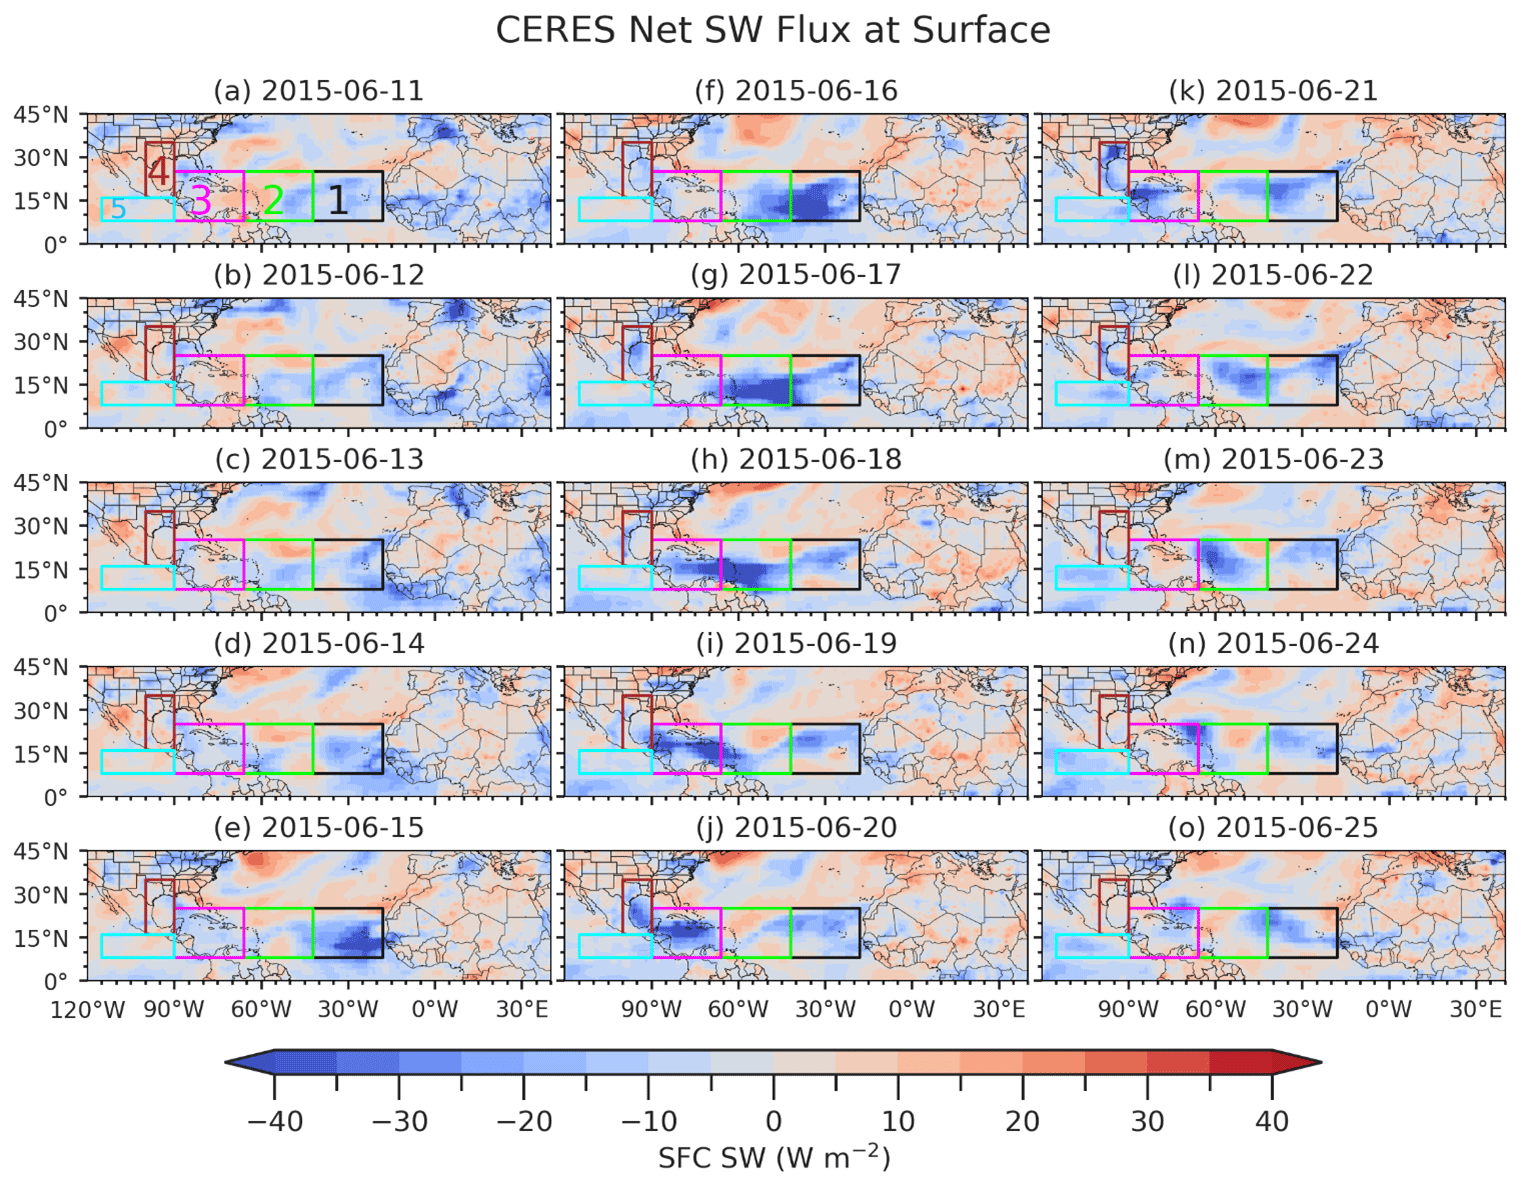
Figure 12Anomalies (with reference to the June climatology from 2003–2022) in CERES clear-sky net shortwave fluxes at the surface (W m−2). Boxes serve as averaging regions for tracking changes in radiative flux caused by the propagation of the African dust plume. Region 1 (black) is located between 8–25° N and 18–42° W, region 2 (green) is located between 8–25° N and 42–66° W, region 3 (magenta) is located between 8–25° N and 66–90° W, region 4 (brown) is located between 16–35° N and 90–100° W, and region 5 (cyan) is located between 8–16° N and 90–115° W.
The spatial pattern of anomalous net surface SW flux during the June 2015 event is shown in Fig. 12. The propagation of the negative anomalies in surface SW fluxes is quite consistent with the westward movement of the dust plume (Fig. 3), as expected; the large reductions occur over the regions where AOD reached the 95th percentile (dotted areas in Fig. 3), with a magnitude reaching −73.6 W m−2 in the eastern tropical Atlantic on 16 June and −56.6 W m−2 over the Caribbean Basin on 21 June. Note that during 21–25 June, the reduction in net surface SW flux extended to the eastern tropical Pacific as the dust plume was advected to the region by the extremely strong CLLJ, with a magnitude of up to −28.4 W m−2.
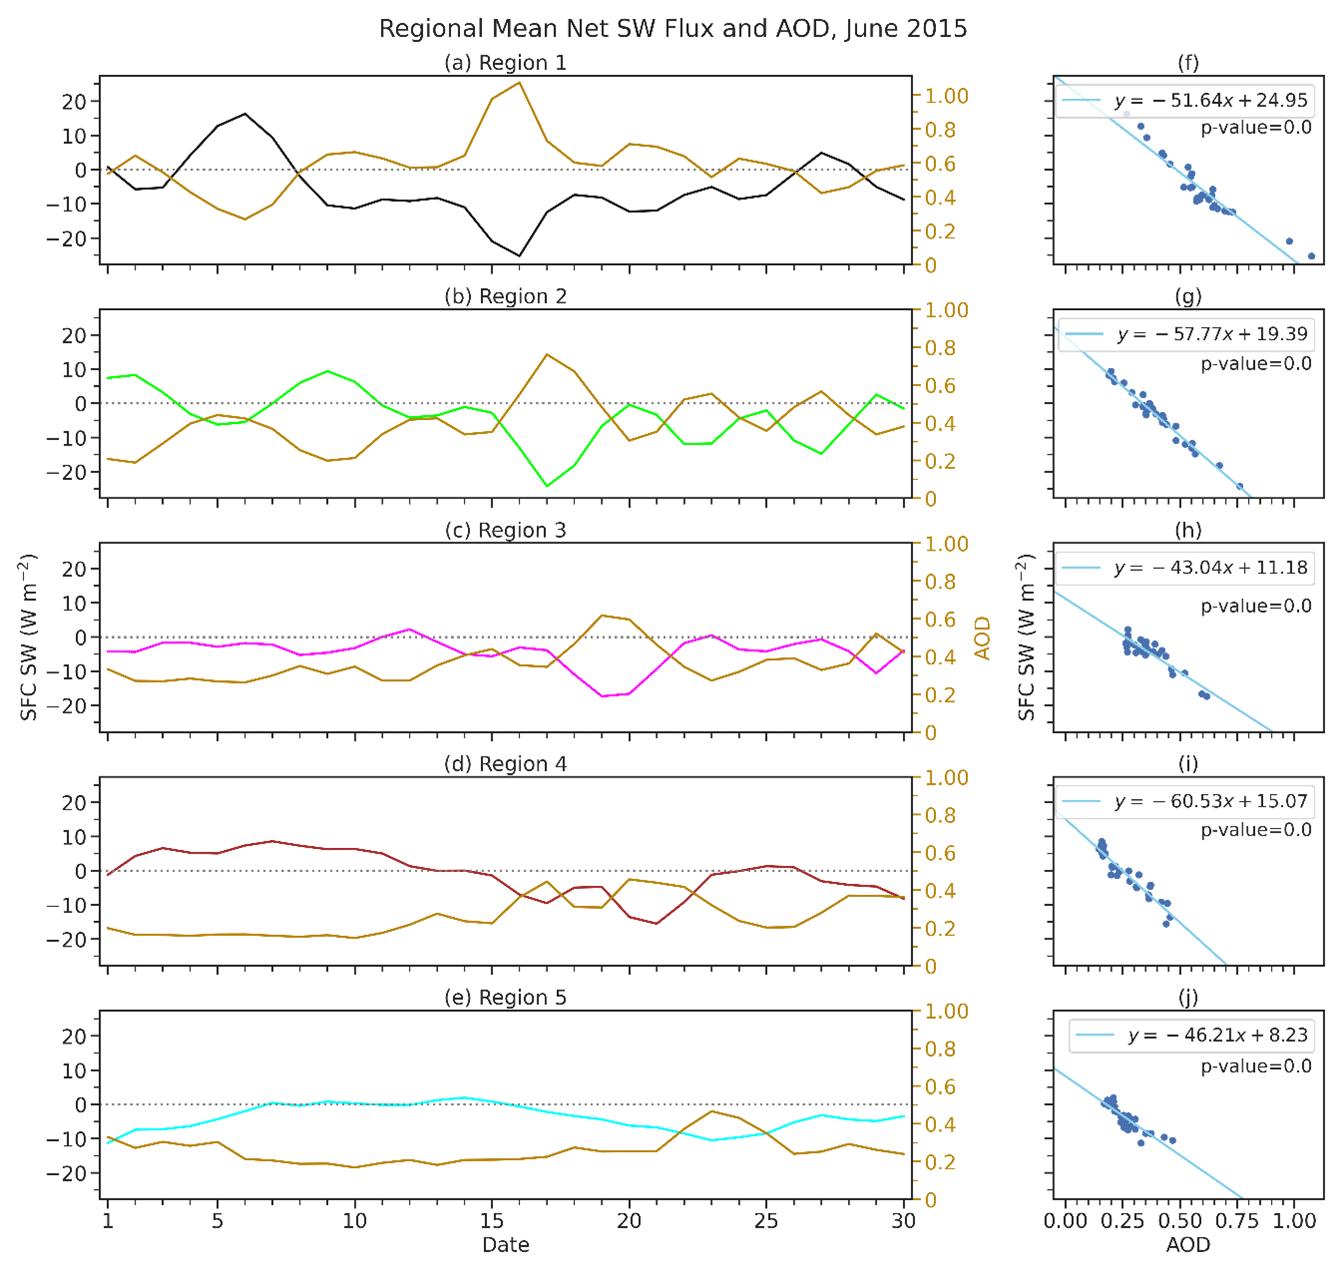
Figure 13(a–e) Anomalies in CERES clear-sky net shortwave flux at the surface (W m−2), with reference to the June climatology from 2003–2022, over the tropical North Atlantic in regions 1–5 (see locations in Fig. 12) for June 2015. The black, green, magenta, brown, and cyan lines represent the regional mean of the net surface shortwave flux from regions 1–5. The gold lines represent regional mean of AOD from regions 1–5. (f–j) Scatterplots illustrating the relationship between the regional mean of MODIS AOD and anomalies in CERES clear-sky net surface shortwave fluxes (W m−2) for regions 1–5.
Figure 13 tracks the magnitude of the net surface SW flux perturbation and its relationship to AOD by calculating regional averages of both variables within three subregions over the tropical North Atlantic (regions 1–3 in Fig. 12a), over the western Gulf of Mexico and the southern central US (region 4), and over the tropical eastern Pacific (region 5). Regions 1–3 show a steady increase in AOD and a decline in anomalies in surface SW fluxes as the dust plume propagated westward (Fig. 13a–c). The previously described division of the dust plume resulted in higher regional AOD and lower SW flux in the Pacific (region 5), while signals were slightly stronger in the western Gulf of Mexico and the southern central US (region 4; Fig. 13d and e). The magnitude of surface SW perturbation is nearly linear with respect to the magnitude of AOD in regions 1–5 (Fig. 13f–j), ranging from about −43.0 ± 7.9 (95 % confidence interval) to −60.5 ± 7.6 W m−2 per AOD value. This is similar to the nearly linear relationship between increased AOD due to dust and perturbed SW fluxes at the TOA over the tropical North Atlantic found by previous studies, e.g., −36.5 ± 4.8 to −49.7 ± 7.1 W m−2 per AOD value (Song et al., 2018). A similar linear relationship between AOD magnitude and net surface SW flux was found for the 2020 case (Fig. S5); in 2020, coefficients were slightly less negative in regions 1 and 2 but slightly more negative in region 3 in comparison with the 2015 event.
The relationship between anomalies in net surface LW fluxes and AOD during the June 2015 event is shown in Fig. S6. A nearly linear relationship between AOD and net LW fluxes was also found over the tropical North Atlantic (regions 1 and 2) but not over the Caribbean Basin (region 3), likely due to interference from other factors affecting surface longwave flux, such as low-level moisture content and sea surface temperature (SST).
4.4.2 Air quality impacts
The air quality impacts of the 2015 trans-Atlantic dust plume seem to be minor in the United States. Figure 14 shows the daily PM2.5 concentration and the Air Quality Index (AQI) from 20 to 25 June 2015. PM2.5 concentrations increased as the dust plume arrived in the Gulf states around 21 June, propagated northward to the central US and the southern Midwest states on 23 June, and eventually decreased around 25 June (Fig. 14b–f). While PM2.5 measurements are well within the US Environmental Protection Agency (EPA) standard of 35 µg m−3, some sites across Texas, Oklahoma, Kansas, Louisiana, Mississippi, Alabama, Georgia, Tennessee, and West Virginia recorded PM2.5 concentrations exceeding the World Health Organization (WHO) air quality guidelines of 25 µg m−3 (2005 standard) during the event, with the strongest impacts on 23 June (Fig. 14d). Even more states reached the latest WHO guideline of 15 µg m−3 (2021 standard), likely indicating the impacts of other aerosols (e.g., local anthropogenic emissions). Chen et al. (2018) also identified four sites in Texas that reported daily maximum PM2.5 concentrations above 36.3 µg m−3 due to the long-range transport of African dust from 21–23 June 2015.
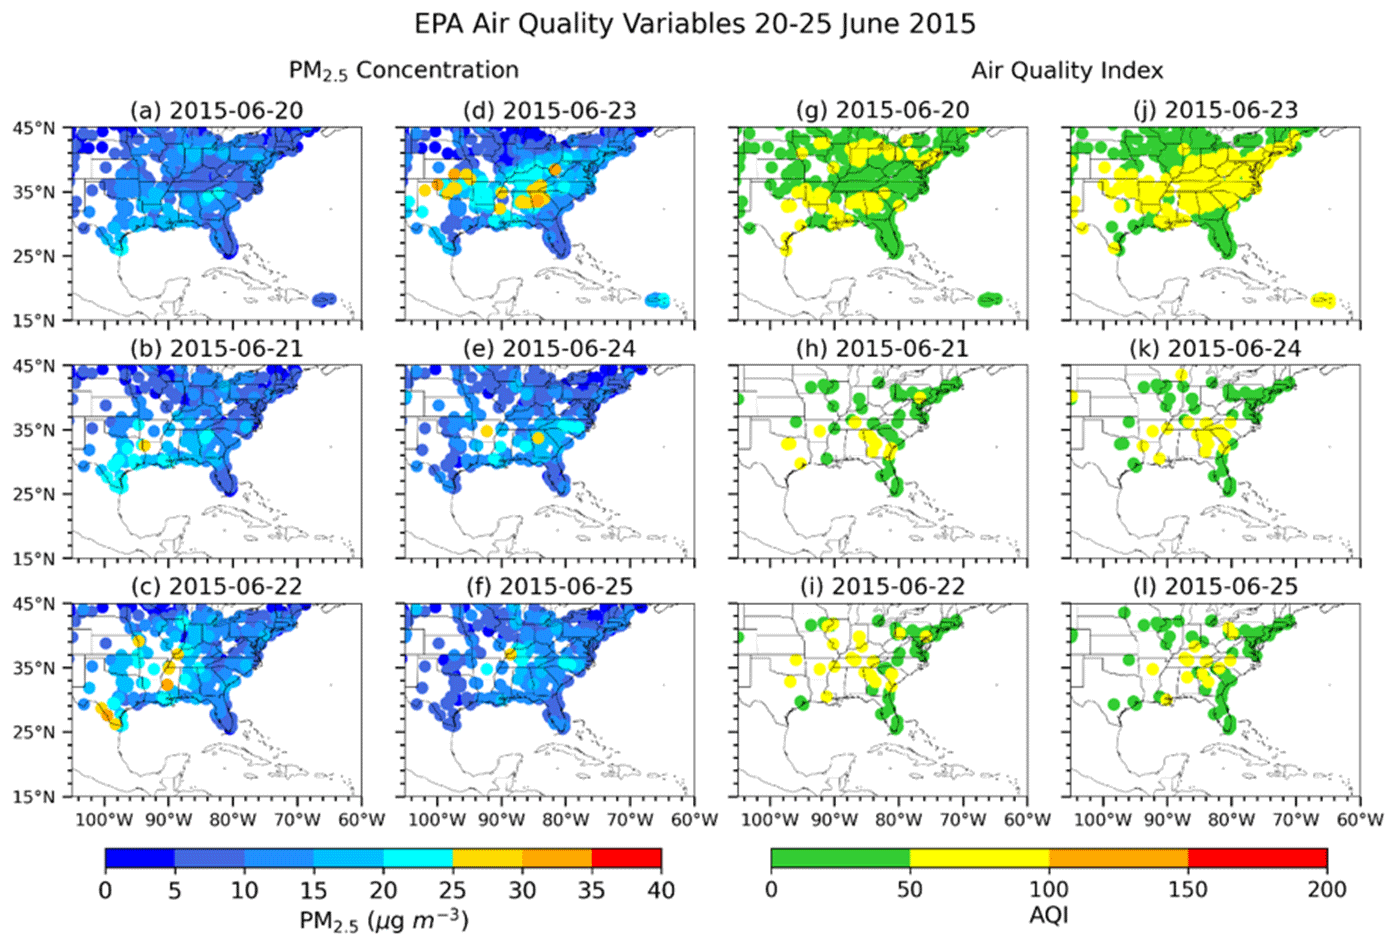
Figure 14(a–f) Daily PM2.5 concentrations (µg m−3) and (g–l) the Air Quality Index (AQI) from the EPA Air Quality System (AQS) stations for the period 20 to 25 June 2015. AQI values of 0–50 indicate good air quality (green), values of 51–100 indicate moderate conditions (yellow), values of 101–150 indicate unhealthy conditions for sensitive groups (orange), and values of 151–200 indicate unhealthy conditions (red).
The AQI tells a similar story, with all daily ratings falling within the “good” (green) to “moderate” (yellow) range (Fig. 14g–l). The relatively weak perturbation of the African dust plume in the AQI and PM2.5 records for the June 2015 event is associated with the extremely strong CLLJ that occurred from 17–25 June and dispersed part of the plume to the eastern Pacific, which greatly reduced the amount of dust reaching the continental US. This suggests that the air quality impacts of African dust in the US are sensitive to local circulations, such as the CLLJ, and to the amount of transported dust over the tropical North Atlantic.
4.5 Comparison to the extreme 2020 trans-Atlantic dust event
In this section, we further compare the June 2015 event with the extreme Godzilla dust event of June 2020. The evolution of both events was quite similar. The extremely high AOD over the tropical North Atlantic was preceded by a great intensification of the AEJ 2 to 4 d earlier, while the enhancement of the CLLJ and the increase in AOD over the Caribbean Basin were almost concurrent (Fig. S7). Note that in both cases, the AEJ increased again after the extreme trans-Atlantic dust events we focused on, e.g., around 21–23 June 2015 and 24–28 June 2020, which is consistent with the formation of another trans-Atlantic African dust plume (Fig. 3; Fig. 1 in Pu and Jin, 2021).
Table 1The features and impacts of the extreme trans-Atlantic dust events that occurred in June 2015 and June 2020. The magnitude and duration (in parentheses) of the AEEs over both the tropical North Atlantic (TNA; green box in Fig. 1a) and western North Africa (WNA; blue box in Fig. 1a) are listed. The corresponding regional means of DOD from MERRA-2 for the same periods are shown in square brackets. The peak perturbations of the shortwave (SW) and longwave (LW) radiative fluxes at the surface (sfc) and top of the atmosphere (TOA), averaged over the eastern tropical North Atlantic (region 1 in Fig. 12) during the corresponding AEETNA events, are shown. Values are shown as anomalies with reference to the June climatology during 2003–2022. The last two columns show the number of states in the southeastern US (24–40° N, 74–105° W) with PM2.5 concentrations exceeding the EPA guideline of 35 µg m−3 and the number with an AQI exceeding 100 during the peak pollutant days of the two events (i.e., 23 June 2015 and 27 June 2020)
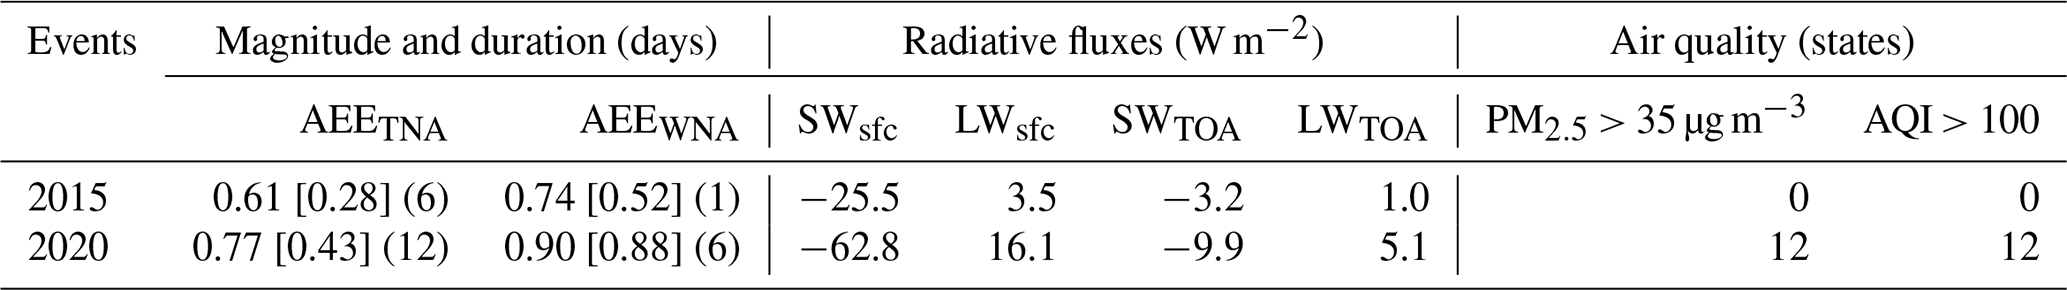
The peak magnitude of the regional mean of MODIS AOD in the tropical North Atlantic was lower in 2015 (0.71) than in 2020 (1.01; Fig. S7a), consistent with the lower peak value of AOD over western North Africa (0.74 vs. 1.02). The peak magnitude of AOD over the Caribbean Basin in the 2015 case is also lower than that in the 2020 case (0.66 vs. 0.96). Additionally, there was a stronger CLLJ in the 2015 event (Fig. S7b), which advected a portion of the dust plume away to the eastern Pacific, leading to much weaker air quality impacts resulting from the 2015 event than from the 2020 event. Table 1 summarizes the magnitude and duration of the AEEs in the two events, along with their radiative and air quality impacts. Consistent with the weaker magnitude and shorter duration of the AEEs in the June 2015 event, the resultant perturbations of radiative fluxes over the eastern tropical Atlantic and the air quality over the southeastern US are weaker in the 2015 event.
Table 2A comparison of land surface and circulation conditions between the extreme trans-Atlantic dust events of June 2015 and June 2020. The surface wind speed (V10 m), NDVI, and soil moisture across the dust source region in western North Africa (blue box in Fig. 1a) are calculated for a 2-week period for each event, i.e., from before the onset of the event to the early stage of the event (3–16 June 2015 and 7–20 June 2020). Values are shown as anomalies, with reference to the June climatology from 2003–2022. The magnitude of the AEJ index for both events is calculated for the entire event period (i.e., 12–23 June 2015 and 14–27 June 2020). The magnitude of the CLLJ index and the regional mean of 850 hPa geopotential height (Z850) across the western NASH (17–35° N, 70–95° W) are calculated for the late stages of each event (17–23 June 2015 and 21–27 June 2020), i.e., when the plume arrived at the western tropical North Atlantic. All circulation variables are shown as anomalies, with reference to the June climatology from 1979–2022 in the ERA5 reanalysis. The percentages of the anomalies relative to the climatological means are shown in parentheses.
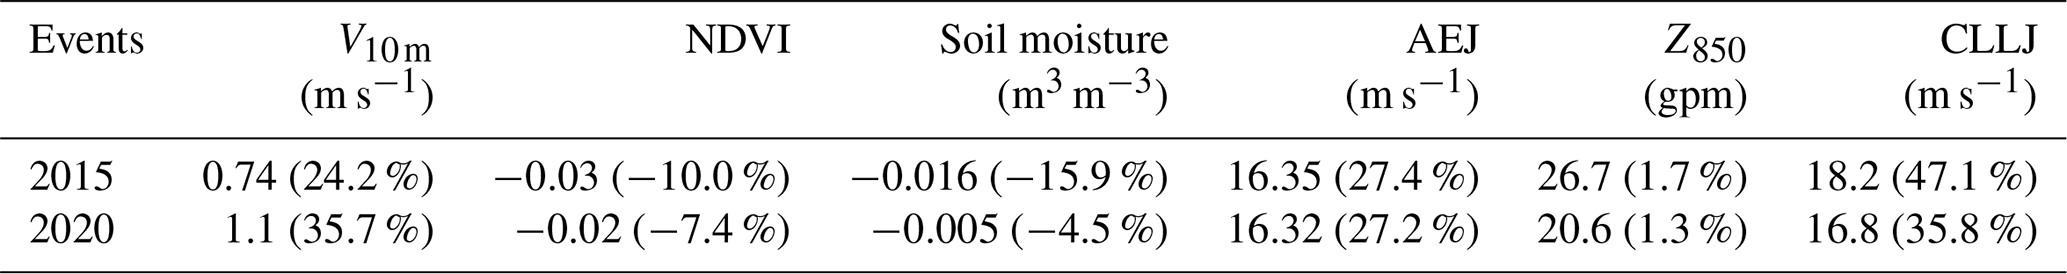
In terms of dust emissions, increased surface wind speeds in dust source regions across western North Africa and favorable land surface conditions, such as soil moisture deficit and vegetation decay in the Sahel, are found in both events (Table 2). However, the magnitude (0.74) and duration (1 d) of AEEs over western North Africa in the 2015 event are much weaker than those pertaining to the 2020 event (0.90 and 6 d, respectively). In fact, the magnitude of African AEEs in the 2015 event is very close to the mean of all summertime AEEs that occurred from 2003–2022 (0.73; Fig. 1d). The relatively moderate AEE in the dust source regions and the disproportionally high dust loading over the tropical North Atlantic (i.e., the second strongest AEE following the 2020 event) suggest the importance of atmospheric circulation conditions that facilitate the westward transport of African dust to the ocean. This includes the extremely intensified AEJ, with a magnitude comparable to that during the 2020 event (Table 2), and the CLLJ, with a greater magnitude than that of the 2020 event; Table 2), along with the intensified and westward-extended NASH.
Several uncertainties are associated with the analysis of the extreme African dust event that occurred in June 2015. We mainly use satellite retrievals, i.e., MODIS and VIIRS, to examine the magnitude of the event. Since the AOD at 550 nm from the polar-orbiting satellites is only available once daily, with areas of missing values due to clouds or retrieval uncertainties, the magnitude of the dust plume may be underestimated as subdaily variations cannot be captured. This is further illustrated by comparing satellite AOD with subdaily AERONET AOD from the event (Fig. 4). The daytime maxima recorded by ground observations were largely missed by MODIS and VIIRS AOD measurements. On the other hand, AERONET records also have drawbacks, such as limited spatial coverage – i.e., there are very few sites across the central to eastern tropical North Atlantic. Thus, combining both datasets provides a better characterization of the event.
We found that the extremely high loading of dust over the tropical North Atlantic is due to a moderate increase in African dust emissions and a strongly enhanced AEJ, NASH, and CLLJ over the tropical North Atlantic and Caribbean Basin that advected African dust westward. While previous modeling studies have shown that African dust aerosols can lead to a higher, northward-displaced, and intensified AEJ as a result of their radiative effects (e.g., Wilcox et al., 2010; Reale et al., 2011; Grogan et al., 2017; Bercos-Hickey et al., 2017, 2020), the extent to which the extreme dust plume may affect circulation patterns and consequently feed back to its westward propagation is not fully clear in our observational study and warrants further examination in the future.
While CERES TOA radiative fluxes are from satellite retrievals, it should be noted that the surface radiative fluxes are from the radiative-transfer model and that the results from this model are sensitive to prescribed aerosol optical properties, assimilated satellite cloud properties, and MODIS AOD. Improved understanding of dust optical properties, such as dust mineralogy from global dust source regions made available by the Earth Surface Mineral Dust Source Investigation (EMIT) mission (Green et al., 2020), will greatly reduce uncertainties related to the radiative effects of extreme trans-Atlantic African dust events and will be explored in future studies.
This research seeks to improve the current understanding of extreme trans-Atlantic dust storms by examining the causes and impacts of the second strongest trans-Atlantic African dust event that occurred in summertime during the 2003–2022 period. The June 2015 event was characterized by a 1 d aerosol extreme event (AEE) over the dust source regions in western North Africa on 13 June and a 6 d AEE over the tropical North Atlantic from 15 to 20 June. The enhanced dust emissions over land are associated with extremely strong surface wind speeds over western North Africa in Mauritania and Mali and soil moisture deficit and vegetation decay in the southern Sahel. The greatly intensified African easterly jet (AEJ) over West Africa and the eastern tropical North Atlantic that occurred from 11–16 June transported a large amount of African dust towards the ocean. From the western tropical North Atlantic to the Gulf of Mexico, the westward extension of the North Atlantic subtropical high (NASH) further advected the dust plume westward. The increased meridional height gradient over the Caribbean Basin resulted in an extremely enhanced Caribbean low-level jet (CLLJ) that further transported the dust plume westward. The anomalously strong easterly jet diverted a portion of the dust plume westward to the eastern tropical Pacific, while the anticyclonic flow of the NASH steered the rest of the plume towards the southern US.
The dense dust plume reduced the regional mean of the net surface shortwave flux by about 25.5 W m−2 (17.3 W m−2) and increased the net surface longwave flux by about 3.5 W m−2 (3.1 W m−2) over the tropical eastern Atlantic (the Caribbean Basin). Over the tropical eastern Pacific (8–16° N, 90–115° W), a reduction in the regional mean of the net surface shortwave flux of 10.5 W m−2 and an increase in the longwave flux of 5.6 W m−2 are also found as the dust plume was transported to the region by the extremely strong CLLJ. The arrival of the African dust plume increased PM2.5 concentrations over the southern US from 21–25 June. The pollution was strongest on 23 June, when daily PM2.5 concentrations at certain sites across Texas, Oklahoma, Kansas, Mississippi, Alabama, Georgia, Tennessee, and West Virginia exceeded 25 µg m−3. However, none of the sites recorded a daily mean above the EPA guideline of 35 µg m−3. The Air Quality Index (AQI) never exceeded 100 but was elevated to 51–100 or a “moderate” level for many states. The overall air quality impacts are not particularly dangerous, likely due to the strengthened CLLJ that deflected part of the African dust plume into the Pacific, resulting in lower dust loading in the southern US.
Similar to the Godzilla dust event of June 2020, i.e., the strongest trans-Atlantic African dust event to have occurred in JJA since 2003, circulation extremes also played important roles in the formation of the extreme 2015 trans-Atlantic dust event. Although the magnitude and duration of the dust emissions from the 2015 event are much weaker than those from the 2020 event (i.e., a 1 d AEE with a magnitude close to the long-term means of the summertime AEEs), the extremely intensified AEJ (the fourth strongest for 11–16 June from 1979–2022) and CLLJ (the strongest for 17–22 June from 1979–2022), along with the enhanced and westward-extended NASH (geopotential height reached 95th percentile in June over 1979–2022), collectively facilitated the westward transport of African dust to the ocean, resulting in disproportionally high dust loading over the tropical North Atlantic (the second strongest during summer since 2003). Understanding the mechanisms and impacts of extreme trans-Atlantic African dust events, such as those that occurred in 2015 and 2020, is crucial for predicting similar extreme dust events and mitigating their negative effects on weather, climate, air quality, and human health. This analysis reveals the importance of atmospheric circulation features over the tropical North Atlantic and the Caribbean Basin, like the NASH, AEJ, and CLLJ, in influencing the westward transportation and dispersion of African dust plumes and how these factors change the impacts of extreme dust events.
Analysis codes can be provided upon request from the corresponding authors.
Hourly and monthly ERA5 data at single levels and at various pressure levels can be downloaded from https://doi.org/10.24381/cds.bd0915c6 (Hersbach et al., 2023a), https://doi.org/10.24381/cds.6860a573 (Hersbach et al., 2023b), https://doi.org/10.24381/cds.adbb2d47 (Hersbach et al., 2023c), and https://doi.org/10.24381/cds.f17050d7 (Hersbach et al., 2023d). MERRA-2 DOD data can be downloaded from https://doi.org/10.5067/KLICLTZ8EM9D (GMAO, 2015). MODIS AOD data can be obtained from https://doi.org/10.5067/MODIS/MOD04_L2.061 (Levy et al., 2015a), https://doi.org/10.5067/MODIS/MYD04_L2.061 (Levy et al., 2015b), https://doi.org/10.5067/MODIS/MOD08_D3.061 (Platnick et al., 2015a), https://doi.org/10.5067/MODIS/MYD08_D3.061 (Platnick et al., 2015b), https://doi.org/10.5067/MODIS/MOD08_M3.061 (Platnick et al., 2015c), and https://doi.org/10.5067/MODIS/MYD08_M3.061 (Platnick et al., 2015d). IMERG subhourly precipitation data can be downloaded from https://doi.org/10.5067/GPM/IMERG/3B-HH/06 (Huffman et al., 2019). CALIOP lidar data were obtained from the NASA Langley Research Center's Atmospheric Science Data Center at https://doi.org/10.5067/CALIOP/CALIPSO/CAL_LID_L1-Standard-V4-51 (NASA/LARC/SD/ASDC, 2023) and https://doi.org/10.5067/CALIOP/CALIPSO/LID_L2_05KMAPRO-STANDARD-V4-20 (NASA/LARC/SD/ASDC, 2018; Winker et al., 2007). The CERES radiation fluxes were obtained from https://doi.org/10.5067/Terra+Aqua/CERES/SYN1degDay_L3.004A (NASA/LARC/SD/ASDC, 2017a) and https://doi.org/10.5067/TERRA+AQUA/CERES/SYN1DEGMONTH_L3.004A (NASA/LARC/SD/ASDC, 2017b; Doelling et al., 2016). AERONET station data can be acquired from https://aeronet.gsfc.nasa.gov/new_web/data.html (Holben et al. 1998). EPA air quality data can be found at https://www.epa.gov/outdoor-air-quality-data/download-daily-data (US Environmental Protection Agency, 2022), and SEVIRI dust RGB data are available at https://navigator.eumetsat.int/product/EO:EUM:DAT:MSG:HRSEVIRI?query=High%20Rate%20SEVIRI%20Level%201.5%20Image%20Data%20-%20MSG%20-%200%20degree&s=advanced (EUMESAT, 2009; Schepanski et al. 2007).
The supplement related to this article is available online at: https://doi.org/10.5194/acp-24-8625-2024-supplement.
The study was conceived by BP. BH performed the analysis, with guidance and assistance from BP and QJ. BH wrote the paper, with input and edits from BP and QJ.
The contact author has declared that none of the authors has any competing interests.
Publisher’s note: Copernicus Publications remains neutral with regard to jurisdictional claims made in the text, published maps, institutional affiliations, or any other geographical representation in this paper. While Copernicus Publications makes every effort to include appropriate place names, the final responsibility lies with the authors.
We thank David Mechem and Nathaniel Brunsell for their helpful suggestions with respect to this paper. We also thank Jacob Tindan for his assistance with coding in the early stages of the study. The helpful comments from the four anonymous reviewers greatly improved the paper and are sincerely appreciated. We also thank the AERONET program for establishing and maintaining the sun photometer sites used in this study. We are grateful for the satellite data provided by the NASA Langley Research Center's Atmospheric Science Data Center.
This research has been supported by the National Science Foundation (grant no. 2227707).
This paper was edited by Yves Balkanski and reviewed by four anonymous referees.
Ackerman, S. A.: Remote sensing aerosols using satellite infrared observations, J. Geophys. Res.-Atmos., 102, 17069–17079, https://doi.org/10.1029/96JD03066, 1997.
Adams, A. M., Prospero, J. M., and Zhang, C.: CALIPSO-Derived Three-Dimensional Structure of Aerosol over the Atlantic Basin and Adjacent Continents, J. Climate, 25, 6862–6879, https://doi.org/10.1175/JCLI-D-11-00672.1, 2012.
Agutu, N. O., Ndehedehe, C. E., Awange, J. L., Kirimi, F., and Mwaniki, M.: Understanding uncertainty of model-reanalysis soil moisture within Greater Horn of Africa (1982–2014), J. Hydrol., 603, 127169, https://doi.org/10.1016/j.jhydrol.2021.127169, 2021.
Akpinar-Elci, M., Martin, F. E., Behr, J. G., and Diaz, R.: Saharan dust, climate variability, and asthma in Grenada, the Caribbean, Int. J. Biometeorol., 59, 1667–1671, https://doi.org/10.1007/s00484-015-0973-2, 2015.
Ashpole, I. and Washington, R.: An automated dust detection using SEVIRI: A multiyear climatology of summertime dustiness in the central and western Sahara, J. Geophys. Res.-Atmos., 117, D08202, https://doi.org/10.1029/2011JD016845, 2012.
Asutosh, A., Vinoj, V., Murukesh, N., Ramisetty, R., and Mittal, N.: Investigation of June 2020 giant Saharan dust storm using remote sensing observations and model reanalysis, Sci. Rep., 12, 6114, https://doi.org/10.1038/s41598-022-10017-1, 2022.
Banks, J. R., Schepanski, K., Heinold, B., Hünerbein, A., and Brindley, H. E.: The influence of dust optical properties on the colour of simulated MSG-SEVIRI Desert Dust infrared imagery, Atmos. Chem. Phys., 18, 9681–9703, https://doi.org/10.5194/acp-18-9681-2018, 2018.
Banks, J. R., Hünerbein, A., Heinold, B., Brindley, H. E., Deneke, H., and Schepanski, K.: The sensitivity of the colour of dust in MSG-SEVIRI Desert Dust infrared composite imagery to surface and atmospheric conditions, Atmos. Chem. Phys., 19, 6893–6911, https://doi.org/10.5194/acp-19-6893-2019, 2019.
Barkan, J., Kutiel, H., Alpert, P., and Kishcha, P.: Synoptics of dust intrusion days from the African continent into the Atlantic Ocean, J. Geophys. Res.-Atmos., 109, D08201, https://doi.org/10.1029/2003JD004416, 2004.
Beck, H. E., Pan, M., Miralles, D. G., Reichle, R. H., Dorigo, W. A., Hahn, S., Sheffield, J., Karthikeyan, L., Balsamo, G., Parinussa, R. M., van Dijk, A. I. J. M., Du, J., Kimball, J. S., Vergopolan, N., and Wood, E. F.: Evaluation of 18 satellite- and model-based soil moisture products using in situ measurements from 826 sensors, Hydrol. Earth Syst. Sci., 25, 17–40, https://doi.org/10.5194/hess-25-17-2021, 2021.
Bercos-Hickey, E., Nathan, T. R., and Chen, S.-H.: Saharan dust and the African easterly jet–African easterly wave system: Structure, location and energetics, Q. J. Roy. Meteor. Soc., 143, 2797–2808, https://doi.org/10.1002/qj.3128, 2017.
Bercos-Hickey, E., Nathan, T. R., and Chen, S.-H.: On the Relationship between the African Easterly Jet, Saharan Mineral Dust Aerosols, and West African Precipitation, J. Climate, 33, 3533–3546, https://doi.org/10.1175/JCLI-D-18-0661.1, 2020.
Bozlaker, A., Prospero, J. M., Price, J., and Chellam, S.: Identifying and Quantifying the Impacts of Advected North African Dust on the Concentration and Composition of Airborne Fine Particulate Matter in Houston and Galveston, Texas, J. Geophys. Res.-Atmos., 124, 12282–12300, https://doi.org/10.1029/2019JD030792, 2019.
Braun, S. A.: Reevaluating the Role of the Saharan Air Layer in Atlantic Tropical Cyclogenesis and Evolution, Mon. Weather Rev., 138, 2007–2037, https://doi.org/10.1175/2009MWR3135.1, 2010.
Brindley, H., Knippertz, P., Ryder, C., and Ashpole, I.: A critical evaluation of the ability of the Spinning Enhanced Visible and Infrared Imager (SEVIRI) thermal infrared red-green-blue rendering to identify dust events: Theoretical analysis, J. Geophys. Res.-Atmos., 117, D07201, https://doi.org/10.1029/2011JD017326, 2012.
Brindley, H. E. and Russell, J. E.: An assessment of Saharan dust loading and the corresponding cloud-free longwave direct radiative effect from geostationary satellite observations, J. Geophys. Res.-Atmos., 114, D23201, https://doi.org/10.1029/2008JD011635, 2009.
Bristow, C. S., Hudson-Edwards, K. A., and Chappell, A.: Fertilizing the Amazon and equatorial Atlantic with West African dust, Geophys. Res. Lett., 37, L14807, https://doi.org/10.1029/2010GL043486, 2010.
Brocca, L., Massari, C., Pellarin, T., Filippucci, P., Ciabatta, L., Camici, S., Kerr, Y. H., and Fernández-Prieto, D.: River flow prediction in data scarce regions: soil moisture integrated satellite rainfall products outperform rain gauge observations in West Africa, Sci. Rep., 10, 12517, https://doi.org/10.1038/s41598-020-69343-x, 2020.
Buchard, V., Randles, C. A., da Silva, A. M., Darmenov, A., Colarco, P. R., Govindaraju, R., Ferrare, R., Hair, J., Beyersdorf, A. J., Ziemba, L. D., and Yu, H.: The MERRA-2 Aerosol Reanalysis, 1980 Onward. Part II: Evaluation and Case Studies, J. Climate, 30, 6851–6872, https://doi.org/10.1175/JCLI-D-16-0613.1, 2017.
Burpee, R. W.: The Origin and Structure of Easterly Waves in the Lower Troposphere of North Africa, J. Atmos. Sci., 29, 77–90, https://doi.org/10.1175/1520-0469(1972)029<0077:TOASOE>2.0.CO;2, 1972.
CALIPSO User Guide: https://www-calipso.larc.nasa.gov/resources/calipso_users_guide/data_summaries/profile_data_v420.php#heading09 (last access: 30 March 2024), 2018.
Carlson, T. N. and Caverly, R. S.: Radiative characteristics of Saharan dust at solar wavelengths, J. Geophys. Res., 82, 3141–3152, https://doi.org/10.1029/JC082i021p03141, 1977.
Carlson, T. N. and Prospero, J. M.: The Large-Scale Movement of Saharan Air Outbreaks over the Northern Equatorial Atlantic, J. Appl. Meteorol. Clim., 11, 283–297, https://doi.org/10.1175/1520-0450(1972)011<0283:TLSMOS>2.0.CO;2, 1972.
Caton Harrison, T., Washington, R., and Engelstaedter, S.: Satellite-Derived Characteristics of Saharan Cold Pool Outflows During Boreal Summer, J. Geophys. Res.-Atmos., 126, e2020JD033387, https://doi.org/10.1029/2020JD033387, 2021.
CERES Surface Flux Accuracy and Validation: https://ceres.larc.nasa.gov/documents/DQ_summaries/CERES_SYN1deg_Surface_Ed4A.pdf (last access: 7 July 2024), 2021.
Chen, S.-P., Lu, C.-H., McQueen, J., and Lee, P.: Application of satellite observations in conjunction with aerosol reanalysis to characterize long-range transport of African and Asian dust on air quality in the contiguous U.S., Atmos. Environ., 187, 174–195, https://doi.org/10.1016/j.atmosenv.2018.05.038, 2018.
Claquin, T., Roelandt, C., Kohfeld, K., Harrison, S., Tegen, I., Prentice, I., Balkanski, Y., Bergametti, G., Hansson, M., Mahowald, N., Rodhe, H., and Schulz, M.: Radiative forcing of climate by ice-age atmospheric dust, Clim. Dynam., 20, 193–202, https://doi.org/10.1007/s00382-002-0269-1, 2003.
Cook, K. H.: Generation of the African Easterly Jet and Its Role in Determining West African Precipitation, J. Climate, 12, 1165–1184, https://doi.org/10.1175/1520-0442(1999)012<1165:GOTAEJ>2.0.CO;2, 1999.
Cowie, S. M., Knippertz, P., and Marsham, J. H.: A climatology of dust emission events from northern Africa using long-term surface observations, Atmos. Chem. Phys., 14, 8579–8597, https://doi.org/10.5194/acp-14-8579-2014, 2014.
Cowie, S. M., Marsham, J. H., and Knippertz, P.: The importance of rare, high-wind events for dust uplift in northern Africa, Geophys. Res. Lett., 42, 8208–8215, https://doi.org/10.1002/2015GL065819, 2015.
DeMott, P. J., Sassen, K., Poellot, M. R., Baumgardner, D., Rogers, D. C., Brooks, S. D., Prenni, A. J., and Kreidenweis, S. M.: African dust aerosols as atmospheric ice nuclei, Geophys. Res. Lett., 30, 1732, https://doi.org/10.1029/2003GL017410, 2003.
Didan, K., Munoz, A. B., and Huete, A.: MODIS Vegetation Index User's Guide (MOD13 Series), the University of Arizona, https://lpdaac.usgs.gov/documents/621/MOD13_User_Guide_V61.pdf (last access: 9 July 2024), 2015.
Doelling, D. R., Sun, M., Nguyen, L. T., Nordeen, M. L., Haney, C. O., Keyes, D. F., and Mlynczak, P. E.: Advances in Geostationary-Derived Longwave Fluxes for the CERES Synoptic (SYN1deg) Product, J. Atmos. Ocean. Tech., 33, 503–521, https://doi.org/10.1175/JTECH-D-15-0147.1, 2016.
Doherty, O. M., Riemer, N., and Hameed, S.: Saharan mineral dust transport into the Caribbean: Observed atmospheric controls and trends, J. Geophys. Res.-Atmos., 113, D07211, https://doi.org/10.1029/2007JD009171, 2008.
Dunion, J. P.: Rewriting the Climatology of the Tropical North Atlantic and Caribbean Sea Atmosphere, J. Climate, 24, 893–908, https://doi.org/10.1175/2010JCLI3496.1, 2011.
Dunion, J. P. and Velden, C. S.: The Impact of the Saharan Air Layer on Atlantic Tropical Cyclone Activity, B. Am. Meteorol. Soc., 85, 353–366, https://doi.org/10.1175/BAMS-85-3-353, 2004.
Engelstaedter, S. and Washington, R.: Atmospheric controls on the annual cycle of North African dust, J. Geophys. Res.-Atmos., 112, D03103, https://doi.org/10.1029/2006JD007195, 2007.
Engelstaedter, S., Tegen, I., and Washington, R.: North African dust emissions and transport, Earth-Sci. Rev., 79, 73–100, https://doi.org/10.1016/j.earscirev.2006.06.004, 2006.
European Organisation for the Exploitation of Meteorological Satellites (EUMESAT): High Rate SEVIRI Level 1.5 Image Data – MSG – 0 degree, EUMESAT [data set], https://navigator.eumetsat.int/product/EO:EUM:DAT:MSG:HRSEVIRI?query=High%20Rate%20SEVIRI%20Level%201.5%20Image%20Data%20-%20MSG%20-%200%20degree&s=advanced (last access: 1 August 2024), 2009.
Evan, A. T., Flamant, C., Gaetani, M., and Guichard, F.: The past, present and future of African dust, Nature, 531, 493–495, https://doi.org/10.1038/nature17149, 2016.
Fiedler, S., Kaplan, M. L., and Knippertz, P.: The importance of Harmattan surges for the emission of North African dust aerosol, Geophys. Res. Lett., 42, 9495–9504, https://doi.org/10.1002/2015GL065925, 2015.
Foltz, G. R., Evan, A. T., Freitag, H. P., Brown, S., and McPhaden, M. J.: Dust Accumulation Biases in PIRATA Shortwave Radiation Records, J. Atmos. Ocean. Tech., 30, 1414–1432, https://doi.org/10.1175/JTECH-D-12-00169.1, 2013.
Fontaine, B., Philippon, N., Trzaska, S., and Roucou, P.: Spring to summer changes in the West African monsoon through NCEP/NCAR reanalyses (1968–1998), J. Geophys. Res.-Atmos., 107, ACL 1-1–ACL 1-9, https://doi.org/10.1029/2001JD000834, 2002.
Francis, D., Fonseca, R., Nelli, N., Cuesta, J., Weston, M., Evan, A., and Temimi, M.: The Atmospheric Drivers of the Major Saharan Dust Storm in June 2020, Geophys. Res. Lett., 47, e2020GL090102, https://doi.org/10.1029/2020GL090102, 2020.
Francis, D., Nelli, N., Fonseca, R., Weston, M., Flamant, C., and Cherif, C.: The dust load and radiative impact associated with the June 2020 historical Saharan dust storm, Atmos. Environ., 268, 118808, https://doi.org/10.1016/j.atmosenv.2021.118808, 2022.
Freitas, E. d. S., Coelho, V. H. R., Xuan, Y., Melo, D. d. C. D., Gadelha, A. N., Santos, E. A., Galvão, C. d. O., Ramos Filho, G. M., Barbosa, L. R., Huffman, G. J., Petersen, W. A., and Almeida, C. d. N.: The performance of the IMERG satellite-based product in identifying sub-daily rainfall events and their properties, J. Hydrol., 589, 125128, https://doi.org/10.1016/j.jhydrol.2020.125128, 2020.
Gelaro, R., McCarty, W., Suárez, M. J., Todling, R., Molod, A., Takacs, L., Randles, C. A., Darmenov, A., Bosilovich, M. G., Reichle, R., Wargan, K., Coy, L., Cullather, R., Draper, C., Akella, S., Buchard, V., Conaty, A., Silva, A. M. da, Gu, W., Kim, G.-K., Koster, R., Lucchesi, R., Merkova, D., Nielsen, J. E., Partyka, G., Pawson, S., Putman, W., Rienecker, M., Schubert, S. D., Sienkiewicz, M., and Zhao, B.: The Modern-Era Retrospective Analysis for Research and Applications, Version 2 (MERRA-2), J. Climate, 30, 5419–5454, https://doi.org/10.1175/JCLI-D-16-0758.1, 2017.
Giles, D. M., Sinyuk, A., Sorokin, M. G., Schafer, J. S., Smirnov, A., Slutsker, I., Eck, T. F., Holben, B. N., Lewis, J. R., Campbell, J. R., Welton, E. J., Korkin, S. V., and Lyapustin, A. I.: Advancements in the Aerosol Robotic Network (AERONET) Version 3 database – automated near-real-time quality control algorithm with improved cloud screening for Sun photometer aerosol optical depth (AOD) measurements, Atmos. Meas. Tech., 12, 169–209, https://doi.org/10.5194/amt-12-169-2019, 2019.
Gillette, D. A., Adams, J., Endo, A., Smith, D., and Kihl, R.: Threshold velocities for input of soil particles into the air by desert soils, J. Geophys. Res.-Oceans, 85, 5621–5630, https://doi.org/10.1029/JC085iC10p05621, 1980.
Global Modeling and Assimilation Office (GMAO): MERRA-2 tavg1_2d_aer_Nx: 2d,1-Hourly,Time-averaged,Single-Level,Assimilation,Aerosol Diagnostics V5.12.4, Goddard Earth Sciences Data and Information Services Center (GES DISC), Greenbelt, MD, USA [data set], https://doi.org/10.5067/KLICLTZ8EM9D, 2015.
Goudie, A. S.: Desert dust and human health disorders, Environ. Int., 63, 101–113, https://doi.org/10.1016/j.envint.2013.10.011, 2014.
Goudie, A. S. and Middleton, N. J.: Saharan dust storms: nature and consequences, Earth-Sci. Rev., 56, 179–204, https://doi.org/10.1016/S0012-8252(01)00067-8, 2001.
Green, R. O., Mahowald, N., Ung, C., Thompson, D. R., Bator, L., Bennet, M., Bernas, M., Blackway, N., Bradley, C., Cha, J., Clark, P., Clark, R., Cloud, D., Diaz, E., Ben Dor, E., Duren, R., Eastwood, M., Ehlmann, B. L., Fuentes, L., Ginoux, P., Gross, J., He, Y., Kalashnikova, O., Kert, W., Keymeulen, D., Klimesh, M., Ku, D., Kwong-Fu, H., Liggett, E., Li, L., Lundeen, S., Makowski, M. D., Mazer, A., Miller, R., Mouroulis, P., Oaida, B., Okin, G. S., Ortega, A., Oyake, A., Nguyen, H., Pace, T., Painter, T. H., Pempejian, J., Garcia-Pando, C. P., Pham, T., Phillips, B., Pollock, R., Purcell, R., Realmuto, V., Schoolcraft, J., Sen, A., Shin, S., Shaw, L., Soriano, M., Swayze, G., Thingvold, E., Vaid, A., and Zan, J.: The Earth Surface Mineral Dust Source Investigation: An Earth Science Imaging Spectroscopy Mission, in: 2020 IEEE Aerospace Conference, Big Sky, MT, 7–14 March 2020, IEEE, 1–15, https://doi.org/10.1109/AERO47225.2020.9172731, 2020.
Grogan, D. F. P., Nathan, T. R., and Chen, S.-H.: Saharan Dust and the Nonlinear Evolution of the African Easterly Jet–African Easterly Wave System, J. Atmos. Sci., 74, 27–47, https://doi.org/10.1175/JAS-D-16-0118.1, 2017.
Groß, S., Freudenthaler, V., Schepanski, K., Toledano, C., Schäfler, A., Ansmann, A., and Weinzierl, B.: Optical properties of long-range transported Saharan dust over Barbados as measured by dual-wavelength depolarization Raman lidar measurements, Atmos. Chem. Phys., 15, 11067–11080, https://doi.org/10.5194/acp-15-11067-2015, 2015.
Gyan, K., Henry, W., Lacaille, S., Laloo, A., Lamsee-Ebanks, C., McKay, S., Antoine, R. M., and Monteil, M. A.: African dust clouds are associated with increased paediatric asthma accident and emergency admissions on the Caribbean island of Trinidad, Int. J. Biometeorol., 49, 371–376, https://doi.org/10.1007/s00484-005-0257-3, 2005.
Haarig, M., Ansmann, A., Althausen, D., Klepel, A., Groß, S., Freudenthaler, V., Toledano, C., Mamouri, R.-E., Farrell, D. A., Prescod, D. A., Marinou, E., Burton, S. P., Gasteiger, J., Engelmann, R., and Baars, H.: Triple-wavelength depolarization-ratio profiling of Saharan dust over Barbados during SALTRACE in 2013 and 2014, Atmos. Chem. Phys., 17, 10767–10794, https://doi.org/10.5194/acp-17-10767-2017, 2017.
Hansell, R. A., Tsay, S. C., Ji, Q., Hsu, N. C., Jeong, M. J., Wang, S. H., Reid, J. S., Liou, K. N., and Ou, S. C.: An Assessment of the Surface Longwave Direct Radiative Effect of Airborne Saharan Dust during the NAMMA Field Campaign, J. Atmos. Sci., 67, 1048–1065, https://doi.org/10.1175/2009JAS3257.1, 2010.
Haywood, J., Francis, P., Osborne, S., Glew, M., Loeb, N., Highwood, E., Tanré, D., Myhre, G., Formenti, P., and Hirst, E.: Radiative properties and direct radiative effect of Saharan dust measured by the C-130 aircraft during SHADE: 1. Solar spectrum, J. Geophys. Res.-Atmos., 108, 8577, https://doi.org/10.1029/2002JD002687, 2003.
Haywood, J. M., Francis, P. N., Glew, M. D., and Taylor, J. P.: Optical properties and direct radiative effect of Saharan dust: A case study of two Saharan dust outbreaks using aircraft data, J. Geophys. Res.-Atmos., 106, 18417–18430, https://doi.org/10.1029/2000JD900319, 2001.
Helgren, D. M. and Prospero, J. M.: Wind Velocities Associated with Dust Deflation Events in the Western Sahara, J. Appl. Meteorol. Clim., 26, 1147–1151, https://doi.org/10.1175/1520-0450(1987)026<1147:WVAWDD>2.0.CO;2, 1987.
Hersbach, H., Bell, B., Berrisford, P., Hirahara, S., Horányi, A., Muñoz-Sabater, J., Nicolas, J., Peubey, C., Radu, R., Schepers, D., Simmons, A., Soci, C., Abdalla, S., Abellan, X., Balsamo, G., Bechtold, P., Biavati, G., Bidlot, J., Bonavita, M., De Chiara, G., Dahlgren, P., Dee, D., Diamantakis, M., Dragani, R., Flemming, J., Forbes, R., Fuentes, M., Geer, A., Haimberger, L., Healy, S., Hogan, R. J., Hólm, E., Janisková, M., Keeley, S., Laloyaux, P., Lopez, P., Lupu, C., Radnoti, G., de Rosnay, P., Rozum, I., Vamborg, F., Villaume, S., and Thépaut, J.-N.: The ERA5 global reanalysis, Q. J. Roy. Meteor. Soc., 146, 1999–2049, https://doi.org/10.1002/qj.3803, 2020.
Hersbach, H., Bell, B., Berrisford, P., Biavati, G., Horányi, A., Muñoz Sabater, J., Nicolas, J., Peubey, C., Radu, R., Rozum, I., Schepers, D., Simmons, A., Soci, C., Dee, D., and Thépaut, J.-N.: ERA5 hourly data on pressure levels from 1940 to present, Copernicus Climate Change Service (C3S) Climate Data Store (CDS) [data set], https://doi.org/10.24381/cds.bd0915c6, 2023a.
Hersbach, H., Bell, B., Berrisford, P., Biavati, G., Horányi, A., Muñoz Sabater, J., Nicolas, J., Peubey, C., Radu, R., Rozum, I., Schepers, D., Simmons, A., Soci, C., Dee, D., and Thépaut, J.-N.: ERA5 monthly averaged data on pressure levels from 1940 to present, Copernicus Climate Change Service (C3S) Climate Data Store (CDS) [data set], https://doi.org/10.24381/cds.6860a573, 2023b.
Hersbach, H., Bell, B., Berrisford, P., Biavati, G., Horányi, A., Muñoz Sabater, J., Nicolas, J., Peubey, C., Radu, R., Rozum, I., Schepers, D., Simmons, A., Soci, C., Dee, D., and Thépaut, J.-N.: ERA5 hourly data on single levels from 1940 to present, Copernicus Climate Change Service (C3S) Climate Data Store (CDS) [data set], https://doi.org/10.24381/cds.adbb2d47, 2023c.
Hersbach, H., Bell, B., Berrisford, P., Biavati, G., Horányi, A., Muñoz Sabater, J., Nicolas, J., Peubey, C., Radu, R., Rozum, I., Schepers, D., Simmons, A., Soci, C., Dee, D., and Thépaut, J.-N.: ERA5 monthly averaged data on single levels from 1940 to present, Copernicus Climate Change Service (C3S) Climate Data Store (CDS) [data set], https://doi.org/10.24381/cds.f17050d7, 2023d.
Highwood, E. J., Haywood, J. M., Silverstone, M. D., Newman, S. M., and Taylor, J. P.: Radiative properties and direct effect of Saharan dust measured by the C-130 aircraft during Saharan Dust Experiment (SHADE): 2. Terrestrial spectrum, J. Geophys. Res.-Atmos., 108, 8578, https://doi.org/10.1029/2002JD002552, 2003.
Holben, B. N., Eck, T. F., Slutsker, I., Tanré, D., Buis, J. P., Setzer, A., Vermote, E., Reagan, J. A., Kaufman, Y. J., Nakajima, T., Lavenu, F., Jankowiak, I., and Smirnov, A.: AERONET – A Federated Instrument Network and Data Archive for Aerosol Characterization, Remote Sens. Environ., 66, 1–16, https://doi.org/10.1016/S0034-4257(98)00031-5, 1998 (data available at: https://aeronet.gsfc.nasa.gov/new_web/data.html, last access: 11 January 2023).
Holben, B. N., Tanré, D., Smirnov, A., Eck, T. F., Slutsker, I., Abuhassan, N., Newcomb, W. W., Schafer, J. S., Chatenet, B., Lavenu, F., Kaufman, Y. J., Castle, J. V., Setzer, A., Markham, B., Clark, D., Frouin, R., Halthore, R., Karneli, A., O'Neill, N. T., Pietras, C., Pinker, R. T., Voss, K., and Zibordi, G.: An emerging ground-based aerosol climatology: Aerosol optical depth from AERONET, J. Geophys. Res.-Atmos., 106, 12067–12097, https://doi.org/10.1029/2001JD900014, 2001.
Hsu, N. C., Lee, J., Sayer, A. M., Kim, W., Bettenhausen, C., and Tsay, S.-C.: VIIRS Deep Blue Aerosol Products Over Land: Extending the EOS Long-Term Aerosol Data Records, J. Geophys. Res.-Atmos., 124, 4026–4053, https://doi.org/10.1029/2018JD029688, 2019.
Huang, J., Zhang, C., and Prospero, J. M.: African dust outbreaks: A satellite perspective of temporal and spatial variability over the tropical Atlantic Ocean, J. Geophys. Res.-Atmos., 115, D05202, https://doi.org/10.1029/2009JD012516, 2010.
Huffman, G. J., Stocker, E. F., Bolvin, D. T., Nelkin, E. J., and Tan, J.: GPM IMERG Final Precipitation L3 Half Hourly 0.1 degree x 0.1 degree V06, Greenbelt, MD, Goddard Earth Sciences Data and Information Services Center (GES DISC) [data set], https://doi.org/10.5067/GPM/IMERG/3B-HH/06, 2019.
Huneeus, N., Schulz, M., Balkanski, Y., Griesfeller, J., Prospero, J., Kinne, S., Bauer, S., Boucher, O., Chin, M., Dentener, F., Diehl, T., Easter, R., Fillmore, D., Ghan, S., Ginoux, P., Grini, A., Horowitz, L., Koch, D., Krol, M. C., Landing, W., Liu, X., Mahowald, N., Miller, R., Morcrette, J.-J., Myhre, G., Penner, J., Perlwitz, J., Stier, P., Takemura, T., and Zender, C. S.: Global dust model intercomparison in AeroCom phase I, Atmos. Chem. Phys., 11, 7781–7816, https://doi.org/10.5194/acp-11-7781-2011, 2011.
Jenkins, G. S., Pratt, A. S., and Heymsfield, A.: Possible linkages between Saharan dust and tropical cyclone rain band invigoration in the eastern Atlantic during NAMMA-06, Geophys. Res. Lett., 35, L08815, https://doi.org/10.1029/2008GL034072, 2008.
Jickells, T. D., Baker, A. R., and Chance, R.: Atmospheric transport of trace elements and nutrients to the oceans, Philos. T. R. Soc. Math. Phys. Eng. Sci., 374, 20150286, https://doi.org/10.1098/rsta.2015.0286, 2016.
Johnson, G. C., Lyman, J. M., and Loeb, N. G.: Improving estimates of Earth's energy imbalance, Nat. Clim. Change, 6, 639–640, https://doi.org/10.1038/nclimate3043, 2016.
Jones, C., Mahowald, N., and Luo, C.: The role of easterly waves on African desert dust transport, J. Climate, 16, 3617–3628, https://doi.org/10.1175/1520-0442(2003)016<3617:TROEWO>2.0.CO;2, 2003.
Kalashnikova, O. V. and Kahn, R. A.: Mineral dust plume evolution over the Atlantic from MISR and MODIS aerosol retrievals, J. Geophys. Res.-Atmos., 113, D24204, https://doi.org/10.1029/2008JD010083, 2008.
Kanitz, T., Engelmann, R., Heinold, B., Baars, H., Skupin, A., and Ansmann, A.: Tracking the Saharan Air Layer with shipborne lidar across the tropical Atlantic, Geophys. Res. Lett., 41, 1044–1050, https://doi.org/10.1002/2013GL058780, 2014.
Kar, J., Vaughan, M. A., Lee, K.-P., Tackett, J. L., Avery, M. A., Garnier, A., Getzewich, B. J., Hunt, W. H., Josset, D., Liu, Z., Lucker, P. L., Magill, B., Omar, A. H., Pelon, J., Rogers, R. R., Toth, T. D., Trepte, C. R., Vernier, J.-P., Winker, D. M., and Young, S. A.: CALIPSO lidar calibration at 532 nm: version 4 nighttime algorithm, Atmos. Meas. Tech., 11, 1459–1479, https://doi.org/10.5194/amt-11-1459-2018, 2018.
Karyampudi, V. M. and Carlson, T. N.: Analysis and Numerical Simulations of the Saharan Air Layer and Its Effect on Easterly Wave Disturbances, J. Atmos. Sci., 45, 3102–3136, https://doi.org/10.1175/1520-0469(1988)045<3102:AANSOT>2.0.CO;2, 1988.
Kato, S., Rose, F. G., Rutan, D. A., Thorsen, T. J., Loeb, N. G., Doelling, D. R., Huang, X., Smith, W. L., Su, W., and Ham, S.-H.: Surface Irradiances of Edition 4.0 Clouds and the Earth's Radiant Energy System (CERES) Energy Balanced and Filled (EBAF) Data Product, J. Climate, 31, 4501–4527, https://doi.org/10.1175/JCLI-D-17-0523.1, 2018.
Kaufman, Y. J., Koren, I., Remer, L. A., Tanré, D., Ginoux, P., and Fan, S.: Dust transport and deposition observed from the Terra-Moderate Resolution Imaging Spectroradiometer (MODIS) spacecraft over the Atlantic Ocean, J. Geophys. Res.-Atmos., 110, D10S12, https://doi.org/10.1029/2003JD004436, 2005.
Kim, D., Chin, M., Remer, L. A., Diehl, T., Bian, H., Yu, H., Brown, M. E., and Stockwell, W. R.: Role of surface wind and vegetation cover in multi-decadal variations of dust emission in the Sahara and Sahel, Atmos. Environ., 148, 282–296, https://doi.org/10.1016/j.atmosenv.2016.10.051, 2017.
Kim, M.-H., Omar, A. H., Tackett, J. L., Vaughan, M. A., Winker, D. M., Trepte, C. R., Hu, Y., Liu, Z., Poole, L. R., Pitts, M. C., Kar, J., and Magill, B. E.: The CALIPSO version 4 automated aerosol classification and lidar ratio selection algorithm, Atmos. Meas. Tech., 11, 6107–6135, https://doi.org/10.5194/amt-11-6107-2018, 2018.
Knippertz, P. and Todd, M. C.: Mineral dust aerosols over the Sahara: Meteorological controls on emission and transport and implications for modeling, Rev. Geophys., 50, RG1007, https://doi.org/10.1029/2011RG000362, 2012.
Kok, J. F., Adebiyi, A. A., Albani, S., Balkanski, Y., Checa-Garcia, R., Chin, M., Colarco, P. R., Hamilton, D. S., Huang, Y., Ito, A., Klose, M., Li, L., Mahowald, N. M., Miller, R. L., Obiso, V., Pérez García-Pando, C., Rocha-Lima, A., and Wan, J. S.: Contribution of the world's main dust source regions to the global cycle of desert dust, Atmos. Chem. Phys., 21, 8169–8193, https://doi.org/10.5194/acp-21-8169-2021, 2021.
Kok, J. F., Storelvmo, T., Karydis, V. A., Adebiyi, A. A., Mahowald, N. M., Evan, A. T., He, C., and Leung, D. M.: Mineral dust aerosol impacts on global climate and climate change, Nat. Rev. Earth Environ., 4, 71–86, https://doi.org/10.1038/s43017-022-00379-5, 2023.
Kumar, A., Abouchami, W., Galer, S. J. G., Garrison, V. H., Williams, E., and Andreae, M. O.: A radiogenic isotope tracer study of transatlantic dust transport from Africa to the Caribbean, Atmos. Environ., 82, 130–143, https://doi.org/10.1016/j.atmosenv.2013.10.021, 2014.
Largeron, Y., Guichard, F., Bouniol, D., Couvreux, F., Kergoat, L., and Marticorena, B.: Can we use surface wind fields from meteorological reanalyses for Sahelian dust emission simulations?, Geophys. Res. Lett., 42, 2490–2499, https://doi.org/10.1002/2014GL062938, 2015.
Lensky, I. M. and Rosenfeld, D.: Clouds-Aerosols-Precipitation Satellite Analysis Tool (CAPSAT), Atmos. Chem. Phys., 8, 6739–6753, https://doi.org/10.5194/acp-8-6739-2008, 2008.
Leroux, S. and Hall, N. M. J.: On the Relationship between African Easterly Waves and the African Easterly Jet, J. Atmos. Sci., 66, 2303–2316, https://doi.org/10.1175/2009JAS2988.1, 2009.
Levin, Z., Ganor, E., and Gladstein, V.: The Effects of Desert Particles Coated with Sulfate on Rain Formation in the Eastern Mediterranean, J. Appl. Meteorol. Clim., 35, 1511–1523, https://doi.org/10.1175/1520-0450(1996)035<1511:TEODPC>2.0.CO;2, 1996.
Levy, R., Hsu, C., et al.: MODIS Atmosphere L2 Aerosol Product, NASA MODIS Adaptive Processing System, Goddard Space Flight Center, USA [data set], https://doi.org/10.5067/MODIS/MOD04_L2.061, 2015a.
Levy, R., Hsu, C., et al.: MODIS Atmosphere L2 Aerosol Product, NASA MODIS Adaptive Processing System, Goddard Space Flight Center, USA [data set], https://doi.org/10.5067/MODIS/MYD04_L2.061, 2015b.
Li, F., Vogelmann, A. M., and Ramanathan, V.: Saharan Dust Aerosol Radiative Forcing Measured from Space, J. Climate, 17, 2558–2571, https://doi.org/10.1175/1520-0442(2004)017<2558:SDARFM>2.0.CO;2, 2004.
Li, F., Ginoux, P., and Ramaswamy, V.: Transport of Patagonian dust to Antarctica, J. Geophys. Res.-Atmos., 115, D18217, https://doi.org/10.1029/2009JD012356, 2010.
Li, J., Garshick, E., Huang, S., and Koutrakis, P.: Impacts of El Niño-Southern Oscillation on surface dust levels across the world during 1982–2019, Sci. Total Environ., 769, 144566, https://doi.org/10.1016/j.scitotenv.2020.144566, 2021.
Li, W., Li, L., Fu, R., Deng, Y., and Wang, H.: Changes to the North Atlantic Subtropical High and Its Role in the Intensification of Summer Rainfall Variability in the Southeastern United States, J. Climate, 24, 1499–1506, https://doi.org/10.1175/2010JCLI3829.1, 2011.
Liu, H., Remer, L. A., Huang, J., Huang, H.-C., Kondragunta, S., Laszlo, I., Oo, M., and Jackson, J. M.: Preliminary evaluation of S-NPP VIIRS aerosol optical thickness, J. Geophys. Res.-Atmos., 119, 3942–3962, https://doi.org/10.1002/2013JD020360, 2014.
Loeb, N. G., Doelling, D. R., Wang, H., Su, W., Nguyen, C., Corbett, J. G., Liang, L., Mitrescu, C., Rose, F. G., and Kato, S.: Clouds and the Earth's Radiant Energy System (CERES) Energy Balanced and Filled (EBAF) Top-of-Atmosphere (TOA) Edition-4.0 Data Product, J. Climate, 31, 895–918, https://doi.org/10.1175/JCLI-D-17-0208.1, 2018.
Mahowald, N., Albani, S., Kok, J. F., Engelstaeder, S., Scanza, R., Ward, D. S., and Flanner, M. G.: The size distribution of desert dust aerosols and its impact on the Earth system, Aeolian Res., 15, 53–71, https://doi.org/10.1016/j.aeolia.2013.09.002, 2014.
Marsham, J. H., Parker, D. J., Grams, C. M., Taylor, C. M., and Haywood, J. M.: Uplift of Saharan dust south of the intertropical discontinuity, J. Geophys. Res.-Atmos., 113, D21102, https://doi.org/10.1029/2008JD009844, 2008.
Martin, E. R. and Schumacher, C.: The Caribbean Low-Level Jet and Its Relationship with Precipitation in IPCC AR4 Models, J. Climate, 24, 5935–5950, https://doi.org/10.1175/JCLI-D-11-00134.1, 2011.
Martínez, M. A., Ruiz, J., and Cuevas, E.: Use of SEVIRI images and derived products in a WMO Sand and dust Storm Warning System, IOP Conf. Ser. Earth Environ. Sci., 7, 012004, https://doi.org/10.1088/1755-1307/7/1/012004, 2009.
Mehra, M., Shrestha, S., Ap, K., Guagenti, M., Moffett, C. E., VerPloeg, S. G., Coogan, M. A., Rai, M., Kumar, R., Andrews, E., Sherman, J. P., Flynn III, J. H., Usenko, S., and Sheesley, R. J.: Atmospheric heating in the US from saharan dust: Tracking the June 2020 event with surface and satellite observations, Atmos. Environ., 310, 119988, https://doi.org/10.1016/j.atmosenv.2023.119988, 2023.
Meloni, D., di Sarra, A., Di Iorio, T., and Fiocco, G.: Influence of the vertical profile of Saharan dust on the visible direct radiative forcing, J. Quant. Spectrosc. Ra., 93, 397–413, https://doi.org/10.1016/j.jqsrt.2004.08.035, 2005.
MODIS Land General Accuracy Statement: https://modis-land.gsfc.nasa.gov/ValStatus.php?ProductID=MOD13 (last access: 30 March 2024), 2023.
Moulin, C. and Chiapello, I.: Evidence of the control of summer atmospheric transport of African dust over the Atlantic by Sahel sources from TOMS satellites (1979–2000), Geophys. Res. Lett., 31, L02107, https://doi.org/10.1029/2003GL018931, 2004.
Moulin, C., Lambert, C. E., Dulac, F., and Dayan, U.: Control of atmospheric export of dust from North Africa by the North Atlantic Oscillation, Nature, 387, 691–694, https://doi.org/10.1038/42679, 1997.
Myhre, G., Grini, A., Haywood, J. M., Stordal, F., Chatenet, B., Tanré, D., Sundet, J. K., and Isaksen, I. S. A.: Modeling the radiative impact of mineral dust during the Saharan Dust Experiment (SHADE) campaign, J. Geophys. Res.-Atmos., 108, 8579, https://doi.org/10.1029/2002JD002566, 2003.
NASA/LARC/SD/ASDC: CERES and GEO-Enhanced TOA, Within-Atmosphere and Surface Fluxes, Clouds and Aerosols Daily Terra-Aqua Edition4A, NASA Langley Atmospheric Science Data Center DAAC [data set], https://doi.org/10.5067/Terra+Aqua/CERES/SYN1degDay_L3.004A, 2017a.
NASA/LARC/SD/ASDC: CERES and GEO-Enhanced TOA, Within-Atmosphere and Surface Fluxes, Clouds and Aerosols Monthly Terra-Aqua Edition4A, NASA Langley Atmospheric Science Data Center DAAC [data set], https://doi.org/10.5067/TERRA+AQUA/CERES/SYN1DEGMONTH_L3.004A, 2017b.
NASA/LARC/SD/ASDC: CALIPSO Lidar Level 2 Aerosol Profile, V4-20, NASA Langley Atmospheric Science Data Center DAAC [data set], https://doi.org/10.5067/CALIOP/CALIPSO/LID_L2_05KMAPRO-STANDARD-V4-20, 2018.
NASA/LARC/SD/ASDC: CALIPSO Lidar Level 1B profile data, V4-51, NASA Langley Atmospheric Science Data Center DAAC [data set], https://doi.org/10.5067/CALIOP/CALIPSO/CAL_LID_L1-Standard-V4-51, 2023.
Okin, G. S., Mahowald, N., Chadwick, O. A., and Artaxo, P.: Impact of desert dust on the biogeochemistry of phosphorus in terrestrial ecosystems, Global Biogeochem. Cy., 18, GB2005, https://doi.org/10.1029/2003GB002145, 2004.
Ott, S.-T., Ott, A., Martin, D. W., and Young, J. A.: Analysis of a Trans-Atlantic Saharan Dust Outbreak Based on Satellite and GATE Data, Mon. Weather Rev., 119, 1832–1850, https://doi.org/10.1175/1520-0493(1991)119<1832:AOATAS>2.0.CO;2, 1991.
Pan, W., Wu, L., and Shie, C.-L.: Influence of the Saharan Air Layer on Atlantic tropical cyclone formation during the period 1–12 September 2003, Adv. Atmos. Sci., 28, 16–32, https://doi.org/10.1007/s00376-010-9165-5, 2011.
Petit, R. H., Legrand, M., Jankowiak, I., Molinié, J., Asselin de Beauville, C., Marion, G., and Mansot, J. L.: Transport of Saharan dust over the Caribbean Islands: Study of an event, J. Geophys. Res.-Atmos., 110, D18S09, https://doi.org/10.1029/2004JD004748, 2005.
Piles, M., Ballabrera-Poy, J., and Muñoz-Sabater, J.: Dominant Features of Global Surface Soil Moisture Variability Observed by the SMOS Satellite, Remote Sens., 11, 95, https://doi.org/10.3390/rs11010095, 2019.
Platnick, S., Hubanks, P., Meyer, K., and King, M. D.: MODIS Atmosphere L3 Daily Product, NASA MODIS Adaptive Processing System, Goddard Space Flight Center, USA [data set], https://doi.org/10.5067/MODIS/MOD08_D3.061, 2015a.
Platnick, S., Hubanks, P., Meyer, K., and King, M. D.: MODIS Atmosphere L3 Daily Product, NASA MODIS Adaptive Processing System, Goddard Space Flight Center, USA [data set], https://doi.org/10.5067/MODIS/MYD08_D3.061, 2015b.
Platnick, S., Hubanks, P., Meyer, K., and King, M. D.: MODIS Atmosphere L3 Monthly Product, NASA MODIS Adaptive Processing System, Goddard Space Flight Center, USA [data set], https://doi.org/10.5067/MODIS/MOD08_M3.061, 2015c.
Platnick, S., Hubanks, P., Meyer, K., and King, M. D.: MODIS Atmosphere L3 Monthly Product, NASA MODIS Adaptive Processing System, Goddard Space Flight Center, USA [data set], https://doi.org/10.5067/MODIS/MYD08_M3.061, 2015d.
Prenni, A. J., Petters, M. D., Faulhaber, A., Carrico, C. M., Ziemann, P. J., Kreidenweis, S. M., and DeMott, P. J.: Heterogeneous ice nucleation measurements of secondary organic aerosol generated from ozonolysis of alkenes, Geophys. Res. Lett., 36, L06808, https://doi.org/10.1029/2008GL036957, 2009.
Prospero, J. M.: Long-term measurements of the transport of African mineral dust to the southeastern United States: Implications for regional air quality, J. Geophys. Res.-Atmos., 104, 15917–15927, https://doi.org/10.1029/1999JD900072, 1999.
Prospero, J. M. and Carlson, T. N.: Radon-222 in the North Atlantic Trade Winds: Its Relationship to Dust Transport from Africa, Science, 167, 974–977, https://doi.org/10.1126/science.167.3920.974, 1970.
Prospero, J. M. and Carlson, T. N.: Vertical and areal distribution of Saharan dust over the western equatorial north Atlantic Ocean, J. Geophys. Res., 77, 5255–5265, https://doi.org/10.1029/JC077i027p05255, 1972.
Prospero, J. M. and Carlson, T. N.: Saharan air outbreaks over the tropical North Atlantic, Pure Appl. Geophys., 119, 677–691, https://doi.org/10.1007/BF00878167, 1981.
Prospero, J. M. and Lamb, P. J.: African Droughts and Dust Transport to the Caribbean: Climate Change Implications, Science, 302, 1024–1027, https://doi.org/10.1126/science.1089915, 2003.
Prospero, J. M., Bonatti, E., Schubert, C., and Carlson, T. N.: Dust in the Caribbean atmosphere traced to an African dust storm, Earth Planet. Sci. Lett., 9, 287–293, https://doi.org/10.1016/0012-821X(70)90039-7, 1970.
Prospero, J. M., Ginoux, P., Torres, O., Nicholson, S. E., and Gill, T. E.: Environmental Characterization of Global Sources of Atmospheric Soil Dust Identified with the Nimbus 7 Total Ozone Mapping Spectrometer (toms) Absorbing Aerosol Product, Rev. Geophys., 40, 2-1–2-31, https://doi.org/10.1029/2000RG000095, 2002.
Prospero, J. M., Blades, E., Mathison, G., and Naidu, R.: Interhemispheric transport of viable fungi and bacteria from Africa to the Caribbean with soil dust, Aerobiologia, 21, 1–19, https://doi.org/10.1007/s10453-004-5872-7, 2005.
Prospero, J. M., Delany, A. C., Delany, A. C., and Carlson, T. N.: The Discovery of African Dust Transport to the Western Hemisphere and the Saharan Air Layer: A History, B. Am. Meteorol. Soc., 102, E1239–E1260, https://doi.org/10.1175/BAMS-D-19-0309.1, 2021.
Pu, B. and Ginoux, P.: Climatic factors contributing to long-term variations in surface fine dust concentration in the United States, Atmos. Chem. Phys., 18, 4201–4215, https://doi.org/10.5194/acp-18-4201-2018, 2018a.
Pu, B. and Ginoux, P.: How reliable are CMIP5 models in simulating dust optical depth?, Atmos. Chem. Phys., 18, 12491–12510, https://doi.org/10.5194/acp-18-12491-2018, 2018b.
Pu, B. and Jin, Q.: A Record-Breaking Trans-Atlantic African Dust Plume Associated with Atmospheric Circulation Extremes in June 2020, B. Am. Meteorol. Soc., 102, E1340–E1356, https://doi.org/10.1175/BAMS-D-21-0014.1, 2021.
Pu, B., Ginoux, P., Guo, H., Hsu, N. C., Kimball, J., Marticorena, B., Malyshev, S., Naik, V., O'Neill, N. T., Pérez García-Pando, C., Paireau, J., Prospero, J. M., Shevliakova, E., and Zhao, M.: Retrieving the global distribution of the threshold of wind erosion from satellite data and implementing it into the Geophysical Fluid Dynamics Laboratory land–atmosphere model (GFDL AM4.0/LM4.0), Atmos. Chem. Phys., 20, 55–81, https://doi.org/10.5194/acp-20-55-2020, 2020.
Randles, C. A., Silva, A. M. da, Buchard, V., Colarco, P. R., Darmenov, A., Govindaraju, R., Smirnov, A., Holben, B., Ferrare, R., Hair, J., Shinozuka, Y., and Flynn, C. J.: The MERRA-2 Aerosol Reanalysis, 1980 Onward. Part I: System Description and Data Assimilation Evaluation, J. Climate, 30, 6823–6850, https://doi.org/10.1175/JCLI-D-16-0609.1, 2017.
Reale, O., Lau, K. M., and da Silva, A.: Impact of Interactive Aerosol on the African Easterly Jet in the NASA GEOS-5 Global Forecasting System, Weather Forecast., 26, 504–519, https://doi.org/10.1175/WAF-D-10-05025.1, 2011.
Reddy, K., Kumar, D. V. P., Ahammed, Y. N., and Naja, M.: Aerosol vertical profiles strongly affect their radiative forcing uncertainties: study by using ground-based lidar and other measurements, Remote Sens. Lett., 4, 1018–1027, https://doi.org/10.1080/2150704X.2013.828182, 2013.
Roberts, A. J., Woodage, M. J., Marsham, J. H., Highwood, E. J., Ryder, C. L., McGinty, W., Wilson, S., and Crook, J.: Can explicit convection improve modelled dust in summertime West Africa?, Atmos. Chem. Phys., 18, 9025–9048, https://doi.org/10.5194/acp-18-9025-2018, 2018.
Rosenfeld, D., Rudich, Y., and Lahav, R.: Desert dust suppressing precipitation: A possible desertification feedback loop, P. Natl. Acad. Sci. USA, 98, 5975–5980, https://doi.org/10.1073/pnas.101122798, 2001.
Rutan, D. A., Kato, S., Doelling, D. R., Rose, F. G., Nguyen, L. T., Caldwell, T. E., and Loeb, N. G.: CERES Synoptic Product: Methodology and Validation of Surface Radiant Flux, J. Atmos. Ocean. Tech., 32, 1121–1143, https://doi.org/10.1175/JTECH-D-14-00165.1, 2015.
Sassen, K.: The Polarization Lidar Technique for Cloud Research: A Review and Current Assessment, B. Am. Meteorol. Soc., 72, 1848–1866, https://doi.org/10.1175/1520-0477(1991)072<1848:TPLTFC>2.0.CO;2, 1991.
Sayer, A. M., Hsu, N. C., Lee, J., Kim, W. V., and Dutcher, S. T.: Validation, Stability, and Consistency of MODIS Collection 6.1 and VIIRS Version 1 Deep Blue Aerosol Data Over Land, J. Geophys. Res.-Atmos., 124, 4658–4688, https://doi.org/10.1029/2018JD029598, 2019.
Schepanski, K.: Transport of Mineral Dust and Its Impact on Climate, Geosciences, 8, 151, https://doi.org/10.3390/geosciences8050151, 2018.
Schepanski, K., Tegen, I., Laurent, B., Heinold, B., and Macke, A.: A new Saharan dust source activation frequency map derived from MSG-SEVIRI IR-channels, Geophys. Res. Lett., 34, L18803, https://doi.org/10.1029/2007GL030168, 2007.
Schepanski, K., Heinold, B., and Tegen, I.: Harmattan, Saharan heat low, and West African monsoon circulation: modulations on the Saharan dust outflow towards the North Atlantic, Atmos. Chem. Phys., 17, 10223–10243, https://doi.org/10.5194/acp-17-10223-2017, 2017.
Schmetz, J., Pili, P., Tjemkes, S., Just, D., Kerkmann, J., Rota, S., and Ratier, A.: An Introduction To Meteosat Second Generation (MSG), B. Am. Meteorol. Soc., 83, 977–992, https://doi.org/10.1175/1520-0477(2002)083<0977:AITMSG>2.3.CO;2, 2002.
Scott, S. R., Dunion, J. P., Olson, M. L., and Gay, D. A.: Lead Isotopes in North American Precipitation Record the Presence of Saharan Dust, B. Am. Meteorol. Soc., 103, E281–E292, https://doi.org/10.1175/BAMS-D-20-0212.1, 2022.
Shinn, E. A., Griffin, D. W., and Seba, D. B.: Atmospheric Transport of Mold Spores in Clouds of Desert Dust, Arch. Environ. Health, 58, 498–504, 2003.
Slingo, A., Ackerman, T. P., Allan, R. P., Kassianov, E. I., McFarlane, S. A., Robinson, G. J., Barnard, J. C., Miller, M. A., Harries, J. E., Russell, J. E., and Dewitte, S.: Observations of the impact of a major Saharan dust storm on the atmospheric radiation balance, Geophys. Res. Lett., 33, L24817, https://doi.org/10.1029/2006GL027869, 2006.
Song, Q., Zhang, Z., Yu, H., Kato, S., Yang, P., Colarco, P., Remer, L. A., and Ryder, C. L.: Net radiative effects of dust in the tropical North Atlantic based on integrated satellite observations and in situ measurements, Atmos. Chem. Phys., 18, 11303–11322, https://doi.org/10.5194/acp-18-11303-2018, 2018.
Strong, J. D. O., Vecchi, G. A., and Ginoux, P.: The Climatological Effect of Saharan Dust on Global Tropical Cyclones in a Fully Coupled GCM, J. Geophys. Res.-Atmos., 123, 5538–5559, https://doi.org/10.1029/2017JD027808, 2018.
Tegen, I. and Lacis, A. A.: Modeling of particle size distribution and its influence on the radiative properties of mineral dust aerosol, J. Geophys. Res.-Atmos., 101, 19237–19244, https://doi.org/10.1029/95JD03610, 1996.
Tegen, I., Lacis, A. A., and Fung, I.: The influence on climate forcing of mineral aerosols from disturbed soils, Nature, 380, 419–422, https://doi.org/10.1038/380419a0, 1996.
Tegen, I., Bierwirth, E., Heinold, B., Helmert, J., and Wendisch, M.: Effect of measured surface albedo on modeled Saharan dust solar radiative forcing, J. Geophys. Res.-Atmos., 115, D24312, https://doi.org/10.1029/2009JD013764, 2010.
Tindan, J. Z., Jin, Q., and Pu, B.: Understanding day–night differences in dust aerosols over the dust belt of North Africa, the Middle East, and Asia, Atmos. Chem. Phys., 23, 5435–5466, https://doi.org/10.5194/acp-23-5435-2023, 2023.
Urrutia-Pereira, M., Rizzo, L., Staffeld, P., Chong Neto, H., Viegi, G., and Solé, D.: Dust from the Sahara to the American Continent: Health impacts, Allergol. Immunopathol. (Madr.), 49, 187–194, https://doi.org/10.15586/aei.v49i4.436, 2021.
US Environmental Protection Agency: Air Quality System Data Mart, US Environmental Protection Agency [data set], https://www.epa.gov/outdoor-air-quality-data/download-daily-data, last access: 5 August 2022.
Villar-Argaiz, M., Cabrerizo, M. J., González-Olalla, J. M., Valiñas, M. S., Rajic, S., and Carrillo, P.: Growth impacts of Saharan dust, mineral nutrients, and CO2 on a planktonic herbivore in southern Mediterranean lakes, Sci. Total Environ., 639, 118–128, https://doi.org/10.1016/j.scitotenv.2018.05.041, 2018.
Vuolo, M. R., Chepfer, H., Menut, L., and Cesana, G.: Comparison of mineral dust layers vertical structures modeled with CHIMERE-DUST and observed with the CALIOP lidar, J. Geophys. Res.-Atmos., 114, D09214, https://doi.org/10.1029/2008JD011219, 2009.
Wang, C.: Variability of the Caribbean Low-Level Jet and its relations to climate, Clim. Dynam., 29, 411–422, https://doi.org/10.1007/s00382-007-0243-z, 2007.
Wang, C., Dong, S., Evan, A. T., Foltz, G. R., and Lee, S.-K.: Multidecadal Covariability of North Atlantic Sea Surface Temperature, African Dust, Sahel Rainfall, and Atlantic Hurricanes, J. Climate, 25, 5404–5415, https://doi.org/10.1175/JCLI-D-11-00413.1, 2012.
Wang, J., Petersen, W. A., and Wolff, D. B.: Validation of Satellite-Based Precipitation Products from TRMM to GPM, Remote Sens., 13, 1745, https://doi.org/10.3390/rs13091745, 2021.
Wang, Z., Zhong, R., Lai, C., and Chen, J.: Evaluation of the GPM IMERG satellite-based precipitation products and the hydrological utility, Atmos. Res., 196, 151–163, https://doi.org/10.1016/j.atmosres.2017.06.020, 2017.
Waters, S. M., Purdue, S. K., Armstrong, R., and Detrés, Y.: Metagenomic investigation of African dust events in the Caribbean, FEMS Microbiol. Lett., 367, fnaa051, https://doi.org/10.1093/femsle/fnaa051, 2020.
Weinzierl, B., Ansmann, A., Prospero, J. M., Althausen, D., Benker, N., Chouza, F., Dollner, M., Farrell, D., Fomba, W. K., Freudenthaler, V., Gasteiger, J., Groß, S., Haarig, M., Heinold, B., Kandler, K., Kristensen, T. B., Mayol-Bracero, O. L., Müller, T., Reitebuch, O., Sauer, D., Schäfler, A., Schepanski, K., Spanu, A., Tegen, I., Toledano, C., and Walser, A.: The Saharan Aerosol Long-Range Transport and Aerosol–Cloud-Interaction Experiment: Overview and Selected Highlights, B. Am. Meteorol. Soc., 98, 1427–1451, https://doi.org/10.1175/BAMS-D-15-00142.1, 2017.
Wielicki, B. A., Barkstrom, B. R., Harrison, E. F., Lee, R. B., Smith, G. L., and Cooper, J. E.: Clouds and the Earth's Radiant Energy System (CERES): An Earth Observing System Experiment, B. Am. Meteorol. Soc., 77, 853–868, https://doi.org/10.1175/1520-0477(1996)077<0853:CATERE>2.0.CO;2, 1996.
Wilcox, E. M., Lau, K. M., and Kim, K.-M.: A northward shift of the North Atlantic Ocean Intertropical Convergence Zone in response to summertime Saharan dust outbreaks, Geophys. Res. Lett., 37, L04804, https://doi.org/10.1029/2009GL041774, 2010.
Winker, D. M., Hunt, W. H., and Hostetler, C. A.: Status and performance of the CALIOP lidar, in: Laser Radar Techniques for Atmospheric Sensing, Proc. SPIE, 5575, 8–15, https://doi.org/10.1117/12.571955, 2004.
Winker, D. M., Hunt, W. H., and McGill, M. J.: Initial performance assessment of CALIOP, Geophys. Res. Lett., 34, L19803, https://doi.org/10.1029/2007GL030135, 2007.
Wu, C., Lin, Z., and Liu, X.: The global dust cycle and uncertainty in CMIP5 (Coupled Model Intercomparison Project phase 5) models, Atmos. Chem. Phys., 20, 10401–10425, https://doi.org/10.5194/acp-20-10401-2020, 2020.
Xu, H., Guo, J., Wang, Y., Zhao, C., Zhang, Z., Min, M., Miao, Y., Liu, H., He, J., Zhou, S., and Zhai, P.: Warming effect of dust aerosols modulated by overlapping clouds below, Atmos. Environ., 166, 393–402, https://doi.org/10.1016/j.atmosenv.2017.07.036, 2017.
Yin, Z.-Y., Maytubby, A., and Liu, X.: Variation Patterns of the ENSO's Effects on Dust Activity in North Africa, Arabian Peninsula, and Central Asia of the Dust Belt, Climate, 10, 150, https://doi.org/10.3390/cli10100150, 2022.
Yorks, J. E., McGill, M., Rodier, S., Vaughan, M., Hu, Y., and Hlavka, D.: Radiative effects of African dust and smoke observed from Clouds and the Earth's Radiant Energy System (CERES) and Cloud-Aerosol Lidar with Orthogonal Polarization (CALIOP) data, J. Geophys. Res.-Atmos., 114, D00H04, https://doi.org/10.1029/2009JD012000, 2009.
Yu, H., Kaufman, Y. J., Chin, M., Feingold, G., Remer, L. A., Anderson, T. L., Balkanski, Y., Bellouin, N., Boucher, O., Christopher, S., DeCola, P., Kahn, R., Koch, D., Loeb, N., Reddy, M. S., Schulz, M., Takemura, T., and Zhou, M.: A review of measurement-based assessments of the aerosol direct radiative effect and forcing, Atmos. Chem. Phys., 6, 613–666, https://doi.org/10.5194/acp-6-613-2006, 2006.
Yu, H., Chin, M., Bian, H., Yuan, T., Prospero, J. M., Omar, A. H., Remer, L. A., Winker, D. M., Yang, Y., Zhang, Y., and Zhang, Z.: Quantification of trans-Atlantic dust transport from seven-year (2007–2013) record of CALIPSO lidar measurements, Remote Sens. Environ., 159, 232–249, https://doi.org/10.1016/j.rse.2014.12.010, 2015a.
Yu, H., Chin, M., Yuan, T., Bian, H., Remer, L. A., Prospero, J. M., Omar, A., Winker, D., Yang, Y., Zhang, Y., Zhang, Z., and Zhao, C.: The fertilizing role of African dust in the Amazon rainforest: A first multiyear assessment based on data from Cloud-Aerosol Lidar and Infrared Pathfinder Satellite Observations, Geophys. Res. Lett., 42, 1984–1991, https://doi.org/10.1002/2015GL063040, 2015b.
Yu, H., Tan, Q., Chin, M., Remer, L. A., Kahn, R. A., Bian, H., Kim, D., Zhang, Z., Yuan, T., Omar, A. H., Winker, D. M., Levy, R. C., Kalashnikova, O., Crepeau, L., Capelle, V., and Chédin, A.: Estimates of African Dust Deposition Along the Trans-Atlantic Transit Using the Decadelong Record of Aerosol Measurements from CALIOP, MODIS, MISR, and IASI, J. Geophys. Res.-Atmos., 124, 7975–7996, https://doi.org/10.1029/2019JD030574, 2019.
Yu, H., Tan, Q., Zhou, L., Zhou, Y., Bian, H., Chin, M., Ryder, C. L., Levy, R. C., Pradhan, Y., Shi, Y., Song, Q., Zhang, Z., Colarco, P. R., Kim, D., Remer, L. A., Yuan, T., Mayol-Bracero, O., and Holben, B. N.: Observation and modeling of the historic “Godzilla” African dust intrusion into the Caribbean Basin and the southern US in June 2020, Atmos. Chem. Phys., 21, 12359–12383, https://doi.org/10.5194/acp-21-12359-2021, 2021.