the Creative Commons Attribution 4.0 License.
the Creative Commons Attribution 4.0 License.
 | 26 Jul 2024
Large contributions of soil emissions to the atmospheric nitrogen budget and their impacts on air quality and temperature rise in North China
Siyu Yang
Qingcai Chen
Liangqing Li
Xiaoyan Ma
Yan-Lin Zhang
Zhaozhong Feng
K. Folkert Boersma
Soil emissions of nitrogen compounds, including NO and HONO, play a significant role in the atmospheric nitrogen budget. However, HONO has been overlooked in previous research on soil reactive nitrogen (Nr) emissions and their impacts on air quality in China. This study estimates soil NOx and soil HONO emissions (SNOx and SHONO) in North China during July 2018 using an updated soil Nr emissions scheme in a chemical transport model, Unified Inputs (initial and boundary conditions) for Weather Research and Forecasting coupled with Chemistry (UI-WRF-Chem). The effects of soil Nr emissions on O3 pollution, air quality and temperature rise are also studied, with a focus on two key regions, Beijing–Tianjin–Hebei (BTH) and the Fenwei Plain (FWP), known for high soil Nr and anthropogenic emissions. We find that the flux of SNOx is nearly double that of SHONO. The monthly contributions of SNOx and SHONO account, respectively, for 37.3 % and 13.5 % of anthropogenic NOx emissions in BTH and for 29.2 % and 19.2 % in the FWP during July 2018. Soil Nr emissions have a significant impact on surface O3 and nitrate, exceeding SNOx or SHONO effects alone. On average, soil Nr emissions increase maximum daily 8 h (MDA8) O3 by 16.9 % and nitrate concentrations by 42.4 % in BTH, and they increase MDA8 O3 by 17.2 % and nitrate concentrations by 42.7 % in the FWP. Reducing anthropogenic NOx emissions leads to a more substantial suppressive effect of soil Nr emissions on O3 mitigation, particularly in BTH. Soil Nr emissions, through their role as precursors for secondary inorganic aerosols, can result in a slower increase rate of surface air temperature in future emissions reduction scenarios. This study suggests that mitigating O3 pollution and addressing climate change in China should consider the role of soil Nr emissions and their regional differences.
- Article
(7191 KB) - Full-text XML
-
Supplement
(1833 KB) - BibTeX
- EndNote


Surface ozone (O3) is a major air pollutant harmful to human health, terrestrial vegetation and crop growth (Z. Feng et al., 2022; Turner et al., 2016; Unger et al., 2020; Yue et al., 2017). China is facing serious O3 pollution, with the surface O3 concentrations routinely exceeding air quality standards (Li et al., 2019). Although the Chinese Action Plan on Air Pollution Prevention and Control implemented in 2013 has significantly reduced the nationwide anthropogenic emissions of primary pollutants, including particulate matter (PM) and nitrogen oxides (), the summertime O3 concentrations observed by national ground sites and satellite observations show an increasing trend of 1–3 ppbv a−1 in megacity clusters of East China from 2013 to 2019 (W. Wang et al., 2022; Wei et al., 2022). Many studies have explored the causes of O3 pollution from the perspective of changes in meteorology and anthropogenic emissions, and they have attributed the O3 increase to decreased PM levels and anthropogenic NOx emissions as well as adverse meteorological conditions (K. Li et al., 2019, 2020, 2021; Liu and Wang, 2020a, b; Lu et al., 2019).
Soil emissions are an important natural source of reactive nitrogen species (including N2O, NOx, HONO and NH3) and can strongly affect the atmospheric chemistry, air pollution and climate change (Elshorbany et al., 2012; Pinder et al., 2012). It has been acknowledged that the soil emissions account for 12 %–20 % of the total global average emissions of NOx (Vinken et al., 2014; Yan et al., 2005) and 40 %–51 % in agricultural regions during periods in which fertilizers are applied to soils, resulting in a significant increase in O3 and NO2 concentrations in the USA (Almaraz et al., 2018; Romer et al., 2018; Sha et al., 2021; Wang et al., 2021b), Europe (Skiba et al., 2020) and sub-Saharan Africa (Huang et al., 2018).
China has a large area of cultivated land ( km2, https://en.wikipedia.org/wiki/Land_use_statistics_by_country, last access: 18 December 2023), which contributes one-third of global nitrogen fertilizer use and which has extensive nitrogen deposition (Liu et al., 2013; Lu and Tian, 2017; Reay et al., 2008). So far, only a few studies have focused on the impact of soil NOx emissions (denoted as SNOx) on O3 pollution in China (Huang et al., 2023; Lu et al., 2021; Shen et al., 2023; Wang et al., 2008; R. Wang et al., 2022, 2023). Lu et al. (2021) demonstrated that the presence of SNOx in the North China Plain significantly reduced the sensitivity of surface O3 to anthropogenic emissions. Huang et al. (2023) suggested that substantial SNOx could increase maximum daily 8 h (MDA8) O3 concentrations by 8.0–12.5 µg m−3 on average for June 2018 in China. These studies focused only on NOx emitted from soils and neglected the fact that similar soil microbial activities also emit nitrous acid (HONO). The measurements in the laboratory showed that the emission rates of soil HONO were comparable to those of NO (Oswald et al., 2013; Weber et al., 2015). The photolysis of HONO has been identified as an important source of atmospheric hydroxyl radical (•OH), which enhances concentrations of hydroperoxyl (HO2) and organic peroxy radicals (RO2), accelerating the conversion of NO to NO2 and resulting in more concentrations of O3 and secondary pollutants. Although the sources and formation mechanisms of HONO are still not fully understood, recent model studies have suggested that HONO emissions from soils in the agriculture-intensive North China Plain could increase the regionally averaged daytime •OH, O3 and daily fine particulate nitrate concentrations (T. Feng et al., 2022; Wang et al., 2021a).
Only a few studies have simultaneously considered the impact of soil HONO emissions (denoted as SHONO) along with SNOx on O3 and other secondary pollutants (Tan et al., 2023; Y. Wang et al., 2023a). Y. Wang et al. (2023a) found that the NOx and HONO emissions from natural soils (i.e., soil background emissions) increased daily average O3 concentrations by 2.0 % in the Northeast Plain during August 2016, without considering the contribution from fertilized cropland. Tan et al. (2023) found that the contribution of soil NOx and HONO to O3 pollution saw an increasing trend from 2013 (5.0 pptv) to 2019 (8.0 pptv) in the summer seasons over the North China Plain by using the GEOS-Chem model. However, the coarse resolution of GEOS-Chem simulation may not be sufficient to resolve the spatial heterogeneity in soil emission distributions (Lu et al., 2021). Associated with the decreasing anthropogenic emissions is the increasing contribution of soil emissions to the atmospheric nitrogen budget in China. Therefore, it is critical to quantify the impact of soil reactive nitrogen (Nr: NOx and HONO) emissions on O3 and secondary pollutants.
In this study, we improve the soil Nr emissions scheme in the Unified Inputs (initial and boundary conditions) for Weather Research and Forecasting model coupled with Chemistry (UI-WRF-Chem) by considering all potential sources of HONO published in the literature. July 2018 was chosen as the study period because of severe O3 pollution during this month as well as higher air temperatures and more frequent precipitation compared to June and August (Figs. S1 and S2 in the Supplement), which could contribute to the enhanced soil Nr emissions (Fig. S3 in the Supplement). We conduct a series of sensitivity experiments to quantify the coupled and separate impacts of SNOx and SHONO on O3 and secondary pollutants during July 2018 over North China, focusing on two city clusters, the Beijing–Tianjin–Hebei (BTH) region and the Fenwei Plain (FWP) region, both of which have vast areas of cropland and dense populations and experience severe O3 and PM2.5 pollution. In addition, by quantitatively analyzing the difference in the responses of surface O3 concentrations and surface air temperatures to the anthropogenic emissions reductions in the presence or absence of soil Nr emissions, the roles of soil Nr emissions in O3 mitigation strategies and climate change are also studied. Our study is designed to address the underestimated role of soil Nr emission in O3 pollution, thereby providing a scientific basis for O3 mitigation strategies and climate change.
2.1 Model description
2.1.1 Model configurations, input data and non-soil HONO emissions
The UI-WRF-Chem model, developed from the standard version of WRF-Chem 3.8.1 (Grell et al., 2005), was used in this study. The 0.625°×0.5° Modern-Era Retrospective analysis for Research and Applications, Version 2 (MERRA-2) data provide the meteorological and chemical boundary and initial conditions (Gelaro et al., 2017). The 0.25°×0.25° Global Land Data Assimilation System (GLDAS) data provide the initial and boundary conditions of soil properties, i.e., soil moisture and temperature (Rodell et al., 2004). Details of meteorological and chemical position data for UI-WRF-Chem can be found in recent publications (Li et al., 2024; Y. Wang et al., 2023b). Anthropogenic emissions are imported from the Multi-resolution Emission Inventory model for Climate and air pollution research (MEIC: http://www.meicmodel.org/, last access: 1 December 2022) with a spatial resolution of 0.25°×0.25° for the year 2017. Due to the differences in spatial resolution and map projection between MEIC and the model grid, we applied a spatial interpolation method to convert MEIC to model-ready formats. The descriptions are given in Sect. S1 of the Supplement. Biomass burning emissions are from the Fire INventory from NCAR (FINN, version 1.5, https://www.acom.ucar.edu/Data/fire/, last access: 1 December 2022). Biogenic emissions are calculated using the Model of Emissions of Gases and Aerosols from Nature (MEGAN) version 2.1 (Guenther et al., 2012).
The physical and chemical schemes include the Morrison two-moment microphysical scheme (Morrison et al., 2009), the Grell 3-D cumulus scheme (Grell and Dévényi, 2002), the Rapid Radiative Transfer Model for General Circulation Models (RRTMG) for both longwave and shortwave radiation schemes (Iacono et al., 2008), the Yonsei University planetary boundary layer scheme (Hong et al., 2006) and the Noah land surface model (Tewari et al., 2004), and the Carbon Bond Mechanism Z (CBM-Z) for gas-phase chemistry and the Model for Simulating Aerosol Interactions and Chemistry (MOSAIC) aerosol module with four sectional aerosol bins and aqueous reactions (Zaveri and Peters, 1999; Zaveri et al., 2008) are adopted in the UI-WRF-Chem model. Two nested domains are used: domain one covers China with a horizontal resolution of 27 km and contains 112×112 grid cells; and domain two covers Central and East China and its surrounding area with a horizontal resolution of 9 km, containing 196×166 grid cells (study region shown in Fig. S4 in the Supplement). Both domains have 74 vertical levels from the surface to 50 hPa and 4 levels of soil. The simulations were conducted from 29 June to 31 July 2018, with the first 2 d as the spin-up period. The model outputs from 1 to 31 July 2018 are analyzed.
The default WRF-Chem model only considers the gas-phase formation of HONO (), thus underestimating the HONO concentrations. In this study, in addition to considering SHONO (details in Sect. 2.1.2), potential sources of HONO recognized in recent studies are also taken into account in the current model (Fu et al., 2019; Li et al., 2010; Ye et al., 2016, 2017; Zhang et al., 2016, 2020, 2021, 2022a, b), including traffic emissions, NO2 heterogeneous reactions on ground and aerosol surfaces as well as inorganic nitrate photolysis in the atmosphere. Through a series of tests and comparisons with observed surface HONO concentrations, the specific parameterization schemes of HONO sources adopted in this study are shown in Sect. S2 of the Supplement.
2.1.2 Parameterization of soil Nr emissions
The soil Nr emissions schemes in the UI-WRF-Chem model are updated in this study. The default SNOx scheme in UI-WRF-Chem, MEGAN v2.1, is replaced by the Berkeley–Dalhousie–Iowa Soil NO Parameterization (BDISNP), and the implementation of BDISNP can be found in Sha et al. (2021). Considering that the baseline year of N fertilizer data is 2006 and that the amount of N fertilizer application in China has changed in the past 10 years, we update the N fertilizer data to the year 2018 based on the N fertilizer application data at the provincial level from the statistical yearbook (Table S1 in the Supplement).
The process of soil HONO emission is similar to that of NOx, as both are influenced by the physical and chemical characteristics of soils. Consequently, soil emissions of HONO with consideration of their dependence on land type, soil humidity and temperature are also parameterized into the UI-WRF-Chem model. We first map the soil types measured in Oswald et al. (2013) (collected from 17 ecosystems in Table S2 in the Supplement) into the most closely matching MODIS land cover types in the model following T. Feng et al. (2022), as described in Table S3 in the Supplement. The optimal emission flux for each MODIS land cover type is calculated as the average of the measured fluxes from the category or categories in Oswald et al. (2013) that has or have been mapped into a specific MODIS classification. We also collect the SHONO data from various ecosystems in China published in different studies to correct the optimal SHONO fluxes in the model (Table S4 in the Supplement). These ecosystems include semiarid, fertilized and irrigated farmland in China. Consequently, the parameterization scheme takes into account the effect of fertilizer application on the SHONO. After that, the optimal fluxes over the domains are digested in the model and further scaled online according to the soil temperature and water content in each model grid at each time step throughout the simulation period using the following equation from Zhang et al. (2016):
where FN,opt(HONO) is the optimal flux of SHONO in terms of nitrogen. f(T) and f(SWC) are the scaling factors of soil temperature (T) and water content (SWC).
Ea is the activation energy of HONO (80 kJ mol−1), R is the gas constant, Topt is the temperature at which the optimal flux is emitted (298.15 K), T is the soil temperature calculated online by the model, f(SWC) is fitted based on the data curves in Figs. 1 and 3 in Oswald et al. (2013), and the equation is as follows:
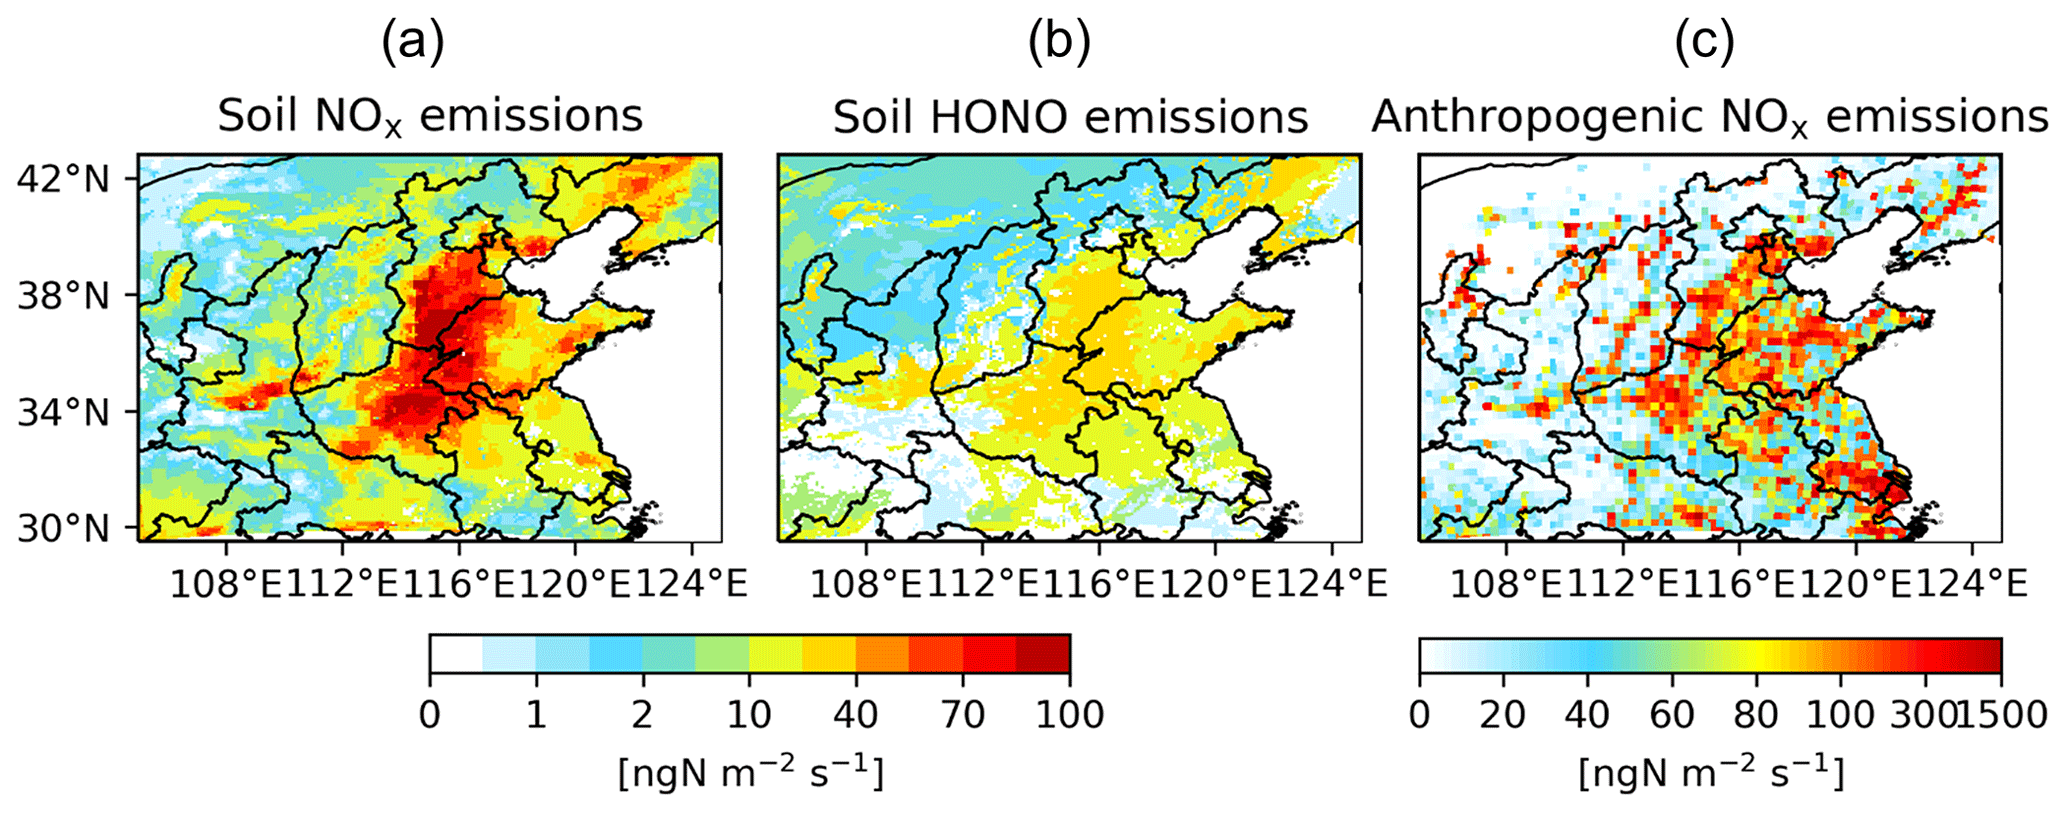
Figure 1Distribution of the simulated monthly mean (a) soil NOx emissions, (b) soil HONO emissions and (c) anthropogenic NOx emissions in North China in July 2018.
2.2 Model experiment design
The descriptions of the sensitivity simulations are given in Table 1. The Default simulation uses the MEGAN scheme to estimate SNOx, and no SHONO is considered. The Base simulation uses soil Nr emissions schemes with the improvement of using the BDISNP scheme for SNOx and with consideration of SHONO and four other HONO sources (as described above). Comparison of results from the Default and Base simulations is used to show the improvement in the model performance after updating the soil Nr emissions schemes and incorporating potential HONO sources. To explore the impact of soil Nr emissions on O3 and secondary pollutants, we conduct a series of sensitivity simulations with soil NOx and HONO emissions turned on or off separately or jointly (anthropogenic emissions for the year 2017), i.e., NoSoilNr, NoSHONO and NoSNOx. To investigate the relative importance and interaction between anthropogenic and natural emissions of nitrogen-containing pollutants, we conduct the Base_redANOx and NoSoil_redANOx simulations to evaluate the role of soil Nr emissions in O3 mitigation strategies, in which anthropogenic NOx emissions decreased by 20 %, 40 %, 60 %, 80 % and 100 %, respectively. Furthermore, considering the co-control of multiple air pollutants and greenhouse gas reductions in future emissions reduction scenarios, the Base_redAnt and NoSoil_redAnt simulations are conducted to evaluate the role of soil Nr emissions in air temperature change, and the anthropogenic reduction scenarios simultaneously consider SO2, NOx, primary PM2.5, volatile organic compounds (VOCs) and CO emissions reductions (reduced by 20 %, 40 %, 60 %, 80 % and 100 %).
Table 1Descriptions of the model simulation experiments.
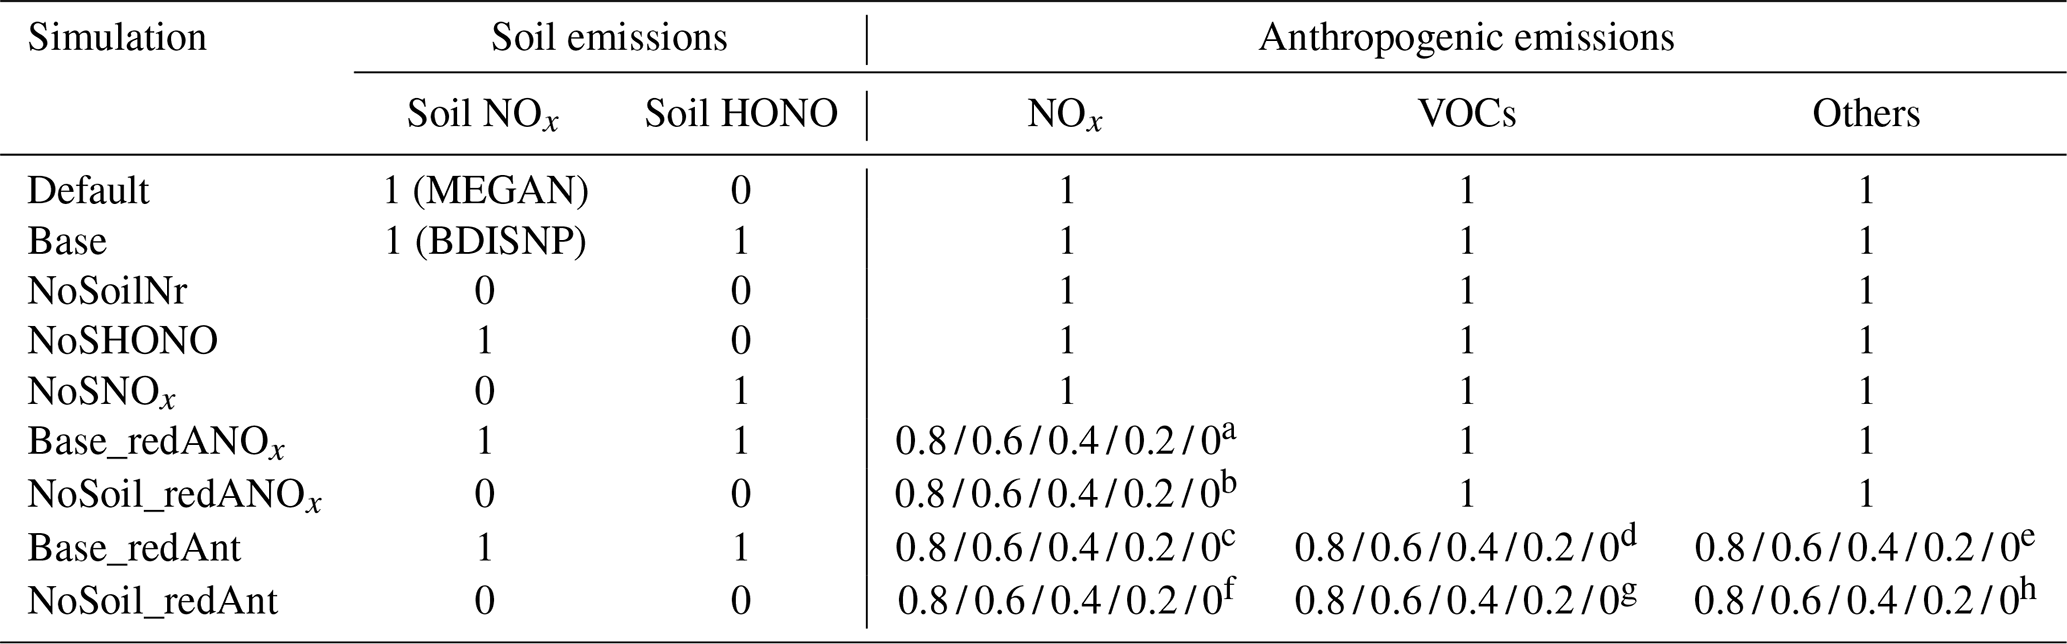
a–h The values represent the reduction ratios applied to the anthropogenic emissions in the sensitivity simulations compared to Base.
2.3 Observational data
The tropospheric column densities of NO2 from TROPOMI (TROPOspheric Monitoring Instrument) level 2 in version 1 with a horizontal spatial resolution of 3.5 km×7 km are used (Van Geffen et al., 2021). The quality controls, i.e., cloud-screened (cloud fraction below 30 %) and quality-assured (qa_value above 0.50), and the averaging kernels (AKs) are applied in the comparison of the TROPOMI- and UI-WRF-Chem-simulated tropospheric NO2 vertical column densities (defined as NO2 VCDs).
To evaluate the model performance in simulating surface air pollutants, we use the hourly surface O3 concentrations at 888 monitoring sites from the China National Environmental Monitoring Center (CNEMC) and the hourly surface HONO concentrations measured by the In-situ Gas and Aerosol Compositions (IGAC) monitor (Zhan et al., 2021) at Nanjing University of Information Science & Technology (NUIST) (32.2° N, 118.7° E; 22 m above sea level) (Xu et al., 2019).
3.1 Soil nitrogen emissions and air pollution evaluation
The soil Nr emissions in July are much higher than the other seasons due to higher air temperatures and frequent precipitation, accounting for 39.5 % of anthropogenic NOx emissions over the study region, i.e., 50.2 % in BTH and 47.4 % in the FWP, which is consistent with previous studies (Huang et al., 2023; Shen et al., 2023; Y. Wang et al., 2023a). The proportions can increase to 58.9 %, 57.0 % and 65.0 %, respectively, when statistics cover only the croplands in these regions (Fig. S3). Given the substantial contribution of soil emissions to the atmospheric nitrogen budget in July, we choose this month to assess the impact of soil Nr emissions on air quality and climate change. From the spatial distribution of simulated monthly mean SNOx and SHONO fluxes across North China in July 2018 (Fig. 1), it is shown that the SNOx flux is nearly double that of SHONO in most regions, and higher SNOx and SHONO are concentrated in areas dominated by cropland. The monthly total soil emissions over the whole study domain (cropland) are 104.5 (82.4) Gg N month−1 for NOx and 52.7 (45.9) Gg N month−1 for HONO. In the densely populated BTH region, the monthly total SNOx is 18.7 Gg N month−1 in July, which is equivalent to 37.3 % of the anthropogenic NOx emissions for the year 2017. For the FWP region, which also experiences severe O3 and PM2.5 pollution, the monthly total SNOx (7.0 Gg N month−1) accounts for 29.2 % of anthropogenic NOx emissions. The monthly total SHONO values in both study regions are much lower than their SNOx counterparts, with emissions of 6.9 and 4.6 Gg N month−1 accounting for 13.5 % and 19.2 % of anthropogenic NOx emissions in the BTH and FWP regions, respectively.
To evaluate the model performance, Fig. 2 shows the tropospheric NO2 VCD from TROPOMI satellite products and UI-WRF-Chem simulations (Default and Base) in North China during July 2018. Default and Base can both reproduce the hotspots of NO2 VCDs in the urban areas shown in the TROPOMI observations. However, Default significantly underestimates the NO2 VCD, especially in regions surrounding urban areas. It is found that Default underestimates the NO2 VCD by 48 % over the regions where soil emissions dominate (i.e., soil Nr emissions contribute more than half to the atmospheric nitrogen emissions), while Base reduced the bias to 13 % (Fig. S5 in the Supplement). Overall, Base shows improved performance in simulating the NO2 VCD in comparison to Default, with a decreasing bias from −30 % (−21 %) to +4 % (+17 %) and an increasing spatial correlation coefficient (R) from 0.62 (0.50) to 0.65 (0.54) in the study region (cropland). However, there is still a discrepancy between the Base simulation and the TROPOMI NO2 VCD. This discrepancy could be driven by the combined effects of uncertainties in simulations and observations associated with the time lag in the anthropogenic emissions inventory used in the model (Chen et al., 2021) and instantaneous uncertainties in the TROPOMI tropospheric NO2 VCD at the pixel level (up to 25 %–50 % or 0.5–0.6×10¹⁵ molecules cm−2). Uncertainties in the stratospheric portion of the NO2 VCD and AK caused the retrieval errors (Van Geffen et al., 2020, 2021). Additionally, the estimated SNOx values are subjected to certain limitations and uncertainties. The first uncertainty comes from the amount of N fertilizer application, which has been identified as the dominant contributor to SNOx. In this study, we use the amount of agricultural N fertilizer application at the provincial level from the statistical yearbook to update the default N fertilizer application data in the model (the baseline year for 2006), but a recent study showed that compound fertilizers, usually with nitrogen (N), phosphorus (P) and potassium (K), were more commonly used in China. If only N fertilizer is considered to nudge the N fertilizer application data in the model, the estimated SNOx may be underestimated by 11.1 %–41.5 % (Huang et al., 2023). Furthermore, we use the modeled green vegetation fraction (GVF) to determine the distribution of arid (GVF≤30 %) and non-arid (GVF>30 %) regions. Huber et al. (2023) showed that the estimated SNOx based on the static classification of arid and non-arid is very sensitive to the soil moisture and thus could not produce self-consistent results when using different input soil moisture products, unless a normalized soil moisture index is to be represented. Therefore, more direct measurements of soil Nr fluxes are crucial for better constraining soil emissions and improving the parameterization in the model. Nevertheless, the improved simulation performance of the NO2 VCD with a reduced bias and increased spatial correlation coefficient in Base is credible, and the soil Nr emissions scheme has the fidelity needed to study the implication of the soil Nr emissions for air quality in North China.
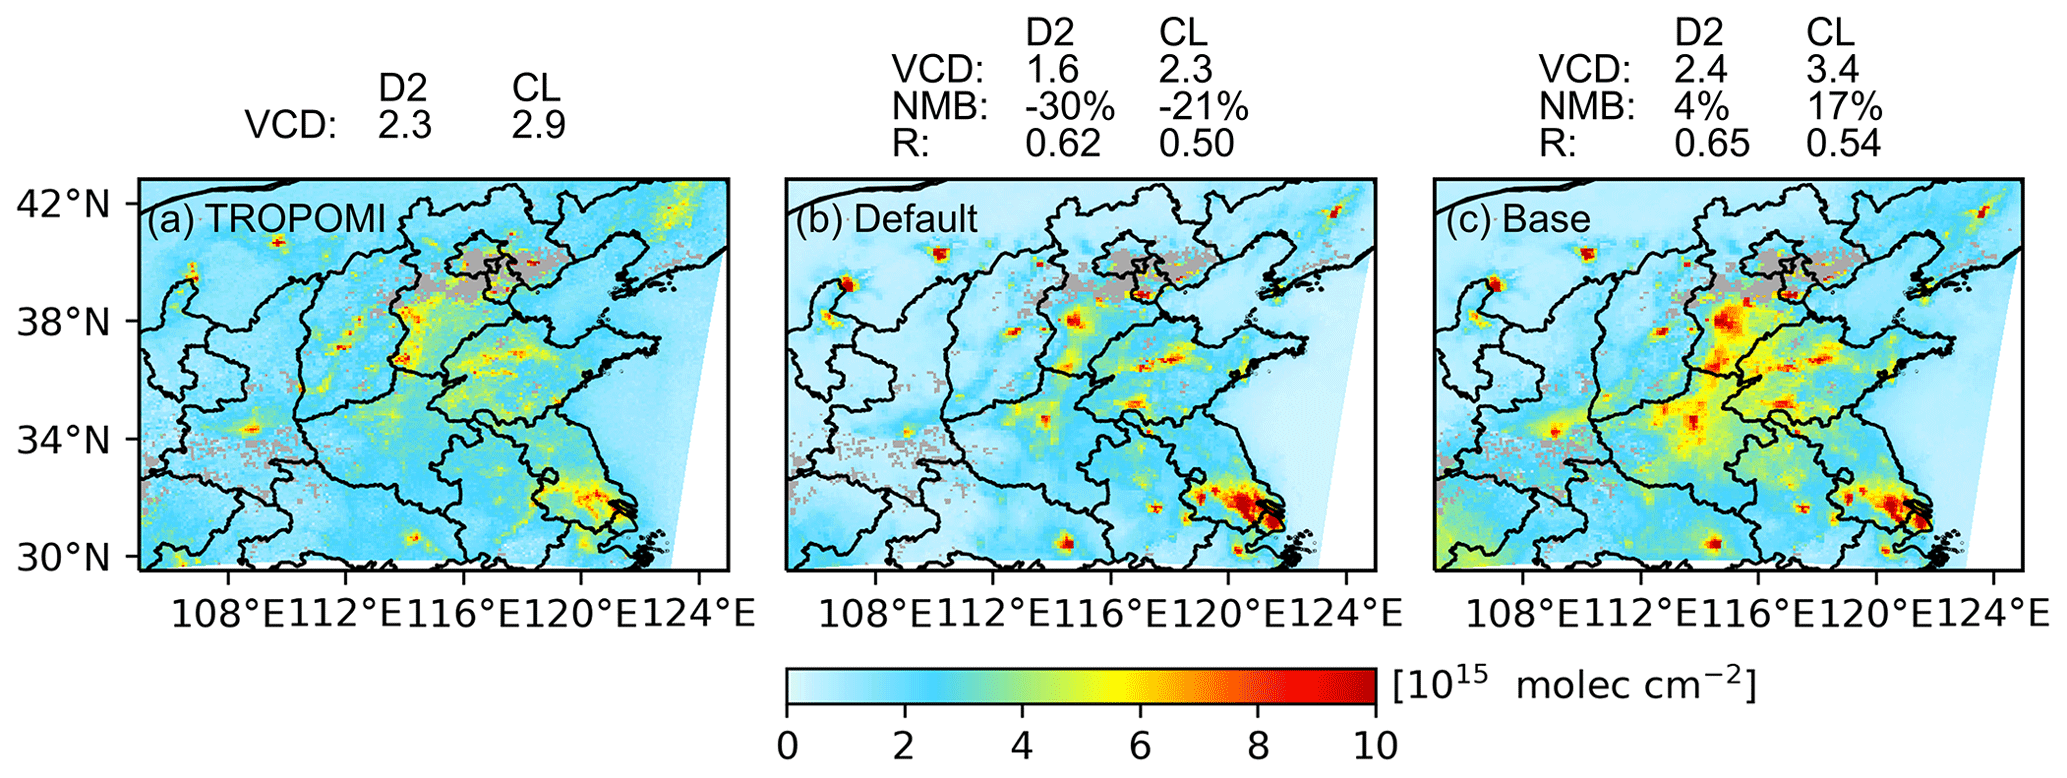
Figure 2(a) Monthly mean tropospheric NO2 VCD retrieved by TROPOMI, measured at 12:00–14:00 LT and simulated by (b) Default and (c) Base and averaged over the same periods in July 2018 in North China.
We evaluate the simulation with the surface O3 observations from the CNEMC network (http://www.cnemc.cn/en/, last access: 1 September 2022) (Fig. 3). Over the whole study region, Base can better capture the spatial distribution of the observed surface MDA8 O3, with a relatively higher spatial correlation of R=0.68 than that in Default (R=0.46). The simulated monthly averaged MDA8 O3 concentrations across the 888 sites in the study region are 123.0 µg m−3 in Default and 132.5 µg m−3 in Base, respectively, which are both slightly higher than the observed concentration (120.7 µg m−3). Overprediction is also observed for the FWP and BTH regions in the Base simulation, with normalized mean biases (NMBs) of 6.1 % and 4.9 %, respectively (Fig. S6 in the Supplement). Previous studies showed that the NMBs of simulated O3 concentrations were within ±30 % for nearly 80 % of the cases collected from air quality model studies (Yang and Zhao, 2023). These discrepancies may arise from simplifications of complex chemical mechanisms and physical processes, such as dry deposition and vertical mixing (Akimoto et al., 2019; Travis and Jacob, 2019). The uncertainties of input data, including emission inventories, meteorological fields and other parameters, may also contribute to these discrepancies (Sun et al., 2019; Ye et al., 2022), suggesting a potential systematic O3 bias in air quality models. Therefore, the increased spatial correlation and reasonable bias found in Base indicate that the application of the soil Nr emissions schemes can effectively improve the simulation performance of the MDA8 O3.
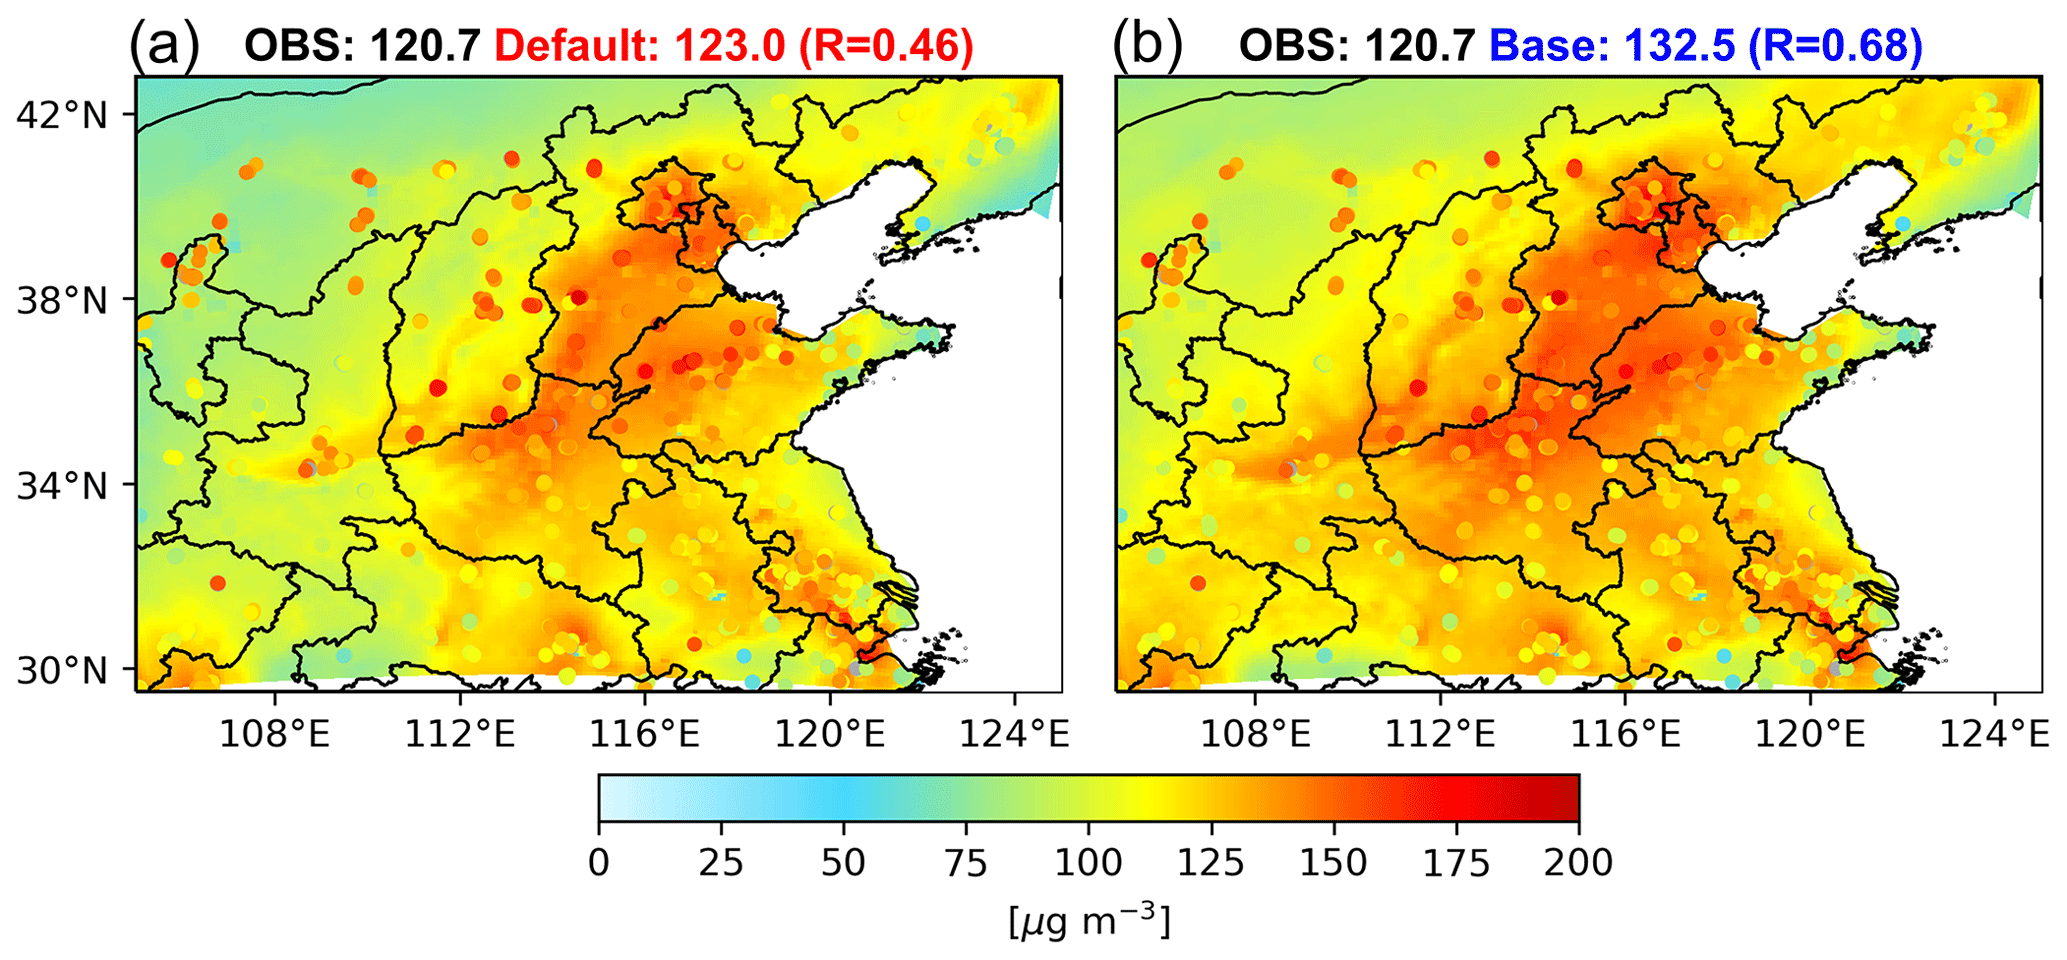
Figure 3Distribution of observed (dotted) and simulated (shaded) surface MDA8 O3 from (a) Default and (b) Base in North China in July 2018. The statistics in the upper corners of the panels are the monthly mean MDA8 O3 concentrations averaged over the study region and the R between the observations and the simulations.
We also compare the simulated surface HONO and nitrate concentrations to the observations at a rural station in Nanjing during July 2018. Figure 4 shows that the simulated HONO concentrations in Default are 98.3 % lower than the observations. In comparison, Base (which considers SHONO and other potential HONO sources) significantly improves the simulation performance and reduces the bias to 47.8 %. It also reproduces the diurnal variation of HONO with a temporal correlation of R=0.76. It is worth noting that the simulated concentrations of HONO from 08:00 to 18:00 LT are lower than the observations. This discrepancy may be attributed to the underestimated contribution from the predominant sources of HONO during the daytime, such as NO2 heterogeneous reactions on ground and aerosol surfaces. Moreover, the contributions of different sources to ambient HONO concentrations at this rural station are also evaluated, and the soil emissions could contribute almost 25.8 % to the surface HONO concentrations, which may be partially attributed to the high emissions of HONO from cropland around the city of Nanjing (Fig. S7 in the Supplement). The result that soil emissions contribute less to the daytime positive flux than the other source is consistent with previous studies (Skiba et al., 2020; Y. Wang et al., 2023a). For nitrate concentration, the Base simulation shows a lower bias (5.6 %) and an improved diurnal variation (temporal correlation of R=0.92) compared to the Default simulation (bias=27.8 %, R=0.85). We acknowledge that there are certain uncertainties in the current model. Nevertheless, the improved simulation performance of the NO2 VCD, surface HONO, MDA8 O3 and nitrate concentrations compared to Default illustrates the credibility of the results obtained from the Base simulation.
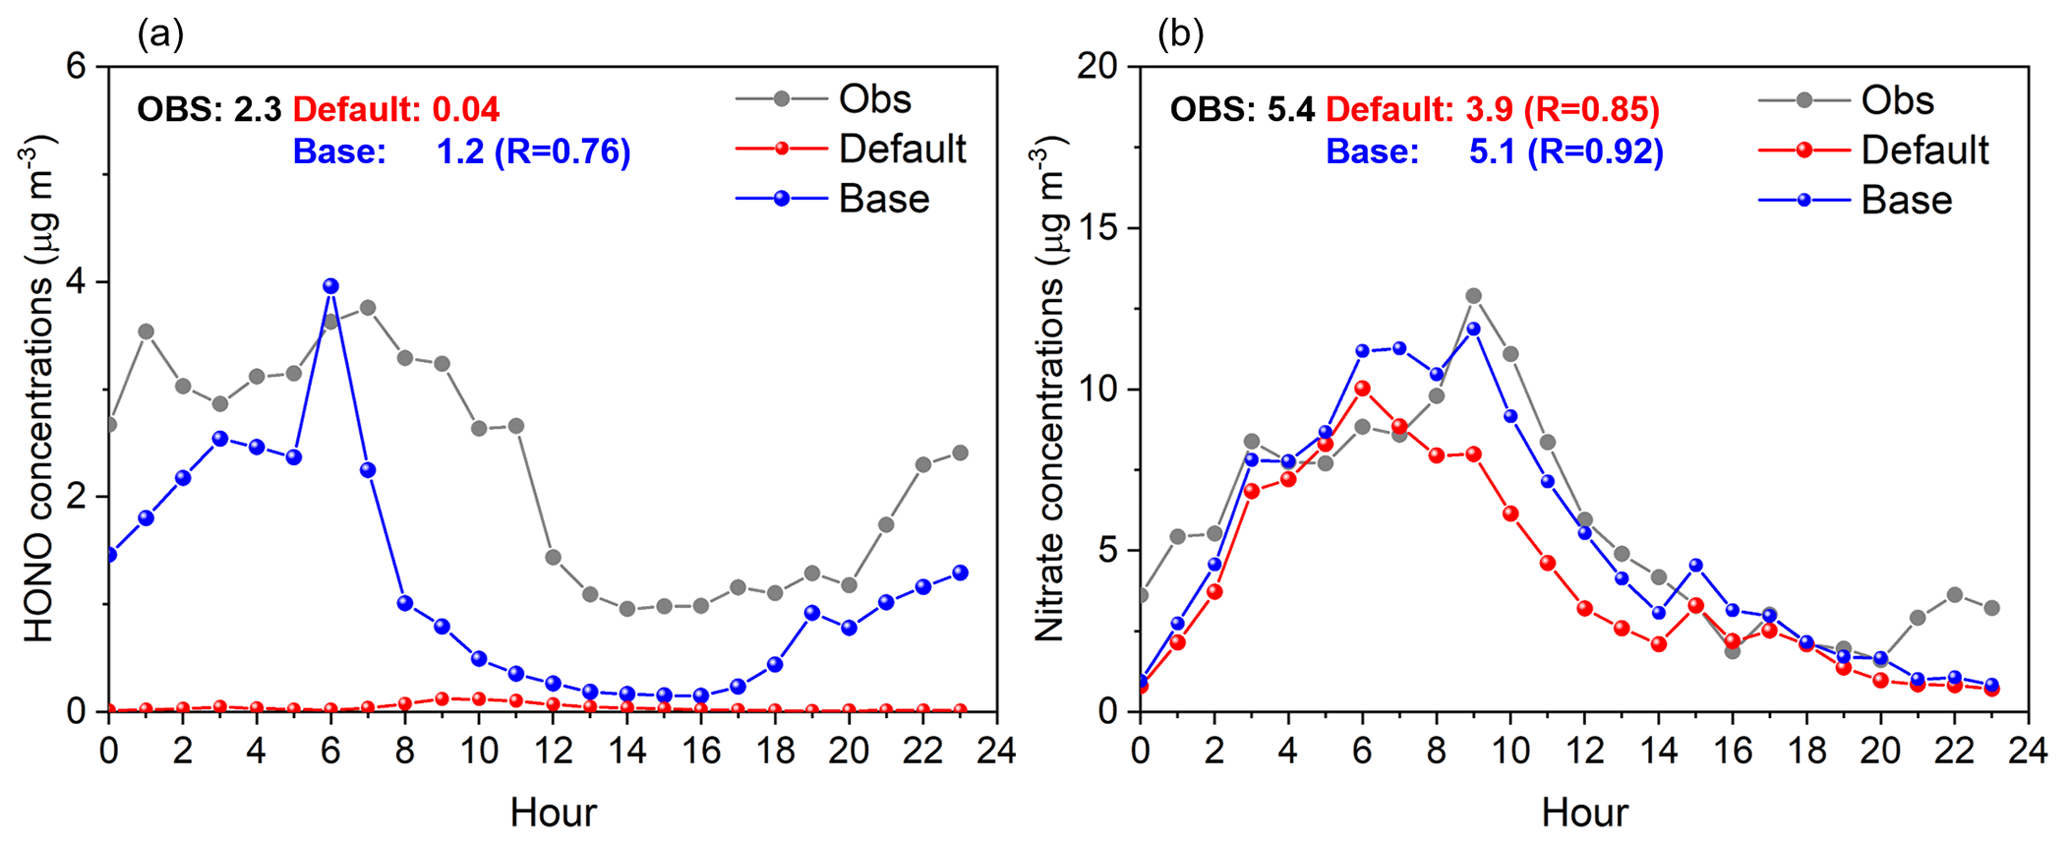
Figure 4Diurnal variation of observed (in grey) and simulated (Default in red and Base in blue) surface (a) HONO and (b) nitrate concentrations at a rural station in Nanjing in July 2018, with the mean value and R shown in the upper-right corner.
3.2 Impact on O3 formation and air quality
To quantify the effects of SNOx and SHONO on atmospheric oxidation capacity, O3 formation and air quality as well as their combined effect, the conventional brute-force method was used; i.e., the impact of a specific source was determined in atmospheric chemistry models as the differences between the standard and base simulations with all the emissions turned on and a sensitivity simulation with this source turned off or perturbed (Table 1). As shown in Fig. 5, the contribution of SNOx and SHONO to surface NO2 and HONO has a different spatial pattern from that of the fluxes of SNOx and SHONO in July. Overall, the maximum contribution of SNOx to the monthly average surface NO2 concentrations is 78.6 %, with a domain-averaged value of 30.3 %. Regionally, SNOx contributes 5.5 µg m−3 (37.1 %) and 2.5 µg m−3 (31.8 %) to the surface NO2 in the BTH and FWP regions, respectively, which are both higher than the domain-averaged contribution. Although SHONO fluxes are lower than those of SNOx in this period, their effect on ambient HONO cannot be ignored. Over the study region, the contribution of SHONO to the surface HONO concentration ranges from 0 % to 49.0 %, with a domain-averaged value of 35.6 %. For the selected key regions, there are 1.8 µg m−3 (36.7 %) and 1.5 µg m−3 (38.0 %) of the monthly average HONO concentrations in the BTH and FWP regions, respectively, from soil emissions. It is noteworthy that, despite the surface NO2 (HONO) concentrations in the study regions being impacted by less than 13 % (17 %) due to SHONO (SNOx), the combined effects of soil Nr emissions on HONO are found to be greater than the individual effects, which are 38.4 % (40.3 %) for BTH and 33.9 % (40.1 %) for the FWP region, respectively (Table S5 in the Supplement). These results highlight the importance of considering the cumulative impacts of multiple reactive nitrogen emissions from soils on air pollution.
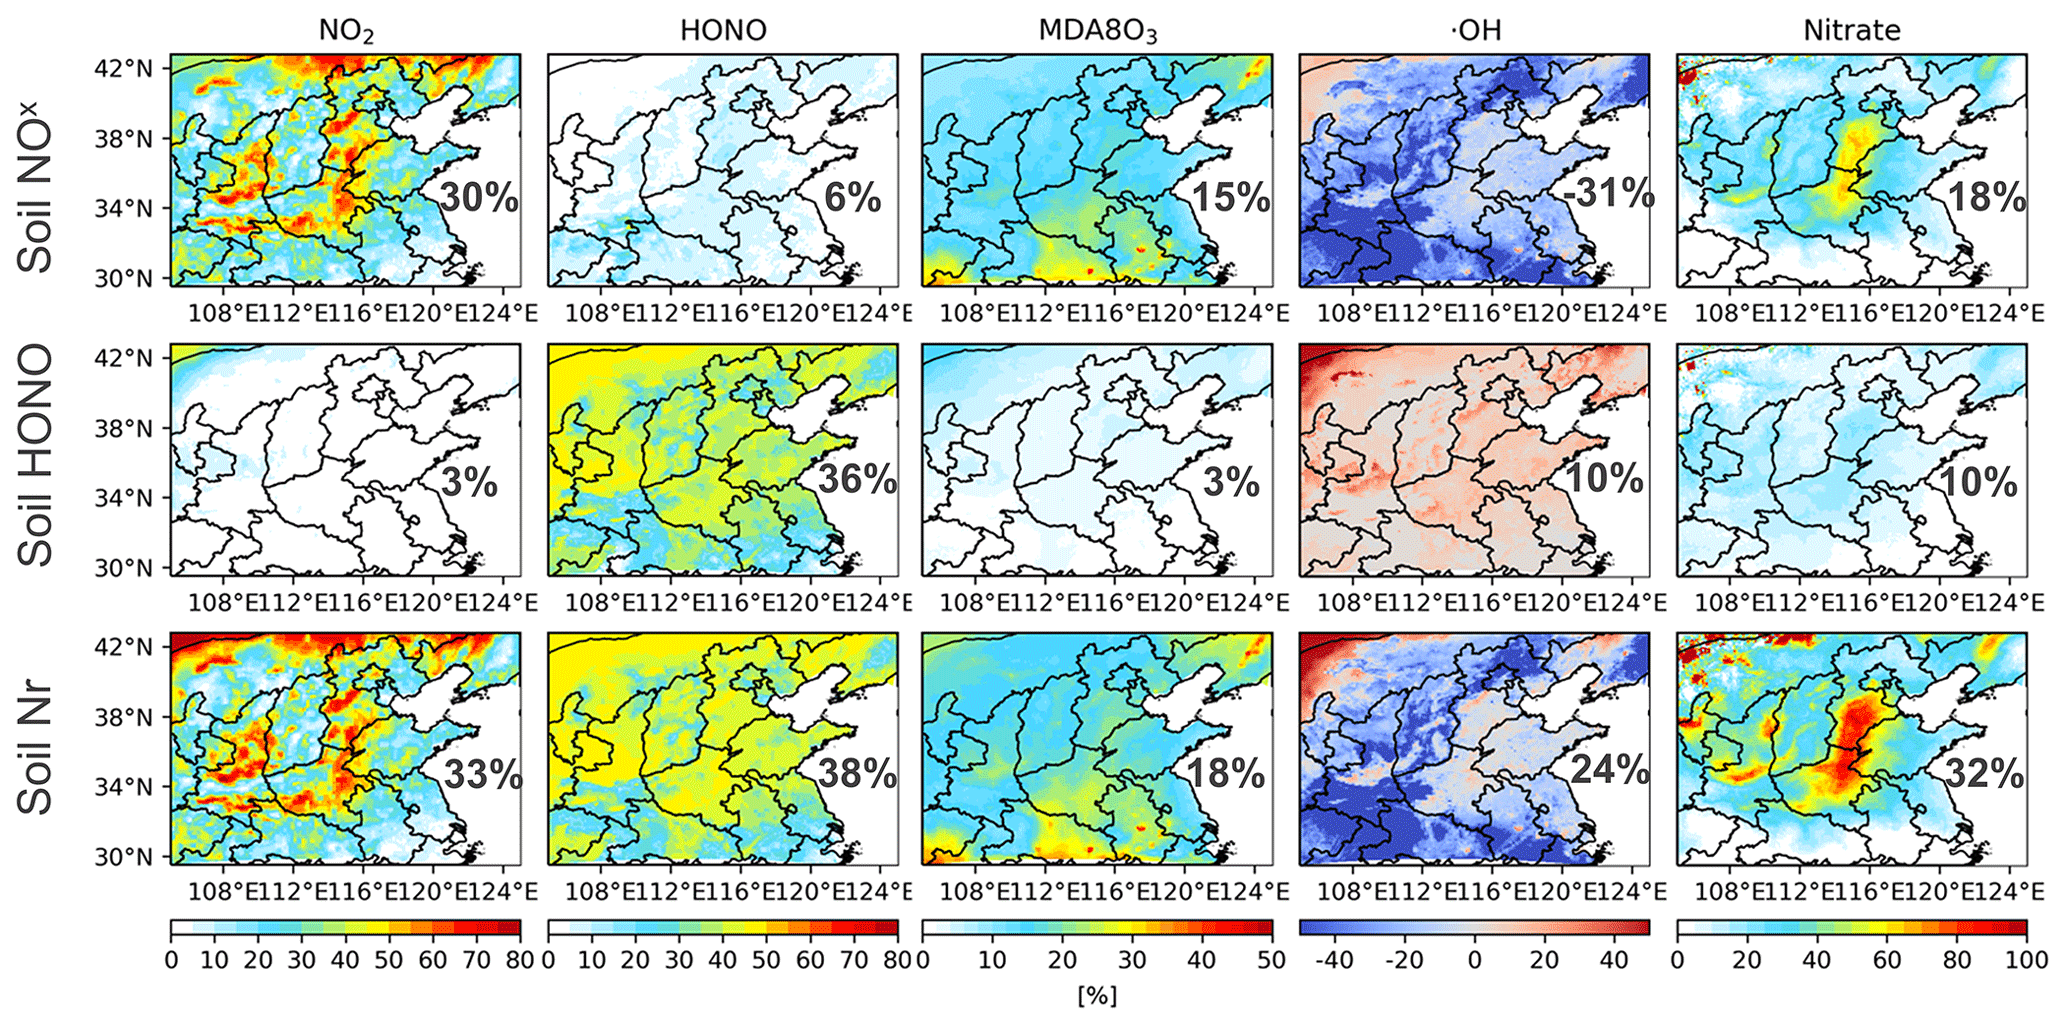
Figure 5Simulated effects of soil Nr emissions on air quality in North China in July 2018. The first and second rows show the contributions of soil NOx and soil HONO emissions to monthly average concentrations of NO2, HONO, MDA8 O3, max-1 h •OH and nitrate, respectively. The third row shows the combined effect of soil Nr emissions on the species listed above. Statistics in the right corner of each panel are the mean values averaged over the study region.
Consequently, substantial soil Nr emissions in July have a non-negligible effect on atmospheric oxidation and the formation of secondary pollutants. For atmospheric oxidation, we assess the impact of soil Nr emission on the maximum 1 h (max-1 h) •OH levels and find that SHONO has the potential to increase the max-1 h •OH in most areas, with a domain-averaged increase of 10.0 %. In contrast, the inclusion of SNOx results in a significant reduction of 31.3 % in the max-1 h •OH across the entire study domain. Considering the combined effect of SNOx and SHONO, there is an overall decrease of 24.3 % in the max-1 h •OH over the study domain, with the BTH region experiencing a decrease of 22.6 % and the FWP region showing a relatively greater reduction of 32.2 % (Table S6 in the Supplement). These findings are different from the previous study, which showed that soil background emissions including NOx and HONO led to a 7.5 % increase in the max-1 h •OH in China (Y. Wang et al., 2023a). The discrepancy between our findings and those of other studies regarding the impact of SNOx on •OH levels could be attributed to the abundance of ambient NH3 in China during summer, when soil emissions may lead to a significant increase in nitrate, and the increased aerosols can affect the concentrations of •OH through photochemical reactions (Wang et al., 2011; Xu et al., 2022). Additionally, after taking into account the SNOx in the model, the environment may shift to a relatively NOx-saturated regime, and thus the termination reaction for O3 production could be NO2 or •OH to generate HNO3 (Chen et al., 2022; W. Wang et al., 2023). We also stress the crucial role of SNOx in influencing •OH concentrations and highlight the varying impacts across different regions. For secondary pollutants, substantial O3 enhancement is found in Henan and Hubei provinces, while the increase in nitrate is consistent with the spatial pattern of surface NO2 from soil emissions. Specifically, soil Nr emissions increase the monthly average MDA8 O3 and nitrate concentrations by 18.2 % and 31.8 %, respectively, across the study domain, with increases of 16.9 % and 42.4 % in the BTH region and 17.2 % and 42.7 % in the FWP region. Moreover, SNOx has a stronger effect on O3 and nitrate in North China in July than those of SHONO.
The ratio of surface H2O2–HNO3 concentrations (hereafter ) was used as an indicator of the O3 formation regime to study the changes in the sensitivity of summer O3 to its precursors after considering the soil Nr emissions. The threshold of for determining the O3 formation regime varies regionally (Sillman, 1995). Thus, in this study, we identify the regions with values greater than 0.65 as NOx-sensitive regimes, regions with values lower than 0.35 as VOC-sensitive regimes and regions with values between 0.35 and 0.65 as VOC–NOx mixed sensitive regimes (Shen et al., 2023). Figure 6 illustrates that the majority of the BTH region has values lower than 0.35 in the Base simulation, indicating a VOC-sensitive regime or a NOx-saturated regime in July. In contrast, the distribution of the sensitivity of O3 to precursor emission in the FWP region is more complex, with a mixture of three O3 formation regimes. The spatial patterns of O3 formation regimes presented in this study are consistent with the previous studies based on satellite observations and model simulations during the summer seasons, despite using a different method (Wang et al., 2019; W. Wang et al., 2023). This agreement across multiple approaches strengthens confidence in the spatial patterns of O3 formation regimes in the key regions of China. However, when soil nitrogen emissions are excluded, the values mostly increase within 40 %, and the O3 formation regime shifts to a VOC–NOx mixed sensitive regime and a NOx-sensitive regime in both the BTH and FWP regions. Although soil Nr emissions are lower than anthropogenic emissions, they could still affect the sensitivity of O3 to its precursors and thus have an impact on the effectiveness of emissions reduction policies. Therefore, soil emissions must be considered in formatting policies for the prevention and management of O3 pollution.
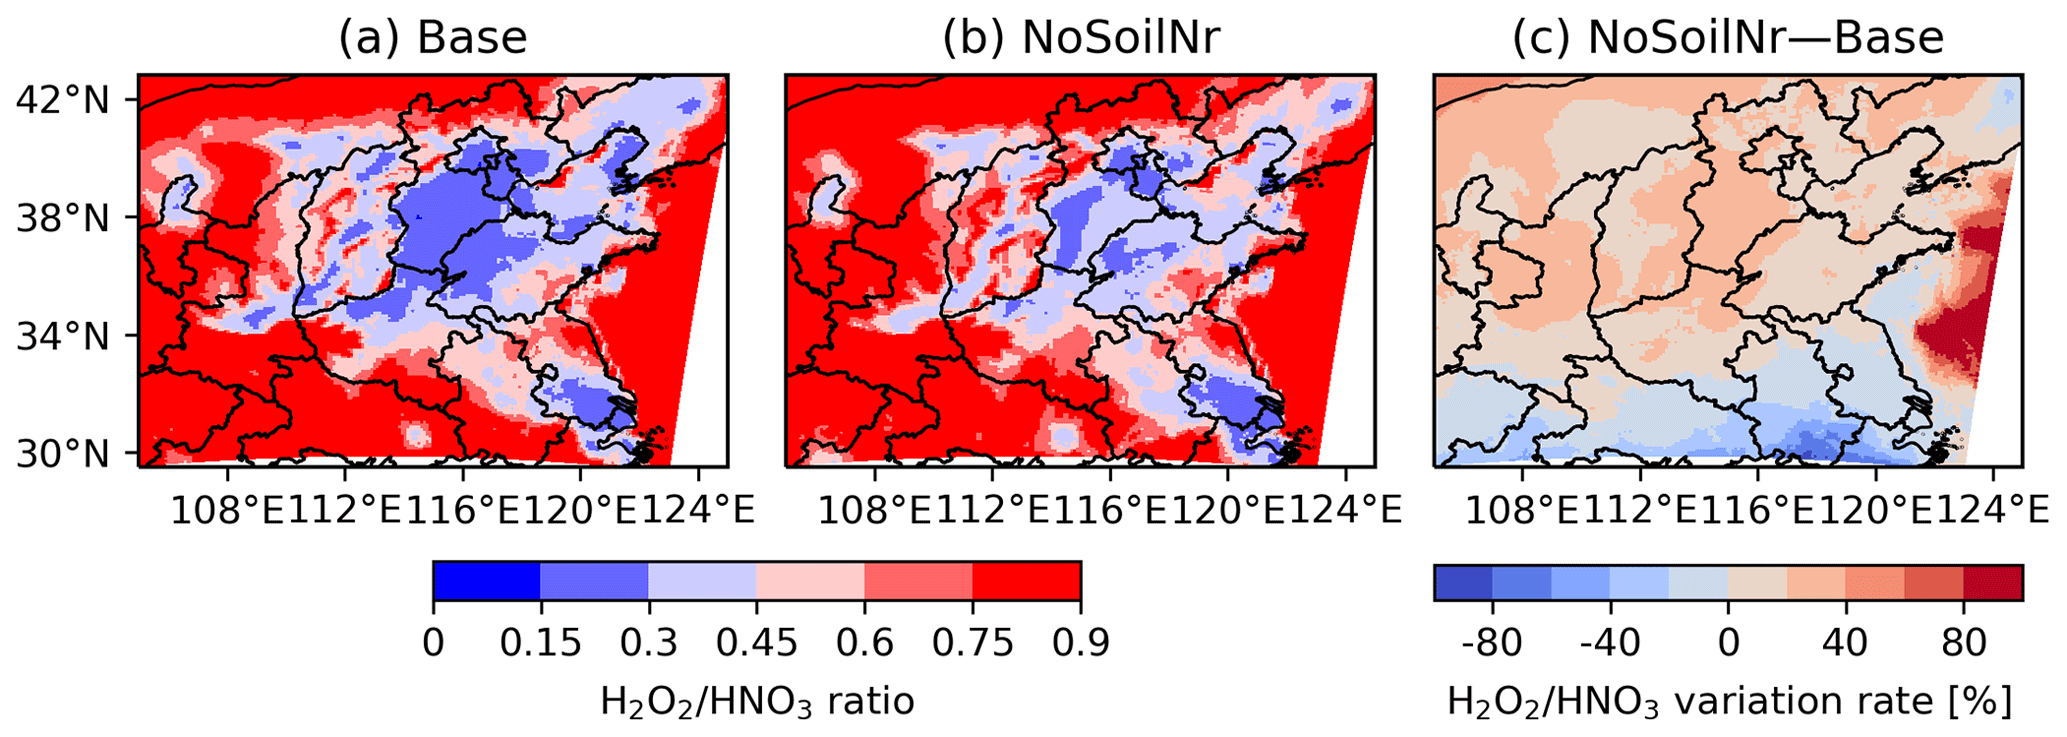
Figure 6Distribution of the O3 formation regimes (represented as ratios) in North China in July 2018 for (a) the Base simulation with the addition of soil Nr emissions and (b) the NoSoilNr simulation without the addition of soil Nr emissions. (c) Changes in the distribution of O3 formation regimes due to the soil Nr emissions.
3.3 Implication for O3 mitigation strategies and temperature rises
Due to the influence of soil Nr emissions, the sensitivity of O3 pollution to its precursors varies spatially, depending on the local levels of anthropogenic emissions. It is thus important to quantify the role of soil Nr emissions in O3 pollution regulation to improve the effectiveness of air control measures. We conduct a series of sensitivity experiments with anthropogenic NOx emissions reduced by 20 %, 40 %, 60 %, 80 % and 100 %, respectively, relative to the Base simulation (Table 1), and we analyze the difference in the response of surface O3 concentrations to the anthropogenic NOx emissions reductions in the presence and absence of soil Nr emissions. Figure 7 shows that, with the reduction in anthropogenic NOx emissions, MDA8 O3 concentrations show an accelerated decreasing trend, suggesting increasing efficiency of anthropogenic NOx control measures. The MDA8 O3 response to anthropogenic NOx emissions in the BTH region is more curved (nonlinear) than that in the FWP region, which is consistent with the fact that BTH tends to have a more NOx-saturated regime (Fig. 6).
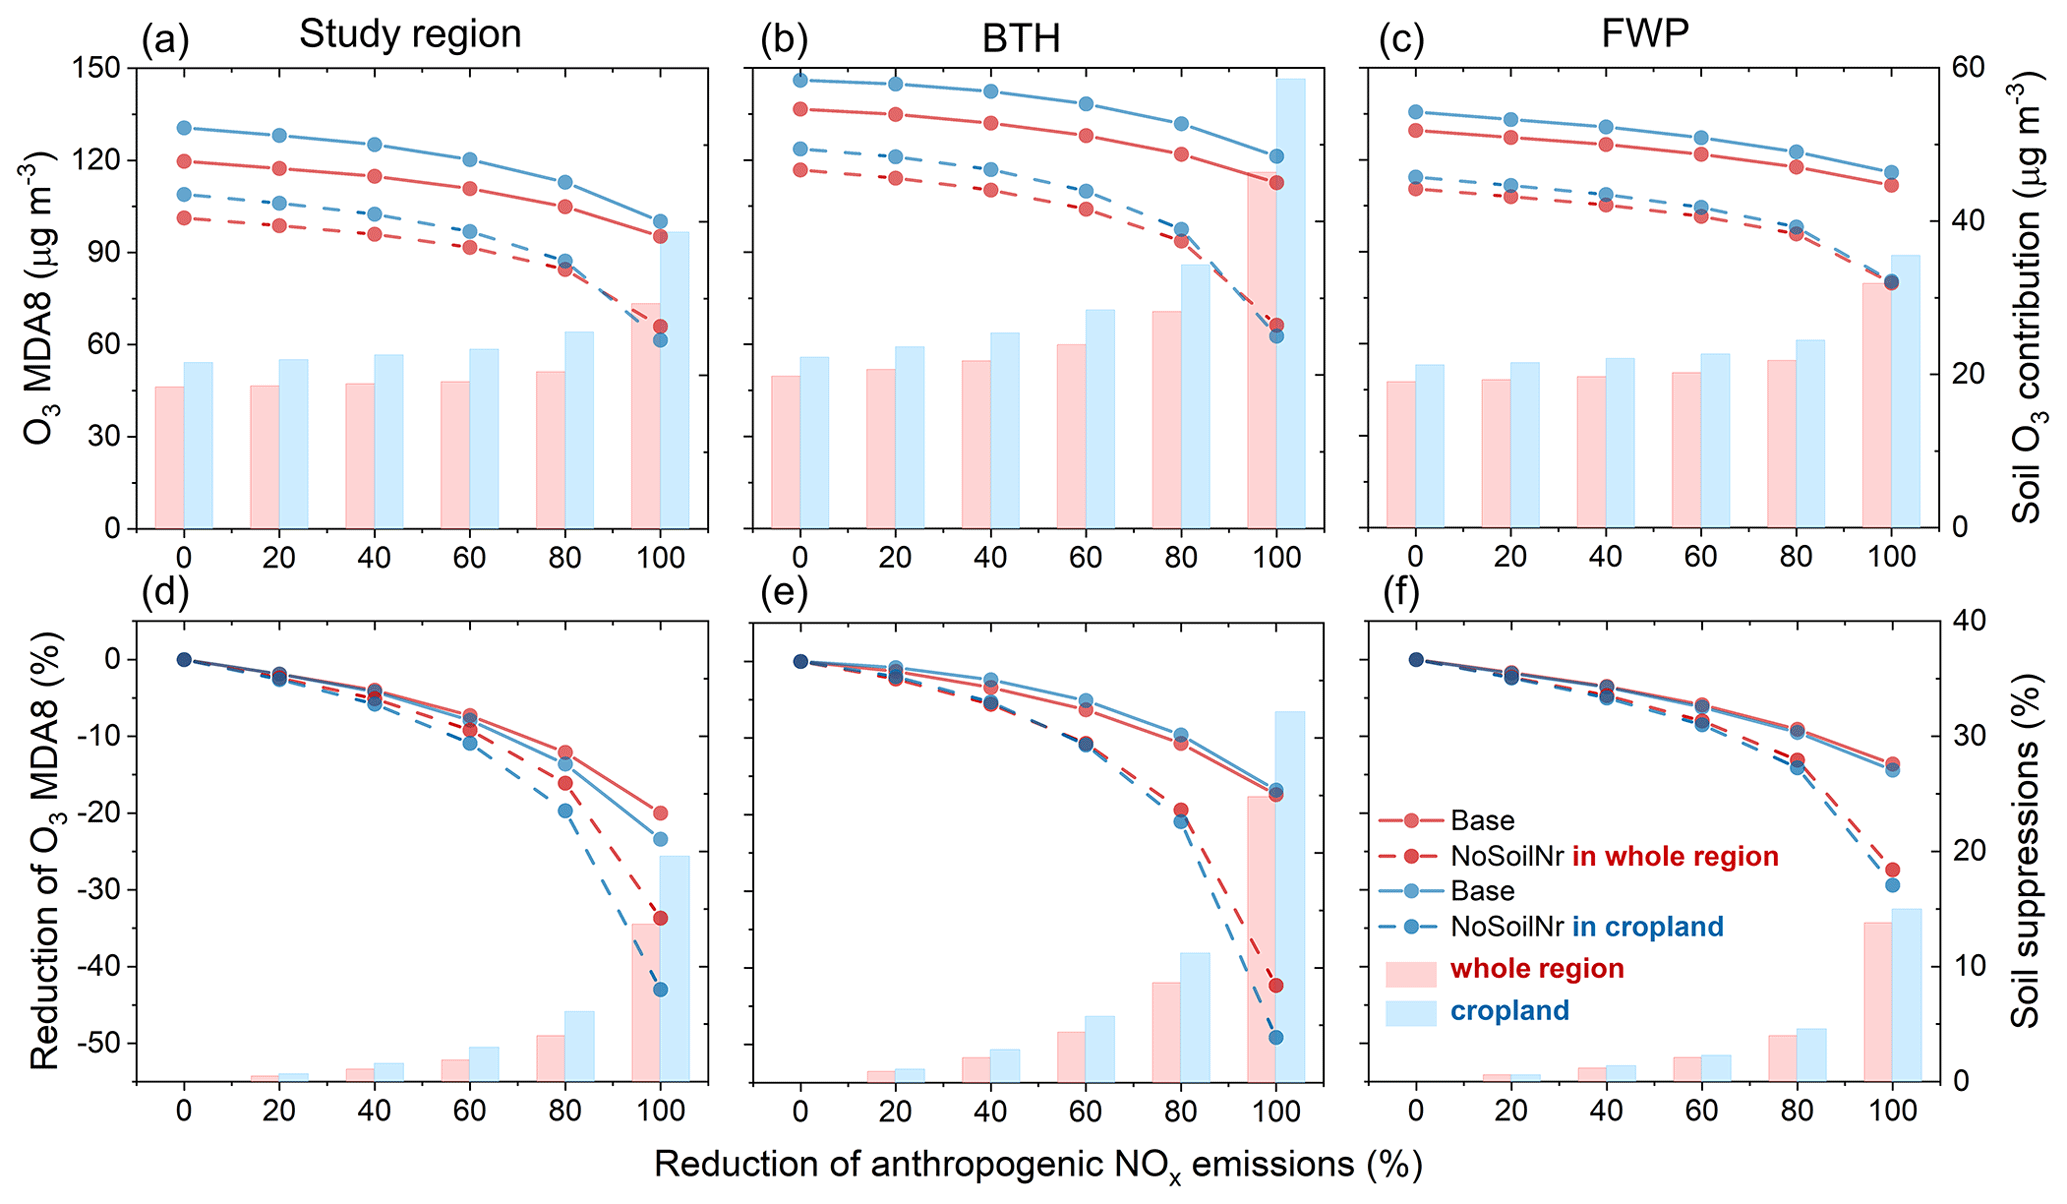
Figure 7Role of soil Nr emissions in O3 pollution regulation in North China in July 2018, with the responses of MDA8 O3 concentrations to the reductions in anthropogenic NOx emissions (20 %, 40 %, 60 %, 80 % and 100 %) relative to July 2018 levels, in the presence (solid line) and absence (dotted line) of soil Nr emissions in the BTH region and FWP region. (The lines in panels a–c and d–f are the MDA8 O3 concentrations and the relative reductions in MDA8 O3 for different anthropogenic NOx emissions reductions, respectively. The red bars (right y axis) in panels a–c show the corresponding O3 contribution from soil Nr emissions, which is determined as the difference between the solid and dotted lines, and the blue bars are the same as the red bars but for statistics on cropland. The red bars (right y axis) in panels d–f show the suppression of O3 pollution mitigated due to the existence of soil Nr emissions, which are determined as the difference between the solid and dotted lines, and the blue bars are the same as the red bars but for statistics on cropland.)
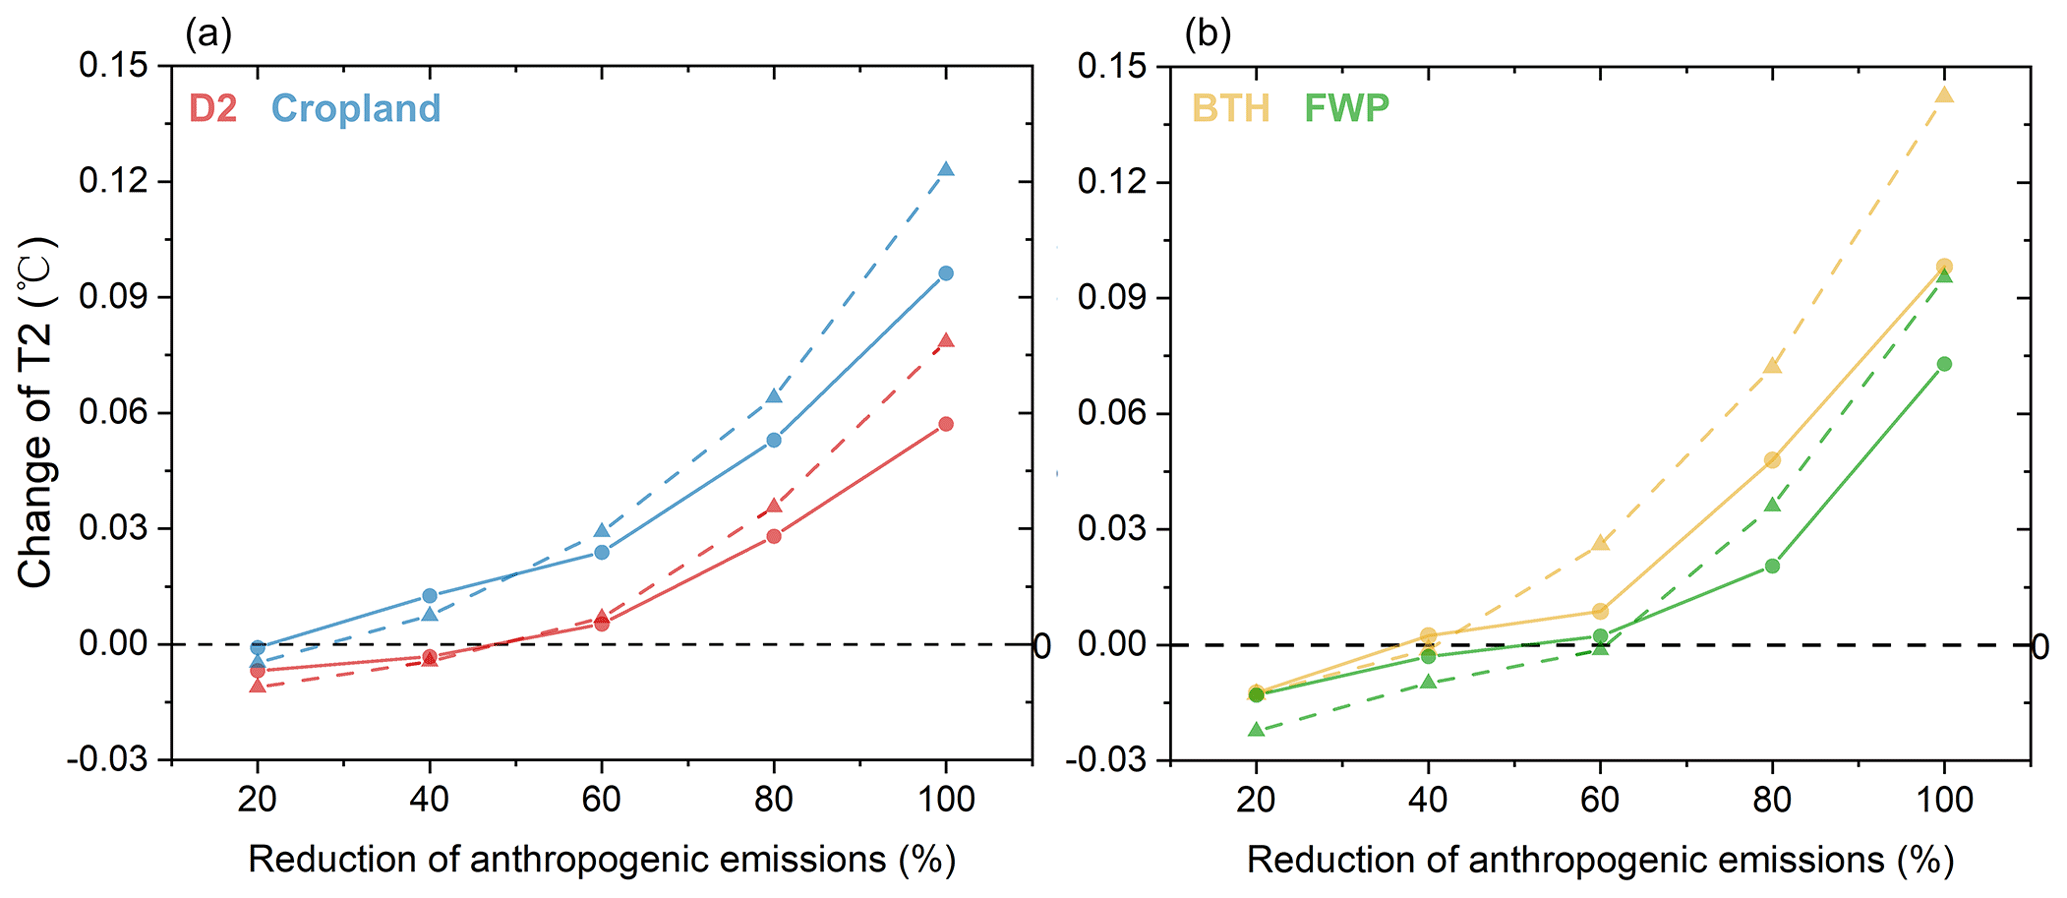
Figure 8The responses of air temperature at 2 m (T2) to the reductions in anthropogenic emissions (taking into account the SO2, NOx, primary PM2.5, VOCs and CO reduced by 20 %, 40 %, 60 %, 80 % and 100 %) relative to July 2018 levels in the presence (solid line) and absence (dotted line) of soil Nr emissions (a) in the study region and (b) in the BTH and FWP regions.
It is notable that the reduction in anthropogenic NOx emissions in the presence of soil Nr emissions leads to a slower decrease in MDA8 O3 compared to when soil Nr emissions are excluded. We further analyze the details of the domain-averaged MDA8 O3 changes in different anthropogenic reduction scenarios for the two key regions. Specifically, in the BTH region, MDA8 O3 decreases by 1.3 % (1.8 µg m−3), 6.3 % (8.7 µg m−3) and 17.4 % (24.0 µg m−3) with anthropogenic NOx emissions reductions of 20 %, 60 % and 100 %, respectively, in the presence of soil Nr emissions. Comparatively, in the absence of soil Nr emissions, the reductions in MDA8 O3 are more pronounced and decrease by 2.3 % (2.7 µg m−3), 10.7 % (12.8 µg m−3) and 42.3 % (50.6 µg m−3), respectively. In the FWP region, with a 20 % reduction in anthropogenic NOx emissions, MDA8 O3 levels only exhibit a slight decrease of 1.7 % (2.3 µg m−3) in the presence of soil Nr emissions, whereas a decrease of 2.3 % (2.6 µg m−3) is found in the absence of soil Nr emissions. When anthropogenic NOx emissions are removed entirely, MDA8 O3 decreases by 13.6 % (17.7 µg m−3) in the presence of soil Nr emissions, and more significant decreases are found in the absence of soil Nr emissions, with a reduction of 27.4 % (34.0 µg m−3) (as shown in Fig. 7b, c, e and f). We conclude that the existence of soil Nr emissions could contribute to an additional part of O3 production, amounting to ranges of 0 %–24.9 % in BTH and 0 %–13.8 % in the FWP in July, and these suppressions could be enlarged over the rural areas, which have more substantial soil Nr emissions, i.e., 0 %–32.3 % in cropland over BTH and 0 %–15.0 % in cropland over the FWP. These findings suggest that soil Nr emissions have the potential to suppress the effectiveness of measures implemented to mitigate O3 pollution, and this effect becomes more significant as anthropogenic NOx emissions decrease.
We also quantify the O3 generated from soil Nr emission sources (denoted as the soil O3) in July in the different anthropogenic NOx emissions reduction scenarios. Overall, soil O3 concentrations in croplands are higher than in non-croplands. Regionally, in BTH, the soil O3 concentrations are 19.8 µg m−3 at a high anthropogenic emissions level (referred to as the Base simulation), while the soil O3 concentrations significantly increase to 46.4 µg m−3 when all anthropogenic NOx emissions are cut down (shown as the red bars in Fig. 7b). A similar trend is also found in the FWP region. Although soil Nr emissions are relatively lower than those in the BTH region, the soil O3 concentrations are 19.0 µg m−3 in the Base simulation and do not change significantly with the reduction in anthropogenic emissions, but they increase to 31.9 µg m−3 when anthropogenic NOx emissions are excluded (shown as the red bars in Fig. 7c). The reduction in anthropogenic NOx emissions results in a shift of the O3 formation regime towards a more NOx-sensitive regime, leading to a higher contribution of O3 from soil emission sources. We conclude that, with stricter anthropogenic emissions reduction measures, the contributions of soil Nr emissions to O3 production in both absolute and relative values would increase and further hamper the effectiveness of anthropogenic emissions reductions. To effectively mitigate O3 pollution, it is necessary to implement much stricter control measures for anthropogenic emissions, including coal burning and transportation due to the synergistic effects of SNOx and SHONO.
Here we show that the substantial soil Nr emissions present an additional challenge for O3 pollution regulation in North China. We further assess the impact of soil Nr emissions on air temperature change in different anthropogenic emissions reduction scenarios. Against the background of climate change, future emissions reduction scenarios should focus on the co-control of multiple air pollutants and greenhouse gas reductions. Therefore, we conduct multi-pollutant co-control reduction scenarios, taking into account the SO2, NOx, primary PM2.5, VOC and CO emissions reduced by 20 %, 40 %, 60 %, 80 % and 100 %, respectively, to investigate the impact of soil Nr emissions on air temperature change in different anthropogenic reduction scenarios (Table 1). By comparing changes in air temperature at 2 m (T2) with and without soil Nr emissions in different reduction scenarios, Fig. 8 shows that incorporating soil Nr emissions results in a slower rate of T2 increase compared to scenarios without soil Nr emissions, especially when multi-pollutant emissions are reduced by more than half, and this phenomenon is consistent across all the study regions. In the FWP region, when anthropogenic emissions are eliminated, T2 increases by 0.073 °C in the presence of soil Nr emissions compared to 0.095 °C in the absence of soil Nr emissions. In the BTH region, which has relatively high anthropogenic emissions, reducing multi-pollutant emissions by the same proportion could result in relatively higher warming, and T2 increases by 0.098 °C in the presence of soil Nr emissions compared to 0.14 °C in the absence of soil Nr emissions when anthropogenic emissions are excluded. This is attributed to the effective radiative forcing (ERF) associated with the cooling effects of primary pollutants (e.g., SO2, NOx) and secondary inorganic aerosols (SIAs), and a positive ERF is associated with the warming effects of CO and VOCs (high confidence) (Bellouin et al., 2020; Liao and Xie, 2021). Decreases in primary pollutant emissions and SIA concentrations could weaken the cooling effect and potentially accelerate warming to some extent, and the decrease in CO and VOC emissions may still lead to temperature rise in the short term. However, the soil Nr emissions could contribute to a certain background concentration of aerosol, partially offsetting the temperature rise caused by declining anthropogenic emissions of primary pollutants and greenhouse gases (Fig. S8 in the Supplement). Therefore, although soil Nr emissions are relatively low compared to anthropogenic emissions, the combined effects of NOx and HONO emissions from natural soil and agricultural land should be considered when assessing climate change and implementing strategies to mitigate O3 pollution.
In this study, the updated soil Nr emissions scheme was implemented in the UI-WRF-Chem model and used to estimate the combined and individual impacts of SNOx and SHONO on subsequent changes in air quality and air temperature rise in North China, with a focus on two key regions (the BTH and FWP regions) because of high levels of soil Nr and anthropogenic emissions. We showed that the SNOx fluxes are almost twice as high as SHONO during July 2018, with higher soil emissions in areas with extensive cropland. The contribution of soil Nr emissions in July to the monthly average NO2 and HONO are 38.4 % and 40.3 % in BTH and 33.9 % and 40.1 % in the FWP region, respectively, and the substantial soil Nr emissions lead to a considerable increase in the monthly average MDA8 O3 and nitrate concentrations, with values of 16.9 % and 42.4 % in the BTH region and 17.2 % and 42.7 % in the FWP region, which both exceed the individual SNOx or SHONO effect. The presence of soil Nr emissions, acting as precursors of O3 and SIA, has a suppressing effect on efforts to mitigate summer O3 pollution, particularly in the BTH region, and also leads to a slower increase rate of T2 (0.098 °C) in July compared to scenarios without soil Nr emissions (0.14 °C) when anthropogenic emissions are excluded. We note that the effect of soil Nr emissions shows spatial heterogeneity in different anthropogenic emissions reduction scenarios.
However, we admit that uncertainties exist in both the soil Nr and anthropogenic emissions as well as the parameterization scheme of HONO sources. The agricultural emissions of another important reactive nitrogen gas, NH3, may also be underestimated due to uncertainties in agricultural fertilizer application and livestock waste in MEIC (B. Li et al., 2021). These uncertainties could impact the aerosol formation and local cooling effect. Also, the discrepancies between the simulated and observed NO2, O3 and other air pollutants in the model may affect the assessment of the role of soil Nr emissions in O3 mitigation strategies and their impact on climate change. Thus, more direct measurements of soil Nr fluxes are crucial for better constraining soil emissions and improving the parameterization in the model.
Our study highlights that, despite soil Nr emissions being lower than anthropogenic emissions, they still have a substantial impact on the effectiveness of O3 pollution mitigation measures, and this effect becomes more significant as anthropogenic emissions decrease. Therefore, reactive nitrogen from soil emission sources must be considered in formatting measures for the prevention and management of O3 pollution as well as in addressing climate change.
The MEIC inventory is from http://www.meicmodel.org/ (MEIC Team, 2012). The surface O3 observations are from the China National Environmental Monitoring Centre (http://www.cnemc.cn/en/, CNEMC, 2014). The TROPOMI NO2 product is from the NASA Goddard Earth Sciences Data and Information Services Center (https://doi.org/10.5270/S5P-s4ljg54, KNMI, 2018). The other data, model outputs and codes can be accessed by contacting Tong Sha (tong-sha@sust.edu.cn).
The supplement related to this article is available online at: https://doi.org/10.5194/acp-24-8441-2024-supplement.
TS carried out the model simulation, data analysis and manuscript writing. TS and JW proposed the idea. SY, QC and LL supervised this work and revised the manuscript. XM, ZF and KFB helped with the revision of the manuscript. YLZ provided and analyzed the observation data.
The contact author has declared that none of the authors has any competing interests.
Publisher's note: Copernicus Publications remains neutral with regard to jurisdictional claims made in the text, published maps, institutional affiliations, or any other geographical representation in this paper. While Copernicus Publications makes every effort to include appropriate place names, the final responsibility lies with the authors.
Jun Wang's participation is made possible by the in-kind support from the University of Iowa.
This research has been supported by the National Natural Science Foundation of China (grant nos. 42205107 and 42130714).
This paper was edited by Leiming Zhang and reviewed by Fei Liu and one anonymous referee.
Akimoto, H., Nagashima, T., Li, J., Fu, J. S., Ji, D., Tan, J., and Wang, Z.: Comparison of surface ozone simulation among selected regional models in MICS-Asia III – effects of chemistry and vertical transport for the causes of difference, Atmos. Chem. Phys., 19, 603–615, https://doi.org/10.5194/acp-19-603-2019, 2019.
Almaraz, M., Bai, E., Wang, C., Trousdell, J., Conley, S., Faloona, I., and Houlton, B. Z.: Agriculture is a major source of NOx pollution in California, Sci. Adv., 4, eaao3477, https://doi.org/10.1126/sciadv.aao3477, 2018.
Bellouin, N., Quaas, J., Gryspeerdt, E., Kinne, S., Stier, P., Watson‐Parris, D., Boucher, O., Carslaw, K. S., Christensen, M., Daniau, A.-L., Dufresne, J.-L., Feingold, G., Fiedler, S., Forster, P., Gettelman, A., Haywood, J. M., Lohmann, U., Malavelle, F., Mauritsen, T., McCoy, D. T., Myhre, G., Mülmenstädt, J., Neubauer, D., Possner, A., Rugenstein, M., Sato, Y., Schulz, M., Schwartz, S. E., Sourdeval, O., Storelvmo, T., Toll, V., Winker, D., and Stevens, B.: Bounding global aerosol radiative forcing of climate change, Rev. Geophys., 58, e2019RG000660, https://doi.org/10.1029/2019RG000660, 2020.
Chen, K., Wang, P., Zhao, H., Wang, P., Gao, A., Myllyvirta, L., and Zhang, H.: Summertime O3 and related health risks in the north China plain: A modeling study using two anthropogenic emission inventories, Atmos. Environ., 246, 118087, https://doi.org/10.1016/j.atmosenv.2020.118087, 2021.
Chen, W., Guenther, A. B., Jia, S., Mao, J., Yan, F., Wang, X., and Shao, M.: Synergistic effects of biogenic volatile organic compounds and soil nitric oxide emissions on summertime ozone formation in China, Sci. Total Environ., 828, 154218, https://doi.org/10.1016/j.scitotenv.2022.154218, 2022.
CNEMC (China National Environmental Monitoring Centre): In situ measurements of surface O3 over China, CNEMC [data set], http://www.cnemc.cn/en/ (last access: 1 September 2022), 2014.
Elshorbany, Y. F., Steil, B., Brühl, C., and Lelieveld, J.: Impact of HONO on global atmospheric chemistry calculated with an empirical parameterization in the EMAC model, Atmos. Chem. Phys., 12, 9977–10000, https://doi.org/10.5194/acp-12-9977-2012, 2012.
Feng, T., Zhao, S., Liu, L., Long, X., Gao, C., and Wu, N.: Nitrous acid emission from soil bacteria and related environmental effect over the North China Plain, Chemosphere, 287, 132034, https://doi.org/10.1016/j.chemosphere.2021.132034, 2022.
Feng, Z., Xu, Y., Kobayashi, K., Dai, L., Zhang, T., Agathokleous, E., Calatayud, V., Paoletti, E., Mukherjee, A., Agrawal, M., Park, R. J., Oak, Y. J., and Yue, X.: Ozone pollution threatens the production of major staple crops in East Asia, Nat. Food, 3, 47–56, https://doi.org/10.1038/s43016-021-00422-6, 2022.
Fu, X., Wang, T., Zhang, L., Li, Q., Wang, Z., Xia, M., Yun, H., Wang, W., Yu, C., Yue, D., Zhou, Y., Zheng, J., and Han, R.: The significant contribution of HONO to secondary pollutants during a severe winter pollution event in southern China, Atmos. Chem. Phys., 19, 1–14, https://doi.org/10.5194/acp-19-1-2019, 2019.
Gelaro, R., McCarty, W., Suárez, M. J., Todling, R., Molod, A., Takacs, L., Randles, C. A., Darmenov, A., Bosilovich, M. G., Reichle, R., Wargan, K., Coy, L., Cullather, R., Draper, C., Akella, S., Buchard, V., Conaty, A., da Silva, A. M., Gu, W., Kim, G.-K., Koster, R., Lucchesi, R., Merkova, D., Nielsen, J. E., Partyka, G., Pawson, S., Putman, W., Rienecker, M., Schubert, S. D., Sienkiewicz, M., and Zhao, B.: The Modern-Era Retrospective Analysis for Research and Applications, Version 2 (MERRA-2), J. Climate, 30, 5419–5454, https://doi.org/10.1175/jcli-d-16-0758.1, 2017.
Grell, G. A. and Dévényi, D.: A generalized approach to parameterizing convection combining ensemble and data assimilation techniques, Geophys. Res. Lett., 29, 1693, https://doi.org/10.1029/2002gl015311, 2002.
Grell, G. A., Peckham, S. E., Schmitz, R., McKeen, S. A., Frost, G., Skamarock, W. C., and Eder, B.: Fully coupled “online” chemistry within the WRF model, Atmos. Environ., 39, 6957–6975, https://doi.org/10.1016/j.atmosenv.2005.04.027, 2005.
Guenther, A. B., Jiang, X., Heald, C. L., Sakulyanontvittaya, T., Duhl, T., Emmons, L. K., and Wang, X.: The Model of Emissions of Gases and Aerosols from Nature version 2.1 (MEGAN2.1): an extended and updated framework for modeling biogenic emissions, Geosci. Model Dev., 5, 1471–1492, https://doi.org/10.5194/gmd-5-1471-2012, 2012.
Hong, S. Y., Noh, Y., and Dudhia, J.: A new vertical diffusion package with an explicit treatment of entrainment processes, Mon. Weather Rev., 134, 2318, https://doi.org/10.1175/MWR3199.1, 2006.
Huang, L., Fang, J., Liao, J., Yarwood, G., Chen, H., Wang, Y., and Li, L.: Insights into soil NO emissions and the contribution to surface ozone formation in China, Atmos. Chem. Phys., 23, 14919–14932, https://doi.org/10.5194/acp-23-14919-2023, 2023.
Huang, Y., Hickman, J. E., and Wu, S.: Impacts of enhanced fertilizer applications on tropospheric ozone and crop damage over sub-Saharan Africa, Atmos. Environ., 180, 117–125, https://doi.org/10.1016/j.atmosenv.2018.02.040, 2018.
Huber, D. E., Steiner, A. L., and Kort, E. A.: Sensitivity of Modeled Soil NOx Emissions to Soil Moisture, J. Geophys. Res.-Atmos., 128, e2022JD037611, https://doi.org/10.1029/2022jd037611, 2023.
Iacono, M. J., Delamere, J. S., Mlawer, E. J., Shephard, M. W., Clough, S. A., and Collins, W. D.: Radiative forcing by long-lived greenhouse gases: Calculations with the AER radiative transfer models, J. Geophys. Res.-Atmos., 113, D13103, https://doi.org/10.1029/2008jd009944, 2008.
KNMI (Copernicus Sentinel data processed by ESA, Koninklijk Nederlands Meteorologisch Instituut): Sentinel-5P TROPOMI Tropospheric NO2 1-Orbit L2 7 km × 3.5 km, Greenbelt, MD, USA, Goddard Earth Sciences Data and Information Services Center (GES DISC) [data set], https://doi.org/10.5270/S5P-s4ljg54, 2018.
Li, B., Chen, L., Shen, W., Jin, J., Wang, T., Wang, P., Yang, Y., and Liao, H.: Improved gridded ammonia emission inventory in China, Atmos. Chem. Phys., 21, 15883–15900, https://doi.org/10.5194/acp-21-15883-2021, 2021.
Li, C., Wang, J., Zhang, H., Diner, D. J., Hasheminassab, S., and Janechek, N.: Improvement of Surface PM2.5 Diurnal Variation Simulations in East Africa for the MAIA Satellite Mission, ACS ES&T Air, https://doi.org/10.1021/acsestair.3c00008, 2024.
Li, G., Lei, W., Zavala, M., Volkamer, R., Dusanter, S., Stevens, P., and Molina, L. T.: Impacts of HONO sources on the photochemistry in Mexico City during the MCMA-2006/MILAGO Campaign, Atmos. Chem. Phys., 10, 6551–6567, https://doi.org/10.5194/acp-10-6551-2010, 2010.
Li, K., Jacob, D. J., Liao, H., Zhu, J., Shah, V., Shen, L., Bates, K. H., Zhang, Q., and Zhai, S.: A two-pollutant strategy for improving ozone and particulate air quality in China, Nat. Geosci., 12, 906–910, https://doi.org/10.1038/s41561-019-0464-x, 2019.
Li, K., Jacob, D. J., Shen, L., Lu, X., De Smedt, I., and Liao, H.: Increases in surface ozone pollution in China from 2013 to 2019: anthropogenic and meteorological influences, Atmos. Chem. Phys., 20, 11423–11433, https://doi.org/10.5194/acp-20-11423-2020, 2020.
Li, K., Jacob, D. J., Liao, H., Qiu, Y., Shen, L., Zhai, S., Bates, K. H., Sulprizio, M. P., Song, S., Lu, X., Zhang, Q., Zheng, B., Zhang, Y., Zhang, J., Lee, H. C., and Kuk, S. K.: Ozone pollution in the North China Plain spreading into the late-winter haze season, P. Natl. Acad. Sci. USA, 118, e2015797118, https://doi.org/10.1073/pnas.2015797118, 2021.
Liao, H. and Xie, P.: The roles of short-lived climate forcers in a changing climate, Adv. Clim. Change Res., 17, 685–690, 2021.
Liu, X., Zhang, Y., Han, W., Tang, A., Shen, J., Cui, Z., Vitousek, P., Erisman, J. W., Goulding, K., Christie, P., Fangmeier, A., and Zhang, F.: Enhanced nitrogen deposition over China, Nature, 494, 459–462, https://doi.org/10.1038/nature11917, 2013.
Liu, Y. and Wang, T.: Worsening urban ozone pollution in China from 2013 to 2017 – Part 1: The complex and varying roles of meteorology, Atmos. Chem. Phys., 20, 6305–6321, https://doi.org/10.5194/acp-20-6305-2020, 2020a.
Liu, Y. and Wang, T.: Worsening urban ozone pollution in China from 2013 to 2017 – Part 2: The effects of emission changes and implications for multi-pollutant control, Atmos. Chem. Phys., 20, 6323–6337, https://doi.org/10.5194/acp-20-6323-2020, 2020b.
Lu, C. and Tian, H.: Global nitrogen and phosphorus fertilizer use for agriculture production in the past half century: shifted hot spots and nutrient imbalance, Earth Syst. Sci. Data, 9, 181–192, https://doi.org/10.5194/essd-9-181-2017, 2017.
Lu, X., Zhang, L., Chen, Y., Zhou, M., Zheng, B., Li, K., Liu, Y., Lin, J., Fu, T.-M., and Zhang, Q.: Exploring 2016–2017 surface ozone pollution over China: source contributions and meteorological influences, Atmos. Chem. Phys., 19, 8339–8361, https://doi.org/10.5194/acp-19-8339-2019, 2019.
Lu, X., Ye, X., Zhou, M., Zhao, Y., Weng, H., Kong, H., Li, K., Gao, M., Zheng, B., Lin, J., Zhou, F., Zhang, Q., Wu, D., Zhang, L., and Zhang, Y.: The underappreciated role of agricultural soil nitrogen oxide emissions in ozone pollution regulation in North China, Nat. Commun., 12, 5021, https://doi.org/10.1038/s41467-021-25147-9, 2021.
MEIC Team: The Multi-resolution Emission Inventory Model for Climate and Air Pollution Research, MEIC Model [data set], http://www.meicmodel.org/ (last access: 1 December 2022), 2012.
Morrison, H., Thompson, G., and Tatarskii, V.: Impact of Cloud Microphysics on the Development of Trailing Stratiform Precipitation in a Simulated Squall Line: Comparison of One- and Two-Moment Schemes, Mon. Weather Rev., 137, 991–1007, https://doi.org/10.1175/2008mwr2556.1, 2009.
Oswald, R., Behrendt, T., Ermel, M., Wu, D., Su, H., Cheng, Y., Breuninger, C., Moravek, A., Mougin, E., Delon, C., Loubet, B., Pommerening-Röser, A., Sörgel, M., Pöschl, U., Hoffmann, T., Andreae, M. O., Meixner, F. X., and Trebs, I.: HONO Emissions from Soil Bacteria as a Major Source of Atmospheric Reactive Nitrogen, Science, 341, 1233–1235, https://doi.org/10.1126/science.1242266, 2013.
Pinder, R. W., Davidson, E. A., Goodale, C. L., Greaver, T. L., Herrick, J. D., and Liu, L.: Climate change impacts of US reactive nitrogen, P. Natl. Acad. Sci. USA, 109, 7671–7675, https://doi.org/10.1073/pnas.1114243109, 2012.
Reay, D. S., Dentener, F., Smith, P., Grace, J., and Feely, R. A.: Global nitrogen deposition and carbon sinks, Nat. Geosci., 1, 430–437, https://doi.org/10.1038/ngeo230, 2008.
Rodell, M., Houser, P. R., Jambor, U., Gottschalck, J., Mitchell, K., Meng, C.-J., Arsenault, K., Cosgrove, B., Radakovich, J., Bosolovich, M., Entin, J. K., Walker, J. P., Lohmann, D., and Toll, D.: The global land data assimilation system, B. Am. Meteorol. Soc., 85, 381–394, https://doi.org/10.1175/BAMS-85-3-381, 2004.
Romer, P. S., Duffey, K. C., Wooldridge, P. J., Edgerton, E., Baumann, K., Feiner, P. A., Miller, D. O., Brune, W. H., Koss, A. R., de Gouw, J. A., Misztal, P. K., Goldstein, A. H., and Cohen, R. C.: Effects of temperature-dependent NOx emissions on continental ozone production, Atmos. Chem. Phys., 18, 2601–2614, https://doi.org/10.5194/acp-18-2601-2018, 2018.
Sha, T., Ma, X., Zhang, H., Janechek, N., Wang, Y., Wang, Y., Castro García, L., Jenerette, G. D., and Wang, J.: Impacts of Soil NOx Emission on O3 Air Quality in Rural California, Environ. Sci. Technol., 55, 7113–7122, https://doi.org/10.1021/acs.est.0c06834, 2021.
Shen, Y., Xiao, Z., Wang, Y., Xiao, W., Yao, L., and Zhou, C.: Impacts of Agricultural Soil NOx Emissions on O3 Over Mainland China, J. Geophys. Res.-Atmos., 128, e2022JD037986, https://doi.org/10.1029/2022jd037986, 2023.
Sillman, S.: The use of NOy, H2O2, and HNO3 as indicators for ozone-NOx-hydrocarbon sensitivity in urban locations, J. Geophys. Res., 100, 14175–14188, https://doi.org/10.1029/94JD02953, 1995.
Skiba, U., Medinets, S., Cardenas, L. M., Carnell, E. J., Hutchings, N., and Amon, B.: Assessing the contribution of soil NOx emissions to European atmospheric pollution, Environ. Res. Lett., 16, 025009, https://doi.org/10.1088/1748-9326/abd2f2, 2020.
Sun, L., Xue, L., Wang, Y., Li, L., Lin, J., Ni, R., Yan, Y., Chen, L., Li, J., Zhang, Q., and Wang, W.: Impacts of meteorology and emissions on summertime surface ozone increases over central eastern China between 2003 and 2015, Atmos. Chem. Phys., 19, 1455–1469, https://doi.org/10.5194/acp-19-1455-2019, 2019.
Tan, W., Wang, H., Su, J., Sun, R., He, C., Lu, X., Lin, J., Xue, C., Wang, H., Liu, Y., Liu, L., Zhang, L., Wu, D., Mu, Y., and Fan, S.: Soil Emissions of Reactive Nitrogen Accelerate Summertime Surface Ozone Increases in the North China Plain, Environ. Sci. Technol., 57, 12782–12793, https://doi.org/10.1021/acs.est.3c01823, 2023.
Tewari, M., Chen, F., Wang, W., Dudhia, J., LeMone, M. A., Mitchell, K., Ek, M., Gayno, G., Wegiel, J., and Cuenca, R. H.: Implementation and verification of the unified NOAH land surface model in the WRF model, 20th Conference on Weather Analysis and Forecasting/16th Conference on Numerical Weather Prediction, Seattle, WA, 11–15, 2004.
Travis, K. R. and Jacob, D. J.: Systematic bias in evaluating chemical transport models with maximum daily 8 h average (MDA8) surface ozone for air quality applications: a case study with GEOS-Chem v9.02, Geosci. Model Dev., 12, 3641–3648, https://doi.org/10.5194/gmd-12-3641-2019, 2019.
Turner, M. C., Jerrett, M., Pope, C. A., Krewski, D., Gapstur, S. M., Diver, W. R., Beckerman, B. S., Marshall, J. D., Su, J., Crouse, D. L., and Burnett, R. T.: Long-Term Ozone Exposure and Mortality in a Large Prospective Study, Am. J. Resp. Crit. Care, 193, 1134–1142, https://doi.org/10.1164/rccm.201508-1633OC, 2016.
Unger, N., Zheng, Y., Yue, X., and Harper, K. L.: Mitigation of ozone damage to the world's land ecosystems by source sector, Nat. Clim. Change, 10, 134–137, https://doi.org/10.1038/s41558-019-0678-3, 2020.
van Geffen, J., Boersma, K. F., Eskes, H., Sneep, M., ter Linden, M., Zara, M., and Veefkind, J. P.: S5P TROPOMI NO2 slant column retrieval: method, stability, uncertainties and comparisons with OMI, Atmos. Meas. Tech., 13, 1315–1335, https://doi.org/10.5194/amt-13-1315-2020, 2020.
van Geffen, J. H. G. M., Eskes, H. J., Boersma, K. F., and Veefkind, J. P.: TROPOMI ATBD of the total and tropospheric NO2 data products, Report S5P-KNMI-L2-0005-RP, version 2.2.0, 2021-06-16, KNMI, De Bilt, the Netherlands, http://www.tropomi.eu/data-products/nitrogen-dioxide/ (last access: 7 March 2022), 2021.
Vinken, G. C. M., Boersma, K. F., Maasakkers, J. D., Adon, M., and Martin, R. V.: Worldwide biogenic soil NOx emissions inferred from OMI NO2 observations, Atmos. Chem. Phys., 14, 10363–10381, https://doi.org/10.5194/acp-14-10363-2014, 2014.
Wang, N., Lyu, X., Deng, X., Huang, X., Jiang, F., and Ding, A.: Aggravating O3 pollution due to NOx emission control in eastern China, Sci. Total Environ., 677, 732–744, https://doi.org/10.1016/j.scitotenv.2019.04.388, 2019.
Wang, Q. G., Han, Z., Wang, T., and Zhang, R.: Impacts of biogenic emissions of VOC and NOx on tropospheric ozone during summertime in eastern China, Sci. Total Environ., 395, 41–49, https://doi.org/10.1016/j.scitotenv.2008.01.059, 2008.
Wang, R., Bei, N., Wu, J., Li, X., Liu, S., Yu, J., Jiang, Q., Tie, X., and Li, G.: Cropland nitrogen dioxide emissions and effects on the ozone pollution in the North China plain, Environ. Pollut., 294, 118617, https://doi.org/10.1016/j.envpol.2021.118617, 2022.
Wang, R., Bei, N., Pan, Y., Wu, J., Liu, S., Li, X., Yu, J., Jiang, Q., Tie, X., and Li, G.: Urgency of controlling agricultural nitrogen sources to alleviate summertime air pollution in the North China Plain, Chemosphere, 311, 137124, https://doi.org/10.1016/j.chemosphere.2022.137124, 2023.
Wang, S., Xing, J., Jang, C., Zhu, Y., Fu, J. S., and Hao, J.: Impact Assessment of Ammonia Emissions on Inorganic Aerosols in East China Using Response Surface Modeling Technique, Environ. Sci. Technol., 45, 9293–9300, https://doi.org/10.1021/es2022347, 2011.
Wang, W., Parrish, D. D., Wang, S., Bao, F., Ni, R., Li, X., Yang, S., Wang, H., Cheng, Y., and Su, H.: Long-term trend of ozone pollution in China during 2014–2020: distinct seasonal and spatial characteristics and ozone sensitivity, Atmos. Chem. Phys., 22, 8935–8949, https://doi.org/10.5194/acp-22-8935-2022, 2022.
Wang, W., Li, X., Cheng, Y., Parrish, D. D., Ni, R., Tan, Z., Liu, Y., Lu, S., Wu, Y., Chen, S., Lu, K., Hu, M., Zeng, L., Shao, M., Huang, C., Tian, X., Leung, K. M., Chen, L., Fan, M., Zhang, Q., Rohrer, F., Wahner, A., Pöschl, U., Su, H., and Zhang, Y.: Ozone pollution mitigation strategy informed by long-term trends of atmospheric oxidation capacity, Nat. Geosci., 17, 20–25, https://doi.org/10.1038/s41561-023-01334-9, 2023.
Wang, Y., Fu, X., Wu, D., Wang, M., Lu, K., Mu, Y., Liu, Z., Zhang, Y., and Wang, T.: Agricultural Fertilization Aggravates Air Pollution by Stimulating Soil Nitrous Acid Emissions at High Soil Moisture, Environ. Sci. Technol., 55, 14556–14566, https://doi.org/10.1021/acs.est.1c04134, 2021a.
Wang, Y., Ge, C., Castro Garcia, L., Jenerette, G. D., Oikawa, P. Y., and Wang, J.: Improved modelling of soil NOx emissions in a high temperature agricultural region: role of background emissions on NO2 trend over the US, Environ. Res. Lett., 16, 084061, https://doi.org/10.1088/1748-9326/ac16a3, 2021b.
Wang, Y., Fu, X., Wang, T., Ma, J., Gao, H., Wang, X., and Pu, W.: Large Contribution of Nitrous Acid to Soil-Emitted Reactive Oxidized Nitrogen and Its Effect on Air Quality, Environ. Sci. Technol., 57, 3516–3526, https://doi.org/10.1021/acs.est.2c07793, 2023a.
Wang, Y., Wang, J., Zhang, H., Janechek, N., Wang, Y., Zhou, M., Shen, P., Tan, J., He, Q., Cheng, T., and Huang, C.: Impact of land use change on the urban-rural temperature disparity in Eastern China, Atmos. Environ., 308, 119850, https://doi.org/10.1016/j.atmosenv.2023.119850, 2023b.
Weber, B., Wu, D., Tamm, A., Ruckteschler, N., Rodríguez-Caballero, E., Steinkamp, J., Meusel, H., Elbert, W., Behrendt, T., Sörgel, M., Cheng, Y., Crutzen, P. J., Su, H., and Pöschl, U.: Biological soil crusts accelerate the nitrogen cycle through large NO and HONO emissions in drylands, P. Natl. Acad. Sci. USA, 112, 15384–15389, https://doi.org/10.1073/pnas.1515818112, 2015.
Wei, J., Li, Z., Li, K., Dickerson, R. R., Pinker, R. T., Wang, J., Liu, X., Sun, L., Xue, W., and Cribb, M.: Full-coverage mapping and spatiotemporal variations of ground-level ozone (O3) pollution from 2013 to 2020 across China, Remote Sens. Environ., 270, 112775, https://doi.org/10.1016/j.rse.2021.112775, 2022.
Xu, W., Kuang, Y., Zhao, C., Tao, J., Zhao, G., Bian, Y., Yang, W., Yu, Y., Shen, C., Liang, L., Zhang, G., Lin, W., and Xu, X.: NH3-promoted hydrolysis of NO2 induces explosive growth in HONO, Atmos. Chem. Phys., 19, 10557–10570, https://doi.org/10.5194/acp-19-10557-2019, 2019.
Xu, W., Zhao, Y., Wen, Z., Chang, Y., Pan, Y., Sun, Y., Ma, X., Sha, Z., Li, Z., Kang, J., Liu, L., Tang, A., Wang, K., Zhang, Y., Guo, Y., Zhang, L., Sheng, L., Zhang, X., Gu, B., Song, Y., Van Damme, M., Clarisse, L., Coheur, P.-F., Collett, J. L., Goulding, K., Zhang, F., He, K., and Liu, X.: Increasing importance of ammonia emission abatement in PM2.5 pollution control, Sci. Bull., 67, 1745–1749, https://doi.org/10.1016/j.scib.2022.07.021, 2022.
Yan, X., Ohara, T., and Akimoto, H.: Statistical modeling of global soil NOx emissions, Global Biogeochem. Cy., 19, GB3019, https://doi.org/10.1029/2004gb002276, 2005.
Yang, J. and Zhao, Y.: Performance and application of air quality models on ozone simulation in China – A review, Atmos. Environ., 293, 119446, https://doi.org/10.1016/j.atmosenv.2022.119446, 2023.
Ye, C., Gao, H., Zhang, N., and Zhou, X.: Photolysis of Nitric Acid and Nitrate on Natural and Artificial Surfaces, Environ. Sci. Technol., 50, 3530–3536, https://doi.org/10.1021/acs.est.5b05032, 2016.
Ye, C., Zhang, N., Gao, H., and Zhou, X.: Photolysis of Particulate Nitrate as a Source of HONO and NOx, Environ. Sci. Technol., 51, 6849–6856, https://doi.org/10.1021/acs.est.7b00387, 2017.
Ye, X., Wang, X., and Zhang, L.: Diagnosing the Model Bias in Simulating Daily Surface Ozone Variability Using a Machine Learning Method: The Effects of Dry Deposition and Cloud Optical Depth, Environ. Sci. Technol., 56, 16665–16675, https://doi.org/10.1021/acs.est.2c05712, 2022.
Yue, X., Unger, N., Harper, K., Xia, X., Liao, H., Zhu, T., Xiao, J., Feng, Z., and Li, J.: Ozone and haze pollution weakens net primary productivity in China, Atmos. Chem. Phys., 17, 6073–6089, https://doi.org/10.5194/acp-17-6073-2017, 2017.
Zaveri, R. A. and Peters, L. K.: A new lumped structure photochemical mechanism for large-scale applications, J. Geophys. Res.-Atmos., 104, 30387–30415, https://doi.org/10.1029/1999jd900876, 1999.
Zaveri, R. A., Easter, R. C., Fast, J. D., and Peters, L. K.: Model for Simulating Aerosol Interactions and Chemistry (MOSAIC), J. Geophys. Res.-Atmos., 113, DS13204, https://doi.org/10.1029/2007jd008782, 2008.
Zhan, Y., Xie, M., Gao, D., Wang, T., Zhang, M., and An, F.: Characterization and source analysis of water-soluble inorganic ionic species in PM2.5 during a wintertime particle pollution episode in Nanjing, China, Atmos. Res., 262, 105769, https://doi.org/10.1016/j.atmosres.2021.105769, 2021.
Zhang, J., Lian, C., Wang, W., Ge, M., Guo, Y., Ran, H., Zhang, Y., Zheng, F., Fan, X., Yan, C., Daellenbach, K. R., Liu, Y., Kulmala, M., and An, J.: Amplified role of potential HONO sources in O3 formation in North China Plain during autumn haze aggravating processes, Atmos. Chem. Phys., 22, 3275–3302, https://doi.org/10.5194/acp-22-3275-2022, 2022a.
Zhang, J., Ran, H., Guo, Y., Xue, C., Liu, X., Qu, Y., Sun, Y., Zhang, Q., Mu, Y., Chen, Y., Wang, J., and An, J.: High crop yield losses induced by potential HONO sources – A modelling study in the North China Plain, Sci. Total Environ., 803, 149929, https://doi.org/10.1016/j.scitotenv.2021.149929, 2022b.
Zhang, L., Wang, T., Zhang, Q., Zheng, J., Xu, Z., and Lv, M.: Potential sources of nitrous acid (HONO) and their impacts on ozone: A WRF-Chem study in a polluted subtropical region, J. Geophys. Res.-Atmos., 121, 3645–3662, https://doi.org/10.1002/2015jd024468, 2016.
Zhang, S., Sarwar, G., Xing, J., Chu, B., Xue, C., Sarav, A., Ding, D., Zheng, H., Mu, Y., Duan, F., Ma, T., and He, H.: Improving the representation of HONO chemistry in CMAQ and examining its impact on haze over China, Atmos. Chem. Phys., 21, 15809–15826, https://doi.org/10.5194/acp-21-15809-2021, 2021.
Zhang, W., Tong, S., Jia, C., Wang, L., Liu, B., Tang, G., Ji, D., Hu, B., Liu, Z., Li, W., Wang, Z., Liu, Y., Wang, Y., and Ge, M.: Different HONO Sources for Three Layers at the Urban Area of Beijing, Environ. Sci. Technol., 54, 12870–12880, https://doi.org/10.1021/acs.est.0c02146, 2020.